8
Y E A R – E N D R E P O R T 2 0 1 4
Y E A R – E N D
R E P O R T
2 0 1 4

OperationsSvea Ekonomi AB conducts financing activities under a permit from the Swedish Financial Supervi-sory Authority and in accordance with the provisions of the Banking and Financing Business Act (SFS 2004:297). The Svea Ekonomi AB Group also provides administrative services.
The Group’s business concept is to provide the market with personal service and efficient custom solutions within the areas of Administrative and Financial Services (AFS) and Debt Recovery. Under this business concept we offer the following: invoice services, business financing, factoring, invoice purchasing, debt recovery, deposits, unsecured loans, VAT recovery, billing, legal services, credit reports, training, payment transfers and foreign currency exchange.
Financial services are offered by the consolidated situation, which comprises Svea Ekonomi AB, the branches Svea Finans NUF in Norway, Svea Ekonomi AB in Finland, and the wholly owned subsidi-aries Svea Finance AS, Svea Finance SIA, Svea Finans A/S, Svea Rahoitus Suomi OY, Svea Finans Nederland BV, Svea Finans AG, Payson AB and Svea Exchange AB. It also includes the subsidiar-ies Kapitalkredit Sverige AB, Svea Ekonomi Cyprus Limited (formerly Cogilane Holdings Limited), Rhoswen Limited, Daylet Limited and Svea Finance ZRT.
Administrative services are offered by the subsidiary operating companies Svea Kreditinfo AB, Svea Juridiska AB, Mobivox Telecom AB, Svea Billing Services AB and the Group company Svea Vat Adviser AB. Also included are the associated companies eLombard Oyj, Credex AB and Trade in Sports Europe AB.
Debt recovery operations are conducted by the sub-group Svea Inkasso AB with the subsidiaries Svea Finans AS, Svea Inkasso A/S and Svea Finans GmbH, and by Svea Perintä Oy with the subsidiar-ies Svea Inkasso OÜ and Svea Inkasso SIA. In addition, debt recovery operations are carried out in Eastern Europe by the associated company Creditexpress NV.
The Group conducts business operations in the Nordic region and in other parts of Europe, and is one of the biggest within financing, administration and debt recovery. The Parent Company constitutes a substantial part of the Group, which can be seen in the five-year summaries on pages 8 and 9 of the Annual Report.
Events during the financial yearThe year was characterized by expansion and an increase in loans and deposits. The positive earnings trend is mainly attributable to an increase in net income from interest, fees and commissions. This positive trend is expected to continue. While credit losses grew in respect of loans to private individuals, losses in respect of lending to companies fell. Total credit losses fell compared to the previous year.
Financial operations developed according to plan, with the exceptions of Denmark, the Netherlands and Switzerland, which performed less well than planned. Investments in past-due receivables portfolios in eastern and central Europe developed according to plan, with the exceptions of the Ukraine and Russia, which performed less well than planned, mainly due to foreign exchange effects. Debt recovery operations developed according to plan, with the exceptions of Finland and Denmark, which performed less well than planned. Eastern Europe operations performed better than planned.
During the first quarter, the Parent Company issued a further convertible loan in the amount of SEK 50 mil-lion, which was taken up by the new company Svea Intressenter 2 AB. During the second quarter, the earlier convertible loan was converted to equity, shares were withdrawn and a subordinated loan was raised in the amount of SEK 75 million.
During the first quarter, all loan receivables, which amounted to an approximate nominal SEK 285 million, together with the currency exchange operation and Giroservice, were acquired from Exchange Finans Europe AB. Foreign currency exchange and Giroservice is run by the subsidiary Svea Exchange AB, to which the necessary capital was extended during the period.
Investments were also made for the acquisition of past-due receivables portfolios in Croatia, Bulgaria, Hun-gary and Slovenia, and in the acquisition of receivables in Slovakia. Following further capital contributions, the holding in eLombard Oyj has been written down to zero.
During the year, the subsidiary Seblinco Finans Holding AB was sold and the dormant subsidiary DialIT Communications BV was liquidated. The companies did not conduct any business in 2014.
The extraordinary shareholders meeting of 29 October 2014 resolved to pay a dividend to shareholders of SEK 15 million in accordance with a separate statement from the Board.
Operating revenues and operating profitOperating revenues amounted to SEK 1,498.2 million (1,208.9) for the Group, and SEK 1,319.2 mil-lion (949.6) for the Parent Company. Operating profit amounted to SEK 325.9 million (195.4) for the Group, and SEK 519.6 million (267.1) for the Parent Company.
LendingAs of 31 December 2014, external lending to the public amounted to SEK 5,150.4 million (4,289.1) for the Group, and SEK 4,260.6 million (3,504.2) for the Parent Company.
FinancingGroup lending to the public is financed through deposits from the public, our own operations, other credit institutions, convertible loans and subordinated debts. As of 31 December 2014, deposits from the public amounted to SEK 7,544.8 million (5,561.7) for the Group, and SEK 7,411.7 million (5,461.5) for the Parent Company. As of 31 December 2014, liabilities to credit institutions amounted to SEK 29.1 million (37.7) for the Group. The Parent Company has no liabilities to credit institutions.Convertible loans amounted to a nominal SEK 50 million (50.0), and subordinated debt to SEK 75.0 million (0.0).
Stockholm, May 2015 SVEA EKONOMI AB
Lennart Ågren CEO
LiquidityAs of 31 December 2014, cash and bank balances plus approved but unutilized credits, amounted to SEK 1,970.7 million (1,125.2) for the Group, and SEK 1,581.7 million (839.3) for the Parent Company. As of 31 December 2014, liquidity including investments in listed bonds and other securities amount-ed to SEK 3,011.6 million (1,715.2) for the Group, and SEK 2,622.6 million (1,429.3) for the Parent Company.
InvestmentsInvestments in tangible and intangible assets for the year amounted to SEK 92.4 million (61.0) for the Group, and SEK 200.2 million (155.0) for the Parent Company.
PersonnelThe average number of permanent employees in the Group amounted to 839 (656), of whom 504 were women (395), and in the Parent Company 432 (411), of whom 239 were women (235). As of 31 December 2014, the number of employees in the Group amounted to 896 (667), and in the Parent Company 440 (423).
The planning and decision-making process regarding remunerations and benefits for key individuals in executive positions, including the Board, is described in Note 10 in the Annual Report.
Capital adequacyThe new European CRR/CRDIV (Basel III) regulations came into force as of 1 January 2014, and entail more stringent requirements for the highest quality components of the capital base – core primary capital and primary capital. In addition to the minimum capital requirement, a capital conservation buffer of 2.5 per cent was introduced as of 01 August 2014. A contra-cyclic buffer of 1.0 per cent will also be introduced and come into force on 13 September 2015.
As of 31 December 2014, the minimum capital requirement for the core primary capital ratio amounted to 7.0 per cent, the primary capital ratio to 8.5 per cent and the total capital ratio to 10.5 per cent.
The Board decided to implement a buffer of a further 0.5 per cent as of 01 August 2014, which means the capital requirement for the core primary capital ratio amounts to 7.5 per cent, the primary capi-tal ratio to 9.0 per cent and the total capital ratio to 11.0 per cent.
Capital requirement is calculated in compliance with statutory minimum requirements for capital for credit risk, market risk, operational risk and credit value adjustment risk. Comparative figures for capital ratios up until 2013 were based on earlier regulations.
The core primary capital ratio in the Parent Company amounted to 11.65 per cent (13.12) as of 31 December 2014, the primary capital ratio to 11.65 per cent (13.12) and the total capital ratio to 11.77 per cent (14.34).
In the consolidated situation, the core primary capital ratio amounted to 10.87 per cent (10.56) as of 31 December 2014, the primary capital ratio to 10.94 per cent (10.56) and the total capital ratio to 11.87 per cent (11.61).
For further information on risk management and capital management, refer to pages 4–7 and Note 37 in the Annual Report.
Events after closing dayThe period January to April 2015 developed according to plan. Volumes increased in both financial services and administrative services.
The extraordinary shareholders meeting of 5 March 2015 resolved to pay a dividend to share holders of SEK 25 million in accordance with a separate statement from the Board.
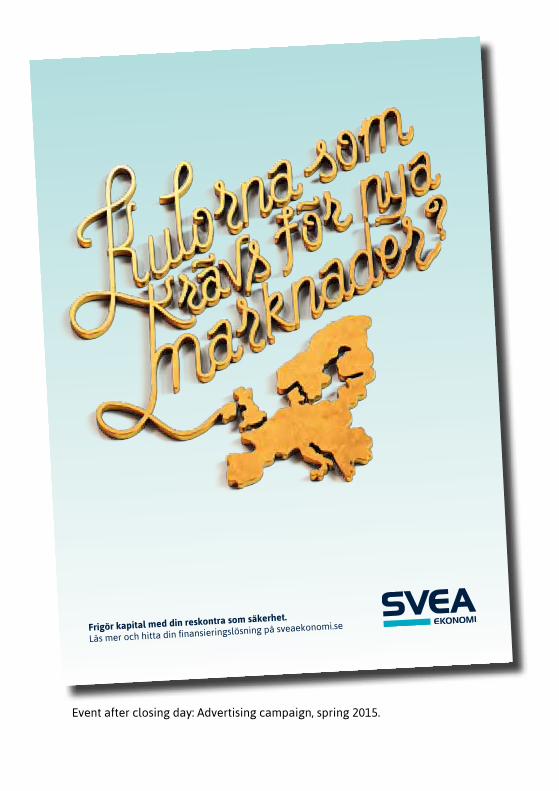
Frigör kapital med din reskontra som säkerhet.
Läs mer och hitta din finansieringslösning på sveaekonomi.se
Event after closing day: Advertising campaign, spring 2015.
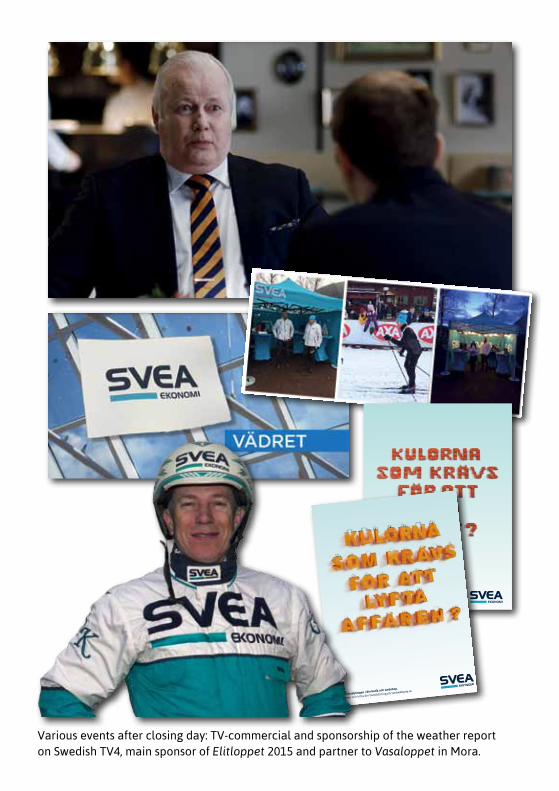
Various events after closing day: TV-commercial and sponsorship of the weather report on Swedish TV4, main sponsor of Elitloppet 2015 and partner to Vasaloppet in Mora.
Låna till projektet med din bostad som säkerhet.Läs mer och hitta din finansieringslösning på sveadirekt.se/xxxxxx
Öka försäljningen i din butik och webshop.
Läs mer och hitta din betallösning på sveawebpay.se
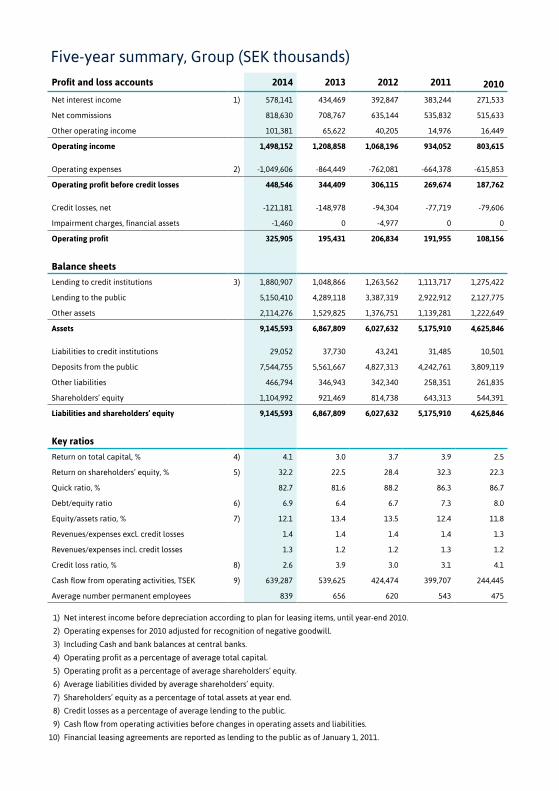
Profit and loss accounts 2014 2013 2012 2011 2010 Net interest income 1) 578,141 434,469 392,847 383,244 271,533
Net commissions 818,630 708,767 635,144 535,832 515,633
Other operating income 101,381 65,622 40,205 14,976 16,449
Operating income 1,498,152 1,208,858 1,068,196 934,052 803,615
Operating expenses 2) -1,049,606 -864,449 -762,081 -664,378 -615,853
Operating profit before credit losses 448,546 344,409 306,115 269,674 187,762
Credit losses, net -121,181 -148,978 -94,304 -77,719 -79,606
Impairment charges, financial assets -1,460 0 -4,977 0 0
Operating profit 325,905 195,431 206,834 191,955 108,156
Balance sheets
Lending to credit institutions 3) 1,880,907 1,048,866 1,263,562 1,113,717 1,275,422
Lending to the public 5,150,410 4,289,118 3,387,319 2,922,912 2,127,775
Other assets 2,114,276 1,529,825 1,376,751 1,139,281 1,222,649
Assets 9,145,593 6,867,809 6,027,632 5,175,910 4,625,846
Liabilities to credit institutions 29,052 37,730 43,241 31,485 10,501
Deposits from the public 7,544,755 5,561,667 4,827,313 4,242,761 3,809,119
Other liabilities 466,794 346,943 342,340 258,351 261,835
Shareholders’ equity 1,104,992 921,469 814,738 643,313 544,391
Liabilities and shareholders’ equity 9,145,593 6,867,809 6,027,632 5,175,910 4,625,846
Key ratios
Return on total capital, % 4) 4.1 3.0 3.7 3.9 2.5
Return on shareholders’ equity, % 5) 32.2 22.5 28.4 32.3 22.3
Quick ratio, % 82.7 81.6 88.2 86.3 86.7
Debt/equity ratio 6) 6.9 6.4 6.7 7.3 8.0
Equity/assets ratio, % 7) 12.1 13.4 13.5 12.4 11.8
Revenues/expenses excl. credit losses 1.4 1.4 1.4 1.4 1.3
Revenues/expenses incl. credit losses 1.3 1.2 1.2 1.3 1.2
Credit loss ratio, % 8) 2.6 3.9 3.0 3.1 4.1
Cash flow from operating activities, TSEK 9) 639,287 539,625 424,474 399,707 244,445
Average number permanent employees 839 656 620 543 475
Five-year summary, Group (SEK thousands)
1) Net interest income before depreciation according to plan for leasing items, until year-end 2010.
2) Operating expenses for 2010 adjusted for recognition of negative goodwill.
3) Including Cash and bank balances at central banks.
4) Operating profit as a percentage of average total capital.
5) Operating profit as a percentage of average shareholders’ equity.
6) Average liabilities divided by average shareholders’ equity.
7) Shareholders’ equity as a percentage of total assets at year end.
8) Credit losses as a percentage of average lending to the public.
9) Cash flow from operating activities before changes in operating assets and liabilities.
10) Financial leasing agreements are reported as lending to the public as of January 1, 2011.
READ MORE www.sveaekonomi.se
SolnaSE-169 81 Solna
Sweden
Evenemangsgatan 31
Tel: + 46 8 735 90 00
Fax: +46 8 735 42 09
GothenburgBox 2149
SE-403 13 Gothenburg
Sweden
Otterhällegatan 12 B
Tel: + 46 31 17 25 45
Fax: + 46 31 711 18 16
ÅsedaBox 116
SE-364 21 Åseda
Sweden
Skolgatan 8
Tel: + 46 8 735 90 00
Fax: + 46 474 716 68
www.sveaekonomi.se
Co. reg. no. 556489-2924
Registered office: Stockholm


