36
still day one QUARTERLY FINANCIAL REPORT 1 2015/2016

still
day o
ne
Quarterly Financial report 1 2015 / 2016

Key Figures oF the sinner schrader group
Q1 2015/2016 Q1 2014/2015 change
Gross revenues € 000s 13,040 13,493 –3 %
Net revenues € 000s 12,812 12,401 +3 %
EBITDA € 000s 1,024 559 +83 %
EBITA € 000s 835 272 +207 %
Relation of the EBITA to net revenues (Operating margin) % 6.5 2.2 +197 %
EBIT € 000s 835 272 +207 %
Net income € 000s 566 142 +299 %
Net income per share, diluted € 0.05 0.01 +295 %
Shares outstanding1) number 11,548,644 11,400,869 +1 %
Cash flows from operating activities € 000s 951 –4,312 +122 %
Employees, full-time equivalents number 454 487 –7 %
30.11.2015 30.11.2014 change
Liquid funds and securities € 000s 5,951 1,358 +338 %
Shareholders’ equity € 000s 15,029 14,220 +6 %
Balance sheet total € 000s 27,639 27,316 +1 %
Shareholders’ equity rate % 54.4 52.1 +4 %
Employees, end of period number 494 535 –8 %
1) Weighted average shares outstanding

01 interim status report 1 2015/2016
05 General 05 Group Business and structure 06 Market and coMpetitive environMent 07 Business developMent and Group situation 15 risks and opportunities of future Business developMent 15 Major events after the Balance sheet date 16 forecast
02 consolidated quarterly accounts 1 2015/2016
18 consolidated Balance sheets 20 consolidated stateMents of operations 21 consolidated stateMents of coMprehensive incoMe 22 consolidated stateMents of shareholders’ equity 24 consolidated stateMents of cash flows 26 notes
03 Further inFormation
35 events & contact inforMation
contents

0101 | interim status report 1 2015/2016 05–16
02 | consolidated quarterly accounts 1 2015/2016 18–33

sin
ne
rs
ch
ra
de
r g
ro
up
— q
ua
rt
er
ly
Fin
an
cia
l r
ep
or
t 1
20
15
/2
01
6
int
er
im s
ta
tu
s r
ep
or
t 1
20
15/
20
16
1 general
This Interim Status Report of the Sinner Schrader Group (“Sinner Schrader” or “Group”) as at 30 November 2015
represents the development of the income, financial, and assets status of the Group which is managed by Sinner Schrader
Aktiengesellschaft (“Sinner Schrader AG” or “AG”) in the first quarter of the 2015/2016 financial year from 1 September
to 30 November 2015. It deals with the major risks and opportunities and the probable developments in the remainder of
the financial year.
The consolidated financial statements on which this status report is based were drawn up according to the International
Financial Reporting Standards (“IFRS”). The Interim Status Report, particularly Section 7, contains statements and
information aimed at the future. These forward-looking statements are based on current knowledge, estimates, and
assumptions and therefore entail a number of risks and uncertainties. A variety of factors, many of which are outside
Sinner Schrader’s sphere of influence, have an impact on the business development and results. These factors mean
that the actual future business development of Sinner Schrader and the actual results achieved may differ significantly
from the explicit or implicit information in the forward-looking statements.
This quarterly financial report should be read in conjunction with the Consolidated Financial Statements of
Sinner Schrader AG for the 2014/2015 financial year.
2 group Business and structure
The Sinner Schrader Group is a digital agency group which offers companies in Germany and abroad a comprehensive
range of services for the use of digital technologies to optimise and further develop their business. The emphasis is
on the use of the Internet for the sale of goods and services (e-commerce), for marketing and communication, and for
the acquisition and retention of customers.
With more than 500 employees, Sinner Schrader is one of the biggest independent digital agency groups in Germany and
performs its services at locations in Hamburg, Frankfurt am Main, Berlin, Hanover, Munich and Prague. Sinner Schrader
mainly works for companies based in Germany, but also counts companies from Switzerland, the UK, the Netherlands,
France, Austria and Luxembourg among its clients.
The consolidation group has not changed in comparison to the status on 31 August 2015. In the quarter of the report,
the Sinner Schrader Group thus consisted of Sinner Schrader AG in addition to Sinner Schrader Deutschland GmbH,
Sinner Schrader Mobile GmbH, Sinner Schrader Praha s.r.o., the NEXT AUDIENCE Group, comprising NEXT AUDIENCE
GmbH and Sinner Schrader Content GmbH, and the Commerce Plus Group, made up of Commerce Plus GmbH and
Commerce Plus Consulting GmbH. Moreover, the operationally inactive companies Sinner Schrader UK Ltd. in London and
Sinner Schrader Benelux BV in Rotterdam are still part of the consolidation group.
As decided and announced at the end of June 2015, Sinner Schrader commenced with its withdrawal from the business
conducted by NEXT AUDIENCE GmbH in the quarter of the report. This process will probably have been completed during
the course of the second quarter of the 2015/2016 financial year.
The Sinner Schrader Group continues to structure its business activity in the Interactive Marketing, Interactive Media
and Interactive Commerce segments. The Interactive Marketing segment comprises Sinner Schrader Deutschland GmbH,
Sinner Schrader Mobile GmbH and Sinner Schrader Praha s.r.o. The Interactive Media segment is formed by the NEXT
AUDIENCE Group, and the Interactive Commerce segment by the Commerce Plus Group.
5

sin
ne
rs
ch
ra
de
r g
ro
up
— q
ua
rt
er
ly
Fin
an
cia
l r
ep
or
t 1
20
15
/2
01
6
int
er
im s
ta
tu
s r
ep
or
t 1
20
15/
20
16
3 marKet and competitiVe enVironment
Unlike the previous 2014/2015 financial year, the 2015/2016 financial year started with a tailwind from the good overall
economic position and the positive mood in Germany. At 109 points in November, the ifo business climate index reached
its highest level of the 2015 calendar year and exceeded the previous year’s value by more than 4 index points. In
December 2015, the index was just below this at 108.7 points, but it was higher than in the first ten months of the year
and 3 index points above the level of the previous year.
Since mid-2015, the positive development of the ifo business climate index for the commercial economy has been largely
due to an improvement in business expectations. However, in the last few months of the year, the business situation was
assessed to be slightly worse than in the spring and summer of 2015.
The forecasts for the German economy from economic experts and from national and international organisations from
the last four months of 2015 largely assume that economic growth in 2016 will slightly exceed the growth of 2015.
The sixteen economic forecasts brought together at tagesschau.de/wirtschaft/konjunkturprognose114.html lie between
1.5 % and 1.8 % for 2015. A growth rate of up to 2.1 % is currently assumed for the real gross domestic product in 2016.
The good mood in the German economy in the last calendar quarter of 2015 is in contrast to many risk areas, such
as the continuing unsolved conflicts in the Middle East, the resulting problem of refugees and the weakness of economic
development in China, which could also entail potential setbacks for the German economy.
The positive mood of the commercial economy (the processing industry, mainstream construction industry, wholesaling
and retailing) summarised in the ifo business climate index is greatly surpassed by the mood in the service sector
measured in a comparable ifo business climate indicator. In October 2015 the indicator reached a historic high and rose
even higher in November and December 2015.
In the opinion of “iBusiness” magazine, the factors shaping the situation of the service sector as a whole apply to a
particular degree to the digital agency sector. The survey on the “interactive economic climate” published in October 2015
came to the conclusion that the sector is on a high. The magazine mainly refers to the fact that the broad-based initiative
for digital transformation now in place in many companies ensures excellent order books for digital agencies.
The “iBusiness” analysis, which is based on studies from PricewaterhouseCoopers and EY from 2015, among others,
sees “digital business processes and Internet-driven transformation” as the “most important areas of business” for
digital agencies in the years ahead, which will replace the “operative Internet business” as the main source of revenue.
According to “iBusiness”, it is mainly their experience “with implementing digital projects” that makes digital agencies
promising candidates to profit from digital transformation, even if the nature and scope of the subjects and projects
pointed more towards classic IT and IT consulting companies as the service providers to be considered.
6

sin
ne
rs
ch
ra
de
r g
ro
up
— q
ua
rt
er
ly
Fin
an
cia
l r
ep
or
t 1
20
15
/2
01
6
int
er
im s
ta
tu
s r
ep
or
t 1
20
15/
20
16
4 Business deVelopment and group situation
In the first quarter of 2015/2016, Sinner Schrader developed positively as planned in a generally positive economic
environment, and created a good basis for achieving its overall annual targets.
The revenue generated by the Group reached a volume of € 12.8 million in the quarter of the report. The volume of
business thus exceeded that of the respective comparable quarter of the previous year again for the first time in three
quarters. The increase was still limited, at 3.3 %, since the decision to withdraw from NEXT AUDIENCE business had
a negative effect in the extent of € 0.5 million. The growth rate in the quarter of the report was 8.1 % without taking
account of NEXT AUDIENCE business.
The quarterly EBITA amounted to a good € 0.8 million, which corresponds to a trebling of the result for the previous year.
In addition to the increase in the business volume and improvements to efficiency, the scaling back of NEXT AUDIENCE
business contributed to increasing the operating result in the amount of a good € 0.1 million. NEXT AUDIENCE still had
a negative effect of just under € 0.3 million on the EBITA in the quarter of the report.
As expected, mainly on the basis of experience with seasonal fluctuations in the past few financial years, the key
operating figures in the first quarter of 2015/2016 fell short of the figures for the previous fourth quarter of 2014/2015,
in which Sinner Schrader generated revenue of € 13.4 million and an EBITA of € 1.2 million.
On the bottom line, the positive operating development resulting from the normalisation of the tax rate due to the
withdrawal from NEXT AUDIENCE business was enhanced. Net income in the quarter of the report thus improved to just
under € 0.6 million, i.e. four times the figure for the previous year. This corresponded to a result of € 0.05 per share in
the first quarter of 2015/2016.
eBita
deVelopment oF the operatiVe Key Figures reVenues and eBita in € mil l ion for the last f ive quarters
Q4 2014/2015
Q1 2015/2016
Q3 2014/2015
11.3
13.40.5
0.7
12.911.7
12.80.2
12.6
Q2 2014/2015
10.6
Q1 2014/2015
12.4
SinnerSchrader group without next audience next audience
Q3 2014/2015
Q4 2014/2015
Q1 2015/2016
0.8 –0.8
–0.3
Q1 2014/2015
0.3
Q2 2014/2015
–0.2
1.2
–1.2–0.4
+2.4
+0.7 +1.1
reVenues
7
sin
ne
rs
ch
ra
de
r g
ro
up
— q
ua
rt
er
ly
Fin
an
cia
l r
ep
or
t 1
20
15
/2
01
6
int
er
im s
ta
tu
s r
ep
or
t 1
20
15/
20
16
Unlike in previous years, the operating cash flow was already clearly positive in the first quarter of 2015/2016, reaching
€ 0.95 million thanks to the positive development of business and a high settlement rate. Just over half of the operating
cash flow was used for investments and buying back shares of treasury stock, which increased the liquidity reserve by
€ 0.4 million to € 5.95 million.
The personnel capacity was reduced in comparison to the previous year, mainly due to the initiation of the withdrawal
from NEXT AUDIENCE business. The Company had 454 full-time employees in the first quarter of 2015/2016.
The following describes the developments of the income, financial, and assets status in the first quarter of the 2015/2016
financial year in more detail.
4 .1 reVenues
In the first quarter of the 2015/2016 financial year, Sinner Schrader earned net revenue in the amount of € 12.8 million.
This exceeded the comparable value of the previous year by € 0.4 million, which corresponds to a growth rate of 3.3 %.
Net revenue decreased by just under € 0.6 million or 4.3 % in comparison to the preceding strong fourth quarter of the
2014/2015 financial year, although the decrease was slightly less than predicted in the plans for the financial year.
The development of the business volume was negatively influenced by the decision taken at the end of June 2015 to
withdraw from NEXT AUDIENCE business. The measures taken on the basis of the decision meant that the corresponding
client contracts expired not later than by the end of 2015. NEXT AUDIENCE still contributed around € 0.2 million to the
revenue in the quarter of the report, which was around € 0.5 million less than in the previous year and € 0.3 million less
than in the fourth quarter of 2014/2015.
Adjusted by the contributions from NEXT AUDIENCE business, Sinner Schrader increased its revenue by 8.1 % over that
of the same quarter of the previous year. The decrease in comparison to the previous quarter was thus reduced to 2.1 %.
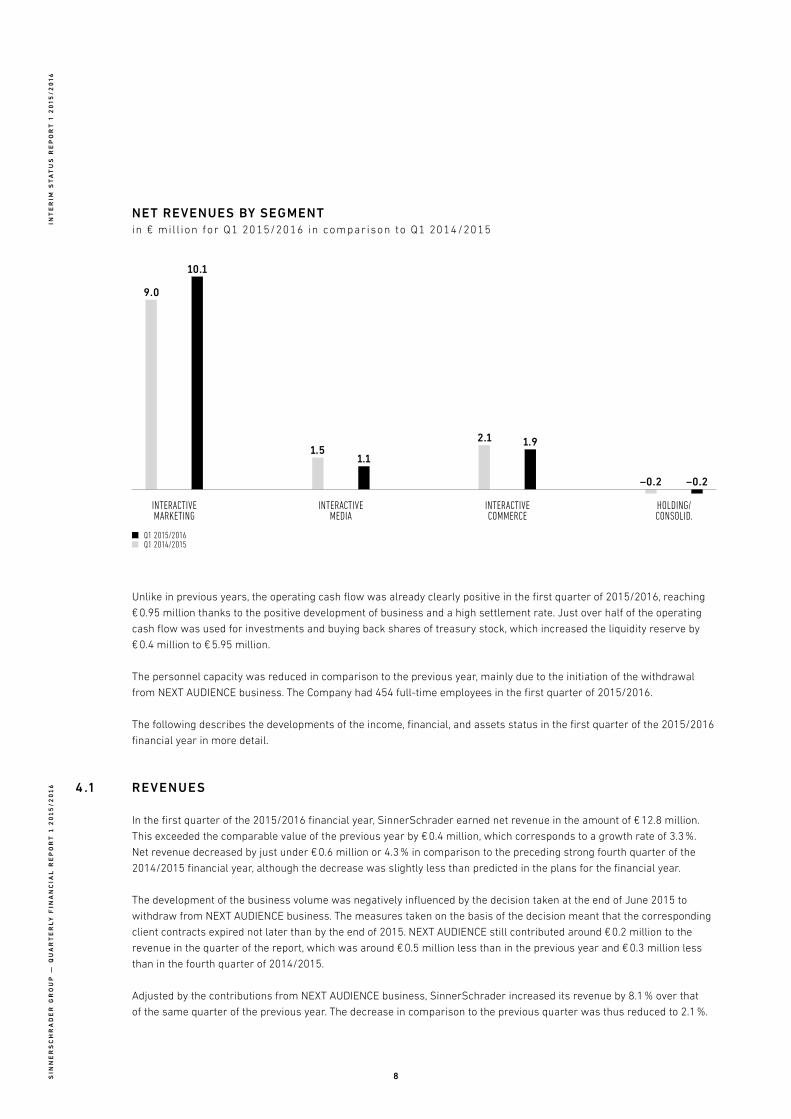
net reVenues By segmentin € mil l ion for Q1 2015/2016 in comparison to Q1 2014/2015
interactive commerce
holding/conSolid.
interactive marketing
interactive media
2.1
–0.2–0.2
10.1
1.1
1.91.5
9.0
Q1 2015/2016 Q1 2014/2015
8

sin
ne
rs
ch
ra
de
r g
ro
up
— q
ua
rt
er
ly
Fin
an
cia
l r
ep
or
t 1
20
15
/2
01
6
int
er
im s
ta
tu
s r
ep
or
t 1
20
15/
20
16
In the breakdown by segment in the first quarter of 2015/2016, Sinner Schrader business only increased over the
previous year in the Interactive Marketing segment. The increase amounted to € 1.1 million, which corresponds to
a growth rate of 12.4 %. Segment revenue thus reached € 10.1 million in the quarter of the report. The Sinner Schrader
agency and Sinner Schrader Mobile both contributed a share to the increase in revenue, with the Sinner Schrader Mobile
development of revenue being driven not least of all by the first-time consolidation of mobile agency Swipe GmbH, taken
over at the end of June 2015, for the full period in the quarter of the report.
While the dynamics of the development of revenue for the segment were shown to be somewhat restrained in the
quarter of the report, the orders received in the Sinner Schrader agency in the same period were an indication that there
could be more impetus in the coming quarters. The volume of incoming orders exceeded € 12 million in the first quarter
of 2015/2016, which was around twice as high as a year earlier.
In the Interactive Media segment, the first step in the resolved withdrawal from NEXT AUDIENCE business was completed.
In contrast, content marketing business increased by around 9.0 %. The two developments added up to a € 0.4 million, or
28.3 %, decrease in revenue in comparison to the previous year, to amount to € 1.1 million for the segment.
Revenue generated in the Interactive Commerce segment also declined. As expected, it was not possible to fully offset
a contraction of the budgets of some major clients with business with new clients. Revenue decreased by a good
€ 0.2 million, or 11.1 %, to € 1.9 million, which approximately corresponds to the quarterly average of the targeted total
annual revenue. Fortunately, a promising new e-commerce client, HSE24, was acquired towards the end of the quarter,
though hardly any contribution to revenue has been generated yet in the quarter of the report.
The comparison with the previous quarter also focuses on the Interactive Marketing segment, in which revenue in the
first quarter of 2015/2016 was € 0.5 million lower than in the previous quarter. The main reasons for this decline was the
decreasing activity conducted by some accounts at the end of the year, and a low productive capacity due to training
initiatives and annual conferences such as the trend conference NEXT and the European JavaScript conference JSConf EU,
both of which took take place in September for the first time.
deVelopment oF the reVenue structure according to client siZe and sector in % for Q1 2015/2016 in comparison to Q1 2014/2015 and the 2014/2015 f inancial year
Financial year2014/2015
Q12015/2016
74.1
18.019.7
15.918.7
40.238.0
100 %73.9
16.6
21.7
35.6
76.4
Q12014/2015
Financial year2014/2015
Q12015/2016
Q12014/2015
top 1 top 2–5 top 6–10
retail & conSumer goodS Financial ServiceS telecommunicationS & technology
tranSport & touriSm media & entertainment other
4.5
38.8
17.4
3.54.8
28.122.8
16.619.6
4.24.9
15.916.1
31.731.8
2.8
12.8
23.7
9

sin
ne
rs
ch
ra
de
r g
ro
up
— q
ua
rt
er
ly
Fin
an
cia
l r
ep
or
t 1
20
15
/2
01
6
int
er
im s
ta
tu
s r
ep
or
t 1
20
15/
20
16
The revenue in the two other segments decreased slightly, in each case by € 0.05 million in comparison to the previous
quarter, with losses in NEXT AUDIENCE business being largely offset by an increase in the volume of content marketing
business in the Interactive Media segment.
The new-client rate – the revenue generated with clients with whom the Sinner Schrader Group had not conducted any
business in the comparable period of the previous year – for all the segments was at a good 16.6 % in the first quarter of
2015/2016. It was strongly characterised by the acquisition of new clients in the preceding fourth quarter of 2014/2015,
and easily exceeded the figure in the first quarter of 2014/2015. Revenue generated with new clients amounted to an
absolute € 2.2 million in the quarter of the report. Existing budgets decreased by around € 1.3 million beyond the scope of
the contraction in revenue with existing clients in NEXT AUDIENCE business.
The biggest client accounted for 21.7 % of revenue in the first quarter of 2015/2016. This share was 15.9 % in the previous
year as a whole. In spite of the increase in the share of the leading client, the client concentration declined slightly in
the distribution of revenue in the quarter of the report in comparison to the distribution for the previous year as a whole.
The five biggest clients accounted for 57.3 % of the total revenue, compared to 56.2 % for these clients in the previous
year. The ten biggest clients accounted for 73.9 % of revenue in the quarter of the report, after 74.1 % in the previous year.
In the sector mix, the continuation of the trend towards a revitalisation of Financial Services clients as seen in the previous
financial year was reinforced. Their share in the overall revenue of the Sinner Schrader Group rose to 38.8 % after having
settled at 28.1 % for the entire financial year of 2014/2015. This development is almost entirely due to the increase in the
budgets of existing clients, who are now stepping up their investments in the digital transformation of their company. By
contrast, the share of clients in the Telecommunications & Technology sector was reduced from 31.7 % in the 2014/2015
financial year to 23.7 % in the quarter of the report. This development is also mainly caused by existing clients, some of
whom have started implementing an in-house sourcing strategy for individual service areas.
In the first quarter of 2015/2016, Sinner Schrader achieved 17.4 % of the revenue with clients from the Transport &
Tourism sector, which approximately corresponds to the share of 16.6 % for the previous year. Sinner Schrader was able
to acquire two important new clients, who more than balanced the reductions in budgets with existing clients, in the
fourth quarter of 2014/2015.
In the quarter of the report, there were likewise no significant impulses generated by the Retail & Consumer Goods sector,
in which shares in the revenue have been steadily decreasing the past few years. The share of revenue for the Group
continued to fall, from 15.9 % in the 2014/2015 financial year of as a whole, to 12.8 % in the quarter of the report. The
share of clients in the Media & Entertainment sector also fell, from 4.2 % to 2.8 %, in the quarter of the report. Other clients
accounted for a share of revenue of 4.5 %, 1.0 percentage points more than in the 2014/2015 financial year as a whole.
4 .2 operating result (eBita)
The operating result (EBITA) of the Sinner Schrader Group amounted to a good € 0.8 million in the first quarter of
2015/2016, thus exceeding the EBITA in the first quarter of 2014/2015 by just under € 0.6 million, or threefold. In addition
to the growth in revenue, the efficiency improvements implemented last year contributed more than anything else to the
upturn in income.
The reduction in the operating losses from NEXT AUDIENCE business accounted for a good € 0.1 million of the rise in
income. A loss of just under € 0.3 million was nevertheless incurred in the quarter of the report, without which the
operating result would have amounted to around € 1.1 million.
The operating margin, at 6.5 % on the inclusion of the NEXT AUDIENCE losses and at 8.7 % without these losses, fell short
of the margin of around 10 % targeted for the financial year. This was not least due to broad training initiatives with
a focus on agile project methodologies in the first months of the financial year and to the fact that the two conferences
organised by Sinner Schrader – the trend conference NEXT and the European JavaScript conference JSConf EU – were
held in September 2015.
10

sin
ne
rs
ch
ra
de
r g
ro
up
— q
ua
rt
er
ly
Fin
an
cia
l r
ep
or
t 1
20
15
/2
01
6
int
er
im s
ta
tu
s r
ep
or
t 1
20
15/
20
16
Around € 0.5 million of the rise in Group income over the same quarter of the previous year was generated in the
Interactive Marketing segment, which achieved an EBITA of € 1 million. The development of the EBITA in the Interactive
Media segment was also positive as the gradual withdrawal from loss-generating NEXT AUDIENCE business progressed.
The operating result in this segment improved by € 0.1 million and was just balanced in the quarter of the report. In
comparison to the previous year, the operating result was negative in the Interactive Commerce segment. The fall in
revenue meant that the EBITA was reduced by € 0.1 million to break even.
Furthermore, in the quarter of the report, the holding company accounted for just under € 0.1 million of the rise in Group
income in comparison to the previous year. An increase in expenses to be allocated accompanied by lower administration
expenses resulted in this reduction of surplus costs in the holding company.
A look at the overall Statement of Operations for the Sinner Schrader Group shows that the trebling of the operating
result in the first quarter of 2015/2016 was mainly achieved through an improvement in the gross profit and a reduction
in marketing costs. With the cost of revenues at the same level as in the previous year, the increase in revenue was
completely reflected to the amount of € 0.4 million in the gross profit. The gross margin was thus improved by
2.7 percentage points, to 24.0 % in the quarter of the report.
The marketing costs were reduced by just under € 0.3 million in comparison to the previous year, mainly as a result of the
halt to marketing and sales efforts in NEXT AUDIENCE business. Sinner Schrader was able to achieve the high volume of
incoming orders without significantly increased marketing costs, particularly in the Interactive Marketing segment, thanks
to high demand pressure. The costs for holding the conferences were mainly covered by income from sponsoring and
tickets sales. In relation to revenue, the marketing costs decreased by 2.3 percentage points, to 5.5 % of the revenue in the
quarter of the report.
The general and administrative costs were stable in comparison to the previous year. In a first step, mainly carried out
with a view to possibly selling the software for consolidation tasks, research and development costs decreased by just
under € 0.1 million to around € 0.15 million as a result of downsizing the NEXT AUDIENCE development team.
eBita By segmentin € mil l ion for Q1 2015/2016 in comparison to Q1 2014/2015
interactive commerce
holding/conSolid.
interactive marketing
interactive media
0.0
0.1
–0.2–0.3
1.0
–0.1
0.5
–0.0
Q1 2015/2016 Q1 2014/2015
11

sin
ne
rs
ch
ra
de
r g
ro
up
— q
ua
rt
er
ly
Fin
an
cia
l r
ep
or
t 1
20
15
/2
01
6
int
er
im s
ta
tu
s r
ep
or
t 1
20
15/
20
16
The balance of other income and expenses was slightly negative in the quarter of the report, falling short by just under
€ 0.2 million of the same quarter of the previous year, in which comparatively high non-periodic income was generated
from the resolution of reserves and from non-enforced liabilities.
A breakdown of costs shows that, in addition to the revenue growth, the improvement in the profit is the result of
a reduction in personnel costs in the amount of a good € 0.2 million, a decrease of a good € 0.2 million in the cost of
purchased goods and services and lower depreciation in the amount of € 0.1 million. The cost cuts were matched by
higher other operating expenses in the amount of € 0.2 million and by the negative difference in the balance of other
income and expenses already mentioned.
In the case of the decrease in personnel costs, a reduction in the personnel capacity of just under 33 full-time employees,
or 6.7 %, was matched by a 4.4 % increase in average costs per full-time employee. More than anything else, the
personnel measures resulting from the decision to withdraw from NEXT AUDIENCE business accounted for the decrease
in the personnel capacity. The decrease is however also partly due to the fact that it was not possible to implement the
scheduled increases in capacity in the expected time frame in an increasingly tighter human resources market. The
reduction in the cost of purchased goods and services, at 9.1 % in comparison to the same quarter of the previous year,
thus fell slightly short of plans.
The reduction of one third in depreciation was mainly the result of the software for the NEXT AUDIENCE Platform being
written off to zero by way of scheduled and unscheduled depreciation in the Annual Report as at 31 August 2015.
The operating result in the quarter of the report also fell short of the figure achieved in the preceding fourth quarter, in
line with the development of revenue, with profitability declining temporarily, particularly in the Interactive Marketing
segment, mainly as a result of the direct costs and the cost of time required for the training initiatives and conferences.
The extraordinary charges resulting from the unscheduled depreciation of NEXT AUDIENCE software and the cost
of initial personnel measures for NEXT AUDIENCE in the Interactive Media segment showed a contrasting development.
development of costs by funct ion
Q1 2015/2016 Q1 2014/2015 change
in € 000S in %1) in € 000S in %1) in %
Cost of revenues 9,741 76.0 9,755 78.7 –0.1
Costs of marketing 705 5.5 964 7.8 –26.8
General and administrative costs 1,359 10.6 1,352 10.9 0.5
Research and development costs 159 1.2 228 1.8 –30.5
development of costs by cost type
Q1 2015/2016 Q1 2014/2015 change
in € 000S in %1) in € 000S in %1) in %
Personnel expenses 7,764 60.6 7,970 64.3 –2.6
Costs of materials and services 2,344 18.3 2,579 20.8 –9.1
Other operating expenses 1,668 13.0 1,463 11.8 14.0
Depreciation 189 1.5 287 2.3 –34.2
1) As a percentage of net revenues
12

sin
ne
rs
ch
ra
de
r g
ro
up
— q
ua
rt
er
ly
Fin
an
cia
l r
ep
or
t 1
20
15
/2
01
6
int
er
im s
ta
tu
s r
ep
or
t 1
20
15/
20
16
4 .3 net income
With regard to net income, in the first quarter of 2015/2016 the positive operating development in comparison to the
same quarter of the previous year was further enhanced by the normalisation of the tax rate. There were no longer
any losses with no effect on taxes in the Statement of Operations in the quarter of the report following the recovery
of losses in NEXT AUDIENCE business and the stable income situation in the content marketing business conducted by
Sinner Schrader Content GmbH. The financial result was balanced, as in the same quarter of the previous year.
Net income thus reached just under € 0.6 million in the first quarter of 2015/2016, which is around four times the amount
for the same period of the previous year. Earnings per share amounted to € 0.05. Just like the EBITA, net income did not
reach the excellent figure achieved in the previous quarter.
4 .4 cash FloWs
The operating cash flow was positive in the first quarter of 2015/2016, and shows an inflow of funds in the amount of
€ 0.95 million.
Experience in the past few years, namely that clients defer payments as part of their year-end planning until into
December, thus causing the need for working capital to rise at a disproportionately high level as at the end of the first
quarter of the Sinner Schrader Group financial year, on 30 November, was not repeated in the period of the report.
The operating cash flow in the previous financial year amounted to € –4.3 million in the first quarter. This was mainly due
to the above-mentioned effect. The change is presumably not least of all due to the low appeal of liquidity in times of
negative interest rates for sight deposits.
This meant that in total, funds amounting to just under € 0.4 million were released from accounts receivable and
unbilled services in the quarter of the report. In the same period of the previous year, funds in the amount of just under
€ 3.7 million were tied up in these two items.
The change in the operating cash flow in comparison to the previous year was also reinforced by the elimination of
variable compensation at an employee level in the 2014/2015 financial year. In previous years, personnel provisions had
to be set aside for variable compensation by 31 August every year. Most of these provisions were used for paying
compensation during the course of the first quarter of the following financial year. An outflow of funds resulting from the
use of provisions in the amount of just under € 1.1 million thus resulted in the first quarter of the previous year. In contrast,
the development of provisions even showed an inflow of funds in the amount of € 0.15 million in the quarter of the report.
Investments were at a low level in the first quarter of 2015/2016. Offset by income from the occasional sale of operating
assets – slightly raised in the quarter of the report due to the breaking down of the NEXT AUDIENCE infrastructure, which
had already been commenced – the cash flow from investment activities only amounted to € –0.05 million. In the previous
year, the investment amount had been at just under € 0.2 million.
The cash flow from financing activities on the other hand showed that funds in the amount of € 0.5 million had been used.
This resulted from the resumption of buying back treasury stock in October 2015. Sinner Schrader AG repurchased
135,801 shares of treasury stock on the market for an average price (excluding expenses) of € 4.10 a share in the period
from 15 October to 30 November 2015. On the other hand, as part of the exercising of employee options, 25,000 shares
were issued to employees for an average exercise price of € 2.13.
In the total amount of cash flows resulting from operating, investment and financing activities there was an increase in
liquid funds in the amount of € 0.4 million in the first quarter of the current financial year. In the previous year, an outflow
of just under € 4.5 million resulted.
13

sin
ne
rs
ch
ra
de
r g
ro
up
— q
ua
rt
er
ly
Fin
an
cia
l r
ep
or
t 1
20
15
/2
01
6
int
er
im s
ta
tu
s r
ep
or
t 1
20
15/
20
16
4 .5 asset situation
There was hardly any change to the balance sheet of Sinner Schrader AG in the period from 31 August to 30 November
2015. The balance sheet total decreased overall by € 0.1 million, to € 27.6 million. The shareholders’ equity rate increased
slightly by 0.5 percentage points, to 54.4 %.
On the assets side, the increase in liquid funds of € 0.4 million was matched by a reduction in receivables from clients
and other receivables, which resulted in a slight decrease in current assets of just under € 0.05 million in net terms,
to € 20.3 million. Due to the low level of investment, non-current assets were also reduced slightly, by € 0.05 million to
€ 7.3 million as at 30 November 2015.
From a financing point of view, current liabilities increased slightly by € 0.1 million, while deferred tax liabilities reported
as non-current liabilities in the amount of € 0.3 million on 31 August 2015 were to be reversed as at 30 November 2015.
Payments received and tax debts in short-term liability items increased in each case by just under € 0.56 million, and
reserves by € 0.15 million, while liabilities to suppliers and other current liabilities were reduced by € 0.5 million and
€ 0.6 million, respectively.
Shareholders’ equity rose by just under € 0.1 million as a result of the positive net income balance of just under
€ 0.6 million and the effect on shareholders’ equity from the repurchase of treasury stock in the amount of € 0.5 million.
4 .6 employees
The number of employees in the Sinner Schrader Group decreased from 506 employees on 31 August 2015 to
494 employees on 30 November 2015. The partial reduction in the NEXT AUDIENCE workforce as at 30 September 2015
resulted in a decrease of 14 employees in the workforce, which meant that the total number of employees in the other
units increased slightly by 2 employees in the first quarter of 2015/2016.
The number of employees in the Interactive Marketing segment was increased from 337 employees on 31 August 2015
to 342 employees on 30 November 2015. However, given the tight situation on human resources markets, the addition to
the number of employees remained behind the plan.
There were 31 employees in the Interactive Media segment on the balance sheet date of the quarter of the report, after
43 employees at the end of the previous financial year. The reduction at NEXT AUDIENCE, as already mentioned, was
matched by an increase of 2 employees in the number of staff working in content marketing business.
The Interactive Commerce segment adjusted the number of employees downwards again as planned in view of the flat
revenue development forecast for the 2015/2016 financial year by way of non-replacement in the event of fluctuation. On
the reporting date there were 78 employees in comparison to 83 employees three months previously.
On 30 November 2015 there were 43 employees working in the holding company, which was unchanged in comparison to
the status on 31 August 2015.
On 30 November 2014, the staff of the Sinner Schrader Group comprised 535 employees, spread as 340, 51, 100 and
44 employees, respectively, over the Interactive Marketing, Interactive Media and Interactive Commerce segments and the
holding company.
Of the 494 employees on 30 November 2015, 13 employees were receiving vocational training, 39 employees were
working as students or completing an internship.
According to the classification by functional areas, 139 of the 494 employees worked in consulting (including strategy,
data analysis and media planning), 188 employees in technology, 112 employees in the area of creation and 55 employees
in administrative functions. The comparative figures on 31 August 2015 were 152, 195, 104 and 55 employees.
14
sin
ne
rs
ch
ra
de
r g
ro
up
— q
ua
rt
er
ly
Fin
an
cia
l r
ep
or
t 1
20
15
/2
01
6
int
er
im s
ta
tu
s r
ep
or
t 1
20
15/
20
16
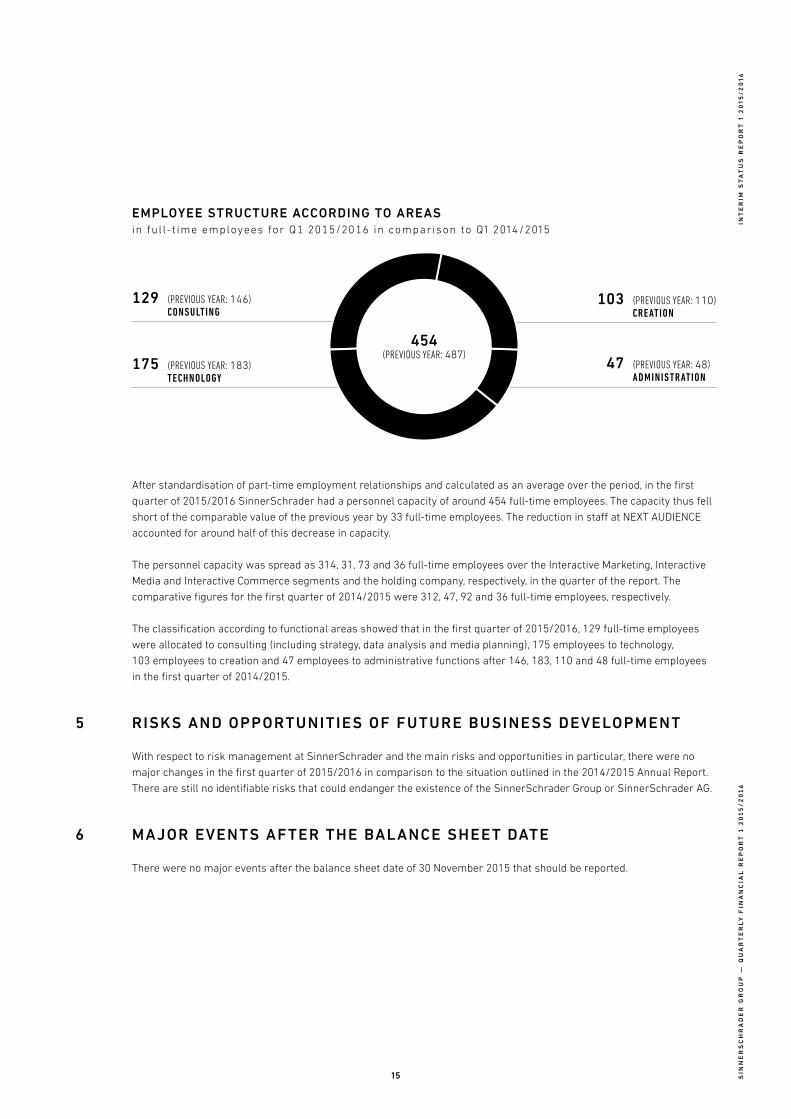
After standardisation of part-time employment relationships and calculated as an average over the period, in the first
quarter of 2015/2016 Sinner Schrader had a personnel capacity of around 454 full-time employees. The capacity thus fell
short of the comparable value of the previous year by 33 full-time employees. The reduction in staff at NEXT AUDIENCE
accounted for around half of this decrease in capacity.
The personnel capacity was spread as 314, 31, 73 and 36 full-time employees over the Interactive Marketing, Interactive
Media and Interactive Commerce segments and the holding company, respectively, in the quarter of the report. The
comparative figures for the first quarter of 2014/2015 were 312, 47, 92 and 36 full-time employees, respectively.
The classification according to functional areas showed that in the first quarter of 2015/2016, 129 full-time employees
were allocated to consulting (including strategy, data analysis and media planning), 175 employees to technology,
103 employees to creation and 47 employees to administrative functions after 146, 183, 110 and 48 full-time employees
in the first quarter of 2014/2015.
5 risKs and opportunities oF Future Business deVelopment
With respect to risk management at Sinner Schrader and the main risks and opportunities in particular, there were no
major changes in the first quarter of 2015/2016 in comparison to the situation outlined in the 2014/2015 Annual Report.
There are still no identifiable risks that could endanger the existence of the Sinner Schrader Group or Sinner Schrader AG.
6 maJor eVents aFter the Balance sheet date
There were no major events after the balance sheet date of 30 November 2015 that should be reported.
129 (previouS year: 146) consulting
47 (previouS year: 48) AdministrAtion
103 (previouS year: 110) creAtion
175 (previouS year: 183) technology
454 (previouS year: 487)
employee structure according to areasin ful l- t ime employees for Q1 2015/2016 in comparison to Q1 2014/2015
15

sin
ne
rs
ch
ra
de
r g
ro
up
— q
ua
rt
er
ly
Fin
an
cia
l r
ep
or
t 1
20
15
/2
01
6
int
er
im s
ta
tu
s r
ep
or
t 1
20
15/
20
16
7 Forecast
Sinner Schrader started the 2015/2016 financial year well. The Group’s revenue and profit were slightly above internal
plans. The withdrawal from the NEXT AUDIENCE business progressed according to plan and will be completed in the first
calendar quarter of 2016, as intended.
The revenue development of the first quarter does not completely reflect the high level of demand for services from the
Sinner Schrader Group: The volume of incoming orders from existing and new clients in the Interactive Marketing
segment in the first quarter of 2015/2016 was around twice as high as a year earlier. In the content marketing business,
which is assigned to the Interactive Media segment, the visibility of Sinner Schrader’s expertise has noticeably increased
and resulted in inquiries with great potential. And the Interactive Commerce segment, in which revenue had fallen in
comparison to the previous year, mainly due to budget cuts by a major existing client, ended the quarter of the report with
the pleasing news of a new client in the form of the e-commerce client HSE24.
The dynamism of the market that Sinner Schrader is currently experiencing is against the backdrop of a positive overall
economic mood in Germany, great dynamism in the service markets in general and a noticeable determination in the
decision-making bodies of German companies to seriously address the challenges of the digital transformation and
to allocate sufficient budget funds to it. A typical example of this is the announcement by Deutsche Bank in the spring of
2015 that it would invest around € 1 billion in digital projects. The pronouncements by the CEO of Allianz, Oliver Bäte,
in an interview with the German business journal “WirtschaftsWoche” in November 2015 also point in this direction. Large
teams from Sinner Schrader are involved as a digital agency in both of these companies.
Certain events at the start of the 2016 calendar year, however, once again clearly show the risks to overall economic
development in Germany which, if they occur, would not fail to leave their mark on digital budgets and therefore on
Sinner Schrader: the challenges of the refugee crisis, the unsolved conflicts in the Middle East, the economic difficulties
in China and other emerging countries as well as threats to the cohesion of the European Community.
Provided that the above-mentioned problem areas do not result in any major adverse effects to German economic
development and companies’ investment behaviour, Sinner Schrader is assuming that it will achieve the forecast for the
2015/2016 financial year announced in November 2015 – revenue of around € 50.5 million, EBITA in the order of
€ 5 million and net income of over € 3 million or more than € 0.26 per share.
Hamburg, 14 January 2016
The Management Board
Matthias Schrader Thomas Dyckhoff
16

0201 | interim status report 1 2015/2016 05–16
02 | consolidated quarterly accounts 1 2015/2016 18–33

sin
ne
rs
ch
ra
de
r g
ro
up
— q
ua
rt
er
ly
Fin
an
cia
l r
ep
or
t 1
20
15
/2
01
6
co
ns
ol
ida
te
d q
ua
rt
er
ly
ac
co
un
ts
1 2
015
/2
016
consolidated Balance sheetsas at 30 noVemBer 2015
Assets in € 30.11.2015 31.08.2015
Current assets:
Liquid funds 5,950,977 5,558,880
Liquid funds 5,950,977 5,558,880
Accounts receivable, net of allowances for doubtful accounts of € 62,350 and € 52,150, respectively 9,694,146 10,325,660
Unbilled revenues 4,044,747 3,784,261
Tax receivables 22,838 22,838
Other current assets and prepaid expenses 632,828 696,172
Total current assets 20,345,536 20,387,811
Non-current assets:
Goodwill 4,820,937 4,820,937
Other intangible assets 155,566 177,682
Property and equipment 1,489,143 1,602,527
Tax receivables 45,329 68,649
Deferred tax assets 782,284 672,475
Total non-current assets 7,293,259 7,342,270
Total assets 27,638,795 27,730,081
18
sin
ne
rs
ch
ra
de
r g
ro
up
— q
ua
rt
er
ly
Fin
an
cia
l r
ep
or
t 1
20
15
/2
01
6
co
ns
ol
ida
te
d q
ua
rt
er
ly
ac
co
un
ts
1 2
015
/2
016
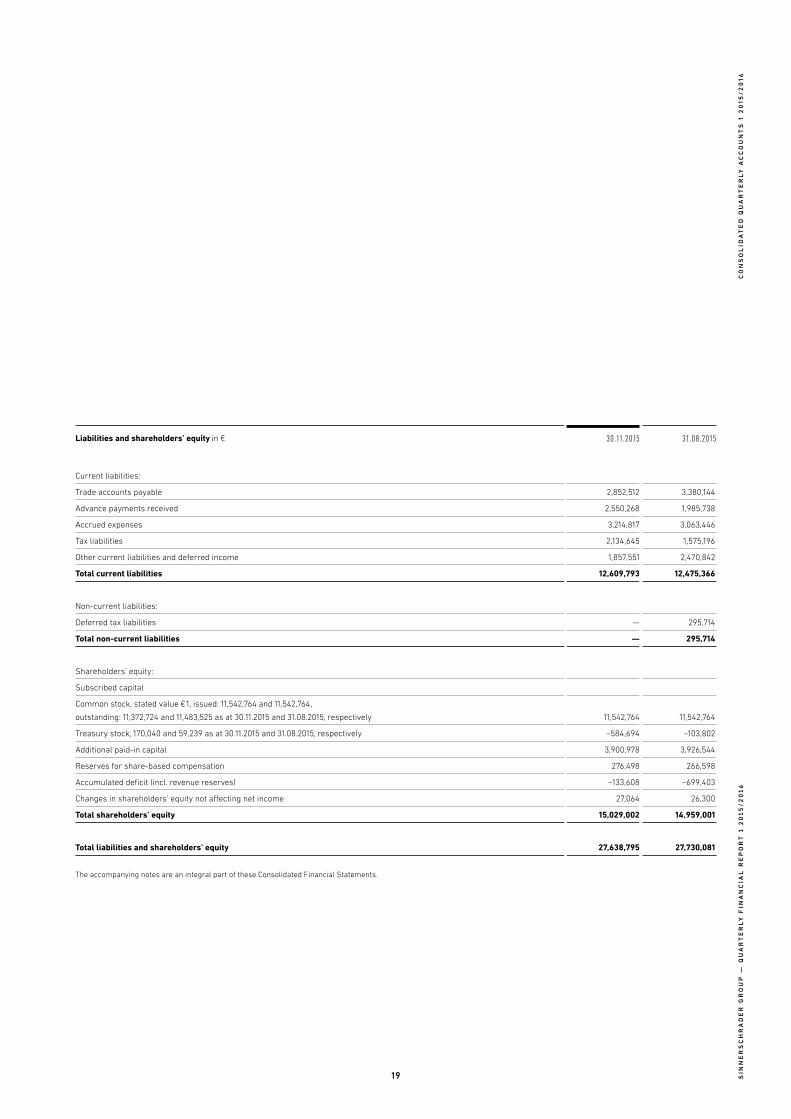
Liabilities and shareholders’ equity in € 30.11.2015 31.08.2015
Current liabilities:
Trade accounts payable 2,852,512 3,380,144
Advance payments received 2,550,268 1,985,738
Accrued expenses 3,214,817 3,063,446
Tax liabilities 2,134,645 1,575,196
Other current liabilities and deferred income 1,857,551 2,470,842
Total current liabilities 12,609,793 12,475,366
Non-current liabilities:
Deferred tax liabilities — 295,714
Total non-current liabilities — 295,714
Shareholders’ equity:
Subscribed capital
Common stock, stated value € 1, issued: 11,542,764 and 11,542,764,
outstanding: 11,372,724 and 11,483,525 as at 30.11.2015 and 31.08.2015, respectively 11,542,764 11,542,764
Treasury stock, 170,040 and 59,239 as at 30.11.2015 and 31.08.2015, respectively –584,694 –103,802
Additional paid-in capital 3,900,978 3,926,544
Reserves for share-based compensation 276,498 266,598
Accumulated deficit (incl. revenue reserves) –133,608 –699,403
Changes in shareholders’ equity not affecting net income 27,064 26,300
Total shareholders’ equity 15,029,002 14,959,001
Total liabilities and shareholders’ equity 27,638,795 27,730,081
The accompanying notes are an integral part of these Consolidated Financial Statements.
19

sin
ne
rs
ch
ra
de
r g
ro
up
— q
ua
rt
er
ly
Fin
an
cia
l r
ep
or
t 1
20
15
/2
01
6
co
ns
ol
ida
te
d q
ua
rt
er
ly
ac
co
un
ts
1 2
015
/2
016
consolidated stateMents of operationsFrom 1 septemBer to 30 noVemBer 2015
in € Q1 2015/2016 Q1 2014/2015
Gross revenues 13,039,773 13,492,999
Media costs –228,191 –1,092,373
Total revenues, net 12,811,582 12,400,626
Cost of revenues –9,741,301 –9,754,559
Gross profit 3,070,281 2,646,067
Selling and marketing expenses –705,472 –963,800
General and administrative expenses –1,359,226 –1,351,939
Research and development expenses –158,694 –228,437
Other income and expenses, net –11,781 170,567
Operating income 835,108 272,458
Financial income 513 1,420
Financial expenses –307 –1,420
Income before provision for income tax 835,314 272,458
Income tax –269,519 –130,780
Net income 565,795 141,678
Net income attributable to the shareholders of SinnerSchrader AG 565,795 141,678
Net income per share (basic) 0.05 0.01
Net income per share (diluted) 0.05 0.01
Weighted average shares outstanding (basic) 11,447,582 11,235,858
Weighted average shares outstanding (diluted) 11,548,644 11,400,869
The accompanying notes are an integral part of these Consolidated Financial Statements.
20

sin
ne
rs
ch
ra
de
r g
ro
up
— q
ua
rt
er
ly
Fin
an
cia
l r
ep
or
t 1
20
15
/2
01
6
co
ns
ol
ida
te
d q
ua
rt
er
ly
ac
co
un
ts
1 2
015
/2
016
consolidated stateMents of coMprehensive incoMeFrom 1 septemBer to 30 noVemBer 2015
in € Q1 2015/2016 Q1 2014/2015
Net income 565,795 141,678
Other comprehensive income
Items that may be reclassified to profit or loss in future periods
Foreign currency translation adjustment 764 628
Changes in shareholders’ equity not affecting net income 764 628
Consolidated comprehensive income 566,559 142,306
Comprehensive income attributable to the shareholders of SinnerSchrader AG 566,559 142,306
The accompanying notes are an integral part of these Consolidated Financial Statements.
21

sin
ne
rs
ch
ra
de
r g
ro
up
— q
ua
rt
er
ly
Fin
an
cia
l r
ep
or
t 1
20
15
/2
01
6
co
ns
ol
ida
te
d q
ua
rt
er
ly
ac
co
un
ts
1 2
015
/2
016
consolidated stateMents of shareholders’ equityFrom 1 septemBer to 30 noVemBer 2015
in € number oF ShareS outStanding
common Stock
treaSury Stock
additional paid-in capital
reServeS For Share-baSed compenSation
retained earningS/loSSeS
other comprehenSive income
total ShareholderS’ eQuity
Balance as at 31.08.2014 11,235,858 11,542,764 –537,778 3,654,636 260,077 –869,487 25,162 14,075,374
Comprehensive income — — — — — 141,678 628 142,306
Deferred compensation — — — — 2,704 — — 2,704
Balance as at 30.11.2014 11,235,858 11,542,764 –537,778 3,654,636 262,781 –727,809 25,790 14,220,384
Balance as at 31.08.2015 11,483,525 11,542,764 –103,802 3,926,544 266,598 –699,403 26,300 14,959,001
Comprehensive income — — — — — 565,795 764 566,559
Deferred compensation — — — — 9,900 — — 9,900
Purchase of treasury stock –135,801 — –559,708 — — — — –559,708
Re-issuance of treasury stock 25,000 — 78,816 –25,566 — — — 53,250
Balance as at 30.11.2015 11,372,724 11,542,764 –584,694 3,900,978 276,498 –133,608 27,064 15,029,002
The accompanying notes are an integral part of these Consolidated Financial Statements.
22

sin
ne
rs
ch
ra
de
r g
ro
up
— q
ua
rt
er
ly
Fin
an
cia
l r
ep
or
t 1
20
15
/2
01
6
co
ns
ol
ida
te
d q
ua
rt
er
ly
ac
co
un
ts
1 2
015
/2
016
consolidated stateMents of shareholders’ equityFrom 1 septemBer to 30 noVemBer 2015
in € number oF ShareS outStanding
common Stock
treaSury Stock
additional paid-in capital
reServeS For Share-baSed compenSation
retained earningS/loSSeS
other comprehenSive income
total ShareholderS’ eQuity
Balance as at 31.08.2014 11,235,858 11,542,764 –537,778 3,654,636 260,077 –869,487 25,162 14,075,374
Comprehensive income — — — — — 141,678 628 142,306
Deferred compensation — — — — 2,704 — — 2,704
Balance as at 30.11.2014 11,235,858 11,542,764 –537,778 3,654,636 262,781 –727,809 25,790 14,220,384
Balance as at 31.08.2015 11,483,525 11,542,764 –103,802 3,926,544 266,598 –699,403 26,300 14,959,001
Comprehensive income — — — — — 565,795 764 566,559
Deferred compensation — — — — 9,900 — — 9,900
Purchase of treasury stock –135,801 — –559,708 — — — — –559,708
Re-issuance of treasury stock 25,000 — 78,816 –25,566 — — — 53,250
Balance as at 30.11.2015 11,372,724 11,542,764 –584,694 3,900,978 276,498 –133,608 27,064 15,029,002
The accompanying notes are an integral part of these Consolidated Financial Statements.
23
sin
ne
rs
ch
ra
de
r g
ro
up
— q
ua
rt
er
ly
Fin
an
cia
l r
ep
or
t 1
20
15
/2
01
6
co
ns
ol
ida
te
d q
ua
rt
er
ly
ac
co
un
ts
1 2
015
/2
016
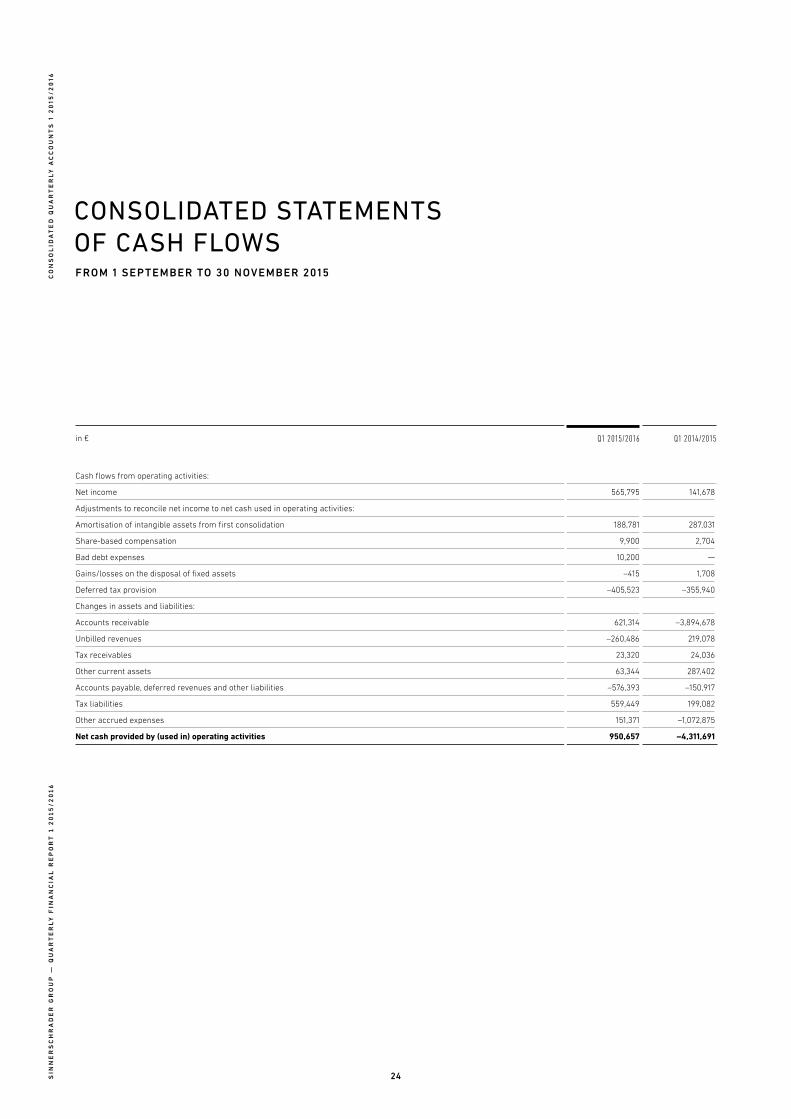
consolidated stateMents of cash flowsFrom 1 septemBer to 30 noVemBer 2015
in € Q1 2015/2016 Q1 2014/2015
Cash flows from operating activities:
Net income 565,795 141,678
Adjustments to reconcile net income to net cash used in operating activities:
Amortisation of intangible assets from first consolidation 188,781 287,031
Share-based compensation 9,900 2,704
Bad debt expenses 10,200 —
Gains/losses on the disposal of fixed assets –415 1,708
Deferred tax provision –405,523 –355,940
Changes in assets and liabilities:
Accounts receivable 621,314 –3,894,678
Unbilled revenues –260,486 219,078
Tax receivables 23,320 24,036
Other current assets 63,344 287,402
Accounts payable, deferred revenues and other liabilities –576,393 –150,917
Tax liabilities 559,449 199,082
Other accrued expenses 151,371 –1,072,875
Net cash provided by (used in) operating activities 950,657 –4,311,691
24

sin
ne
rs
ch
ra
de
r g
ro
up
— q
ua
rt
er
ly
Fin
an
cia
l r
ep
or
t 1
20
15
/2
01
6
co
ns
ol
ida
te
d q
ua
rt
er
ly
ac
co
un
ts
1 2
015
/2
016
in € Q1 2015/2016 Q1 2014/2015
Cash flows from investing activities:
Purchase of property and equipment –65,252 –173,459
Proceeds from the sale of equipment 12,386 9,504
Net cash provided by (used in) investing activities –52,866 –163,955
Cash flows from financing activities:
Payment for treasury stock –559,708 —
Incoming payment for treasury stock 53,250 —
Net cash provided by (used in) financing activities –506,458 —
Net effect of rate changes on cash and cash equivalents 764 628
Net increase/decrease in cash and cash equivalents 392,097 –4,475,018
Cash and cash equivalents at beginning of period 5,558,880 5,832,597
Cash and cash equivalents at end of period 5,950,977 1,357,579
For information only, contained in cash flows from operating activities:
Interest payment received 91 632
Paid interest –307 –1,420
The accompanying notes are an integral part of these Consolidated Financial Statements.
25

sin
ne
rs
ch
ra
de
r g
ro
up
— q
ua
rt
er
ly
Fin
an
cia
l r
ep
or
t 1
20
15
/2
01
6
co
ns
ol
ida
te
d q
ua
rt
er
ly
ac
co
un
ts
1 2
015
/2
016
notes as at 30 noVemBer 2015
26

sin
ne
rs
ch
ra
de
r g
ro
up
— q
ua
rt
er
ly
Fin
an
cia
l r
ep
or
t 1
20
15
/2
01
6
co
ns
ol
ida
te
d q
ua
rt
er
ly
ac
co
un
ts
1 2
015
/2
016
1 general Foundations
The Consolidated Interim Financial Statements as at 30 November 2015 of SinnerSchrader Aktiengesellschaft
(“ SinnerSchrader AG” or “AG”) and its subsidiaries (“SinnerSchrader Group”, “SinnerSchrader”, or “Group”) for the first
quarter of the 2015/2016 financial year from 1 September to 30 November 2015 were prepared according to the
International Financial Reporting Standards (“IFRS”) of the International Accounting Standards Board (“IASB”) in force on
the report date, taking account of the interpretations of the International Financial Reporting Interpretations Committee
(“IFRIC”) and in compliance with the standard for interim financial reports specified by DRS 16 of the German Accounting
Standards. They were not subject to auditing and should be read in conjunction with the Consolidated Financial
Statements of SinnerSchrader AG as at 31 August 2015.
The accounting, valuation, and consolidation principles of the Quarterly Report at hand are unchanged from the Group’s
Consolidated Financial Statements as at 31 August 2015. They are disclosed and explained in the Group’s Consolidated
Financial Statements as at 31 August 2015, which are published in the 2014/2015 Annual Report.
2 consolidation group
The consolidation group as at 30 November 2015 consists of SinnerSchrader AG as well as the following direct and
indirect subsidiaries of the AG, each of which is fully consolidated:
1. Sinner Schrader Deutschland GmbH, Hamburg, Germany
2. Commerce Plus GmbH, Hamburg, Germany
3. Commerce Plus Consulting GmbH, Hamburg, Germany
4. NEXT AUDIENCE GmbH, Hamburg, Germany
5. Sinner Schrader Content GmbH, Hamburg, Germany
6. Sinner Schrader Mobile GmbH, Berlin, Germany
7. Swipe GmbH, Hamburg, Germany
8. Sinner Schrader Praha s.r.o., Prague, Czech Republic
9. Sinner Schrader UK Ltd., London, UK
10. Sinner Schrader Benelux BV, Rotterdam, the Netherlands
The consolidation group has not changed in comparison to the status on 31 August 2015.
27
sin
ne
rs
ch
ra
de
r g
ro
up
— q
ua
rt
er
ly
Fin
an
cia
l r
ep
or
t 1
20
15
/2
01
6
co
ns
ol
ida
te
d q
ua
rt
er
ly
ac
co
un
ts
1 2
015
/2
016
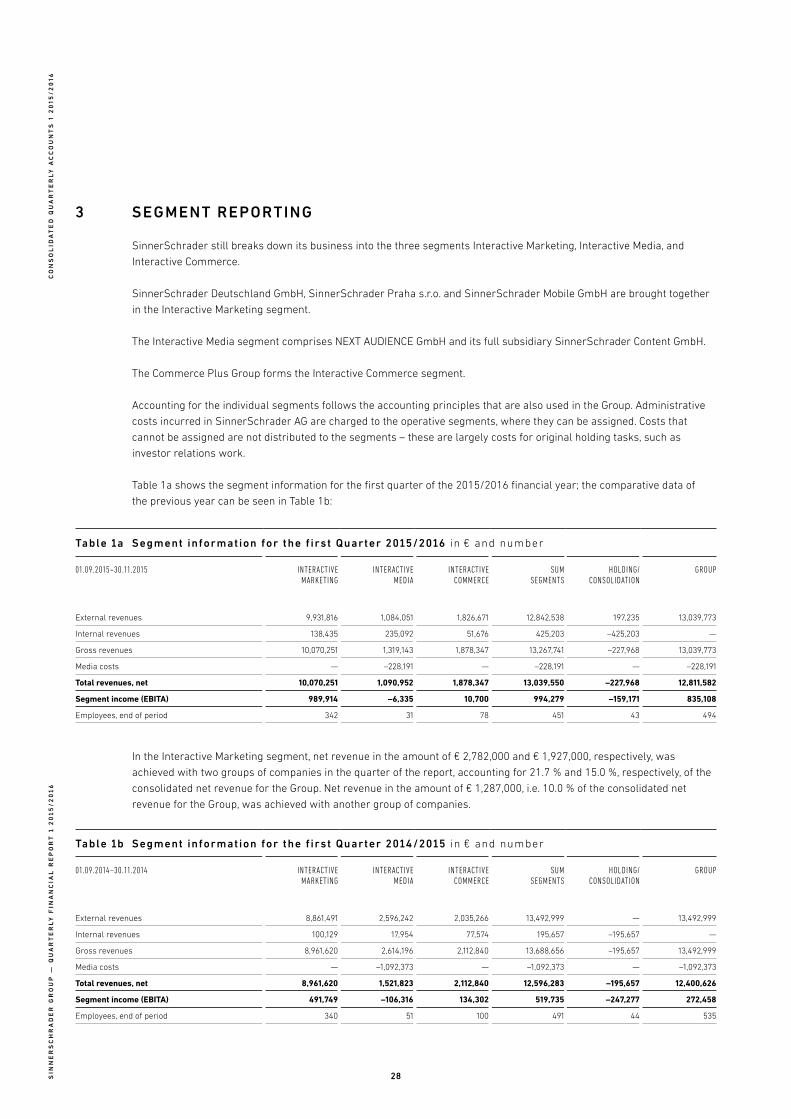
3 segment reporting
SinnerSchrader still breaks down its business into the three segments Interactive Marketing, Interactive Media, and
Interactive Commerce.
SinnerSchrader Deutschland GmbH, SinnerSchrader Praha s.r.o. and SinnerSchrader Mobile GmbH are brought together
in the Interactive Marketing segment.
The Interactive Media segment comprises NEXT AUDIENCE GmbH and its full subsidiary SinnerSchrader Content GmbH.
The Commerce Plus Group forms the Interactive Commerce segment.
Accounting for the individual segments follows the accounting principles that are also used in the Group. Administrative
costs incurred in SinnerSchrader AG are charged to the operative segments, where they can be assigned. Costs that
cannot be assigned are not distributed to the segments – these are largely costs for original holding tasks, such as
investor relations work.
Table 1a shows the segment information for the first quarter of the 2015/2016 financial year; the comparative data of
the previous year can be seen in Table 1b:
table 1a segment information for the f irst quarter 2015/2016 in € and number
01.09.2015–30.11.2015 interactive marketing
interactive media
interactive commerce
Sum SegmentS
holding/conSolidation
group
External revenues 9,931,816 1,084,051 1,826,671 12,842,538 197,235 13,039,773
Internal revenues 138,435 235,092 51,676 425,203 –425,203 —
Gross revenues 10,070,251 1,319,143 1,878,347 13,267,741 –227,968 13,039,773
Media costs — –228,191 — –228,191 — –228,191
Total revenues, net 10,070,251 1,090,952 1,878,347 13,039,550 –227,968 12,811,582
Segment income (EBITA) 989,914 –6,335 10,700 994,279 –159,171 835,108
Employees, end of period 342 31 78 451 43 494
In the Interactive Marketing segment, net revenue in the amount of € 2,782,000 and € 1,927,000, respectively, was
achieved with two groups of companies in the quarter of the report, accounting for 21.7 % and 15.0 %, respectively, of the
consolidated net revenue for the Group. Net revenue in the amount of € 1,287,000, i.e. 10.0 % of the consolidated net
revenue for the Group, was achieved with another group of companies.
table 1b segment information for the f irst quarter 2014/2015 in € and number
01.09.2014–30.11.2014 interactive marketing
interactive media
interactive commerce
Sum SegmentS
holding/conSolidation
group
External revenues 8,861,491 2,596,242 2,035,266 13,492,999 — 13,492,999
Internal revenues 100,129 17,954 77,574 195,657 –195,657 —
Gross revenues 8,961,620 2,614,196 2,112,840 13,688,656 –195,657 13,492,999
Media costs — –1,092,373 — –1,092,373 — –1,092,373
Total revenues, net 8,961,620 1,521,823 2,112,840 12,596,283 –195,657 12,400,626
Segment income (EBITA) 491,749 –106,316 134,302 519,735 –247,277 272,458
Employees, end of period 340 51 100 491 44 535
28

sin
ne
rs
ch
ra
de
r g
ro
up
— q
ua
rt
er
ly
Fin
an
cia
l r
ep
or
t 1
20
15
/2
01
6
co
ns
ol
ida
te
d q
ua
rt
er
ly
ac
co
un
ts
1 2
015
/2
016
Table 1c explains the transfer of the total segment income to Group income before taxes for the period from 1 September
to 30 November 2015 and for the comparable period of the previous year:
table 1c reconcil iat ion of segment income to income before taxes of the group in €
Q1 2015/2016 Q1 2014/2015
Segment income (EBITA) all reporting segments 994,279 519,735
Central costs not passed on to segments –159,171 –247,277
EBITA of the Group 835,108 272,458
Financial income of the Group 206 —
Income before taxes of the Group 835,314 272,458
All of SinnerSchrader’s external revenues were earned by Group companies based in Germany.
4 BreaKdoWn oF expenses according to the total cost method
The total revenues, marketing, administrative, and research and development costs in the first quarter of the 2015/2016
and 2014/2015 financial years were broken down according to cost types, as shown in Table 2:
table 2 operat ing costs by cost type in €
Q1 2015/2016 Q1 2014/2015
Personnel expenses 7,764,162 7,970,118
Costs of materials and services 2,343,955 2,578,915
Depreciation of property and equipment, as far as not from first consolidation 188,781 287,031
Other operating expenses 1,667,795 1,462,671
Total 11,964,693 12,298,735
29

sin
ne
rs
ch
ra
de
r g
ro
up
— q
ua
rt
er
ly
Fin
an
cia
l r
ep
or
t 1
20
15
/2
01
6
co
ns
ol
ida
te
d q
ua
rt
er
ly
ac
co
un
ts
1 2
015
/2
016
5 income tax
The income tax reported in the Statements of Operations is made up of current and deferred components, as shown in
Table 3:
table 3 income tax in €
Q1 2015/2016 Q1 2014/2015
Current 675,042 486,720
Deferred –405,523 –355,940
Total 269,519 130,780
In the first quarter of the 2015/2016 financial year, current taxes in the amount of € 675,000 (previous year: € 487,000)
were incurred. Deferred taxes were to be formed in recognition of profit and loss according to IAS 12 due to temporary
differences between the book values in the Consolidated Balance Sheets and the tax assumptions. This resulted in income
in the amount of € 406,000 for the quarter of the report (previous year: € 356,000).
6 Financial oBligations and contingent liaBilities
The contingencies and other financial obligations as at 30 November 2015 were largely unchanged compared to the
Consolidated Financial Statements as at 31 August 2015.
7 treasury stocK
As at 30 November 2015, the treasury stock of SinnerSchrader AG amounted to 170,040 shares with a calculated face
value of € 170,040, representing 1.47 % of the share capital. On 31 August 2015 the number of shares of treasury stock
amounted to 59,239 shares with a calculated face value of € 59,239, or 0.51 % of the share capital.
In the first quarter of 2015/2016, 25,000 shares of treasury stock were issued in the context of the exercising of employee
options, and 135,801 shares of treasury stock were purchased at an average acquisition cost of € 4.12 per share.
The 170,040 shares of treasury stock as at 30 November 2015 were to be recognised at acquisition costs in an amount
of € 584,694, or an average of € 3.44 per share.
8 stocK option plans
In January 2007, the Annual General Meeting of SinnerSchrader AG approved the 2007 SinnerSchrader Stock Option Plan
(“2007 Plan”), which provided by 31 December 2011 for the granting of share options to allocate a total of 600,000 shares
to the members of the Management Board of SinnerSchrader AG and to the members of the management of the affiliated
companies as well as to selected employees performing managerial tasks within SinnerSchrader AG and affiliated
companies.
In a resolution of 20 December 2012, the Annual General Meeting of SinnerSchrader AG adopted the 2012 SinnerSchrader
Stock Option Plan (“2012 Plan”) to grant share options for the sale of a total of 550,000 shares to members of the
Management Board of SinnerSchrader AG (100,000 options) and members of the management of the companies affiliated
with SinnerSchrader AG (300,000 options) as well as selected employees with management functions in SinnerSchrader
AG and the companies affiliated with SinnerSchrader AG (150,000 options).
30

sin
ne
rs
ch
ra
de
r g
ro
up
— q
ua
rt
er
ly
Fin
an
cia
l r
ep
or
t 1
20
15
/2
01
6
co
ns
ol
ida
te
d q
ua
rt
er
ly
ac
co
un
ts
1 2
015
/2
016
Detailed information on the 2007 and 2012 Stock Option Plans can be found in the Notes to the Consolidated Financial
Statements as at 31 August 2015.
A total of 25,000 options from the 2007 Stock Option Plan with an average exercise price of € 2.13 were exercised in
the first quarter of the financial year.
A total of 95,000 options from the 2012 Stock Option Plan with an average exercise price of € 3.48 were allocated in
the first quarter of 2015/2016.
Table 4a shows the parameters used to assess the newly allocated options in the first quarter of the 2015/2016 financial
year on the basis of a binomial model according to Cox/Ross/Rubenstein:
table 4a parameters for valuat ion of stock opt ions at the date of issue
Q1 2015/2016
Expected life of option 4.5 years
Risk-free interest rate 0.15 %
Expected dividend yield 5 %
Expected volatility 38 %
Exercise price € 3.48
Price at valuation date € 3.93
Table 4b summarises the changes in the number of options from the 2007 and 2012 Stock Option Plans outstanding in
the first quarter of the 2015/2016 financial year:
table 4b outstanding stock opt ions in € and number
number oF optionS weighted average exerciSe price
weighted average grant date Fair value
Outstanding at 31 August 2015 283,333 2.14 0.41
Granted 95,000 3.48 0.95
Exercised –25,000 2.13 0.41
Outstanding at 30 November 2015 353,333 2.50 0.56
As at 30 November 2015, 103,333 employee options from the 2007 Stock Option Plan and 250,000 employee options from
the 2012 Stock Option Plan with an average exercise price of € 2.15 and € 2.65, respectively, were thus still outstanding.
IFRS 2 prescribes income-affecting entry in the balance sheet of costs resulting from the issue of employee options on
the basis of the current value. The market value of the options on the issue date should be distributed over the waiting
period for exercising the option and then proportionately entered in the Statements of Operations as personnel costs for
the relevant period. The costs are recorded against the shareholders’ equity in the reserve for share-based compensation.
In the first quarter of the 2015/2016 financial year, the costs to be taken into account amounted to € 9,900, compared to
€ 2,704 in the comparable period of 2014/2015.
31

sin
ne
rs
ch
ra
de
r g
ro
up
— q
ua
rt
er
ly
Fin
an
cia
l r
ep
or
t 1
20
15
/2
01
6
co
ns
ol
ida
te
d q
ua
rt
er
ly
ac
co
un
ts
1 2
015
/2
016
9 related party transactions
In the first quarter of the 2015/2016 and 2014/2015 financial years, SinnerSchrader earned gross revenues in the
amount of € 302,491 and € 539,559, respectively, with companies in which members of the SinnerSchrader Supervisory
Board held positions relevant to decision-making.
10 maJor eVents aFter the Balance sheet date
There were no major events after the balance sheet date that should be reported.
11 directors’ holdings oF shares and suBscription rights to shares (“director’s dealings”)
Table 5 shows the number of shares and subscription rights to shares of SinnerSchrader AG held by Board members of
SinnerSchrader AG as at 30 November 2015 and their changes in the first quarter of the 2015/2016 financial year:
table 5 shares and options of the Board members in number
ShareS 31.08.2015 additionS diSpoSalS 30.11.2015
Management Board:
Matthias Schrader 2,576,289 — — 2,576,289
Thomas Dyckhoff 109,950 — — 109,950
Total shares of the Management Board 2,686,239 — — 2,686,239
Supervisory Board:
Dieter Heyde — — — —
Prof. Cyrus D. Khazaeli — — — —
Philip W. Seitz — — — —
Total shares of the Supervisory Board — — — —
Total shares of the Board members 2,686,239 — — 2,686,239
optionS 31.08.2015 additionS diSpoSalS 30.11.2015 current value oF each
SubScription right on the
date oF granting
Management Board:
Matthias Schrader — — — —
Thomas Dyckhoff 45,000 — — 45,000 € 0.48
Total options of the Management Board 45,000 — — 45,000
Supervisory Board:
Dieter Heyde — — — —
Prof. Cyrus D. Khazaeli — — — —
Philip W. Seitz — — — —
Total options of the Supervisory Board — — — —
Total options of the Board members 45,000 — — 45,000
32

sin
ne
rs
ch
ra
de
r g
ro
up
— q
ua
rt
er
ly
Fin
an
cia
l r
ep
or
t 1
20
15
/2
01
6
co
ns
ol
ida
te
d q
ua
rt
er
ly
ac
co
un
ts
1 2
015
/2
016
responsiBility stateMent
To the best of our knowledge, and in accordance with the applicable reporting principles, the Quarterly Financial Report of the
SinnerSchrader Group gives a true and fair view of the asset, financial, and income situation of the Group, and the Interim
Status Report includes a fair review of the development and performance of the business and the position of the Group, together
with a description of the principal opportunities and risks associated with the expected development of the Group.
Hamburg, 14 January 2016
The Management Board
Matthias Schrader Thomas Dyckhoff
33

sin
ne
rs
ch
ra
de
r g
ro
up
— q
ua
rt
er
ly
Fin
an
cia
l r
ep
or
t 1
20
15
/2
01
6
34
sin
ne
rs
ch
ra
de
r g
ro
up
— q
ua
rt
er
ly
Fin
an
cia
l r
ep
or
t 1
20
15
/2
01
6
co
ns
ol
ida
te
d q
ua
rt
er
ly
ac
co
un
ts
1 2
015
/2
016
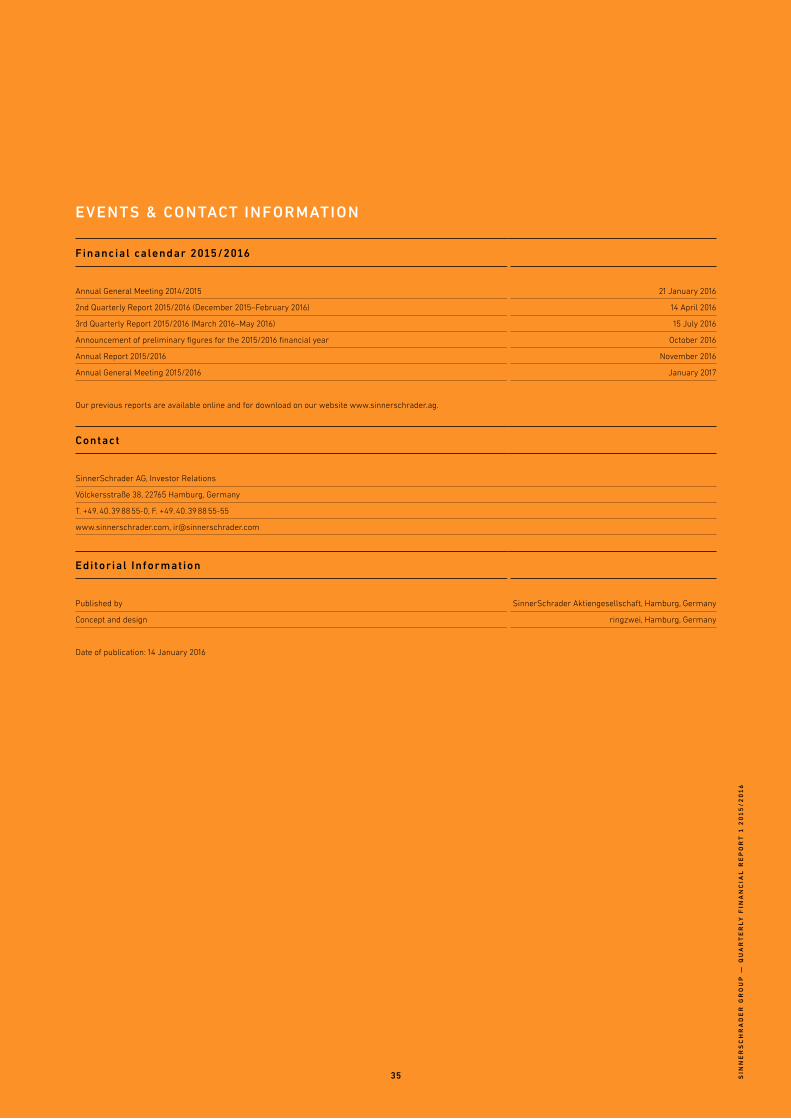
eVents & contact inFormation
Financial calendar 2015/2016
Annual General Meeting 2014/2015 21 January 2016
2nd Quarterly Report 2015/2016 (December 2015–February 2016) 14 April 2016
3rd Quarterly Report 2015/2016 (March 2016–May 2016) 15 July 2016
Announcement of preliminary figures for the 2015/2016 financial year October 2016
Annual Report 2015/2016 November 2016
Annual General Meeting 2015/2016 January 2017
Our previous reports are available online and for download on our website www.sinnerschrader.ag.
contact
SinnerSchrader AG, Investor Relations
Völckersstraße 38, 22765 Hamburg, Germany
T. +49. 40. 39 88 55-0, F. +49. 40. 39 88 55-55
www.sinnerschrader.com, [email protected]
editorial information
Published by SinnerSchrader Aktiengesellschaft, Hamburg, Germany
Concept and design ringzwei, Hamburg, Germany
Date of publication: 14 January 2016
sin
ne
rs
ch
ra
de
r g
ro
up
— q
ua
rt
er
ly
Fin
an
cia
l r
ep
or
t 1
20
15
/2
01
6
35

sinnerschrader aKtiengesellschaFt VölcKersstrasse 3822765 hamBurggermany
WWW.sinnerschrader.com


