Page 1
EFFECT OF INTERNATIONALISATION ON FINANCIAL
PERFORMANCE OF LISTED MANUFACTURING COMPANIES
IN NIGERIA
YAKUBU YAHAYA
DOCTOR OF PHILOSOPHY
(Business Administration)
JOMO KENYATTA UNIVERSITY OF
AGRICULTURE AND TECHNOLOGY
2018
Page 2
Effect of Internationalisation on Financial Performance of Listed
Manufacturing Companies in Nigeria
Yakubu Yahaya
A thesis submitted in partial fulfilment for the degree of Doctor of
Philosophy in Business Administration in the Jomo Kenyatta
University of Agriculture and Technology
Page 3
ii
DECLARATION
This thesis is my original work and has not been presented for a degree in any other
university.
Signature………………………… Date……………………………
Yakubu Yahaya
This thesis has been submitted for examination with our approval as university
supervisors.
Signature………………………… Date……………………………
Prof. Oloko M. A
JKUAT, KENYA
Signature………………………… Date……………………………
Dr. Oluoch J. Oluoch
JKUAT, KENYA
Page 4
iii
DEDICATION
I give all thanks to the Almighty Allah I dedicate this work to my lovely wife Mrs.
Jamila and children, Ahmed, Khadija, Kabiru, Sadiq, and Abdallah .You stood by me
through this long and challenging journey. To my late Father, Baba Singiri and to my
mum, Madam Talatu Baba who have been my source of inspiration, I will forever be
grateful to my brother Alhaji Barau for his moral and financial support. I equally
appreciate my brothers, Boyi, Ahmadu, Saleh, Nuhu, Usman, Adamu, Isa, Barau and
Musa for their moral and financial support. I thank Saidu‘, Safiyanu‘, Korau‘,
Abdulkarim‘ Murtala‘, Sani‘, my in laws for their support and encouragement. I
appreciate my Rector Dr Lame for his encouragement. I equally appreciate, my
Uncles, friends‘brothers and sisters for their support. God bless you all.
Page 5
iv
ACKNOWLEDGEMENTS
First, my gratitude goes to our Almighty Allah for His mercies and grace that have
enabled me to come this far. Thanks to my two supervisors: Dr Oloko M.A and Dr
Oluoch Oluoch for their valuable contributions, guidance and constructive criticisms
towards this work. I thank all my lecturers who impacted knowledge to me during
the course work. Thanks to the management of Jomo Kenyatta University of
Technology and Agriculture for the opportunity given to actualise my dream. Thanks
to my mother Madam. Talata Baba and father Baba Singiri for their moral and
financial supports. My mentors Alhaji Abubakar Barau. Soja Musa Baba and
Professor Ahmadu Baba Singiri for their words of encouragement and supports, Mr
Haruna Gani.
Page 6
v
TABLE OF CONTENTS
DECLARATION ........................................................................................................ ii
DEDICATION ........................................................................................................... iii
ACKNOWLEDGEMENTS...................................................................................... iv
TABLE OF CONTENTS........................................................................................... v
LIST OF TABLES ................................................................................................... xii
LIST OF FIGURES ................................................................................................. xv
LIST OF APPENDICES ........................................................................................ xvi
LIST OF ACRONYNMS....................................................................................... xvii
DEFINITIONS OF TERMS .................................................................................. xix
ABSTRACT ............................................................................................................. xxi
CHAPTER ONE ........................................................................................................ 1
INTRODUCTION ...................................................................................................... 1
1.1 Background of the study ................................................................................... 1
1.1.1 Business Internationalisation in Developed Economies ............................. 3
1.1.2. Business Internationalisation in Emerging Economies .............................. 5
1.1.3. Internationalisation in Nigeria ................................................................... 8
1.2 Statement of the Problem .................................................................................. 9
1.3 Research Objectives ........................................................................................ 12
Page 7
vi
1.3.1 General Objectives .................................................................................... 12
1.3.2 Specific Objectives............................................................................... 12
1.4 Research Hypothesis ....................................................................................... 13
1.5 Significance of the Study ................................................................................ 13
1.5.1 Theory Building ........................................................................................ 13
1.5.2 Policy Making ........................................................................................... 14
1.5.3 Practitioners in Manufacturing Sector ...................................................... 14
1.6 Scope of the Study .......................................................................................... 14
1.7 Limitations of the Study .................................................................................. 15
CHAPTER TWO ..................................................................................................... 16
LITERATURE REVIEW........................................................................................ 16
2.1 Introduction ..................................................................................................... 16
2.2 Theoretical Review ......................................................................................... 16
2.2.1 Resource Based Theory........................................................................ 16
2.2.2 Internalization Theory .......................................................................... 18
2.2.3 Internationalisation Process Theory ..................................................... 19
2.3 Conceptual Framework ................................................................................... 21
2.3.1 Foreign Trade ...................................................................................... 22
2.3.2 Foreign Direct Investment .................................................................. 24
Page 8
vii
2.3.3 International Proprietary Rights ........................................................... 25
2.3.4 Business Foreign Funding .................................................................... 26
2.3.5 Financial Performance ......................................................................... 27
2.4 Empirical Literature Review .......................................................................... 28
2.4.1 Foreign Trade and Financial Performance .......................................... 28
2.4.2 Foreign Direct Investment and Financial Performance ...................... 31
2.4.3 International Proprietary Rights and Financial Performance ............... 35
2.4.4 Business Foreign Funding and Financial Performance ........................ 36
2.4.5. Financial Performance ............................................................................. 38
2.5 Critique of Existing Literature ........................................................................ 39
2.6 Research Gaps ................................................................................................. 43
CHAPTER THREE ................................................................................................. 45
RESEARCH METHODOLOGY ........................................................................... 45
3.1 Introduction ..................................................................................................... 45
3.2 Research Philosophy ....................................................................................... 45
3.3 Research Design .............................................................................................. 46
3.4 Target Population ........................................................................................... 47
3.5 Data and Data Collection ................................................................................ 47
3.7 Pilot Study ....................................................................................................... 48
Page 9
viii
3.8 Data processing and analysis .......................................................................... 49
3.8.1. Model Specification ............................................................................. 49
3.8.3 Tests of Hypotheses ............................................................................. 50
3.8.4 Operationalization and Measurement of Variables .............................. 50
3.9 Diagnostic Tests .............................................................................................. 51
3.9.1 Normality Test .......................................................................................... 52
3.9.2 Multicollinearity ........................................................................................ 52
3.9.3 Autocorrelation ......................................................................................... 52
3.9.4 Heteroskedasticity ..................................................................................... 53
CHAPTER FOUR .................................................................................................... 54
RESULTS AND DISCUSSIONS ............................................................................ 54
4.1 Introduction ..................................................................................................... 54
4.2 Pilot Test Results ........................................................................................... 54
4.3 Bio Data .......................................................................................................... 55
4.3.1 Response Rate ...................................................................................... 55
4.3.2 Level of Education of the Respondents ............................................... 56
4.3.3 Experience of the Respondents ............................................................ 57
4.3.4 Company Age ...................................................................................... 58
4.3.5 Company Size based on Market Capitalization ................................... 58
Page 10
ix
4.4 Trend Analysis ................................................................................................ 59
4.4.1 Foreign Trade ....................................................................................... 60
4.4.2 Foreign Direct Investment ................................................................... 61
4.4.3 Business Foreign Funding .................................................................... 62
4.4.4 International Proprietary Rights ........................................................... 63
4.4.5 Return on Assets .................................................................................. 64
4.5 Descriptive Analysis Results........................................................................... 65
4.5.1 Foreign Trade ....................................................................................... 68
4.5.2 Foreign Direct Investment ................................................................... 70
4.5.3 International Proprietary Rights ........................................................... 73
4.5.4 Business Foreign Funding .................................................................... 76
4.6 Diagnostic Tests .............................................................................................. 78
4.6.1 Normality Tests .................................................................................... 79
4.6.2 Homoscedastic Test Results ................................................................. 80
4.6.3 Autocorrelation Test............................................................................. 81
4.6.4 Test for Multicollinearity ..................................................................... 82
4.6.5 Hausman Test ....................................................................................... 83
4.7 Correlation Analysis Results ........................................................................... 84
4.7.1 Foreign Trade and Financial performance ........................................... 84
Page 11
x
4.7.2 Foreign Direct Investments and Financial performance ...................... 85
4.7.3 International Proprietary Rights and Financial performance ............... 86
4.7.4 Business Foreign Funding and Financial performance ........................ 87
4.8 Regression Analysis Results ........................................................................... 88
4.8.1 Foreign Trade and Financial Performance ........................................... 89
4.8.2 Foreign Direct Investments and Financial performance ...................... 91
4.8.3 International Proprietary Rights and Financial performance ............... 94
4.8.4 Business Foreign Funding and Financial performance ........................ 97
4.8.5 Multivariate Regression Analysis ...................................................... 100
CHAPTER FIVE.................................................................................................... 106
SUMMARY, CONCLUSIONS AND RECOMMENDATIONS ....................... 106
5.1 Introduction ................................................................................................... 106
5.2 Summary of Findings .................................................................................... 106
5.2.1 Effect of Foreign Trade on Financial Performance............................ 106
5.2.2 Effect of Foreign Direct Investment on Financial Performance ........ 107
5.2.3 Effect of International proprietary Rights on Financial Performance 108
5.2.4 Effect of Business Foreign Funding on Financial Performance ........ 109
5.3 Conclusion .................................................................................................... 110
5.4 Recommendations ......................................................................................... 111
Page 12
xi
5.5 Areas for Further Research ........................................................................... 112
REFERENCES ....................................................................................................... 113
APPENDICES ........................................................................................................ 131
Appendix I Questionnaire ........................................................................................ 131
Appendix II Secondary data collection Sheet .......................................................... 136
Appendix III Listed Manufacturing Companies in Nigeria ..................................... 137
Page 13
xii
LIST OF TABLES
Table 3.1 Operationalization and Measurement of Study Variables ........................... 51
Table 4.1 Reliability Tests Results .............................................................................. 55
Table 4.2: Response Rate ............................................................................................ 56
Table 4.3: Factor Analysis for All the Variables ........................................................ 65
Table 4.4 Summary Statistics for Study Variables ...................................................... 65
Table 4.5 Foreign Trade Descriptive Results .............................................................. 68
Table 4.6 Foreign Direct Investment Descriptive Results........................................... 71
Table 4.7 International Proprietary Rights Descriptive Results .................................. 74
Table 4.7 Business Foreign Funding Descriptive Results ........................................... 76
Table 4.8 Normality Tests Results .............................................................................. 79
Table 4.9 Bruisch Pagan Test for Homoscedasticity .................................................. 81
Table 4.10 Durbin Watson Statistics for Autocorrelation ........................................... 82
Table 4.11 Test for Multicollinearity .......................................................................... 83
Table 4.12 Hausman Test for Model Specification Results ........................................ 83
Page 14
xiii
Table 4.13 Correlation Results for Foreign Trade and Financial performance .......... 84
Table 4.14 Correlation Results for FDI and Financial performance .......................... 85
Table 4.15 International Proprietary Rights and Financial performance .................... 86
Table 4.16 Business Foreign Funding and Financial performance .......................... 87
Table 4.17 Model Summary for Foreign Trade and Financial Performance .............. 89
Table 4.18 ANOVA Results for Foreign Trade and Financial Performance .............. 89
Table 4.19 Regression Coefficients for Foreign Trade and Financial Performance ... 90
Table 4.20 Model Summary for FDI and Financial Performance ............................... 92
Table 4.21 ANOVA Results for FDI and Financial Performance .............................. 92
Table 4.22 Regression Coefficients for FDI and Financial Performance ................... 93
Table 4.23 Model Summary for International Proprietary Rights and ROA .............. 95
Table 4.24 ANOVA Results for International Proprietary Rights and ROA .............. 95
Table 4.25 Regression Coefficients for International Proprietary Rights and ROA ... 96
Table 4.26 Model Summary for Business Foreign Funding and ROA ....................... 97
Table 4.27 ANOVA Results for Business Foreign Funding and ROA ....................... 98
Page 15
xiv
Table 4.28 Regression Coefficients for Business Foreign Funding and ROA ............ 98
Table 4.29 Model Summary for Multivariate Regression Analysis .......................... 100
Table 4.30 ANOVA Results for Multivariate Regression Analysis ......................... 101
Table 4.31 Regression Coefficients for Multivariate Regression Analysis .............. 101
Table 4.32 Model Summary for Multivariate Regression Analysis .......................... 103
Table 4.33 ANOVA Results for Multivariate Regression Analysis ......................... 104
Table 4.34 Regression Coefficients for Multivariate Regression Analysis .............. 104
Page 16
xv
LIST OF FIGURES
Figure 2.1 Conceptual framework ............................................................................... 22
Figure 4.1 Education Level of Respondents ............................................................... 56
Figure 4.2 Experience of the Respondents .................................................................. 57
Figure 4.3 Age of the Company .................................................................................. 58
Figure 4.4 Size of the Company .................................................................................. 59
Figure 4.5 Trend Analysis for Foreign Trade ............................................................. 60
Figure 4.6 Trend Analysis for Foreign Direct Investments ........................................ 61
Figure 4.7 Trend Analysis for Business Foreign Funding .......................................... 62
Figure 4.8 Trend Analysis for International Proprietary Rights ................................. 63
Figure 4.9 Trend Analysis for Return on Assets ......................................................... 64
Page 17
xvi
LIST OF APPENDICES
APPENDICES ......................................................................................................... 142
Appendix I Questionnaire ........................................................................................ 142
Appendix II Secondary data collection Sheet .......................................................... 147
Appendix III Listed Manufacturing Companies in Nigeria ..................................... 148
Page 18
xvii
LIST OF ACRONYNMS
ANOVA Analysis of Variance
CEO Chief Executive Officer
CLRM Classical Linear Regression Model
DOI Degree of Internationalisation
EVA Economic Value Added
FDI Foreign Direct Investment
FIML Full Information Maximum Likelihood
GDP Gross Domestic Product
GTR Government Tax Revenue
IP Internationalisation Process
IPR International Proprietary Rights
M &A Merger and Acquisition
MNEs Multinational National Enterprises\
NSE Nairobi Securities Exchange
NSEC Nigerian Stock Exchange Commission
OLS Ordinary Least Square
R&D Research and Development
Page 19
xviii
RBV Resource-Based View
ROA Return on Assets
ROE Return on Equity
ROI Return on Investment
SMEs Small and Medium Size Enterprises
TNCs Transnational Corporations
UK United Kingdom
US United States
VAR Vector Auto Regression
VEC Vector Error Correction
Page 20
xix
DEFINITIONS OF TERMS
Business Foreign Funding: refers to firm acquiring foreign exchange to enhance
operation, technical skills, management skills and technology to
increase productivity (Armstrong, 2004).
Financial Performance: refers to the level of companies‘ financial feat relative to
their major competitors over the past years Hoque and James (2000). It
literally refers to financial measures, such as return equity, return on
investment, operating profit, and sales growth rate (Chenhall &
Langfield, 2007).
Foreign Direct Investment: refers to the investment of resources in business
activities outside a firm ‗s home country (Hill, 2003).
Foreign Trade: Is the exchange of capital, goods and services across international
borders or territories. (Elhanan & Krugman, 1985)
Internationalisation: Is the gradual expansion of company‘s activities in foreign
markets and expanding company‘s involvement in international
operations and firms‘ operations (strategy, structure, resources,) to
international environments (Uppsala, 2012).
International Proprietary rights: refers to those rights access intellectual property
from research and innovation for use in international market (Arora,
2009).
Market Return: Is the amount of money earned by investments (Merton & Robert,
1980).
Nigeria Stock Exchange: the market used for the trade of both debt and equity
securities and their related derivatives in Nigeria (NSE, 2016).
Page 21
xx
Return on Asset: Is a financial ratio that shows the percentage of profit that a
company earns in relation to its overall resources (total asset) (Beltratti
& Stulz, 2012).
Page 22
xxi
ABSTRACT
Business internationalisation has created distinctive characteristics in the
manufacturing industry, one of which is the removal of trade barriers among nations
to facilitate market expansion and improve healthy competitions among business
organizations. This study sought to establish the effect of business
internationalisation on financial performance of listed manufacturing companies in
Nigeria. Specifically, the study sought to determine the effect of foreign trade,
foreign direct investments, international proprietary rights and business foreign
funding on financial performance of listed manufacturing companies in Nigeria.
Correlational survey research was utilized in this study. The study‘s target population
is 74 seventy-four listed manufacturing companies from which 70 representing about
95% of the total targeted population were included in the analysis. The secondary
data was collected from the company‘s financial reports in order to inquire about
business internationalisation and financial performance of listed manufacturing
companies. Descriptive and inferential statistics were used to analyse the data in this
research. Specifically, descriptive statistics related to means, minimum, maximum
and standard deviation. The study used multiple linear regression models to show the
effect of internationalisation of business on financial performance of the listed
Nigerian manufacturing companies. The study results for both primary and
secondary data revealed that foreign trade, foreign direct investment and business
foreign funding have a significant effect with financial performance measured by
ROA of listed manufacturing companies in Nigeria. The effect of international
proprietary rights on financial performance was found to be positive but insignificant
using primary data but they findings were significant using secondary data. Based on
the finding of the study, the study concludes that foreign trade is important in
manufacturing sector. Listed manufacturing companies that engage strategically in
foreign trade through exportation and exploration of foreign markets have a high
probability being successful in terms of financial performance compared to
companies that refrain from engaging in foreign trade. The study concluded that
companies that invest outside their origin countries enjoy increased profits margins
and high returns on assets through their foreign operations. The study therefore
concluded that international proprietary rights do not influence in any way the
financial performance of the companies that have internationalized their operations.
The study concluded that listed manufacturing companies that are struggling to
finance their operations must seek international partners to partner with. The study
recommended that efforts should be made by the management of the listed
manufacturing companies to make the sector more attractive to entice more foreign
direct investment, engage in foreign trade and seek for foreign funding into the listed
manufacturing companies in Nigeria for improved financial performance.
Page 23
1
CHAPTER ONE
INTRODUCTION
1.1 Background of the study
A firm‘s decision to expand operations to international markets has far reaching
implications that can shape operations for many years and impact its future
profitability and growth opportunities (Altuntas & Berry-Stölzle, 2010). The
internationalisation of a company means that its activities go beyond the boundaries
of its home country or are undertaken chiefly abroad. Such a company operates
either both in its domestic and foreign market, or only in the latter one.
Internationalisation is equated with a company's foreign expansion, which may
comprise of any kind of business activity undertaken abroad or with a foreign partner
(Wach, 2014).
According to Johanson and Mattsson (2015) company internationalisation
(regardless of adopted strategy of performing this process) requires obtaining capital,
a competent manager, choosing appropriate product offer, then analysing the target
market (analysis of foreign markets), entering the foreign market (canvassing, sales,
marketing) and developing operations (logistics, after-sales service, realization of
payments, responsibility for sold products, intercultural communication in a team of
employees). Each enterprise develops its own strategy of internationalisation and in
accordance with the adopted strategy it must provide a set of factors vital for the
internationalisation process and individually establish the level of these factors.
The internationalisation of firms has generated interest not just because of the
benefits to firm growth, survival and competitive position, but also because of its
positive influence on a nation‘s economic growth and development (Mayer &
Ottaviano, 2008). While internationalisation can be a source of growth for firms, it
can also be a risky venture that can generate losses which may adversely affect the
long-term survival of a firm. Any company seeking to be an industry leader in the
Page 24
2
twenty-first century must not focus on domestic market leadership only but must also
focus on global market leadership. O'Cass and Weerawardena (2009) assert that
global competition for African businesses is not an option but an economic priority.
International expansion can enhance a firm‘s knowledge base and capabilities
through the experiential learning it gets from operating in foreign markets. Industrial
organization arguments have also been used to postulate that firms can gain greater
market power over suppliers, distributors, and customers by expanding overseas.
Some researchers have suggested that firms can diversify risks by operating across
several international markets (Crick, 2009). The benefits from the exploitation of
economies of scale and scope, organizational learning through exploration and
greater market power implies that firms with greater international diversification
should experience higher financial performance.
An organized system of company internationalisation assessment covers both
objective and particular criteria. Among objective criteria are those related to the
structure, for example the number of foreign units of a company, capital ownership
structure according to its origin, organizational structure of the company as well as
criteria of productivity, for example value of foreign revenues and value of fixed
capital located abroad (Agndal & Chetty, 2007). Internationalisation based only on
exporting products is ‗shallow‘ as it does not require involvement of resources
necessary for their production abroad. ‗Deep‘ internationalisation is based on the
second dimension, which is transition of production infrastructure from domestic
market to other countries. Its ‗depth‘ results from the size of financial, material and
human resources engaged in the process of internationalisation, which are necessary
to launch production outside home country (Dawson, 2007).
As firms operate in more diverse market environments, they face a greater need to
integrate their activities and logically therefore, encounter an escalation in the cost of
coordinating their activities. At higher levels of international expansion,
diseconomies can set in due to escalating costs of coordination and from the greater
Page 25
3
information processing demands on managers and administrative systems. With
continued international diversification, the complexities of managing information
and communication among widespread units imply that extensive international
diversification is likely to result in net costs (Ellis, 2007).
The increasing economic integration of markets associated with globalization has not
only driven the internationalisation of companies, it has also influenced the nature of
their strategies (Melén & Nordman, 2009). Technological change and the ease of
trade have enabled managers to effectively monitor and control their company‘s
global activities and have resulted in major changes in organizational relationship
and strategy. While historically many companies have had foreign sales operations,
the ability to conduct business efficiently and effectively across the boundaries has
enabled managers to make strategic decisions on where to geographically locate the
different activities that constitute a firm‘s value chain (Melén & Nordman, 2009).
1.1.1 Business Internationalisation in Developed Economies
In USA, the internationalisation of hospitality industry began after World War II
(Dunning & McQueen, 1982). Initiated by the rapid increase in international travel in
the 1950s, US hospitality organizations began to expand overseas operations in the
1960s. Economic depression and overdeveloped domestic markets between the
1970s and 1980s led US hospitality corporations to become increasingly involved in
hotel and restaurant operations around the world (Graves & Thomas, 2004). By
2012, major US publicly traded restaurant corporations have aggressively entered
foreign markets. For example, McDonald has owned and franchised more than
33,500 restaurants in 119 countries, and Burger King International invested in or
managed 12,604 restaurants worldwide (Yang, 2012). Beverage service company,
Starbucks Coffee owns or franchises 17,651 store locations in nearly 60 countries
(Welch, & Welch, 2009).
In cooperation and competition with foreign companies, the Chinese companies have
improved their management and technical skills for international competition
Page 26
4
(Buckley, et al., 2007). Lower entry barriers and a more relaxed regulation of the
FDI have allowed the Chinese companies to reform through foreign joint ventures
with foreign companies, and the success of the Chinese open economy has also
furthered the internationalisation of the Chinese companies (Andersson, Gabrielsson,
& Wictor, 2006). The Chinese government has encouraged a number of Chinese
companies to expand their international market through specialized foreign trade
corporations, with the objective of enlarging exports and securing supplies of raw
materials, and further acquiring advanced technology and R&D capabilities through
their internationalisation strategy (Child & Rodrigues, 2005).
Analysing a panel data set of UK firms Greenaway, Upward and Wakelin (2002)
applied matching techniques and found a feedback relationship between the firms‘
export activities and productivity (labour productivity as well as total factor
productivity): Highly productive firms become exporters but exporting also increases
productivity. Apparently, using matching techniques leads to results that are more in
favour of a causal effect of international business activities on firm performance.
Hatum and Michelini (2011) investigate the relationship between firm performance
and internationalisation behaviour for the period from the firms‘ start-up until 1997,
using data from the first survey. They found that an international engagement
improves labour productivity and increases sales growth rate but does not affect
employment growth rate. The foreign market may be particularly important for
young, small, technology-oriented firms, especially for those operating in a narrow
market position. In order to be competitive in international markets, Malaysian
companies have taken the opportunities which are available worldwide through
internationalisation strategies where there are no transactional or geographical
boundaries, and time zones where business transaction can now be performed more
rapidly (Ganotakis & Love, 2012).
However, in the early 1990‘s the internet base technology started becoming
commercialized with some limitation and restriction which delayed many companies
Page 27
5
from expanding internationally that could lead them to cross border success remain
unpredictable (Petersen, Pedersen & Sharma, 2003). Thus, Kaur and Sandhu (2014)
noted that internationalisation has become one of the most interesting topics discuss
among companies internationally. The transforming process of information
technology communication across countries has displacing all the business activities
into information technology-based activities. The most significant element in
improving the firm‘s effectiveness and efficiency is fully utilizing of their resources,
learning knowledge and networking available.
Tzeremes (2009) study on internationalization and firm performance using the case
of the top 10 non-financial TNCs from South-East Europe found that the levels of
internationalisation, positively influenced on firms‘ performance. Similarly, Da and
Ken (2015) study on internationalization strategy and firm performance in Chinese
IT Companies showed that that an internationalization strategy has a positive
relationship with firm performance, and an indirect positive effect.
Heyder, Makus and Theuvsen (2011) study on internationalization and firm
performance in agribusiness using empirical evidence from European cooperatives
revealed that that internationalization has a significant positive impact on firm
performance. Ruigrok, Amann and Wagner (2007) study on 87 manufacturing firms
from Switzerland on Degree of Internationalization and performance revealed that
here was inverted ―S‖ shaped relationship. The firm that operates with high levels of
DOI presents a low performance and high averages of variation in the performance.
Bobillo, LópezIturriaga and TejerinaGaite (2012) study on the relationship between
internationalization and performance in 1721 firms from twelve European countries
revealed a positive relationship in the DOI- performance relationship.
1.1.2. Business Internationalisation in Emerging Economies
Liberalization, privatization and globalization measures adopted by countries all over
the globe have led to the reduction in trade barriers and allowed for the smooth flow
of goods and services across borders. A large number of firms in both developing
Page 28
6
and developed economies are entering global markets to take advantage of the
availability of cheap labour, inexpensive land and abundant resources. Recent
decades have witnessed rapid growth in international business and because of this
rapid internationalization; MNEs now consider the entire world as one market (Hsu,
2006).
Regional internationalization can be defined as internationalization into a relatively
homogeneous cluster of countries which are physically and culturally less distant.
The physical proximity and cultural similarity should lead to lower costs of
transaction and coordination (Pan, Tsai & Kuo, 2010). Multinational firms face high
costs related to cultural differences which are associated with difficulties in
transferring competitive advantages and knowledge between different regions
(Benito & Gripsrud, 1992). However, at the lower level of regional
internationalization, the divergence of culture may be minimal. For example,
multinational firms that operate in countries clustered in a homogeneous region may
face lower cost than countries clustered in several heterogeneous regions. Moreover,
multinational firms that expand into countries clustered physically close to each other
should have lower transaction and coordination costs (Michael, Beamish & DaCosta,
1989). The similarities of homogeneous areas can thus affect a multinational‘s ability
to earn profits.
For instance, among all developing countries, India has altogether different
institutional factors such as culture, economic development, and the political and
regulatory environment (Singla & George, 2013). Indian multinational corporations
(MNCs) face intense competition from foreign MNCs that have developed firm-level
capabilities such as adaptive skills, better competitive ability and faster learning
(Gaur et al., 2014). Indian MNCs possess comparative advantages that include a
competency to successfully manufacture skill-intensive products and services,
quality managers and a lowcost base (Ramamurti, 2009). Altaf and Shah (2015)
study on internationalization and firm performance of Indian firms confirmed a U-
Page 29
7
shape relationship between internationalization and firm performance and a
significant negative effect of product diversity on firm performance.
Located in Southeast Asia, Malaysia is one developing country that is assisting SME
to become international players. Malaysia has advantages such as political stability, a
first-class physical infrastructure, and a skilled, multicultural and multilingual
workforce (Senik, Isa, Scott-Ladd, & Entrekin, 2010). Currently, the country is
competitive in attracting direct foreign investments and is among the world‘s top 20
trading nations (Bhatti, 2012).
Kenyan manufacturing sector has realized tremendous growth in the last ten years
and firms have significantly increased their presence within the Eastern Africa region
through FDIs. Over the same period, the manufacturing industry in Kenya has
involved itself in automation moving from the traditional methods to better meet the
growing complex needs of their customers and internationalisation challenges. South
African government launched its new strategy for economic growth and
development. One of the components of the new strategy was to grow South Africa‘s
market through increased local companies‘ internationalisation to the Southern
African region and other fast-growing economies (Aykut & Goldstein, 2007). The
benefits of firm internationalisation include the improvement of a firm‘s financial
position by generating more revenues and funds that could be used for reinvestment
and growth, efficiently allocating and utilising production capabilities and improving
management skills (Arteaga & Fernández, 2010).
Wei-Hwa and Wei-Chun (2012) study on internationalization, regional
diversification and firm performance in Taiwan find that regional internationalization
acts as a significant determinant on firm performance. Originally internationalisation
implied that a firm either participated in foreign markets by exporting or through
foreign direct investment. Nowadays, a firm can choose to undertake international
activities through exporting, licensing and franchising, joint ventures or the
Page 30
8
establishment of foreign subsidiaries. Of these, exporting is the most common and
the usually the norm, especially for smaller firms (Mtigwe, 2005).
1.1.3. Internationalisation in Nigeria
In Nigeria, internationalisation just began a few years ago with the advent of
democracy when organizations realized international market would offer them more
opportunity and unlimited scope for growth. At the early 2000s some ambitious
service firms, especially Banks, manufacturing industries and Insurance institutions,
began their first experiment abroad, which means internationalisation is still at its
early stage in Nigerian (Ezeoha, 2007).
However, there are no coherent frameworks that may help practitioners to gain a
convergent understanding of the internationalisation decisions of these service firms.
Despite the long-time awareness of the impact of internationalisation and economic
growth which can be influenced by its industry, many firms still find it difficult to
acclimatize themselves with this recent trend in business especially in Nigeria, which
is most times due to the size of the firm, technological availability, the firm
competitive advantage (position of the firm in its industry whether a market leader or
follower), its market characteristics, management attitude, profitability for foreign
subsidiaries (Ezeoha, 2007).
According to Ezeoha, Ebele and Okereke (2009) Nigeria has thus, become relatively
integrated with the global economic system. It has applied various policies over the
year to stimulate the productive and external sector of the economy so as to ensure
she benefit positively from business internationalisation.
According to Nigeria Stock Exchange (2014) the following industrial sectors which
are conglomerates, natural resources, industrial goods, health care, and consumer
goods are classified as listed Manufacturing companies in Nigeria. There are
seventy-four (74) listed manufacturing companies as at 2015. Adenikinju and Chete
(2002) in their research on empirical analysis of the financial performance of the
Page 31
9
Nigerian manufacturing sector over a 30-year period revealed that the Nigerian
manufacturing sector performed with satisfactory growth levels from 1970 to 1980.
Internationalisation can have either positive or negative effects on corporate
performance. On the positive side, as mentioned by Tallman and Li (1996)
internationalized operations can distribute management and overhead costs to
different countries, thereby leveraging the economies of scale. In addition, profits
can be maximized by allocating cheaper resources and labour costs in host countries
through foreign expansion. The uncontrollable factors affecting the operating
environment of international business according to Shikwe (2014) are physical
forces, economic forces, socio-cultural forces, financial forces, political forces, legal
forces, labour forces and ecological forces. The controllable forces are the factors of
production and the organizational activities. Management of organizations has some
command over the controllable elements unlike the uncontrollable ones.
The analysis of the empirical and theoretical discussions on the effects of
internationalisation on the financial performance of manufacturing firms showed that
empirical literature contradicts theoretical arguments on the effects of
internationalisation on firm performance. Similarly, various authors reported
different findings in various context that their studies was conducted. Therefore, this
necessitated the need to conduct a study on the effects of internationalisation on
financial performance of manufacturing firms in Nigeria.
1.2 Statement of the Problem
The world is turning into a global village as a result of internationalisation of
business across various divides; many traditionally local businesses are now
searching for growth opportunities in foreign markets (Fernandez & Nieto, 2005).
Internationalisation is considered one of the most important strategies for firms'
growth and expansion (Graves & Thomas, 2008). Manufacturing firms play an
increasingly significant role in Nigeria economy, and are expected to grow fast given
the growth prospects and the various internationalisation policies of the federal
Page 32
10
government (Awolusi, 2013). The Nigeria manufacturing companies began
internationalisation of their operations more recently when they realized world
market would offer them more opportunity and unlimited scope for growth; some
ambitious service firms, especially Banks and Insurance institutions, began their first
experiment abroad, which means Nigerian internationalisation, is still at its early
stage (Onafowora & Owoye, 2006; Ezeoha, 2007). According to Onafowora and
Owoye (2006) despite the significant investments in internationalisation initiatives
by manufacturing firms around the world, formal efforts to determine their success
and the underlying critical decision factor have been very limited.
However, most domestic companies are not performing up to the expected level as a
result of competition from foreign companies, studies have observed that a great deal
of inconsistency exists in addressing this factors that influence internationalisation
(Segaro, 2012). There have been contradicting results on the effect of
internationalisation on financial performance of listed manufacturing companies in
Nigeria. Adenikinju and Chete (2002) posit that internationalisation have negative
effect on financial performance of listed companies. Furthermore, Ezeoha (2007)
examines the effect of internationalisation on financial performance, the result shows
significant positive relationship between internationalisation and financial
performance of listed companies.
Prior studies on foreign trade reveal that product export increases the financial return
of the listed companies (Awolusi, 2013). While Oyeniyi and Omotayo (2009) report
that foreign trade led to loss of profit and has negative financial performance.
Anfofum, Gambo and Suleiman (2013) investigate the impact of FDI on
performance and the findings shows positive impact of FDI on recipient companies.
Foreign funding of operation improves financial performance of manufacturing
companies (Kareem, Bakare & Ologunla, 2013). Ofili (2014) study on international
proprietary rights protection and economic development in Nigeria found that IPRs
protection has negative and insignificant relationship with the rate of innovation in
developing countries notwithstanding whether the developing country is within the
Page 33
11
low or high GDP band. Lee (2010) investigated the impact of internationalisation on
firm performance using quartile regression. The study findings show that for firms
with high performances, their performances were sensitive to internationalisation
activities; however, for firms with low performances, the stock market barely
recognized their attempts to internationalize. The findings further revealed that firms
with different firm performance across the distribution respond differently in
magnitude to their degree of internationalisation.
Furthermore, there is inadequate knowledge due to the early stage of
internationalisation of manufacturing companies in Nigeria (Ezeoha, 2012).
Similarly, studies (Graves & Thomas, 2006; Alkaabi, & Dixon, 2014; Senik, 2010;
Zahra, 2003) have been conducted on internationalisation in different countries such
as the US, China, and Europe show divergent results foreign direct investment have
positive impact on companies, foreign funding improve financial performance of
companies while delivery of foreign raw materials have significant negative effect on
the companies and product export increase the financial return of companies. Hsu
and Pereira (2008) conducted a study on the effects of the degree of
internationalisation on firm performance. The results based on data from a cross-
sectional set of U.S. multinational firms find evidence of positive relationship
between degree of internationalisation and firm performance. The rate of return on
assets declines, then increases, and finally decreases slightly as the degree of
internationalisation increases.
According to Ehinomen and Oguntona (2012) unemployment rate in Nigeria is very
high at 15% and manufacturing companies with international presence in other
continents can be catalyst through foreign trade and export thereby reducing the
unemployment rate in Nigeria economy. Also, Odi (2013) posit that Nigeria
economy is experiencing stagnation due to low demand of goods within Nigeria and
listed manufacturing companies can only increase demand through foreign trade and
export majorly within the West African region. Manufacturing companies can
Page 34
12
produce optimally and profitably with the aid of research and development (Jegede,
Egbetokun & Siyanbola, 2012).
Nigerian economy is facing contraction due to dwelling global oil price, reduced oil
revenue and growing statutory expenditure, however listed manufacturing companies
can leverage on FDI to improve productivity, quality and competitiveness it also
increases knowledge about training the workforce, contributes to the acquisition and
dissemination of new knowledge, and allows managers to learn new organizational
practices to enhance return on asset through internationalisation of the goods and
services (Thériault & Beckman 2008). Foreign and cheap source of funding will aid
the rapid development and internationalisation of Nigerian listed manufacturing
companies to advantage of the opportunities in African market (Olusegun, 2012).
Review of previous theoretical and empirical literature revealed that there is a
knowledge gap on the effects of internationalisation on firm performance since the
findings presented are contradictory to theoretical arguments.
1.3 Research Objectives
1.3.1 General Objectives
The general objective of this study was to determine the effect of internationalisation
on financial performance of listed manufacturing companies in Nigeria
1.3.2 Specific Objectives
i. To determine the effect of foreign trade on financial performance of listed
manufacturing companies in Nigeria.
ii. To establish the effect of foreign direct investment on financial performance
of listed manufacturing companies in Nigeria.
iii. To investigate the effect of international proprietary rights on financial
performance of listed manufacturing companies in Nigeria.
Page 35
13
iv. To determine the effect of business foreign funding on financial performance
of listed manufacturing companies in Nigeria.
1.4 Research Hypothesis
The study sought to test the following hypotheses;
H01 Foreign trade has no significant effect on financial performance of listed
manufacturing companies in Nigeria
H02 Foreign direct investment has no significant effect on financial performance
of listed manufacturing companies in Nigeria
H03 International proprietary right has no significant effect on financial
performance of listed manufacturing companies in Nigeria
H04 Business foreign funding has no significant effect on financial performance
of listed manufacturing companies in Nigeria
1.5 Significance of the Study
1.5.1 Theory Building
This study adopted resourced based theory, internalization theory and
internationalisation process theory to expound on the relationship between business
internationalization and financial performance of listed manufacturing companies in
Nigeria. In so doing the study expounded the applicability and utility of these
theories hence building the theory further. Therefore, future researchers may also use
the theory in this line of research. Academicians and scholars may use the finding
of this study in their empirical and methodology argument in future studies as a
source of reference.
Page 36
14
1.5.2 Policy Making
Policy makers and the government of Nigeria will find the results of this study useful
in designing policy framework and creating the enabling environment that supports
indigenous manufacturing firms to internationalize. Investors in manufacturing
industry will enjoy higher returns if they invest with the understanding of how
internationalisation strategies by firms affect performance.
1.5.3 Practitioners in Manufacturing Sector
The manufacturing sector in Nigeria has a huge potential in contribution to
employment and GDP if the challenges caused by lack of internationalization are
properly addressed. The findings of this study would eventually provide insight and
new knowledge for the stakeholders in manufacturing sector. The finding provided
necessary information on how to successfully internationalize manufacturing firms in
Nigeria. The stakeholders and management in the manufacturing sector may further
adopt the findings of this study so as to improve the performance of their companies.
1.6 Scope of the Study
The study covered the effect of internationalisation on financial performance of listed
manufacturing companies in Nigeria. The study specifically focused on the effect of
foreign trade, foreign direct investment, international proprietary rights, business
foreign funding on the financial performance of listed manufacturing companies in
Nigeria. The study was anchored on resourced based theory, internalization theory
and internationalisation process theory to expound on the relationship between
business internationalization and financial performance of listed manufacturing
companies in Nigeria. The study reviewed previous literature related to the effect of
business internationalization on firm performance. The study population was all
listed 74 manufacturing companies in Nigeria. The scope of the study covered the
period of 2006 to 2015. The study focused on this period since the concept of
Page 37
15
business internationalization is increasingly being adopted by many manufacturing
companies in Nigeria with the view to explore international markets.
1.7 Limitations of the Study
The following are some of the limitations of the study. The generalization of the
findings shall be limited if there are issues relating to breach ethical research
practices. Secondly, the research focused only on the listed manufacturing
companies, a highly regulated industry; the unlisted manufacturing companies are
left out. The study adopted descriptive and correlational analysis where the
relationship of the independent variables and dependent variable were identified by
regressing the independent variables with the dependent variables. The study was
further limited to Resourced Based Theory, Internalization Theory and
Internationalisation Process Theory. The study was conducted on manufacturing
companies in Nigeria.
Page 38
16
CHAPTER TWO
LITERATURE REVIEW
2.1 Introduction
This chapter encompasses both the theoretical and empirical literature with regard to
effect of internationalisation on financial performance of listed manufacturing
companies in Nigeria. The theoretical review guides the framework of the study
which includes all the relevant theories upon which this study is anchored and aid in
the clarity of the study perspective. Empirical literature discusses the relevant studies
which have been done on the variables under study. The conceptual framework
attempts to explain the relationships between the variables under study.
2.2 Theoretical Review
2.2.1 Resource Based Theory
Resource based theory was initiated in the mid-1980s by Wernerfelt (1984), Rumelt
and Lamb (1984) and Barney (1986) the Resource-Based View (RBV) has since
become one of the dominant contemporary approaches to the analysis of sustained
competitive advantage. The resource-based view suggests that valuable firm
resources comprising tangible and intangible elements are usually scarce, imperfectly
imitable, and lacking in direct substitutes (Brouthers & Hennart, 2007). It is about
producing the most value from one's existing capabilities and resources by
combining these with others' sources of advantage and, in this, ensuring
complementarily is paramount (Johanson & Vahlne, 1990).
The resource-based view suggests that firms develop unique resources that they can
exploit in foreign markets or use foreign markets as a source for acquiring or
developing new resource-based advantages (Luo, 2002). Luo (2002) suggests that
firms develop resource-based advantages by developing or acquiring a set of firm-
specific resources and capabilities that are valuable, rare and imperfectly imitable
Page 39
17
and for which there are no commonly available substitutes. According to Barney
(1991), a firm resource must, in addition, be valuable, rare, and imperfectly imitable
and substitutable in order to be source of a sustained competitive advantage.
Foss (1998) stated that the resource-based perspective does not escape the general
problem of finding the appropriate unit of analysis. Most contributions within the
RBV take the individual resource as the relevant unit of analyze are to study
competitive advantage. However, Foss (1998) points out that this choice may only be
legitimated if the relevant resources are sufficiently well-defined and free-standing.
If, in contrast, there are strong relations of complementarity and specialization
among resources, it is the way resources are clustered and how they interplay and fit
into the system that is important to the understanding of competitive advantage. Foss
(1998) recognizes that the concepts ‗capabilities‘ and ‗competences‘ aim perhaps at
grabbing this clustering and interplay. The conceptual framework takes this problem
into account by relating competitive advantage to strategy rather than to individual
resources.
Barney (1991) introduced the Resource Based View (RBV) which suggests that
characteristics of firm‘s resources may contribute to sustainable competitive
advantage. However only if these resources are rare, valuable, non-substitutable and
difficult to imitate the company can have a competitive edge compared to its
competitors (Barney, 1991). Multinational companies have better resources as
compared to local companies. Globalization has enabled these companies to reach
markets overseas because of their superior marketing strategies influence by better
resources. Gimeno (1999, p. 101) states that the resource-based research ―has
emphasized the lack of ability of imitators or rivals to erode the market position of a
firm as a necessary condition for sustainability, implicitly assuming that any rival
capable of eroding the position will do so and cannot be restrained from pursuing
that course of action‖.
Page 40
18
Although the resource-based view (RBV) has emerged as one of the substantial
theories of strategic management, it is said that it has overlooked the role of
entrepreneurial strategies and entrepreneurial abilities as one of the crucial sources of
the competitive advantage of a firm (Fink & Kraus, 2007). For the purpose of this
study, resource-based theory is found relevant as it provides theoretical foundation
for explaining how companies organize resources to enhance internationalisation
process and its effect on financial performance. Therefore, this theory is expected to
provide theoretical basis for specific objective one to four.
2.2.2 Internalization Theory
This theory was developed by Buckley and Casson (1976) and followed by Hennart
(1982). The origin of this theory was by Coase (1937) in a national context and
Hymer (1976) in an international context. Hymer (1976) established two major
determinants of FDI. The first were the advantages, which some firms possess in a
particular activity while the second was the removal of competition. Buckley and
Casson 1976) state that transnational companies organize their internal activities to
benefit from specific advantages, which are to be exploited. The Internalization
theory lies on why companies do not prefer to sign contract with a subcontractor in a
foreign country instead of engaging in Foreign Direct Investment themselves.
Denisia (2010) illustrates Internalization theory on the concept that transnational
companies arrange their activities internally to achieve specific advantages that they
can exploit. This theory explains the growth of multinational enterprise (MNE) and
the reasons why countries venture into foreign direct investment. If companies
contract out with a subcontractor, such companies may use the technology to
compete with the agency company by interrupting the contract or the agent may
damage the brand reputation of the company. Hymer (1976) demonstrates that FDI
take place, only if the benefits of exploiting these specific advantages are more than
the cost of the operations in foreign country. Most companies are more comfortable
with investing directly in a foreign country. It must be more beneficial to the firm
Page 41
19
possessing the ownership advantages to use them itself rather to lease or sell them to
foreign firms.
Hymer (1976) discussed the problem of information costs for international firms with
respect to local firms, different currency risk and differences in government‘s fiscal
policies. The theory of internalisation explains the motivations of the transnational
companies for making foreign direct investment by taking advantage of various
government fiscal policies and other policies. The internalisation advantages include
the following: avoid governmental intervention such as tariffs, price controls and
quotas; avoidance of litigation and violated contract; control of conditions and supply
of sale of inputs; application of transfer pricing; avoidance of negotiation and search
costs and control of market outlets.
The possession of internalization advantages suggests that the firm will exploit these
advantages by way of FDI rather than by contractual resource exchanges. For the
purpose of this study, internalisation theory is found relevant as it provides
theoretical foundation for explaining how companies can internally organise the
organisation‘s system to benefit from internationalisation and its effect on financial
performance. Therefore, this theory is expected to provide theoretical basis for
specific objective one to four.
2.2.3 Internationalisation Process Theory
Internationalisation Process (IP) theory acknowledges two approaches to the Uppsala
Model also called U-Model and the innovation – related model also refers to I-
model, both referred to the stage model based on firm behaviour. This theory was
first proposed by Johanson and Wiedersheim-Paul (1975) and Johanson and Vahlne
(1977) and states that internationalisation is a staged process and firms gradually
progress from early to latter stages of internationalisation. The stages of
internationalisation were defined based on resource commitments made by the
organisation with lowest resource commitment defining the first stage of
internationalisation and highest resource commitment defining the last stage of
Page 42
20
internationalisation. Thus, stages of internationalisation ranged from no export
activity to setting up a subsidiary in another country of interest.
Internationalisation Process theory states that firms moved from the one stage to the
next sequentially as they incrementally gained knowledge of their export markets.
An increase in knowledge with respect to international business facilitates increase in
level of internationalisation by reducing the psychic distance between firms from
home and host countries. Incremental internationalisation process theory builds on
knowledge accumulation and experience (Andersen, 1993) it incorporates several
related approaches, which are similar in their explanatory power. Both the Uppsala
internationalisation model and the innovation-related internationalisation model
contend that firms become international in a slow and incremental process with a
limited number of targeted geographic markets (Andersen, 1993).
Zahra (2005) investigate the nature of foreign market entry, incremental
internationalisation and accelerated early cross-border engagements have come to
form the dominant paradigms in internationalisation process research. The
incremental view of internationalisation has not been without its critics. As the
environment has changed significantly since the traditional internationalisation
theories were developed, firms have quite often been required to speed up their
foreign market entry processes.
The increased level of globalization in many industries may further lessen the
perceived risk of entering foreign markets and partly explains the observed increase
in the speed of internationalisation. Technological innovation aside, the presence of
an increasing number of people with international business experience has
established new foundations for multinational enterprises (Oviatt & McDougall,
1994). For the purpose of this study, internationalisation process theory is found
relevant as it provides theoretical foundation for explaining how companies follow
stage by stage progress of internationalisation and its effect on financial
Page 43
21
performance. Therefore, this theory is expected to provide theoretical basis for
specific objective one to four.
2.3 Conceptual Framework
According to Kombo and Tromp (2009), a concept is an abstract or general idea
infeed or derived from specific instances. A conceptual framework is a set of broad
ideas and principles taken from relevant fields of enquiry and used to structure a
subsequent presentation. In this study, the conceptual framework has shown in figure
2.1. Shows the relationship of the independent and dependent variables of this study
include foreign trade, foreign direct investment, International Proprietary Rights and
foreign funding. The dependent variables under this study are the financial
performance. The selection of these variables is based on the fact that they are
capable of revealing the effect of internationalisation on financial performance by
listed companies (Riding, Orser, Spence & Belanger, 2012). They have been used in
earlier research like Thériault and Beckman (2008). Extant literature shows that
internationalisation influence financial performance. Kraśnicka and Głód (2013)
posit that a significant relationship exists between internationalisation and financial
performance.
While financial performance as the explained variable (return on assets and market
return), this accounting information represent expected return from engaging in
internationalisation and can be derived from annual audited published financial
reports. This measure for financial performance will be adopted for two key reasons;
firstly, the level of success of a firm within the manufacturing sector is measured
through its financial performance based on a selected period of time (Surroca, Tribó
& Waddock, 2010). Secondly, financial performance is a measure of an
organization‘s financial condition or financial outcomes resulting from management
decisions carried out by organization members (Campbell & Mínguez-Vera, 2008).
For the purpose of this study, internationalisation that was used in the study was
geared towards understanding its effect on financial performance of listed
Page 44
22
manufacturing companies in Nigeria. Since the general objective of the study
evaluated the effect of internationalisation on financial performance, the financial
performance measure employed in this analysis was return on assets. Therefore, this
study was conceptualised as depicted in figure 2.1
Independent Variables
Figure 2.1 Conceptual framework
2.3.1 Foreign Trade
Evidence from literature on foreign trade shows contradicting positions. Foreign
trade is a variable that provides information on the firms‘ orientation to export and is
measured as export income ratio and import expenses ratio (Filatotchev & Piesse,
2009). Riding, Orser, Spence and Belanger (2012) study the relationship between
Dependent Variable
Foreign Trade
Export income ratio
Import expense ratio
Foreign Direct Investments
Foreign operation profit share
Foreign asset to total asset ratio
International Proprietary Rights
Patent rights cost ratio
Royalties income ratio
Business Foreign Funding
Foreign cost of Debt.
Foreign cost of Equity
Financial
Performance
Return on Assets
Page 45
23
export barriers and the export performance of Greek firms, the study used
exploratory and confirmatory factor analyses. The result shows operational
dimension, environmental dimension, financial dimension, source dimension has
positive effect while legal dimension and logistic dimension have negative effect on
performance of Greek firms (Fung, Yau, & Zhang, 2011).
Some of the main benefits of an international expansion are the exploitation of
economies scale, learning and innovation opportunities, access to key resources, and
bargaining power (Luo, 1998). On the other hand, at early stages of international
expansion the firm faces liabilities of foreignness and are not able to best explore the
economies of scale and learning opportunities, does not possess the ability to
configure local key resources in a way that minimizes the overall costs, because of
company‘s unfamiliarity with the local idiosyncrasies and has not the sufficient
bargaining power, since it has not established its legitimacy in the host country
(Gilpin, 2016). Summarizing, in the first stages of international expansion those
liabilities will hinder the full exploitation of the international expansion benefits in
such a way that will engender a declining of performance (Walley, 2007).
With increasing international experience, development of new capabilities,
diminishing costs of being new and foreign, and expansion of the international
operation, the firm starts to benefit from the international expansion (Zahra, Ireland
& Hitt, 2000). But when this expansion starts to grow to more and more countries
and subsidiaries, the costs of governance and coordination rises up to a point that the
costs involved supplant its benefits (Lu & Beamish, 2004).
The long-term performance of internationally diversified firms may be based, at least
partially, on their ability on developing product and process innovation (Hitt et al.,
1997). Based on that, to those authors, product diversification plays an important
moderating role in their model. From a resource-based perspective, the experience
with product diversification is a key on developing managerial capabilities. Those
built capabilities will in the future provide the required ability to deal with complex
Page 46
24
challenges on the international business (Sapienza, Autio, George & Zahra, 2006).
Similarly to the international diversification strategy, some important reasons for a
firm to assume both international and product expansion are the better opportunities
to exploit the economies of scope and scale, learning and bargaining power, since
prior experience in product diversification gives experience in the management of
multiple product-markets, which can result on positive interactive effects of both
product and international diversification (Hitt et al, 1997). Hitt et al, (1997) suggest
that international diversification is negatively related to performance in non-
diversified firms, positively related in highly product diversified firms and
curvilinear in moderately product diversified firms.
Export and import are also more common among older and larger SMEs. Despite the
increasing prevalence of international new ventures recently established firms that
start exporting soon after inception, most SMEs venturing abroad often still do so
using a cautious, stepwise approach after several years of domestic growth
(Sleuwaegen & Onkelinx, 2014). While high tech firms may choose rapid
internationalization and follow the international new venture approach (Onkelinx &
Sleuwaegen, 2010), the stage theory (Johanson & Vahlne, 1977) may still be the
most appropriate one for firms in mature industries. The timing and risks involved in
these approaches are different, and firms need to evaluate whether they want to
reduce the risk and follow a conservative pattern or need to rapidly capture market
share before their technology becomes obsolete (Cavusgil & Knight, 2009).
2.3.2 Foreign Direct Investment
Developing countries, emerging economies and countries in transition have come
increasingly to see FDI as a source of economic development and modernisation,
income growth and employment (Lall, 2000). Countries have liberalised their FDI
regimes and pursued other policies to attract investment. They have addressed the
issue of how best to pursue domestic policies to maximise the benefits of foreign
presence in the domestic economy. The study Foreign Direct Investment for
Page 47
25
Development attempts primarily to shed light on the second issue, by focusing on the
overall effect of FDI on macroeconomic growth and other welfare-enhancing
processes, and on the channels through which these benefits take effect (Brada,
Kutan & Yigit, 2006).
The overall benefits of FDI for developing country economies are well documented.
Given the appropriate host-country policies and a basic level of development, a
preponderance of studies shows that FDI triggers technology spillovers, assists
human capital formation, contributes to international trade integration, helps create a
more competitive business environment and enhances enterprise development
(Rugraff, 2008).
All of these contribute to higher economic growth, which is the most potent tool for
alleviating poverty in developing countries. Moreover, beyond the strictly economic
benefits, FDI may help improve environmental and social conditions in the host
country by, for example, transferring ―cleaner‖ technologies and leading to more
socially responsible corporate policies (Ahmed, 2012). The main factors motivating
FDI into Africa in recent decades appear to have been the availability of natural
resources in the host countries (investment in the oil industries of Nigeria and
Angola) and, to a lesser extent, the size of the domestic economy (Anyanwu, 2011).
The reasons for the lacklustre FDI in most other African countries are most likely the
same factors that have contributed to a generally low rate of private investment to
GDP across the continent (Basu, & Srinivasan, 2002).
2.3.3 International Proprietary Rights
International proprietary rights come in many forms, trade secrets, copyrights, and
patents being the most important in relation to technology transfer (Arora, 2009).
The literature on trade secrecy and copyrights is sparse, especially for trade secrecy,
and particularly as it relates to international technology transfer; much of the
empirical evidence at hand deals with patents (Graves, 2007). The principal reasons
are that patent databases are widely available, it is much easier to link patents to
Page 48
26
technology and industry groups, and there is great variation in the extent and nature
of patent protection across countries. Details of patent protection and its role in
technology transfer are also of great policy interest (Bejesky, 2003).
McCalman (2001) employed a more disaggregated set of measures using detailed
information about patent institutions by summarizing the extent of coverage offered
restrictions on the form of exploitation of patents and the availability of enforcement
institutions (Hall & Helmers, 2010). This study is, however, an exception rather than
the norm in not using a summary measure of the strength of IPR protection.
However, unless one is fortunate, the use of multiple measures makes it difficult to
empirically answer the impact of IPRs. Instead, one can only quantify the effect of
this or that aspect of the IPR regime (Hall & Helmers, 2010). Arora, Fosfuri and
Gambardella (2007) explored international technology licensing. Maskus, Saggi and
Puttitanum (2004) provided a survey of the theoretical and empirical literature on
patents and technology transfer through direct foreign investment and licensing.
2.3.4 Business Foreign Funding
Harash, Al-Timim and Alsaadi (2014) states that access to foreign capital is essential
to the survival and performance of international firms. Access to external foreign
finance is a key determinant of a firm‘s ability to develop, operate and expand
internationally (Galí, López‐Salido & Vallés, 2007). No international company can
survive without enough funds for working capital, fixed assets investment,
employment of skilled employees, development of markets and new products.
Young (2012) posits that short term foreign capital finance is for a shorter period of
time, usually less than one year. It is required for the purchase of working capital
assets, for meeting day to day working requirements and financing operations of the
companies. Long term capital finance is available for an extended period of time of
over one year. Long term capital finance is needed for investment in fixed assets
such as land and buildings, plant and machinery and for financing expansion
Page 49
27
programmes. Sources of long-term finance include shares, foreign grants, retained
profits, long-term loans and sale of assets (Kalantzis, 2015).
Manova, Wei and Zhang (2015) examine the effects of foreign capital on financial
performance of publicly listed manufacturing companies in Egypt. Using sampling
technique and the study used secondary data, which was obtained from the
companies‘ statistics and journals at the Cairo stock Exchange. The results from this
research suggested that in most of the manufacturing firms listed on CSE, there is a
direct positive relationship between foreign capital and the dependent variable,
Profitability and Liquidity. Similar studies on foreign source of capital and firm
performance.
2.3.5 Financial Performance
Salter (1995) suggested that performance measurement of corporate and business
unit has three dimensions: effectiveness, efficiency, and adaptability. Some
indicators of three dimensions are returns on investment, sales growth, and new
product success, respectively. Furthermore, Salter (1995) argued that relative
performance measures appropriate surrogates for objective measures in the single-
industry sample. Morgan (2012) suggested that business performance consists of two
aspects: market performance and financial performance. Market performance relates
to customer behaviours.
Higher sales volume, customer satisfaction increases, customer loyalty, and growth
of market shares are indicators of market performance while the financial
performance is measured in accounting terms. This study defines firm performance
as a goal achievement and financial performance that are indicated by the net income
goal achievement, sales amount and market share increases, the better return on
investment, and the growth and continuance of overall performance (Mella, 2012).
Business operation focus on highest potential profit and a common approach is a cost
control that is expected to produce the greatest overall financial performance (Wu,
Page 50
28
Lin & Chang, 2011). Cost management strategy implementation success might
generate value to the firm, for example, the greater control production activities
results in better quality of procedure and lowers the unit cost of goods and cost
variance. In addition, the consequence of the cost management success is firm value
increasing and profit improvement that positively affects firms' value greater than
pricing (Gibcus & Kemp, 2003). Therefore, it can be expected that cost management
implementation will increase firm performance.
Profitability is also used as a general measure of a firm‘s overall financial health over
a given period of time and can be used to compare similar firms across the same
industry or to compare industries or sectors in aggregation (Mella, 2012).). Four
useful profitability ratios and measures are the return on assets (ROA), return on
equity (ROE), operating profit margin and net income. The ROA measures the
returns to all assets and is often used as an overall index profitability and the higher
the value, the more profitable the business. ROE measures the rate of return on the
owners‘ equity employed in the business. It is useful to consider ROE in relation to
ROA to determine if the firm is making profitable returns on their borrowed money
(Walsh, 2006).
2.4 Empirical Literature Review
This section reviews literature from prior scholars relevant to the variables under the
study regarding the effect of internationalisation on financial performance of listed
manufacturing companies in Nigeria.
2.4.1 Foreign Trade and Financial Performance
Musuva (2013) researched on the firm level factors and international performance of
companies listed on the Nairobi Securities Exchange. Specifically, the research
focused on the effect of institutional capital, management characteristics,
organisational demographics, firm capabilities, internationalisation orientation and
degree of internationalisation on firm international performance. The firm
Page 51
29
capabilities studied were organisational innovation, knowledge capability and
adaptive capability. This research adopted a quantitative approach based on a cross-
sectional study of publicly quoted companies in Kenya. A semi structured
questionnaire was administered for data collection. Structural equation modelling -
Partial Least Squares analysis was used to analyse the survey responses and to test
the hypotheses, however the results are still mixed. The results indicated that
institutional capital and management characteristics have a positive and significant
effect on firm capabilities. Additionally, it was also found that the level of firm
capabilities influences the effect of institutional capital on international performance.
The level of international expansion, measured as the degree of internationalisation
was found to influence the effect of firm capabilities on the international
performance of a firm as relates to organisational innovation intensity but not for
knowledge and adaptive capability.
Ghanatabadi (2005) conducted a study on internationalisation of small and medium-
sized enterprises in Iran, based on Innovation-Related Internationalisation models the
author view the development of export activities as an innovation adoption cycle or
as an export development ‗learning curve‘ influenced by internal factors. He further
argues that internationalisation models explain the firms‘ internationalisation‘ in a
slow and incremental manner. Kraśnicka and Głód (2013) conducted a study on the
impact of the internationalisation of Polish SMEs on their performance. The study
also reviewed the differences between classical models of internationalisation and
the so-called born global models. The finding reveals a positive relationship between
exports of small and medium enterprises and their financial performance.
Similarly, Thériault and Beckman (2008) investigate the internationalisation of
Indian firms in order to identify strategic issues and organizational design.
Hypotheses and study questions were developed, which were finally tested via a
grounded methodology and the findings show that simultaneous to the opening up of
the Indian economy to international markets, lead Indian companies to undergone
significant transformation towards newer forms of organizing over the last 5 years. In
Page 52
30
addition, the findings shed light on key strategic issues such as internationalisation-
related modes, competitive drivers, geographical focus, and aspirations, as well as
drivers of organizational transformation of internationalizing Indian companies.
Ahmed Sheikh and Wang (2011) examine the determinants of textile and clothing
exports of Pakistan, using a time series data over the period twenty years. The
demand and supply side exports equation were estimated in a simultaneous equation
frame-work. The coefficient on the price of textile exports and world income
appeared with correct signs but turned out to be insignificant. All the coefficients on
the supply side were found to be statistically significant. Ehinomen and Daniel
(2012) examine the export and economic growth in Nigeria, the study uses annual
time series covering 1970 to 2010 to determine the causal and long-run relationship.
The findings show a uni- directional relationship between export and economic
growth, thus export sales have effect on financial performance on manufacturing
companies in Nigeria. Also in Pakistan Raheman, Afza, Qayyum and Bodla (2010)
found that trade openness and export of sales have significant influence of
performance of listed manufacturing companies.
Roy (2007) estimates the demand and supply functions of the manufactured exports
for India, using a time series data over the period 1960-2006. The FIML has been
used to estimate the demand and supply side exports for six different categories of
manufactured exports including cloth and garments, chemicals and machinery,
transport equipments, steel and iron, and the leather manufactures. The findings
suggest importance of all demand side factors for exports performance. On the
supply side, the variables produced mix results in terms of significance and some
variables like world GDP and exports volume turned out to be insignificant for
textile and iron-steel exports respectively.
Ehinomen (2012) investigates the relationship between firm performance and
internationalisation behaviour for the period from the firms‘ start-up until 1997,
using data from the first survey. They found that an international engagement
Page 53
31
improves labour productivity and increases sales growth rate, but does not affect
employment growth rate. The foreign market may be particularly important for
young, small, technology oriented firms, especially for those operating in a narrow
market niche. In order to be competitive in international markets, Malaysian
companies have taken the opportunities which are available worldwide through
internationalisation strategies where there are no transactional or geographical
boundaries, where business transaction can now be performed more rapidly (Molla,
& Licker, 2005).
Martinez (2006) examines the relationship between industrial districts and the export
performance of SMEs in Spain using panel data. The study showed a positive and
significant link between the location of the firm in the district and networks
(competitors‘ network and institutional network) and the EP of Spanish SMEs in a
given area. Indeed, according to the location of the firm in the district (near ports,
airports and supplier) a company does gain because it will benefit from better
conditions than its competitors. Furthermore, Damoah (2011) examine export
behaviour of small and medium-sized manufacturing firms in Ghana, data were
collected from garment and textile industry of Ghana. The study drew on a set of
quantitative data and more qualitative interviews concerns the behaviour of both
small and medium-sized exporting and non-exporting firms from the garment and
textile manufacturing sector in Ghana. The findings reveal that on overall, firm size,
sector, workforce education levels, and participation in international and domestic
business networks are found to be the key drivers explaining why some SMEs from
Ghana choose to export. Based on the findings it is concluded that international
networks serve as a means of improving their financial performance through
international markets.
2.4.2 Foreign Direct Investment and Financial Performance
Empirical literature on foreign direct investment show varying results, Doukas and
Lang (2003) state that foreign companies that invest in their business performed
Page 54
32
better than post-acquisition financial companies that do not diversify into fields of
activities other than traditional activities. FDI can improve productivity, quality and
competitiveness it also increases knowledge about training the workforce,
contributes to the acquisition and dissemination of new knowledge, and allows
managers to learn new organizational practices (Thériault & Beckman 2008). Many
multinational enterprises have been attracted by new markets, cheap labour forces
and supporting policies toward foreign direct investment (FDI) in transition
economies (Cheng & Kwan, 2000).
Wagner (2004) conducted a study on internationalisation speed and cost efficiency
using survey data and financial statement data of German insurance groups with
property-liability business for the years 2009. The study developed a resource-based
perspective and argued that strategic transformation is a major factor driving
insurance groups‘ internationalisation, whereby successful international insurance
groups facilitate organizational learning from international operations to enhance
home market performance. The findings of the study confirmed the notion and
showed that the establishment of branch offices as well as greater internationalisation
is positively correlated with company‘s financial performance. Chatterjee (2009)
posit that the main motives for a firm to engage in foreign production are to seek
natural resources, to seek market, to seek efficiency and to seek strategic asset.
However, study on the factors influencing the performance of Japanese FDI in
Thailand, 270 Japanese MNCs subsidiaries between year 2005-2009 were sampled
and result shows that firm size is negatively associated with profitability.
Mawugnon and Qiang (2009) investigates the effect of foreign direct investment on
economic growth through internationalisation in Togo using time series data, the
research found that there was a unidirectional relationship between FDI and GDP.
The direction of causation ran from FDI through internationalisation to GDP enables
to conclude that FDI positively influence GDP through internationalisation and not
otherwise. The study therefore recommends improvement in the investment climate
Page 55
33
for foreign direct investment to enhance competitiveness and strengthen through
internationalisation.
Büthe and Milner (2008) examine the influence of Foreign Direct Investment on Per
Capita GDP in Nigeria using Vector Error Correction. The result shows a negative
relationship between FDI and economic growth in Nigeria. Similarly, Kolstad and
Wiig (2012) investigate the impact of foreign direct investment (FDI) on Economic
Growth in Nigeria within the period of 1986-2011. The study employed multiple
regression models to determine the impact of some external variables on the gross
domestic product (GDP) proxy for economic growth in Nigeria. The study used time
series data to ascertain the inflow of FDI to the Nigerian economy and its
implications on economic growth. The finding revealed a positively impact on the
economy though its contribution to GDP was very low within the period under
review.
In addition, Head, and Ries (2008) examined the sustainability of the FDI- growth
relationship in Nigeria. Using the Johansen co-integration framework and a
multivariate VAR within a vector error correction model, found evidence of a long-
run equilibrium relationship between economic growth and FDI inflows. The study
also revealed a unidirectional causality from FDI to economic growth.
Also, Kinda (2010) looking at a cross-country study on FDI and economic growth,
the study used a bivariate VAR modelling technique and found evidence of a positive
FDI-led growth for Nigeria, Sri Lanka, Tunisia, and Egypt; and based on weak
exogeneity tests, a long-run causality between FDI and economic growth running in
both directions was found for the same set of countries.
Mathews (2006) examine internationalisation in emerging market companies from
the Asia-Pacific region, it shows that their internationalisation was very rapid and
had positive influence on the financial performance of companies. Also it was
different from that of the conventional western multinationals, and also from that of
the erstwhile developing country multinationals in the 1960s and 1970s. The study
Page 56
34
further showed that there was a positive relationship between FDI and Gross
Domestic Product (GDP). The study concluded that the economy would perform
better with greater inflow of FDI.
Mathews and Zander (2007) review internationalisation as practice by multinationals
through FDI described it as ‗accelerated internationalisation.‘ Newer multinationals
from emerging markets have been able to pursue rapid internationalisation owing to
their distinctive ability to come up with organizational and strategic innovations
compensating for their lack of financial and managerial capabilities. The resultant
effect on financial performance was significantly high. The harsh environmental
conditions in most emerging economies such as a weak institutional context,
demanding yet price sensitive consumers, and challenging distribution networks in
their home markets, instead of acting as impediments, have helped emerging market
companies to develop unique competencies, to be later apply to compete successfully
in foreign markets that impacted on financial returns positively.
McGrew and Poku (2007) explore the effects of internationalisation on firm
performance using a sample of I64 Japanese SMEs. Findings show that high levels of
FDI are positively related to performance. Further, it also shows that exporting has a
negative moderating effect on the relationship between FDI and performance, which
points to the importance of the configuration of internationalisation strategies. FDI
applicable to the companies through internationalisation and access to foreign
markets influence performance of the companies in a positive manner FDI flows as a
bundle of resources to companies enhances financial performance. Also FDI‘s effect
on economic growth is thus based on its contribution to capital accumulation and
total factor productivity improvements.
Khanna, Palepu and Sinha (2005) posit that the rise of companies such as Ranbaxy
Laboratories from India, Samsung from Korea, and Acer from Taiwan, into powerful
global giants clearly demonstrates the effect of FDI properly managed by companies
to generate super high financial rewards. Gatawa, Aliyu and Musa (2013) analysed
Page 57
35
the impact of FDI on performance of manufacturing sector in Nigeria, the study
employs a model that measures the exert FDI on financial performance. This study
concludes that FDI have impact on financial performance. Umah (2007) states that
FDI of multinational corporations distort developing nation economy, distortions
include the crowding out of national firms, rising unemployment related to the use of
capital-intensive technology, and a marked loss of political sovereignty.
2.4.3 International Proprietary Rights and Financial Performance
Arora (2009) conducted a study on intellectual property rights and the international
transfer of technology in developing countries. The study aimed at exploring one of
the main areas to which research efforts have been devoted, namely, the determinants
of the use of different appropriability strategies at the firm and sectoral level. The
data was analysed using Statistical package of social studies. The data was analysed
using inferential statistics; correlation and regression model. The study concluded
that it is useful to note that it is essential to analyse the impact of patenting and other
appropriability tools on variables such as profits or innovation activities.
Bejesky (2003) conducted a study on managing the patent versus trade secret
protection decision for the multinational corporation in China. The study cconsidered
two factors related to this risk in the context of China associated with the global
importance of this market and serious apprehensions encompassing China's
International Proprietary Rights protections. First, it considered objective
enforcement of codified legal institutions" that protect patents and trade secrets while
examining political, cultural, and informal" influences on legal frameworks. MNCs
often must negotiate with government officials and build political relationships in the
investee country. Second, within the context of dynamic interactions between
political and legal influences, the article appraises the important trade-off between
filing for patent protection or protecting process technology internally via trade
secret. In order to protect a patent, a firm must comply with filing requirements, the
invention must fall within the scope of patent protection as defined by the host
Page 58
36
government, and the holder must take measures to enforce patent rights if there is a
potential infringement.
Hall and Helmers (2010) conducted a study on the role of patent protection in
technology transfer. The study reviewed the evidence on the role of patents for
innovation and international technology transfer in general. The literature suggested
that patent protection in a host country encourages technology transfer to that
country but that its impact on innovation and development is much more ambiguous.
The study discussed the implications of these findings and other technology‐specific
evidence for the diffusion of climate change‐related technologies. The study
concluded that the double externality problem, that is the presence of both
environmental and knowledge externalities, implies that international proprietary
rights may not be the ideal and cannot be the only policy instrument to encourage
innovation in this area and that the range and variety of green technologies as well as
the need for local adaptation of technologies means that patent protection may be
neither available nor useful in some settings.
2.4.4 Business Foreign Funding and Financial Performance
Extant studies on the effect of foreign funding on financial performance reveal that
access to foreign capital by manufacturing companies influences performance.
Samarina and Bezemer (2016) investigate the impact of foreign source of financing
on performance of companies in Ghana, the result reveal that foreign source of
financing has positive effect on financial performance of companies in Ghana.
Foreign source of financing operations was mostly, foreign equity shares, bank loans
due their repayment structure which were structured in line with the business cash
flows the funds were mainly used for financing working capital and to source raw
materials for production.
Vanacker, Manigart, Meuleman and Sels (2011) examine the impact of foreign lease
financing on the financial performance of Nigerian oil and gas companies. Data for
the study was collected from annual reports and accounts of 6 sampled companies in
Page 59
37
the Nigerian Oil and Gas industry, that are engaged in foreign lease financing and
were also listed on the Nigerian Stock Exchange (NSE) not later than January, 2010.
Robust OLS regression analysis is used to analyse the impact of foreign lease
financing on return on assets (ROA). The results of the study revealed that foreign
lease financing has significant impact on the ROA of oil and gas companies in
Nigeria. Therefore, the research recommends that firms should embrace foreign lease
financing as a method of financing their operations as evidence suggests that value is
added through the use of foreign lease financing.
Benigno, Converse and Fornaro (2015) that foreign source of financial leverage had
a significant negative relationship with performance as measured by return on assets
(ROA) and return on equity (ROE); Caballero (2014) the study investigates the
relationship between manufacturing companies and performance of listed companies
in Italy. The findings revealed that there was an inverse relationship between foreign
source of capital and financial performance of listed firms; Gopinath, Kalemli-
Ozcan, Karabarbounis and Villegas-Sanchez (2015) found that foreign sources of
debt and equity were major determinants of financial performance of firms listed at
the NSE and there was evidence of a negative and significant effect of foreign source
of capital on all measures of performance.
Furthermore, Gbandi and Amissah (2014) examine the impact of foreign capital on
the performance of manufacturing companies in Nigeria. Sample of 15
manufacturing companies listed on the Nigeria Stock Exchange were used for this
study which covers a period of five years from 2005-2009. Multiple regression
analysis was applied on performance indicators such as return on asset and profit
margin as well as short-term debt to total assets, long term debt to total assets and
total debt to equity as capital structure variables. The results show that there is a
negative relationship between foreign source of capital, ROA and profit margin.
Buster (2012) examine effects of foreign source of debt on firm performance: a
survey of commercial banks listed on Nairobi securities exchange the study use a
Page 60
38
longitudinal research design in collection of data. Sample of 11 commercial banks
was considered in the study. The data was analysed using Statistical package of
social studies. The data was analysed using inferential statistics; correlation and
regression model. The study reveals that foreign debt negatively affects firm
performance. The study concludes that the use of foreign source of debt in a firms‘
capital structure negatively affects the performance of commercial banks in Kenya.
Owino (2015) examine the effect of foreign capital on the financial performance of
investment and banking firms listed at the Nairobi Securities Exchange in Kenya this
study therefore sought to examine the extent to which foreign capital influences
financial performance, secondary data were collected from investment companies
and banking institutions listed on the Nairobi Securities Exchange (NSE). Investment
companies and banking institutions were evaluated through the analysis of their
published financial statements for the period 2009 to 2013. Descriptive analysis and
post estimation tests were conducted to adhere to the assumptions of regression
analysis. Regression results for the influence of foreign source of capital on ROE
revealed that foreign capital have a positive a significant relationship with ROE.
2.4.5. Financial Performance
Performance is the result of strategies the firm employs to achieve financial goals
(Uotila, Maula, Keil & Zahra, 2009). The level of success of a firm within the
manufacturing sector is measured through its financial performance based on a
selected period of time. Financial performance is a measure of an organization‘s
financial condition or financial outcomes resulting from management decisions
carried out by organization members (Campbell & Mínguez-Vera, 2008). According
to Chi and Gursoy (2009) financial performance refers to the level of companies‘
financial performance relative to their major competitors over the past years. It
literally refers to financial measures, such as return equity (ROE), return on
investment (ROI), operating profit, and sales growth rate (Kuhle, Walther &
Wurtzebach, 2009). Pratheepkanth (2011) claimed that these indicators are the best
Page 61
39
to identify whether an organization is doing things right and hence these indicators
can be used as the primary measure of organization success.
Furthermore, Protopappa and Seifert (2010) pointed profitability as the most
common measure of performance in companies. This indicator is considered to be
the common measures of financial profitability. Various scholars have attempted to
provide a clear definition of performance, but they had yet to come to an agreement
over a common definition, particularly regarding some aspects of terminology issues,
analytical levels, and the conceptual basis for assessment. Performance of a company
can be defined in various ways depending on the questions in mind when inquire
about a company‘s performance (Sueyoshi & Goto, 2010).
Regardless of the differences among researchers on what the definition of
performance is, they agree that it is generally associated with expectations for
success. The financial performance of international manufacturing companies
depends on the success of firms in the market, both locally and internationally.
Information on financial performance is useful in predicting the capacity of the
enterprise hence analysing how well or poorly an enterprise is doing against its set
objectives. Financial performance is commonly used as an indicator of a firm‘s
financial health over a given period of time. This puts financial performance as the
dependent variable key issues of international firms. Therefore, in this study financial
performance refers to return on equity, return on asset and return on investment.
2.5 Critique of Existing Literature
This section discusses the empirical literature. It reviews prior studies on
internationalisation and financial performance. Studies on this area are compared and
contrasted in terms of methodology, objectives, variables, conclusions and research
gaps. For instance, Musuva (2013) study focused on the firm level factors and
international performance of companies listed on the Nairobi Securities Exchange.
Specifically, the research focused on the effect of institutional capital, management
characteristics, organisational demographics, firm capabilities, internationalisation
Page 62
40
orientation and degree of internationalisation on firm international performance. This
study was conducted in Kenya hence the finding cannot be generalized to listed
manufacturing companies in Nigeria. Similarly, the objectives of this study were
different with the objectives of the current study.
Ghanatabadi (2005) on the other hand, conducted a study on internationalisation of
small and medium-sized enterprises in Iran, based on Innovation-Related
Internationalisation models the author view the development of export activities as
an innovation adoption cycle or as an export development ‗learning curve‘
influenced by internal factors. Similarly, the context of this study is different from
the context of the current study. Ghanatabadi, (2005) study was conducted on
internationalisation of small and medium-sized enterprises in Iran while the current
study will be conducted on listed manufacturing companies in Nigeria.
Kraśnicka and Głód (2013) conducted a study on the impact of the
internationalisation of Polish SMEs on their performance. Kraśnicka and Głód
(2013) study was conducted on impact of the internationalisation of Polish SMEs on
their performance while the current study will be conducted on listed manufacturing
companies in Nigeria. Similarly, Thériault and Beckman (2008) investigate the
internationalisation of Indian firms. Thériault and Beckman (2008) study findings
may not be applied to the context of Nigeria since Nigeria had different socio-
economic settings.
Ahmed, Sheikh and Wang (2011) further examined the determinants of textile and
clothing exports of Pakistan, using a time series data over the period twenty years.
The study focused on exports while the current study focused on foreign trade,
foreign direct investment, international proprietary rights and business foreign
funding. Similarly, Ahmed, Sheikh and Wang (2011) may not apply in the Nigerian
context since it was conducted in Pakistan. Ehinomen and Daniel (2012) on their part
examinee the export and economic growth in Nigeria, the study uses annual time
series covering 1970 to 2010 to determine the causal and long-run relationship. The
Page 63
41
study focused on exports and economic growth while the current study focused on
effect of foreign trade, foreign direct investment, international proprietary rights and
business foreign funding on financial performance of listed manufacturing
companies in Nigeria.
Roy (2007) estimates the demand and supply functions of the manufactured exports
for India, using a time series data over the period 1960-2006. The study did not focus
on the effects on internationalisation on financial performance of listed firms.
Martinez (2006) examines the relationship between industrial districts and the export
performance of SMEs in Spain using panel data. These study findings may not be
applied to the context of Nigeria since Nigeria had different socio-economic settings.
Muhammad (2012) conducted a study on internationalisation speed and cost
efficiency using survey data and financial statement data of German insurance
groups with property-liability business for the years 2009. These study findings may
not be applied to the context of Nigeria because German is a developed economy
while Nigeria is emerging economy. Mawugnon and Qiang (2009) investigates the
effect of foreign direct investment on economic growth through internationalisation
in Togo using time series data, the research found that there was a unidirectional
relationship between FDI and GDP. The study focused on foreign direct investment
while the current study included other variables such as foreign trade, business
foreign funding and international proprietary rights.
Büthe and Milner (2008) examine the influence of Foreign Direct Investment on Per
Capita GDP in Nigeria using Vector Error Correction. This study focused on Foreign
Direct Investment and economic growth while the current study will focus on FDI
and financial performance of listed Manufacturing companies. Similarly Büthe and
Milner (2008) used Vector Error Correction while the current study used ordinary
least squares regression analysis. Head and Ries (2008) examined the sustainability
of the FDI- growth relationship in Nigeria. Using the Johansen co-integration
framework and a multivariate VAR within a vector error correction model, found
Page 64
42
evidence of a long-run equilibrium relationship between economic growth and FDI
inflows. Head and Ries (2008) used Johansen co-integration framework and a
multivariate VAR within a vector error correction model while the current study used
ordinary least squares regression analysis.
Mathews (2006) examine internationalisation in emerging market companies from
the Asia-Pacific region, it shows that their internationalisation was very rapid and
had positive influence on the financial performance of companies. These study
findings may not be applied to the context of Nigeria because Asia-Pacific region
and Nigeria have different economic, social and political settings. McGrew and
Poku, (2007) explore the effects of internationalisation on firm performance Using a
sample of I64 Japanese SMEs. These study findings may not be applied to the
context of Nigeria because Japan is a developed economy while Nigeria is emerging
economy and the two countries have different economic, social and political settings.
Vanacker, Manigart, Meuleman and Sels (2011) examined the impact of foreign
lease financing on the financial performance of Nigerian oil and gas companies. Data
for the study was collected from annual reports and accounts of 6 sampled companies
in the Nigerian Oil and Gas industry, that are engaged in foreign lease financing and
were also listed on the Nigerian Stock Exchange (NSE) not later than January, 2010.
The current study focused on listed manufacturing companies in Nigeria. Gbandi and
Amissah (2014) examine the impact of foreign capital on the performance of
manufacturing companies in Nigeria. Sample of 15 manufacturing companies listed
on the Nigeria Stock Exchange were used for this study which covers a period of five
years from 2005-2009. Gbandi and Amissah (2014) focused on foreign capital while
the current study included foreign trade, foreign direct investments and international
proprietary rights.
Buster (2012) examine effects of foreign source of debt on firm performance: a
survey of commercial banks listed on Nairobi securities exchange the study use a
longitudinal research design in collection of data. The current study was conducted in
Page 65
43
Nigeria that has different socio-economic and political settings. Owino (2015)
examine the effect of foreign capital on the financial performance of investment and
banking firms listed at the Nairobi Securities Exchange in Kenya this study therefore
sought to examine the extent to which foreign capital influences financial
performance, secondary data were collected from investment companies and banking
institutions listed on the Nairobi Securities Exchange (NSE). The current study was
conducted in Nigeria that has different socio-economic and political settings.
2.6 Research Gaps
Manufacturing firms play an increasingly significant role in Nigeria economy, and
are expected to grow fast given the growth prospects and the various
internationalisation policies of the federal government (Awolusi, 2013). The Nigeria
manufacturing companies began internationalisation when they realized world
market would offer them more opportunity and unlimited scope for growth; some
ambitious service firms, especially Banks and Insurance institutions, began their first
experiment abroad, which means Nigerian internationalisation, is still at its early
stage (Onafowora & Owoye, 2006).
Literature review revealed that studies have been conducted on financial
performance of listed manufacturing companies in Nigeria Adenikinju and Chete
(2002); (Ezeoha, 2007); Oyeniyi and Omotayo (2009); Awolusi, (2013). However,
literature on the effect of business internationalisation on financial performance of
listed manufacturing firms especially in the Nigerian context is very scarce. The
inadequate knowledge on effect of business internationalisation on financial
performance of listed manufacturing firms may be due to the early stage of
internationalisation of manufacturing companies in Nigeria (Ezeoha, 2012).
Similarly, studies (Graves & Thomas, 2006; Ibrahim, Soufani & Lam, 2003; Liang,
Wang & Cuit, 2012; Senik, 2010; Tsang, 2001; Zahra, 2003) have been conducted on
internationalisation in different countries such as the US, China, and Europe show
divergent results foreign direct investment have positive impact on companies,
Page 66
44
foreign funding improve financial performance of companies while delivery of
foreign raw materials have significant negative effect on the companies and product
export increase the financial return of companies. Hsu and Pereira (2008) conducted
a study on the effects of the degree of internationalisation on firm performance. The
results based on data from a cross-sectional set of U.S. multinational firms find
evidence of positive relationship between degree of internationalisation and firm
performance. The rate of return on assets declines, then increases, and finally
decreases slightly as the degree of internationalisation increases. Based on the above-
mentioned research and knowledge gaps, this study sought to determine the effects of
foreign trade, foreign direct investments, international proprietary rights and business
foreign funding on financial performance of listed manufacturing companies in
Nigeria.
Page 67
45
CHAPTER THREE
RESEARCH METHODOLOGY
3.1 Introduction
This chapter provides details about the methodology adopted to assist in achieving
the research objectives. It details research design, research population, data collection
instruments, data collection procedures and data processing and analysis. Henning
(2004) describes research methodology as coherent group of methods that
complement one another and that have the ability to fit to deliver data and findings
suit the researcher‘s purpose. According to Polit and Hungler (2004), research
methodology is a way of obtaining, organizing and analysing data and thus
methodology decisions often depend on the nature of the research question.
3.2 Research Philosophy
The research philosophy used for this study is based on positivism which holds that
reality is concretized and has an independent existence of its own (Ashley &
Orentein 2005) positivism is a philosophy that adheres to the view that only factual
knowledge gained through observation, including measurement is trustworthy. In
positivist studies, the role of the researcher is limited to data and interpretation
through objective approaches and research findings are usually observable and
quantifiable observations that lend themselves to statistical analysis (Ashley &
Orentein 2005). Moreover, in positivist studies the researcher is independent from
the study (that is maintains minimal interactions with the research participants when
carrying out the research) and there are no provisions for human interest within the
study. Crowther & Lancaster (2008) asserts that as a general rule, positivist studies
usually adopt a deductive approache and it also relates to the viewpoint that the
researcher needs to concentrate on facts.
Page 68
46
3.3 Research Design
Various scholars have defined research design and the definitions seem to move
towards the same direction. Beck (2003) defines research design as the overall plan
for obtaining answers to the questions being studied and for handling some of the
difficulties encountered during the research process.
Descriptive survey research studies are those studies which are concerned with
describing the characteristics of a particular individual, or of a group, whereas
diagnostic research studies determine the frequency with which something occurs or
its association with something else (Kothari, 2004). Descriptive research is
conducted to describe the present situation, what people currently believe, what
people are doing at the moment and so forth (Baumgartner, Strong & Hensley,
2002). According to Kothari (2004), descriptive research includes surveys and fact-
finding enquiries of different kinds. The major purpose of descriptive research is
description of the state of affairs as it exists at present (Kothari, 2004).
In contrast, a correlation survey research involves collecting data in order to
determine whether and to what degree a relationship exists between two or more
quantifiable variables. Survey research is the most common type of research design
which involves determining the views or practices of a group through interviews all
by administering a questionnaire. Jackson (2002), states that a survey typically uses a
data-collection method with a series of questions administered to a particular
population in order to gain information about that population. The degree of
relationship is expressed as a correlation coefficient (r).
The choice of correlational survey research design was because it was used to
explore relationships between variables and to predict a subject score on one variable
given his or her score on another variable. This method permits one to analyse
interrelationships among a large number of variables in a single study. It also allows
one to analyse how several variables either singly or in combination might affect a
particular phenomenon being studied. The method also provides information
Page 69
47
concerning the degree of relationships between the variables being studied (Jackson,
2002; Kothari, 2004; Mugenda & Mugenda, 1999). This study used descriptive and
correlational analysis where the relationship of the independent variables and
dependent variable were identified by regressing the independent variables with the
dependent variables.
3.4 Target Population
Burns and Grove (2003) describe population as all the elements that meet the criteria
for inclusion in a study. A population is defined as total collection of elements about
which we wish to make some inferences (Cooper & Schinder, 2011). Mcmillian and
Schumacher (2010) define population as a large collection of subjects from where a
sample can be drawn. In other words, population is the aggregate of all that conforms
to a given specification. The population of this study is all the listed 74
manufacturing companies in Nigeria. Kitchenham and Pfleeger (2002) assert that a
target population is the group of individuals to whom the survey applies. It is the
collection of individuals about whom conclusions and inferences are made (Enarson,
Kennedy & Miller, 2004). Mugenda and Mugnda (2004) term target population as
that population to which a researcher wants to generalize the results of the study. The
study‘s target population is 74 seventy-four listed manufacturing companies in
Nigeria.
3.5 Data and Data Collection
According to Gall et al. (2007) data collection could be refers to as the process of
gathering raw and unprocessed information that can be processed into meaningful
information. Burns and Grove (2003) also define data collection as the precise;
systematic gathering of information relevant to the research problems, adopting
various methods such as interviews, participant observations, focus group discussion,
narratives and case history. This study employed structured questionnaires to obtain
both quantitative and qualitative data for the research.
Page 70
48
The study used both primary and secondary data. The primary data was collected
from the direct responses from the top management of the listed manufacturing
companies which include The Chief Executive Officers, The Finance Director, The
Head Human Resource, The Corporate Affairs and The Director of Operations on
which the structured questionnaires was administered. Kothari (2014) describes
primary data as those which are collected afresh and for the first time by the
researcher, and thus original in character. In this study Closed- ended or structure
questionnaires were adopted to generate statistics in quantitative form for the
research. The study also used secondary data which was obtained from the annual
financial statements of the sampled companies. The questionnaires were sub- divided
into five sections; Section A captured bio-data information of the respondents and
the company characteristics; while sections B to F was based on research objectives.
The questionnaires were sent to the respondents accompanied by an introductory
letter from the university. The researcher made a follow up and the fully completed
questionnaires were picked from the respondents later. Secondary data on the other
hand was gathered from the audited financial statements accessed through the
Companies‘ websites, Nigerian Stock Exchange and NSE factbooks.
3.7 Pilot Study
Before actual collection of data, a pilot testing was conducted to obtain some
assessment of the questions‘ validity and the likely reliability of the data. It is during
the pre-test of the instrument that the researcher was able to assess the clarity of the
instrument and the ease of use of the instrument (Mugenda & Mugenda, 2003). Since
this is an interviewer-administered questionnaire, further inquiry on the length,
clarity and ambiguity of the questions were also sought. Pretesting was done to 5
non-listed manufacturing companies which were randomly sampled.
The information collected during the pilot study was used to undertake a preliminary
analysis to enable the research questions to be answered. In order to minimize the
possible instrumentation error and hence increase the reliability of the data collected,
Page 71
49
test of reliability was carried out to check on the internal consistency of data
measurement instruments by use of Cronbach‘s Coefficient Alpha. Cronbach‘s
Coefficient Alpha was computed using statistical packages for social sciences (SPSS
22.0). Alpha values range from 0 to 1.00. A rule of thumb of 0.7 or higher to guide
on what is an acceptable alpha before a research instrument was used.
3.8 Data processing and analysis
Data analysis is the process of data to make meaningful information (Saunders,
Lewis & Thornhill, 2009) defined data as mechanism for reducing and organizing
data to produce findings that require interpretation by researcher. According to
Hyndman (2008) data processing involves translating the answers on a questionnaire
into a form that can be manipulated to produce statistics. In this research endeavour
the data collected were analysed using both descriptive and inferential statistics. This
involves coding, editing, data entry, and categorizing through the use of statistical
package for social sciences (SPSS) version 20.0 computer software.
3.8.1. Model Specification
Multiple regression analysis was used to determine the effects of multiple predictor
variables (rather than a single predictor variable) on the dependent measured. The
multiple regression model Equation shows the linear regression model of the
independent variables against the dependent variable. The following model was used
in this study;
Yit = β0+ β 1X1t + β 2 X2t + β 3 X3t + β 4 X4t +Ɛit
Where:
Yit= Financial performance (ROA) at time t
X1t= Foreign Trade at time t
Page 72
50
X2t=Foreign Direct Investments at time t
X3t=International Proprietary Rights at time t
X4t= Business Foreign Funding at time t
β 0= Regression Output the Constant
β 1- β 4 = the coefficient of independent variables
e = Error Term
3.8.3 Tests of Hypotheses
T-test and F- Statistic at 5% level of significant was used to examine significance of
coefficients of variables in the model. Explanatory power of internationalisation on
financial performance for the total period of observation, adjusted coefficient of
determination (R2) was performed. Also Ordinary Least Square (OLS) simple,
multiple regression analyses and Pearson correlation test was performed on data set.
In addition, the study also employed Fixed and Random Effects Models for the
purpose of addressing heterogeneity of the sample data (Omokhudu & Ibadin, 2015).
Breusch-Pagan test was applied to the data set. If an F-test confirms that the
independent variables are jointly significant then the null hypothesis of
homoscedasticity can be rejected.
3.8.4 Operationalization and Measurement of Variables
Table 3.1 contains a list of the various study variables, their indicators and the
measurements to be used to estimate these variables. Constructs of each item of the
variable was measured by scale as summarized in Table 3.1.
Page 73
51
Table 3.1 Operationalization and Measurement of Study Variables
Category Variables Indicator Scale of
Measurement
Dependent
Variables
Financial
Performance
ROA Ratio & Ordinal
Independent
Variables
Foreign Trade Exports income to
total income ratio
Total imports to
expense ratio
Ratio & Ordinal
Foreign Direct
Investment Percentage of profits
from foreign
operations
Foreign assets to total
assets ratio
Ratio & Ordinal
International
Proprietary Rights Patents rights cost
ratio
Royalties income
ratio
Ratio & Ordinal
Business Foreign
Funding Foreign cost of Debt.
Foreign cost of
Equity
Ratio& Ordinal
Source: Author, (2016)
3.9 Diagnostic Tests
It was necessary during the study to ensure non-violation of the assumptions of the
classical linear regression model (CLRM) before attempting to estimate regression
equations when the assumptions of the classical linear regression model are violated
runs the risk of obtaining biased, inefficient, and inconsistent parameter estimates.
Consequently, the following diagnostic tests were conducted in order to ensure
proper specification of equations; Normality test, multicollinearity, autocorrelation
and heteroscedasticity (Fadhili, et al., 2011).
Page 74
52
3.9.1 Normality Test
In order to assess likelihood that the data set is normally distributed, Kolmogorov-
Smirnov (K-S) Test was performed. According to Ghasemi and Zahediasl (2012),
K-S test is the most commonly used normality test possibly because of disadvantages
of other tests and that it can easily be examined using SPSS.
3.9.2 Multicollinearity
Multicollinearity was tested in the study using correlation matrix whereby the cut-off
point for severe multicollinearity was 0.8 (Cooper & Schindler, 2008). Failure to
account for perfect multicollinearity may result into indeterminate regression
coefficients and infinite standard errors while existence of imperfect multicollinearity
results into large standard errors. Large standard errors affect the precision and
accuracy of rejection or failure to reject the null hypothesis. During estimation, the
problem is not lack of multicollinearity but rather its severity. A correlation
coefficient greater than 0.8, thus, indicate the presence of severe multicollinearity.
Variance Inflation Factors (VIF) was used in this study. The guiding rule is that a
VIF that exceed 4 will indicate need for further investigation, while A VIF of 1
implied absence of correlation among predictors but serious multicollinearity sign
was reveal when VIF exceeded 10 (Gujarati, 2004).
3.9.3 Autocorrelation
Autocorrelation is expected to be tested with the use of most widely used Durbin
Watson (DW) test which is considered appropriate for this study because of the
sample involve with regard to the population of the study (Anderson, Sweeney &
Williams, 2008). DW test result that is around 2 was considered as no autocorrelation
while its presence was confirmed if the test result‘s is significantly different from 2.
Page 75
53
3.9.4 Heteroskedasticity
Heteroscedasticity is an assumption of CLRM that needs to be tested for in the data
and properly accounted for if present. Specifically, the CLRM assumes that the error
term is homoskedastic, that is, it has constant variance. If the error variance is not
constant, then there is heteroskedasticity in the data. Running a regression model
without accounting for heteroskedasticity would lead to unbiased parameter
estimates but the invalid standard errors. In this thesis, Newey-West method which is
an extension of White‘s test for detecting heteroscedasticity and corrects standard
error for autocorrelation at the same time were employed because of its suitability for
large sample. This heteroscedasticity test has been employed in prior study such as
Alfaraih (2009).
Page 76
54
CHAPTER FOUR
RESULTS AND DISCUSSIONS
4.1 Introduction
This chapter dealt with the analysis and results of the data and discussion of the
findings. The findings were presented based on the four specific objectives of the
study. A structured questionnaire was used during the study to collect data. Section A
addressed the general/demographic information of the research, while subsequent
section addressed issues relating to independent variables. The study further
collected secondary data on study variables for a period on 10 years. This section
contains results on company characteristics, trend analysis, descriptive analysis,
diagnostic tests, correlation and finally regression analysis. Tables and charts were
used to present data.
4.2 Pilot Test Results
Before actual collection of data, a pilot testing was conducted to obtain some
assessment of the questions‘ validity and the likely reliability of the data. Pretesting
was done and questionnaires issued to seven respondents which were randomly
sampled. The questionnaires were then analysed to establish the reliability and
validity of the research instrument. According to Sekara, (2008) the closer a
Cronbach‗s Alpha is to 1 the higher the reliability and a value of at least 0.7 is
recommended. The Cronbach‘s alpha was used in this study to measure the internal
consistency of the variables. The study consists of four independent variables and
one dependent variable. The independent variables consist of Foreign Trade, Foreign
Direct Investment, International Proprietary Rights, and Business Foreign Funding.
The study computed the reliability for independent variables only since the
dependent variables was measured using the secondary data. The reliability of the
variables and the results are shown in table 4.1.
Page 77
55
Table 4.1 Reliability Tests Results
Variables Respondents
Cronbach‘s
Alpha
Number of
Items Comment
Foreign Trade 7 0.717 6 Accepted
Foreign Direct
Investment 7 0.701 6 Accepted
International Proprietary
Rights 7 0.857 5 Accepted
Business Foreign
Funding 7 0.741 6 Accepted
The results showed that foreign trade had a Cronbach‗s Alpha of 0.717, foreign
direct investment had a Cronbach‗s Alpha of 0.701, international proprietary rights
had Cronbach‗s Alpha of 0.857 and finally business foreign funding had Cronbach‗s
Alpha of 0.741. None of the variables had a Cronbach‗s Alpha of less than 0.7
therefore all the items in the questionnaire were maintained for the final data
collection.
4.3 Bio Data
4.3.1 Response Rate
A total number of 74 questionnaires were administered to the CEO of 74 listed
manufacturing companies in Nigeria however only 70 questionnaires were dully
filled and returned. This constituted 94.6% response rate. Response rate refers to the
extent to which the final data set includes all sample members and is calculated as
the number of people with whom interviews are completed divided by the total
Page 78
56
number of people in the entire sample, including those who refused to participate and
those who were unavailable (Fowler, 2013). According to Mugenda and Mugenda
(2003), a response rate of more than 50% is adequate for descriptive study and
analysis.
Table 4.2: Response Rate
Response Total Percent
Returned 70 94.6%
Unreturned 4 5.4%
Total 74 100%
4.3.2 Level of Education of the Respondents
The study sought to establish the level of education of the respondents. The findings
are provided in the figure 4.1.
Figure 4.1 Education Level of Respondents
The results indicated that 47% of the respondents had post graduate level of
education while those who had bachelor‘s degree were 40% and finally those with
polytechnic/college level of education were the least at 13%. The findings of this
Page 79
57
study imply that all the respondents were well educated which justifies why they
hold top management positions in their respectively companies. The level of general
education of the respondents is important because education facilitates the
acquisition of more current technical skills which allow them to have more
innovative ideas or be able to better adapt to new environments (Ouimet & Zarutskie,
2014).
4.3.3 Experience of the Respondents
The study further sought to find the number of years the respondents had worked in
the manufacturing sectors. The findings are presented in figure 4.2.
Figure 4.2 Experience of the Respondents
The research findings indicated that 50.0% of the respondents had an experience
ranging over five years, followed by 43.0 % with an experience ranging between 3-5
years and 7% with less than two years‘ experience. The findings indicated that more
of the respondents had higher experiences. This is as per other studies that verify the
importance of experience, as a major source of self-efficacy (Boyd & Vozikis, 1994).
Page 80
58
4.3.4 Company Age
For the purpose of this analysis, the companies were classified into two categories.
The first category is those who are more than ten years in operation and the second
category are the manufacturing companies whose age is below ten years. The results
as presented in figure 4.1 shows that 83% of the companies selected have been in the
business for more than 10 years while the remaining 17% have spent less than 10
years in the business. The result implies that a group of experienced companies were
selected for this study. Therefore, the results can be relied upon for decision making.
The reason for this classification is based on the assumption of George and Admercy
(2009) who posits that the needs to go international usually stems from age and
experience.
Figure 4.3 Age of the Company
4.3.5 Company Size based on Market Capitalization
The study further categorized companies as small or large using their market
capitalization. The findings showed that 70% of the companies could be categorized
as small since their market capitalization was below the average market
capitalization. Only 30% of the companies could be categorized as large.
Page 81
59
Figure 4.4 Size of the Company
As posited by Johanson and Mattsson (2015) company internationalisation
(regardless of adopted strategy of performing this process) requires series of stages
which includes obtaining capital, a competent manager, choosing appropriate product
offer, then analysing the target market (analysis of foreign markets), entering the
foreign market (canvassing, sales, marketing) and developing operations (logistics,
after-sales service, realization of payments, responsibility for sold products,
intercultural communication in a team of employees). Thus, size is a key factor in
internationalization of companies when those factors are put into consideration.
4.4 Trend Analysis
Trend analysis was conducted for the variables considered in this study. The essence
of trend analysis was to analyse the behaviour of the data across the study period.
Trend analysis provides a means to analyse company data over a period of time by
focusing on the change in specific line items in the data (Albert, 2015). The trend
analysis was done for the entire period of ten years ranging from 2006 to 2015.
Page 82
60
4.4.1 Foreign Trade
The study used exports income to total income ratio and total imports to expense
ratio as measure of foreign trade. The trends for this measures was conducted the
results are presented in figure 4.5.
Figure 4.5 Trend Analysis for Foreign Trade
The findings presented in Table 4.5 clearly revealed that total imports to expense
ratio for listed manufacturing companies was high compared to exports income to
total income ratio. The findings also showed almost constant trends in both exports
income to total income ratio and total imports to expense ratio implying the variation
was very small across the study period. The findings implied that most listed
manufacturing companies in Nigeria have maintained certain level of foreign trade.
This could be attributed high cost associated with foreign trade and high exchange
rates catapulted by declining Naira. De Silva (2014) contended that accelerated
business operations in recent years, globalization of trade, changes in the global
competition and rapid development of Asian economies, export trends have
drastically changed in recent years.
Page 83
61
4.4.2 Foreign Direct Investment
The trend analysis for measures of foreign direct investment adopted by the study for
the ten years under consideration was presented in figure 4.6.
Figure 4.6 Trend Analysis for Foreign Direct Investments
The study measured FDI using percentage of profits from foreign operations and
foreign assets to total assets ratio. The finding in figure 4.6 showed that there has
been a slight increase of the percentage of profits from foreign operations which
signals that listed manufacturing companies in Nigeria have embraced business
internationalization. On the other hand, the trend foreign assets to total assets ratio
have remained almost constants within the period of the study. The findings implied
that listed Manufacturing firms in Nigeria have not being increasing their foreign
assets which revealed a slow pace of internationalization in terms of foreign assets
acquisitions. According to Lall, (2000) developing countries, emerging economies
and countries in transition have come increasingly to see FDI as a source of
economic development and modernisation, income growth and employment.
Page 84
62
4.4.3 Business Foreign Funding
The trend analysis result for business foreign funding for a period of ten years using
the mean of all the companies for each year was presented in figure 4.7. The study
measured foreign funding using foreign debt and foreign equity.
Figure 4.7 Trend Analysis for Business Foreign Funding
The results presented in figure 4.7 show that listed manufacturing companies foreign
debt in millions USD was high compared to foreign equity. The finding implied that
listed manufacturing companies in Nigeria were borrowing heavily from
international partners while the same partners have not been investing in local
manufacturing firms. The trend analysis further revealed that both the foreign debt
and foreign equity have been increasing across the study period. The highest foreign
debt occurred in 2010 which coincided with the highest foreign equity. This could be
attributed to manufacturing sector growth that was experience during the same time
due good prices of oil. Samarina and Bezemer (2016) also revealed that foreign
source of financing operations is mostly, foreign equity shares, bank loans due their
repayment structure which are structured in line with the business cash flows the
Page 85
63
funds are mainly used for financing working capital and to source raw materials for
production.
4.4.4 International Proprietary Rights
The study further analysed the trend in international proprietary rights. International
proprietary right was measured using the R&D cost ratio which was computed by
dividing R&D cost and Total Costs.
Figure 4.8 Trend Analysis for International Proprietary Rights
The results presented in figure 4.8 showed that the trends in international proprietary
right measured by R&D cost ratio was in tandem with the financial performance of
the manufacturing companies in Nigeria. The finding implied that increased in R&D
cost resulted to a corresponding increase in financial performance measured by
ROA. Also in a similar study Katila and Ahuja (2002) posited that companies that
invest in R&D tend to strengthen their-market positions and provide opportunities to
enter new product-market domains thereby improving financial performance.
Muñoz-Bullón and Sanchez-Bueno (2011 results also found that a firm engaging in
Page 86
64
R&D activities earns 4% to 11% higher sales and generates 4% to 13% more profits
than firms that do not engage in R&D activities.
4.4.5 Return on Assets
The study further analysed the financial performance of the listed manufacturing
companies in Nigeria. Financial performance was measured using return on assets
and results shown in figure 4.9 showed the trend in ROA.
Figure 4.9 Trend Analysis for Return on Assets
The results presented in figure 4.9 showed that return on assets for listed
manufacturing companies has been very volatile. In 2006 average ROA was slightly
14% which drop to about 13.5% the following year. The volatility nature of return on
assets continued in 2008 and 2009 however 2009 to 2012 almost a constant increase
in ROA. In 2013 there was a drop, since then the average ROA for listed
manufacturing companies improved in 2014 and 2015 respectively. The findings
implied that average performance of listed manufacturing companies did not differ
significantly despite some companies having ROA as slow as 9%.
Page 87
65
The results further implied that the management of the listed manufacturing
companies in Nigeria have been efficient in the use of shareholders resources and
thereby providing reasonable returns on the assets. In order to reduce volatility in
financial performance listed companies have resorted to business internationalization
to stabilize performance. Odi (2013) posited that Nigeria economy is experiencing
stagnation due to low demand of goods within Nigeria and listed manufacturing
companies can only increase demand through foreign trade and export majorly
within the West African region.
4.5 Descriptive Analysis Results
This section provides descriptive results on how respondents responded to the
statement in the questionnaire. The study sought to establish whether the foreign
trade, foreign direct investments, proprietary rights and business foreign funding
affected financial performance of listed manufacturing firms in Nigeria.
Table 4.3 Summary Statistics for Study Variables
Descriptive Statistics N Mean
Std.
Deviation Minimum
Maximu
m
Exports Income total income
ratio 220 0.22532 0.046123 0.15 0.3
Total Imports to expense ratio 220 0.57827 0.073886 0.45 0.7
Percentage profit from
Foreign operation 220 0.22577 0.043519 0.15 0.3
Ratio of foreign assets to total
assets 220 0.09918 0.031073 0.05 0.15
Foreign Debt (USD millions) 220 0.95545 0.318268 0.5 1.5
Foreign Equity (USD
millions) 220 0.4677 0.27333 0.1 0.9
ROA 220 0.1405 0.0253 0.1 0.18
Page 88
66
The finding in table 4.3 showed that exports income to total income ratio had a mean
of 0.22532, a standard deviation of 0.046123. The minimum and maximum values
were 0.15 and 0.3 respectively. The findings implied that manufacturing companies
were earning high income from exports as shown as by the mean of 0.22532.
However, some companies earned significantly low income from export as shown by
the minimum exports income to total income ratio. The findings further showed that
Total Imports to expense ratio had a mean of 0.57827, a standard deviation of
0.073886. The minimum and maximum values were 0.45 and 0.7 respectively. The
finding implied that listed manufacturing companies in Nigeria spend high resources
in importations. This could be attributed to increase importation of raw materials by
most manufacturing companies. The findings further implied that listed
manufacturing companies in Nigeria have embraced foreign trade with the view of
increasing their financial performance. De Silva (2014) contended that accelerated
business operations in recent years, globalization of trade, changes in the global
competition and rapid development of Asian economies, export trends have
drastically changed in recent years.
The findings in Table 4.3 further showed that Percentage of profit from foreign
operations had a mean of 0.22577, a standard deviation of 0.043519. The minimum
and maximum values were 0.15 and 0.3 respectively. The finding implied that an
average of 22.5% of the profit for majority of the listed manufacturing companies in
Nigeria was accounted for by foreign operations. The maximum value of 30%
indicated that some listed manufacturing companies had a larger share of profit from
foreign operations. Similarly, the results showed that the mean of the Ratio of foreign
assets to total assets was 0.09918 while the maximum and minimum value were 0.15
and 0.05 as shown in Table 4.3. The finding of this study confirmed that listed
manufacturing companies in Nigeria have investment in foreign countries and have
taken advantage of the internationalisation to invest in assets in overseas country and
neighbouring African countries. The findings further implied that listed
manufacturing companies have also benefited from foreign direct investments by
multinationals companies that sought to investment locally. According to Lall,
Page 89
67
(2000) developing countries, emerging economies and countries in transition have
come increasingly to see FDI as a source of economic development and
modernisation, income growth and employment.
The descriptive statistic for foreign funding measured by the foreign debt and foreign
equity had a mean of 0.95545 and 0.4677 million USD respectively. The minimum
and the maximum value for foreign debt were 0.5 and 1.5 million USD respectively
while the minimum and the maximum value for foreign equity were 0.1 and 0.9
million USD with a standard deviation of 0.27333 showing high variation foreign
equity from the mean value. Samarina and Bezemer (2016) also revealed that foreign
source of financing operations is mostly, foreign equity shares, bank loans due their
repayment structure which are structured in line with the business cash flows the
funds are mainly used for financing working capital and to source raw materials for
production.
The finding finally showed that return on assets had a mean of 0.1405, a standard
deviation of 0.0253. The minimum and maximum values were 0.1 and 0.18
respectively. The findings implied that manufacturing companies in Nigeria had a
varying financial performance. Some companies had superior financial performance
as shown by the maximum ROA of 0.18 while other had poor financial performance
as shown by the ROA of 0.1. However, on average the sector was performing fairly
well as shown by the mean of 0.1405. High performance by some listed
manufacturing firms could possibly be attributed to high internationalisation degree
and the advantage of international markets. Odi (2013) posited that Nigeria economy
is experiencing stagnation due to low demand of goods within Nigeria and listed
manufacturing companies can only increase demand through foreign trade and export
majorly within the West African region.
Page 90
68
4.5.1 Foreign Trade
The first objective of the study was to establish the effect of foreign trade on
financial performance of listed manufacturing companies in Nigeria. The results
presented in Table 4.4 contain descriptive results on foreign trade.
Table 4.4 Foreign Trade Descriptive Results
Statements SD D N A SA
Mea
n
Std
Dev
We focus on exports trade
to improve our income
streams 7.1% 4.3% 24.3% 25.7%
38.6
% 3.84 1.20
Revenue from exports
account for a significant
share of the company total
income
12.9
% 4.3% 21.4% 30.0%
31.4
% 3.63 1.32
Our company has a
reliable international
markets through foreign
partners 7.1% 7.1% 25.7% 27.1%
32.9
% 3.71 1.21
Our company has adopted
modern technologies and
innovations through
interaction with our
international partners 5.7% 2.9% 30.0% 31.4%
30.0
% 3.77 1.09
The company has invested
a lot of resources in
marketing our products in
International markets 5.7% 8.6% 21.4% 37.1%
27.1
% 3.71 1.13
Participating in foreign
trade has led to increase in
the company performance 2.9% 7.1% 21.4% 41.4%
27.1
% 3.83 1.01
Page 91
69
The study sought to find out whether listed manufacturing companies in Nigeria We
focused on exports trade to improve their income streams. The results revealed that
38.6% and 25.7% of the respondents strongly agreed and agreed respectively. The
statement further had a mean of 3.84 and a standard deviation of 1.20 which further
confirmed that majority of the respondents agreed and the response varied slightly
from the mean.
Similarly, the study sought to find out whether revenue from exports accounted for a
significant share of the company total income. The results in table 4.4 showed that
31.4% and 30.0% of the respondents strongly agreed and agreed respectively. The
statement further had a mean of 3.63 and a standard deviation of 1.32. This findings
implied that majority of the respondents were in agreement with the statement which
further implied that listed manufacturing companies in Nigeria earned significantly
from exports.
The study further sought to find out whether listed manufacturing companies in
Nigeria had reliable international markets through foreign partners. The statement
had a mean response of 3.71 and standard deviation of 1.21. The results showed that
majority of the respondents agreed that listed manufacturing companies in Nigeria
had reliable international markets through foreign partners. The finding imply that
exportation of products by the local manufacturing firms was done by the reliable
international markets established the companies.
The study further intended to establish whether listed manufacturing companies had
adopted modern technologies and innovations through interaction with our
international partners. The statement was found to have a mean response of 3.77 and
a standard deviation of 1.09. This finding indicated that respondents agreed and
strongly agreed with the above statement. A standard deviation of 1.09 further
revealed slightly variation in the responses on the above statement. These findings
can therefore be assumed to imply that through business internationalization listed
Page 92
70
manufacturing firms have been able to modernize their operations through
interactions and partnership with foreign international companies.
The study also sought to determine whether listed manufacturing companies in
Nigeria had invested a lot of resources in marketing their products in International
markets. The statement was found to have a mean response of 3.71 and a standard
deviation of 1.13. The results indicated that majority of the respondents were in
agreement with the statement and further that the responses varied slightly among
various respondents. The findings implied that listed manufacturing companies had
market operation and resources designated to international markets with the aim of
increasing their customer portfolio to international markets.
The study further asked the respondents whether participating in foreign trade led to
increased company financial performance. The statement had a mean of 3.83 and a
standard deviation of 1.01 which indicated that majority of the respondents agreed
that foreign trade led to increase in financial performance of the companies. The
findings are consistent with those of Wang (2012) who finds a significant
relationship between foreign trade and financial performance. The results confirm
those of Francis and Magnus (2007) on the 47 listed firms on the US stock market
which revealed that firms with higher income from exportation performed better than
their other counterparts and reported higher returns on assets
4.5.2 Foreign Direct Investment
The second objective of this study was to determine whether foreign direct
investment influence financial performance of listed manufacturing companies in
Nigeria. The descriptive results on the effects of foreign direct investments are
presented in Table 4.5.
Page 93
71
Table 4.5 Foreign Direct Investment Descriptive Results
Statements SD D N A SA
Mea
n Std Dev
The company has
engaged in foreign
production to
improve revenue 5.7% 4.3% 22.9% 35.7% 31.4% 3.83 1.10
The percentage of
profit from foreign
operations has
significantly
improved 5.7% 10.0% 28.6% 35.7% 20.0% 3.54 1.10
The company is
open to merge with
foreign investors
who seek to invest
locally 2.9% 4.3% 37.1% 34.3% 21.4% 3.67 0.96
The company has
acquired profit
earning assets in
overseas countries 7.1% 4.3% 24.3% 32.9% 31.4% 3.77 1.16
The company has
subsidiaries in
foreign countries to
boost participation
in international
market 5.7% 4.3% 30.0% 30.0% 30.0% 3.74 1.11
The company‘s
foreign investments
have enhanced our
competitiveness
and strengthen
global position 7.1% 7.1% 38.6% 15.7% 31.4% 3.57 1.21
The study sought to establish whether listed manufacturing companies in Nigeria
engaged in foreign production to improve revenue. The results showed that 35.7%
and 31.4% of the respondents agreed and strongly agreed respectively. The findings
further showed that the statement had a mean of 3.83 and a standard deviation of
1.10. The study also intended to establish whether the percentage of profit from
foreign operations for listed manufacturing companies had significantly improved.
The results in Table 4.5 showed that 35.7% and 20.0% of the respondents agreed and
Page 94
72
strongly agreed respectively. The findings further showed that the statement had a
mean of 3.54 and a standard deviation of 1.10.
The study was further interested to find out if the listed manufacturing companies are
open to merge with foreign investors who sought to invest locally. The results
showed that 34.3% and 21.4% of the respondents agreed and strongly agreed
respectively. The findings further showed that the statement had a mean of 3.67 and
a standard deviation of 0.96. The findings implied that listed manufacturing
companies were prepared to embrace internationalisation to the extent of merging
with willing foreign international firms.
The study further sought to determine whether listed manufacturing companies in
Nigeria had acquired profit earning assets in overseas countries. The results showed
that 32.9% and 31.4% of the respondents agreed and strongly agreed with the
statement respectively. The findings further showed that the statement had a mean of
3.77 and a standard deviation of 1.16. The study further sought to determine whether
listed manufacturing companies in Nigeria had subsidiaries in foreign countries to
boost participation in international market. The statement had a mean response of
3.74 which indicated that majority of the respondents agreed with the statement.
Finally, this study sought to find out whether listed manufacturing companies in
Nigeria foreign investments have enhanced their global competitiveness and
strengthen global position. The statement was found to have a mean response of 3.57
and a standard deviation of 1.21 which indicated that majority of the
internationalisation by listed manufacturing companies in Nigeria enhanced their
global competitiveness and strengthened global position.
The main factors motivating FDI into Africa in recent decades appear to have been
the availability of natural resources in the host countries (investment in the oil
industries of Nigeria and Angola) and, to a lesser extent, the size of the domestic
economy (Anyanwu, 2011). The reasons for the lacklustre FDI in most other African
countries are most likely the same factors that have contributed to a generally low
Page 95
73
rate of private investment to GDP across the continent (Basu, & Srinivasan, 2002).
According to Lall, (2000) developing countries, emerging economies and countries
in transition have come increasingly to see FDI as a source of economic development
and modernisation, income growth and employment.
4.5.3 International Proprietary Rights
The third objective of this study was to determine the effect of International
Proprietary Rights on financial performance of listed manufacturing companies in
Nigeria. The descriptive findings of International Proprietary Rights are presented in
Table 4.6.
Page 96
74
Table 4.6 International Proprietary Rights Descriptive Results
Statements SD D N A SA
Mea
n Std Dev
We enhance our
income streams by
relying on international
trade marks 2.9% 7.1% 38.6% 20.0% 31.4% 3.70 1.08
We enhance our trade
through the use of
international patents
rights 1.4% 10.0% 40.0% 22.9% 25.7% 3.61 1.03
Royalties income from
proprietary rights make
an important portions
of our international
operations 7.1% 8.6% 25.7% 28.6% 30.0% 3.66 1.20
Foreign business
ownership has been
made easy through
internationalisation 8.6% 2.9% 31.4% 25.7% 31.4% 3.69 1.20
Countries worldwide
have adopted Foreign
investment rights that
make easy for foreign
companies to invest 5.7% 5.7% 31.4% 25.7% 31.4% 3.71 1.14
The study sought to establish listed manufacturing companies enhanced our income
streams by relying on international trade marks. The result in Table 4.7 showed that
38.6% of the respondents were neutral while 31.4% strongly agreed, 20.0% agreed.
Only 2.9% and 7.1% of the respondents strongly disagreed and disagreed
respectively. The statement had a mean response of 3.70 and standard deviation of
1.08. The study further sought to establish listed manufacturing companies enhanced
Page 97
75
our trade through the use of international patents rights. The result in Table 4.7
showed that 40.0% of the respondents were neutral while 25.7% strongly agreed,
22.9% agreed. Only 1.4% and 10.0% of the respondents strongly disagreed and
disagreed respectively. The statement had a mean response of 3.61 and standard
deviation of 1.03.
The study further intended to find out respondents opinion if royalties income from
proprietary rights make an important portions of our international operations. The
statement had a mean response of 3.66 and a standard deviation of 1.20. This results
indicated that majority of the respondents agreed and strongly agreed with the
statement. The standard deviation on the other hand indicated that the response did
not vary much from one respondent to another. On whether the foreign business
ownership had been made easy through internationalisation, majority of the
respondents agreed and strongly agreed as shown by the mean response of 3.69 and a
standard deviation of 1.20.
The finding presented in Table 4.6 further showed that majority of the respondents as
shown by the mean of 3.71 and standard deviation of 1.14 agreed that countries
worldwide have adopted foreign investment rights that make easy for foreign
companies to invest. The above findings implied that international proprietary rights
influenced the degree of internationalisation by the manufacturing companies since it
influences the business licencing and registration process. Therefore business
friendly international proprietary rights could massively influence the financial
performance of manufacturing companies by ensuring companies that
internationalise their operation do so in less bureaucratic manner.
International proprietary rights come in many forms, trade secrets, copyrights, and
patents being the most important in relation to technology transfer (Arora, 2009).
The literature on trade secrecy and copyrights is sparse, especially for trade secrecy,
and particularly as it relates to international technology transfer; much of the
empirical evidence at hand deals with patents (Graves, 2007).
Page 98
76
4.5.4 Business Foreign Funding
The fourth objective of this study was to determine the influence of business foreign
funding on the financial performance of listed manufacturing companies in Nigeria.
The descriptive results for the effect of business foreign funding are presented in
table 4.7.
Table 4.7 Business Foreign Funding Descriptive Results
Statements SD D N A SA Mean
Std
Dev
The company has
access to foreign
capital from foreign
partners and donors 11.4% 1.4% 35.7% 32.9% 18.6% 3.46 1.16
The has a high
proportion of foreign
debts 5.7% 4.3% 27.1% 21.4% 41.4% 3.89 1.17
A significant amount
of the company‘s
equity is provided by
the foreign and
international partners 7.1% 7.1% 21.4% 32.9% 31.4% 3.74 1.19
Foreign source of
financing has
positive effect on
financial
performance of
companies 7.1% 7.1% 28.6% 30.0% 27.1% 3.63 1.17
The company has
embraced foreign
lease financing as a
method of financing
its operations 4.3% 8.6% 27.1% 34.3% 25.7% 3.69 1.08
Foreign funding is
essential to the
survival and
performance of
performance of listed
manufacturing
companies in Nigeria 2.9% 7.1% 32.9% 21.4% 35.7% 3.80 1.10
Page 99
77
The study sought to establish whether listed manufacturing companies in Nigeria had
access to foreign capital from foreign partners and donors. The results showed that
35.7% of the respondents were neutral, 32.9% agreed while 18.6% strongly agreed.
The statement had a mean response of 3.46 and standard deviation of 1.16. Similarly,
the study sought to establish the listed manufacturing companies had a high
proportion of foreign debts. The results in Table 4.7 indicated that the statement had
a mean of 3.89 and a standard deviation of 1.17. The finding indicated that majority
of the respondents agreed with the statement and the responses varied slightly from
the mean as shown by the standard deviation of 1.17.
The study was further interested in establishing whether a significant amount of the
company‘s equity was provided by the foreign and international partners. The results
presented in the Table 4.7 showed that the statement above had a mean of 3.74 which
indicated that majority of the respondents were in agreement with the statement. The
standard deviation further showed that the response varied slightly from one
respondent to another. The results also revealed that majority of the respondents
agreed and strongly agreed that foreign source of financing had positive effect on
financial performance of listed manufacturing companies as Nigeria as shown by the
mean response of 3.63.
The study also intended to establish whether listed manufacturing companies in
Nigeria had embraced foreign lease financing as a method of financing its operations.
The findings presented in Table 4.7 indicated that 34.3% of the respondents agreed
while 25.7% strongly agreed. Those who disagreed were the least at 4.3%. The
results further showed the statements had a mean of 3.69 and a standard deviation of
1.08 which confirmed that majority of the respondents agreed and the response
varied slightly as shown by the standard deviation of 1.08.
Finally, the study sought to establish whether foreign funding was essential to the
survival and performance of listed manufacturing companies in Nigeria. The resulted
presented in Table 4.7 showed that 35.7% of the respondents strongly agreed, 32.9%
Page 100
78
were neutral while 21.4% agreed. Those who disagreed were 7.1% with only 2.9%
strongly disagreeing with the statement. The above statement was found a have a
mean of 3.80 and standard deviation of 1.10 which confirmed that majority of the
respondents agreed with the statement. The above findings implied that listed
manufacturing companies were using foreign funding to internationalize their
operations. Listed manufacturing companies borrowed from their international
partners to finance their operations.
Access to external foreign finance is a key determinant of a firm‘s ability to develop,
operate and expand internationally (Galí, López‐Salido & Vallés, 2007). No
international company can survive without enough funds for working capital, fixed
assets investment, employment of skilled employees, development of markets and
new products. Manova, Wei and Zhang (2015) examine the effects of foreign capital
on financial performance of publicly listed manufacturing companies in Egypt. The
results from this research suggested that in most of the manufacturing firms listed on
CSE, there is a direct positive relationship between foreign capital and the dependent
variable, Profitability and Liquidity.
4.6 Diagnostic Tests
When the assumptions of the linear regression model are correct, ordinary least
square (OLS) provides efficient and unbiased estimates of the parameters (Long and
Ervin, 2000). As Pedhazur (1997) noted, "Knowledge and understanding of the
situations when violations of assumptions lead to serious biases, and when they are
of little consequence, are essential to meaningful data analysis". To keep up with the
assumptions, this study conducted the following diagnostic tests: normality test,
homoscedasticity test and multicollinearity test on the variables. However, as
Osborne, Christensen, and Gunter (2001) observe, few articles report having tested
assumptions of the statistical tests they rely on for drawing their conclusions.
Page 101
79
4.6.1 Normality Tests
One of the assumptions of linear regression requires that the data should be normally
distributed. Therefore, to test the normality of the dependent variable return on
assets, a One-Sample Kolmogorov-Smirnov Test (KS) was conducted. The findings
are presented in Table 4.8.
Table 4.8 Normality Tests Results
One-Sample
Kolmogorov-Smirnov
Test
Foreig
n
Trade
Foreign
Direct
Investments
International
Proprietary
Rights
Business
Foreign
Funding
RO
A
N
70 70 70 70 70
Normal
Parametersa,
b Mean 3.75 3.6881 3.6743 3.7
0.14
042
9
Std.
Deviati
on
0.6683
3 0.59785 0.67517 0.62978
0.02
699
6
Most
Extreme
Differences
Absolu
te 0.208 0.214 0.188 0.212
0.11
8
Positiv
e 0.102 0.112 0.098 0.101
0.11
8
Negati
ve -0.208 -0.214 -0.188 -0.212
-
0.10
6
Kolmogorov-
Smirnov Z
0.736 0.793 0.574 0.777
0.98
9
Asymp. Sig.
(2-tailed) 0.315 0.323 0.514 0.344
0.28
2
a Test distribution is
Normal.
b Calculated from data.
Page 102
80
The Kolmogorov-Smirnov test (also known as the K-S test or one sample
Kolmogorov-Smirnov test) is a non-parametric statistics that determines whether a
sample of data comes from a specific distribution, i.e., normal, uniform, Poisson, or
exponential distribution. It is mostly used for evaluating the assumption of univariate
normality by taking the observed cumulative distribution of scores and comparing
them to the theoretical cumulative distribution for a normally distributed variable.
The null and alternative hypotheses are stated below.
Ho: The data was normally distributed
H1: The data was not normally distributed
The results obtained in Table 4.8 indicate that Kolmogorov-Smirnov Z p-value was
greater than 0.05 for the variables therefore the null hypothesis was not rejected and
concluded that the data was normally distributed. The results implied that the data
was fit for linear regression analysis.
4.6.2 Homoscedastic Test Results
One of the assumptions of linear regression analysis tested in this study was
homoscedasticity; this implies that the error terms along the regression line were
equal. According to Barley (2009), the violation of homoscedasticity which is
otherwise known as heteroscedasticity make it difficult to gauge the true standard
deviation of the forecast errors, usually resulting in confidence intervals that are too
wide or too narrow. Particularly, if there is increase in the variance of the error term
over time, confidence intervals for out-of-sample predictions will tend to be
unrealistically narrow. In that case, heteroscedasticity may also have the effect of
giving too much weight to a small subset of the data (namely the subset where the
error variance was largest) when estimating coefficients. Thus, to prevent such
scenario when conducting a research, it is expedient to test for homoscedasticity
before carrying out a regression analysis. Therefore, this study tested the null
Page 103
81
hypothesis that the data collected was homoscedastic in variance using Bruisch
pagan test.
Table 4.9 Bruisch Pagan Test for Homoscedasticity
Test Statistics Degree of Freedom P-Value
205.9717 5 1.000
The result of the test presented in Table 4.9 revealed that the test statistics was
205.9717 while the p-value was 1 indicating that the data collected was not
heteroscedasticity in variance and thus necessitating the acceptance of null
hypothesis that the data collected was homoscedastic in variance and can be relied on
for regression analysis.
4.6.3 Autocorrelation Test
Durbin Watson Statistic was conducted to test for autocorrelation in the secondary
data before accepting it for regression analysis. According to Kothari and Garg,
(2014), Autocorrelation occurs when the residuals are not independent from each
other. In other words, when the value of y(x+1) is not independent from the value of
y(x). Therefore, the null hypothesis that there was no autocorrelation in the data
collected for this study was tested with use of Durbin Watson Statistics. The results
as presented in Table 4.10 revealed that the Durbin Watson Statistics for lag 1 was
1.795524 with a p-value of 0.245 while the Durbin Watson Statistics for lag 2 and 3
were 1.983643 and 1.883001 with a p-value of 0.386 and 0.130 respectively. Since
the p-value was greater than 0.05, the null hypothesis which stated that there was no
autocorrelation in the data was not rejected. This implies that the residuals were
independent from each other. Similarly, the result satisfied the rule of thumb which
states that values of 1.5 < d < 2.5 show that there is no auto-correlation in the data
(Barley, 2009). It can therefore be said that the return on assets for year 2006 was not
Page 104
82
a function of return on assets for the year 2005. Return on assets for the year 2007
was also not a function of return on assets for 2006 and soon.
Table 4.10 Durbin Watson Statistics for Autocorrelation
Lag D.W Statistics P-Value
1 1.795524 0.245
2 1.986343 0.386
3 1.883001 0.130
4.6.4 Test for Multicollinearity
Multicollinearity is an unacceptable high level of inter correlation among the
independent variables, such that effects of independent variables cannot be separated
(Garson, 2012). In multiple regression, the variance inflation factor (VIF) is used as
an indicator of multicollinearity. Variance inflation factor (VIF) is a factor by which
the variance of the given partial regression coefficient increases due to given
variable‘s extent of correlation with other predictors in the model (Dennis, 2011). As
a rule of thumb, lower levels of variance inflation factor (VIF) are desirable as higher
levels of VIF are known to affect adversely the results associated with multiple
regression analysis. A simple diagnostic of co linearity is the variance inflation factor
for each regression coefficient. This study adopted a VIF value of 10.0 as the
threshold based on the rule of thumb. The results of the analysis are shown in Table
4.11
Page 105
83
Table 4.11 Test for Multicollinearity
Variables Tolerance VIF
Foreign Trade 0.404 2.473
Foreign Direct Investments 0.528 1.894
International Proprietary Rights 0.513 1.951
Business Foreign Funding 0.382 2.618
Foreign Trade had a VIF of 2.473, Foreign Direct Investments 1.894, International
Proprietary Rights 1.951, and Business Foreign Funding had a VIF of 2.618. These
results indicated that the VIF values of the independent variables were within the
threshold of 10.0. This indicated that that there was no threat of multicollinearity
problem and therefore, the study used linear regression model.
4.6.5 Hausman Test
Hausman specification test was used by the study to select the best regression model
between a random effect and a fixed effect regression model. The null hypothesis for
Hausman test states that the difference between the coefficients is not consistent
meaning that a random effect model is the best while the alternative hypothesis states
that the differences are consistent implying that a fixed effect model is the best.
Table 4.12 Hausman Test for Model Specification Results
Hausman Test Results
chi2(6) = (b-B)'[(Vb-V_B)^(-1)](b-B) = 4.19
Prob>chi2 = 0.6514
Page 106
84
Results in the table above indicates a prob>chi2
value of 0.6514 which is greater than
critical P value at 5% level of significance which implies that the null hypothesis that
a random effect model is the best was not rejected. The study hence used a random
effect regression model.
4.7 Correlation Analysis Results
According to Kothari (2014), the correlation coefficient can range from -1 to +1,
with -1 indicating a perfect negative correlation, +1 indicating a perfect positive
correlation, and 0 indicating no correlation at all. A linearity test was conducted as
evidenced by the Pearson correlation coefficient. Kothari (2014) further stated that
the importance of correlation is to determine the extent to which changes in the value
of an attribute is associated with changes in another attribute.
4.7.1 Foreign Trade and Financial performance
The study intended to establish the relationship between Foreign Trade and Financial
performance of listed manufacturing companies in Nigeria. The results are presented
in Table 4.13.
Table 4.13 Correlation Results for Foreign Trade and Financial performance
Foreign Trade ROA
Foreign Trade
Pearson Correlation 1 .663**
Sig. (2-tailed) .000
N 70 70
ROA
Pearson Correlation .663**
1
Sig. (2-tailed) .000
N 70 70
**. Correlation is significant at the 0.01 level (2-tailed).
Page 107
85
The correlation test results revealed a positive and significant association (r=0.663,
p=0.000) between foreign trade and Financial performance of listed manufacturing
companies in Nigeria. The findings implied that when foreign trade is positive and
higher then financial performance of listed manufacturing companies in Nigeria will
also be positive and high showing significant association. The findings are consistent
with those of Wang (2012) who finds a significant relationship between foreign trade
and financial performance. The result concurs with that of Caleb (2008) reported a
positive relationship between foreign trade and Tobin‘s Q in a sample of 8,165 firms
with observations from 1992 to 2001 in the US.
4.7.2 Foreign Direct Investments and Financial performance
The second objective of this study was to establish the relationship between Foreign
Direct Investments and Financial performance of listed manufacturing companies in
Nigeria. The results are presented in Table 4.14.
Table 4.14 Correlation Results for FDI and Financial performance
Foreign Direct
Investments
ROA
Foreign Direct Investments
Pearson Correlation 1 .626**
Sig. (2-tailed) .000
N 70 70
ROA
Pearson Correlation .626**
1
Sig. (2-tailed) .000
N 70 70
**. Correlation is significant at the 0.01 level (2-tailed).
The correlation test results also revealed a positive and significant association
(r=0.626, p=0.000) between Foreign Direct Investments and Financial performance
Page 108
86
of listed manufacturing companies in Nigeria. The findings implied that when
Foreign Direct Investments is positive and higher then financial performance of
listed manufacturing companies in Nigeria will also be positive and high showing
significant association.
The result concurs with that of Mawugnon and Qiang (2009) that investigates the
effect of foreign direct investment on economic growth through internationalization
in Togo using time series data, the research found that there was a unidirectional
relationship between FDI and GDP. The direction of causation ran from FDI through
internationalization to GDP enables to conclude that FDI positively influence GDP
through internationalization and not otherwise
4.7.3 International Proprietary Rights and Financial performance
The third objective of the study was to determine the effect of International
Proprietary Rights and financial performance of listed manufacturing companies in
Nigeria. The study further employed correlation tests to ascertain the association
between international proprietary rights and financial performance of listed
manufacturing companies in Nigeria. The findings are presented in Table 4.15.
Table 4.15 International Proprietary Rights and Financial performance
International
Proprietary
Rights
ROA
International Proprietary
Rights
Pearson Correlation 1 .571**
Sig. (2-tailed) .000
N 70 70
ROA
Pearson Correlation .571**
1
Sig. (2-tailed) .000
N 70 70
**. Correlation is significant at the 0.01 level (2-tailed).
The correlation test results also revealed a positive and significant association
(r=0.626, p=0.000) between International Proprietary Rights and Financial
Page 109
87
performance of listed manufacturing companies in Nigeria. The findings implied that
when International Proprietary Rights is positive and higher then financial
performance of listed manufacturing companies in Nigeria will also be positive and
high showing significant association. The result contradicts Adeoye and Elegunde
(2012), who examines the impact of international proprietary rights on organizational
financial performance in the food and beverage industry in Nigeria. Renko (2011)
also reported that international proprietary rights are a major determinant of return on
assets especially for manufacturing industry.
4.7.4 Business Foreign Funding and Financial performance
The final objective of the study was to determine the effect of business foreign
funding on financial performance of listed manufacturing companies in Nigeria. The
study also used correlation analysis to ascertain the association between business
foreign funding and financial performance of listed manufacturing companies in
Nigeria. The findings are presented in Table 4.16.
Table 4.16 Business Foreign Funding and Financial performance
Business Foreign
Funding
ROA
Business Foreign Funding
Pearson Correlation 1 .587**
Sig. (2-tailed) .000
N 70 70
ROA
Pearson Correlation .587**
1
Sig. (2-tailed) .000
N 70 70
**. Correlation is significant at the 0.01 level (2-tailed).
The results in Table 4.16 showed that business foreign funding had a Pearson
correlation value of 0.587 and significance value of 0.000. The finding implied that
business foreign funding had a significant association with financial performance of
Page 110
88
listed manufacturing companies in Nigeria. The results implied that when foreign
funding for listed manufacturing companies goes up, their financial performance is
likely to increase. The result agreed with most of the previous literatures such as
Benigno, Converse and Fornaro (2015) who reported that foreign source of financial
leverage had a significant negative relationship with performance as measured by
return on assets (ROA) and return on equity (ROE). Caballero (2014) study
investigated the relationship between foreign cost of capital and performance of
listed companies in Italy. The findings revealed that there was an inverse relationship
between foreign source of capital and financial performance of listed firms.
4.8 Regression Analysis Results
To investigate the nature and strength of the relationship between audit committees
of non-commercial state corporations and quality of financial reporting, the study
adopted the use of ordinary least squares regression analysis. Kothari (2014) defines
regression as the determination of a statistical relationship between two or more
variables. In simple regression, there are two variables, one variable (defined as
independent) is the cause of the behaviour of another one (defined as dependent
variable).
When there are two or more than two independent variables, the analysis concerning
relationship is known as multivariate regression and the equation describing such
relationship is known as the multiple regression equation. Kothari (2014) described
Analysis of Variables (ANOVA) as a procedure for testing the difference among
different groups of data for homogeneity. The essence of ANOVA is that the total
amount of variation in a set of data is broken down into two types, that amount which
can be attributed to chance and that amount which can be attributed to specified
causes. F-test was also used in the context of ANOVA for judging the significance of
multiple correlation coefficients.
Page 111
89
4.8.1 Foreign Trade and Financial Performance
The first objective of the study was to determine the relationship between foreign
trade and financial performance of listed manufacturing companies in Nigeria. The
study used univariate regression test to ascertain the influence of foreign trade on
financial performance, the results are presented in Table 17 -19
Table 4.17 Model Summary for Foreign Trade and Financial Performance
Model R R Square Adjusted R Square Std. Error of the
Estimate
1 .663a .440 .432 .0203492
a. Predictors: (Constant), Foreign Trade
The regression analysis for foreign trade and financial performance of listed
manufacturing companies in Nigeria revealed that foreign trade explained 44.0% of
the variation in the financial performance of listed manufacturing companies as
measured by ROA (R2=0.440) while the remaining percentage of 66.0% was
explained by other variables not in this model.
Table 4.18 ANOVA Results for Foreign Trade and Financial Performance
Model Sum of
Squares
Df Mean Square F Sig.
1
Regression .022 1 .022 53.440 .000b
Residual .028 68 .000
Total .050 69
a. Dependent Variable: ROA
b. Predictors: (Constant), Foreign Trade
Page 112
90
Furthermore, F-test was carried out to test the null hypothesis that there is no
significant relationship between foreign trade and financial performance measured by
return on assets. The analysis of variance test in Table 4.18 shows that the
significance of the F-statistic =53.440 and p=0.000 is less than the significance level
of 0.05 adopted in this study meaning that null hypothesis was rejected and
concluded that there was a significant relationship between foreign trade and
company‘s return on assets. It can also be concluded that the model
ROA=0.04+0.027 (Foreign Trade) +ε was significantly fit.
Table 4.19 Regression Coefficients for Foreign Trade and Financial
Performance
B Std. Error Beta t Sig.
(Constant) 0.04 0.014
2.861 0.006
Foreign Trade 0.027 0.004 0.663 7.31 0.000
a Dependent Variable: ROA
To test the significance of regression relationship between the foreign trade and
return on assets, the regression coefficient (β) and the intercept (α), in the model
were subjected to the t-test to test the null hypothesis that the beta is zero. The null
hypothesis state that, β (beta) = 0, meaning there is no significant relationship
between the foreign trade and financial performance as the slope β (beta) = 0 (no
relationship between the two variables). The results on the beta coefficient of the
resulting model in Table 4.19 revealed that the constant α = 0.04 which is
significantly different from 0, while the p- value = 0.000 which is less than 0.05.
The coefficient β = 0.027 was also significantly different from 0 with a p-
value=0.000 which is also less than 0.05 indicating that financial performance of
listed manufacturing companies in Nigeria was significantly influenced by the
foreign trade. This implies that the null hypothesis β1=0 was rejected and the
Page 113
91
alternative hypothesis β1≠0 is taken to hold implying that the model
ROA=0.04+0.027 (Foreign Trade) +ε is significantly fit. The model holds as
suggested by the above test. This confirmed that there is a significant positive linear
relationship between the foreign trade and company‘s return on assets. The study
therefore rejected the null hypothesis which implied that foreign trade had a
significant effect on financial performance of listed manufacturing companies in
Nigeria.
The results confirm those of Francis and Magnus (2007) on the 47 listed firms on the
US stock market which revealed that firms with higher income from exportation
performed better than their other counterparts and reported higher returns on assets.
The study focused on 47 US firms that major in gas and computer industries using
data from 1982 to 2002. This implies that the higher the income from the exportation
of local products from the manufacturing companies in Nigeria the better the return
on assets. The result however contradicts that of Kraśnicka and Głód (2013) who
conducted a study on the impact of the internationalization of Polish SMEs on their
performance. The study also reviewed the differences between classical models of
internationalization and the so-called born global models. The finding reveals a
negative relationship between exports income of small and medium enterprises and
their financial performance
4.8.2 Foreign Direct Investments and Financial performance
The second objective of the study was to determine the relationship between foreign
direct investments and financial performance of listed manufacturing companies in
Nigeria. The study used univariate regression test to ascertain the influence of
foreign direct investments on financial performance, the results are presented in
Table 20 -22
Page 114
92
Table 4.20 Model Summary for FDI and Financial Performance
Model R R Square Adjusted R Square Std. Error of the
Estimate
1 .626a .392 .384 .0211957
a. Predictors: (Constant), Foreign Direct Investments
The regression analysis for foreign direct investments and financial performance of
listed manufacturing companies in Nigeria revealed that foreign direct investments
explained 39.2% of the variation in the financial performance of listed manufacturing
companies as measured by ROA (R2=0.392) while the remaining percentage of
60.8% was explained by other variables not in this model.
Table 4.21 ANOVA Results for FDI and Financial Performance
Model Sum of
Squares
df Mean Square F Sig.
1
Regression .020 1 .020 43.933 .000b
Residual .031 68 .000
Total .050 69
a. Dependent Variable: ROA
b. Predictors: (Constant), Foreign Direct Investments
F-test was carried out to test the null hypothesis that there is no significant
relationship between foreign direct investments and financial performance measured
by return on assets. The analysis of variance test in Table 4.21 shows that the
significance of the F-statistic =43.933 and p=0.000 is less than the significance level
of 0.05 adopted in this study meaning that null hypothesis was rejected and
concluded that there was a significant relationship between foreign direct
investments and company‘s return on assets. It can also be concluded that the model
ROA=0.04+0.027 (Foreign Direct Investments) +ε was significantly fit.
Page 115
93
Table 4.22 Regression Coefficients for FDI and Financial Performance
B Std. Error Beta t Sig.
(Constant) 0.036 0.016
2.264 0.027
Foreign Direct Investments 0.028 0.004 0.626 6.628 0.000
a Dependent Variable: ROA
To test the significance of regression relationship between the foreign trade and
return on assets, the regression coefficient (β) and the intercept (α), in the model
were subjected to the t-test to test the null hypothesis that the beta is zero. The null
hypothesis state that, β (beta) = 0, meaning there is no significant relationship
between the foreign direct investments and financial performance as the slope β
(beta) = 0 (no relationship between the two variables). The results on the beta
coefficient of the resulting model in table 4.22 revealed that the constant α = 0.036
which is significantly different from 0, while the p- value = 0.027 which is less than
0.05.
The coefficient β = 0.028 was also significantly different from 0 with a p-
value=0.000 which is also less than 0.05 indicating that financial performance of
listed manufacturing companies in Nigeria was significantly influenced by the
foreign direct investments. This implies that the null hypothesis β1=0 was rejected
and the alternative hypothesis β1≠0 is taken to hold implying that the model
ROA=0.036+0.028 (Foreign Direct Investments) +ε is significantly fit. The model
holds as suggested by the above test. This confirmed that there is a significant
positive linear relationship between the foreign direct investments and company‘s
return on assets. The null hypothesis that foreign direct investment has no significant
effect on financial performance of listed manufacturing companies in Nigeria was
therefore rejected.
The result affirms those of Mawugnon and Qiang (2009) that investigates the effect
of foreign direct investment on economic growth through internationalisation in
Page 116
94
Togo using time series data, the research found that there was a unidirectional
relationship between FDI and GDP. The direction of causation ran from FDI through
internationalisation to GDP enables to conclude that FDI positively influence GDP
through internationalisation and not otherwise. The study therefore recommends
improvement in the investment climate for foreign direct investment to enhance
competitiveness and strengthen through internationalisation. It also contradicts that
of Büthe and Milner (2008) who examine the influence of Foreign Direct Investment
on Per Capita GDP in Nigeria using Vector Error Correction. The result shows a
negative relationship between FDI and economic growth in Nigeria. Similarly,
Kolstad and Wiig (2012) investigate the impact of foreign direct investment (FDI) on
Economic Growth in Nigeria within the period of 1986-2011. The study employed
multiple regression models to determine the impact of some external variables on the
gross domestic product (GDP) proxy for economic growth in Nigeria. The study used
time series data to ascertain the inflow of FDI to the Nigerian economy and its
implications on economic growth. The finding revealed a positively impact on the
economy though its contribution to GDP was very low within the period under
review
4.8.3 International Proprietary Rights and Financial performance
The third objective of the study was to determine the effect of international
proprietary rights on the financial performance of listed manufacturing firms in
Nigeria. This section contain the results of the univariate regression analysis that was
used to ascertain the relationship between international proprietary rights on the
financial performance measured by ROA of listed manufacturing firms in Nigeria.
Page 117
95
Table 4.23 Model Summary for International Proprietary Rights and ROA
Model R R Square Adjusted R Square Std. Error of the
Estimate
1 .571a .326 .316 .0223303
a. Predictors: (Constant), International Proprietary Rights
The regression analysis for International Proprietary Rights and financial
performance of listed manufacturing companies in Nigeria revealed that International
Proprietary Rights explained 32.6% of the variation in the financial performance of
listed manufacturing companies as measured by ROA (R2=0.326) while the
remaining percentage of 67.4% was explained by other variables not in this model.
Table 4.24 ANOVA Results for International Proprietary Rights and ROA
Model Sum of
Squares
df Mean Square F Sig.
1
Regression .016 1 .016 32.848 .000b
Residual .034 68 .000
Total .050 69
a. Dependent Variable: ROA
b. Predictors: (Constant), International Proprietary Rights
F-test was carried out to test the null hypothesis that there is no significant
relationship between international proprietary rights and financial performance
measured by return on assets. The analysis of variance test in Table 4.24 shows that
the significance of the F-statistic =32.848 and p=0.000 is less than the significance
level of 0.05 adopted in this study meaning that null hypothesis was rejected and
concluded that there was a significant relationship between International Proprietary
Page 118
96
Rights and company‘s return on assets. It can also be concluded that the model
ROA=0.057+0.023 (International Proprietary Rights) +ε was significantly fit.
Table 4.25 Regression Coefficients for International Proprietary Rights and
ROA
B Std. Error Beta t Sig.
(Constant) 0.057 0.015
3.805 0.000
International Proprietary Rights 0.023 0.004 0.571 5.731 0.000
a Dependent Variable: ROA
The null hypothesis state that, β (beta) = 0, meaning there is no significant
relationship between the international proprietary rights and financial performance as
the slope β (beta) = 0 (no relationship between the two variables). The results on the
beta coefficient of the resulting model in Table 4.25 revealed that the constant α =
0.057 which is significantly different from 0, while the p- value = 0.000 which is less
than 0.05.
The coefficient β = 0.023 was also significantly different from 0 with a p-
value=0.000 which was also less than 0.05 indicating that financial performance of
listed manufacturing companies in Nigeria was significantly influenced by the
international proprietary rights. This implies that the null hypothesis β1=0 was
rejected and the alternative hypothesis β1≠0 is taken to hold implying that the model
ROA=0.057+0.023 (international proprietary rights) +ε is significantly fit. The
model holds as suggested by the above test. This confirmed that there is a significant
positive linear relationship between the international proprietary rights and
company‘s return on assets. The null hypothesis that international proprietary rights
have no significant effect on financial performance of listed manufacturing
companies in Nigeria was rejected.
The result contradicts Adeoye and Elegunde (2012), who examines the impact of
international proprietary rights on organizational financial performance in the food
Page 119
97
and beverage industry in Nigeria. Renko (2011) also reported that international
proprietary rights are a major determinant of return on assets especially for
manufacturing industry.
4.8.4 Business Foreign Funding and Financial performance
The final objective of this study was to determine the effect of business foreign
funding on financial performance of listed manufacturing companies in Nigeria. This
section contains the results of the univariate regression analysis that was used to
ascertain the relationship between business foreign funding and financial
performance measured by ROA of listed manufacturing firms in Nigeria.
Table 4.26 Model Summary for Business Foreign Funding and ROA
Model R R Square Adjusted R Square Std. Error of the
Estimate
1 .587a .345 .335 .0220095
a. Predictors: (Constant), Business Foreign Funding
The regression analysis for Business Foreign Funding and financial performance of
listed manufacturing companies in Nigeria revealed that Business Foreign Funding
explained 34.5% of the variation in the financial performance of listed manufacturing
companies as measured by ROA (R2=0.345) while the remaining percentage of
65.5% can be explained by other variables such as foreign trade, foreign direct
investment and international proprietary rights.
Page 120
98
Table 4.27 ANOVA Results for Business Foreign Funding and ROA
Model Sum of
Squares
df Mean Square F Sig.
1
Regression .017 1 .017 35.809 .000b
Residual .033 68 .000
Total .050 69
a. Dependent Variable: ROA
b. Predictors: (Constant), Business Foreign Funding
F-test was carried out to test the null hypothesis that there is no significant
relationship between Business Foreign Funding and financial performance measured
by return on assets. The analysis of variance test in Table 4.27 shows that the
significance of the F-statistic =35.809 and p=0.000 is less than the significance level
of 0.05 adopted in this study meaning that null hypothesis was rejected and
concluded that there was a significant relationship between Business Foreign
Funding and company‘s return on assets. It can also be concluded that the model
ROA=0.047 +0.025 (Business Foreign Funding) +ε was significantly fit.
Table 4.28 Regression Coefficients for Business Foreign Funding and ROA
B Std. Error Beta t Sig.
(Constant) 0.047 0.016
2.9375 0.004
Business Foreign Funding 0.025 0.004 0.587 6.25 0.000
a Dependent Variable: ROA
To test the significance of regression relationship between the business foreign
funding and financial performance measured by return on assets of the listed
manufacturing companies in Nigeria, the regression coefficient (β) and the intercept
(α), in the model were subjected to the t-test to test the null hypothesis that the beta is
zero. The null hypothesis state that, β (beta) = 0, meaning there is no significant
Page 121
99
relationship between the foreign funding and financial performance as the slope β
(beta) = 0 (no relationship between the two variables). The results on the beta
coefficient of the resulting model in Table 4.28 revealed that the constant α = 0.047
which is significantly different from 0, while the p- value = 0.004 which is less than
0.05. The coefficient β = 0.025 is also significantly different from 0 with a p-
value=0.000 which is also less than 0.05 indicating that financial performance of
listed manufacturing companies in Nigeria was significantly influenced by the
business foreign funding.
This implies that the null hypothesis β1=0 was rejected and the alternative hypothesis
β1≠0 is taken to hold implying that the model ROA=0.047 +0.025 (Business Foreign
Funding) +ε was statistically fit. The model Return on assets = α + β (Foreign
Funding) holds as suggested by the above test. This confirms that there is a
significant positive linear relationship between the foreign funding and company‘s
return on assets. This confirmed that there is a significant positive linear relationship
between the foreign funding and company‘s return on assets hence the null
hypothesis was rejected.
The result supports most of the previous literatures. Benigno, Converse and Fornaro
(2015) reported that foreign source of financial leverage had a significant negative
relationship with performance as measured by return on assets (ROA) and return on
equity (ROE); Caballero (2014) in a study that investigate the relationship between
manufacturing companies and performance of listed companies in Italy, the findings
revealed that there was an inverse relationship between foreign source of capital and
financial performance of listed firms. Gopinath, Kalemli-Ozcan, Karabarbounis and
Villegas-Sanchez (2015) also found that foreign sources of debt and equity were
major determinants of financial performance of firms listed at the NSE and there was
evidence of a significant effect of foreign source of capital on all measures of
performance.
Page 122
100
4.8.5 Multivariate Regression Analysis
4.8.5.1 Multivariate Regression Using Primary Data
A multivariate regression model was conducted to test the joint relationship of all the
independent variables and the dependent variable. The findings for the multivariate
regression Model are presented in Table 4.29 - 4.32.
Table 4.29 Model Summary for Multivariate Regression Analysis
Model R R Square Adjusted R Square Std. Error of the
Estimate
1 .730a .533 .504 .0190076
a. Predictors: (Constant), Business Foreign Funding, Foreign Direct Investments,
International Proprietary Rights, Foreign Trade
The results showed that foreign trade, foreign direct investment, international
proprietary rights and business foreign funding had a significant association with
financial performance measured by ROA of listed manufacturing companies in
Nigeria (R=0.730). The results further revealed that foreign trade, foreign direct
investment, international proprietary rights and business foreign funding jointly
accounted for 53.3% of the variation in financial performance measured by ROA of
listed manufacturing companies in Nigeria. The remaining percentage is explained
by factors that were not included in this model.
Page 123
101
Table 4.30 ANOVA Results for Multivariate Regression Analysis
Model Sum of
Squares
df Mean Square F Sig.
1
Regression .027 4 .007 18.547 .000b
Residual .023 65 .000
Total .050 69
a. Dependent Variable: ROA
b. Predictors: (Constant), Business Foreign Funding, Foreign Direct Investments,
International Proprietary Rights, Foreign Trade
The result of analysis of variance (ANOVA) test on Table 4.30 revealed that the
significance of the F-statistic = 18.547 and p= 0.000 which was less than 0.05
meaning that null hypothesis is rejected and can be concluded that there is a
significant relationship between all the independent variables (foreign trade, foreign
direct investment, international proprietary rights, foreign funding) jointly and
financial performance (return on assets) of listed manufacturing companies in
Nigeria. The study therefore concluded that all the independent variables were
significant predictor of financial performance of listed manufacturing companies in
Nigeria.
Table 4.31 Regression Coefficients for Multivariate Regression Analysis
B Std. Error Beta t Sig.
(Constant) 8.335 0.712 0.269 11.706 0.000
Foreign Trade 0.914 0.108 0.461 8.463 0.000
Foreign Direct Investments 0.503 0.115 0.216 4.374 0.000
International Proprietary Rights 0.062 0.109 0.797 0.569 0.074
Business Foreign Funding 0.179 0.037 0.185 4.838 0.000
a Dependent Variable: ROA
Page 124
102
Optimal Model
ROA = 8.335 + 0.914 (Foreign Trade) + 0.503 (Foreign Direct Investments) + 0.062
(International Proprietary Rights) + 0.179 (Business Foreign Funding) +ε
From the results of the beta coefficients, foreign trade was positively correlated with
return on assets. The coefficient was 0.914 while the t-statistics and p-value were
8.411 and 0.000 respectively. This implies that an increase in foreign trade by one
unit leads to an increase in the return on assets of listed manufacturing companies in
Nigeria by about 0.914 units. The findings agreed with that of Raheman, Afza,
Qayyum and Bodla (2010) who found that trade openness and export of sales have
significant influence of performance of listed manufacturing companies in Pakistan.
Similarly, the beta coefficient on foreign direct investment was positive and
significant at 5% level of significance. The coefficient was 0.503 while the t-
statistics and p-value were 4.368 and 0.000 respectively. Thus, increase in return on
assets is associated with an increase in the inflow of foreign direct investment into
the listed manufacturing companies in Nigeria and that a unit change in foreign direct
investment will results in about 0.503 increase in return on assets. This results is in
line with McGrew and Poku, (2007) who investigates the effects of
internationalization on firm performance using a sample of I64 Japanese SMEs,
finding show that higher levels of foreign direct investment are positively related to
performance
International proprietary rights had a positive and insignificant relationship with
return on assets. The result contradicts Adeoye and Elegunde (2012), who examines
the impact of international proprietary rights on organizational financial performance
in the food and beverage industry in Nigeria. Renko (2011) also reported that
international proprietary rights are a major determinant of return on assets especially
for manufacturing industry.
Page 125
103
Finally, a significant positive relationship was found between return on assets and
business foreign funding of listed companies in Nigeria as beta coefficient was 0.179
and t-statistic was 4.641 indicating that an increase in foreign business funding
would result to an increase in financial performance as measured by return on assets
of the listed manufacturing companies in Nigeria. These finding supports the finding
of Harash, Al-Timim and Alsaadi (2014) who found that access to foreign capital is
essential to the survival and performance of international firms, as well as that of
Galí, López‐Salido and Vallés, (2007) who found that access to external foreign
finance is a key determinant of a firm‘s ability to develop, operate and expand
internationally.
4.8.5.2 Multivariate Regression Using Secondary Data
The study conducted multivariate regression analysis using the secondary data. The
results of the model summary revealed that foreign trade, foreign direct investments,
international proprietary rights and foreign funding explained 31.5% of the variation
in financial performance of listed manufacturing firms in Nigeria.
Table 4.32 Model Summary for Multivariate Regression Analysis
Model R R Square Adjusted R Square Std. Error of the
Estimate
1 0.561 0.315 0.302 0.02113
a. Predictors: (Constant), FF, FDI, FT, FPR
The result of analysis of variance (ANOVA) test for secondary data on Table 4.33
revealed that the significance of the F-statistic = 24.701 and p= 0.000 which was less
than 0.05 meaning that null hypothesis was rejected and can be concluded that there
is a significant relationship between all the independent variables (foreign trade,
foreign direct investment, international proprietary rights, foreign funding) jointly
and financial performance (return on assets) of listed manufacturing companies in
Nigeria.
Page 126
104
Table 4.33 ANOVA Results for Multivariate Regression Analysis
Model
Sum of
Squares
df Mean Square F Sig.
1
Regression 0.044 4 0.011 24.701 0.000
Residual 0.096 215 0.000
Total 0.140 219
a. Dependent Variable: ROA
b. Predictors: (Constant), FF, FDI, FT, FPR
The results in Table 4.34 contain the results for regression coefficients obtained from
the multivariate regression analysis using secondary data.
Table 4.34 Regression Coefficients for Multivariate Regression Analysis
B Std. Error Beta t Sig.
(Constant) 0.05 0.012
4.167 0.000
FT 0.089 0.033 0.166 2.697 0.009
FDI 0.044 0.021 0.129 2.095 0.039
FPR 0.11 0.036 0.208 3.056 0.002
FF 0.022 0.006 0.258 3.667 0.000
a Dependent Variable: ROA
Optimal Model
ROA = 0.05 + 0.089 (FT) + 0.044 (FDI) + 0.11 (FPR) + 0.022 (FF) +ε
Analysis of secondary data revealed that foreign trade (FT) had a beta coefficient of
0.089 with a significance value of 0.009. The results confirmed the findings of
primary data that there was positive and significance relationship between foreign
trade and return on assets for listed manufacturing companies in Nigeria. The
findings agreed with that of Raheman, Afza, Qayyum and Bodla (2010) who found
Page 127
105
that trade openness and export of sales have significant influence of performance of
listed manufacturing companies in Pakistan.
The finding also revealed that foreign direct investment (FDI) had a beta coefficient
of 0.044 with a significance value of 0.039 which was less than 0.05 meaning FDI
had positive and significance relationship with ROA for listed manufacturing
companies in Nigeria. These findings also concurred with the findings of primary
data the revealed that there was a significant relationship between FDI and financial
performance of listed manufacturing firms in Nigeria. Similarly, the results showed
that international proprietary rights had a significance and positive relationship with
financial performance. These finding differed from those obtained using primary data
that showed that international proprietary rights had a positive but insignificant
relationship with ROA for listed manufacturing companies in Nigeria. Finally
analysis of secondary data showed that foreign funding had a positive and significant
relationship with financial performance of listed manufacturing companies in
Nigeria.
These finding supports the finding of Harash, Al-Timim and Alsaadi (2014) who
found that access to foreign capital is essential to the survival and performance of
international firms, as well as that of Galí, López‐Salido and Vallés, (2007) who
found that access to external foreign finance is a key determinant of a firm‘s ability
to develop, operate and expand internationally.
Page 128
106
CHAPTER FIVE
SUMMARY, CONCLUSIONS AND RECOMMENDATIONS
5.1 Introduction
The general objective of this study was to determine the effects of internalization on
the financial performance of listed manufacturing companies in Nigeria. This chapter
presents the summary of major findings based on the research objectives. The
chapter further presents conclusions and recommendations as well as suggestions for
further research were also highlighted.
5.2 Summary of Findings
The main purpose of the study is to determine the effect of internationalization on the
performance of listed manufacturing companies in Nigeria. The theoretical and
empirical literature on the effect of internationalization and financial performance of
listed manufacturing companies in Nigeria were reviewed. Detailed conceptual
framework of the effect of internationalization and financial performance was
formulated. The hypothesized effect was tested by the specific objectives of the
study. The study administered a single questionnaire to the CEOs of all the 74 listed
manufacturing companies in Nigeria. Secondary data on financial performance of the
listed manufacturing companies was gathered for period of between 2006 and 2015.
The population of this study is all the listed 74 manufacturing companies in Nigeria.
Descriptive and inferential statistics are used to analyse and interpret the data use in
this research. Multiple regression analysis was used to determine the effects of
multiple predictor variables on the dependent measured.
5.2.1 Effect of Foreign Trade on Financial Performance
The first objective of the study was to determine the effect of foreign trade on
financial performance of listed manufacturing companies in Nigeria. Foreign trade
was measured using exports income to total income ratio and total imports to
Page 129
107
expense ratio. The trend analysis revealed that total imports to expense ratio for
listed manufacturing companies was high compared to exports income to total
income ratio. The findings also showed almost constant trends in both exports
income to total income ratio and total imports to expense ratio implying the variation
was very small across the study period. The results of descriptive analysis revealed
that majority of the respondents agreed and strong agreed with the statement on their
companies‘ involvement in foreign trade. The finding implied that most of the listed
manufacturing companies in either exported their products to foreign market or
imported materials for production from the foreign markets. The finding further
implied that majority of the listed manufacturing companies in Nigeria were
engaging in foreign trade through exportation and importation.
The correlation test results revealed a positive and significant association between
foreign trade and financial performance of listed manufacturing companies in
Nigeria. The findings implied that when foreign trade increase then financial
performance of listed manufacturing companies in Nigeria will likely increase since
they had a positive and significant association as shown by the correlation results.
The findings of regression analysis further confirmed that there existed a positive and
significant relationship between foreign trade and financial performance measured by
ROA of the listed manufacturing companies in Nigeria. The coefficient of foreign
trade was found to be significantly at 5% significance level indicating foreign trade
significantly influenced financial performance measured by ROA of listed
manufacturing companies in Nigeria. The study rejected the null hypothesis that
foreign trade does not have a significant relationship with financial performance of
listed manufacturing companies in Nigeria.
5.2.2 Effect of Foreign Direct Investment on Financial Performance
The second objective of the study was to determine the effect of foreign direct
investment on financial performance of listed manufacturing companies in Nigeria.
Page 130
108
The study measured FDI using percentage of profits from foreign operations and
foreign assets to total assets ratio
The finding showed that there were a percentage of profits from foreign operations
which signaled that listed manufacturing companies in Nigeria have embraced
business internationalization. The finding of the descriptive analysis also showed that
majority of the respondents agreed and strongly agreed with most of the statements
regarding the effects of foreign direct investments on financial performance of listed
manufacturing companies in Nigeria.
The study further used correlation and regression analysis to ascertain the
relationship between foreign direct investments and financial performance of listed
manufacturing companies in Nigeria. The correlation test results also revealed a
positive and significant association between Foreign Direct Investments and
Financial performance of listed manufacturing companies in Nigeria. These findings
were further confirmed by the regression result that established that the coefficient of
foreign direct investment was significant indicating that foreign direct investments
significantly influenced financial performance measured by ROA of listed
manufacturing companies in Nigeria. The findings implied that an increase Foreign
Direct Investments would results to an increase in financial performance of listed
manufacturing companies in Nigeria.
5.2.3 Effect of International proprietary Rights on Financial Performance
The third objective of the study was to determine the effect of international
proprietary rights on financial performance of listed manufacturing companies in
Nigeria. The finding of the descriptive analysis also showed that majority of the
respondents agreed and strongly agreed with most of the statements regarding the
effects of international proprietary rights on financial performance as measured by
ROA of listed manufacturing companies in Nigeria. The study further used
correlation and regression analysis to ascertain the relationship between foreign
Page 131
109
direct investments and financial performance of listed manufacturing companies in
Nigeria.
The correlation test results also revealed a positive and significant association
between international proprietary rights and financial performance of listed
manufacturing companies in Nigeria. These findings were further confirmed by the
regression result that established that the coefficient of International proprietary
Rights was insignificant indicating that international proprietary rights insignificantly
influenced financial performance measured by ROA of listed manufacturing
companies in Nigeria however, using secondary data international proprietary rights
was found to have a positive and significant relationship with financial performance
of listed manufacturing companies in Nigeria. The findings implied that increase
international proprietary rights would results to an increase in financial performance
of listed manufacturing companies in Nigeria
5.2.4 Effect of Business Foreign Funding on Financial Performance
The final objective of the study was to determine the effect of business foreign
funding on financial performance of listed manufacturing companies in Nigeria. The
study sought to test the null hypothesis that business foreign funding has no
significant effect on financial performance of listed manufacturing companies in
Nigeria. Business foreign funding was measured suing foreign debt and foreign
equity. The results revealed that listed manufacturing companies foreign debt in
millions USD was significantly high compared to foreign equity. The trend analysis
further revealed that both the foreign debt and foreign equity have been increasing
across the study period which could mean that Nigeria listed manufacturing
companies have internationalize their operations. The results further showed that
majority of the respondents agreed ad strongly agreed with most of the statements on
the effects of business foreign funding on financial performance of listed
manufacturing companies in Nigeria.
Page 132
110
The study further used correlation and regression analysis to ascertain the
relationship between business foreign funding and financial performance of listed
manufacturing companies in Nigeria. The correlation test results also revealed a
positive and significant association between business foreign funding and financial
performance of listed manufacturing companies in Nigeria. These findings were
further confirmed by the regression result that established that the coefficient of
International proprietary Rights was significant indicating that foreign direct
investments significantly influenced financial performance measured by ROA of
listed manufacturing companies in Nigeria. The findings implied that an increase
business foreign funding would results to an increase in financial performance of
listed manufacturing companies in Nigeria.
5.3 Conclusion
This study aimed to determine the effects of business internationalisation on financial
performance of listed manufacturing companies in Nigeria. Specifically, the study
sought to determine the effects of foreign trade, foreign direct investment,
international proprietary rights and business foreign funding on financial
performance measured by return on assets. Based on the finding of the study, the
study concludes that foreign trade is important in manufacturing sector. Listed
manufacturing companies that engage strategically in foreign trade through
exportation and exploration of foreign markets have a high probability being
successful in terms of financial performance compared to companies that refrain
from engaging in foreign trade. Through internationalisation local companies have
been exposed to overseas and international markets therefore companies should take
advantage and market their products globally.
This study also established that foreign direct investment has a positive and
significant relationship with performance of listed manufacturing companies in
Nigeria. Based on these findings, the study concluded that companies that invest
outside their origin countries enjoy increase profits margins and high returns on
Page 133
111
assets through their foreign operations. Foreign investments provide and additional
advantage to companies that have internationalize over that companies that are yet to
take advantage of internationalisation. The study further concluded that foreign direct
investments enable domestic companies to have improved financial performance.
The study also established that international proprietary rights had a positive but
insignificant relationship with financial performance of listed manufacturing
companies in Nigeria. The study therefore concluded that international proprietary
rights do not influence in any way the financial performance of the companies that
have internationalized their operations. International proprietary rights play a
significant role in simplifying the business registration and licensing processes but do
not impact on financial performance of the companies.
The study finally established that business foreign funding positively and
significantly influenced the financial performance of listed manufacturing companies
in Nigeria. Business foreign funding is unexploited sources of capital that the listed
manufacturing companies can adopt in order improve their financial performance.
Manufacturing industry is capital intensive and any reliable and cheap mode of
financing would definitely influence the performance in the positive way. The study
concluded that listed manufacturing companies that are struggling to finance their
operations must seek international partners to partner with.
5.4 Recommendations
The management and the board of directors of the listed manufacturing companies
should intensify efforts on how the locally produced products will be able to
penetrate into the foreign countries as it was discovered that majority of the goods
produced by the manufacturing companies in Nigeria are consumed locally. Any
company seeking to be an industry leader in the twenty-first century must not focus
on domestic market leadership only, but must also focus on global market leadership.
Page 134
112
The findings also revealed that the company with the highest percentage of foreign
direct investment had about twenty two percent of its assets contributed by the
foreign direct investors which is very low when it is compare with what is obtainable
in other emerging economy. Therefore, efforts should be made by the management
of the listed manufacturing companies to make the sector attractive in order to attract
more foreign direct investment into the listed manufacturing companies in Nigeria.
This insignificant relationship is attributable to the low investment in research effort
by the listed manufacturing companies in Nigeria. Lastly, the negative relationship
between foreign funding and return on assets is worrisome and posing a serious
danger to the long term survival of the listed manufacturing companies in Nigeria.
Therefore, the use of equity capital instead of debt capital should be embraced as a
good alternative for the listed manufacturing companies in Nigeria.
5.5 Areas for Further Research
The study examined the effects of internationalization on firm financial performance,
measured by return on equity. It may be useful to re-examine matter using other
market based performance variables such as EVA and Tobin‘s Q and compare the
relationship. The use of economic value added will enable the measurement of
financial performance using both quantitative and qualitative data from the company.
Another avenue for further research is to test additional internationalization variables
not considered in this study that may influence firm performance. Examples of such
additional variables are; the technological change, cross border barrier, foreign
pricing system and so on.
Page 135
113
REFERENCES
Adenikinju, A. F. & Chete, L. N. (2002). Productivity, market structure and trade
liberalization in Nigeria (Vol. 126). Nairobi: African Economic Research
Consortium. 19(2), 53
Agndal, H. & Chetty, S. (2007). The impact of relationships on changes in
internationalisation strategies of SMEs. European Journal of Marketing,
41(11/12), 1449-1474.
Ahmed Sheikh, N. & Wang, Z. (2011). Determinants of capital structure: An
empirical study of firms in manufacturing industry of Pakistan. Managerial
Finance, 37(2), 117-133.
Ahmed, E. M. (2012). Are the FDI inflow spillover effects on Malaysia's economic
growth input driven? Economic Modelling, 29(4), 1498-1504.
Alfaraih, M. (2009). Compliance with international financial reporting standards
(IFRS) and the value relevance of accounting information in emerging stock
markets: evidence from Kuwait (Doctoral dissertation, Queensland
University of Technology).
Alkaabi, S. K. & Dixon, C. (2014). Factors affecting internationalization decision
making in family businesses: An integrated literature review. Journal of
Applied Management and Entrepreneurship, 19(2), 53.
Altaf, N. & Shah, F. A. (2015). Internationalization and firm performance of Indian
firms: Does product diversity matter? Pacific Science Review B: Humanities
and Social Sciences, 1(2), 76-84.
Andersen, O. (1993). On the internationalization process of firms: A critical analysis.
Journal of international business studies, 24(2), 209-231.
Page 136
114
Anderson, D. R., Sweeney, D. J., & Williams, T. A. (2008). Statistics for Business
and Economics 1 and 2: 49211 and 49212. Thomson South-Western.
Andersson, S. Gabrielsson, J. & Wictor, I. (2006). Born Globals' foreign market
channel strategies. International Journal of Globalisation and Small
Business, 1(4), 356-373.
Anfofum, A. A. Gambo, J. S. & Suleiman, T. (2013). Estimating the impact of
foreign direct investment in Nigeria. International Journal of Humanities and
Social Science, 3(17), 138-145.
Anyanwu, J. C. (2011). Determinants of foreign direct investment inflows to Africa,
1980-2007. African Development Bank Group.
Arora, A. (2009). Intellectual property rights and the international transfer of
technology: Setting out an agenda for empirical research in developing
countries. The Economics of Intellectual Property, 41.
Arteaga‐Ortiz, J., & Fernández‐Ortiz, R. (2010). Why don't we use the same export
barrier measurement scale? An empirical analysis in small and medium‐sized
enterprises. Journal of Small Business Management, 48(3), 395-420.
Ashley, D., & Orenstein, D. M. (2005). Sociological theory: Classical statements.
Allyn & Bacon.
Awolusi, O. D. (2013). The effects of total quality management on customer service
management in the Nigerian banking industry: an empirical analysis.
International Journal of Management and Network Economics, 3(1), 57-77.
Aykut, D., & Goldstein, A. (2007). Developing country multinationals: South-South
investment comes of age. Industrial Development for the 21st Century:
Sustainable Development Perspectives, New York, 85-116.
Page 137
115
Barney, J. (1991). Firm resources and sustained competitive advantage. Journal of
management, 17(1), 99-120.
Barney, J. B. (1986). Strategic factor markets: Expectations, luck, and business
strategy. Management science, 32(10), 1231-1241.
Basu, M. A., & Srinivasan, M. K. (2002). Foreign direct investment in Africa: Some
case studies (No. 2-61). International Monetary Fund.
Baumgartner, T. A., Strong, C. H., & Hensley, L. D. (2002). Conducting and reading
research in health and human performance with Power Web: Health and
human performance.
Beck, K. (2003). Test-driven development: by example. Addison-Wesley
Professional.
Bejesky, R. (2003). Investing in the dragon: Managing the patent versus trade secret
protection decision for the multinational corporation in China. Tulsa J. Comp.
& Int'l L., 11, 437.
Benigno, G., Converse, N., & Fornaro, L. (2015). Large capital inflows, sectoral
allocation, and economic performance. Journal of International Money and
Finance, 55, 60-87.
Benito, G. R., & Gripsrud, G. (1992). The expansion of foreign direct investments:
discrete rational location choices or a cultural learning process? Journal of
International Business Studies, 23(3), 461-476.
Berry‐Stölzle, T. R., & Altuntas, M. (2010). A Resource‐Based Perspective on
Business Strategies of Newly Founded Subsidiaries: The Case of German
Pensionsfonds. Risk Management and Insurance Review, 13(2), 173-193.
Page 138
116
Bobillo, A. M. López-Iturriaga, F. & Tejerina-Gaite, F. (2012). The effects of
international diversification on firm performance: An empirical study across
twelve European countries. International Journal of Management, 29(4), 531.
Boyd, N. G., & Vozikis, G. S. (1994). The influence of self-efficacy on the
development of entrepreneurial intentions and actions. Entrepreneurship
theory and practice, 18, 63-63.
Brada, J. C., Kutan, A. M., & Yigit, T. M. (2006). The effects of transition and
political instability on foreign direct investment inflows. Economics of
Transition, 14(4), 649-680.
Brouthers, K. D., & Hennart, J. F. (2007). Boundaries of the firm: Insights from
international entry mode research. Journal of management, 33(3), 395-425.
Buckley, P. J., & Casson, M. C. (1998). Analyzing foreign market entry strategies:
Extending the internalization approach. Journal of international business
studies, 29(3), 539-561.
Buckley, P. J., Clegg, L. J., Cross, A. R., Liu, X., Voss, H., & Zheng, P. (2007). The
determinants of Chinese outward foreign direct investment. Journal of
international business studies, 38(4), 499-518.
Burns, N., & Grove, S. K. (2010). Understanding nursing research: Building an
evidence-based practice. Elsevier Health Sciences.
Buster, B. D. (2012). Relationship between asset allocation and financial
performance of mutual funds in Kenya (Doctoral dissertation, University of
Nairobi, Kenya).
Büthe, T., & Milner, H. V. (2008). The politics of foreign direct investment into
developing countries: increasing FDI through international trade
agreements?. American Journal of Political Science, 52(4), 741-762.
Page 139
117
Calof, J. L., & Beamish, P. W. (1995). Adapting to foreign markets: Explaining
internationalization. International business review, 4(2), 115-131.
Campbell, K., & Mínguez-Vera, A. (2008). Gender diversity in the boardroom and
firm financial performance. Journal of business ethics, 83(3), 435-451.
Cavusgil, S. T., & Knight, G. (2009). Born global firms: A new international
enterprise. Business expert press.
Chatterjee, S. (2013). China‘s Offshore Yuan Market: Inside the Engine Room of the
World‘s Next Trade Currency. In Investing in Asian Offshore Currency
Markets (pp. 86-97). Palgrave Macmillan UK.
Cheng, L. K., & Kwan, Y. K. (2000). What are the determinants of the location of
foreign direct investment? The Chinese experience. Journal of international
economics, 51(2), 379-400.
Chi, C. G., & Gursoy, D. (2009). Employee satisfaction, customer satisfaction, and
financial performance: An empirical examination. International Journal of
Hospitality Management, 28(2), 245-253.
Child, J., & Rodrigues, S. B. (2005). The internationalization of Chinese firms: a
case for theoretical extension? Management and organization review, 1(3),
381-410.
Cooper, J., & Schindler, M. (2008). Perfect Sample Size in Research.
Crick, D., & Jones, M. V. (2000). Small high-technology firms and international
high-technology markets. Journal of international marketing, 8(2), 63-85.
Crowther, D., & Lancaster, G. (2008). Research Methods: a Consice Introduction to
Research in Management and Business Consultancy.
Page 140
118
Damoah, O. B. O. (2011). The export behaviour of small and medium-sized
manufacturing firms: Evidence from the garment and textile industry of
Ghana (Doctoral dissertation, University of Wales).
Dawson, J. A. (2007). Scoping and conceptualising retailer internationalisation.
Journal of economic geography.
De Silva, L. S. (2014). Export Trends and Free Trade in Australia: An analysis. The
Otemon Journal of Australian Studies, 40.
Denisia, V. (2010). Foreign direct investment theories: An overview of the main FDI
theories.
Doukas, J. A., & Lang, L. H. (2003). Foreign direct investment, diversification and
firm performance. Journal of International Business Studies, 34(2), 153-172.
Dunning, J. H., & McQueen, M. (1982). Multinational corporations in the
international hotel industry. Annals of Tourism Research, 9(1), 69-90.
Ehinomen, C., & Daniel, O. O. (2012). Export and Economic Growth Nexus in
Nigeria. Management Science and Engineering, 6(4), 132.
Ellis, P. D. (2007). Paths to foreign markets: does distance to market affect firm
internationalisation? International Business Review, 16(5), 573-593.
Enarson, D. A., Kennedy, S. M., & Miller, D. L. (2004). Choosing a research study
design and selecting a population to study [Research Methods]. The
International Journal of Tuberculosis and Lung Disease, 8(9), 1151-1156.
Ezeoha, A. (2007). Structural effects of banking industry consolidation in Nigeria: A
review. Journal of banking regulation, 8(2), 159-176.
Page 141
119
Ezeoha, A., Ebele, O., & Ndi Okereke, O. (2009). Stock market development and
private investment growth in Nigeria. Journal of Sustainable Development in
Africa, 11(2), 20-35.
Fernández, Z., & Nieto, M. J. (2006). Impact of ownership on the international
involvement of SMEs. Journal of International Business Studies, 37(3), 340-
351.
Fink, M., & Kraus, S. (2007). Mutual trust as a key to internationalization of SMEs.
Management Research News, 30(9), 674-688.
Foss, N. J. (1998). The resource-based perspective: an assessment and diagnosis of
problems. Scandinavian Journal of management, 14(3), 133-149.
Fung, H. G., Yau, J., & Zhang, G. (2011). Reported trade figure discrepancy,
regulatory arbitrage, and round-tripping: Evidence from the China–Hong
Kong trade data. Journal of International Business Studies, 42(1), 152-176.
Galí, J., López‐Salido, J. D., & Vallés, J. (2007). Understanding the effects of
government spending on consumption. Journal of the European Economic
Association, 5(1), 227-270.
Ganotakis, P., & Love, J. H. (2012). Export propensity, export intensity and firm
performance: The role of the entrepreneurial founding team. Journal of
International Business Studies, 43(8), 693-718.
Gaur, A. S., Kumar, V., & Singh, D. (2014). Institutions, resources, and
internationalization of emerging economy firms. Journal of World Business,
49(1), 12-20.
Gbandi, E. C., & Amissah, G. (2014). Financing options for small and medium
enterprises (SMEs) in Nigeria. European Scientific Journal, 10(1).
Page 142
120
Ghanatabadi, F. (2013). Impact of entrepreneurs on the process of
internationalization of small and medium-sized enterprises in Iran. The
Process of Internationalization in Emerging SMEs and Emerging Economies,
111.
Ghasemi, A., & Zahediasl, S. (2012). Normality tests for statistical analysis: a guide
for non-statisticians. International journal of endocrinology and metabolism,
10(2), 486-489.
Gibcus, P., & Kemp, R. G. M. (2003). Strategy and small firm performance. EIM
Business & Policy Research. 10(2), 486-489.
Gilpin, R. (2016). The political economy of international relations. Princeton
University Press.
Gimeno, J. (1999). Reciprocal threats in multimarket rivalry: Staking out'spheres of
influence'in the US airline industry. Strategic Management Journal, 101-128.
Gopinath, G., Kalemli-Ozcan, S., Karabarbounis, L., & Villegas-Sanchez, C. (2015).
Capital allocation and productivity in South Europe (No. w21453). National
Bureau of Economic Research.
Graves, C. T. (2007). Trade Secrets as Property: Theory and Consequences. J. Intell.
Prop., 15, 39.
Graves, C., & Thomas, J. (2004). Internationalisation of the family business: a
longitudinal perspective. International Journal of Globalisation and Small
Business, 1(1), 7-27.
Greenaway, D., Upward, R., & Wakelin, K. (Eds.). (2002). Trade, investment,
migration and labour market adjustment. Springer.
Page 143
121
Grove, J. W., & Burns, N. H. (2003). Experimental assessment of factors affecting
transfer length. Structural Journal, 100(6), 740-748.
Gujarati, D. (2004). Basic Econometrics. United States Military Academy, West
Point.
Hajjar, R. A., Kindler, D., Tan, P., Kent, D., & Malyak, P. H. (2010). U.S. Patent No.
7,733,310. Washington, DC: U.S. Patent and Trademark Office.
Hall, B. H., & Helmers, C. (2010). The role of patent protection in (clean/green)
technology transfer (No. w16323). National Bureau of Economic Research.
Hatum, A., & Michelini, J. (2010). Going global: the process of internationalisation
of Latino multinational firms. International Journal of Business and
Emerging Markets, 3(1), 36-56.
Head, K., & Ries, J. (2008). FDI as an Outcome of the Market for Corporate Control:
Theory and Evidence. Journal of International Economics, 74(1), 2-20.
Hennart, J. F. (1982). A theory of multinational enterprise. Univ of Michigan Pr.
Henning, E. Van Rensburg, W. & Smit, B. (2004). Finding your way in qualitative
research (pp. 19-22). Pretoria: Van Schaik.
Heyder, M., Makus, C., & Theuvsen, L. (2011). Internationalization and firm
performance in agribusiness: empirical evidence from European cooperatives.
International journal on food system dynamics, 2(1), 77-93.
Hitt, M. A. Hoskisson, R. E. & Kim, H. (1997). International diversification: Effects
on innovation and firm performance in product-diversified firms. Academy of
Management journal, 40(4), 767-798.
Hsu, C. C. (2006). Internationalization and performance: the S-curve hypothesis and
product diversity effect. Multinational Business Review, 14(2), 29-46.
Page 144
122
Hymer, S. H. (1976). The international operations of national firms: A study of
foreign direct investment.
Hyndman, R. J. (2008). Stochastic population forecasts using functional data models
for mortality, fertility and migration. International Journal of Forecasting,
24(3), 323-342.
Jackson, S. A. (2002). On the boundaries of theological tolerance in Islam.
Jegede, O. O. Egbetokun, A. A., & Siyanbola, W. O. (2012). Assessment of
technological innovations in selected indigenous oilfield servicing firms in
Nigeria. African Journal of Science, Technology, Innovation and
Development, 4(2), 69-91.
Johanson, J. & Mattsson, L. G. (2015). Internationalisation in industrial systems—a
network approach. In Knowledge, Networks and Power (pp. 111-132).
Palgrave Macmillan UK.
Johanson, J., & Vahlne, J. E. (1977). The internationalization process of the firm—a
model of knowledge development and increasing foreign market
commitments. Journal of international business studies, 8(1), 23-32.
Johanson, J. & Vahlne, J. E. (1990). The mechanism of internationalisation.
International marketing review, 7(4).
Kareem, R. O. Bakare, H. A. & Ologunla, E. S. (2013). Globalization and Economic
Growth in Nigeria: Any Nexus? Service Science and Management Research
(SSMR), 2(1), 9-17.
Kaur, S. & Sandhu, M. S. (2014). Internationalisation of born global firms: Evidence
from Malaysia. Journal of the Asia Pacific Economy, 19(1), 101-136.
Khanna, T. Palepu, K. G. & Sinha, J. (2005). Strategies that fit emerging markets.
Harvard business review, 83(6), 4-19.
Page 145
123
Kitchenham, B. A. Pfleeger, (2002). Preliminary guidelines for empirical research in
software engineering. IEEE Transactions on software engineering, 28(8),
721-734.
Kolstad, I. & Wiig, A. (2012). What determines Chinese outward FDI? Journal of
World Business, 47(1), 26-34.
Kombo, D. K. & Tromp, D. L. (2009). Introduction to proposal writting. Nairobi:
Pauline publications.
Kothari, C. R. (2004). Research methodology: Methods and techniques. New Age
International.
Kraśnicka, T. & Głód, W. (2013). The Impact of the Internationalization of Polish
SMEs on Their Performance. Journal of Economics & Management, 13, 67-
83.
Kuhle, J. Walther, C. & Wurtzebach, C. (2009). The financial performance of real
estate investment trusts. Journal of Real Estate Research 13, 67-83
Lall, S. (2000). FDI and development: policy and research issues in the emerging
context.
Lee, J. J. (2010). International students‘ experiences and attitudes at a US host
institution: Self-reports and future recommendations. Journal of Research in
International Education, 9(1), 66-84.
Lu, J. W. & Beamish, P. W. (2004). International diversification and firm
performance: The S-curve hypothesis. Academy of management journal,
47(4), 598-609.
Luo, Y. (1998). Timing of investment and international expansion performance in
China. Journal of International Business Studies, 29(2), 391-407.
Page 146
124
Manova, K. Wei, S. J. & Zhang, Z. (2015). Firm exports and multinational activity
under credit constraints. Review of Economics and Statistics, 97(3), 574-588.
Martínez, J. (2006). Do industrial districts influence export performance and export
intensity? Evidence for Spanish SMEs' internationalization process.
European Planning Studies, 14(6), 791-810.
Mathews, J. A. (2006). Dragon multinationals: New players in 21st century
globalization. Asia Pacific journal of management, 23(1), 5-27.
Mathews, J. A. & Zander, I. (2007).The international entrepreneurial dynamics of
accelerated internationalisation.Journal of International Business Studies,
38(3), 387-403.
Mawugnon, A. K. & Qiang, F. (2011, November). The Relationship Between
Foreign Direct Investment and Economic Growth in Togo (1991–2009). In
Proceedings of the 8th International Conference on Innovation and
Management (ICIM 2011), Kitakyushu, Japan, November 30–December 2,
2011, E1269 E (Vol. 73).
Mayer, T. & Ottaviano, G. I. (2008). The happy few: The internationalisation of
european firms. Intereconomics, 43(3), 135-148.
McGrew, A. & Poku, N. K. (2007).Globalization, development and human
security.Polity.
Mcmillan, H. & Schumacher, S. (2010). Researcher in Education.
Melén, S. & Nordman, E. R. (2009). The internationalisation modes of Born Globals:
A longitudinal study. European Management Journal, 27(4), 243-254.
Mella, P. (2012). Performance indicators in business value-creating organizations.
Economia Aziendale Online, (2), 25-52.
Page 147
125
Michael Geringer, J. Beamish, P. W. & DaCosta, R. C. (1989). Diversification
strategy and internationalization: Implications for MNE performance.
Strategic Management Journal, 10(2), 109-119.
Molla, A. & Licker, P. S. (2005). eCommerce adoption in developing countries: a
model and instrument. Information & management, 42(6), 877-899.
Mtigwe, B. (2005). The entrepreneurial firm internationalization process in the
Southern African context: A comparative approach. International Journal of
Entrepreneurial Behavior & Research, 11(5), 358-377.
Mugenda, O. M. (1999). Research methods: Quantitative and qualitative
approaches. African Centre for Technology Studies.
Mugenda, O. M., & Mugenda, A. G. (2012). Research methods dictionary.
Mugenda, O., & Mugenda, A. (2003). Research methodology: qualitative and
quantitative techniques.
Musuva, M. A. (2013). Firm level factors and international performance of
companies listed on the Nairobi Securities Exchange (Doctoral dissertation,
University of Nairobi).
O'Cass, A. & Weerawardena, J. (2009). Examining the role of international
entrepreneurship, innovation and international market performance in SME
internationalisation. European Journal of Marketing, 43(11/12), 1325-1348.
Ofili, O. U. (2014). Intellectual Property Rights Protection and Economic
Development: The Case of Nigeria.
Olusegun, A. I. (2012). Is small and medium enterprises (SMEs) an
entrepreneurship?.International Journal of Academic Research in Business
and Social Sciences, 2(1), 487.
Page 148
126
Omokhudu, O. O. & Ibadin, P. O. (2015). The value relevance of accounting
information: Evidence from Nigeria. Accounting and Finance Research, 4(3),
p20.
Onafowora, O. A. & Owoye, O. (2006). An empirical investigation of budget and
trade deficits: the case of Nigeria. The Journal of Developing Areas, 39(2),
153-174.
Onkelinx, J. & Sleuwaegen, L. E. (2010). Internationalization strategy and
performance of small and medium sized enterprises.
Osborne, J. W. Christensen, W. R. & Gunter, J. (2001). Educational psychology from
a statistician‘s perspective: A review of the power and goodness of
educational psychology research. In national meeting of the American
Education Research Association (AERA), Seattle, WA.
Ouimet, P. & Zarutskie, R. (2014). Who works for startups? The relation between
firm age, employee age, and growth. Journal of financial Economics, 112(3),
386-407.
Oviatt, B. M. & McDougall, P. P. (1994). Toward a theory of international new
ventures. Journal of international business studies, 25(1), 45-64.
Owino, A. O. (2015). The Effect Of Funding On The Financial Performance Of
Commercial Banks In Kenya (Doctoral dissertation, University of Nairobi).
Oyeniyi, O. (2009). Analysis of Nigerian Consumers‘ Perception of Foreign
Products. online]: www-upg-bulletin-serro/achieve/2009-3/3-220Oyeniyi-
pdf,(accessed 01/03/11).
Pan, W. H. Tsai, W. C. & Kuo, T. Y. (2010). Internationalization and firm
performance: Exploring the moderating effects of regional diversification.
African Journal of Business Management, 4(18), 4049.
Page 149
127
Petersen, B. Pedersen, T. & Sharma, D. D. (2003). The role of knowledge in firms‘
internationalisation process: Wherefrom and whereto. Learning in the
internationalisation process of firms, 36-55.
Polit, D. F. Beck, C. T. Hungler, B. P. & Bartholomeyczik, S. (2004). Lehrbuch
Pflegeforschung: Methodik, Beurteilung und Anwendung. Huber.
Pratheepkanth, P. (2011). Capital structure and financial performance: Evidence
from selected business companies in Colombo stock exchange Sri Lanka.
Researchers World, 2(2), 171.
Protopappa-Sieke, M. & Seifert, R. W. (2010). Interrelating operational and financial
performance measurements in inventory control. European Journal of
Operational Research, 204(3), 439-448.
Raheman, A. Afza, T. Qayyum, A. & Bodla, M. A. (2010). Working capital
management and corporate performance of manufacturing sector in Pakistan.
International Research Journal of Finance and Economics, 47(1), 156-169.
Ramamurti, R. (2009). 13 What have we learned about emerging—market MNEs?.
Emerging multinationals in emerging markets, 399.
Riding, A. Orser, B. J. Spence, M. & Belanger, B. (2012). Financing new venture
exporters. Small Business Economics, 38(2), 147-163.
Rugraff, E. (2008). Are the FDI policies of the Central European countries efficient?.
Post-communist economies, 20(3), 303-316.
Ruigrok, W. Amann, W. & Wagner, H. (2007). The internationalization-performance
relationship at Swiss firms: A test of the S-shape and extreme degrees of
internationalization. Management International Review, 47(3), 349-368.
Page 150
128
Rumelt, R. P. & Lamb, R. (1984). Competitive strategic management. Toward a
Strategic Theory of the Firm, 556-570.
Samarina, A. & Bezemer, D. (2016). Do capital flows change domestic credit
allocation?. Journal of International Money and Finance, 62, 98-121.
Sapienza, H. J. Autio, E., George, G., & Zahra, S. A. (2006). A capabilities
perspective on the effects of early internationalization on firm survival and
growth. Academy of management review, 31(4), 914-933.
Saunders, M. L., & Lewis, P. (2009). P. & Thornhill, A.(2009). Research methods
for business students, 4.
Segaro, E. (2012). Internationalisation of family SMEs: the impact of ownership,
governance, and top management team. Journal of Management &
Governance, 16(1), 147-169.
Senik, Z., Isa, R. Scott-Ladd, B., & Entrekin, L. (2010). Influential factors for SME
internationalization: Evidence from Malaysia. International Journal of
Economics and Management, 4(2), 285-304.
Shikwe, G. O. (2014). Problems of internationalization of operations by Kenyan
Insurance firms (Doctoral dissertation, University of Nairobi).
Singla, C. & George, R. (2013). Internationalization and performance: A contextual
analysis of Indian firms. Journal of Business Research, 66(12), 2500-2506.
Sinha Roy, S. (2007). Demand and Supply Factors in the Determination of India's
Disaggregated Manufactured Exports: A Simultaneous Error-Correction
Aprroach.
Sleuwaegen, L. & Onkelinx, J. (2014). International commitment, post-entry growth
and survival of international new ventures. Journal of Business Venturing,
29(1), 106-120.
Page 151
129
Sueyoshi, T. Goto, M. & Ueno, T. (2010). Performance analysis of US coal-fired
power plants by measuring three DEA efficiencies. Energy Policy, 38(4),
1675-1688.
Surroca, J. Tribó, J. A. & Waddock, S. (2010). Corporate responsibility and financial
performance: The role of intangible resources. Strategic management journal,
31(5), 463-490.
Tallman, S. & Li, J. (1996). Effects of international diversity and product diversity
on the performance of multinational firms. Academy of Management journal,
39(1), 179-196.
Thériault, L. É. & Beckman, K. (2008). Trends in Foreign Direct Investment and
Mergers and Acquisitions: International and Canadian Performance and
Implications. Conference Board of Canada.
Tzeremes, N. G. (2009). Internationalization And Firm Performance: The Case Of
The Top 10 Non-Financial Tncs From South-East Europe.
Uotila, J. Maula, M. Keil, T. & Zahra, S. A. (2009). Exploration, exploitation, and
financial performance: analysis of S&P 500 corporations. Strategic
Management Journal, 30(2), 221-231.
Vanacker, T. Manigart, S. Meuleman, M. & Sels, L. (2011). A longitudinal study on
the relationship between financial bootstrapping and new venture growth.
Entrepreneurship & Regional Development, 23(9-10), 681-705.
Wach, K. (2014). The Role of Knowledge in the Internationalisation Process: An
Empirical Investigation among Polish Businesses. International
Competitiveness in Visegrad Countries: Macro and Micro Perspectives, 143-
158.
Wagner, H. (2004). Internationalization speed and cost efficiency: Evidence from
Germany. International Business Review, 13(4), 447-463.
Page 152
130
Walley, K. (2007). Coopetition: an introduction to the subject and an agenda for
research. International Studies of Management & Organization, 37(2), 11-31.
Walsh, J. & Deery, S. (2006). Refashioning organizational boundaries: Outsourcing
customer service work. Journal of Management Studies, 43(3), 557-582.
Wei-Hwa, P. & Wei-Chun, T. (2012). Internationalization, regional diversification
and firm performance: the moderating effects of administrative intensity.
International Journal of Business and Social Science, 3(18).
Welch, C. L. & Welch, L. S. (2009). Re-internationalisation: Exploration and
conceptualisation. International Business Review, 18(6), 567-577.
Wernerfelt, B. (1984). A resource‐based view of the firm. Strategic management
journal, 5(2), 171-180.
Yang, N. (2012). Small businesses and international entrepreneurship in the
economic hard time: a global strategic perspective. International Journal of
Entrepreneurship, 16, 113.
Zahra, S. A. (2003). International expansion of US manufacturing family businesses:
The effect of ownership and involvement. Journal of business venturing,
18(4), 495-512.
Zahra, S. A. (2005). Entrepreneurial risk taking in family firms. Family Business
Review, 18(1),
Zahra, S. A., Ireland, R. D., & Hitt, M. A. (2000). International expansion by new
venture firms: International diversity, mode of market entry, technological
learning, and performance. Academy of Management journal, 43(5), 925-950.
Page 153
131
APPENDICES
Appendix I Questionnaire
SECTION A: GENERAL AND DEMOGRAPHIC DATA
1. Please indicate the highest level of education you have attained
a) Polytechnic/College level ( )
b) University level ( )
c) Post graduate level ( )
2. Cumulatively, how many years have you worked in manufacturing sector?
a) Less than 2 years ( )
b) 2 to 5 years ( )
c) Over 5 years ( )
SECTION B: FOREIGN TRADE
3. This section intends to measure the effect of Foreign Trade on the financial
performance of listed manufacturing companies in Nigeria. The following
statements are measured on likert scale kindly indicate your level of
agreement with the statement. Tick as appropriate as 1= Strongly Disagree,
2=Disagree, 3=Neutral, 4=Agree, 5=Strongly Agree.
Page 154
132
No Statements 1 2 3 4 5
1. 1 We focus on exports trade to
improve our income streams
2. 2 Revenue from exports
account for a significant
share of the company total
income
3. 3 Our company has a reliable
international markets through
foreign partners
4. 4 Our company has adopted
modern technologies and
innovations through
interaction with our
international partners
5. 5 The company has invested a
lot of resources in marketing
our products in International
markets
6. 6 Participating in foreign trade
has led to increase in the
company performance
Page 155
133
SECTION C: FOREIGN DIRECT INVESTMENTS
4. The following statements are measured on likert scale kindly indicate your
level of agreement with the statement. Tick as appropriate as 1= Strongly
Disagree, 2=Disagree, 3=Neutral, 4=Agree, 5=Strongly Agree.
No Statements 1 2 3 4 5
7. 1 The company has engaged in
foreign production to
improve revenue
8. 2 The percentage of profit
from foreign operations has
significantly improved
9. 3 The company is open to
foreign investors who seek to
invest locally
4 The company has acquired
profit earning assets in
overseas countries
5 The company has
subsidiaries in foreign
countries to boost
participation in international
market
6 The company‘s foreign
investments have enhanced
our competitiveness and
strengthen global position
Page 156
134
SECTION D: INTERNATIONAL PROPRIETARY RIGHTS
5. This section intends to measure the effect of International Proprietary Rights
on the financial performance of listed manufacturing companies in Nigeria.
The following statements are measured on likert scale. Kindly indicate your
level of agreement with the statement. Tick as appropriate as 1= Strongly
Disagree, 2=Disagree, 3=Neutral, 4=Agree, 5=Strongly Agree.
No Statements 1 2 3 4 5
1 We enhance our income
streams by relying on
international trade marks
2 We enhance our trade through
the use of international patents
rights
3 Royalties income from
proprietary rights make an
important portions of our
international operations
4 Foreign business ownership
has been made easy through
internationalisation
5 Countries worldwide have
adopted Foreign investment
rights that make easy for
foreign companies to invest
Page 157
135
SECTION E: BUSINESS FOREIGN FUNDING
6. The following statements are measured on likert scale kindly indicate your
level of agreement with the statement. Tick as appropriate as 1= Strongly
Disagree, 2=Disagree, 3=Neutral, 4=Agree, 5=Strongly Agree.
No Statements 1 2 3 4 5
10. 1 The company has access to
foreign capital from foreign
partners and donors
11. 2 The has a high proportion of
foreign debts
12. 3 A significant amount of the
company‘s equity is
provided by the foreign and
international partners
4 Foreign source of financing
has are considered easier to
access than local sources of
finance
5 The company has embraced
foreign lease financing as a
method of financing its
operations
6 Foreign funding is essential
to the survival and
performance of international
firms
Page 158
136
Appendix II Secondary data collection Sheet
Years
Income
from
exports
to total
income
ratio
Value of
Total
Imports
to
expense
ratio
percentag
e of
Profits
from
foreign
operations
Ratio of
foreign
assets to
total
assets
Paten
t
rights
cost
ratio
Roya
lties
inco
me
ratio
For
eig
n
deb
t
foreig
n
equit
y ROA
2006
2007
2008
2009
2010
2011
2012
2013
2014
2015
Page 159
137
Appendix III Listed Manufacturing Companies in Nigeria
Consumer Goods
Company Name Sector
1. Up Bottling Company Plc
2. Big Treat Plc
3. Cadbury Nigeria Plc
4. Champion Brew Plc
5. Dangote Flour Mills Plc
6. Dangote Sugar Refinery Plc
7. Dn Tyre & Rubber Plc
8. Nigerian Enamelware Plc
9. Flour Mills Nigeria Plc
10. Golden Guinea Brew.Plc
11. Guiness Nig Plc
12. Honey Well Flour Mills Plc
13. International Breweries Plc
14. Jos Int. Breweries
15. P.S. Mandrides & Co Plc
16. Mcnichols Plc
17. Mult- Trex Integrated Foods Plc
18. National Salt Co.Nig .Plc
19. Nigerian Brew Plc
20. Nestle Nigeria Plc
21. Nigerian Flour Mills
22. Premier Breweries Plc
23. Cussons Nigeria Plc
24. Rokana Industries Plc
25. Unilever Nigeria Plc
Page 160
138
26. Union Dicon Salt Plc
27. Utc Nig Plc
28. Greif Nigeria Plc
29. Vitafoam Nig. Plc
30. Vono Products Plc
Industrial Goods
1. Adswitch Plc
2. African Paints (Nig) Plc
3. Aluminium Extrusion Nd Plc
4. Ashaka Cem Plc
5. Austin Laz & Company Plc
6. Avon Crowncaps & Containers
7. Berger Paints Plc
8. Beta Glass Co Plc
9. Cap Plc
10. Cement Co Of North Nig Plc
11. Cutix Plc
12. Dangote Cement
13. Dn Meyer Plc
14. First Aluminium Nigeria Plc
15. Ipwa Plc
16. Nigeria Ropes
17. Nig.Sew Mach.Man.Co.Plc
18. Nigerian Wire And Cable Plc
19. Paints And Coatings Manufactures
Plc
20. Portland Paints & Products Nigeria
Plc
21. Premier Paints Plc
Page 161
139
22. Stokvis Plc
23. Wa Glass Ind Plc
24. Lafarge Wapco Plc
Health Care
1.Ekocorp Plc
2. Evans Medical Plc
3. Fidson Health Care Plc
4. Glaxo Smithkline Consumer
5. May & Baker Nigeria Plc
6. Morison Industries Plc
7. Neimeth International Pharmaceuticals
Plc
8. Nigerian German Chemicals Plc
9. Pharma - Deko Plc
10. Union Diagnostic And Clinical
Services Plc
Page 162
140
Conglomerates
1.Ag Leventis Nigeria Plc
2. Chellarams Plc
3.John Holt Plc
4.Scoa Nig Plc
5.Transnational Corporation Of Nigeria
Plc
6. Uacn Pc
Natural Resources
1. Aluminium Extrusion Nd Plc
2. Alumaco Plc
3. B.00,Gases Plc
4. Multiverse Plc
5.Thomas Wyatt Nigeria Plc


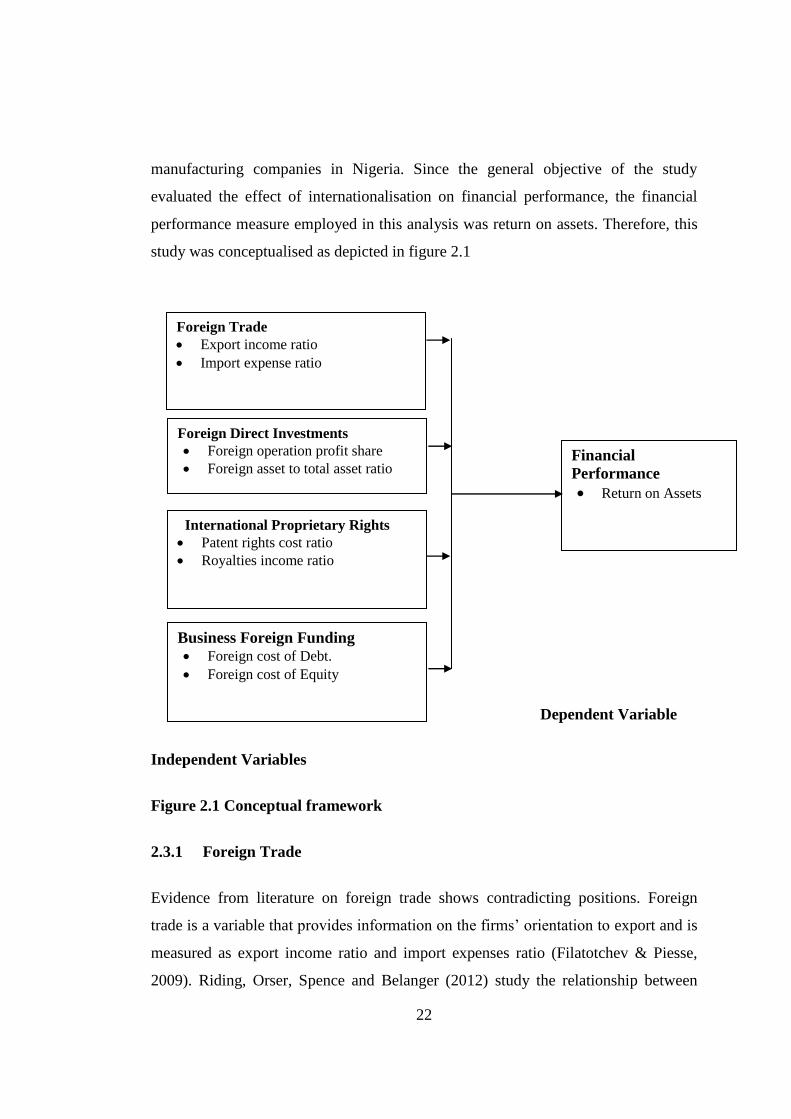


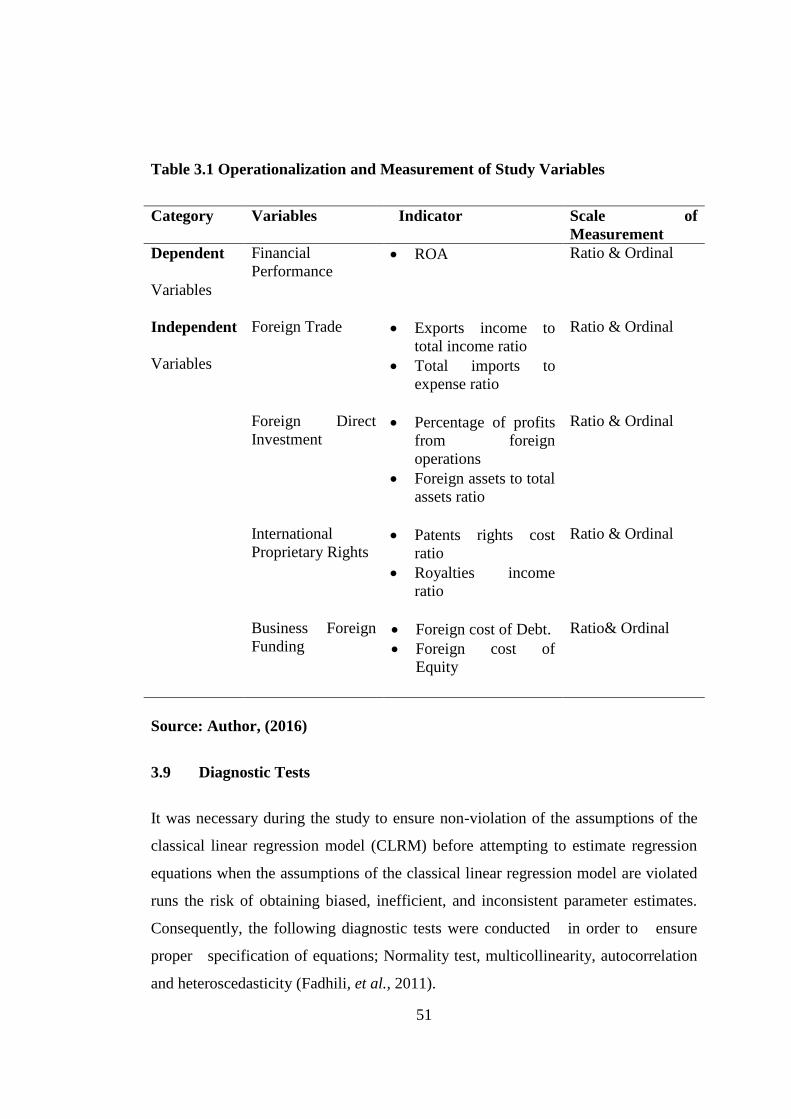


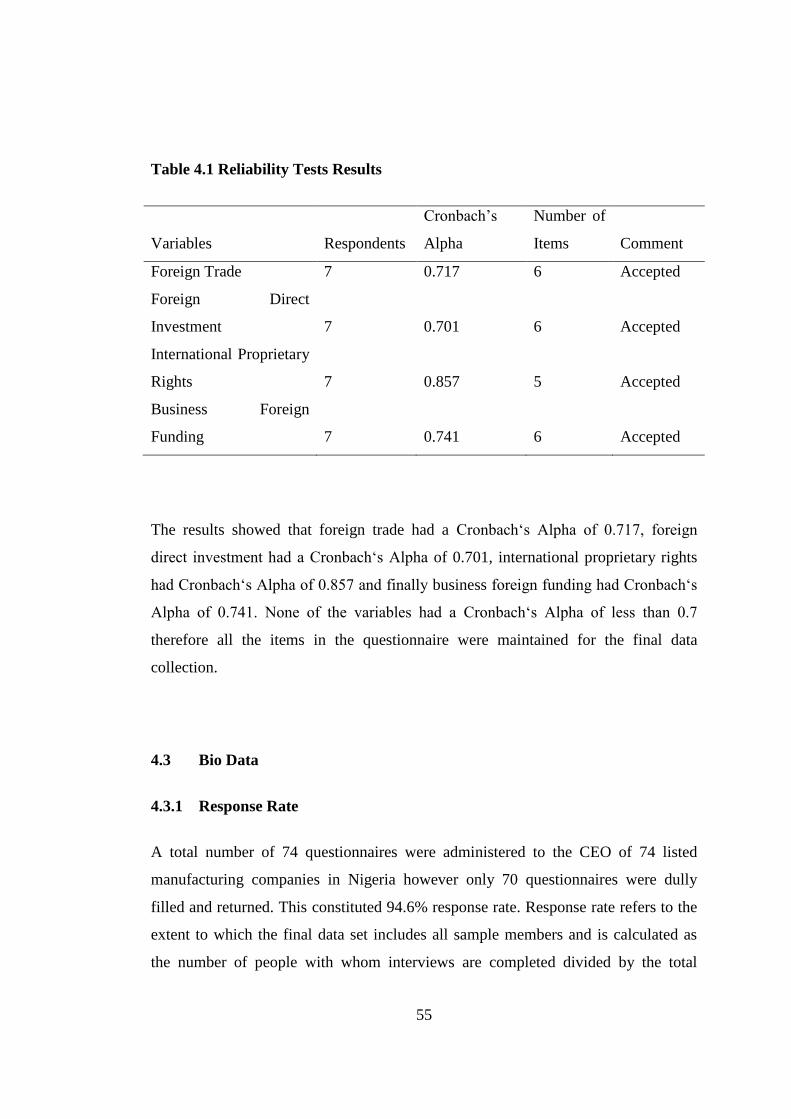

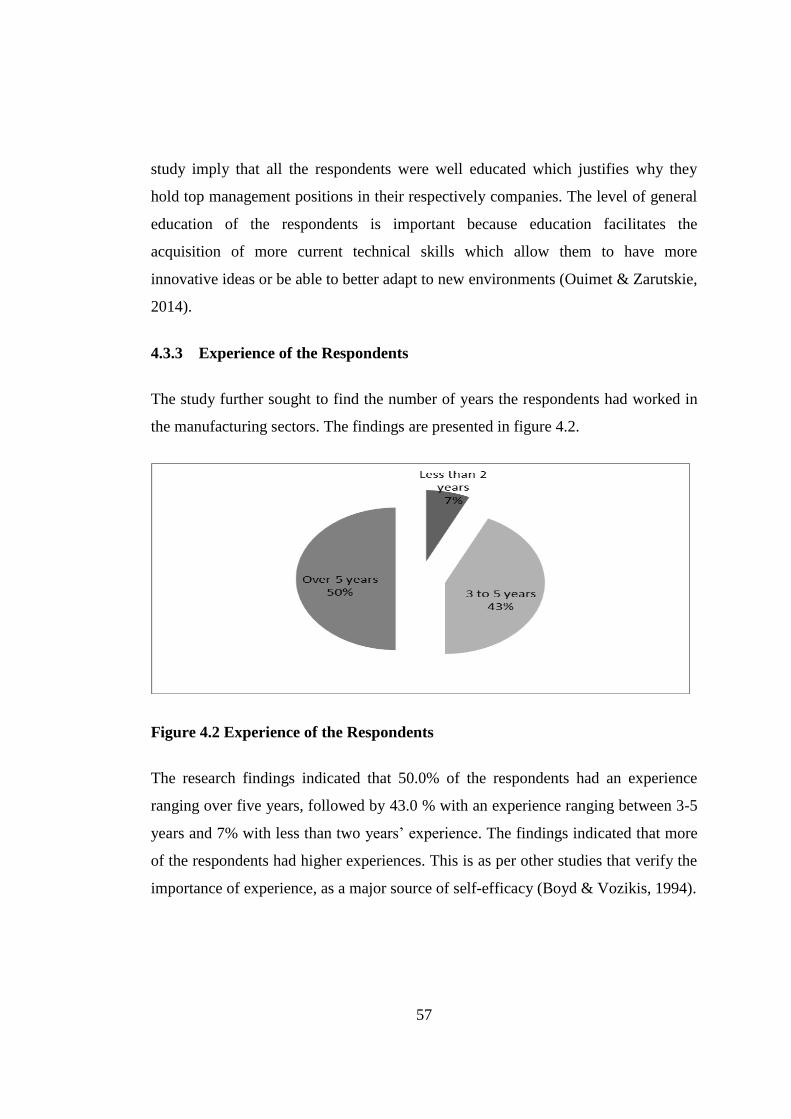
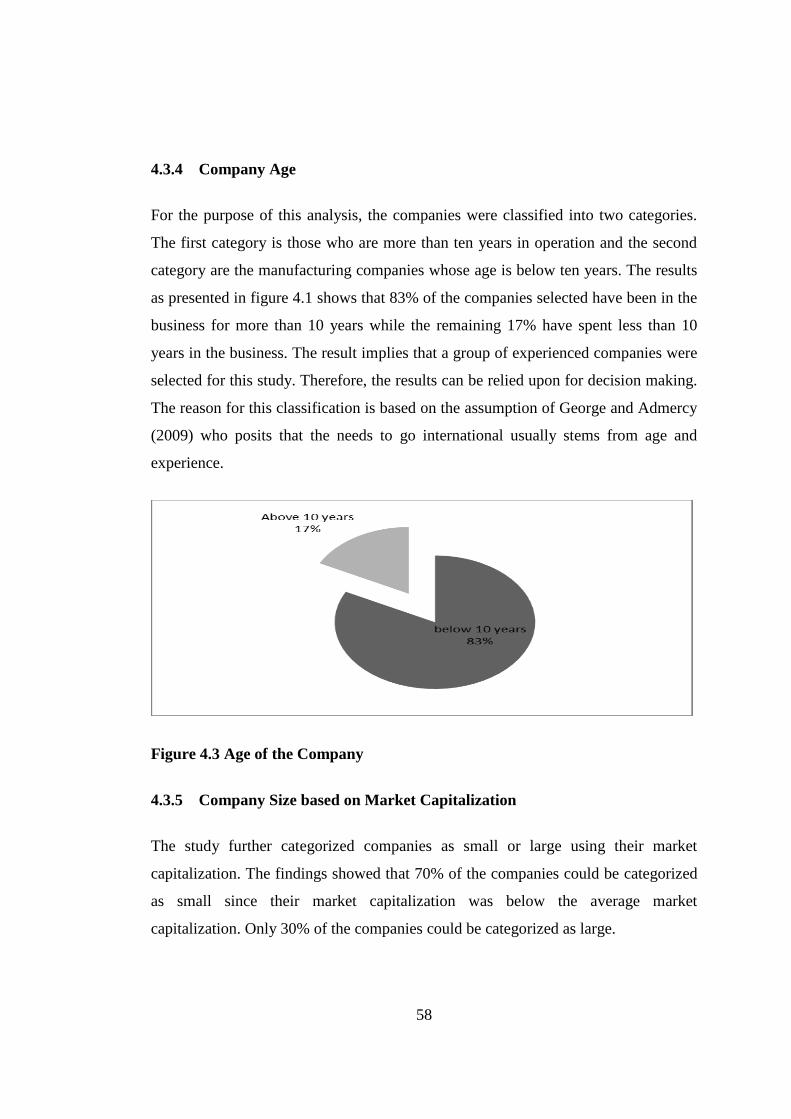
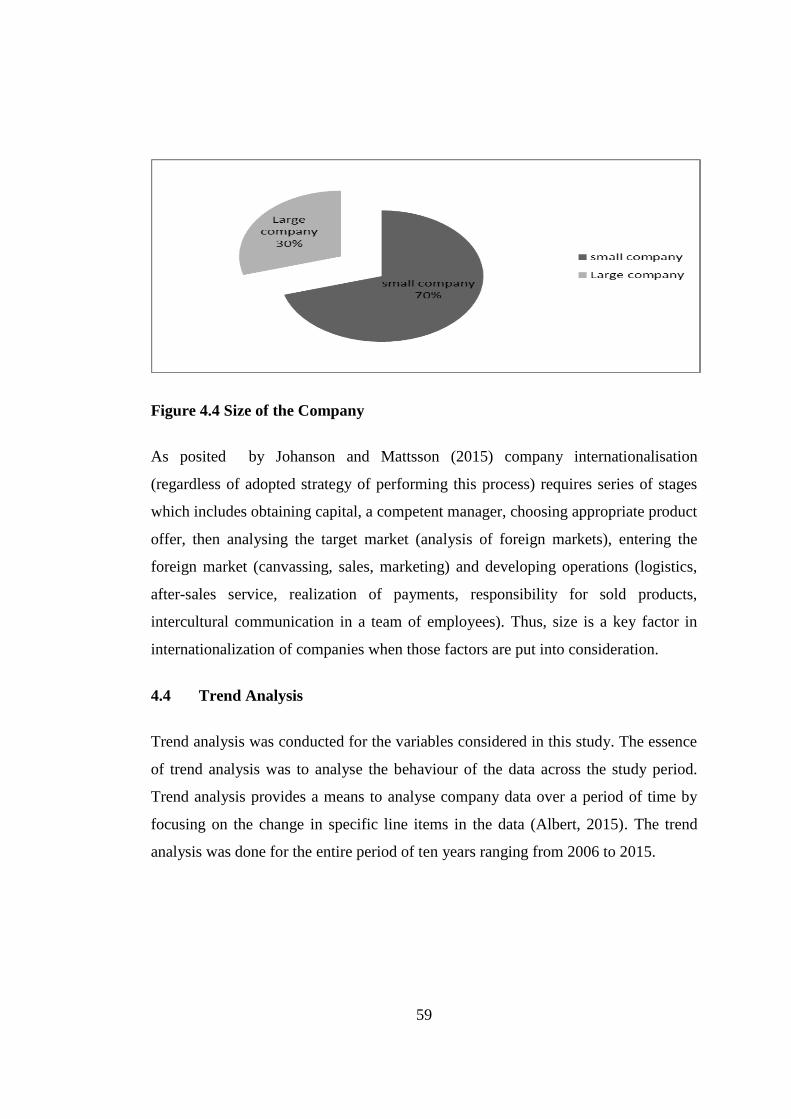
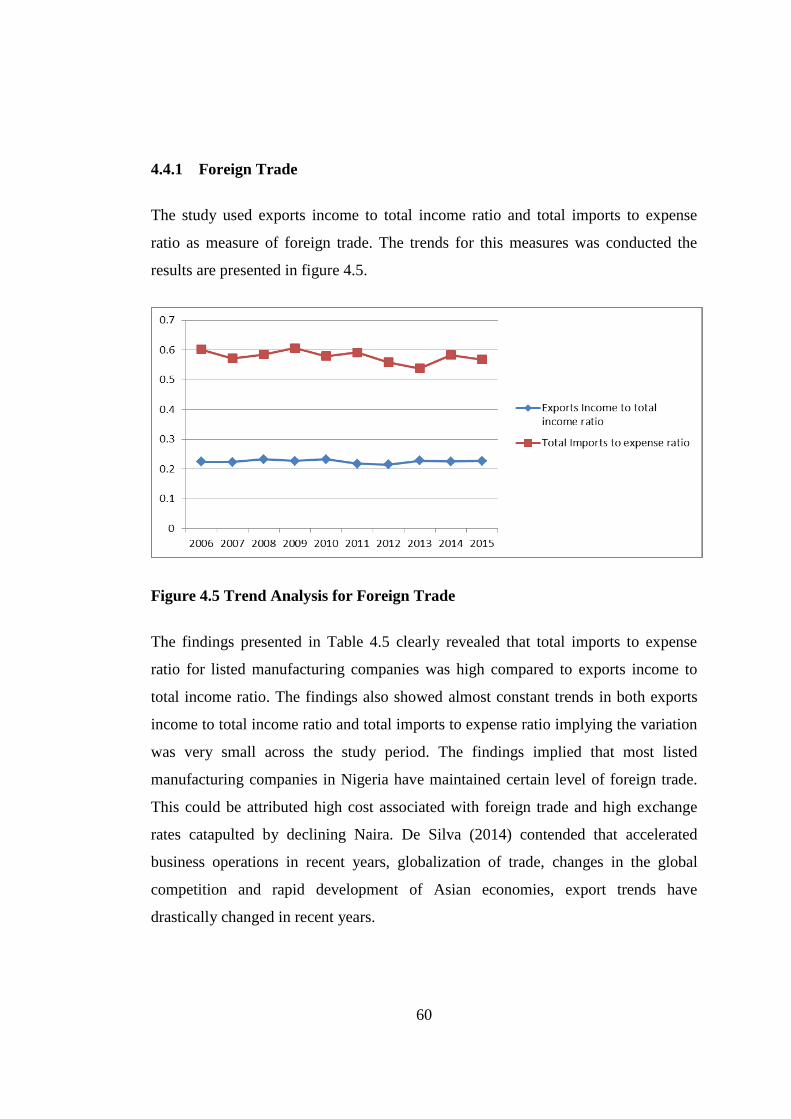


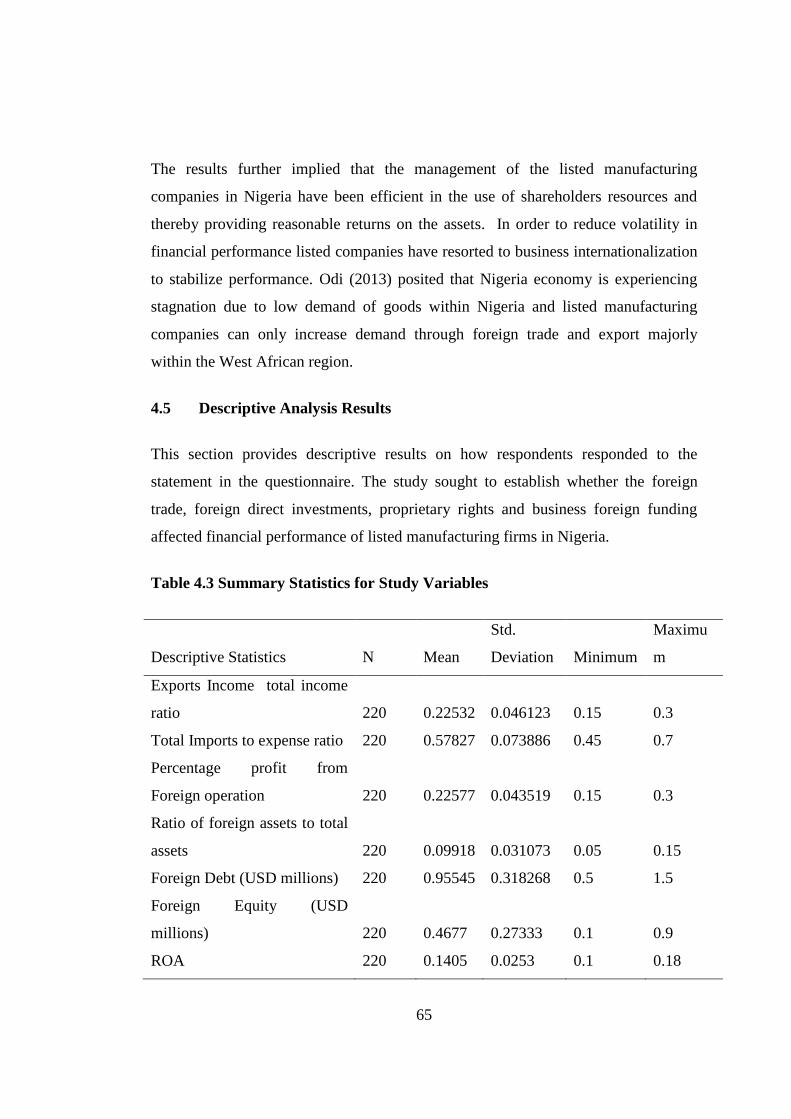


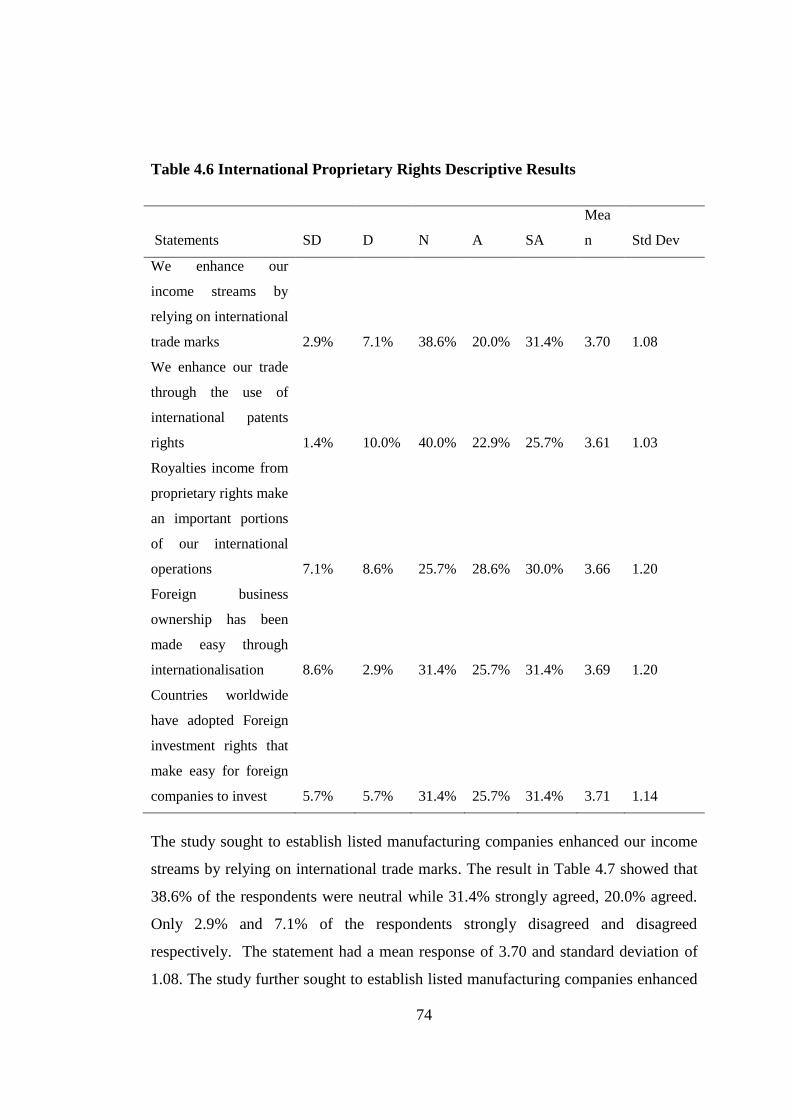
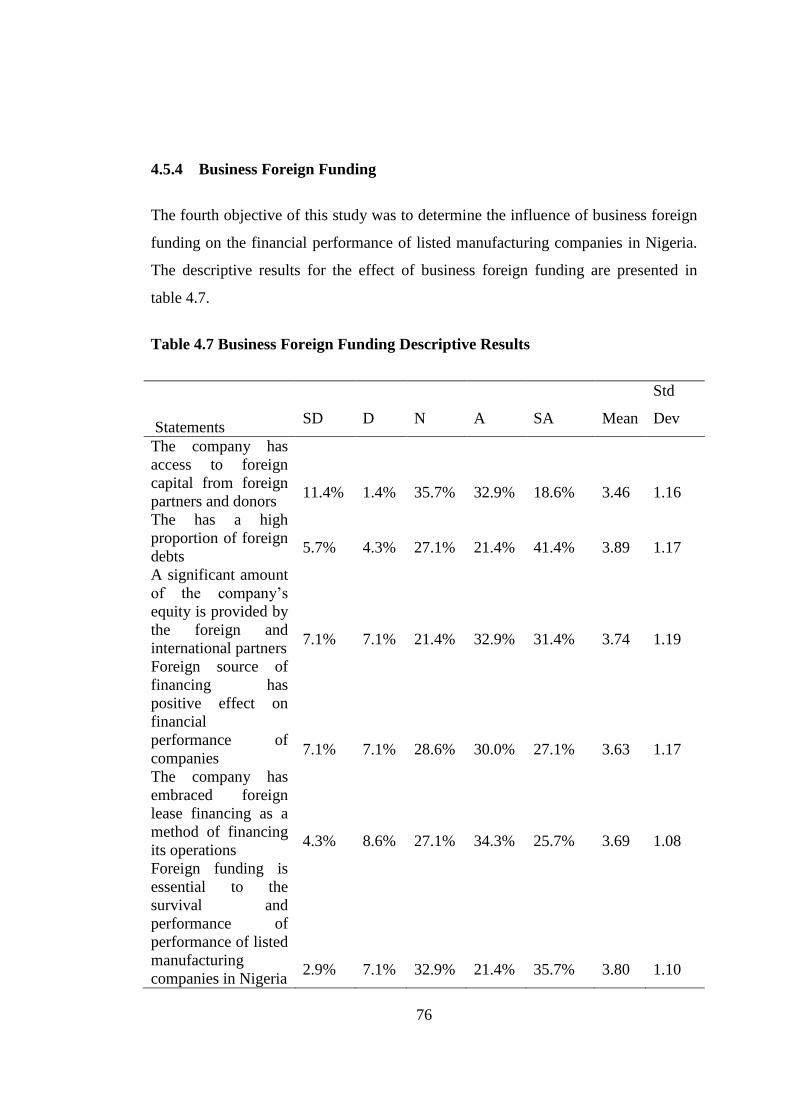

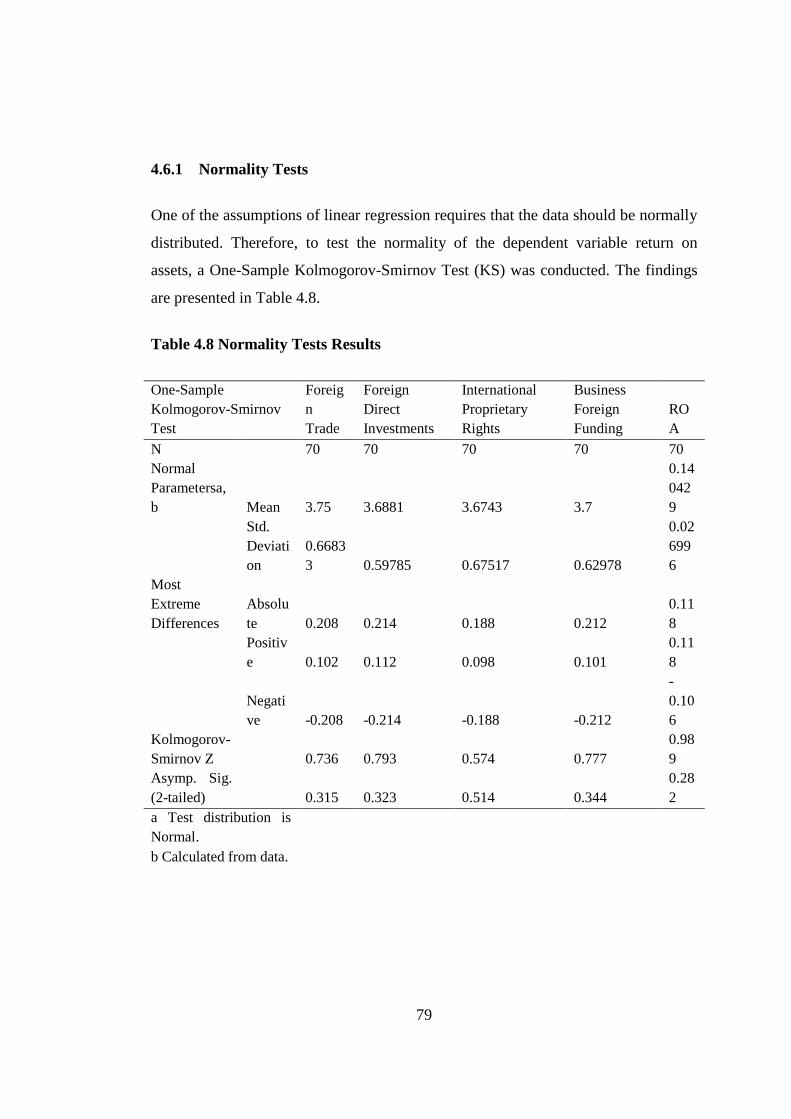
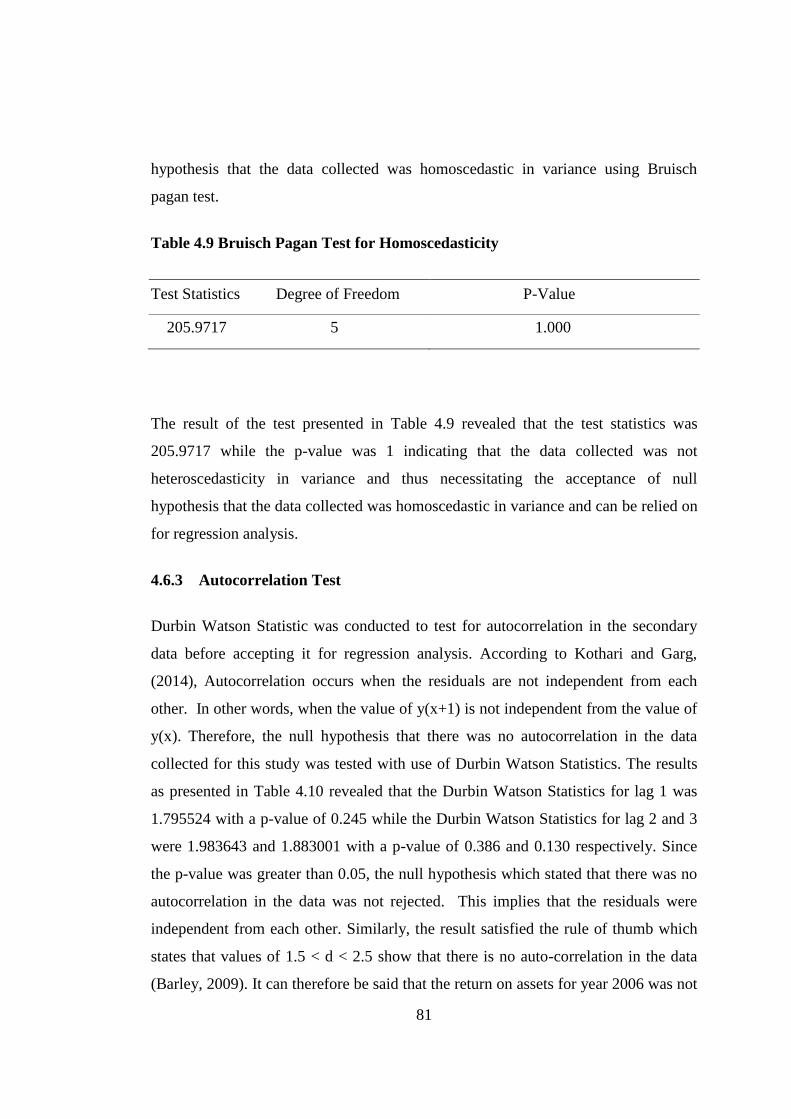
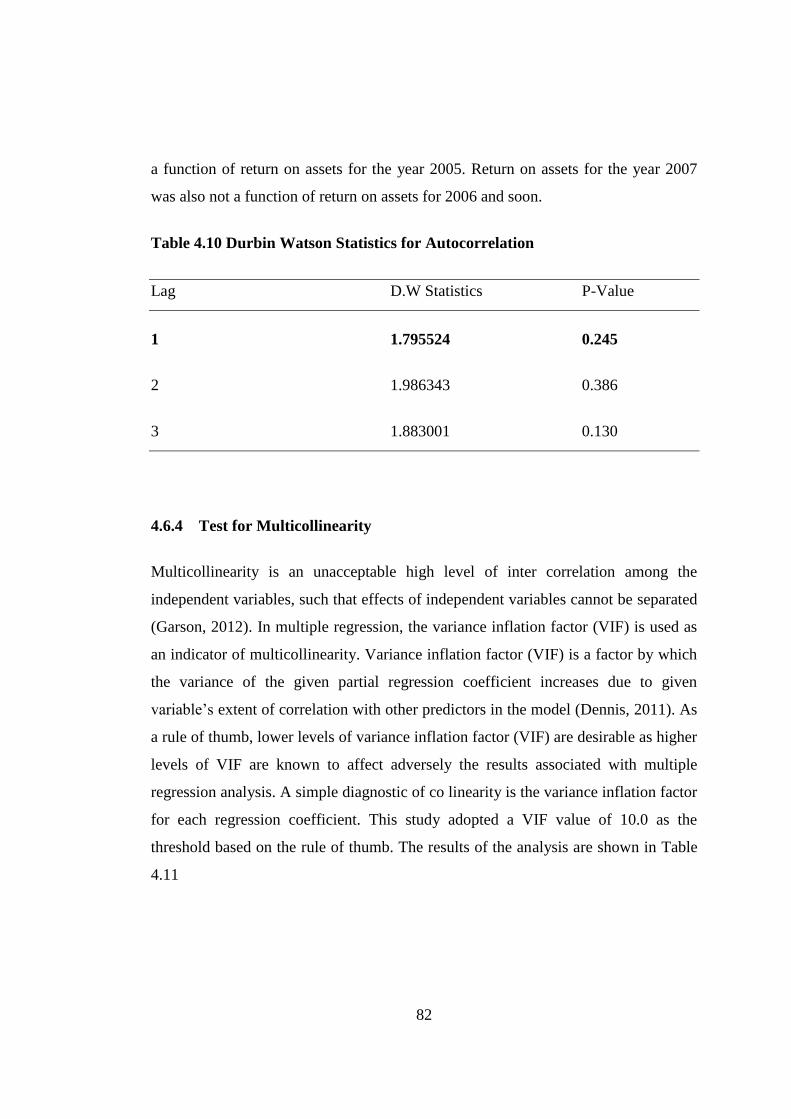
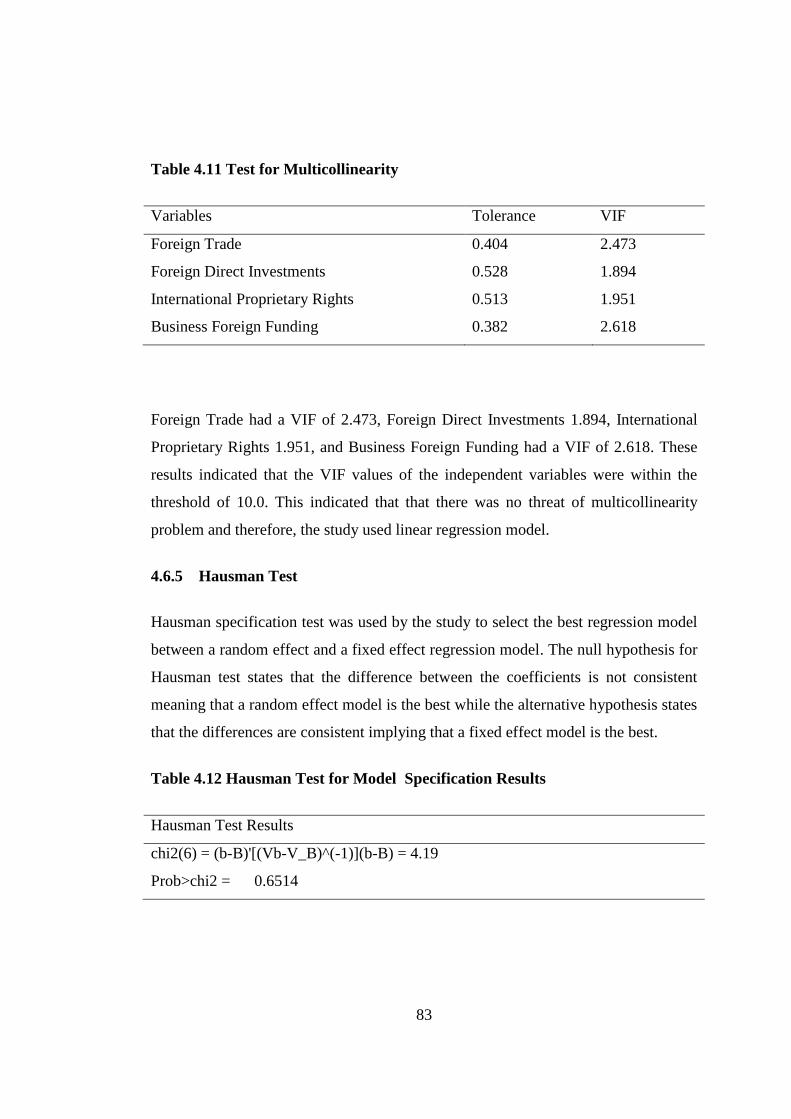

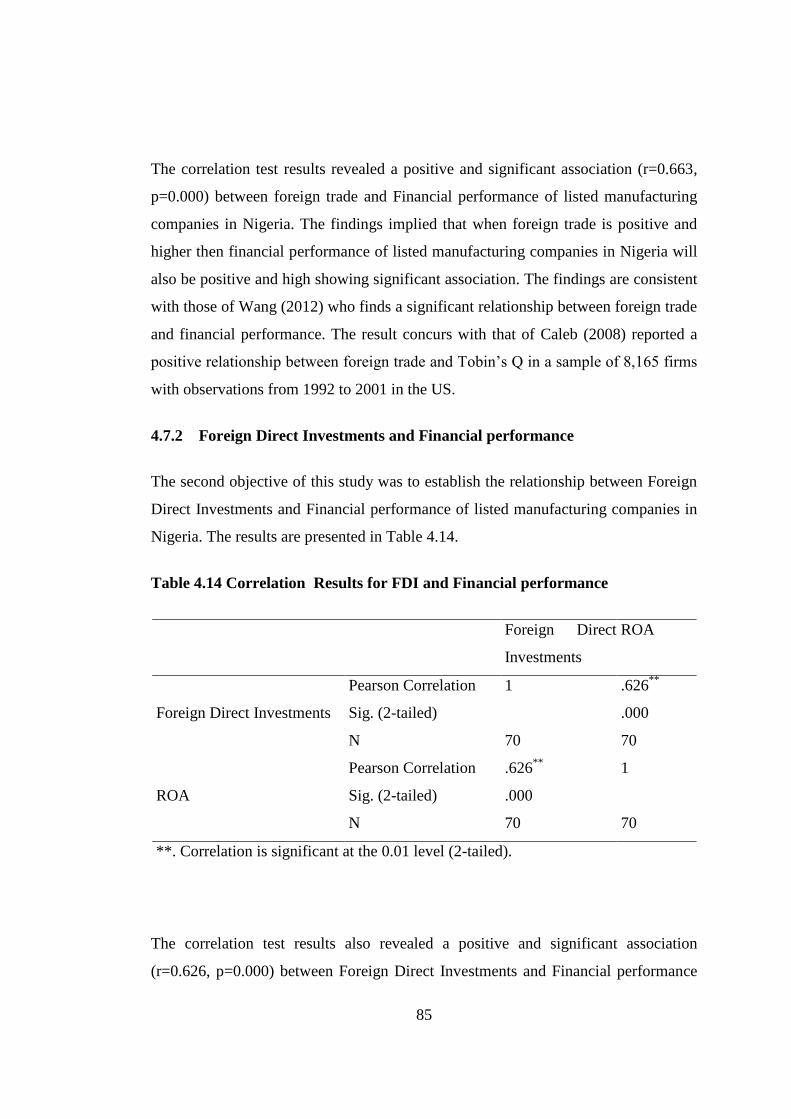

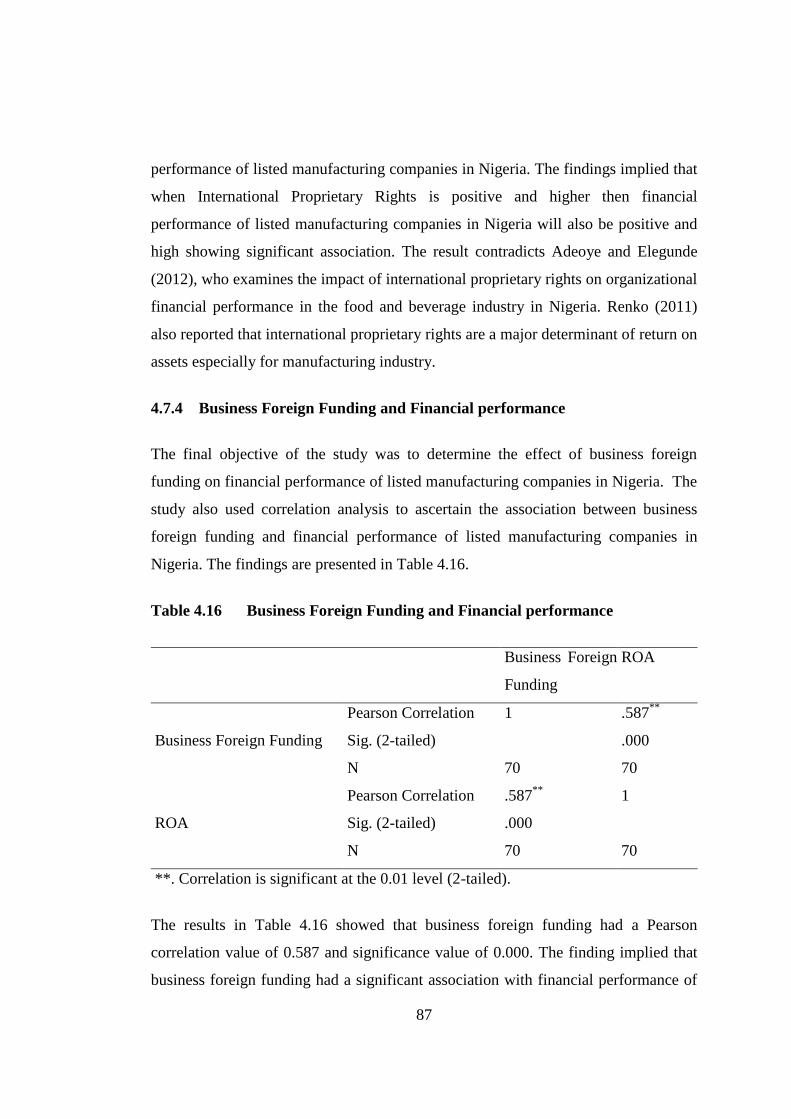

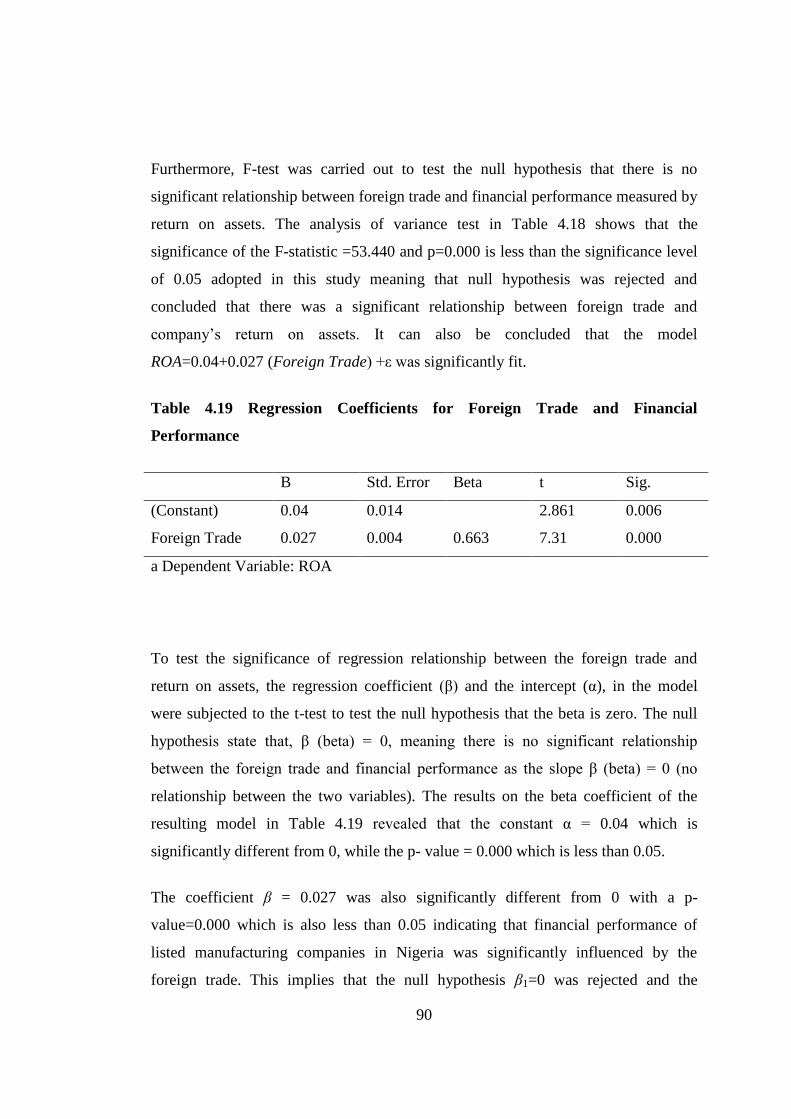
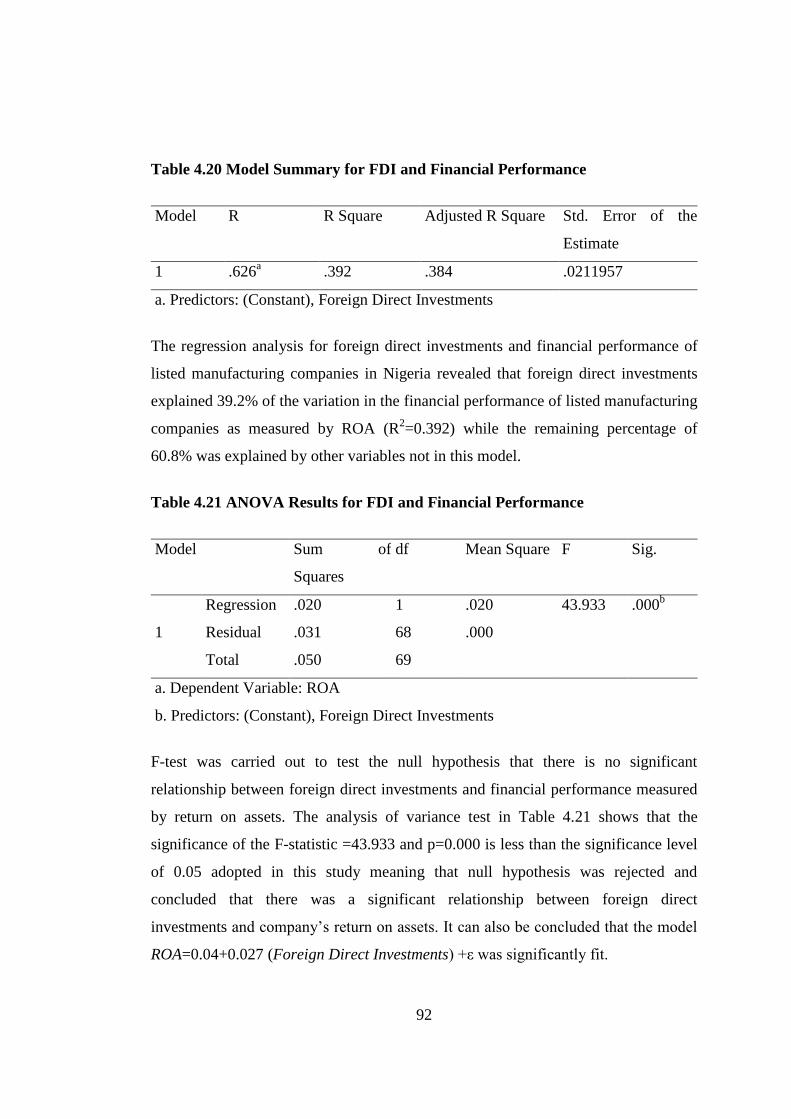

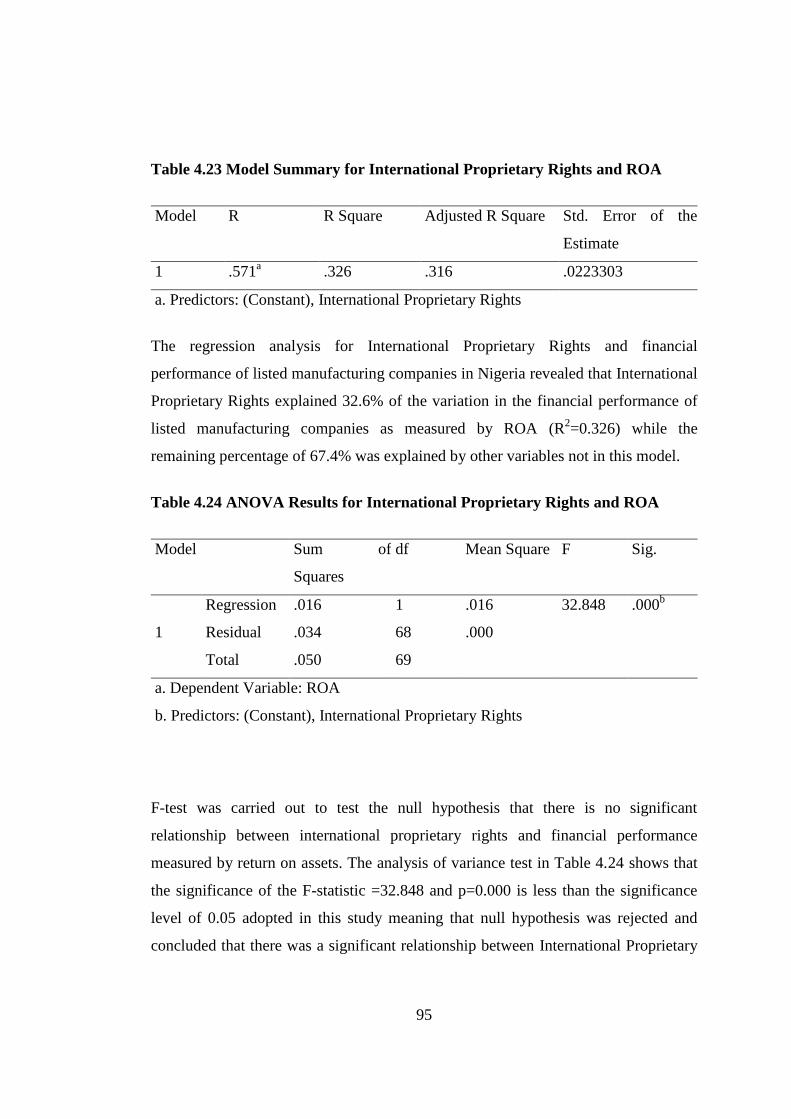
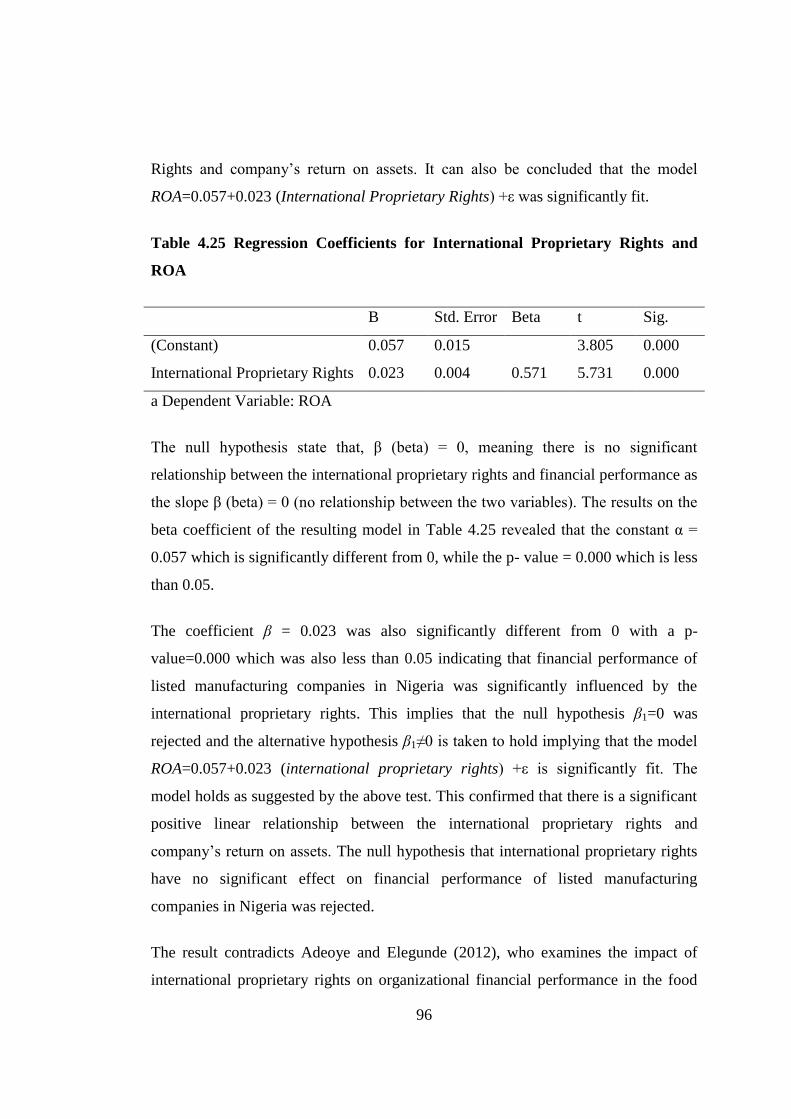


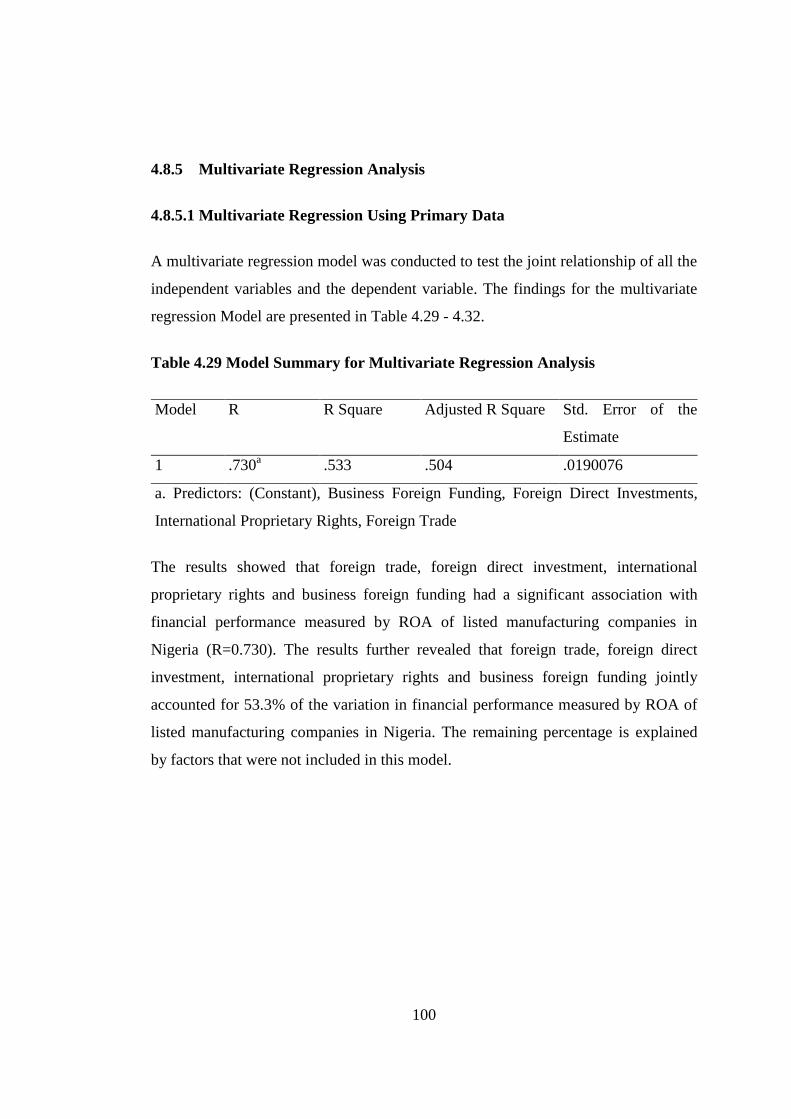
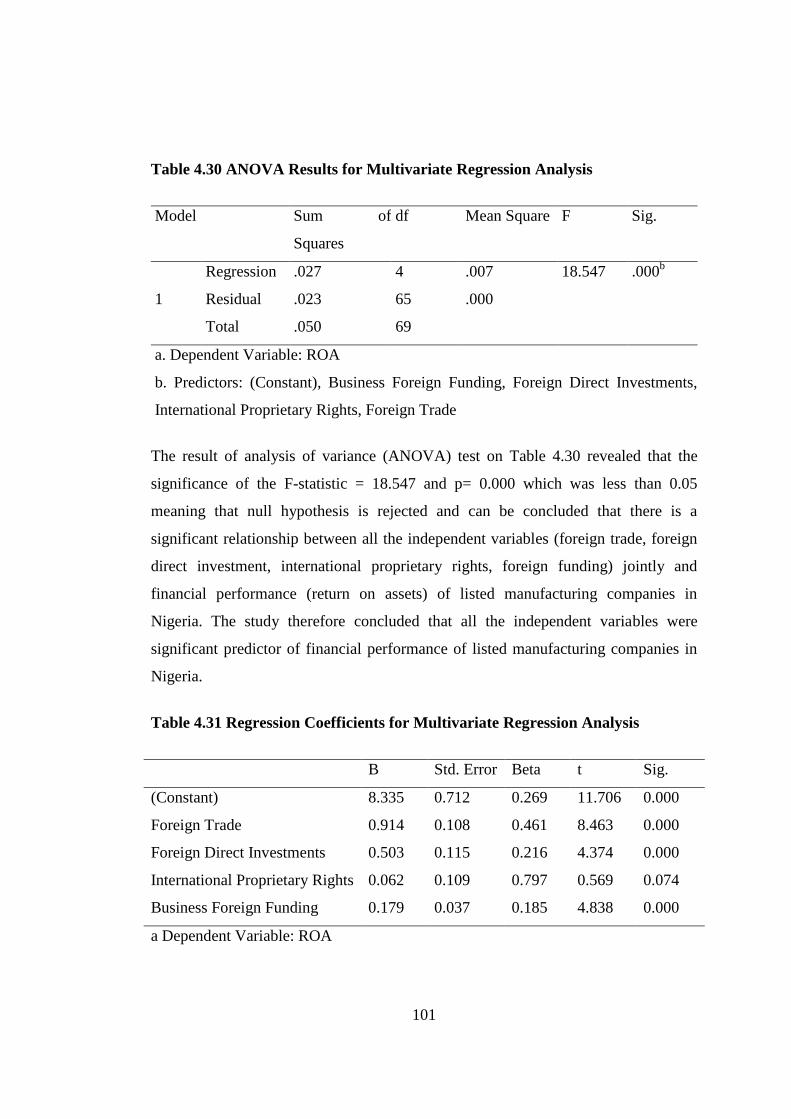
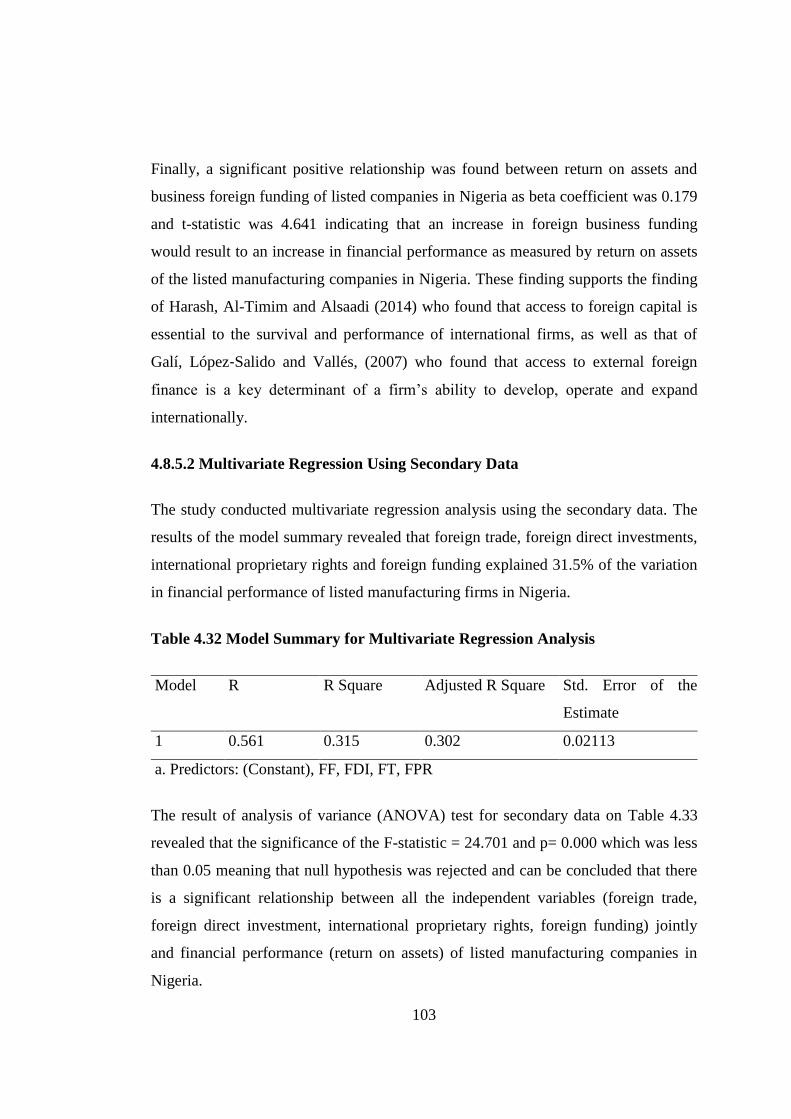
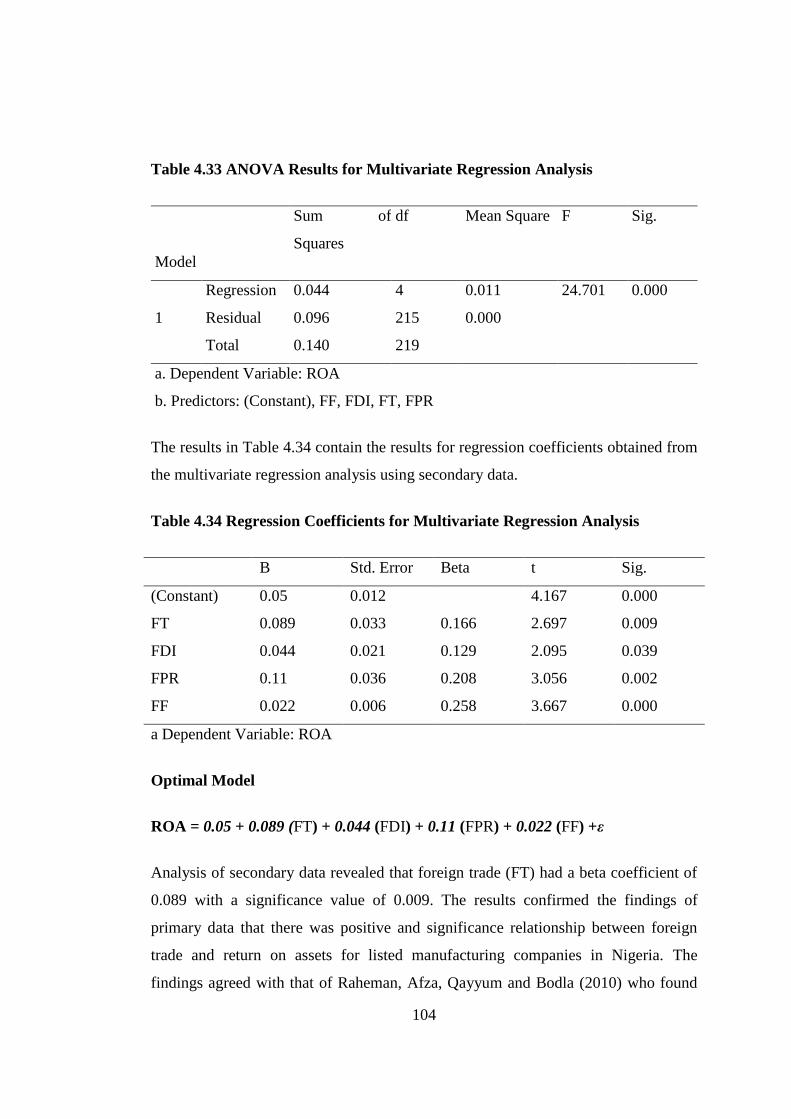
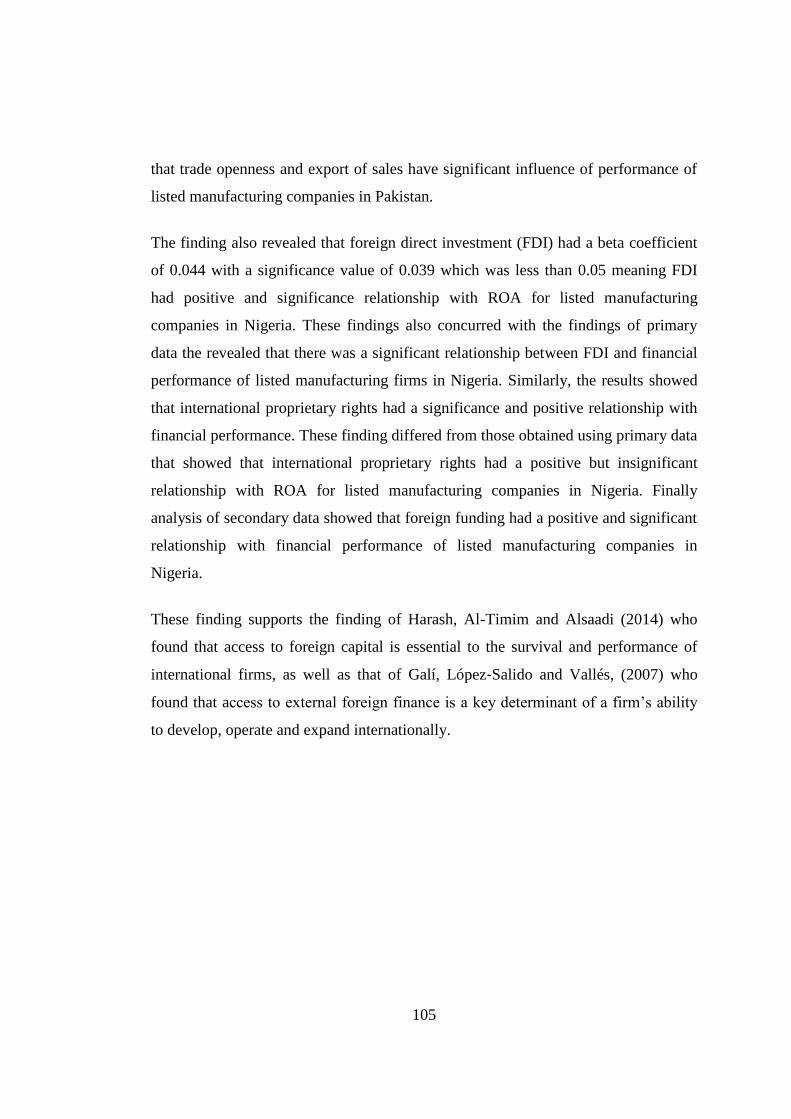


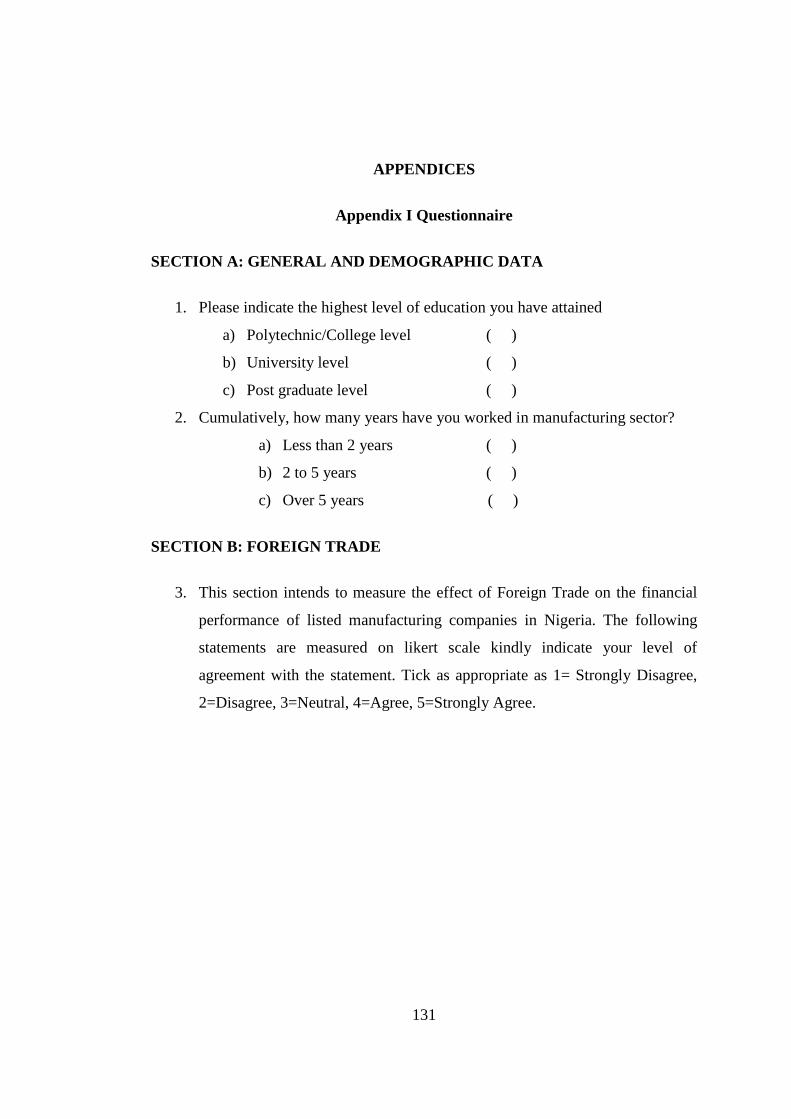
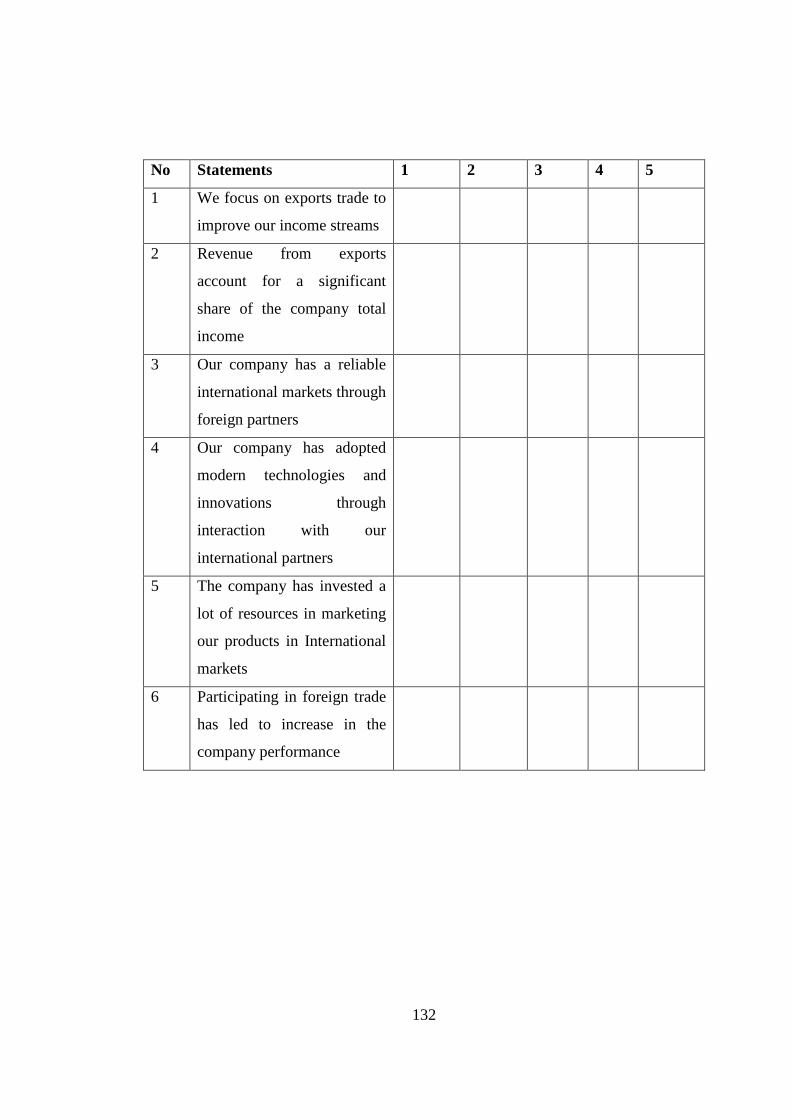


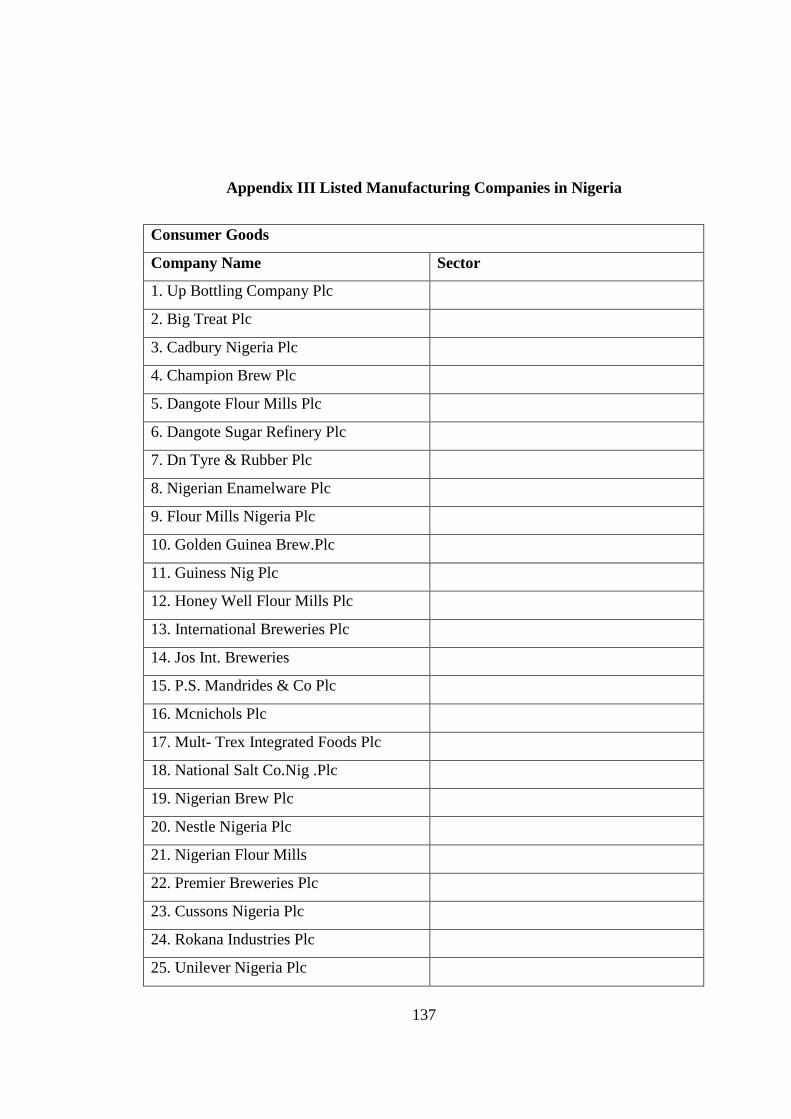


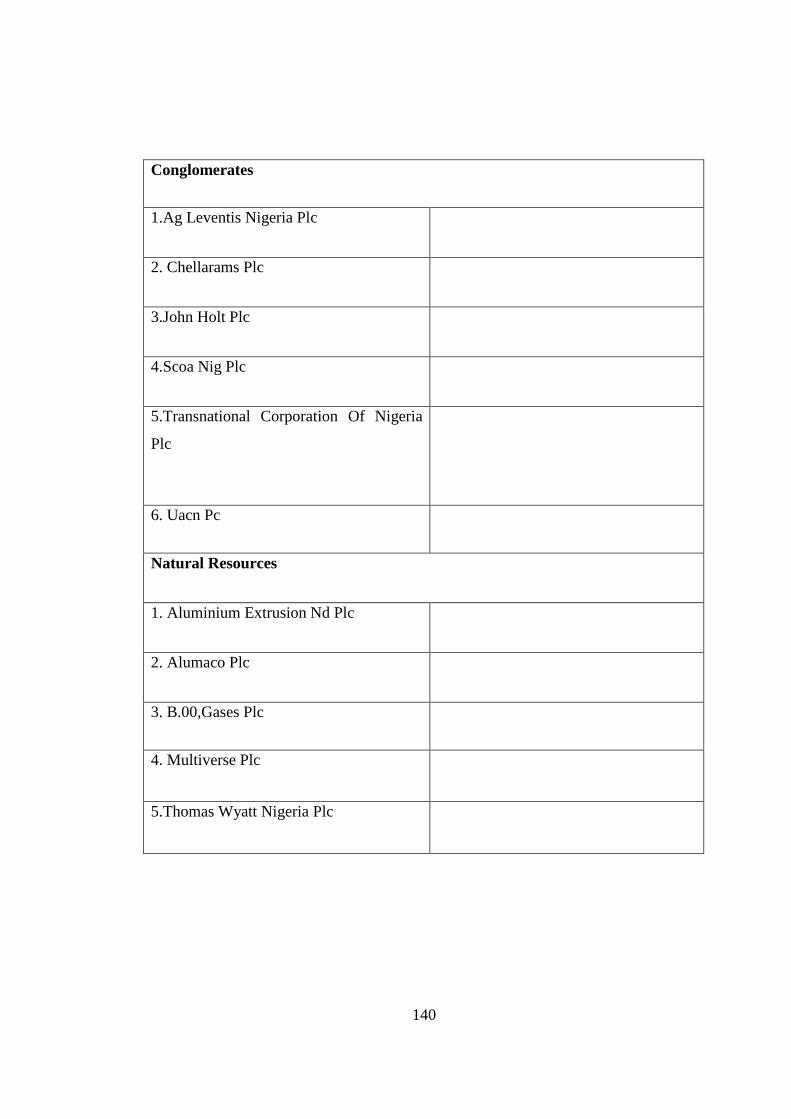


![[d], [o] If one doctor doctors another doctor does the doctor who doctors the doctor doctor the doctor the way the doctor he is doctoring doctors? Or.](https://static.documents.pub/doc/80x56/56649e995503460f94b9c732/d-o-if-one-doctor-doctors-another-doctor-does-the-doctor-who-doctors-the.jpg)


