27
1 Yale School of Management Price Impact Costs and the Limit of Arbitrage Zhiwu Chen Werner Stanzl Masahiro Watanabe
| Date post: | 22-Dec-2015 |
| Category: |
Documents |
| View: | 214 times |
| Download: | 0 times |

1
Yale School of Management
Price Impact Costs and the Limit of Arbitrage
Zhiwu ChenWerner Stanzl
Masahiro Watanabe

Arbitrageur PriceAnomalies

3
Yale School of Management
Market Anomalies
Size effect (Banz, 1981; Fama & French, 1993)Smaller size, larger returns Long small-size & short big-size stocks
B/M (value) effect (Basu, 1983; FF 1993Lakonishok et al., 1994; LaPorta et al.,
1997)Higher B/M, greater returns Long high-B/M & short low-B/M stocks
Momentum (Levy, 1967; Jegadeesh & Titman, 1993 & 2001)Return continuation Long past winners & short past losers

4
Yale School of Management
Empirical Price Impact Literature
Linear Price ImpactBreen, Hodrick & Korajczyk (2001)Sadka (2002)
Nonlinear (Concave) Price ImpactHasbrouck (1991)Hausman, Lo & MacKinlay (1992)Keim and Madhavan (1996)Knez and Ready (1996)

5
Yale School of Management
Data
TAQ Price impact estimation1/1993-6/1993: Oldest available
CRSP Return & portfolio formation7/1963-12/2001: Covers Fama & French(1993) and Jegadeesh & Titman (1993)
Compustat Accounting information4th Quarter, 1962 - 4th Qtr, 2001
TASSEstimation of actual hedge fund sizeCovers 1330 hedge funds as of 5/2000

6
Yale School of Management
Estimation of Price-Impact Function
Price Impact
where Qt = Quote midpoint at transaction time t
Vt = Dollar trading volume at t
Nonlinearity b/w log ( = 0) & linear ( = 1) functions inclusive
The only method that can be applied to almost all stocks without overfitting to outliers
Nonlinear least squares, purchases and sales separately
Matching & trade direction: Lee & Ready (1991) Method
Discard the top one-percentile trades
tt
t
ttt
Vba
Q
QQPI
11

7
Yale School of Management
Overfitting problem except for the Box-Cox model
Example: FHTFigure 1

8
Yale School of Management
Estimated Price ImpactsFigure 2

9
Yale School of Management
GE KO BONT CSII S INGR MIKE
(a) BuysNobs 23,265 23,157 518 1,212 10,826 2,329 4,704 aB (×10-3) -0.020 -0.060 -5.28 -3.89 -0.13 -0.49 -0.78
(-1.34) (-3.71) (-2.75) (-5.11) (-3.07) (-1.99) (-6.69)bB (×10-4) 0.00308 0.0109 6.53 4.91 0.0379 0.770 0.940
(2.27) (3.20) (3.04) (5.69) (2.27) (2.77) (7.91)B 0.468 0.410 0.000 0.000 0.302 0.000 0.000
(12.51) (15.05) (--) (--) (7.97) (--) (--)
(b) SellsNobs 25,543 25,029 523 692 16,368 1,710 4,362 aS (×103) 0.018 -0.020 -1.37 -2.83 -0.030 -0.87 -0.30
(2.49) (-1.50) (-0.70) (-2.47) (-1.65) (-3.05) (-2.36)bS (×104) 0.000774 0.00406 2.74 3.72 0.00392 1.20 0.47
(1.95) (3.13) (1.30) (3.01) (2.38) (3.83) (3.68)S 0.575 0.499 0.000 0.000 0.502 0.000 0.000 (13.17) (18.11) (--) (--) (13.79) (--) (--)
Estimates for Individual StocksTable 2

10
Yale School of Management
Box-Cox vs. Linear PI FunctionsFigure 3

11
Yale School of Management
Linear vs. Nonlinear PI FunctionsTicker Symbol
GE KO BONT CSII S INGR MIKENobs
23,265
23,157
518
1,212
10,826
2,329
4,704
B (×10-4) 0.614 0.822 3.464 1.288 1.394 1.467 1.200
(24.22) (21.81) (1.11) (1.16) (23.12) (3.57) (6.83)
B (×10-8) 0.0455 0.0829 1.075 2.657 0.0631 0.2690 0.0403
(37.04) (42.43) (0.90) (4.02) (27.56) (1.77) (1.64)
(a) Price impact from $50,000 trade (bp) Linear 0.84 1.24 8.84 14.57 1.71 2.81 1.40 Box-Cox 0.83 1.62 17.85 14.23 1.87 3.43 2.37 Difference 0.01 -0.38 -9.01 0.35 -0.16 -0.62 -0.97
(b) Price impact from $300,000 trade (bp) Linear 1.98 3.31 35.72 80.99 3.29 9.54 2.41 Box-Cox 2.20 4.05 29.55 23.02 4.24 4.81 4.05 Difference -0.22 -0.74 6.17 57.97 -0.96 4.73 -1.65
Table 3

12
Yale School of Management
Table 4
For both buys and sells,Slope coefficient b decreases with sizeConcavity coefficient has a U-shape
Portfolio PI Functions by Size
Size aB(x10-3) bB(x10-4) B aS(x10-3) bS(x10-4) SSmall -1.98 4.56 0.245 -0.16 2.41 0.285
2 -1.95 3.15 0.198 -1.16 2.29 0.206
3 -1.69 2.48 0.155 -1.13 2.03 0.160
4 -1.65 2.53 0.121 -1.13 2.03 0.157
5 -1.53 2.44 0.113 -1.10 2.00 0.148
6 -1.59 2.33 0.108 -1.41 2.26 0.108
7 -1.52 2.10 0.108 -1.24 1.89 0.137
8 -1.22 1.49 0.133 -1.19 1.61 0.119
9 -1.00 1.11 0.168 -0.99 1.21 0.162
Big -0.19 0.22 0.268 -0.25 0.35 0.239

13
Yale School of Management
Figure 4
Buy trades have positive price impacts, sells negativeAbsolute price impact increases with the size of tradePrice impact monotonically decreases with firm size
Price Impacts by Size Decile

14
Yale School of Management
Implementation of Strategies
Set up a long-short portfolio based on each strategyMeasure excess return after cost, where volume to
compute PIs converted to year 1993 dollarsSince price impact increases in fund size, there is a
maximal fund size at which
excess return after cost = 0The maximal fund size reported in year 2001 dollars

15
Yale School of Management
Portfolios are formed annually, semiannually, or quarterly
Value of long position = Value of short position
Rebalance when stocks are either added to or dropped from a
portfolio; also when weights change
Commisions: 15 bp for purchases and sales
25 bp for short-selling
Short-sale rebate: 80% of Fed Fund Rate
Maximum $ volume / trade: 1% of market cap
Maximum holding: 5% of market cap
Investment Strategy Criteria

16
Yale School of Management
Initial fund size: 0
At the beginning of period t1, investbt = t-1 – PILt – PISt – TCLt – TCSt
Volume to compute PIs converted to year 1993 dollarsAt the end of period t,
t = (1 + rl,t – rs,t+ 0.8 rFF,t) bt Excess return after cost
Rt = t / t-1 – 1 – rFF,t Break-even fund size
Below, 0 is reported in year 2001 dollars
}0)(RT
1|0sup{
1 0t0 T
t
Portfolio Accounting

17
Yale School of Management
Size StrategyMean
Excess Standard Sharpe Return (t-stat) Deviation Max / Min Ratio
Size 0.067 (1.36) 0.265 0.733 / -0.369 0.252Strategy [0.058] [(1.46)] [0.247] [0.733 / -0.369] [0.236]CRSP 0.092 (1.67) 0.295 0.972 / -0.473 0.311
Equally Weighted [0.093] [(2.24)] [0.259] [0.972 / -0.473] [0.358]
Arbitrage MeanFund Excess Standard Sharpe Mean Price Mean Mean Price Mean Size Return (t-stat) Deviation Max / Min Ratio Impact Turnover Impact Turnover1M 0.059 (1.21) 0.263 0.722 / -0.373 0.225 0.004 0.661 0.001 0.542
[0.051] [(1.28)] [0.245] [0.722 / -0.373] [0.207] [0.004] [0.649] [0.001] [0.530]10M 0.053 (1.10) 0.261 0.714 / -0.376 0.204 0.008 0.663 0.001 0.544
[0.045] [(1.14)] [0.244] [0.714 / -0.376] [0.185] [0.008] [0.651] [0.001] [0.533]100M 0.043 (0.90) 0.259 0.698 / -0.381 0.167 0.016 0.667 0.002 0.549
[0.036] [(0.91)] [0.242] [0.698 / -0.381] [0.148] [0.016] [0.655] [0.002] [0.538]500M 0.032 (0.68) 0.256 0.680 / -0.386 0.126 0.025 0.671 0.003 0.554
[0.025] [(0.66)] [0.239] [0.680 / -0.386] [0.107] [0.023] [0.659] [0.003] [0.543]1B 0.026 (0.56) 0.254 0.670 / -0.389 0.103 0.029 0.674 0.004 0.557
[0.020] [(0.52)] [0.237] [0.670 / -0.389] [0.084] [0.028] [0.661] [0.003] [0.546]5B 0.008 (0.18) 0.249 0.637 / -0.397 0.034 0.043 0.682 0.005 0.566
[0.004] [(0.10)] [0.233] [0.637 / -0.397] [0.016] [0.040] [0.668] [0.005] [0.554]7B 0.004 (0.08) 0.248 0.628 / -0.398 0.016 0.046 0.684 0.006 0.568
[0.000] [(-0.01)] [0.232] [0.628 / -0.398] [-0.001] [0.043] [0.670] [0.005] [0.556]9B 0.000 (0.01) 0.247 0.621 / -0.400 0.001 0.049 0.685 0.006 0.570
[-0.003] [(-0.09)] [0.231] [0.621 / -0.400] [-0.015] [0.045] [0.671] [0.005] [0.558]10B -0.001 (-0.03) 0.247 0.618 / -0.401 -0.005 0.050 0.686 0.006 0.570
[-0.005] [(-0.13)] [0.230] [0.618 / -0.401] [-0.021] [0.047] [0.672] [0.006] [0.559]
Long Portfolio Short Portfolio
(b) Equally Weighted, with Costs
(a) Equally Weighted, without Costs
Table 5
Huge, but is this really attainable?

18
Yale School of Management
Realistically implemented size strategies will not accommodate more than several hundred million dollars
Trading and Holding RestrictionsFigure 5

19
Yale School of Management
The potential benefit of “fine tuning” does not cover higher price impact costs
Higher Rebalancing FrequenciesFigure 6

20
Yale School of Management
Book-to-Market StrategyTable 7
MeanExcess Standard Sharpe Return (t-stat) Deviation Max / Min Ratio
B/M 0.093 (3.57) 0.139 0.320 / -0.234 0.664Strategy [0.093] [(3.76)] [0.152] [0.320 / -0.272] [0.610]CRSP 0.092 (1.67) 0.295 0.972 / -0.473 0.311
Equally Weighted [0.093] [(2.24)] [0.259] [0.972 / -0.473] [0.358]
Arbitrage MeanFund Excess Standard Sharpe Mean Price Mean Mean Price Mean Size Return (t-stat) Deviation Max / Min Ratio Impact Turnover Impact Turnover1M 0.061 (2.30) 0.142 0.296 / -0.254 0.428 0.013 1.030 0.012 0.984
[0.061] [(2.45)] [0.153] [0.296 / -0.304] [0.397] [0.013] [0.970] [0.012] [0.985]10M 0.037 (1.37) 0.145 0.280 / -0.268 0.254 0.024 1.046 0.022 0.999
[0.038] [(1.53)] [0.155] [0.280 / -0.320] [0.248] [0.022] [0.985] [0.021] [0.999]50M 0.013 (0.45) 0.151 0.267 / -0.280 0.084 0.035 1.067 0.032 1.018
[0.017] [(0.64)] [0.159] [0.267 / -0.333] [0.104] [0.032] [1.001] [0.030] [1.014]90M 0.002 (0.07) 0.155 0.262 / -0.305 0.013 0.040 1.077 0.036 1.028
[0.007] [(0.28)] [0.162] [0.262 / -0.337] [0.045] [0.036] [1.010] [0.034] [1.022]100M 0.000 (0.00) 0.156 0.262 / -0.313 0.000 0.040 1.079 0.037 1.030
[0.006] [(0.21)] [0.163] [0.262 / -0.338] [0.035] [0.037] [1.012] [0.035] [1.023]300M -0.023 (-0.73) 0.170 0.254 / -0.418 -0.135 0.051 1.110 0.047 1.057
[-0.014] [(-0.48)] [0.174] [0.254 / -0.418] [-0.079] [0.046] [1.035] [0.043] [1.045]
(a) Equally Weighted, without Costs
(b) Equally Weighted, with Costs
Long Portfolio Short Portfolio
21
Yale School of Management
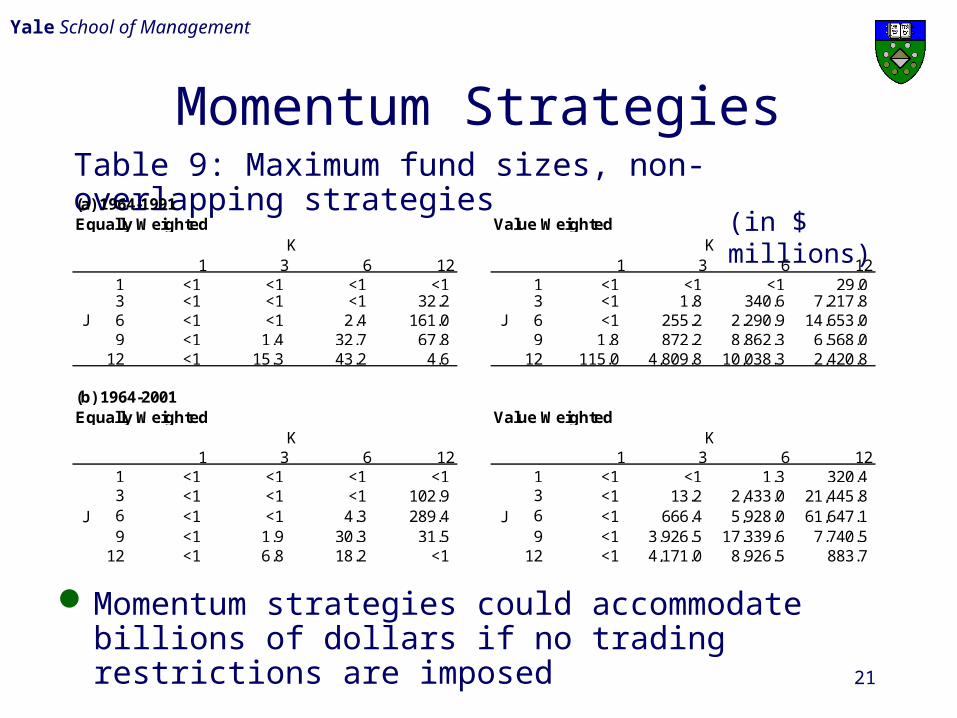
Momentum StrategiesTable 9: Maximum fund sizes, non-overlapping strategies
Momentum strategies could accommodate billions of dollars if no trading restrictions are imposed
(in $ millions)
1 3 6 12 1 3 6 121 <1 <1 <1 <1 1 <1 <1 <1 29.0 3 <1 <1 <1 32.2 3 <1 1.8 340.6 7,217.8
J 6 <1 <1 2.4 161.0 J 6 <1 255.2 2,290.9 14,653.0 9 <1 1.4 32.7 67.8 9 1.8 872.2 8,862.3 6,568.0
12 <1 15.3 43.2 4.6 12 115.0 4,809.8 10,038.3 2,420.8
1 3 6 12 1 3 6 121 <1 <1 <1 <1 1 <1 <1 1.3 320.4 3 <1 <1 <1 102.9 3 <1 13.2 2,433.0 21,445.8
J 6 <1 <1 4.3 289.4 J 6 <1 666.4 5,928.0 61,647.1 9 <1 1.9 30.3 31.5 9 <1 3,926.5 17,339.6 7,740.5
12 <1 6.8 18.2 <1 12 <1 4,171.0 8,926.5 883.7
KK
KValue WeightedEqually Weighted
(a) 1964-1991
Equally Weighted Value Weighted(b) 1964-2001
K

22
Yale School of Management
At a glance…Table 6 Rebalancing (in $ millions)
frequency Equally Weighted Value WeightedSize Strategy Annual 9,173.1 421.0
[6841.4] [129.8]Semiannual 3,812.7 173.2
[4384.0] [75.0]Quarterly 634.0 16.6
[827.3] [8.2]B/M Strategy Annual 100.17 <1
[158.5] [<1]Semiannual 25.78 <1
[69.2] [<1]Quarterly 12.01 <1
[23.0] [<1]Size-B/M Annual 768.6 758.9 Combined [1395.9] [636.5]Strategy Semiannual 294.6 208.6
[946.9] [325.0]Quarterly 44.4 17.7
[175.1] [37.4]Momentum Annual 4.6 2,420.8 Strategy [<1] [883.7]
Semiannual 2.4 2,290.9 [4.3] [5928.0]
Quarterly <1 1.8 [<1] [13.2]

23
Yale School of Management
Size-B/M Combined Strategy (Table 10)Smaller break-even fund sizes than the size-only strategy
because of higher turnover in the long positionBecause of this and the smaller # stocks in both the long
and short positions, the 1% trade-size and 5% position-size restrictions will make the fund sizes even smaller than those for size-only strategies in Figure 5
No-small-stock B/M Strategy (Table 11)Restricts the available stocks to only those in the biggest 5
decilesMediocre performance, due to much lower returns before
cost than with all stocks
Combined/No-small-stock Strategies

24
Yale School of Management
No-small-stock Momentum Strategy
Arbitrage MeanFund Excess Standard Sharpe Mean Price Mean Mean Price Mean Size Return (t-stat) Deviation Max / Min Ratio Impact Turnover Impact Turnover10M 0.036 (0.94) 0.203 0.486 / -0.387 0.178 0.006 1.798 0.006 1.786
[0.037] [(0.84)] [0.269] [0.809 / -0.816] [0.138] [0.006] [1.765] [0.006] [1.778]100M 0.026 (0.69) 0.201 0.469 / -0.395 0.130 0.011 1.805 0.010 1.794
[0.027] [(0.62)] [0.266] [0.795 / -0.818] [0.103] [0.010] [1.773] [0.010] [1.786]1B 0.004 (0.12) 0.199 0.442 / -0.462 0.022 0.020 1.826 0.020 1.816
[0.008] [(0.19)] [0.264] [0.777 / -0.820] [0.030] [0.019] [1.790] [0.019] [1.804]3B -0.025 (-0.66) 0.198 0.430 / -0.561 -0.124 0.033 1.857 0.034 1.847
[-0.014] [(-0.33)] [0.264] [0.774 / -0.821] [-0.055] [0.028] [1.813] [0.029] [1.828]
Long Portfolio Short Portfolio
(f) Value Weighted, with Costs and 1% Market-Capital Per-trade Restriction
Table 12, VW 12/12 non-overlapping strategy
Still works.Both the EW & VW strategies accommodate b/w $1
and 3 billions with the 1% trade-size restriction.

25
Yale School of Management
Actual Hedge Fund SizeTable 13
Size (in millions of dollars)Style #funds %total Mean Minimum Maximum SumTop down macro 362 27.4% 241.4 0.0147 4,122.0 87,396.0Bottom up approach 694 52.6% 195.0 0.1898 23,474.4 135,306.2Short selling 524 39.7% 201.1 0.0147 4,618.1 105,362.6Long bias 443 33.6% 181.1 0.3780 23,474.4 80,217.2
Market neutral 313 23.7% 152.0 0.0147 4,122.0 47,563.9Opportunities 498 37.8% 139.0 0.1100 23,474.4 69,206.0Relative value 360 27.3% 183.0 0.0147 10,194.0 65,862.1Arbitrage 408 30.9% 137.3 0.0602 23,474.4 56,018.6Discretionary 275 20.8% 101.1 0.0147 23,474.4 27,803.3Trend follower 201 15.2% 72.7 0.3384 3,958.9 14,603.4Technical 401 30.4% 74.9 0.0147 23,474.4 30,036.8Fundamental 702 53.2% 169.5 0.1898 4,618.1 118,957.1Systematic 323 24.5% 83.4 0.0602 10,194.0 26,940.0Diverse 354 26.8% 140.2 0.0147 23,474.4 49,646.3Other 153 11.6% 98.6 0.0147 23,474.4 15,087.2Total 1319 100.0% 139.9 0.0147 23,474.4 184,492.4

26
Yale School of Management
Price impact reduces returns substantially
For size and B/M strategies, only about one hundred million
dollars can be accommodated under realistic trading
restrictions
This is marginal compared to the actual hedge fund size
However, some momentum strategies may be implemented
profitably with about one billion dollars
Market is minimally efficient to allow for size & B/M
anomaly; persistence of momentum is still a challenge
Conclusions

27
Yale School of Management
“Working” the order
VWAP
Time variation in liquidity suggests change
in price impacts
Change in other costs (bid-ask spread, short
sale carry cost, transactions fees)
Future Research


