Page 1
ON THE USE OF MARKER STRATEGY DESIGN TO DETECT PREDICTIVE
MARKER EFFECT IN CANCER IMMUNOTHERAPY
Yan Han
Submitted to the faculty of the University Graduate School in partial fulfillment of the requirements
for the degree Master of Science
in the Department of Biostatistics, Indiana University
June 2019
Page 2
ii
Accepted by the Graduate Faculty of Indiana University, in partial fulfillment of the requirements for the degree of Master of Science.
Master's Thesis Committee
______________________________________ Sha Cao, PhD, Chair
______________________________________ Ying Zhang, PhD
______________________________________
Chi Zhang, PhD
______________________________________
Giorgos Bakoyannis, PhD
Page 3
iii
© 2019
Yan Han
Page 4
iv
ACKNOWLEDGEMENT
I would like to thank sincerely Dr. Sha Cao, my thesis supervisor, for her
supervision. Her wealth of knowledge and research experience are crucial for the
completion of my thesis project.
I also would like to thank Dr. Ying Zhang. The book “Fundamentals of
Biostatistics Seventh Edition” that he introduced to me helped me entering into the field
of biostatistics smoothly. The completion of my master’s study would not be possible
without his continuous and unlimited support and invaluable advice.
I also thank Dr. Chi Zhang for giving me the opportunity to learn in his group and
apply the theory in the class into practice, which is invaluable for preparing me for the
future jobs. Thanks are also given to Dr. Ziyue Liu, Dr. Huiping Xu, Dr. Giorgos
Bakoyannis, Dr. Zuofeng Shang and Dr. Honglang Wang for their patient and
knowledgeable teaching.
Last but not least, I would like to dedicate this thesis to my husband Yong Zang
and my parents. They constantly understood, supported and encouraged me throughout
my study.
Page 5
v
Yan Han
ON THE USE OF MARKER STRATEGY DESIGN TO DETECT PREDICTIVE
MARKER EFFECT IN CANCER IMMUNOTHERAPY
The marker strategy design (MSGD) has been proposed to assess and validate
predictive markers for targeted therapies and immunotherapies. Under this design,
patients are randomized into two strategies: the marker-based strategy, which treats
patients based on their marker status, and the non-marker-based strategy, which
randomizes patients into treatments independent of their marker status in the same way as
in a standard randomized clinical trial. The strategy effect is then tested by comparing the
response rate between the two strategies and this strategy effect is commonly used to
evaluate the predictive capability of the markers. We show that this commonly used
between-strategy test is flawed, which may cause investigators to miss the opportunity to
discover important predictive markers or falsely claim an irrelevant marker as predictive.
Then we propose new procedures to improve the power of the MSGD to detect the
predictive marker effect. One is based on a binary response endpoint; the second is based
on survival endpoints. We conduct simulation studies to compare the performance of the
MSGD with the widely used marker stratified design (MSFD). Numerical studies show
that the MSGD and MSFD has comparable performance. Hence, contrary to popular
belief that the MSGD is an inferior design compared with the MSFD, we conclude that
using the MSGD with the proposed tests is an efficient and ethical way to find predictive
markers for targeted therapies.
Sha Cao, PhD, Chair
Page 6
vi
TABLE OF CONTENTS
List of Tables.................................................................................................................vii
List of Figures ............................................................................................................. viii
List of Abbreviations ...................................................................................................... ix
1. Introduction ................................................................................................................. 1
2. Deficiency of the between-strategy test ........................................................................ 6
3. New tests for detecting the predictive marker effect ..................................................... 9
3.1 Binary endpoint.................................................................................................... 9
3.2 Survival endpoint ............................................................................................... 10
4. Simulation studies...................................................................................................... 12
5. Conclusion................................................................................................................. 18
Appendixes.................................................................................................................... 20
Appendix A ............................................................................................................. 20
Appendix B ............................................................................................................. 21
References ..................................................................................................................... 22
Curriculum Vitae
Page 7
vii
LIST OF TABLES
Table 1: Examples to illustrate the deficiency of the between-strategy test ....................... 7
Table 2: Type I error rate and power (%) of the MSGD for evaluating the predictive
marker effect under the proposed approach (pro.) and the between-strategy (str.)
comparison when the outcome is a binary endpoint and n=200 ...................................... 13
Table 3: Type I error rate and power (%) of the MSGD for evaluating the predictive
marker effect under the proposed approach (pro.) and the between-strategy (str.)
comparison when the outcome is a survival endpoint and n=200.................................... 14
Table 4: Type I error rate, power (%) and the number of response (in brackets) of the
MSGD and MSFD for evaluating the predictive marker effect under the between
-strategy test and proposed test when the outcome is a binary response endpoint ........... 16
Table 5: Type I error rate, power (%) and median survival month (in brackets) of the
MSGD and MSFD for evaluating the predictive marker effect under the between
-strategy test and proposed test when the outcome is a survival response endpoint. ........ 17
Page 8
viii
LIST OF FIGURES
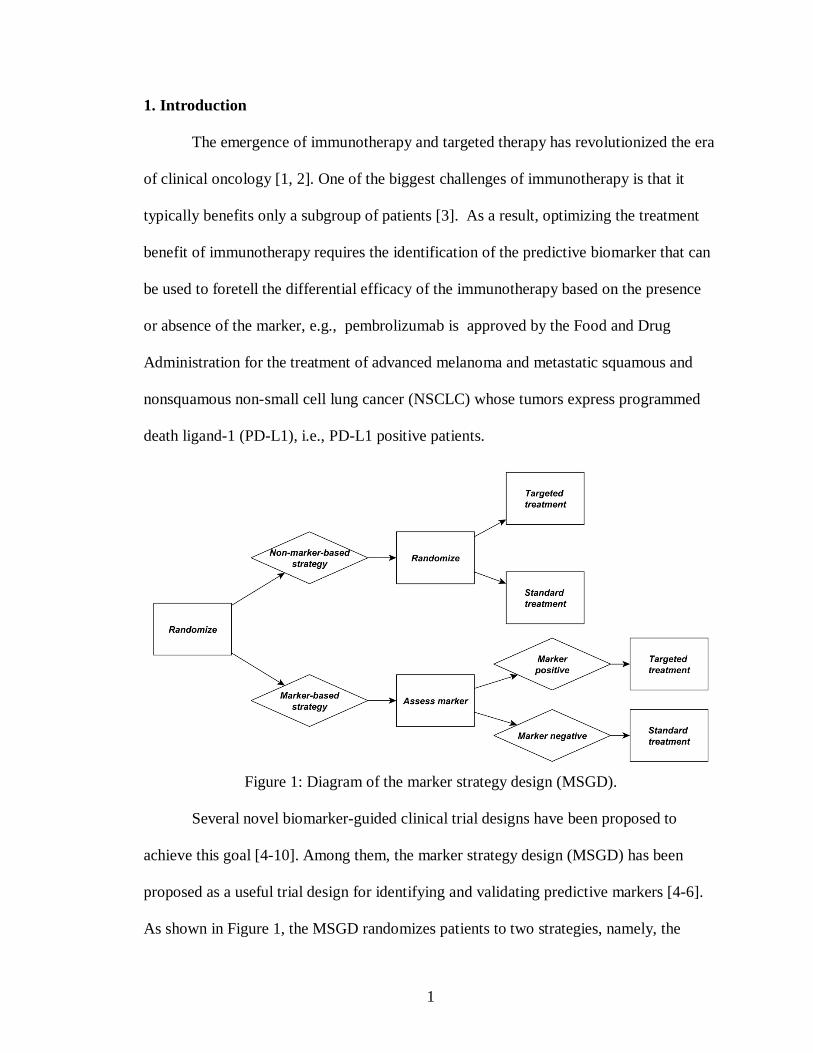
Figure 1: Diagram of the marker strategy design (MSGD). .............................................. 1
Figure 2: Diagram of the marker stratified design (MSFD). ............................................. 2
Page 9
ix
LIST OF ABBREVIATIONS
NSCLC non-small cell lung cancer
PD-L1 programmed death ligand-1
MSGD marker strategy design
MSFD marker stratified design
ERCC1 excision repair cross-complementing 1
Page 10
1
1. Introduction
The emergence of immunotherapy and targeted therapy has revolutionized the era
of clinical oncology [1, 2]. One of the biggest challenges of immunotherapy is that it
typically benefits only a subgroup of patients [3]. As a result, optimizing the treatment
benefit of immunotherapy requires the identification of the predictive biomarker that can
be used to foretell the differential efficacy of the immunotherapy based on the presence
or absence of the marker, e.g., pembrolizumab is approved by the Food and Drug
Administration for the treatment of advanced melanoma and metastatic squamous and
nonsquamous non-small cell lung cancer (NSCLC) whose tumors express programmed
death ligand-1 (PD-L1), i.e., PD-L1 positive patients.
Figure 1: Diagram of the marker strategy design (MSGD).
Several novel biomarker-guided clinical trial designs have been proposed to
achieve this goal [4-10]. Among them, the marker strategy design (MSGD) has been
proposed as a useful trial design for identifying and validating predictive markers [4-6].
As shown in Figure 1, the MSGD randomizes patients to two strategies, namely, the
Page 11
2
Figure 2: Diagram of the marker stratified design (MSFD).
marker-based strategy and the non-marker-based strategy. Patients randomized to the
marker-based strategy are treated (deterministically) based upon their biomarker statuses
(e.g., patients with a marker-positive status receive the targeted treatment and those with
a marker-negative status receive the standard treatment). Patients randomized to the non-
marker-based strategy are further randomized to different treatments independent of their
marker statuses. Although measuring the biomarker profiles of patients randomized to the
non-marker-based strategy is not required, in practice we often do so, prospectively or
retrospectively, for the purpose of biomarker discovery and other correlation studies. In
this article, we assume that the biomarker is measured for all patients in the trial. A
series of clinical trials [11-13] has adopted the MSGD for evaluating and validating
predictive marker effects. For example, by using the MSGD, the excision repair cross-
Page 12
3
complementing 1 (ERCC1) trial [11] found that the ERCC1 mRNA expression level
might be a predictive marker for treating non-small cell lung cancer (NSCLC) patients
with docetaxle plus gemcitabine (the p-value = 0.02) based on 444 patients with stage-IV
NSCLC.
In addition to the MSGD, another biomarker-guided clinical trial design which
has been widely used to identify and validate the predictive marker is the marker
stratified design (MSFD) [4-6]. As shown in Figure 2, the MSFD stratifies patients into
different subgroups based on the patients' biomarker profile and then randomizes the
patients to receive either the targeted treatment or the standard treatment within each
subgroup. Under the MSFD, the predictive biomarker effect is typically evaluated by
comparing the difference in the treatment effects within the marker-positive subgroup to
those within the marker-negative subgroup [14]. Under the MSGD, however, the most
common approach to test the predictive marker is to compare the response rate (or hazard
for survival outcome) between the marker-based and non-marker-based strategies using a
t test (or log-rank test). If the response rate of the marker-based strategy is significantly
higher than that of the non-marker-based strategy, the marker is claimed as the predictive
marker. Mandrekar and Sargent [5] and Freidlin et al. [15] noted that the between-
strategy test has low statistical power to detect the predictive biomarker effect because a
certain proportion of patients will receive the same treatment regardless of their
assignment to the marker-based or non-marker-based strategies (e.g., some patients with
a marker-positive status in both strategies will receive the targeted treatment), thereby
diluting the differences between the two treatment strategies. Therefore, it is generally
believed that the MSGD design is an inferior design compared with the MSFD [15].
Page 13
4
In this thesis, we argue that the primary interest of MSGD is to evaluate the
between-strategy effect, which does not necessarily equal to the predictive effect defined
in the MSFD. Therefore, it is unfair to directly compare MSGD with MSFD as these two
designs target for different objects. Actually, if the predictive marker effect rather than
the between-strategy effect is the primary interest of a clinical trial, we prove in the
following content that the commonly used between-strategy test by MSGD is indeed
problematic. After that, we propose a new test to evaluate the true predictive marker
effect under MSGD. Finally, we conduct simulation studies to compare MSGD with
MSFD under the same definition of predictive marker. Our simulation results reveal that
contrary to popular belief, the MSGD is not an inferior design and has plausible
performance compared with the MSFD.
Our study is motivated by a colorectal cancer trial, which is being conducted at
the Indiana University Melvin and Bren Simon Cancer Center. The biomarker used in
this trial is the KRAS gene mutation. The MTA is a novel KRAS inhibitor and the
standard treatment is radiotherapy. This trial is conducted under the MSGD. A total of
210 patients with colorectal cancer are equally randomized to either the non-marker-
based strategy and marker-based strategy. Patients in the non-marker-based strategy are
further equally randomized to receive either the MTA or the standard treatment. Patients
in the marker-based strategy are treated according to their KRAS gene status. The
patients without the KRAS gene mutation receive the standard treatment whereas the
patients with the KRAS gene mutation receive the MTA. The purpose of this trial is to
evaluate whether the KRAS gene is a predictive marker for patients with colorectal
cancer. As the commonly used between-strategy test is problematic in detecting the
Page 14
5
predictive effect, novel test is required to evaluate such effect, which inspires the research
for this thesis.
Page 15
6
2. Deficiency of the between-strategy test
We first use two numerical examples to illustrate that the between-strategy test
adopted by the MSGD is fundamentally flawed to detect the predictive marker effect.
Suppose that the patient population of interest consists of 20% marker-positive (M+)
patients and 80% marker-negative (M-) patients. Assume that for the standard treatment,
the response rates for the M+ and M- patients are the same, at a value of 0.4; and for the
targeted treatment under investigation, the response rates for the M+ and M- patients are
0.8 and 0.5, respectively. Clearly, M is a predictive marker because the M+ patients
respond to the targeted treatment substantially more favorably than the M- patients.
Now, we look at the response rate in the marker-based strategy and the non-marker-based
strategy. As summarized in Table 1, in the marker-based strategy, M+ patients are
assigned to the targeted treatment, and M- patients are assigned to the standard treatment.
Thus, the overall average response rate for the marker-based strategy is 20%×0.8+ 80%×
0.4=0.48. In the non-marker-based strategy, patients are equally randomized into the
standard and targeted treatments. The average response rate is (0.8+0.4)/2=0.6 for the M+
patients and (0.5+0.4)/2=0.45 for the M- patients. Thus, the overall average response rate
for the non-marker-based strategy treatment arm is 20%×0.6+ 80%× 0.45=0.48, which is
the same as that of the marker-based strategy! This means that we will completely miss
the predictive marker effect if we take the approach of the commonly used between-
strategy test.
Page 16
7
Table 1: Examples to illustrate the deficiency of the between-strategy test.
Example 1: marker is predictive Example 2: marker is not predictive
Marker-based
strategy
Non-marker
based strategy
Marker-based
strategy
Non-marker
based strategy
Treatment M+
(20%)
M-
(80%)
M+
(20%)
M-
(80%)
M+
(20%)
M-
(80%)
M+
(20%)
M-
(80%)
Targeted 0.8 N/A 0.8 0.5 0.1 N/A 0.1 0.1
Standard N/A 0.4 0.4 0.4 N/A 0.4 0.4 0.4
Average 0.8 0.4 0.6 0.45 0.1 0.4 0.25 0.25
Overall 0.48 0.48 0.34 0.25
The between-strategy test can also mislead investigators to falsely conclude that a
marker is predictive when it actually is not. To see this, consider a case similar to the
above example, but now the marker is not predictive, with the response rate of the
targeted treatment being the same (0.1) for both the M+ and M- patients. In this case, as
shown in Table 1, the overall average response rate in the marker-based strategy is 0.34,
higher than the overall response rate in the non-marker-based strategy (i.e., 0.25). If we
use the between-strategy test, we will draw an incorrect conclusion that the marker is
predictive.
Mathematically, the deficiency of the between-strategy test stems from the fact
that the treatment effect evaluated by the between-strategy test is actually not the
predictive marker effect, except under certain restrictive conditions, as described in
Theorem 1. The proof is provided in Appendix.
Page 17
8
Theorem 1 Let φ be the marker positive prevalence. For the binary endpoint, the
between-strategy Z test is valid for testing the predictive marker effect only when φ=0.5;
and for the time-to-event endpoint, the between-strategy log-rank test is valid for testing
the predictive marker effect only when (1) there is no treatment effect or (2) there is no
prognostic effect and φ=0.5.
Page 18
9
3. New tests for detecting the predictive marker effect
3.1 Binary endpoint
In this section, we describe new procedures that are generally valid for the MSGD
to detect the predictive marker effect. We first consider the binary response outcome. Let
𝑝𝑝𝑗𝑗𝑗𝑗 denote the response rate for patients with marker status k who are receiving treatment
j, where k=+/- denotes marker-positive/-negative, and j=1/0 denotes the targeted/standard
treatment.
The treatment effects of the targeted agent (with respect to the standard treatment
as a control) are given by 𝑝𝑝1+ − 𝑝𝑝0+ and 𝑝𝑝1− − 𝑝𝑝0− for M+ and M- patients, respectively.
The predictive marker effect is defined as𝜃𝜃 = (𝑝𝑝1+ − 𝑝𝑝0+) − (𝑝𝑝1− − 𝑝𝑝0−), i.e., the
difference in the treatment effect between M+ and M- patients, with 𝜃𝜃 = 0 representing
that the marker is not predictive. We notice that this definition has also been used by the
MSFD to define the predictive marker effect [4, 14]. Our goal here is to test 𝐻𝐻0: 𝜃𝜃 = 0
versus 𝐻𝐻1: 𝜃𝜃 ≠ 0. We also aware that the definition of the predictive marker effect is not
unique. Indeed, the predictive marker effect can also be defined as a treatment-marker
interaction term in a logistic model [16, 17], which is beyond the scope of this article.
Let �̂�𝑝𝑗𝑗𝑗𝑗 = 𝑚𝑚𝑗𝑗𝑗𝑗/𝑛𝑛𝑗𝑗𝑗𝑗 denote the observed response rate for patients with marker
status k who are receiving the treatment j, where 𝑛𝑛𝑗𝑗𝑗𝑗 is the number of patients having
marker status k who are receiving treatment j, and 𝑚𝑚𝑗𝑗𝑗𝑗 is the number of response among
𝑛𝑛𝑗𝑗𝑗𝑗 patients. We propose to evaluate the predictive marker effect for the MSGD using the
following Z test,
𝑍𝑍 =(�̂�𝑝1+ − �̂�𝑝0+) − (�̂�𝑝1− − �̂�𝑝0−)
��̂�𝑝1+(1 − �̂�𝑝1+)𝑛𝑛1+
+ �̂�𝑝0+(1− �̂�𝑝0+)𝑛𝑛0+
+ �̂�𝑝1−(1 − �̂�𝑝1−)𝑛𝑛1−
+ �̂�𝑝0−(1− �̂�𝑝0−)𝑛𝑛0−
Page 19
10
which asymptotically follows a standard normal distribution under the null hypothesis
that there is no predictive marker effect. Given a significance level of 𝛼𝛼, we declare that
M is a predictive marker if |𝑍𝑍| > 𝑧𝑧𝛼𝛼/2 where 𝑧𝑧𝛼𝛼/2 is the upper 𝛼𝛼/2 quantile of a standard
normal distribution.
It can be shown that under the alternative hypothesis 𝐻𝐻1: 𝜃𝜃 = 𝜃𝜃1, Z asymptotically
follows a non-central normal distribution 𝑁𝑁(𝜏𝜏, 1) where
𝜏𝜏 =2√𝑛𝑛𝜃𝜃1
�3φ𝑝𝑝1+(1− 𝑝𝑝1+) + φ𝑝𝑝0+(1− 𝑝𝑝0+) + (1 − φ)𝑝𝑝1−(1− 𝑝𝑝1−) + 3(1 − φ)𝑝𝑝0−(1− 𝑝𝑝0−)
Given the type I error α, the power of the test under 𝐻𝐻1 is given by
Pr �|𝑍𝑍| > �Ф−1 �𝛼𝛼2��� ≈ Ф(Ф−1 �𝛼𝛼
2�+ |𝜏𝜏|).
Hence, to achieve the power of 1-β, we require Ф−1 �𝛼𝛼2�+ |𝜏𝜏| = Ф−1(1 − 𝛽𝛽), leading to
the following sample size formula
𝑛𝑛 =14�Ф−1(1− 𝛽𝛽) −Ф−1 �
𝛼𝛼2��2
[3φ𝑝𝑝1+(1 − 𝑝𝑝1+) + φ𝑝𝑝0+(1− 𝑝𝑝0+) + (1− φ)𝑝𝑝1−(1
− 𝑝𝑝1−) + 3(1− φ)𝑝𝑝0−(1 − 𝑝𝑝0−)]
As most sample size calculations, the value of n depends on a variety of
parameters. The values of these parameters can be estimated from historical data or
provided by investigators based on their domain knowledge. If such prior information is
not available, a pilot study may be needed to obtain initial estimates of the parameters.
3.2 Survival endpoint
We now turn to the survival endpoints (e.g., progression-free survival or overall
survival). Let 𝜆𝜆𝑗𝑗𝑗𝑗 denote the hazard rate for the patients with D=j and M=k, and 𝜃𝜃+ =
log (𝜆𝜆1+/𝜆𝜆0+) and 𝜃𝜃− = log (𝜆𝜆1−/𝜆𝜆0−) denote the log hazard ratio between the targeted
Page 20
11
treatment and standard treatment for the M+ patients and M- patients, respectively. That
is, 𝜃𝜃+ and 𝜃𝜃− respectively represent the treatment effect of the targeted agent (with
respect to the standard treatment as the control) for the M+ patients and M- patients.
Then, the predictive marker effect can be defined as 𝜃𝜃 = 𝜃𝜃+ − 𝜃𝜃− with 𝜃𝜃 = 0
representing no predictive marker effect. We are interested in testing 𝐻𝐻0: 𝜃𝜃 = 0 versus
𝐻𝐻1: 𝜃𝜃 ≠ 0.
Let 𝑍𝑍�+ and 𝑍𝑍�− denote the standard log-rank test statistics of comparing the
targeted treatment versus the standard treatment for M+ and M- patients, respectively;
and let φ denote the prevalence of M+ patients. We propose to test the predictive
marker effect using the following weighted log rank test,
𝑍𝑍� = �1 − φ 𝑍𝑍�+ − � φ 𝑍𝑍�−
The asymptotic distribution of Z ̃ is described in Theorem 2. The proof is provided in
Appendix.
Theorem 2 Let ∆ be the total number of events. Test statistic 𝑍𝑍� asymptotically
follows 𝑁𝑁(0,1) under 𝐻𝐻0: 𝜃𝜃 = 0 (i.e., no predictive marker effect), and follows
𝑁𝑁(�3(1−φ)φ∆𝜃𝜃14
, 1) under 𝐻𝐻0: 𝜃𝜃 = 𝜃𝜃1.
Along the same line as the binary endpoint, given the type I error α and type II
error 𝛽𝛽, it can be shown that the sample size formula for the survival endpoint is
∆= 16[Ф−1(1−𝛽𝛽)−Ф−1(𝛼𝛼/2)]2
3𝜃𝜃12φ(1−φ).
Page 21
12
4. Simulation studies
We carried out simulation studies to compare the performance of the proposed
approaches with the commonly used between-strategy test under the MSGD. We
considered three cases: (1) the marker has no predictive effect, which corresponds to the
null scenario of no predictive marker effect; (2) the marker has only the predictive effect;
and (3) the marker has both predictive and prognostic effects. The prognostic effect is a
type of marker effect that is not affected by the treatment, e.g., tumor stage is often a
prognostic marker, and patients with higher stages have poor outcomes, regardless of the
treatment. Our purpose of the simulation was to evaluate the predictive marker effect
only. Hence, case (1) was used to evaluate the empirical type I error rate, and cases (2)
and (3) were used to evaluate the empirical power. Under each of the simulation
configurations, we conducted 10,000 simulated trials to evaluate the type I error rate and
power, with a nominal level of 5%.
Table 2 shows the results for the binary response outcome. The between-strategy
test generally led to inflated type I error rates except when φ=0.5. For example, when
φ=0.3, the response rate of the standard treatment is 0.1 for M+ and M- patients, the
response rate of the targeted treatment is 0.4 for M+ and M- patients, and the type I error
rate was inflated to $17.8%. In contrast, the proposed Wald test consistently yielded type
I error rates around the nominal level of 5%. In terms of power, the proposed test
significantly outperformed the between-strategy test. The power gain ranged from 30% to
50%, depending on the size of the predictive marker effect. For example, when the true
response rate of the standard treatment is 0.2 for M+ and M- patients and the true
response rates of the targeted treatment are 0.6 and 0.1 for M+ and M- patients, given that
Page 22
13
the prevalence of the M+ status is 30%, the power of the proposed test is 88.8%, while
that of the between-strategy test is merely 33.5%.
Table 2: Type I error rate and power (%) of the MSGD for evaluating the predictive
marker effect under the proposed approach (pro.) and the between-strategy (str.)
comparison when the outcome is a binary endpoint and n=200.
True response rate Prevalence of M+
Standard Targeted 30% 50% 70%
M+ M- M+ M- str. pro. str. pro. str. pro.
0.1 0.1 0.2 0.2 7.2 4.9 5.3 5.1 7.3 5.1
0.1 0.1 0.3 0.3 11.6 5.2 5.4 5.1 10.9 5.2
0.1 0.1 0.4 0.4 17.8 4.8 5.2 4.9 15.9 5.3
0.2 0.2 0.4 0.1 20.1 52.1 23.3 63.3 26.7 58.4
0.2 0.2 0.5 0.1 26.7 73.8 35.2 83.8 43.7 80.6
0.2 0.2 0.6 0.1 33.5 88.8 46.9 95.2 62.4 92.4
0.2 0.2 0.7 0.1 40.1 95.9 60.4 98.9 77.8 98.1
0.2 0.4 0.3 0.1 46.7 74.4 34.5 83.5 23.4 76.8
0.2 0.4 0.4 0.1 52.9 88.1 47.1 94.3 41.2 90.6
0.2 0.4 0.5 0.1 61.1 95.7 59.3 98.7 58.8 97.1
0.2 0.4 0.6 0.1 68.9 98.9 72.0 99.8 75.9 99.3
Table 3 shows the results for the survival endpoint. We use the exponential
distribution to generate the survival endpoint and specify a 20% censoring rate for each
patient. The simulation results for the survival endpoint were similar to those for the
Page 23
14
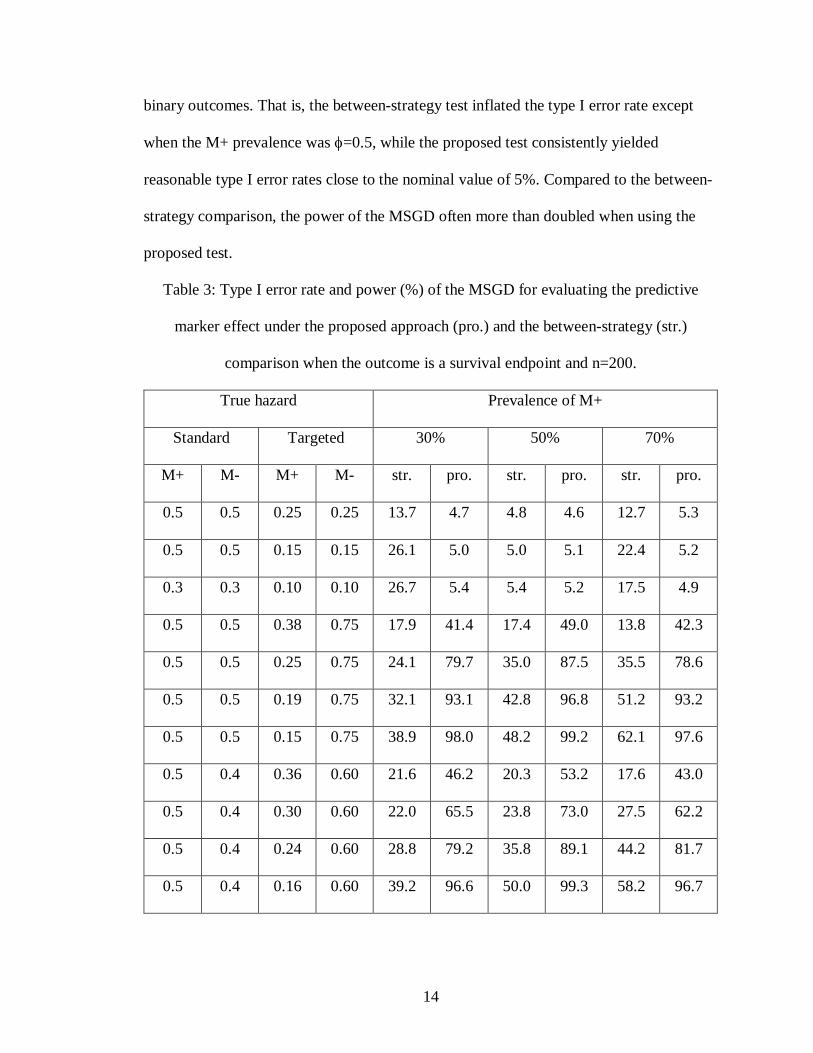
binary outcomes. That is, the between-strategy test inflated the type I error rate except
when the M+ prevalence was φ=0.5, while the proposed test consistently yielded
reasonable type I error rates close to the nominal value of 5%. Compared to the between-
strategy comparison, the power of the MSGD often more than doubled when using the
proposed test.
Table 3: Type I error rate and power (%) of the MSGD for evaluating the predictive
marker effect under the proposed approach (pro.) and the between-strategy (str.)
comparison when the outcome is a survival endpoint and n=200.
True hazard Prevalence of M+
Standard Targeted 30% 50% 70%
M+ M- M+ M- str. pro. str. pro. str. pro.
0.5 0.5 0.25 0.25 13.7 4.7 4.8 4.6 12.7 5.3
0.5 0.5 0.15 0.15 26.1 5.0 5.0 5.1 22.4 5.2
0.3 0.3 0.10 0.10 26.7 5.4 5.4 5.2 17.5 4.9
0.5 0.5 0.38 0.75 17.9 41.4 17.4 49.0 13.8 42.3
0.5 0.5 0.25 0.75 24.1 79.7 35.0 87.5 35.5 78.6
0.5 0.5 0.19 0.75 32.1 93.1 42.8 96.8 51.2 93.2
0.5 0.5 0.15 0.75 38.9 98.0 48.2 99.2 62.1 97.6
0.5 0.4 0.36 0.60 21.6 46.2 20.3 53.2 17.6 43.0
0.5 0.4 0.30 0.60 22.0 65.5 23.8 73.0 27.5 62.2
0.5 0.4 0.24 0.60 28.8 79.2 35.8 89.1 44.2 81.7
0.5 0.4 0.16 0.60 39.2 96.6 50.0 99.3 58.2 96.7
Page 24
15
In addition to the MSGD, the MSFD can also be used to evaluate the predictive
marker effect and it is popular belief that MSFD is much more powerful than the MSGD.
However, we argue that such conclusion is arbitrary because the original MSGD actually
evaluate the between-strategy effect. Therefore, to make a fair comparison, we conducted
simulation studies to compare the MSGD with MSFD by using the same test proposed in
this thesis. That is, both designs were targeted for the same predictive marker effect.
Also, the between-strategy test was also used for the MSGD for the purpose of power
comparison. In addition to the power evaluation, we also reported the number of response
(for the binary response) and the median survival month (for the survival outcome) to
investigate the individual ethics of these two designs.
Table 4 summarizes the simulation results for the binary response outcome with
n=200. In terms of power comparison, the MSGD is less powerful mainly because the
between-strategy test used. For example, given φ=0.3, when the true response rate of the
standard treatment is 0.2 for M+ and M- patients and the true response rates of the
targeted treatment are 0.4 and 0.1 for M+ and M- patients, if the between-strategy test is
used, the MSGD is 42.9% less powerful than the MSFD. On the other hand, if the
proposed test is used, then the MSGD is only 7% less powerful. Moreover, although the
MSGD was still 5% to 10% less powerful than the MSFD with the proposed method, this
design gets around 6 to 12 more patients’ response to the treatment, indicting the MSGD
a more ethical design. This is because the MSGD allocates patients to more effective
treatments based on their biomarker profiles in the marker-based strategy arm, thereby
enhancing the ethics of the trial. As a tradeoff, the randomization in the MSGD is less
balanced than the MSFD,
Page 25
16
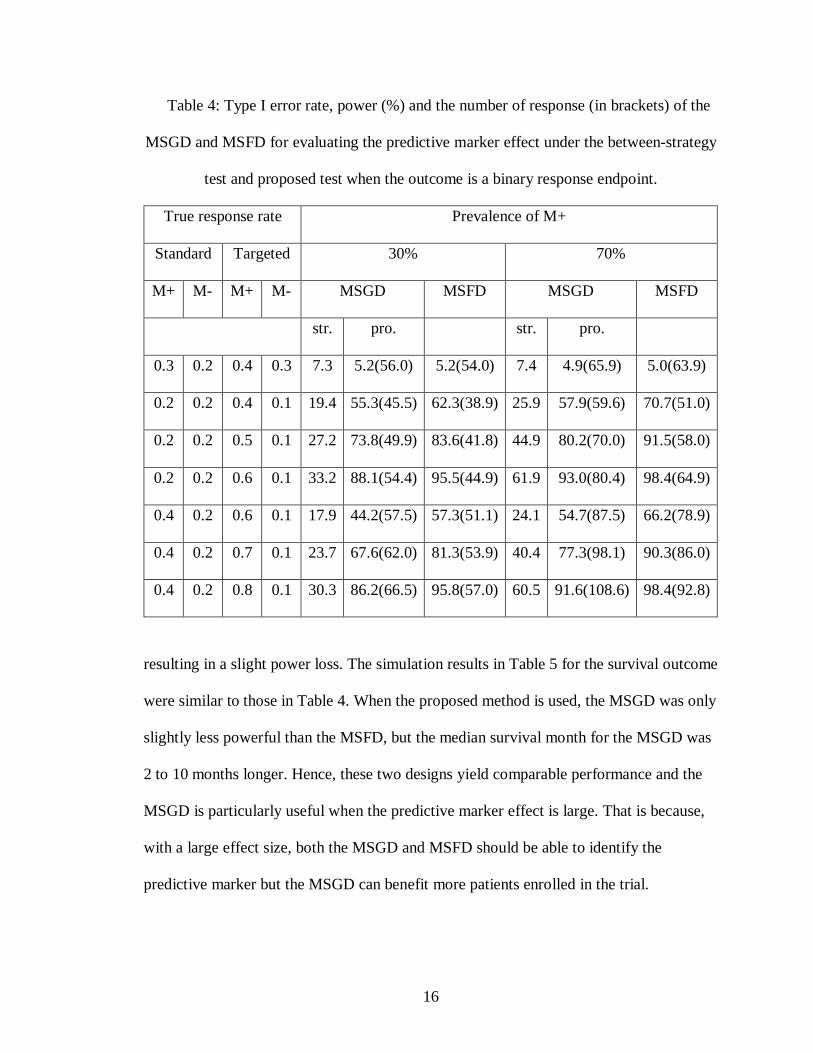
Table 4: Type I error rate, power (%) and the number of response (in brackets) of the
MSGD and MSFD for evaluating the predictive marker effect under the between-strategy
test and proposed test when the outcome is a binary response endpoint.
True response rate Prevalence of M+
Standard Targeted 30% 70%
M+ M- M+ M- MSGD MSFD MSGD MSFD
str. pro. str. pro.
0.3 0.2 0.4 0.3 7.3 5.2(56.0) 5.2(54.0) 7.4 4.9(65.9) 5.0(63.9)
0.2 0.2 0.4 0.1 19.4 55.3(45.5) 62.3(38.9) 25.9 57.9(59.6) 70.7(51.0)
0.2 0.2 0.5 0.1 27.2 73.8(49.9) 83.6(41.8) 44.9 80.2(70.0) 91.5(58.0)
0.2 0.2 0.6 0.1 33.2 88.1(54.4) 95.5(44.9) 61.9 93.0(80.4) 98.4(64.9)
0.4 0.2 0.6 0.1 17.9 44.2(57.5) 57.3(51.1) 24.1 54.7(87.5) 66.2(78.9)
0.4 0.2 0.7 0.1 23.7 67.6(62.0) 81.3(53.9) 40.4 77.3(98.1) 90.3(86.0)
0.4 0.2 0.8 0.1 30.3 86.2(66.5) 95.8(57.0) 60.5 91.6(108.6) 98.4(92.8)
resulting in a slight power loss. The simulation results in Table 5 for the survival outcome
were similar to those in Table 4. When the proposed method is used, the MSGD was only
slightly less powerful than the MSFD, but the median survival month for the MSGD was
2 to 10 months longer. Hence, these two designs yield comparable performance and the
MSGD is particularly useful when the predictive marker effect is large. That is because,
with a large effect size, both the MSGD and MSFD should be able to identify the
predictive marker but the MSGD can benefit more patients enrolled in the trial.
Page 26
17
Table 5: Type I error rate, power (%) and median survival month (in brackets) of the
MSGD and MSFD for evaluating the predictive marker effect under the between-strategy
test and proposed test when the outcome is a survival response endpoint.
True hazard Prevalence of M+
Standard Targeted 30% 70%
M+ M- M+ M- MSGD MSFD MSGD MSFD
str. pro. str. pro.
0.5 0.5 0.25 0.25 14.0 5.0(27.1) 4.8(25.2) 12.1 4.9(29.0) 5.3(26.9)
0.5 0.5 0.38 0.75 18.2 42.1(19.2) 51.8(17.3) 15.5 42.3(21.8) 51.6(19.9)
0.5 0.5 0.25 0.75 27.9 78.6(20.6) 89.0(18.2) 37.4 78.7(26.6) 88.3(22.8)
0.5 0.5 0.19 0.75 35.1 93.2(21.8) 98.3(19.0) 52.0 93.6(31.0) 98.0(25.0)
0.4 0.5 0.24 0.60 14.5 42.9(22.1) 52.1(20.6) 22.3 42.8(28.8) 51.3(25.9)
0.4 0.5 0.16 0.60 22.9 79.8(23.8) 89.1(21.6) 43.8 79.7(35.5) 89.2(29.5)
0.4 0.5 0.12 0.60 29.4 93.6(25.0) 98.2(22.1) 57.2 93.3(41.0) 98.1(31.9)
As a side note, our results also indicate that the criticism that the MSGD is an
inefficient design with low power to detect predictive markers [5, 15] is not completely
valid. Low statistical power is not an inherent deficiency of the MSGD design itself, but
simply caused by the use of an inappropriate statistical method (i.e., between-strategy
test). When adopting the proposed test procedures, the MSGD can have significantly
higher power to detect predictive markers.
Page 27
18
5. Conclusion
The MSGD has been used in clinical trials to evaluate predictive marker effects.
In this article, we show that, under the MSGD, the commonly used between-strategy test
for assessing the predictive marker effect is fundamentally flawed. Such an approach not
only suffers from low statistical power, but also potentially misleading results, e.g.,
falsely declaring that a marker is predictive when it is actually not. We propose new tests
to be used with the MSGD for detecting the predictive marker effects. Numerical studies
show that the proposed tests are generally valid and substantially more powerful than the
between-strategy tests. Equipping the MSGD with the proposed tests provides clinicians
a powerful design to detect predictive marker effects. Our simulation results also show
that compared with the MSFD, the true power reduction by using the MSGD is at most
10% but the MSGD is a more ethical design. Therefore, we conclude that the MSGD is
not an inferior design and is especially useful when the predictive marker effect is large.
The choice between the MSFD and MSGD depends on the trial setting and objectives. If
power is of the biggest concern, the MSFD might be preferred. If investigators are
interested in evaluating the real-world effect of the targeted therapy (i.e., the benefit of
personalizing treatment by patient's biomarkers versus treating patients without using
their biomarkers), the MSGD is clearly the choice. In addition, as the personalized
treatment component of the MSGD may increase patient enrollment and retention, the
MSGD is an attractive option when patient accrual is difficult, in particular given that the
power loss of the MSGD is generally minor.
We have focused on the case in which the marker is measured for all patients
prospectively or retrospectively. In principle, the MSGD does not require the
Page 28
19
measurement of the marker for the patients randomized to the non-marker-based strategy.
If this is the case, we can extend our methods to accommodate the missing marker
information, for example, using the expectation-maximum algorithm. These extensions
are statistically more involved and will be discussed elsewhere.
In conclusion, on the basis of the results of our study, the common approach of
using the between-strategy test to detect predictive markers is problematic and has caused
the misconception that the MSGD is an inefficient design with low statistical power. By
using the proposed testing procedures, the MSGD provides a powerful and ethical
clinical trial design to detect predictive markers.
Page 29
20
Appendixes
Appendix A: Proof of Theorem 1
We consider the binary endpoint first. For the equally randomized MSGD, the
response rate for the marker-based strategy is 𝑝𝑝1+φ + 𝑝𝑝0−(1 − φ) and the response rate
for the non-marker-based strategy is 0.5[(𝑝𝑝1+ + 𝑝𝑝0+)φ + (𝑝𝑝1− + 𝑝𝑝0−)(1− φ)]. Hence,
defining 𝜃𝜃∗ as the between-strategy difference, it can be expressed as 𝜃𝜃∗ =
0.5[(1− φ)𝜃𝜃 + (2φ− 1)(𝑝𝑝11 − 𝑝𝑝01)] and the conventional between-strategy method
indeed tests the hypothesis 𝐻𝐻0: 𝜃𝜃∗ = 0 versus 𝐻𝐻1: 𝜃𝜃∗ ≠ 0 since in general we have 𝑝𝑝11 ≠
𝑝𝑝01. As a result, when θ = 0, 𝜃𝜃∗ = 0 only if φ = 0.5. That is, the between-strategy test is
statistically valid only when the restrictive condition φ = 0.5 holds.
Similarly, for the survival endpoint, the hazard ratio at time t under the marker-
based strategy is
𝜆𝜆00𝑒𝑒−𝜆𝜆00𝑡𝑡(1 − φ) + 𝜆𝜆11𝑒𝑒−𝜆𝜆11𝑡𝑡φ𝑒𝑒−𝜆𝜆00𝑡𝑡(1− φ) + 𝑒𝑒−𝜆𝜆11𝑡𝑡φ
And the hazard ratio at time t under the non-marker-based strategy is
0.5𝜆𝜆00𝑒𝑒−𝜆𝜆00𝑡𝑡(1− φ) + 0.5𝜆𝜆01𝑒𝑒−𝜆𝜆01𝑡𝑡φ + 0.5𝜆𝜆10𝑒𝑒−𝜆𝜆10𝑡𝑡(1 − φ) + 0.5𝜆𝜆11𝑒𝑒−𝜆𝜆11𝑡𝑡φ0.5𝑒𝑒−𝜆𝜆00𝑡𝑡(1 − φ) + 0.5𝑒𝑒−𝜆𝜆01𝑡𝑡φ + 0.5𝑒𝑒−𝜆𝜆10𝑡𝑡(1 − φ) + 0.5𝑒𝑒−𝜆𝜆11𝑡𝑡φ
When θ = 0, these two hazard ratios are equivalent only if (1) there is no treatment effect
or (2) there is no prognostic effect and φ=0.5. Therefore, for the survival endpoints, the
between-strategy test is valid to detect the predictive marker effect only if one of these
two restrictive conditions hold.
Page 30
21
Appendix B: Proof of Theorem 2
For the survival endpoint, defining ∆ as the total number of events, according to
Schoenfeld [18], we have 𝑍𝑍�−~𝑁𝑁(�3(1−φ)∆𝜃𝜃−4
, 1) and 𝑍𝑍�+~𝑁𝑁(�3φ∆𝜃𝜃+4
, 1). Hence, 𝑍𝑍� =
�1 − φ𝑍𝑍�+ − �φ𝑍𝑍�− has the following asymptotic distribution
𝑍𝑍�~𝑁𝑁��3(1 − φ)φ∆(𝜃𝜃+ − 𝜃𝜃−)
4 , 1� = 𝑁𝑁(�3(1− φ)φ∆θ
4 , 1)
Then, under the null hypothesis 𝐻𝐻0: 𝜃𝜃 = 0, we have 𝑍𝑍�~𝑁𝑁(0,1), and under 𝐻𝐻1: 𝜃𝜃 = 𝜃𝜃1,
we have 𝑍𝑍�~𝑁𝑁(�3(1−φ)φ∆𝜃𝜃14
, 1).
Page 31
22
References
[1] Couzin-Frankel J: Cancer immunotherapy. Science 324: 1432-1433, 2013.
[2] Sawyers C: Targeted cancer therapy. Nature 432: 294-297, 2004.
[3] Kaufman HL: Precision immunology: the promise of immunotherapy for the
treatment of cancer. Journal of Clinical Oncology 33: 1315-1317, 2015.
[4] Sargent DJ, Conley BA, Allegra C, et al: Clinical trial designs for predictive marker
validation in cancer treatment trials. Journal of Clinical Oncology 23: 2020-2027, 2005.
[5] Mandrekar SJ, Sargent DJ: Clinical trial designs for predictive biomarker validation:
theoretical considerations and practical challenges. Journal of Clinical Oncology 27:
4027-4034, 2009.
[6] Sargent DJ, Allegra C: Issues in clinical trial design for tumor marker studies.
Seminars in Oncology 29: 222-230, 2002.
[7] Simon R, Maitournam A: Evaluating the efficiency of targeted designs for
randomized clinical trials. Clinical Cancer Research 10: 6759-6763, 2004.
[8] Freidlin B, Simon R: Adaptive signature design: an adaptive clinical trial design for
generating and prospectively testing a gene expression signature for sensitive patients.
Clinical Cancer Research 11: 7872-7878, 2005.
[9] Jiang W, Freidlin B, Simon, R: Biomarker-adaptive threshold design: a procedure for
evaluating treatment with possible biomarker-defined subset effect. Journal of National
Cancer Institution 99: 1036-1043, 2007.
[10] Freidlin B, Jiang W, Simon, R: The cross-validated adaptive signature design.
Clinical Cancer Research 16: 691-698, 2009.
Page 32
23
[11] Cobo M, Isa D, et al: Customizing cisplatin based on quantitative excision repair
cross-complementing 1 mRNA expression: a phase III trial in non-small-cell lung cancer.
Journal of Clinical Oncology 25: 2747-2754, 2007.
[12] Cree IA, Kurbacher CM, Lamont A, et al: A prospective randomized controlled trial
of tumor chemosensitivity assay directed chemotherapy versus physician’s choice in
patients with recurrent platinum-resistant ovarian cancer. Anticancer Drugs 18: 1093-
1101, 2007.
[13] Rosell R, Vergnenegre A, Fournel P, et al: Pharmacogenetics in lung cancer for the
lay doctor. Targeted Oncology 3: 161-171, 2008.
[14] Lee JJ, Gu X and Liu S: Bayesian adaptive randomization designs for targeted agent
development. Clinical Trials 7: 584-596, 2010.
[15] Freidlin B, McShane LM, Korn EL: Randomized clinical trials with biomarkers:
design issues. Journal of National Cancer Institution 102: 152-160, 2010.
[16] Liu C, Liu A, Hu J, Yuan V and Halabi S: Adjusting for misclassification in a
stratified biomarker clinical trial. Statistics in Medicine 33: 3100-3113, 2014.
[17] Zang Y, Lee JJ and Yuan Y: Two-stage marker-stratified clinical trial design in the
presence of biomarker misclassification. Journal of the Royal Statistical Society-Series C
65: 585-601, 2016.
[18] Schoenfeld D: The asymptotic properties of nonparametric tests for comparing
survival distributions. Biometrika 68: 316-319, 1981.
Page 33
Curriculum vitae
Yan Han
Education
Indiana University – Purdue University Indianapolis Indiana, USA
M.S. in Biostatistics Aug., 2017-Jun., 2019
The University of Hong Kong Hong Kong, China
Ph.D in Immunology Sept., 2009-Aug., 2013
Sun Yat-Sen University Guangdong, China
M.S. in Biochemistry and Molecular Biology Sept., 2006-Jul., 2008
Sun Yat-Sen University Guangdong, China
B.S. in Biotechnology & Its Application Sept., 2002-Jul., 2006
Research experience
IUPUI (Aug., 2017-May, 2019) Indiana, USA
Development of new statistical testing method of single cell RNA-Seq data.
Conducting bioinformatics and statistical analysis pipeline on an RNA-Seq data set of
acute myeloid leukemia.
Analysis of clinical trial data and related methodology development.
Design novel Bayesian phase I/II clinical trials for molecularly targeted therapy and
immunotherapy.
The University of Hong Kong (Aug., 2009–Oct., 2013) Hong Kong, China
Used mouse model to investigate the effect of cigarette smoke exposure on pandemic
H1N1 and avian H9N2 influenza A virus infection
Page 34
Defined the antiviral function and immunomodulatory role of mannose-binding lectin
(MBL) in pandemic H1N1 and avian H9N2 influenza A virus infection
State Key Laboratory of Biocontrol
Sun Yat-Sen University (Sept., 2005-Jul., 2009) Guangdong, China
Identified the lymphocyte-like cells and lymphoid-related genes in amphioxus, which
indicated the twilight of the emergence of primitive adaptive immune system in
amphioxus
Made a profile of morphological studies of the gills and the gut in amphioxus through
optical and electron microscopy
Skills
Proficiency with SAS, LaTeX and Microsoft Office.
Honors
College of Life Sciences Scholarships, 2003-2005
University Excellent Student Scholarships, 2003, 2005
University Excellent Graduate Scholarships, 2007
Tianpu Honesty Scholarships, 2007
University Haida Scholarships, 2008
State Key Laboratory and Eastwin Scientific Inc associated Scholarships, 2008
Postgraduate Scholarships, 2009-2013
University Postgraduate Fellowships, 2009-2013
Page 35
Working Experience
Research Assistant. Department of Medical and Molecular Genetics, IUPUI, Nov.,
2017-May, 2019.
Research Assistant I. Department of Paediatrics and Adolescent Medicine, the
University of Hong Kong, Aug., 2009; Sep., 2013-Oct., 2013.
Technician. State Key Laboratory of Biocontrol, Guangdong Key Laboratory of
Pharmaceutical Functional Genes, College of Life Sciences, Sun Yat-Sen University,
Aug., 2008-Jul., 2009.
Publications
1. Zang, Y., B. Guo, Y. Han, S. Cao, and C. Zhang. 2019. A Bayesian adaptive marker-
stratified design for molecularly targeted agents with customized hierarchical
modeling. Statistics in Medicine In press.
https://onlinelibrary.wiley.com/doi/10.1002/sim.8159
2. Han, Y., and Y. L. Lau. 2014. Nicotine, an anti-inflammation molecule. Inflamm Cell
Signal 1: 182-190.
3. Han, Y., M. T. Ling, H. Mao, J. Zheng, M. Liu, K. T. Lam, Y. Liu, W. Tu, and Y. L.
Lau. 2014. Influenza virus-induced lung inflammation was modulated by cigarette
smoke exposure in mice. PLoS One 9(1): e86166.
4. Ling, M. T., W. Tu, Y. Han, H. Mao, W. P. Chong, J. Guan, M. Liu, K. T. Lam, H.
K. Law, J. S. Peiris, K. Takahashi, and Y. L. Lau. 2012. Mannose-binding lectin
contributes to deleterious inflammatory response in pandemic H1N1 and avian H9N2
infection. J Infect Dis 205: 44-53.
Page 36
5. Han, Y., G. Huang, Q. Zhang, S. Yuan, J. Liu, T. Zheng, L. Fan, S. Chen, and A. Xu.
2010. The primitive immune system of amphioxus provides insights into the ancestral
structure of the vertebrate immune system. Dev Comp Immunol 34: 791-796.
6. Xu, C., Y. Han, L. Fan, and G. Huang. 2008. Cloning and Expression Pattern Analysis
of AmphiDC-like in Amphioxus. Chinese Journal of Biochemistry and Molecular
Biology. 24: 41-45.
7. Huang, G., X. Xie, Y. Han, L. Fan, J. Chen, C. Mou, L. Guo, H. Liu, Q. Zhang, S.
Chen, M. Dong, J. Liu, and A. Xu. 2007. The identification of lymphocyte-like cells
and lymphoid-related genes in amphioxus indicates the twilight for the emergence of
adaptive immune system. PLoS One 2: e206.
8. Huang, G., H. Liu, Y. Han, L. Fan, Q. Zhang, J. Liu, X. Yu, L. Zhang, S. Chen, M.
Dong, L. Wang, and A. Xu. 2007. Profile of acute immune response in Chinese
amphioxus upon Staphylococcus aureus and Vibrio parahaemolyticus infection. Dev
Comp Immunol 31: 1013-1023.
Conference presentations
1. “Protective role of acute cigarette smoking against pdmH1N1 and H9N2 infection in
mice”, 16th Research Postgraduate Symposium, The University of Hong Kong, Hong
Kong, CN, Dec., 7-8, 2011.
2. “Immunomodulatory role of acute cigarette smoke exposure in pdmH1N1 and H9N2
infection”, IMMUNOLOGY2012TM, The 99th AAI Annual Meeting, Boston, USA,
May, 4-8, 2012.
Page 37
3. “Immunomodulatory role of acute cigarette smoke exposure in pdmH1N1 and H9N2
infection”, 17th Research Postgraduate Symposium, The University of Hong Kong,
Hong Kong, CN, Dec., 12-13, 2012.
4. “Acute cigarette smoke exposure modulates the inflammatory response in pdmH1N1
and H9N2 infection”. IMMUNOLOGY 2013TM, The 100th AAI Annual Meeting,
Honolulu, Hawaii, USA, May, 3-7, 2013.
5. “Immunomodulatory role of cigarette smoke exposure in pdmH1N1 and H9N2
infection”. ASPR-PSM 2013, Kuching, Sarawak, Malaysia. May, 9-12, 2013.
Training course
2nd HKU-Pasteur Immunology Course, Nov., 19-Dec., 2, 2009, HKU-Pasteur Research
Centre, Hong Kong, China.