44
Yara International ASA 2018 first quarter results 20 April 2018
Yara International ASA 2018 first quarter results 20 April 2018

0
5
Jan'16 Mar May Jul Sep Nov Jan '17 Mar May July Sep Nov Jan'18 Mar'18
TRI (Total recordable injuries 12-month rolling)1
Safe operations is our first priority
1) TRI: Total recordable injuries, lost time (absence from work), restricted work and medical treatment cases per one million work hours.
IR – 20 April 2018 2
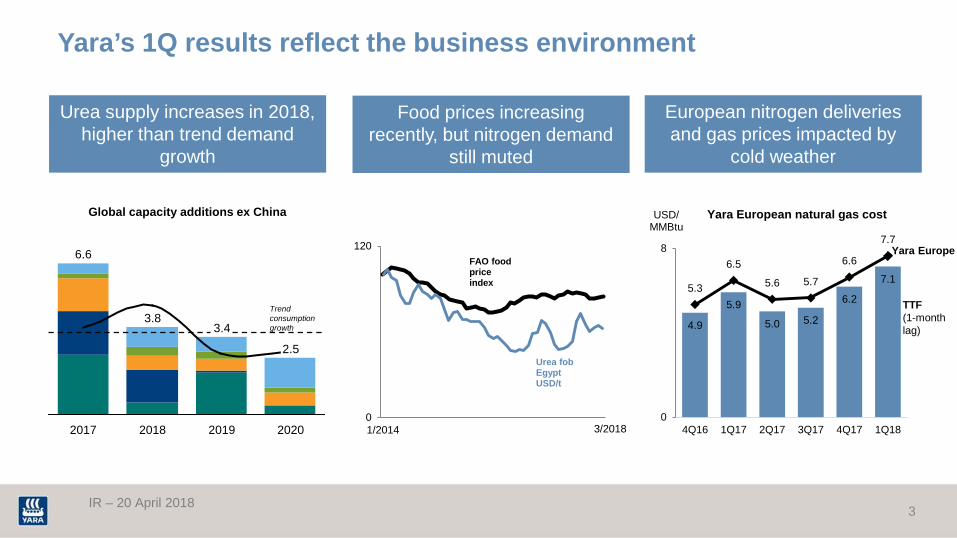
Yara’s 1Q results reflect the business environment
Food prices increasing recently, but nitrogen demand
still muted
Urea supply increases in 2018, higher than trend demand
growth
European nitrogen deliveries and gas prices impacted by
cold weather
0
120
1/2014 10/2014 7/2015 4/2016 1/2017 10/2017
Urea fob Egypt USD/t
FAO food price index
Global capacity additions ex China
4.9
5.9
5.0 5.2
6.2
7.1 5.3
6.5
5.6 5.7
6.6
7.7
0
8
4Q16 1Q17 2Q17 3Q17 4Q17 1Q18
USD/ MMBtu
Yara European natural gas cost
3/2018
2.5
2020 2019
6.6
3.8
2017
3.4
2018
Trend consumption growth
IR – 20 April 2018 3
Yara Europe
TTF (1-month lag)
0
600
1Q15 3Q15 1Q16 3Q16 1Q17 3Q17 1Q18
USD/t
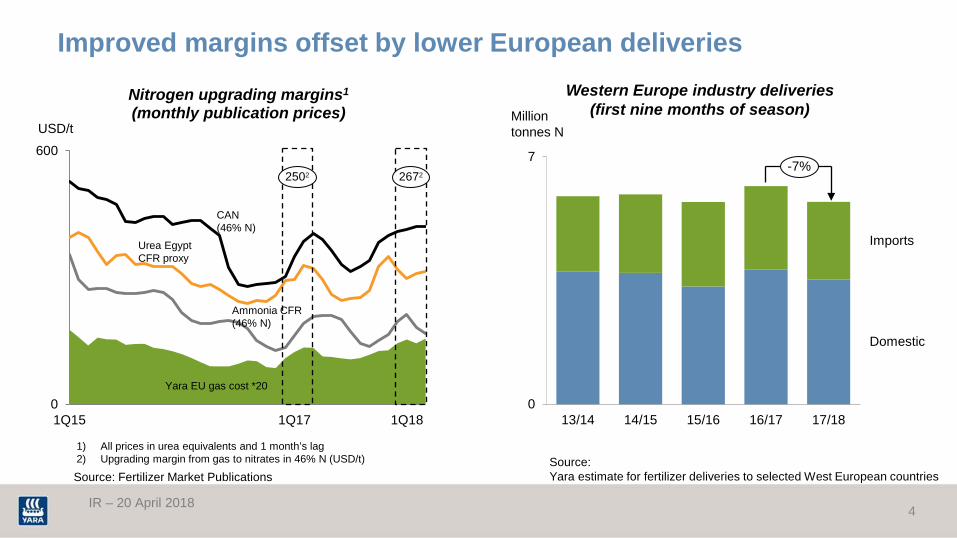
Nitrogen upgrading margins1 (monthly publication prices)
Yara EU gas cost *20
Urea Egypt CFR proxy
Improved margins offset by lower European deliveries
1) All prices in urea equivalents and 1 month’s lag 2) Upgrading margin from gas to nitrates in 46% N (USD/t)
Source: Fertilizer Market Publications
0
7
13/14 14/15 15/16 16/17 17/18
Western Europe industry deliveries (first nine months of season)
-7%
Source: Yara estimate for fertilizer deliveries to selected West European countries
Million tonnes N
Ammonia CFR (46% N)
CAN (46% N)
Domestic
Imports
2672 2502
IR – 20 April 2018 4
0
500
14 15 16 17 18
0
8,000
2014 2015 2016 2017 2018
Kilotons Kilotons
0
2,000
2014 2015 2016 2017 2018
Kilotons
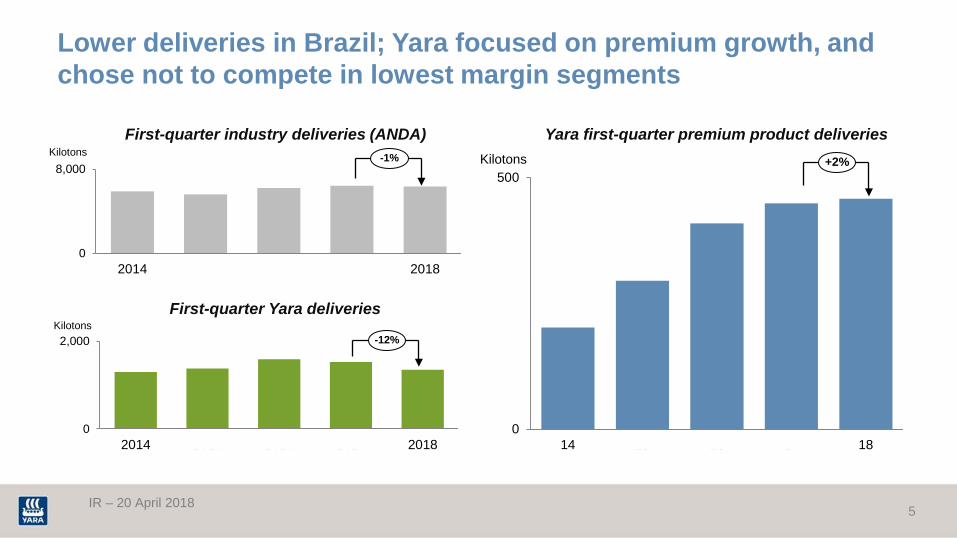
Yara first-quarter premium product deliveries First-quarter industry deliveries (ANDA)
Lower deliveries in Brazil; Yara focused on premium growth, and chose not to compete in lowest margin segments
-1%
-12%
First-quarter Yara deliveries
IR – 20 April 2018 5
+2%

Strong ammonia production performance
1) Including share of equity-accounted investees
0
2,200 +13%
Ammonia1
Kilotons
5,500
0
+2%
Finished fertilizer & industrial products1
Kilotons
Urea
Nitrates
NPK
CN UAN SSP
2015 2016 2017 2015 2016 2017
IR – 20 April 2018 6
Ammonia1
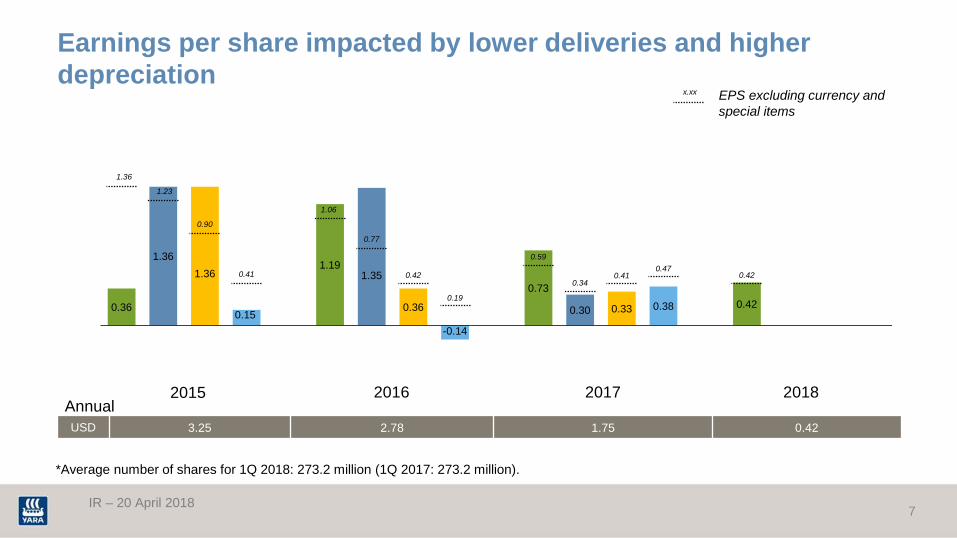
Earnings per share impacted by lower deliveries and higher depreciation
0.36
1.36 1.36
0.15
1.19 1.35
0.36
-0.14
0.73
0.30 0.33 0.38 0.42
1.36
1.23
0.90
0.41
1.06
0.77
0.42
0.19
0.59
0.34 0.41
0.47 0.42
USD 3.25 2.78 1.75 0.42
Annual 2015 2016 2017 2018
*Average number of shares for 1Q 2018: 273.2 million (1Q 2017: 273.2 million).
EPS excluding currency and special items
IR – 20 April 2018 7
x.xx
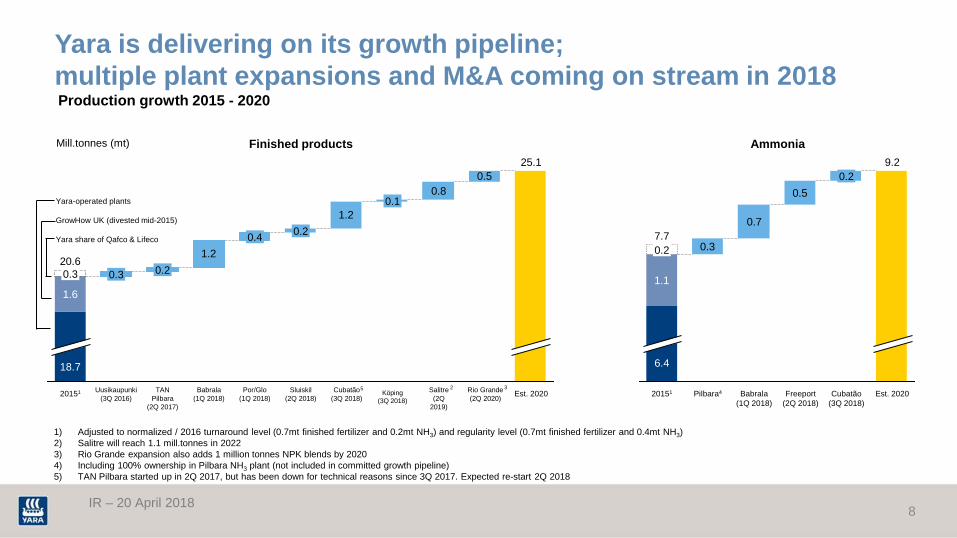
Yara is delivering on its growth pipeline; multiple plant expansions and M&A coming on stream in 2018
1) Adjusted to normalized / 2016 turnaround level (0.7mt finished fertilizer and 0.2mt NH3) and regularity level (0.7mt finished fertilizer and 0.4mt NH3) 2) Salitre will reach 1.1 mill.tonnes in 2022 3) Rio Grande expansion also adds 1 million tonnes NPK blends by 2020 4) Including 100% ownership in Pilbara NH3 plant (not included in committed growth pipeline) 5) TAN Pilbara started up in 2Q 2017, but has been down for technical reasons since 3Q 2017. Expected re-start 2Q 2018
Production growth 2015 - 2020
Finished products Ammonia Mill.tonnes (mt)
0.50.8
1.2
1.2
1.6
Est. 2020
25.1
Rio Grande (2Q 2020)
Salitre (2Q
2019)
Köping (3Q 2018)
0.1
Cubatão (3Q 2018)
Sluiskil (2Q 2018)
0.2
Por/Glo (1Q 2018)
0.4
Babrala (1Q 2018)
TAN Pilbara
(2Q 2017)
0.2
Uusikaupunki (3Q 2016)
0.3
20151
20.6
18.7
0.3
0.3
0.7
0.5
1.1
Est. 2020
9.2
Cubatão (3Q 2018)
0.2
Freeport (2Q 2018)
Babrala (1Q 2018)
Pilbara4 20151
7.7
6.4
0.2
Yara-operated plants GrowHow UK (divested mid-2015) Yara share of Qafco & Lifeco
IR – 20 April 2018 8
5 2 3
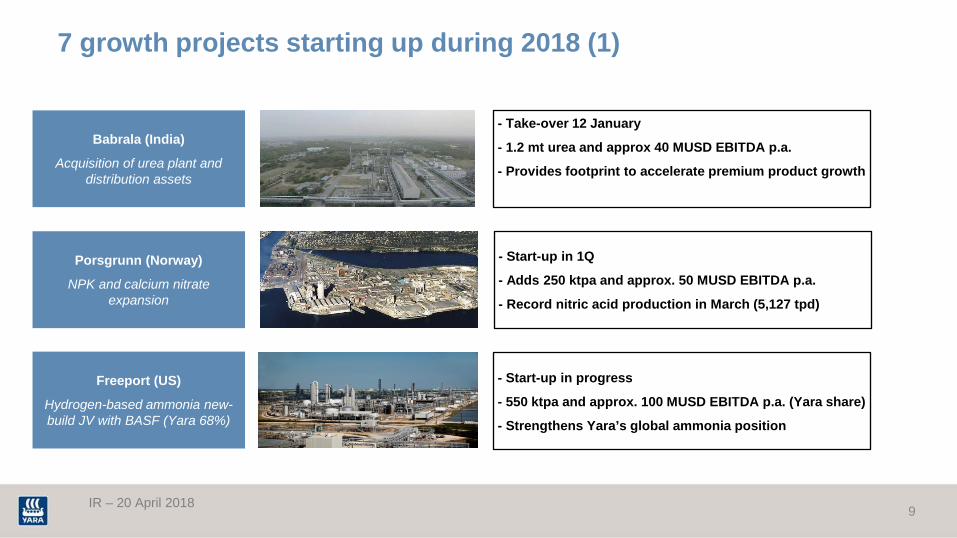
7 growth projects starting up during 2018 (1)
Babrala (India)
Acquisition of urea plant and distribution assets
Porsgrunn (Norway)
NPK and calcium nitrate expansion
Freeport (US)
Hydrogen-based ammonia new-build JV with BASF (Yara 68%)
- Start-up in progress
- 550 ktpa and approx. 100 MUSD EBITDA p.a. (Yara share)
- Strengthens Yara’s global ammonia position
- Start-up in 1Q
- Adds 250 ktpa and approx. 50 MUSD EBITDA p.a.
- Record nitric acid production in March (5,127 tpd)
- Take-over 12 January
- 1.2 mt urea and approx 40 MUSD EBITDA p.a.
- Provides footprint to accelerate premium product growth
IR – 20 April 2018 9

7 growth projects starting up during 2018 (2)
Sluiskil (NL)
Revamp and urea+S expansion
Salitre (Brazil)
Phosphate mine
Cubatao (Brazil)
N and P production facility acquisition
- Closing expected mid-2018
- 1.4 mtpa and approx. 60 MUSD EBITDA p.a.
- Strengthens production and industrial footprint in Brazil
- Start-up in 2Q (rock production only)
- Adds approx. 1.1 mtpa SSP equivalents by 2020
- Limited earnings until chemical production starts mid-2019
- Start-up in 2Q
- Adds approx. 210 ktpa and 30 MUSD EBITDA p.a.
- Improved product mix - from urea prills to nitrates and urea+S
IR – 20 April 2018
Köping (Sweden)
Nitric acid revamp and TAN expansion
- Start-up in 3Q
- 90 ktpa and approx. 50 MUSD EBITDA p.a.
- Strong long-term fundamentals for civil explosives industry
10

Kilotons
> 2million tonnes delivered last 12 months
1.000
2.000
0 2018 2014
AdBlue: record deliveries and expansion in Brunsbüttel
Facility comprising storage tank, truck-loading station and harbor facilities to increase sales and exports of AdBlue
Annual AdBlue production capacity of 1.1 million tonnes
This is enough AdBlue to remove around half a million tonnes of NOX emissions a year; enough to abate all road transport-related NOX emissions of Germany, Austria and Switzerland combined
Brunsbüttel AdBlue facility opened in February
IR – 20 April 2018 11
+19% CAGR

Underlying EBITDA down 5%
622 667
845
411
585 664
363 242
381 352 303 312 370
741
652
559
411
585
480
359 296
395 338 347 350 377
2015 2017 2016 2018
USD millions
EBITDA excluding special items
USD millions 2,545 1,854 1,348 370
Annual
xxx
12 IR – 20 April 2018
IR – 20 April 2018
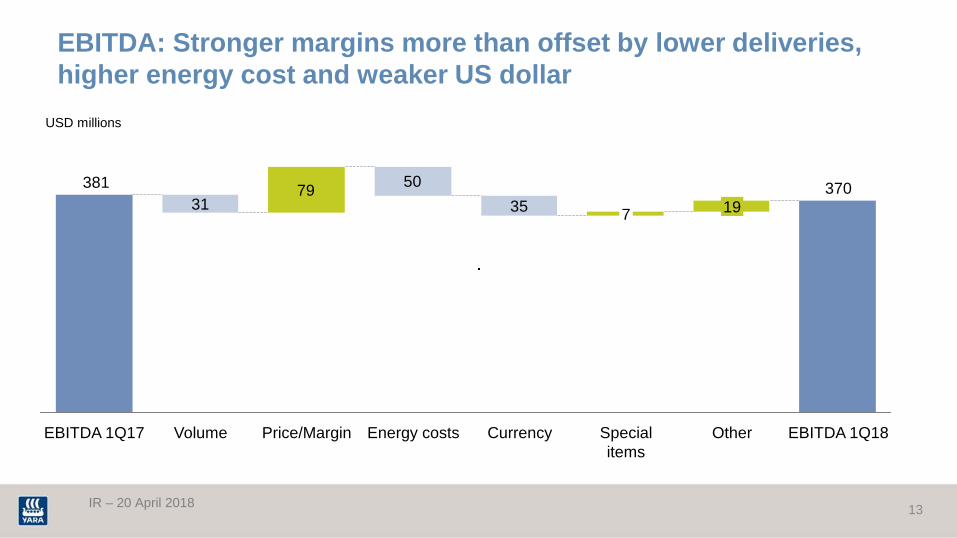
EBITDA: Stronger margins more than offset by lower deliveries, higher energy cost and weaker US dollar
3179 50
35370381
EBITDA 1Q18 Other
19
Special items
7
Currency Energy costs Price/Margin Volume EBITDA 1Q17
USD millions
13
IR – 20 April 2018
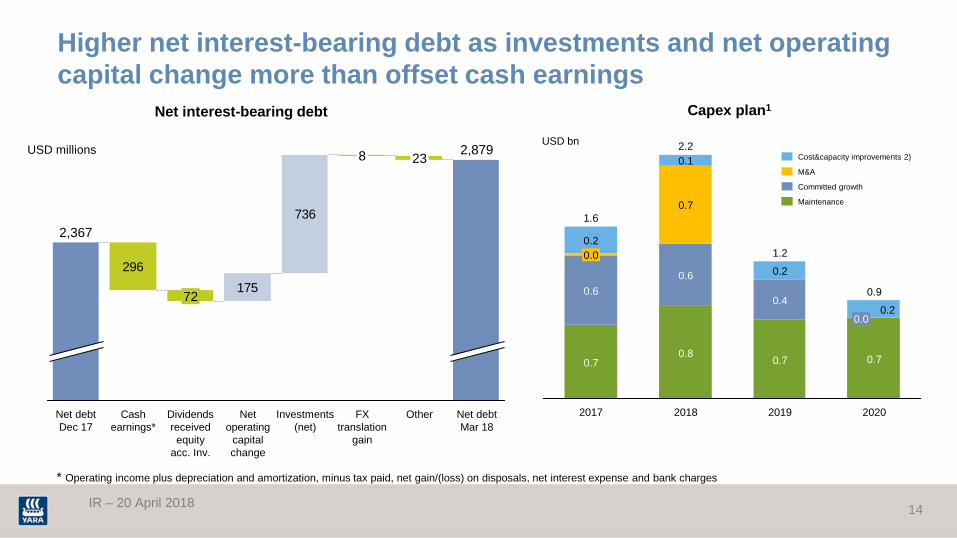
Higher net interest-bearing debt as investments and net operating capital change more than offset cash earnings
736
175296
2,879
Other
23
FX translation
gain
8
Net debt Mar 18
Investments (net)
Net operating
capital change
Dividends received equity
acc. Inv.
72
Cash earnings*
Net debt Dec 17
2,367
* Operating income plus depreciation and amortization, minus tax paid, net gain/(loss) on disposals, net interest expense and bank charges
USD millions
2019
1.2
0.7
0.4
0.2
2020
0.9
0.7
0.0 0.2
2018
2.2
0.8
0.6
0.7
0.0 0.2
0.1
2017
1.6
0.7
0.6
Maintenance
Cost&capacity improvements 2)
M&A
Committed growth
USD bn
Capex plan1 Net interest-bearing debt
14
IR – 20 April 2018
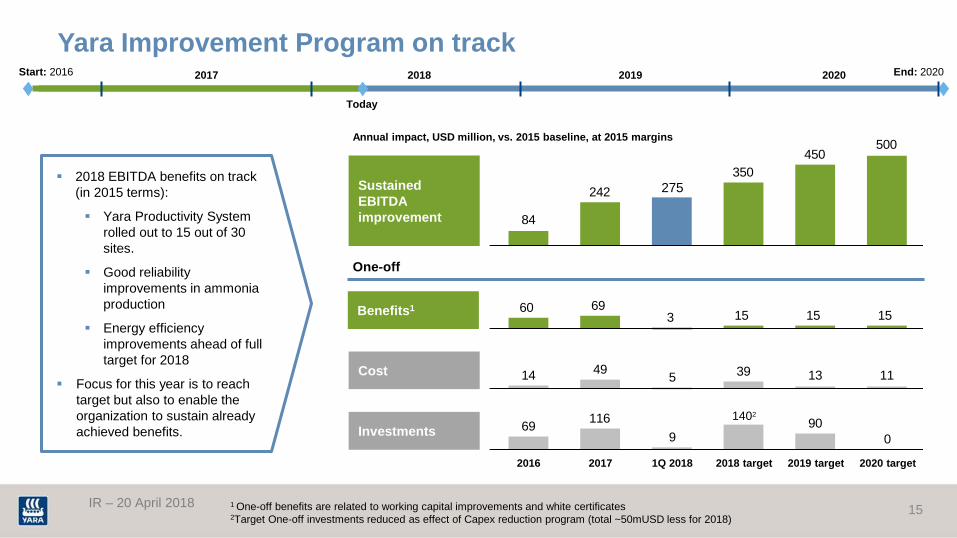
Yara Improvement Program on track
2018 EBITDA benefits on track (in 2015 terms):
Yara Productivity System rolled out to 15 out of 30 sites.
Good reliability improvements in ammonia production
Energy efficiency improvements ahead of full target for 2018
Focus for this year is to reach target but also to enable the organization to sustain already achieved benefits.
500450
350242
84
275
Annual impact, USD million, vs. 2015 baseline, at 2015 margins
Today
Start: 2016 End: 2020 2017 2018 2019 2020
151536960 15
090
911669
500
2016
1402
1Q 2018 2017 2019 target 2018 target 2020 target
11133954914
1 One-off benefits are related to working capital improvements and white certificates
2Target One-off investments reduced as effect of Capex reduction program (total ~50mUSD less for 2018)
One-off
Sustained EBITDA improvement
Benefits1
Cost
Investments
15
IR – 20 April 2018
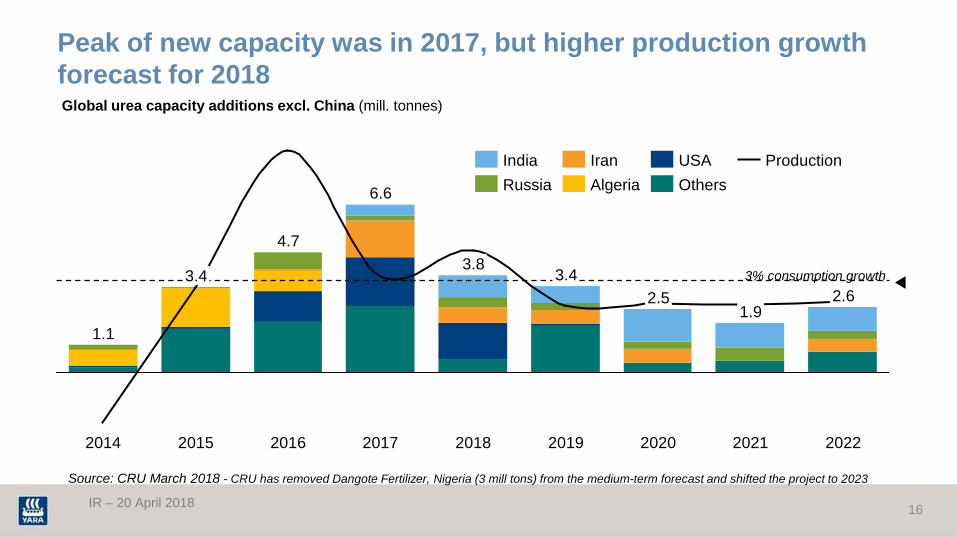
Peak of new capacity was in 2017, but higher production growth forecast for 2018
2.6
2022 2021
2.5
2020
1.9
2019
3.4
2018
3.8
2017
6.6
2016
4.7
2015
3.4
2014
1.1
Production Others
India USA Iran Algeria Russia
3% consumption growth
Global urea capacity additions excl. China (mill. tonnes)
Source: CRU March 2018 - CRU has removed Dangote Fertilizer, Nigeria (3 mill tons) from the medium-term forecast and shifted the project to 2023
16
IR – 20 April 2018 17
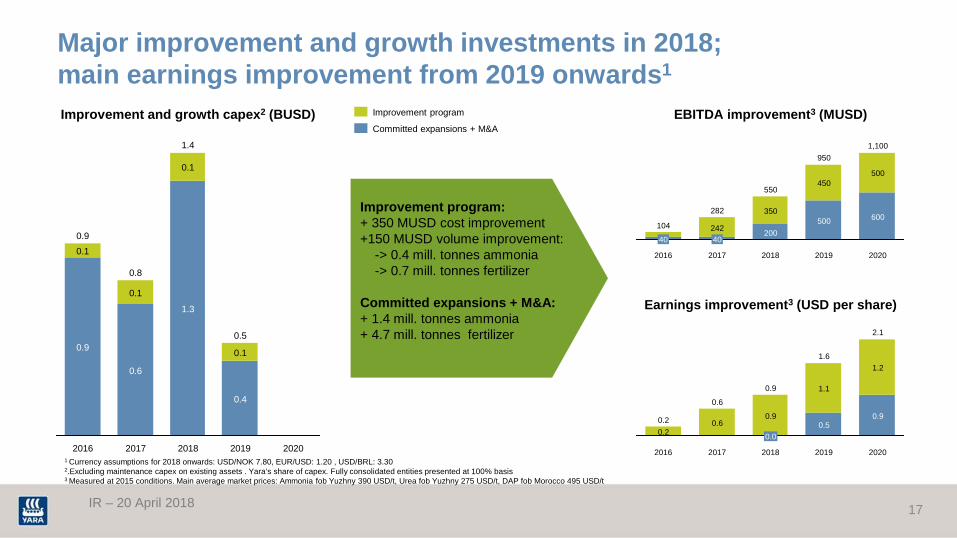
2020 2019
0.5
0.4
0.1
2018
1.4
1.3
0.1
2017
0.8
0.6
0.1
2016
0.9
0.9
0.1
Committed expansions + M&A
Improvement program
2020
1,100
600
500
2019
950
500
450
2018
550
200
350
2017
282
40 242
2016
104
40
2020
2.1
0.9
1.2
2019
1.6
0.5
1.1
2018
0.9
0.0
0.9
2017
0.6
0.6
2016
0.2 0.2
1 Currency assumptions for 2018 onwards: USD/NOK 7.80, EUR/USD: 1.20 , USD/BRL: 3.30 2.Excluding maintenance capex on existing assets . Yara’s share of capex. Fully consolidated entities presented at 100% basis 3 Measured at 2015 conditions. Main average market prices: Ammonia fob Yuzhny 390 USD/t, Urea fob Yuzhny 275 USD/t, DAP fob Morocco 495 USD/t
Improvement program: + 350 MUSD cost improvement +150 MUSD volume improvement: -> 0.4 mill. tonnes ammonia -> 0.7 mill. tonnes fertilizer Committed expansions + M&A: + 1.4 mill. tonnes ammonia + 4.7 mill. tonnes fertilizer
Major improvement and growth investments in 2018; main earnings improvement from 2019 onwards1
EBITDA improvement3 (MUSD)
Earnings improvement3 (USD per share)
Improvement and growth capex2 (BUSD)
IR – 20 April 2018
Backup / additional information
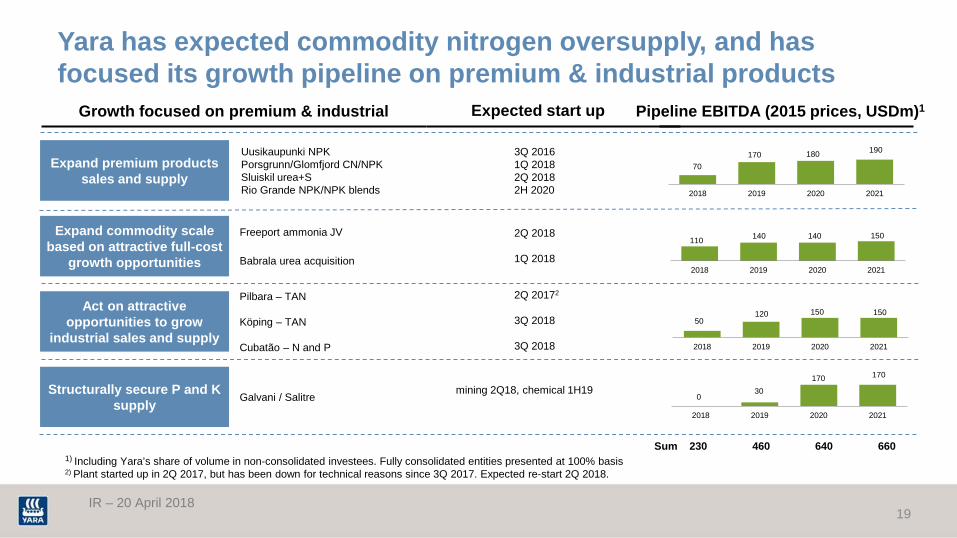
Yara has expected commodity nitrogen oversupply, and has focused its growth pipeline on premium & industrial products
Uusikaupunki NPK Porsgrunn/Glomfjord CN/NPK Sluiskil urea+S Rio Grande NPK/NPK blends
Expand premium products sales and supply
Freeport ammonia JV
Babrala urea acquisition
Expand commodity scale based on attractive full-cost
growth opportunities
Act on attractive opportunities to grow
industrial sales and supply
Galvani / Salitre Structurally secure P and K supply
Pilbara – TAN Köping – TAN Cubatão – N and P
Growth focused on premium & industrial
1) Including Yara’s share of volume in non-consolidated investees. Fully consolidated entities presented at 100% basis 2) Plant started up in 2Q 2017, but has been down for technical reasons since 3Q 2017. Expected re-start 2Q 2018.
Pipeline EBITDA (2015 prices, USDm)1
70 170 180 190
2018 2019 2020 2021
110 140 140 150
2018 2019 2020 2021
0 30
170 170
2018 2019 2020 2021
Expected start up
3Q 2016 1Q 2018 2Q 2018 2H 2020
2Q 2018 1Q 2018
mining 2Q18, chemical 1H19
2Q 20172 3Q 2018 3Q 2018
Sum 230 460 640 660
50 120 150 150
2018 2019 2020 2021
IR – 20 April 2018 19
2020
1,100
600
500
2019
950
500
450
2018
550
200
350
2017
282
40 242
2016
124
40
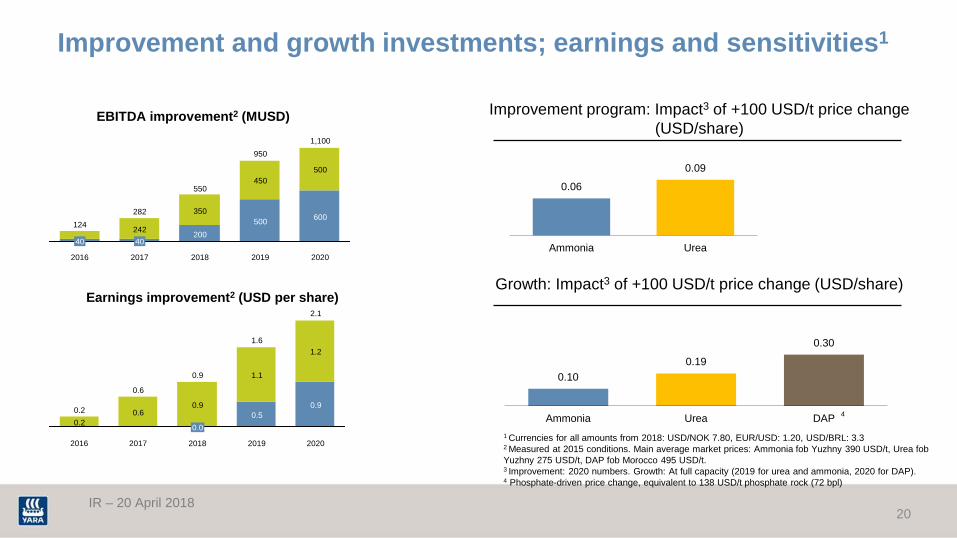
Improvement and growth investments; earnings and sensitivities1
EBITDA improvement2 (MUSD)
Earnings improvement2 (USD per share)
0.10 0.19
0.30
Ammonia Urea DAP
Growth: Impact3 of +100 USD/t price change (USD/share)
1 Currencies for all amounts from 2018: USD/NOK 7.80, EUR/USD: 1.20, USD/BRL: 3.3
2 Measured at 2015 conditions. Main average market prices: Ammonia fob Yuzhny 390 USD/t, Urea fob Yuzhny 275 USD/t, DAP fob Morocco 495 USD/t. 3 Improvement: 2020 numbers. Growth: At full capacity (2019 for urea and ammonia, 2020 for DAP). 4 Phosphate-driven price change, equivalent to 138 USD/t phosphate rock (72 bpl)
Improvement program: Impact3 of +100 USD/t price change (USD/share)
0.06
0.09
Ammonia Urea
4
2020
2.1
0.9
1.2
2019
1.6
0.5
1.1
2018
0.9
0.0
0.9
2017
0.6
0.6
2016
0.2 0.2
IR – 20 April 2018 20

IR – 20 April 2018
Higher margins in Crop Nutrition and Industrial segment
124 141
45 53
237
157 149
223
158
1Q17 1Q18
EBITDA (USD millions)
EBITDA excluding special items
Crop Nutrition Industrial Production
21
IR – 20 April 2018
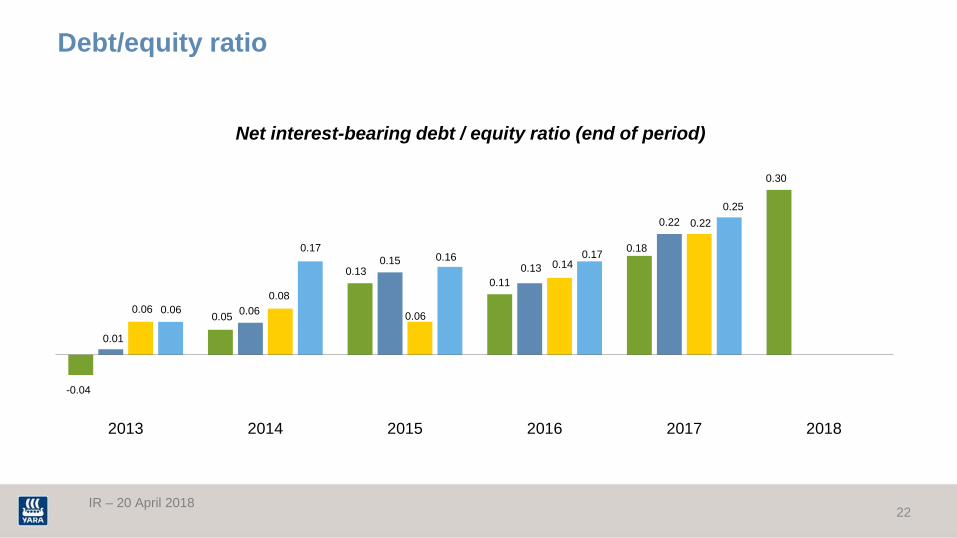
Debt/equity ratio
-0.04
0.05
0.13 0.11
0.18
0.30
0.01
0.06
0.15 0.13
0.22
0.06 0.08
0.06
0.14
0.22
0.06
0.17 0.16 0.17
0.25
2013 2014 2015 2016 2017 2018
Net interest-bearing debt / equity ratio (end of period)
22
IR – 20 April 2018
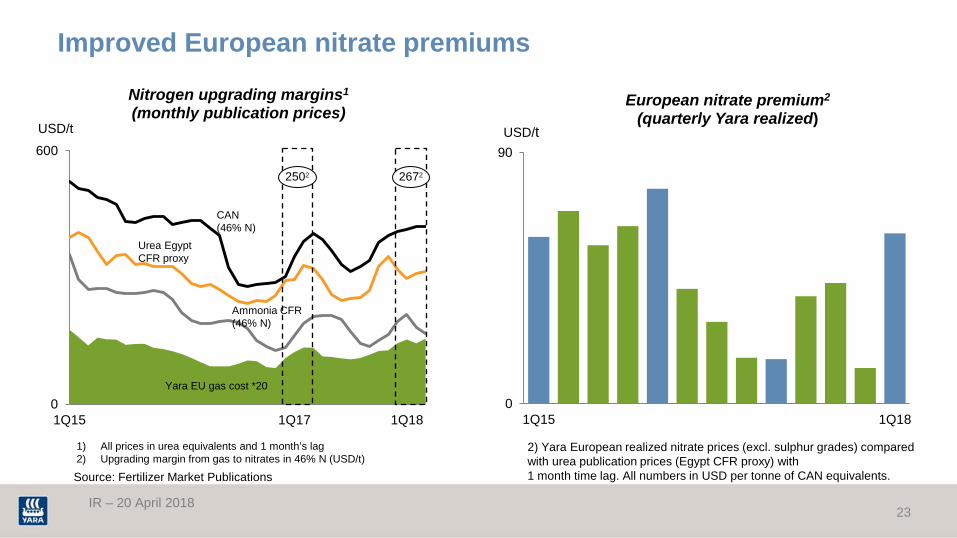
Improved European nitrate premiums
23
2) Yara European realized nitrate prices (excl. sulphur grades) compared with urea publication prices (Egypt CFR proxy) with 1 month time lag. All numbers in USD per tonne of CAN equivalents. Source: Fertilizer Market Publications
0
90
1Q15 3Q15 1Q16 3Q16 1Q17 3Q17 1Q18
European nitrate premium2 (quarterly Yara realized)
USD/t
0
600
1Q15 3Q15 1Q16 3Q16 1Q17 3Q17 1Q18
USD/t
Nitrogen upgrading margins1 (monthly publication prices)
Yara EU gas cost *20
Urea Egypt CFR proxy
Ammonia CFR (46% N)
CAN (46% N)
2672 2502
1) All prices in urea equivalents and 1 month’s lag 2) Upgrading margin from gas to nitrates in 46% N (USD/t)

IR – 20 April 2018
Weighted average global premium above blend cost
0
700
1Q15 3Q15 1Q16 3Q16 1Q17 3Q17 1Q18
USD/t NPK premium over blend1
Value above raw material
0
600
1Q15 3Q15 1Q16 3Q16 1Q17 3Q17 1Q18
USD/t Phosphate upgrading margins
DAP FOB US Gulf
Solid commodity phosphate margins and compound NPK premiums
24
1) Export NPK plants, average grade 19-10-13, net of transport and handling cost.
Rock, fob North Africa *1.4
NH3, fob Black Sea *0.22
Source: Fertilizer Market Publications
DAP, CIF inland Germany
MOP, CIF inland Germany
Urea, CIF inland Germany
Nitrate premium, CIF inland Germany

IR – 20 April 2018
64
45 27
42 46
90
70
18
20
20
12
0102030405060708090
100
1Q17 2Q17 3Q17 4Q17 1Q18 2Q18 3Q18
USD millions
EU/US estimate* EU/US actual
Higher natural gas cost expected for the next two quarters
25
2.0
3.0
4.0
5.0
6.0
7.0
8.0
9.0
1Q17 2Q17 3Q17 4Q17 1Q18 2Q18 3Q18
USD/ MMBtu
TTF (1-month lag) Yara Europe
Yara European natural gas cost Change in global natural gas cost
Source: Yara, World Bank, Argus/ICIS Heren *Dotted lines denote forward prices as of 30 January 2018 Pilbara actual

IR – 20 April 2018
Energy cost
26
4.0 4.4 4.0
2.8 3.7
4.4
2.6 2.0 2.1
2.8 3.0 3.0 3.0 2.9 2.9 3.2 3.2 2.7 2.8
4.8 5.7
8.2 8.0 8.0 6.9
5.5
4.1 3.8 4.0 4.3 5.3 4.7
5.9 6.0 5.7 4.7
6.6
9.2 9.4 10.5
8.1
6.4
4.2 4.4 4.2
5.4 5.8 5.0 5.5
6.6 6.8 6.9 6.9 6.6
7.6
10.7 11.0 11.4
9.1
7.1
5.0 4.6 4.9 5.3
6.5 5.6 5.7
6.6 7.7 8.0
7.4
2009 2010 2011 2012 2013 2014 2015 1Q16 2Q16 3Q16 4Q16 1Q17 2Q17 3Q17 4Q17 1Q18 2Q18 3Q18
US gas price (Henry Hub) Yara Global TTF day ahead (Zeebrugge 2009-2012) Yara Europe
Yearly averages 2009 – 2015, quarterly averages for 2016-18 with forward prices* for 1Q18 and 2Q18.
*Dotted lines denote forward prices as of 30 January 2018 Source: Yara, World Bank, Argus/ICIS Heren
IR – 20 April 2018
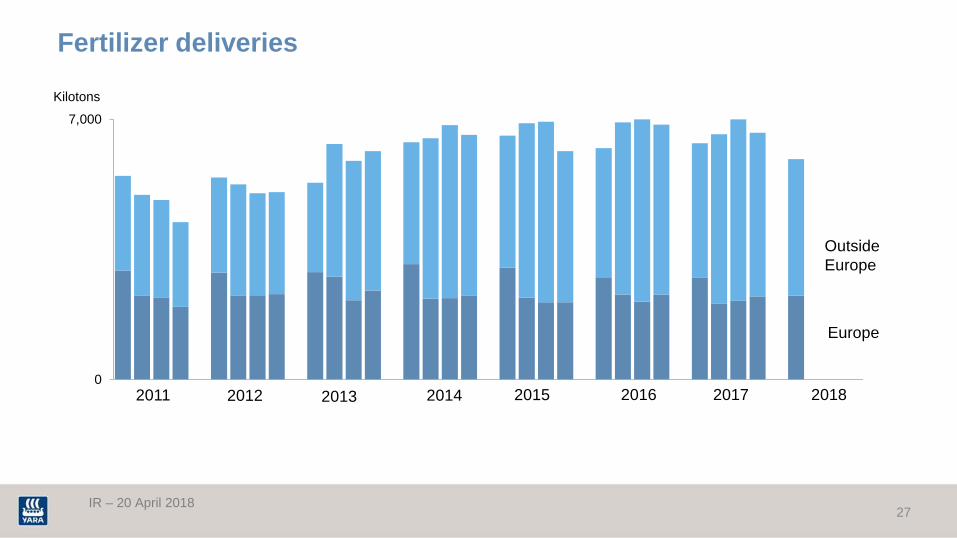
Fertilizer deliveries
27
0
7,000
Kilotons
2014 2011 2012 2013 2015 2016 2017 2018
Europe
Outside Europe
IR – 20 April 2018
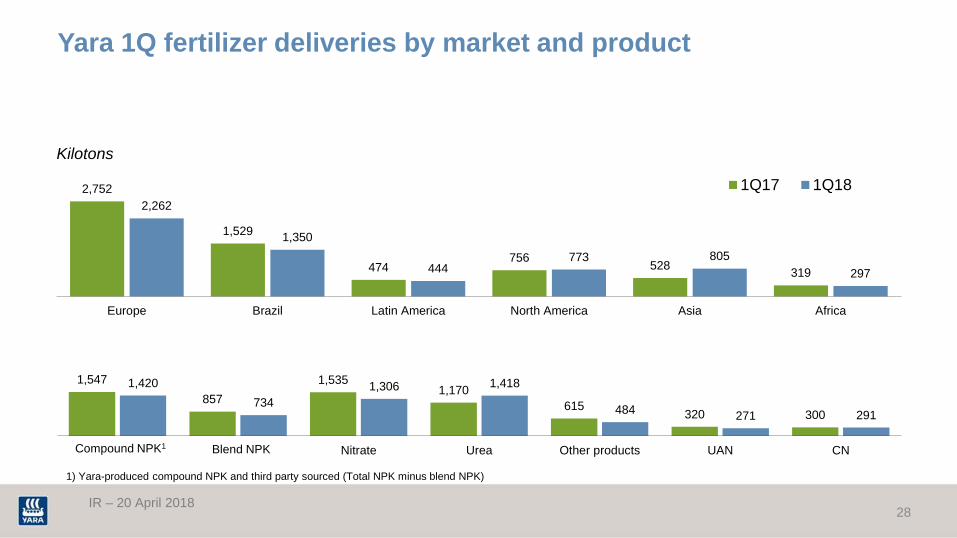
Yara 1Q fertilizer deliveries by market and product
28
2,752
1,529
474 756 528 319
2,262
1,350
444 773 805
297
Europe Brazil Latin America North America Asia Africa
1Q17 1Q18
1,547 857
1,535 1,170
615 320 300
1,420 734
1,306 1,418
484 271 291
Nitrate Urea Other products UAN CNCompound NPK1 Blend NPK
1) Yara-produced compound NPK and third party sourced (Total NPK minus blend NPK)
Kilotons

IR – 20 April 2018
Fertilizer deliveries by product and source
29
1,535 1,306
1,547 1,420
857 734
1,170
1,418
320 271
929 783
1Q17 1Q18 1Q17 1Q18 1Q17 1Q18 1Q17 1Q18 1Q17 1Q18 1Q17 1Q18
Yara-produced deliveries Joint venture & third party sourced
NPK compounds NPK blends Urea UAN Other
Kilotons
Nitrate

IR – 20 April 2018
Strong premium product deliveries
30
1) YaraBela, YaraMila and YaraLiva deliveries
0
500
1,000
1,500
2,000
2,500
3,000
3,500
4,000
1Q14 1Q15 1Q16 1Q17 1Q18
250
409
198
43
172
317
449
237
70
180
307
458
236
100
176
Asia Brazil LatinAmerica excl.
Brazil
Africa NorthAmerica
Value-added fertilizer deliveries1 Value-added fertilizer deliveries1
CAGR 8%
Outside Europe Europe 1Q18 1Q17 1Q16
IR – 20 April 2018
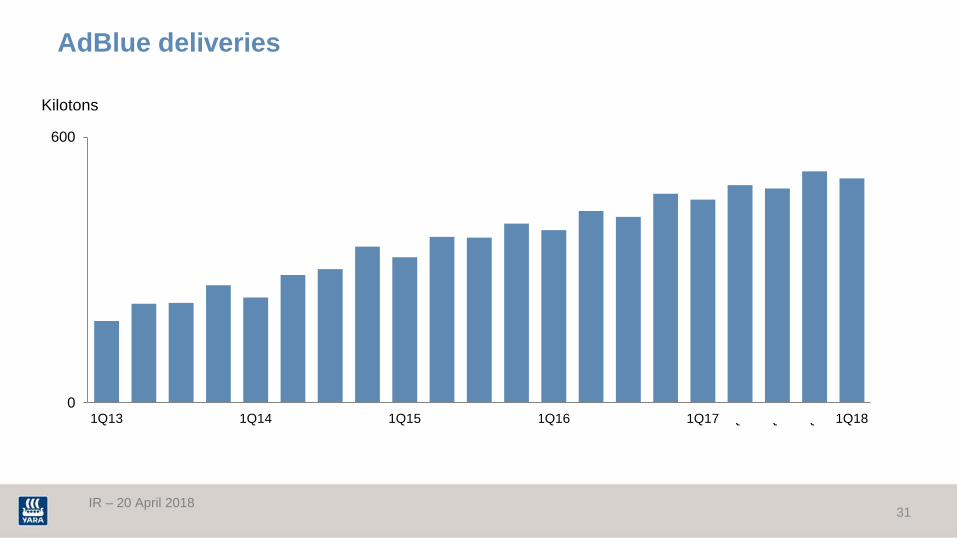
AdBlue deliveries
31
0
600
1Q13 2Q13 3Q13 4Q13 1Q14 2Q14 3Q14 4Q14 1Q15 2Q15 3Q15 4Q15 1Q16 2Q16 3Q16 4Q16 1Q17 2Q17 3Q17 4Q17 1Q18
Kilotons

IR – 20 April 2018
0
8,000
Yara stocks
32
Kilotons Finished fertilizer
Urea
Nitrates
Compound NPK
Other
IR – 20 April 2018
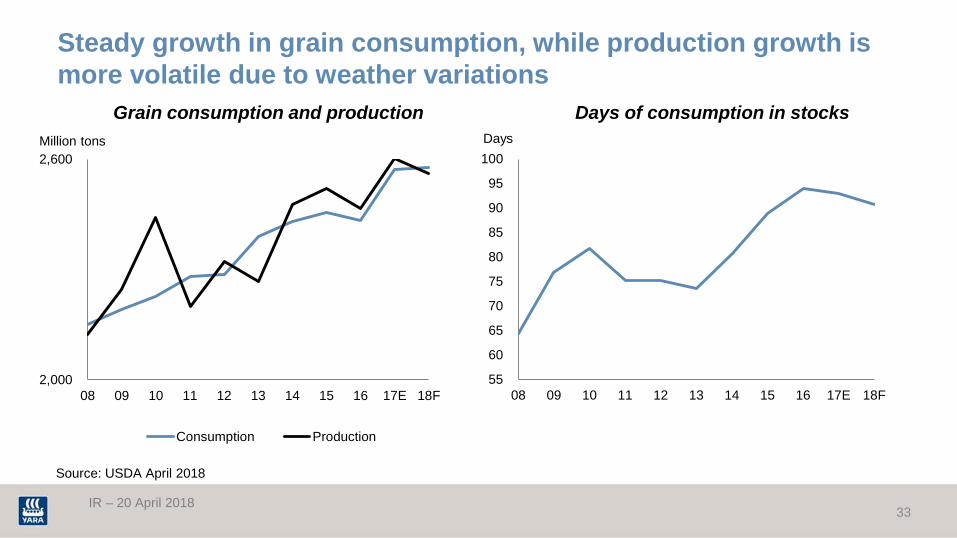
Steady growth in grain consumption, while production growth is more volatile due to weather variations
33
Source: USDA April 2018
2,000
2,600
08 09 10 11 12 13 14 15 16 17E 18F
Million tons
Consumption Production
Grain consumption and production Days of consumption in stocks
55
60
65
70
75
80
85
90
95
100
08 09 10 11 12 13 14 15 16 17E 18F
Days

IR – 20 April 2018
Relatively weak grain economics
34
0
50
100
150
200
250
300
1/2006 1/2007 1/2008 1/2009 1/2010 1/2011 1/2012 1/2013 1/2014 1/2015 1/2016 1/2017 1/2018
Index FAO price index
Cereals Price Index Cereals 5 year avg. Food Price Index Food 5 year avg.Source: FAO
IR – 20 April 2018
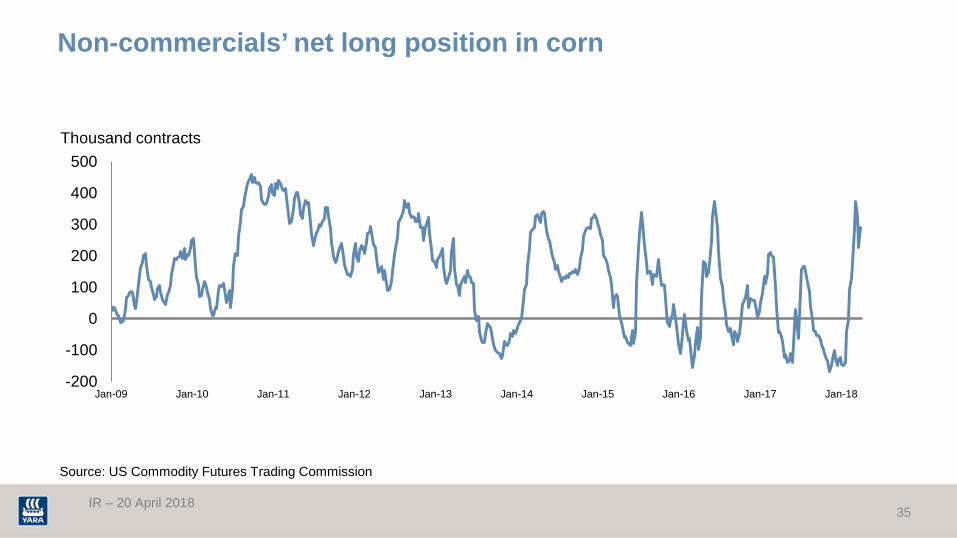
Non-commercials’ net long position in corn
35
-200
-100
0
100
200
300
400
500
Jan-09 Jan-10 Jan-11 Jan-12 Jan-13 Jan-14 Jan-15 Jan-16 Jan-17 Jan-18
Thousand contracts
Source: US Commodity Futures Trading Commission
IR – 20 April 2018
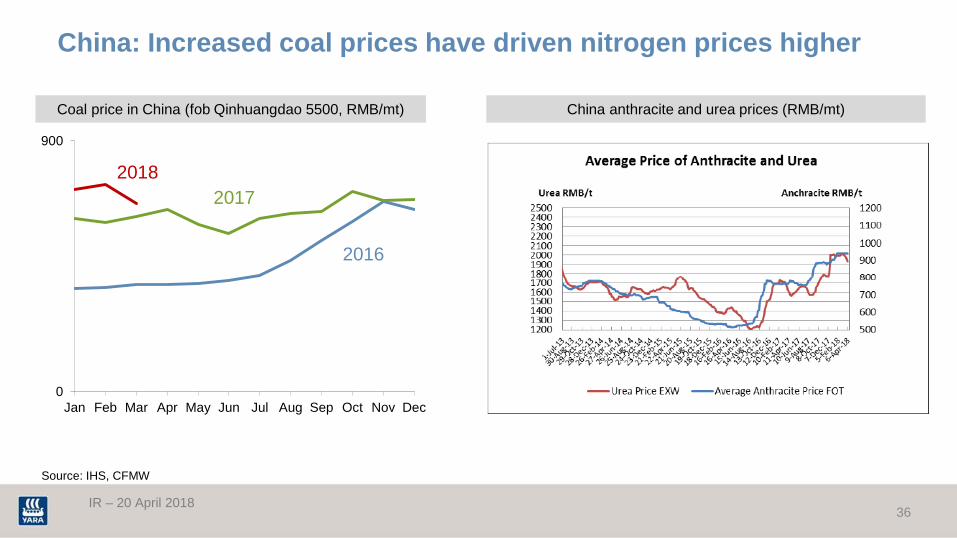
China: Increased coal prices have driven nitrogen prices higher
36
Coal price in China (fob Qinhuangdao 5500, RMB/mt) China anthracite and urea prices (RMB/mt)
Source: IHS, CFMW
0
900
Jan Feb Mar Apr May Jun Jul Aug Sep Oct Nov Dec
2016
2018 2017
IR – 20 April 2018
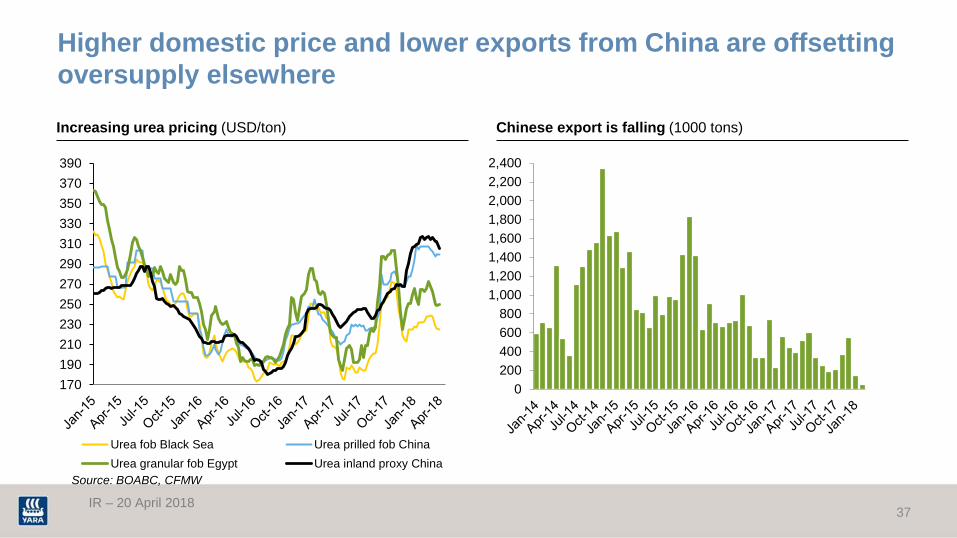
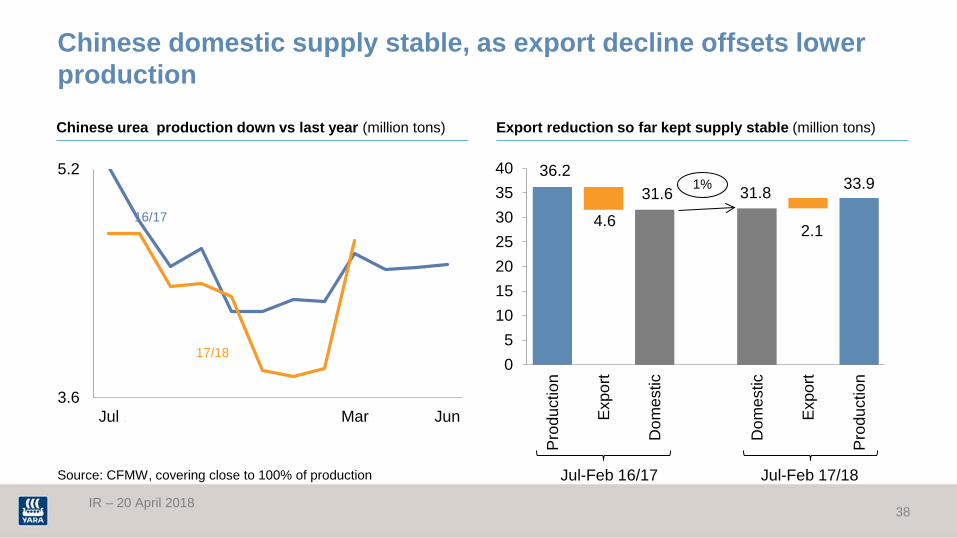
Higher domestic price and lower exports from China are offsetting oversupply elsewhere
37
170190210230250270290310330350370390
Urea fob Black Sea Urea prilled fob ChinaUrea granular fob Egypt Urea inland proxy China
Source: BOABC, CFMW
Increasing urea pricing (USD/ton) Chinese export is falling (1000 tons)
0200400600800
1,0001,2001,4001,6001,8002,0002,2002,400
IR – 20 April 2018
36.2
4.6
31.6 31.8
2.1
33.9
05
10152025303540
Pro
duct
ion
Exp
ort
Dom
estic
Dom
estic
Exp
ort
Pro
duct
ion
3.6
5.2
Jul Aug Sep Oct Nov Dec Jan Feb Mar Apr May Jun
Source: CFMW, covering close to 100% of production
17/18
Chinese domestic supply stable, as export decline offsets lower production
Jul-Feb 16/17 Jul-Feb 17/18
1%
16/17
Chinese urea production down vs last year (million tons) Export reduction so far kept supply stable (million tons)
38

IR – 20 April 2018
Deliveries in USA and Europe lagging last season, partly due to late spring
0
14
13/14 14/15 15/16 16/17 17/180
7
13/14 14/15 15/16 16/17 17/18
Source: Yara estimate for fertilizer deliveries to selected West European countries. Total nitrogen deliveries based on TFI, US Trade Commission, Blue-Johnson and Yara estimates
West Europe Million tons N USA Million tons N
39
-5% -7%
Domestic
Production
Production
Net imports
IR – 20 April 2018
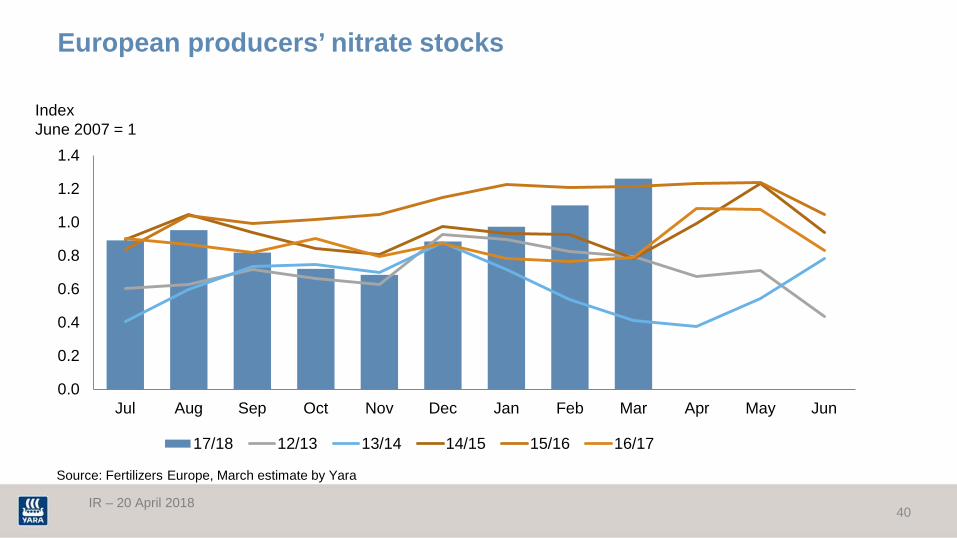
European producers’ nitrate stocks
0.0
0.2
0.4
0.6
0.8
1.0
1.2
1.4
Jul Aug Sep Oct Nov Dec Jan Feb Mar Apr May Jun
17/18 12/13 13/14 14/15 15/16 16/17
Source: Fertilizers Europe, March estimate by Yara
Index June 2007 = 1
40
IR – 20 April 2018
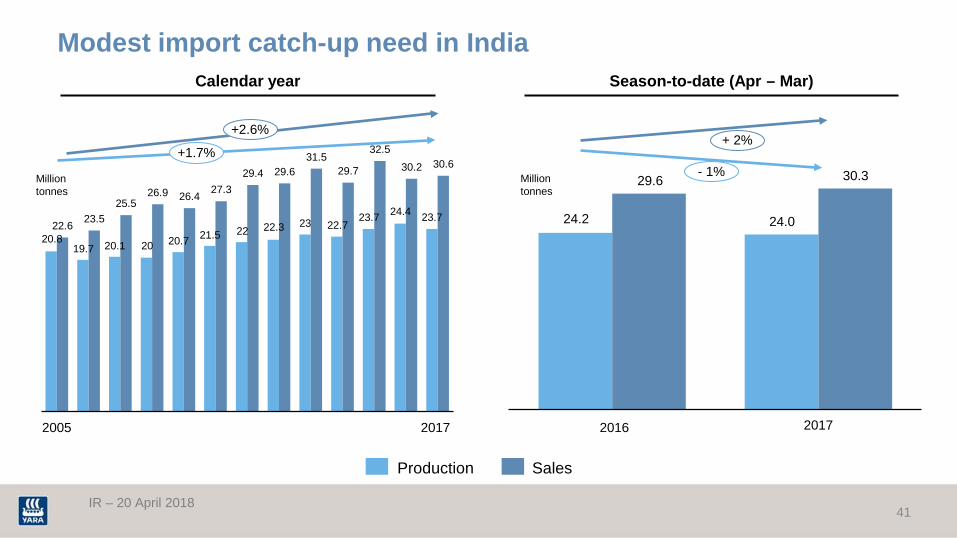
24.2 24.0
29.6 30.3
Modest import catch-up need in India
41
20.8 19.7 20.1 20 20.7 21.5 22 22.3 23 22.7
23.7 24.4 23.7 22.6 23.5
25.5 26.9 26.4 27.3
29.4 29.6 31.5
29.7
32.5 30.2 30.6
+1.7%
2017 2016 2017
+2.6%
2005
Production Sales
Million tonnes
+ 2%
- 1%
Season-to-date (Apr – Mar) Calendar year
Million tonnes
IR – 20 April 2018
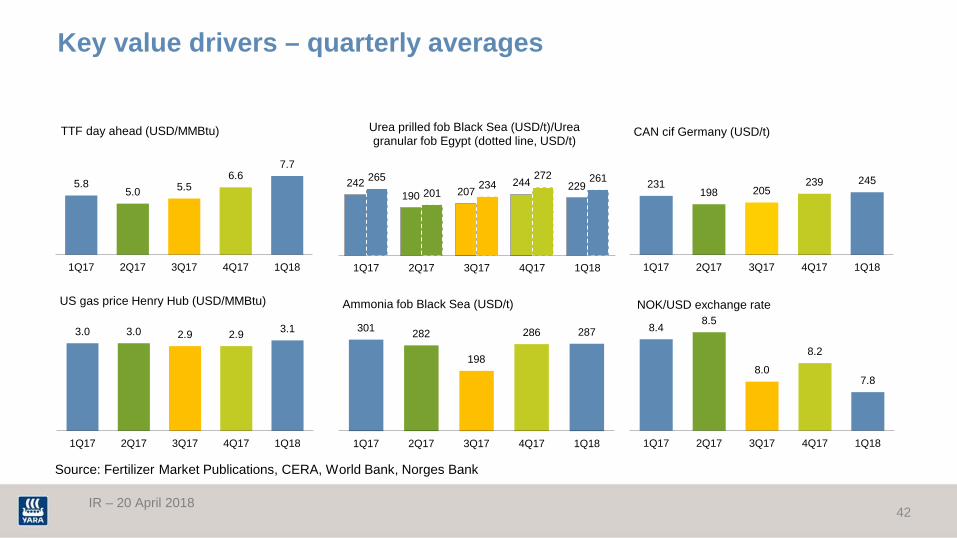
Key value drivers – quarterly averages
42
242 190 207
244 229 265
201 234
272 261
1Q17 2Q17 3Q17 4Q17 1Q18
Urea prilled fob Black Sea (USD/t)/Urea granular fob Egypt (dotted line, USD/t)
231 198 205
239 245
1Q17 2Q17 3Q17 4Q17 1Q18
CAN cif Germany (USD/t)
3.0 3.0 2.9 2.9 3.1
1Q17 2Q17 3Q17 4Q17 1Q18
US gas price Henry Hub (USD/MMBtu)
5.8 5.0 5.5
6.6 7.7
1Q17 2Q17 3Q17 4Q17 1Q18
TTF day ahead (USD/MMBtu)
8.4 8.5
8.0
8.2
7.8
1Q17 2Q17 3Q17 4Q17 1Q18
NOK/USD exchange rate
301 282
198
286 287
1Q17 2Q17 3Q17 4Q17 1Q18
Ammonia fob Black Sea (USD/t)
Source: Fertilizer Market Publications, CERA, World Bank, Norges Bank

IR – 20 April 2018
10-year fertilizer prices – monthly averages
43
0
200
400
600
800
2008 2009 2010 2011 2012 2013 2014 2015 2016 2017 2018
USD/t Urea prilled fob Black Sea/Urea granular fob Egypt
Average prices 2008 - 2017
0
200
400
600
800
1,000
1,200
2008 2009 2010 2011 2012 2013 2014 2015 2016 2017 2018
USD/t DAP fob US Gulf/MOP granular fob Vancouver
0
100
200
300
400
500
2008 2009 2010 2011 2012 2013 2014 2015 2016 2017 2018
USD/t CAN cif Germany
0
200
400
600
800
1,000
2008 2009 2010 2011 2012 2013 2014 2015 2016 2017 2018
USD/t Ammonia fob Black Sea
Source: Fertilizer Market Publications
IR – 20 April 2018


