73
Yarmouk University Hijjawi Faculty For Engineering Tech Project Management and Quality Control PROJECT PLANNING AND SCHEDULING Fall 2014 1 A. Al-Tamimi © Lecture 04
| Date post: | 26-Dec-2015 |
| Category: |
Documents |
| Upload: | catherine-pope |
| View: | 213 times |
| Download: | 0 times |
A. Al-Tamimi © 1
Yarmouk University Hijjawi Faculty For Engineering
Tech
Project Managementand
Quality Control
PROJECT PLANNING AND SCHEDULING
Fall 2014
Lecture 04
A. Al-Tamimi © 2
Lecture Overview
• Work Breakdown Structure (WBS)
• Estimating Activity Duration• Resource Breakdown Structure• Project Network Diagram• Critical Path Method
Lecture 04
A. Al-Tamimi © 3
Work Breakdown Structure (WBS)
The Work Breakdown Structure (WBS) is a hierarchical description of the work that must be done to complete the project as defined in the Project Overview Statement (POS).
An activity is simply a chunk of work.
A task is a smaller chunk of work.
A work package is a complete description of how the tasks that make up an activity will actually be done– It includes a description of the what, who, when,
and how of the work.Lecture 04
4
Work Breakdown Structure (WBS)
Lecture 04 A. Al-Tamimi & Mohammad Al Bataineh ©
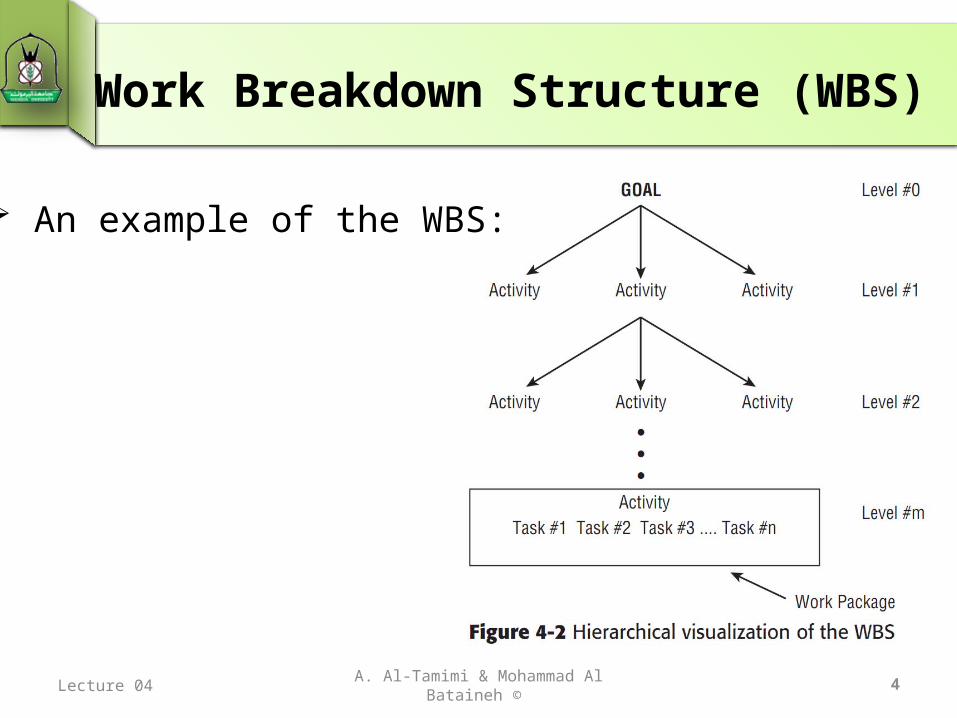
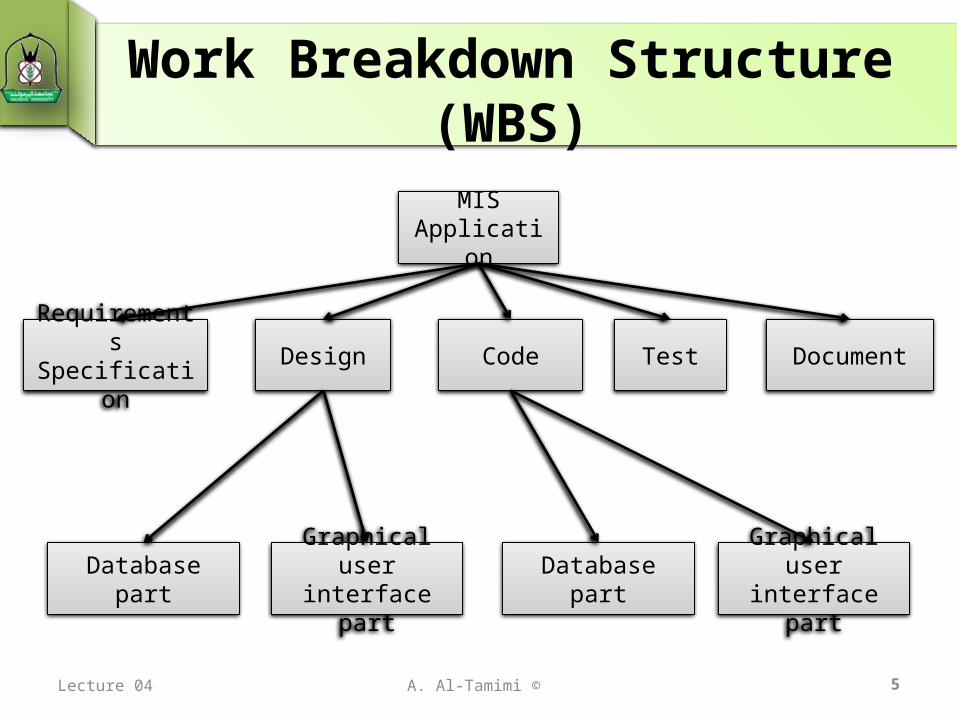
An example of the WBS:
A. Al-Tamimi ©
Work Breakdown Structure (WBS)
5
MISApplication
RequirementsSpecification Design Code Test Document
Database part Graphical user interface part Database part Graphical user
interface part
Lecture 04

A. Al-Tamimi © 6
Work Breakdown Structure (WBS)
Breaking down work into a hierarchy of activities, tasks, and work packages is called decomposition.
As a general rule, when an activity at Level n is decomposed into a set of activities at Level n+1 and the work associated with those activities is complete, the activity at Level n, from which they were defined, is complete
Lecture 04
7
Work Breakdown Structure (WBS)
• The WBS has four uses:– Thought process tool– Architectural design tool– Planning tool– Project status reporting tool
Lecture 04 A. Al-Tamimi ©
A. Al-Tamimi © 8
WBS: Thought Process Tool
• First and maybe foremost, the WBS is a thought process.
• As a thought process, it is a design and planning tool.– It helps the project manager and the
project team visualize exactly how the work of the project can be defined and managed effectively
Lecture 04
A. Al-Tamimi © 9
WBS: Architectural Design Tool
• WBS is a picture of the work of the project and how the items of work are related to one another.
• It must make sense.
Lecture 04
A. Al-Tamimi © 10
WBS: Planning Tool
• In the planning phase, the WBS gives the project team a detailed representation of the project as a collection of activities that must be completed in order for the project to be completed.
Lecture 04
A. Al-Tamimi © 11
WBS: Project Status Reporting Tool
• The WBS is used as a structure for reporting project status.
• As work is completed, activities will be completed.• Completion of lower-level activities causes higher-
level activities to be partially complete.• Some of these higher-level activities may represent
significant progress whose completion will be milestone events in the course of the project.
• WBS defines milestone events that can be reported to senior management and to the customer.
Lecture 04
A. Al-Tamimi © 12
Generating the WBS
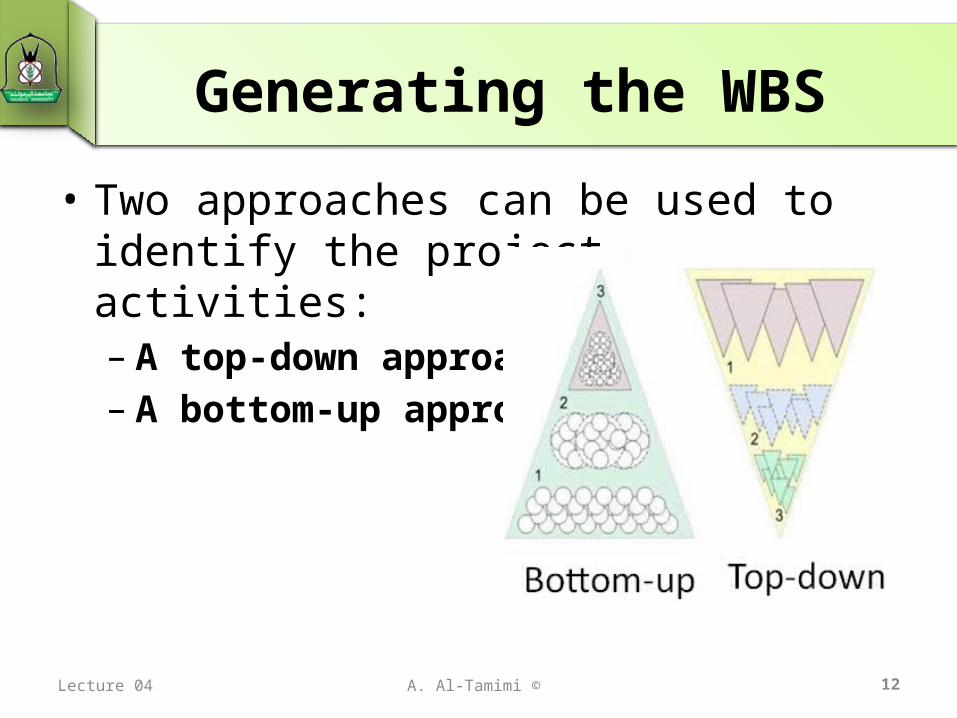
• Two approaches can be used to identify the project activities:– A top-down approach– A bottom-up approach
Lecture 04
A. Al-Tamimi © 13
Top-Down Approach The top-down approach begins at the goal level
and successively partitions work down to lower levels of definition,
until the participants are satisfied that the work has been sufficiently defined,
to allow you to estimate time, cost, and resource requirements first at the activity level and then aggregate to the project level.
Because the activities are defined to this level of detail, project time, cost, and resource requirements are estimated much more accurately.
You can sequence the project work so that as many activities as possible are performed in parallel, rather than in sequence.Lecture 04
A. Al-Tamimi © 14
Bottom-Up Approach
• This approach is more like a brainstorming session than an organized approach to building the WBS.
• The entire planning team agrees to the first-level breakdown.
• The planning team is then divided into as many groups as there are first-level activities
Lecture 04
A. Al-Tamimi © 15
Bottom-Up Approach• To do this, they proceed as follows:
– Someone in the group identifies an activity and announces it to the group. If the group agrees, then the activity is written on a slip of paper and put in the middle of the table. The process repeats itself until no new ideas are forthcoming.
– The group then sorts the slips into activities that seem to be related to one another. This grouping activity should help the planning team add missing activities or remove redundant ones.
– Once the team is satisfied it has completed the activity list for the first-level breakdown, the members are finished. Each group then reports to the entire planning team the results of its work.
– Final critiques are given, missing activities added, and redundant activities removed.
Lecture 04
A. Al-Tamimi © 16
Estimating Activity Duration
• Activity duration is a random variable.
• One of your goals in estimating activity duration is to define the activity narrow details so that your estimates have a narrow variance.
• As project work is completed, you will be able to improve the earlier estimates of activities scheduled later in the project.
Lecture 04
17
Variation in Task Duration:
The following factors can cause variation in the actual task duration:1) Varying skill levels: Our strategy is to
estimate activity duration based on using people of average skills assigned to work on the activity.
2) Unexpected events: Random acts of nature, vendor delays, incorrect shipments of materials, traffic jams, power failures, and sabotage (damages) are but a few of the possibilities
Lecture 04 A. Al-Tamimi ©
A. Al-Tamimi © 18
Variation in Task Duration :
3) Efficiency of worker’s time: Every time a worker is interrupted, it takes additional time to get up to the level of productivity attained prior to the time of the interruption.
4) Mistakes and misunderstandings: Despite all of your efforts to clearly and concisely describe each task that is to be performed, you will most likely miss a few.
Lecture 04

A. Al-Tamimi © 19
Activity Variation Causes :
5) Common cause variation: Apart from all of the previous factors that can influence activity duration, the reality is that durations will vary for no reason other than the statistical variation that arises because the duration is in fact a random variable.A task duration has a natural variation,
and there is nothing you do can to cause a favorable change in that variation. It is there and must be accepted!
Lecture 04
A. Al-Tamimi © 20
Six Methods of Estimating Activity Duration
Reminder: As we stated before1) Similarity to other activities2) Historical data3) Expert advice4) Delphi technique5) Three-point technique6) Wide-band Delphi technique
Lecture 04
A. Al-Tamimi © 21
Estimation Precision• Early estimates of activity duration will not
be as good as later estimates.
• We can only hope that we have gained some knowledge through the project to improve our estimates.
• In our top-down project planning model, we start out with “roughly right” estimates, with the intention of improving the precision of these estimates later in the project.
Lecture 04
A. Al-Tamimi © 22
Estimating Resource Requirements
• Types of Resources: People Facilities Equipment Money Materials
Lecture 04
23
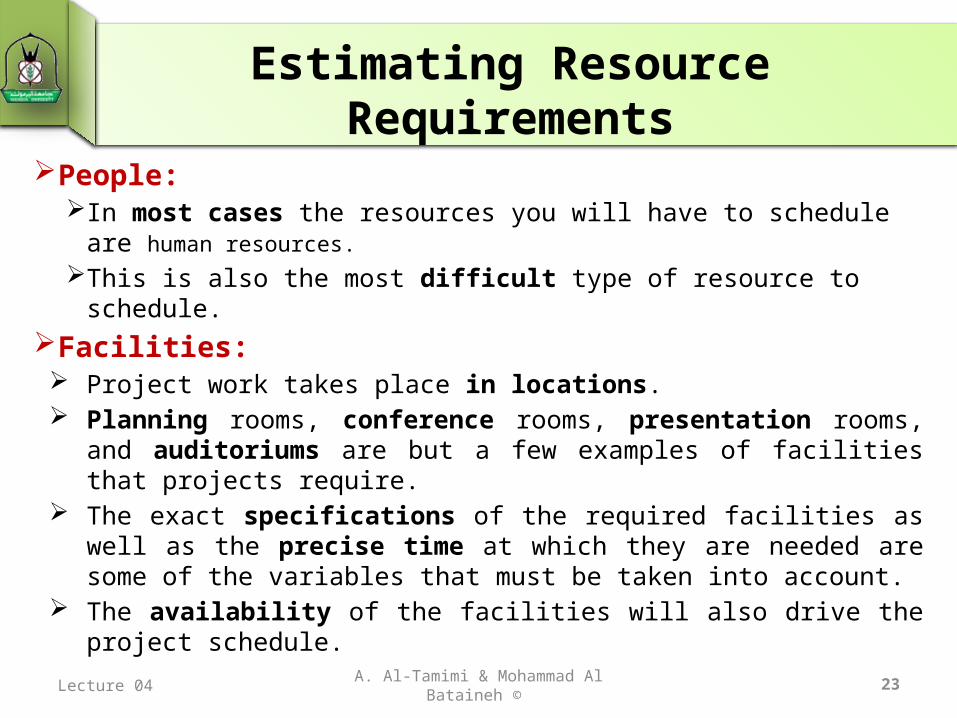
Estimating Resource Requirements
People: In most cases the resources you will have to schedule are
human resources.This is also the most difficult type of resource to schedule.
Facilities: Project work takes place in locations. Planning rooms, conference rooms, presentation
rooms, and auditoriums are but a few examples of facilities that projects require.
The exact specifications of the required facilities as well as the precise time at which they are needed are some of the variables that must be taken into account.
The availability of the facilities will also drive the project schedule.
Lecture 04 A. Al-Tamimi & Mohammad Al Bataineh ©

A. Al-Tamimi © 24
Estimating Resource Requirements
Equipment: Equipment is treated exactly the same as facilities. The
availability of equipment will also drive the task schedule. Money:
Accountants would tell us that everything is eventually reduced to dollars, which is true.
Project expenses typically include travel, accommodations, meals, and supplies.
Materials: The timely availability of parts to be used in the fabrication
of products and other physical deliverables will be part of the project work schedule.
For example, the materials needed to build a PC might include processor, memory, hard-drives, and video cards.
Lecture 04
25
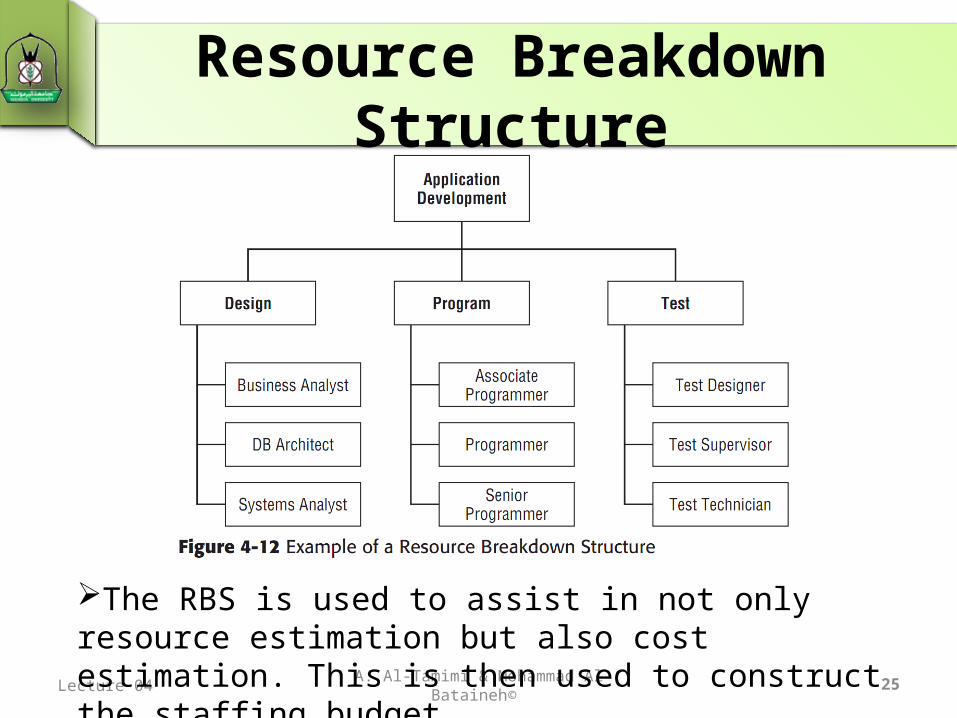
Resource Breakdown Structure
Lecture 04 A. Al-Tamimi & Mohammad Al Bataineh©
The RBS is used to assist in not only resource estimation but also cost estimation. This is then used to construct the staffing budget.
26
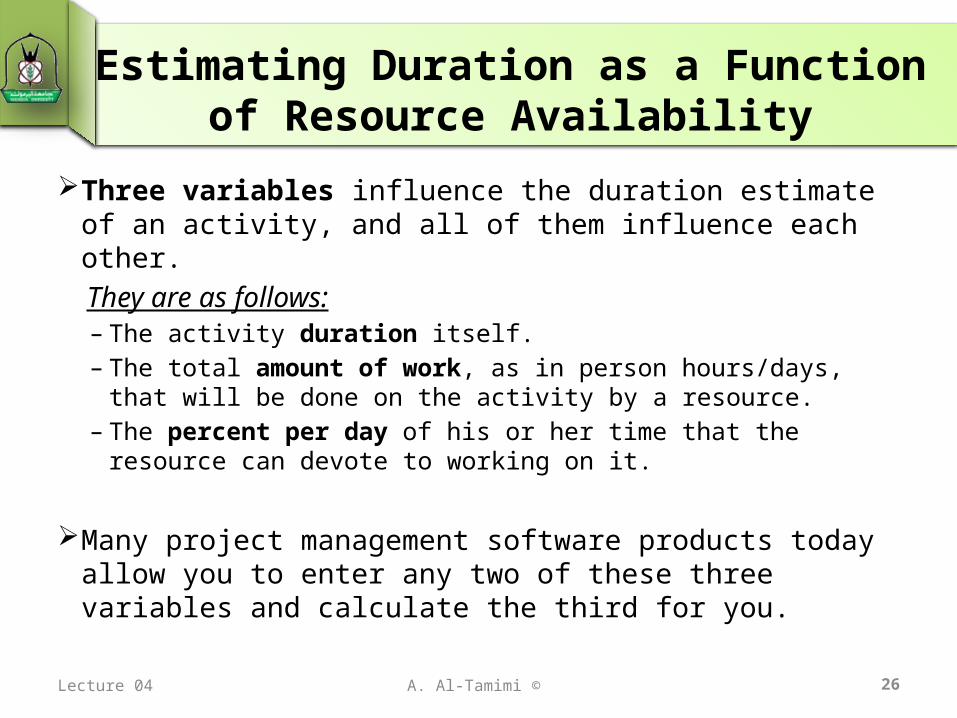
Estimating Duration as a Function of Resource Availability
Three variables influence the duration estimate of an activity, and all of them influence each other.
They are as follows:– The activity duration itself.– The total amount of work, as in person hours/days,
that will be done on the activity by a resource.– The percent per day of his or her time that the
resource can devote to working on it.
Many project management software products today allow you to enter any two of these three variables and calculate the third for you.
Lecture 04 A. Al-Tamimi ©
A. Al-Tamimi © 27
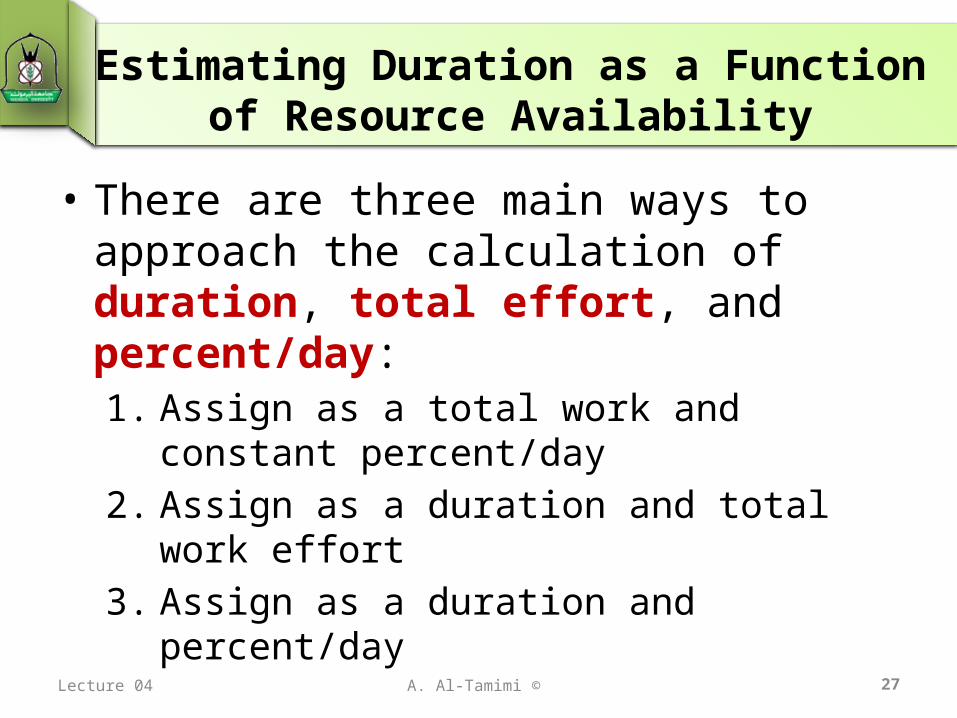
Estimating Duration as a Function of Resource Availability
• There are three main ways to approach the calculation of duration, total effort, and percent/day:1. Assign as a total work and constant
percent/day2. Assign as a duration and total work
effort3. Assign as a duration and percent/day
Lecture 04
A. Al-Tamimi © 28
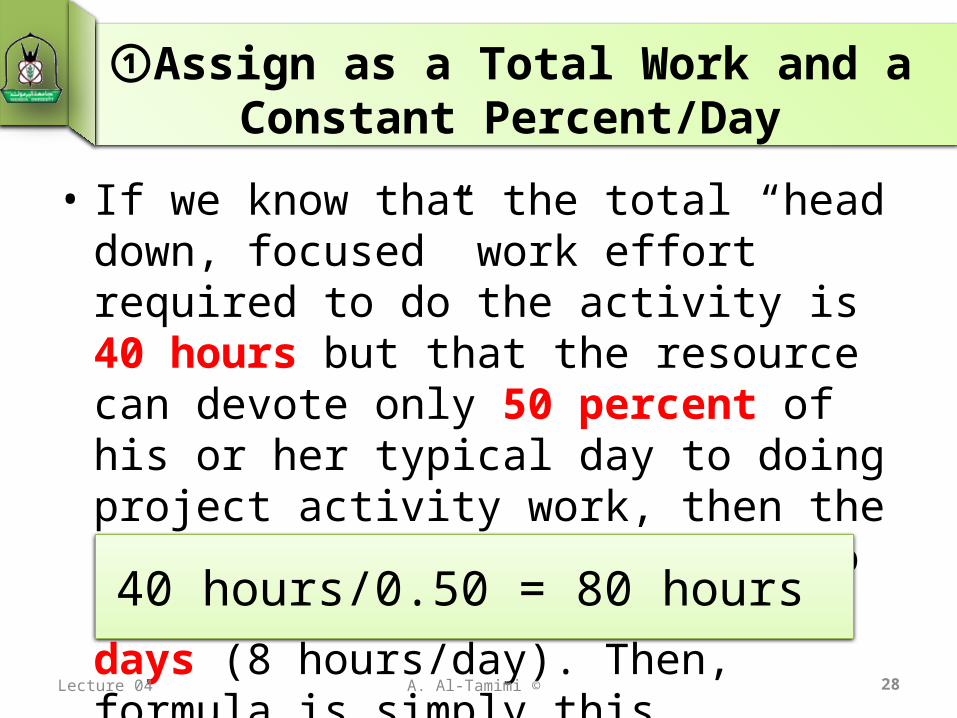
①Assign as a Total Work and a Constant Percent/Day
• If we know that the total “head down, focused” work effort required to do the activity is 40 hours but that the resource can devote only 50 percent of his or her typical day to doing project activity work, then the resulting duration is going to be 80 hours, or 10 business days (8 hours/day). Then, formula is simply this
Lecture 04
40 hours/0.50 = 80 hours
A. Al-Tamimi © 29
①Assign as a Total Work and a Constant Percent/Day
• The duration becomes a calculated value based on the percent-per-day and the work.
• This method is the one that most software products use as their default method.
• It’s tempting to use a percent-per-day resource allocation value that’s higher than it actually will be.– The project completion date is then invalid
because it is calculated using an overly optimistic duration.
Lecture 04
A. Al-Tamimi © 30
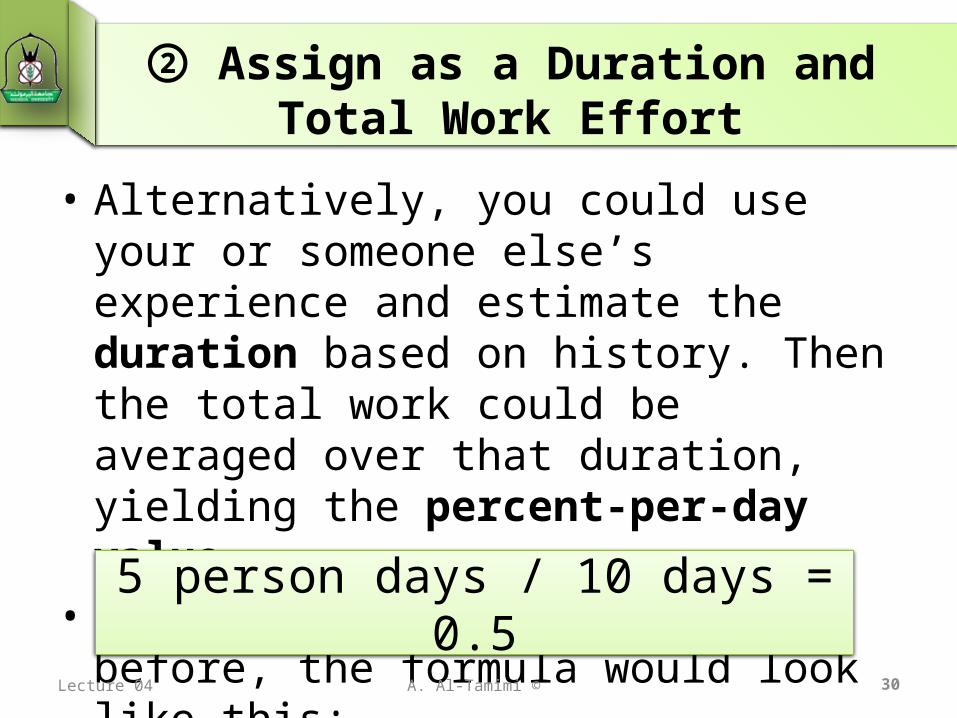
② Assign as a Duration and Total Work Effort
• Alternatively, you could use your or someone else’s experience and estimate the duration based on history. Then the total work could be averaged over that duration, yielding the percent-per-day value.
• Using the same values as before, the formula would look like this:
Lecture 04
5 person days / 10 days = 0.5
A. Al-Tamimi © 31
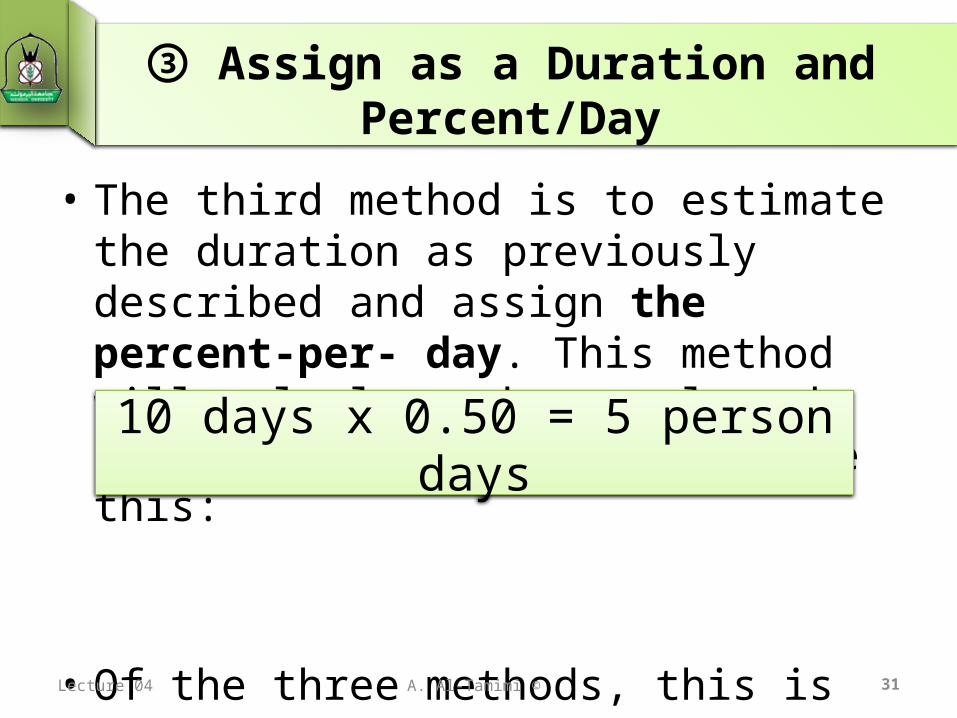
③ Assign as a Duration and Percent/Day
• The third method is to estimate the duration as previously described and assign the percent-per- day. This method will calculate the total work effort. The formula works like this:
• Of the three methods, this is the least used.
Lecture 04
10 days x 0.50 = 5 person days
A. Al-Tamimi ©
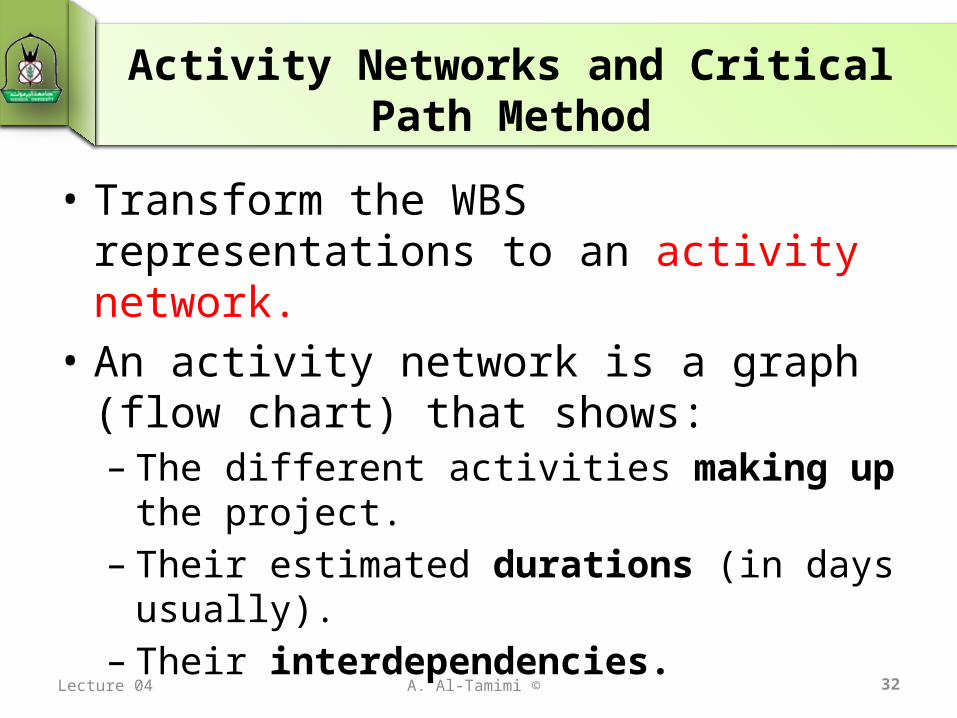
Activity Networks and Critical Path Method
• Transform the WBS representations to an activity network.
• An activity network is a graph (flow chart) that shows:– The different activities making up the
project.– Their estimated durations (in days
usually).– Their interdependencies.
32Lecture 04
Activity Networks Diagram
33Lecture 04 Mohammad Al Bataineh ©
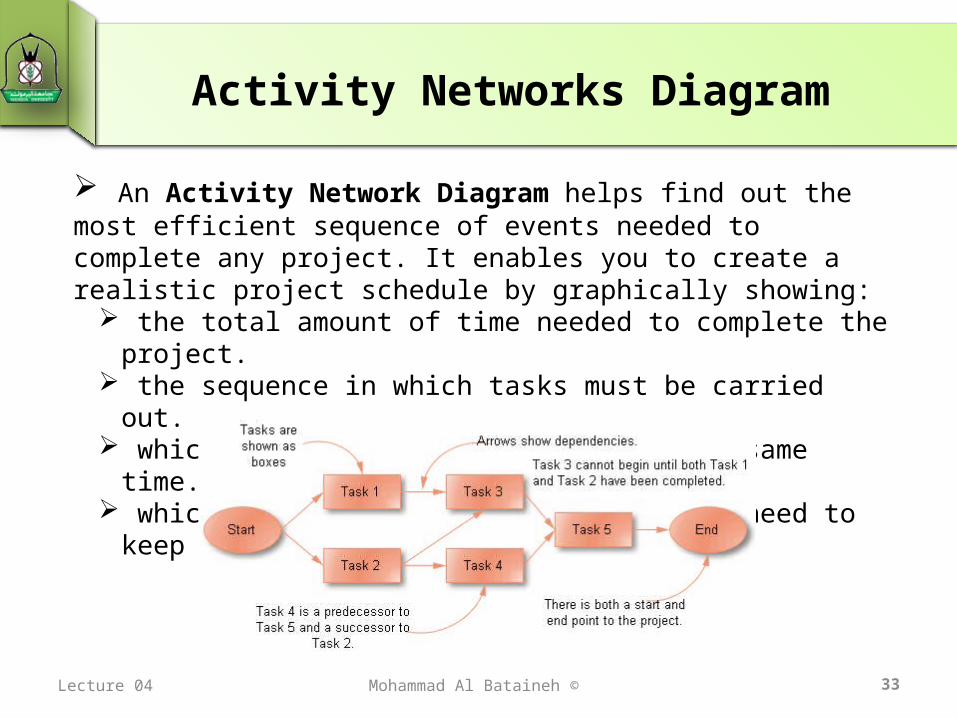
An Activity Network Diagram helps find out the most efficient sequence of events needed to complete any project. It enables you to create a realistic project schedule by graphically showing:
the total amount of time needed to complete the project. the sequence in which tasks must be carried out. which tasks can be carried out at the same time. which are the critical tasks that you need to keep an eye
on.
A. Al-Tamimi ©
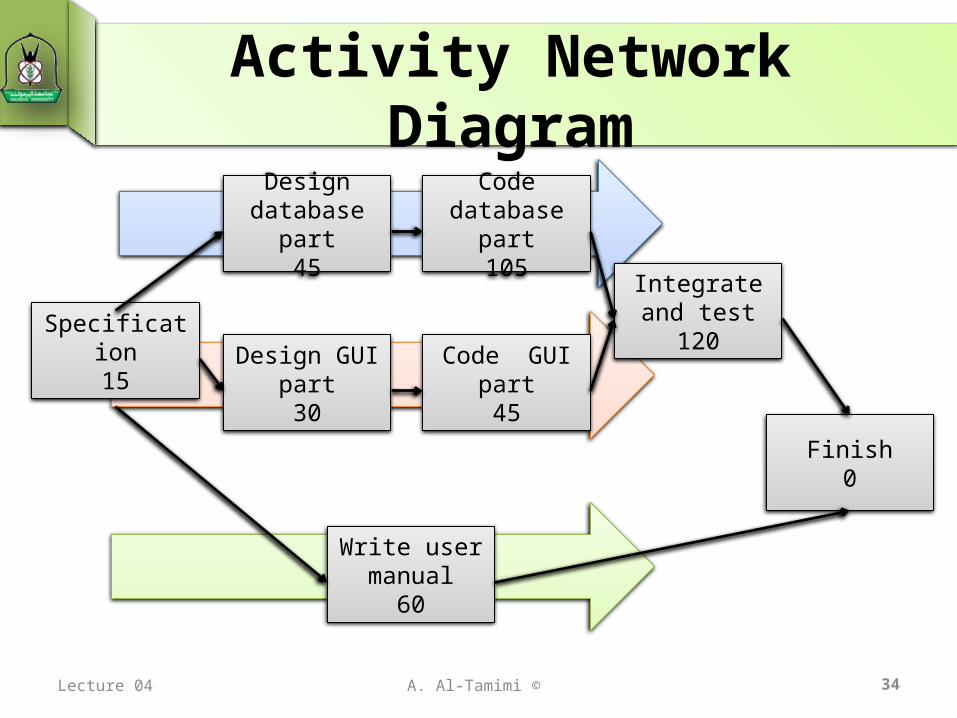
Activity Network Diagram
34
Specification15
Design database part
45
Code database part105
Design GUI part30
Code GUI part45
Write user manual
60
Integrate and test120
Finish0
Lecture 04
35
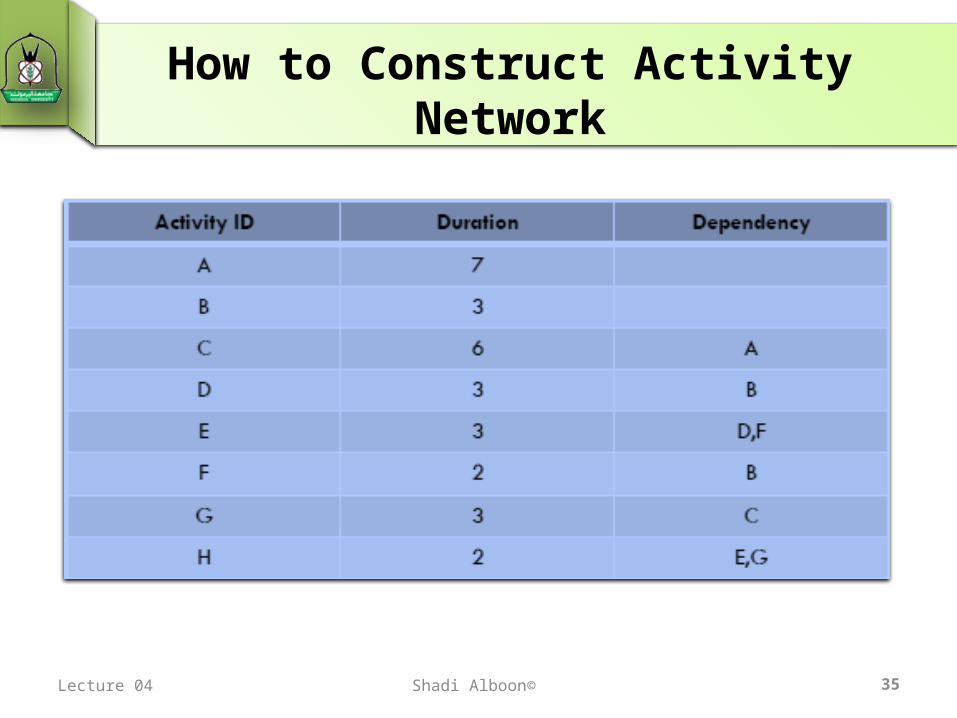
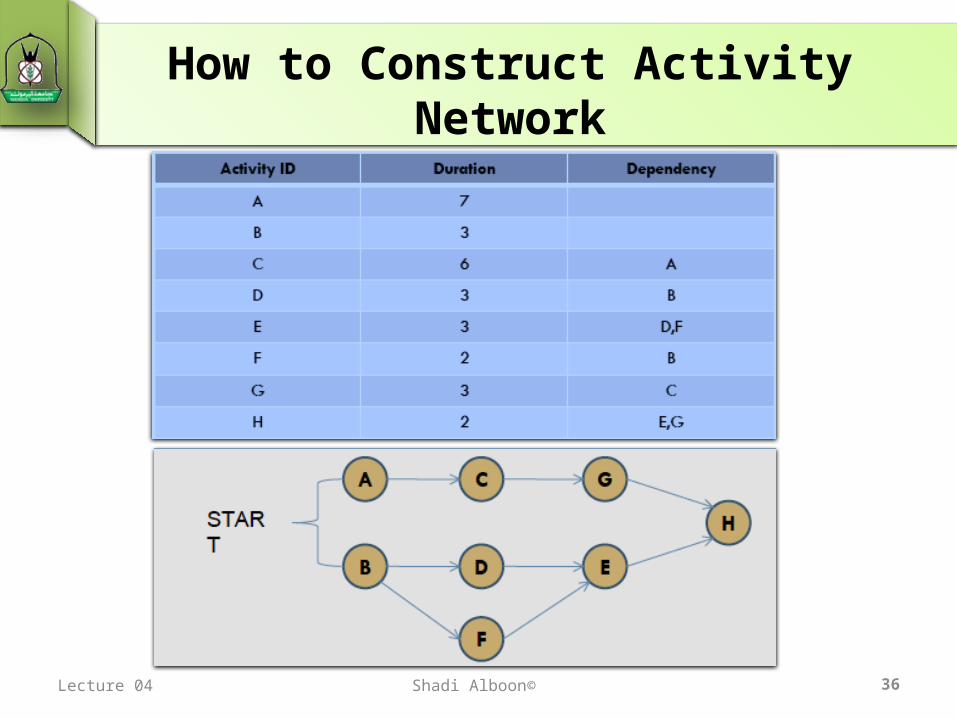
How to Construct Activity Network
Lecture 04 Shadi Alboon©
36
How to Construct Activity Network
Lecture 04 Shadi Alboon©
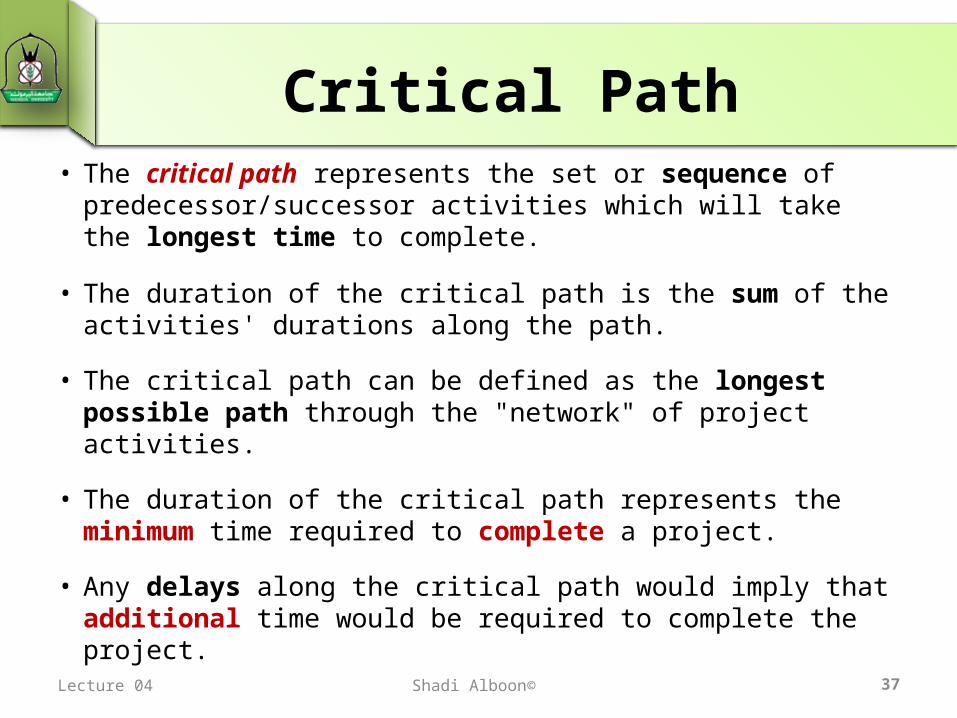
Critical Path• The critical path represents the set or sequence of
predecessor/successor activities which will take the longest time to complete.
• The duration of the critical path is the sum of the activities' durations along the path.
• The critical path can be defined as the longest possible path through the "network" of project activities.
• The duration of the critical path represents the minimum time required to complete a project.
• Any delays along the critical path would imply that additional time would be required to complete the project.
37Lecture 04 Shadi Alboon©
Critical Path
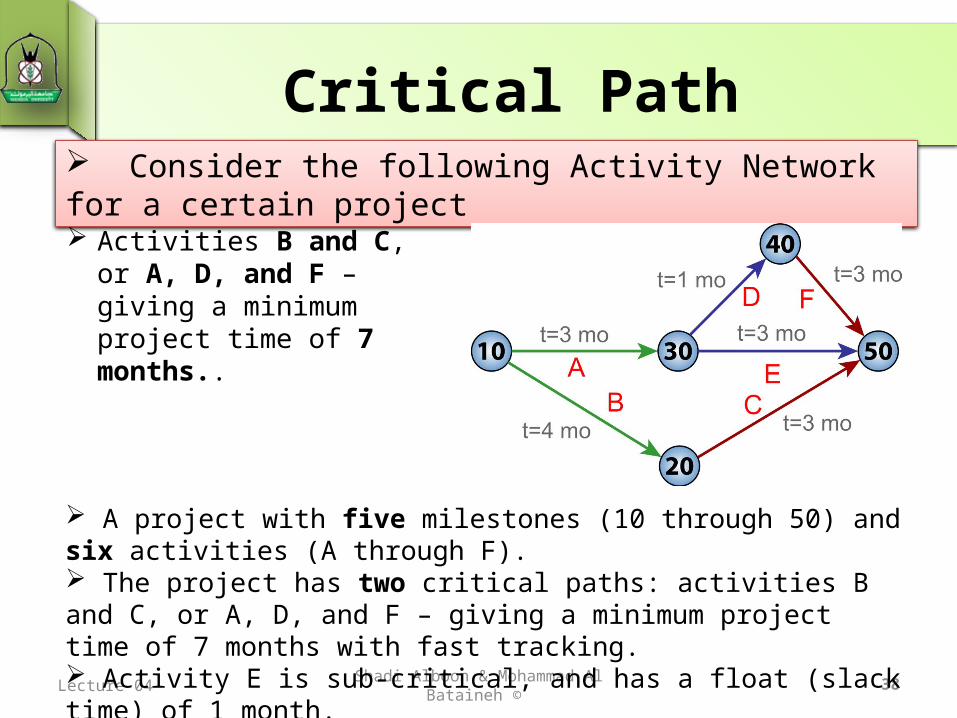
Activities B and C, or A, D, and F – giving a minimum project time of 7 months..
Lecture 04Shadi Alboon & Mohammad Al
Bataineh © 38
Consider the following Activity Network for a certain project
A project with five milestones (10 through 50) and six activities (A through F). The project has two critical paths: activities B and C, or A, D, and F – giving a minimum project time of 7 months with fast tracking. Activity E is sub-critical, and has a float (slack time) of 1 month.
39
Critical Path
Lecture 04 Shadi Alboon©

A. Al-Tamimi ©
Critical Path Method (CPM)
• Used to identify the path where any delay in the completion of these tasks will lengthen the project timescale, unless action is taken.
• We can get the following information from the activity network representation:– The minimum time to finish the
project (MT)• Maximum path time
– The earliest start time of a task (ES)• Maximum time from start to the task (on its
path).40Lecture 04
A. Al-Tamimi ©
Critical Path Method (CPM)
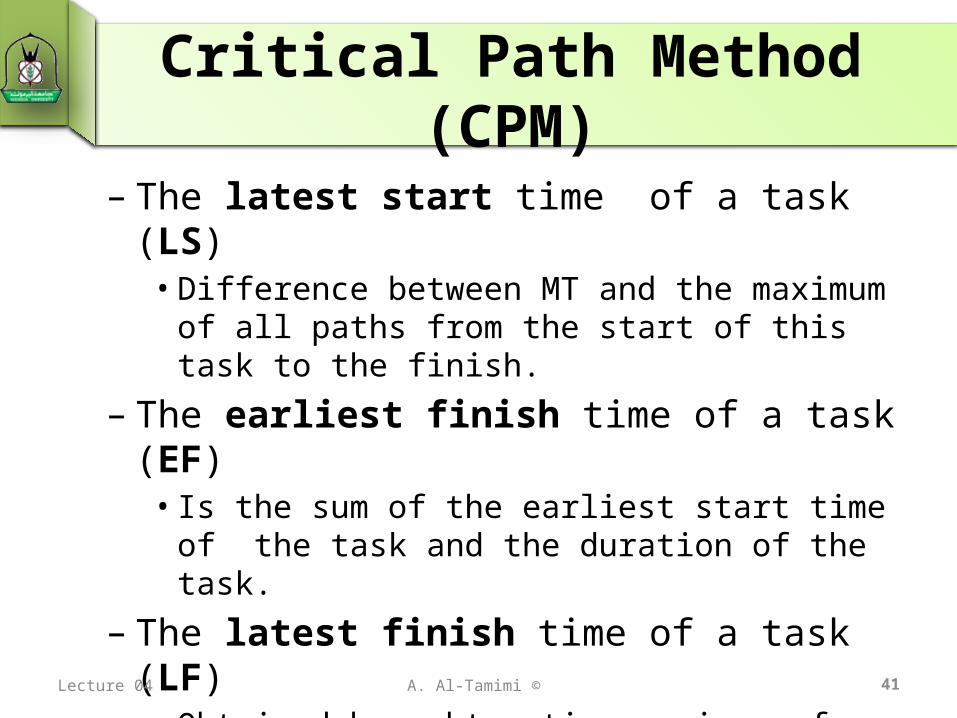
– The latest start time of a task (LS)• Difference between MT and the maximum
of all paths from the start of this task to the finish.
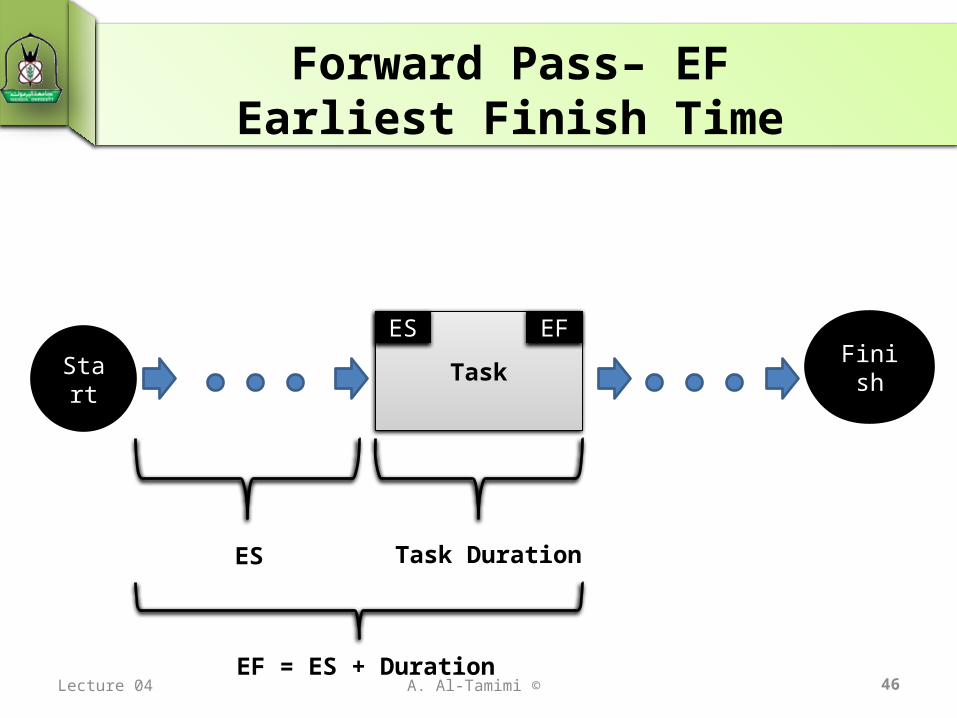
– The earliest finish time of a task (EF)• Is the sum of the earliest start time of the
task and the duration of the task.
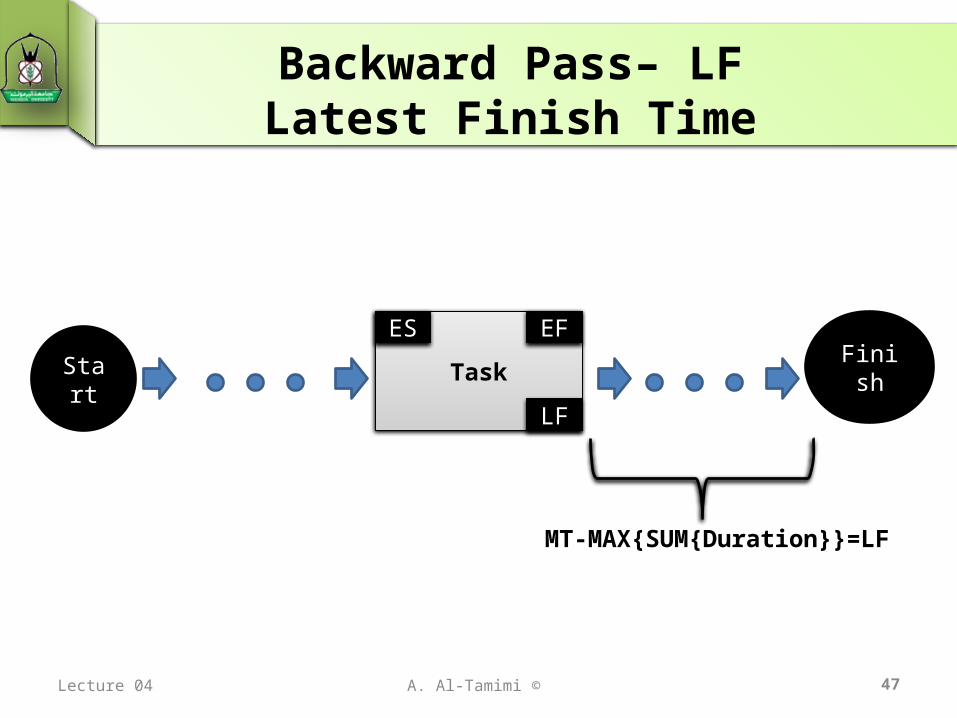
– The latest finish time of a task (LF)• Obtained by subtracting maximum of all
paths from the end of this task to finish from the MT value
(Or LF = LS+Task duration) 41Lecture 04
A. Al-Tamimi ©
Critical Path Method (CPM)
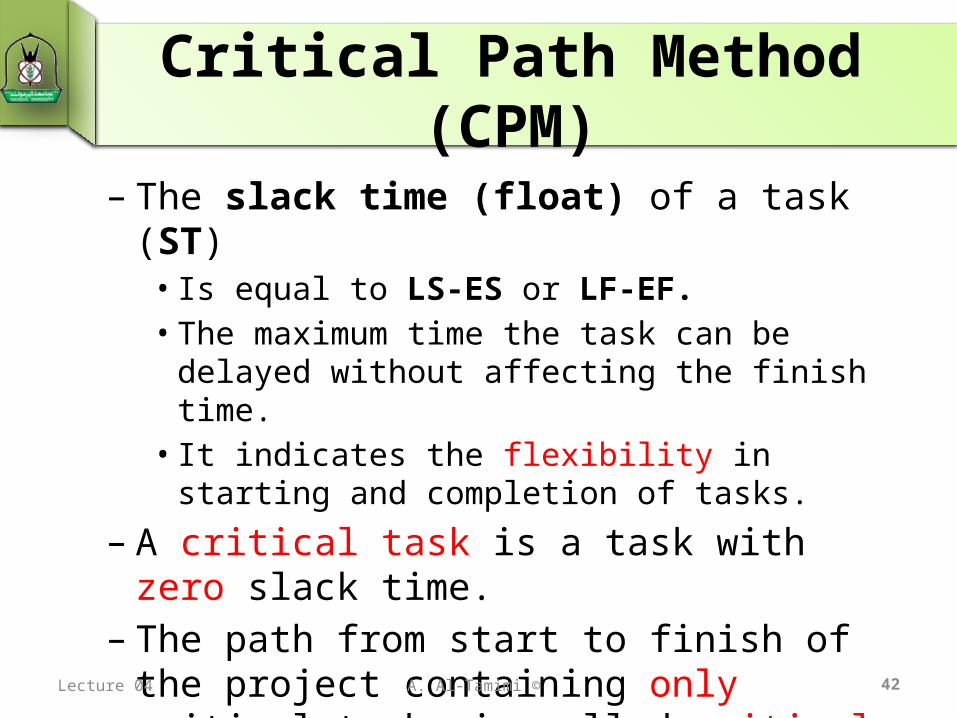
– The slack time (float) of a task (ST)• Is equal to LS-ES or LF-EF.• The maximum time the task can be delayed
without affecting the finish time.• It indicates the flexibility in starting and
completion of tasks.
– A critical task is a task with zero slack time.
– The path from start to finish of the project containing only critical tasks is called critical path
42Lecture 04
43
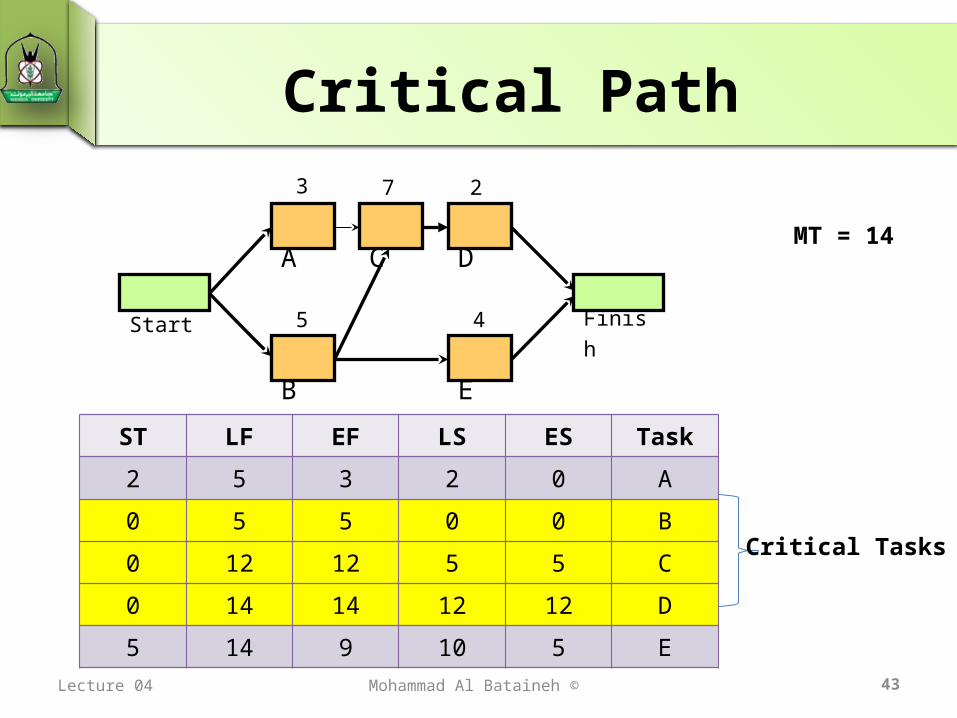
Critical Path
Lecture 04 Mohammad Al Bataineh ©
ST LF EF LS ES Task
2 5 3 2 0 A
0 5 5 0 0 B
0 12 12 5 5 C
0 14 14 12 12 D
5 14 9 10 5 E
Start
Finish
A C D
B
E
3 7 2
5 4
MT = 14
Critical Tasks
A. Al-Tamimi ©
Critical Path Method (CPM)
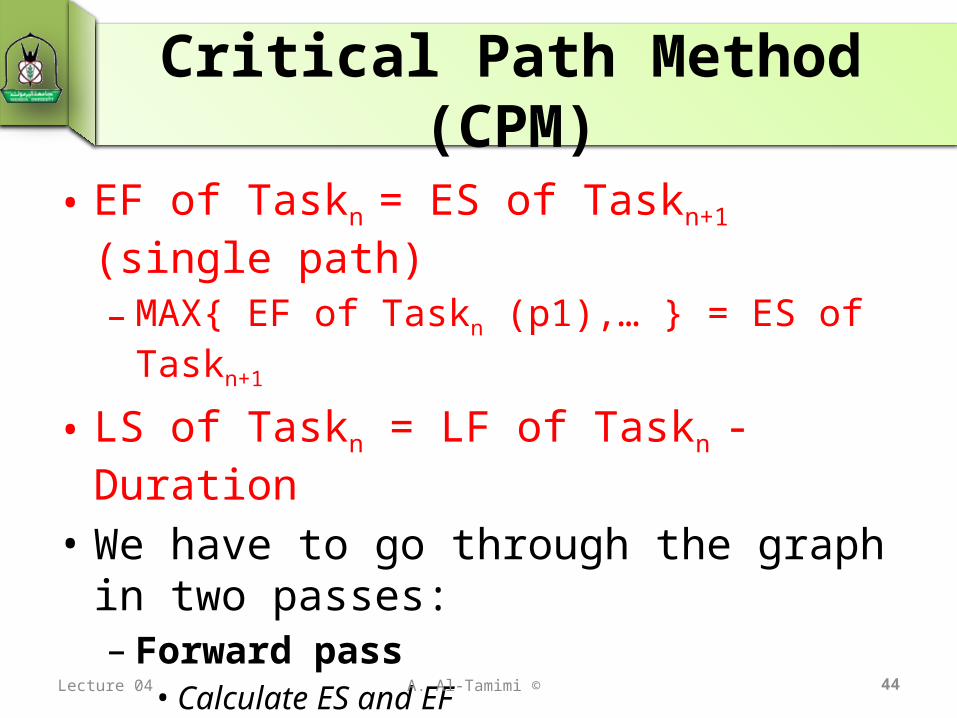
• EF of Taskn = ES of Taskn+1 (single path)–MAX{ EF of Taskn (p1),… } = ES of
Taskn+1
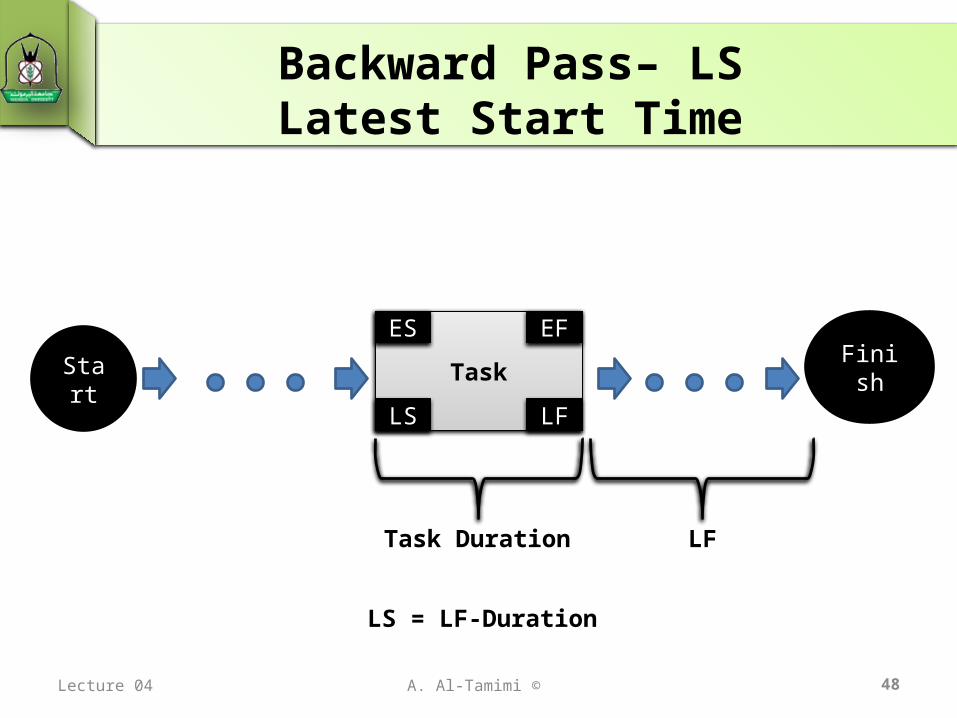
• LS of Taskn = LF of Taskn - Duration
• We have to go through the graph in two passes:– Forward pass• Calculate ES and EF
–Backward pass• Calculate LF and LS
44Lecture 04
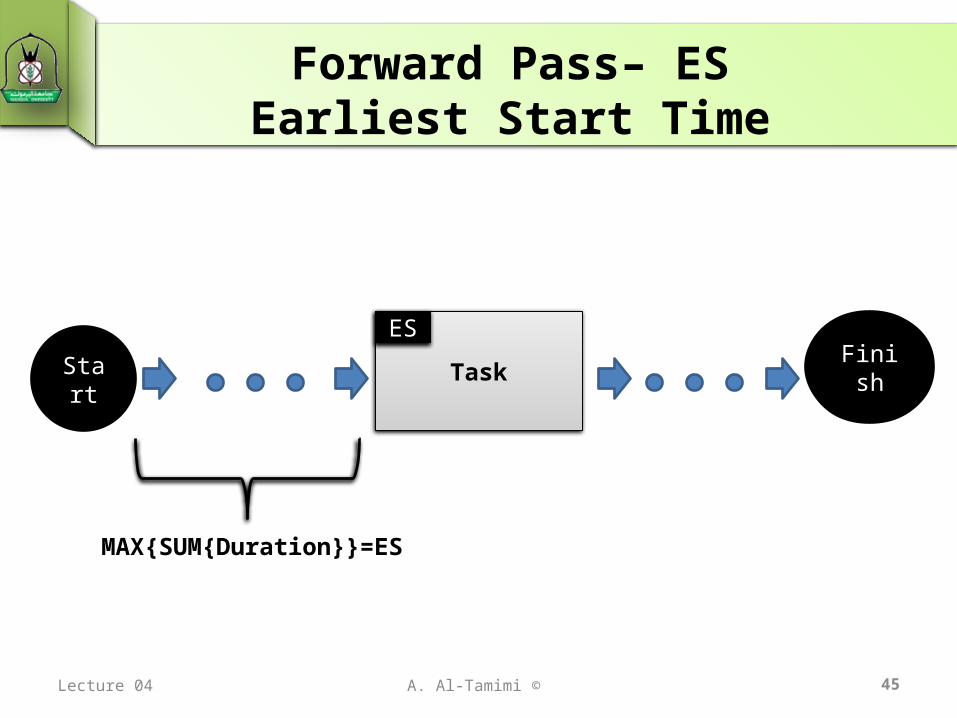
A. Al-Tamimi ©
Forward Pass– ESEarliest Start Time
45
TaskStart Finish
MAX{SUM{Duration}}=ES
ES
Lecture 04
A. Al-Tamimi ©
Forward Pass– EFEarliest Finish Time
46
TaskStart Finish
Task Duration
EF = ES + Duration
ES EF
ES
Lecture 04
A. Al-Tamimi ©
Backward Pass– LFLatest Finish Time
47
TaskStart Finish
MT-MAX{SUM{Duration}}=LF
ES EF
LF
Lecture 04
A. Al-Tamimi ©
Backward Pass– LSLatest Start Time
48
TaskStart Finish
LF
ES EF
LFLS
Task Duration
LS = LF-Duration
Lecture 04
A. Al-Tamimi ©
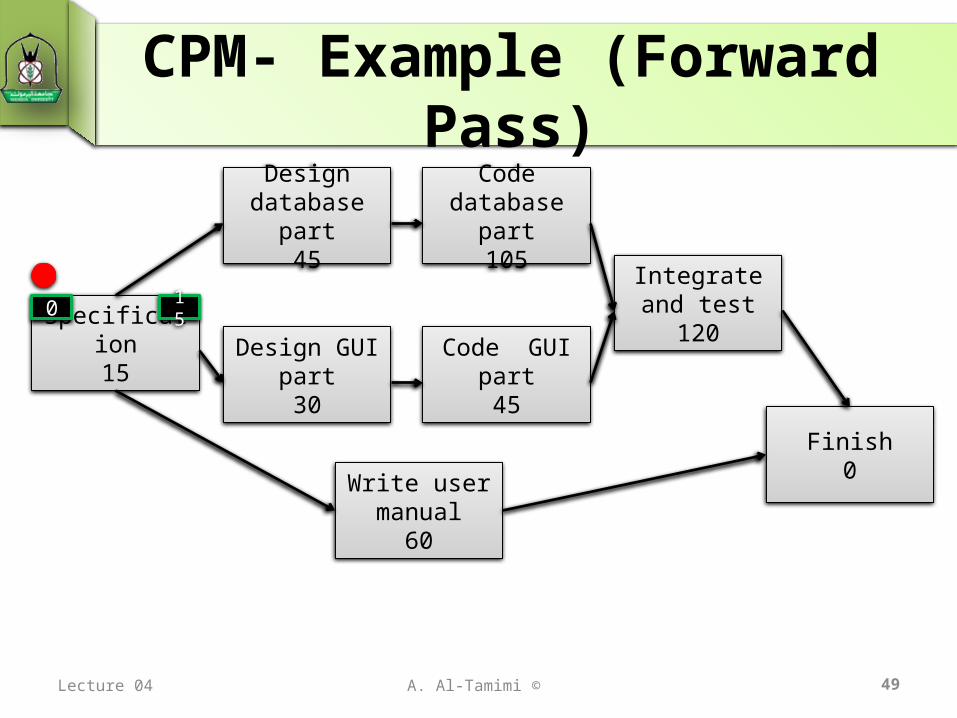
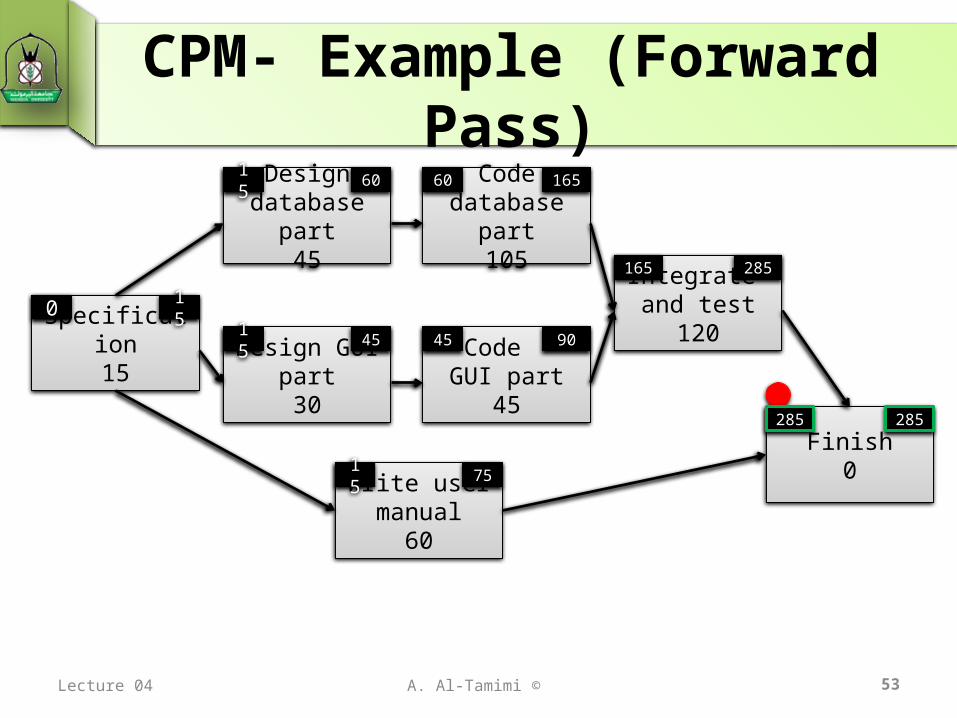
CPM- Example (Forward Pass)
49
Specification15
Design database part
45
Code database part105
Design GUI part30
Code GUI part45
Write user manual
60
Integrate and test120
Finish0
0 15
Lecture 04
A. Al-Tamimi ©
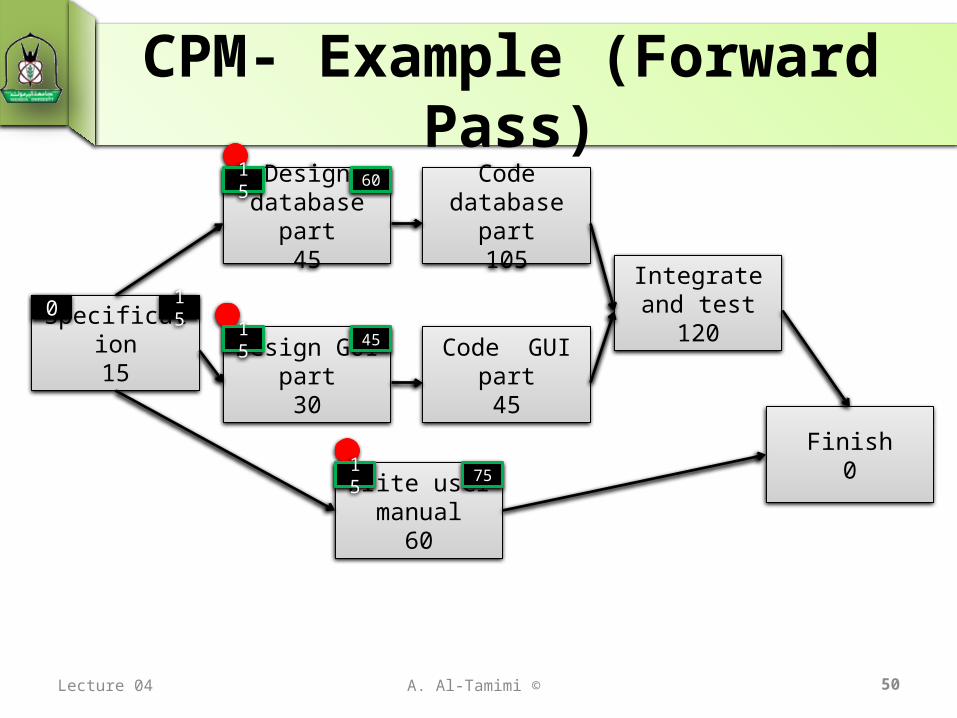
CPM- Example (Forward Pass)
50
Specification15
Design database part
45
Code database part105
Design GUI part30
Code GUI part45
Write user manual
60
Integrate and test120
Finish0
0 15
15
15
15
60
45
75
Lecture 04
A. Al-Tamimi ©
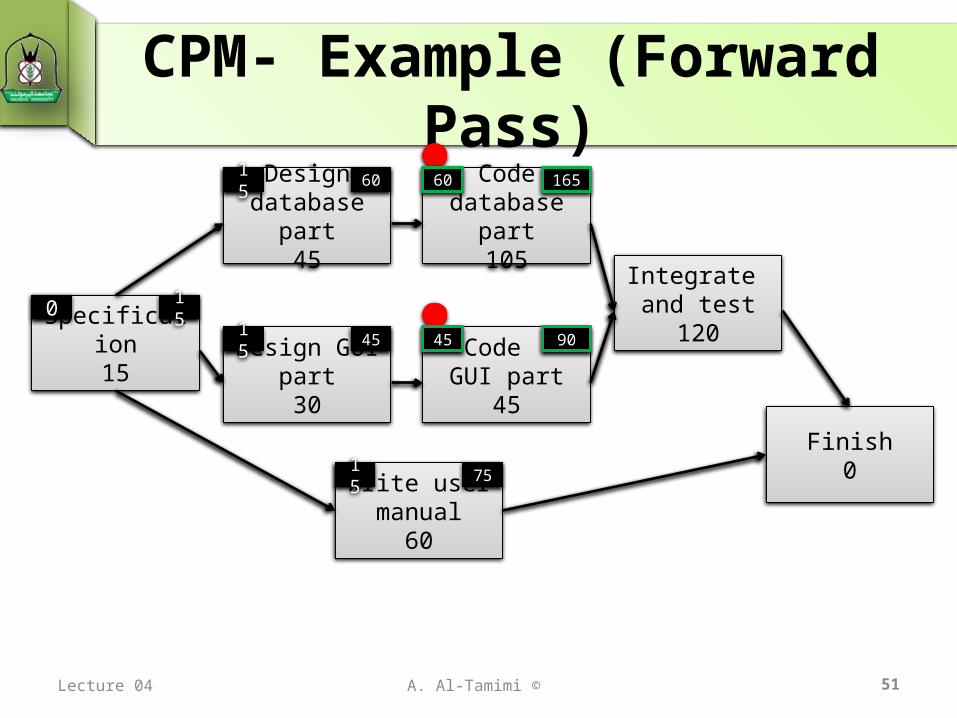
CPM- Example (Forward Pass)
51
Specification15
Design database part
45
Code database part105
Design GUI part30
Code GUI part
45
Write user manual
60
Integrate and test
120
Finish0
0 15
15
15
15
60
45
75
60
45
165
90
Lecture 04
A. Al-Tamimi ©
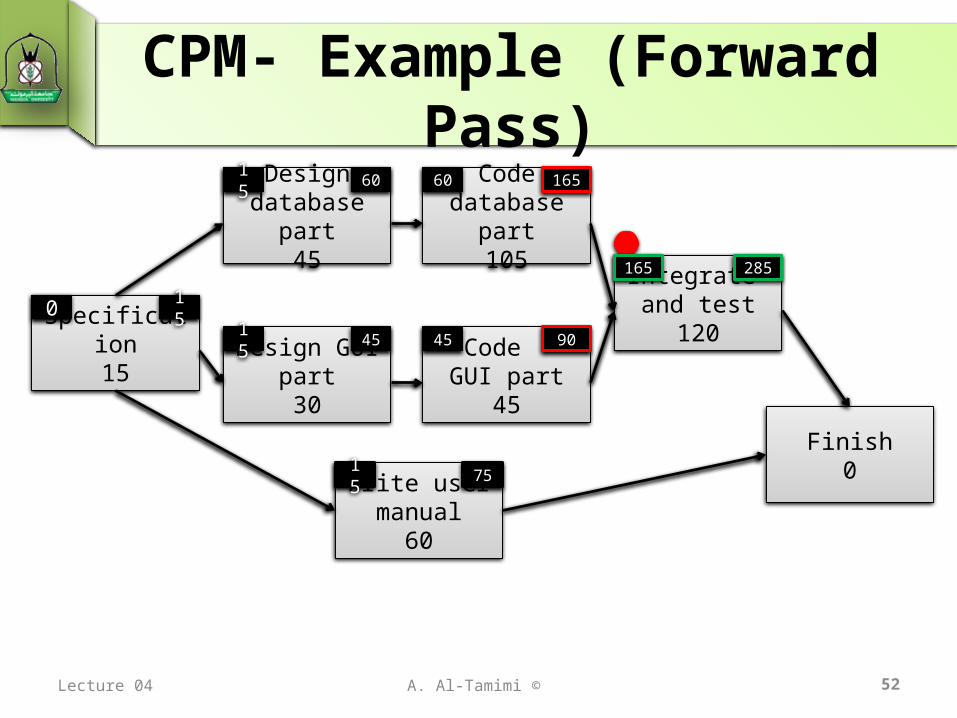
CPM- Example (Forward Pass)
52
Specification15
Design database part
45
Code database part105
Design GUI part30
Code GUI part
45
Write user manual
60
Integrate and test
120
Finish0
0 15
15
15
15
60
45
75
60
45
165
90
165 285
Lecture 04
A. Al-Tamimi ©
CPM- Example (Forward Pass)
53
Specification15
Design database part
45
Code database part105
Design GUI part30
Code GUI part
45
Write user manual
60
Integrate and test
120
Finish0
0 15
15
15
15
60
45
75
60
45
165
90
165 285
285 285
Lecture 04
A. Al-Tamimi ©
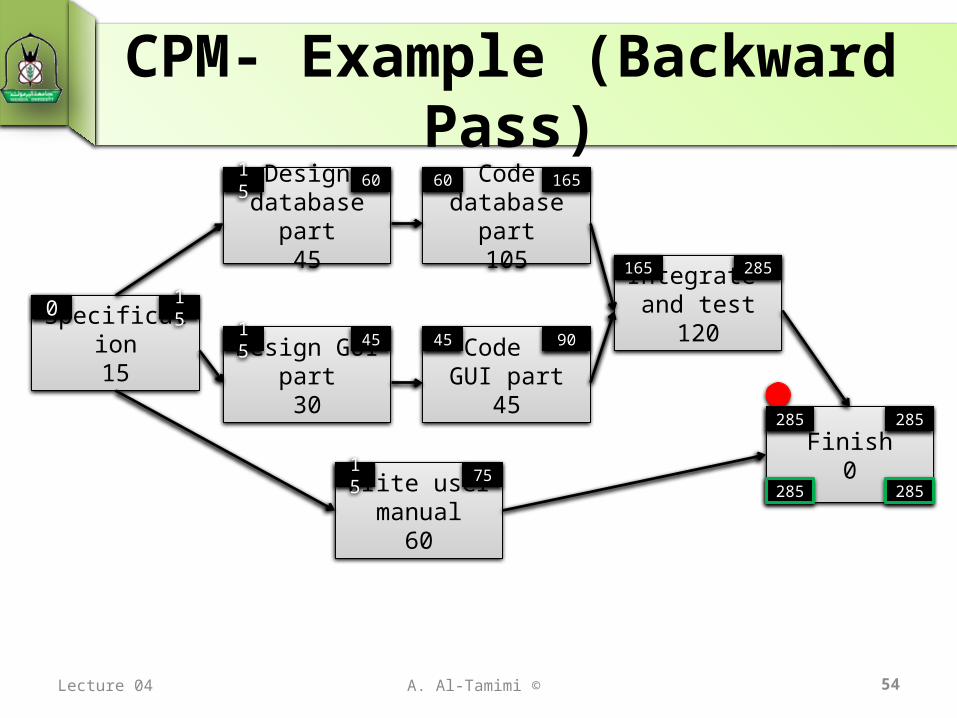
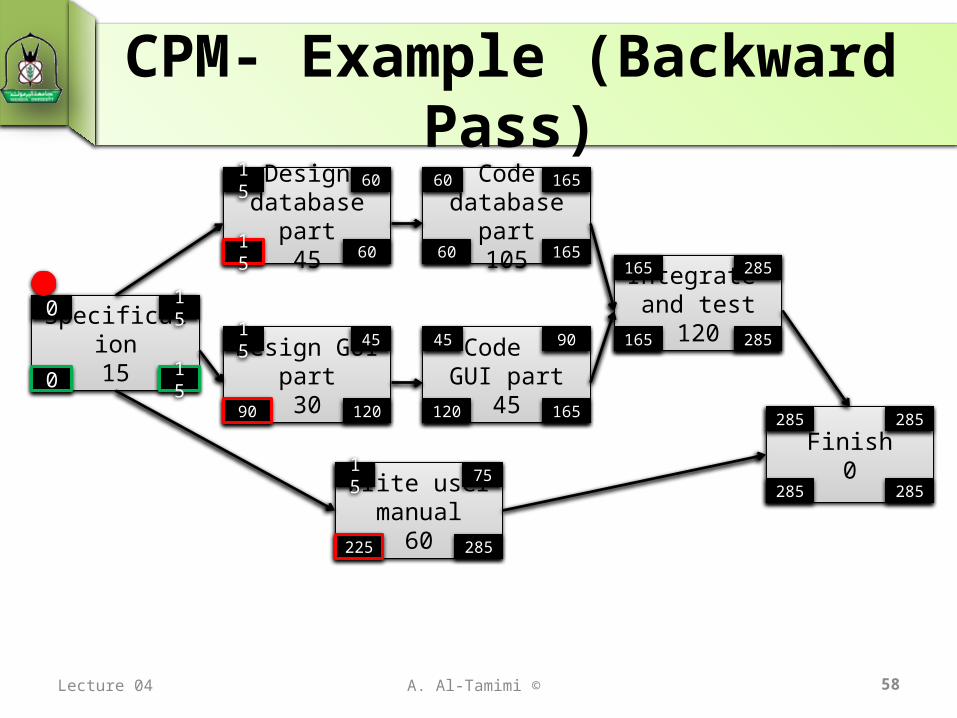
CPM- Example (Backward Pass)
54
Specification15
Design database part
45
Code database part105
Design GUI part30
Code GUI part
45
Write user manual
60
Integrate and test
120
Finish0
0 15
15
15
15
60
45
75
60
45
165
90
165 285
285 285
285 285
Lecture 04

A. Al-Tamimi ©
CPM- Example (Backward Pass)
55
Specification15
Design database part
45
Code database part105
Design GUI part30
Code GUI part
45
Write user manual
60
Integrate and test
120
Finish0
0 15
15
15
15
60
45
75
60
45
165
90
165 285
285 285
285 285
285165
285225
Lecture 04
A. Al-Tamimi ©
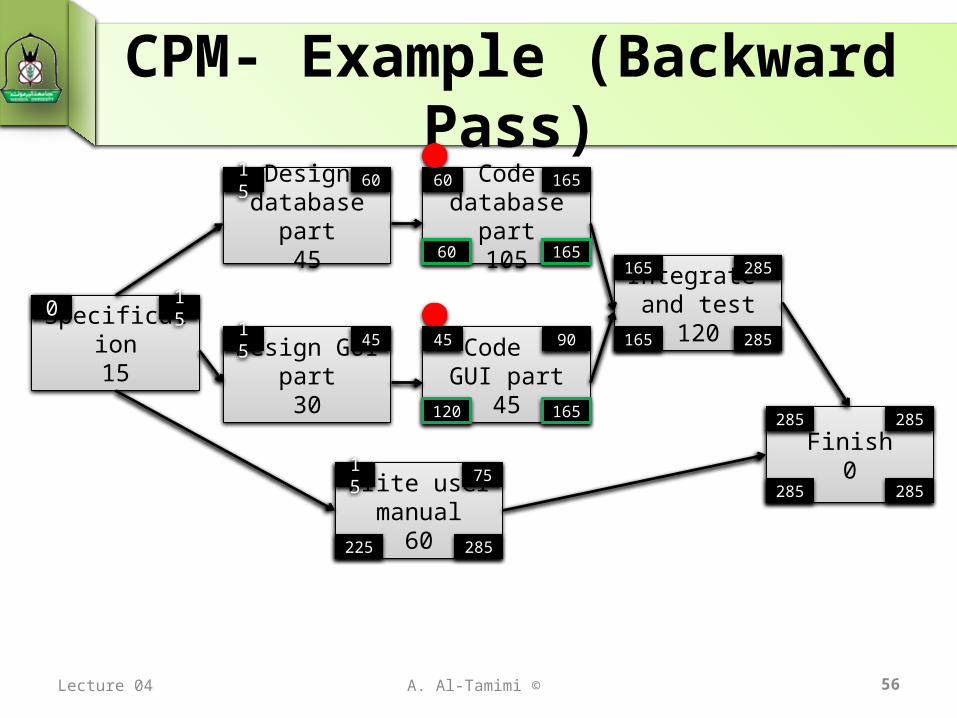
CPM- Example (Backward Pass)
56
Specification15
Design database part
45
Code database part105
Design GUI part30
Code GUI part
45
Write user manual
60
Integrate and test
120
Finish0
0 15
15
15
15
60
45
75
60
45
165
90
165 285
285 285
285 285
285165
285225
165
165
60
120
Lecture 04
A. Al-Tamimi ©
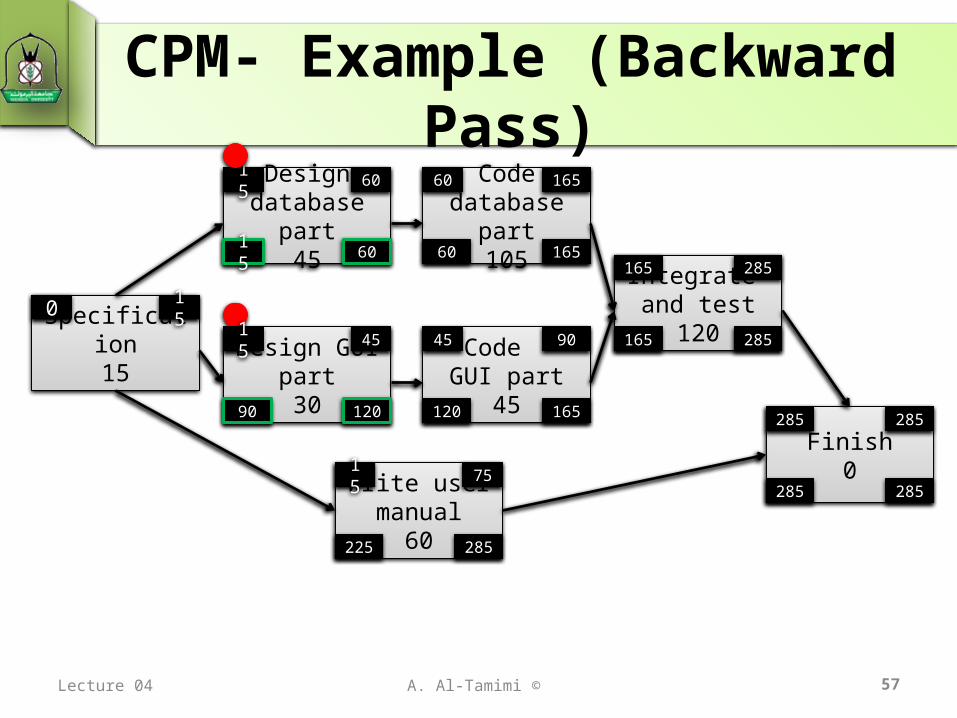
CPM- Example (Backward Pass)
57
Specification15
Design database part
45
Code database part105
Design GUI part30
Code GUI part
45
Write user manual
60
Integrate and test
120
Finish0
0 15
15
15
15
60
45
75
60
45
165
90
165 285
285 285
285 285
285165
285225
165
165
60
120120
6015
90
Lecture 04
A. Al-Tamimi ©
CPM- Example (Backward Pass)
58
Specification15
Design database part
45
Code database part105
Design GUI part30
Code GUI part
45
Write user manual
60
Integrate and test
120
Finish0
0 15
15
15
15
60
45
75
60
45
165
90
165 285
285 285
285 285
285165
285225
165
165
60
120120
6015
90
150
Lecture 04

A. Al-Tamimi ©
CPM-Example (Slack Time)LS-ES or LF-EF
59
Specification15
Design database part
45
Code database part105
Design GUI part30
Code GUI part
45
Write user manual
60
Integrate and test
120
Finish0
0 15
15
15
15
60
45
75
60
45
165
90
165 285
285 285
285 285
285165
285225
165
165
60
120120
6015
90
150
Task
ES EF
LFLS
0
0
75
0
75
210
0
0
Lecture 04
A. Al-Tamimi ©
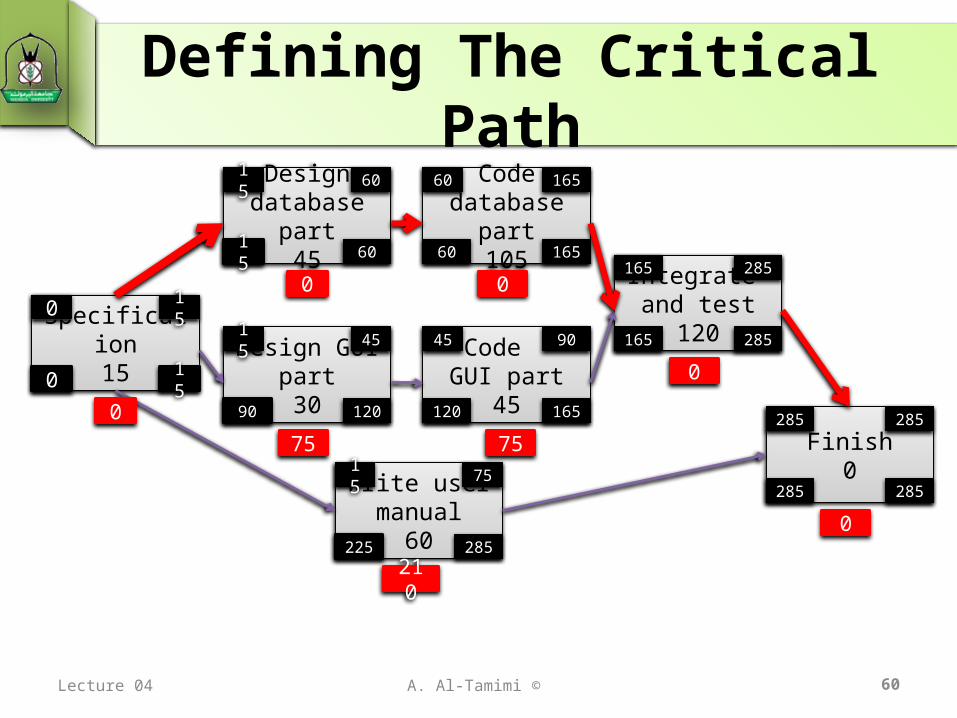
Defining The Critical Path
60
Specification15
Design database part
45
Code database part105
Design GUI part30
Code GUI part
45
Write user manual
60
Integrate and test
120
Finish0
0 15
15
15
15
60
45
75
60
45
165
90
165 285
285 285
285 285
285165
285225
165
165
60
120120
6015
90
1500
0
75
0
75
210
0
0
Lecture 04

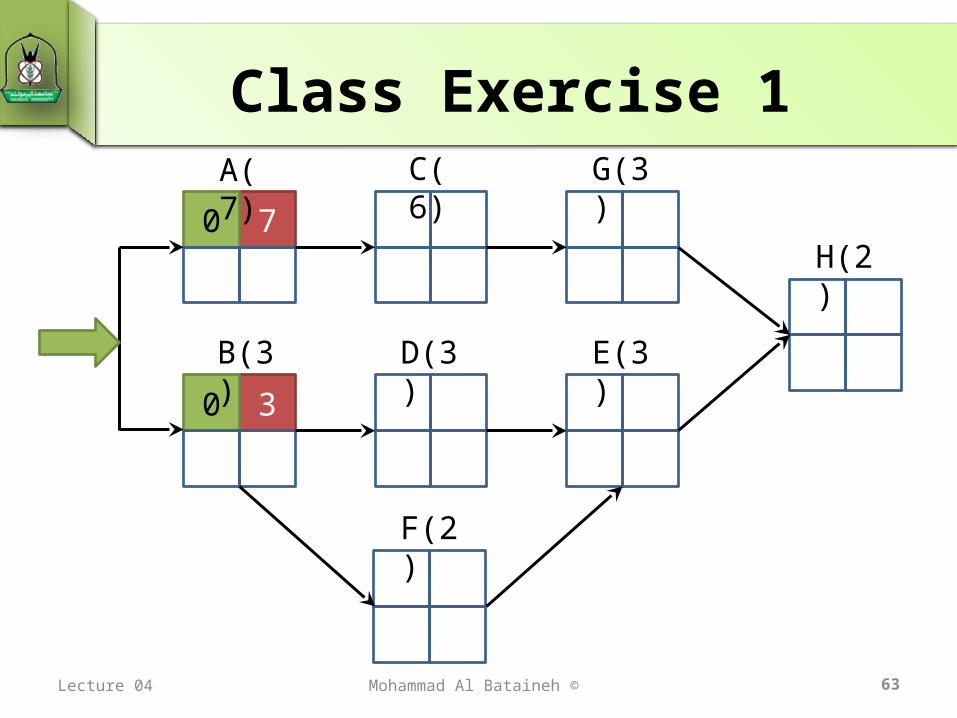
61
Class Exercise 1
Lecture 04 Shadi Alboon©

62
Class Exercise 1
Lecture 04 Mohammad Al Bataineh ©
0
0
A(7) C(6) G(3)
B(3) D(3) E(3)
F(2)
H(2)
63
Class Exercise 1
Lecture 04 Mohammad Al Bataineh ©
70
30
A(7) C(6) G(3)
B(3) D(3) E(3)
F(2)
H(2)

64
Class Exercise 1
Lecture 04 Mohammad Al Bataineh ©
70 137
30 63
53
A(7) C(6) G(3)
B(3) D(3) E(3)
F(2)
H(2)
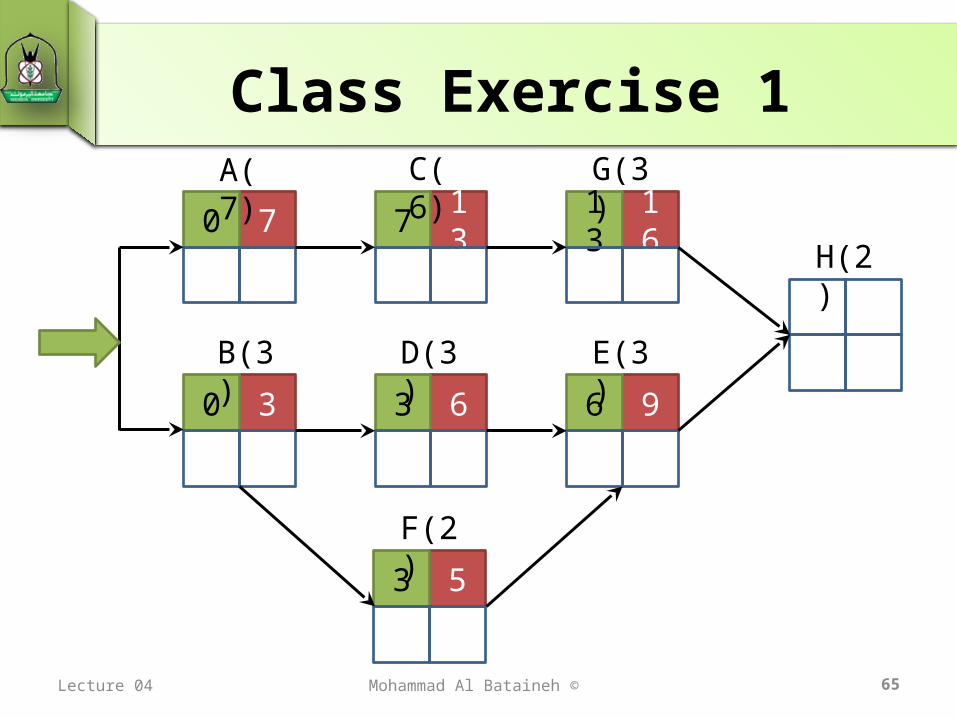
65
Class Exercise 1
Lecture 04 Mohammad Al Bataineh ©
70 137 1613
30 63 96
53
A(7) C(6) G(3)
B(3) D(3) E(3)
F(2)
H(2)
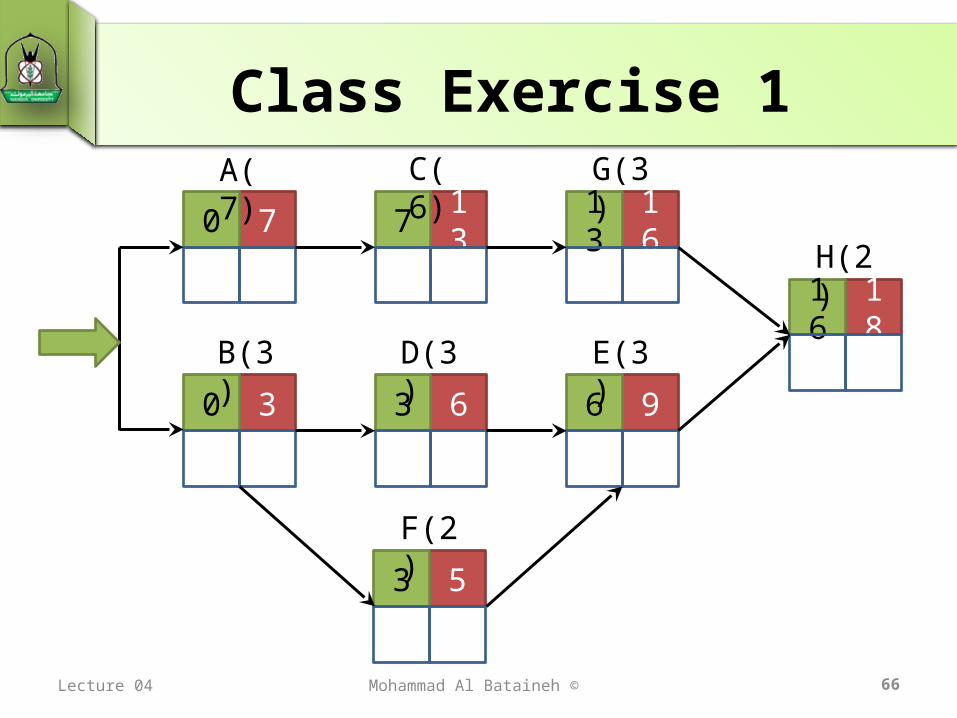
66
Class Exercise 1
Lecture 04 Mohammad Al Bataineh ©
70 137 1613
30 63 96
53
1816
A(7) C(6) G(3)
B(3) D(3) E(3)
F(2)
H(2)

67
Class Exercise 1
Lecture 04 Mohammad Al Bataineh ©
70 137 1613
30 63 96
53
1816
16 18
A(7) C(6) G(3)
B(3) D(3) E(3)
F(2)
H(2)
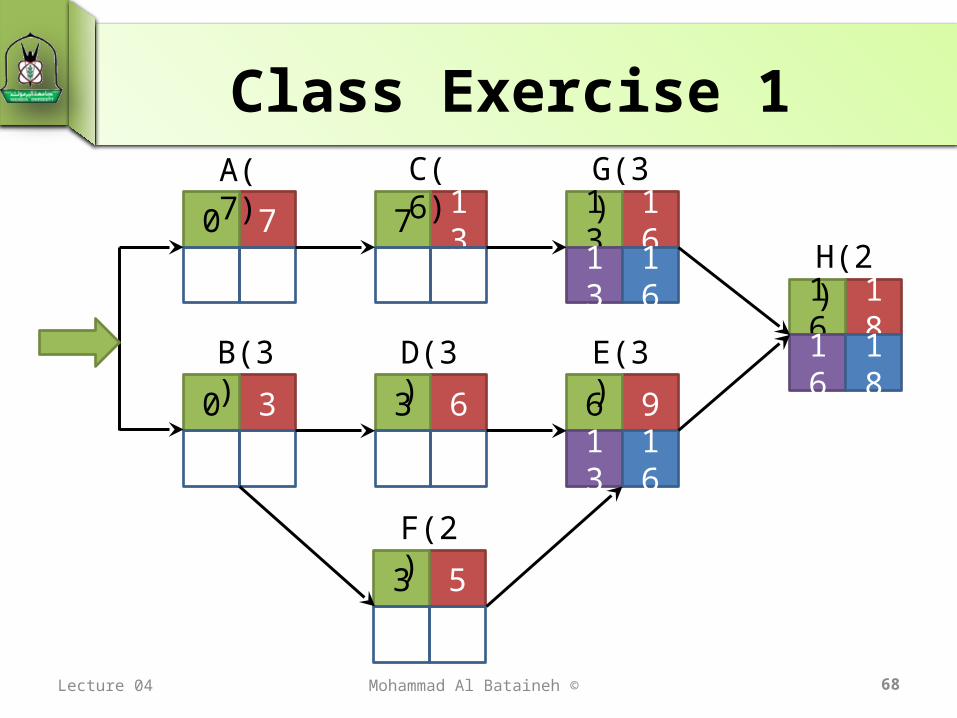
68
Class Exercise 1
Lecture 04 Mohammad Al Bataineh ©
70 137 1613
13 16
30 63 96
13 16
53
1816
16 18
A(7) C(6) G(3)
B(3) D(3) E(3)
F(2)
H(2)
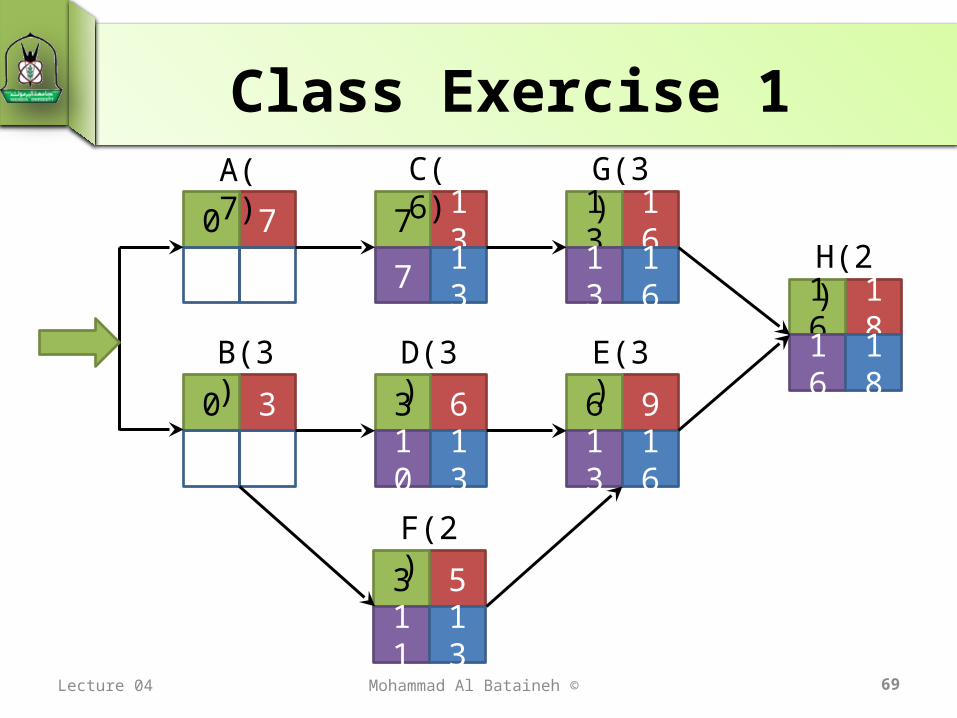
69
Class Exercise 1
Lecture 04 Mohammad Al Bataineh ©
70 137
7 13
1613
13 16
30 63
10 13
96
13 16
53
11 13
1816
16 18
A(7) C(6) G(3)
B(3) D(3) E(3)
F(2)
H(2)
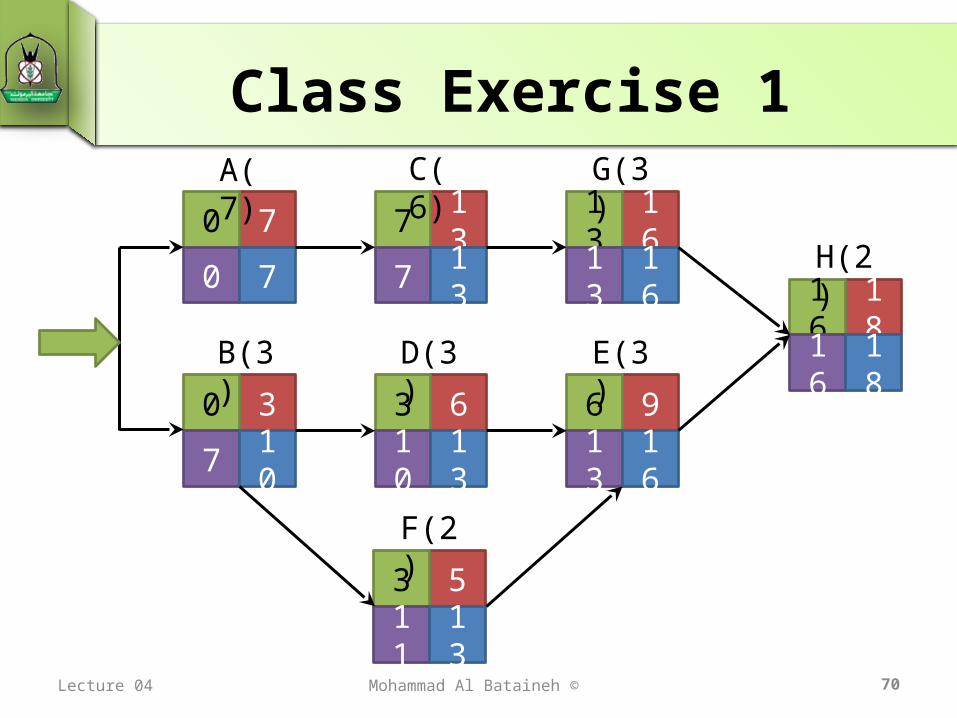
70
Class Exercise 1
Lecture 04 Mohammad Al Bataineh ©
70
0 7
137
7 13
1613
13 16
30
7 10
63
10 13
96
13 16
53
11 13
1816
16 18
A(7) C(6) G(3)
B(3) D(3) E(3)
F(2)
H(2)
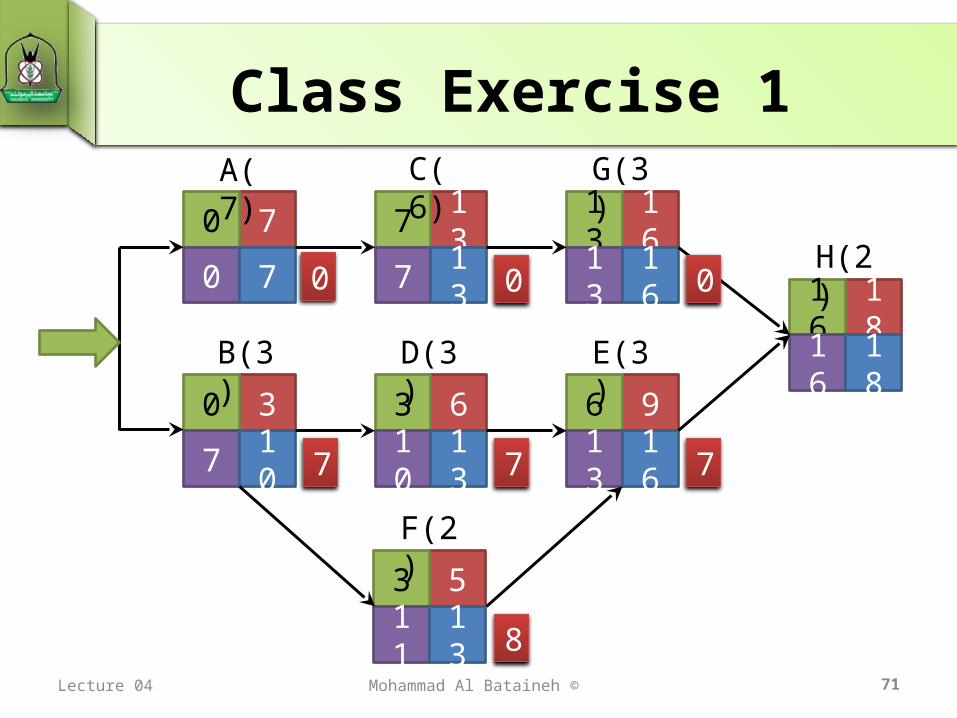
71
Class Exercise 1
Lecture 04 Mohammad Al Bataineh ©
70
0 7
137
7 13
1613
13 16
30
7 10
63
10 13
96
13 16
53
11 13
1816
16 18
A(7) C(6) G(3)
B(3) D(3) E(3)
F(2)
H(2)0 0 0
777
8
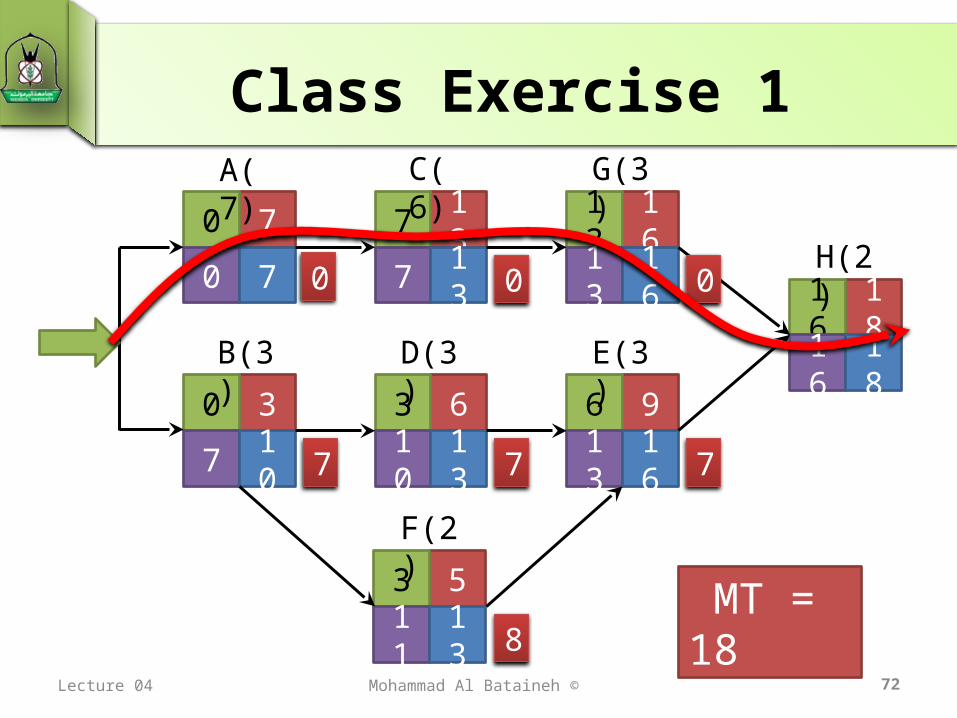
72
Class Exercise 1
Lecture 04 Mohammad Al Bataineh ©
70
0 7
137
7 13
1613
13 16
30
7 10
63
10 13
96
13 16
53
11 13
1816
16 18
A(7) C(6) G(3)
B(3) D(3) E(3)
F(2)
H(2)0 0 0
777
8 MT = 18
A. Al-Tamimi © 73
Questions
Lecture 04


