23
™
| Date post: | 12-Jan-2017 |
| Category: |
Data & Analytics |
| Upload: | jean-louis-queguiner |
| View: | 541 times |
| Download: | 0 times |

™

™

© Wajam 2015
1. Context2. Infrastructure3. Issue4. Findings5. Solving the issue
a. Basic Script optimizationb. Yarn tuning
6. Results7. Conclusion
CONTENT
© Wajam 2015
● 150 GB of logs every day● 4 Millions active users● 17 Millions of ads every day
CONTEXT
© Wajam 2015
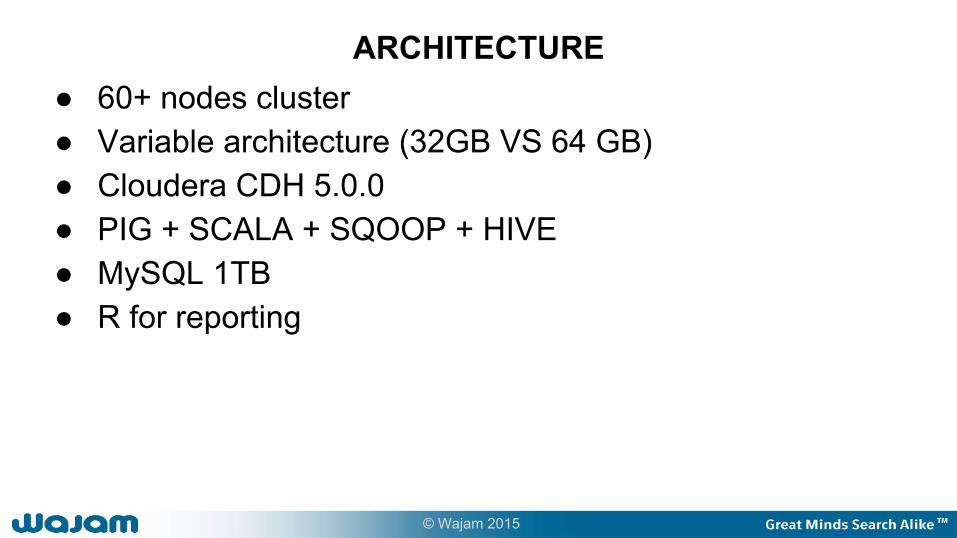
● 60+ nodes cluster● Variable architecture (32GB VS 64 GB)● Cloudera CDH 5.0.0● PIG + SCALA + SQOOP + HIVE● MySQL 1TB● R for reporting
ARCHITECTURE

© Wajam 2015
● New feature launch● 150 GB -> 300 GB● Pipeline struggle and late
ISSUE

© Wajam 2015
Sqoop jobs were pretty long jobs
- despite option still slow- -Dsqoop.export.records.per.statement=1000
- -Dsqoop.export.statements.per.transaction=10
- analyzed mysql logs
- Set general_log = 1
- surprise : 1 statement per transaction, 1 record per statement...
- bug in sqoop
- fixed in 1.4.6 in june 2014
FINDINGS

© Wajam 2015
Important Metrics
MAX CPU vs AVG CPU (should follow same trend)
FINDINGS
© Wajam 2015
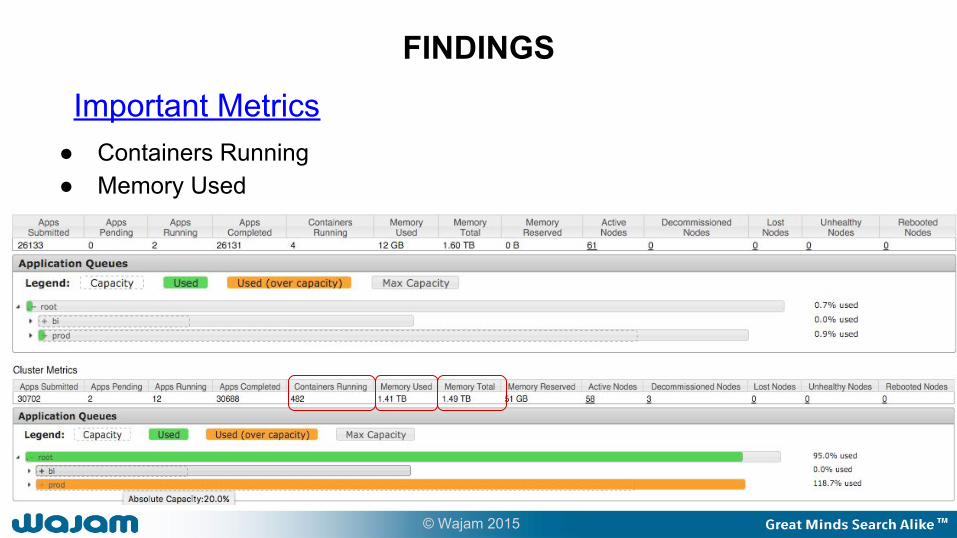
Important Metrics● Containers Running● Memory Used● Memory Total
FINDINGS
© Wajam 2015
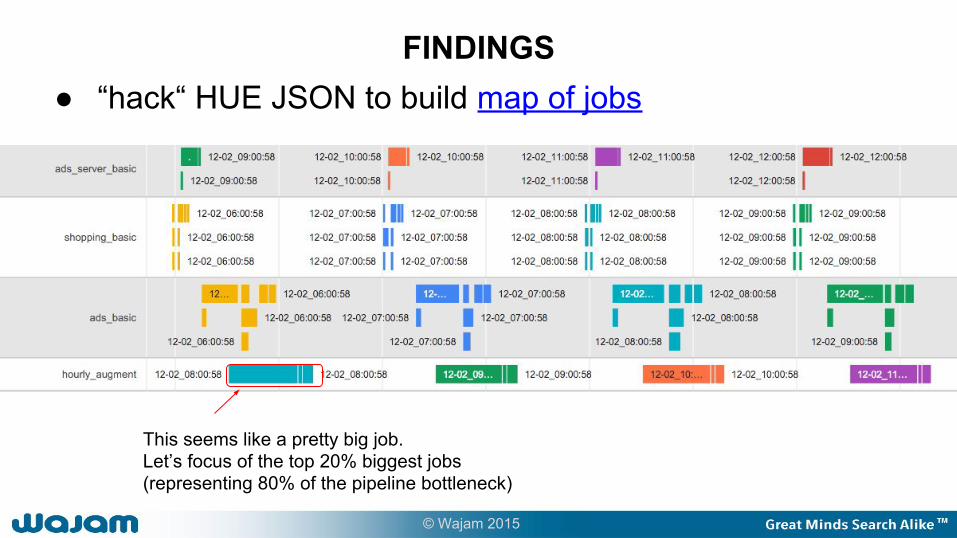
● “hack“ HUE JSON to build map of jobsFINDINGS
This seems like a pretty big job.Let’s focus of the top 20% biggest jobs (representing 80% of the pipeline bottleneck)

© Wajam 2015
find biggest jobs 1h40… really ?check the job live
2 Killed Reduce
Why ?
15’ map25’*3 =75’ reduce
FINDINGS
© Wajam 2015
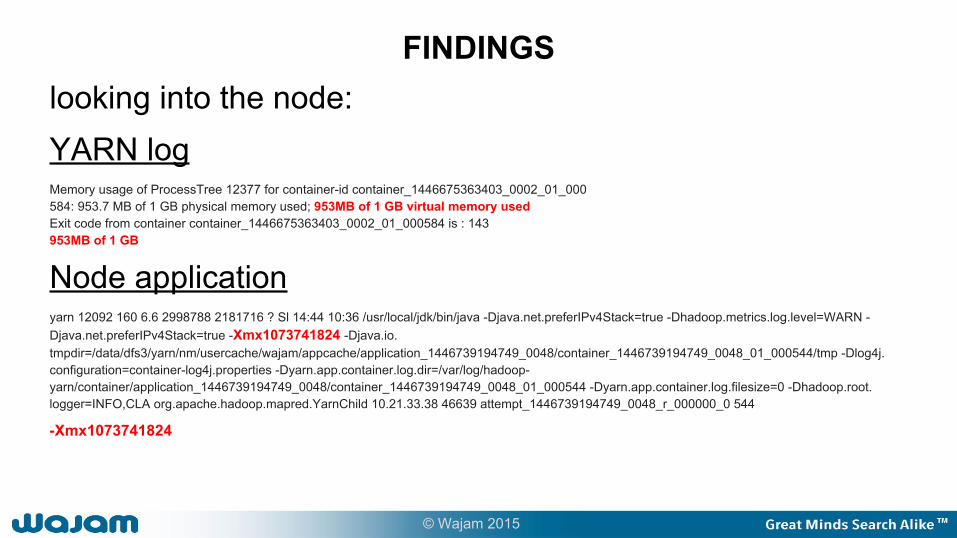
looking into the node:YARN logMemory usage of ProcessTree 12377 for container-id container_1446675363403_0002_01_000584: 953.7 MB of 1 GB physical memory used; 953MB of 1 GB virtual memory usedExit code from container container_1446675363403_0002_01_000584 is : 143953MB of 1 GB
Node applicationyarn 12092 160 6.6 2998788 2181716 ? Sl 14:44 10:36 /usr/local/jdk/bin/java -Djava.net.preferIPv4Stack=true -Dhadoop.metrics.log.level=WARN -Djava.net.preferIPv4Stack=true -Xmx1073741824 -Djava.io.tmpdir=/data/dfs3/yarn/nm/usercache/wajam/appcache/application_1446739194749_0048/container_1446739194749_0048_01_000544/tmp -Dlog4j.configuration=container-log4j.properties -Dyarn.app.container.log.dir=/var/log/hadoop-yarn/container/application_1446739194749_0048/container_1446739194749_0048_01_000544 -Dyarn.app.container.log.filesize=0 -Dhadoop.root.logger=INFO,CLA org.apache.hadoop.mapred.YarnChild 10.21.33.38 46639 attempt_1446739194749_0048_r_000000_0 544
-Xmx1073741824
FINDINGS

© Wajam 2015
1. Filter just after the load
2. Don’t order on 300GB
Solving the issue: script optimization
© Wajam 2015
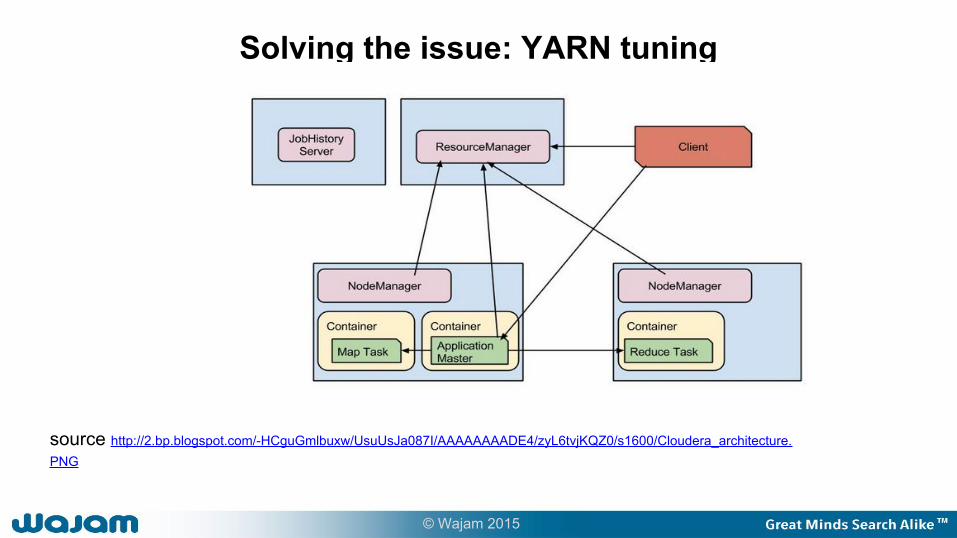
Solving the issue: YARN tuning
source http://2.bp.blogspot.com/-HCguGmlbuxw/UsuUsJa087I/AAAAAAAADE4/zyL6tvjKQZ0/s1600/Cloudera_architecture.PNG

© Wajam 2015
Solving the issue: YARN tuning
1. Is it big enough for your data ?2. Isn’t it too big for your data ?
© Wajam 2015
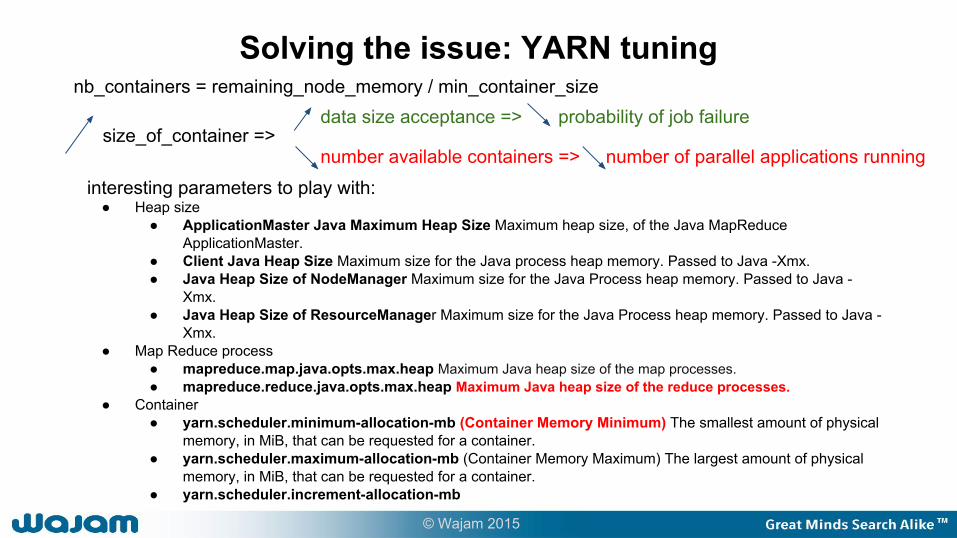
Solving the issue: YARN tuning
size_of_container => data size acceptance => probability of job failure
number available containers => number of parallel applications running
nb_containers = remaining_node_memory / min_container_size
interesting parameters to play with:● Heap size
● ApplicationMaster Java Maximum Heap Size Maximum heap size, of the Java MapReduce ApplicationMaster.
● Client Java Heap Size Maximum size for the Java process heap memory. Passed to Java -Xmx.● Java Heap Size of NodeManager Maximum size for the Java Process heap memory. Passed to Java -
Xmx.● Java Heap Size of ResourceManager Maximum size for the Java Process heap memory. Passed to Java -
Xmx.● Map Reduce process
● mapreduce.map.java.opts.max.heap Maximum Java heap size of the map processes.● mapreduce.reduce.java.opts.max.heap Maximum Java heap size of the reduce processes.
● Container● yarn.scheduler.minimum-allocation-mb (Container Memory Minimum) The smallest amount of physical
memory, in MiB, that can be requested for a container. ● yarn.scheduler.maximum-allocation-mb (Container Memory Maximum) The largest amount of physical
memory, in MiB, that can be requested for a container.● yarn.scheduler.increment-allocation-mb

© Wajam 2015
Java Heap Size
Node Manager Java Heap Size
Container Sizeyarn.scheduler.minimum-allocation-mbyarn.scheduler.maximum-allocation-mbyarn.scheduler.increment-allocation-mb
Client Java Heap SizeResource Manager Java Heap Size
Application Master Java Maximum Heap Size
mapreduce.map.java.opts.max.heap
mapreduce.reduce.java.opts.max.heap
Solving the issue: YARN tuning

Solving the issue: YARN tuning
MapReduce: Simplified Data Processing on Large Clusters (Jeffrey Dean and Sanjay Ghemawat)
“[...] redundant execution can be used to reduce the impact of slow machines, and to handle machine failures and data loss.”
Unfortunately name is obscure in YARN : speculation and default is FALSE
speculation_mode on => data processing time
number available containers by replication_factornb_avail._container_cluster = nb_job * min_size_container * replication_factor
© Wajam 2015

YARN tuning - Variable architecture
● 16 Gb nodes● 32 Gb nodes● Intel● AMD● How to deal with this?
Cloudera manager + groups
© Wajam 2015
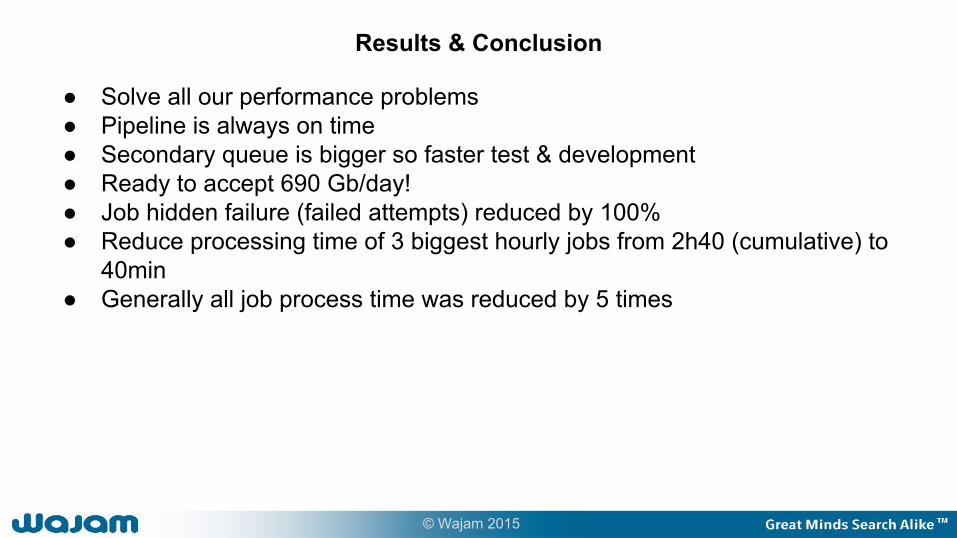
Results & Conclusion
● Solve all our performance problems● Pipeline is always on time● Secondary queue is bigger so faster test & development● Ready to accept 690 Gb/day!● Job hidden failure (failed attempts) reduced by 100%● Reduce processing time of 3 biggest hourly jobs from 2h40 (cumulative) to
40min● Generally all job process time was reduced by 5 times
© Wajam 2015
Results & Conclusion
Other benefits :- Moving from reactive to proactive maintenance : Cluster not fully restarted.- Increase collaboration between IT and BI (special task force)- Developed monitoring tools (during the time dedicated to special task force)- Identify bad practice in both team and commonly agreed to work on it- Discover that we were not ready for parcel CDH upgrade- Discover that yarn config was not replicated to job scheduler !!- Reduce hit in MySQL thanks to batch inserts by keeping tools up to date
(sqoop)
© Wajam 2015

THANK YOU
© Wajam 2015

Few references:YARN RELATED ARTICLESGoogle Map Reduce Paper
Cloudera YARN tuning documentation
Cloduera YARN tuning guide (spreadsheet)
Pivotal YARN documentationIBM YARN calculation guide
INTERESTING LECTURESThe Phoenix Project (IT management concepts novel)
© Wajam 2015


