32
Circular economy in a European perspective environmental and economic co-benefits Ybele Hoogeveen I 28 November I Herning
Circular economy in a European perspective environmental and economic co-benefits
Ybele Hoogeveen I 28 November I Herning

7th Environment Action Programme
‘In 2050, we live well, within the planet's ecological limits.
Our prosperity and healthy environment stem from an innovative, circular economy where nothing is wasted and where natural resources are managed sustainably, and biodiversity is protected, valued and restored in ways that enhance our society's resilience. Our low-carbon growth has long been decoupled from resource use, setting the pace for a global safe and sustainable society.’

The sustainability challenge

Global total material use by resource type, 1900-2009 (billion tonnes)
Source: Krausmann et al., 2009
• Has grown 10-fold since 1900 and may double again by 2030
Global resource use
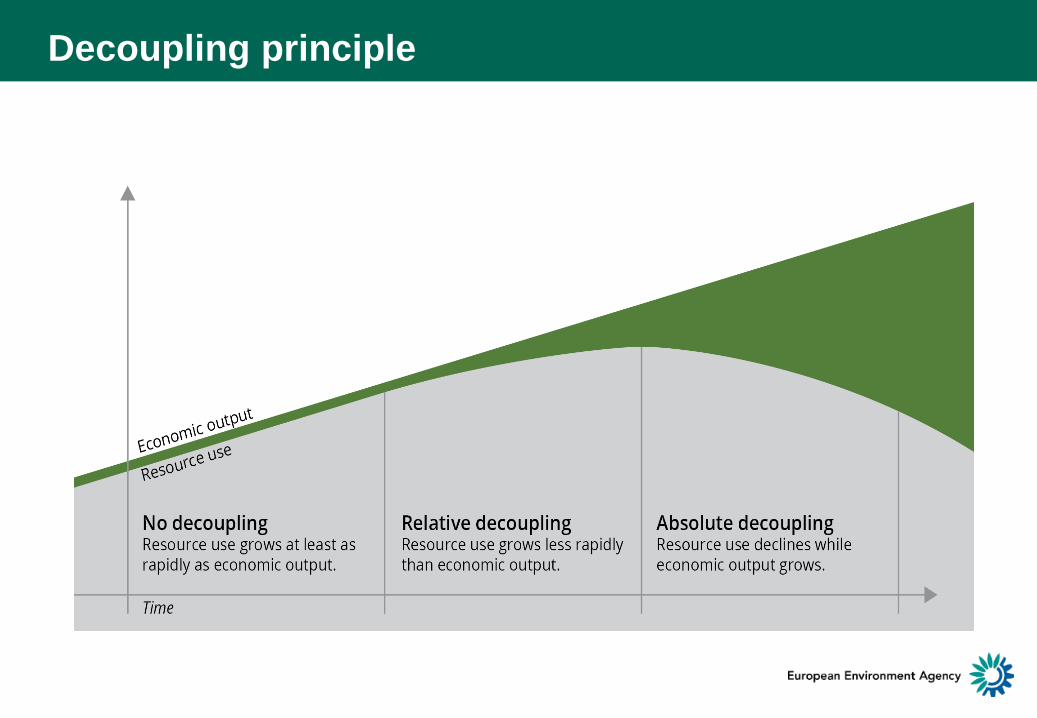
Decoupling principle

Source: SERI 2012
GDP at 2005 market prices
Material consumption
PopulationMaterial productivity
Material intensity
Global decoupling

European decoupling

Reliance on imports
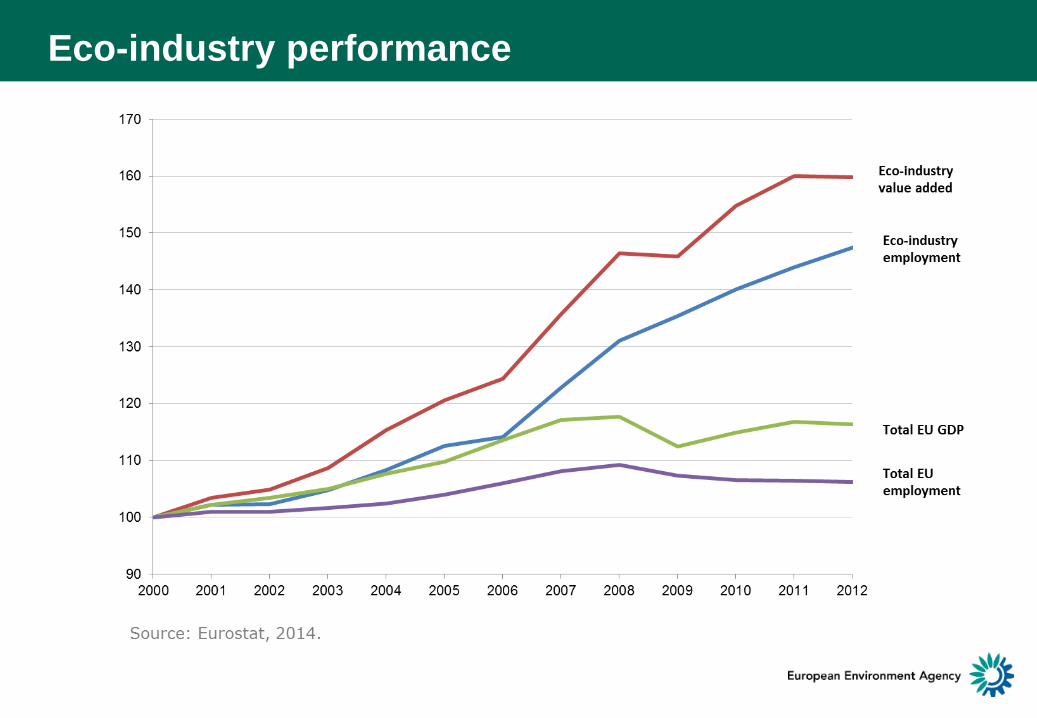
Eco-industry performance

Circular economy

Circular economy concept
11.5 tonnes of materials extracted in 2014
3.0 tonnes of material per person imported in 2014
0.3 tonnes of waste per person incinerated in 2012
2.2 tonnes of waste per person sent to landfill in 2012

1975• Waste Framework Directive
2005• Thematic Strategy on the Prevention and Recycling of Waste
2008• Waste Framework Directive (revised)
2011• Roadmap to a Resource efficient Europe
2013• 7th Environment Action Programme
2014• CE Communication v 1.0 (withdrawn)
2015• New Circular Economy package
Policy development

Communication
Closing the loop An EU action plan for the Circular Economy
Revised legislative proposals• Waste Framework Directive• Landfill Directive• Packaging waste Directive• WEEE Directive• End-of-life vehicles Directive• Batteries and accumulators
Directive
The new Circular Economy Package

EC Circular Economy Package - Targets
• A common EU target for recycling 65% of municipal waste by 2030; • A common EU target for recycling 75% of packaging waste by 2030; • A binding landfill target to reduce landfill to maximum of 10% of municipal
waste by 2030;
• A ban on landfilling of separately collected waste; • Promotion of economic instruments to discourage landfilling; • Simplified and improved definitions and harmonised calculation methods for
recycling rates throughout the EU; • Concrete measures to promote re-use and stimulate industrial symbiosis -
turning one industry's by-product into another industry's raw material; • Economic incentives for producers to put greener products on the market and
support recovery and recycling schemes (e.g. for packaging, batteries, electric and electronic equipment, vehicles).

EC Circular Economy Package – Priority areas
• PlasticsStrategy on recyclability, biodegradability, hazardous substances and the SDG on marine litter
• Food wasteCommon measurement methodology, improved date marking and tools to meet the global SDG to halve food waste by 2030
• Critical raw materialsActions to encourage recovery Guidance and promotion of best practices on mining waste
• Construction and demolitionRecycling protocol and guidelines for pre-demolition assessments (2016) and life cycle assessments for buildings (2017)
• Biomass and bio-based productsGuidance on cascading use of biomass and innovation supportTarget for recycling of wood packagingProvision to ensure the separate collection of bio-waste

Focus
Human well-being
Ecosystem resilience
Resource efficiency
Waste prevention
Waste management
Circular economy focusGreen economy focus
Waste Framework Directive(and other EU waste legislation)
Resource EfficiencyRoadmap
7th Environment Action Programme
CE package Strategy non-toxic environment

Reporting series
Circular economy
Waste prevention
Resource efficiency
Municipal waste management across European countries
Waste management

Resource efficiency – inventory of national policies
Officially launched 9 June at the Environment for Europe ministerial conference in Batumi
32 country profiles, self-assessments prepared by countries

Motives for national RE policies

Reported circular economy initiatives

Monitoring the circular economy
Ybele Hoogeveen I 28 November I Herning

CE concept
11.5 tonnes of materials extracted in 2014
3.0 tonnes of material per person imported in 2014
0.3 tonnes of waste per person incinerated in 2012
2.2 tonnes of waste per person sent to landfill in 2012

CE monitoring - aspects
• Material flows and waste statistics• Information on enablers/barriers• Information on CE related policies• Environmental impacts/benefits• Economic impacts/benefits
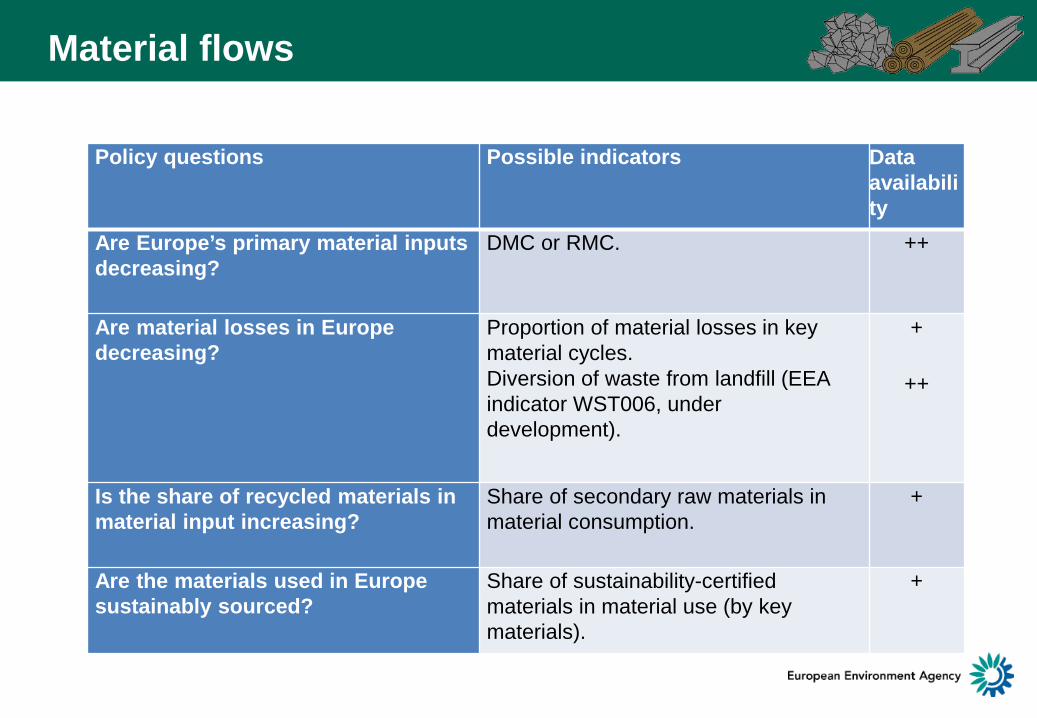
Policy questions Possible indicators Data availability
Are Europe’s primary material inputs decreasing?
DMC or RMC. ++
Are material losses in Europe decreasing?
Proportion of material losses in key material cycles.Diversion of waste from landfill (EEA indicator WST006, under development).
+
++
Is the share of recycled materials in material input increasing?
Share of secondary raw materials in material consumption.
+
Are the materials used in Europe sustainably sourced?
Share of sustainability-certified materials in material use (by key materials).
+
Material flows

Material flows – DMC

Material flows – Resource productivity

Material flows - Losses
Policy questions Possible indicators Data availability
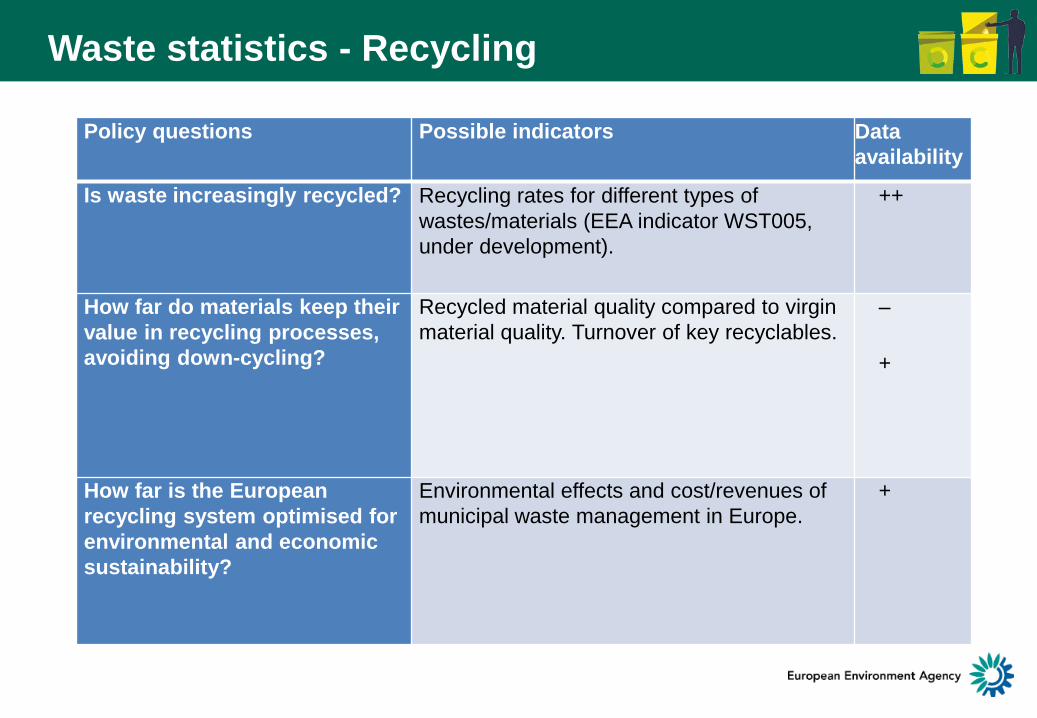
Is waste increasingly recycled? Recycling rates for different types of wastes/materials (EEA indicator WST005, under development).
++
How far do materials keep their value in recycling processes, avoiding down-cycling?
Recycled material quality compared to virgin material quality. Turnover of key recyclables.
–
+
How far is the European recycling system optimised for environmental and economic sustainability?
Environmental effects and cost/revenues of municipal waste management in Europe.
+
Waste statistics - Recycling

Sources: Eurostat, Czech Ministry of Environment, Environment Agency of Iceland
0
10
20
30
40
50
60
70
Ger
man
yA
ustri
aB
elgi
umS
witz
erla
ndN
ethe
rland
sS
wed
enLu
xem
bour
gU
nite
d K
ingd
omD
enm
ark
Italy
Nor
way
Fran
ceIre
land
Slo
veni
aC
zech
Rep
ublic
Spa
inFi
nlan
dP
olan
dH
unga
ryE
ston
iaLi
thua
nia
Por
tuga
lIc
elan
dB
ulga
riaLa
tvia
Gre
ece
Cyp
rus
Cro
atia
Rom
ania
Mal
taS
lova
kia
Ser
bia
Turk
ey
%
% of municipal waste recycled 2004
% of municipal waste recycled 2014
Waste statistics - Recycling
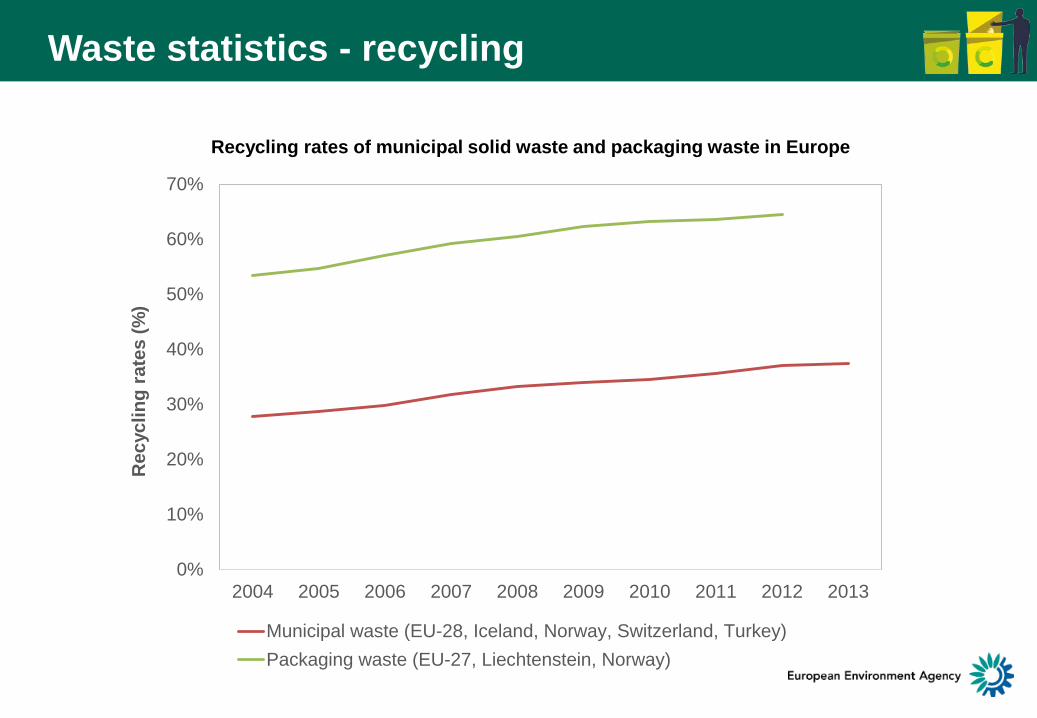
0%
10%
20%
30%
40%
50%
60%
70%
2004 2005 2006 2007 2008 2009 2010 2011 2012 2013
Rec
yclin
g ra
tes
(%)
Municipal waste (EU-28, Iceland, Norway, Switzerland, Turkey)Packaging waste (EU-27, Liechtenstein, Norway)
Recycling rates of municipal solid waste and packaging waste in Europe
Waste statistics - recycling

Policy questions Possible indicators Data availability
Are products designed to last longer?
Durability / lifetime, compared to an industry average for a similar product.
–
Are products designed for disassembly?
Time and number of necessary tools for disassembly.
–
Are recycled materials included in product design?
Proportion of recycled material in new products.
–
Are materials designed to be recycled, avoiding pollution from recycling loops?
Share of materials where safe recycling options exist.
–
Enablers - Ecodesign

Challenges
More recycling versus clean
material cycles?
How many renewable
resources can we use sustainably?
Does a perfect circular economy
guarantee ecosystem resilience?
Frictions between the matured rules,
norms and legislation and
new approaches
What is the quality of the new jobs vs. the ones
that are replaced?


