Electrolux Professional – Year-end report, Q4 2020 P. 1 First page Message from the CEO Financial overview Financial reports Definitions Shareholders information Fourth quarter, October–December 2020 > The COVID-19 pandemic continued to impact the hospitality business. Net sales amounted to SEK 1,935m (2,334). Sales decreased by 17.1%. Organically sales decreased by 13.2%. > EBITA amounted to SEK 142m (181), corresponding to a margin of 7.3% (7.8). > Operating income amounted to SEK 119m (165), corresponding to a margin of 6.1% (7.1). > Operating cash flow after investments amounted to SEK 460m (355). > Income for the period amounted to SEK 70m (168), and earnings per share was SEK 0.24 (0.59). > Due to the ongoing pandemic, the Board proposes to pay no dividend for 2020. Key ratios Fourth quarter Full year SEKm Oct–Dec 2020 Oct–Dec 2019 Change, % Jan–Dec 2020 Jan–Dec 2019 Change, % Net sales 1,935 2,334 –17.1 7,263 9,281 –21.7 EBITA 142 181 –21.5 456 1,058 –56.9 EBITA margin, % 7.3 7.8 6.3 11.4 Operating income 119 165 –28.0 387 992 –61.0 Operating margin, % 6.1 7.1 5.3 10.7 Income after financial items 113 157 –28.1 363 978 –62.9 Income for the period 70 168 –58.4 278 663 –58.1 Earnings per share, SEK 1 0.24 0.59 0.97 2.31 Operating cash flow after investments 460 355 570 1,138 1) Basic number of outstanding shares. Q4 Year-end report
Transcript
Electrolux Professional – Year-end report, Q4 2020 P. 1
First page
Message from the CEO
Financial overview
Financial reports
Definitions
Shareholders information
Fourth quarter, October–December 2020 > The COVID-19 pandemic continued to impact the hospitality business. Net sales amounted to
SEK 1,935m (2,334). Sales decreased by 17.1%. Organically sales decreased by 13.2%.
> EBITA amounted to SEK 142m (181), corresponding to a margin of 7.3% (7.8).
> Operating income amounted to SEK 119m (165), corresponding to a margin of 6.1% (7.1).
> Operating cash flow after investments amounted to SEK 460m (355).
> Income for the period amounted to SEK 70m (168), and earnings per share was SEK 0.24 (0.59).
> Due to the ongoing pandemic, the Board proposes to pay no dividend for 2020.
Key ratiosFourth quarter Full year
SEKmOct–Dec
2020Oct–Dec
2019 Change, %Jan–Dec
2020Jan–Dec
2019 Change, %
Net sales 1,935 2,334 –17.1 7,263 9,281 –21.7 EBITA 142 181 –21.5 456 1,058 –56.9 EBITA margin, % 7.3 7.8 6.3 11.4 Operating income 119 165 –28.0 387 992 –61.0 Operating margin, % 6.1 7.1 5.3 10.7 Income after financial items 113 157 –28.1 363 978 –62.9 Income for the period 70 168 –58.4 278 663 –58.1 Earnings per share, SEK1 0.24 0.59 0.97 2.31 Operating cash flow after investments 460 355 570 1,138
1) Basic number of outstanding shares.
Q4Year-end report
Electrolux Professional – Year-end report, Q4 2020 P. 2
First page
Message from the CEO
Financial overview
Financial reports
Definitions
Shareholders information
”
Message from the CEO:
Strong cash flow in a turbulent time
After the sales recovery in the third quarter, the second wave of the corona virus pandemic has halted the recovery. However, the negative impact is more contained now compared to the first wave, as customers have learned to adapt to the new situation.
Sales in the quarter declined organ-ically by 13.2%. Sales of Laundry was almost flat compared to the same quarter last year which shows both the resilience of the laundry market and our strong position. Sales of Food & Beverage declined compared to the same quarter last year, to a large extent driven by the weak development in Southern Europe.
Thanks to short-term savings, improve-ments from the structural cost saving programs and the stable development in Laundry, we have been able to deliver a margin in line with the same quarter last year. EBITA for the quarter was SEK 142m (181) with a correspond-ing margin of 7.3% (7.8). Operating cash flow after investments improved and amounted to SEK 460m (355) in the quarter.
Sales of Food & Beverage declined organically by 20.8% in the quarter, reporting an EBITA-margin of 1.0%. Laundry continued on a comparable sales level with an organic decline of 1.9%, but an improved EBITA-margin of 16.9%.
The restructuring plan announced in September is progressing in line with plan and is expected to generate annu-al savings of SEK 110m from the second quarter of 2021 and additional SEK 20m from the second quarter of 2022.
Product innovations play a key role in our business, but further investments
have also been made to enhance efficiency. Hence, we have started a multi-year project to roll out a new common IT infrastructure to all factories in the Group. In addition, the consol-idation of our beverage and laundry operations in Thailand into one factory is nearing completion.
We recently launched our sustainabil-ity commitments and targets focusing on climate, health & safety, as well as diversity. The overarching target is to become climate neutral within our industrial operations by 2030. We are fully committed to take further action to mitigate climate change and support the ambitions of the Paris Agreement.
After 2019 with its intense preparations for the separation from AB Electrolux, 2020 was positioned for strengthen-ing and growing the business after the listing efforts being completed in March. However, the coronavirus pandemic forced us to radically change our focus since the hospitality industry has been one of the most affected industries.
We are proud to have demonstrated resilience during the pandemic turbu-lence in 2020. Thanks to the flexibility of our employees and the cost saving measures adopted, we have laid the foundation for the future. Short term the pandemic creates challenges, but when larger parts of the population world-wide are vaccinated against the coronavirus, I am confident that the business in restaurants, hotels and bars will come back – and when this hap-pens, we will have the products, the service and dedicated people in place to support our customers.
Alberto Zanata, President and CEO
Short term the pandemic creates challenges, but when larger parts of the population world-wide are vaccinated against the coronavirus, I am confident that the business in restaurants, hotels and bars will come back.
Alberto Zanata, President and CEO
“
Electrolux Professional – Year-end report, Q4 2020 P. 3
First page
Message from the CEO
Financial overview
Financial reports
Definitions
Shareholders information
Financial overviewFourth quarter development Net salesNet sales for the fourth quarter amounted to SEK 1,935m (2,334), a decline by 17.1% compared to the same period last year. Organically, sales decreased by 13.2% and currency contributed negatively by 3.5%.
The sales decline was driven by lower sales vol-umes due to the impact from the pandemic. Sales of Food & Beverage declined organically by 20.8%. Laundry was almost flat with an organic decline of 1.9%. Organically, sales in Europe and Americas declined approximately 15% while sales in Asia- Pacific, Middle East and Africa declined approxi-mately 10%.
* In the fourth quarter of 2019, four months of the acquisition of Unic were reported in order to align with Electrolux Professional reporting.
Share of sales by segment, October–December 2020
Food & BeverageLaundry 46% 54%
Share of sales by region, October–December 2020
EuropeAmericas
Asia-Pacific, Middle East, Africa 17%
15% 68%
Operating income and EBITA Operating income excluding amortization of intan-gible assets (EBITA) amounted to SEK 142m (181) corresponding to a margin of 7.3% (7.8). Operating income amounted to SEK 119m (165), corresponding to a margin of 6.1% (7.1). The decline in operating income is mainly due to lower sales volumes.
Short-term cost saving activities together with already implemented structural cost savings to mitigate the sales decline contributed positively. These actions have reduced cost in the quarter by approximately SEK 90m compared to the fourth quarter of 2019.
Sales and EBITA margin
2020¹2019¹
Sales EBITA margin
0
500
1,000
1,500
2,000
2,500
Q4Q3Q2Q1Q4Q3Q2Q1
SEKm %
-5
0
5
10
15
20
1) The second quarter 2019 includes items affecting comparability of SEK +90m, the third quarter 2019 includes items affecting comparability of SEK –122m and the third quarter 2020 includes items affecting comparability of SEK –77m.
Financial netNet financial items amounted to SEK –5m (–7).
Income for the periodIncome for the period amounted to SEK 70m (168), corresponding to SEK 0.24 (0.59) in earnings per share. Income tax for the period amounted to SEK –43m (11). The tax cost in the fourth quarter of 2019 was positively affected by a step-up in the asset base as a consequence of fair market value sale of certain assets and liabilities between AB Electrolux and Electrolux Professional.
Group common costGroup common cost was SEK –19m (–21).
Electrolux Professional – Year-end report, Q4 2020 P. 4
First page
Message from the CEO
Financial overview
Financial reports
Definitions
Shareholders information
Segment Food & Beverage
In the fourth quarter, sales for Food & Beverage was SEK 1,047m (1,405), a decline by 25.5% compared to the same period last year. Organically sales decreased by 20.8% and currency had a negative effect of 4.1%.
Sales continued to be heavily impacted by the pandemic and South-ern Europe and South America accounted for more than half of the total drop in sales. Sales decreased by approximately 25% in Europe and Americas. In the US sales decreased by approximately 5%. In Asia-Pacific, Middle East and Africa, sales decreased by approximate-ly 5%. South East Asia continued to be negatively affected while sales in China was unchanged.
Operating income excluding amortization of intangible assets (EBITA) amounted to SEK 11m (82), corresponding to a margin of 1.0% (5.8). EBITA declined due to lower volumes. Operating income amount-ed to SEK –8m (72), corresponding to a margin of –0.8% (5.1).
Sales and EBITA margin
0
500
1,000
1,500
2,000
Q4Q3Q2Q1Q4Q3Q2Q12019¹
Sales EBITA margin
SEKm %
2020¹
–10
–5
0
5
10
15
1) The second quarter 2019 includes items affecting comparability of SEK +31m, the third quarter 2019 includes items affecting comparability of SEK –98m and the third quarter 2020 includes items affecting comparability of SEK –55m.
* In the fourth quarter of 2019, four months of the acquisition of Unic were reported in order to align with Electrolux Professional reporting.
Electrolux Professional – Year-end report, Q4 2020 P. 5
First page
Message from the CEO
Financial overview
Financial reports
Definitions
Shareholders information
Segment Laundry
In the fourth quarter, sales for Laundry was SEK 888m (930), a decline by 4% compared to the same period last year. Organically sales decreased by 1.9% and currency had a negative effect of 2.6%.
Sales in Europe grew approximately 2% and was flat in Americas, but declined almost 15% in Asia-Pacific, Middle East and Africa. In the US, sales grew approximately 10%.
Operating income excluding amortization of intangible assets (EBITA) amounted to SEK 150m (120), corresponding to a margin of 16.9% (12.9). Cost efficiency and a positive price development contrib-uted to the improved EBITA. Operating income amounted to SEK 146m (114), corresponding to a margin of 16.4% (12.3).
Sales and EBITA margin
0
200
400
600
800
1,000
Q4Q3Q2Q1Q4Q3Q2Q1
Sales EBITA margin
SEKm %
2019¹ 2020¹
0
5
10
15
20
25
1) The second quarter 2019 includes items affecting comparability of SEK +59m, the third quarter 2019 includes items affecting comparability of SEK –24m and the third quarter 2020 includes items affecting comparability of SEK –22m.
Group common costsEBITA –19 –21 –99 –18 Amortization –0 –0 –1 0 Operating income –19 –21 –100 –18
Total Group Net sales 1,935 2,334 7,263 9,281 EBITA 142 181 456 1,058 Amortization –23 –16 –69 –66 Operating income 119 165 387 992 Financial items, net –5 –7 –24 –15 Income after financial items 113 157 363 978 Taxes –43 11 –85 –314 Income for the period 70 168 278 663
Electrolux Professional – Year-end report, Q4 2020 P. 7
First page
Message from the CEO
Financial overview
Financial reports
Definitions
Shareholders information
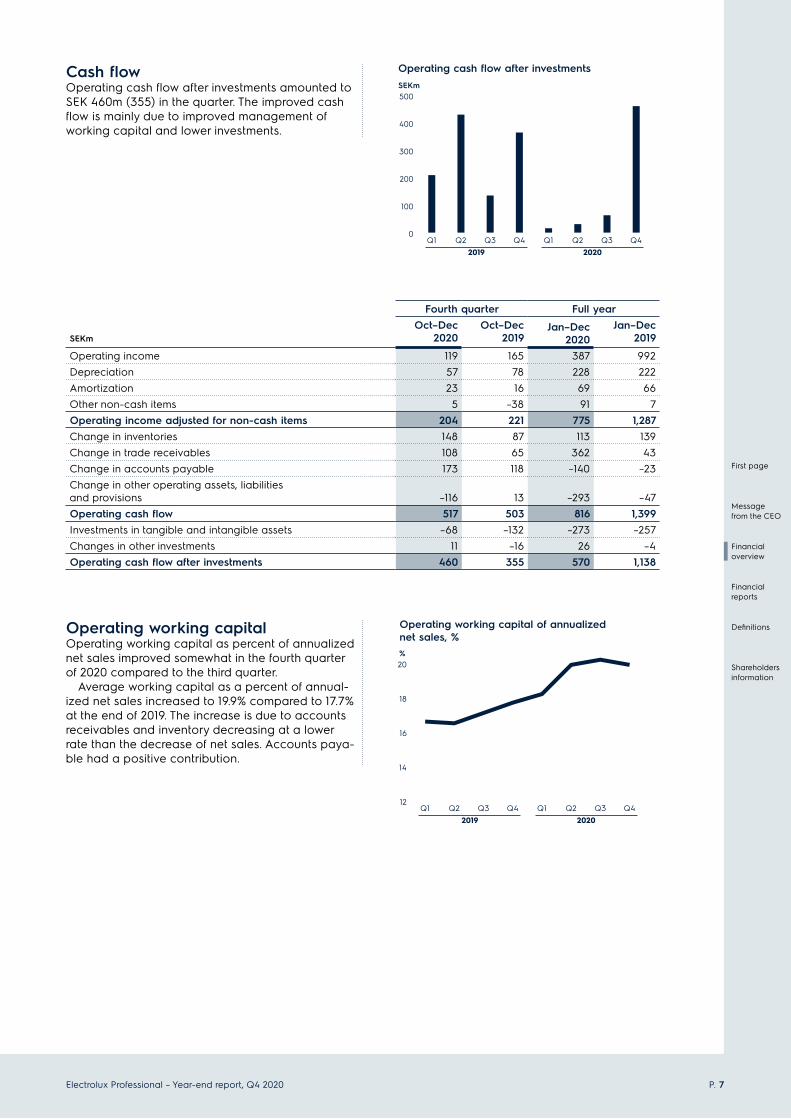
Cash flowOperating cash flow after investments amounted to SEK 460m (355) in the quarter. The improved cash flow is mainly due to improved management of working capital and lower investments.
Operating cash flow after investments
20202019
0
100
200
300
400
500
Q4Q3Q2Q1Q4Q3Q2Q1
SEKm
Fourth quarter Full year
SEKmOct–Dec
2020Oct–Dec
2019Jan–Dec
2020Jan–Dec
2019
Operating income 119 165 387 992 Depreciation 57 78 228 222 Amortization 23 16 69 66 Other non-cash items 5 –38 91 7 Operating income adjusted for non-cash items 204 221 775 1,287 Change in inventories 148 87 113 139 Change in trade receivables 108 65 362 43 Change in accounts payable 173 118 –140 –23 Change in other operating assets, liabilities and provisions –116 13 –293 –47 Operating cash flow 517 503 816 1,399 Investments in tangible and intangible assets –68 –132 –273 –257 Changes in other investments 11 –16 26 –4 Operating cash flow after investments 460 355 570 1,138
Operating working capitalOperating working capital as percent of annualized net sales improved somewhat in the fourth quarter of 2020 compared to the third quarter.
Average working capital as a percent of annual-ized net sales increased to 19.9% compared to 17.7% at the end of 2019. The increase is due to accounts receivables and inventory decreasing at a lower rate than the decrease of net sales. Accounts paya-ble had a positive contribution.
Operating working capital of annualized net sales, %%
20202019
12
14
16
18
20
Q4Q3Q2Q1Q4Q3Q2Q1
Electrolux Professional – Year-end report, Q4 2020 P. 8
First page
Message from the CEO
Financial overview
Financial reports
Definitions
Shareholders information
Financial positionNet debtAs of December 31, 2020, Electrolux Professional had a financial net debt position (excluding lease liabilities and post-employment provisions) of SEK 202m compared to SEK 588m as of December 31, 2019. Lease liabilities decreased somewhat to SEK 216m and net provisions for post-employments benefits decreased to SEK 131m.
In total, net debt amounted to SEK 549m as of December 31, 2020, compared to SEK 1,025m per December 31, 2019.
Long-term borrowings amounted to SEK 601m and total short-term borrowings amounted to SEK 412m. Total borrowings amounted to SEK 1,012m compared to SEK 1,244m on December 31, 2019. During the first quarter of 2020, loans to Electrolux Group was repaid and new external credit facilities were put in place.
Liquid funds as of December 31, 2020, amounted to SEK 810m compared to SEK 656m as of Decem-ber 31, 2019.
Credit facilities and loans On February 21, 2020, Electrolux Professional AB entered into a EUR 250m multicurrency revolving credit facilities agreement with its core banking- group with Skandinaviska Enskilda Banken AB (publ) as arranger and on March 6, 2020 a bilateral term loan was entered into with AB Svensk Export-kredit. The revolving credit facilities has a tenor of five years (with extension options) and the term loan has a tenure of seven years. As of December 31, 2020, EUR 40m of the revolving credit facility was utilized.
Net debt
SEKmDec 31,
2020Dec 31,
2019
Short-term loans 403 4 Short-term loans, Electrolux Group – 990 Short-term borrowings 403 994 Financial derivative liabilities 6 4 Accrued interest expenses and prepaid interest income 2 8 Other financial liabilities, Electrolux Group – 234 Total short-term borrowings 412 1,241 Long-term loans 601 3 Long-term borrowings 601 3 Total borrowings¹ 1,012 1,244
Cash and cash equivalents 797 651 Financial derivative assets 12 4 Prepaid interest expenses and accrued interest income 1 2 Liquid funds 810 656
Financial net debt 202 588 Lease liabilities 216 243 Net provisions for post-employment benefits 131 195 Net debt 549 1,025
Net debt/EBITDA ratio 0.8 0.8 EBITDA 684 1,280
1) Whereof interest-bearing liabilities amounting to SEK 1,004m as of December 31, 2020 and SEK 997m as of December 31, 2019.
Electrolux Professional – Year-end report, Q4 2020 P. 9
First page
Message from the CEO
Financial overview
Financial reports
Definitions
Shareholders information
Parent CompanyThe Parent Company’s activities include head office as well as production and sales in and from Sweden.
Net sales for the Parent Company, Electrolux Professional AB, for the period from 1 January to 31 December 2020 amounted to SEK 2,266m (2,361) of which SEK 886m (926) referred to sales to Group Companies and SEK 1,380m (1,435) to external customers.
Income before tax for the year was –1,822m (–17). Income amounted to SEK –1,886m (–1). A revision of the, at the time of the separation from AB Electrolux, carrying values of some of the acquisitions, in combination with the COVID-19 situation adding
pressure on profitability, has led to that Electrolux Professional AB in the fourth quarter, 2020 impaired some of its investments in subsidiaries. The total impairment amounts to SEK 2,039m.
Capital expenditure in tangible and intangible assets was SEK 12m (18). Liquid funds at the end of the period amounted to SEK 425m, as against SEK 204m at the beginning of the year.
Undistributed earnings in the Parent Company at the end of the period amounted to SEK 5,795m, against SEK 7,681m at the beginning of the year.
The income statement and balance sheet for the Parent Company are presented on page 19.
Other disclosuresSeparation and stock listing of Electrolux ProfessionalAt an Extraordinary General Meeting in AB Electrolux held on February 21, 2020, it was resolved to dis-tribute all shares in the wholly owned subsidiary Electrolux Professional AB to the shareholders of Electrolux. Consequently, Electrolux Professional was on March 23, 2020 listed on Nasdaq Stockholm and is since then a stand-alone company.
Conversion of sharesAccording to Electrolux Professional´s articles of association, owners of A-shares have the right to have such shares converted to B-shares. Con-version reduces the total number of votes in the Company. 68,998 shares were converted in the fourth quarter. The total number of registered shares in the company on December 31, 2020 amounted to 287,397,450 of which 8,120,527 were A-shares and 279,276,923 were B-shares. The total number of votes amounted to 36,048,219.3.
Related party transactions Buying and selling services and products between Electrolux Professional and AB Electrolux and its subsidiaries were regarded as related party transactions up until March 23, 2020, see table on page 16. Transactions with related parties were on market-based terms.
Employees The number of employees at the end of the quarter was 3,515 (3,624).
Events after the balance sheet date After the end of the reporting period, no significant events have taken place that could affect the com-pany’s operations.
Annual General Meeting 2021Electrolux Professional’s Annual General Meeting will be held on April 28, 2021.
Proposed dividend Due to the ongoing pandemic, the Board proposes to pay no dividend for 2020.
Risk and uncertainty factors Electrolux Professional is an international group with a wide geographic spread and is thus ex-posed to a number of business and financial risks. Risk management in Electrolux Professional aims to identify, control and reduce risks. The risk factors are described in the Prospectus ahead of the listing of the shares in Electrolux Professional and consist of operational risk, industry risks, legal risks and
financial risks. Compared to the Prospectus, which was issued on March 11, 2020, and the prospectus supplement that was published on March 20, 2020 no new material risks have been identified. Electrolux Professional expects that its financial performance during the beginning of 2021 will continue to be affected by the pandemic related to the coronavirus.
Stockholm, February 3, 2021
Electrolux Professional AB (publ)
Alberto Zanata President and CEO
This report has not been audited or reviewed by external auditors.
Electrolux Professional – Year-end report, Q4 2020 P. 10
First page
Message from the CEO
Financial overview
Financial reports
Definitions
Shareholders information
One Connected solutions
• Helps customers get top performances from their Electrolux Professional solutions.
• Maximizes profit and accelerates customer’s return on investment
• Control operations from any device• Only OnE Connected platform for all connected appliances
• Reduces downtime and maintains top operation performances
Real-time solutions for Washers & DryersMonitor the equipment’s status and performance from anywhere and take actions to improve the business.
SkyLine Cook and Chill solutionPioneering Cook and Chill solution that anticipates chef’s needs with SkyDuo, the seamless, self-intuitive connection between SkyLine appliance.
Connected solutions and the OnE dashboard provides customers with full control of their complete kitchen and laundry operations from one single digital platform.
Electrolux Professional – Year-end report, Q4 2020 P. 11
First page
Message from the CEO
Financial overview
Financial reports
Definitions
Shareholders information
Fourth quarter Full year
SEKmOct–Dec
2020Oct–Dec
2019Jan–Dec
2020Jan–Dec
2019
Net sales 1,935 2,334 7,263 9,281 Cost of goods sold –1,334 –1,563 –4,896 –6,040 Gross operating income 602 771 2,367 3,241 Selling expenses –326 –392 –1,355 –1,699 Administrative expenses –161 –242 –631 –582 Other operating income/expenses 4 28 5 32 Operating income 119 165 387 992 Financial items, net –5 –7 –24 –15 Income after financial items 113 157 363 978 Taxes –43 11 –85 –314 Income for the period 70 168 278 663 Items that will not be reclassified to income for the period: Remeasurement of provisions for post-employment benefits 13 58 83 –33 Income tax relating to items that will not be reclassified 1 –13 –8 6 14 44 75 –27 Items that may be reclassified subsequently to income for the period: Exchange-rate differences on translation of foreign operations –201 –76 –263 101 Other comprehensive income, net of tax –187 –32 –188 74
Total comprehensive income for the period –117 137 89 737 Income for the period attributable to: Equity holders of the Parent Company 70 168 278 663 Total 70 168 278 663
Total comprehensive income for the period attributable to: Equity holders of the Parent Company –117 137 89 737 Total –117 137 89 737 Earnings per share, SEK Basic, SEK 0.24 0.59 0.97 2.31 Diluted, SEK 0.24 0.59 0.97 2.31 Average number of shares Basic, million 287.4 287.4 287.4 287.4 Diluted, million 287.4 287.4 287.4 287.4
Consolidated statement of total comprehensive income
Financial reports
Electrolux Professional – Year-end report, Q4 2020 P. 12
First page
Message from the CEO
Financial overview
Financial reports
Definitions
Shareholders information
Consolidated balance sheet
SEKmDec 31,
2020Dec 31,
2019*
AssetsNon-current assetsProperty, plant and equipment, owned 1,254 1,214 Property, plant and equipment, right-of-use 211 238 Goodwill 1,690 1,821 Other intangible assets 305 388 Deferred tax assets 361 350 Pension plan assets 21 13 Other non-current assets 27 34 Total non-current assets 3,869 4,057
Current assetsInventories 1,086 1,265 Trade receivables 1,265 1,687 Tax assets 53 102 Other current assets 244 273 Cash and cash equivalents 797 651 Total current assets 3,444 3,978 Total assets 7,314 8,035
Equity and liabilities Equity attributable to equity holders of the Parent CompanyShare capital 29 25 Other paid-in capital 5 5 Other reserves 2 266 Retained earnings 2,764 2,415 Equity attributable to equity holders of the Parent Company 2,800 2,711 Total equity 2,800 2,711
Current liabilitiesTrade payables 1,289 1,606 Tax liabilities 324 309Other liabilities 988 1,361 Short-term borrowings 403 994 Short-term lease liabilities 65 72 Other provisions 162 198 Total current liabilities 3,232 4,539 Total equity and liabilities 7,314 8,035
*Year 2019 includes related party balances, see page 16.
Electrolux Professional – Year-end report, Q4 2020 P. 13
First page
Message from the CEO
Financial overview
Financial reports
Definitions
Shareholders information
Changes in condensed consolidated equityFull year
SEKmJan–Dec
2020Jan–Dec
2019
Opening balance 2,711 3,527 Total comprehensive income for the period 89 737
Dividend to equity holders of the Parent Company 0 –428 Other transactions with equity holders of the Parent Company1 –0 –1,125 Total transactions with equity holders –0 –1,553 Closing balance 2,800 2,711
1) Transactions related to transfer of assets and liabilities as part of the formation of the Electrolux Professional Group between Electrolux Group and Electrolux Professional Group have been classified as transactions with shareholders. During 2017, 2018 and 2019, asset and liabilities were transferred to Electrolux Professional without any consideration paid. During the latter half of 2019, a major legal restructuring was executed to form the legal Electrolux Professional group and a number of transactions took place where Electrolux Professional paid consideration for the asset and liabilities legally transferred, which, Electrolux Professional already had recognized in its combined financial statements.
Electrolux Professional – Year-end report, Q4 2020 P. 14
First page
Message from the CEO
Financial overview
Financial reports
Definitions
Shareholders information
Consolidated cash flow statementFourth quarter Full year
SEKmOct–Dec
2020Oct–Dec
2019Jan–Dec
2020Jan–Dec
2019
Operations Operating income 119 165 387 992 Depreciation and amortization 80 94 297 287 Other non-cash items 5 –38 91 7 Financial items paid, net1 –6 0 –22 –6 Taxes paid –16 –76 –66 –275 Cash flow from operations, excluding change in operating assets and liabilities 181 145 687 1,006
Change in operating assets and liabilities Change in inventories 148 87 113 139 Change in trade receivables 108 65 362 43 Change in accounts payable 173 118 –140 –23 Change in other operating assets, liabilities and provisions –116 13 –293 –47 Cash flow from change in operating assets and liabilities 313 283 41 112 Cash flow from operations 495 428 729 1,118
Investments Acquisition of operations – – – –441 Capital expenditure in property, plant and equipment –65 –125 –267 –243 Capital expenditure in product development 0 –2 –1 –9 Capital expenditure in other intangibles –3 –4 –5 –5 Other 11 –16 26 –4 Cash flow from investments –57 –148 –246 –702 Cash flow from operations and investments 438 280 483 417
Financing Change in short-term borrowings, net –243 14 413 –32 New long-term borrowings – – 600 – Amortization of long-term borrowings –0 –32 –1 –36 Payment of lease liabilities –19 –36 –82 –83 Dividend to Electrolux Group – –64 – –428 Shareholders contribution – 5,702 – 5,702 Change in financial liabilities, Electrolux Group – –4,977 –1,224 1,672 Cash flow from financing –262 608 –294 6,795 Total cash flow 176 888 189 7,211
Cash and cash equivalents at beginning of period 640 418 651 230 Exchange-rate differences referring to cash and cash equivalents –19 –5 –42 14 Other cash flow from transactions with shareholders, Electrolux Group2 – –651 – –6,804 Cash and cash equivalents at end of period 797 651 797 651
1) For the period January 1 to December 31: interest and similar items received SEK 5m (12), interest and similar items paid SEK -13m (-13) and other financial items received/paid SEK -7m (1). Interest paid for lease liabilities SEK -7m (-6)
2) “Other cash flow from transactions with shareholders, Electrolux group” consists of effects on cash from cash flows presented in Electrolux Professional’s combined financial statements belonging to legal entities remaining in the Electrolux Group following the separation. In 2019, it also includes cash paid by Electrolux Professional to the Electrolux Group, to acquire its group companies.
Electrolux Professional – Year-end report, Q4 2020 P. 15
First page
Message from the CEO
Financial overview
Financial reports
Definitions
Shareholders information
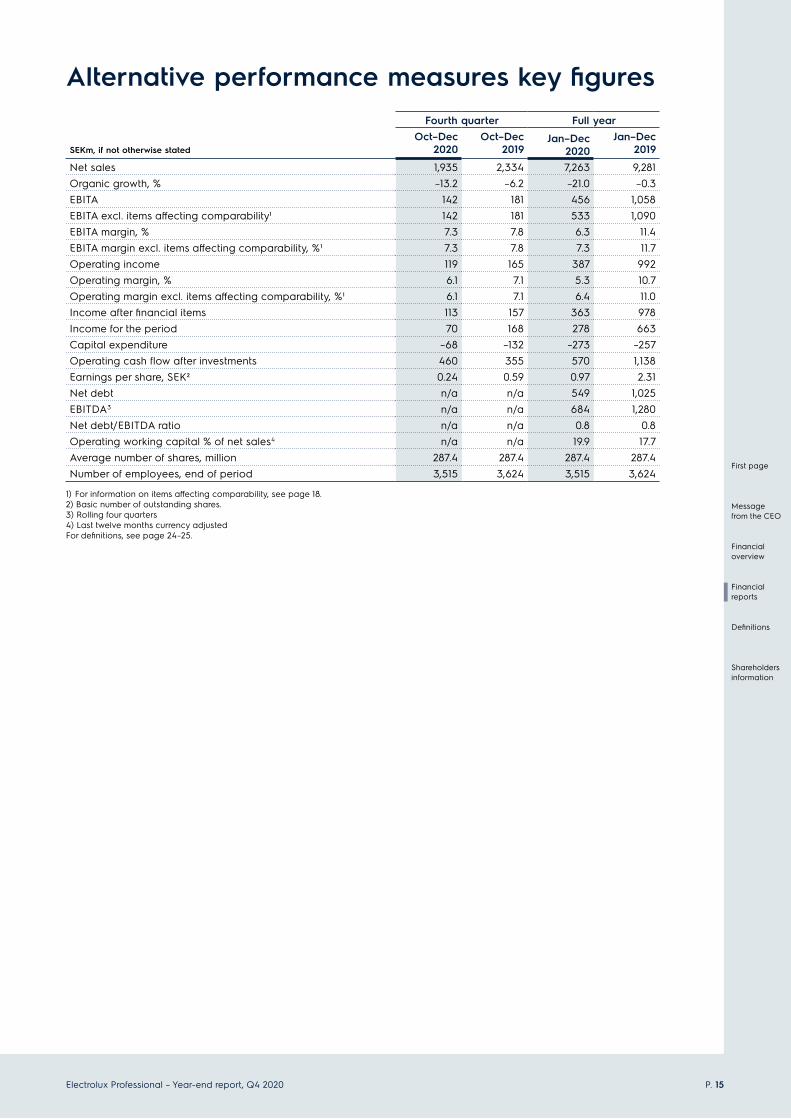
Alternative performance measures key figuresFourth quarter Full year
SEKm, if not otherwise statedOct–Dec
2020Oct–Dec
2019Jan–Dec
2020Jan–Dec
2019
Net sales 1,935 2,334 7,263 9,281 Organic growth, % –13.2 –6.2 –21.0 –0.3 EBITA 142 181 456 1,058 EBITA excl. items affecting comparability¹ 142 181 533 1,090 EBITA margin, % 7.3 7.8 6.3 11.4 EBITA margin excl. items affecting comparability, %¹ 7.3 7.8 7.3 11.7 Operating income 119 165 387 992 Operating margin, % 6.1 7.1 5.3 10.7 Operating margin excl. items affecting comparability, %¹ 6.1 7.1 6.4 11.0 Income after financial items 113 157 363 978 Income for the period 70 168 278 663 Capital expenditure –68 –132 –273 –257 Operating cash flow after investments 460 355 570 1,138 Earnings per share, SEK² 0.24 0.59 0.97 2.31 Net debt n/a n/a 549 1,025 EBITDA3 n/a n/a 684 1,280 Net debt/EBITDA ratio n/a n/a 0.8 0.8 Operating working capital % of net sales4 n/a n/a 19.9 17.7 Average number of shares, million 287.4 287.4 287.4 287.4 Number of employees, end of period 3,515 3,624 3,515 3,624
1) For information on items affecting comparability, see page 18. 2) Basic number of outstanding shares. 3) Rolling four quarters4) Last twelve months currency adjustedFor definitions, see page 24–25.
Electrolux Professional – Year-end report, Q4 2020 P. 16
First page
Message from the CEO
Financial overview
Financial reports
Definitions
Shareholders information
Related party transactions, Electrolux GroupFourth quarter Full year
SEKmOct–Dec
2020Oct–Dec
2019Jan–Dec
2020Jan–Dec
2019
Income for the periodPurchase of goods – –13 –15 –50Interest income – 3 – 9Interest expense – –6 –1 –17
AssetsOther current assetsOther short-term operational receivables – 1 – 1
Electrolux Professional – Year-end report, Q4 2020 P. 18
First page
Message from the CEO
Financial overview
Financial reports
Definitions
Shareholders information
Shares
Exchange rates
Number of shares A-shares B-shares Shares, totalShares held by
other shareholders
Number of shares as of January 1, 2020 8,192,539 279,204,911 287,397,450 287,397,450 Conversion of shares –72,012 72,012 Number of shares as of December 31, 2020 8,120,527 279,276,923 287,397,450 287,397,450
1) The SEK –77m relates to restructuring charges for efficiency measures and are included in the line item cost of goods sold, marketing and admininstration.
2) The SEK –122m relates to restructuring charges for efficiency measures and are included in the line item cost of goods sold, marketing and admininstration.
3) The non-recurring item of SEK 90m relates to a pension plan settlement in Sweden and is included in the line item administration.
Financial income/expense, net -1 69 -7 65Impairment of shares in subsidiaries –2,039 0 –2,039 0Financial items, net –2,040 69 –2,046 65Income after financial items –1,950 80 –1,817 235Appropriations –5 –252 –5 –252Income before taxes –1,955 –172 –1,822 –17Taxes –20 6 –64 16Income for the period –1,975 –166 –1,886 –1
SEKmDec 31,
2020Dec 31,
2019
Assets Non–current assets 6,452 8,527 Current assets 1,886 1,543 Total assets 8,338 10,070
Equity and liabilities Restricted equity 47 46 Non–restricted equity 5,795 7,681 Total equity 5,842 7,727 Untaxed reserves 114 109 Provisions 98 96 Non-current liabilties 600 –Current liabilities 1,684 2,138 Total equity and liabilities 8,338 10,070
Electrolux Professional – Year-end report, Q4 2020 P. 20
First page
Message from the CEO
Financial overview
Financial reports
Definitions
Shareholders information
Notes
Electrolux Professional applies International Finan-cial Reporting Standards (IFRS) as adopted by the European Union. This report has been prepared in accordance with IAS 34, Interim Financial Report-ing.
Electrolux Professional interim reports contain a condensed set of financial statements. For the Group this chiefly means that the disclosures are limited compared to the combined financial state-ments presented in the prospectus. Enumerated amounts presented in tables and statements may not always agree with the calculated sum of the related line items due to rounding differences. The aim is for each line item to agree with its source and therefore there may be rounding differences affecting the total when adding up the presented line items.
The accounting principles adopted in the prepa-ration of this interim report apply to all periods and comply with the accounting principles presented in the prospectus “Admission to trading of Shares in Electrolux Professional AB on Nasdaq Stockholm” in Note 1.
Government grants and government assistance are recognized in the financial statements when there is reasonable assurance that the entity will
comply with the conditions attached to them and the grants will be received. Grants which are ded-icated to a specific and clearly identified expense item, is reported as a deduction of the specific expense. Grants of a more general character are reported as other operating income. Grants related to assets are reported as prepaid income in the balance sheet. The grant is amortized over the use-ful life of the asset for which it has been received.
For the Parent Company financial statements in general are presented in condensed versions and with limited disclosures compared to the annual report. The interim financial statements of Electrolux Professional AB have been prepared in accordance with the Swedish Annual Accounts Act and the accounting standard RFR 2, accounting for legal entities. The most recent annual financial statements of Electrolux Professional AB have been prepared in accordance with the Annual Accounts Act and the standard from the Swedish Accounting Standards Board BFNAR 2012:1 Annual report and consolidated accounts (K3).
Reportable segmentsFood & Beverage and Laundry represent the Group’s reportable segments.
Note 2 Disaggregation of revenue
Fourth quarter Full year
SEKOct–Dec
2020Oct–Dec
2019Jan–Dec
2020Jan–Dec
2019
Geographical region Europe 1,315 1,593 5,053 6,165 Asia-Pacific, Middle East and Africa 338 388 1,187 1,513 Americas 283 353 1,023 1,603 Total 1,935 2,334 7,263 9,281
Note 1 Accounting principles
Sales of products are revenue recognized at a point in time, when control of the products has transferred. Revenue from services related to instal-lation of products, repairs or maintenance service is recognized when control is transferred being over the time the service is provided. Sales of these services are not material in relation to Electrolux Professional total net sales.
Geography is an important attribute when disaggregating Electrolux Professional revenue. Therefore, the table below presents net sales per geographical region based on the location of the end customer.
Electrolux Professional – Year-end report, Q4 2020 P. 21
First page
Message from the CEO
Financial overview
Financial reports
Definitions
Shareholders information
Note 3 Fair values and carrying amounts of financial assets and liabilities
Dec 31, 2020 Dec 31, 2019
SEK Fair value Carrying amount Fair value
Carrying amount
Per category Financial assets at fair value through profit and loss 0 0 0 0 Financial assets measured at amortized cost 2,058 2,058 2,339 2,339 Derivatives, financial assets at fair value through profit and loss 12 12 4 4 Total financial assets 2,070 2,070 2,344 2,344 Financial liabilities measured at amortized cost 2,293 2,289 2,837 2,837 Derivatives, financial liabilities at fair value through profit and loss 6 6 5 5 Total financial liabilities 2,299 2,295 2,843 2,843
The Group strives for arranging master-netting agreements (ISDA) with the counterparts for deriv-ative transactions and has established such agree-ments with the majority of the counterparties, i.e., if a counterparty will default, assets and liabilities will be netted. Derivatives are presented gross in the balance sheet.
Fair value estimationValuation of financial instruments at fair value is done at the most accurate market prices available. Instruments which are quoted on the market, e.g., the major bond and interest-rate future markets, are all mark-to-market with the current price. The foreign-exchange spot rate is used to convert the value into SEK. For instruments where no reliable price is available on the market, cash-flows are discounted using the deposit/swap curve of the cash flow currency. If no proper cash-flow schedule is available, e.g., as in the case with forward-rate agreements, the underlying schedule is used for valuation purposes.
To the extent option instruments are used, the valuation is based on the Black & Scholes’ formula.
The carrying value less impairment provision of trade receivables and payables are assumed to approximate their fair values. The fair value of financial liabilities is estimated by discounting the future contractual cash flows at the current market- interest rate for similar financial instruments. The Group’s financial assets and liabilities are measured according to the following hierarchy:
Level 1: Quoted prices in active markets for iden-tical assets or liabilities. At December 31, 2020, the fair value for Level 1 financial assets was SEK 0m (0) and for financial liabilities SEK 0m (0).
Level 2: Inputs other than quoted prices included in Level 2 that are observable for assets or liabilities either directly or indirectly. At December 31, 2020, the fair value of Level 2 financial assets was SEK 12m (4) and financial liabilities SEK 6m (5).
Level 3: Inputs for the assets or liabilities that are not entirely based on observable market data. At Dectember 31, 2020, the fair value of Level 3 finan-cial assets was SEK 0m (1) and financial liabilities SEK 0m (0).
Note 4 Contingent liabilities
SEKmDec 31,
2020Dec 31,
2019
Group Guarantees and other commitments 129 125
On January 21, 2020, a supplier filed a lawsuit in Ita ly against Electrolux Professional. The claimed amount was EUR 11.3m but was during the third quarter increased to EUR 12.1m, approximately SEK 121m, and covers alleged damages related to products and prices during the contractual period
and compensation for costs and damages resulting from the allegedly wrongful termination of the sup-ply agreement. Electrolux Professional rejects the claim but it cannot be ruled out that the final out-come could have a significant impact on Electrolux Professional’s operating income and cash flow.
Electrolux Professional – Year-end report, Q4 2020 P. 22
First page
Message from the CEO
Financial overview
Financial reports
Definitions
Shareholders information
As a consequence of the COVID-19 outbreak, Electrolux Professional has assessed any potential impact on the carrying value of asset and liabilities.
Trade receivablesNo material increase in actual credit losses has been experienced. Collection of trade receivables is carefully monitored. Management have stressed the need for even more focus on forward looking evaluation of the risk of not being able to collect payments and therefore the expected credit loss provision has increased to SEK 100m on 31 Decem-ber, 2020 compared to SEK 66m on 31 December 2019.
Credit insurance and other forms of collaterals, for example letter of credit and bank guarantees are used as a protection against credit risk. In ad-dition, some sales are also made to governmental institutions which are deemed as secure.
InventoriesDuring the year, no extraordinary material write-down of finished goods inventories or supplies have been recognized as a consequence of the COVID-19 situation.
Impairment of assetsNo material impairment of assets has been recog-nized in the consolidated financial statements as a direct consequence of COVID-19.
LeasesThe Group has received some minor office rent reductions.
Government grants and government assistanceCompanies within the Group have received or assume that they fulfil the requirements of monetary help from governments. As of December 31, 2020 the amount recognized in profit or loss is SEK 18m in the quarter and SEK 95m year to date and refers mainly to short-term furlough of personnel.
The Group has also utilized the possibility to postpone tax payments in Sweden resulting in posi-tive operating cash flow effect of SEK 48m in the second quarter. In the third quarter SEK 30m has been paid and the remaining SEK 18m has been paid during quarter four 2020.
Note 5 COVID-19
Electrolux Professional – Year-end report, Q4 2020 P. 23
First page
Message from the CEO
Financial overview
Financial reports
Definitions
Shareholders information
Four year overviewSEKm, if not otherwise stated 2020 2019 2018 2017
Net sales 7,263 9,281 8,666 7,723 Organic growth, % –21.0 –0.3 4.1 5.6 EBITA 456 1,058 1,188 1,098 EBITA, % 6.3 11.4 13.7 14.2 Operating income 387 992 1,143 1,060 Operating margin, % 5.3 10.7 13.2 13.7 Income after financial items 363 978 1,134 1,052 Income for the period 278 663 952 786 Items affecting comparability –77 –32 – – Capital expenditure –273 –257 –169 –167 Operating cash flow after investments 570 1,138 1,131 1,167 Earnings per share, SEK¹ 0.97 2.31 3.31 2.74 Equity per share, SEK 9.74 9.43 31.91 8.43 Dividend per share, SEK – – – – Net debt 549 1,025 –226 –481 EBITDA 684 1,280 1,363 1,253 Net debt/EBITDA ratio 0.8 0.8 –0.2 –0.4 Average number of shares, million 287.4 287.4 287.4 287.4 Number of employees, end of period 3,515 3,624 3,555 3,183
1) Basic number of outstanding shares.
Operations by segment yearlySEKm 2020 2019 2018 2017
Group common cost Operating income –100 –18 –14 –11
Total Group Net sales 7,263 9,281 8,666 7,723 EBITA 456 1,058 1,188 1,098 EBITA, % 6.3 11.4 13.7 14.2 Operating income 387 992 1,143 1,060 Operating margin, % 5.3 10.7 13.2 13.7
Electrolux Professional – Year-end report, Q4 2020 P. 24
First page
Message from the CEO
Financial overview
Financial reports
Definitions
Shareholders information
DefinitionsDefinitions and reconciliation of alternative performance measuresElectrolux Professional presents certain measures that are not defined under IFRS (alternative performance meas-ures – “APMs”). These are used by management to assess the financial and operational performance of the Group. Management believes that these APMs provide useful information regarding the Group’s financial and operating performance. Such measures may not be comparable to
similar measures presented by other companies. Con-sequently, APMs have limitations as analytical tools and should not be considered in isolation or as a substitute for related financial measures prepared in accordance with IFRS. The APMs have been derived from the Electrolux Professional’s internal reporting and are not audited. The APM reconciliations can be found on Electrolux Professional website www.electroluxprofessional.com/cor-porate/interim-reports/
APM Definition Reason for use
Organic growth % Change in sales growth excluding net FX impact and acquisitions.
The Group’s presentation currency is SEK while the net sales are mainly in other cur-rencies. Organic growth is dependent on fluctuations in SEK versus other currencies and in addition acquired business can have an impact on reported net sales. Organic growth adjusted for acquisitions and currency shows the underlying sales development without these parameters.
Acquisitions % Change in net sales during the current period attributable to acquired operation in relation to prior period’s sales, following a period of 12 months commencing on the acquisition date.
See “Organic growth” above.
Operating income (EBIT) Earnings before interest and tax. Used as an indicator that shows the Group’s ability to make a profit, regard-less of the method of financing (then determines the optimal use of debt versus equity).
Operating margin (EBIT margin)
Operating income as a percentage of net sales.
Operating margin shows the operating income in percentage of net sales. Operat-ing margin is a key internal measure as the Group believes that it provides users of the financial statements with a better under-standing of the Group’s financial perfor-mance both short and long term.
Items affecting comparability
Material profit or loss items such as capital gains and losses from divestments of product groups or major units, close down or significant down-sizing of major units or activities, restructuring activities, significant impairment, and other major non-recurring costs or income.
Summarizes events and transactions with significant effects, which are relevant for understanding the financial performance when comparing income for the current period with previous periods.
Operating income excluding items affect-ing comparability as a percentage of net sales.
Operating margin excluding items affecting comparability shows the operating income in percentage of net sales adjusted for items affecting comparability. This is a key internal measure, as the Group believes that it provides users of the financial state-ments with a better understanding of the Group’s financial performance both short and long term.
Capital expenditure Investments in property, plant and equip-ment, product development and other intangible assets.
Used to ensure that cash spending is in line with Group’s overall strategy for the use of cash.
Electrolux Professional – Year-end report, Q4 2020 P. 25
First page
Message from the CEO
Financial overview
Financial reports
Definitions
Shareholders information
APM Definition Reason for use
EBITA Operating income less amortization and write-down related to intangibles assets (excluding right of use assets).
EBITA gives an indication of the operating income less amortization and write-down related to intangibles assets (excluding right of use assets) and is mainly used to follow up operating income without the distortion of amortization of surplus values related to acquisitions.
EBITA margin EBITA expressed as a percentage of net sales.
Used to evaluate business performance in relation to net sales in order to measure the efficiency of the Company.
EBITDA EBITA less depreciation of tangible assets (including right of use assets).
EBITDA is an indicator for business’ cash generating capacity in relation to sales.
EBITA excluding items affecting comparability
Operating income less amortization and write-down related to intangibles assets (excluding right of use assets) and less items affecting comparability.
Items affecting comparability vary between years and periods and in order to analyze trends items affecting comparability are excluded from EBITA.
EBITA excluding items affecting compa-rability, expressed as a percentage of net sales.
Items affecting comparability vary between years and periods and in order to analyse trends, items affecting comparability are excluded from EBITA margin.
Operating cash flow after investments
Cash flow from operations and investments adjusted for financial items paid, net, taxes paid and acquisitions/divestments of operations.
Used to monetarize the cash from core operation.
Net debt Short-term borrowings (short-term loans and trade receivables with recourse), accrued interest expenses and prepaid interest income and long-term borrowings, lease liabilities, net provisions for post-em-ployment benefits, less liquid funds (cash and cash equivalents, prepaid interest expenses and accrued interest income and cashpool accounts Electrolux Group).
Net debt describes the Group’s total debt financing and is monitored by manage-ment.
Net debt/EBITDA Net debt in relation to EBITDA (Net debt is based on the end of period balance and EBITDA is calculated based on last four rolling quarters).
A measurement of financial risk, showing net debt in relation to cash generation.
Operating working capital, % of net sales
Sum of currency adjusted last twelve months’ average of inventories, non-re-lated party trade receivables and trade payables (Operating working capital) as percentage of currency adjusted last twelve months’ average net sales.
All months of the period are currency adjusted by applying the end of period average currency rate.
Used to evaluate how efficient the Group is generating cash in relation to net sales.
Electrolux Professional – Year-end report, Q4 2020 P. 26
First page
Message from the CEO
Financial overview
Financial reports
Definitions
Shareholders information
Shareholders informationPresident and CEO Alberto Zanata’s comments on the fourth quarter results 2020Today’s press release is available on the Electrolux Professional website www.electroluxprofessional.com/corporate
Telephone conference 09.00 CET A telephone conference is held at 09.00 today, February 3, 2021. Alberto Zanata, President and CEO and Fabio Zarpellon, CFO will comment on the report.
Details for participation by telephone are as follows:Participants in Sweden: +46 8 505 583 65Participants in UK/Europe: +44 333 300 9030Participants in US: +1 833 526 8396
Slide presentations for download: www.electroluxprofessional.com/corporate
Link to webcast: https://electroluxprofessional.creo.se/210203
For further information, please contact:Jacob Broberg, Senior Vice President Investor Relations and Communications +46 70 190 00 33
Financial calender Date
Annual Report 2020 published March 31, 2021
Interim report Q1 2021 April 27, 2021
Annual General Meeting April 28, 2021
Interim report Q2 2021 July 22, 2021
Interim report Q3 2021 October 28, 2021
StrategyElectrolux Professional’s strategy focuses on four pillars, built on a foundation of operational excellence to improve sales productivity and cost efficiency within the supply chain.
GROW the business by developing sustainable, innovative low-running cost solutions: Set the pace of industry innovation in sustainability and energy efficiency, complemented with a connected and digital platform meeting customers’ needs. EXPAND in food service chains, especially in North America, grow in beverage and expand in emerging markets: Increase the global footprint and market position in selected industry verticals organically and through selective M&A as a further accelerator. BOOST Customer Care (aftermarket sales) by further developing the global service network and competence as a full-service provider while increasing sales of accessories and consumables to enhance product performance and ownership experience.
LEVERAGE the OnE approach: Strengthen the position as a full-solution provider within food, beverage and laundry to cater for all customers’ needs under one global brand and make customers’ lives easier in a world of connected appliances.
Mission Making Electrolux Professional’s customers’ work-life easier, more profitable – and truly sustainable every day.
Financial targets
Organic sales growth Organic annual growth of more than 4 percent over time, complemented by value accretive acquisi-tions. EBITA marginEBITA margin of 15 percent. Operating working capital Operating working capital below 15 percent of net sales.
Net debt/EBITDALeverage ratio below 2.5x Net debt/EBITDA. Higher levels may be temporarily acceptable in case of acquisitions, provided a clear path to deleveraging.
Dividend policy30 percent of net income.
This information is information that Electrolux Professional AB (publ) is obliged to make public pursuant to the EU Market Abuse Regulation. The in-formation was submitted for publication, through the agency of the contact person detailed in the column to the left, at 8:00 a.m. CET on February 3, 2021.
Electrolux Professional AB (publ), 556003-0354Postal and visiting address: S:t Göransgatan 143, SE-112 17 StockholmTelephone: +46 8 41056450
Website: www.electroluxprofessional.com/corporate
This report contains ‘forward-looking’ statements that reflect the company’s current expectations. Although the company believes that the expecta-tions reflected in such forward-looking statements are reasonable, no assurance can be given that such expectations prove to have been correct as they are subject to risks and uncertainties that could cause actual results to differ materially due to a variety of factors. These factors include, but are not limited to, changes in consumer demand, changes in economic, market and competitive conditions, currency fluctuations, developments in product liability litigation, changes in the regulatory environment and other government actions.
Forward-looking statements speak only as of the date they were made, and, other than as required by applicable law, the company undertakes no obligation to update any of them in light of new information or future events.
About Electrolux ProfessionalElectrolux Professional is one of the leading global providers of food service, beverage and laundry for professional users.
Our innovative products and worldwide service network make our customers’ work-life easier, more profitable and truly sustainable every day.
Our solutions and products are manufactured in 12 plants in seven countries and sold in over 110 countries. In 2020, Electrolux Professional
had global sales of SEK 7,3bn and approximately 3,500 employees. For more information, visit www.electroluxprofessional.com/corporate