Prepared by: Neola Crosby Wendy Still, Chief Probation Officer Alameda County Probation Department YEAR FIVE STATUS UPDATE Public Safety Realignment in Alameda County July 1, 2015 – June 30, 2016
Transcript
Prepared by: Neola Crosby
Wendy Still, Chief Probation Officer
Alameda County Probation Department
YEAR FIVE STATUS UPDATE Public Safety Realignment in Alameda County
July 1, 2015 – June 30, 2016
I. Executive Summary ................................................................................. 1
II. Guiding Principles .................................................................................... 7
III. Population ............................................................................................... 9
IV. Recidivism .............................................................................................. 12
V. Housing .................................................................................................. 15
VI. Employment .......................................................................................... 23
VII. Probation Services ................................................................................. 26
Grant-making: Community Capacity Fund/Direct Services Grants ... 29
VIII. Public Defender: Clean Slate Program and Social Worker Initiatives ..... 32
IX. Sheriff’s Office: In-Custody Services ...................................................... 38
X. District Attorney .................................................................................... 41
XI. Behavioral Health Care Services - Substance Use Disorder Treatment,
Mental Health Services and Innovations In ReEntry .............................. 44
XII. Transition/Day Reporting Center (TDRC) ............................................... 55
Page | 1
I. EXECUTIVE SUMMARY
OVERVIEW
Alameda County’s Public Safety Realignment Year Five Status Report covers the period from July 1,
2015 – June 30, 2016. This Report will highlight Alameda County’s allocations, expenditures, recidivism
rate, population, services and client outcomes.
Community Corrections Partnership Executive Committee The Community Corrections Partnership Executive Committee (CCPEC) was established, as a result of the passage of the AB 109 Public Safety Realignment Act (Realignment). The CCPEC has oversight for the implementation of Realignment in Alameda County, including the submission of funding and budgetary recommendations to the Alameda County Board of Supervisors.
COMMUNITY CORRECTIONS PARTNERSHIP EXECUTIVE COMMITTEE MEMBERS
Wendy Still, Chief Probation Officer and CCPEC Chair Lori Cox, Director, Social Services Agency Nancy O’Malley, District Attorney Judge Morris Jacobson, Superior Court David Spiller, Pleasanton Police Chief Rich Lucia, Undersheriff Brendon Woods, Public Defender
Alameda County Community Advisory Board In December 2013, the Alameda County Board of Supervisors established the Community Advisory Board (CAB) in an effort to ensure a “community voice” on matters relating to Realignment and reentry in Alameda County. The CAB is a 15-member board, appointed by the Board of Supervisors, with three representatives from each of the five supervisorial districts; at least one of the three members must be formerly incarcerated. The CCPEC approved Operating Guidelines1 for the CAB on April 22, 2014.
Realignment Funding Alameda County received the following Public Safety Realignment funding for Fiscal Year (FY) 15/16:
Final Allocation $40,861,385
Growth $1,776,165
Total Allocation $42,637,550
The Alameda County Board of Supervisors approved the designation of 50% of the prior fiscal year’s AB
109 Public Safety Realignment base allocation to community-based organizations that work with the
realigned population. For FY 14/15, the base allocation was $31,497,960, resulting in $15,748,980 to be
allocated to community-based organizations for FY 15/16.
Following are the detailed amounts allocated to community-based organizations for Year Five:
Community Services Behavioral Health Care Service (Mental Health & Substance Use) $ 2.0M For Us By Us $ 1.0M Community Capacity Fund $ 3.0M Housing $ .6M Case Management $ 1.0M Innovations in Reentry $ 1.0M Education $ 1.0M Pre-Trial/Early Intervention Court $ 1.7M Employment $ 5.3M* Transition/Day Reporting Center $ 3.8M**
*Includes allocations for programmatic and operational costs
**Includes initial allocation of $3M, plus additional allocations to cover increases in services
TOTAL: $20.4 million
The remaining 50% to be allocated to the government partners was to be determined in discussion with the County Administrator’s Office and the Auditor Controller’s Office. Following are the expenditures for the governmental partners for Year Five:
Governmental Partners
District Attorney $ 1,530,324* Public Defender $1,852,213* Probation Department $ 3,872,722 Sheriff’s Office $20,155,534
*Includes AB 109 and AB 118 expenditures
Total: $27,410,793
SUMMARY: Alameda County spent $47,810,793 on realignment-related activities during Year Five, which exceeded our Public Safety Realignment allocation of $42,637,550 by $5,173,243, indicating that the governmental partners had to utilize non-realignment funding to provide the amount of services delivered to realigned clients.
The total amount slated to be allocated to community-based organizations for Year Five was
$15,748,980. However, $20,400,000 was allocated, which represents an additional $4,651,020, thereby
surpassing the 50% mandated by the Board of Supervisors by 23%!
Page | 3
POPULATION
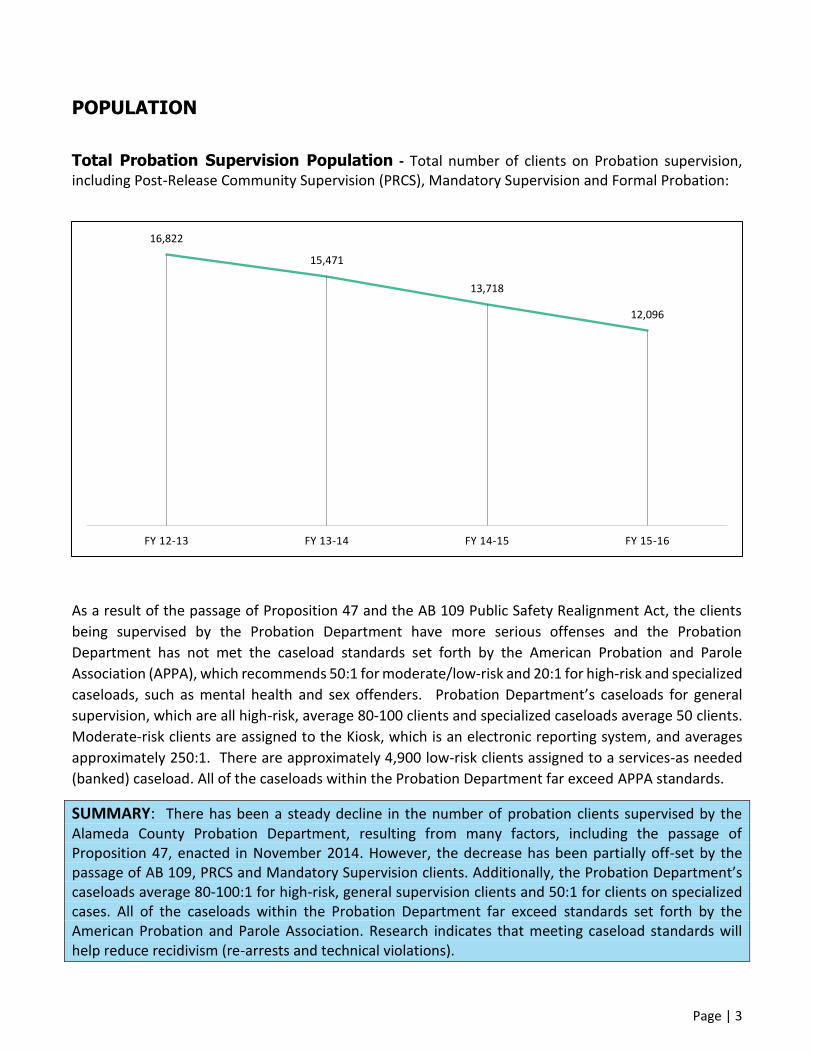
Total Probation Supervision Population - Total number of clients on Probation supervision, including Post-Release Community Supervision (PRCS), Mandatory Supervision and Formal Probation:
As a result of the passage of Proposition 47 and the AB 109 Public Safety Realignment Act, the clients
being supervised by the Probation Department have more serious offenses and the Probation
Department has not met the caseload standards set forth by the American Probation and Parole
Association (APPA), which recommends 50:1 for moderate/low-risk and 20:1 for high-risk and specialized
caseloads, such as mental health and sex offenders. Probation Department’s caseloads for general
supervision, which are all high-risk, average 80-100 clients and specialized caseloads average 50 clients.
Moderate-risk clients are assigned to the Kiosk, which is an electronic reporting system, and averages
approximately 250:1. There are approximately 4,900 low-risk clients assigned to a services-as needed
(banked) caseload. All of the caseloads within the Probation Department far exceed APPA standards.
SUMMARY: There has been a steady decline in the number of probation clients supervised by the Alameda County Probation Department, resulting from many factors, including the passage of Proposition 47, enacted in November 2014. However, the decrease has been partially off-set by the passage of AB 109, PRCS and Mandatory Supervision clients. Additionally, the Probation Department’s caseloads average 80-100:1 for high-risk, general supervision clients and 50:1 for clients on specialized cases. All of the caseloads within the Probation Department far exceed standards set forth by the American Probation and Parole Association. Research indicates that meeting caseload standards will help reduce recidivism (re-arrests and technical violations).
16,822
15,471
13,718
12,096
FY 12-13 FY 13-14 FY 14-15 FY 15-16
Page | 4
Total Realigned Population In March 2013, the Alameda County Community Corrections Partnership Executive Committee expanded the State’s definition of realignment to include individuals charged and/or sentenced to an AB 109 eligible offense.
SUMMARY: From October 1, 2011 – June 30, 2016, Alameda County’s realigned population is approximately 25,334 individuals.
Recidivism In November 2014, the Board of State and Community Corrections (BSCC) released a definition of recidivism to be state-wide in an effort to standardize the reporting and measurement of recidivism. The definition is as follows: Adult Recidivism Definition: Recidivism is defined as conviction of a new felony or misdemeanor committed within three years of release from custody or committed within three years of placement on supervision for a previous criminal conviction. Utilizing this definition, Alameda County’s recidivism rates are as follows:
Type Rate
New Convictions 20.3%
In addition to tracking recidivism for new convictions, Alameda County also uses two additional
benchmarks, noted below:
Petitions filed by DA 20.4%
Petitions filed by Probation 5.9%
SUMMARY: Alameda County tends to file violations of probation, in lieu of new convictions at a greater rate than many other counties; as a result, Alameda County also tracks recidivism based upon violations of probation, as well as new convictions for clients supervised or previously supervised by the Probation Department. Note: These figures are only for violations and new offenses within Alameda County; therefore, the recidivism rates presented above may be under-representations of the level of criminal activity that probation clients engage in. The recidivism rates above, utilizing the BSCC definition, will serve as the County’s baseline for future reports.
Page | 5
CLIENT OUTCOME HIGHLIGHTS
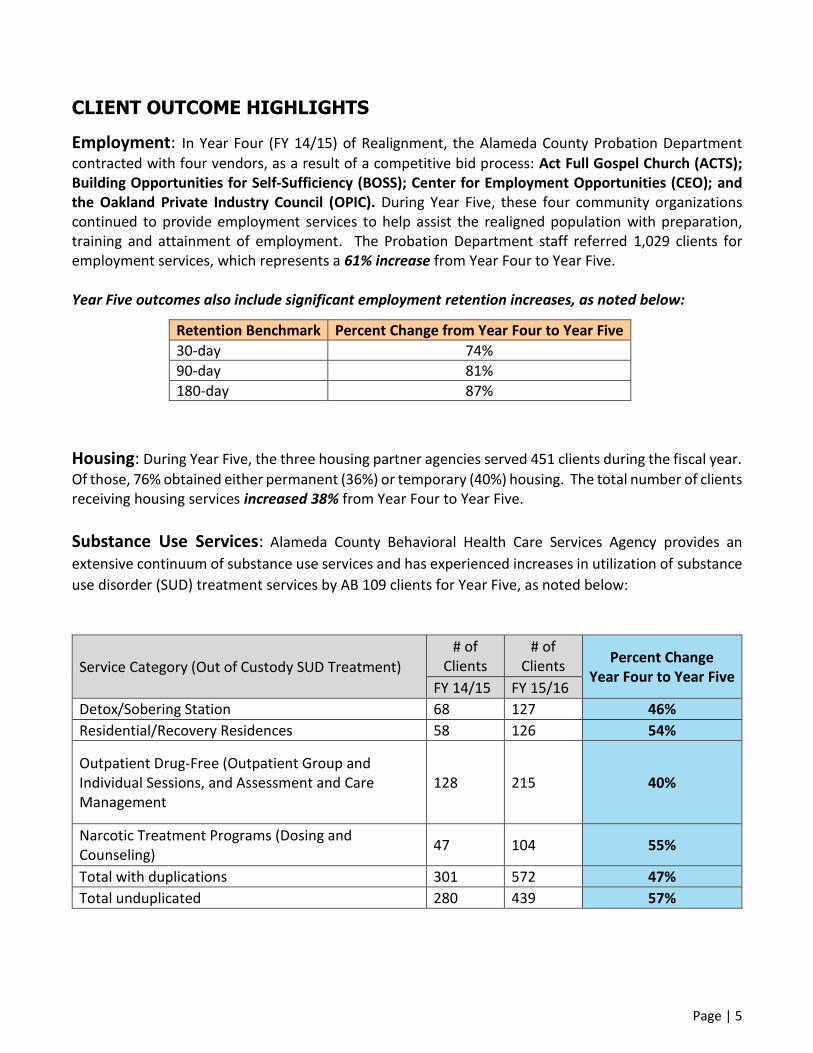
Employment: In Year Four (FY 14/15) of Realignment, the Alameda County Probation Department
contracted with four vendors, as a result of a competitive bid process: Act Full Gospel Church (ACTS); Building Opportunities for Self-Sufficiency (BOSS); Center for Employment Opportunities (CEO); and the Oakland Private Industry Council (OPIC). During Year Five, these four community organizations continued to provide employment services to help assist the realigned population with preparation, training and attainment of employment. The Probation Department staff referred 1,029 clients for employment services, which represents a 61% increase from Year Four to Year Five. Year Five outcomes also include significant employment retention increases, as noted below:
Retention Benchmark Percent Change from Year Four to Year Five
30-day 74%
90-day 81%
180-day 87%
Housing: During Year Five, the three housing partner agencies served 451 clients during the fiscal year.
Of those, 76% obtained either permanent (36%) or temporary (40%) housing. The total number of clients receiving housing services increased 38% from Year Four to Year Five.
Substance Use Services: Alameda County Behavioral Health Care Services Agency provides an
extensive continuum of substance use services and has experienced increases in utilization of substance
use disorder (SUD) treatment services by AB 109 clients for Year Five, as noted below:
Service Category (Out of Custody SUD Treatment)
# of Clients
# of Clients
Percent Change Year Four to Year Five
FY 14/15 FY 15/16
Detox/Sobering Station 68 127 46%
Residential/Recovery Residences 58 126 54%
Outpatient Drug-Free (Outpatient Group and Individual Sessions, and Assessment and Care Management
128 215 40%
Narcotic Treatment Programs (Dosing and Counseling)
47 104 55%
Total with duplications 301 572 47%
Total unduplicated 280 439 57%
Page | 6
SUMMARY: Alameda County has experienced significant increases in the number of clients receiving services, as a result of the expansion of services beyond Post-Release Community Supervision clients to individuals being supervised as a result of a realigned offense. Although this expansion in the definition of realignment was approved by the Alameda County Community Corrections Partnership Executive Committee in 2013, it has taken time to develop systems of referral/tracking and increased knowledge to Probation’s deputies regarding the services. As a result, overall, there has been an increase in utilization and improved client outcomes during Year Five of Realignment.
Page | 7
II. GUIDING PRINCIPLES
Like Alameda County's Initial Implementation Plan (2011), Year Two Plan (FY 12/13), Year Three Status Update (FY 13/14), Year Four Status Update (FY 2014/15), this Year Five Public Safety Realignment Plan Status Update (FY 15/16) continues the Community Corrections Partnership Executive Committee's (CCPEC's) commitment to individual accountability and the use of research-indicated efforts to reduce recidivism for adult offenders realigned from State to county responsibility. Alameda County's Realignment efforts continue to focus on reducing recidivism "through reinvestment in community-based corrections programs and utilization of evidence-based strategies that increase public safety while holding offenders accountable."2 This Year Five Status Update continues the CCPEC's emphasis on interagency and public/private collaboration to provide effective in-custody and community-based services, treatments, and programs to realigned individuals (Post-Release Community Supervision; Individuals charged and/or resolved with an 1170(h)-eligible offense; and Parole Violators) and to address programming needs at every stage of
the correctional continuum in custody, prior to release from custody, during community supervision, and after termination of supervsion. Additionally, the CCPEC will continue to assess any new needs or policy changes in order to update and improve coordination, collaboration and systems integration. This Year Five Status Update also continues the CCPEC's commitment to gathering data and carefully
assessing its processes, programs, and outcomes related to Realignment. From the outset, it has been
the CCPEC's intention to "track the services and outcomes of each individual in the realigned population
and to assess the efficacy of the programs those individuals are referred to." Additionally, the CCPEC is
committed to tracking and assessing "the recidivism and re-incarceration rates of new populations to be
The major goals adopted for Year Two continued to guide Year Three, Year Four and Year Five of
Realignment. Approved by the Board of Supervisors in November 2012, these goals are:
Protect the public through transparent and accountable administration and service: Activities
include staffing and programming in both custody and community settings designed to promote
and sustain offender rehabilitation.
Ensure effective and supportive transitions from detention to the community: Activities include
emphasizing and enhancing transition services designed to provide a continuum between in-
custody services and support, and their community-based counterparts.
Develop innovative and therapeutic support for clients focused on health, housing, and improving access to family sustaining employment: Activities include, among others, maximizing partnerships with community-based service providers to deliver behavioral health care, housing, employment services, and other transition services known to help reduce offender recidivism.
Continued collaboration between and among community members, community-based service providers and public agency personnel is essential to accomplishing these goals. The Year Five Status Update seeks to sustain and enhance the vitality of ongoing collaboration and communication.
Page | 9
III. POPULATION
The total number of clients served by the Probation Department in Year Five (FY 15/16) of Realignment
was 12,096. Recent years have seen a decline in the number of individuals on felony probation in
Alameda County, which is driven by a decline in the number of individuals on formal probation grants,
specifically. One contributing factor present for Year Five of Realignment is related to the
implementation of Proposition 47. In addition to Proposition 47, terminations from probation
supervision, along with the Probation Department’s quality control efforts have also contributed to the
decrease of clients active to probation.
Aside from the decrease in the formal probation population, the number of PRCS clients and Mandatory
Supervision clients has only fluctuated marginally over the last few years, with a steady decline over the
last three years with the Mandatory Supervision population. The vast majority of Alameda County’s
Mandatory Supervision clients are clients that transfer in from other counties across the state, meaning
that differences in these numbers are highly contingent upon changing circumstances outside of
Alameda County.
In March 2013, the Alameda County Community Corrections Partnership Executive Committee expanded the State’s definition of realignment to include all of the following:
Defining the County’s Realigned Population: Individuals charged and/or sentenced to an AB 109 eligible offense
Individuals sentenced under PC 1170(h) o Jail only o Mandatory Supervision
PRCS population
Parole violations Since the enactment of Realignment, and based upon the categories above, Alameda County has served 25,334 unique clients. Below is a breakdown by population type: Alameda County's Realigned Population from October 1, 2011 - June 30, 2016, by population type:
Individuals sentenced under PC 1170(h) - straight sentence - 451
Individuals sentenced under PC 1170(h) - split sentence - 33
PRCS population - 2,362
Individuals with Parole Violations - 360
Individuals charged or sentenced with an AB 109 eligible offense, who were on Felony
Probation at any point during time period - 10,777
Individuals charged or sentenced with an AB 109 eligible offense, who were not on Felony
Probation at any point during time period - 11, 351
Page | 10
Note: Probation’s data includes: PRCS, Mandatory Supervision, and Formal clients.
Since the enactment of Realignment, there has been a steady decline in the average daily population for
both the Probation Department and the Sherriff’s Office. As a result of the passage of Proposition 47
and the AB 109 Public Safety Realignment Act, the clients being supervised by the Probation Department
have more serious offenses and the Probation Department has not met the caseload standards set forth
by the American Probation and Parole Association (APPA) which recommends 50:1 for moderate/low-
risk and 20:1 for high-risk and specialized caseloads, such as mental health or sex offenders. The
15,71014,334
12,57611,012
1,055
1,075
1,101
1,053
57
62
41
31
FY 12-13 FY 13-14 FY 14-15 FY 15-16
# o
f C
lien
ts
Clients Active on Probation
Formal Probation PRCS Mandatory Supervision
13,185 13,718 13,056 12,65711,059
9,500
3,600 3,347 3,418
3,232
2,820
2,495
2011 2012 2013 2014 2015 2016
Average Daily Poplulationby Calendar Year (2011 - 2016)
Sheriff's Department
Probation
Page | 11
Probation Department’s caseloads average 80-100 clients on general supervision, which are all high-risk,
and an average of 50 clients for specialized caseloads. Moderate-risk clients are assigned to the Kiosk,
which is an electronic reporting system, and averages approximately 250:1. There are approximately
4,900 low-risk clients assigned to a services-as needed (banked) caseload. All of the caseloads within the
Probation Department far exceed APPA standards. Research indicates that meeting caseload standards
will help reduce recidivism (re-arrests and technical violations).
Legend Local = Commitments to Santa Rita Jail (SRJ); the numbers also include probation violations Federal = Inmates under the jurisdiction of the United States Marshall housed at SRJ County CDC = Parole Violation enforced by State of California 1170(h) = Individuals charged and/or resolved with a non-violent/non-serious felony offense as defined by Penal
Code 1170(h) PRCS Violators = Local State Prisoners that violated probation at the County level
The average daily population for all inmates at Santa Rita Jail, with the exception of Federal, have seen a decline over the last three years, which may also be attributed to the passage of Proposition 47.
2011
2012
2013
2014
2015
2016
2011 2012 2013 2014 2015 2016
Local 2,469 2,398 2,599 2,468 2,101 1,803
Federal 58 60 47 50 37 54
County CDC 43 261 129 68 52 14
1170(h) 10 128 139 119 102 83
PRCS Violations - 37 70 91 88 86
SANTA RITA JAIL AVERAGE DAILY POPULATIONBY CALENDAR YEAR 2011 - 2016
Page | 12
IV. RECIDIVISM
Reducing recidivism continues to be at the forefront of the work within the County. The resources and
efforts dedicated to rehabilitate and reintegrate the realigned population serve to provide a life free
from crime, both for them and for their communities. In this regard, recidivism rates indicate how
successfully this population is served.
Since the enactment of AB 109, recidivism has been defined in different ways by different stakeholders
and throughout the State of California. As a result, the Board of State and Community Corrections (BSCC),
in an effort to standardize the measurement of recidivism, released a State-wide definition of recidivism
in November 2014, as follows:
BSCC Adult Recidivism Definition: “Recidivism is defined as conviction of a new felony or misdemeanor committed within three years of release from custody or committed within three years of placement on supervision for a previous criminal conviction.” As a result, this report will provide Alameda County’s recidivism rate, based upon the BSCC definition, which will serve as the County’s baseline for future reports. Because Alameda County tends to file violations of probation, in lieu of new convictions at a greater rate than many other counties, it is noteworthy for Alameda County to also track recidivism based upon violations of probation, as well as new convictions for clients supervised or previously supervised by the Probation Department. Important to note, however, that these figures are only for violations and new offenses within Alameda County; therefore, the recidivism rates presented below may be under-representations of the level of criminal activity that probation clients engage in.
TYPE RATE New Convictions 20.3% Petitions filed by DA 20.4% Petitions filed by Probation 5.9%
Although it is important to understand what happens to our clients while on probation, it is perhaps even more important to understand the lasting effects on probation clients. Thus, it becomes important to also view recidivism in the light of how many prior probation clients have received a new conviction after their probation supervision ended. By looking at the number of clients whose supervision ended in one fiscal year, and seeing whether they were registered for a new conviction in the subsequent fiscal year, provides insight into how well the Probation Department and its partners prepares its clients for longer-term success after probation.
Page | 13
The chart below reflects the totals for all three types of probation clients – PRCS, Mandatory Supervision
and Formal Probation. There was a slight increase in the number of clients whose cases closed during
FY 14/15 and then experienced a new conviction during FY 15/16.
Note: Alameda County convictions, only
The graph below depicts the details of the above graph by classification type. While there was a sharp decline of new convictions registered for PRCS clients a year after their supervision was terminated for fiscal years 12/13, 13/14 and 14/15, there has been a slight increase for both PRCS and formal probation clients who had their cases terminated during FY 14/15 and experienced a new conviction during FY 15/16.
Note: Based on Alameda County data
Another benchmark of recidivism denotes clients who are actively being supervised by Probation and
experience a new conviction during the course of their supervision. The following two graphs depict the
6.2%6.80% 6.80%
8.1%
FY 12-13 FY 13-14 FY 14-15 FY 15-16
% O
F C
LIEN
TS W
HO
SE P
RO
BA
TIO
N
TER
MIN
ATE
D IN
TH
E P
REV
IOU
S FY
WIT
H A
N
EW C
ON
VIC
TIO
N
New Conviction One Year After Termination of Probation
15.6%
12.5%
9.7%10.9%
6.1% 6.3% 6.4%7.7%
25.0%
15.4%
21.2%
8.7%
FY 12-13 FY 13-14 FY 14-15 FY 15-16
New Conviction One Year After Termination of Probation
PRCS
Formal Probation
Mandatory Supervision
Page | 14
totals for all three types of supervision and the breakdown for each type of supervision. For PRCS and
Mandatory Supervision clients, there has been some fluctuation in convictions over the past four years
of Realignment, while new convictions for clients on Formal Probation remain largely unchanged.
Note: Alameda County convictions, only
Overall, Year Five of Realignment saw slight increases in recidivism rates for various categories of supervision. Further research is needed, including researching the impact of Proposition 47 terminations that may have resulted in unintended consequences as clients are terminated with fewer resources and no supervision. Additionally, the County has contracted with an outside evaluator and moving forward, will be able to utilize the information garnered through the evaluation to better determine the services and needs of our clients, along with next steps and the priority of initiatives that will positively impact service delivery and client outcomes.
2.6%
3.1% 3.0%
4.0%
FY 12-13 FY 13-14 FY 14-15 FY 15-16
Active Clients with a New Conviction in Fiscal Year
12.0%
13.6%
11.8%
14.0%
1.9% 2.2% 2.2%3.0%
8.8%
17.7%
14.6%
12.1%
FY 12-13 FY 13-14 FY 14-15 FY 15-16
Active Clients with a New Conviction in Fiscal Year
PRCS
Formal Probation
Mandatory Supervision
Page | 15
V. HOUSING
This report represents the data on the Realignment Housing Program (RHP) during the period between July 1, 2015 and June 30, 2016. This program is a collaborative partnership between three community-based organizations:
Abode Services – serving South/East/Mid County
Berkeley Food and Housing Program (BFHP) – serving Berkeley, Albany, and Emeryville
East Oakland Community Program (EOCP) – serving Oakland and Piedmont Programmatic oversight is provided by the Alameda County Housing and Community Development (HCD) Department. The program began as a pilot in 2012. HCD coordinates with the Alameda County Probation Department, the Santa Rita Jail Transition Center and the Transition Day Reporting Center, which provide referrals for clients in need of services. Referral to the program may occur while the individual is still incarcerated or after they have been released. Eligible participants are people being supervised by Probation under realignment who are homeless or have other housing needs.
The range of services provided includes, though is not limited to:
Short-term rental subsidies Housing Case management
Housing search and placement support Landlord relationship building
Support with reducing barrier to obtaining
housing
Assistance with re-unification with support
system and family members
Coordination with employment support
providers
Transportation assistance
Emergency Shelter
Page | 16
How Much Did We Do? Table 1: Realignment Housing Program Referrals and Enrollments: Years One through Four
Year One Aug 2012 – June
2013*
Year Two July 2013 – June
2014*
Year Three July 2014 – June
2015
Year Four July 2015 – June
2016
Total Served
97 144 280 451
Source: Realignment Housing Program Spreadsheets *Note that during Years 1 and 2 only people being supervised under Post Release Community Supervision were eligible for the program.
Probation Officers, working with those currently incarcerated and those newly released, provide referrals to the three agency partners within the RHP. The program enrolled 77% of the number enrolled during the year. As of June 30, 2016, the Program had a total of 126 RHP referrals in Outreach who had not yet been enrolled.
Table 2: Shelter Bed Usage; Monthly Summary
Source: Shelter Occupancy Report – HMIS
Emergency shelter services were provided for RHP participants who indicated a temporary shelter need.
The three housing agencies also provided motel vouchers for emergency temporary housing when
shelter space was not available or appropriate. The chart above only reflects shelter stays. In total, 61
unique participants utilized the agencies’ shelter services for a total of 3,548 bed nights. The table above
represents the total bed nights used each month (in brown), and the total unique project participants
accessing shelter services that month (in green). For comparison and analysis of trends, during Year
Three, agencies supported 21 participants with shelter services for 2,747 total bed nights. Clients
accessing shelter services were also consecutively enrolled in the RHP and received services and support
towards obtaining permanent housing.
20 19 22 20 18 20 25 22 16 9 5 7
318
462
391
334293
355
414392
273
145
78 93
0
50
100
150
200
250
300
350
400
450
500
People Total bed nights used
Page | 17
How Much Did We Do?
Table 3: Geographic Distribution of Realignment Housing Program Participants
Source: RHP Summary Report – InHOUSE
Note: BFWC provided services during Year One only. Following Year One, Mid-County was combined with South and East
County regions and served by Abode.
As in prior years, many of those served returned to the City of Oakland. RHP housing agencies report
that, due to continued rising housing costs, some clients receive support in re-locating to areas of the
County with lower rental costs. Alternatively, some clients temporarily return to their pre-incarceration
housing situation and receive services to obtain more stable housing in another part of the County.
16%
18%
60%
6%
Year One
38%
59%
3%
Year Two
31%
64%
5%
Year Three
50%48%
2%
Year Four
South County (Abode Services) Mid-County (BFWC)*
City of Oakland Berkeley & Emeryville (BFHP)
Page | 18
How Much Did We Do?
Table 4: Number of Realignment Housing Program Participants served by Agency: FY 15/16
Source: RHP Summary Report – InHOUSE
There were a total of 451 clients served by the three agencies during Year Four. To be counted as ‘served’
reflects that the client was enrolled in the program and received services after they were referred. Abode
Services served a total of 223 unique clients. East Oakland Community Program (EOCP) served a total of
218 clients. Berkeley Food & Housing Program (BFHP) served a total of 10 clients. In total, there were 11
clients who were served by multiple agencies during this period. Clients were referred to and served by
the organization whose geographical region they were returning to upon exit from incarceration.
During the course of the year, Men of Valor Academy
supported and enrolled 56 clients. This compares to a
reflection of 20 clients served in the previous year.
55 6987
113135
155174 165 182 187 199
1456
66
1
73
22
2 13
3140
147148
154
163161
167 174166 162 138
79
0
50
100
150
200
250
300
350
400
Abode BFHP EOCP
5656
Men Of Valor Academy
Enrollment Referrals
100%
Page | 19
How Well Did We Do?
Table 5: Realignment Housing Program - Referral and Enrollment Time Comparison
The table represents the average, median, and range (in days) between referral and enrollment into the
RHP program. The median days between referral to enrollment remains consistent with Year Three (3
days) and may be attributable to strengthened communications between the client, Probation Officer,
and housing agency. Housing Agencies attempt to contact people who are referred several times a week
for at least two months and coordinate with Probation Officers when they are unable to reach potential
participants.
Table 6: Realignment Housing Program Participants -
Disabling Conditions Reported at Entry: Year Four
Source: Annual Performance Report (APR) – HMIS
Table six represents the 281 total people (all
adults in households served) who stated that
they had a disability upon entering the RHP.
A total of 143 people (51%) reported having
only one type of disability. A total of 22% (63
people) stated having three conditions prior
to entry into the program. Agencies state
that in some cases disabling conditions have
provided additional barriers which resulted
in longer time periods in the program prior to
obtaining housing and employment. For
comparison, the representation of
disabilities (and percentage of distribution)
was in alignment to Year Three data (despite
a larger subset of clients).
Length of Stay in Project
In comparison to the previous year, as the number of clients increased, as did the overall length of service within the project. The Men of Valor Academy supports clients who may be served for up to a year, as reflected in the 9 clients who received services an average length of 220 days. Three clients received MOVA support for more than 300 consecutive days.
Year Four 8/14 – 6/15
Year Five 7/15 – 6/16
1 – 29 Days 6 19
30 – 59 Days 5 7
60 – 89 Days 5 10
90 – 119 Days 4 11
>120 Days 0 9
62.03%, 116
12.83%, 24
26.74%, 50
27.27%, 51
8.02%, 15
0.86%, 1
28.88%, 54
0.00% 10.00% 20.00% 30.00% 40.00% 50.00%
Mental Illness
Alcohol Abuse
Drug Abuse
Chronic HealthCondition
DevelopmentalDisability
HIV/AIDS
Physical Disability
Page | 20
Is Anyone Better Off?
Table 7: Realignment Housing Program - Exits by Destination Types: Year Four
Source: Annual Performance Report (APR) – HMIS
Table seven represents the exit destinations of the 251 clients who exited the Program during the year.
The RHP goal of supporting participants to obtain permanent housing is demonstrated with 36% of exits
to permanent housing types, which include rental (with or without subsidy), Permanent Supportive
Housing (long-term rental subsidies, which include support services), and living with family or friends
(permanent tenure). This compares with a Year Three permanent housing exit rate of 42% and Year Two
rate of 56%. While this shows a lower percentage comparison, it is important to remember that Year
Three reflects 60 exited participants and Year Two reflects 27 exits. Housing agencies state that those
exiting to “Other” represent clients who did not tend to be engaged in services and includes those who
enrolled in the Program and later went AWOL from the Program and often from Probation as well.
Destination Definitions The RHP uses the following destination types and categories for those exiting the program:
Permanent Destinations: Rental by Client, no subsidy Rental by Client, with subsidy Permanent Supportive Housing Living with Family/Friends, Permanent Tenure
Temporary Destinations: Emergency Shelter Transitional Housing Staying with Family/Friends, Temporary
Tenure Place not Meant for Human Habitation Hotel or Motel, Paid by Client
Other Destinations (Jail or Prison): Deceased Other Don’t Know/Refused or Information Missing
Temporary40%
Permanent36%
Institution/Hospital2%
Jail14%
Other8%
Page | 21
Is Anyone Better Off?
Table 8: Average Length of Time in Program (days)
by Housing Outcome: Year Four
Source: Annual Performance Report (APR) – HMIS
During Year Four of the RHP, clients exiting to permanent housing were served by the program for an average of 231 days. Those exiting to Jail represented as 92 day median stay (reduction for 166 day average in Year Three). In general, those exiting the program to temporary housing did so due to their eligibility for the program ending with their release from Probation supervision. Often these clients continued to be served under other programs provided by the RHP agencies. Longer support periods provided clients with a stronger foundation for securing positive, long-term housing. Support included assistance with referrals to employment agencies, credit repair, re-issuing of identification and driver’s license, along with the direct housing search and financial supports.
Table 9: Exited from Program, Who Did/Did-Not Re- enter Homeless Programs: Year Four
Year One 8/12-6/13
Year Two 7/13-6/14
Year Three 7/14-6/15
Year Four 7/15-6/16
Exited to Permanent Housing 91
Returned to Homelessness 90 Days
4
Returned to Homelessness 180 Days
3
Returned to Homelessness 12 months
10
Number who did not return 84 Source: Return to Homelessness Report – HMIS
This is a newly included data table, referencing the number of RHP participants who exit to a permanent housing situation and re-enter the Homeless System of Care. Of 91 clients who exited to permanent housing during FY 15/16, four re-entered the homelessness system to receive Outreach, and shelter services (within 90 days of exit). Three clients who re-entered the homelessness system within 180 days of exit received Shelter support and Drop-In Center support. There are 10 clients who had left during FY 14/15 and who re-entered a homeless program during FY 15/16 to receive the following range of services: Shelter, Substance Abuse Treatment, Rapid Re-housing, and Transitional Housing.
Permhousing
Institutional
JailTemp
housingOther
Exit Type 231 130 92 232 180
People 91 4 36 101 19
231
130
92
232
180
0
50
100
150
200
250
Day
s in
Pro
gram
(Ave
rage
)
Page | 22
BUDGET SUMMARY
HOUSING ALLOCATIONS AND EXPENDITURES FY 15/16 ALLOCATION EXPENDITURE CDA (Abode/East Oakland Community Project/Berkeley Food and Housing)
$1,660,000* $1,241,423
Men of Valor
$100,000** $99,725
*Per MOU **Approved in FY 14/15
Page | 23
VI. EMPLOYMENT
At the beginning of Year Four of Realignment, the Alameda County Probation Department contracted
with four community organizations to help assist the realigned population with preparation, training and
attainment of employment. The four vendors selected through the competitive bidding process were:
ACTS Full Gospel Church (ACTS); Building Opportunities for Self Sufficiency (BOSS); Center for
Employment Opportunities (CEO); and the Oakland Private Industry Council (PIC). Services with these
four vendors were extended to Year Five of Realignment. Combined, these partners cover a range of
different employment-related services across the entire County, and play a critical role in helping clients
transition from the criminal justice system to a self-sustaining life free of crime.
A partial list of employment services provided by the contracted vendors include:
Employability Assessments Job Readiness Training Transitional Work Programs Subsidized/Unsubsidized Employment Job Retention Services
Page | 24
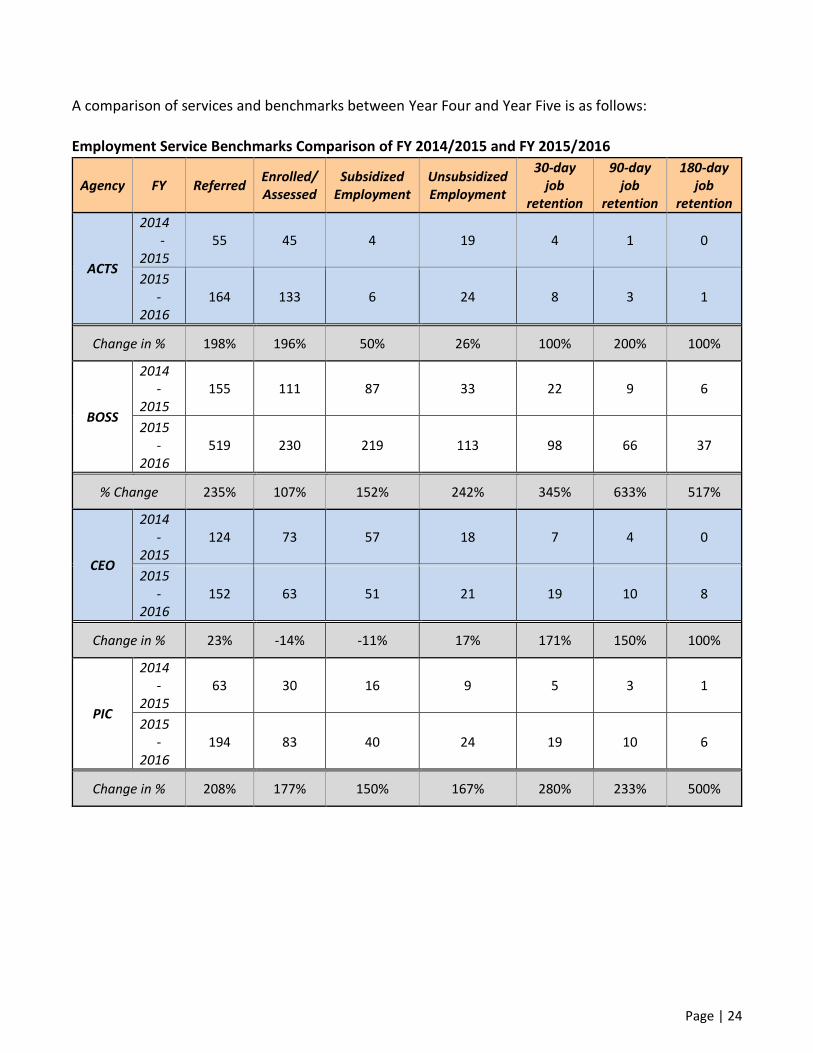
A comparison of services and benchmarks between Year Four and Year Five is as follows:
Employment Service Benchmarks Comparison of FY 2014/2015 and FY 2015/2016
Agency FY Referred Enrolled/ Assessed
Subsidized Employment
Unsubsidized Employment
30-day job
retention
90-day job
retention
180-day job
retention
ACTS
2014 -
2015 55 45 4 19 4 1 0
2015 -
2016 164 133 6 24 8 3 1
Change in % 198% 196% 50% 26% 100% 200% 100%
BOSS
2014 -
2015 155 111 87 33 22 9 6
2015 -
2016 519 230 219 113 98 66 37
% Change 235% 107% 152% 242% 345% 633% 517%
CEO
2014 -
2015 124 73 57 18 7 4 0
2015 -
2016 152 63 51 21 19 10 8
Change in % 23% -14% -11% 17% 171% 150% 100%
PIC
2014 -
2015 63 30 16 9 5 3 1
2015 -
2016 194 83 40 24 19 10 6
Change in % 208% 177% 150% 167% 280% 233% 500%
Page | 25
TOTALS - All Four Vendors
*Referred Enrolled/ Assessed
Subsidized Employment
Unsubsidized Employment
30-day job retention
90-day job retention
180-day job retention
Totals FY
14/15 397 259 164 79 38 17 7
Totals FY
15/16 1029 509 316 182 144 89 52
Change in % 159% 97% 93% 130% 279% 424% 643%
Improvement in referral mechanisms and increased understanding and knowledge of employment vendors’ services resulted in a significant (159%) increase in the number of clients referred for employment services. Overall, there was an increase in utilization at every stage throughout the continuum of employment services!
BUDGET SUMMARY
EMPLOYMENT VENDORS Allocations/Expenditures FY 14/15 and 15/16*
NAME ALLOCATION EXPENDITURE
Acts Full Gospel Church $ 505,367.51 $ 505,367.51
Building Opportunities for Self Sufficiency $2,133,878.50 $2,133,878.50
Center for Employment Opportunities $ 342,500.00 $ 322,401.00
Oakland Private Industry Council $ 656,537.50 $ 656,537.50
TOTALS $3,638,283.51 $3,618,184.51
*Contracts effective 1/28/14
Page | 26
VII. PROBATION SERVICES
The Alameda County Probation Department Adult Services Division provides a wide range of services
and supports to its clients, partnering agencies, and to the community, at large.
The primary responsibilities for Deputy Probation Officers in the Adult Division include:
Rehabilitation and treatment opportunities for clients
Resources to victims of crimes
Effective, consistent enforcement of court orders
Accurate and timely services to the Courts The Adult Division provides the following services: Pre-Sentence Investigation Reports to the Court
Administering a Standardized Risk Assessment to determine the level of supervision
Administering the State-authorized Risk Assessment Tool for Sex Offenders
Staffing the Courts with Court Officers
Write and submit pre-sentence investigation report to the court that recommends clients’ disposition.
Supervision services, includes:
Post Release Community Supervision (PRCS) – Realignment of clients from the State and County level
Mandatory Supervision - Penal Code 1170(h)(5) – Realignment of clients from the State and County level
Formal Probationers - Clients on felony probation
Oversight of Domestic Violence Batterers’ Treatment
Specialized Supervision of Sex Offenders
Supervision of Cases Transferred In/Out of the County (Jurisdictional Transfers)
Interstate Compact (Out-of-State transfers)
Task Force Operations – Collaboration between Probation Department and law enforcement agencies
The Adult Services Division provides the following discretionary programs and services
Adult Probation Orientation – Orientation provided to all clients placed on kiosk or banked caseloads
Mentor Diversion – Pre-plea diversion program
Crossroads Mentor Program – Wrap-around services for low-risk clients
Court Officer services to cover the following court rooms: Parolee Re-entry, PRCS, Revocation and Veterans Court
Family Justice Center – A Deputy Probation Officer is assigned to assist with domestic violence client issues
Kiosk Self Reporting – A computerized self-reporting system for moderate-risk clients
Re-entry Deputy (located at Santa Rita Jail) – To connect clients to pre-release services
Page | 27
HIV/AIDS Classes—HIV Education and Prevention Project of Alameda County presents a monthly class at the Probation Department
Narcotics Anonymous–Held at 400 Broadway, M-F, 12pm
Realignment/ReEntry The Chief Probation Officer serves as the Chair of the Community Corrections Partnership Executive Committee (CCPEC). The Probation Department, working with the CCPEC, has developed a Realignment Strategic Plan, and took the lead in developing the board-adopted Alameda County Adult Re-Entry Strategic Plan. Partnerships and Collaborations
The Alameda County Probation Department serves as an integral member of the community and has,
on many occasions, taken the lead in developing collaborations and partnerships within the community
and between county departments.
Deputy Probation Officers Michele Keller and Angela Reed convened a co-hosted meeting with staff from Behavioral Health Care Services (BHCS) to discuss the access and referral of needed services for our clients with mental health and substance use disorders. This historic event brought together Adult Probation staff, BHCS staff and community providers that resulted in recommendations, action items and information-sharing that was helpful to all attendees. The event, held on Wednesday, May 25, 2016, was a lively and solutions-focused discussion with approximately 40 individuals in attendance. It was also a great networking opportunity for all attendees. As a result of this event, all Adult Probation staff received a “Probation Cheat Sheet,” a quick reference guide to BHCS services.
Annually, Deputy Probation Officers volunteer to assist with community events, such as Civic Pride’s 2016 Knowledge is Power Youth Leadership Conference. This yearly conference allows students, their parents, educators, and organizations to come together to help develop a roadmap for the youth to continue on into their professional lives. DPO Michael Toy and DPO Justin Eaglin were invited as guest speakers on a comprehensive panel to encourage youth and their parents in areas such as education and careers in law enforcement. Additionally, youth received information regarding internships, employment, and college information.
BUDGET SUMMARY
Alameda County Probation Department FY 15/16: Expenditures
Salaries & Employee Benefits $3,792,386
Other Operating Services $ 80,336
Total $3,872,722
Staff who support realignment efforts are as follows:
Staff FTE Deputy Probation Officer III 12 Deputy Probation Officer I 2 Management Analyst 1.6 Reentry Coordinator 1 Unit Supervisors 3 Specialist Clerk I 2 Division Director 1 Clerical Assistant TAP 1
23.6
Page | 29
GRANT-MAKING: COMMUNITY CAPACITY FUND/DIRECT SERVICES GRANTS
During Year Five, the Probation Department was charged with developing procurement instruments and
contracts for realignment-funded service providers in Alameda County. This became a major function
as the Probation Department had to increase its infrastructure and re-prioritize its staffing to meet this
new demand.
In August 2015, the Alameda County Probation Department formed a cross-system design team comprised of content experts in program design, organization development, Alameda County procurement protocol, and grant making to design the grant programming for AB 109 funds administered by the Alameda County Probation Department. This team functions as the internal workgroup and is comprised of representatives from the former Fund Development Office, the General Services Agency, and executive and line staff in the Probation Department. Together, over a year long process, our workgroup has lead the design and procurement strategy for seven new AB 109 grant programs. These programs, as envisioned by a diverse community of providers, advocates, and consumers have sought to direct the investment of AB 109 funds to build the capacity of community service providers, and to achieve measurable impact for Alameda County’s realigned population. Consistent with the direction of the Alameda County Board of Supervisors and the Alameda County Community Corrections Partnership, the Probation Department’s design team efforts seek to protect and leverage the Department’s historical and current investment in community partnerships that foster improved outcomes for our clients.
The Design Team (DT) began its work by conducting an extensive review of county specific planning documents, scanning regional Bay Area county AB 109 strategies, undertaking a broad literature review of evidence-based correctional practice, while seeking input and lessons learned from local community partners and vendors who have worked closely with the Department over the years. This research laid the foundation for the design of a two-pronged grant-making approach in which service providers regardless of their size, budget and capacity, could participate in improving their ability to deliver services capable of demonstrating measurable improvement in outcomes for the reentry population. The Probation Department’s two AB 109 grant funding categories are called Direct Service Grants (DSG) and the Community Capacity Fund (CCF).
Between August 2015 and June 2016, the Probation Department, in concert with the Design Team,
achieved the following:
Probation Department – Procurement/Contracting Highlights:
In August 2015, established a “Design Team”
During Year Five, Released:
Four (4) Requests for Proposals (RFPs); Two (2) Requests for Applications (RFA) for the two rounds of the CCF Planning Grants; and; One (1) RFA to hire two CCF Technical Assistance Providers
Developed scopes of services for the seven (7) categories of funding, noted below:
Community Capacity Fund $ 3.0 Million
Case Management $ 1.0 Million
Education $ 1.0 Million
Employment $ 5.3 Million*
For Us By Us $ 1.0 Million
Pre-Trial/Early Intervention Court $ 1.7 Million
*Includes initial allocation of $3 million for FY 15/16 and additional allocations to cover increases in
services.
COMMUNITY CAPACITY FUND OVERVIEW
On June 27, 2014, the Alameda County Board of Supervisors (BOS) approved the development of a Community Capacity Fund (CCF). The CCF was designed to support organizations in developing an effective, culturally responsive, well-coordinated system of services that promotes evidence-based practices with and for those impacted by reentry, including individuals, their families and victims, along with critical funding and technical assistance resources to strengthen their capacity. The CCF is specifically intended to foster measurable improvements in organization capacity in one or more of seven areas:
Mission, Vision, Strategy; Organizational Structure; Governance and Leadership; Partnerships, External Relations, Networking; Management Systems; Operational Ability; Fundraising, Revenue Generation, Fiscal Sustainability; and Sector-Specific Knowledge and Best Practices
In order to achieve this goal, the CCF is supported by Technical Assistance vendors that provide
instruction and support to help organizations with the following:
To understand the elements of organizational capacity; To self-assess their capacity needs in a one-day orientation; and To build a detailed Capacity Building Plan
The two Technical Assistance vendors awarded contracts through a competitive bidding process are:
Hatchuel Tabernik & Associates and Jeweld Legacy.
Page | 31
The CCF provides multiple opportunities for organizations to obtain assistance and has two phases – a
Planning Phase and an Implementation Phase. During Year Five, two Requests for Application (RFA) were
released that provided information, tools, and materials for vendors to compete for both Planning and
Implementation Grants.
PHASE I: Planning (3-month grant period)
Eighty-seven (87) grantees participated in an all-day orientation and training session that included a
process to self-assess their current organizational capacity and to identify opportunities for
improvement in a range of areas. Throughout this phase, organizations worked with their assigned CCF
Technical Assistance provider to create a Capacity Building Plan that outlined a comprehensive approach
to strengthening their organization. The applicant's Capacity Building Plan serves as the foundation for
any future Implementation Grant proposal they may submit. In addition to gaining support from the
Technical Assistance provider, grantees received a one-time $5,000 cash grant to offset costs and
support their organization's participation in this planning process.
PHASE II: Implementation Grant
Throughout the Implementation Phase, grantees will implement one or more elements of their Capacity Development Plan.
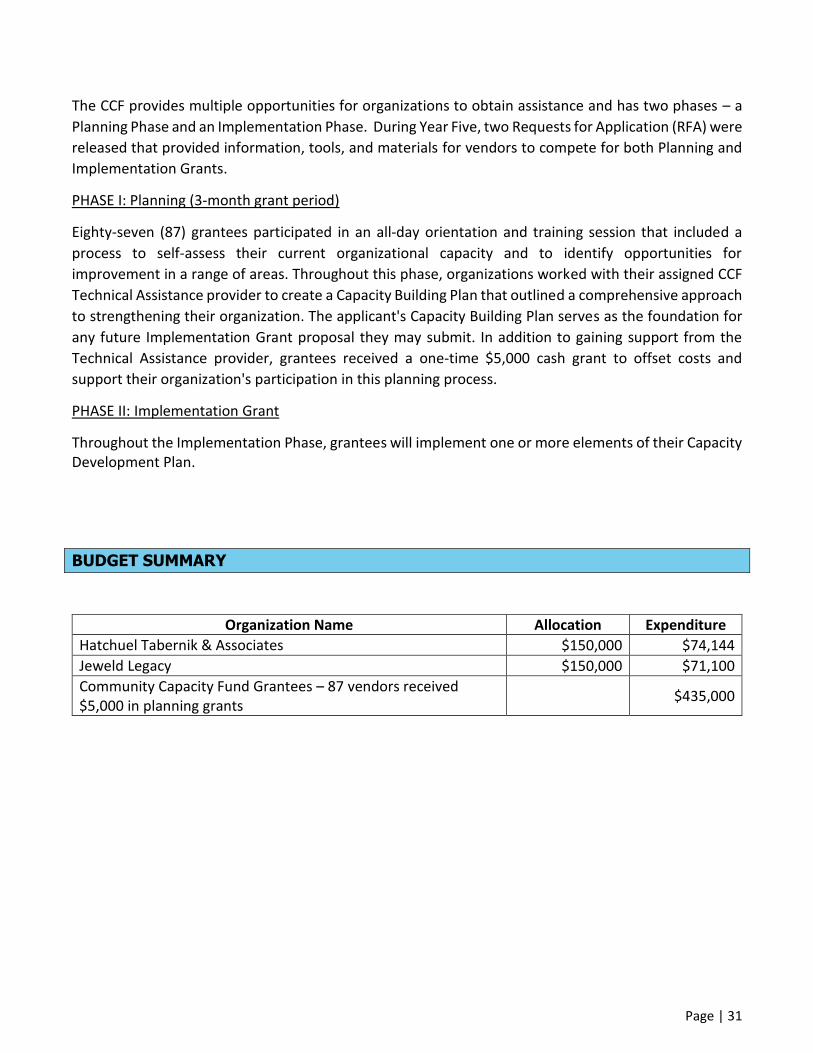
BUDGET SUMMARY
Organization Name Allocation Expenditure
Hatchuel Tabernik & Associates $150,000 $74,144
Jeweld Legacy $150,000 $71,100
Community Capacity Fund Grantees – 87 vendors received $5,000 in planning grants
$435,000
Page | 32
VIII. PUBLIC DEFENDER: CLEAN SLATE PROGRAM AND SOCIAL WORKER INITIATIVES
The premise of AB 109 is that low level felony individuals are better served with the appropriate level of supervision and programming instead of spending time in state prison. In our exceptional legal defense for AB 109 clients, the Public Defender’s Office utilizes social workers to provide expertise to help judges and prosecutors understand our clients’ circumstances and to recommend treatment programs to provide a positive intervention. In addition, the office utilizes elements of the holistic defense model, by addressing the collateral damage from an arrest or a conviction, exemplified by our Clean Slate Practice.
CLEAN SLATE ACTIVITIES
The Clean Slate program provides high quality, high volume representation for clients who are seeking
criminal court-based remedies, including “expungements,” early termination of probation, reduction of
felonies to misdemeanors, Certificates of Rehabilitation, sealing of arrest records, diversion record
sealing, and other remedies. The Public Defender also advises and represents these same clients on civil
and administrative remedies that allow them to overcome barriers to employment, including
employment and consumer rights enforcement. In addition the staff provides holistic, collaborative, and
multimodal services to help formerly incarcerated people access their legal rights and connect with the
services that they need, including obtaining jobs, providing housing support, and other rehabilitation
services – to improve employment opportunities and increase stability and civic participation. The
strategies pursued are not only improving the lives of clients served and their family members – this
work is making communities safer and more secure.
CLEAN SLATE CASES The Public Defender keeps Clean Slate statistics by calendar year, not fiscal year.
Petitions Filed Petitions Granted Success Rate Clients Served
2015 1,353 1,310 97% 692
2016 1,239 1,182 95% 760
REVOCATIONS As a result of the passage of AB 109, Public Defender is required to represent clients at parole
revocation hearings and the AB 109 revocation hearings. Revocations Opened in FY 15/16:
Parole PRCS Total
544 664 1,208
Page | 33
THE SOCIAL WORKER PROGRAM REPORT:
The Alameda County Public Defender Social Workers provide a holistic approach in the defense of clients charged with felonies. The social workers assess and advocate on behalf of clients, humanizing our clients within the context of the criminal justice system. The social workers create re-entry plans, advocating for alternatives to incarceration for many clients suffering from disorders underlying their criminal conduct, including substance abuse and mental health disorders. The social work program’s innovative approach to fostering holistic, client-centered criminal defense work has also included: coordinating the donation of nearly 1,000 books to Santa Rita Jail, offering hundreds of items of children’s clothing to public defender clients and their families, and supporting psychological evaluations for competency to stand for trial. When appropriate, social workers have coordinated with Family Court on child abuse cases and outreached to victims who were interested in our clients receiving treatment and opportunities in lieu of incarceration.
PARTNERS: C.U.R.A., Salvation Army, City Team, New Bridge Foundation, Chrysalis, Cronin House, Options, Second Chance, Magnolia House, Orchid, The Jericho Project, Delancy Street Foundation, Alameda County Probation.
How Much Did We Do? STORY: Social workers serve clients charged with felonies by assessing for substance abuse, mental health, and other issues. When appropriate, social workers provide recommendations for treatment in lieu of incarceration to the District Attorney and to the Court. Additionally, social workers interview clients and prepare social history reports for the District Attorney and the Court, which provide relevant background information. Social workers also support clients as needed in their transition from jail into the community. There is no minimum or maximum caseload. The supervisor assigns new cases based on the number and the severity of the current caseload of each social worker.
68%
32%
Number of Cases Referred to a Social Worker(Total = 232)
Number of CasesClosed (158)
Number of CasesOpen and Active(74)
Page | 34
How Much Did We Do? Story: After the initial client assessment of the 158 closed cases, 79 of those clients received a treatment plan to be submitted to the Courts. The other clients received referrals to mental health services, drug and alcohol services, employment assistance, and other supportive activities.
How Well Did We Do It?
Story: In order to successfully connect clients with needed services and to effectively establish rapport, it is essential for social workers to meet with clients promptly.
80%
15%
5%
Client Outreach Time(Total Number Clients Evaluated = 79)
Clients Contacted within 10 Business Days (63)
Clients Contacted between 11 and 30 Business Days (12)
Clients Not Contacted within 30 Business Days (4)
50%50%
Cases in Which Services Were Rendered(Total Cases Evaluated = 158)
Treatment PlansSubmitted to theCourt (79)
Referred to OtherServices (79)
Page | 35
Is Anyone Better Off?
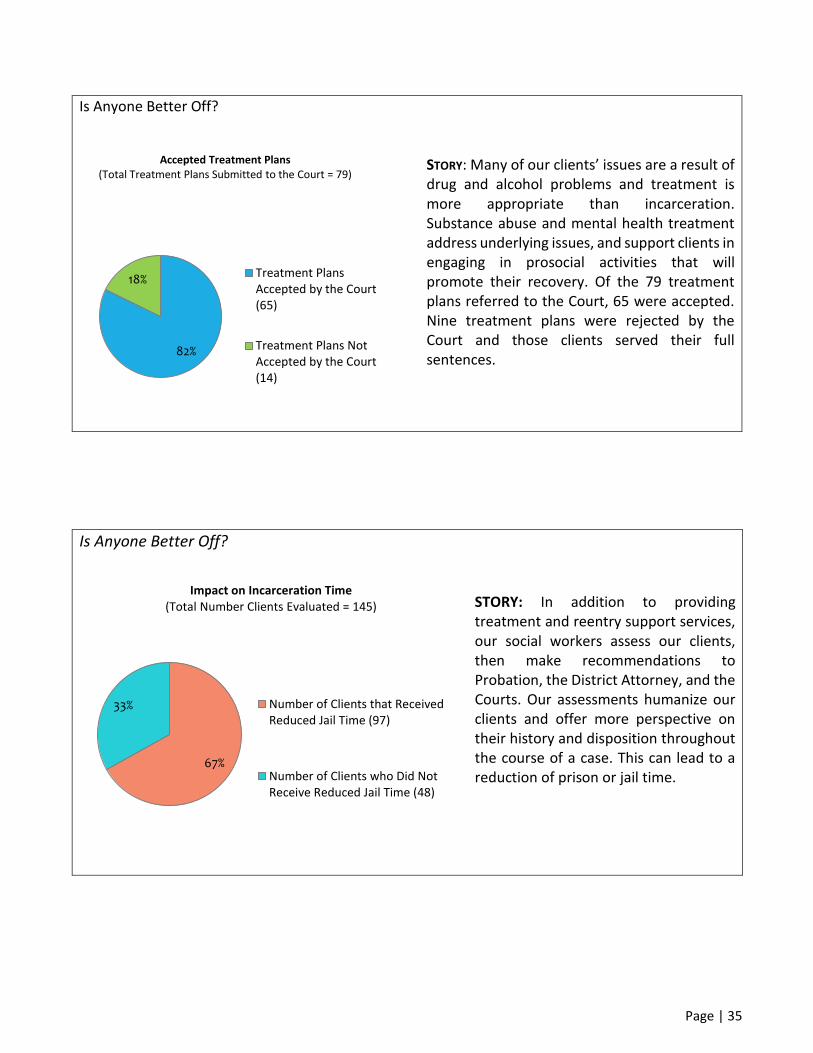
STORY: Many of our clients’ issues are a result of drug and alcohol problems and treatment is more appropriate than incarceration. Substance abuse and mental health treatment address underlying issues, and support clients in engaging in prosocial activities that will promote their recovery. Of the 79 treatment plans referred to the Court, 65 were accepted. Nine treatment plans were rejected by the Court and those clients served their full sentences.
Is Anyone Better Off? STORY: In addition to providing treatment and reentry support services, our social workers assess our clients, then make recommendations to Probation, the District Attorney, and the Courts. Our assessments humanize our clients and offer more perspective on their history and disposition throughout the course of a case. This can lead to a reduction of prison or jail time.
82%
18%
Accepted Treatment Plans(Total Treatment Plans Submitted to the Court = 79)
Treatment PlansAccepted by the Court(65)
Treatment Plans NotAccepted by the Court(14)
67%
33%
Impact on Incarceration Time(Total Number Clients Evaluated = 145)
Number of Clients that ReceivedReduced Jail Time (97)
Number of Clients who Did NotReceive Reduced Jail Time (48)
Page | 36
Is Anyone Better Off?
STORY: Of the 65 people who received a treatment plan in lieu of incarceration, 10 recidivated. Recidivism is being defined as a new conviction or probation violation within six months of the sentencing date for out of custody clients, or six months of the release date for in custody clients.
15%
85%
Number who Reached Stability in Recovery/Recidivism Rate(Total = 65)
Clients Who Recidivated (10)
Successful Reentry Clients (55)
Page | 37
BUDGET SUMMARY
The Public Defender’s Office was allocated $1.3 Million in revenue to support AB 109 activities in three program areas: Clean Slate; Parole and PRCS Revocations; and Social Worker Program.
Allocation Expenditure Balance
$1.3 M 1.8 M ($.5 M)
2015/16 Realignment Summary of Expenditures by Program
Social Workers $389,392.85
Clean Slate $461,225.85
Revocations $826,563.79
Administration $175,030.20
Total $1,852,212.69
POSITIONS ALLOCATED
Social Worker Program
Social Worker I (1)
Social Worker II (3)
Social Worker Supervisor (1)
Clean Slate
Specialist Clerk I (2)
Legal Secretary (1)
Legal Assistant (1)
Assistant Public Defender (1)
Revocations
Deputy Public Defender (5)
Specialist Clerk I (1)
Administration
Assistant Public Defender (2)
Chief Assistant Public Defender (1)
Realignment funding pays for a portion of the above staff
Page | 38
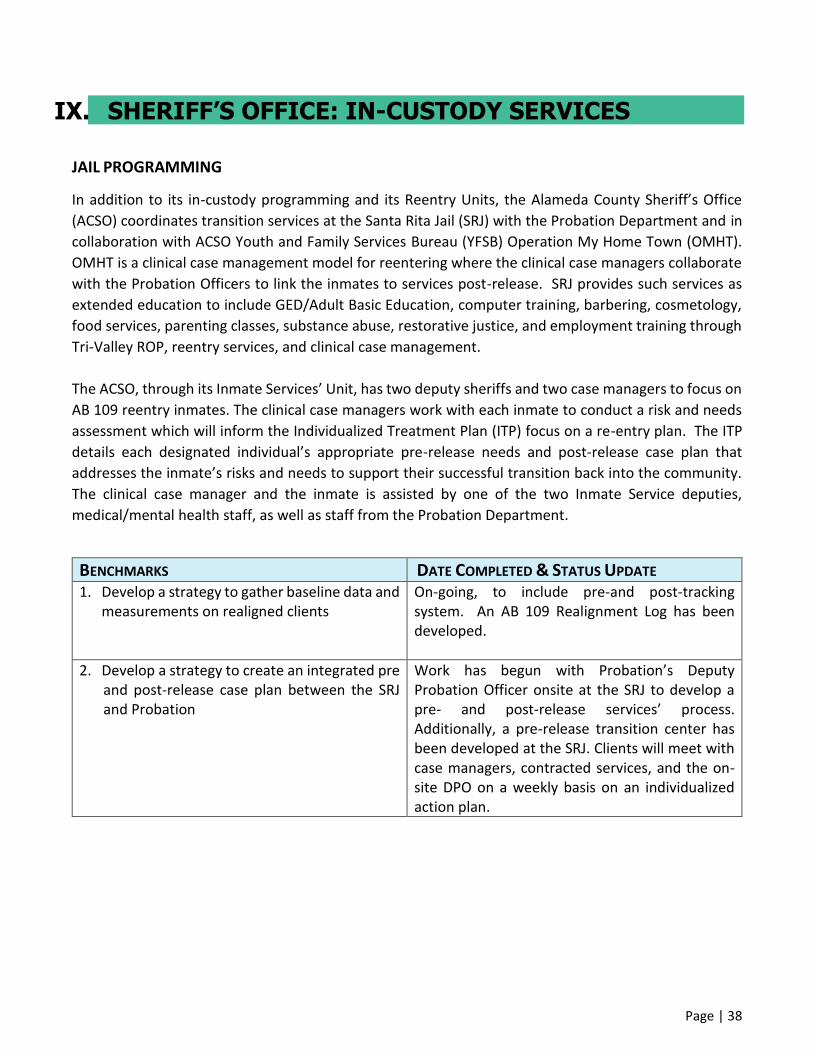
IX. SHERIFF’S OFFICE: IN-CUSTODY SERVICES
JAIL PROGRAMMING
In addition to its in-custody programming and its Reentry Units, the Alameda County Sheriff’s Office
(ACSO) coordinates transition services at the Santa Rita Jail (SRJ) with the Probation Department and in
collaboration with ACSO Youth and Family Services Bureau (YFSB) Operation My Home Town (OMHT).
OMHT is a clinical case management model for reentering where the clinical case managers collaborate
with the Probation Officers to link the inmates to services post-release. SRJ provides such services as
extended education to include GED/Adult Basic Education, computer training, barbering, cosmetology,
food services, parenting classes, substance abuse, restorative justice, and employment training through
Tri-Valley ROP, reentry services, and clinical case management.
The ACSO, through its Inmate Services’ Unit, has two deputy sheriffs and two case managers to focus on
AB 109 reentry inmates. The clinical case managers work with each inmate to conduct a risk and needs
assessment which will inform the Individualized Treatment Plan (ITP) focus on a re-entry plan. The ITP
details each designated individual’s appropriate pre-release needs and post-release case plan that
addresses the inmate’s risks and needs to support their successful transition back into the community.
The clinical case manager and the inmate is assisted by one of the two Inmate Service deputies,
medical/mental health staff, as well as staff from the Probation Department.
BENCHMARKS DATE COMPLETED & STATUS UPDATE 1. Develop a strategy to gather baseline data and
measurements on realigned clients On-going, to include pre-and post-tracking system. An AB 109 Realignment Log has been developed.
2. Develop a strategy to create an integrated pre and post-release case plan between the SRJ and Probation
Work has begun with Probation’s Deputy Probation Officer onsite at the SRJ to develop a pre- and post-release services’ process. Additionally, a pre-release transition center has been developed at the SRJ. Clients will meet with case managers, contracted services, and the on-site DPO on a weekly basis on an individualized action plan.
Page | 39
Outcomes:
PRE-RELEASE # PERCENTAGE Number of AB 109/PRCS clients referred for services
from July 2015 - June 2016 (participated or not) 155
Number of clients who engaged, signed up and
participate in recommended pre-release services
100 - The total number of
realigned clients served
from July 2015 – June 2016
Number/percent of clients with positive contact and
communication with family and other primary
relationships
45 40%
POST-RELEASE # PERCENTAGE
Number of clients who begin the transition process back into the community pre-release
45 - The total number of realigned clients served
post-release.
100% began the transition
process pre-release.
Number/percent of clients who experience a reduction in recidivism defined as no new arrests or violations of probation within 18-months of release
30 67%
Number/percent of sustained placements in secure, safe, stable, and drug-free housing upon release from custody
10 22%
Number/percent of clients who obtain employment and job retention, post-release
7 16%
Number/percent of clients who decrease their abuse of drugs/alcohol, post-release
10 22%
Number/percent of clients who experience family re-unification (where possible) and positive dynamics with family and other primary relationship
16 36%
Number/percent of clients who continue education and vocational opportunities, post-release
3 7%
Page | 40
BUDGET SUMMARY
The Realignment housing costs at Santa Rita Jail for FY 15/16, based on the average daily rate of
$142.96 and average realignment population of 262, was $13,660,829.
The total security costs associated with operation of the Realignment Based Incarceration (RBI) housing
units at Santa Rita Jail was $5,164,917. There has been a significant increase over the last year as a
result of realignment-based programing being expanded into a maximum Housing Unit (HU4).
The Youth and Family Services Bureau (YFSB) provides pre- and post-release case management and a
comprehensive range of re-entry services for individuals at the Santa Rita Jail facility. The cost for
providing these services in FY 15/16 was $700,823.
The Santa Rita Jail facilitates the transition of inmates receiving re-entry services. The designated
staff providing these services include two (2) Deputy Sheriffs and two (2) Youth and Family Services
(YFS) Therapists. These services are handled on-site by case managers with the Deputy Sheriffs
facilitating the movement. The cost for providing these services in FY 15/16 was $628,965.
Housing costs associated with realignment inmates $13,660,829 Staffing/Security costs to cover both RBI housing units $5,164,917 Pre and post release services and case management (YFSB) $700,823 Transition services at SRJ $628,965
Total: $20,155,534
Page | 41
X. DISTRICT ATTORNEY
REALIGNMENT SERVICES
All Realignment funding allocated to the District Attorney (DA) in FY 15/16 was used to offset employee
salary and benefit expenses. AB 109 funding provided partial salary support for 15 DA employees
engaged in realignment activities as follows:
Realignment Coordinators (4) - Each D.A. branch office prosecuting felony offenses has a designated Realignment Coordinator. Forty percent (40%) of the Coordinators’ salary and benefits are charged to AB 109. The Coordinator oversees, and in some cases personally staffs, the various programs and collaborative courts at their branch that support the mission of Realignment, including the following:
Project Clean Slate (Expungement of Criminal Records)
Pacific Educational Services (PES) Diversion Program
Veteran’s Treatment Court
Felony Plea Deputy (2) - These experienced attorneys conduct the plea negotiations on non-vertical
felony cases at the Hayward Hall of Justice and Rene C. Davidson courthouses. These attorneys are
experts in the handling of Realigned felonies, including the available sentencing options for each offense
and possible opportunities for community-based treatment. Forty percent (40%) of the Felony Plea
Deputies’ salary and benefits are charged to AB 109.
Felony Sentencing Deputy (2) - These attorneys staff the two felony sentencing courts at the Hayward
Hall of Justice and Rene C. Davidson courthouses, respectively. Like their counterparts in the felony plea
courts, they are experts in the available sentencing options for every felony offense and possible
opportunities for community-based treatment. These attorneys work closely with the Probation Officer
assigned to the sentencing court serve as a general resource to the Court on felony sentencing issues.
Twenty percent (20%) of the Felony Sentencing Deputies’ salary and benefits are charged to AB 109.
Probation Violation Deputy (2) - These attorneys are responsible for vertically prosecuting alleged felony
probation violations at the Hayward Hall of Justice and Rene C. Davidson courthouses, respectively.
Their responsibility ranges from reviewing the initial police report to determine if the evidence supports
the filing a felony probation violation, to charging the violation, to personally prosecuting the violation
in court and overseeing all aspects of plea negotiations and sentencing. Like their counterparts in the
felony plea courts and felony sentencing courts, they are experts in the available sentencing options for
every felony offense and possible opportunities for community-based treatment. Since the two
attorneys handle these cases vertically, and handle all aspects of these prosecutions from charging to
sentencing, the D.A. charges eighty percent (80%) of their salary and benefits to AB 109.
Page | 42
Probation Violation Support Staff (2) - These are support staff personnel assigned to assist the Probation
Violation Deputies discussed above. They are responsible for processing and filing the court
pleadings/violations based on the deputies’ charging decision, creating probation case files, pulling court
calendars and providing general support for these violations. In FY 15/16, the District Attorney filed over
1,900 felony probation violations in lieu of filing a new criminal complaint against a defendant. Those
are the cases handled by these two support staff employees. Seventy-five (75%) of the Probation
Violation Support Staff salary and benefits are charged to AB 109.
Realignment Policy/Community Resource Deputy (1) - One Senior Deputy District Attorney is assigned
to serve as a community liaison and general resource for Realignment issues. That attorney attends
meetings of the below groups and reports directly to the District Attorney. This Deputy is charged to AB
109 at a rate of twenty percent (20%) salary and benefits.
Community Advisory Board (CAB) Community Corrections Partners Executive Committee (CCPEC) (D.A. O’Malley serves on
Committee) AB 109 Fiscal Procurement (D.A. O’Malley co-chairs) AB 109 Data sub-committee (D.A. O’Malley co-chairs) BSCC Meetings in Sacramento Joint ReEntry One Table Operation My Home Town
Victim Restitution Advocates / Realigned Crimes /Parole (2) - Finally, the District Attorney allocates a
portion of AB 109 funding to employ two full-time Victim Restitution Advocates to provide services for
victims of Realigned crimes and to serve as a general resource for those victims. The table below reflects
the number of services provided by just these two Realignment Advocates since AB 109 went into effect.
One Hundred Percent (100%) of the Victim Restitution Advocates’ salary and benefits are charged to the
D.A.’s AB 109 funding.
Page | 43
AB 118 Funding: In addition to the above employees, the District Attorney charges a portion of the salary
and benefits for two additional employees to funding.
Parole/PRCS Court Deputy (1) and Parole/PRCS Support Staff (1) - One attorney and one support staff
employee are responsible for preparing the revocations and processing of all cases heard in ReEntry
Court - Parole violations and violations of Post-Release Community Supervision (“PRCS”). In FY 15/16
that included 355 alleged parole violations and 308 PRCS petitions. The Deputy District Attorney
assigned to ReEntry Court is charged to AB 118 at rate of eighty percent (80%) salary and benefits. The
support staff person is charged at the rate of seventy-five percent (75%) salary and benefits.
BUDGET SUMMARY
Following is a summary of the staff positions/percentages that support Realignment services provided on behalf of the District Attorney’s Office:
Chargeable %
Branch Realignment Coordinators (4) 40%
Felony Plea Deputy (2) 40%
Felony Sentencing Court Deputy (2) 20%
Probation Violation Deputy (2) 80%
Probation Violation Support Staff (2) 75%
Victim Restitution Advocate / Realigned Crimes / Parole (2) 100%
Realignment Policy / Community Resource Deputy (1) 20%
Total number of DA personnel funded (whole or part) 15
Total AB 109 expenses incurred/actual $1,657,698.47
Total AB 109 expenses claimed $1,250,000.00
Page | 44
XI. BEHAVIORAL HEALTH CARE SERVICES - SUBSTANCE USE DISORDER TREATMENT, MENTAL HEALTH SERVICES AND INNOVATIONS IN REENTRY
SUBSTANCE USE DISORDER (SUD) SUMMARY Alameda County Behavioral Health Care Service's (BHCS) Agency Substance Use Disorder (SUD) System of Care provides an extensive continuum of substance use services. There are multiple levels of care, many of which offer gender- and age-specific programs and/or programs with young children. The system includes sobering Centers, Residential Treatment, Recovery Residences (Sober Living Environments), Intensive Outpatient Treatment, Outpatient Treatment and Narcotic Treatment and Screening.
PARTNERS: Criminal Justice Departments, CenterPoint, and SUD providers (especially Bi-Bett, C.U.R.A.,
New Bridge, Options and Second Chance).
How Much Did We Do?
Total utilization of SUD treatment services by AB 109 clients
SERVICE Category (Out of Custody SUD Treatment) # of Clients FY 14/15
# of Clients FY 15/16
Detox/Sobering Station 68 127
Residential/Recovery Residences 58 126
Outpatient Drug-Free (Outpatient Group and Individual Sessions, and Assessment and Care Management
128 215
Narcotic Treatment Programs (Dosing and Counseling) 47 104
Total with duplications 301 572
Total unduplicated 280 439
Clients find their way into treatment through Probation and Criminal Justice Care Management
(CJCM), and also through self-referral and other means. The total number of AB 109 SUD clients served
has increased by 57%.
Page | 45
How Well Did We Do? Clients who were referred by Probation to Criminal Justice Care Management (CJCM) for assessment and referral, and were then admitted into treatment Referrals from Probation and Assessments and Referral to Treatment FY 14/15 FY 15/16
Referrals from Probation to CJCM 298 376
CJCM assessments with referrals into treatment 233 258
% of clients referred by Probation who showed up for and received assessments by CJCM and referrals into treatment
78% 69%
Clients assessed for and referred into treatment by CJCM who showed up for and were admitted into treatment
182 186
% of clients assessed and referred into treatment by CJCM who were later admitted into treatment
78% 72%
CenterPoint operates our CJCM program and receives referrals directly from Probation. The increase in the number of referrals and the total number of clients admitted into treatment is likely due to Probation using the broader definition for AB 109 to include a larger population of people on probation with realigned offenses. A high percentage of those referred by Probation showed up for assessments by CJCM, and an equally high percentage of those assessed were subsequently admitted into treatment.
Timely beginning of treatment for those clients assessed and referred by CJCM Admitted in 14 days Admitted in 35 days
Timeliness of 186 admissions into SUD treatment
32 were for residential treatment
68 were for outpatient coupled with sober living environment
86 were for outpatient without a sober living environment
150 (81%) 36 (19%)
81% within 14 days is a very strong performance statistic for the general population and even more so
for Criminal Justice. 100% within a short time thereafter is impressive, and is due to concerted and
collaborative efforts between Probation, CenterPoint, and providers. The distribution of referrals is a
departure from previously unmanaged trends when most referrals went to residential treatment.
CenterPoint is using the American Society of Addiction Medicine (ASAM) criteria that match client
situations to the level of care most appropriate for their needs.
Page | 46
How Well Did We Do? Timely engagement in treatment inclusive of all AB 109 clients, irrespective of how they were initially referred
There were 439 AB 109 clients admitted into SUD Treatment
365 clients had at least two treatment sessions or treatment days with 30 days after admission
89% of clients received two or more sessions or treatment days
89% of all clients were well into treatment within 30 days of admission. Providers work in collaboration
with Probation to engage clients quickly. This measure of engagement is used nationally as a validated
predictor of positive outcomes. In comparison with national norms, Alameda County’s results are very
high.
Clients admitted into treatment through referral by CJCM who were later transferred to a
different level of SUD treatment
32 Were Later Transferred to a Different Level Of Treatment Of the 32 transfers:
5 were originally in residential treatment
17 were originally in outpatient coupled with a sober living environment
10 were originally in outpatient without a sober living environment
Transferring clients to different levels of service indicates that providers are using a “client centered”
versus a “program centered” approach. When a client’s situation changes to warrant a different level of
care, they are transferred accordingly. This involves individualized, regular assessment of progress and
needs, using the American Society of Addiction Medicine (ASAM) criteria that are considered best
practice in the field of addiction.
Page | 47
Is Anyone Better Off?
Discharge outcomes of clients admitted into treatment through a CJCM referral
Discharge Status # of Clients
FY 14/15 # of Clients
FY 15/16 % Discharged
FY 14/15 % Discharged
FY 15/16
Discharged after successful progress 45 54 31% 34%
Transferred to another level of care 24 32 17% 20%
Discharged without significant progress 65 64 45% 40%
Discharged due to re-incarceration 10 10 7% 6%
TOTAL 145 160 100% 100%
This is a complex and challenging population. There is slight improvement from the previous year but
still room for further improvement. This year we will explore other evidence-based practice trainings
for providers to enhance their effectiveness. We will also continue to meet with providers and Probation
staff to improve collaboration around care coordination.
Page | 48
MENTAL HEALTH SUMMARY Alameda County Behavior Health Care Services mission is to maximize the recovery, resilience and
wellness of all eligible Alameda County residents who are developing or experiencing serious mental
health, alcohol or drug concerns.
PARTNERS: Probation, Sheriff’s Office, John George Pavilion, Highland hospital, Telecare, BACS, Bonita
House, Social Services, Pathways to Wellness, etc.
How Much Did We Do?
Number of AB 109 clients from Sheriff’s and Probation’s AB 109 lists and any additional persons not on either of the two lists who were identified as AB 109 and referred by Probation to ACCESS.
Method: Number of individuals from the Probation/Sheriff AB 109 list who were served by ACCESS
during the fiscal year, and were given a referral source of “AB 109/Adult Probation” by ACCESS in the
contact tracking database.
97
80
FY 14-15 FY 15-16
AB 109 Clients referred to ACCESS
Page | 49
How Well Did We Do?
Number of AB 109 clients screened and referred for case/care management while in custody.
*Case/Care Management (CCM) **Includes non AB 109 clients admitted to Case/Care Management (CCM) program
Method: Individuals from the Probation/Sheriff AB 109 list who were served in CJ Mental Health program and were opened to the Case and Care Management Program while they had an open episode in CJ Mental Health program. Also provided, is the total number of clients with episodes in Case and Care Management Program during the fiscal year – regardless of custody or AB 109 status at Case and Care Management Program admission date.
Number of AB 109 clients provided with mental health treatment while in custody.
Method: Individuals from the Probation/Sheriff AB 109 list who received services by a CJ Mental Health program during each fiscal year.
773
769
FY 14-15 FY 15-16
Number of AB 109 Clients Provided with Mental Health Treatment while in Custody
227
59
Total Clients Admitted to CCM**
Clients Admitted to CCM* While in Custody
Fiscal Year 15/16
Page | 50
How Well Did We Do?
Number of AB 109 clients provided with mental health treatment while out of custody in total and by treatment modality.
*Excludes crisis stabilization, hospital, and CJ Mental Health services
Method: (5) Unduplicated number of individuals from AB 109 Probation/Sheriff list served in any non-CJ Mental Health program, and in any non- CJ Mental Health treatment program during the fiscal year. Hospital and Crisis Stabilization services are not included as treatment programs
Number and percent of clients referred to ACCESS who were admitted into treatment.
Fiscal Year Clients Admitted Into
Treatment % Admitted to Treatment
After ACCESS Contact Total AB 109 Clients Connected
to ACCESS
2014 - 2015 71 24% 297
2015 - 2016 55 24% 233
Method: Of individuals from Probation/Sheriff AB 109 list who had an ACCESS service during the fiscal year, how many were opened to a treatment program after the ACCESS service(s) (# and %). Treatment services must have begun during the fiscal year or within three months of the end of the fiscal year, in order to count as post Access admissions into treatment. Hospital, Crisis Stabilization, and CJ Mental Health services are not included as treatment.
Of the AB 109 clients who began receiving services from the Case and Care Management Program while in custody, the number and percent who had a mental health treatment session within 30 days of release.
Fiscal Year Case/Care Management
Clients Released Clients Served Within 30
days* % Served within 30
Days
2015 – 2016 52 13 25% *Served at outpatient provider (Not included: case/care management, hospital, CJMH, or crisis stabilization services)
203
415
187
394
Out of Custody MH Treatment Clients*
Any Out of Custody MH Service Clients
FY 15-16 FY 14-15
Page | 51
Is Anyone Better Off? Of the AB 109 clients who were admitted into Psychiatric Emergency Service (PES), the number and percent who did not have a readmission into the service within 30-days.
Fiscal Year PES Clients Re-Admission Clients No Re-Admission
Clients % without Admission
within 30-days
2014 – 2015 316 112 204 65%
2015 – 2016 298 96 202 68%
Method: of the individuals from AB 109 Probation/Sheriff list who were served in psychiatric emergency service during the fiscal year, the number and percentage who did not have a re-admission into psychiatric emergency service within 30-days of a discharge from psychiatric emergency service.
Number of clients receiving inpatient acute care and number of total hospital/admin days. Fiscal Year Clients Days
2014 – 2015 74 742
2015 – 2016 73 639
Method: Number of individuals from AB 109 Probation/Sheriff list who were served in hospital and number of hospital service days during the fiscal year for those clients. This data includes hospital stays, only and not psychiatric emergency room.
Number of clients receiving inpatient subacute care and number of total hospital/admin days.
Fiscal Year Subacute
Clients Subacute
Days Subacute Clients served
at Hospital Subacute Client Days at
Hospital
2014 – 2015 18 727 9 180
2015 – 2016 7 551 2 63
Method: Number of individuals from AB 109 Probation/Sheriff list who were served in subacute during the fiscal year and number of subacute and hospital service days during the fiscal year for those clients.
Number and percent of clients who are in outpatient therapy*.
Fiscal Year Clients Visits
2014 – 2015 103 2,152
2015 – 2016 117 2,406 *Served in outpatient therapy (FSP, Service Team, or Level 3) during the fiscal year
Page | 52
INNOVATIONS IN REENTRY
Innovations In Reentry (IIR) is a pilot grant program designed to spur innovative ideas to address the
needs of the adult reentry population. Managed by Alameda County Behavioral Health Care Services (AC
BHCS), IIR awards support community-based projects that contribute to reducing adult recidivism in
Alameda County.
In the FY 15/16, IIR received $1 Million through AB 109, which AC BHCS matched with $1 million from Mental Health Services Act funding. During this period, the IIR program allocated two rounds of funding: The Round One Continuation (June 1 to November 30, 2016) grants provided seven of the Round One grantees with six months of additional funds to develop toolkits, models, and curricula based on or guided by their original projects implemented during 2013 to 2015. The awards include the following:
Grantee Program/Service Funding
Asian Prisoner Support Committee Culturally competent curriculum for Asian/Pacific Islander reentry population
$10,000
Centerforce Culturally competent training curriculum for reentry case managers
$49,931
Lawyers' Committee for Civil Rights & National Employment Law Project
Model reentry hiring policies for county agencies $116,144
Resource Development Associates Technical assistance for grantees $56,175
The Bridging Group Technical assistance for grantees $58,410
The Gamble Institute Probation referral service model $20,000
The Mentoring Center Culturally responsive curriculum for reentry leadership development
$25,500
University of California San Francisco
Sustainability model for provision of reentry peer services
$45,023
Youth Uprising Video tool to support engagement of transition age youth in reentry services
$55,562
In addition, Round One Continuation provided the grantees with technical assistance through The Bridging Group and Resource Development Associates. The total amount of funding allocated in Round One Continuation was $436,745.
Page | 53
The Round Two (July 1 to December 31, 2016 or 2017) grants funded individual and collaborative projects in three categories designed to support systemic reentry objectives:
1. Stakeholder Participation (6-month grant period) – Develop effective and implementable
models or practices to ensure the “voice of stakeholders” is included in significant decisions
impacting the design and effectiveness of programs serving reentry or formerly incarcerated
individuals in the community.
2. ReEntry Workforce Development for Peer Services (18-month grant period) – Develop effective
and adoptable plans for incorporating formerly incarcerated individuals into the workforce of
agencies and programs providing services to the reentry population.
3. Medi-Cal Billing Readiness (6-month grant period) – Develop and field test a standardized and effective assessment of organizations’ capacity and readiness to claim and retain funding through BHCS specialty mental health services in order to broaden the diversity of service providers.
The awards include the following:
GRANTEE PROGRAM/SERVICE FUNDING Stakeholder Engagement (6-Months) Roots Community Health Center, Timelist and Centerforce
Building stakeholder capacity to impact program and policy decisions at community/board level
$154,497
The Reset Foundation Building stakeholder capacity to impact program and policy decisions at organizational level
$25,000
ReEntry Workforce Development For Peer Services (18-Months) Asian Prisoner Support Committee & Building Opportunities for Self Sufficiency
Training peer specialists to provide case management services with cross-racial dialogue and partnership
$200,000
E C Reems Community Services & Conscious Voices
Training peer specialists to provide therapeutic services, focusing on women
$200,000
Genesis Worship Center & Tri-Cities Community Development
Training peer specialists to provide case management services starting pre-jail release
$200,000
Oakland California Youth Outreach
Training peer specialists to provide case management services with trauma-informed care
$99,000
Medi-Cal Billing Readiness Assessment Tool (6-Months) California Institute for Behavioral Health Solutions & Roots Community Health Center
Expands number and diversity of agencies qualified to bill for specialty mental health Medi-Cal through AC Behavioral Health Care Services
$150,000
The total amount of funding allocated in Round Two was $1,028,497.
Grand Total 50,009 8,912,574 3,550,640 5,361,934 2,316,928 3,045,007
949 Unduplicated No. of Clients -MH
439 Unduplicated No. of Clients -SUD
1,219 Unduplicated No. of Clients -BHCS
FY 2015-2016 (July 1, 2015-June 30, 2016)
Category # 1 -Treatment Services and Infrastructure
Page | 55
XII. TRANSITION/DAY REPORTING CENTER (TDRC)
The Transition Day Reporting Center (TDRC) is a reentry program that provides comprehensive, coordinated support services for moderate to high risk Alameda County adult probationers. The TDRC aligns law enforcement and support services into an approach that is focused on accountability, responsibility, and opportunities for long-term change. The Center is operated by Leaders in Community Alternatives, Inc. (LCA). The core components of the TDRC program are evidence-based Cognitive Behavior Therapy (CBT) workshops that are proven to change criminal thinking by addressing targeted criminogenic risks and needs that are identified through validated assessment tools. Research has clearly revealed that targeting individualized risks and needs is essential for helping formerly incarcerated individuals to permanently exit the criminal justice system. The TDRC utilizes the Level of Service – Case Management Index (LS/CMI) assessment tool for male participants and the Service Planning Instrument for Women (SPIN-W) for female participants. Evidence-based curricula are delivered through group sessions, small group discussions, and one-on-one meetings with Case Managers. For each group session, clients are responsible for completing Interactive Journals® that provide individualized, structured programming for each participant.
Partnerships and Collaborations LCA provides and coordinates essential supportive services to aid in each client’s engagement with the TDRC program and their successful reentry into the community. These services include but are not limited to: barrier removal assistance; transportation to and from groups and community appointments; and referrals to other community-based organizations (CBOs) to address additional client needs, such as housing and employment. LCA subcontracts with CBOs to provide other supportive services, including: educational services provided by the San Francisco 5 Keys Charter School; parenting classes provided by Community Works West; cultural coaching and peer mentoring provided by Village Connect Inc.; and nutritious meals provided by St Vincent de Paul. During this last fiscal year, the TDRC worked with additional entities and expanded onsite partners to include the Department of Social Services, which provides Medi-Cal and Cal Fresh enrollments, employment partners such as BOSS, CEO, and OPIC, and housing partners such as Abode Housing Services and East Oakland Community Programs that provide rapid housing assessments and placements. Additional partners include: Roots Community
Page | 56
Clinic, which offers health navigation, primary care, and referral services; Because Black is Still Beautiful, which offers educational services to women; the Gamble Institute’s Street Scholars Mentorship program, which offers post-secondary education enrollment assistance and mentorship; and Defy Ventures, which offers employment apprenticeship training and opportunities for clients interested in launching their own small businesses.
Services and Program Design: Engagement for high-risk justice involved clients is a major challenge throughout the country. TDRC has deployed several strategies to address this issue. For example, for clients exiting Santa Rita Jail (SRJ), TDRC staff coordinate a transition plan with the client and their Probation Officer thirty days prior to their discharge date. We provide transportation from Santa Rita Jail to the TDRC, and/or housing on the day the client discharges. Clients who are actively participating in the core CBT components of the program receive Clipper cards to assist them in getting from home to the program. Clients with additional transportation barriers are provided with transportation by TDRC staff, including transportation to and from the Probation office in Hayward. TDRC staff make outreach calls to clients to remind them about scheduled groups and to ask if any transportation assistance is needed. Over the past year, staff made hundreds of calls in an effort to engage clients. Participating clients are also welcomed to bring pro-social family members and friends to the TDRC, both to utilize the space and to participate in special events, such as monthly client birthday and holiday celebrations. Another engagement strategy is a comprehensive incentive program where clients earn points by completing activities and then redeem points for items such as gift cards, phones, duffle bags, computer tablets, and other desirable items. Free meals and a clothing closet access are also available to clients who actively participate in the program. Collaborative team work between the supervising Probation Officers and TDRC Case Managers is an essential component of the TDRC model. Frequent case conferences and client engagement reports enable coordination between Probation and the TDRC staff, and formal monthly case conferences happen between each Probation Unit and the TDRC clinical team. Monthly case conference participants strategize to improve client participation and accountability.
Page | 57
How Much Did We Do?
The TDRC opened on March 23, 2015, at its temporary site located at 400 Broadway on the 2nd Floor. The pathway for clients to enroll into the program is through a referral generated by an Adult Deputy Probation Officer (DPO). During the three months of operations during FY15, Probation prioritized Post Release Community Supervision (PRCS) referrals as the initial group to receive TDRC services. At the beginning of FY16, referral eligibility was expanded to include all probationers with realigned offenses and an assigned DPO. This change resulted in increased referrals received and processed by the TDRC.
81 - 100%
312 - 100%
2015 2016
Number and Percent of Probation Referrals
Page | 58
How Well Did We Do It?
The enrollment rates for FY 15/16 referrals were 79% and 67%, respectively. The figures reported here exclude referrals that were determined as ineligible, based on the eligibility criteria established by Probation’s initial planning and implementation team, which consisted of a mix of DPOs and management staff from LCA and the Alameda County Probation Department. Typically, once a referral is made, TDRC staff make numerous phone calls to reach clients and encourage them to come in for orientation. Referring DPOs are also asked to assist in engaging referred clients who are resistant to participating in the program. Of the referrals that did not result in program enrollment, 45% did not respond to outreach attempts and phone calls, and 12% were re-incarcerated before they could enroll into the program. 21% were individuals who presented needs beyond the scope of the TDRC program. These clients received referrals to alternative community service providers, including substance use and mental health treatment services, to address these needs prior to enrollment with the TDRC. Several clients who could have enrolled but chose not to cite that they were either already engaged with other service providers, fully employed and would not be able to participate, or had other conflicting family/community obligations that would prevent them from engaging in the program. In many such cases (17%), there were discussions between the referring DPO and the program staff, and a determination was made to hold off on enrollment until the individual is able to engage. The remaining 5% were not enrolled due to Probation violations, including absconding and revocations. Recognizing the need to continue to reach those at the greatest risk of recidivism, Probation and LCA staff are actively engaging in collaborative meetings on all levels in order to mitigate the attrition rates and create supportive structures for clients to be successful in the reentry process. It should also be noted that the TDRC has experienced start-up issues that plague every new program, and everyone is working diligently to develop procedures that ensure successful referral and engagement processes.
52 - 79%
196 - 67%66
291
2015 2016
Number and Percent of Eligible Probationers Who Enrolled (Completed Intake)
Eligible Referrals Enrolled
Page | 59
How Well Did We Do It?
A TDRC contract goal is to ensure that 75% of all participating clients are connected to one or more services within 30-days of arrival. The program achieved 90% connection rate for both FY 15/16. Such services include enrollment into CBT workshops, barrier item identification and removal, such as California ID card issuance and Social Services benefit assessments/enrollments, and connecting clients to education and housing providers when needed. The high connection rates can be attributed to the TDRC’s highly responsive and client-centered approaches.
47 - 90%
176 - 90%52
196
2015 2016
Number and Percent Connected to Services within 30 Days of Enrollment (Baseline 75%)
Enrolled and Connected to Service
Page | 60
Is Anyone Better Off?
The three-month operational timeline for FY 15 did not allow for adequate time to see any significant progress on client case plan objectives. FY 16 was the first full year of operation with sufficient time to measure client case plan progress. During the fiscal year, 118 unduplicated clients exited the program after enrollment. Of these, 45 clients had progressed and completed at least 75% of their case plan objectives before exiting. Such objectives included CBT workshop progress, barrier removal activities, and connection to partner services. Additionally, 38 more clients had demonstrated between 50% to 74% progress before exiting. In the initial start-up period and throughout the first year of operation, client attendance was a constant issue faced by the program. As noted above, outreach efforts inviting CBOs to work alongside the TDRC have been very beneficial, although the most behavior change will be realized through completion of CBT classes. Continuing collaboration with supervising DPOs will ensure that the highest risk and need clients participate in the program.
045 - 38%
0
38 - 32%18
118
2015 2016
Number and Percent of Exited Clients who Progressed through their Case Plans (CBT Workshops, Barrier Removal, Partner Service Connections)
75% or more progress 50%-74% progress
Page | 61
Is Anyone Better Off?
The TDRC conducts initial and follow up LS/CMI assessment on all male clients. These assessments are used to determine individual criminogenic risk and need levels at the time of referral and subsequent changes after consistent engagement in the program (6-months and/or program completion). The assessed factors include Criminal History, Education/Employment, Family Relationships, Leisure/Recreational Activities, Companions, Alcohol/Drug Use, Pro-Criminal Attitude, and Antisocial Patterns. The results of these assessments are used to guide the discussions between the client and Case Manager to build the client’s Individual Case Plan. The optimal successful outcome is a reduced LS/CMI score, which reflects a reduced likelihood of client recidivism. As shown in the chart above, the clients who engaged in the program consistently and completed a follow-up assessment showed an average of a 4-point reduction in their criminogenic risk/need levels. This is a significant drop in risk levels since it represents a shift from High to Medium risk.