40
Global Supply of Tuna Report 2009 SEAFISH 1 Yellowfin tuna A global and UK supply chain analysis

Global Supply of Tuna Report 2009 SEAFISH 1
Yellowfin tuna A global and UK supply chain analysis
Yellowfin tunaA global and UK supply chain analysis
Authors:Angus Garrett, Seafish Economics
Adam Brown, Seafish Economics
Industry contributors: Mike Mitchell, Foodvest Group;
Richard Ansell, M & J Seafood;
Lucy Pelham Burn, New England Seafood;
Nigel Edwards, Seachill
March 2009
Global Supply of Tuna Report 2009 SEAFISH 5
Contents
Page
Executive Summary
1. Introduction 4
2. Global overview 8
3. International trade rules 14
4. Yellowfin Tuna - Key markets and supply routes 18
5. Yellowfin Tuna - UK market and supply 30
6. Developments and options 36
6 SEAFISH Global Supply of Tuna Report 2009
Executive SummaryGlobally, the tuna market is worth approximately
US$5.5 billion. In the UK tuna is one of the top five
consumed species by volume. The UK market is
characterised by a range of tuna products including
fresh, frozen and ambient, with materials sourced
from international fisheries.
UK processors currently suffer knowledge gaps in the
tuna market. There is a lack of understanding around:
volume, value and format of imports; the routes of
supply into the UK; and competitive pressures on
sources of supply. Yellowfin tuna is of particular
interest to UK processors as the majority of fresh
tuna consumed in the UK is yellowfin.
Following consultation with industry it was apparent
that research aimed at filling some of the knowledge
gaps relating to tuna would be of value. It was also
apparent that individual companies are unable to
undertake this type of research alone. This research
therefore proposed to characterise: the global tuna
market; the key markets for yellowfin tuna; and the UK
market and supply routes for tuna with an emphasis
on yellowfin tuna. The research also describes the
international trade rules for relating to tuna and
possible development options for the industry.
The research undertaken included primary research in
the form of interviews with key industry stakeholders.
Secondary research involved a review of publications
regarding tuna markets and analysis of official catch,
production and consumption data.
Global OverviewThe total volume of tuna caught globally each year is
now in the region of 4.3 million tonnes. Japan, the EU,
Taiwan, Indonesia, Philippines and Korea are the six
main catching nations. The status of tuna stocks, along
with catching trends indicate that an increase in the
total volume of tuna caught annually is unlikely. Trade
in tuna materials has increased greatly with trade
in frozen materials more than doubling since 1985,
and increased volumes of fresh tuna being traded.
The vast majority of tuna is processed into ambient,
prepared or preserved tuna products, which Thailand
produces in the greatest volumes. Although trade
data on fresh tuna is limited, it is known that these
materials are traded as bullets or as fresh loins. The
key consumption areas for tuna are: Japan where
the greatest volume of fresh tuna is consumed; and
the EU and US which both consume large quantities
of ambient tuna products and increasing volumes of
fresh tuna.
International Trade RulesThe market for tuna products is global and as such is
subject to international trade rules. Trade tariffs and
barriers affect trade flows of tuna as they can affect
the price and availability of tuna in specific regions
or nations. The EU operates a tariff system which
encourages imports of unprocessed raw materials or
materials from specific groups of developing nations.
Meanwhile, these EU tariffs act as a barrier to the
cheaper imports from the major South East Asian tuna
producing nations. Outside the EU there are a number
of bilateral agreements between states that impact on
the global tuna trade.
Yellowfin Tuna Key Markets and Supply RoutesYellowfin tuna is second only to skipjack in terms of
popularity and volume. Found in equatorial waters in
the Atlantic, Indian and Pacific Oceans, yellowfin is
caught by many nations but Japan, Indonesia, Mexico
and the Philippines are responsible for the majority
of the total annual catch. The majority of yellowfin is
caught by purse seine method although large volumes
are also caught by long-line.
The three main customer groups of yellowfin tuna are
Japan, the US and the EU. The Japanese consume
yellowfin predominantly as sashimi. By contrast, the
EU and the US markets consume the majority of their
tuna products in an ambient format. However, in recent
years both the EU and the US have experienced
significant growth in the fresh tuna market. Fresh
yellowfin is the main fresh species in both of these
consumption areas.
Overview of UK Tuna MarketTuna is supplied into the UK as ambient, frozen or
fresh/chilled. Ambient tuna is a high volume, low value

Global Supply of Tuna Report 2009 SEAFISH 7
segment which contrasts with the low volume, high
value fresh tuna segment. Skipjack represents the
largest volume of tuna imported into the UK followed
by yellowfin and albacore. The majority of UK tuna
consumption is of ambient products but in the last
15 years there has been considerable growth in fresh
tuna in the retail and food service sectors.
Fresh or chilled tuna imports into the UK are
predominantly yellowfin loins. The majority of the
volume imported into the UK is through a small
number of processors for sale into multiple retailers.
The majority of the fresh or chilled tuna air-freighted
into the UK is from Indian Ocean countries such as
Sri Lanka and the Maldives. UK processors have high
sourcing standards across a broad set of criteria which
demands that they develop close relationships with
their suppliers. Sustainability is a key concern for UK
processors driven predominantly by retailer demands.
Developments and Possible OptionsOn the basis of the evidence gathered in this research
there appears to be a number of key developments
impacting on UK yellowfin tuna processors.
Sustainability requirements of the UK market may
make the UK a less desirable customer for suppliers.
Volatile supply may impact on processors’ ability to
consistently satisfy demand. The increasing strain
placed on tuna resources may increase competition
for materials and limit the availability of materials for
the UK market. Better utilisation of the resource may
increase the availability of materials for the fresh and
chilled markets. Relaxation of EU trade rules and
the emergence of new bilateral trade agreements
may encourage tuna imports into the EU. Yellowfin
may attract greater attention from non-governmental
organisations, affecting public perception and demand.
Global Supply of Tuna Report 2009 SEAFISH 7
8 SEAFISH Global Supply of Tuna Report 2009
Authors:Angus Garrett, Adam BrownSeafish EconomicsIndustry contributors: Mike Mitchell, Foodvest Group; Richard Ansell, M & J Seafood; Lucy Pelham Burn, New England Seafood; Nigel Edwards; SeachillMarch 2009
1. IntroductionGlobally, the tuna market is worth approximately
US$5.5 Billion.
In the UK, tuna is one of the top five seafood species
consumed by volume. The UK market for tuna is
characterised by a range of product formats; fresh,
frozen and ambient, with material sourced from
international fisheries.
Future growth of the UK market for tuna depends on
understanding customer preferences and the ability to
secure supply within a very competitive global context.
Securing supply could mean sourcing material from a
variety of tuna species from a range of fisheries.
UK seafood processors currently have imperfect
knowledge of the tuna market, and especially the volume,
value and format of imports, the routes of these imports
into the UK and the competitive pressures on sources of
supply. This restricts their view of key trends or events that
might offer opportunities for growth or alternatively pose a
threat to their businesses.
Why yellowfin?Most fresh tuna consumed in the UK is yellowfin tuna,
but global stocks of yellowfin are under pressure and
demand for products fluctuates across the globe.
From our consultations with the industry, we know that
UK processors have a keen interest in understanding the
trends and influences upon global yellowfin supply chains
– but it is almost impossible for individual companies to
undertake this type of research on their own. Trade data
is limited or restricted as commodity codes do not always
differentiate by species. For example, commodity codes
for whole (fresh or frozen) tuna imports differentiate
between types of tuna but commodity codes for fresh
or frozen fillets do not even differentiate between
species. This makes it difficult or impossible to calculate
accurately the volumes and values of different formats of
raw material imported into the UK.
The purpose of this report is to help the industry to fill
the gaps in its knowledge of the yellowfin tuna market
8 SEAFISH Global Supply of Tuna Report 2009

Global Supply of Tuna Report 2009 SEAFISH 9
both worldwide and domestically, and so improve long
term plans and strategic decision-making.
Research aimsThe trade in tuna (and yellowfin tuna in particular) is
broad, complex and involves multiple stakeholders.
Tuna fisheries exist in a range of national and
international waters and the UK must compete for its
supply with other national markets.
This report looks at the risks for UK processors
that arise from factors affecting the supply chain.
For example, the sustainability initiatives of UK
retailers and the illegal, unreported and unregulated
(IUU) fishing prevention initiatives of the
EU generate added compliance responsibilities in
the supply chain which may threaten continuity of
supplies. There are also information gaps in chain
impact, for example energy intensity and CO2
distributions. Again this research can go some way
to filling these and providing industry with a platform
for decision-making.
In creating this report we aimed to:
Characterise the global tuna market •
Characterise the key markets for yellowfin tuna•
Characterise the UK market and supply routes for •
tuna with a focus on yellowfin tuna
Identify the economic and related drivers influencing •
purchasing and supply decisions
Method This report was produced by Seafish in partnership
with the industry. Primary research involved face-to-
face and telephone interviews with UK stakeholders.
Secondary research involved identifying, reviewing
and referencing existing industry data and analysis
(statistics and reports) in order to generate new data
and fresh insights.
UK processors already have significant existing
knowledge of the tuna market, and a great deal
of tuna-related research is either available or underway.
Our aim in this study was to avoid duplication, add
value to processors’ knowledge, and capture and
articulate the views of stakeholders.
The results are presented here using a supply chain
model, as an effective tool for managing complex
subject matter and highlighting market-specific
opportunities and risks.
Limitations Consultation was limited to stakeholders within
the UK seafood industry. Our analysis is therefore
by necessity a UK-centric view of the yellowfin trade.
Our ability to track raw material flows in supply
chains was restricted by a lack of relevant trade
data. Harmonised commodity codes only allow us to
identify trade in either chilled (code 03023) or frozen
(03034) whole fish or ambient products and material
for further processing (1604). Trade in partially-
processed tuna is often incorporated into commodity
codes that refer to a broader category of material -
including other fish species. Commodity codes
for fresh or frozen fillets (including vacuum packed
chilled loins to be processed into steaks) do not
differentiate between species and refer to ‘all species
of fish including tuna’.
This makes it difficult, if not impossible, to
obtain the detail needed to track specific product
formats by species, for example trade in fresh
yellowfin loins.
Future growth of the UK market for tuna depends on understanding customer preferences and the ability to secure supply within a very competitive global context.

10 SEAFISH Global Supply of Tuna Report 2009
2. Global overviewThis section provides an overview of the main tuna supply routes, followed by brief descriptions of catching, trading and processing activities and the main consumption patterns.
Global Supply of Tuna Report 2009 SEAFISH 11
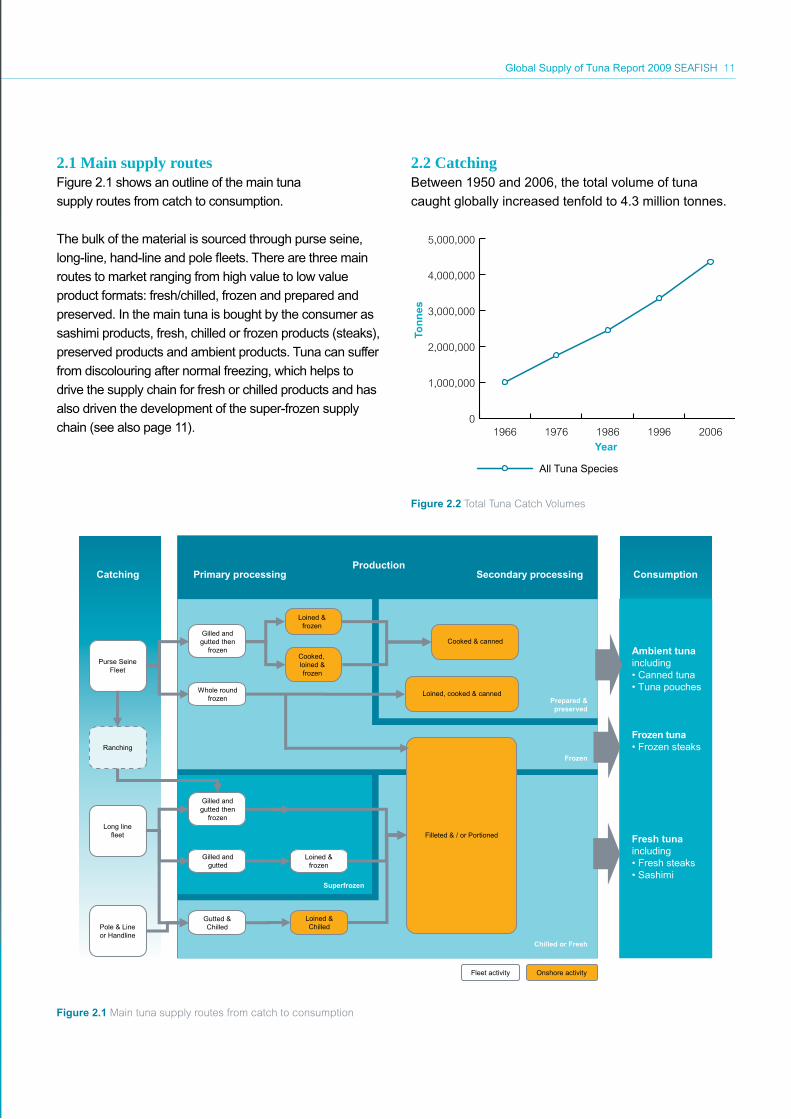
2.1 Main supply routesFigure 2.1 shows an outline of the main tuna
supply routes from catch to consumption.
The bulk of the material is sourced through purse seine,
long-line, hand-line and pole fleets. There are three main
routes to market ranging from high value to low value
product formats: fresh/chilled, frozen and prepared and
preserved. In the main tuna is bought by the consumer as
sashimi products, fresh, chilled or frozen products (steaks),
preserved products and ambient products. Tuna can suffer
from discolouring after normal freezing, which helps to
drive the supply chain for fresh or chilled products and has
also driven the development of the super-frozen supply
chain (see also page 11).
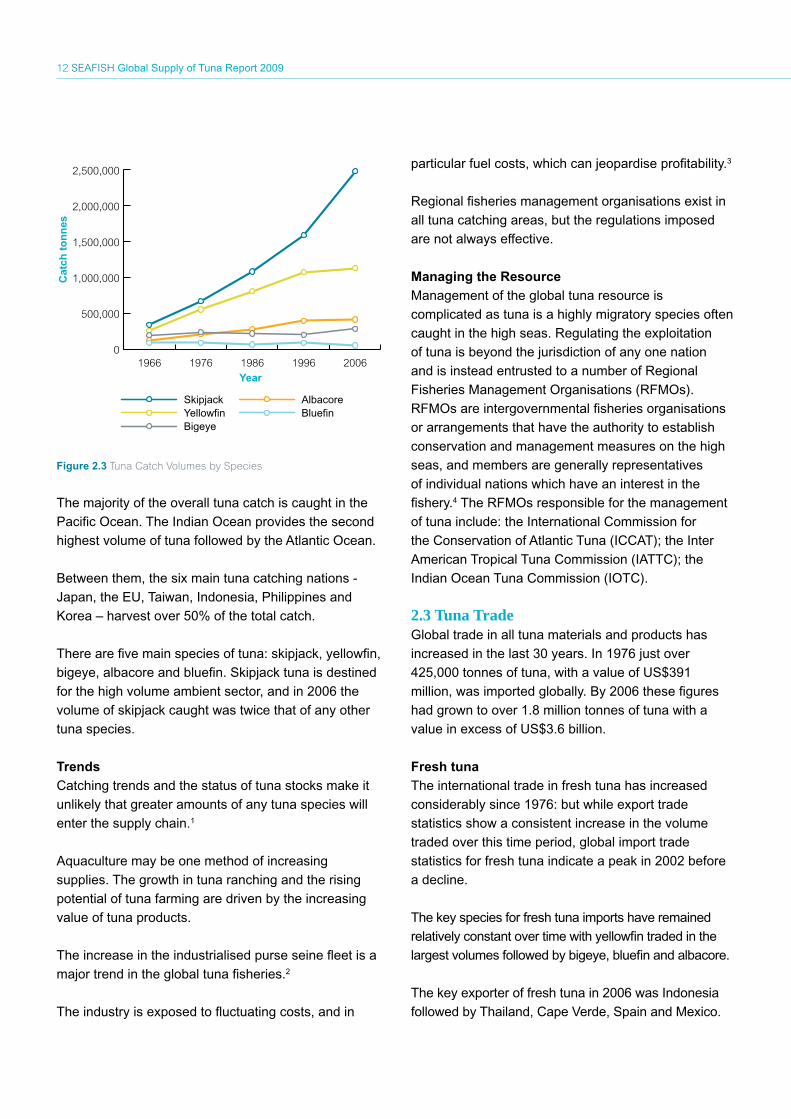
2.2 CatchingBetween 1950 and 2006, the total volume of tuna
caught globally increased tenfold to 4.3 million tonnes.
0
1,000,000
2,000,000
3,000,000
4,000,000
5,000,000
Year
Tuna Capture volumes
Ton
nes
1966 1976 1986 1996 2006
All Tuna Species
Figure 2.2 Total Tuna Catch Volumes
ProductionPrimary processing Secondary processing
Chilled or Fresh
Frozen
Loined, cooked & canned
Cooked & canned
Whole round frozen
Gilled and gutted then
frozen
Loined & frozen
Gilled and gutted then
frozen
Superfrozen
Prepared &preserved
Filleted & / or Portioned
Gutted & Chilled
Long line fleet
Pole & Line or Handline
Gilled and gutted
Loined & frozen
Purse Seine Fleet
Catching Consumption
Cooked, loined &frozen
Loined & Chilled
Fleet activity Onshore activity
Ranching
Ambient tuna including • Canned tuna • Tuna pouches
Frozen tuna • Frozen steaks
Fresh tunaincluding• Fresh steaks• Sashimi
Figure 2.1 Main tuna supply routes from catch to consumption
12 SEAFISH Global Supply of Tuna Report 2009
0
500,000
1,000,000
1,500,000
2,000,000
2,500,000
Year
Global Captured supply of Tuna
Cat
ch t
on
nes
1966 1976 1986 1996 2006
SkipjackYellowfinBigeye
AlbacoreBluefin
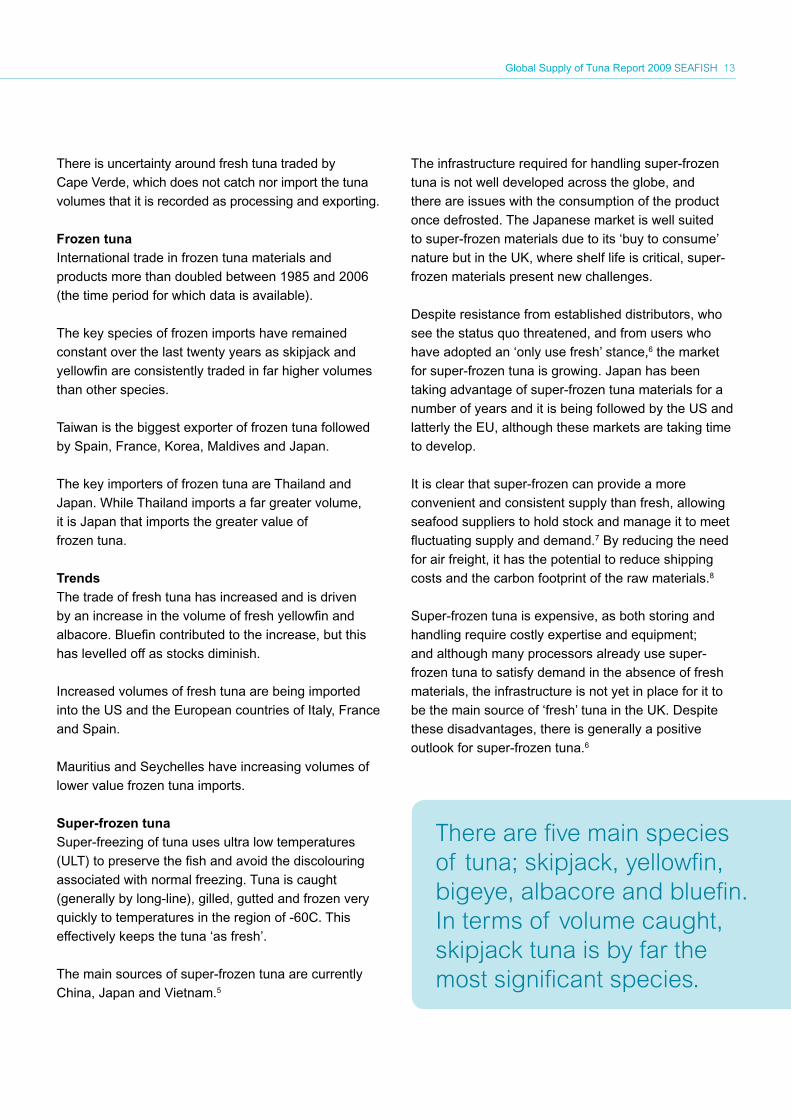
Figure 2.3 Tuna Catch Volumes by Species
The majority of the overall tuna catch is caught in the
Pacific Ocean. The Indian Ocean provides the second
highest volume of tuna followed by the Atlantic Ocean.
Between them, the six main tuna catching nations -
Japan, the EU, Taiwan, Indonesia, Philippines and
Korea – harvest over 50% of the total catch.
There are five main species of tuna: skipjack, yellowfin,
bigeye, albacore and bluefin. Skipjack tuna is destined
for the high volume ambient sector, and in 2006 the
volume of skipjack caught was twice that of any other
tuna species.
TrendsCatching trends and the status of tuna stocks make it
unlikely that greater amounts of any tuna species will
enter the supply chain.1
Aquaculture may be one method of increasing
supplies. The growth in tuna ranching and the rising
potential of tuna farming are driven by the increasing
value of tuna products.
The increase in the industrialised purse seine fleet is a
major trend in the global tuna fisheries.2
The industry is exposed to fluctuating costs, and in
particular fuel costs, which can jeopardise profitability.3
Regional fisheries management organisations exist in
all tuna catching areas, but the regulations imposed
are not always effective.
Managing the ResourceManagement of the global tuna resource is
complicated as tuna is a highly migratory species often
caught in the high seas. Regulating the exploitation
of tuna is beyond the jurisdiction of any one nation
and is instead entrusted to a number of Regional
Fisheries Management Organisations (RFMOs).
RFMOs are intergovernmental fisheries organisations
or arrangements that have the authority to establish
conservation and management measures on the high
seas, and members are generally representatives
of individual nations which have an interest in the
fishery.4 The RFMOs responsible for the management
of tuna include: the International Commission for
the Conservation of Atlantic Tuna (ICCAT); the Inter
American Tropical Tuna Commission (IATTC); the
Indian Ocean Tuna Commission (IOTC).
2.3 Tuna Trade Global trade in all tuna materials and products has
increased in the last 30 years. In 1976 just over
425,000 tonnes of tuna, with a value of US$391
million, was imported globally. By 2006 these figures
had grown to over 1.8 million tonnes of tuna with a
value in excess of US$3.6 billion.
Fresh tunaThe international trade in fresh tuna has increased
considerably since 1976: but while export trade
statistics show a consistent increase in the volume
traded over this time period, global import trade
statistics for fresh tuna indicate a peak in 2002 before
a decline.
The key species for fresh tuna imports have remained
relatively constant over time with yellowfin traded in the
largest volumes followed by bigeye, bluefin and albacore.
The key exporter of fresh tuna in 2006 was Indonesia
followed by Thailand, Cape Verde, Spain and Mexico.
Global Supply of Tuna Report 2009 SEAFISH 13
There is uncertainty around fresh tuna traded by
Cape Verde, which does not catch nor import the tuna
volumes that it is recorded as processing and exporting.
Frozen tunaInternational trade in frozen tuna materials and
products more than doubled between 1985 and 2006
(the time period for which data is available).
The key species of frozen imports have remained
constant over the last twenty years as skipjack and
yellowfin are consistently traded in far higher volumes
than other species.
Taiwan is the biggest exporter of frozen tuna followed
by Spain, France, Korea, Maldives and Japan.
The key importers of frozen tuna are Thailand and
Japan. While Thailand imports a far greater volume,
it is Japan that imports the greater value of
frozen tuna.
TrendsThe trade of fresh tuna has increased and is driven
by an increase in the volume of fresh yellowfin and
albacore. Bluefin contributed to the increase, but this
has levelled off as stocks diminish.
Increased volumes of fresh tuna are being imported
into the US and the European countries of Italy, France
and Spain.
Mauritius and Seychelles have increasing volumes of
lower value frozen tuna imports.
Super-frozen tunaSuper-freezing of tuna uses ultra low temperatures
(ULT) to preserve the fish and avoid the discolouring
associated with normal freezing. Tuna is caught
(generally by long-line), gilled, gutted and frozen very
quickly to temperatures in the region of -60C. This
effectively keeps the tuna ‘as fresh’.
The main sources of super-frozen tuna are currently
China, Japan and Vietnam.5
The infrastructure required for handling super-frozen
tuna is not well developed across the globe, and
there are issues with the consumption of the product
once defrosted. The Japanese market is well suited
to super-frozen materials due to its ‘buy to consume’
nature but in the UK, where shelf life is critical, super-
frozen materials present new challenges.
Despite resistance from established distributors, who
see the status quo threatened, and from users who
have adopted an ‘only use fresh’ stance,6 the market
for super-frozen tuna is growing. Japan has been
taking advantage of super-frozen tuna materials for a
number of years and it is being followed by the US and
latterly the EU, although these markets are taking time
to develop.
It is clear that super-frozen can provide a more
convenient and consistent supply than fresh, allowing
seafood suppliers to hold stock and manage it to meet
fluctuating supply and demand.7 By reducing the need
for air freight, it has the potential to reduce shipping
costs and the carbon footprint of the raw materials.8
Super-frozen tuna is expensive, as both storing and
handling require costly expertise and equipment;
and although many processors already use super-
frozen tuna to satisfy demand in the absence of fresh
materials, the infrastructure is not yet in place for it to
be the main source of ‘fresh’ tuna in the UK. Despite
these disadvantages, there is generally a positive
outlook for super-frozen tuna.6
There are five main species of tuna; skipjack, yellowfin, bigeye, albacore and bluefin. In terms of volume caught, skipjack tuna is by far the most significant species.
14 SEAFISH Global Supply of Tuna Report 2009
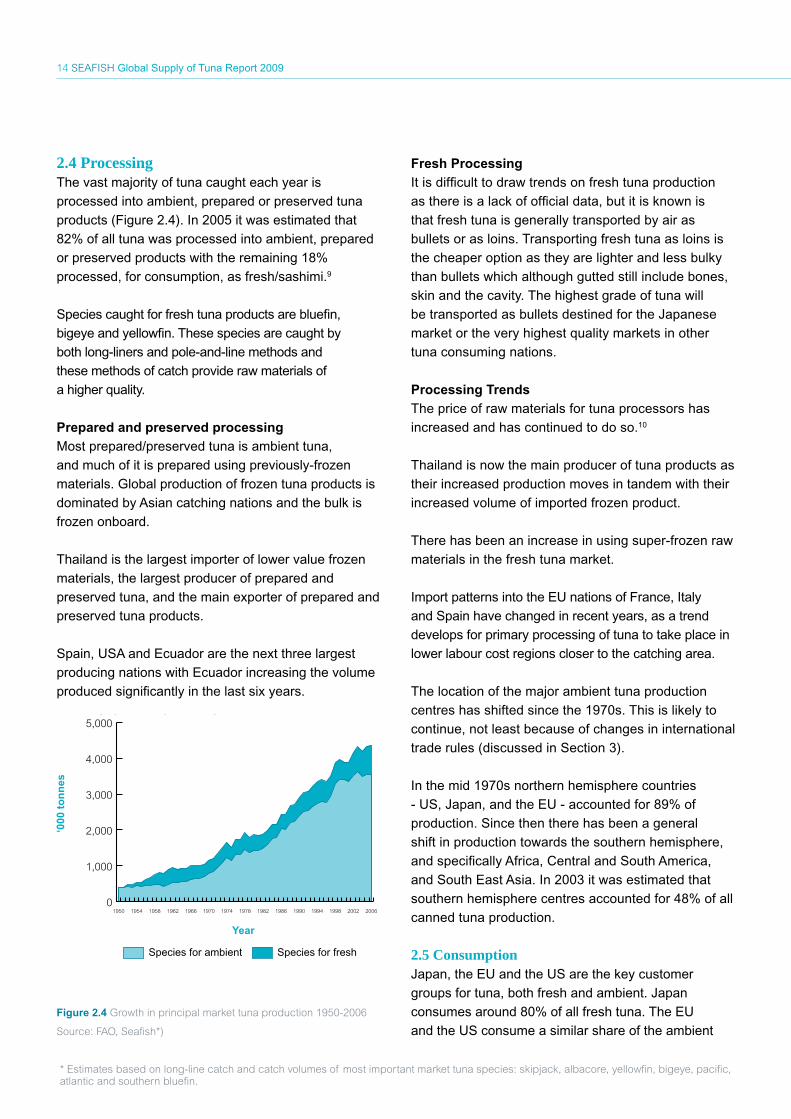
2.4 ProcessingThe vast majority of tuna caught each year is
processed into ambient, prepared or preserved tuna
products (Figure 2.4). In 2005 it was estimated that
82% of all tuna was processed into ambient, prepared
or preserved products with the remaining 18%
processed, for consumption, as fresh/sashimi.9
Species caught for fresh tuna products are bluefin,
bigeye and yellowfin. These species are caught by
both long-liners and pole-and-line methods and
these methods of catch provide raw materials of
a higher quality.
Prepared and preserved processingMost prepared/preserved tuna is ambient tuna,
and much of it is prepared using previously-frozen
materials. Global production of frozen tuna products is
dominated by Asian catching nations and the bulk is
frozen onboard.
Thailand is the largest importer of lower value frozen
materials, the largest producer of prepared and
preserved tuna, and the main exporter of prepared and
preserved tuna products.
Spain, USA and Ecuador are the next three largest
producing nations with Ecuador increasing the volume
produced significantly in the last six years.
0
1,000
2,000
3,000
4,000
5,000
Year
Estimated fishery production destined for ambient and fresh markets (capture & aquaculture) '000 metric tonnes
‘000
to
nn
es
1950 2002199819941990198619821978197419701966196219581954
Species for ambient Species for fresh
2006
Figure 2.4 Growth in principal market tuna production 1950-2006
Source: FAO, Seafish*)
Fresh ProcessingIt is difficult to draw trends on fresh tuna production
as there is a lack of official data, but it is known is
that fresh tuna is generally transported by air as
bullets or as loins. Transporting fresh tuna as loins is
the cheaper option as they are lighter and less bulky
than bullets which although gutted still include bones,
skin and the cavity. The highest grade of tuna will
be transported as bullets destined for the Japanese
market or the very highest quality markets in other
tuna consuming nations.
Processing TrendsThe price of raw materials for tuna processors has
increased and has continued to do so.10
Thailand is now the main producer of tuna products as
their increased production moves in tandem with their
increased volume of imported frozen product.
There has been an increase in using super-frozen raw
materials in the fresh tuna market.
Import patterns into the EU nations of France, Italy
and Spain have changed in recent years, as a trend
develops for primary processing of tuna to take place in
lower labour cost regions closer to the catching area.
The location of the major ambient tuna production
centres has shifted since the 1970s. This is likely to
continue, not least because of changes in international
trade rules (discussed in Section 3).
In the mid 1970s northern hemisphere countries
- US, Japan, and the EU - accounted for 89% of
production. Since then there has been a general
shift in production towards the southern hemisphere,
and specifically Africa, Central and South America,
and South East Asia. In 2003 it was estimated that
southern hemisphere centres accounted for 48% of all
canned tuna production.
2.5 Consumption Japan, the EU and the US are the key customer
groups for tuna, both fresh and ambient. Japan
consumes around 80% of all fresh tuna. The EU
and the US consume a similar share of the ambient
* Estimates based on long-line catch and catch volumes of most important market tuna species: skipjack, albacore, yellowfin, bigeye, pacific, atlantic and southern bluefin.

Global Supply of Tuna Report 2009 SEAFISH 15
produce 9 (these groups are discussed in detail
later). The EU nations of UK, France, Germany, Italy
and Spain are all amongst the largest importers of
prepared and preserved tuna products. The nation that
imports the largest volume of prepared or preserved
tuna for consumption is the US.
Consumption trendsAn increasing proportion of the total annual catch is
consumed as fresh or frozen.
China has the potential to impact greatly on global
tuna trade and consumption.11 As a nation, China
currently consumes huge volumes of seafood annually.
If the Chinese people develop a taste for tuna, this
will greatly increase competition for what is a finite
resource. Other emerging markets for tuna products
include Russia and South America.12
16 SEAFISH Global Supply of Tuna Report 2009
3. International trade rulesThis section provides a brief introduction to international trade rules, the key agreements that exist for EU trade, and their impact on tuna processors. The section also considers the agreements currently being negotiated, and the likely forward developments.
Global Supply of Tuna Report 2009 SEAFISH 17
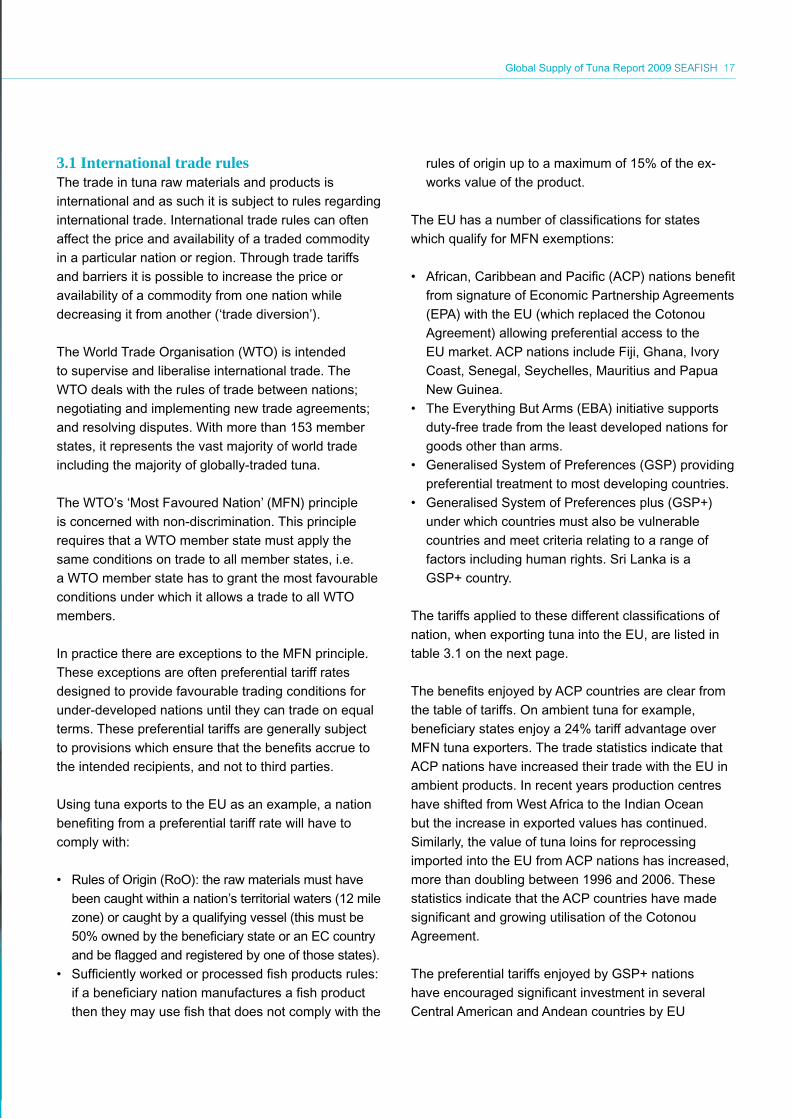
3.1 International trade rulesThe trade in tuna raw materials and products is
international and as such it is subject to rules regarding
international trade. International trade rules can often
affect the price and availability of a traded commodity
in a particular nation or region. Through trade tariffs
and barriers it is possible to increase the price or
availability of a commodity from one nation while
decreasing it from another (‘trade diversion’).
The World Trade Organisation (WTO) is intended
to supervise and liberalise international trade. The
WTO deals with the rules of trade between nations;
negotiating and implementing new trade agreements;
and resolving disputes. With more than 153 member
states, it represents the vast majority of world trade
including the majority of globally-traded tuna.
The WTO’s ‘Most Favoured Nation’ (MFN) principle
is concerned with non-discrimination. This principle
requires that a WTO member state must apply the
same conditions on trade to all member states, i.e.
a WTO member state has to grant the most favourable
conditions under which it allows a trade to all WTO
members.
In practice there are exceptions to the MFN principle.
These exceptions are often preferential tariff rates
designed to provide favourable trading conditions for
under-developed nations until they can trade on equal
terms. These preferential tariffs are generally subject
to provisions which ensure that the benefits accrue to
the intended recipients, and not to third parties.
Using tuna exports to the EU as an example, a nation
benefiting from a preferential tariff rate will have to
comply with:
Rules of Origin (RoO): the raw materials must have •
been caught within a nation’s territorial waters (12 mile
zone) or caught by a qualifying vessel (this must be
50% owned by the beneficiary state or an EC country
and be flagged and registered by one of those states).
Sufficiently worked or processed fish products rules: •
if a beneficiary nation manufactures a fish product
then they may use fish that does not comply with the
rules of origin up to a maximum of 15% of the ex-
works value of the product.
The EU has a number of classifications for states
which qualify for MFN exemptions:
African, Caribbean and Pacific (ACP) nations benefit •
from signature of Economic Partnership Agreements
(EPA) with the EU (which replaced the Cotonou
Agreement) allowing preferential access to the
EU market. ACP nations include Fiji, Ghana, Ivory
Coast, Senegal, Seychelles, Mauritius and Papua
New Guinea.
The Everything But Arms (EBA) initiative supports •
duty-free trade from the least developed nations for
goods other than arms.
Generalised System of Preferences (GSP) providing •
preferential treatment to most developing countries.
Generalised System of Preferences plus (GSP+) •
under which countries must also be vulnerable
countries and meet criteria relating to a range of
factors including human rights. Sri Lanka is a
GSP+ country.
The tariffs applied to these different classifications of
nation, when exporting tuna into the EU, are listed in
table 3.1 on the next page.
The benefits enjoyed by ACP countries are clear from
the table of tariffs. On ambient tuna for example,
beneficiary states enjoy a 24% tariff advantage over
MFN tuna exporters. The trade statistics indicate that
ACP nations have increased their trade with the EU in
ambient products. In recent years production centres
have shifted from West Africa to the Indian Ocean
but the increase in exported values has continued.
Similarly, the value of tuna loins for reprocessing
imported into the EU from ACP nations has increased,
more than doubling between 1996 and 2006. These
statistics indicate that the ACP countries have made
significant and growing utilisation of the Cotonou
Agreement.
The preferential tariffs enjoyed by GSP+ nations
have encouraged significant investment in several
Central American and Andean countries by EU

18 SEAFISH Global Supply of Tuna Report 2009
investors. Development of the processing industry
in these countries has considerably increased the
volumes of processed tuna. GSP+ status, coupled
with a trade agreement with the United States means
that these South American countries have been able
to increase production and generate greater
economies of scale while enjoying a competitive
advantage through tariff exemptions.
Table 3.1 also demonstrates the EU ‘tariff peaks’
which protect domestic industries from low cost
competition. EU tariff peaks are used for the
importation of processed material but tariffs are
kept low on unprocessed raw materials used
for production. Industries within the EU can buy
unprocessed materials tariff free while all low cost
imported products, other than those from ACP/GSP+
nations, attract a tariff.
The major South East Asian producers of tuna such
as Thailand, Philippines and Indonesia do not benefit
from preferential treatment and are at a disadvantage
due to the EU’s tariff peaks. In order to comply with
WTO rules the EU had to reach a compromise (under
the WTO Dispute Resolution Understanding) with
these disadvantaged countries. Under the terms of
the compromise, known as the Cotonou Waiver, the
EU agreed to allow specific volumes of ambient tuna
(25,000 tonnes) and tuna loins (4,000 tonnes) from
these producing countries at a reduced tariff of 12%.
The effect of these tariff quotas for SE Asian countries
is that once a year, SE Asian tuna comes to the EU
market with low tariffs. It is estimated to take only days
to sell this tuna which would indicate that even with a
12% competitive disadvantage, the tuna is still cheaper
than ACP or GSP+ tuna. SE Asian countries do not
have to comply with any of the rules relating to RoO (as
described above for nations with tariff exemptions). This
offers them an advantage as they can purchase their
raw materials from the cheapest source.
Impact on EU Tuna ProcessorsAmbient tuna production in the EU is particularly
affected by these trade rules. While the rules are
designed in part to protect the industry, they can also be
restrictive. The importation of whole unprocessed tuna
may be tariff free, but the labour intensity of processing
this in the EU means that it is too expensive and
processors prefer to import loins. Imported loins from
ACP or GSP+ nations do not attract a tariff (subject to
RoO) but supplies are not sufficient to meet demand 13 and processors are forced into purchasing high tariff
attracting SE Asian loins.
As a result, processors in the EU are now pushing
for an increase in the volume of tariff-reduced, non-EU
tuna loins.
Description ACP GSP+ EBA GSP MFN
0302 and 0303Fresh chilled or frozen tuna for production under 1604 0% 0% 0% 0% 0%
0302 and 0303 Fresh chilled or frozen tuna for uses other than production 0% 0% 0% 18.5% 22%
03041Fresh chilled fillets (all species of fish, including tuna) 0% 0% 0% 11.5% 15%
03042Frozen Fillets (all species of fish, including tuna) 14.5% 18%
1604Tuna loins to be processed 0% 0% 0% 20.5% 24%
1604Ambient tuna products, with oil and others (all species) 0% 0% 0% 20.5% 24%
Table 3.1 Simplified EU Tariff Structure for Tuna and Tuna Products. Source: Campling, L. (2008)13

Global Supply of Tuna Report 2009 SEAFISH 19
3.2 Current trade agreementsThere are a number of free trade agreements
(FTAs) that are relevant to the tuna trade. Table 3.2 (on
the previous page) lists those that are most relevant
to tuna. Each trade agreement that is signed will have
effects on markets beyond the two contracting nations.
For example, as Thailand trades more with Australia
and Japan other tuna producing nations will lose
market share. If the EU signed a free trade
agreement with Thailand then, given that they are
cheaper with a 12% tariff disadvantage, this would
adversely affect the competitiveness of the ACP and
GSP+ tuna producing nations.
This list of agreements is evidence that Thailand is
seeking to consolidate its position as the dominant
producer of preserved tuna. If Thailand successfully
negotiates a free trade or reduced tariff deal with the
US, it will have a considerable advantage in the US
market and put countries such as the Philippines at
a disadvantage.
Contracting Parties
Status Market Access for Ambient Tuna
NAFTA (US, Mexico, Canada)
In force Mexico: full market access for ambient tuna 2008 onwards
US-Columbia FTA In force 10 year phase out
US – Ecuador FTA
Stalled 10 year phase out
US-Thailand FTA Advanced negotiations
10 year phase out
Japan-Thai FTA In force Market access for all tuna products, but EU type Rules of Origin
EU – ASEAN Initial negotiations
Discussions commenced in summer 2007
Thai – Australia/New Zealand FTAs
In force 2003/2005
Gradual tariff and quota based phase out to 2009
Table 3.2 Key bilateral trade agreements 13
3.3 Future Trade DevelopmentsThe EU may relax the RoO and allow ACP •
and GSP+ countries to source their tuna on
the international market (‘global sourcing RoO’).
This would provide ACP and GSP+ countries
with access to cheaper materials and increase
their output capacity, and in turn allow EU
producers to source sufficient raw materials from
them. Global sourcing RoO have already been
provided to signatories of the Pacific-EU
Economic Partnership Agreement but is unlikely
to be extended to other EPA regions. This is
because the current system benefits the EU tuna
fleet as it, in effect, provides a captive market for
their catch.
The EU may agree treaties with South East •
Asian nations to reduce tariffs on imported
tuna, either on loins or for ambient tuna.
Reduction of tariffs on loins would enable EU
producers to source cheaper raw materials for
ambient tuna. Reduced tariffs on ambient tuna
from SE Asia would impact upon the
competitiveness of EU producers.
WTO agreements reduce the maximum •
tariff on tuna. Talks are currently ongoing to
reduce tariffs including those on tuna. As EU
tariffs are just below the upper limit of 25% for
tuna, any reduction in the maximum tariff would
mean a decrease in the EU tariff, which could
fall to just 6% in two to five years.13 This would make
it harder for the EU to protect domestic industries
and also reduce the advantages offered to ACP and
GSP+ countries.
The impact of trade liberalisation on ACP •
and GSP+ countries may result in a
downward spiral in competitiveness of their
ambient tuna industries and a growing
dominance of ambient tuna producers in South
East Asia.14 This may present opportunities
for ACP and GSP+ countries to move out
of ambient tuna and into fresh or frozen
fillet production.20

20 SEAFISH Global Supply of Tuna Report 2009
4. Yellowfin Tuna Key markets and supply routesThis section provides a short overview of the key markets, trade and supply of yellowfin tuna in three major customer blocs and the key trends in ambient and fresh/chilled supply chains.
With limitations on specific yellowfin trade data, this part of the report relies on trade data and insights from existing research material. Commentary on yellowfin tuna is provided where possible, otherwise conclusions are drawn from general tuna consumption.
Global Supply of Tuna Report 2009 SEAFISH 21
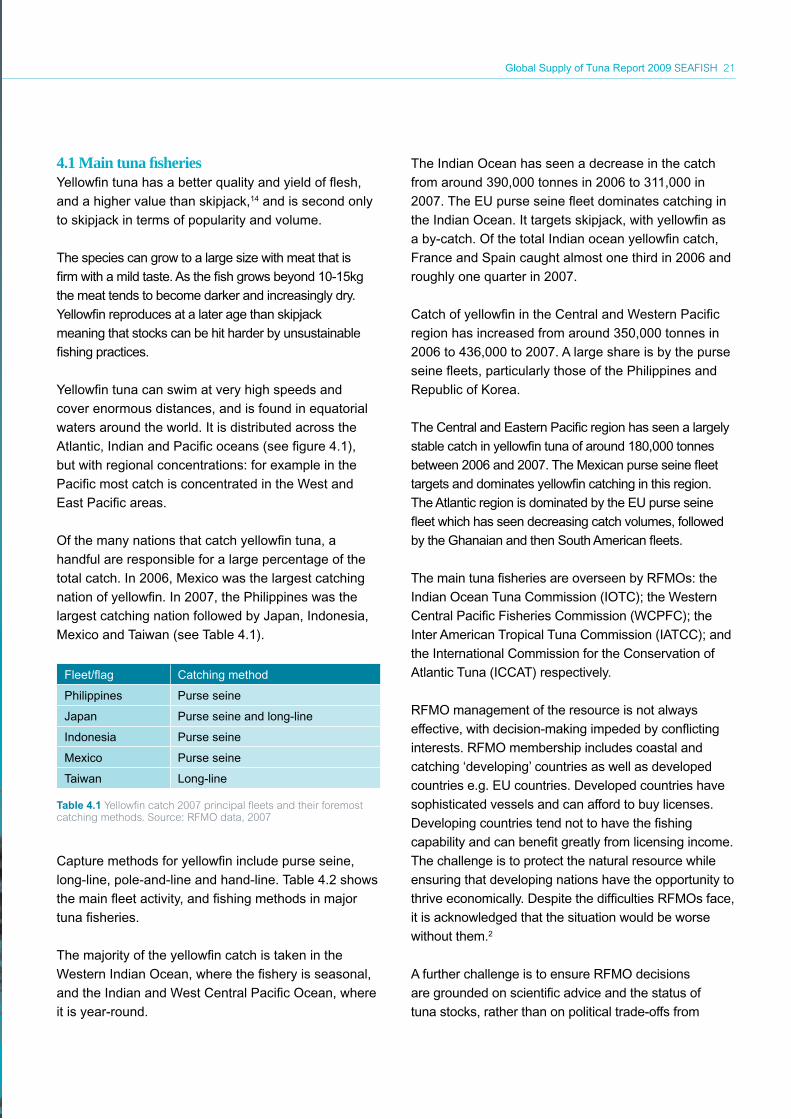
4.1 Main tuna fisheriesYellowfin tuna has a better quality and yield of flesh,
and a higher value than skipjack,14 and is second only
to skipjack in terms of popularity and volume.
The species can grow to a large size with meat that is
firm with a mild taste. As the fish grows beyond 10-15kg
the meat tends to become darker and increasingly dry.
Yellowfin reproduces at a later age than skipjack
meaning that stocks can be hit harder by unsustainable
fishing practices.
Yellowfin tuna can swim at very high speeds and
cover enormous distances, and is found in equatorial
waters around the world. It is distributed across the
Atlantic, Indian and Pacific oceans (see figure 4.1),
but with regional concentrations: for example in the
Pacific most catch is concentrated in the West and
East Pacific areas.
Of the many nations that catch yellowfin tuna, a
handful are responsible for a large percentage of the
total catch. In 2006, Mexico was the largest catching
nation of yellowfin. In 2007, the Philippines was the
largest catching nation followed by Japan, Indonesia,
Mexico and Taiwan (see Table 4.1).
Fleet/flag Catching method
Philippines Purse seine
Japan Purse seine and long-line
Indonesia Purse seine
Mexico Purse seine
Taiwan Long-line
Table 4.1 Yellowfin catch 2007 principal fleets and their foremost catching methods. Source: RFMO data, 2007
Capture methods for yellowfin include purse seine,
long-line, pole-and-line and hand-line. Table 4.2 shows
the main fleet activity, and fishing methods in major
tuna fisheries.
The majority of the yellowfin catch is taken in the
Western Indian Ocean, where the fishery is seasonal,
and the Indian and West Central Pacific Ocean, where
it is year-round.
The Indian Ocean has seen a decrease in the catch
from around 390,000 tonnes in 2006 to 311,000 in
2007. The EU purse seine fleet dominates catching in
the Indian Ocean. It targets skipjack, with yellowfin as
a by-catch. Of the total Indian ocean yellowfin catch,
France and Spain caught almost one third in 2006 and
roughly one quarter in 2007.
Catch of yellowfin in the Central and Western Pacific
region has increased from around 350,000 tonnes in
2006 to 436,000 to 2007. A large share is by the purse
seine fleets, particularly those of the Philippines and
Republic of Korea.
The Central and Eastern Pacific region has seen a largely
stable catch in yellowfin tuna of around 180,000 tonnes
between 2006 and 2007. The Mexican purse seine fleet
targets and dominates yellowfin catching in this region.
The Atlantic region is dominated by the EU purse seine
fleet which has seen decreasing catch volumes, followed
by the Ghanaian and then South American fleets.
The main tuna fisheries are overseen by RFMOs: the
Indian Ocean Tuna Commission (IOTC); the Western
Central Pacific Fisheries Commission (WCPFC); the
Inter American Tropical Tuna Commission (IATCC); and
the International Commission for the Conservation of
Atlantic Tuna (ICCAT) respectively.
RFMO management of the resource is not always
effective, with decision-making impeded by conflicting
interests. RFMO membership includes coastal and
catching ‘developing’ countries as well as developed
countries e.g. EU countries. Developed countries have
sophisticated vessels and can afford to buy licenses.
Developing countries tend not to have the fishing
capability and can benefit greatly from licensing income.
The challenge is to protect the natural resource while
ensuring that developing nations have the opportunity to
thrive economically. Despite the difficulties RFMOs face,
it is acknowledged that the situation would be worse
without them.2
A further challenge is to ensure RFMO decisions
are grounded on scientific advice and the status of
tuna stocks, rather than on political trade-offs from

22 SEAFISH Global Supply of Tuna Report 2009
countries that stand to lose money and jobs if their
tuna quotas are cut. The ICCAT recently commissioned
an independent panel to review its own performance
following widespread concern over the management of
Atlantic tuna stocks. The panel branded the ICCAT an
‘international disgrace’ commenting that member states
do not adhere to regulations and that quotas do not
follow scientific advice.15
4.2 Trade in yellowfin tunaYellowfin tuna is the second most prevalent tuna
species in terms of volume caught, and makes up
around 25% (1.1 million tonnes in 2006) of the total
tuna catch (figure 4.2). The total volume of yellowfin
tuna caught each year increased steadily between
1950 and 2004. Since 2004 catch volumes have
fallen back to levels similar to the late 1990s.
The rate at which the yellowfin catch has increased
is not as fast as that of skipjack but the total volume
caught increased tenfold in the time period shown.
0
300,000
600,000
900,000
1,200,000
1,500,000
Year
Yellowfin tuna
Ton
nes
Yellowfin tuna
1950 199819901982197419661958 2006
Figure 4.2 Yellowfin tuna catch 1950 - 2006
Yellowfin tuna is traded as either ambient product (solid
pack, chunks, flakes, grated), raw material for ambient
tuna (fresh, frozen and frozen pre-cooked loins) or as
tuna for direct consumption (fresh/chilled and frozen) in
the form of tuna steaks or sashimi.
WCPFCIOTC IATCC ICCAT
600 900 1200E 150 1800 1500 1200W 900 600 300 000 300
600 900 1200E 150 1800 1500 1200W 900 600 300 000 300
CCSBT IOTC
N 600
300
000
300
S 600
N 600
300
000
300
S 600
Figure 4.1 Major yellowfin fisheries
Global Supply of Tuna Report 2009 SEAFISH 23
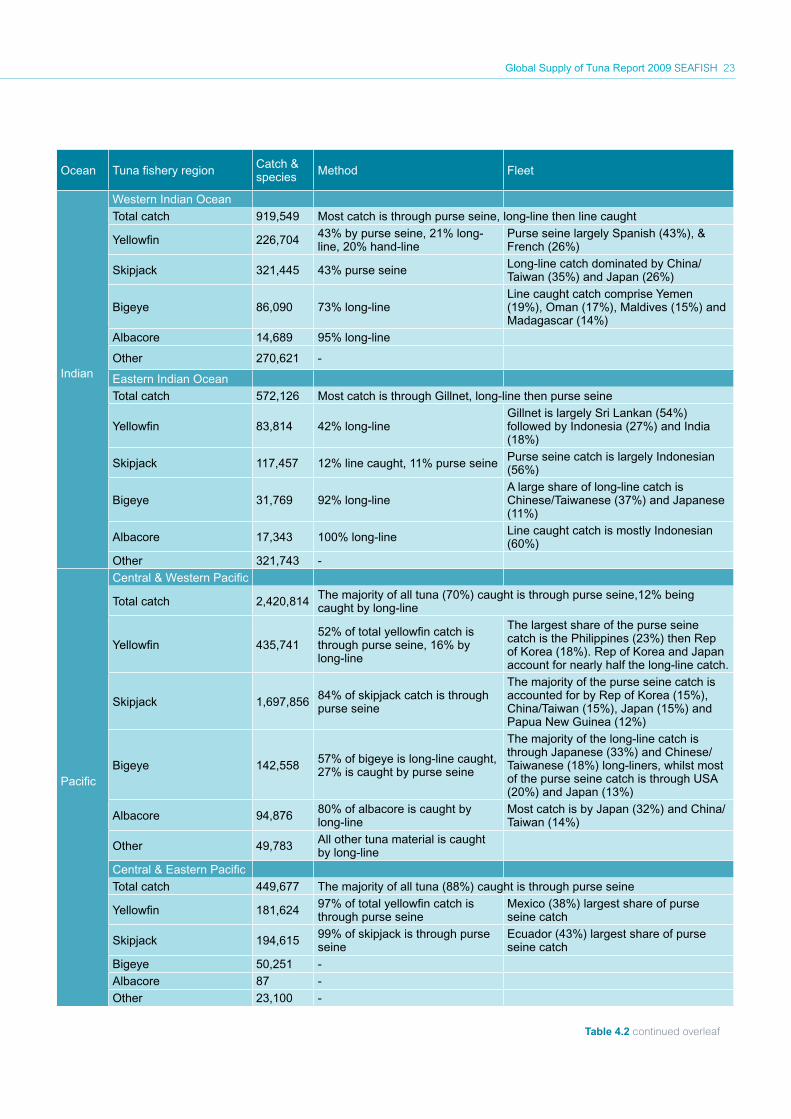
Ocean Tuna fishery region Catch & species Method Fleet
Indian
Western Indian Ocean
Total catch 919,549 Most catch is through purse seine, long-line then line caught
Yellowfin 226,704 43% by purse seine, 21% long-line, 20% hand-line
Purse seine largely Spanish (43%), & French (26%)
Skipjack 321,445 43% purse seine Long-line catch dominated by China/Taiwan (35%) and Japan (26%)
Bigeye 86,090 73% long-lineLine caught catch comprise Yemen (19%), Oman (17%), Maldives (15%) and Madagascar (14%)
Albacore 14,689 95% long-line
Other 270,621 -
Eastern Indian Ocean
Total catch 572,126 Most catch is through Gillnet, long-line then purse seine
Yellowfin 83,814 42% long-lineGillnet is largely Sri Lankan (54%) followed by Indonesia (27%) and India (18%)
Skipjack 117,457 12% line caught, 11% purse seine Purse seine catch is largely Indonesian (56%)
Bigeye 31,769 92% long-lineA large share of long-line catch is Chinese/Taiwanese (37%) and Japanese (11%)
Albacore 17,343 100% long-line Line caught catch is mostly Indonesian (60%)
Other 321,743 -
Pacific
Central & Western Pacific
Total catch 2,420,814 The majority of all tuna (70%) caught is through purse seine,12% being caught by long-line
Yellowfin 435,74152% of total yellowfin catch is through purse seine, 16% by long-line
The largest share of the purse seine catch is the Philippines (23%) then Rep of Korea (18%). Rep of Korea and Japan account for nearly half the long-line catch.
Skipjack 1,697,856 84% of skipjack catch is through purse seine
The majority of the purse seine catch is accounted for by Rep of Korea (15%), China/Taiwan (15%), Japan (15%) and Papua New Guinea (12%)
Bigeye 142,558 57% of bigeye is long-line caught, 27% is caught by purse seine
The majority of the long-line catch is through Japanese (33%) and Chinese/Taiwanese (18%) long-liners, whilst most of the purse seine catch is through USA (20%) and Japan (13%)
Albacore 94,876 80% of albacore is caught by long-line
Most catch is by Japan (32%) and China/Taiwan (14%)
Other 49,783 All other tuna material is caught by long-line
Central & Eastern Pacific
Total catch 449,677 The majority of all tuna (88%) caught is through purse seine
Yellowfin 181,624 97% of total yellowfin catch is through purse seine
Mexico (38%) largest share of purse seine catch
Skipjack 194,615 99% of skipjack is through purse seine
Ecuador (43%) largest share of purse seine catch
Bigeye 50,251 -
Albacore 87 -
Other 23,100 -
Table 4.2 continued overleaf
24 SEAFISH Global Supply of Tuna Report 2009
The three largest markets for fresh/chilled yellowfin tuna
are Japan, the US and the EU. The largest markets for
ambient tuna are the EU and the US.
Sourcing practices and supply chain structure for fresh/
chilled product are distinct for each of the customer blocs;
shaped by the technical requirements of the material
as well as historical fishing practices which reflect the
markets for individual product formats.
While the market for tuna, per se, places pressure on
tuna stocks, the market for individual product formats
places pressure on how the material is caught, processed
and sold.
The majority of the catch is used for ambient tuna
although increasingly it is being used as fresh/frozen loins,
fresh/frozen fillets or smoked. Of course where it is used
as fresh/frozen it could still be used for ambient tuna.
Yellowfin tuna, to be sold as fresh/chilled to the market, is
caught by hand-line, pole-and-line or long-line in order to
preserve its red colour and has either to be landed directly
to the destination market, air-freighted, or super-frozen.
Yellowfin tuna for ambient products is generally caught
using purse seine, frozen onboard and processed in
canneries before freighting to the customer.
4.3 Major yellowfin supply chainsGiven the limitations in available data, the supply chain
descriptions in this report are based on a combination
of data sources. Given the lack of data on yellowfin
tuna trade and consumption relating to the three major
customer groups, overall tuna consumption has been used
to gain insights and general impressions. Conclusions on
yellowfin tuna are provided where possible.
When the three key customer groups are compared it is
clear that, in terms of overall tuna consumption, the EU
and the US markets share similar characteristics and
tend to contrast with the Japanese market.
Of the three main customer groups, the 27 EU •
nations as a trade bloc consume the largest amount
of tuna in terms of volume at around 1.2 million
tonnes per year.
Japan consumes more tuna than any other single nation. •
In the USA, tuna is an important part of the diet and •
consumption volumes of tuna are second only to
those in Japan.
Buyers in each of the three key customer groups •
have different factors driving their buying decisions.
The EU and the US are responsible for practically the •
whole market for loins of all tuna species.14
The statistics for overall tuna catch in 2006 indicate that,
of the three key customer groups:
Japan is the largest catching nation. •
Japan is also the main importer of tuna. •
The EU is the most significant of the three key •
customer groups in relation to imports and production
of prepared or preserved tuna products.
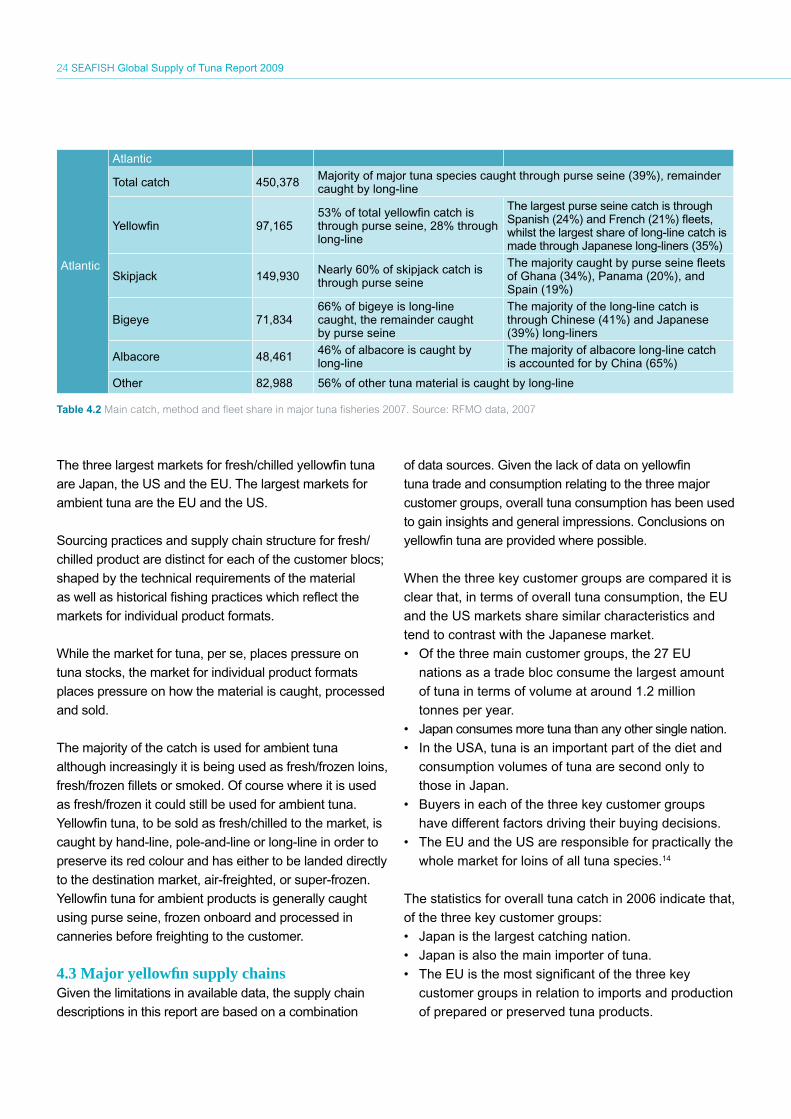
Atlantic
Atlantic
Total catch 450,378 Majority of major tuna species caught through purse seine (39%), remainder caught by long-line
Yellowfin 97,16553% of total yellowfin catch is through purse seine, 28% through long-line
The largest purse seine catch is through Spanish (24%) and French (21%) fleets, whilst the largest share of long-line catch is made through Japanese long-liners (35%)
Skipjack 149,930 Nearly 60% of skipjack catch is through purse seine
The majority caught by purse seine fleets of Ghana (34%), Panama (20%), and Spain (19%)
Bigeye 71,83466% of bigeye is long-line caught, the remainder caught by purse seine
The majority of the long-line catch is through Chinese (41%) and Japanese (39%) long-liners
Albacore 48,461 46% of albacore is caught by long-line
The majority of albacore long-line catch is accounted for by China (65%)
Other 82,988 56% of other tuna material is caught by long-line
Table 4.2 Main catch, method and fleet share in major tuna fisheries 2007. Source: RFMO data, 2007

Global Supply of Tuna Report 2009 SEAFISH 25
Major supply chains follow for the major consuming
blocs of yellowfin tuna i.e. Japan, US and the EU.
JapanJapan is the leading market for fresh tuna. In 2006 it had
an estimated total tuna consumption of around 900,000
tonnes, with sashimi accounting for an estimated 56%,
katsuobushi responsible for 27% and ambient for 17%.16
The major market for tuna in Japan is therefore the
market for fresh sashimi, which accounts for the
majority of the tuna raw material volume and also for
the most value.16
The sashimi market uses larger species of tuna such
as bluefin, bigeye and yellowfin. Bluefin tuna attracts
the highest prices but is available in much lower
volumes. Bigeye is well priced and because it inhabits
deeper, colder water it has a high fat content, which is
sought after in Japan. Yellowfin is popular as sashimi
but priced lower than Bigeye.16 17 18 The consumption
of yellowfin tuna is believed to be in the fresh/chilled
category rather than ambient material.
Fresh / chilled Despite the relatively high volumes of sashimi
consumed in Japan, the Japanese market has been
declining. Japanese direct consumption of all tunas
(eaten fresh as sashimi) was estimated to have fallen
from around 650,000 tonnes in 2002 to 500,000 tonnes
in 2006.16
The premium sashimi market favours fresh and chilled
tuna but accepts frozen material. Around 80% of
product sold in Japan is super-frozen using freezing
infrastructure developed over the last 30 years.6
Sashimi demands high quality handling of the fish,
therefore tuna caught by long-line has traditionally
been used and more recently ranched tuna has been a
source of material. Top grade yellowfin tuna caught by
Asian long-liners is sold as sashimi in Japan. Material
from long-line operations derives from large distant
water freezer fleets and smaller offshore fleets serving
fresh markets via air freight.19
In the Pacific region the freezer fleets focus on sourcing
bigeye and yellowfin material for the frozen sashimi
market. This fleet involves Japanese, Korean and
Taiwanese vessels in the West and Central Pacific with
some vessels operating in Central and Eastern Pacific
waters. There has seen some decline in freezer vessel
numbers over recent years.
The smaller offshore fleets in the Pacific region target
bigeye and yellowfin, but focus on the fresh sashimi
market. Offshore fleets from Japan, China, Indonesia,
Taiwan and Pacific Island nations have seen some
growth in fishing effort.18 19
Over the last ten years the balance of fishing effort
between Asian nations has changed, with declining
Japanese catches and an increase in landings from
Taiwanese vessels which provide the majority of frozen
material supplied to Japan.
Fresh tuna is flown into Japan largely from:
Mediterranean countries (ranched bluefin) and•
Indonesia (bigeye and yellowfin) - sourced from •
offshore fleets of Japan, and Taiwan in the Western
Pacific and particularly by the Indonesian and
Chinese fleets.
The average price paid by Japan for imported tuna has
risen since 2002, increasing 30 - 40% in the 2006-07
period alone. The cost of individual consumer purchases
has remained level, but only because retailers have
adjusted the portion size. With high prices, both fresh/
chilled and frozen imported material has also declined,
although there has been an increase in imported frozen
loins. Imports of yellowfin have followed the decline in
overall fresh/chilled tuna.14 16
Ambient tunaAmbient tuna consumed in the Asian market is
predominantly skipjack. Focusing their fishing
efforts in the Western Pacific region, Japanese
and Taiwanese purse seiners primarily target
skipjack but it is estimated that 15-30% of their
catch is yellowfin.14

26 SEAFISH Global Supply of Tuna Report 2009
Tuna canneries supplying the Japanese market operate
in Japan and increasingly Thailand. Both Japanese and
Thai canneries rely on the Japanese and Taiwanese
purse seine fleets to supply largely skipjack but also
yellowfin tuna.
United StatesTuna is an important part of the US diet and
consumption volumes of tuna in the US are only
slightly less than the volumes consumed in Japan. As
the second most popular seafood species, tuna has a
high level of market penetration with an estimated 90%
of Americans eating tuna once per month and a 70%
household penetration.20
The US market for tuna is dominated by ambient,
prepared or preserved tuna, but the US fresh tuna
market has grown in recent years and is now the
world’s second largest, after Japan. Skipjack, sourced
from the Pacific, is believed to be a key species for
canneries with yellowfin a key species for sashimi
sourced from the Atlantic.21 14
Ambient tunaAmbient tuna sales in the US are in decline, partly as a
result of the 2001 methyl mercury scare among North
American consumers. In contrast, despite relatively
small volumes, tuna pouches are the main growth
segment with Ecuador securing an important share of
this growth in recent years (resulting from a free trade
agreement with the US).21 22
Ambient production in the US is largely undertaken
in American Samoa and to a lesser extent in California,
while direct imports of ambient tuna are from
Thailand, Philippines, Indonesia and Ecuador (US
dolphin-safe labelling standards means Mexico is
virtually banned from supplying tuna to the US). Tuna
canneries in California handle loins only.14 21
Material for canneries in American Samoa and
Thailand is sourced from vessels in the Western
Pacific, and this is likely to be largely skipjack with
yellowfin as by-catch given the target species of purse
seiners in that region.
600 900 1200E 150 1800 1500 1200W 900 600 300 000 300
600 900 1200E 150 1800 1500 1200W 900 600 300 000 300
CCSBT IOTC
N 600
300
000
300
S 600
N 600
300
000
300
S 600
WCPFCIOTC IATCC ICCAT
Fresh/chilled/superfrozen Canned Major Cannery Major Customber bloc
Figure 4.3: Major trade flows for yellowfin tuna sold to Japan

Global Supply of Tuna Report 2009 SEAFISH 27
The suppliers of loins to California (Ecuador and
Trinidad and Tobago) are sourcing from vessels
in the Eastern Pacific, and this material is also likely to
be largely skipjack with yellowfin as by-catch given the
target species of Ecuadorian purse seiners.14
Fresh/chilledDirect consumption in the US has been estimated to
be around 35,000 tonnes annually. Originally this was
driven by Japanese restaurants, but a wide variety of
mainstream restaurants now serve sushi.
The USA is an important outlet for suppliers of non-
ambient tuna particularly from Latin America but also
Asian countries, especially Vietnam. Fresh yellowfin
is the main species for sashimi in the US (70% by
volume) and Senegal is an important supplier. The
market can absorb locally caught bluefin given the
range of Japanese restaurants and an ability to pay
higher prices than the Japanese market.21 23
Although in recent years imports of fresh tuna into
the US have increased, the latest statistics show
fresh imports declined by 10% in the first half of 2008.
This indicates that US consumption of fresh tuna,
considered a high-end seafood product, is reducing in
the current economic climate.21 23
EuropeOf the three main customer groups, the 27 EU nations
as a trade bloc consume the largest amount of tuna in
terms of volume at around 1.2 million tonnes per year.
The majority of EU tuna consumption is in the ambient,
prepared or preserved formats. The EU market for fresh
tuna has been growing in recent years and now countries
such as the UK are joining traditional tuna-consuming
nations such as Spain and Italy in the consumption of
fresh tuna.
Yellowfin is sourced mainly from the Indian Ocean but
also from the Atlantic and Pacific (figure 4.5).
Ambient tuna marketAlthough skipjack is the major species for ambient
600 900 1200E 150 1800 1500 1200W 900 600 300 000 300
600 900 1200E 150 1800 1500 1200W 900 600 300 000 300
CCSBT IOTC
N 600
300
000
300
S 600
N 600
300
000
300
S 600
WCPFCIOTC IATCC ICCAT
Fresh/chilled/superfrozen Canned Major Cannery Major Customber bloc
Figure 4.4 Major trade flows for yellowfin tuna sold to the US
28 SEAFISH Global Supply of Tuna Report 2009
tuna in Europe, yellowfin is the preferred material
in ambient tuna in Southern European countries.
Consumers are used to seeing ambient tuna as
a relatively cheap commodity and there may
be limits on price increases without loss of customers.
Growth in the ambient market has come through
yellowfin tuna as a higher quality material and also
through innovative marketing and product innovation.
The market for ambient tuna in Western Europe
already has high levels of penetration while Eastern
Europe is considered an opportunity for growth.24
Ambient tuna processingSpain, Italy and France are the main ambient
tuna producing nations in the EU, with Spain the
largest producer.
Spanish canneries rely on both skipjack and yellowfin
tuna in the form of frozen whole tuna caught by the EU
fleet and imported loins from the likes of Ecuador and
El Salvador. Italy uses imported loins of yellowfin tuna
for ambient production, mainly from Indian and Atlantic
sources. France, consumers of skipjack and yellowfin,
imports loins for domestic canneries which focus on
high quality products, while standard ambient products
are produced in Africa.
In 2007, some 60% of EU imports of whole round
frozen tuna were yellowfin. According to some
sources, ambient tuna production in Europe “is now
mostly aimed at yellowfin”.25 Ambient products using
yellowfin put pressure on the materials available
for fresh yellowfin tuna products. There is a trend
for outsourcing the primary stages of ambient tuna
production i.e. growth in imports of tuna loins rather
than whole fish, particularly into Italy and France and
more recently Spain.
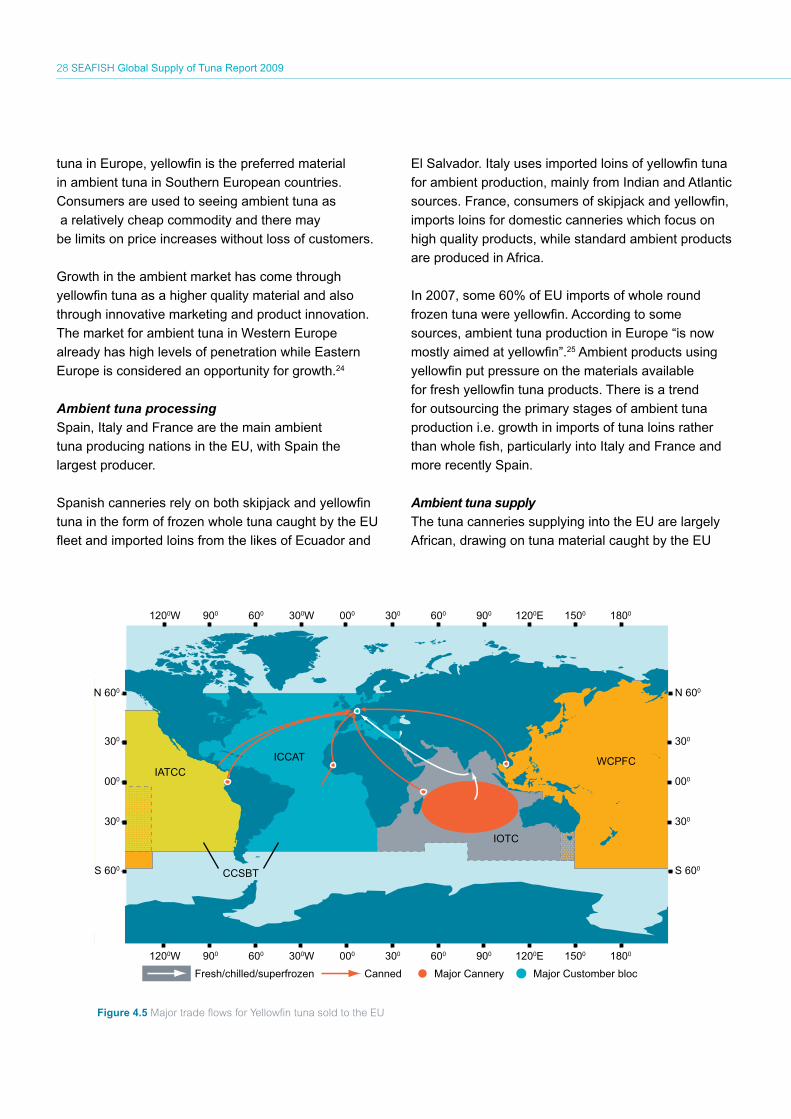
Ambient tuna supplyThe tuna canneries supplying into the EU are largely
African, drawing on tuna material caught by the EU
1200W 900 600 300W 000 300 600 900 1200E 1500 1800
1200W 900 600 300W 000 300 600 900 1200E 1500 1800
WCPFCIATCC
ICCAT
CCSBT
N 600
300
000
300
S 600
N 600
300
000
300
S 600
IOTC
Fresh/chilled/superfrozen Canned Major Cannery Major Customber bloc
Figure 4.5 Major trade flows for Yellowfin tuna sold to the EU
Global Supply of Tuna Report 2009 SEAFISH 29
purse seine fleets operating in the Atlantic and Indian
oceans. Thailand is also a source of ambient material
for the EU.
The majority of ambient tuna material is skipjack,
however yellowfin is the target species for the fleet
operating in the Atlantic18 (a large share of landed
volume is from French vessels), and is the by-catch
species of the EU fleet in the Indian Ocean.
The major suppliers of tuna loins imported by EU
canneries were from Latin America, likely to be
largely skipjack tuna, then yellowfin sourced from the
Ecuadorian fleet and a much smaller share from the
Spanish fleet operating in the Eastern Pacific.
Fresh/frozen marketMediterranean countries, and urban areas in particular,
are the main markets for direct consumption in the EU.
This is largely in the form of steaks, estimated to be
40,000 tonnes.
Historically the main species for these markets have been
yellowfin, bluefin and albacore, but in recent years this has
changed. Bluefin has declined to a very small share of EU
direct consumption with retailers and restaurants removing
this species from their product range.14
Fresh and frozen tuna volumes are expected to increase.
For some, this suggests material will be drawn away from
the ambient industry, but this is by no means certain, as
catching of juvenile tuna destined for the ambient industry
restricts the volume available for the fresh tuna industry.
In the EU, trade in super-frozen material, which would
support the consumption of fresh/chilled product
formats, is disadvantaged by the lack of infrastructure
to support it.
The influence of RFMOsPossibly the most important factor impacting on the fresh/
chilled tuna trade is the effectiveness (or otherwise) of the
RFMOs. For example, although those nations surrounding
the Indian Ocean have signed up to fishery reporting, in
reality they have real difficulty in carrying through their
commitments. Furthermore there is disproportionate
political influence, largely through lobbying by purse
seine fleets in the buying of licences from Indian Ocean
countries. This has a real impact upon the economic
utilisation of yellowfin as a species; since the value of
juvenile fish is considerably lower than even a slightly
more mature fish.26
30 SEAFISH Global Supply of Tuna Report 2009
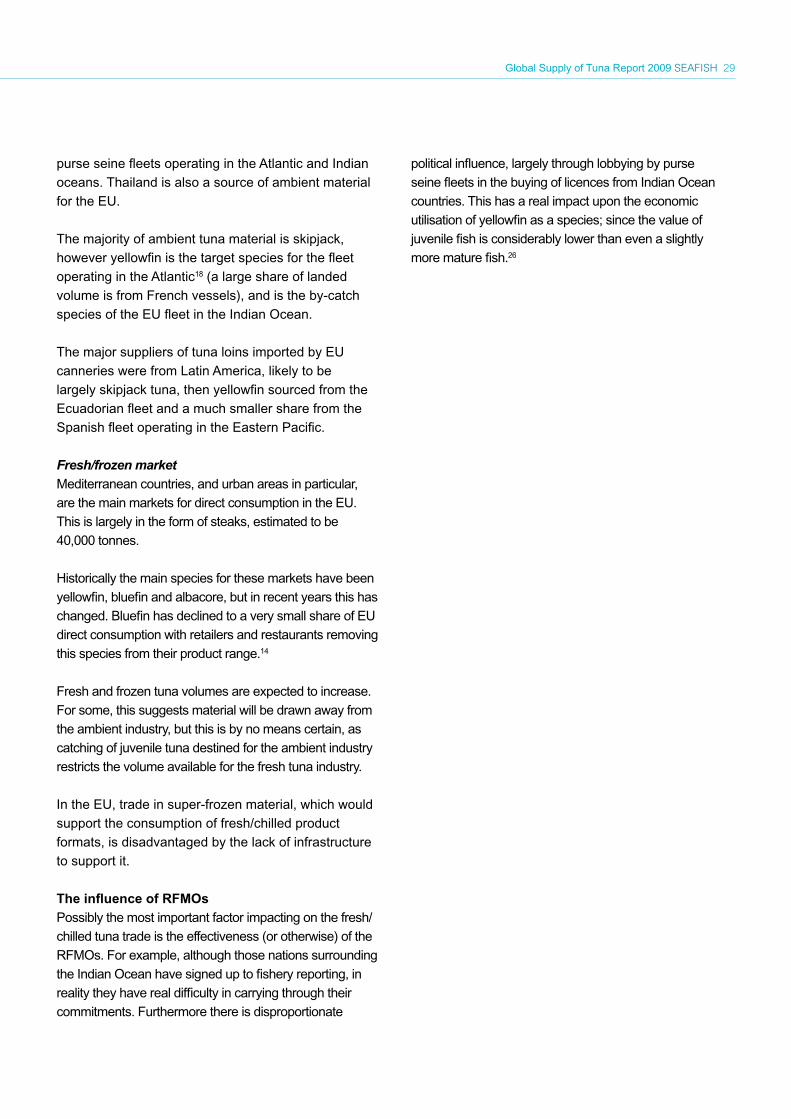
Factors Trends
Catching Processing Consuming
Political
Undue political influence of purse seine fleet in accessing the fishing rights from developing coastal states
In 2004, US Govt consumer advice on fish consumption and mercury levels specifically mention ambient tuna and tuna steaks for the first time.
Social
In US, consumer ‘scare’ over •mercury in ambient tuna Yellowfin regarded as superior in •quality to Skipjack
Environmental
In the Indian Ocean, yellowfin •catch is seasonal, caught as by-catch by purse seine fleet, and catch levelling off.El Nino effect lasting longer•In West Pacific, yellowfin catch •is year round; El Nino increases purse seine yellowfin catch in West and limits it in the EastIn Atlantic, El Nino starting to •have an effect on West Africa
Economic
Purse seine targeting of •juvenile yellowfin does not maximize the economic value of yellowfin stockIncreasing fuel costs•Long-line fleet catch declining •in Japan, expanding in Taiwan (although only a proportion goes into canning)In Indian Ocean, Iranian purse •seine fleet catch increasingIn Pacific, Japan and US fleet •catch in decline In South Pacific, there is growth •in domestic fleetsIn Pacific, gradual reduction in •distant water fleets In Atlantic, EU catches •declining, Taiwan and Ghana catches increasingIn Atlantic, yellowfin catches •decliningIn Atlantic, yellowfin beginning •to be caught by long-line, super-frozen for sashimi market
Yellowfin has a better yield •than SkipjackDeveloped country •canneries outsourcing primary processing stage to developing countries Developed countries such •as France and Spain importing loins from developing countriesThailand a major ambient •tuna ‘hub’ sourcing from Japanese and Taiwanese fleetsPrice of imported tuna •increasingIranian canneries are •“dynamic”New canneries may •emerge in Papua New Guinea and India
Yellowfin generates a better •price than SkipjackIn EU, yellowfin is an opportunity •to increase penetration in existing ambient marketsOpportunities for ambient growth •in new markets e.g. Eastern Europe In US, ambient tuna in decline, •tuna pouches in growth
Technological In Pacific, use of FADs increasing the catch of juvenile Yellowfin
Legal
Difficulties of fishery reporting by RFMOs and acting on scientific advice
Trade liberalization may •result in ACP and GSP+ countries becoming uncompetitive with increasing dominance of South East Asia as production ‘hub’.US and Thailand discuss •duty free trade
Summary influencing factors and trends for ambient Skipjack/Yellowfin tuna supply chains
Global Supply of Tuna Report 2009 SEAFISH 31
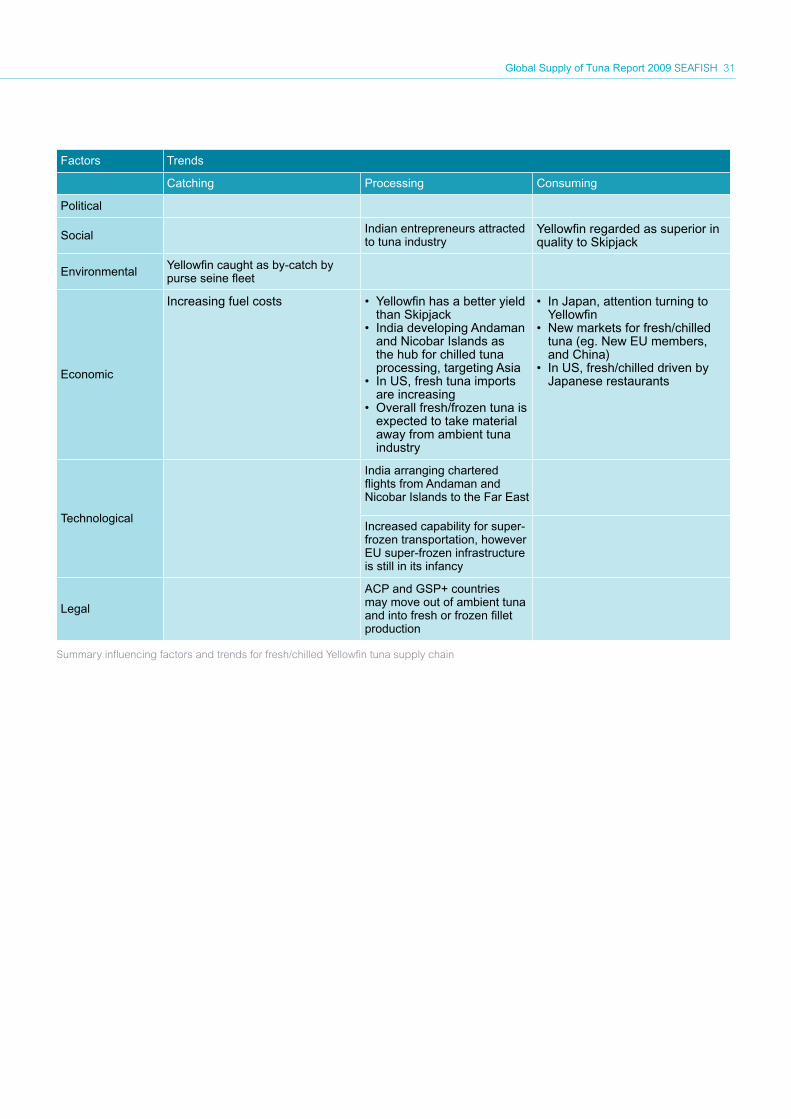
Factors Trends
Catching Processing Consuming
Political
SocialIndian entrepreneurs attracted to tuna industry
Yellowfin regarded as superior in quality to Skipjack
Environmental Yellowfin caught as by-catch by purse seine fleet
Economic
Increasing fuel costs Yellowfin has a better yield •than SkipjackIndia developing Andaman •and Nicobar Islands as the hub for chilled tuna processing, targeting AsiaIn US, fresh tuna imports •are increasingOverall fresh/frozen tuna is •expected to take material away from ambient tuna industry
In Japan, attention turning to •YellowfinNew markets for fresh/chilled •tuna (eg. New EU members, and China)In US, fresh/chilled driven by •Japanese restaurants
Technological
India arranging chartered flights from Andaman and Nicobar Islands to the Far East
Increased capability for super-frozen transportation, however EU super-frozen infrastructure is still in its infancy
Legal
ACP and GSP+ countries may move out of ambient tuna and into fresh or frozen fillet production
Summary influencing factors and trends for fresh/chilled Yellowfin tuna supply chain

32 SEAFISH Global Supply of Tuna Report 2009
5. Yellowfin Tuna – UK markets and supplyAs with the previous section, where there are insufficient trade data on yellowfin tuna, observations are drawn from overall tuna trade.
Global Supply of Tuna Report 2009 SEAFISH 33
5.1 Overview of UK tuna marketTuna is supplied into the UK as ambient, frozen or
fresh/chilled tuna.
Ambient tuna is a high volume, low value segment
dominating the overall price per kilo of tuna sold in
the UK, in contrast with the high value low volume
sales of fresh tuna. Social groups C2 and D buy the
most ambient tuna while fresh tuna is most popular
amongst groups A and B. In terms of age, tuna is
most popular amongst 25-34s and least popular
with over 65s. Ambient tuna is popular with
families, with consumption tailing off as children
leave home.27
81,000 tonnes of tuna was sold through retail in 2007.
The overall retail price per kilo of tuna has increased
slightly since 2005: this has been driven by fresh
tuna, as the high value segment, with frozen tuna and
ambient remaining essentially static. In volume and
value terms, tuna imported into the UK is dominated
by ambient tuna.27
Skipjack represents the largest volume of tuna
imported followed by yellowfin, albacore and a
relatively small amount of bluefin tuna (based on
volumes of imported whole/headed and gutted tuna).
Sourcing standards for tuna are very high: building
on EU regulatory requirements, UK buyers meet a
range of private standards including those set by the
retail sector (through the BRC). Sustainability is a key
concern across all formats with multiple retailers and
restaurants specifying catching methods for fresh and
frozen, and ‘dolphin friendly’ labels on all cans sold
through the big supermarkets.14 20
5.2 Ambient tunaAmbient tuna is consumed at home, and out-of-home
through the catering sector, in pizza toppings, salads
and sandwiches.
Around 70% of ambient tuna is sold through
supermarkets and 30% through the catering sector.
The dominant species in ambient tuna is skipjack, but
yellowfin is also important.
Ambient tuna has to be sourced through imports:
unlike other EU countries, such as Spain, the UK has
no canneries of its own. The main imports are from
canneries in the Seychelles, Mauritius, Thailand, and
Ghana.28 Imports of ambient tuna have increased by
more than 15% since 2000.29
Princes and John West are the principle brands and
distribution routes of ambient tuna in the UK, followed
by the multiples’ ‘own brand’ labels, and niche labels.
Princes is part of the Mitsubishi group which has a
cannery in Mauritius, John West was owned by Heinz,
a group with canneries in the Seychelles and Ghana
and is now owned by private equity firm M W Brands.
Retailer/own label brands are supplied from Thailand.
In 2008, Princes accounted for around 31% value and
28% volume of the market for standard ambient tuna
while John West was responsible for 27% and 25%.
As with the other fifteen members of the core
European Union (with the exception of Germany), the
market for standard ambient tuna can be considered
“saturated”. In recent years there has been evidence
to suggest that innovative marketing and product
development can increase the size of market. Despite
high consumption of skipjack, increasingly yellowfin
tuna is being used for ambient products because of its
superior quality.14 24
Low catches are expected to drive the prices of
ambient tuna upward as canneries use up supplies in
cold storage.28
5.3 Frozen tunaAccording to a UK buyer “frozen fish products tend
to be for older aged customers, usually those with a
limited culinary repertoire and the item will be chosen
at the end of their shopping trip”. As a consequence,
for some buyers, frozen tuna steaks are “not
particularly sought after”.
In comparison with ambient and fresh, frozen material
accounts for a small share of tuna volumes sold through
retail; 700 tonnes in 2007. Frozen tuna sold through
wholesalers is often destined for the volume food service
market e.g. canteens in the form of frozen steaks.31

34 SEAFISH Global Supply of Tuna Report 2009
5.4 Fresh/chilled tunaFresh or chilled tuna is considered to be a far superior
product compared to frozen. Fresh or chilled tuna
imports into the UK are predominantly yellowfin but
also albacore (also known in the USA as ‘white tuna’).
Fresh albacore is imported into the UK but the
volumes are small. A small volume, around 70 tonnes,
of albacore is landed in South West England. This UK
landed material is processed as loins and steaks and
it is thought that half the volume is frozen to smooth
supply across the season.
All UK-landed albacore is destined for a very niche
market of high-end food service outlets, with the UK
consumer palate apparently a key factor. As one UK
processor reflected: “it tends to be the educated fish-
eaters that go for albacore…in the UK, people aren’t
used to the pink colouring”.
Fresh/chilled Yellowfin tuna supply chainChilled products and longer shelf-life are important
considerations for UK consumers, who tend to “buy
to store” (unlike Japanese consumers, who buy “fresh
to eat”).
An important factor for the UK consumer of fresh tuna
steaks is colour: red flesh is clearly recognisable and
an indicator of freshness.
Retail sales of yellowfin are estimated at around 4,500
tonnes and £54m. Sales through food service are
estimated to be around 1,300 tonnes and £125m. Exports
of fresh yellowfin material are thought to be negligible.
The sushi market has become firmly established in
the UK both in terms of retail and food service; as one
respondent reflected “now every other take away is a
sushi outlet”. According to Seafish, by July 2008, the
retail sushi market was worth £38.9m, a 21 percent
growth from the previous year.
Around 5,900 tonnes of yellowfin are imported into the
UK, with an estimated value of £70m
Foodservicesector
£144m
Value
Volume
Foodservicesectorp rts
i
5,931t4,240 t 4,113 t
4,500 t
5,9315, 753 t
3% loss/waste
1,691 t
Negligible
3% loss/waste
5,753 t
1,640 t
1,253 t
54 m
£179 mFoodservice sector
125 m
Negl gible
70m £XXm
£XXm £XXm
£XXm70m
£XXm
t
££
£
£
The total live weight of imports is: 9,121 t
Imports
Exports
Retail sector
Processing
Imports Processing
Wholesaler,Trader
Wholesaler,Trader
Retail sector
Ex o
Figure 5.1 Fresh/chilled Yellowfin tuna supply chain to the UK (Seafish estimated volumes and values, 2007)

Global Supply of Tuna Report 2009 SEAFISH 35
Buyer decision-makingThe high standards of UK buyers across a broad
set of criteria demand that suppliers develop close
relationships in the supply chain.
Quality factors for fresh tuna include colour, taste,
flavour and texture, but in contrast with the Japanese
market, fat content is considered less important.
Supermarkets require a shelf life of six days and stipulate
requirements in terms of bacteria, oil content, and a stable
bright red colour.20 Such conditions clearly influence the
availability of fresh/chilled yellowfin; sourcing tuna is
influenced by geographical proximity, with capability of
air-freight or super-freezing material essential factors.
Routes to marketThe majority of volume is imported through a small
number of processors for onward sale into multiple
retailers. Most UK processors have a narrow supply
base for fresh/chilled yellowfin tuna, with a single
supplier often having a greater than 50% share.
Yellowfin tuna is largely imported as fresh/chilled loins
(vacuum packed, skinless and boneless), with smaller
volumes of frozen loins and a small amount imported as
fresh or frozen bullets (whole fish headed and gutted).
Fresh tuna loins are processed to customer
specification for sale to retail outlets as pre-pack, or
chilled loins for fish counters. Whole (headed and
gutted) is supplied to wholesalers who supply into food
service customers, mainly pubs and restaurants.
The majority of fresh/chilled yellowfin tuna is air
freighted from Indian Ocean countries such as Sri
Lanka and the Maldives. A relatively small quantity is
imported as super-frozen tuna - at least 270 tonnes
annually – to supplement the main fresh volume.
Super-frozen / Ultra low temperature TunaSuper-freezing tuna is an important innovation in
maintaining tuna quality. An important feature for
UK suppliers is that the tuna retains its red colour
for a time when defrosted (normal freezing results in
material that is brown when defrosted). Super-freezing
36 SEAFISH Global Supply of Tuna Report 2009
also provides processors with the capability to smooth
supply during monsoon periods.
The majority of super-frozen material is sold through
processors to retail outlets. Some super-frozen
material is channelled through wholesale markets
where it is thawed and put into modified atmosphere
packaging (to maintain colour) for the sushi market.
Supplier decision-makingThe selling decision of fresh/chilled yellowfin tuna
suppliers will be influenced not just by price but the
quality of the material, and specific preferences in their
decision-making, particularly:
regular buyers who provide core business at •
stable prices
buyers that add value to the relationship, •
e.g. production expertise
There are risks that UK market requirements to drive
up the quality of the catch could end up driving raw
materials away from the UK market. Non-UK competitors
sourcing fresh/chilled yellowfin may impose fewer
conditions on suppliers when buying, so that suppliers
may begin to question the need to clear extra hurdles in
order to supply the UK market.
5.5 Trends and influencing factorsThere has been rapid growth in fresh tuna in both retail
and food service sectors over the last 15 years.
Summer is the high season for UK consumers and is
a period of significant price rises. Peak UK consumer
demand from May to early October coincides with the
low (monsoon) season for fishing in the main sourcing
nations around the Indian Ocean.
The cost of yellowfin tuna is also affected by
exchange rate movements. The current economic
turmoil is demonstrating that when sterling weakens
against the Euro, European tuna buyers are able to
secure better prices.
It is felt that continued price increases will “limit the
attractiveness of tuna to the customer. There is a limit
to how much consumers will pay for a specific protein
before switching to others.
Fresh tuna is still considered to be the best quality,
and despite constraints in supply, there are indications
that fresh tuna is becoming a year-round product. So
it is unsurprising that, in the words of one supplier,
“everyone is looking at super-frozen” as it retains
product quality and allows continuity of supply.
The driver behind super-freezing technology and
logistics infrastructure was the high-value Japanese
market, where it was comparatively easy to recover
the high investment costs. Super-frozen material
can be up to 20% more costly for UK processors,
but commitments by UK retailers to environmental
priorities may be enough to drive investment in super-
frozen technologies.
The supply of yellowfin is jeopardised by the decrease
in stocks and exacerbated by the pursuit of juvenile
stocks (perceived to be the result of purse seine fishing
for the ambient tuna industry).
Maintaining yellowfin tuna as a source of supply
is challenged by a lack of information as well as
management difficulties. Yellowfin tuna is a highly
migratory trans-oceanic species which makes
comprehensive data collection and informed
decisions difficult.8 There is a risk of inadequate
management of the yellowfin stock through
shortcomings in the RFMO framework.
Fishermen in the Indian Ocean are facing increasingly
unpredictable fishing seasons; the result of variations in
climate (affecting distributions of fish) and general weather
conditions (such as changing monsoon seasons).
There has been rapid growth in fresh tuna in both retail and food service sectors over the last 15 years
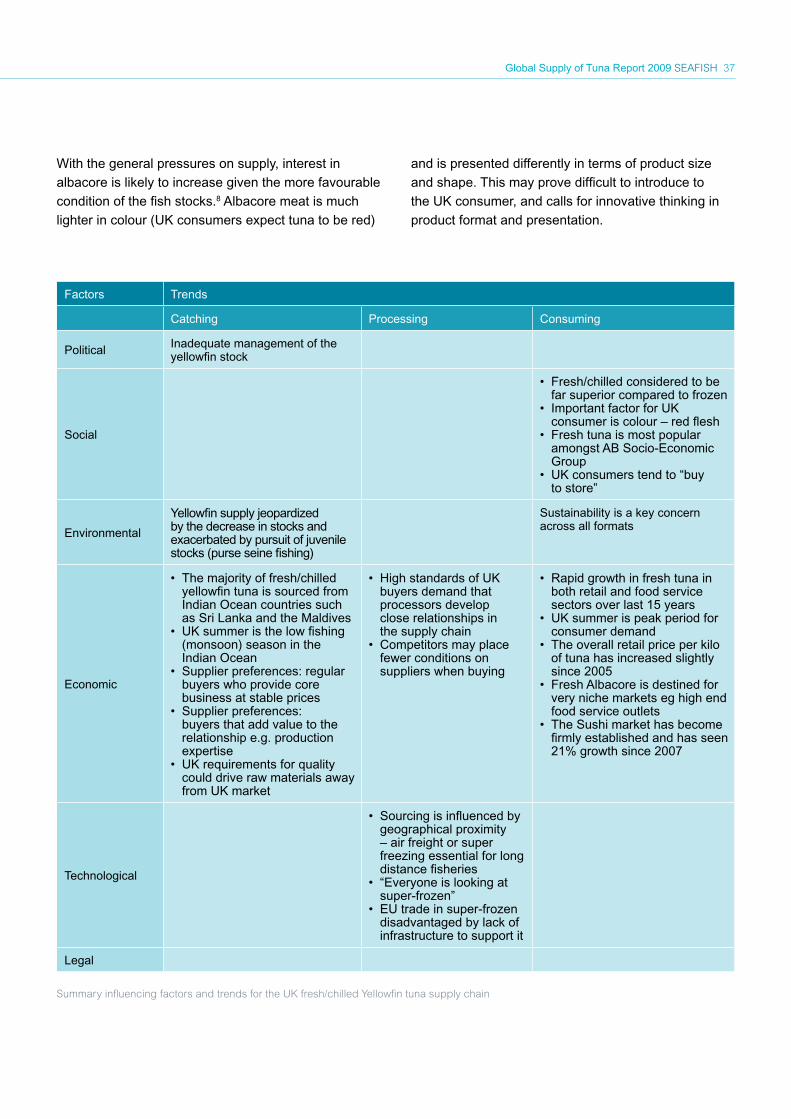
Global Supply of Tuna Report 2009 SEAFISH 37
Factors Trends
Catching Processing Consuming
Political Inadequate management of the yellowfin stock
Social
Fresh/chilled considered to be •far superior compared to frozenImportant factor for UK •consumer is colour – red fleshFresh tuna is most popular •amongst AB Socio-Economic GroupUK consumers tend to “buy •to store”
Environmental
Yellowfin supply jeopardized by the decrease in stocks and exacerbated by pursuit of juvenile stocks (purse seine fishing)
Sustainability is a key concern across all formats
Economic
The majority of fresh/chilled •yellowfin tuna is sourced from Indian Ocean countries such as Sri Lanka and the MaldivesUK summer is the low fishing •(monsoon) season in the Indian OceanSupplier preferences: regular •buyers who provide core business at stable pricesSupplier preferences: •buyers that add value to the relationship e.g. production expertiseUK requirements for quality •could drive raw materials away from UK market
High standards of UK •buyers demand that processors develop close relationships in the supply chainCompetitors may place •fewer conditions on suppliers when buying
Rapid growth in fresh tuna in •both retail and food service sectors over last 15 yearsUK summer is peak period for •consumer demandThe overall retail price per kilo •of tuna has increased slightly since 2005Fresh Albacore is destined for •very niche markets eg high end food service outletsThe Sushi market has become •firmly established and has seen 21% growth since 2007
Technological
Sourcing is influenced by •geographical proximity – air freight or super freezing essential for long distance fisheries“Everyone is looking at •super-frozen”EU trade in super-frozen •disadvantaged by lack of infrastructure to support it
Legal
Summary influencing factors and trends for the UK fresh/chilled Yellowfin tuna supply chain
With the general pressures on supply, interest in
albacore is likely to increase given the more favourable
condition of the fish stocks.8 Albacore meat is much
lighter in colour (UK consumers expect tuna to be red)
and is presented differently in terms of product size
and shape. This may prove difficult to introduce to
the UK consumer, and calls for innovative thinking in
product format and presentation.

38 SEAFISH Global Supply of Tuna Report 2009
6. Developments and possible options

Global Supply of Tuna Report 2009 SEAFISH 39
6.1 DevelopmentsThe key developments for UK yellowfin tuna
processors appear to be:
Growth in consumptionGrowth in existing markets for fresh tuna•
New markets are going to open up in fresh and •
ambient
New markets in the emerging economies; Eastern •
Europe (low grade ambient tuna), South America,
China, Russia
Sustainability requirements of the UK marketThe retail multiples need proof of sustainable •
supplies, and their actions affect the wider fresh
tuna trade
Non-UK competitors may not demand stringent •
sustainability conditions when buying tuna from
suppliers
Volatile supplyIncreased variability in climate•
Changing fishing seasons•
Strain placed on tuna resourceIncreased purse seine activity – more vessels with •
larger holds
More sophisticated catch techniques e.g. FADs and •
the associated catch of juveniles
Shortage of other tuna species e.g. bluefin•
Better utilisation of the resourceImproved management of resource•
Requirements for a collaborative approach•
Major competition from ambient industryYellowfin has greater yield•
Perceived by some – especially in Southern Europe •
- as a superior product
Trade infrastructure offers significant opportunities (i.e. super-frozen) and threats
Smoothing supply through the year•
Diversifying supply e.g. yellowfin from Pacific in •
addition to Indian ocean
Product standardisation•
Emergence of tuna ‘hubs’, e.g: Indian tuna hub •
targeted at Asian economies (Andaman and
Nicobar Islands)
Relaxation of preferential trade agreements, and the emergence of bilateral, trade agreements
May accelerate the concentration of ambient •
primary processing into tuna hubs, e.g. Thailand,
and an increase in raw material buying power
Existing ambient facilities may become •
underutilised, presenting a possible opportunity
for fresh processing
Yellowfin has attracted NGO attention and is likely to continue to do so in the future
Is yellowfin the new bluefin?•
Finally, the absence of sufficiently detailed trade data is a serious impediment to monitoring trade developments in particular tuna species.
6.2 Possible options for UK tuna processorsOf the developments outlined in the previous
section, there appear to be three key areas of risk
for UK processors:
International trade agreements and trading •
conditions
Trade data deficiencies•
Declining stocks•
By way of next steps, it is recommended that industry
stakeholders:
review the above developments and identify key •
risk areas
identify opportunities to influence and so mitigate •
risk areas
agree possible stakeholder actions•
It is important to note the scale of the fresh tuna sector
in the UK which is relatively small in comparison to
the ambient sector. It may therefore be beneficial to
collaborate across the different sectors of the UK tuna
industry to ensure meaningful action.

Global Supply of Tuna Report 2009 SEAFISH 41
ReferencesStakeholder interviews1.
Roberts, P., Towards a sustainable tuna fishery, 2.
Infofish Tuna Conference, May 2008
Tuna Market Report: Asia. Infofish (FAO) March 20083.
Elferink, A. and Rothwell, D., Oceans Management 4.
in the 21st Century: Institutional Frameworks and
Responses. Martinus Nijhoff Publishers. 2004
Stakeholder interviews5.
Tripis, S., Superfrozen ULT - Tuna, Infofish Tuna 6.
Conference, May 2008
Stakeholder interviews7.
Stakeholder interviews8.
Gilman, E. and Lundin C., Fast facts: Commercial 9.
Tuna Fisheries. Excerpt from 2008 (in progress).
Principles and Methods to Minimize Bycatch of
Sensitive Species Groups in Marine Capture
Fisheries: Lessons from Commercial Tuna Fisheries.
In Grafton Q, Hillborn R, Squires D, Tait M, Williams
M (Eds.). Handbook of Marine Fisheries Conservation
and Management. Oxford University Press.
Davidsson, K. and Eyjolfsson, E., Global Tuna 10.
Industry Status & Prospects, Infofish Tuna
Conference, May 2008
Redmayne, P., The Chinese Market for Fresh and 11.
Frozen Tuna, Infofish Tuna Conference, May 2008
Nunez, C., S American markets for tuna and tuna 12.
products, Infofish Tuna Conference, May 2008
Campling, L., Direct and Indirect Preference 13.
Erosion and the Competitiveness of the ACP
Tuna Processing Sector. In Veniana Qalo, (2008)
Bilateralism and Development: Emerging Trade
Patterns, London: Cameroon May
Global Supply of Tuna Report 2009 SEAFISH 41

42 SEAFISH Global Supply of Tuna Report 2009
The European tuna sector economic situation, 14.
prospects and analysis of the impact of the
liberalisation of trade. Oceanic Development.
November 2005
Intrafish, Ben Di Pietro November 200815.
Japanese Market for Tuna products: Trends, 16.
Issues and Prospects. Infofish Tuna Conference,
May 2008
Majkowski, J., Global fishery resources of tuna and 17.
tuna-like species, FAO Technical Paper No. 483
Miyake, M.P., Miyabe, N. Nakano. Historical trends 18.
of tuna catches in the world. Technical Paper No
467, Rome, FAO. 2004
Williams, P., and Reid, C., Overview Of Tuna 19.
Fisheries In The Western And Central Pacific
Ocean, Including Economic Conditions, 2006
Campling, L., An assessment of the potential 20.
benefits to PACP states of a revision of the rules of
origin for fisheries products of HS Chapters 0304
and 0305. 2008
Tuna Market Report: US. Infofish (FAO). May 200721.
Connelly, J., The US Market Shelf Stable Seafood, 22.
Infofish Tuna Conference, May 2008
Globefish US Market Report September 200823.
Vaseechi, A., The EU27 market for canned tuna. 24.
Infofish Tuna Conference, May 2008
Brus, H., EU Market for Fresh and Frozen Tuna. 25.
Infofish Tuna Conference, May 2008
Akester, S., (Macallister Elliott and partners), 26.
Responsible fishing and good practice guide: Sri
Lanka Tuna long-line fishery, 2008
UK retail tuna market – data to 52 w/e 19 April, 27.
Seafish. 2008
FISHinfo Network Market report Tuna. 200728.
Tuna Market Report: Europe. Infofish (FAO). 29.
March 2008
AC Nielsen Scantrack data; GB Total Coverage 30.
MAT; 17 May 2008 (from Tinned Tunas hidden
catch. Greenpeace. 2008)
Stakeholder interviews31.
Data SourcesFood and Agriculture Organisation (FAO) of the United
Nations: FishStat Plus http://www.fao.org/fishery/
statistics/software/fishstat
Indian Ocean Tuna Commission, www.iotc.org
Inter-American Tropical Tuna Commission, www.iattc.org
International Commission for the Conservation of
Atlantic Tunas, www.iccat.es
United Nations Commodity Trade Statistics Database:
UN comtrade. http://comtrade.un.org/
Western and Central Pacific Fisheries Commission,
www.wcpfc.int
Stakeholder InterviewsBill Lart, Seafish
Chris Driver, Le Lien
Chris Leftwich, Billingsgate market
Jonathon Goy, Business and Trade Statistics Ltd
Jon Harman, Seafish
Lorna Jack, Seafish
Lucy Pelham Burn, New England Seafoods
Mike Mitchell, The Seafood Company/Foodvest Group
Nigel Edwards, Seachill
Phil MacMullen, Seafish
Richard Ansell, M & J Seafood
ConsulteesKate Goodison, UK Foreign & Commonwealth Office
(FCO), UK Trade and Investment
Liam Campling
Levy auditors, Seafish
Malcolm Large, Seafish
Steven Park, Food and Drink Federation
Stefania Vannuccini, Food and Agriculture
Organisation, UN
Research AssistantsKnut Kristiansen and Kilian Begeman
42 SEAFISH Global Supply of Tuna Report 2009

44 SEAFISH Global Supply of Tuna Report 2009
Seafish18 Logie MillLogie Green RoadEdinburghEH7 4HS
t: +44 (0)131 558 3331f: +44 (0)131 558 1442
e: [email protected] w: www.seafish.org SIN: http://sin.seafish.org


