ORNL/SPR-2019/1128 Nuclear Data – Benchmarking 19 Fn) Yield Data for Nuclear Safeguards Stephen Croft Ramkumar Venkataraman Glenn Fugate Ian Gauld Robert McElroy Angela Moore Andrea Favalli Daniela Henzlova Martyn Swinhoe September 2019 Approved for public release. Distribution is unlimited.
Transcript
ORNL/SPR-2019/1128
Nuclear Data – Benchmarking 19Fn) Yield Data for Nuclear Safeguards
September 2019Approved for public release.Distribution is unlimited.
DOCUMENT AVAILABILITYReports produced after January 1, 1996, are generally available free via US Department of Energy (DOE) SciTech Connect.
Website www.osti.gov
Reports produced before January 1, 1996, may be purchased by members of the public from the following source:
National Technical Information Service5285 Port Royal RoadSpringfield, VA 22161Telephone 703-605-6000 (1-800-553-6847)TDD 703-487-4639Fax 703-605-6900E-mail [email protected] http://classic.ntis.gov/
Reports are available to DOE employees, DOE contractors, Energy Technology Data Exchange representatives, and International Nuclear Information System representatives from the following source:
Office of Scientific and Technical InformationPO Box 62Oak Ridge, TN 37831Telephone 865-576-8401Fax 865-576-5728E-mail [email protected] http://www.osti.gov/contact.html
This report was prepared as an account of work sponsored by an agency of the United States Government. Neither the United States Government nor any agency thereof, nor any of their employees, makes any warranty, express or implied, or assumes any legal liability or responsibility for the accuracy, completeness, or usefulness of any information, apparatus, product, or process disclosed, or represents that its use would not infringe privately owned rights. Reference herein to any specific commercial product, process, or service by trade name, trademark, manufacturer, or otherwise, does not necessarily constitute or imply its endorsement, recommendation, or favoring by the United States Government or any agency thereof. The views and opinions of authors expressed herein do not necessarily state or reflect those of the United States Government or any agency thereof.
NUCLEAR DATA – BENCHMARKING 19Fn) YIELD DATA FOR NUCLEAR SAFEGUARDS
Stephen Croft Ramkumar Venkataraman
Glenn Fugate Ian Gauld
Robert McElroy Angela Moore Andrea Favalli
Daniela Henzlova Martyn Swinhoe
_______________University of Tennessee, KnoxvilleLos Alamos National Laboratory
September 2019
Prepared byOAK RIDGE NATIONAL LABORATORY
Oak Ridge, TN 37831-6283managed by
UT-BATTELLE, LLCfor the
US DEPARTMENT OF ENERGYunder contract DE-AC05-00OR22725
iii
CONTENTS
LIST OF FIGURES .......................................................................................................................................vLIST OF TABLES .........................................................................................................................................vEXECUTIVE SUMMARY .........................................................................................................................viiABSTRACT...................................................................................................................................................11. INTRODUCTION .................................................................................................................................22. ACHIEVEMENT OF PROJECT GOALS ON A TASK BY TASK BASIS........................................3
2.1 TASK 1: MEASUREMENT OF WELL-KNOWN UF6 ITEMS USING STANDARD NEUTRON COUNTERS ............................................................................................................3
2.2 TASK 2: BENCHMARKING MCNP EFFICIENCIES USING A NIST-CERTIFIED 252CF SOURCE ............................................................................................................................7
2.3 TASK 3: MCNP SIMULATION OF LV-AWCCC AND MINI-ENMC TO SELECT A SUITABLE NEUTRON SPECTRUM BY MATCHING THE RING RATIO DATA ..............8
2.4 TASK 4: PROVIDE LAUNCH SPECTRUM OPTIONS FOR MODELING. IN ADDITION TO GUIDING THE CHOICE OF EFFICIENCY, THIS WILL BOUND THE EFFICIENCY UNCERTAINTY ......................................................................................112.4.1 Construction of a Thick-Target Yield for UF6..............................................................122.4.2 Discussion on Neutron Spectra Calculated Using SOURCES 4C; Updated
MCNP efficiencies........................................................................................................152.5 TASK 5: DATA REDUCTION AND UNCERTAINTY ANALYSIS .....................................202.6 TASK 6: COLLABORATE WITH LANL IN CREATING PRESENTATIONS,
GENERATING PUBLICATIONS, AND IN COMMUNICATION AND ARCHIVING OF RESULTS ............................................................................................................................26
2.7 TASK 7: THOROUGH DOCUMENTATION AND REPORTING OF THE DELIVERABLES—PROVIDE QUARTERLY REPORTS AND END-OF-YEAR REPORT ....................................................................................................................................26
2.8 TASK 8 (LANL): PERFORM MEASUREMENTS USING THE LANL ENMC AND THE SAME UF6 SOURCES THAT WERE MEASURED WITH LV-AWCC. THE LANL ENMC WILL BE SHIPPED TO ORNL. LANL PHYSICIST ANDREA FAVALLI WILL SET UP AND PERFORM MEASUREMENTS AT ORNL. THE MEASUREMENTS WILL BE USED TO DIRECTLY DETERMINE THE SPECIFIC NEUTRON YIELD (NEUTRONS/SEC/GRAM) OF 234U. ......................................................27
2.9 ADDITIONAL TASK ...............................................................................................................273. CONCLUSIONS .................................................................................................................................274. FUTURE WORK.................................................................................................................................285. REFERENCES ....................................................................................................................................30APPENDIX A. REFERENCE 252Cf-SOURCE EMISSION RATE CHECK BY ABSOLUTE
NEUTRON COINCIDENCE COUNTING AND ASSOCIATED UNCERTAINTY QUANTIFICATION USING THE MINI-ENMC ............................................................................A-1
APPENDIX B. RADIOLYSIS ..................................................................................................................B-1APPENDIX C. STOPPING POWER DATA FOR ALPHA PARTICLES...............................................C-1
v
LIST OF FIGURES
Figure 1. The ORNL LV AWCC...................................................................................................................4Figure 2. Schematic drawings and picture of LANL mini-ENMC................................................................5Figure 3. Various items available for measurement. .....................................................................................6Figure 4. LV-AWCC with 1S-Monel UF6 cylinder. ......................................................................................8Figure 5. Mini-ENMC with 1S-Model UF6 cylinder. ....................................................................................8Figure 6. MCNP Efficiencies for LV-AWCC for UF6 item P-10 – 252Cf Mannhart Energy
Spectrum. ........................................................................................................................................10Figure 7. MCNP Efficiencies for mini-ENMC for UF6 item P-10 – 252Cf Mannhart Energy
Spectrum. ........................................................................................................................................10Figure 8. Blended microscopic 19F(α,n) cross section σ(E) in mb as a function of incident α-
particle energy in the laboratory frame, E, in MeV. .......................................................................13Figure 9. Calculated thick target integrated over angle yield curve Y(E) in units of neutrons per
million α-particles as a function of energy E, in MeV....................................................................14Figure 10. Ratio of alpha stopping powers of UF6; SRIM-2013 to Ziegler-1977. ......................................15Figure 11. F(,n) launch spectra for UF6, calculated using updated SOURCES 4C...................................15Figure 12. 234U F(,n) spectrum calculated using updated SOURCES 4C vs measured spectra for
CaF2 [15]. ........................................................................................................................................16Figure 13. Comparison of 234U F(,n) spectrum calculated using the initial (un-updated) and
updated versions of SOURCES 4C.................................................................................................17Figure 14. LV-AWCC MCNP efficiencies for UF6 item Hoke ANL-11, calculated using 234U
F(n) launch spectrum from updated SOURCES 4C code; also shown are efficiencies using measured F,n) spectra from Jacob and Liskien [15], corresponding to alpha energies of 4.5 MeV and 5.0 MeV..................................................................................................19
Figure 15. LV-AWCC MCNP efficiencies for UF6 item Hoke ANL-11, calculated using 234U F(n) launch spectrum from updated SOURCES 4C code; also shown are efficiencies using measured F(,n) spectra from Jacob and Liskien [15], corresponding to alpha energies of 4.5 MeV and 5.0 MeV..................................................................................................19
LIST OF TABLES
Table 1. Mass loadings and enrichment of UF6 items. ..................................................................................6Table 2. States accessible in 22Na by the 19F(α,n) reaction stimulated by 234U α-particles. .........................12Table 3. Ratio of Initial vs. updated 234U F(,n) Spectra as a function of energy (average of 0.1
MeV wide bins)...............................................................................................................................18Table 4. LV-AWCC and mini-ENMC MCNP efficiencies for Hoke ANL-11 UF6 item............................20Table 5. Summary of Results for HEU items. .............................................................................................24Table 6. Results summary for LEU and DU UF6 items...............................................................................25
vii
EXECUTIVE SUMMARY
The goal of this 1 year project was to measure the thick-target yield from the 19Fn) reaction in UF6 with a
high accuracy of approximately ±2%. This accuracy will be a significant improvement over currently available
data in the literature which show a scatter of ±30%. The stated goal of establishing the specific yield
(neutrons/sec/gram) of 234U, a legitimate physical constant, was accomplished via direct measurements. Two
recognized safeguards instruments were used to measure a diverse collection of well-characterized small
samples—the Los Alamos National Laboratory (LANL) Mini-Epithermal Neutron Multiplicity Counter (Mini-
ENMC) and the Oak Ridge National Laboratory (ORNL) Large-Volume Active Well Coincidence Counter
(LV AWCC). The instruments are efficiency calibrated using a National Institutes of Standards and
Technology (NIST)–certified 252Cf source. A Monte Carlo transport code (MCNP)–based adjustment to the
F(α,n) launch spectrum and items was made using spectra taken from the literature* as well as predicted by the
SOURCES4C code. The SOURCES 4C codes makes use of thin target data, a nuclear model for energetics,
and stopping power data. SOURCES 4C was updated for this case alone, namely, 234U 19F(,n) yields from
UF6 using the alpha stopping powers calculated using the SRIM code and a blended microscopic cross section
data set. The blended microscopic cross sections consisted of data available to ORNL from a previous NA-22
project.† A robust determination of the n/s/g of 234U in UF6 was generated along with a scientifically defensible
uncertainty analysis. The dominant sources of uncertainty are efficiency determination (1.1% relative standard
deviation associated with the 252Cf reference source) and an additional about 0.9% systematic uncertainty
coming from the uncertainty in the F(α,n) spectrum. The combined overall relative uncertainty is of the order
of 2%.The stated uncertainties are an order of magnitude better than current data based on accelerator data
reported in the literature. The updated SOURCES 4C code is available to the safeguards community and
beyond from the Radiation Safety Information Computational Center (RSICC) at ORNL, which is a repository
for computer codes used in the field of nuclear technology. The 234U 19F(,n) yield from UF6 established in
this project will be shared with the NDA Working Groups associated with the Institute of Nuclear Material
Management (INMM) and the European Safeguards Research and Development Association (ESARDA). The
updated yield and the publications related to this work will be included in the next revision of the relevant
ASTM C26.10 and ANSI N15 standards. Aside from being of immediate and direct use by the safeguards
community, the 234U 19F(,n) yield from UF6 established in this project will serve as an enduring integral
benchmark that subsequent data evaluations will need to match in order to be credible.
* GJH Jacobs and H Liskien, “Energy Spectra of Neutrons Produced by α-Particles in Thick Targets of Light Elements,” Annals of Nuclear Energy 10(10) (1983) 541-552.† W.A. Peters et al., A kinematically complete interdisciplinary and co-institutional measurement of the 19F(α,n) cross section for nuclear safeguards science, Idaho National Laboratory Report INL/EXT-16-38791.
1
ABSTRACT
Fluorine compounds of U and Pu are ubiquitous in the nuclear fuel cycle, so F(α,n) neutrons are an
important signature and quantitative source term that needs to be understood for physics-based
interpretation of nondestructive assay measurements. Historically there have been large differences in the
basic nuclear data for this reaction reported by various groups. UF6 is the most prominent material in the
nuclear fuel cycle, with the potential for short-term production into weaponizable form. Verification of
bulk quantities, natural feed, depleted tails, and especially low enriched product in cylinders is
particularly important. The principal physical measurement is neutron counting. For enriched material,
the 19F(α,n) reaction, driven by 234U, is the dominant source of neutrons. Basic nuclear data, cross
sections, needed to calculate the yield, as well as information on the source spectrum for sensitivity
studies are sparse and highly discrepant. This limits defensible physics-based performance evaluations.
The same applies to holdup and criticality studies in which hydrated uranyl fluoride is the material of
interest which accumulates in enrichment facilities. In the future we anticipate that the physics
community will have made improved accelerator-based measurements and undertaken a more thorough
evaluation and adjustment of all relevant available data. But in the short term, this does not help the
safeguards community face the pressing real-world nondestructive assay requirements. To address this
need, we have performed quality neutron measurements on UF6 materials using well-known material and
high-capability neutron counters. A robust determination of the n/s/g of 234U in UF6 was generated along
with a scientifically defensible uncertainty analysis. The weighted average value of the neutron yield is
509 n/s/g234U with a random uncertainty of approximately 1%. Dominant sources of systematic
uncertainty are in the efficiency determination where we incur approximately 1.1% relative standard
deviation associated with the 252Cf reference source and about 0.9% uncertainty coming from the
uncertainty in the F(α,n) spectrum. The stated uncertainties are an order of magnitude better than current
data based on accelerator data reported in the literature. Aside from being of immediate and direct use by
the safeguards community, this result will serve as an enduring integral benchmark for subsequent data
evaluations that will need to match it in order to be credible. In addition to yield normalization,
safeguards users of F(α,n) data also need guidance of the neutron emission spectrum. We have generated
a neutron emission using a modified version of the well-known SOURCES 4C code, updated with new
alpha stopping power coefficients, and a blended microscopic cross section data set. The yield and spectra
are available in a form that MCNP users can readily use.
2
1. INTRODUCTION
Thick-target integrated over angle (α,n) yields and neutron emission spectra for special nuclear materials
in a variety of compounds are needed to help interpret nuclear safeguards measurements. For instance,
when natU is enriched using a method that exploits the mass difference between UF6 molecules, 234U is
also enriched in the product stream [1-4]. Consequently, the low enriched uranium (LEU) hexafluoride,
collected and stored in product cylinders prior to its processing into reactor fuel, is a relatively strong
source of F(α,n) driven predominately by 234U. Measurement of the neutron rate emerging from storage
cylinders is routinely used to verify their declared content. Even assuming commercial enrichment
facilities are optimized to closely approximate an ideal cascade, the 234U mass fraction enrichment as a
function of 235U mass fraction enrichment will still vary depending on the enrichment of the tails (which
is driven by economics) and the 234U content of uranium ores (which can vary over an approximate range
of 48 to 62 ppm) [1]. The natural variability in the 234U/238U atom ratio is attributed to 234U and 238U not
being in secular equilibrium [5] due to water leaching at radiation-damaged lattice sites. Neutron
measurements therefore also rely on isotopic composition data, either measured or based on a correlation
with enrichment.
Such measurements are an important part of the overall system of nuclear safeguards measures that are in
place to verify that enrichment facilities, and the materials they process are being used only for peaceful
purposes. This is important because in terms of separative work, LEU uranium hexafluoride is an
attractive feed material for the production of highly enriched uranium (HEU).
In contrast to the passive gamma signatures, which come mainly from the outermost surface or skin, the
emergent neutron intensity is more representative of the bulk content of the cylinder. Because of this, and
because passive neutron counting is simple and stable, neutron counting has long been recognized to be
an attractive nondestructive way to assay the amount of 235U present [6]. Although it is most common to
use direct neutron measurements [7], indirect neutron signatures such as the detection of capture gamma-
rays generated in steel are also viable [8]. Both techniques are candidate technologies for inclusion in
unattended cylinder verification stations at centrifuge enrichment plants [9].
We note that for similar reasons neutron counting is the preferred method for the measurement of uranium
holdup inventory in large components of gaseous diffusion cascades. In this case, uranyl fluoride
(UO2F2:nH2O), the reaction product of UF6 with moist air, is usually considered the compound of interest,
with F(α,n) being the principal source term. For the Oak Ridge Gaseous Diffusion Plant, the cascade
allowed for various arrangements, with feed and product withdrawal to occur at different locations and
3
with cell and unit bypass. As a result, 234U correlations based on sampling by building were developed
[2], although the question of what value to use for the n/s/g 234U remained [10] given the long-standing
inconsistencies in the knowledge of the F(α,n) cross section and yield curve in various compounds [11].
The purpose of our measurements is to support a science-based approach by measuring the specific (α,n)
yield, in neutrons per second per gram of 234U in UF6. To do this, we use two recognized safeguards
instruments: the Los Alamos National Laboratory (LANL) Mini-Epithermal Neutron Multiplicity Counter
(mini-ENMC) and the Oak Ridge National Laboratory (ORNL) Large-Volume Active Well Coincidence
Counter (LV AWCC) to measure a diverse collection of well-characterized small samples. The
instruments are efficiency calibrated using a National Institutes of Standards and Technology (NIST)
certified 252Cf source. An MCNP adjustment to the F(α,n) launch spectrum and items is made using
spectra taken from the literature as well as predicted by the SOURCES4C code [12]. Our initial goal was
to make a determination with a defensible uncertainty (1-σ) of less than about 2%. This is over an order
of magnitude better than the scatter in literature values (see review [11]). Three measurement campaigns
have been conducted. Here we will report results using only the LV AWCC from the first two campaigns
and for the items measured individually, as the other data are still being analyzed.
The present measurement also serves as a high-quality benchmark for future data evaluation which
combines thin target (differential), thick target, and integral information about the F(α,n) reaction.
2. ACHIEVEMENT OF PROJECT GOALS ON A TASK BY TASK BASIS
This section describes the work performed on the various tasks and the goals accomplished.
2.1 TASK 1: MEASUREMENT OF WELL-KNOWN UF6 ITEMS USING STANDARD NEUTRON COUNTERS
The purpose of our measurements was to support a science-based approach by measuring the specific
(α,n) yield, in neutrons per second per gram of 234U in UF6. To do this, two recognized safeguards
instruments were used to measure a diverse collection of well-characterized small samples: LANL Mini-
mini-ENMC and the ORNL LV AWCC. Several UF6 items of well-known enrichments and mass
loadings were measured. The ORNL LV AWCC is similar in design to the standard AWCC (Canberra
Industries Inc., model JCC-51 [13]) but has been scaled to a larger cavity diameter and uses higher
of 25.4 mm (1 inch) external diameter, 0.508 mm stainless steel wall thickness with a 3He partial pressure
of 4.5 atm at 25°C and 635 mm (25 inches) active length arranged in two concentric rings about an 11
inch diameter, 15 inch tall assay measurement cavity. For the measurements in this task, graphite end-
4
plugs were used with an internal 0.5 mm thick Cd layer. A photograph of the LV AWCC is shown in
Figure 1.
Figure 1. The ORNL LV AWCC.
The mini-ENMC has a split sample cavity that enables the counter to be configured as a well counter or
opened to accommodate samples larger than the measurement cavity. The outer dimensions of the mini-
ENMC are 56 cm by 56 cm by 89 cm high. The closed geometry sample cavity is 15.9 cm in diameter by
38 cm high. There are 104 3He tubes filled to 10 atmosphere pressure (52 in each half) arranged in four
concentric rings. The inner cavity is lined with cadmium, and cadmium also surrounds the outermost
ring. Figure 2 shows an MCNP drawing of the tube arrangement and the counter and a picture of the
counter in the open configuration.
5
Poly
Graphite
Helium-3
Tubes Air
Junction
Box
104 Tubes
Floor
56 cm
89 cm
Figure 2. Schematic drawings and picture of LANL mini-ENMC.
Various chemically pure UF6 items were counted several times, individually and in combination (some
were included in all three campaigns as an internal consistency check). This was done to include as much
non-controlled variation as possible into the data set so that the overall uncertainty is realistic. The
samples measured were three P-10 cylinders, each containing about 15 g of 90% enriched UF6; three 1-S
cylinders, each containing about 400 g of UF6 at 4.6% enrichment; and two 2-S cylinders of about 400 g
UF6 each, with enrichments of 2.7 and 4.6 % respectively; pseudo-hoke stainless steel items, New
Brunswick Laboratory (NBL) cylinders with LEU; and a depleted uranium (DU) keg. The items shown in
Figure 3 (from left to right) are, 1S cylinder, the NBL-22 cylinder, the NBL-7 cylinder, a pseudo-hoke
stainless steel item, two P-10 cylinders, and the DU keg. The purity, enrichment, and UF6 mass of each
item were accurately known by analytical chemistry methods. The items differed substantially in 234U
enrichment (for example three pseudo-hoke stainless steel items with 0.87, 1.4, and 2.2 at% 234U).
Multiple measurements were taken in two campaigns separated by a number of months, so that the
background and other effects were realistically sampled. The spontaneous fission and cosmic ray
spallation contributions for all samples were negligible. Further, the neutron signal was dominated by 234U-induced (α,n) reactions. The allowance for 235U plus 238U (α,n) contributions was only 2.8, 1.4, and 0.81 % in ascending order of 234U abundance. Collectively the items provided a check on the robustness
of the analysis.
6
Figure 3. Various items available for measurement. In the photograph the P-10 configurations are shown in the second column from the right, and an example of the Hoke container is the third column from the
right.
The mass loadings are given in Table 1.
Table 1. Mass loadings and enrichment of UF6 items.
Sum 1089.5 1045.1 44.371S-1 1729 1312.3 416.69 Ni or Monel 4.61481S-2 1761.1 1360.8 400.31 Ni or Monel 4.61481S-3 1758.7 1314.4 444.25 Ni or Monel 4.6148
Besides counting UF6 items by themselves, a NIST traceable 252Cf source was counted for the purposes of
determining the measured efficiency of the counter for the 252Cf energy spectrum.
7
2.2 TASK 2: BENCHMARKING MCNP EFFICIENCIES USING A NIST-CERTIFIED 252CF SOURCE
Recently it has been realized that absolute neutron coincidence counting (NCC) has the potential to
determine the neutron production rate in 252Cf sources to high accuracy. The ABsolute Californium
Determination (ABCD) method using NCC allows users to independently check the emission rate of a
certified source (which is always a good experimental practice), or, in some circumstances, perhaps even
self-certify a source at a similar or higher level of accuracy as a national metrology laboratory. The
primary reference source used in this work was FTC-CF-1830, and we adopted the emission rate
established by the U.S. National Institute of Standards and Technology (NIST) using their MnSO4 bath.
But as a check we undertook the absolute NCC measurement described in Appendix A. This is an
important aspect of the present UF6(α,n) measurement campaign because it independently confirms the
absolute scale of the measurements.
The limited objective of the present Cf-yield determination measurements was to provide an independent
check on the certificate provided by NIST for FTC-CF-1830, since this source was used to set the
absolute scale of our UF6(α,n) specific yield determination. We consider checking the purity and yield of
reference sources to be a good experimental practice in order to avoid unidentified error. Within the
combined overall uncertainties stated, our assessment agrees with the decay-corrected calculation, so we
have full confidence in the certificate value, which we have therefore adopted in the analysis of our
UF6(α,n) data. Several suggestions for improvements to the method of source strength measurement by
the ABCD method using NCC described here can be offered because, according to the uncertainty
analysis presented, the method is potentially capable of high accuracy, and our goal was not to approach
the ultimate accuracy limit. To do so it is necessary to pay particular attention to all experimental steps
and analysis details. The benefit of highly developing the ABCD technique for 252Cf sources would be
the resulting fillip it would provide to the entire applied neutron metrology community. Standardized
high-density polyethylene moderated arrays for use by standards laboratories would be complementary to
the established MnSO4-bath technique but are in many ways easier to set up, maintain, and operate.
Furthermore, it would be especially suitable for the weaker sources which challenge the detection limit of
the MnSO4 bath. NCC’s are extremely stable and well suited to also make relative comparisons of all
types of sources (not just 252Cf). We also extend the analysis to show how the detection efficiency can
also be estimated absolutely and directly using a small, sealed radionuclide 252Cf source.
The measured efficiency from the NIST-certified 252Cf source is used to determine the efficiency of the
neutron counter for 19F(,n) neutrons.
8
. (1)𝜀𝐹(𝛼,𝑛) = (𝜀𝐹(𝛼,𝑛)
𝜀𝐶𝑓252)𝑀𝐶𝑁𝑃∗ 𝜀𝐶𝑓252_𝑚𝑒𝑎𝑠𝑢𝑟𝑒𝑑
2.3 TASK 3: MCNP SIMULATION OF LV-AWCCC AND MINI-ENMC TO SELECT A SUITABLE NEUTRON SPECTRUM BY MATCHING THE RING RATIO DATA
The efficiency calculations were performed using the Monte Carlo code MCNP. The MCNP model for
the counters was updated to include UF6 source geometries of interest. The model captured the details of
the source(s) as well as any support structures such as a lab-jack that may have been used to locate the
item inside the counter well. In the MCNP model, as well as in the measurements, the 252Cf source was
attached to the given UF6 item at various locations (top, middle, bottom) and the variation in the
efficiency was estimated. In all cases, the variation in the efficiency was negligible and well within the
counting precision of a few tenths of a percent. Figure 4 and Figure 5 show the MCNP models of the LV-
AWCC and the mini-ENMC, with the 1S-monel UF6 item and the 252Cf source attached toward the top of
the item.
Figure 4. LV-AWCC with 1S-Monel UF6 cylinder. Figure 5. Mini-ENMC with 1S-Model UF6 cylinder.
The efficiency was measured for each configuration using a NIST-certified 252Cf spontaneous fission
source (S/N FTC-CF-1810). The spectrum for 252Cf neutrons was taken from the 71-energy-group
Mannhart evaluation [14]. The absolute emission rate of the source has a relative 1-σ uncertainty of about
9
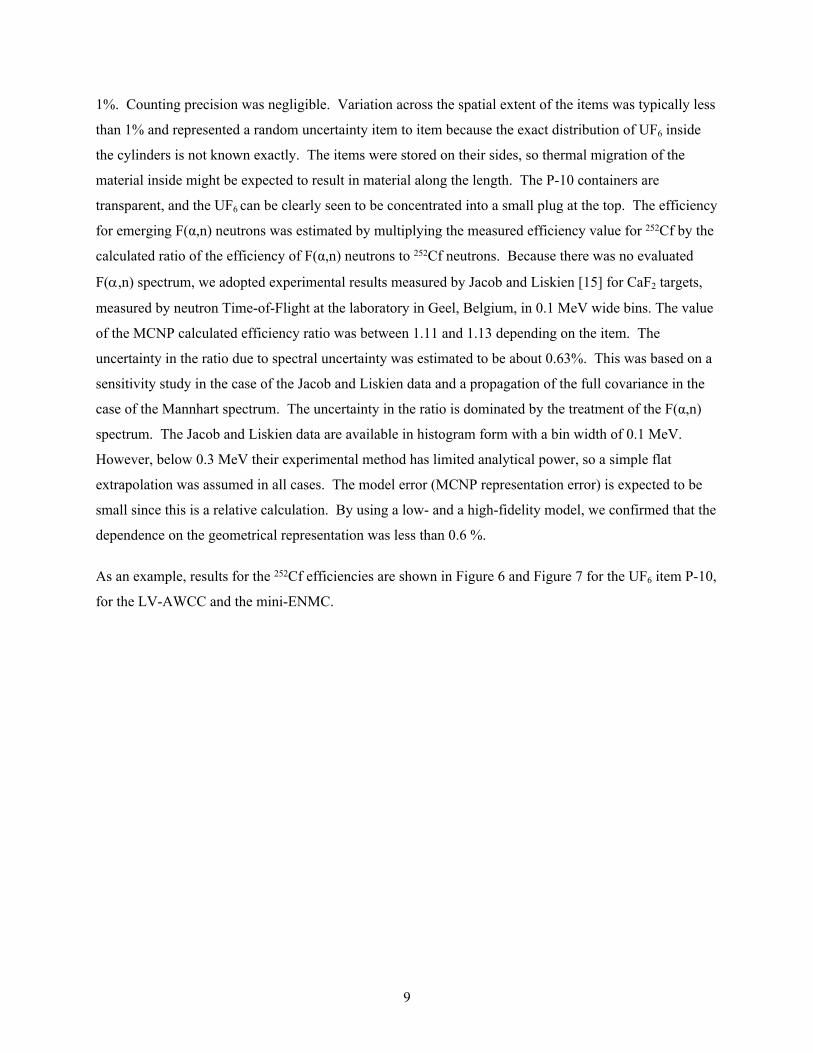
1%. Counting precision was negligible. Variation across the spatial extent of the items was typically less
than 1% and represented a random uncertainty item to item because the exact distribution of UF6 inside
the cylinders is not known exactly. The items were stored on their sides, so thermal migration of the
material inside might be expected to result in material along the length. The P-10 containers are
transparent, and the UF6 can be clearly seen to be concentrated into a small plug at the top. The efficiency
for emerging F(α,n) neutrons was estimated by multiplying the measured efficiency value for 252Cf by the
calculated ratio of the efficiency of F(α,n) neutrons to 252Cf neutrons. Because there was no evaluated
F(,n) spectrum, we adopted experimental results measured by Jacob and Liskien [15] for CaF2 targets,
measured by neutron Time-of-Flight at the laboratory in Geel, Belgium, in 0.1 MeV wide bins. The value
of the MCNP calculated efficiency ratio was between 1.11 and 1.13 depending on the item. The
uncertainty in the ratio due to spectral uncertainty was estimated to be about 0.63%. This was based on a
sensitivity study in the case of the Jacob and Liskien data and a propagation of the full covariance in the
case of the Mannhart spectrum. The uncertainty in the ratio is dominated by the treatment of the F(α,n)
spectrum. The Jacob and Liskien data are available in histogram form with a bin width of 0.1 MeV.
However, below 0.3 MeV their experimental method has limited analytical power, so a simple flat
extrapolation was assumed in all cases. The model error (MCNP representation error) is expected to be
small since this is a relative calculation. By using a low- and a high-fidelity model, we confirmed that the
dependence on the geometrical representation was less than 0.6 %.
As an example, results for the 252Cf efficiencies are shown in Figure 6 and Figure 7 for the UF6 item P-10,
for the LV-AWCC and the mini-ENMC.
10
Figure 6. MCNP Efficiencies for LV-AWCC for UF6 item P-10 – 252Cf Mannhart Energy Spectrum.
Figure 7. MCNP Efficiencies for mini-ENMC for UF6 item P-10 – 252Cf Mannhart Energy Spectrum.
11
The plots show the fractional number of events registered in the detector at each energy bin, not the
probability per unit energy. This is the reason for the apparent structure observed in Figure 6 and Figure
7. For the P-10 item, the LV-AWCC MCNP efficiency averaged over the normalized 252Cf Mannhart
energy spectrum ( ) is 0.3438 ± 0.0001 counts/neutron; i is the efficiency of the counter for the ∑71𝑖 = 1𝜀𝑖
fraction of neutrons in the i-th energy bin. The mini-ENMC MCNP efficiency for the same item is 0.6289
± 0.0001 counts/neutron. Uncertainties are sampling only at 1.
2.4 TASK 4: PROVIDE LAUNCH SPECTRUM OPTIONS FOR MODELING. IN ADDITION TO GUIDING THE CHOICE OF EFFICIENCY, THIS WILL BOUND THE EFFICIENCY UNCERTAINTY
It was noted earlier that because there is no evaluated F(,n) spectrum, we adopted experimental results
measured by Jacob and Liskien [15] for CaF2 targets, measured by neutron time-of-flight at the laboratory
in Geel, Belgium, in bins 0.1 MeV wide. By SOURCES4C calculation we showed that the difference
between CaF2 and UF6 targets is not important from the point of view of the emitted spectrum. Jacob and
Liskien provide data at 4, 4.5, 5 and 5.5 MeV incident alpha energy. We took the average of the 4.5 and
5 MeV spectra to be representative of that which would result from the 234U line spectrum (average about
4.76 MeV). We took the 4.5 MeV spectrum to be “soft” (mean energy 1.0 MeV) and the 5 MeV
spectrum to be “hard” (mean energy 1.12 MeV) and half the spread in calculated efficiency values to be
indicative of the uncertainty associated with the uncertainty. MCNP sampling statistics were small
(0.04% rsd) compared to the spectral uncertainty (0.67 to 0.77 % relative), which is the dominant
uncertainty in the relative efficiency estimate.
We adopt experimentally based spectra for the UF6 (α,n) spectrum, rather than the theoretically calculated
spectra of SOURCES4C, because calculating the spectrum requires (among other nuclear data but in
particular) detailed knowledge of the partial differential cross section, which is lacking [17]. The
situation is rather complicated, as has been summarized by Bell et al. [18], and their results and insightful
comments serve as a reminder not to accept model assumptions without some experimental verification
and validation. The threshold for the 19F(α,n)22Nag.s reaction is approximately 2363 keV, but even though
the 234U α-line spectrum is relatively soft (4774 keV with probability 0.714; 4722 keV with probability
0.284, and 4602 with probability 0.02), the first seven states of 22Na are energetically accessible. The
situation is summarized in Table 2.
12
Table 2. States accessible in 22Na by the 19F(α,n) reaction stimulated by 234U α-particles.
[Based on the List of Levels from www.nndc.bnl.gov]
factor of 2.68 is adopted. In this way the cross section is defined by 579 points from a threshold at
2.3635 MeV to 6.67 MeV. Above 6.67 MeV we extend the cross section to 9.92 MeV using 13 additional
points extracted from the thick-target measurements of Norman et al. [23, 24] scaled by a factor of 1.14.
We recognize that this approach is largely subjective and unsatisfactory since the individual data sets
appear to be fundamentally incompatible in both scale and shape (beyond resolution differences). And
we note the very large (non-unity) scaling factors needed to join the different data sets smoothly, that is,
to stich them together on the scale defined by Peters et al. [19]. The result is shown is Figure 8. Note that
this is the total cross section but tells nothing about the differential partial cross sections, which are
needed to make spectral calculations (based on two-body reaction kinematics). At the present time it is
common practice to turn to theoretical statistical model calculations for guidance on how to roughly
partition the total cross section. This discussion emphasizes that a considerable amount of work remains
to be done.
Performing the yield-curve integration using simple panel integration on the energy grid of the cross
section data results in the yield curves, as shown in Figure 9. For the present discussion we have
deliberately limited the plot to show only the energy range relevant to 234, 235, 238U α-particles. Plutonium
materials and other measurement problems extend this range of interest. Also shown in the plot is the
yield curve adopted in prior work [25] updated to SRIM-2013 stopping cross sections. The current curve
shows a finer structure. Spectral changes might also be anticipated.
0
100
200
300
400
500
600
2 3 4 5 6 7 8 9 10
Blended F(α,n) Cross Section
Incident α-particle energy [MeV]
F(α,
n) c
ross
sect
ion
[mb]
Figure 8. Blended microscopic 19F(α,n) cross section σ(E) in mb as a function of incident α-particle energy in the laboratory frame, E, in MeV.
14
0
1
2
3
2 3 4 5
Current
Prior
Incident α-particle energy [MeV]
Neu
tron
yie
ld p
er
mill
ion
α-pa
rtic
les
Figure 9. Calculated thick-target integrated over angle yield curve Y(E) in units of neutrons per million α-particles as a function of energy E, in MeV. The curve labelled “Current” is the result of the present work.
The curve labelled “Prior” is based on an earlier estimate [25] that relies on the yield data of PbF2 by Norman et al. [23–24] reanalyzed using SRIM-2013 stopping cross sections.
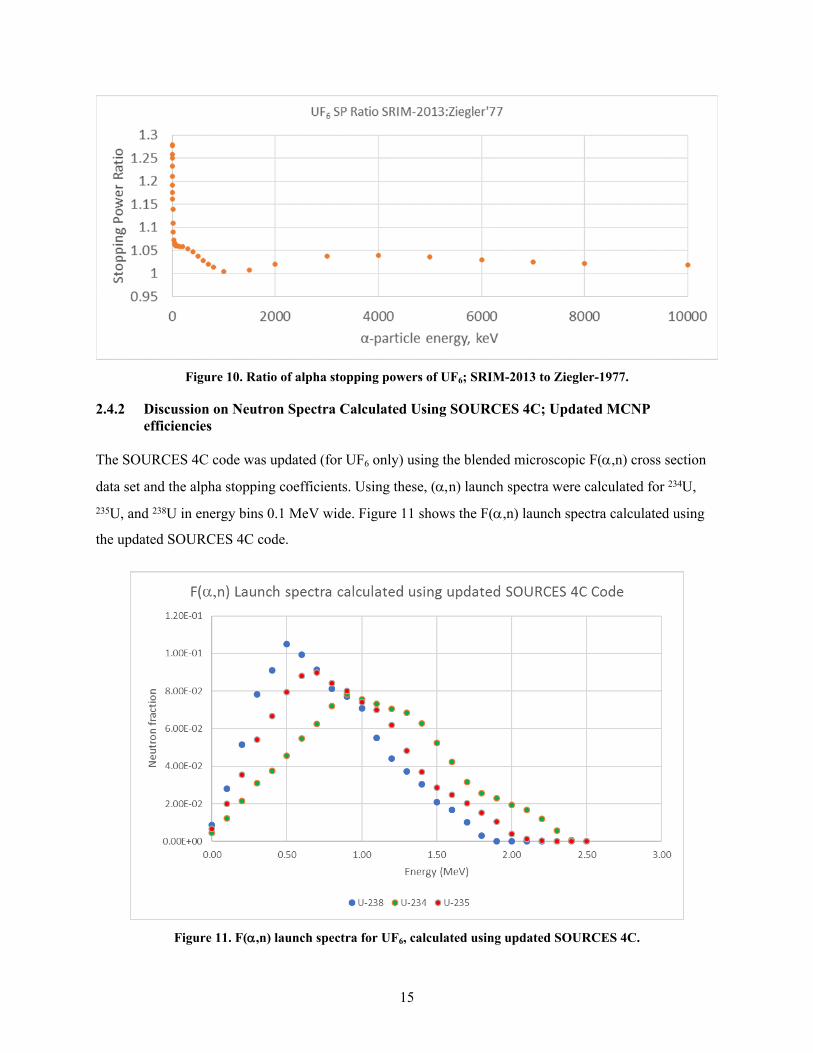
We highlight the impact of different stopping power tables and prescriptions. SOURCES 4C uses
stopping powers from Ziegler (1977) [20]. In our work we have adopted SRIM-2013.These different data
sources are by the same group. Figure 10 shows the ratio of the alpha stopping power for UF6 computed
using SRIM-2013 divided by the same quantity calculated using the Ziegler’77 algorithm. In the energy
range of interest (above the threshold at 2.36 MeV and up to the alpha launch energies from U), the
deviation from unity is on the order of 3%. This means that by using the same F(,n) microscopic cross
section data the computed thick-target yields would be about 3% lower when using SRIM-2013 stopping
powers. Our present experimental accuracy for the 234U in UF6 yield is sub 2%, so it is clear updates to the
SOURCES 4C code are needed. This also emphasizes the need to measure the yield from different
compounds directly and to measure stopping powers in compounds of interest directly, because
undoubtedly there will be a bias in SRIM-2013 in addition to binding and additivity assumption errors.
15
Figure 10. Ratio of alpha stopping powers of UF6; SRIM-2013 to Ziegler-1977.
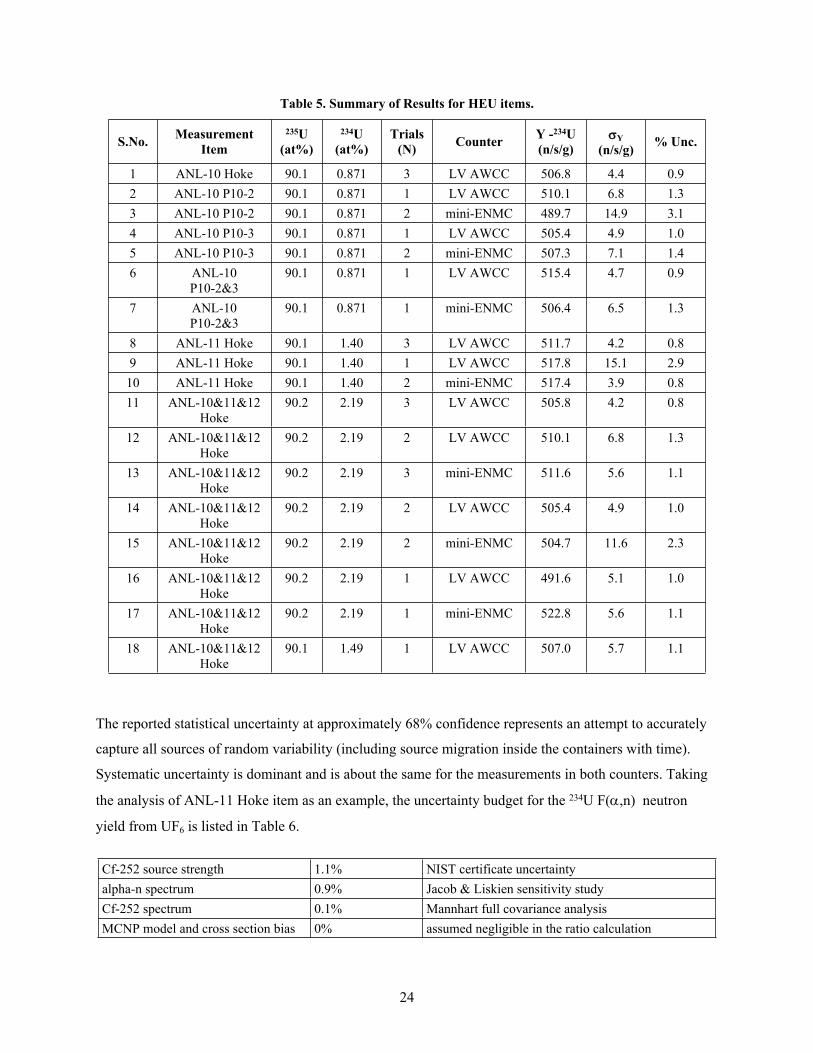
2.4.2 Discussion on Neutron Spectra Calculated Using SOURCES 4C; Updated MCNP efficiencies
The SOURCES 4C code was updated (for UF6 only) using the blended microscopic F(,n) cross section
data set and the alpha stopping coefficients. Using these, (n) launch spectra were calculated for 234U, 235U, and 238U in energy bins 0.1 MeV wide. Figure 11 shows the F(,n) launch spectra calculated using
the updated SOURCES 4C code.
Figure 11. F(,n) launch spectra for UF6, calculated using updated SOURCES 4C.
16
The 234U F,n) neutron energy spectrum calculated using the updated SOURCES 4C code was compared
with the measured spectra for CaF2 reported by Jacob and Liskien [15], as show in Figure 12.
Figure 12. 234U F(,n) spectrum calculated using updated SOURCES 4C vs measured spectra for CaF2 [15].
The SOURCES 4C spectrum is bounded by the measured CaF2 F(,n) spectra corresponding to alpha
energies of 4.5 MeV and 5.0 MeV. It was mentioned earlier that below 0.3 MeV Jacob and Liskien’s
experimental method has limited analytical power, so a simple flat extrapolation was assumed in all cases.
This is evident in Figure 11. One also cannot say with confidence that the SOURCES 4C spectrum is
more truthful, since it was calculated based on a blended cross section set. The SOURCES 4C
calculations have some shortcomings that need to be addressed as well. For example, the (,n) spectra are
calculated using an assumed isotropic angular distribution in the center-of-mass system. A blended set of
microscopic cross sections had to be used since a comprehensive set of thin target microscopic cross
sections spanning the entire energy range of interest was not available.
The 234U F(n) spectrum from UF6 calculated using the “initial” (or un-updated) version of
SOURCES 4C was compared with the 234U F(n) spectrum calculated using the updated version of
SOURCES 4C. The results are given in Figure 13, and in Table 3.
17
Figure 13. Comparison of 234U F(,n) spectrum calculated using the initial (un-updated) and updated versions of SOURCES 4C.
Even though the spectra in Figure 13 appear to be close visually, there are differences exceeding 20%
between the neutron fractions in some of the energy groups (Table 3).
The average energy of the spectra was very close, however; the initial spectrum was 1.1310 MeV, and the
spectrum generated using the updated SOURCES 4C code was 1.1306 MeV.
Efficiency calculations were performed using MCNP and the SOURCES 4C (,n) spectra for single
items, as well as multiple items of the same type counted using the LV-AWCC and the mini-ENMC. The
efficiencies for single versus multiple items (e.g., One 1S Monel Cylinder versus Three 1S Monel
Cylinders) were very close. Efficiency calculations for single and multiple items (of the same type) were
also performed using the 238U spontaneous fission spectrum taken from Terrell and 252Cf spontaneous
fission spectrum taken from Mannhart.
18
Table 3. Ratio of Initial vs. updated 234U F(,n) Spectra as a function of energy (average of 0.1 MeV wide bins).
As an example, in Figure 14 and Figure 15, we illustrate the MCNP efficiencies for the Hoke cylinder
ANL-11, calculated using the 234U F(,n) spectrum calculated using the updated version of
SOURCES 4C. Also shown are the efficiencies corresponding to the measured Fn) spectra from Jacob
and Liskien [15] at alpha energies of 4.5 MeV and 5.0 MeV. The efficiencies for LV-AWCC and the
mini-ENMC are shown for the same item. For both counters, the efficiencies from Jacob and Liskien
bound the efficiencies corresponding to UF6 calculated using updated SOURCES 4C.
19
Figure 14. LV-AWCC MCNP efficiencies for UF6 item Hoke ANL-11, calculated using 234U F(n) launch spectrum from updated SOURCES 4C code; also shown are efficiencies using measured F,n) spectra from
Jacob and Liskien [15], corresponding to alpha energies of 4.5 MeV and 5.0 MeV.
Figure 15. LV-AWCC MCNP efficiencies for UF6 item Hoke ANL-11, calculated using 234U F(n) launch spectrum from updated SOURCES 4C code; also shown are efficiencies using measured F(,n) spectra from
Jacob and Liskien [15], corresponding to alpha energies of 4.5 MeV and 5.0 MeV.
20
The efficiencies of Hoke ANL-11 UF6 item are tabulated in Table 4.
Table 4. LV-AWCC and mini-ENMC MCNP efficiencies for Hoke ANL-11 UF6 item.
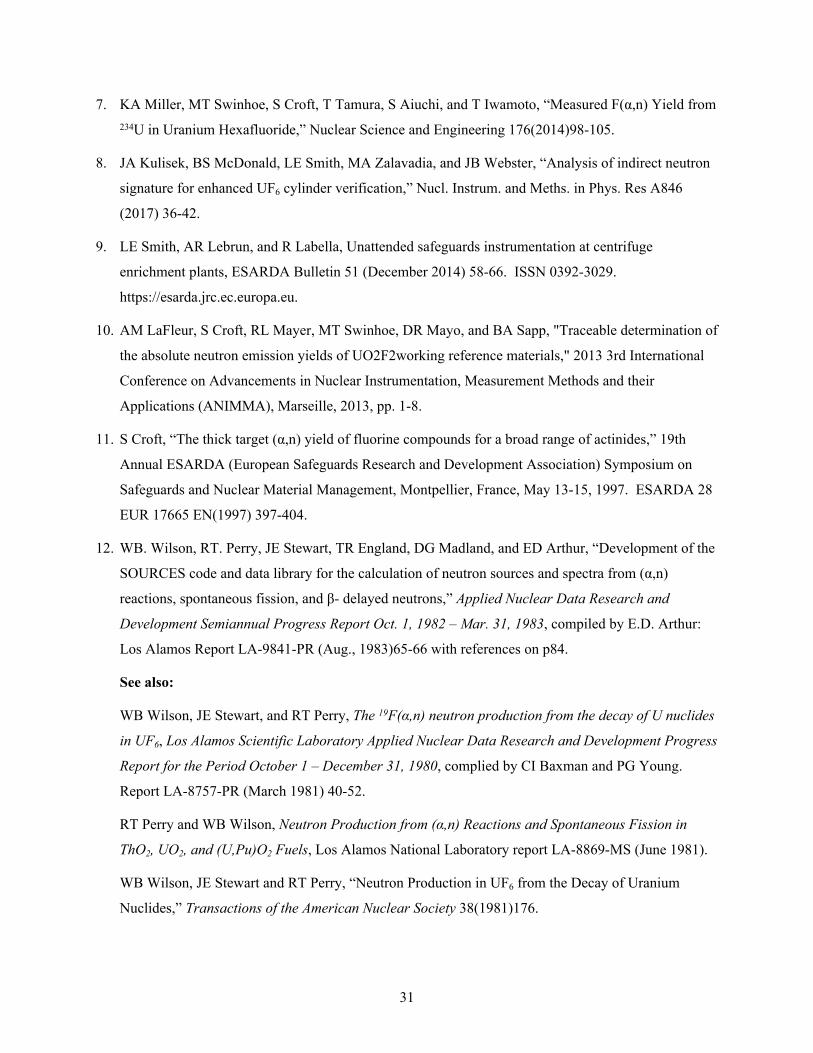
The reported statistical uncertainty at approximately 68% confidence represents an attempt to accurately
capture all sources of random variability (including source migration inside the containers with time).
Systematic uncertainty is dominant and is about the same for the measurements in both counters. Taking
the analysis of ANL-11 Hoke item as an example, the uncertainty budget for the 234U F(,n) neutron
yield from UF6 is listed in Table 6.
Cf-252 source strength 1.1% NIST certificate uncertaintyalpha-n spectrum 0.9% Jacob & Liskien sensitivity studyCf-252 spectrum 0.1% Mannhart full covariance analysisMCNP model and cross section bias 0% assumed negligible in the ratio calculation
25
Positional uncertainties are automatically taken into account case by case in the analysis and contribute in
the spread of the results when items are measured repeatedly within a campaign and across campaigns
with the same or different detectors.
It is not our intention here to provide a detailed review of the literature or make a comprehensive
comparison to other works, but we note that a commonly used value in nuclear safeguards is that
recommended by Sampson [27] of 576±42 n/s/g 234U in UF6. Recently two estimates based on field
measurements of collections of large commercial storage at enrichment plants have been reported [28].
Miller et al. [7] found a value of 474±21 n/s/g 234U was consistent their observations, while Kulisek et al.
[8] gives a value of 503 n/s/g 234U derived from 219 cylinders ranging from natural to 5 wt% of known 234U abundance. The standard deviation across the measurements (excluding clear outliers) is 2.6%.
Benchmarking of the Monte Carlo model using 252Cf is good to about 2%. It is hard to estimate other
uncertainty contributions including the allowance for non-234U α-induced neutrons, which depends on
enrichment. However, an overall uncertainty on the order of 4% at 1-σ would seem plausible based on
the description of the measurements. We consider the agreement between the field data and our
laboratory-based measurements to be extremely good.
In addition to HEU items, LEU items and a DU item were also measured. Table 6 gives the results from
the LEU items IS Monel, NBL-22, and NBL-7, and the DU item.
Table 6. Results summary for LEU and DU UF6 items.
In Table 6, the average neutron yield from the 1S items is greater than the weighted mean value from the
HEU items by approximately 4.5%. One possible reason for the systematically high value of the neutron
yield could be the contribution from the spontaneous fission of 238U, as well as 238U F(,n) neutrons. A
correction factor is being calculated to account for these contributions. The neutron yield from the LEU
item NBL-7 is within 2 of the uncertainties with respect to the yield from the HEU items, but the results
for the NBL-22 LEU items is biased low by 9.4%. The reason for this bias is being investigated. The 234U 19F(n) neutron yield result for the DU keg is clearly an outlier when compared with the HEU and LEU
results. We are investigating the reasons for this significant positive bias.
2.6 TASK 6: COLLABORATE WITH LANL IN CREATING PRESENTATIONS, GENERATING PUBLICATIONS, AND IN COMMUNICATION AND ARCHIVING OF RESULTS
A paper titled “The Specific (α,n) Production Rate for 234U in UF6” was presented at the SORMA
conference held in Ann Arbor from June 11–14, 2018. After a peer review, the paper was published the
journal Nuclear Instruments and Methods in Physics Research A.
Additionally, a paper titled “Status of (α,n)-reaction data for nuclear safeguards” was presented at the
INMM 2018 conference and was published in the proceedings. The authors of both the papers are
Stephen Croft (ORNL), Andrea Favalli (LANL), Glenn Fugate (ORNL), Robert McElroy (ORNL),
Angela Simone (University of Tennessee), Martyn Swinhoe (LANL), and Ramkumar Venkataraman
(ORNL).
Besides collaboration on these publications, ORNL and LANL scientists worked closely developing the
MCNP models of UF6 item geometries for efficiency calculations, planning and performing
measurements using the mini-ENMC neutron counter, and discussing the results obtained.
2.7 TASK 7: THOROUGH DOCUMENTATION AND REPORTING OF THE DELIVERABLES—PROVIDE QUARTERLY REPORTS AND END-OF-YEAR REPORT
Quarterly reports were provided for all quarters of FY 2018, and for the first two quarters of FY 2019. A
one page summary was prepared for inclusion in NA-22 Annual Report. An end-of-the-year report will be
provided, capturing all the work that was performed and the deliverables.
2.8 TASK 8 (LANL): PERFORM MEASUREMENTS USING THE LANL ENMC AND THE SAME UF6 SOURCES THAT WERE MEASURED WITH LV-AWCC. THE LANL ENMC WILL BE SHIPPED TO ORNL. LANL PHYSICIST ANDREA FAVALLI WILL SET UP AND PERFORM MEASUREMENTS AT ORNL. THE MEASUREMENTS WILL BE
27
USED TO DIRECTLY DETERMINE THE SPECIFIC NEUTRON YIELD (NEUTRONS/SEC/GRAM) OF 234U.
The mini-ENMC was shipped from LANL to ORNL in Q2 of FY 2018. LANL scientist Dr. Andrea
Favalli visited ORNL in January 2018 and participated in measurements of UF6 items using the mini-
ENMC. All the UF6 items that were counted using the LV-AWCC were also counted using the mini-
ENMC. The MCNP model of the mini-ENMC was updated to include the UF6 item geometries of
interest. All the MCNP efficiency calculations were performed using the mini-ENMC model as well. Data
reduction was performed.
2.9 ADDITIONAL TASK
The methods and concepts developed in this work can be applied to investigating other (n) reactions
that are of interest in nuclear safeguards applications, e.g., O (n). The PI on the current project,
Dr. Stephen Croft, has supported the work done on O(,n) reaction [29], [30], [31], [32].
3. CONCLUSIONS
The purpose of our measurements was to support a science-based approach by measuring the specific
(α,n) yield in neutrons per second per gram of 234U in UF6. To do this, two recognized safeguards
instruments— the LANL Mini-ENMC and the ORNL LV AWCC—were used to measure a diverse
collection of well-characterized small samples. The instruments are efficiency calibrated using a National
Institutes of Standards and Technology (NIST)–certified 252Cf source. A Monte Carlo transport code
(MCNP)–based adjustment to the F(α,n) launch spectrum and items was made using spectra taken from
the literature as well as those predicted by the SOURCES4C code. Efficiency calculations using MCNP
were completed for a variety of UF6 items in the LV-AWCC and the LANL mini-ENMC counters. The
efficiencies from MCNP were compared against measured efficiencies using the NIST-calibrated 252Cf
source FTC-1830. An agreement of better than a few tenths of a percent was obtained. The efficiency for
n) neutrons was then obtained by multiplying this by the ratio of (n) to 252Cf efficiencies (calculated
using MCNP). For the MCNP calculations, the evaluated 252Cf fission spectrum of Mannhart was used.
This is available in 71 groups and has a full covariance matrix. The systematic uncertainty associated with
the uncertainty in the shape of the spectrum was estimated by propagating the full covariance matrix
generated by Mannhart for the 71 energy-group representation. The code SOURCES 4C was used to
predict the (n) energy spectrum. The SOURCES 4C code makes use of thin target data, a nuclear model
for energetics, and stopping power data. SOURCES 4C was updated for this case alone, namely,234U 19F(,n) yields from UF6. The alpha stopping powers were calculated using the code SRIM, and
28
coefficients of the polynomial fits were calculated. SOURCES 4C code was updated using the alpha
stopping powers and the microscopic cross sections available to ORNL from a previous NA-22 project. In
this project we built-in benchmarks based on measurements we took, or measurements available in the
literature, in order to validate calculations (MCNP and other). The weighted mean of the neutron yield,
based on the HEU items that were measured, is 509.5 ± 1.3 n/s/g 234U (or ± 0.25% uncertainty). The
uncertainty in the weighted mean does not include systematic uncertainties. For HEU items, the dominant
sources of uncertainty are efficiency determination, approximately 0.9% relative standard deviation,
associated with the 252Cf reference source and an additional about 1.1% systematic uncertainty coming
from the uncertainty in the F(α,n) spectrum. For the 1S Cylinder LEU items that were measured (4.6% 235U abundance), the 234U F(n) yields are 4.5% higher on average when compared with the yield from
the HEU item. For the NBL22 LEU items, which are also 4.6% enriched in 235U, the 234U F(,n) yields
are biased low by about 9.4% with respect to the yield from the HEU item. The yield averaged over the
results from the two sets of items, both 4.6% enriched, is 496 n/s/g. The reason for the spread is not
known. The result for the DU item is high by 40%. This is clearly an outlier compared to the HEU and
LEU results. Indications are, based on neutron coincidence counting, that the book value for the mass is
understated. We are investigating the reasons for these biases and will apply appropriate corrections. The
updated SOURCES 4C code is available to the safeguards community and beyond from the Radiation
Safety Information Computational Center (RSICC) at ORNL, which is a repository for computer codes
used in the field of nuclear technology. The 234U 19F(,n) yield from UF6 established in this project will
be shared with the NDA Working Groups associated with the Institute of Nuclear Material Management
(INMM) and the European Safeguards Research and Development Association (ESARDA). The updated
yield and the publications related to this work will be included in the next revision of the relevant ASTM
C26.10 and ANSI N15 standards.
4. FUTURE WORK
Accurate (α,n) yields and spectra of actinide compounds are required to support a range of different
applications including basic nuclear physics, neutron background and activation estimation, nuclear waste
characterization, dosimetry and health physics, nondestructive mass assay of fresh and used nuclear fuel,
nuclear safeguards, and materials control and accountancy. From an applications perspective, the thick-
target integrated over angle yield curve is perhaps the most important function. This can be measured
directly using continuous α-beams using a flat (efficiency in energy) 4π neutron detector or via associated
activation techniques where applicable. Alternatively, it can be calculated from a thin target (microscopic
data). Except in the case of UO2, trusted measurements have not been made on actinide compounds of
29
interest but are made on other materials. Often the detection systems deployed do not provide as
complete a coverage as one would like. Scaling between materials incurs an additional error that needs to
be quantified, especially with regard to stopping powers and the Bragg-Kleeman mixing rule. The
experimental data generally show scatter that is far greater than claimed by the reporting researchers.
This could be in part due to unrecognized bias arising from changing detection efficiency as the α-energy
sweeps over thresholds and resonances. A concerted experimental effort is needed to resolve the
discrepancies in the literature; otherwise, performing meaningful first-of-a-kind data evaluations for
charged particle reactions for technological applications is seriously hampered. High-quality benchmark
and comparison data of high accuracy are also needed to validate and, in some cases, normalize
accelerator measurements. Knowledge of emitted neutron energy spectra is especially patchy yet much
needed. Calculations rely on differential partial cross sections which are difficult to determine and cannot
be calculated from first principles with present tools to the required accuracy. Pulse beam time-of-flight
measurements as a function of angle off thick targets are therefore recommended as the first step. Again,
complementary measurements on stable homogenous actinide compounds using a variety of
spectrometers are needed for purposes of validation.
30
5. REFERENCES
1. GS Solov’ev, AV Saprygin, VV Komarov, and AI Izrailevich, 234U content in enriched uranium as a
function of the 234U concentration in the initial material, Atomic Energy 95(1) (2003) 473-475.
Translated from Atomnaya Énergiya 95(1) (July 2003) 32-34.
2. KD Kimball, Recommendations of 235U/234U ratios and alpha-neutron yields for the K-25/K-27 D&D
5. Z Zarpas, A Lorber, H Sela, O Paz-Tal, Y Hagag, P Kurttio, and L Salonen, “Measurement of the
234U/238U ratio by MC-ICPMS in drinking water, hair, nails, and urine as an indicator of urine
exposure source,” Health Physics 89(4) (2005) 315-321.
6. RB Walton, TD Reilly, JL Parker, JH Menzel, ED Marshall, and LW Fields, Measurements of UF6
cylinders with portable instruments, Nuclear Technology 21(February 1974)133-148. These authors
use a value of 460 n/s/g 234U and relative yield per alpha factors of 0.56, 0.75 and 0.38 for 235U, 236U
and 238U, respectively. The reference for these values is TD Reilly, JL Parker, AE Evans, and RB
Walton, “Uranium enrichment measurements on UF6 product cylinders,” in Nuclear Safeguards
Research and Development Progress Report May-August 1971, Los Alamos Scientific Laboratory
report LA-4794-MS(1971)16-19. These authors determined experimentally the UF6(α,n) n/s/g 234U
by counting with a neutron slab detector the emission of three type 5A cylinders of differing 234U
enrichment (0.10, 0.52, and 0.75 %). Few details are provided, and no uncertainty analysis is
provided, although an allowance for self-multiplication was made. The relative yield per alpha
factors seems to have been based on data taken from E Amaldi, Handbook der Physik, Vol.
XXXVIII/2, p.109. Note Reilly et al. credit JL Feuerbacher with the original concept of total neutron
counting to assay bulk UF6.
31
7. KA Miller, MT Swinhoe, S Croft, T Tamura, S Aiuchi, and T Iwamoto, “Measured F(α,n) Yield from 234U in Uranium Hexafluoride,” Nuclear Science and Engineering 176(2014)98-105.
8. JA Kulisek, BS McDonald, LE Smith, MA Zalavadia, and JB Webster, “Analysis of indirect neutron
signature for enhanced UF6 cylinder verification,” Nucl. Instrum. and Meths. in Phys. Res A846
(2017) 36-42.
9. LE Smith, AR Lebrun, and R Labella, Unattended safeguards instrumentation at centrifuge
10. AM LaFleur, S Croft, RL Mayer, MT Swinhoe, DR Mayo, and BA Sapp, "Traceable determination of
the absolute neutron emission yields of UO2F2working reference materials," 2013 3rd International
Conference on Advancements in Nuclear Instrumentation, Measurement Methods and their
Applications (ANIMMA), Marseille, 2013, pp. 1-8.
11. S Croft, “The thick target (α,n) yield of fluorine compounds for a broad range of actinides,” 19th
Annual ESARDA (European Safeguards Research and Development Association) Symposium on
Safeguards and Nuclear Material Management, Montpellier, France, May 13-15, 1997. ESARDA 28
EUR 17665 EN(1997) 397-404.
12. WB. Wilson, RT. Perry, JE Stewart, TR England, DG Madland, and ED Arthur, “Development of the
SOURCES code and data library for the calculation of neutron sources and spectra from (α,n)
reactions, spontaneous fission, and β- delayed neutrons,” Applied Nuclear Data Research and
Development Semiannual Progress Report Oct. 1, 1982 – Mar. 31, 1983, compiled by E.D. Arthur:
Los Alamos Report LA-9841-PR (Aug., 1983)65-66 with references on p84.
See also:
WB Wilson, JE Stewart, and RT Perry, The 19F(α,n) neutron production from the decay of U nuclides
in UF6, Los Alamos Scientific Laboratory Applied Nuclear Data Research and Development Progress
Report for the Period October 1 – December 31, 1980, complied by CI Baxman and PG Young.
Report LA-8757-PR (March 1981) 40-52.
RT Perry and WB Wilson, Neutron Production from (α,n) Reactions and Spontaneous Fission in
ThO2, UO2, and (U,Pu)O2 Fuels, Los Alamos National Laboratory report LA-8869-MS (June 1981).
WB Wilson, JE Stewart and RT Perry, “Neutron Production in UF6 from the Decay of Uranium
Nuclides,” Transactions of the American Nuclear Society 38(1981)176.
32
W.B Wilson and RT Perry, Thick-Target Neutron Yields in Boron and Fluorine, Los Alamos
National Laboratory memorandum T-2-M-1835 to N. Ensslin (1987).
IC Gauld, EF Shores, and RT Perry, “New neutron source algorithms in the ORIGEN-S code,” paper
presented at American Nuclear Society/Radiation Protection & Shielding Division, 12th Biennial
RPSD Topical Meeting, April 14-18, 2002, Santa Fe, New Mexico.
13. H Menlove, Description and Operation Manual for the Active Well Coincidence Counter, Los
Alamos National Laboratory, report LA-7823-M, Los Alamos National Laboratory, Los Alamos,
NM, 1979.
14. W. Mannhart, “Evaluation of the Cf-252 fission neutron spectrum between 0 MeV and 20 MeV,” in
Properties of Neutron Sources, IAEA TECDOC-410(Vienna, March 1987)158-171.
15. GJH Jacobs and H Liskien, “Energy Spectra of Neutrons Produced by α-Particles in Thick Targets of
Light Elements,” Annals of Nuclear Energy 10(10) (1983) 541-552.
See also:
W Mannhart, “Status of the Cf-252 fission-neutron spectrum evaluation with regard to recent
experiments,” in Physics of Neutron Emission in Fission, HD Lemmel (Editor), IAEA INDC(NDS)-
220 (June 1989) 305-336.
W Mannhart, “Data fitting and evaluation techniques for neutron spectra,” in International
Symposium on Nuclear Data Evaluation Methodology, C.L. Dunford (Editor), World Scientific
Publishing Co. Pte. Ltd. (1993) 247-256. ISBN 981-02-1285-2.
J Terrell, “Prompt neutrons from fission,” Proc. Symp. Phys. & Chem. of fission, Salzburg, IAEA,
Vienna, Vol. 2 (1965) 3-24.
16. J Campbell and G Spriggs, “Recommended relative abundances and energy spectra for the eight time-
group representation,” Appendix 3 of Delayed neutron data for the major actinides, a report by the
working party of international evaluation co-operation of the NEA nuclear science committee, NEA
OECD report NEA/WPEC-6(2002).
17. V Benji and D Mostacci, “Neutrons from (α,n) reactions in uranium hexafluoride,” Applied Radiation
and Isotopes 48(2) (1997) 213-214.
18. ZW Bell, K-P Ziock, MF Ohmes, Y Xu, T Downar, and SA Pozzi, “Measurement of neutron yields
from UF4,” IEEE Trans on Nucl Sci 57(4) (August, 2010) 2239-2246.
33
19. W.A. Peters et al., A kinematically complete interdisciplinary and co-institutional measurement of the 19F(α,n) cross section for nuclear safeguards science, Idaho National Laboratory Report INL/EXT-
16-38791.
20. JF Ziegler, JP Biersack, and MD Ziegler, SRIM The Stopping and Range of Ions in Matter (SRIM
Co., 2008) ISBN-13: 978-0-9654207-1-6, available from www.SRIM.org.
21. M Balakrishnan, S Kailas, and MK Mehta, “A study of the reaction 19F(α,n)22Na in the bombarding
energy range 2.6 to 5.1 MeV,” Pramāna 10(3) (1978) 329-339.
22. PR Wrean and RW Kavanagh, “Total cross sections and reaction rates for 19F(α,n)22Na, 22Ne(p,n)22Na, and their inverses,” Phys. Rev. C62, 055805 (2000). See also PR Wrea, 19F(α,n)22Na, 22Ne(p,n)22Na, and the role of their inverses in the destruction of 22Na, PhD Dissertation, California
Institute of Technology, Pasadena, California, USA (1998).
23. EB Norman, TE Chupp, KT Lesko, PJ Grant, and GE Woodruff, “22Na Production Cross Sections
from the 19F(α, n) Reaction,” Phys. Rev. C 30, 1339 (1984).
24. EB Norman, TE Chupp, KT Lesko, PJ Grant, and GE Woodruff, “19F(α,n) thick target yield from 3.5
to 10.0 MeV,” Applied Radiation and Isotopes 103 (2015)177-178.
25. S Croft, “The thick target (α,n) yield of fluorine compounds for a broad range of actinides,” 19th
Annual ESARDA (European Safeguards Research and Development Association) Symposium on
Safeguards and Nuclear Material Management, Montpellier, France, May 13-15, 1997. ESARDA 28
EUR 17665 EN(1997)397-404.
26. HG Huges, “Uncertainties beyond statistics in Monte Carlo simulations,” Radiation Protection
Dosimetry 126(1-4) (2007) 45-51.
27. TE Sampson, “Neutron yields from uranium isotopes in uranium hexafluoride,” Nucl Sci & Engin
54(4) (1974) 470-474.
28. GC-Y. Chan, JD Valentine, and RE Russo, Towards novel field-deployable instrumentation for UF6
enrichment – an overview of existing and emerging technologies, ESARDA Bulletin 54 (June 2017)
[A-2] D. Henzlova, A. Favalli, and S. Croft, “In-Depth Evaluation of 252Cf Absolute Calibration by
Passive Neutron Correlation Counting Method. Metrologia,” accepted for publication.
[A-3] A. S. Moore, S. Croft, R. D. McElroy Jr., and J. P. Hayward, “Methods for Diagnosing and
Quantifying Double Pulsing in a Uranium Neutron Collar System Using Shift Register Logic,”
Nucl. Instrum. Meths. Phys Res. A, submitted (2019).
[A-4] S. Cox, P. Fields, A. Friedman, R. Sjoblom, and A. Smith, “Delayed neutrons from the
spontaneous fission of 252Cf,” Phys. Rev. 112(3) (1958) 960-963.
[A-5] A. Smith, P. Fields, A. Friedman, S.A. Cox, and R. Sjoblom, An experimental study of fission in
the actinide elements, Proc. 2nd International Conference on the Peaceful Uses of Atomic Energy,
United Nations, NY. A/CONF.15/P/690(June 1958) 12pp.
[A-6] S. Croft, A. Favalli, and R.D. McElroy Jr., “A review of the prompt neutron nu-bar value for 252Cf spontaneous fission,” Nucl. Instrum. Meths. Phys Res. A, in press.
[A-21] S. Croft and A. Favalli, “Extension of the Dytlewski-style dead time correction formalism for
neutron multiplicity counting to any order,” Nucl. Instrum. Meths Phys. Res. A869 (2017) 141-
152.
[A-22] R. Weinmann-Smith, S. Croft, M.T. Swinhoe, and A. Enqvist, Changes to the 252Cf neutron
spectrum caused by source encapsulation, ESARDA Bulletin, Issue 54 June 2017 pp44-53. ISSN
0392-3029.
APPENDIX B. RADIOLYSIS
B-3
APPENDIX B. RADIOLYSIS
Considerable information on the properties of UF6, particularly about its safe handling, conversion,
enrichment, and fuel fabrication, can be found in [B-1]]. Long-term stability is of concern since, as we
are reminded by NRC [B-2], UF6 is dynamic substance even when thermal processes can be ignored
because chemical reactions can be induced by ionizing radiation via the process known as radiolysis.
Consequently, one can expect a slow and spontaneous dissociation or decomposition of highly enriched
UF6 due to the self-irradiation by 234U α-particles [B-3]. It is well known that for the actinides, energy
deposition is dominated by α-tracks [B-4]. It has also been suggested that α-particles in bulk UF6 are
considerably more effective for a given amount of energy deposited at breaking chemical bonds [B-2]
than other forms of ionizing radiation (e.g. x-, γ- and β-rays). Trowbridge et al. [B-5] in Table 2 on page
p. 19 of [B-5], which refers to Saraceno on page 26 of [B-6], summarize fluoride radiolysis of uranium
fluorides and Molten Salt Reactor Experiment (MSRE) salts. They give the radiation chemical yield, G,
value of 1.5 molecules of fluorine, F2, produced per 100 eV of absorbed radiation for α-radiation in solid
UF6. The corresponding value quoted for x- and γ-radiation (which liberate fast electrons that cause most
of the associated ionization) is considerably lower at only 0.02. Both values likely have large
uncertainties given the sparse semi-theoretical and experimental data on which they are based and the
difficulties associated in performing the experiments on uranium, which has a low specific activity and
hence low rate of gas production (and, in these studies, pressure due to gas production was being used as
the direct observable, rather than say optical spectroscopy [B-7]). Being one of the few published reports
on radiolysis in UF6, Saraceno [B-6] has been widely adopted. Our narrow interest is to quantify whether
the rate of radiolysis is high enough to affect the (α,n) production rate for the range of items (enrichment
and age) we measured. Our problem is that we do not know how to rigorously assess the accuracy of the
G values presented by Saraceno [B-6] and therefore any conclusions made by assuming Sareceno’s
recommended value.
The G value proposed by Saraceno [B-6] is actually an upper bound, assuming no reverse (reformation or
back reaction or long-term dynamic-equilibrium that might be established in a sealed system) and that
every ion pair formed results in decomposition of one UF6 molecule. The number of ion pairs per
α-particle assumed by Saraceno was 0.137×10⁶ i.p./234U α-particle taken from Bernhardt et al. [B-8] for
UF6 gas based on ionization data measured by Steidlitz et al. [B-9]. Steidlitz et al. studied 13 gases,
including a range of fluorocarbon gases, for which the average energy, w, needed to create an ion pair was
within about 10% 30 eV/i.p. in all cases. They also confirmed additivity scaling rules for both range and
ionization. We shall return to this discussion later.
B-4
Bernhardt et al. studied UF6 radiolysis using radon (222Rn) as the α-source. The chemical reaction may be
represented as follows:
. (B.1)𝑈𝐹6 𝛼 ⇄ 𝑈𝐹𝑥 + (6 ― 𝑥
2 ) ∙ 𝐹2
The solid product was designated as because it could be eiher UF4 or UF5 but could not be identified 𝑈𝐹𝑥
because of the small amounts generated. For our purposes, we are primarily concerned with the loss of
F(α,n)-targets in the medium, so if we assume consistent with the characterization of solid uranium 𝑥 = 5,
fluorides in UF6-storage cylinder heels, and ignore the back reaction, on this basis we have
(B.2)2 ∙ 𝑈𝐹6 𝛼
2 ∙ 𝑈𝐹5 + 𝐹2,
and G is the number of molecules of F2 produced per 100 eV of radiation energy deposited. Across a
series of nine experiments (with no additional diluent gases present) Bernhardt et al. obtained G values
ranging from about 0.24 to 0.70, the mean values being (0.45±0.05), where the uncertainty is the
statistical standard error only. In a second series of measurements with nitrogen added, a wide range of
results was again obtained with extracted G values extending to approximately 2.8. In addition to the
random scatter, Bernhardt et al. caution that systematic bias, such as other unidentified dissociation
mechanisms, which are difficult to quantify, may also be present in one of both types of experiment.
Dmitrievskii et al. [B-10] was primarily concerned with the decomposition of UF6 under fission fragment
irradiation. From both new experimental data and a search of the available literature, a G value of about
0.4±0.05 was obtained for fission fragments, again with a potentially large additional systematic
uncertainty. They also found UF6 dissociation by fast electrons to be negligible in comparison (with a G
on the order of 0.005 stated in the text, although the value is 0.06 if we use the alternative statement of
0.045 moles of UF6 per kWh).
Trowbridge et al. [B-5] reviewed experimental radiolysis data reported in the literature with an emphasis
on experimental molten salt reactor fuel. Some unconvincing arguments are made to justify that G-values
for x-, γ-, and fast electron radiation is much less than that for α-radiation (although this does not matter
for purposes of our discussion because α-radiation dominates the energy deposition). The relevant
experimental data considered is mainly from the K-25 group at the Oak Ridge Gaseous Diffusion Plant
reported prior to the report by Bernhardt et al. Again, they find a large variation in G-values, roughly
spanning the range from 0.085 to 0.43, with a mean of about 0.5 molecules of F2 per 100 eV in the case of
B-5
UF6 gas subject to 220Rn. The estimated value of Saraceno [B-6], 1.5 molecules of F2 per 100 eV,
discussed earlier, is also included in Bernhardt’s review.
Given the scant experimental data and concerns over both the precision and accuracy of the direct
experimental data, one can appreciate why Saraceno’s estimate is included as a legitimate, technically
defensible, and conservative choice. However, the overall situation is clearly unacceptable from a
scientific perspective since in principle it is feasible to determine the quantity with far better precision and
accuracy than is exhibited in the current literature.
Adopting Saraceno’s logic then, if 0.137×10⁶ ion pairs are formed per 234U α-particle and each ionization
results in one molecule of UF6 being dissociated into UF5 + F2 and given the mean α-particle energy 12
emitted by 234U is 4.75926×10⁶ eV [B-11], we find 4.75926/0.137=34.74 eV is needed on average per UF6
dissociation or 69.48 eV per molecule of F2 produced. The G-value is therefore 100/69.48=1.44 (rounded
to 1.5) molecules of F2 per 100 eV. The assumption that every ( ) ion pair results in a 𝑈𝐹 +6 + 𝑒 ―
dissociation of a UF6 molecule means that this estimate is an upper limit for G. Collectively the
experimental data supports a lower value. We suggest that a G-value of 0.5 molecules of F2 per 100 eV is
more reasonable (than 1.5) with a relative uncertainty (68% confidence interval) of not less than 20%.
Recall too that, for our purposes, fluorine that remains trapped in the (solid) UF6 matrix and does not
emerge into the head space, remains as a potential α-particle target, and is therefore not fully “lost.”
In terms of UF5 (rather than F2) production, our choice of G value (0.5) equates to one molecule of UF5
produced per 100 eV of α-energy deposited. For our purposes we assume that the effect of radiolysis is
to reduce the (α,n) production rate because instead of stopping in pure UF6, emergent α-particles are
stopped in a mixture of UF6 and UF5. Let be the fraction of UF6 molecules dissociated into UF5. Then 𝑓
for we can neglect the dissociation of UF5, and assuming all the F2 gas escapes, the (α, n) yield of 𝑓 ≪ 1
an aged item can be approximated as
. (B.3)𝑌 ≈ (1 ― 𝑓) ∙ 𝑌𝑈𝐹6 + 𝑓 ∙ 𝑌𝑈𝐹5
The estimation of proceeds as follows. It is well known from the field of nuclear calorimetry [B-4] that 𝑓
for actinide materials which decay by α-emission, for instance the U and Pu isotopes and 241Am, the
majority of energy deposited in the material is due to the kinetic energy of the α-particles, with recoil of
the daughter nucleus being a small fraction. The range is short, so α-particles are likely to stop within the
material, and the escape of γ- and internal conversion electron energy is minor. Spontaneous fission is
usually negligible because the low branching ratio more than off-sets the relatively high (about 200 MeV)
B-6
energy release per event. With this in mind, for the present purposes of F(α,n) sensitivity analysis, the
total radiation deposited per decay may be taken to a high degree of approximation to be equal to the
Q-value of the reaction without the need to consider the fine details of the decay scheme; that is, we do
not need to treat non α-particle radiation differently.
Because the strongest effect is expected for HEU, we shall assume that the 234U α-emission rate utterly
dominates. We know for 234U that the specific α-activity is 2.302×10⁸ Bq/g with a mean α-particle energy
of 4.7594×10⁶ eV [B-11]. In one year (365.25 d) 1 g of 234U will therefore dissociate (assuming constant
rate):
2.302𝑥108𝑥4.7594𝑥106𝑥(365.25𝑥24𝑥3600)𝑥( 1100)~3.458𝑥1020 molecules of UF6 .
Suppose we start out with a HEU sample of pure UF6 with a nominal isotopic composition or 1.2, 93.0,
and 5.8 wt% in 234U, 235U and 238U, respectively, so that the U molar mass is 237.8254 g. 1 g of 234U
corresponds to 1/0.012=83.33 g of U and (83.33/237.8254) × 6.022141×1023 = 2.110×10²³moles of U.
There is one U atom per UF6 molecule, so the fraction of UF6 molecules dissociated is
(B.4)𝑓~3.458𝑥1020
2.110𝑥1023~0.00164.
To first order (which is all that is justified given our knowledge of the radiation chemical yield, G, value)
we can scale from this estimate for other isotopic compositions and sample ages. We have purposefully
chosen to illustrate the calculation with an extreme (most radiolytically active) example. For recycled
material, 232U also needs to be considered. Even at the ppb level, 232U can contribute significantly
because of its high specific activity (short half-life) and because it has roughly half a dozen α-particles in
its decay chain. The calculation of the fraction f requires a more careful temporal treatment to account for
the decay chain kinetics.
From our earlier result,
, (B.5)𝑌
𝑌𝑈𝐹6≈ (1 ― 𝑓) + 𝑓 ∙
𝑌𝑈𝐹5
𝑌𝑈𝐹6
and inserting for our illustrative example and (from simple scaling rules), we find 𝑓~0.00164𝑌𝑈𝐹5
𝑌𝑈𝐹6~0.927
for this specific case where the 1-σ uncertainty estimated by propagation of 𝑌
𝑌𝑈𝐹6~0.99988 ± 0.00008,
B-7
variance assumes a 20% and 5% relative standard deviation in the values of and respectively. 𝑓𝑌𝑈𝐹5
𝑌𝑈𝐹6 ,
Repeating the calculation for 2-, 3-, 4-, and 5-year-old source material by doubling the value of and so 𝑓
on, we find the following.
Table B-1. Indicative fractional reduction in (α,n) production rate from a HEU sample with age based on the illustrative example discussed in the text.