1
Daily Equity Trend 14 January 2021
Equity Indices
Market Review
Indian benchmark indices started session with good gains and
after hitting record high levels witnessed profit-booking and ended
on a flat note. The S&P BSE Sensex fell 24.79 points or 0.05
percent while NSE Nifty50 closed 1.40 points or 0.01 percent up.
Nifty Bank outperform the Nifty50, gaining 235.65 points or 0.73
percent. Sectoral action was seen telecom, public sector, auto, oil
& gas on the other side healthcare, finance, consumer durables
and energy sectors witnessed profit booking. On the broader
markets front, S&P BSE mid-cap index fell 121.01 points or 0.63
percent and S&P BSE small-cap index fell 72.07 points or 0.38
percent. Overall market breadth turned slightly towards negative
side. On the BSE, total 1,236 shares advanced while 1,828 shares
declined and 148 shares were unchanged. Foreign Institutional
Investors net bought shares worth Rs 1,879.06 crores, while
Domestic Institutional Investors net sold shares worth Rs 2,370.17
crores in the Indian equity markets.
Today’s Economic Events: India & Global
- NIL
Advance/Decline – NSE
0.8
1.6
1.2
0.6
1.1
0.5
0.0
0.2
0.4
0.6
0.8
1.0
1.2
1.4
1.6
1.8
0
400
800
1,200
1,600
2,000
06-Jan 07-Jan 08-Jan 11-Jan 12-Jan 13-Jan
Num
ber o
f Sha
res
Advance (LHS) Decl ine (LHS) Adv/Decl Ratio (RHS)
NSE Movement
Particulars 13-Jan-21 12-Jan-21 % Change
Traded Value
(Rs. In Crores)85334 81773 4.17
Traded Quantity
(in Lakhs)45223 42431 6.17
Number of Trades 23204300 21859289 5.80
Total Market Cap.
(Rs. In Crores)19556240 19594620 -0.20
Asian Indices
Nikkei SGX Nifty Hang Seng
Current Quote 28,849.01 14,588.50 28,289.33
% Change 1.38% 0.11% 0.19%
Live Markets As on 08.00 hours IST
Shanghai
3,571.07
-0.77%
NIFTY Vs. Institutional Activity
13982 14019 14133
14200
14146
14137
8000
8500
9000
9500
10000
10500
11000
11500
12000
12500
13000
13500
14000
14500
(30000)
(20000)
(10000)
0
10000
20000
30000
40000
50000
60000
70000
01-Jan 04-Jan 05-Jan 06-Jan 07-Jan 08-Jan
(Rs` Mn)
FII (LHS) MF (LHS) Ni fty (RHS)
Provisional Figures for Investments
Volume Shockers
0.0010.0020.0030.0040.0050.0060.0070.0080.00
NE
LC
AS
T
IT
I
TA
TA
EL
XS
I
CIN
EL
INE
CA
RB
OR
UN
IV
SA
ND
HA
R
TA
RM
AT
TH
AN
GA
MA
YL
DP
WIR
ES
HA
RIT
AS
EA
T
62.99 60.3653.67
44.12
13.579.36 6.33 4.72 4.18 2.53
Volumes (Rs. Lakhs)
Last Close % Change P/EDivindend
Yield
Sensex 49,492 -0.05 34.65 0.80
Nifty 14,565 0.01 39.94 1.09
Nifty Midcap 50 6,385 -0.66 220.09 1.47
Nifty Auto 10,209 0.88 336.20 1.60
Nifty Bank 32,575 0.73 31.42 0.39
Nifty Energy 17,430 0.58 18.26 2.74
Nifty Fin. Services 15,624 -0.56 31.78 0.56
Nifty FMCG 34,618 0.37 44.87 1.32
Nifty IT 27,004 0.08 35.98 1.56
Nifty Media 1,759 0.32 0.00 2.24
2
Daily Equity Trend 14 January 2021
Business News
Wipro – the company has reported consolidated profit of Rs
2,968 crores for the December quarter, increased 20.4 percent
from Rs 2,465.7 crores in the last quarter. Consolidated revenue
of the company rose by 3.8 percent at Rs 15,670 crores as
compared to Rs 15,096.7 crores in September quarter.
Company’s dollar revenue growth is at 3.9 percent which is
highest in 36 quarter.
Infosys – company has reported better than expected earnings
performance for the third quarter. Company’s profit rose 7.3
percent at Rs 5,197 crores in December quarter from Rs 4,845
crores for the September quarter. While revenue of the company
increased by 5.5 percent to Rs 25,927 crores from Rs 24,570
crores quarter-on-quarter basis.
Coal India – company has raised its capital expenditure budget
by 30 percent to Rs 13,000 crores for the ongoing financial year.
Earlier company’s target for 2020-21 was 10,000 crores. The
company has posted 166 percent growth at Rs 7,801 crores
during the first nine months of fiscal ending December’20.
SAIL – Government to sale up to 10 percent stake in the
company via Offer for Sale (OFS). The floor price for SAIL OFS
is set at Rs 64 per equity shares of the firm.
L&T – the company have won orders for construction of
metallurgical plants and power transmission and distribution
project worth in the range of Rs 1,000 crores to Rs 2,500 crores.
Gainers & Losers
6.22%
4.97%
4.89%
3.06%
2.40%
-2.79%
-2.76%
-2.53%
-1.95%
-1.85%
-15% -5% 5% 15%
M&M
ADANIPORTS
SBIN
IOC
NTPC
HDFC
BAJFINANCE
SHREECEM
UPL
BAJAJFINSV
% Change
NIFTY Vs. India VIX
14146 1413714347 14485
14563 14565
21.0 20.6 20.6
22.422.8 23.3
15
20
25
30
35
40
12500
13000
13500
14000
14500
15000
15500
6/Jan 7/Jan 8/Jan 11/Jan 12/Jan 13/Jan
Nifty Spot (LHS) INDIA VIX (RHS)
Global Indices
Source: SSL Research, Economic Times, Business Line, Business Standard, Times of India, DNA Money, Mint, Financial Express, Bloomberg
Economic Update – India & Global Unemployment rate in US is above 20 percent for the lowest
paid workers – US unemployment rate has come down from the
pandemic peak of 14.7 percent to the current 6.7 percent, while
Fed economist estimate the jobless rate for the lowest quartile of
earnings is likely above 20 percent.
RBI sets up working group for better regulation of digital
lending – The Reserve Bank of India has set up an internal
working group to create a regulatory framework for digital lending
firms as the recent spike in such loans sparked concerns. The
working group will study digital lending activities in the regulated
and unregulated financial sector so that an appropriate regulatory
approach can be put in place, according to a statement on the
RBI website.
% Change YTD
DJIA -0.03 2.77
S&P 500 0.23 2.95
Nasdaq100 0.63 2.20
FTSE100 -0.13 2.64
CAC 0.21 1.32
DAX 0.11 1.55
KOSPI 0.71 6.92
US Dollar Index -0.07 0.38
Last Close
3148.29
90.27
31,060
12,974
6,746
5,663
13,940
3,810
ADR
ADR Close NSE Close 1 Day
INFOSYS 18.60 1387.70 -1.50
ICICI BANK 15.20 556.40 0.50
DRREDDY 72.10 5291.10 0.10
HDFC BANK 74.80 1471.00 23.40
TATAMOTORS 16.60 242.50 0.30
(Converted to INR) Prem / (Disc) in (%)
3
Daily Equity Trend 14 January 2021
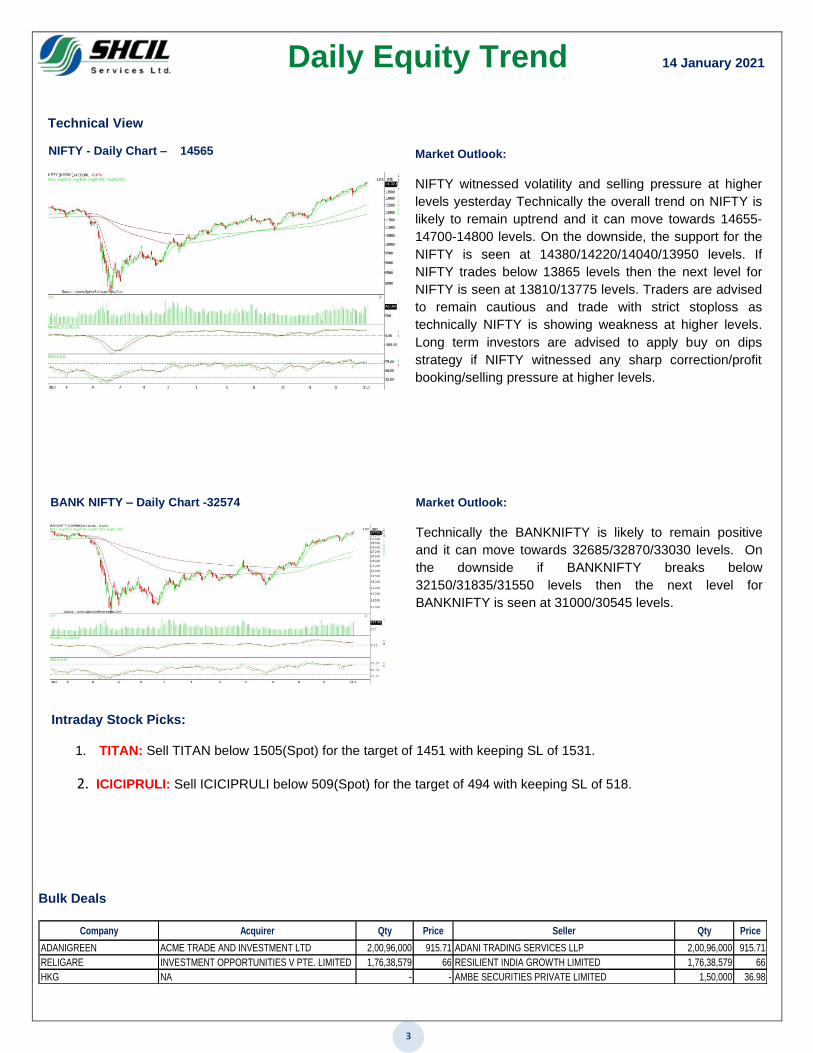
Technical View
NIFTY - Daily Chart – 14565
Intraday Stock Picks:
1. TITAN: Sell TITAN below 1505(Spot) for the target of 1451 with keeping SL of 1531.
2. ICICIPRULI: Sell ICICIPRULI below 509(Spot) for the target of 494 with keeping SL of 518.
Market Outlook:
NIFTY witnessed volatility and selling pressure at higher
levels yesterday Technically the overall trend on NIFTY is
likely to remain uptrend and it can move towards 14655-
14700-14800 levels. On the downside, the support for the
NIFTY is seen at 14380/14220/14040/13950 levels. If
NIFTY trades below 13865 levels then the next level for
NIFTY is seen at 13810/13775 levels. Traders are advised
to remain cautious and trade with strict stoploss as
technically NIFTY is showing weakness at higher levels.
Long term investors are advised to apply buy on dips
strategy if NIFTY witnessed any sharp correction/profit
booking/selling pressure at higher levels.
BANK NIFTY – Daily Chart -32574
Market Outlook:
Technically the BANKNIFTY is likely to remain positive
and it can move towards 32685/32870/33030 levels. On
the downside if BANKNIFTY breaks below
32150/31835/31550 levels then the next level for
BANKNIFTY is seen at 31000/30545 levels.
Bulk Deals
Company Acquirer Qty Price Seller Qty Price
ADANIGREEN ACME TRADE AND INVESTMENT LTD 2,00,96,000 915.71 ADANI TRADING SERVICES LLP 2,00,96,000 915.71
RELIGARE INVESTMENT OPPORTUNITIES V PTE. LIMITED 1,76,38,579 66 RESILIENT INDIA GROWTH LIMITED 1,76,38,579 66
HKG NA - - AMBE SECURITIES PRIVATE LIMITED 1,50,000 36.98
4
Daily Equity Trend 14 January 2021
F&O Cues
The Put Call ratio stood at 1.46 levels and suggesting that
consolidation with positive bias on NIFTY Future. The Nifty
futures were at 14606 at premium of 41 points compared with
the Nifty's closing of 14565 in the cash market.
On the options front, call open interest (OI) of 23.13 lakh
contracts was seen at the 15000-strike price and this will act
as a crucial resistance level for current series. This is
followed by 14000 strike prices, which holds 15.17 lakh
contracts in open interest, and 14500, which has
accumulated 14.06 lakh contracts in open interest.
Put open interest of 30.36 lakh contracts was seen at 14000
strike price, which will act as crucial support for current
series. This is followed by 13500 strike price, which holds
21.99 lakh contracts in open interest, and 13900 strike price,
which has accumulated 20 lakh contracts in open interest.
The Indian Volatility Index was seen increasing by 8.47%,
closing at 25.20 indicating volatitliy may remain high in
coming trading sessions.
NIFTY Spot Vs PCR
13500
14000
14500
15000
0.00
0.40
0.80
1.20
1.60
2.00
7/Jan 8/Jan 11/Jan 12/Jan 13/Jan
PCR-OI PCR-VOL NIFTY
FIIs Statistics in F&O
Product Buy Sell Net OI
(% Change)
INDEX FUTURES 4094.72 5071.02 -976.30 -4.16
INDEX OPTIONS 514686.09 508726.14 5959.95 15.97
STOCK FUTURES 15913.43 17198.59 -1285.16 0.32
STOCK OPTIONS 13014.05 13038.79 -24.74 8.86
Total 547708.29 544034.54 3673.75 20.99
FIIs Fund Activity
110001150012000125001300013500140001450015000
(2000)(1500)(1000)(500)
0500
100015002000
7/J
an
8/J
an
11/
Jan
12/
Jan
13/
Jan
FII B/S OI Nifty Spot
NIFTY Options OI
0
1
2
4
141
00
142
00
143
00
144
00
145
00
146
00
147
00
148
00
149
00
150
00
151
00
Put OI Call OI
Stocks in Ban Period for Trade
-SAIL, BHEL
Derivatives Snapshot – NIFTY
Particulars Spot Future Prem. / Disc. Futures OI PCR OI PCR VOL VIX (%)
Current 14565.00 14606.15 41.15 14600625 1.46 1.09 23.29
Previous 14563.00 14597.95 34.95 15205050 1.73 0.92 22.85
Change (%) 0.01 0.06 – -3.98 – – –
NIFTY: Premium (+)/Discount (-)
32.3
18.45
43.45
54.1
23.9
4.25
34.95
41.15
0
10
20
30
40
50
60
4/J
an
5/J
an
6/J
an
7/J
an
8/J
an
11/J
an
12/J
an
13/J
an
5
Daily Equity Trend 14 January 2021
Sector Movements
Sectors
Price
% Change OI %
Change
Auto 1.10 -2.40
Banking 2.12 -1.32
FMCG 0.83 -1.09
Oil & Gas 0.60 1.36
Metals -0.36 -1.15
IT -0.01 2.15
Telecom 1.74 -3.18
Capital Goods 1.20 0.74
Pharma -0.59 0.58
Power 1.65 2.50
Financial Services -2.31 -0.88
Infra 0.18 -0.42
Media 1.43 -1.14
Chemicals & Fertilizers 0.05 2.68
Insurance -1.05 1.10
Paint -1.46 -0.55
Real Estate 11.52 -5.40
Others -1.39 -1.13
Bull/Bear Signals – OI v/s Price
Long Buildup
Scrip Price %
Price Change
%
OI Change
%
Delivery
ONGC 105.75 1.98 8.91 22.45
PNB 36.80 0.41 7.56 20.00
UBL 1282.85 2.50 6.88 29.09
TATACHEM 543.70 3.40 6.57 11.18
BPCL 413.85 2.35 5.70 23.82
Short Buildup
Scrip Price %
Price Change
%
OI Change
%
Delivery
ICICIPRULI 511.55 -2.39 4.33 23.54
DIVISLAB 3739.40 -1.23 4.23 50.83
TITAN 1514.35 -1.35 4.12 40.33
RBLBANK 253.70 -1.63 3.95 14.34
INDIGO 1641.85 -2.72 3.90 24.81
Short Covering
Scrip Price %
Price Change
%
OI Change
%
Delivery
IDEA 12.35 1.23 -0.90 18.17
ITC 212.35 2.54 -1.01 32.80
ACC 1799.45 0.05 -1.06 23.23
GAIL 139.00 0.14 -1.09 20.41
SUNTV 537.60 1.43 -1.14 17.11
Long Unwinding
Scrip Price %
Price Change
%
OI Change
%
Delivery
PIDILITIND 1799.30 -0.54 -1.32 32.90
BERGEPAINT 800.10 -0.57 -1.39 18.52
KOTAKBANK 1892.05 -1.04 -1.54 69.59
HINDUNILVR 2384.50 -0.14 -1.55 43.82
HDFC 2683.40 -2.67 -1.58 56.04
Sector Cues
• Long buildup was seen in CAPITAL GOODS
and POWER.
• Short covering was seen in TELECOM and
BANKING stocks.
Stock Futures Snapshot
✓ Decrease in open interest along with decrease in price
indicates positive bias and long unwinding was seen in
ONGC, PNB and UBL.
✓ An increase in open interest along with decrease in price
indicates negative bias and short build up was seen in
DIVISLAB, RBLBANK and TITAN.
Top Stock Options IV
Scrip Strike CE/PE Volume
BHARTIARTL 600 CE 28089
INFY 1400 CE 23291
ITC 220 CE 15822
ITC 210 CE 14620
ITC 230 CE 14476
BHARTIARTL 620 CE 11361
INFY 1380 CE 10965
ICICIBANK 560 CE 10821
INFY 1500 CE 10239
HDFCBANK 1500 CE 9079
BHARTIARTL 610 CE 8886
ITC 215 CE 8872
BHARTIARTL 590 CE 8736
BHARTIARTL 580 CE 8696
BPCL 420 CE 8587
6
Daily Equity Trend 14 January 2021
SSL Research Centre
S. Devarajan Head – Research
(Technical & Derivatives) [email protected] 022-61778621
Gauri Hanmantgad Research Associate [email protected] 022-61778600
DISCLAIMER: This is solely for information of clients of SHCIL Services Ltd. and does not construe to be an investment advice. It is
also not intended as an offer or solicitation for the purchase and sale of any financial instruments. Any action taken by you on the
basis of the information contained herein is your responsibility alone. SHCIL Services Ltd., its associate companies, and employees
will not be liable in any manner for the consequences of such action taken by you. We have exercised due diligence in checking the
correctness and authenticity of the information contained in this recommendation. SHCIL Services Ltd., its associate companies, and
employees shall not be in any way responsible for any loss or damage that may arise to any person from any inadvertent error in the
information contained in this recommendation or any action taken on basis of this information.
Disclosures: SSL is registered as Research Analyst with SEBI bearing registration number INH000001121 as per SEBI (Research
Analysts) Regulations, 2014. SSL is primarily engaged in the business of providing broking services. SHCIL Services Limited is a
SEBI registered Stock Broker providing services to institutional and retail clients. SEBI registration no: INZ000199936 Details of
associates of SSL are as under: 1.Stock Holding Corporation of India Limited (SHCIL) : SHCIL is primarily engaged in the business
of providing custodial services, post trading services, Sub-broking services in association with SHCIL Services Limited and
depository related services. SHCIL is also registered as Research Analyst with SEBI bearing registration number INH000001303 as
per SEBI (Research Analysts) Regulations, 2014. 2.StockHolding Document Management Services Limited: Stockholding DMS
Limited is in the business of providing End to End Document Management Solutions and Information Technology Enabled Services.
3.StockHolding Securities IFSC Limited (SSIL): SSIL offers a comprehensive bouquet of service solutions to all eligible investors at
IFSC, Gift City, Gandhinagar.
SSL or its Research Analyst or relatives or its associates do not have any financial interest in the company(ies). SSL, the Research
Analyst or relatives or its associates collectively do not hold more than 1% of the securities of the company(ies) referred to in this
document as of the end of the month immediately preceding the date of this document. SSL or its Research Analyst or relatives or its
associates may from time to time have positions in, purchase or sell, or be interested in any of the securities mentioned herein. SSL,
the Research Analyst or relatives or its associates do not have any other material conflict of interest in the above company. SSL, the
Research Analyst or relatives or its associates have not received compensation or other benefits of any kind from the company(ies)
referred to in this document or from any third party, in the past twelve months. SSL, the Research Analyst or relatives or its
associates have not managed or co-managed in the previous twelve months, any offering of securities for the company(ies) referred
to in this document. SSL, the Research Analyst or relatives or its associates have not served as an Officer, Director or employee of
the company(ies) referred to in this document. SSL, the Research Analyst or relatives or its associates have not been engaged in
market making activity for the company(ies) referred to in this document.
SHCIL Services Limited CIN NO: U65990MH1995GOI085602.
Plot No. P-51, T.T.C. Industrial Area, MIDC Mahape, Navi Mumbai – 400 710 www.shcilservices.com
Disclaimer