106
Keynotes and Extended Abstracts Edited by Ibrahim Kucukkoc University of Exeter 9-11 April 2013 Peter Chalk Centre University of Exeter
Keynotes and
Extended
Abstracts
Edited by Ibrahim Kucukkoc University of Exeter
9-11 April 2013 Peter Chalk Centre University of Exeter


YOR18
University of Exeter
9-11 April, 2013
Keynote Papers
and
Extended Abstracts
Edited by
Ibrahim Kucukkoc
University of Exeter, UK

I. Kucukkoc / YOR18 - Keynote Papers and Extended Abstracts Foreword, pp.I-II (2013)
ii

YOR18 Biennial Conference - Keynote Papers and Extended Abstracts, pp.I-II
University of Exeter, 9-11 April 2013
Foreword
i
Foreword
On behalf of the entire organising committee I am delighted to welcome you to the biennial
conference of The OR Society, YoungOR18, held at University of Exeter, which was selected
as “University of the Year” by Sunday Times.
Held during 9-11 April 2013, YoungOR presents a rich and exciting programme for both
practitioners and academics with experience of up to ten years in Operational Research. The
conference brings together the future generation of operational researchers to provide an
excellent forum whilst sharing and updating the knowledge of the field in a collaborative and
supportive way. Moreover, scheduled tutorial and training sessions in the programme give the
opportunity of engaging with various challenging issues in your field of interest while
widening your network.
Like the previous ones, a number of interesting keynote papers from both academics and
practitioners have been received for this conference. In addition to the keynote papers, the
submissions of extended abstracts were also accepted to be included in this book. The papers
presented here cover a wide range of opportunities for learning from some of the best and
brightest in their fields. We hope that you enjoy them.
In the Infrastructure stream, Andy Chow presents a framework for linear modelling and
optimisation of road transport infrastructure. This framework contributes to the assessment,
modelling, and management of infrastructure. Particularly, it provides useful insights on
managing traffic flow with a specific example of motorway networks.
Franklin Fomeni, Konstantinos Kaparis, and Adam Letchford review the first level relaxation
with alternative methods for mixed 0-1 programmes for Optimisation stream. They also
propose a method of generating cutting planes that can be applied to any pure or mixed 0-1
programmewith a linear or quadratic objective.
In the Supply Chain stream, Vicky Forman presents a case study which shows the importance
of embedding operational research techniques in any part of a well-known UK based retailer‟s
(Marks & Spencer) supply chain. This study analyses the critical role of OR in the company‟s
transformation process of supply chain structure to cope with increased complexity while
delivering a reduction in inventory.
The Strategy & Sustainability stream comprises an interesting work by Miles Weaver and
Andrea Bonfiglioli that provides an overview of the key contributions that have addressed
issues in strategy and sustainability. They explore the OR Society contributions to
sustainability against the OR/MS literature. It is asserted that OR contributions are
predominantly focus on the theme of environmental management dimension but not social
impact of sustainability.
Another interesting work, which surveys the importance of operational research, is carried out
by Pavel Albores, Oscar Rodriguez, and Priyanka Roy in Disaster Management stream. They
present an overview of the importance of OR in disaster management while providing some
critics from previous contributions in the field, the most common OR tools to cope with

I. Kucukkoc / YOR18 - Keynote Papers and Extended Abstracts Foreword, pp.I-II (2013)
ii
logistics issues in an emergency, and further research directions for new research
opportunities are also waiting for the attention of the readers.
Paul Kailiponi and Duncan Shaw have also presented their keynote for Disaster
Management stream on an interesting topic, evacuation decision making. A modular
system of influence diagrams is presented for strategic decision-making processes along with
an example of utilising this system to analyse evacuation policies on different aspects.
In the DEA stream, Jamal Ouenniche briefly reviews the basic concepts of DEA, and
proposes an orientation-free super-efficiency DEA framework for assessing the relative
performance of competing forecasting models for crude oil prices volatility
In the Soft Methods stream, Ashley Carreras analyses some significant developments within a
few soft OR approaches, collectively known as Problem Structuring Methods (PSMs), by
discussing the usage and effects of soft methods in practice.
In the Health stream, Hazel Squires, James Chilcott, Ronald Akehurst, and Jennifer Burr
propose a conceptual modelling framework to help decision makers make appropriate policy
decisions to improve the quality and communication of Public Health economic models.
Michael O‟Connell and John James present how data scientists and other business users can
be organised into a productive unit to cope with the differing requirements of data analysis, in
Analytics stream.
The key similarities and variations between simulation models and general software
development methodologies are discussed by Steven Jones, in the Simulation stream. The
crucial points that simulation model developers can learn from other areas are emphasised as
well.
Another exciting study in Disaster Management stream is presented by Priyanka Roy, Oscar
Rodríguez-Espíndola, Pavel Albores-Barajas, and Christopher Brewster this year. They
address the gap between the authorities and academics within this field and emphasise the
importance of an effective logistical management process to deal with disaster within
developing countries. A multi-method approach, which carries some advantages such as
simpler models, increased interaction with authorities, easier tools, and more geographical
systems, is proposed in the study.
We sincerely appreciate all keynote speakers and authors whose valuable contributions were
helpful in making the conference a great success.
Ibrahim Kucukkoc
Editor of Keynote Papers and Extended Abstracts Book
YOR18 Conference, University of Exeter
April 2013
YOR18 Biennial Conference - Keynote Papers and Extended Abstracts, pp.III
University of Exeter, 9-11 April 2013
Contents
iii
Table of Contents
Modelling and Management of Road Transport Infrastructure-A Linear Programming
Approach .................................................................................................................................. 1
Andy H.F. Chow
Strong First-Level RLT Relaxations of Mixed 0-1 Programs ........................................... 12
Franklin Djeumou Fomeni, Konstantinos Kaparis and Adam N. Letchford
Case Study: OR in the Marks & Spencer Supply Chain ................................................... 25
Vicky Forman
Embedding Sustainability into Strategy: Assessing the OR Society Contribution ......... 32
Miles W. Weaver, Andrea Bonfiglioli
Operational Research: Key for Successful Disaster Management .................................... 47
Pavel Albores, Oscar Rodriguez, Priyanka Roy
Inter-Model Influence Diagram Analysis Using Modular Elicitation Methods for
Evacuation Decision-Making ................................................................................................ 60
Paul Kailiponi, Duncan Shaw
Performance Evaluation of Forecasting Models: At Last, Problem Solved! .................. 74
Jamal Ouenniche
Productive Dialogue is the Answer, Now What is the Question? ...................................... 77
Ashley L. Carreras
Health Economic Modelling: A Conceptual Modelling Framework for Public Health
Economic Models ................................................................................................................... 81
Hazel Squires, James Chilcott, Ronald Akehurst, Jennifer Burr
Data Science 2.0 – Guided and In-line Analytics Why being a Data Scientist is Sexy in
the era of Big Data ................................................................................................................. 84
Michael O‟Connell, John James
What can Simulation Model Developers Learn from Software Developers? ................. 89
Steven Jones
New OR Perspectives for Disaster Management in Developing Countries ..................... 91
Priyanka Roy, Oscar Rodríguez-Espíndola, Pavel Albores-Barajas, Christopher Brewster


YOR18 Biennial Conference - Keynote Papers and Extended Abstracts, pp.1-11
University of Exeter, 9-11 April 2013
Infrastructure
1
KEYNOTE
Modelling and Management of Road Transport Infrastructure -
A Linear Programming Approach
Andy H.F. Chow
University College London, Centre for Transport Studies, London WC1E 6BT, United Kingdom
Abstract
This paper presents a linear modelling and optimization framework for road transport
infrastructure. The framework is developed based upon a macroscopic model of traffic flow.
This underlying model of traffic is piecewise linear with which optimization of the network
operations can be formulated as a linear programming and hence can be solved by established
solution algorithm for the global optimal solution. The concept is illustrated through a specific
example of motorway networks. The global optimal solution obtained from the linear
programming may not be readily implementable in practice. However, it provides useful
insights and guidance on how we should manage traffic flow. The work presented herein
contributes to the assessment, modelling and management of transport infrastructure.
Keywords: Transportation; Traffic flow model; Congestion; Active traffic management;
Linear programming (LP)
1. Introduction
The ever-increasing demand for travel raises various problems and issues including
congestion, energy, environmental impact, safety and security. The UK Eddington study
(Eddington, 2006) states that the monetary cost due to road congestion will reach £22 billion
(at 2002 prices) per annum for all road users by 2025, in which 13% of road traffic will be
subject to stop-start travel conditions. In a report published in 2009, UK Department for
Transport (DfT) also suggests that congestion across the English road network as a whole will
increase from 2003 levels by 27% by 2025, and 54% by 2035 (HM Treasury, 2012).
Continuous construction of new roads will not be a sustainable solution due to the
increasingly tight fiscal, physical and environmental constraints. Consequently, governments,
businesses, and research teams around the world want to explore alternative ways to
effectively utilize and manage existing road infrastructure. A sustainable solution for
mitigating congestion calls for effective management of existing infrastructure through
appropriate planning and control measures. Such an infrastructure system will have to be
active so that it can sense prevailing conditions, and derive and implement appropriate actions
without the need for additional physical capacity. Following Hegyi (2004), objectives of
traffic management include: (i) maximizing efficiency (e.g. minimize the total time spent in
travel); (ii) maximizing safety; (iii) maximizing travel reliability; (iv) minimizing fuel
consumption; and (v) minimizing emission.
A.H.F. Chow / YOR18 Keynote Papers and Extended Abstracts, pp.1-11 (2013)
2
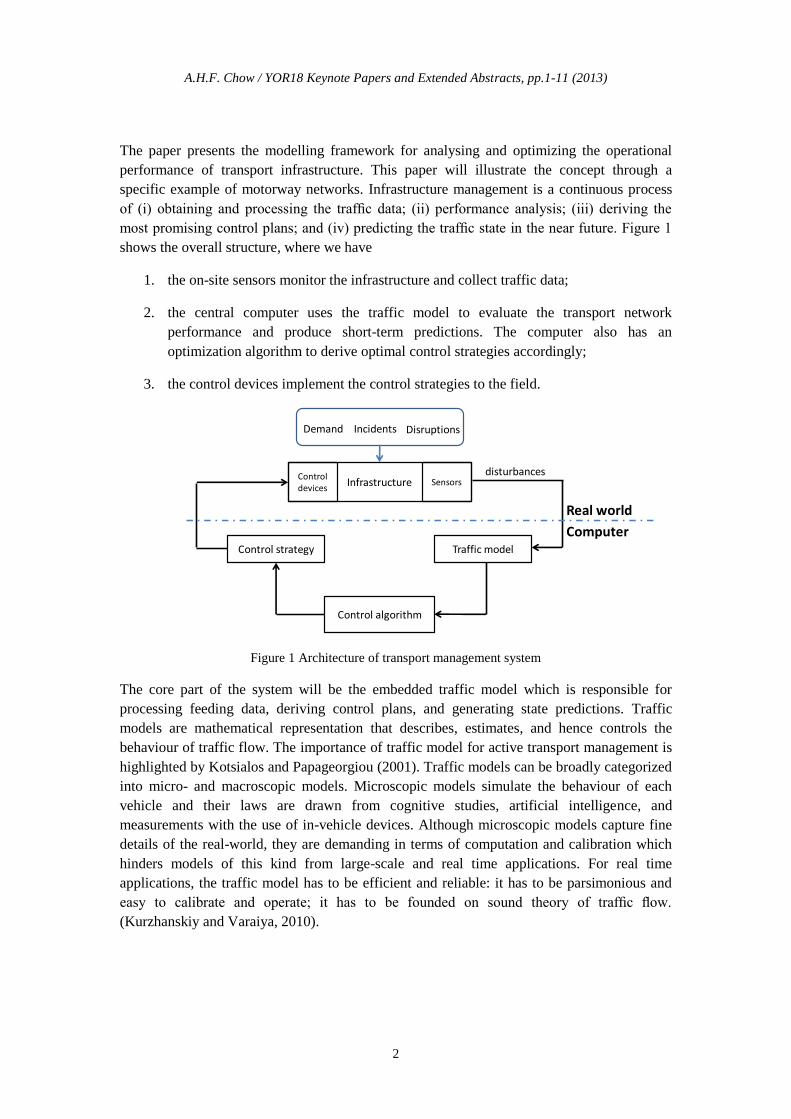
The paper presents the modelling framework for analysing and optimizing the operational
performance of transport infrastructure. This paper will illustrate the concept through a
specific example of motorway networks. Infrastructure management is a continuous process
of (i) obtaining and processing the traffic data; (ii) performance analysis; (iii) deriving the
most promising control plans; and (iv) predicting the traffic state in the near future. Figure 1
shows the overall structure, where we have
1. the on-site sensors monitor the infrastructure and collect traffic data;
2. the central computer uses the traffic model to evaluate the transport network
performance and produce short-term predictions. The computer also has an
optimization algorithm to derive optimal control strategies accordingly;
3. the control devices implement the control strategies to the field.
Figure 1 Architecture of transport management system
The core part of the system will be the embedded traffic model which is responsible for
processing feeding data, deriving control plans, and generating state predictions. Traffic
models are mathematical representation that describes, estimates, and hence controls the
behaviour of traffic flow. The importance of traffic model for active transport management is
highlighted by Kotsialos and Papageorgiou (2001). Traffic models can be broadly categorized
into micro- and macroscopic models. Microscopic models simulate the behaviour of each
vehicle and their laws are drawn from cognitive studies, artificial intelligence, and
measurements with the use of in-vehicle devices. Although microscopic models capture fine
details of the real-world, they are demanding in terms of computation and calibration which
hinders models of this kind from large-scale and real time applications. For real time
applications, the traffic model has to be efficient and reliable: it has to be parsimonious and
easy to calibrate and operate; it has to be founded on sound theory of traffic flow.
(Kurzhanskiy and Varaiya, 2010).
Control algorithm
Control strategy Traffic model
Infrastructure SensorsControl devices
Demand Incidents Disruptions
Computer
Real world
disturbances

Modelling and Management of Road Transport Infrastructure – A LP Approach
3
Macroscopic models represent traffic dynamics in terms of aggregated quantities: volume,
density and mean speed of traffic. In general, the required macroscopic data can be readily
obtained from standard surveillance infrastructure such as loop detectors, cameras, and other
kinds of fixed sensors. Moreover, macroscopic models are much more efficient than their
microscopic counterparts in terms of computation and calibration. This makes macroscopic
models feasible candidates for large-scale applications in real world. Consequently, the
modelling and optimization framework presented in this paper is developed based upon
macroscopic models.
This paper is organized as follows: Section 2 introduces the traffic model that we use to
capture the traffic flow characteristics on the infrastructure networks. Section 3 summarizes
various indicators that we use to assess the performance of transport infrastructure operations.
Section 4 presents different control strategies that we use to manage traffic flow. We also
present the formation of the optimal design of control strategies as a linear programming
based upon the assumed traffic model. Finally, Section 5 provides some concluding remarks.
2. Modelling of traffic flow
This section introduces the model of traffic dynamics that we adopt and the associated
numerical scheme.
2.1. Lighthill-Whitham-Richards‟ kinematic wave model of traffic flow
Lighthill and Whitham (1955), and later Richards (1956), propose a macroscopic dynamic
model of traffic which is known as the kinematic wave model or LWR model. The model
considers three variables ),( txf , ),( tx and ),( txv which respectively represent the
average flow [dimension: veh/time], density [dimension: veh/space] and speed [dimension:
space/time] at location x along a road section at time t. The speed ),( txv is considered to be
related to the corresponding flow and density values as
),(
),(),(
tx
txftxv
, (1)
for all x and t. The evolution of flow and density is governed by the conservation law:
),(),(),(),(
txstxrx
txf
t
tx
, (2)
where ),( txr and ),( txs are respectively the exogenous inflow (e.g. on-ramps) and outflow
(e.g. off-ramps) at (x, t).
Finally, ),( txf and ),( tx are related by a predefined flow-density function which is
known as the fundamental diagram of traffic flow where:
A.H.F. Chow / YOR18 Keynote Papers and Extended Abstracts, pp.1-11 (2013)
4
)],([),( txtxf (3)
for all x and t.
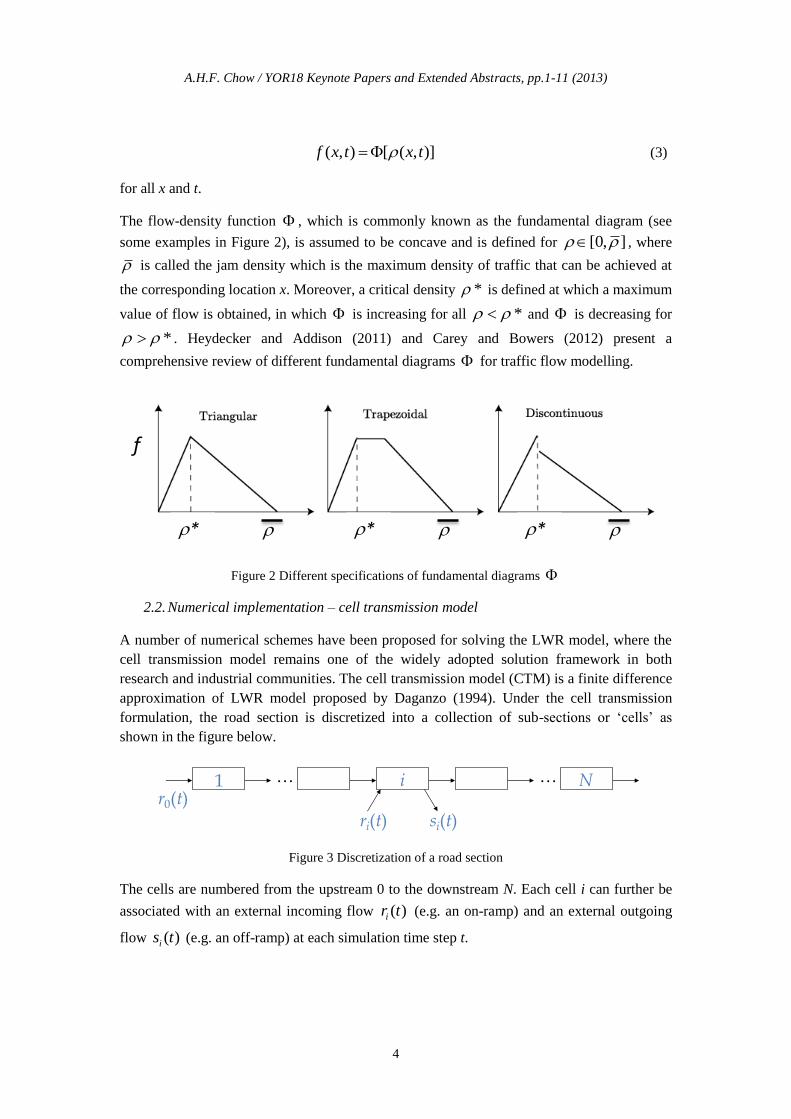
The flow-density function , which is commonly known as the fundamental diagram (see
some examples in Figure 2), is assumed to be concave and is defined for ],0[ , where
is called the jam density which is the maximum density of traffic that can be achieved at
the corresponding location x. Moreover, a critical density * is defined at which a maximum
value of flow is obtained, in which is increasing for all * and is decreasing for
* . Heydecker and Addison (2011) and Carey and Bowers (2012) present a
comprehensive review of different fundamental diagrams for traffic flow modelling.
Figure 2 Different specifications of fundamental diagrams
2.2. Numerical implementation – cell transmission model
A number of numerical schemes have been proposed for solving the LWR model, where the
cell transmission model remains one of the widely adopted solution framework in both
research and industrial communities. The cell transmission model (CTM) is a finite difference
approximation of LWR model proposed by Daganzo (1994). Under the cell transmission
formulation, the road section is discretized into a collection of sub-sections or „cells‟ as
shown in the figure below.
Figure 3 Discretization of a road section
The cells are numbered from the upstream 0 to the downstream N. Each cell i can further be
associated with an external incoming flow )(tri (e.g. an on-ramp) and an external outgoing
flow )(tsi (e.g. an off-ramp) at each simulation time step t.
* * *
f
… …1 Ni
ri(t) si(t)r0(t)
Modelling and Management of Road Transport Infrastructure – A LP Approach
5
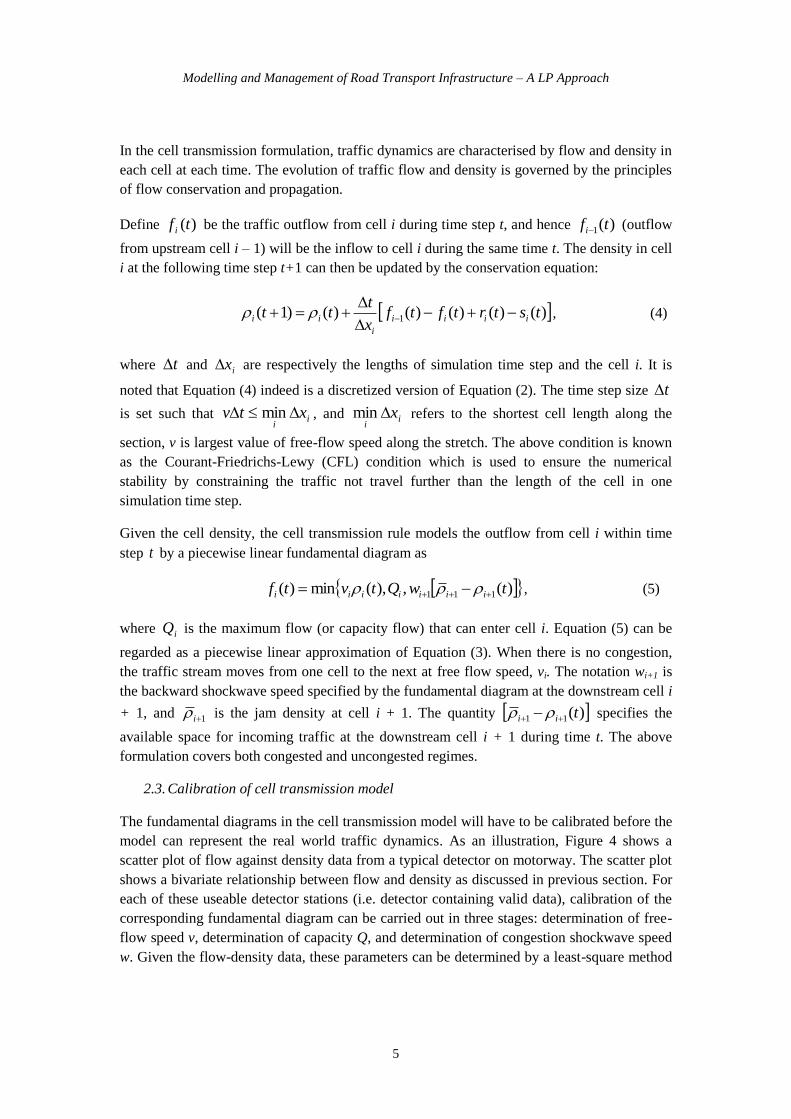
In the cell transmission formulation, traffic dynamics are characterised by flow and density in
each cell at each time. The evolution of traffic flow and density is governed by the principles
of flow conservation and propagation.
Define )(tf i be the traffic outflow from cell i during time step t, and hence )(1 tfi (outflow
from upstream cell i – 1) will be the inflow to cell i during the same time t. The density in cell
i at the following time step t+1 can then be updated by the conservation equation:
)()()()()()1( 1 tstrtftfx
ttt iiii
i
ii
, (4)
where t and ix are respectively the lengths of simulation time step and the cell i. It is
noted that Equation (4) indeed is a discretized version of Equation (2). The time step size t
is set such that ii
xtv min , and ii
xmin refers to the shortest cell length along the
section, v is largest value of free-flow speed along the stretch. The above condition is known
as the Courant-Friedrichs-Lewy (CFL) condition which is used to ensure the numerical
stability by constraining the traffic not travel further than the length of the cell in one
simulation time step.
Given the cell density, the cell transmission rule models the outflow from cell i within time
step t by a piecewise linear fundamental diagram as
)(,),(min)( 111 twQtvtf iiiiiii , (5)
where iQ is the maximum flow (or capacity flow) that can enter cell i. Equation (5) can be
regarded as a piecewise linear approximation of Equation (3). When there is no congestion,
the traffic stream moves from one cell to the next at free flow speed, vi. The notation wi+1 is
the backward shockwave speed specified by the fundamental diagram at the downstream cell i
+ 1, and 1i is the jam density at cell i + 1. The quantity )(11 tii specifies the
available space for incoming traffic at the downstream cell i + 1 during time t. The above
formulation covers both congested and uncongested regimes.
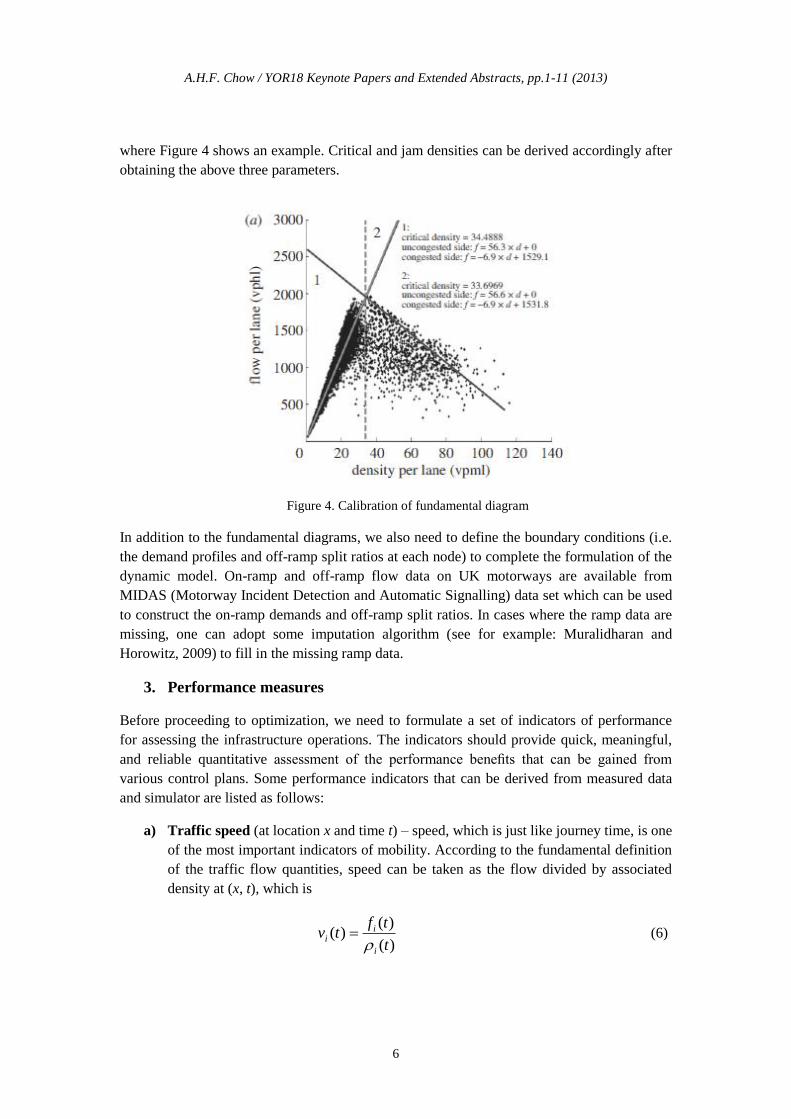
2.3. Calibration of cell transmission model
The fundamental diagrams in the cell transmission model will have to be calibrated before the
model can represent the real world traffic dynamics. As an illustration, Figure 4 shows a
scatter plot of flow against density data from a typical detector on motorway. The scatter plot
shows a bivariate relationship between flow and density as discussed in previous section. For
each of these useable detector stations (i.e. detector containing valid data), calibration of the
corresponding fundamental diagram can be carried out in three stages: determination of free-
flow speed v, determination of capacity Q, and determination of congestion shockwave speed
w. Given the flow-density data, these parameters can be determined by a least-square method
A.H.F. Chow / YOR18 Keynote Papers and Extended Abstracts, pp.1-11 (2013)
6
where Figure 4 shows an example. Critical and jam densities can be derived accordingly after
obtaining the above three parameters.
Figure 4. Calibration of fundamental diagram
In addition to the fundamental diagrams, we also need to define the boundary conditions (i.e.
the demand profiles and off-ramp split ratios at each node) to complete the formulation of the
dynamic model. On-ramp and off-ramp flow data on UK motorways are available from
MIDAS (Motorway Incident Detection and Automatic Signalling) data set which can be used
to construct the on-ramp demands and off-ramp split ratios. In cases where the ramp data are
missing, one can adopt some imputation algorithm (see for example: Muralidharan and
Horowitz, 2009) to fill in the missing ramp data.
3. Performance measures
Before proceeding to optimization, we need to formulate a set of indicators of performance
for assessing the infrastructure operations. The indicators should provide quick, meaningful,
and reliable quantitative assessment of the performance benefits that can be gained from
various control plans. Some performance indicators that can be derived from measured data
and simulator are listed as follows:
a) Traffic speed (at location x and time t) – speed, which is just like journey time, is one
of the most important indicators of mobility. According to the fundamental definition
of the traffic flow quantities, speed can be taken as the flow divided by associated
density at (x, t), which is
)(
)()(
t
tftv
i
ii
(6)

Modelling and Management of Road Transport Infrastructure – A LP Approach
7
b) Vehicle-Distance-Travelled (VDT) – is the measure of the throughput of the link
during the current time step:
txtftVDT iii )()( (7)
c) Vehicle-Hour-Travelled (VHT) – reflects the time that the vehicles spend in the
link:
txttVHT iii )()( (8)
d) Delay (D) –
f
iii
v
tVDTtVHTtD
)()()( (9)
where fv is a predefined free flow speed threshold.
It is noted that all the performance indicators can be computed at run time of the simulation
model. Knowing these performance indicators one can evaluate the overall performance of
different control plans.
4. Control and optimization
Consider motorway operations, there are three main control strategies: ramp metering,
variable speed control, and dynamic hard shoulder. They are introduced briefly as follows.
Ramp metering (see Figure 5) aims at improving the traffic flow on motorway by
regulating the inflow from the on-ramps to the mainstream. Ramp metering can be either
fixed time or traffic-responsive. Traffic responsive meters are based on real-time
measurements from detectors or other kinds of sensors installed in the motorway network.
Ramp metering can further be classified into local or coordinated.
Figure 5 UK installation of ramp metering system (Source: Highways Agency, 2007)

A.H.F. Chow / YOR18 Keynote Papers and Extended Abstracts, pp.1-11 (2013)
8
Variable speed control scheme aims to adjust to speed limit according to traffic
conditions on the road. The objective is to improve mobility through managing the
formation of congestion and smoothing traffic flow, as well as safety through
reducing the variance in speed.
Dynamic hard shoulder - on a conventional motorway, the hard shoulder must not
be driven on except in an emergency or breakdown. In areas where a “Dynamic hard
shoulder” scheme is in force, motorists may use the hard shoulder as a running lane
when indicated.
The control strategies can be implemented in a local and „ad-hoc‟ manner in which we can
make use of measurements from the vicinity of the controllers. Some prominent examples of
local strategies include ALINEA strategy (Papageorgiou et al., 1991) and its variations. The
ALINEA strategy and its variations are feedback control schemes targeting a set-point
(typically the critical value) for the downstream occupancy.
The weakness of the control strategies mentioned above is that they are local and feedback
(i.e. they operate based upon observations in the past). An effective control system should be
network-wide and predictive. The need for a predictive global control system leads to the
development of a centralized optimization algorithm.
The optimization algorithm uses a traffic model of the infrastructure network and predict the
response of the system to the control actions. It consists of the following components:
1. the objective function;
2. the traffic model with calibrated parameters;
3. origin-destination pairs for the motorway network;
4. the definition and constraint set on the control variables.
It is known that the traffic dynamics in cell transmission model (the outflow function, (5)) can
be reformulated as the following linear program (Lo, 1999, Ziliaskopoulos, 2000, Gomez and
Horowitz, 2006):
Maximize )(tf i
Subject to )()( tvtf iii (10)
ii Qtf )( (11)
)()( 111 twtf iiii (12)
for all cell i and time t.

Modelling and Management of Road Transport Infrastructure – A LP Approach
9
This enables the optimization problem based upon cell transmission model to be formulated
as a linear programming (LP) and to be solved sequentially in time and space by established
algorithm (e.g. SIMPLEX algorithm) for the global optimal solution.
Given the network configuration (with calibrated parameters: iv , iQ , iw , and i ) and
demands, we can formulate a optimization problem that aims to seek an optimal flow pattern
that minimizes the total network delay as follows:
i t f
i
i
i t
iv
tVDTtVHTtD
)()()(min (13)
subject to
conservation equation (4)
outflow equations (10), (11), and (12)
constraints on control variables (e.g. maximum queue lengths, minimum
speed limits, etc)
The global optimal solution obtained from the programming may not be readily
implementable in practice, say, one may not be able to limit the access from every single
ramp or the speed at every single section along the motorway. However, it provides useful
insights and guidance on how we should manage traffic flow. The LP formulation has been
used to solve for optimal signal timing strategies in urban networks (Lo, 1999) and ramp
metering strategies in freeway networks (Gomez, 2004).
The control plans can be implemented and tested on the macroscopic model through
manipulating the model parameters. For example, ramp metering can be implemented by
adjusting the ramp inflow rate ( ir ) of the associated on-ramps, variable speed limit by
adjusting the free-flow speed ( iv ) of the associated sections or cells, hard shoulder running
can be captured by adjusting the capacity value ( iQ ) of the associated sections.
5. Conclusion
This paper presents a linear modelling and optimisation framework for transport infrastructure
management where we illustrate through a specific example of motorway networks. The
framework is developed by using Daganzo‟s (1994) macroscopic cell transmission model,
which is shown to be a plausible and reliable representation of real traffic through extensive
theoretical and empirical studies. With the piecewise linear structure of the cell transmission
model, the corresponding optimization of network operations can be formulated as a linear
programming which can be solved by established algorithms for the global optimal solution.
The optimal solution may not be readily implementable in practice, while it provides

A.H.F. Chow / YOR18 Keynote Papers and Extended Abstracts, pp.1-11 (2013)
10
important insights to how we should manage traffic flow. For motorway management, the
optimal solution can be used as guidelines for deriving ramp metering, variable speed limit,
and dynamic hard shoulder running strategies for maximizing efficiency, reliability, and
safety of motorway operations. The optimizer can also be implemented into a dynamic
optimization framework, say optimal control and dynamic programming, for real-time
operations. The work presented herein contributes to the assessment, modelling and
management of transport infrastructure.
Acknowledgement
The work presented in the paper is a result of research conducted at University of California
at Berkeley where the author was a postdoctoral researcher under the California PATH
program, and at University College London where the author is currently a lecturer in the
Centre for Transport Studies.
References
Carey, M., Bowers, M. (2012) A review of properties of flow-density functions.
Transportation Reviews 32(1): 49-73.
Daganzo, C (1994). The cell-transmission model: a simple dynamic representation of
highway traffic. Transportation Research Part B 28(4): 269-287.
Gomez G (2004). Optimization and micro-simulation of ramp metering strategies for
congested freeways. PhD thesis, University of California at Berkeley, USA.
Gomes, G. and Horowitz, R. (2006) Optimal freeway ramp metering using the asymmetric
cell transmission model. Transportation Research Part C 14(4): 244 – 262.
Heydecker, B., Addison, J. (2011) Analysis and modelling of traffic flow under variable
speed limits. Transportation Research Part C 19: 206-217.
Hegyi A (2004). Model predictive control for integrating traffic control measures. PhD thesis,
Technische Universiteit Delft, The Netherlands.
Highways Agency (2007) Ramp metering – summary report.
Kotsialos, A. and Papageorgiou M. (2001) The importance of traffic flow modeling for
motorway traffic control. Networks and Spatial Economics 1: 179-203.
Kurzhanskiy , A and Varaiya P (2010). Active traffic management on road networks: a
macroscopic approach. Philosophy Transactions of the Royal Society A 368: 4607 -
4626.
Lighthill, M and Whitham J B (1955). On kinematic waves. I. Flow movements in long
rivers. II. A theory of traffic flow on long crowded road. Proceedings of Royal Society
A 229: 281-345.

Modelling and Management of Road Transport Infrastructure – A LP Approach
11
Lo, H (1999). A novel traffic signal control formulation. Transportation Research Part A 33:
433-448.
Muralidharan, A. and Horowitz, R. (2009) Imputation of ramp data flow for freeway traffic
simulation. Transportation Research Record 2099: 58 – 64.
Papgeorgiou, M, Hadj-Salem, H and Blosseville, H (1991) Alinea: A local feedaback control
law for onramp metering. Transportation Research Record 1320.
Richards, P I (1956). Shockwaves on the highway. Operation Research 4: 42 - 51.
Ziliaskopoulos, A (2000) A linear programming model for the single destination system
optimum dynamic traffic assignment problem. Transportation Science 34(1): 37 – 49.

YOR18 Biennial Conference - Keynote Papers and Extended Abstracts, pp.12 -24
University of Exeter, 9-11 April 2013
Optimisation
12
KEYNOTE
Strong First-Level RLT Relaxations of Mixed 0-1 Programs
Franklin Djeumou Fomeni, Konstantinos Kaparis and Adam N. Letchford
Department of Management Science, Lancaster University
Management School, Lancaster LA1 4YX, United Kingdom
{F.DjeumouFomeni, K.Kaparis, A.N.Letchford}@lancaster.ac.uk
Abstract
The Reformulation-Linearization Technique (RLT), due to Sherali and Adams, is used to
construct hierarchies of linear programming relaxations of various optimisation problems. We
review the first-level (RLT) relaxation, along with alternative relaxations for mixed 0-1
programs. We also describe a method for generating cutting planes in the space of the first-
level RLT relaxation, based on optimally weakening valid inequalities for the second-level.
The resulting cutting planes can be applied to any pure or mixed 0-1 program with a linear or
quadratic objective function, and any mixture of linear, quadratic and convex constraint
functions.
Keywords: Reformulation-linearization technique, Cutting planes, 0-1 quadratic
programming, Quadratic knapsack problem, Quadratic assignment problem.
1. Introduction
Numerous methods for tackling `hard' optimization problems, rely on solving some relaxation
of the original problem. By relaxing the `hard' conditions of the given formulation, one yields
a bound and other useful information for the true optimal solution. This information can be
exploited within an algorithmic framework to guide the search of the solution space. The most
prominent example is probably the linear programming (LP) relaxation for integer linear
programs, obtained by relaxing the integrality condition.
The Reformulation-Linearization Technique (RLT), developed by Adams, Sherali and co-
authors, is a general framework for constructing strong linear programming relaxations of
various optimisation problems. It was first developed in Sherali and Adams (1990), in the
context of 0-1 Linear Programs (0-1 LPs). Then, in Sherali and Adams (1994), it was
extended to the mixed case, i.e., the case in which some variables are continuous rather than
binary. Since then, it has been further extended, to cover a wide range of integer
programming and global optimisation problems (see, see, e.g., Sherali (2007); Sherali and
Adams (1998)).
Actually, RLT enables one to construct an entire hierarchy of LP relaxations. If the original
problem has n variables, then the first relaxation in the hierarchy, the so-called first-level
Strong First-Level RLT Relaxations of Mixed 0-1 Programs
13
relaxation, has an additional 2
n
variables. The relaxation above it, the second-level
relaxation, has a further 3
n
variables, and so on. This hierarchy has some interesting
theoretical properties, but, for many problems of practical interest, one can hope to solve only
the first-level relaxation, since the higher-level relaxations have too many variables. In fact,
even solving the first-level relaxation can be a challenge.
First-level RLT relaxations can be derived for many different kinds of problems; specifically,
any mixed 0-1 program in which the objective function is either linear or quadratic, and each
constraint is either linear, quadratic or convex. In this paper, we present a procedure for
generating valid linear inequalities that strengthen these relaxations. The inequalities are
derived by taking valid linear inequalities for the second-level relaxation (which can be easily
derived in a number of ways), and then weakening them to make them valid for the first-level
relaxation. Interestingly, a single valid second-level inequality can be the source for an
exponentially-large number of first-level inequalities.
The paper is organised as follows. In Section 2, we review the relevant literature. In Section
3, we present the valid inequalities and discuss the associated separation algorithms, for the
special case in which all of the original constraints are linear. Some concluding remarks are
presented in Section 4.
2. Literature review
2.1. The original version of RLT
The RLT was first introduced in Sherali and Adams (1990), in the context of 0-1 LPs.
Suppose we have a 0-1 LP of the form:
min Tc x (1)
. .s t Ax b (2)
{0,1} ,nx (3)
where nc Q ,
m nA Q and mb Q . The continuous relaxation of the 0-1 LP is the
problem obtained by replacing the constraints (3) with the weaker constraints [0,1]nx .
Let ={1, , }N n . For all pairs { , }i j N , let ijy be a new binary variable, representing
the product i jx x . We now construct new linear inequalities involving the x and y variables,
in the following way:
Each linear inequality in the system (2), say T x , is multiplied by each variable
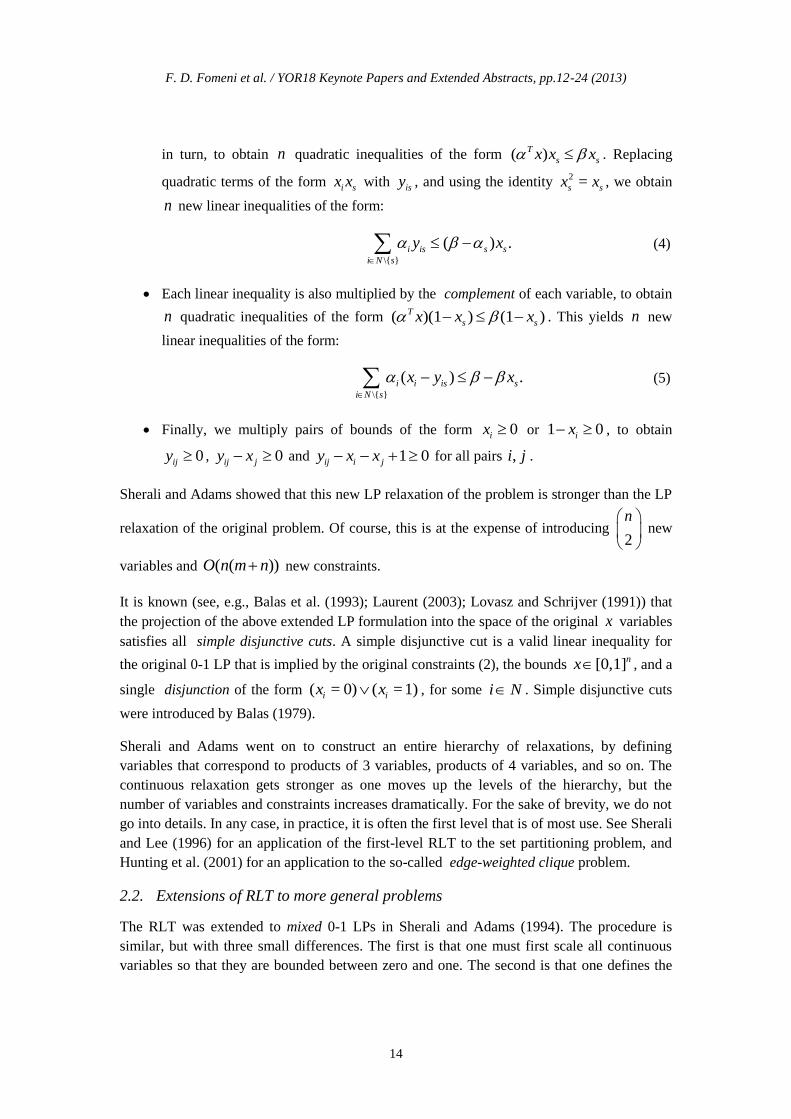
F. D. Fomeni et al. / YOR18 Keynote Papers and Extended Abstracts, pp.12-24 (2013)
14
in turn, to obtain n quadratic inequalities of the form ( )T
s sx x x . Replacing
quadratic terms of the form i sx x with isy , and using the identity 2 =s sx x , we obtain
n new linear inequalities of the form:
\{ }
( ) .i is s s
i N s
y x
(4)
Each linear inequality is also multiplied by the complement of each variable, to obtain
n quadratic inequalities of the form ( )(1 ) (1 )T
s sx x x . This yields n new
linear inequalities of the form:
\{ }
( ) .i i is s
i N s
x y x
(5)
Finally, we multiply pairs of bounds of the form 0ix or 1 0ix , to obtain
0ijy , 0ij jy x and 1 0ij i jy x x for all pairs ,i j .
Sherali and Adams showed that this new LP relaxation of the problem is stronger than the LP
relaxation of the original problem. Of course, this is at the expense of introducing 2
n
new
variables and ( ( ))O n m n new constraints.
It is known (see, e.g., Balas et al. (1993); Laurent (2003); Lovasz and Schrijver (1991)) that
the projection of the above extended LP formulation into the space of the original x variables
satisfies all simple disjunctive cuts. A simple disjunctive cut is a valid linear inequality for
the original 0-1 LP that is implied by the original constraints (2), the bounds [0,1]nx , and a
single disjunction of the form ( = 0) ( =1)i ix x , for some i N . Simple disjunctive cuts
were introduced by Balas (1979).
Sherali and Adams went on to construct an entire hierarchy of relaxations, by defining
variables that correspond to products of 3 variables, products of 4 variables, and so on. The
continuous relaxation gets stronger as one moves up the levels of the hierarchy, but the
number of variables and constraints increases dramatically. For the sake of brevity, we do not
go into details. In any case, in practice, it is often the first level that is of most use. See Sherali
and Lee (1996) for an application of the first-level RLT to the set partitioning problem, and
Hunting et al. (2001) for an application to the so-called edge-weighted clique problem.
2.2. Extensions of RLT to more general problems
The RLT was extended to mixed 0-1 LPs in Sherali and Adams (1994). The procedure is
similar, but with three small differences. The first is that one must first scale all continuous
variables so that they are bounded between zero and one. The second is that one defines the

Strong First-Level RLT Relaxations of Mixed 0-1 Programs
15
variables ijy only when at least one of the variables ix and
jx is binary. The third is that one
multiplies the original linear inequalities and bounds only by binary variables and their
complements.
Adams and Sherali (1986) applied the first-level RLT to 0-1 quadratic programs. The idea is
simply that any quadratic term i jx x in the objective function is replaced with the
corresponding term ijy . This RLT variant has been applied, for example, to the quadratic
assignment problem Adams and Johnson (1994), the quadratic semi-assignment problem
Saito et al. (2009), the quadratic three-dimensional assignment problem Hahn et al. (2008),
the quadratic knapsack problem Billionnet and Calmels (1996) and the linear arrangement
problem Amaral (2009).
The RLT has been extended to many other problems in integer programming and global
optimisation. See, e.g., Sherali (2007); Sherali and Adams (1998) for details. Also see Laurent
(2003) for a comparison between the Sherali-Adams procedure and other related procedures.
One other extension of particular relevance to us, due to Lovasz and Schrijver (1991), is the
following: suppose that, instead of being given a linear inequality system Ax b , one is
simply given the condition that x must belong to some convex set [0,1]nC . One can
define inequalities of the form (4) and (5) in this more general setting, by choosing any pair
( , ) such that the inequality T x is valid for C . Lovasz and Schrijver showed that,
if an efficient separation algorithm exists for C , then an efficient separation algorithm exists
also for the inequalities that can be derived in this way.
2.3. Further relaxations
Relaxations alternative to the first level RLT have been proposed in the literature. In this
subsection, we briefly outline some of them.
2.3.1. Polyhedral theory
Given a nonempty and compact set described by a finite set of linear inequalities, the convex
hull of its integer points is a polytope characterized by a finite set of linear inequalities.
Unfortunately, for most practical cases computing the full polyhedral description of the
convex hull is a hard `problem'. Still, partial descriptions can be rather useful since they can
reduce significantly the number of points that should be enumerated.
A milestone idea was introduced by Fortet in his seminal paper (1959). He outlined a way to
linearize any pure 0-1 quadratic problem with n binaries by adding O2( )n binaries and
constraints. Linearisation methods with O ( )n additional variables and constraints were
proposed later on by Glover (1975) and more recently by others (Chaovalitwongse et al.
(2004); Adams and Forester (2005); Sherali and Smith (2007)).
F. D. Fomeni et al. / YOR18 Keynote Papers and Extended Abstracts, pp.12-24 (2013)
16
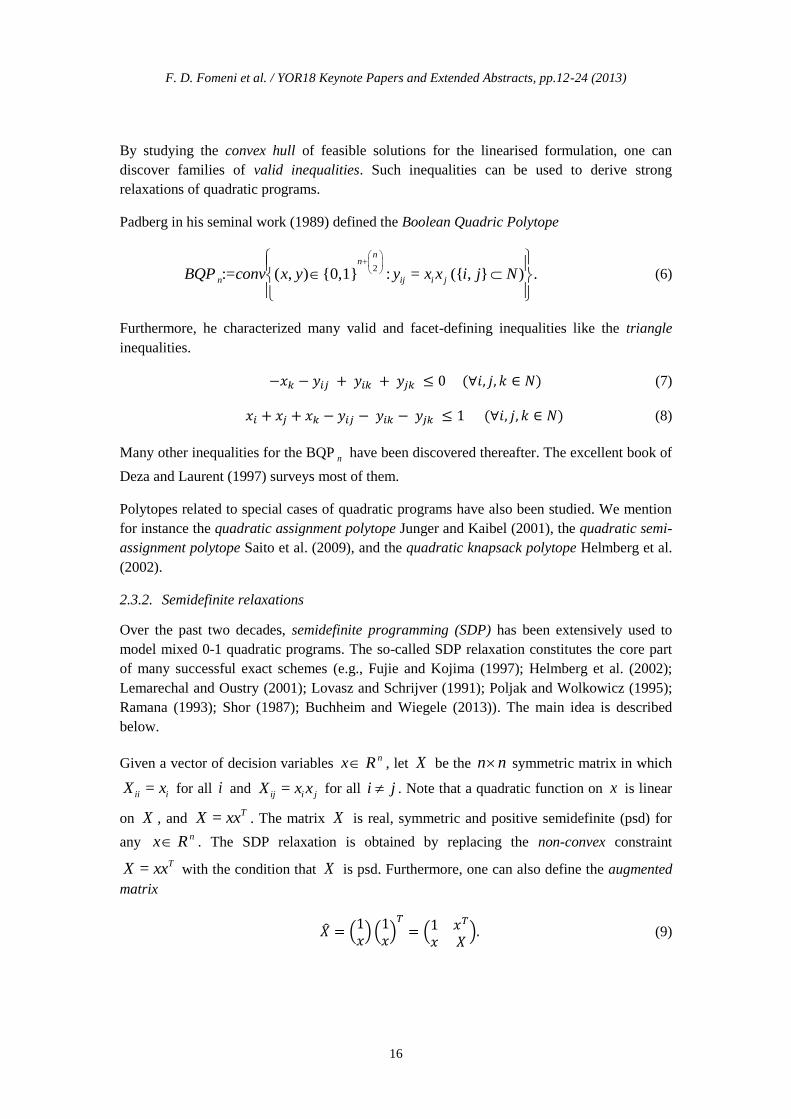
By studying the convex hull of feasible solutions for the linearised formulation, one can
discover families of valid inequalities. Such inequalities can be used to derive strong
relaxations of quadratic programs.
Padberg in his seminal work (1989) defined the Boolean Quadric Polytope
2
:= ( , ) {0,1} : = ({ , } ) .
nn
n ij i jBQP conv x y y x x i j N
(6)
Furthermore, he characterized many valid and facet-defining inequalities like the triangle
inequalities.
(7)
(8)
Many other inequalities for the BQP n have been discovered thereafter. The excellent book of
Deza and Laurent (1997) surveys most of them.
Polytopes related to special cases of quadratic programs have also been studied. We mention
for instance the quadratic assignment polytope Junger and Kaibel (2001), the quadratic semi-
assignment polytope Saito et al. (2009), and the quadratic knapsack polytope Helmberg et al.
(2002).
2.3.2. Semidefinite relaxations
Over the past two decades, semidefinite programming (SDP) has been extensively used to
model mixed 0-1 quadratic programs. The so-called SDP relaxation constitutes the core part
of many successful exact schemes (e.g., Fujie and Kojima (1997); Helmberg et al. (2002);
Lemarechal and Oustry (2001); Lovasz and Schrijver (1991); Poljak and Wolkowicz (1995);
Ramana (1993); Shor (1987); Buchheim and Wiegele (2013)). The main idea is described
below.
Given a vector of decision variables nx R , let X be the n n symmetric matrix in which
=ii iX x for all i and =ij i jX x x for all i j . Note that a quadratic function on x is linear
on X , and = TX xx . The matrix X is real, symmetric and positive semidefinite (psd) for
any nx R . The SDP relaxation is obtained by replacing the non-convex constraint
= TX xx with the condition that X is psd. Furthermore, one can also define the augmented
matrix
( ) (
)
(
) (9)

Strong First-Level RLT Relaxations of Mixed 0-1 Programs
17
which is also a psd matrix. SDP relaxations for quadratic programs are based on this
principle.
It is worth pointing out that the first-level RLT relaxation can be strengthened by using the
ideas described in Subsections (2.3.1) and (2.3.2). Moreover, one can add the constraint that
the augmented matrix X must be psd Lovasz and Schrijver (1991). As Anstreicher (2009)
showed the quality of the resulting bounds is substantially improved, but the extra
computational cost is rather excessive. Similarly, valid inequalities for the Boolean quadric
polytope can be used to strengthen the first level RLT relaxation.
As well as multiplying linear inequalities by individual variables or their complements, one
can also multiply pairs of linear inequalities together (Lovasz and Schrijver (1991)).
Specifically, given two inequalities of the form T x and
T x , one sees that
( )( ) 0T Tx x , which yields the valid inequality
0.T T TX x x (10)
3. New cutting planes for the linear case
In this section, we show how to generate cutting planes for first-level RLT relaxations of
mixed 0-1 linear programs. Note that, for such problems, we need to define the variable ijy
only when at least one of ix and jx are binary.
Throughout this section, N , A , b , n and m are defined as in Subsection 2.1. We also let
B N denote the index set of the binary variables. (Note that the number of binary
variables is then | |
| | ( | |)2
BB n B
.) We also let Q denote the convex hull of pairs
( , )x y that satisfy the constraints:
Ax b
{0,1}( )ix i B
[0,1]( \ )ix i N B
= ({ , } ,{ , } ).ij i jy x x i j N i j B
Also, for any S N and any nQ , we will let ( )S denote ii S
, S
denote
{ : > 0}ii S and S denote { : < 0}ii S .

F. D. Fomeni et al. / YOR18 Keynote Papers and Extended Abstracts, pp.12-24 (2013)
18
3.1. The main concept
Our method is based on the following idea. First, we construct a 'cubic' valid inequality, by
which we mean a non-linear inequality that involves products of up to three x variables, but
no y variables. Then, we weaken the cubic inequality, in order to make it valid for Q .
So, to begin with, let us consider possible ways of generating cubic inequalities. In our view,
the most obvious are the following:
1. We can take three binary variables, say ix , jx and kx , and form the following four
cubic inequalities:
0i j kx x x (11)
(1 ) 0i j kx x x (12)
(1 )(1 ) 0i j kx x x (13)
(1 )(1 )(1 ) 0.i j kx x x (14)
2. We can take a single linear inequality from the system Ax b , say T x , and
two binary variables, say sx and tx , and form the following three cubic inequalities:
( ) 0T
s tx x x (15)
( ) (1 ) 0T
s tx x x (16)
( )(1 )(1 ) 0.T
s tx x x (17)
3. We can take two linear inequalities from the system Ax b , say 1 1x and
2 2x , and a single binary variable, say sx , and form the following two cubic
inequalities:
1 1 2 2( )( ) 0sx x x (18)
1 1 2 2( )( )(1 ) 0.sx x x (19)
4. We can take three linear inequalities from the system Ax b , say i ix for
=1,2,3i , and form the following single cubic inequality:
1 1 2 2 3 3( )( )( ) 0.x x x (20)
Strong First-Level RLT Relaxations of Mixed 0-1 Programs
19
Some more complex ways of generating cubic inequalities are described in Formeni et al.
(2013). For now, however, let us consider how we can weaken a cubic inequality in order to
make it valid for Q . Since quadratic terms of the form i jx x can be replaced with
ijy , and
linear and constant terms can be left unchanged, the only real issue is how to deal with cubic
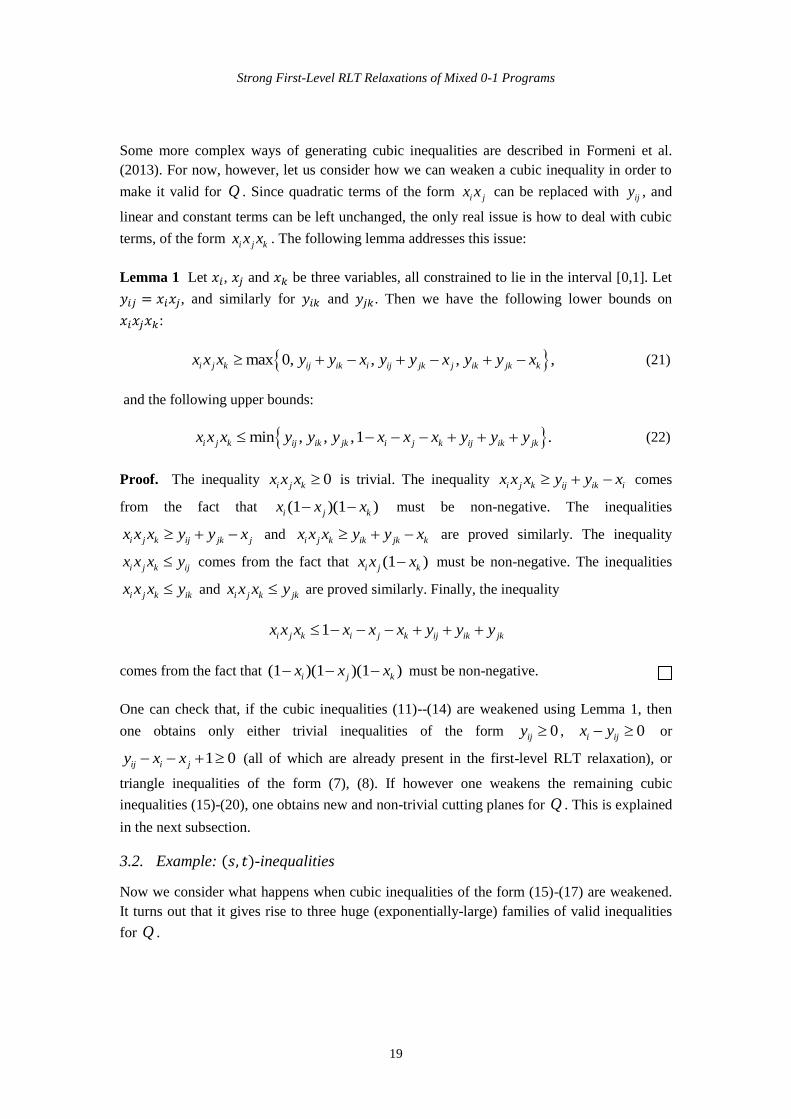
terms, of the form i j kx x x . The following lemma addresses this issue:
Lemma 1 Let , and be three variables, all constrained to lie in the interval [0,1]. Let
, and similarly for and . Then we have the following lower bounds on
:
max 0, , , ,i j k ij ik i ij jk j ik jk kx x x y y x y y x y y x (21)
and the following upper bounds:
min , , ,1 .i j k ij ik jk i j k ij ik jkx x x y y y x x x y y y (22)
Proof. The inequality 0i j kx x x is trivial. The inequality i j k ij ik ix x x y y x comes
from the fact that (1 )(1 )i j kx x x must be non-negative. The inequalities
i j k ij jk jx x x y y x and i j k ik jk kx x x y y x are proved similarly. The inequality
i j k ijx x x y comes from the fact that (1 )i j kx x x must be non-negative. The inequalities
i j k ikx x x y and i j k jkx x x y are proved similarly. Finally, the inequality
1i j k i j k ij ik jkx x x x x x y y y
comes from the fact that (1 )(1 )(1 )i j kx x x must be non-negative.
One can check that, if the cubic inequalities (11)--(14) are weakened using Lemma 1, then
one obtains only either trivial inequalities of the form 0ijy , 0i ijx y or
1 0ij i jy x x (all of which are already present in the first-level RLT relaxation), or
triangle inequalities of the form (7), (8). If however one weakens the remaining cubic
inequalities (15)-(20), one obtains new and non-trivial cutting planes for Q . This is explained
in the next subsection.
3.2. Example: -inequalities
Now we consider what happens when cubic inequalities of the form (15)-(17) are weakened.
It turns out that it gives rise to three huge (exponentially-large) families of valid inequalities
for Q .
F. D. Fomeni et al. / YOR18 Keynote Papers and Extended Abstracts, pp.12-24 (2013)
20
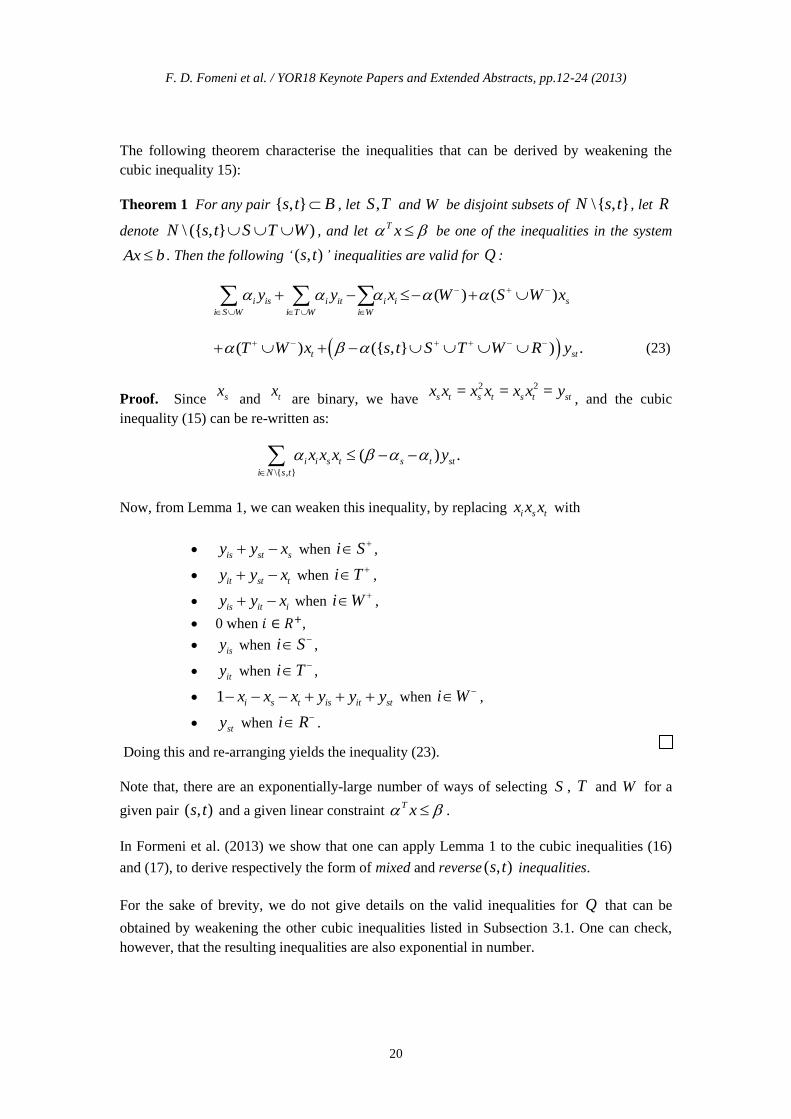
The following theorem characterise the inequalities that can be derived by weakening the
cubic inequality 15):
Theorem 1 For any pair { , }s t B , let ,S T and W be disjoint subsets of \{ , }N s t , let R
denote \ ({ , } )N s t S T W , and let T x be one of the inequalities in the system
Ax b . Then the following „ ( , )s t ‟ inequalities are valid for Q :
( ) ( )i is i it i i s
i S W i T W i W
y y x W S W x
( ) ({ , } ) .t stT W x s t S T W R y (23)
Proof. Since sx and tx
are binary, we have 2 2= = =s t s t s t stx x x x x x y
, and the cubic
inequality (15) can be re-written as:
\{ , }
( ) .i i s t s t st
i N s t
x x x y
Now, from Lemma 1, we can weaken this inequality, by replacing i s tx x x with
is st sy y x when i S ,
it st ty y x when i T ,
is it iy y x when i W ,
0 when ,
isy when i S ,
ity when i T ,
1 i s t is it stx x x y y y when i W ,
sty when i R .
Doing this and re-arranging yields the inequality (23).
Note that, there are an exponentially-large number of ways of selecting S , T and W for a
given pair ( , )s t and a given linear constraint T x .
In Formeni et al. (2013) we show that one can apply Lemma 1 to the cubic inequalities (16)
and (17), to derive respectively the form of mixed and reverse ( , )s t inequalities.
For the sake of brevity, we do not give details on the valid inequalities for Q that can be
obtained by weakening the other cubic inequalities listed in Subsection 3.1. One can check,
however, that the resulting inequalities are also exponential in number.

Strong First-Level RLT Relaxations of Mixed 0-1 Programs
21
3.3. Separation
Since the inequalities produced by our procedure are exponential in number, we need
separation algorithms. For a given family of inequalities, the separation algorithm takes a
fractional point * *( , )x y as input, and outputs a violated inequality in that family, if one
exists.
It turns out that, for all families of inequalities that can be generated using our procedure, the
separation problem can be solved easily in polynomial time. To see this, note first that the
cubic inequalities (11)-(20) are polynomial in number. Then, for each one, we can obtain a
most-violated cutting plane (if any exists) as follows. Consider each cubic term i j kx x x in
turn. If it has a positive coefficient on the left-hand side of the cubic inequality, then replace it
with the term on the right-hand side of (22) that has the smallest value at * *( , )x y . If it has a
negative left-hand side coefficient, replace it with the term on the right-hand side of (21) that
has the largest value at * *( , )x y .
As an illustration, the following theorem applies this general separation scheme to the ( , )s t
inequalities presented in the previous subsection. The complete proof of the theorem is given
in Formeni et al. (2013).
Theorem 2 The separation problem for the ( , )s t inequalities (23) can be solved exactly in
2( | | )O mn B time.
One can solve the separation problems for the mixed ( , )s t inequalities and reverse ( , )s t
inequalities, in 2( | | )O mn B time, in a similar way. Moreover, using the same strategy, one
can show the following results:
Proposition 1 The separation problem for the inequalities that can be derived by weakening
the cubic inequalities (18) and (19) can be solved exactly in 2 2( | |)O m n B time.
Proposition 2 The separation problem for the inequalities that can be derived by weakening
the cubic inequalities (20) can be solved exactly in 3 3( )O m n time.
We omit the (simple but tedious) proofs for brevity. Note that the running times given in these
last two propositions are rather excessive, unless m is small.
In Formeni et al. (2013) we use a simple disjunctive argument to strengthen the (s,t)
inequalities. Furthermore, we show that the separation problem for the strong (s,t) inequalities
can be solved exactly in 2 2( | |)O m n B time.

F. D. Fomeni et al. / YOR18 Keynote Papers and Extended Abstracts, pp.12-24 (2013)
22
4. Concluding remarks
The RLT constitutes a general framework for constructing strong relaxations of various
optimizations problems. Practically, it is the first level that is applied in most real cases due to
the excessive size of higher level formulations.
We showed that one can introduce in the first level RLT relaxation some of the strength of the
second level without the burden of the extra variables implied by the latter. Moreover, We
introduced three exponentially-large families of valid inequalities that can strengthen the first-
level RLT relaxation and can be separated in polynomial time.
Possible topics for future research could include (i) a search for more general families of valid
inequalities that could be used to further strengthen the relaxations, (ii) the derivation of
analogous valid inequalities for higher levels of the RLT hierarchy, and (iii) the incorporation
of our valid inequalities and separation algorithms into branch-and-cut algorithms for specific
problems, such as the quadratic assignment, quadratic knapsack and edge-weighted b-clique
problems.
References
W.P. Adams & R.J. Forester (2005) A simple recipe for concise mixed 0-1 linearizations.
Oper. Res. Lett., 33, 55-61.
W.P. Adams & T. Johnson (1994) Improved linear programming-based lower bounds for the
quadratic assignment problem. In: P. Pardalos & H. Wolkowicz (eds.) Quadratic
Assignment and Related Problems, pp. 43--77. DIMACS Series in Discrete
Mathematics and Theoretical Computer Science, Vol. 16. AMS Publications.
W.P. Adams & H.D. Sherali (1986) A tight linearization and an algorithm for 0-1 quadratic
programming problems. Man. Sci., 32, 1274-1290.
A.R.S. Amaral (2009) A mixed 0-1 linear programming formulation for the exact solution of
the minimum linear arrangement problem. Optim. Lett., 3, 513-520.
K. M. Anstreicher (2009) Semidefinite programming versus the reformulation-linearization
technique for nonconvex quadratically con- strained quadratic programming. J. Glob.
Opt., 43, 471-484.
E. Balas (1979) Disjunctive programming. Ann. Discr. Math., 5, 3-51.
E. Balas, S. Ceria & G. Cornuéjols (1993) A lift-and-project cutting plane algorithm for
mixed 0-1 programs. Math. Program., 58, 295-324.
A. Billionnet & F. Calmels (1996) Linear programming for the 0-1 quadratic knapsack
problem. Eur. J. Oper. Res., 92, 310-325.

Strong First-Level RLT Relaxations of Mixed 0-1 Programs
23
E. Boros & P. L. Hammer (2002) Pseudo-Boolean optimization. Discr. Appl. Math., 123,
155-225.
C. Buchheim & A. Wiegele (2013). Semidefinite relaxations for non-convex quadratic mixed-
integer programming. Math. Prog., DOI 10.1007/s10107-012-0534-y.
W. Chaovalitwongse, P. M. Pardalos, & O. A. Prokopyev (2004) A new linearization
technique for multi-quadratic 0-1 programming problems. Oper Res. Lett., 32(6):517-
522.
M.M. Deza & M. Laurent (1997) Geometry of Cuts and Metrics. Berlin: Springer.
F. D. Formeni, K. Kaparis & A. N. Letchford (2013) Cutting Planes for First-Level RLT
Relaxations on Mixed 0-1 Programs. working paper, source:
http://www.lancs.ac.uk/staff/letchfoa/articles/RLT.pdf.
R. Fortet. (1959) L' Algèbre d Boole et ses applications en recherche opérationnelle. Cahiers
Centre Etudes Rech. Oper. no., 4:5-36.
T. Fujie & M. Kojima (1997) Semidefinite programming relaxation for nonconvex quadratic
programs. J./ Glob./ Opt., 10, 367-380.
P.M. Hahn, B.-J. Kim, T. Stützle, S. Kanthak, W.L. Hightower, H. Samra, Z. Ding & M.
Guignard (2008) The quadratic three-dimensional assignment problem: Exact and
approximate solution methods. Eur. J. Oper. Res., 184, 416-428.
F. Glover (1975) Improved linear integer programming formulations of nonlinear integer
programs. Mngt. Sci., 22, 455-460.
C. Helmberg, F. Rendl & R. Weismantel (2002) A semidefinite programming approach to the
quadratic knapsack problem. J. Comb. Opt., 4, 197-215.
M. Hunting, U. Faigle & W. Kern (2001) A Lagrangean relaxation approach to the edge-
weighted clique problem. Eur. J. Oper. Res., 131, 119-131.
M. Junger & V. Kaibel (2001) Box-inequalities for quadratic assignment polytopes. Math.
Program., 91, 175-197.
C. L. Lémaré c hal & F. Oustry (2001) SDP relaxations in combinatorial optimization from a
Lagrangian viewpoint. In N. Hadjisawas & P.M. Pardalos (eds.), Advances in Convex
Analysis and Global Optimization. Dortrecht: Kluwer.
M. Laurent (2003) A comparison of the Sherali-Adams, Lovasz-Schrijver, and Lasserre
relaxations for 0-1 programming. Oper. Res., 28, 470-496.
L. Lovasz & A.J. Schrijver (1991) Cones of matrices and set-functions and 0-1 optimization.
SIAM J. Optim., 1, 166-190.

F. D. Fomeni et al. / YOR18 Keynote Papers and Extended Abstracts, pp.12-24 (2013)
24
M.W. Padberg (1989) The Boolean quadric polytope: some characteristics, facets and
relatives. Math. Program., 45, 139-172.
S. Poljak & H. Wolkowicz (1995) Convex Relaxations of (0,1)-quadratic programming.
Math. Oper. Res., 20, 550-561.
M. Ramana (1993) An Algorithmic Analysis of Multiquadratic and Semidefinite Programming
Problems. PhD thesis, Johns Hopkins Uni- versity, Baltimore, MD.
H. Saito, T. Fujie, T. Matsui & S. Matuura (2009) A study of the quadratic semi-assignment
polytope. Discr. Opt., 6, 37-50.
H.D. Sherali (2007) RLT: A unified approach for discrete and continuous nonconvex
optimization. Ann. Oper. Res., 149, 185–193.
H.D. Sherali & W. Adams (1990) A hierarchy of relaxations between the continuous and
convex hull representations for 0-1 programming problems. SIAM J. Discr. Math., 3,
411-430.
H.D. Sherali & W.P. Adams (1994) A hierarchy of relaxations and convex hull
characterizations for mixed-integer zero-one programming problems. Discr. Appl.
Math., 52, 83-106.
H.D. Sherali & W.P. Adams (1998) A Reformulation-Linearization Technique for Solving
Discrete and Continuous Nonconvex Problems. Dordrecht: Kluwer.
H.D. Sherali & Y. Lee (1996) Tighter representations for set partitioning problems. Discr.
Appl. Math., 68, 153--167.
H.D. Sherali & J. C. Smith (2007) An improved linearization strategy for zero-one quadratic
progamming problems. J. Glob. Opt., 32, 281-306.
N. Z. Shor (1987) Quadratic optimization problems. Sov. J. Comput. Syst. Sci., 25, 11.

YOR18 Biennial Conference - Keynote Papers and Extended Abstracts, pp.25-31
University of Exeter, 9-11 April 2013
Supply Chain
25
KEYNOTE
Case Study: OR in the Marks & Spencer Supply Chain
Vicky Forman
Marks and Spencer, London, UK
Abstract
Marks & Spencer is a UK-based retailer which over the last 20 years has become an
increasingly international multichannel retailer. To facilitate these changes and growth a
world class supply chain is needed. The current General Merchandise (non-food) supply
chain was set up in the 1980s and is in need of development by way of a new strategic
network. This development is currently underway with the building of a new E-commerce and
national distribution centre. The design and implementation of the new network needed a
large amount of data and for it to be analysed correctly. This is where OR has been used, in
the form of simulation, simple and not-so-simple analytics and mixed integer linear
programming, among others. A summary of the tools used, the benefits realised and
challenges faced during this process so far and going forward will be described.
Keywords: Supply chain; Logistics; Retail; Simulation; Warehousing
1. Background
Marks & Spencer is a UK-based retailer of food, clothing and homeware. The business was
established in 1884 as a „penny bazaar‟ in Leeds and now has over 1,000 stores in 43
countries with total global revenue of £9.9bn (Marks and Spencer, 2012).
The current supply chain supporting the General Merchandise (non-food) part of the business
was originally set up in the 1980s. Since that time, the business has seen substantial changes,
including globalisation of sourcing and stores, proliferation of store formats and product
range and the growing importance of multi-channel.
The “legacy” supply chain is characterised by a network of 110 distribution points in the UK,
with most products being handled at least twice prior to dispatch to stores and customers.
Home delivery was an add-on to the store replenishment network, with slow delivery and
poor availability.
The development of the new supply chain began in 2008, based on the principles of being
faster, leaner and more agile. The integration of multi-channel into the store supply chain is
critical to drive fast response to customer demand and improved inventory utilisation. The
new supply chain will ultimately reduce the number of sites to less than 10.
V. Forman / YOR18 Keynote Papers and Extended Abstracts, pp.25-31 (2013)
26
The General Merchandise supply chain delivers around 500m single items per year to stores
and customers from a catalogue of around 350,000 unique products (SKUs), handled either in
cartons or on hangers.
2. Data and analytics
To facilitate the transition from 110 distribution centres to less than 10, a large amount of core
business data was required, but initially there was no common source of all of this data. In
order to create this repository, a number of data extraction routines were created with data
being fed on a frequent (mostly daily/weekly) basis from a number of operational systems
into the „LDM‟ database. This database contains an accurate picture of all product
movements, including store and E-commerce sales and stock, product movements and
inventory. The database is now around 7TB in size, with new feeds being added when gaps
are identified and data becomes more readily available.
The data from LDM is used in a number of different ways to feed into the various projects
including amongst other things the design of the new network. In most cases, data is
channelled from LDM into Excel where it is merged with other data inputs and then
processed further. A range of OR tools alongside traditional data analysis have been used
including simulation, linear programming and transport scheduling.
3. Legacy network
Using the data in LDM for projects in the legacy network is just as important as designing the
new network. One key part of running an efficient warehouse is managing stock levels,
clearing end of life stock and maintaining appropriate levels of stock for active lines, freeing
up capacity for new lines. From the data held on warehouse stock and despatches and store
sales, SKUs can be classified as to what stage in the product lifecycle they are: new, active,
ending and dormant. Dormant stock (defined as a SKU that has not been received or
despatched from the warehouses for a defined period of time) is identified and flagged for
transfer out of the warehouse to “outlet” stores to free up space for new lines. Additionally
any excess stock in the current E-commerce warehouse is identified, defined as anything over
the required number of weeks‟ stock cover plus a buffer to ensure that any transfers would not
have an adverse effect of availability. The stock levels and despatches at other DCs were
analysed to see where best to move any excess stock to, with the aim of increasing availability
and thus sales.
A second piece of analysis looking at the current legacy network is a bespoke Cost-to-Serve
tool which models the margin generated by SKU and by location. The model provides insight
into the reasons why certain parts of the operations yield higher margin than others. Linked to
this model is the inventory model (another bespoke tool), developed to interact directly with
the LDM server. It simulates different rules impacting flow of product and determines the
required inventory at each node in the supply chain at SKU level. This has been used to
validate the design of the new strategic network in sizing the warehouse based on how much

Case Study: OR in the Marks & Spencer Supply Chain
27
stock and how many SKUs it is expected to need to hold. Other analytical tools have been
developed from the LDM data to look at parts of the legacy network with the aim of further
optimisation, including transport scheduling and modelling the storage and throughput
capacity of the sites.
4. Castle Donington
The first part of the new strategic network is Castle Donington EDC NDC, a national
distribution centre and E-commerce distribution centre for general merchandise. At 875kft2 in
area and 82ft high, it can hold 3,507 double decker buses or 11 Wembley football pitches.
The warehouse will hold both hanging and boxed products despatching to around 600 stores
and the homes of E-commerce customers. This solution is highly automated to drive
efficiency - for example, a hanging product that is required by stores will be manually
unloaded from the vehicle and will then not go through another manual process until it is
loaded onto the vehicle to the store.
Design of the site began in 2009 and transition will start from April 2013. Throughout this
time, a variety of tools have been used for its design and implementation. Before designing
the site a mixed integer linear programme was used to determine the optimum network
configuration including the number of sites and their locations.
Design is not solely about the building of the optimum site for the end state but must also
include the ability to operate as efficiently as possible during the transition phase. To model
this a supply route optimisation tool was used. Castle Donington needs to start up with a sub-
optimal product load for a short period of time. In order to limit the impact of this sub-optimal
routing, a mixed integer model was created to maximise the potential of the site within the
physical constraints of the materials handling equipment and building.
4.1. Simulation
One of the key tools in the design and implementation of Castle Donington are five discrete
event simulation models, which simulate the main flows through the site (both automated and
manual) from goods in through to goods out. The five models are:
1. Boxed goods in and pallet high bay
2. Bulk carton store (BCS) and box picking
3. Hanging high bay storage and picking
4. E-commerce packing and despatch
5. Store despatch
The simulations have been developed with Saker Solutions in Flexsim.
V. Forman / YOR18 Keynote Papers and Extended Abstracts, pp.25-31 (2013)
28
The models were initially set up to simulate a full day during the Christmas peak in 2015, but
have the functionality to run for longer and for the input data to be refreshed with the latest
information. Due to differing levels of detail in each of the models they take between 30
seconds and five hours to run a simulation of a full day.
Each model was built with differing levels of detail based on the purpose of the model, the
hanging model is the least detailed with no SKU information and only high level flows each
hour through the system to enable testing for bottlenecks. At the other end of the scale the
BCS and box pick model contains information about 50k SKUs and 300k orderlines (unique
customer SKU combination), with the capacity for more. Real and simulated orders are used
with SKU level detail and the routing logic is a replica of the actual warehouse control system
(WCS) logic, which controls the launch of orders for picking and triggers replenishment of
SKUs from the BCS to the pick system. This creates a large number of calculations for every
order and orderline; checking whether the order is available to launch, that the stock is
available at the pick station, that there is capacity at the pick station for another order and if
the order needs SKUs from different pick stations, resulting in the run time of around 5 hours
with the current dataset.
These models have been used from design through to implementation and will continue to be
used after Castle Donington goes live for continuous improvement. To get a full picture of the
site, all the models need to join together meaning the outputs from one are the inputs for the
next. This is all done in Microsoft Excel to be as user-friendly as possible. Creating one
model of the entire warehouse would have been unfeasible due to the number of objects, the
complexity of the logic and the processing capabilities that would be required to run a model
of this size. There are also times when experimentation is only needed on a section of the site,
for example the E-commerce packing operation, without changing processes or inputs in the
rest of the site. Having to run the simulation of the whole site would add unnecessary
complication and time. Despite this, building five separate models that must all link together
posed challenges of its own. Because of the differing levels of detail in each of the models,
some of the inputs or outputs were not available directly from the models, so these had to be
simulated separately with user-defined delays and process times. For the inputs and outputs
that could come directly from the models, methods of importing and exporting the data have
been built in to make the process as automated as possible. This is another time consuming
process in the running of the simulations - importing the data to the E-commerce packing
model and updating formulas takes around 40 minutes, the same as the run time.
4.1.1. Design
The design of the automation is a crucial phase of the project; most of the main processes
within the warehouse will be carried out by the automation with minimal manual input. The
simulation models were built during the design phase and initially used for verification and
validation. The automation suppliers also built their own simulation models as a proof of
concept for the design. Using both sets of models we were able to easily identify any potential
issues and their solutions with equipment, layout or logical controls during the design stage,
Case Study: OR in the Marks & Spencer Supply Chain
29
rather than after the physical installation when the cost of implementing any changes or
contingency plans increases significantly and there is a risk of disappointing customers.
One area in which the simulation identified a potential issue was in the
palletising/depalletising of boxed products. The stations are multifunctional, being able to
palletise and depalletise. This is an innovative way of working with new control logic having
to be defined. The simulation identified that the original logic resulted in significant idle time
for the operator while waiting for the empty or full pallet to be lifted or lowered into place. A
full cycle to lift and lower a pallet to and from the station takes around a minute - as such, any
reduction in this time will contribute to higher productivity of the operator and higher
throughput for the same equipment. The cycle time is fixed by the physical constraints but
new logic was proposed by the automation suppliers which limited the number of lifts that
needed to be performed. This was tested using both their simulation and the Flexsim
simulation and both showed that the amount of idle time was significantly reduced and
therefore the throughput was increased, so the logic in the WCS was changed before going
live. Without the simulation this issue may not have been spotted until either much closer to
going live or potentially after when it may have impacted the smooth running of the operation
and been more costly to rectify.
There are also disadvantages of building the simulation during the design phase, in that it
takes more iterations to reach the final accurate version of the model. This is due to the actual
system logic continually changing as improvements are identified. This proved a challenge as
much of the logic is very detailed so any changes to be made were non-trivial. With both
activities going on in parallel, communication between the two teams was also important as
issues that the simulation identified cannot be rectified unless the design team are told.
Conversely, new logic cannot be tested in the simulation unless they are notified of the
changes.
4.1.2. Implementation
As the project has progressed from design phase to the physical build to testing, going live is
becoming closer and closer and the team involved has grown to now include the design team,
testing team and operations team. Every new starter needs an introduction to how Castle
Donington will operate and the different flows of product through the site. During design and
the initial phases of installation it was very hard to get a sense of how the site would work and
the 2D plans are very detailed and difficult to follow. One of the main reasons for choosing
Flexsim as the simulation software was its graphics options, with 3D visuals as standard. This
3D representation was very useful for painting a clear picture of the flows around the site that
was starting to look like a web of conveyors. A video was created of the all simulation models
and put together for a full fly through of the site, making it accessible for the whole team.
The Excel interfaces of all the models for inputs and outputs also help with the
communication of results and capabilities of the simulation, as the results are easily and
quickly available at the end of the run and can be shared with the wider team without having

V. Forman / YOR18 Keynote Papers and Extended Abstracts, pp.25-31 (2013)
30
to consider software or knowledge of simulation. The ability to easily communicate the power
and flexibility of the simulations is important to get buy-in from other areas of the business
when giving recommendations based on the results, but also to give other teams ideas of how
they can use the simulations to assess any plans they have that Castle Donington plays a part
in.
4.1.3. Post go live
Product will begin to transition into Castle Donington from April 2013; however because of
the nature of simulation, many “what-if” scenarios of going live and thereafter have already
been run. This gives the operations team much more time to create contingency plans based
on reliable information about the impacts of certain changes and events.
A key area in which several simulations have been run is in the packing of E-commerce
orders. The design for Castle Donington was started in 2009, and since then E-commerce
businesses across the world have changed vastly, with rapid growth in the traditional channels
and increasingly via new channels such as smartphones and tablets. This is also changing the
profile of orders; with shorter order lead times and more delivery options. These and other
impacts of the changing face of E-commerce poses the site with additional challenges beyond
those in 2009. Flexibility in the original design has been tested using the simulations to see
the impact of these changes and also the best way to utilise the flexibility. E-commerce is
such an important part of the operation to get right as there is the potential to disappoint a lot
of customers. It is not only developments outside our control but internal changes too; these
changes have also been assessed using the simulations. This work has been completed already
but there is the flexibility in the simulations to run many different scenarios in the future
when there are more changes and also once the operation of the site is fully understood.
Other scenarios have been run such as the best way to balance the inbound operation across
the day. This is done so as not to impact the replenishment of the pick stations because the
storage cranes are over-utilised with putaway of inbound product. What-if scenarios include
the impact of out-of-order cranes, shortages of manual labour or if a vehicle arrives
containing only cartons that can‟t be stored in the BCS. The options are endless and will be
utilised more once the site is fully functional and the operation is fully understood, enabling
the operations team to create contingency plans based on reliable information before anything
has gone wrong and customers have been impacted.
As with all large capital investment projects they can only be designed to the best of your
knowledge of the future at that moment in time, as such flexibility and space for expansion
has been built into the design. The simulations can be used to analyse when it is best to install
some or all of this extra equipment and assess the benefit of doing so. This once again
provides valuable reliable information for decision making before large amounts of time and
capital are invested.

Case Study: OR in the Marks & Spencer Supply Chain
31
5. Conclusion
The M&S supply chain program has already delivered substantial savings and is on track to
deliver more over the next few years. This has been delivered against a background of
increased complexity as multi-channel requirements grow exponentially. The new supply
chain is also delivering a reduction in inventory and increase in availability.
The Operational Research element in this change has been critical; it would not have been
possible to work through the required analysis or get the required levels of buy-in from the
wider business without the data, information and conclusions that have been generated.
References
Marks and Spencer (2012). Annual Report 2012

YOR18 Biennial Conference - Keynote Papers and Extended Abstracts, pp.32-46
University of Exeter, 9-11 April 2013
Strategy & Sustainability
32
KEYNOTE
Embedding Sustainability into Strategy: Assessing the OR Society
Contribution
Miles W. Weaver, Andrea Bonfiglioli
Edinburgh Napier University, School of Management, Edinburgh, Scotland, UK
[email protected], [email protected]
Abstract
This paper sets out an overview of the key contributions that have addressed issues in strategy
and sustainability particularly from an OR Society perspective. The paper provides clarity on
emerging perspectives to define sustainability in terms of the economic and
social/environmental/governance (SEG) challenge. OR Society contributions to sustainability
are reviewed against the OR/MS literature in general and operations and supply chain
research. OR contributions are found to predominately focus on the use and application of
modelling in environmental management issues and not the social dimension of sustainability.
This review identifies that this is not necessary the case in OR Society titles (i.e. equal mix
between environmental and social) but contributions are minimal. A turning point is
emerging, post-financial crisis with more prominence attended to the governance dimension.
Although papers in OR Society titles have a slight lag compared with OR/MS in general, and
supply and operations management literature. It is argued that the OR Society can play a
significant role in addressing the sustainability challenge. Further work should focus on a
more extensive literature review and a survey of OR Society members on the utility and
applicability of OR to address the sustainability challenge.
Keywords: Sustainability; Governance; Strategy; Corporate responsibility; OR research and
practice
1. Introduction
The field of sustainability has aroused much interest and grown in great importance over
recent years. It is an expansive, multi-faceted and heavily debated concept (Wilkinson et al.,
2001) predominately since Meadows et al., (1972) first discussed the “Limits to Growth”. At
the heart of this debate is an explicit connection and widespread recognition of a changing
relationship between companies and communities as noted in the UN Global Compact (2011).
This change has been bought in part due to unprecedented levels of economic growth in the
majority of countries, speared on by the industrial revolution from the 1760‟s onwards. In the
last decade alone we have seen vast technological change, market consolidations and new
markets emerging, shift to a service-based knowledge economy, innovations that
fundamentally change the rules of the game and all shaped and based to an extent on global
economic activity. For instance, the early 90‟s saw great pressures of globalisation, to
outsource non-core activities and utilise the lowest forms of production, predominantly

Embedding Sustainability into Strategy: Assessing the OR Society Contribution
33
overseas in China and India (See Friedman, 2005). In more recent years we have experienced
a period of austerity and extensive government spending cuts, which has resulted in high
levels of unemployment, particularly amongst young people and social inequality that
undermine the type of society we aspire to achieve. These changes present many challenges
for practicing managers to act and evaluate their responsibilities towards the pressures on both
people and planet. What the last decade particularly has shown is that the freedom to act is
not a license to abuse (Cannon, 2011). This challenge has not changed and is no greater as
noted by Barack Obama (43rd
President of the United States) in his first inaugural speech:
“For even as we celebrate tonight, we know the challenges that tomorrow will bring
are the greatest of our lifetime - two wars, a planet in peril, the worst financial crisis
in a century”. – Barack Obama Victory Speech (2008)
The challenge for business was most notably made by Friedman (1962) whom suggested that
the „social responsibility of businessmen is to make maximum profits for their shareholders‟.
This he argued should be within the law and rules for society, if so leaders and organisations
are acting responsibly. Additionally, he noted that any expenditure on social/environmental
activities will, in his view, reduce profits and, therefore, managers who „indulge‟ in such
practices will be neglecting their duty to maximise profits for shareholders. On this matter,
Friedman is not short of his critics, particularly leaders who demonstrate ethical and moral
leadership. This includes Henry Ford (1863-1947) who once said “business that makes
nothing but money is a poor kind of business” and Richard Branson who has more recently
commented that “with extreme wealth comes extreme responsibility” (See Coughlan, 2006).
The responsibility for business is becoming much clearer, as public perception change and
leaders take to the task made more prominent by issues such as the rise in CO2 emissions and
population growth (i.e. UK Government Climate Change Act in 2008). These issues lead
business and society to question how our lives can be sustainable in the future and for our
children‟s children. These include great CSR and corporate governance failures (e.g. BP
Deepwater Horizon Oil Spill in 2010); Horsemeat labelled as beef scandal in UK
supermarkets and supply chains (See Lichfield et al., 10/02/2013) and crises in the financial
system (i.e. RBS and Lloyds TSB took government bail-out and ownership, See BBC News,
13/10/2008). These failures have undermined consumer confidence in business and on the
part of civil society and give rise to the environmental, social and governance challenges that
question the predominantly capitalist socio-economic system.
Laszlo and Zhexembayeva (2011) argue that „embedding sustainability‟ is the „next big
competitive advantage for business‟. Taking just the environmental dimension, a survey of
managerial perceptions by Ghobadian et al., (1995) found that developing a response to
environmental issues were a source of business opportunity and could lead to a competitive
advantage. This could be explained in part by considering that „cost‟ can be minimised by
addressing environmental issues (e.g. eliminating waste) and taking environmental action is
explicitly linked to the concept of „quality‟. Interesting, Ghobadian et al., (1995) note that the
operations function present the greatest focus to minimise environmental impact. While these

M. W. Weaver, A. Bonfiglioli / YOR18 Keynote Papers and Extended Abstracts, pp.32-46 (2013)
34
considerations are steadily being realised by managers, the social dimension has received
much less attention (Glavic and Lukman, 2007). As Weaver and Nunes (2007) note that the
response from political and business leaders has not developed fully yet, but the journey has
begun, although slower than is needed to reach the final destination. The two are important
and inherently linked as Ghobadian et al., (2005) also found that both market and non-market
forces are important in shaping environmental strategies (e.g. customers, regulatory agencies).
2. Corporate responsibility to sustainability
The term sustainability has embraced many terms and has evolved significantly over the past
decade alone. Little surprise due to the focus of research on the environmental dimension that
sustainability definitions are skewed towards addressing „green‟ issues. Glavic and Lukman
(2007) note that these terms have included: cleaner production, pollution prevention,
pollution control, and minimisation of resource usage, eco-design and others. New terms
emerge as many literature reviews and theory/concept development papers are published and
special issues presented in different journals. For instance, the International Journal of
Manufacturing and Technology Management (in 2015) will focus a special issue on
„manufacturing and supply chain sustainability: relationships and governance‟ and Harvard
Business School will hold a conference on „Sustainability and the Corporation: Big Ideas‟ in
November 2013.
Since the industrial revolution, the sustainability agenda has been dominated by individual
and corporate philanthropy to demonstrate good corporate citizenship. This is formed on
what Caroll (1991) terms the three philanthropic responsibilities: ethical, legal and
economical. Caroll recognises that to „be profitable‟ is the foundation block that the other
responsibilities rest. The power of the machine over man, raised major issues on
responsibility and ethics that bore attention to the relationship between business, society and
the natural environment. The ethical responsibilities were noted by Mill (1848) in his
Principles of Political Economy when he welcomed the wealth produced by industrialisation
but saw the dangers in the processes that created that wealth and the changing relationship
between workers and their products. Cannon (2011) lists other key contributors that have
questioned ethics since industrialisation: such as writers and philosophers, Charles Dickens,
Henry David Thoreau; religious leaders, Pope Leo XIII; politicians, Theodore Roosevelt and
by the 1950s corporate leaders, Frank Abrams (see Abrams, 1951) and Howard Bowen (see
Bowen, 1953).
In 2006, Dahlsrud reviewed 37 definitions on CSR demonstrating the different cultural and
economic influences on the definition. Common in the definitions is not only Caroll (1991)
view as discussed but also the obligation of corporations to constituent organisations other
than shareholders (i.e. customers, suppliers, employees and related community groups) that is
present in what is termed „stakeholder theory‟. These wider responsibilities are captured in
Waddock (2009) definition of corporate social performance that emphasises the relationship
with numerous stakeholders as well as the natural environment. The UN Global Compact
(2011) also makes explicit that these relationships are partnerships and require openness

Embedding Sustainability into Strategy: Assessing the OR Society Contribution
35
between business, governments, civil society, labour and the United Nations. In this broader
view, there are two compelling reasons for businesses to have a moral duty to take into
account a wider range of stakeholder interests. First, the responsibility to make good social
and environmental „harms‟ created by their business operations. Secondly, to acknowledge
the „contributions‟ made by these stakeholders to their successful business operations.
Elkington (1998) encapsulates this wider view of business responsibility by proposing the
„triple bottom line‟ (TBL) approach. This postulates that those businesses have a set of goals
which extends beyond merely responding to shareholder expectations. In the TBL framework
Elkington argues that businesses can still, legitimately, aim at adding economic (shareholder)
value, but should acknowledge that such benefits may potentially be, at least partially, offset
by negative social and environmental (stakeholder) costs. Therefore, businesses should have
an extended goal set in which the issues of social and environmental value must be addressed.
The concept of CSR implies that companies voluntarily integrate social and environmental
concerns in their operations, and actively interact with stakeholders. This is framed around
„sustainable development‟ which is defined by the Brundtland Commission report for the
Unitied Nations (1987):
"Development that meets the needs of the present without compromising the ability of
future generations to meet their own needs"
The focus involves business consideration of the interests of society, striking the right balance
between economic, environmental and social concerns. Corporate responsibility is interested
in the direct and indirect actions of a business on various stakeholders that may include
customers, suppliers, employees, communities and the environment, as well as their
shareholders. Wartrick and Cochran (1985) note that there are different responsive strategies
to corporate responsiveness: reactionary, defensive, accommodating and pro-activity.
Arguably, it is the pro-activity category that organisations need to fulfil in order to address the
economic SEG challenge by going beyond minimum requirements of stakeholders and acting
in accordance with CSR principles which transcend the law. This is certainly the case if we
are to meet Laszlo and Zhexembayeva (2011) aspiration for sustainability to be the „next big
competitive advantage‟. However, in this paper the authors note that this implies for the
„few‟. Hence, pro-activity to meet the challenge should be stretched to become the „next big
de facto standard‟ or in strategic management terms a „threshold capability‟. Whereby the
standard is raised, but a seismic shift may be required before this may be a possible route.
Taking Friedman (1962) argument, to create stakeholder value would, inevitably, destroy
shareholder value. This is at odds with the concept of CSR which is built on the premise that
positive engagement with stakeholders will enhance shareholder value. Thus, business no
longer has to make a choice between „profits versus ethics‟. In a supply chain context this
includes creating mutually beneficial stable and long-term relationships. This includes all
issues involving the inputs to a business, in terms of resource consumption and the outputs,
pollutant emissions (Sanders, 2012). For instance, the environmental dimension will include
the use of fossil fuels for power generation and the resultant carbon emissions (Mangan et al.,

M. W. Weaver, A. Bonfiglioli / YOR18 Keynote Papers and Extended Abstracts, pp.32-46 (2013)
36
2012). On the other hand, the social dimension would include a concern for employee‟s
welfare and social issues, whether to use existing staff or to outsource non-core activities.
Also, a „local‟ concern on the wider community and civil society to reduce conflict, satisfy
expectations and forge purposeful and meaningful relationships with suppliers (that supply
the inputs) and honest treatment of customers (at the demand side). In addition to addressing
these two dimensions there is a need for new governance models and frameworks to navigate
and offer a point of reference for partnerships and relationships to be built external to the
organisation stretching out to capture and nurture stakeholder involvement in sustainable
development. It is these relationships that concern an emerging need to develop potential new
corporate governance models that could navigate and lead an organisation in the future in
partnership with the value created with and by stakeholders.
The sustainability agenda will be shaped over the next decade or so further. Particularly, as a
„local‟ connection becomes increasingly more important. This will bring about different
thinking, unleashed through new political activism and ideology, the role religion plays, the
nature of a market led system and businesses identifying sources of business opportunity in its
business and with stakeholders (i.e. suppliers) to drive value.
3. Assessing OR Society response to the sustainability challenge
This paper addresses the question: What responses have been made in Operational Research
Society journals on the sustainability challenge? Additionally, draws some comparisons with
systems/operational research in general and with research in supply and operations
management journals. This paper does not claim to present a systematic literature review of
all systems/OR contributions but notes that this would be a useful avenue for further research.
The boundary of the literature review is OR Society journals as this paper forms a keynote
discussion at the Operational Research Society YOR18 conference in April 2013. The
protocols for identifying, selecting and reviewing the literature relevant to the question
follows that used by Ashby et al., (2012) reviewing the sustainability literature in supply
chain and sustainability literature. Ashby et al., (2012) systematic literature review built on
earlier work and contributions by Seuring and Muller (2008) and Burgess et al., (2006); these
studies are used for comparing the OR Society response to sustainability (i.e. the ESG
dimensions).
3.1 Search criteria
The search focuses on sustainability in relation to the ESG dimensions within the six OR
Society publications, listed in table 1 with the associated ABS ranking (2010). The Palgrave
research database was used for this study as all OR Society publications are listed in both
abstract and full text form and the list was consolidated when a publication was listed more
than once. The economic dimension is omitted in accordance with Ashby et al., (2012) review
that noted that this is outside the scope of the review as it can be argued that the economic
dimension is inherent in all discussions on sustainability. The governance dimension was not
noted in Dempsey et al., (2009) conceptual framework on sustainability but is added to this

Embedding Sustainability into Strategy: Assessing the OR Society Contribution
37
study due to the growing importance of moral and ethical decision making by stakeholders in
a sustainability agenda for a given organisation. Publications from 1983 onwards have been
reviewed as this was the year that the World Commission on Environment and Development
(WCED) was established by the United Nations. It was after this date that the environmental
and social dimensions were more formally recognised (Ashby et al., 2012).
Table 1 No of papers per journal title using search terms
Journal Title ABS ranking (2010)
No. of papers
All terms Supply chain
related
European Journal of
Information Systems 3 0 0
Health Systems (launched in 2012) 0 0
Journal of Simulation - 0 0
Journal of the Operational
Research Society 3 26 15
Knowledge Management
Research & Practice 1 1 1
OR Insight 1 2 0
Total N/A 29 16
Table 1 includes a search criteria that focuses on „supply chain related‟ contributions can be
compared with Ashby et al., (2012) review of supply and operations journals. Interestingly,
Ashby et al., (2012) did not include the Journal of the Operational Research Society but did
include the European Journal of Operations Research (EJOR - has a similar ABS rank). The
European Journal of Information Systems which also has an ABS rank of 3 was omitted,
which in part understandable due to Ashby et al., (2012) focus on journals with an operations
focus. The other publications would not have been included in Ashby et al., (2012) review
due to the low ranking of the publication. For comparison purposes, Ashby et al., (2012)
identified only 2 publications in EJOR while a similar search in JORS would have identified
26 in general and 15 specifically on SCM related terms. Figure 1 shows the number of
reviewed papers per year. There has consistently been one paper, which is fair in comparison
to Ashby et al., (2012) identification of two until the year 2000 (with a greater population).
Ashby et al., (2012) noted a substantial change in growth from 2001 onwards; OR society
contributions lagged behind when notable contributions increased from 2005 onwards (except
in 2003, note only two papers). Both studies showed a dramatic change in 2009 to date, post-
global financial crisis.
The number of papers identified in this review is insufficient to draw useful comparisons but
demonstrates how sustainability is an emerging subject. As in Ashby et al., (2012) review to
identify the broadest range of papers a full text search was used in the six OR Society titles
using the search terms noted in table 2. For comparison purposes, the same terms were
reviewed in the International Abstracts in Operations Research which consists of 68,000

M. W. Weaver, A. Bonfiglioli / YOR18 Keynote Papers and Extended Abstracts, pp.32-46 (2013)
38
abstracts of the world‟s OR/MS literature. This shows that there is an existing body of
knowledge in sustainability that requires further examination to identify trends and areas of
opportunity for further theory development. However, the review does point out that OR/MS
research is sufficiently lacking in the area of corporate social responsibility and social
sustainability.
Figure 1 Number of OR Society reviewed papers per year (all search terms)
Table 2 Search terms
Boundary Search terms
No of papers in
operations and
supply journals
noted in Ashby
et al., (2012)
No of
papers in
IAOR
No of papers in
OR Society
specific
journals
Organisational
Sustainability 16
60 8
sustainable development* 33 4
Corporate social
responsibility 8 2 0
Social sustainability 7 4 0
Life cycle analysis (LCA) 3 8 1
Supply
Green supply chains 35 15 1
Sustainable supply chain
management (SSCM) 14 1 0
Closed loop supply chains 7 23 1
Integrated supply chain 1 10 0
* The term sustainable development was searched with sustainability by Ashby et al., (2012). For the purposes of this
review the terms are split to ensure that no papers are omitted from the search.
3.2 Sustainability dimensions
Table 3 lists the fifteen papers that were consolidated from the previous identification of OR
Society titles using the search terms noted in table 2. It shows that to date, there is an equal
0 2 4 6 8
1990
1992
1994
1996
1998
2000
2002
2004
2006
2008
2010
2012

Embedding Sustainability into Strategy: Assessing the OR Society Contribution
39
amount of research that has focused on the environmental and social dimensions. This is at
odds with Ashby et al., (2012) study of operations and supply chain management literature
and earlier reviews of OR literature by White and Gregory (2007). Both suggest that research
has focused more one sided on the environmental dimension as opposed to addressing the
social sustainability challenge. White and Gregory (2007) had specifically noted that OR
responses to sustainability had concentrated on the relationship between environmental
management and product supply chain and rarely focus on the social dimension. At present
the OR Society community is equal, although as White and Gregory (2007) point out, it can
still be argued today that OR has yet to be fully utilised in the area of
sustainability/sustainable development. The governance dimension is emerging, particularly
post financial crisis and would also be useful to research each dimension further across the
OR/MS literature in each geographic location.
Table 3 Occurrences in the OR Society literature on the economic, environmental, social and
governance dimensions
N° Paper 1 2 3 4 5 6 7 8 9 10 11 12 13 14 15 TOTAL
Dim
ensi
on
s
Environmental
/ green • • •
• •
• • • • • • 11
Social • •
•
• • • • •
• • • 11
Economic • • • •
• • •
• 8
Governance
• • • • • 5
Bell (1998) argued that operational researchers had been slow to define and claim a strategic
role for OR. This may help to explain the lack of research into sustainability issues as it can
be argued to be of a strategic nature (but this should not be seen exclusively). Bell (1998)
points out that the community should discuss OR as a strategic asset and that OR in 1998 had
an exciting future to provide a vision. More recently, Lane (2010) argues that OR/MS retains
the ability to do high stake work and capable of high level interventions. Both Bell (1998)
and Lane (2010) did not cite the sustainability challenge posted in this paper, which here is
argued as one of the greatest of a lifetime. Just as Bell noted that „strategic OR‟ is not an
oxymoron, the same can be suggested for „sustainability and OR‟ and can be used to evaluate
sustainability as a source of business opportunity and thus to underpin competitive advantage.
4. Discussion on OR Society contributions to sustainability
Midgley and Reynolds (2004) suggested an agenda for systems/OR research in the context of
sustainable development. The authors make one substantive claim that for every paper on
sustainability and management that is explicit about using OR methods there are at least five
making claims to methodological innovation that are using the same or similar methods
without reference to OR. This highlights the need to compare Ashby et al., (2012) study of
one domain, operations and supply chain and to identify the full extent of coverage with OR.
This also highlights that OR-related research is presented in non-OR journals on the topic on
sustainability and this requires attention of OR journal editors.
M. W. Weaver, A. Bonfiglioli / YOR18 Keynote Papers and Extended Abstracts, pp.32-46 (2013)
40
Special issues could be found calling for papers on the use of OR for the public interest (i.e.
societal issues, in Operations Research, 2010), environment and sustainable development (in
Operational Research - An International Journal, 2009) and the better management for
sustainability (in European Journal of Operational Research, 2009). Interestingly, there is a
call for papers for March 2013 in as special issue of Computers and Operation Research on
„Advances in Operations Research for Sustainable Supply Chain Management‟. In this call it
is noted that the majority of research is based on empirical or case studies, with a dearth of
papers that take a rigorous modelling approach to produce general analytical results (Kannon
and Cheng, 14/02/2013). No special issues relating to sustainability can be identified in OR
Society titles although Knowledge Management Research & Practice will include a special
issue in 2013 on „Sustainable Quality: Knowledge and Information Management‟. Therefore,
the trend identified in the study of a lack of OR/MS research in the sustainability area is
bucking. Although, contributions in OR Society titles are lagging there are some signs that
this is to change.
White et al., (2009) make the point that the label „OR‟ appears to have a low profile in the
discourse about appropriate methodologies and methods in sustainability citing the studies by
Bloemhof-Ruwaard et al., (1995) and Daniel et al., (1997). Midgley and Reynolds (2004)
suggests an agenda for systems/operational research and sustainable development. They
argue that OR have considerable scope to address sustainability issues and cite the three
essential characteristics of operational research. This includes OR has a systems orientation,
being of an interdisciplinary nature and being explicitly purposeful. A systems orientation is
important as it concerns a critique of the boundary, which is key when concerning the
governance dimension of sustainability. Important questions include „who owns controls or
even governs a supply chain‟? „How are relationships forged and managed‟? These
questions have yet to be explicitly addressed by the community but in each of the studies the
boundaries of a model are described (i.e. reviewed papers 3, 5, 8, 12, 15). This requires
holistic thinking, dealing with complexity and uncertainty regarding the unpredictability of
natural and social phenomena. The purpose of studies show a range of disciplines covered,
most notably tourism and supply chains, sustainable development, sustainable communities
and ethical investment. In terms of OR tools and techniques, many have been applied and
adapted including the balanced scorecard approach, benchmarking, robustness analysis, life-
cycle analysis as well as general modelling and simulation tools.
It would be useful to extend this initial review to extensively survey OR/MS literature on the
OR tools and techniques used for sustainability issues but more over to understand there
utility to address the challenges posed in this paper. As noted in Midgley and Reynolds
(2004) addressing sustainable issues will lead to raising the profile of OR in the future.
Where OR may play a substantive role is in assessing sustainability responses that achieve a
cost advantage (e.g. modelling, simulation, optimisation) and in corporate decision-making on
addressing environmental, social and governance issues (i.e. multi-criteria decision making).

Embedding Sustainability into Strategy: Assessing the OR Society Contribution
41
No evidence was found on conceptual modelling of sustainability issues but this is one tool
that could help determine boundaries, understand complexity and improvements that can be
made (See Weaver, 2010). Systems thinking, such as soft systems methodology deal with
problems that are generally ill-defined, explores connectivity between relationships and
action-orientated around improvements (See Checkland and Scholes, 1999). Conceptual
modelling for sustainability issues may be an interesting starting point as it is a crucial and
necessary step before modelling and/or simulation (Robinson, 2004; Weaver, 2010) and is
also incorporated into soft systems thinking. Midgley and Reynolds (2004) note that
sustainability are generally so complex that they resist quantification and OR promote
technical answers to what are ethical or moral questions. The authors suggest this should not
be the case as noted by Checkland and Scholes (1999, pg. A11), OR can be used to observe
the perceived real-world as a system so that one can be engineered („hard‟) and/or organised
and explored as a learning system („soft‟). In terms of quantitative methods, Midgley and
Reynolds (2004) also note quantitative methods should not replace debate about values.
However, once these values are defined OR tools and techniques are purposeful when
evaluating the impact of dynamic behaviour on performance and power relationships (i.e.
governance issues).
5. Conclusions and implications for the OR community
The range and extent of contributions in both this initial study and Ashby et al., (2012) is
limited considering the importance placed on sustainability in practice. This is even more
concerning since OR tools and techniques are well placed to address a whole of host of
sustainability issues on each of the dimensions sustainability (i.e. economic, environmental,
social and governance). Contributions can be found in OR Society titles demonstrating an
equal split between environmental and social dimensions. This is at odd with OR literature in
general and does not fit the pattern identified by Ashby et al., (2012) in terms operations and
supply chain research contributions (i.e. focus on environmental issues). It is clear that there
was a slight increase in contributions across the board, post-global financial crisis and the
prominence of the governance dimensions taking shape. Additionally, numerous special
issues have been presented since 2010 in OR/MS journals and the number of forthcoming
special issues is promising. It is noted that a special issue in OR Society titles has yet to
emerge but may play an influential role in focusing thought-leadership and utility and
applicability of OR to sustainability issues.
OR research has considerable advantages to deal with strategic issues and grand challenges.
Lane (2010) ends his paper discussing high leverage interventions by quoting Archimedes
who he suggests offers some lessons for OR/MS today. Lane (2010) notes how Archimedes
showed great boldness when faced with a grave challenge to demonstrate what OR/MS is
capable of today.
“There is no limit, just give me somewhere to stand, and I shall move the earth”
Drachmann, 1958, p. 281.
M. W. Weaver, A. Bonfiglioli / YOR18 Keynote Papers and Extended Abstracts, pp.32-46 (2013)
42
For the sustainability agenda, the earth does not need to be moved, but we need a seismic shift
to address many of the challenges that face both people and planet today. The OR Society
has made a contribution on both social and environmental dimensions and to a lesser extent
the governance challenges to date. However, great challenges, bring about great
responsibilities to step up and use OR tools and methods for today current problems that will
impact upon generations to come. There is a need to extend this initial survey to identify the
extent of OR research on sustainability in different geographic locations. To identify
emerging themes and trends that can be addressed by OR approaches in the future. This
includes the area of modelling/simulation and problem-structuring techniques. Underlining
these methods is the need to conceptually model a system, identifies the boundary and capture
complexity in terms of the connectedness between links and relationships and to deal with
uncertainty. This paper concludes that a stream at YOR18 is a start, an extensive literature
review and survey of OR Society members on the applicability and utility of OR approaches
would be helpful. This should form a call for action to be addressed in the future by the OR
community.
References
Abrams, F. A. (1951), Management responsibilities in a complex world, Harvard Business
Review, 29, pp. 29 – 34.
Ashby, A., Leat, M., and Hudson-Smith, M. (2012). Making connections: a review of supply
chain management and sustainability literature. Supply Chain Management: An
International Journal, 11(5): 497-516.
BBC News, (2008), UK banks receive £37bn bail-out, BBC News website,
http://news.bbc.co.uk/1/hi/business/7666570.stm, Accessed: 02/02/2013.
Bloemhof-Ruwaard, J. M., Van Beek, P., Hordijk, L., & Van Wassenhove, L. N. (1995),
Interactions between operational research and environmental management. European
Journal of Operational Research, 85(2), pp. 229-243.
Bowen, H., R. (1953), The social responsibilities of business, Harper and Row, New York.
Brundtland, G. H. (1987), Report of the World Commission on environment and development:
our common future, Transmitted to the General Assembly as an Annex to document
A/42/427 – Development and International Co-operation: Environment, United
Nations.
Burgess, K., Singh, P. J., and Koroglu, R. (2006), Supply chain management: a structured
literature review and implications for future research, International Journal of
Operations and Production Management, 26(7), pp. 703-29.
Cannon, T. (2011), Corporate responsibility: Governance, compliance and ethics in a
sustainable environment, 2nd
edition, Pearson Education, Harlow: Essex.

Embedding Sustainability into Strategy: Assessing the OR Society Contribution
43
Cannon, J, P., Petersen K, J., Doney, P. M., Mullen M., R. (2011), Building long term
orientation in buyer-supplier relationships: The moderating role of culture-Ag: 130.
Operations Research Management Science 51(5), 445
Carroll, A. B. (1991), The pyramid of Corporate social responsibility: Towards the moral
management of organisational stakeholders, Business Horizons, Vol. 34(4), pp. 39 – 48.
Checkland, P., and Scholes, P. (1999), Soft systems methodology in action, John Wiley &
Sons Ltd., Chichester, West Sussex.
Coughlan, S. (2006), Branson on wealth, BBC News Magazine,
http://news.bbc.co.uk/1/hi/magazine/4942704.stm, Accessed: 02/02/2013.
Daniel, P. L. (1997), Quantifying trends in system sustainability. Hydrological Sciences
Journal, 42(4), pp. 513-530.
Dahlsrud, A. (2006), How corporate responsibility is defined: An analysis of 37 definitions,
Corporate Responsibility and the Environment, September.
Dempsey, N., Bramley, G., Power, S. and Brown, C. (2009), The social dimension of
sustainable development: defining urban sustainability, Sustainable Development,
19(5), pp. 289-300.
Drachmann, A. G. (1958), How Archimedes expected to move the earth, Centaurus,
International Journal of the History of Science and its Cultural Aspects, 5(3-4), pp. 278
– 282.
Elkington, J. (1998), Partnerships from cannibals with forks: The triple bottom line of 21st‐
century business, Environmental Quality Management, 8(1), pp. 37-51.
Friedman, M. (1962), Capitalism and Freedom, Chicago: University of Chicago Press.
Friedman, T. L. (2005), The world is flat: A brief history of the twenty-first century. Farrar,
Straus and Giroux, New York, NY.
Ghobadian, A., Viney, H., James, P., & Lui, J. (1995), The influence of environmental issues
in strategic analysis and choice: a review of environmental strategy among top UK
corporations. Management Decision, 33(10), pp. 46-58.
Glavič, P., & Lukman, R. (2007). Review of sustainability terms and their
definitions. Journal of Cleaner Production, 15(18), 1875-1885.
Harvey, C., Kelly, A., Morris, H., and Rowlinson, R. (2010), Academic Journal Quality
Guide, Version 4, Association of Business Schools,
http://www.associationofbusinessschools.org/sites/default/files/Combined%20Journal%
20Guide.pdf, Accessed: 7/02/2013.
M. W. Weaver, A. Bonfiglioli / YOR18 Keynote Papers and Extended Abstracts, pp.32-46 (2013)
44
Kannon, G., and Cheng, T. C. E. (2012), „Advances in operations research for sustainable
supply chain management‟, Call for papers in Computers and Operation Research.
Lane, D, C. (2010), High leverage interventions: Three cases of defensive action and their
lessons for OR/MS today, Operations Research, 58(6), pp. 1535 – 1547.
Laszlo, C., & Zhexembayeva, N. (2011), Embedded Sustainability: The Next Big Competitive
Advantage, Greenleaf Publishing: Sheffield.
Lichfield, J., Randall, D., and Manning, S. (2013). IoS investigation: Horsemeat scandal
reveals trail of shadowy suppliers. The Independent on Sunday, Accessed: 10/02/2013.
Mangan, J., Lawani, C., and Butcher, T., (2012), Global logistics and supply chain
management, John Wiley & Sons, Chichester, UK.
McWilliams, A., and Siegel, D., (2000) Corporate social responsibility and financial
performance: Correlation or misspecification? Strategic Management Journal, 21(5),
pp. 603 – 9.
Meadows, D., M., Randeus Jorgen III, B., and Williams, W. (1972), The Limits to Growth,
Universe Books, New York: US.
Midgley, G., & Reynolds, M. (2004), Systems/operational research and sustainable
development: Towards a new agenda. Sustainable Development, 12(1), pp. 56-64.
Mill, J., S. (1848), Principles of political economy: with some of their applications to social
philosophy. Longmans, London.
Obama, B. (2008), Victory speech, New York Times, 05/11/2008,
http://elections.nytimes.com/2008/results/president/speeches/obama-victory-
speech.html, Accessed: 07/01/2013.
Sanders, N., R. (2012), Supply chain management: A global perspective, John Wiley & Sons,
Chichester, UK.
Seuring, S., (2008), Core issues in sustainable supply chain management: a Delphi study,
Business Strategy and the Environment, 17(8), pp. 455 – 66.
Robinson, S. (2004), Simulation: The practice of model development and use, Chichester:
Wiley.
United Nations (2011). Corporate Sustainability in the world economy. New York: UN
Global Compact Office, DC2-612.
Waddock, S., A. (2004), Parallel universes: Companies, academics, and the progress of
corporate citizenship. Business and Society Review, 109(1), pp. 5 – 42.

Embedding Sustainability into Strategy: Assessing the OR Society Contribution
45
Wartick S., L. and Cochran P., L. (1985), The evolution of the corporate social performance
model. Academy of Management Review, 10(4), pp. 758-769.
Weaver, M., and Nunes, B. (2007), Green leadership – Are we nearly there yet?, Young
Fabian‟s Anticipations Journal, Autumn, 11(1), pp. 9 – 11.
Weaver, M., (2010), A simulation conceptual modelling methodology for supply chain
applications, PhD Thesis, Aston University, October 2010.
White, L., and Gregory, J., L. (2007), Operational Research and sustainable development:
Tackling the social dimension. European Journal of Operational Research, 193(3), pp.
683 – 692.
Wilkinson, A., Hill, M., & Gollan, P. (2001), The sustainability debate, International Journal
of Operations & Production Management, 21(12), 1492-1502.
Appendix – reviewed references
1. Bell, S., and Morse, S. (2006), Problem structuring methods: theorizing the benefits of
deconstructing sustainable development projects, Journal of the Operational Research
Society, 58, pp. 576-587.
2. Chalmeta, R., Palomero S. (2010), Methodological proposal for business sustainability
management by means of the Balanced Scorecard, Journal of the Operational Research
Society, 62, pp. 1344-1356.
3. Chen, J., M., and Chang, C., I. (2011), The economics of a closed-loop supply chain with
remanufacturing, Journal of the Operational Research Society, 63, pp. 1323-1335.
4. Dowlatshahi, S. (2001), Product life cycle analysis: a goal programming approach,
Journal of the Operational Research Society, 52, pp. 1201-1214.
5. Filinkov, A., Richmond, M., Nicholson, R., Alshansky M., Stewien, J. (2010), Modelling
personnel sustainability: a tool for military force structure analysis, Journal of the
Operational Research Society, 62, pp. 1485-1497.
6. Lu, W-M., Lo S-F. (2006), A benchmark-learning roadmap for regional sustainable
development in China, Journal of the Operational Research Society, 58, pp. 841-849.
7. Mayne, A., J. (1992), Greening business: Managing for sustainable development, Journal
of the Operational Research Society, 43, pp. 182-183.
8. Namen, A., A., Bornstein, C., T., Rosenhead, J., (2008), Robustness analysis for
sustainable community development, Journal of the Operational Research Society, 60,
pp. 587-597.
M. W. Weaver, A. Bonfiglioli / YOR18 Keynote Papers and Extended Abstracts, pp.32-46 (2013)
46
9. Ortiz-Fournier, L., V., Márquez, E., Flores, F., R., Rivera-Vázquez, J., C., Colon, P., A.
(2010), Integrating educational institutions to produce intellectual capital for
sustainability in Caguas, Puerto Rico, Knowledge Management Research & Practice, 8,
pp. 203-215.
10. Paucar-Caceres, A., Espinosa, A. (2010), Management science methodologies in
environmental management and sustainability: discourses and applications, Journal of the
Operational Research Society, 62, pp. 1601-1620.
11. Ruiz, F., Cabello, J., M., Luque M. (2010), An application of reference point techniques
to the calculation of synthetic sustainability indicators, Journal of the Operational
Research Society, 62, pp. 189-197.
12. Swami, S., Shah, J. (2013), Channel coordination in green supply chain management,
Journal of Operational Research Society, 64, pp. 336 – 351.
13. Tsai, W-H., Chou W-C., Hsu W., (2008), The sustainability balanced scorecard as a
framework for selecting socially responsible investment: an effective MCDM model,
Journal of the Operational Research Society, 60, pp. 1396-1410.
14. Wheeler, F., P. (1998), Systems for sustainability: People, organizations, and
environments, Journal of the Operational Research Society, 49, pp. 1015-1016.
15. Xing, Y. and Dangerfield, B. (2010), Modelling the sustainability of mass tourism in
island tourist economies, Journal of the Operational Research Society, 62, pp. 1742-
1752.
YOR18 Biennial Conference - Keynote Papers and Extended Abstracts, pp.47-59
University of Exeter, 9-11 April 2013
Disaster Management
47
KEYNOTE
Operational Research: Key for Successful Disaster Management
Pavel Albores, Oscar Rodriguez, Priyanka Roy
Aston University, Centre for Research into Safety and Security (CRISIS),
Operations and Information Management Group, Birmingham, UK
{P.Albores, Rodrigoe, Royp1}@aston.ac.uk
Abstract
Disasters are an unpredictable phenomenon and they can happen anywhere at any time,
something reflected on several unfortunate chapters of history related to the experiences of
several countries. The uncertainty around disasters and recent events (e.g. Japan tsunami
(2011), Hurricane Katrina (2005), Pakistan Floods (2010) are increasing awareness about the
importance of comprehensive disaster management. The goal now is not only to mitigate
disasters, but to be prepared to cope with these phenomena, looking to protect vulnerable
people and to provide them with survival items and improve community recovery,
establishing concepts such as vulnerability, risk, service levels, among others, as crucial
elements to aid the decision making. Thus, the complexity of comprehensive disaster
management calls for suitable techniques that can provide tailored solutions to achieve the
goals aforementioned, and that is the role of operational research.
The flexibility and wide range of techniques comprised by operational research can provide
useful solutions for disaster management supported by the advances on emergency logistics,
relying on close cooperation between authorities and researchers. The field of emergency
logistics is still young, but the contributions of operational research are substantial and the
opportunities for improvement are wide-ranging.
The purpose of this paper is to present an overview of the importance of operational research
within disaster management, mentioning previous contributions from several authors on the
field, the most common tools of operational research applied to emergency logistics and
opportunities for new research that can improve emergency operations performed currently
worldwide.
Keywords: Modelling, Disaster management, Emergency response, Operational research
1. Introduction
According to (UNISDR, 2012), from 1992 to 2012 4.4 billion were affected by disasters with
almost 2 trillion USD in damages and 1.3 million people killed worldwide. The economic
losses caused by disasters are increasing every year, and an example is given by the
unprecedented amount on economic losses registered last year. “In 2011, total economic
losses to society (both insured and uninsured) due to disasters reached an estimated USD 350
billion, compared to USD 226 billion in 2010” (Swiss-Re, 2011).

P. Albores et al. / YOR18 Keynote Papers and Extended Abstracts, pp.47-59 (2013)
48
Moreover, “the trends in the number and impact of disasters and the massive scale of recent
global relief efforts have brought growing attention to the need for effective and efficient
disaster response operations” (B. Balcik & Beamon, 2008).
Therefore, the complexity of disaster management combined with the impact of several recent
disasters highlight the need to introduce tools to improve decision-making looking to use
efficiently the resources at hand, and operational research can provide a set of powerful tools
to accomplish that.
Authorities globally are trying to improve operations for disaster management, aiming to
provide a proper assistance to affected communities. But disaster management goes beyond
the response to any disaster, starting with long-term planning and considering also the support
for the affected people to get back to their normal lives. The importance of the field relies on
the fact that there are lives on the line every step of the way (both, rescuers and rescuees) and
every decision impacts a large number of affected people.
A disaster is a “serious disruption of the functioning of society, causing widespread human,
material or environmental losses which exceed the ability of affected society to cope using
only its own resources” (UNISDR, 2009). In many jurisdictions, a confirmation of a disaster
constitutes an official request for, or promises to, provide support. In the beginning of this
discussion another two terms are specified with disaster: natural disaster and manmade
disaster. According to UNISDR (2004), a disaster "takes place when the following three
conditions occur at the same time:
When people live in hazardous places like, for example, close to an active volcano,
on unstable slopes where landslides are likely to happen, or close to rivers which
could flood.
When a hazardous phenomenon occurs, be it natural or human-made.
When the phenomenon also causes a lot of damage, especially where no preventive
measures have been taken".
Disasters are commonly classified depending on its origin (natural or man-made) and its
quickness (sudden onset and slow onset). Figure 1 illustrates examples of disasters at each of
the categories. It is important to notice that depending on the characteristics of each disaster it
is the nature of the appropriate response operations to try to cope with the disaster.
Therefore to cope up with high impact disasters mankind needs an active and well-organized
disaster management process. The objective of disaster management is:
Total prevention of disaster;
Effective rescue and treatment of disaster affected population;
Mitigating the severeness of disaster and control the whole situation;

Operational Research: Key for Successful Disaster Management
49
Causality identification, classification and provide the necessary relief items to the
affected people.
Figure 1 Types of disaster (Van Wassenhove (2006)
2. Operational research: techniques for better performance
According to Altay and Green (2006), the most common operational research techniques used
in disaster management are:
Mathematical Programming
Probability and Statistics
Simulation
Decision Theory and Multi-Attribute Utility Theory
Queuing Theory
Fuzzy Sets
Stochastic Programming
Experts Systems and Artificial Intelligence
Systems Dynamics
Constraint Programming
Soft OR
The first two categories account for more than half of the papers reviewed by the author and
the first four cover over 73% of the research contributions. Thus, there will be only a brief
mention of the first four.
2.1. Mathematical programming
Mathematical programming is the most used technique for emergency logistics Caunhye, Nie,
& Pokharel, (2012), Balcik and Beamon (2008), Kongsomsaksakul, Chen, and Yang (2005),
Duran, Gutierrez, and Keskinocak (2011) and Lin, Batta, Rogerson, Blatt, and Flanigan

P. Albores et al. / YOR18 Keynote Papers and Extended Abstracts, pp.47-59 (2013)
50
(2011), among others are examples where the authors used mathematical programming and
constraints programming for disaster management. Also, Sheu (2007b) and Tzeng, Cheng,
and Huang (2007) used fuzzy optimization for the distribution of relief during disaster
operation.
2.2. Probability and statistics
Probability and statistics are a very flexible tool to calculate the probability of occurrence
(Tao, Tao, & Jiang, 2012) and to analyze scenarios (Dudin & Nishimura, 1999) within
emergency management.
2.3. Simulation
It is the technique of building a (computer) model of a real or proposed system so that the
behaviour of the system under specific conditions may be studied. Its application in disaster
management have several examples (e.g. Albores & Shaw, 2008; Banomyong & Sopadang,
2010; Lee, Ghosh, & Ettl, 2009; Nagarajan, Shaw, & Albores, 2012) and specially tools based
on agent-based systems (Fiedrich & Burghardt, 2007; Hawe, Coates, Wilson, & Crouch,
2012),
2.4. Decision theory and multi-attribute utility theory
Decision theory provides a rational framework for choosing between alternative courses of
action when the consequences resulting from this choice are imperfectly known. Two streams
of thought serve as the foundations: utility theory and the inductive use of probability theory
(North, 1968). "Decision theory concentrates on identifying the “best” decision option, where
the notion of “best” is allowed to have a number of different meanings, of which the most
common is that which maximises the expected utility of the decision maker. Decision theory
provides a powerful tool with which to analyse scenarios in which an agent must make
decisions in an unpredictable environment" (Parsons & Wooldridge, 2002), although recently
there is a calling for improvements on decision analysis to cope with several challenges
identified (Cox, 2012).
3. The role of operational research in disaster management
Winston (1994) defines operational research as a scientific approach for decision making,
which pursues to define the best way of design and operation of a system, usually under
conditions requiring the allocation of scarce resources.
In disaster management there are several trends of research related to social sciences,
specifically focused on sociological impacts after disaster, organisational design and
communication problems. But the other main stream of research is aiming to provide an
effective disaster management process, focusing on operation techniques and tools to fulfil
the needs of decision-makers by combining operational research with disaster management.
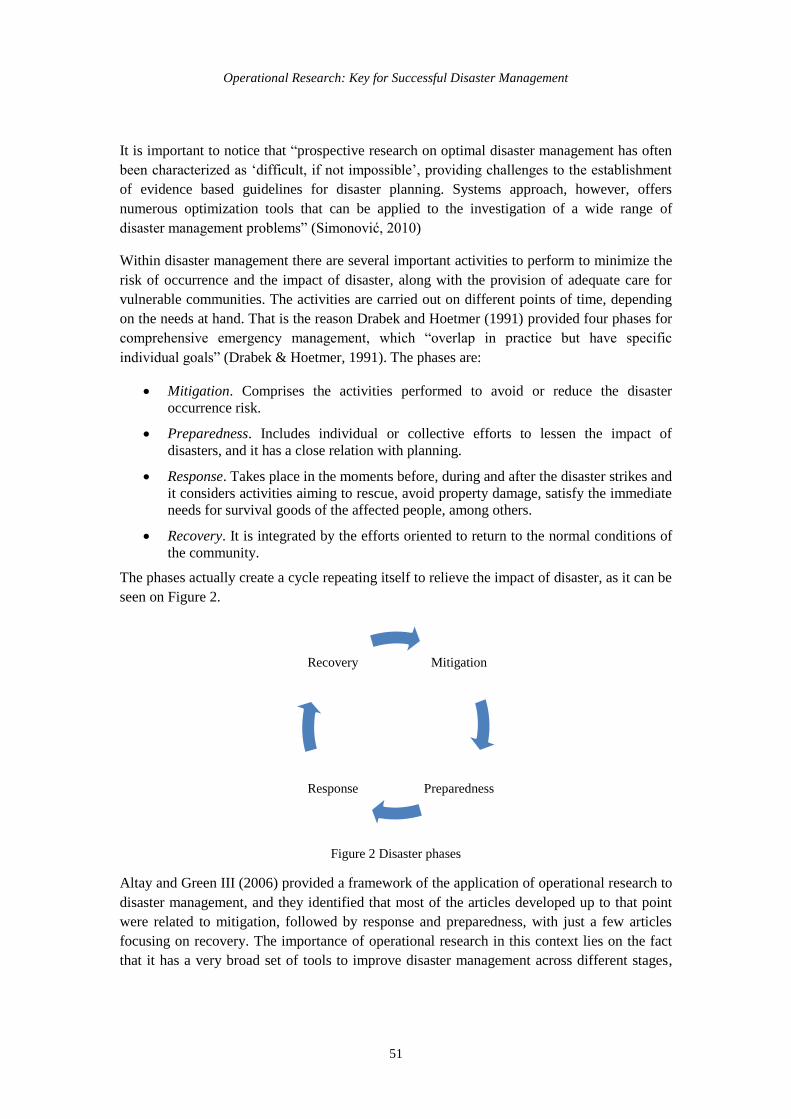
Operational Research: Key for Successful Disaster Management
51
It is important to notice that “prospective research on optimal disaster management has often
been characterized as „difficult, if not impossible‟, providing challenges to the establishment
of evidence based guidelines for disaster planning. Systems approach, however, offers
numerous optimization tools that can be applied to the investigation of a wide range of
disaster management problems” (Simonović, 2010)
Within disaster management there are several important activities to perform to minimize the
risk of occurrence and the impact of disaster, along with the provision of adequate care for
vulnerable communities. The activities are carried out on different points of time, depending
on the needs at hand. That is the reason Drabek and Hoetmer (1991) provided four phases for
comprehensive emergency management, which “overlap in practice but have specific
individual goals” (Drabek & Hoetmer, 1991). The phases are:
Mitigation. Comprises the activities performed to avoid or reduce the disaster
occurrence risk.
Preparedness. Includes individual or collective efforts to lessen the impact of
disasters, and it has a close relation with planning.
Response. Takes place in the moments before, during and after the disaster strikes and
it considers activities aiming to rescue, avoid property damage, satisfy the immediate
needs for survival goods of the affected people, among others.
Recovery. It is integrated by the efforts oriented to return to the normal conditions of
the community.
The phases actually create a cycle repeating itself to relieve the impact of disaster, as it can be
seen on Figure 2.
Figure 2 Disaster phases
Altay and Green III (2006) provided a framework of the application of operational research to
disaster management, and they identified that most of the articles developed up to that point
were related to mitigation, followed by response and preparedness, with just a few articles
focusing on recovery. The importance of operational research in this context lies on the fact
that it has a very broad set of tools to improve disaster management across different stages,
Mitigation
Preparedness Response
Recovery

P. Albores et al. / YOR18 Keynote Papers and Extended Abstracts, pp.47-59 (2013)
52
reason why operational research is widely used in emergency logistics and disaster
management.
At every phase the circumstances are different and obviously the needs and the decisions to
make are also different. Thus, it will be useful to analyze the role of operational research at
each stage to understand the relevance of the use of these techniques.
3.1. Mitigation
Mitigation is very commonly address by governmental authorities using cutting-edge
engineering techniques to build dams, dykes, protective walls, among others (Lopez-Pelaez &
Pigeon, 2011; Uddin & Ang, 2009; Yi, Furen, & Zhenming, 2012); forecasting (Davidson,
Zhao, & Kumar, 2003; Hsieh, 2004) and risk assessment (Coles & Pericchi, 2003; Lian &
Yen, 2003; Matisziw & Murray, 2009).
3.2. Preparedness
To improve planning and prevention, there are several applications of operational research
techniques in the field. The most common activities are location of emergency facilities (B.
Balcik & Beamon, 2008; Basar, Catay, & Unluyurt, 2011; Chowdhury, Watkins, Rahman, &
Karim, 1998; Dekle, Lavieri, Martin, Emir-Farinas, & Francis, 2005; R. Huang, Kim, &
Menezes, 2010; X.-R. Huang & Xie, 2009; Jia, Ordóñez, & Dessouky, 2007; Ng, Park, &
Waller, 2010; Sherali, Carter, & Hobeika, 1991) and pre-positioning (Campbell & Jones,
2011; M.-S. Chang, Tseng, & Chen, 2007; Cross, 2009; Rawls & Turnquist, 2010, 2011,
2012; Salmeron & Apte, 2010).
3.3. Response
This phase is highly aided by operational research for distribution (Burcu Balcik, Beamon, &
Smilowitz, 2008; Berkoune, Renaud, Rekik, & Ruiz, 2012; Özdamar & Demir, 2012;
Özdamar, Ekinci, & Küçükyazici, 2004; Sheu, 2007b, 2010; Suzuki, 2012; Wang & Dai,
2010; Widener & Horner, 2011), evacuation (Alçada-Almeida, Tralhão, Santos, & Coutinho-
Rodrigues, 2009; Apivatanagul, Davidson, & Nozick, 2012; Kongsomsaksakul et al., 2005;
Kulshrestha, Wu, Lou, & Yin, 2011; Li, Zhang, Liu, & Tan, 2011; Park, van de Lindt, Gupta,
& Cox, 2012; Saadatseresht, Mansourian, & Taleai, 2009; Sbayti & Mahmassani, 2006;
Scheer, Varela, & Eftychidis, 2012; Sherali et al., 1991; R. Song, He, & Zhang, 2009; Ye,
Wang, Huang, Xu, & Chen, 2012) and inventory planning (Beamon & Kotleba, 2006; Davis,
Samanlioglu, Qu, & Root, 2013; Ozbay, Kaan, Erman, & Eren, 2007; Ozguven & Ozbay,
2011).
3.4. Recovery
Although it is the less studied phase, there are some papers related to allocate displaced
people (Nikolopoulos & Tzanetis, 2003), infrastructure assessment (S. Chang & Nojima,

Operational Research: Key for Successful Disaster Management
53
2001; Cret, Yamazaki, Nagata, & Katayama, 1993; B. Song, Hao, Murakami, & Sadohara,
1996) and reconstruction (Kim & Dshalalow, 2002).
4. Conclusion and future research
This article focused on the disaster management domain and basically how operational
research techniques can be able to increase the efficiency of decision making process during
the critical situation of disasters. It looked at previous literature related to the use of
operational research in disaster management (See Altay & Green III, 2006; Caunhye et al.,
2012; Kovács & Spens, 2007) and identified new trends of research and the fact that more
contributions are needed for better decision-making in disaster management.
Moreover, the techniques presented are very flexible and can be used along with IT
technologies and soft methods to provide more comprehensive solutions, creating systems
with the advantages of different methods whilst reducing the constraint of a single
perspective.
Although there have been an increasingly number of papers regarding disaster management
recently, the number of topics to address is still very large and there is a need to come up with
new approaches to some topics. There are several areas that ought to be further investigated
and problems to be tackled using operational research, such as coordination, needs
assessment, humanitarian supply chain, emergency logistic operations, among others.
Overall there are great advances on the field, but more research is necessary to really improve
disaster management and the first key is to close the gap between practitioners and
researchers. Authorities have the insights and the experience, meanwhile researchers have the
tools and the expertise, and therefore a mutual arrangement could contribute to develop more
feasible and reliable systems for disaster management.
References
Albores, P., & Shaw, D. (2008). Government preparedness: Using simulation to prepare for a
terrorist attack. Computers and Operations Research, 35, 1924-1943. doi:
10.1016/j.cor.2006.09.021
Alçada-Almeida, L., Tralhão, L., Santos, L., & Coutinho-Rodrigues, J. (2009). A
Multiobjective Approach to Locate Emergency Shelters and Identify Evacuation
Routes in Urban Areas. Geographical Analysis, 41(1), 9-29. doi: 10.1111/j.1538-
4632.2009.00745.x
Altay, N., & Green III, W. G. (2006). OR/MS research in disaster operations management.
European Journal of Operational Research, 175(1), 475-493. doi:
10.1016/j.ejor.2005.05.016
Apivatanagul, P., Davidson, R., & Nozick, L. (2012). Bi-level optimization for risk-based
regional hurricane evacuation planning. Natural Hazards, 60(2), 567-588. doi:
10.1007/s11069-011-0029-9

P. Albores et al. / YOR18 Keynote Papers and Extended Abstracts, pp.47-59 (2013)
54
Balcik, B., & Beamon, B. M. (2008). Facility location in humanitarian relief. International
Journal of Logistics Research and Applications, 11(2), 101-121. doi:
10.1080/13675560701561789
Balcik, B., Beamon, B. M., & Smilowitz, K. (2008). Last Mile Distribution in Humanitarian
Relief. Journal of Intelligent Transportation Systems, 12(2), 51-63. doi:
10.1080/15472450802023329
Banomyong, R., & Sopadang, A. (2010). Using Monte Carlo simulation to refine emergency
logistics response models: a case study. International Journal of Physical
Distribution & Logistics Management, 40(8-9), 709-721.
Basar, A., Catay, B., & Unluyurt, T. (2011). A multi-period double coverage approach for
locating the emergency medical service stations in Istanbul. Journal Of The
Operational Research Society, 62(4), 627-637.
Beamon, B. M., & Kotleba, S. A. (2006). Inventory management support systems for
emergency humanitarian relief operations in South Sudan. International Journal of
Logistics Management, 17(2), 187-212. doi: 10.1108/09574090610689952
Berkoune, D., Renaud, J., Rekik, M., & Ruiz, A. (2012). Transportation in disaster response
operations. Socio-Economic Planning Sciences, 46(1), 23-32. doi:
http://dx.doi.org/10.1016/j.seps.2011.05.002
Campbell, A. M., & Jones, P. C. (2011). Prepositioning supplies in preparation for disasters.
European Journal of Operational Research, 209(2), 156-165. doi:
10.1016/j.ejor.2010.08.029
Caunhye, A. M., Nie, X., & Pokharel, S. (2012). Optimization models in emergency logistics:
A literature review. Socio-Economic Planning Sciences, 46(1), 4-13. doi:
10.1016/j.seps.2011.04.004
Chang, M.-S., Tseng, Y.-L., & Chen, J.-W. (2007). A scenario planning approach for the
flood emergency logistics preparation problem under uncertainty. Transportation
Research Part E: Logistics and Transportation Review, 43(6), 737-754. doi:
10.1016/j.tre.2006.10.013
Chang, S., & Nojima, N. (2001). Measuring post-disaster transportation system performance:
the 1995 Kobe earthquake in comparative perspective. Transportation Research Part
A, 35, 475-494. doi: 10.1016/s0965-8564(00)00003-3
Chowdhury, J. U., Watkins, D. W., Rahman, M. R., & Karim, M. F. (1998). Models for
Cyclone Shelter Planning in Bangladesh. Water International, 23(3), 155-163. doi:
10.1080/02508069808686762
Coles, S., & Pericchi, L. (2003). Anticipating catastrophes through extreme value modelling.
Journal of the Royal Statistical Society. Series C: Applied Statistics, 52(4), 405-416.
doi: 10.1111/1467-9876.00413

Operational Research: Key for Successful Disaster Management
55
Cox, J. L. A. (2012). Community Resilience and Decision Theory Challenges for
Catastrophic Events. Risk Analysis: An International Journal, 32(11), 1919-1934.
doi: 10.1111/j.1539-6924.2012.01881.x
Cret, L., Yamazaki, F., Nagata, S., & Katayama, T. (1993). Earthquake Damage Estimation
And Decision-Analysis For Emergency Shutoff Of City Gas Networks Using Fuzzy
Set-Theory. Structural Safety, 12(1), 1-19.
Cross, C. S. (2009). Stocking up for Disaster. Industrial Engineer: IE, 41(9), 36-40.
Davidson, R. A., Zhao, H., & Kumar, V. (2003). Quantitative model to forecast changes in
hurricane vulnerability of regional building inventory. Journal of Infrastructure
Systems, 9(2), 55-64. doi: 10.1061/(asce)1076-0342(2003)9:2(55)
Davis, L. B., Samanlioglu, F., Qu, X., & Root, S. (2013). Inventory planning and coordination
in disaster relief efforts. International Journal of Production Economics, 141(2), 561-
573. doi: http://dx.doi.org/10.1016/j.ijpe.2012.09.012
Dekle, J., Lavieri, M. S., Martin, E., Emir-Farinas, H. l., & Francis, R. L. (2005). A Florida
County Locates Disaster Recovery Centers. Interfaces, 35(2), 133-139. doi:
10.1287/inte.1050.0127
Drabek, T. E., & Hoetmer, G. J. (1991). Emergency management: principles and practice for
local government: International City Management Association.
Dudin, A., & Nishimura, S. (1999). A BMAP/SM/1 Queueing System with Markovian
Arrival Input of Disasters. [research-article]. Journal of Applied Probability(3), 868.
doi: 10.2307/3215447
Duran, S., Gutierrez, M. A., & Keskinocak, P. (2011). Pre-Positioning of Emergency Items
for CARE International. Interfaces, 41(3), 223-237.
Fiedrich, F., & Burghardt, P. (2007). Agent-Based Systems For Disaster Management.
Communications of the ACM, 50(3), 41-42.
Hawe, G. I., Coates, G., Wilson, D. T., & Crouch, R. S. (2012). Agent-Based Simulation for
Large-Scale Emergency Response: A Survey of Usage and Implementation. ACM
Computing Surveys, 45(1), 8:1-8:51. doi: 10.1145/2379776.2379784
Hsieh, P.-H. (2004). A Data-Analytic Method for Forecasting Next Record Catastrophe Loss.
[research-article]. The Journal of Risk and Insurance(2), 309. doi: 10.2307/3520036
Huang, R., Kim, S., & Menezes, M. B. C. (2010). Facility location for large-scale
emergencies. Annals of Operations Research, 181(1), 271-286. doi: 10.1007/s10479-
010-0736-8
Huang, X.-R., & Xie, R.-H. (2009, 21-22 May 2009). A Model on Location Decision for
Distribution Centers of Emergency Food Logistics. Paper presented at the
Information and Computing Science, 2009. ICIC '09. Second International
Conference on.

P. Albores et al. / YOR18 Keynote Papers and Extended Abstracts, pp.47-59 (2013)
56
Jia, H., Ordóñez, F., & Dessouky, M. (2007). A modeling framework for facility location of
medical services for large-scale emergencies. IIE Transactions, 39(1), 41-55. doi:
10.1080/07408170500539113
Kim, S. K., & Dshalalow, J. H. (2002). Stochastic disaster recovery systems with external
resources. Mathematical and Computer Modelling, 36(11-13), 1235-1257.
Kongsomsaksakul, S., Chen, A., & Yang, C. (2005). Shelter location-allocation model for
flood evacuation planning. Journal of the Eastern Asia Society for Transportation
Studies, 6, 4237 – 4252.
Kovács, G., & Spens, K. M. (2007). Humanitarian logistics in disaster relief operations.
International Journal of Physical Distribution & Logistics Management, 37(2), 99 -
114.
Kulshrestha, A., Wu, D., Lou, Y., & Yin, Y. (2011). Robust Shelter Locations for Evacuation
Planning with Demand Uncertainty. Journal of Transportation Safety & Security,
3(4), 272-288. doi: 10.1080/19439962.2011.609323
Lee, Y. M., Ghosh, S., & Ettl, M. (2009, 13-16 Dec. 2009). Simulating distribution of
emergency relief supplies for disaster response operations. Paper presented at the
Simulation Conference (WSC), Proceedings of the 2009 Winter.
Li, J., Zhang, B., Liu, W., & Tan, Z. (2011). Research on OREMS-based large-scale
emergency evacuation using vehicles. Process Safety and Environmental Protection,
89(5), 300-309. doi: http://dx.doi.org/10.1016/j.psep.2011.06.002
Lian, Y., & Yen, B. C. (2003). Comparison of risk calculation methods for a culvert. Journal
of Hydraulic Engineering, 129(2), 140-152. doi: 10.1061/(asce)0733-
9429(2003)129:2(140)
Lin, Y.-H., Batta, R., Rogerson, P. A., Blatt, A., & Flanigan, M. (2011). A logistics model for
emergency supply of critical items in the aftermath of a disaster. Socio-Economic
Planning Sciences, 45(4), 132-145. doi: http://dx.doi.org/10.1016/j.seps.2011.04.003
Lopez-Pelaez, J., & Pigeon, P. (2011). Co-evolution between structural mitigation measures
and urbanization in France and Colombia: A comparative analysis of disaster risk
management policies based on disaster databases. Habitat International, 35(4), 9.
Nagarajan, M., Shaw, D., & Albores, P. (2012). Innovative Applications of O.R.:
Disseminating a warning message to evacuate: A simulation study of the behaviour of
neighbours. European Journal of Operational Research, 220, 810-819. doi:
10.1016/j.ejor.2012.02.026
Matisziw, T. C., & Murray, A. T. (2009). Modeling – path availability to support disaster
vulnerability assessment of network infrastructure. Computers & Operations
Research, 36(1), 16-26. doi: http://dx.doi.org/10.1016/j.cor.2007.09.004
Ng, M., Park, J., & Waller, S. T. (2010). A Hybrid Bilevel Model for the Optimal Shelter
Assignment in Emergency Evacuations. Computer-Aided Civil and Infrastructure
Engineering, 25(8), 547-556. doi: 10.1111/j.1467-8667.2010.00669.x

Operational Research: Key for Successful Disaster Management
57
Nikolopoulos, C. V., & Tzanetis, D. E. (2003). A model for housing allocation of a homeless
population due to a natural disaster. Nonlinear Analysis: Real World Applications, 4,
561-579. doi: 10.1016/s1468-1218(02)00078-0
North, D. W. (1968). A Tutorial Introduction to Decision Theory. Systems Science and
Cybernetics, IEEE Transactions on, 4(3), 200-210. doi: 10.1109/tssc.1968.300114
Ozbay, Kaan, Erman, O., & Eren. (2007). Stochastic Humanitarian Inventory Control Model
for Disaster Planning. Washington, DC, ETATS-UNIS: National Research Council.
Özdamar, L., & Demir, O. (2012). A hierarchical clustering and routing procedure for large
scale disaster relief logistics planning. Transportation Research: Part E, 48(3), 591-
602. doi: 10.1016/j.tre.2011.11.003
Özdamar, L., Ekinci, E., & Küçükyazici, B. (2004). Emergency Logistics Planning in Natural
Disasters. Annals of Operations Research, 129(1-4), 217-245. doi:
10.1023/b:anor.0000030690.27939.39
Ozguven, E. E., & Ozbay, K. (2011). A secure and efficient inventory management system
for disasters. Transportation Research Part C: Emerging Technologies(0). doi:
http://dx.doi.org/10.1016/j.trc.2011.08.012
Park, S., van de Lindt, J., Gupta, R., & Cox, D. (2012). Method to determine the locations of
tsunami vertical evacuation shelters. Natural Hazards, 63(2), 891-908. doi:
10.1007/s11069-012-0196-3
Parsons, S., & Wooldridge, M. (2002). Game theory and decision theory in multi-agent
systems. Autonomous Agents And Multi-Agent Systems, 5(3), 243-254.
Rawls, C. G., & Turnquist, M. A. (2010). Pre-positioning of emergency supplies for disaster
response. Transportation Research Part B: Methodological, 44(4), 521-534. doi:
10.1016/j.trb.2009.08.003
Rawls, C. G., & Turnquist, M. A. (2011). Pre-positioning Planning for Emergency Response
with Service Quality Constraints. OR Spectrum, 33(3), 481-498. doi:
http://www.springerlink.com/link.asp?id=102498
Rawls, C. G., & Turnquist, M. A. (2012). Pre-positioning and dynamic delivery planning for
short-term response following a natural disaster. Socio-Economic Planning Sciences,
46(1), 46-54. doi: 10.1016/j.seps.2011.10.002
Saadatseresht, M., Mansourian, A., & Taleai, M. (2009). Evacuation planning using
multiobjective evolutionary optimization approach. European Journal of Operational
Research, 198(1), 305-314. doi: http://dx.doi.org/10.1016/j.ejor.2008.07.032
Salmeron, J., & Apte, A. (2010). Stochastic Optimization for Natural Disaster Asset
Prepositioning. Production and Operations Management, 19(5), 561-574.
Sbayti, H., & Mahmassani, H. (2006). Optimal Scheduling of Evacuation Operations.
Transportation Research Record: Journal of the Transportation Research Board,
1964(-1), 238-246. doi: 10.3141/1964-26

P. Albores et al. / YOR18 Keynote Papers and Extended Abstracts, pp.47-59 (2013)
58
Scheer, S. J., Varela, V., & Eftychidis, G. (2012). A generic framework for tsunami
evacuation planning. Physics and Chemistry of the Earth, Parts A/B/C, 49(0), 79-91.
doi: http://dx.doi.org/10.1016/j.pce.2011.12.001
Sherali, H. D., Carter, T. B., & Hobeika, A. G. (1991). A location-allocation model and
algorithm for evacuation planning under hurricane/flood conditions. Transportation
Research Part B: Methodological, 25(6), 439-452. doi: 10.1016/0191-
2615(91)90037-J
Sheu, J.-B. (2007b). An emergency logistics distribution approach for quick response to
urgent relief demand in disasters. Transportation Research Part E: Logistics and
Transportation Review, 43(6), 687-709. doi: 10.1016/j.tre.2006.04.004
Sheu, J.-B. (2010). Dynamic relief-demand management for emergency logistics operations
under large-scale disasters. Transportation Research Part E: Logistics and
Transportation Review, 46(1), 1-17. doi: 10.1016/j.tre.2009.07.005
Simonović, S. P. (2010). Systems approach to management of disasters [electronic resource]
: methods and applications / Slobodan P. Simonovic: Hoboken, NJ : Wiley, 2010.
Song, B., Hao, S., Murakami, S., & Sadohara, S. (1996). Comprehensive Evaluation Method
on Earthquake Damage Using Fuzzy Theory. J. Urban Plann. Dev., 122(1), 1-17.
Song, R., He, S., & Zhang, L. (2009). Optimum Transit Operations during the Emergency
Evacuations. Journal of Transportation Systems Engineering and Information
Technology, 9(6), 154-160. doi: http://dx.doi.org/10.1016/S1570-6672(08)60096-3
Suzuki, Y. (2012). Disaster-Relief Logistics With Limited Fuel Supply. Journal of Business
Logistics, 33(2), 145-157. doi: 10.1111/j.0000-0000.2012.01047.x
Swiss-Re. (2011). Sigma – preliminary estimates for 2011: natural catastrophes and man-
made disasters caused economic losses of USD 350 billion and cost insurers USD
108 billion Retrieved 19 November 2012, from
http://www.swissre.com/media/news_releases/nr_20111215_preliminary_estimates_2
011.html
Tao, Z.-R., Tao, X.-X., & Jiang, W. (2012). A Review on Long-Term Evaluation of
Occurrence Probability for Subduction-Zone Earthquakes in Eastern Japan (pp.
2190): Trans Tech Publications, Zürich, 2012.
Tzeng, G.-H., Cheng, H.-J., & Huang, T. D. (2007). Multi-objective optimal planning for
designing relief delivery systems. Transportation Research Part E: Logistics and
Transportation Review, 43(6), 673-686.
Uddin, N., & Ang, A. H.-S. (2009). Disaster risk assessment and mitigation [electronic
resource] : arrival of tsunami wave in Thailand / edited by Nasim Uddin, Alfredo
Ang: Reston, VA : American Society of Civil Engineers, c2009.
UNISDR. (2012), from http://www.unisdr.org/we/inform/disaster-statistics
UNIDSR . (2009) Reducing Disaster Risks through Science: Issues and Actions, The full
report of the ISDR Scientific and Technical Committee 2009”.

Operational Research: Key for Successful Disaster Management
59
UNISDR, (2004) United Nations Office for Risk Reduction. (2004), from
http://www.unisdr.org/2004/campaign/booklet-eng/Pagina5ing.pdf
Van Wassenhove, L. N. (2006). Humanitarian Aid Logistics: Supply Chain Management in
High Gear. [research-article]. The Journal of the Operational Research Society(5),
475. doi: 10.2307/4102445
Wang, Q., & Dai, B. (2010, 17-19 Dec. 2010). Emergency Logistics Management in Natural
Disasters. Paper presented at the Computational and Information Sciences (ICCIS),
2010 International Conference on.
Widener, M. J., & Horner, M. W. (2011). A hierarchical approach to modeling hurricane
disaster relief goods distribution. Journal of Transport Geography, 19(4), 821-828.
doi: http://dx.doi.org/10.1016/j.jtrangeo.2010.10.006
Winston, W. L. (1994). Operations research : applications and algorithms: London :
Brooks/Cole : Thomson, 2004.
Ye, M., Wang, J., Huang, J., Xu, S., & Chen, Z. (2012). Methodology and its application for
community-scale evacuation planning against earthquake disaster. Natural Hazards,
61(3), 881-892. doi: 10.1007/s11069-011-9803-y
Yi, D., Furen, X., & Zhenming, W. (2012). Wenchuan Earthquake Surface Fault Rupture and
Disaster: A Lesson on Seismic Hazard Assessment and Mitigation. International
Journal of Geophysics. doi: 10.1155/2012/974763

YOR18 Biennial Conference - Keynote Papers and Extended Abstracts, pp.60-73
University of Exeter, 9-11 April 2013
Disaster Management
60
KEYNOTE
Inter-Model Influence Diagram Analysis Using Modular Elicitation
Methods for Evacuation Decision-Making
Paul Kailiponi a, Duncan Shaw
b
a University of Manchester, Humanitarian and Conflict Response Institute (HCRI), Manchester, UK
b University of Warwick, Warwick Business School, Coventry, UK
[email protected], [email protected]
Abstract
Graphical modelling of decisions has been a common tool used in a wide range of analysis
methodologies including decision theory and systems thinking. While these models can be
effective in assessing a single decision context/situation, little emphasis has been placed on
simultaneous analysis of these decision representations for models that represent similar
decision problems. This paper will present a modular system of influence diagrams for
strategic decision-making for similar decision problems. An example of this modular ID
system will be shown by utilizing strategic-level influence diagrams to analyse evacuation
policies across a flood, nuclear and terrorist attack scenarios. The analytical process of the
modular influence diagrams also allows for an analysis of multiple objectives that exist for
evacuation decisions. These results show how communications strategies and public
interaction provide a wider breadth of influence on identified evacuation objectives across the
three disaster scenarios. The analysis also identifies uncertain factors that affect a wide range
of different emergency scenarios and makes transparent strategic decision-making. The
process can be generalized to organizations with identifiable strategic values where either
scenarios or lower-level decisions must be made using a subset of overarching objectives.
Keywords: Scenarios, Decision analysis, Multiple criteria analysis, Knowledge-based systems
1. Introduction
Graphical models have been widely used as a way to analyse decision processes within a wide
range of fields including mind maps in systems dynamics (Senge & Sterman, 1992), rich
pictures in soft systems methods (Checkland, 2001) and influence diagrams (IDs) in decision
theory (Pearl, 2005). In these cases the modelling of these decision processes are used to
assist elicitation of problem structures, specify explicit causal relationships and build strategy
for the decision context (Mingers & White, 2010). This paper will explore the extent to
which IDs elicited from different contexts can be analysed to identify common probabilistic
elements. This will be done by outlining a single objective-based modular elicitation of IDs
which can be combined into a multi-objective IDs. An inter-model analysis based on these
modular single-objective IDs will then be completed to identify common uncertainties
between different scenarios and common probabilistic strings of uncertainties across all
scenarios and objectives.
Inter-Model ID Analysis Using Modular Elicitation Methods for Evacuation Decision-Making
61
The modular elicitation of IDs combined with inter-model analysis attempts to combine
elements of both decision theory and systems dynamics. This can be beneficial both as a way
of sharing important domain knowledge across disparate organisations and provide insight
into uncertainties that have the widest breadth of influence over a single decision context. By
basing the decision model elicitation on IDs, it is possible to assess causal relationships
between uncertainties in order to quantitatively specify probability functions (pfs) (Clemen &
Reilly, 2001). IDs also allow for multi-objective problems by specifying separate objective-
based pfs for each identified joint and conditional relationship (French & Rios Insua, 2000;
Raiffa & Schlaiffer, 2000). An example of this process will be given for emergency
evacuation decision-making in cases of catastrophic disaster. This is based on the Evacuation
Responsiveness by Government Organisations (ERGO) Project which includes the
identification of overarching criterion for evacuation decision-making across various
catastrophic disaster scenarios (Shaw et al., 2011).
Section 2 of this paper will discuss current methods of decision structuring within systems
dynamics and decision theory. In particular we will discuss the objectivity of these different
decision structures when using them to disseminate information between different groups or
individuals. Section 3 will discuss the process of modular ID analysis including the
elicitation of individual objective modules and their combination into complete IDs. Section
4 will describe results of the case study of modular ID analysis using catastrophic evacuation
decision-making for different emergency scenarios. This section will also discuss the
common elements in evacuation decision-making that were identified when comparing the
different emergency scenarios. Common modular elements include spatial/temporal aspects
of the risk, population characteristics and building characteristics. Common probabilistic
stings identified across all evacuation scenarios include communication continuity and
evacuee casualty rates. An evaluation of the modular analysis process and possible expansion
to other fields will be given in Section 5. This analysis is appropriate for problems where an
overarching objective structure is available for a related set of narrative scenarios.
2. Graphical model use and analysis
As a part of operational research, graphical models hold an important position as both a
method to disseminate and structure decision problems (Huff, 1990). Influence diagrams,
however seem to have taken a very different arc within operational research as a framework
for quantitative specification (Quigley, 2009). This section will describe causal map
techniques in order to show the strengths of inter-model analysis within systems dynamics
along with the advantages of multi-objective modelling and quantitative specification found
in influence diagrams.
2.1. Systems thinking problem structuring
Causal maps fit into a much larger body of literature concerning the use of graphical
representations of decision processes. Besides causal maps some other common graphical
tools to support decision-making are mindmaps (Buzan, 2005; Buzan & Buzan, 1994),
P. Kailiponi, D. Shaw / YOR18 Keynote Papers and Extended Abstracts, pp.60-73 (2013)
62
cognitive maps (Eden & Ackermann, 1998) and rich pictures (Checkland, 2001). Causal
maps differ from the aforementioned models in an epistemological sense as they are focused
on the description of cause-and-effect relationships between uncertain factors. Goodier
(2010) describes causal maps as frameworks around which “coherent and coordinated
behaviours and actions are critical”.
Another development within the systems dynamics literature is the comparison of causal
maps developed by separate organisations. This can be useful in identifying common
elements either within different interpretations of a single problem elicited from multiple
individuals or as a method to compare like-scenarios. Markoczy & Goldberg (1995) describe
a method that focuses on identifying the difference between separate causal models by
assessing the nodes and arcs to create a distance ratio. Two primary conclusions were drawn
by the authors in regards to the comparison of these models. First, that an effective analysis
between causal maps is only possible where a systematic elicitation process is used for all
member maps. A second important finding deals with the elimination of subjective aspects of
the causal maps which can result in biased results especially for the identification of clustered
portions of the causal maps.
Causal mapping are commonly used to foster learning and support cause-effect relationships
for complex systems. Comparison between these models can be difficult due to the multiple
meanings that can be attached to each node in the graphical structure and possible variation
due to elicitation methods (Burt, 2011). An explicit, consistent facilitation process was
mentioned by Markoczy as vital to effective comparisons between causal maps. Additional
quantitative processes can be completed to both identify difference between different causal
maps as well as both sequences and clusters of concepts that are common between the maps.
2.2. Influence diagrams
Developed by Howard & Matheson (2005) an influence diagram is a graphical representation
of a single decision context. In order to limit confusion any instance of influence diagrams
within this work will refer to those described by Howard & Matheson. When these graphics
are used in conjunction with elicitation methods it can be a powerful tool to verify and
communicate key issues between decision-makers (DMs). IDs can also be used as a way to
verify that all relevant factors of the decision have been included (requisite modelling)
(French & Rios Insua, 2000). This verification of client-analyst understanding is vital to
increase buy-in of the results of the decision model (Carrigan, Cardner, Conner, & Maule,
2004). The structure of an ID can also be used to develop a quantitative model of the decision.
An ID utilizes shapes (called nodes) and arcs (connecting lines) to represent conditional and
joint relationships between factors in the analysis. Figure 1 is an ID of the basic evacuation
decision.
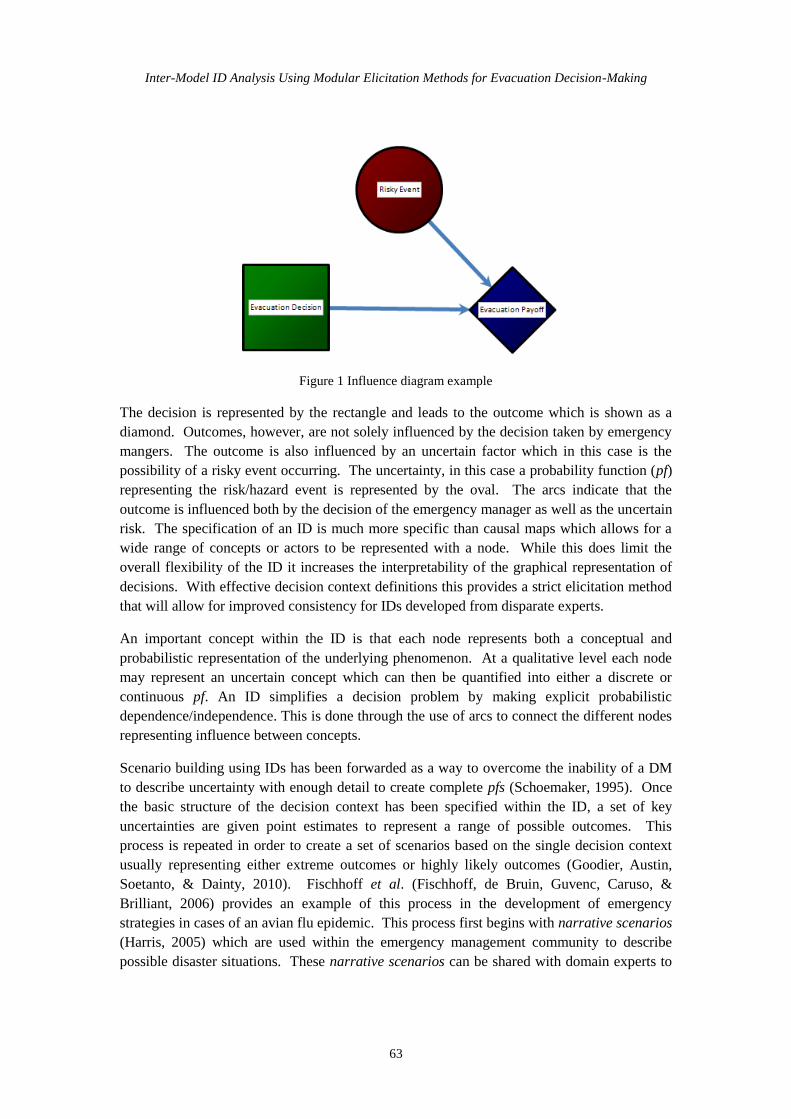
Inter-Model ID Analysis Using Modular Elicitation Methods for Evacuation Decision-Making
63
Figure 1 Influence diagram example
The decision is represented by the rectangle and leads to the outcome which is shown as a
diamond. Outcomes, however, are not solely influenced by the decision taken by emergency
mangers. The outcome is also influenced by an uncertain factor which in this case is the
possibility of a risky event occurring. The uncertainty, in this case a probability function (pf)
representing the risk/hazard event is represented by the oval. The arcs indicate that the
outcome is influenced both by the decision of the emergency manager as well as the uncertain
risk. The specification of an ID is much more specific than causal maps which allows for a
wide range of concepts or actors to be represented with a node. While this does limit the
overall flexibility of the ID it increases the interpretability of the graphical representation of
decisions. With effective decision context definitions this provides a strict elicitation method
that will allow for improved consistency for IDs developed from disparate experts.
An important concept within the ID is that each node represents both a conceptual and
probabilistic representation of the underlying phenomenon. At a qualitative level each node
may represent an uncertain concept which can then be quantified into either a discrete or
continuous pf. An ID simplifies a decision problem by making explicit probabilistic
dependence/independence. This is done through the use of arcs to connect the different nodes
representing influence between concepts.
Scenario building using IDs has been forwarded as a way to overcome the inability of a DM
to describe uncertainty with enough detail to create complete pfs (Schoemaker, 1995). Once
the basic structure of the decision context has been specified within the ID, a set of key
uncertainties are given point estimates to represent a range of possible outcomes. This
process is repeated in order to create a set of scenarios based on the single decision context
usually representing either extreme outcomes or highly likely outcomes (Goodier, Austin,
Soetanto, & Dainty, 2010). Fischhoff et al. (Fischhoff, de Bruin, Guvenc, Caruso, &
Brilliant, 2006) provides an example of this process in the development of emergency
strategies in cases of an avian flu epidemic. This process first begins with narrative scenarios
(Harris, 2005) which are used within the emergency management community to describe
possible disaster situations. These narrative scenarios can be shared with domain experts to
P. Kailiponi, D. Shaw / YOR18 Keynote Papers and Extended Abstracts, pp.60-73 (2013)
64
create a framework of uncertainty around which a set of compatible scenarios can be
identified. Similar process to develop narrative scenarios have been developed for
emergency management (Aven & Renn, 2009), energy policy (Kowalski, Stagl, Madlener, &
Omann, 2009), and environmental issues (Lempert, Groves, Popper, & Bankes, 2006).
A modular criterion-based approach to elicitation will provide the additional structure that
will allow for inter-model analysis not currently present within IDs. Because the inter-model
analysis is based on an ID it can also be used to represent the mixture of probabilistic
dependencies between identified factors. Both of these factors are important and represent
important contributions to both decision theory and emergency management. It also
represents a novel combination of system dynamics methods with decision theory that is
appropriate for problems that have a similar objective structure that is influenced by varied
sets of uncertainties. Within emergency management it will provide insight into common
probabilistic factors that affect evacuation outcomes and underlying strategies to improve
those outcomes.
3. Methodology
The process of objective-based ID modules will be developed in this section including the
elicitation, combination and comparison process for different narrative scenarios of
evacuation decision-making. The ERGO project will also be described in order to illustrate
and define the specific emergency scenarios chosen to analyse evacuation operations.
Because modular elicitation process is focused on cross-model comparison an explicit process
for problem structuring will be used in the elicitation of the underlying ID. The entire
elicitation process is outlined in Table 1.
Table 1 Modular Influence Diagram process
1. Specify an overarching decision context
2. Identify multiple objectives for that decision context
3. Define a set of narrative scenarios to analyse
4. Specify a set of objectives for each narrative scenario
5. Complete modular Influence Diagrams for each
objective within each narrative scenario
6. Combine objective ID modules for each scenario
7. Node-based analysis
8. Identification of common module clusters
Overarching decision context refers to a single decision that must be made under a set of
unique narrative scenarios. In this case an evacuation decision is an overarching decision
that an emergency manager faces given a wide range of possible risks/threats. Multiple
objectives for complex decision problems are a common occurrence in emergency
management (Bertsch, Geldermann, Rentz, & Raskob, 2006). Once the context and
objectives have been identified a set of narrative scenarios will be chosen. A narrative

Inter-Model ID Analysis Using Modular Elicitation Methods for Evacuation Decision-Making
65
scenario refers to a descriptive situation that fits the overarching context and is comprised of
both a objective-based structure representing multiple, conflicting objectives and unique set
of uncertainties that influence outcomes of the scenario for each identified objective. The
elicitation of explicit IDs for each objective within the narrative scenario is then completed.
These modular criterion-based IDs are then combined to create full multi-objective IDs that
are then used to analyse common structural elements between the narrative scenarios.
3.1. Evacuation Responsiveness by Government Organisations (ERGO)
Evacuation operations in advance of catastrophic disaster are of great concern for emergency
management organisations around the world. One important goal of the ERGO project was
the identification of a set of overarching objectives for evacuation operations across of
participating nations. Kailiponi (2009) explains the process through which semi-structured
interviews and facilitated group sessions were used to identify and compile overall objectives
for evacuation operations across a wide range of catastrophic emergency scenarios. Table 2
shows the identified evacuation objectives along with possible attribute measurement scales
for each.
Table 2 Overarching evacuation objective list
Objective Attribute
1. Minimise health and safety threat
Minimise loss of life # of Casualties
Minimise injuries # of Serious injuries
Minimise individuals subject to radiation
# of individuals irradiated
2. Minimise economic disruption
Minimise business disruption Monetary loss
Minimise personal disruption
Monetary loss
3. Minimise public disorder # of individuals that exhibit panicked
behaviour
4. Minimise cost to emergency organisations Monetary loss
5. Minimise public disregard for future
evacuation orders
# of individuals that fail to regard
future evacuation orders
6. Maximise public confidence in officials Public approval strategy
7. Maximise integrity of possible criminal
investigations
Time delay of investigation due to
evacuation
The ERGO project was also vital in identifying an initial set of disaster scenarios. Evacuation
scenarios to further develop were chosen based on the number of participating countries who
expressed concern over that specific scenario. While there was variation within countries as
to their experience with those actual events, there was a great deal of expertise for each of the
P. Kailiponi, D. Shaw / YOR18 Keynote Papers and Extended Abstracts, pp.60-73 (2013)
66
identified high-concern scenarios among the ERGO participating countries. While these
situations represent scenarios of high concern for almost all ERGO countries, it also allowed
the analyst to focus on DMs who have the greatest amount of practical experience in
preparing for evacuation actions in advance of these events. These individuals were then
contacted to further develop the specification of IDs for those catastrophic events.
3.2. Elicitation of modular influence diagrams
For any given scenario j a set of objectives i must be identified that represents the primary
goals that a DM should consider when making the decision chosen from an overarching set of
objectives (Table 2). For each scenario the decision is then structured in such a way that a
separate ID is developed for each pair of objective/scenario. Arcs are used to specify
independence, joint and conditional relationships between each node. This creates the
modular basis for influence diagrams that will then be used to complete inter-model analysis
between scenarios. This process conceptually simplifies the elicitation process by allowing a
DM to focus on a single objective and the identification of uncertain factors that may have an
influence on that objective. A single module is a set of nodes nij that represents the factors
that influence outcomes for that identified objective. Because the process of node
identification and ID specification is repeated for each identified objective it is possible to
have multiple instances of a single node nij between scenarios.
3.3. Inter-model analysis of MIDs
Inter-model analysis of different narrative scenarios can be completed once each set of
objective-based modular IDs have been elicited and combined. This is accomplished at the
node level by counting instances of each node for each objective across all scenarios. This
initial count represents the number of times a single chance node influences an objective
across all scenarios. These simple counts represent the breadth of influence that a single
chance node has across all scenarios and objectives. The purpose of the inter-model analysis
is not based on an understanding of the quantitative elicitation of multi-objective functions
but is instead based on the count of common elements between objectives and scenarios for a
single decision context.
In cases where the underlying set of objectives is similar between the different narrative
scenarios a large amount of overlap in multi-objective structures are possible. Because of this
it is possible to identify clusters of causal relationships. A cluster in this sense is a common
string of probabilistic uncertainties that are present for objective-based ID modules across
different narrative scenarios. This would indicate a combination of both nodes representing
the underlying pf as well as the arc structure that represents the relationship between the
various elements within in ID module. While it is not possible to assume that the
probabilistic modelling of the cluster is common between different narrative scenarios, the
multi-objective ID created when combining modular IDs can provide some insight as to
possible differences between modelled scenarios. Probabilistic clusters within IDs can be
easily seen due to the objective-based modular elicitation of influence diagrams. When these

Inter-Model ID Analysis Using Modular Elicitation Methods for Evacuation Decision-Making
67
modular IDs are elicited in succession across narrative scenarios clusters will occur as the
underlying objectives included between those scenarios become more homogenous.
The methodology of modular objective-based elicitation of IDs allows for a type of inter-
model analysis that is more common within system dynamics methodology. The use of ID
elicitation using an objective-based structure also simplifies the elicitation for multi-objective
problems and allows for greater prescriptive control to verify that the elicitation is done in a
manner that is consistent across different organisations. The modular elicitation structure also
makes explicit the underlying probabilistic structure of uncertainties for multi-objective IDs.
Given the ability to create consistent decision models, an effective inter-model analysis is
then possible. Both a node-based and cluster identification process will be used to identify
common elements within evacuation decision-making. The findings will represent both a
form of knowledge sharing between subject experts but also a form of all-hazard analysis to
guide policy decisions across all possible catastrophic scenarios that may lead to evacuation
operations.
4. Findings
Initial findings indicate that there is a large amount of overlap in the objectives that
emergency managers consider when faced with flood, nuclear dispersion and terror events.
This combination of scenario and objectives led to the creation of 11 separate modular
objective-based IDs. These findings also indicate that a similar set of objectives were
considered when assessing the evacuation decision. This would indicate that the decision-
making process is not sensitive to some of the underlying conditions that may cause the
evacuation. This facilitated the creation of the modular IDs as similar objective structures
that naturally lead into similar probabilistic specification of uncertainty even across different
emergency scenarios. Objective-based modular IDs were then assessed from a primary
decision-maker for each respective emergency scenario. An example of a MID is given in
Figure 2 representing the panic and disorder objective for terror attacks.
The asterisks within Figure 2 represent nodes that have a unique pf for each predecessor. This
notation was used within the figure to simplify the ID. Following the elicitation of ID
modules for all objectives within each narrative scenario and combination of those modules
into a multi-objective ID, a node-based analysis can be completed to find the breadth of
influence that any given elicited uncertainty affects evacuation outcomes. Table 3 provides
the results of the node-based analysis. Each node is listed along with the number of instances
in which it can be found within different objective modules and within each scenario. A
general qualitative category was also connected to each node based on the underlying content
elicited from the appropriate emergency manager.

P. Kailiponi, D. Shaw / YOR18 Keynote Papers and Extended Abstracts, pp.60-73 (2013)
68
Figure 2 Example of modular objective-based ID
The qualitative categories are useful in broadly grouping the uncertainties according to
common topics across the evacuation decision context and also represent common nodes
within a string across the different modules.
Risk factor refers to uncertainties related to the primary threat/hazard that may cause the
evacuation decision. Risk factors between the different evacuation scenarios are unique and
as such they do not exhibit influence across the range of scenarios. The exception to this is
the way that weather conditions affect evacuee casualty rates. Population information holds a
prominent position between all scenarios. An interesting set of findings in regards to the
population at-risk in catastrophic disaster situations are the characteristics of the population
that are important to emergency managers in evacuation situations. The inter-model analysis
shows that general age and health-based characteristics of the population are important in
regards to the associated casualty rates, ability to evacuate from the at-risk area ability to
receive official communications from emergency managers. Building factors also had a
wide-breadth of influence over evacuation objectives. These factors affect both the associated
casualty rates for both evacuees in some scenarios and non-evacuees in all of the scenarios.
Building strength was also found to have an effect on the possible panicked behaviour
exhibited by individuals in at-risk zones. Conceptually this refers to the idea that appropriate
building characteristics can mitigate the effect of a risk/hazard on the public.
Communication factors were found to have a very wide breadth of influence across all
evacuation scenarios. These factors represent a mixture of the formal/informal
communications to the public that ultimately influence evacuation compliance rates and
panic/disorder outcomes across all scenarios. These factors also make explicit aspects of
communication messages (i.e. length, repetition, credibility and clarity) that lead to
information continuity that ultimately affects evacuation compliance rates. This same group

Inter-Model ID Analysis Using Modular Elicitation Methods for Evacuation Decision-Making
69
of factors also influences the amount of panic and disorder of individuals within the area.
Simply because an identical string of factors is present within across different modules does
not mean that the underlying pfs are also similar. Indeed quantitative analysis that would
follow these structural findings would focus of eliciting the effect that these communication
factors influence either panic/disorder among the public for each scenario or evacuation
compliance and that effect on final causality/injury outcomes.
Table 3 Inter-model node analysis
Node name Total count Scenario Objective Category
Population 6 3 2 Population
information received 6 3 2 Population
age 6 3 2 Population
disability 6 3 2 Population
transition 6 3 2 Population
Time of day 6 3 2 Temporal
Evacuation compliance rate 3 3 1 Behaviour
River height forecast 1 1 1 Risk
Rainfall forecast 3 3 1 Risk
Ground saturation 1 1 1 Risk
Dyke effectiveness 1 1 1 Risk
Pumping efficiency 1 1 1 Risk
Temporary defence effectiveness 1 1 1 Risk
Building structure 6 3 2 Infrastructure
Casualty rate 3 3 1 Health
Evacuee casualty rate 3 3 1 Health
Personal fitness 5 3 2 Population
# of previous events 3 3 1 Population
Gov‟t interaction with media 3 3 1 Communication
Gov‟t interaction with public 6 3 2 Communication
Media report (positive/negative) 2 2 1 Communication
Business type 3 3 1 Communication
Previous event outcomes 2 2 1 Behaviour
Economic losses 3 3 1 Spatial
Area to evacuate 6 3 2 Spatial
Initial event intensity 1 1 1 Risk
Distance to event 3 3 1 Spatial
Distance of loved ones to event 3 3 1 Spatial
Visual clues 3 3 1 Risk
Proximity to event 6 3 2 Risk
Secondary threat probability 1 1 1 Risk
Road conditions 3 3 1 Infrastructure
Radiological type 1 1 1 Risk
Release quantity 1 1 1 Risk
Atmospheric dispersion 1 1 1 Risk
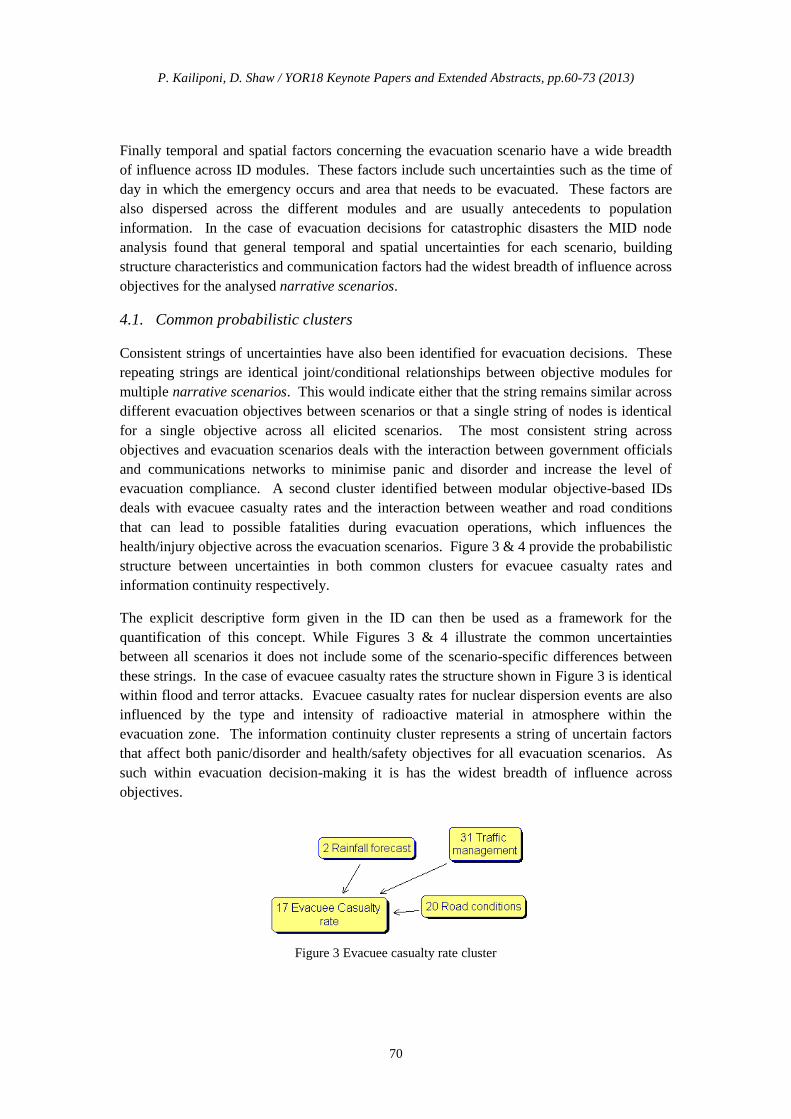
P. Kailiponi, D. Shaw / YOR18 Keynote Papers and Extended Abstracts, pp.60-73 (2013)
70
Finally temporal and spatial factors concerning the evacuation scenario have a wide breadth
of influence across ID modules. These factors include such uncertainties such as the time of
day in which the emergency occurs and area that needs to be evacuated. These factors are
also dispersed across the different modules and are usually antecedents to population
information. In the case of evacuation decisions for catastrophic disasters the MID node
analysis found that general temporal and spatial uncertainties for each scenario, building
structure characteristics and communication factors had the widest breadth of influence across
objectives for the analysed narrative scenarios.
4.1. Common probabilistic clusters
Consistent strings of uncertainties have also been identified for evacuation decisions. These
repeating strings are identical joint/conditional relationships between objective modules for
multiple narrative scenarios. This would indicate either that the string remains similar across
different evacuation objectives between scenarios or that a single string of nodes is identical
for a single objective across all elicited scenarios. The most consistent string across
objectives and evacuation scenarios deals with the interaction between government officials
and communications networks to minimise panic and disorder and increase the level of
evacuation compliance. A second cluster identified between modular objective-based IDs
deals with evacuee casualty rates and the interaction between weather and road conditions
that can lead to possible fatalities during evacuation operations, which influences the
health/injury objective across the evacuation scenarios. Figure 3 & 4 provide the probabilistic
structure between uncertainties in both common clusters for evacuee casualty rates and
information continuity respectively.
The explicit descriptive form given in the ID can then be used as a framework for the
quantification of this concept. While Figures 3 & 4 illustrate the common uncertainties
between all scenarios it does not include some of the scenario-specific differences between
these strings. In the case of evacuee casualty rates the structure shown in Figure 3 is identical
within flood and terror attacks. Evacuee casualty rates for nuclear dispersion events are also
influenced by the type and intensity of radioactive material in atmosphere within the
evacuation zone. The information continuity cluster represents a string of uncertain factors
that affect both panic/disorder and health/safety objectives for all evacuation scenarios. As
such within evacuation decision-making it is has the widest breadth of influence across
objectives.
Figure 3 Evacuee casualty rate cluster

Inter-Model ID Analysis Using Modular Elicitation Methods for Evacuation Decision-Making
71
Figure 4 Information continuity cluster
Information continuity is different from evacuation casualty rates in that the underlying pfs
between evacuation scenarios are unique. Additionally there is a high level of complexity
even within the cluster identified between the different objective-based modules. Emergency
managers can use this information to guide their communication development and
dissemination to the public within at-risk areas. In the case of communication development,
coordination with media outlets and specific aspects of the evacuation order influence
compliance. Message length, repetition and credibility (all of which are specific aspects of
communications made with the public and media outlets) were found to widely influence
outcomes related to the public compliance with evacuation orders as well as panic/disorder
exhibited by the public. The development of specific pfs for this cluster is more complex as
effective measurement of these concepts can be difficult. Despite this, the identification of
the communication provides insight into a set of communication strategies that may have a
much wider breadth of influence over the appropriate evacuation decision objectives.
5. Discussion & Conclusion
The process of creating modular influence diagrams can have many advantages in the
modelling of complex decision problems. A modular assessment of a specific decision
context improves the clarity of probabilistic relationships between identified uncertainties for
multi-objective problems. It also simplifies the elicitation process for experts who, instead of
developing complete multi-objective models, need only create sections of the same model
based on the objectives they feel are appropriate for the decision context. The development of
different narrative scenarios for a single decision context also allows for a structure to
perform inter-model analysis as well as the ability to increase knowledge sharing in cases
where experience concerning a single scenario is external to the existing managers. The ID
structure in this way is appropriate for decision problems where little information is available
and the scenario based expertise that is required for planning is widely dispersed.
In the case of evacuation decision-making common elements were identified across the three
different scenarios proposed by ERGO participating experts. Between the three different
P. Kailiponi, D. Shaw / YOR18 Keynote Papers and Extended Abstracts, pp.60-73 (2013)
72
evacuation scenarios spatial/temporal, population characteristics and building characteristics
were all found to be concepts that influence all scenarios as well as multiple objectives within
those scenarios. This can be used by emergency officials to guide data gathering in
preparation of catastrophic disaster events as well as during evacuation operations to make
acute emergency decisions. The identification of evacuee casualty and communications
clusters is also important to guide policies that affect evacuation planning for multiple
hazards.
This modular process to ID elicitation has the potential to support a wide range of decision
problems where different narrative scenarios share a similar objective structure. By splitting
the elicitation into single objective ID modules the decision structure is made explicit for each
objective, something that is not made explicit in an ID that attempts to show the multi-
objective decision context. Inter-model analysis in this case also provides emergency
managers in this example with some insight into the evacuation decision without the need to
elicit the complete set of joint and conditional relationships to finalise a quantitative decision
model. These findings represent both a strong addition to decision theory methodology using
a combination of inter-model analysis taken from system dynamics and soft systems
methodology with the explicit decision structuring possible through the use of influence
diagrams.
References
Aven, T., & Renn, O. (2009). The Role of Quantitative Risk Assessments for Characterizing
Risk and Uncertainty and Delineating Appropriate Risk Management Options, with
Special Emphasis on Terrorism Risk. Risk analysis, 29(4), 587.
Bertsch, V., Geldermann, J., Rentz, O., & Raskob, W. (2006). Multi-criteria decision support
and stakeholder involvement in emergency management. International Journal of
Emergency Management, 3(2/3), 2-2.
Burt, G. (2011). Towards the integration of system modelling with scenario planning to
support strategy: the case of the UK energy industry. The Journal of the Operational
Research Society, 62(5), 830-830-839.
Buzan, T. (2005). Mindmap Handbook. London: Thorsons.
Buzan, T., & Buzan, B. (1994). The Mind Map Book: How to Use Radiant Thinking to
Maximize Your Brain's Untapped Potential. New York: Plume.
Carrigan, N., Cardner, P. H., Conner, M., & Maule, A. J. (2004). The impact of structuring
information in a patient decision aid. Psychology and Health, 19(4), 457-477.
Checkland, P. (2001). Soft systems methodology. In J. Rosenhead & J. Mingers (Eds.),
Rational Analysis for a Problematic World Revisited (pp. 61-89). Chichester: John
Wiley and Sons.
Clemen, R. T., & Reilly, T. (2001). Making Hard Decisions (2nd ed.). USA: Duxbury.
Eden, C., & Ackermann, F. (1998). Making Strategy: The Journay of Strategic Management.
London: Sage.

Inter-Model ID Analysis Using Modular Elicitation Methods for Evacuation Decision-Making
73
Fischhoff, B., de Bruin, W. B., Guvenc, U., Caruso, D., & Brilliant, L. (2006). Analyzing
Disaster Risks and Plans: An Avian Flu Example. Journal of Risk and Uncertainty,
33(1-2), 131-149.
French, S., & Rios Insua, D. (2000). Statistical Decision Theory (Vol. 9). London: Arnold.
Goodier, C., Austin, S., Soetanto, R., & Dainty, A. (2010). Causal mapping and scenario
building with multiple organisations. Futures, 42(3), 219.
Harris, G. (2005, September 14, 2005). From Washington, a Story about a Killer Flu. New
York Times.
Howard, R. A., & Matheson, J. E. (2005). Influence Diagrams. Decision Analysis, 2(3), 127-
143.
Huff, A. S. (Ed.). (1990). Mapping Strategic Thought. New York: John Wiley & Sons.
Kailiponi, P. (2009). Analysing evacuation decisions using multi-attribute utility theory
(MAUT). First International Conference on Evacuation Modeling and Management
(ICEM), 3, 163-174.
Kowalski, K., Stagl, S., Madlener, R., & Omann, I. (2009). Sustainable energy futures:
Methodological challenges in combining scenarios and participatory multi-criteria
analysis. European Journal of Operational Research, 197(3), 1063.
Lempert, R. J., Groves, D. G., Popper, S. W., & Bankes, S. C. (2006). A General, Analytic
Method for Generating Robust Strategies and Narrative Scenarios. Management
Science, 52(4), 514-528.
Markoczy, L., & Goldberg, J. (1995). A method for eliciting and comparing causal maps.
Journal of Management 21(2), 305-333.
Mingers, J., & White, L. (2010). A review of the recent contribution of systems thinking to
operational research and management science. European Journal of Operational
Research, 207(3), 1147-1161.
Pearl, J. (2005). Influence Diagrams--Historical and Personal Perspectives. Decision Analysis,
2(4), 232-234.
Quigley, J. (2009). Bayesian Networks and Influence Diagrams: A Guide to Construction and
Analysis. Journal of the American Statistical Association, 104(487), 1273.
Raiffa, H., & Schlaiffer, R. (2000). Applied Statistical Decision Theory. New York: John
Wiley & Sons.
Schoemaker, P. J. H. (1995). Scenario Planning: A Tool for Strategic Thinking. Sloan
Management Review, 36(2), 25-40.
Senge, P. M., & Sterman, J. D. (1992). Systems thinking and organizational learning: Acting
locally and thinking globally in the organization of the future. European Journal of
Operational Research, 59(1), 137-150.
Shaw, D., Albores, P., Anson, S., Kailiponi, P., Nagarajan, M., Tissington, P., et al. (2011).
Evacuation Responsiveness by Government Organisations (ERGO): Final Report.
Birmingham, UK: Aston Centre for Research into Safety and Security (CRISIS).

YOR18 Biennial Conference - Keynote Papers and Extended Abstracts, pp.74-76
University of Exeter, 9-11 April 2013
DEA
74
Performance Evaluation of Forecasting Models:
At Last, Problem Solved!
Jamal Ouenniche
Business School, The University of Edinburgh,
29 Buccleuch Place, Edinburgh EH8 9JS, UK
Abstract
The current methodology for assessing the relative performance of competing forecasting
models is unidimensional in nature in that models are compared to each other using a single
criterion at a time, which typically leads to different rankings for different criteria thus
resulting in conflicting results or conclusions regarding the performance of competing models.
Xu and Ouenniche (2011, 2012a, 2012b) addressed this methodological issue by proposing
several data envelopment analysis and multi-criteria decision making analysis frameworks for
determining a single ranking that takes account of several criteria. In this paper, we overcome
some issues with the previously proposed DEA-based methodologies by proposing an
orientation-free super-efficiency DEA framework; namely, a slacks-based super-efficiency
DEA framework. For illustration purposes, we assess the performance of competing models
for forecasting the volatility of crude oil prices.
Keywords: Forecasting crude oil prices‟ volatility; Performance evaluation; Slacks-based
measure (SBM); Data envelopment analysis (DEA); Super efficiency
1. Introduction
Xu and Ouenniche (2011, 2012a, 2012b) highlighted a common issue faced by the forecasting
community; namely, the fact that the current methodology for assessing the relative
performance of competing forecasting models is unidimensional in nature; that is, models are
compared to each other using a single criterion at a time. To be more specific, although most
forecasting studies use several criteria to assess the performance of competing forecasting
models, the assessment exercise of these models typically consists of ranking them based on a
specific measure of a specific criterion, which could lead to as many different rankings as
performance measures a study would include (e.g., Sadorsky, 2005; 2006; Coppola, 2008;
Agnolucci, 2009; Murat and Tokat, 2009). As a consequence, conflicting results about the
performance of specific forecasting models are often reported in that some models perform
better than others with respect to a specific criterion, but worse with respect to other criteria;
thus, leading to a situation where one cannot make an informed decision as to which model
performs best overall when taking all criteria into account. In order to overcome this
methodological issue, Xu and Ouenniche (2011) proposed a multidimensional framework for
assessing the relative performance of competing forecasting models of the level of a
continuous variable (i.e., oil price); namely, context-dependent data envelopment analysis
(CDEA), which is based on the CDEA model of Seiford and Zhu (2003). In 2012, they
Performance Evaluation of Forecasting Models: At Last, Problem Solved!
75
proposed an alternative framework based on multicriteria decision analysis methods (Xu and
Ouenniche, 2012a). On the other hand, Xu and Ouenniche (2012b) proposed a super-
efficiency DEA framework for assessing the relative performance of competing forecasting
models of the volatility of a continuous variable (i.e., oil price), which is based on the super
efficiency model of Andersen and Peterson (1993). In sum, these multicriteria frameworks
allow one to obtain a single ranking that takes account of several performance criteria. In
another research paper (Ouenniche, Xu and Tone, 2013), we propose an alternative
framework to the one proposed by Xu and Ouenniche (2012b) which overcomes the
following issues. First, under the variable returns-to-scale (VRS) assumption, input-oriented
super-efficiency scores can be different from output-oriented super-efficiency scores, which
would lead to different rankings. Second, in many applications such as ours, the choice of an
orientation in DEA is rather superfluous. Third, radial super-efficiency DEA models may be
infeasible for some efficient decision making units; therefore, ties would persist in the
rankings. Fourth, radial super-efficiency DEA only takes account of technical efficiency. In
sum, we propose an orientation-free super-efficiency DEA framework; namely, a slacks-
based super-efficiency DEA framework for assessing the relative performance of competing
volatility forecasting models.
The remainder of this paper is organized as follows. First, we describe the application context
of the proposed multidimensional framework for assessing the relative performance of
competing forecasting models; that is, crude oil prices‟ volatility. Second, we briefly review
the basic concepts of DEA and propose an improved DEA framework to evaluate the relative
performance of competing forecasting models for crude oil prices volatility. Third, we present
and discuss our empirical results. Finally, we summarize our conclusions.
References
Agnolucci, P. (2009). Volatility in crude oil futures: a comparison of the predictive ability of
GARCH and implied volatility models. Energy Economics, 31, 316–321.
Andersen, P., & Petersen N.C., (1993). A procedure for ranking efficient units in data
envelopment analysis. Management Science, 39, 1261–1294.
Coppola, A. (2008). Forecasting oil price movements: exploiting the information in the
futures market. Journal of Futures Markets, 28, 34–56.
Murat, A., & Tokat, E. (2009). Forecasting oil price movements with crack spread futures.
Energy Economics, 31, 85-90.
Ouenniche, J., Xu, B., & Tone, K., (2013). Relative performance evaluation of competing
crude oil volatility forecasting models: A Slacks-Based Super-Efficiency DEA Model
(submitted for publication).
Sadorsky, P., (2005). Stochastic volatility forecasting and risk management. Applied
Financial Economics, 15, 121–135.

J. Ouenniche / YOR18 Keynote Papers and Extended Abstracts, pp.74-76 (2013)
76
Sadorsky, P., (2006). Modelling and forecasting petroleum futures volatility. Energy
Economics, 28, 467–488.
Seiford, L.M., & Zhu, J. (2003). Context-dependent data envelopment analysis: measuring
attractiveness and progress. Omega, 31, 397-480.
Xu, B., & Ouenniche, J. (2011). A Multidimensional Framework for Performance Evaluation
of Forecasting Models: Context-Dependent DEA. Applied Financial Economics, 21,
1873-1890.
Xu, B., & Ouenniche, J. (2012a). Performance Evaluation of Competing Forecasting Models
– A Multidimensional Framework based on Multi-Criteria Decision Analysis. Expert
Systems with Applications, 39, 8312-8324.
Xu, B., & Ouenniche, J. (2012b). A Data Envelopment Analysis-based Framework for The
Relative Performance Evaluation of Competing Crude Oil Prices‟ Volatility Forecasting
Models. Energy Economics, 34, 576-583.

YOR18 Biennial Conference - Keynote Papers and Extended Abstracts, pp.77-80
University of Exeter, 9-11 April 2013
Soft Methods
77
Productive Dialogue is the Answer, Now What is the Question?
Ashley L. Carreras
Decision Consulting Ltd., Leicester, UK
Abstract
In recent years several researchers have assessed the state of development of the soft OR field
and identified challenges and opportunities for moving the field forward (e.g. Ackermann,
2012; Franco & Montibeller, 2010; Howick & Ackermann, 2011; Paucar-Caceres, 2010;
Rosenhead, 2006). These recent reviews of the field signal a significant departure from the
early efforts by the soft OR pioneers to get their methods understood and accepted as
legitimate fields of enquiry within the OR community and across the wider academic
community of which they are a part. Indeed, long forgotten are the heated debates between the
OR „hardies‟ and OR „softies‟ that appeared in the Viewpoints section of the Journal of the
Operational Research Society back in the 1980s. Today soft OR is as a legitimate part of
mainstream OR (Mingers & Rosenhead, 2004), at least on this side of the Atlantic (Mingers,
2011), and thus current debates among soft OR scholars are more about the best ways for
practitioners to learn and apply soft OR skills (e.g. Ackermann, 2011; Carreras & Kaur,
2011). These are important discussions that I suspect will continue for the foreseeable future.
From a practitioner‟s perspective being part of the debate is important, but it can also serve as
a distraction. This paper will concern itself with particular developments within a few soft OR
approaches, collectively known as Problem Structuring Methods (PSMs), and show how these
recent developments advances our understanding of how these methods are used in practice
(e.g. workshops), and with what effects. This can help OR analysts to gain a better
appreciation of the potential of PSMs to support their work, and how to „sell‟ PSMs to their
clients.
1. Framework of analysis & method
Currently a number of soft OR scholars are examining the structures of group conversations
and how they pertain to the progression of interventions where PSMs are applied (e.g. Franco
& Rouwette, 2011; Papadopoulos & Franco, 2012; Tavella, 2012). This work has highlighted
concepts that I contend serve a useful function in understanding why PSMs can offer
successful approaches for organizational change and importantly, from a consultants
perspective, why clients agree to an intervention where the consultant proposes the use of
PSMs. The concept that will serve as the lens through which we view the empirical cases I
will be discussing is that of a “productive dialogue” (Tsoukas, 2009). I will begin by
discussing the relevance of this term, the way in which it is understood in the context of PSM
application, and the reasons why I think it is central to understanding not only what goes on in
a PSM intervention, but also where and when a PSM has been chosen by clients as a
technique that they see of value. It also has the added bonus of putting into focus the manner
in which facilitators provide feedback to each other after an intervention and adjust their
technique for future interventions.

A. L. Carreras / YOR18 Keynote Papers and Extended Abstracts, pp.77-80 (2013)
78
Tsoukas (2009) provides a concise illustration of the series of interactions that might be
construed as the foundation of productive dialogue. Productive dialogue enables individuals
to take „distance from‟ their usual or „customary and unreflective‟ ways of acting as a
practitioner, that is, they achieve „self-distanciation‟. This in turn is dependent upon a
„relational‟ engagement between those engaged in a conversation. Relational engagement
encourages proactive behaviour in terms of taking responsibility for one‟s own tasks and the
tasks that one will jointly engage in with others. It may also act as means by which one is able
to improve one‟s own understanding of one‟s own current activities and from a consultant, or
researcher‟s perspective, develop a deeper understanding of, or new insights about, the
techniques and methods that they use in their respective practice.
This concept of productive dialogue has been extended and incorporated within micro level
explanations of PSM interventions (Franco, 2006, 2012). Where, for example, an
understanding of how the visual models that are an integral part of PSMs affect knowledge
development within a group, can assist the facilitator in explaining the progress that is made
at various stages of a PSM intervention. This can also be extended to an understanding of
models as boundary objects that enable the development (within a group) of: A shared
language (transfer), shared meanings (translation) and common interests (transformation).
These in turn help in the creation of new knowledge and overcome of some of the syntactic,
semantic and pragmatic barriers often encountered in group decision making. Productive
dialogue is also a fruitful way of interpreting the structures of conversations and public
statements that can lead to the agreement of collective actions (Carreras, 2012).
2. Discussion and conclusions
Whilst research at the micro level has been mainly in the realm of causal mapping workshops,
relational engagement is a key feature in the application of all of the PSM interventions in
which I have been involved including: Soft Systems Methods, Strategic Options Development
an Analysis, Strategic Choice Analysis, Decision Conferencing and Robustness Analysis. I do
not have direct experience of utilizing Drama Theory nor Viable Systems Models. Based
upon a reflection of more than 30 separate interventions I will argue that attention to the
nature of the dialogue between all of the actors involved in the intervention (Client,
Facilitator, participants and other stakeholders) will add significantly to the value of the
intervention.
One further aspect that will be discussed is the development of the agreement between client
and consultant. As is the case with all consultancy one is aware that the process of
consultancy begins the moment that one meets the client, prior to any agreement about
working together, memorandum of understanding or contract is signed. The consultant and
potential client engage in a dialogue from the moment they meet, and it is my experience that
attention to the common patterns of dialogue that one encounters is important in moving the
potential client to actual client. This in itself should not be viewed as some sort of insincere
attempt to ingratiate oneself to the client and persuade them to employ a process that is not to
their overall benefit. Being sensitive to the nature of the dialogue between client and
Productive Dialogue is the Answer, Now What is the Question?
79
practitioner, being aware of the way in which a relational engagement serves the interests of
both parties is something that I believe improves the chances of each recognizing that a
working together will be of mutual benefit.
References
Ackermann, F. (2011). „Getting messy‟ with problems: The Challenges of Teaching „Soft‟
OR. INFORMS Transactions on Education, 12(1).
Ackermann, F. (2012). Problem structuring methods „in the Dock‟: Arguing the case for Soft
OR. European Journal of Operational Research, 219(3), 652-658.
Carreras, A. L. (2012). Mapping Collective Intentions, 25th EURO Conference). Vilnius, 8th-
11th July
Carreras, A. L., & Kaur, P. (2011). Teaching Problem Structuring Methods: Improving
understanding through meaningful learning. INFORMS Transactions on Education,
12(1), 20-30.
Franco, L. A. (2006). Forms of Conversation and Problem Structuring Methods: a conceptual
development. Journal of the Operational Research Society, 57(7), 813-821.
Franco, L. A. (2012). On the roles, uses, and effects of models in Soft OR workshops, 25th
EURO Conference). Vilnius, 8th-11th July.
Franco, L. A., & Montibeller, G. (2010). Facilitated Modelling in Operational Research
(Invited Review). European Journal of Operational Research, 205(3), 489-500.
Franco, L. A., & Rouwette, E. A. J. A. (2011). Decision Development in Facilitated
Modelling Workshops European Journal of Operational Research, 212(1), 164-178.
Howick, S., & Ackermann, F. (2011). Mixing OR methods in practice: Past, present and
future directions. European Journal of Operational Research, 215(3), 503-511.
Mingers, J. (2011). Soft OR comes of age -But not everywhere! OMEGA: The International
Journal of Management Science, 39(6), 729-741.
Mingers, J., & Rosenhead, J. (2004). Problem Structuring Methods in Action. European
Journal of Operational Research, 152(3), 530-554.
Papadopoulos, T., & Franco, L. A. (2012). The emergence of agreements within facilitated
modelling workshops, Paper presented at the 25th EURO Conference). Vilnius, 8th-
11th July.
Paucar-Caceres, A. (2010). Mapping the changes in management science: A review of`soft'
OR/MS articles published in Omega (1973-2008). OMEGA: The International Journal
of Management Science, 38(1-2), 46-56.

A. L. Carreras / YOR18 Keynote Papers and Extended Abstracts, pp.77-80 (2013)
80
Rosenhead, J. (2006). The Past, Present and Future of Problem Structuring Methods. Journal
of the Operational Research Society.
Tavella, E. (2012). Exploring Dialogue in Problem Structuring Workshops, Paper presented at
the 25th EURO Conference). Vilnius, 8th-11th July.
Tsoukas, H. (2009). A Dialogical Approach to the Creation of New Knowledge in
Organizations. Organization Science, 20(6), 941-957.
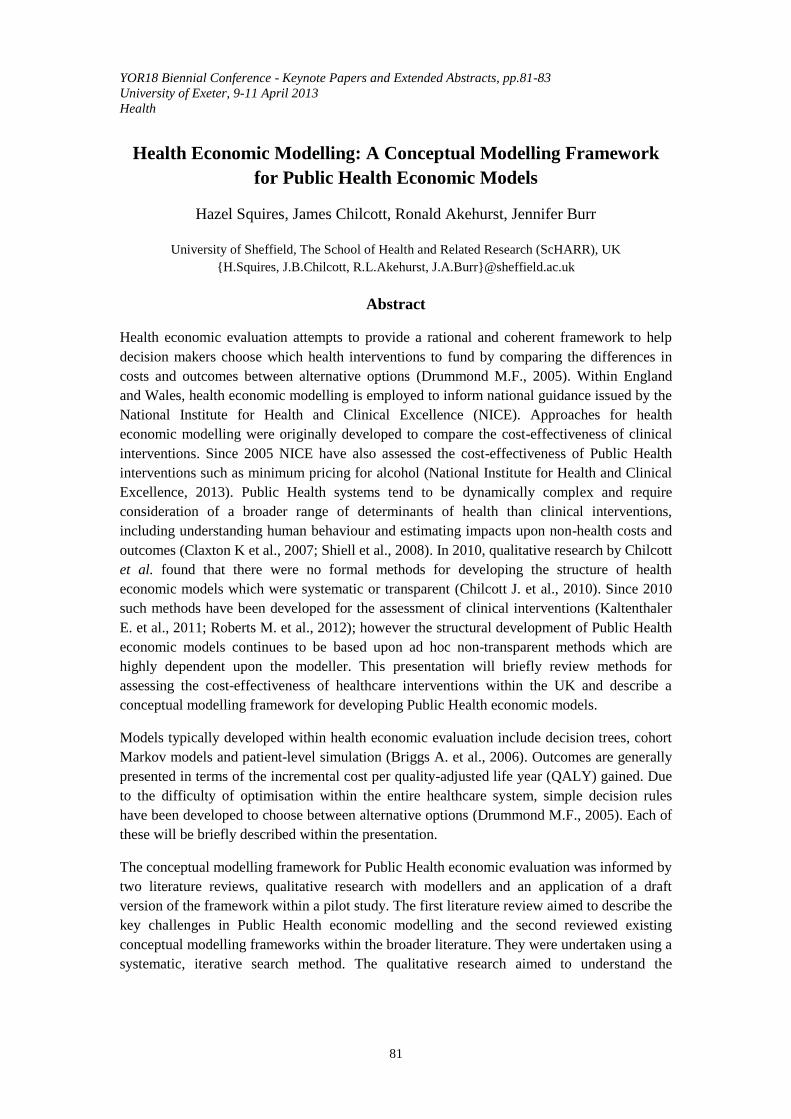
YOR18 Biennial Conference - Keynote Papers and Extended Abstracts, pp.81-83
University of Exeter, 9-11 April 2013
Health
81
Health Economic Modelling: A Conceptual Modelling Framework
for Public Health Economic Models
Hazel Squires, James Chilcott, Ronald Akehurst, Jennifer Burr
University of Sheffield, The School of Health and Related Research (ScHARR), UK
{H.Squires, J.B.Chilcott, R.L.Akehurst, J.A.Burr}@sheffield.ac.uk
Abstract
Health economic evaluation attempts to provide a rational and coherent framework to help
decision makers choose which health interventions to fund by comparing the differences in
costs and outcomes between alternative options (Drummond M.F., 2005). Within England
and Wales, health economic modelling is employed to inform national guidance issued by the
National Institute for Health and Clinical Excellence (NICE). Approaches for health
economic modelling were originally developed to compare the cost-effectiveness of clinical
interventions. Since 2005 NICE have also assessed the cost-effectiveness of Public Health
interventions such as minimum pricing for alcohol (National Institute for Health and Clinical
Excellence, 2013). Public Health systems tend to be dynamically complex and require
consideration of a broader range of determinants of health than clinical interventions,
including understanding human behaviour and estimating impacts upon non-health costs and
outcomes (Claxton K et al., 2007; Shiell et al., 2008). In 2010, qualitative research by Chilcott
et al. found that there were no formal methods for developing the structure of health
economic models which were systematic or transparent (Chilcott J. et al., 2010). Since 2010
such methods have been developed for the assessment of clinical interventions (Kaltenthaler
E. et al., 2011; Roberts M. et al., 2012); however the structural development of Public Health
economic models continues to be based upon ad hoc non-transparent methods which are
highly dependent upon the modeller. This presentation will briefly review methods for
assessing the cost-effectiveness of healthcare interventions within the UK and describe a
conceptual modelling framework for developing Public Health economic models.
Models typically developed within health economic evaluation include decision trees, cohort
Markov models and patient-level simulation (Briggs A. et al., 2006). Outcomes are generally
presented in terms of the incremental cost per quality-adjusted life year (QALY) gained. Due
to the difficulty of optimisation within the entire healthcare system, simple decision rules
have been developed to choose between alternative options (Drummond M.F., 2005). Each of
these will be briefly described within the presentation.
The conceptual modelling framework for Public Health economic evaluation was informed by
two literature reviews, qualitative research with modellers and an application of a draft
version of the framework within a pilot study. The first literature review aimed to describe the
key challenges in Public Health economic modelling and the second reviewed existing
conceptual modelling frameworks within the broader literature. They were undertaken using a
systematic, iterative search method. The qualitative research aimed to understand the
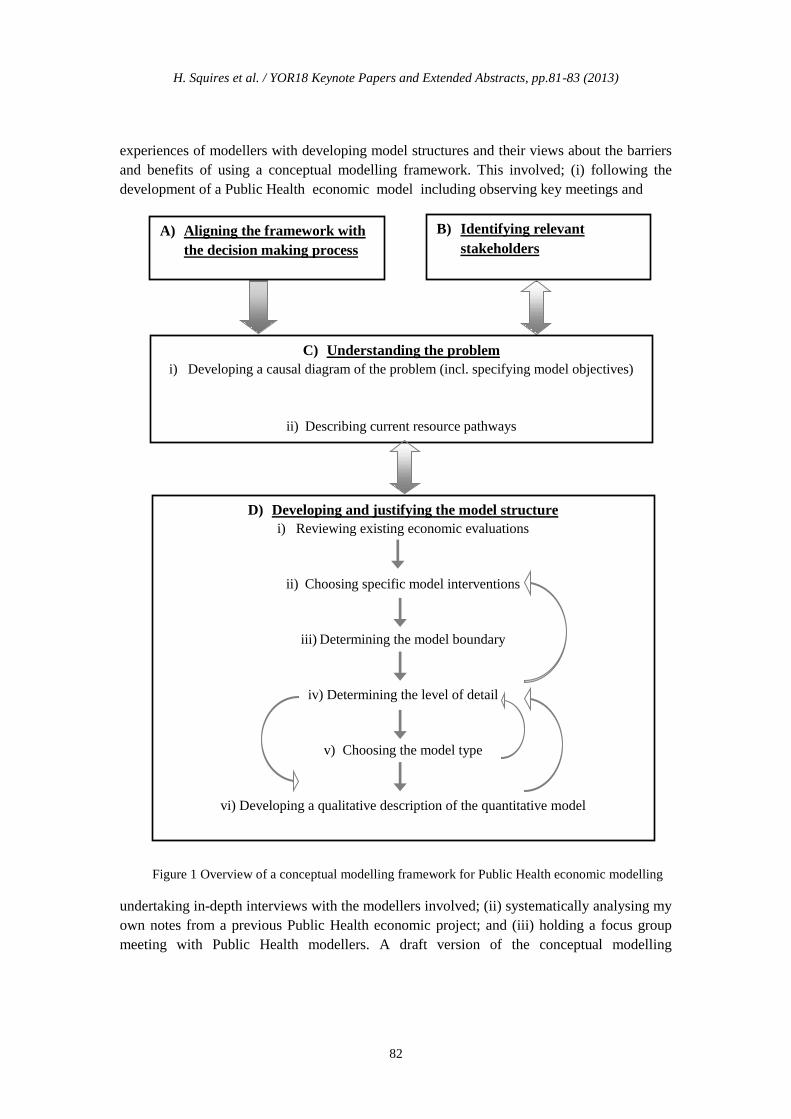
H. Squires et al. / YOR18 Keynote Papers and Extended Abstracts, pp.81-83 (2013)
82
experiences of modellers with developing model structures and their views about the barriers
and benefits of using a conceptual modelling framework. This involved; (i) following the
development of a Public Health economic model including observing key meetings and
Figure 1 Overview of a conceptual modelling framework for Public Health economic modelling
undertaking in-depth interviews with the modellers involved; (ii) systematically analysing my
own notes from a previous Public Health economic project; and (iii) holding a focus group
meeting with Public Health modellers. A draft version of the conceptual modelling
A) Aligning the framework with
the decision making process
B) Identifying relevant
stakeholders
C) Understanding the problem
i) Developing a causal diagram of the problem (incl. specifying model objectives)
ii) Describing current resource pathways
D) Developing and justifying the model structure
i) Reviewing existing economic evaluations
ii) Choosing specific model interventions
iii) Determining the model boundary
iv) Determining the level of detail
v) Choosing the model type
vi) Developing a qualitative description of the quantitative model

Health Economic Modelling: A Conceptual Modelling Framework for Public Health Economic Models
83
framework was piloted within a project assessing the cost-effectiveness of interventions for
diabetes screening and prevention in order to develop it further.
Three key principles for the conceptual modelling framework were identified; (1) that a
systems approach to Public Health modelling is most appropriate (i.e. the system should be
understand as a whole taking into account feedback loops and unintended consequences); (2)
that communication with stakeholders and members of the team throughout model
development is important; and (3) that specifying the modelling objectives and developing a
thorough documented understanding of the problem is valuable prior to developing and
justifying the model structure.
An overview of the conceptual modelling framework is shown in Figure 1. Methods for
undertaking each of the stages shown within Figure 1 are described within the conceptual
modelling framework and non-prescriptive suggestions around the processes modellers might
follow are proposed. These will be described within the presentation.
This conceptual modelling framework should help to improve the scope, quality and
communication of Public Health economic models in order to help decision makers make
appropriate policy decisions.
References
Briggs A., Claxton K. and Sculpher M. (2006) Decision Modelling for Health Economic
Evaluation, New York: Oxford University Press.
Chilcott J., Tappenden P., Rawdin A., Johnson M., Kaltenthaler E., Paisley S., Papaioannou
D. and Shippam A. (2010) Avoiding and identifying errors in health technology
assessment models.
Claxton K, Sculpher M and Culyer A. (2007) Mark versus Luke? Appropriate methods for the
Evaluation of Public Health Interventions. Working papers from Centre for Health
Economics, University of York.
Drummond M.F. (2005) Methods for the Economic Evaluation of Healthcare Programmes,
Oxford: Oxford University Press.
Kaltenthaler E., Tappenden P., Paisley S. and Squires H. (2011) Identifying and reviewing
evidence to inform the conceptualisation and population of cost-effectiveness models,
No. 14.
National Institute for Health and Clinical Excellence. Public Health Guidance (2013).
Roberts M., Russell L., Paltiel D., Chambers M., McEwan P. and Krahn M. (2012)
Conceptual Modeling: A Report of the ISPOR-SMDM Modeling Good Research
Practices Task Force - 2. Medical Decision Making 32:678-689.
Shiell, A., Hawe, P. and Gold, L. (2008) Complex interventions or complex systems?
Implications for health economic evaluation. BMJ 336:1281-1283.

YOR18 Biennial Conference - Keynote Papers and Extended Abstracts, pp.84-88
University of Exeter, 9-11 April 2013
Analytics
84
Data Science 2.0 – Guided and In-line Analytics
Why being a Data Scientist is Sexy in the era of Big Data
Michael O‟Connell, John James
TIBCO Software Corp, Paolo Alto, CA, USA
[email protected], [email protected]
Abstract
This paper looks at how data scientists are of increasing importance in the era of Big Data and
how they and other business users can be organized into a productive unit that address the
differing requirements of data analysis across a business, drawing particularly on our
experiences in financial services organizations. This is described by the author as “Data
Science 2.0”. Further, the author looks at a best-practice approach to data analytics and a
common pitfall that may expose organizations to substantive risk.
Keywords: Big Data, Data scientist, Predictive analytics
1. Introduction
In virtually all profit-making industries, IT initiatives and business projects are justified by
improving productivity, reducing risk and/or growing revenues. Excluding the latter, we
could extend these criteria to the non-for-profit sector as well. The various functional areas of
these organizations rely on “big data” analytics – trading and managing portfolios, creating
value across customer/ citizen relationships, detecting and preventing fraud and managing
risk across the organization.
2. Data scientists and vertical markets
Data Science is the practice of deriving insights from data to solve business problems. The
current market wave is tied to the new world of big data, and Data Scientist is now touted as
the sexiest job of the 21st century in the Harvard Business Review (Davenport and Patil,
2012). McKinsey has noted a 50-60% supply-demand gap for data scientists, with a shortage
of more than 150,000 data scientists and 1.5 million managers with big data analytics
understanding over the next 5 years (McKinsey, 2011).
The value of data science is undeniable, with core applications driving a wide array of
governmental, business and customer intelligence programs including:
- acquiring and growing customers (cross-sell / up-sell)
- attrition modelling (with intervention!)
- trigger-based marketing (including mobile and location based offers)
- sales lift analysis (test and learn)
- dynamic segmentation (treating different segments differently!)

Data Science 2.0 – Guided and In-line Analytics…
85
- pricing analytics (including loyalty and lifetime value)
- sentiment and attribution analysis (staff performance and advertising/campaign
effectiveness)
- fraud and risk analytics (operational execution and enterprise analysis)
In addition, specialized data science programs drive industry vertical solutions, with industry-
specific data sources that are expanding and evolving e.g. to incorporate social networks and
real-time data. In the Financial Services market, this plays out across all of the core functional
areas including:
- capital markets (trading, portfolio)
- retail (market and customer insight)
- risk management (enterprise, credit and counterparty, market)
- fraud and compliance (AML, credit card, trading)
While for the oil and gas sector we would see a very different set, such as:
- production optimization (and calculation of ultimate reserves in fields)
- maintenance of the integrity of key assets (such as rigs and pipelines)
- optimizing the location and operation of drilling operations (including geospatial,
geological and geochemical data)
While there would be a cross-over in the area of energy trading, on the whole these two
industries require the mastering of very different data sets and statistical techniques. It is
evident that “vertical” is a key driver of differentiation here, and this can be extended equally
well to virtually all commercial and non-commercial activities.
3. A common pitfall
With the current excitement around big data and data science there are some solutions getting
attention that are dangerous e.g. promoting isolated, end-user, database analyses with all the
attendant problems such as chasing noise, throwing out data that don‟t match pre-conceptions,
confusing leading and lagging indicators, interpreting correlations as causation e.g. as
described by Silver (2012). Some new companies are even making bold claims that they
invented visual analytics, that data scientists will be dead in 18 months; or that we don‟t need
data scientists, just easier access to big data. This type of thinking introduces substantive risk
– not only of heading in entirely the wrong direction, but with significant negative
ramifications, like bringing down businesses, operations or financial systems! The end-user
community can be readily enabled with self-service analytics (as outlined below), but there
needs to be inbuilt guidance, and a framework of end-user data discovery, collaboration and
enterprise readiness that promotes rigorous and real analysis on the business!

M. O‟Connell, J. James / YOR18 Keynote Papers and Extended Abstracts, pp.84-88 (2013)
86
4. From Data Science 1.0 to Data Science 2.0
I outlined the basic Data Science 1.0 process in a 2012 Forbes article, “What is a Data
Scientist” (Woods, 2012), and in notes to the European Banking Forum (O‟Connell, 2012a)
and WSTA communities (O‟Connell, 2012b). With recent technology innovations (TIBCO,
2012; The Forrester Wave, 2013), we have now jumped beyond this to what I believe to be a
new Data Science 2.0 state. The expanded workflow in this new state includes:
- identifying the high-value business problems and developing value theses with
demonstrable ROI
- assembling the appropriate data mashups to address the problems
- ordering the data aggregations and filters – in-database and in-memory
- exploring the data (EDA) – visually and interactively
- constructing and validating the features that inform the problem – leading and lagging
indicators
- deploying the feature sets and exploratory data analyses as self-service, guided,
collaborative analyses across all relevant functional areas in the enterprise – with
elastic architectures to efficiently meet demand
- building and evaluating models that describe and/or predict the measured response
- deploying the champion model in the real-time event system driving the business
solution across the customer and market space
- building and evaluating new features, dashboards and challenger models for
evolution of the guided analyses and in-line event analysis systems
This workflow is illustrated in Figure 1 for a typical business insight use case in financial
services.
In the Financial Services market, our businesses are evolving rapidly and we are working hard
to be nimble and intelligent with our information solutions. This combination of interactive,
visual, descriptive and predictive analytics; with self-service guided and collaborative
workflows for the masses, and in-line deployment in real-time event systems, is the future.
This is Data Science 2.0.
Data Science 2.0 – Guided and In-line Analytics…
87
Figure 1 Data Science 2.0 workflow for a typical business insight use case in financial services.
References
Davenport, T. and Patil, D.J. (2012). Data Scientist: The Sexiest Job of the 21st Century,
http://hbr.org/2012/10/data-scientist-the-sexiest-job-of-the-21st-century/ar/1.
McKinsey Global Institute (2011). Big Data: The next frontier for innovation, competition
and
productivity.http://www.mckinsey.com/insights/mgi/research/technology_and_innovati
on/big_data_the_next_frontier_for_innovation
Silver, N. (2012). The Signal and the Noise: The Art and Science of Prediction. Penguin
Press: chapter 6 and throughout
Woods, D. (2012). What is a Data Scientist?
http://www.forbes.com/sites/danwoods/2012/01/25/what-is-a-data-scientist-michael-
oconnell-of-tibco-spotfire/
O‟Connell, M. (2012). Big Data Analytics. European Banking Forum
http://www.spgmediadesign.com/arena/ebf/newsletters/2012campaign/2012-
10/tibco.html

M. O‟Connell, J. James / YOR18 Keynote Papers and Extended Abstracts, pp.84-88 (2013)
88
O‟Connell, M. (2012). Big Data Analytics: Scaling Up and Out in the Event-Enabled
Enterprise. Wall Street Technology Association, Ticker 2012, Issue 3.
TIBCO Spotfire (2012). Spotfire 5. http://spotfire.tibco.com/en/spotfire-5.aspx
The Forrester WaveTM
(2013). Big Data Predictive Analytics Solutions, Q1,
http://www.forrester.com/The+Forrester+Wave+Big+Data+Predictive+Analytics+Solut
ions+Q1+2013/fulltext/-/E-RES85601
YOR18 Biennial Conference - Keynote Papers and Extended Abstracts, pp.89-90
University of Exeter, 9-11 April 2013
Simulation
89
What can Simulation Model Developers Learn
from Software Developers?
Steven Jones
Lanner Group, Henley-In-Arden, Warwickshire, UK
Abstract
Simulation model development practices and methodologies vary widely but many share
similarities with general software development. This paper discusses the key similarities and
differences between simulation model and general software development methodologies,
focussing on what simulation model developers can learn from other areas. The advantages
and disadvantages of re-use of these methods are discussed. Examples are given of the steps
in each process as applied to simulation models.
Computerised discrete-event simulation has been around nearly as long as computers and
software have existed. In some ways computerised simulation model development is a subset
of general software development. Software development has in total, across the world, more
investment and more resources than simulation specifically and so has developed more
practice guidelines and methodologies. Simulationists can leverage these techniques where
they apply, and yet many do not. If these cross-over techniques are used to generate more
efficient simulation projects of a higher quality then they can vastly improve the positive
impact of simulation.
So what techniques from software development could improve our simulation projects? Here
are some examples of techniques from the world of software development that we will
explore with the use of a simulation project example:
Development lifecycle methodologies
Development lifecycles such as the V-model, the Waterfall model, the spiral model,
Agile and XP (eXtreme programming), object oriented
Coding practices
Best practice coding from using an agreed naming convention, code commenting
rules, exploring the goal of each section of code and using checked and unchecked
assertions
Verification and Validation methods
Code metrics such as code coverage during testing, black box testing, decision table
and all-pairs testing,

S. Jones / YOR18 Keynote Papers and Extended Abstracts, pp.89-90 (2013)
90
Industry standards
Process modelling standards such BPMN (Business Process Modelling Notation), and
simulation standards such as BPSim
Supporting disciplines
Configuration management (including software to keep control of files),
documentation, Project management, User interface design
YOR18 Biennial Conference - Keynote Papers and Extended Abstracts, pp.91-96
University of Exeter, 9-11 April 2013
Disaster Management
91
New OR Perspectives for Disaster Management
in Developing Countries
Priyanka Roy, Oscar Rodríguez-Espíndola, Pavel Albores-Barajas,
Christopher Brewster
Aston University, Operations and Information Management Research Group, Birmingham, UK
{Royp1, Rodrigoe, P.Albores, C.A.Brewster}@aston.ac.uk
Abstract
Recently, natural disasters have become a common phenomenon affecting several countries
world-wide. But developing countries are the most affected by natural disasters due to the
amount of vulnerable people and the scarcity of resources to protect them. To identify the
logistical challenges faced by authorities in developing countries, the authors performed an
analysis of the Thailand flood (2011), Haiti earthquake (2010), Chile earthquake (2010),
Pakistan flood (2010) and Mexico flood (2007). After analysing reports from the 5 large-scale
disasters, the authors highlighted the main logistical issues presented, showing that the
advances in research are probably not providing suitable mechanisms for developing
countries.
There is a gap between authorities and academics within this field, and the authors believe that
a multi-method approach can draw interest from the authorities to the developments on the
area. The idea is to combine two or more tools sequentially to provide less complex tools with
more comprehensive potential, taking advantage of the features of the different methods.
Therefore, this paper will stress the importance of an effective logistical management process
to cope with disaster within developing countries, along with a multi-method approach for the
development of decision support systems to improve disaster management within developing
countries.
Keywords: Preparedness; Response; Developing countries; Disaster management
1. Introduction
Management of disasters is crucial to protect and provide as quickly and efficiently as
possible for the people affected by any kind of disaster. Experiences over time enhance the
efforts to improve the activities currently performed because "over the last thirty years,
mankind has been facing disasters on an unprecedented scale: an annual average of over ¼
million people worldwide have been affected by natural disasters, with an absolute magnitude
ranging between 68 million, and more than 620 million inhabitants” (Gheorghe SĂ, 2011).
2. Emergency logistics
The relevance of disaster management forces to continuous improvement of all the operations
performed by either governmental or non-governmental authorities. Emergency logistics is a
very useful stream of research to accomplish that because of its high relationship with

P. Roy et al. / YOR18 Keynote Papers and Extended Abstracts, pp.91-96 (2013)
92
operational research (Caunhye et al., 2012). Emergency logistics is defined as "a process of
planning, managing and controlling the efficient flows of relief, information, and services
from the points of origin to the points of destination to meet the urgent needs of the affected
people under emergency conditions” (Sheu, 2007a). Before, during and after a disaster (slow
or rapid onset disaster) the necessity is to secure and move the require materials (food, water,
medicine, shelter etc.) from one point to the other point in the most efficient and effective
way.
3. Disaster phases
Due to the complexity of emergency management, Drabek and Hoetmer (1991) provided four
phases for comprehensive emergency management which “overlap in practice but have
specific individual goals” (Drabek and Hoetmer, 1991). The phases are:
- Mitigation. Activities performed to avoid or reduce the disaster occurrence risk.
- Preparedness. Efforts to lessen the impact of disasters
- Response. Activities aiming to rescue, avoid property damage, satisfy the immediate
needs for survival goods of the affected people, among others.
- Recovery. Efforts oriented to return to the normal conditions of the community.
The phases actually create a cycle repeating itself to relieve the impact of disaster, as it can be
seen on Figure 1.
Figure 1 Disaster phases
During disaster the most challenging effort is to rescue the affected people, take them to safe
places and provide them with resources. Therefore designing an emergency plan, conducting
training to the volunteers, on-going evacuation of vulnerable population, shelter planning,
Mitigation
Preparedness
Response
Recovery

New OR Perspectives for Disaster Management in Developing Countries
93
organisational exercise, pre-positioning of relief materials, relief delivery, setup of a
temporary distribution centre, among others, are essential activities to cope with large-scale
disasters. Preparedness and response are the phases where the above activities are pursued.
These phases engage with unpredictability, quickness of events, short decision and action
times, unavailability of resources, uncertainty about the situation and high pressure.
Also it is important to notice that every emergency is unique and hence preparedness and
response plans need to be customised according to the situation/emergency. Different kind of
emergency operations need different preparedness and response plans.
Therefore it is essential to use operational research techniques for a well organised decision
support system which helps the decision makers to act quickly and efficiently during the
preparedness and response.
4. Disaster management in developing countries: 5 cases
The role of emergency logistics is to try to help people affected by disasters by providing the
decision makers with tools suitable to improve operations, and this trend of research has been
increasing in recent years as a result of several disasters occurred worldwide, whether on
developed or in developing countries. Although the difference lies on the amount of resources
available and the quantity of vulnerable people, thus sometimes two disasters with similar
characteristics occurring on a developing and a developed country can have significantly
different death tolls, with higher impact on the developing country (Julca, 2012).
“The social and economic cost of natural disasters due to climate is in a process of
continuous expansion throughout the world. The trend is largely attributable to increasing
vulnerability in less developed countries, especially in the poor nations, where the population
remains, in most cases, more vulnerable to extreme climate events that occur later, after the
people experienced a first severe disaster” (Gheorghe SĂ, 2011).
Therefore, for the present paper there will be an analysis of 5 recent large scale disasters in
developing countries and the common issues between them. The cases reviewed were the
Thailand flood (2011), Haiti earthquake (2010), Chile earthquake (2010), Pakistan flood
(2010) and Mexico flood (2007). These cases were selected using EMDAT
(http://www.emdat.be) and the selection criteria included recent events (less than 10 years) in
developing countries (non-first world countries) with high impact on the population (more
than 1,000,000 people affected).
Table1 shows the characteristics of every disaster and the last column shows some briefs
examples of the logistical issues found reading different reports. Looking at the disasters
altogether, problems such as shortages on food, inadequate places used as shelters, issues with
relief distribution and lack of pre-defined distribution facilities are constantly mentioned. The
fact that some of the problems happened in different disasters on different locations is a
calling to try to come up with ways to tackle those problems.
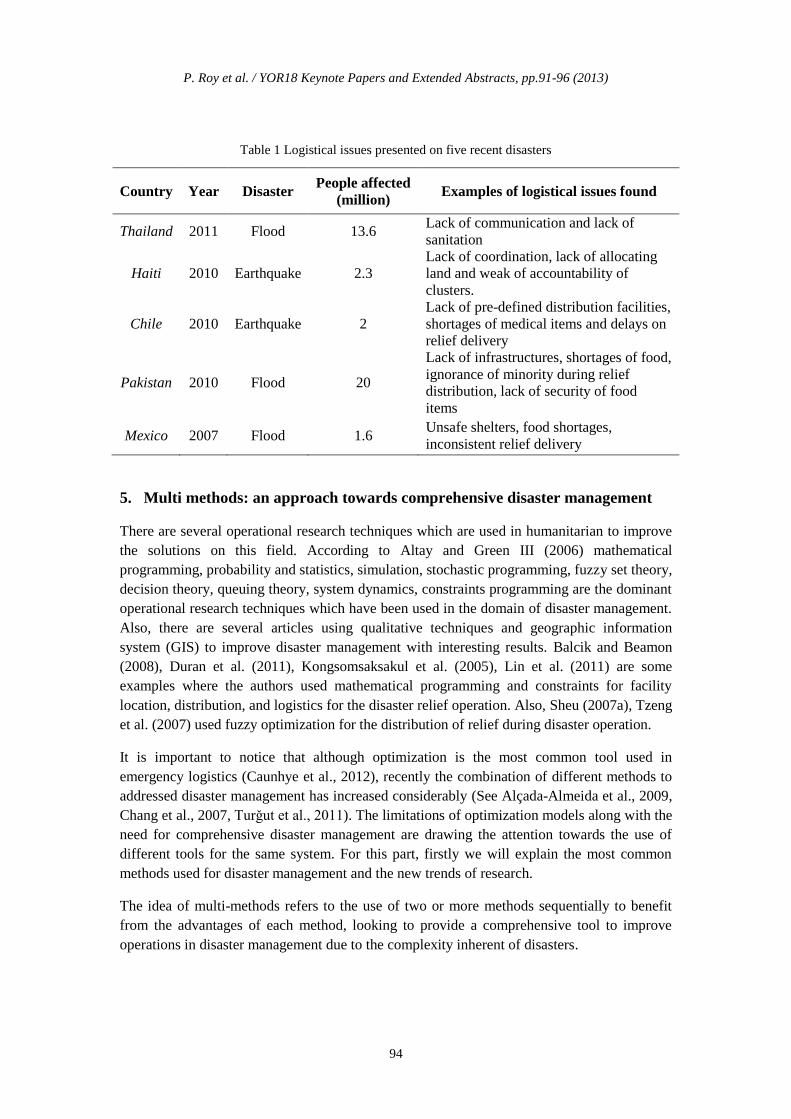
P. Roy et al. / YOR18 Keynote Papers and Extended Abstracts, pp.91-96 (2013)
94
Table 1 Logistical issues presented on five recent disasters
Country Year Disaster People affected
(million) Examples of logistical issues found
Thailand 2011 Flood 13.6 Lack of communication and lack of
sanitation
Haiti 2010 Earthquake 2.3
Lack of coordination, lack of allocating
land and weak of accountability of
clusters.
Chile 2010 Earthquake 2
Lack of pre-defined distribution facilities,
shortages of medical items and delays on
relief delivery
Pakistan 2010 Flood 20
Lack of infrastructures, shortages of food,
ignorance of minority during relief
distribution, lack of security of food
items
Mexico 2007 Flood 1.6 Unsafe shelters, food shortages,
inconsistent relief delivery
5. Multi methods: an approach towards comprehensive disaster management
There are several operational research techniques which are used in humanitarian to improve
the solutions on this field. According to Altay and Green III (2006) mathematical
programming, probability and statistics, simulation, stochastic programming, fuzzy set theory,
decision theory, queuing theory, system dynamics, constraints programming are the dominant
operational research techniques which have been used in the domain of disaster management.
Also, there are several articles using qualitative techniques and geographic information
system (GIS) to improve disaster management with interesting results. Balcik and Beamon
(2008), Duran et al. (2011), Kongsomsaksakul et al. (2005), Lin et al. (2011) are some
examples where the authors used mathematical programming and constraints for facility
location, distribution, and logistics for the disaster relief operation. Also, Sheu (2007a), Tzeng
et al. (2007) used fuzzy optimization for the distribution of relief during disaster operation.
It is important to notice that although optimization is the most common tool used in
emergency logistics (Caunhye et al., 2012), recently the combination of different methods to
addressed disaster management has increased considerably (See Alçada-Almeida et al., 2009,
Chang et al., 2007, Turǧut et al., 2011). The limitations of optimization models along with the
need for comprehensive disaster management are drawing the attention towards the use of
different tools for the same system. For this part, firstly we will explain the most common
methods used for disaster management and the new trends of research.
The idea of multi-methods refers to the use of two or more methods sequentially to benefit
from the advantages of each method, looking to provide a comprehensive tool to improve
operations in disaster management due to the complexity inherent of disasters.
New OR Perspectives for Disaster Management in Developing Countries
95
For this approach, there are several possible combinations and the potential is outstanding
because of the versatility of the tools embedded in operational research. Within disaster
management, the use of GIS with optimization models has been explored successfully
(Alçada-Almeida et al., 2009, Chang et al., 2007), taking advantage of the geographical
potential of the GIS and the decision-making capacity of optimization. Also the use of Fuzzy
Theory with AHP has been used before in the literature (Turgut et al., 2012), delivering a very
interesting tool for facility location in disasters.
From the perspective of the authors, although there are some examples in the literature, a
multi-methods approach can be advantageous to provide solutions applicable for the problems
in the real world, considering more than only one perspective in the analysis. This is
particularly crucial for developing countries, because even though there are great articles in
the literature, a lot of them are too complex because of the difficulties to capture all the
features of any disaster on one tool.
Therefore, the idea is that multi-methods can provide a useful solution for developing
countries because models can be less complex if there is a supplement provided by other tool.
6. Conclusions and future research
Within this paper the importance of research on emergency logistics for developing countries
was highlighted, noticing the unfortunate number of events in these kinds of countries world-
wide and also considering the poor operations performed in five independent events
worldwide. The main logistical issues found are mentioned to provide a framework to
understand that even though a lot of papers in the literature do not distinguish between
developed and developing countries; there are differences that should be addressed to develop
new systems.
There are common logistical issues presented on the cases studied, showing that the current
state of research regarding emergency logistics is not working effectively for developing
countries. Thus, the gap between the activities performed by authorities and the researchers
has to be addressed to be able to provide suitable tools for developing countries.
The multi-methods approach introduced by this paper has been used before, but there is an
opportunity to analyse this approach more deeply to come up with better tools. Advantages
such as simpler models, more interaction with authorities, the combination of expertise on the
field with decision-making tools, tools easier to understand and use, more graphical systems,
among others, are only the beginning, and also some reasons to go further in this trend of
research.
References
Alçada-Almeida, L., Tralhão, L., Santos, L. & Coutinho-Rodrigues, J. (2009). A
Multiobjective Approach to Locate Emergency Shelters and Identify Evacuation Routes
in Urban Areas. Geographical Analysis, 41, 9-29.

P. Roy et al. / YOR18 Keynote Papers and Extended Abstracts, pp.91-96 (2013)
96
Altay, N. & Green Iii, W. G. (2006). OR/MS research in disaster operations management.
European Journal of Operational Research, 175, 475-493.
Balcik, B. & Beamon, B. M. (2008). Facility location in humanitarian relief. International
Journal of Logistics Research and Applications, 11, 101-121.
Caunhye, A. M., Nie, X. & Pokharel, S. (2012). Optimization models in emergency logistics:
A literature review. Socio-Economic Planning Sciences, 46, 4-13.
Chang, M.-S., Tseng, Y.-L. & Chen, J.-W. (2007). A scenario planning approach for the flood
emergency logistics preparation problem under uncertainty. Transportation Research
Part E: Logistics and Transportation Review, 43, 737-754.
Drabek, T. E. & Hoetmer, G. J. (1991). Emergency management: principles and practice for
local government, International City Management Association.
Duran, S., Gutierrez, M. A. & Keskinocak, P. (2011). Pre-Positioning of Emergency Items for
CARE International. Interfaces, 41, 223-237.
Gheorghe Să, V. (2011). The holistic concepts of disaster management and social cohesion -
statistics and method. Scientific Bulletin : Economic Sciences, 3.
Julca, A. (2012). Natural Disasters with Un-natural Effects: Why? Journal of Economic
Issues, 46, 499-510.
Kongsomsaksakul, S., Chen, A. & Yang, C. (2005). Shelter location-allocation model for
flood evacuation planning. Journal of the Eastern Asia Society for Transportation
Studies, 6, 4237 – 4252.
Lin, Y.-H., Batta, R., Rogerson, P. A., Blatt, A. & Flanigan, M. (2011). A logistics model for
emergency supply of critical items in the aftermath of a disaster. Socio-Economic
Planning Sciences, 45, 132-145.
Sheu, J.-B. (2007a). Challenges of emergency logistics management. Transportation Research
Part E: Logistics and Transportation Review, 43, 655-659.
Turǧut, B. T., Taş, G., Herekoǧlu, A., Tozan, H. & Vayvay, O. (2011). A fuzzy AHP based
decision support system for disaster center location selection and a case study for
Istanbul. Disaster Prevention and Management, 20, 499-520.
Tzeng, G.-H., Cheng, H.-J. & Huang, T. D. (2007). Multi-objective optimal planning for
designing relief delivery systems. Transportation Research Part E: Logistics and
Transportation Review, 43, 673-686.


ISBN number = 0 903440 52 0 Copyright © Operational Research Society


