Introduction The primary purpose of TrendWorX32 32-bit data logging is to provide both a data-collection system and a data-retrieval station for historical data to trending and reporting clients. The TrendWorX32 SQL Data Logger:
• Collects real-time data from OPC servers.
• Logs real-time data to a database.
• Provides data-retrieval capability by implementing a draft of the OPC HDA (Historical Data Access) specification.
• Provides data-retrieval services locally and remotely across computer boundaries via DCOM.
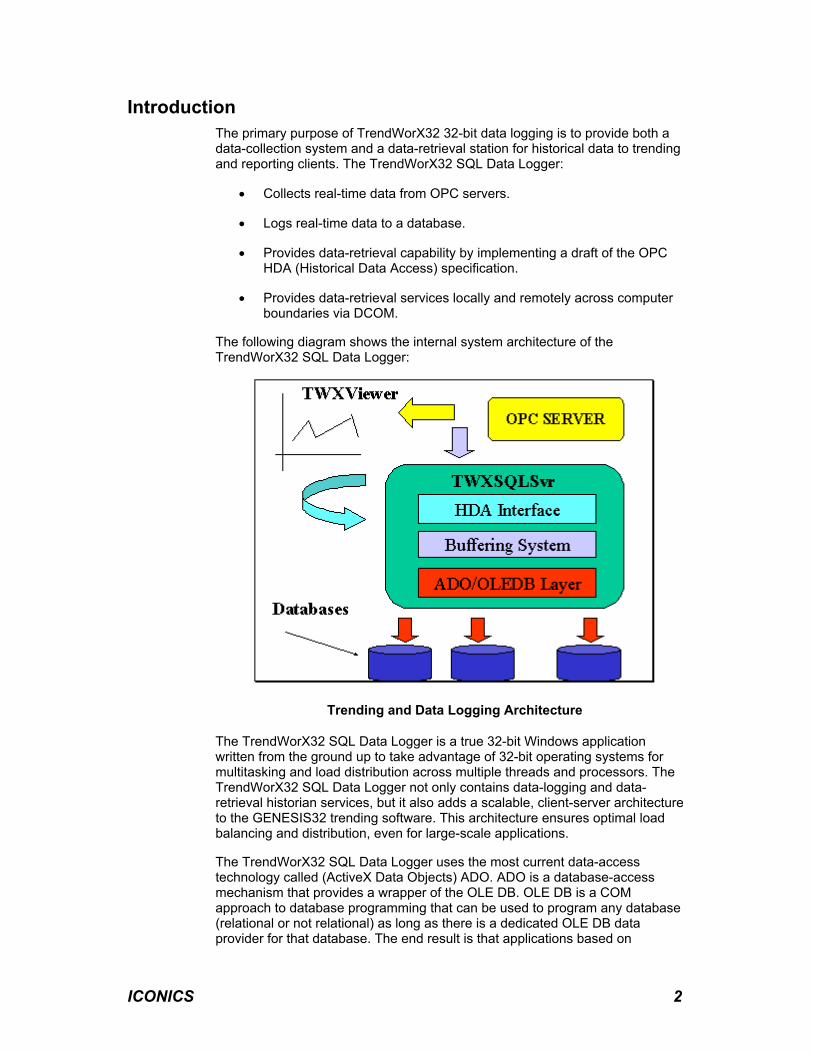
The following diagram shows the internal system architecture of the TrendWorX32 SQL Data Logger:
Trending and Data Logging Architecture
The TrendWorX32 SQL Data Logger is a true 32-bit Windows application written from the ground up to take advantage of 32-bit operating systems for multitasking and load distribution across multiple threads and processors. The TrendWorX32 SQL Data Logger not only contains data-logging and data-retrieval historian services, but it also adds a scalable, client-server architecture to the GENESIS32 trending software. This architecture ensures optimal load balancing and distribution, even for large-scale applications.
The TrendWorX32 SQL Data Logger uses the most current data-access technology called (ActiveX Data Objects) ADO. ADO is a database-access mechanism that provides a wrapper of the OLE DB. OLE DB is a COM approach to database programming that can be used to program any database (relational or not relational) as long as there is a dedicated OLE DB data provider for that database. The end result is that applications based on
ICONICS 2
ADO/OLE DB can potentially access any database regardless of the underlying storage media, file system, and location. TrendWorX32 SQL Data Logger currently uses ADO version 2.5, the Universal OLE DB ODBC data provider supplied by Microsoft, as well as native OLE DB providers to access Microsoft Access, Microsoft SQL Server, MSDE, and Oracle-compliant databases.
Functional Diagram of TrendWorX32 SQL Data Logger
TrendWorX32 SQL Data Logger can be deployed using the same PC on which the database resides, or using a different PC that is networked to the database. In addition, you can have TrendWorX32 SQL Data Logger is deployed on multiple PCs data logging to the same (or different) databases, therefore providing a scalable and distributed data-logging architecture.
TrendWorX32 SQL Data Logger Multiple Database Capability
ICONICS 3
A key feature of TrendWorX32 SQL Data Logger is its ability to handle data logging and data retrieval with respect to multiple types of databases concurrently, therefore enabling you to develop a very cost-effective data-logging and data-retrieval application.
TrendWorX32 SQL Data Logger will support data logging and data retrieval to or from:
• Microsoft Access
• Microsoft SQL Server 6.5, 7.0, and 2000
• MSDE 7.0 and 2000
• Oracle 8.0
TrendWorX32 SQL Data Logger is a MFC/ATL free-threaded server application that performs data logging and data retrieval by implementing a draft of the OPC HDA (Historical Data Access) specification.
Configuration The configuration layout of the TrendWorX32 SQL Data Logger is quite similar to that of an OPC server configuration. The key concept here is the database group object, which replaces the device of the OPC data server configuration.
A database group object represents a:
• High-level grouping of groups of signals to data log.
• Multithreaded object for managing data updates and logging-to-disk activities along with extensive runtime user interface.
• Physical connection to an underlying database.
In addition, each database maintains a list of recent errors for troubleshooting, which can be in the TrendWorX32 Logger Configurator.
Each database group object is responsible for managing data-logging groups of signals. A data-logging group includes:
• A logical collection of signals to be data-logged.
• Common data-collection rate and data-logging table
• Common data-logging configuration.
• Group style management and editing capability for a collection of signals.
For more information, refer to the TrendWorX32 Logger Configurator Help documentation.
ICONICS 4
Features of the TrendWorX32 SQL Data Logger Key features of the TrendWorX32 SQL Data Logger include:
• Database connection dialog
• Enhanced data-retrieval support
• Microsoft ADO 2.7 support
• TraceWorX debug support
• Expression support
• Daylight savings time support
Note: TrendWorX32 up to and including Version 6.1x is using the Windows-based APIs for converting a time from local time to UTC or from UTC to local time. The Windows APIs do not correctly adjust the conversion for the daylight savings time if the timestamp to be converted was obtained from a different time period (i.e. it was obtained in "summer" time but now we have "winter" time). TrendWorX32 Version 7.x introduced new time conversion utilities that account for this discrepancy. There are, however, some things to consider:
• These functions are used by default (no user enabling is required).
• This is what they do in order to convert each time stamp:
o They check Windows for the PC Time Zone Settings and to see if automatic daylight savings is enabled.
o They also obtain from Windows the times/dates for switching over. (These dates do not change; they are in the form of, e.g., the first Sunday of April.)
o Depending on the previous information, the new functions properly adjust the conversion times to compensate for daylight savings time.
Other features include:
• NT service support for TrendWorX32 SQL Data Logger.
• Support for operator comments.
• Support for batch and lot tracking.
• Microsoft SQL 2000 and Microsoft MSDE 2000 support.
• Data-logging filters
• MSDE Manager application for managing MSDE-based data-logging applications.
• GenTray support and integration.
• Remote configuration support.
ICONICS 5
• Data logging tuning parameters.
• ADO 2.5 and 2.6 integration.
• Support for logging tag descriptions.
• TrendWorX32 SQL Data Logger Configurator.
• Support for Oracle data logging.
• Support for MSDE data logging.
• Integration of native OLE DB providers for faster data replay.
• Asynchronous historical data retrieval for faster updates of real-time historical trends.
• UTC support for data logging. (See the note below.)
• Condition/event-handling mechanism.
• Scheduling for minimizing system load and fully decoupling data logging from data collection, while supporting data-logging retrials in cases of failure.
• Support for hot database switching during runtime mode without stopping data-logging activity. In this scenario, you can use the TrendWorX32 Logger Configurator or OLE Automation to select a new database for data logging. You have the option to redirect pending writes to the new database or log them to the current one.
• OLE Automation interface to data logging.
• Integration of data-logging activity into the GenEvent Registrar.
• Support for data logging the same OPC tags in the same data-logging group but under a different-logging name.
• Integration of native OLE DB providers for faster replay and decreased CPU usage.
Note: UTC support refers to data logging the time stamps of samples in the UTC time format. However, all clients will replay historical data using the "local" (non-UTC) client time, unless they are otherwise configured.
ICONICS 6
Upgrading to Versions 6.00 and 6.10 Upgrading From Version 5.20 to Version 6.0
The biggest change in terms of upgrading an existing application of Version 5.20 to Version 6.0 is the new approach to data-logging configuration and administration. Now the configuration information of the TrendWorX32 SQL Data Logger server ("TWXSQLSvr.exe") is stored in a database file. By default, this file is in a Microsoft Access (.mdb) file format. The TrendWorX32 Logger Configurator tool configures data-logging and then downloads the configuration data to the data-logging server, which may be local and/or remote. The most important step here is upgrading an existing 5.20 data-logging configuration to the new Configurator database. To upgrade from Version 5.20 to Version 6.00, use the procedure outlined in the following sections.
Note: It is suggested that you back up all-important historical data and or current (*.txd) configuration files prior to upgrading to the new database Configurator tool.
Upgrading From Version 6.00 to Version 6.10
To upgrade from Version 6.00 to Version 6.10, you simply need to open the TrendWorX32 Logger Configurator and select the configuration database file to be upgraded to the Version 6.10 format. The TrendWorX32 Logger Configurator will automatically convert the configuration .mdb file to the Version 6.10 format.
Upgrading From Version 5.20 to Version 6.00: Step 1 Start the TrendWorX32 SQL Data Logger from the Programs menu in Windows.
TrendWorX32 SQL Data Logger Screen
ICONICS 7
Upgrading From Version 5.20 to Version 6.00: Step 2 From the File menu, choose Open to open the file that you want to export to the new Configurator database.
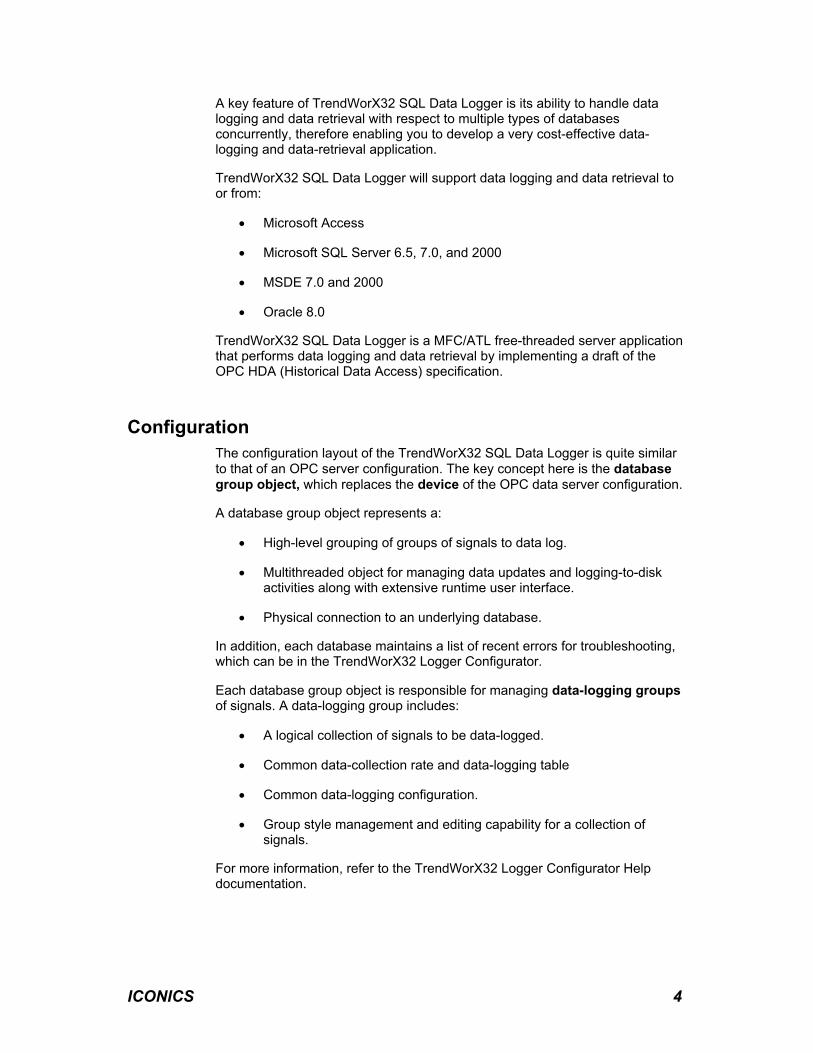
Upgrading From Version 5.20 to Version 6.00: Step 3 From the File menu, choose Export Configuration. This opens the Export Configuration dialog box, shown below.
Export Configuration Dialog Box
The updated installation for Version 6.0 will install the following files under the GENESIS32 "Bin" directory:
• "Twx32Cfg.src"
• "Twx32.mdb"
The first file ("Twx32Cfg.src") is a "template" file for generating default ("empty") configuration databases. The second file ("Twx32.mdb") is a configuration database file that is ready to use. Upon proper installation, when the Export Configuration dialog is opened it should list the OLE DB Provider and the Connection String to the default configuration database file ("Twx32.mdb"), as shown in the figure above.
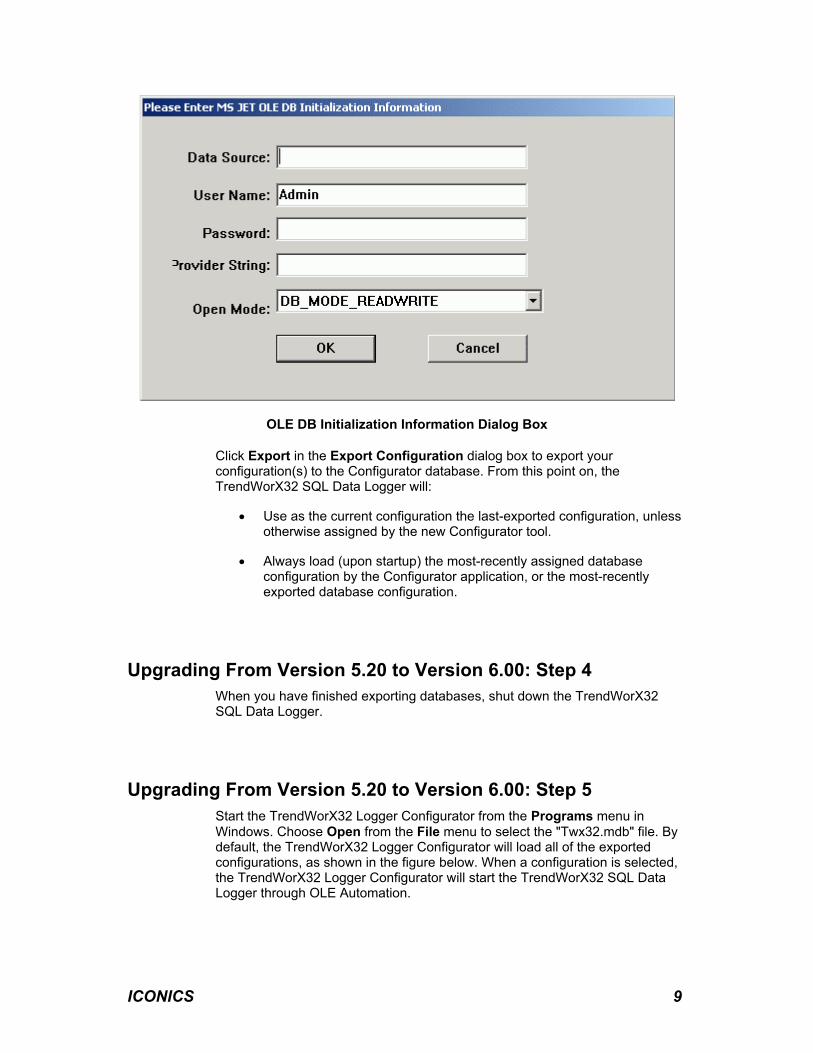
If this is not the case, select Microsoft Access as the OLE DB provider, and then click Set. This opens the OLE DB Initialization Information dialog box, shown below. In the Data Source field, fill in the correct pathway to the "Twx32.mdb" configuration file, including the ".mdb" Microsoft Access file extension, to properly establish a configuration database connection. Then click OK.
ICONICS 8
OLE DB Initialization Information Dialog Box
Click Export in the Export Configuration dialog box to export your configuration(s) to the Configurator database. From this point on, the TrendWorX32 SQL Data Logger will:
• Use as the current configuration the last-exported configuration, unless otherwise assigned by the new Configurator tool.
• Always load (upon startup) the most-recently assigned database configuration by the Configurator application, or the most-recently exported database configuration.
Upgrading From Version 5.20 to Version 6.00: Step 4 When you have finished exporting databases, shut down the TrendWorX32 SQL Data Logger.
Upgrading From Version 5.20 to Version 6.00: Step 5 Start the TrendWorX32 Logger Configurator from the Programs menu in Windows. Choose Open from the File menu to select the "Twx32.mdb" file. By default, the TrendWorX32 Logger Configurator will load all of the exported configurations, as shown in the figure below. When a configuration is selected, the TrendWorX32 Logger Configurator will start the TrendWorX32 SQL Data Logger through OLE Automation.
ICONICS 9
Setting Up a Configuration Database
Note: The TrendWorX32 Logger Configurator is integrated into the TrendWorX32 SQL Data Logger through a COM interface. This means that if the TrendWorX32 SQL Data Logger is started from within the TrendWorX32 Logger Configurator, and if no other application is referencing the TrendWorX32 SQL Data Logger, the TrendWorX32 SQL Data Logger will shut down after stopping data logging (if it is enabled within the Configurator) once the TrendWorX32 Logger Configurator is exited. The exception to this rule is when the TrendWorX32 SQL Data Logger is registered to run as an NT service.
Note: Since the GENESIS32 version 5.20 release, the database access tools used by TrendWorX32 (such as OLE DB and ADO) have been updated by Microsoft. GENESIS32 installation will always install the latest available version of these tools at the time of releasing the GENESIS32 product. It is recommend that, once the existing Version 5.20 TrendWorX32 SQL Data Logger configurations have been successfully exported to the new TrendWorX32 Logger Configurator, you re-establish their connections to the databases so that any new settings on the database connections are automatically updated in the new Configurator database. In addition, you can test the new database connections both for data writes and data reads by clicking the Perform Test button in the TrendWorX32 Logger Configurator.
ICONICS 10
Choosing a Database The TrendWorX32 SQL Data Logger supports the following databases as storage media for its data:
• Microsoft Access
• Microsoft SQL Server 6.5, 7.0, and 2000
• Microsoft Data Engine (MSDE) 7.0 and 2000
• Oracle 8.0
Note: The TrendWorX32 SQL Data Logger support for Oracle assumes that Oracle will be running on an NT Server station and that the Data Logger will connect to an Oracle Database for data logging using the latest ODBC driver for Oracle.
Note: Microsoft SQL Server 2000 performs better than Microsoft SQL Server 7.0 and uses less memory and CPU capacity at the expense of increased use of hard-disk space. The same applies when comparing MSDE 7.0 with MSDE 2000.
Data storage requirements refer to the size of the target database once data collection and data storage begin. Again, the differences between Microsoft Access and Microsoft SQL Server arise from the fact that Microsoft Access is a file-based database engine, while Microsoft SQL Server is a server-based database. As a result, Microsoft Access databases are limited by the capacity of the hard disk on which they reside, while Microsoft SQL Server databases can expand across multiple hardware devices. In addition, Microsoft SQL Server can be configured to increase the database size automatically, if needed, while data logging is activated. The size of MSDE databases is limited to 2 GB, and the size of Microsoft Access databases is limited to 1 GB. To compute an estimate of required database size, on a per-group basis, use the following equation:
Total Number of Records = (Number of Tags x Total Logging Period (in secs)) / (36 x Data-Collection Rate (in secs))
Required Size = (Total Number of Records) x (1024 Bytes/Record) x (1.5) for Microsoft SQL Server 7.0 or MSDE 7.0
Required Size = (Total Number of Records) x (1024 Bytes/Record) x (2.0) for Microsoft SQL Server 2000 or MSDE 2000
The above size calculation does not include the transaction log space used by Microsoft SQL Server or MSDE. Typically it should be a fraction of the data storage space.
Example
For example, assume you want to data log 100 tags with a data-collection rate of 1 second and a total data-logging period of 24 hours (converted to seconds). This will require the following storage for Microsoft SQL Server 7.0 or MSDE 7.0:
ICONICS 11
Total Number of Records = (100) x (24 hours x 60 min/hr x 60 sec/min) / (36 x 1 sec) =240,000 Records
Required Size = (240,000) x 1,024 x 1.5 = 360 MB per day
Note: When you are logging data to an Oracle database, you can expect a minimum 20 percent increase in database size because of the data types supported by Oracle. Typically in a Microsoft Access database historical data logging the fragmentation occurs even when historical data tables are deleted or truncated. Microsoft Access will not reclaim the space the deleted data occupied, and as such its size it will keep growing until the next time it is compacted.
Note, however, that the above example is a worst-case scenario that assumes all tags are updated every second from the OPC server. In reality, OPC servers are event-based, so they will update only when the value of the tag changes. The TrendWorX32 SQL Data Logger also supports various data-logging filters, on a per-tag basis, as well as deadband. These can be used to reduce the database-storage requirements effectively. When the targeted size of the database is more than 1 GB, it is recommended that you use Microsoft SQL Server or MSDE (for up to 2 GB) instead Microsoft Access.
To help you in maintaining the target database size and avoiding situations in which the database size grows uncontrolled, the TrendWorX32 SQL Data Logger supports a cyclic database table structure, which if configured will always maintain the configured number of tables into the database by overwriting existing data as it rolls over each table. Refer to the TrendWorX32 Logger Configurator documentation for more information.
In addition, keep in mind that ordinary database maintenance tasks, such as defragmentation, compaction, and table index updates, may require additional space on the target device(s), which can vary depending on the database tasks under operation. It is recommended that you allow for additional device space in these cases.
The basic criteria for choosing a suitable database for the target application are:
• Data-Logging Load • Data-Storage Requirements • Load of Client Connections • Database Backup and Maintenance
ICONICS 12
Data-Logging Load The data-logging load refers to the total number of tags and the frequency of data-logging activity. The TrendWorX32 SQL Data Logger has a hierarchical tag organization. In this hierarchy, the tags are organized into groups, which belong to a specific database group that is logging data to a dedicated database. Each tag within a group logs data to the same table. This is a great advantage to you in terms of load-balancing a data-logging application by staggering data-collection or data-logging activities over time.
File-Based Versus Server-Based Databases
Microsoft Access is a file-based database, whereas Microsoft SQL Server, MSDE, and Oracle are server-based databases. The main difference is that Microsoft Access can handle data logging for a small-to-medium load of tags, whereas Microsoft SQL Server and MSDE can handle data logging for a much larger load of tags. When the total number of tags is less than 300, and the data-collection rates average 5 seconds or more, a Microsoft Access database can be a reasonable choice. When the total number of tags is more than 300, Microsoft SQL Server or MSDE databases are the only choice. Oracle has been shown to have less data-logging capability than Microsoft SQL Server.
Microsoft Access may also be a valid choice for noncontinuous data logging that involves a small number of tags with very fast data-collection rates. TrendWorX32 SQL Data Logger uses event-based updates, and will only store the samples sent by the OPC server to the target database, thereby reducing the overall data-logging load.
Microsoft SQL Server and MSDE can use hardware resources to yield great performance, even in a multiuse environment. In addition, some other load-balancing strategies include:
• Trading off slower writes to the database for a higher tag count or faster data-collection rates.
• Having one hard drive for data logging and separate one for storing operator displays, program files, and the operating system if graphics (HMI) displays are present on the actively data-logging PC.
ICONICS 13
Data-Storage Requirements Data storage requirements refer to the size of the target database once data collection and data storage begin. Again, the differences between Microsoft Access and Microsoft SQL Server arise from the fact that Microsoft Access is a file-based database engine, while Microsoft SQL Server is a server-based database. As a result, Microsoft Access databases are limited by the capacity of the hard disk on which they reside, while Microsoft SQL Server databases can expand across multiple hardware devices. In addition, Microsoft SQL Server can be configured to increase the database size automatically, if needed, while data logging is activated. The size of MSDE databases is limited to 2 GB, and the size of Microsoft Access databases is limited to to 1 GB. To compute an estimate of required database size, on a per-group basis, use the following equation
Total Number of Records = (Number of Tags x Logging Interval) / (36 x Data-Collection Rate)
Required Size = (Total Number of Records) x (1024 Bytes/Record) x (1.25)
Example
For example, assume you want to data log 100 tags with a data-collection rate of 1 second and a logging interval of 24 hours (converted to seconds). This will require the following:
Total Number of Records = (100) x (24 hours x 60 min/hr x 60 sec/min) / (36 x 1 sec) = 240,000 Records
Required size = (240,000) x 1,024 x 1.25 = 295 MB per day
Note: When you are logging data to an Oracle database, you can expect a 20 percent increase in database size because of the data types supported by Oracle. When logging to Microsoft SQL 2000 or MSDE 2000 databases, you can expect a 20 percent increase in database size. Note, however, that the above example is a worst-case scenario that assumes all tags are updated every second from the OPC server. In reality, OPC servers are event-based, so they will update only when the value of the tag changes. The TrendWorX32 SQL Data Logger also supports various data-logging filters, on a per-tag basis, as well as deadband. These can be used to reduce the database-storage requirements effectively. When the targeted size of the database is more than 1 GB, it is recommended that you use Microsoft SQL Server or MSDE (for up to 2 GB) instead Microsoft Access.
To help you in maintaining the target database size and avoiding situations in which the database size grows uncontrolled, the TrendWorX32 SQL Data Logger supports a cyclic database table structure, which if configured will always maintain the configured number of tables into the database by overwriting existing data as it rolls over each table. Refer to the TrendWorX32 Logger Configurator documentation for more information.
In addition, keep in mind that ordinary database maintenance tasks, such as defragmentation, compaction, and table index updates, may require additional space on the target device(s), which can vary depending on the database tasks under operation. It is recommended that you allow for additional device space in these cases.
ICONICS 14
Load of Client Connections The load of client connections refers to the capacity of the database to handle multiple users connected to the database for reading or writing data. Typically, writing to a database is a much more expensive and slower operation than reading data is. The TrendWorX32 SQL Data Logger uses connections to the database for logging data, previewing historical data, providing data-logging information, and performing some maintenance on the database. In addition, TrendWorX32 Reporting tools use connections to the database.
The TrendWorX32 SQL Data Logger uses by default one constantly open connection to the underlying database while the database group is in runtime mode and data collection is activated. Note that you can modify this behavior in the TrendWorX32 Logger Configurator by disabling the Use Global Connection option. In this case, the database connection will be opened only during the log-to-disk process. It is recommended that the Use Global Connection option be disabled only when the log-to-disk times are slow (e.g. about every 15 minutes) or the number of logging groups is small.
The TrendWorX32 SQL Data Logger will also open database connections on behalf of TrendWorX32 Viewer ActiveX historical clients. There will be one database connection per client Viewer while historical data are retrieved. Once the historical data read operation is completed, the TrendWorX32 SQL Data Logger will close this database connection.
TrendWorX32 SQL Tool ActiveX Control, TrendWorX32 Reporting, and the TrendWorX32 OLE DB Provider will also use database connections for configuration and data retrieval. These database connections remain open while data are retrieved, and then they are closed by the applications that created them when all historical data retrieval is completed.
If you anticipate that more than 10 database connections will be open at any time, it is recommended that you use Microsoft SQL Server instead of Microsoft Access. Microsoft Access cannot handle a large number of simultaneous connections, whereas Microsoft SQL Server, because of its Enterprise architecture, can. In addition, remember that MSDE performance decreases with more than five active (open) connections to an MSDE database. However, both Microsoft SQL Server and MSDE offer central, server-like memory management of all database connections, thereby providing better system-resource management than Microsoft Access, which manages each database connection independently (on a per-client basis).
ICONICS 15
Database Backup and Maintenance Database backup and maintenance are key factors in choosing a suitable database for the target application. You will need to back up historical data, perform periodic maintenance on the database, and defragment the database after extended periods of use. Microsoft Access does not offer most of the above while client database connections are open. In addition, it requires periodic shutdown and maintenance to deal with data fragmentation issues. Typically in a Microsoft Access database historical data logging the fragmentation occurs even when historical data tables are deleted or truncated. Microsoft Access will not reclaim the space the deleted data occupied, and as such its size it will keep growing until the next time it is compacted. In contrast, Microsoft SQL Server and MSDE are self-maintaining database engines that can accommodate scheduled backups, periodic maintenance tasks, defragmentation, and much more. Unlike Microsoft Access, Microsoft SQL Server and MSDE databases do not require stopping all database activity in order to perform these tasks.
To maintain your Microsoft Access database:
1. Shut down all data logging, data replay, and reporting applications.
2. Start the TrendWorX Logger Configurator.
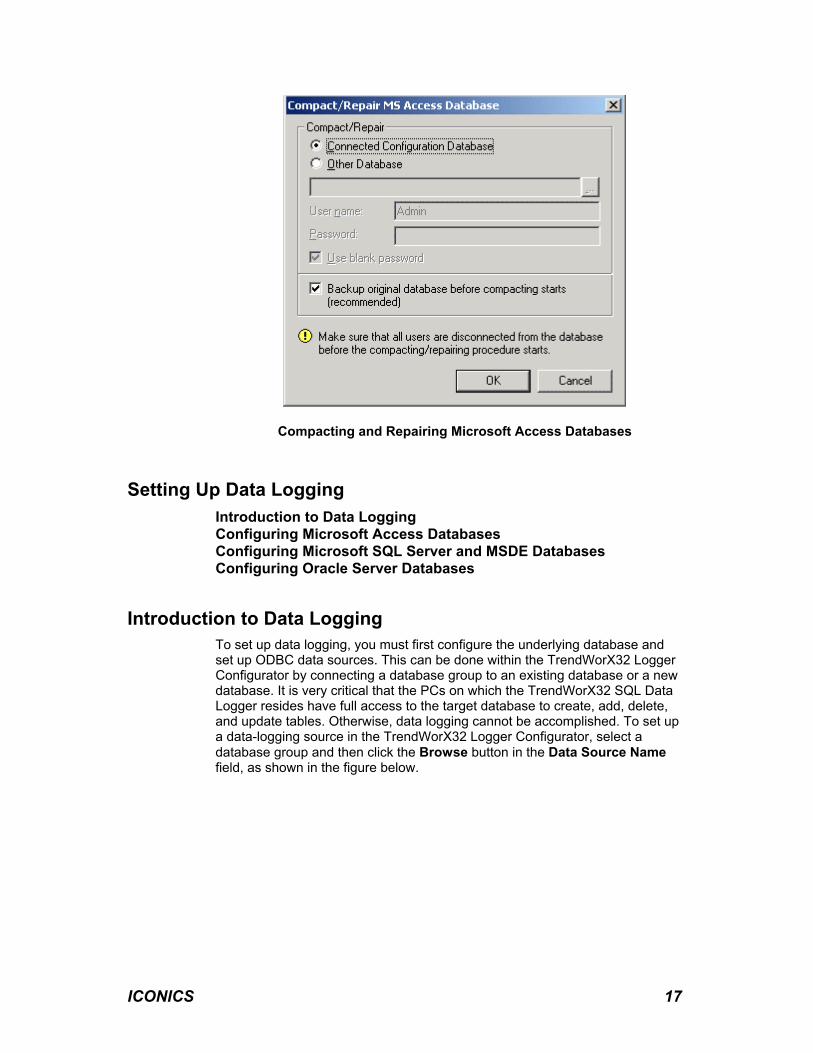
3. From the Tools menu choose Compact/Repair MS Access Database, as shown in the figure below.
Accessing Database Maintenance Tools
4. This opens the Compact/Repair MS Access Database dialog box, as shown in the figure below. You can choose to compact the configuration database or any other historical Microsoft Access database. Note that database compaction requires that you have available free hard disk space equal to the size of the Microsoft Access database prior to compaction. It is a good idea to always back up any database prior to compaction. Microsoft Access database compaction should be done after several iterations through the cyclic table creation configuration of TrendWorX data logging. For example, if the data-logging configuration is set to create a new table every 1 day and maintain a total of 7 tables, a reasonable choice for Microsoft Access database compaction should be about every 1 to 6 months, depending on the volume of data logged.
ICONICS 16
Compacting and Repairing Microsoft Access Databases
Setting Up Data Logging Introduction to Data Logging Configuring Microsoft Access Databases Configuring Microsoft SQL Server and MSDE Databases Configuring Oracle Server Databases
Introduction to Data Logging To set up data logging, you must first configure the underlying database and set up ODBC data sources. This can be done within the TrendWorX32 Logger Configurator by connecting a database group to an existing database or a new database. It is very critical that the PCs on which the TrendWorX32 SQL Data Logger resides have full access to the target database to create, add, delete, and update tables. Otherwise, data logging cannot be accomplished. To set up a data-logging source in the TrendWorX32 Logger Configurator, select a database group and then click the Browse button in the Data Source Name field, as shown in the figure below.
ICONICS 17
TrendWorX32 Logger Configurator
This opens the Select Data Source dialog box, shown below. Choose the Machine Data Source tab and an existing database.
Select Data Source Dialog Box
ICONICS 18
Or you can create a new database by clicking New in the Machine Data Source tab of the Select Data Source dialog box. This opens the Create New Data Source wizard, shown below, which enables you to configure a new database.
Create New Data Source Wizard
It is recommended that you configure the new database as a System Data Source so it is available to any user logged into the specific PC. Click Next to select the corresponding ODBC driver, such as Microsoft Access, Microsoft SQL Server, or Oracle. Refer to the TrendWorX32 Logger Configurator Help documentation for more information on how to configure databases.
ICONICS 19
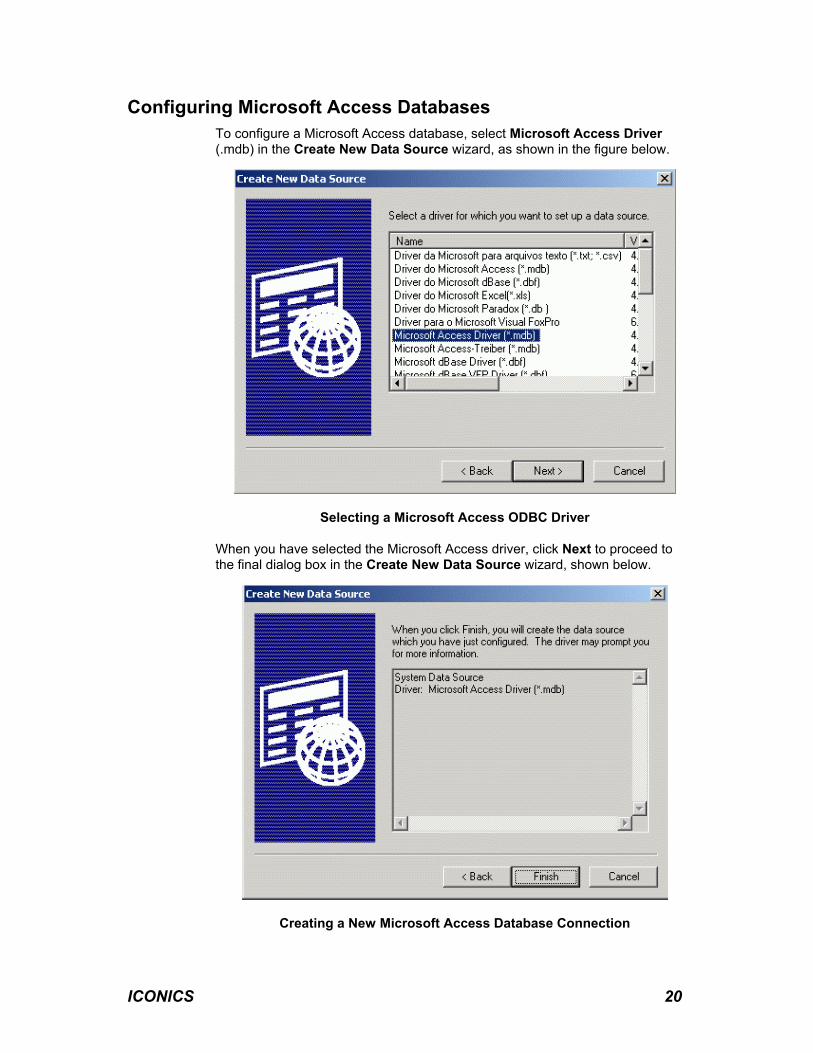
Configuring Microsoft Access Databases To configure a Microsoft Access database, select Microsoft Access Driver (.mdb) in the Create New Data Source wizard, as shown in the figure below.
Selecting a Microsoft Access ODBC Driver
When you have selected the Microsoft Access driver, click Next to proceed to the final dialog box in the Create New Data Source wizard, shown below.
Creating a New Microsoft Access Database Connection
ICONICS 20
Click Finish to configure your new Microsoft Access database. This opens the ODBC Microsoft Access Setup dialog box, shown below. Enter the Data Source Name and the Description.
ODBC Microsoft Access Setup Dialog Box
Click Select to choose an existing .mdb file. This opens the Select Database dialog box, shown below.
Selecting an Existing Microsoft Access Database File
Click Create to create a new .mdb file. This opens the .mdb file directory in the New Database dialog box, as shown below.
ICONICS 21
Creating a New Microsoft Access Database File
You can choose a local hard disk or a networked hard disk as the location of your new .mdb file. Click OK to exit the configuration and establish the database connection.
Note: When creating a new .mdb file, the Microsoft Access configuration dialog box provides the options of creating a Version 4.x or a Version 3.x compatible .mdb file. By default, Version 4.x is selected, creating a Jet Engine 4.x compatible .mdb file, which can be opened only in Microsoft Access 2000. If you have Microsoft Access 97, select the Version 3.x compatibility. In general, Version 4.x is preferred because it offers greater functionality than the older versions.
Configuring Microsoft SQL Server and MSDE Databases The TrendWorX32 SQL Data Logger includes native support for MSDE (Microsoft Data Engine), which is a Microsoft SQL Server 7.0 or 2000 compatible database engine with the following limitations:
• The Maximum database size is 2 GB.
• Performance can decrease if more than five connections are open at one time.
However, MSDE is a Microsoft SQL Server compatible engine that can be directly upgraded to the full Microsoft SQL Server. Thus, database connections to MSDE are identical to the database connections to Microsoft SQL Server.
To establish an ODBC connection to this database, when configuring a new ODBC data source for Microsoft SQL Server or MSDE, select the appropriate ODBC driver. To configure a Microsoft SQL Server or MSDE database, select
ICONICS 22
the SQL Server driver in the Create New Data Source wizard, as shown in the figure below.
Selecting a Microsoft SQL or MSDE Server ODBC Driver
When you have selected the Microsoft SQL Server driver, click Next to proceed to the final dialog box in the Create New Data Source wizard, shown below.
Creating a Microsoft SQL Server or MSDE Database Connection
ICONICS 23
Click Finish to configure your new database. This opens the Create a New Data Source to SQL Server dialog box, shown below. Enter the Data Source Name, the Description, and the name of the Server on which the Microsoft SQL Server or MSDE engine resides.
Create a New Data Source to SQL Server Dialog Box
If it the engine resides on the same PC node as the TrendWorX32 SQL Data Logger, select "local." Otherwise select or specify the appropriate server name. Click Next to continue with the Microsoft SQL Server Security configuration and Connection type. It is recommended that you use the Windows NT authentication mechanism, which eliminates the need for maintaining individual user accounts and passwords.
ICONICS 24
Configuring a Microsoft SQL or MSDE Database Connection
Click Next to continue with the selection of the default database for the connection. Make sure it is not the master database, but the one created for the purpose of data logging.
Setting the Default Microsoft SQL Server or MSDE Database
ICONICS 25
Note: When connecting to an Microsoft SQL Server or MSDE database, make sure that the desired database for historical data logging is selected in the Change the Default Database field, as shown in the figure above. Otherwise, you will establish a connection to the master database, which is not recommended. Click Next to accept or modify the default settings, as shown in the figure below.
Configuring the Default Settings
Complete the connection configuration by clicking Finish. It is recommended that you test the established connection by clicking Test Data Source, as shown in the figure below.
ICONICS 26
Testing a Microsoft SQL Server or MSDE Database Connection
Note: Regardless of the database type, all GENESIS32 TrendWorX32 modules, which interact with databases, will create, modify, drop, and update tables. Therefore, it is critical that the currently logged-in user has permission to perform these tasks.
Configuring Oracle Databases The TrendWorX32 SQL Data Logger includes support for logging data as well as replaying data to and from Oracle databases. The support for Oracle was developed under the assumption that:
• ODBC database connections to Oracle are established using the Oracle ODBC Driver 8.05.60, which is provided by Oracle and is available on the ICONICS product CD under the Tools directory.
• Oracle is running on a Microsoft Windows NT station.
To configure an Oracle database, select the Oracle ODBC Driver in the Create New Data Source wizard, as shown in the figure below.
ICONICS 27
Selecting the Oracle ODBC Driver
When you have selected the ODBC for Oracle driver, click Next to proceed to the final dialog box in the Create New Data Source wizard, shown below.
Creating an Oracle Database Connection
ICONICS 28
Click Finish to configure your new database. This opens the Oracle ODBC Driver Setup dialog box, shown below. Enter the Data Source Name, the Description, the Service Name, and the User ID, and configure the other desired settings.
Configuring an Oracle ODBC Database Connection
ICONICS 29
Performance Optimization and Evaluation This section provides some insight into the options for optimizing a data-logging application. The biggest (and most obvious) performance booster is the hardware available. For data logging, fast processors, increased memory capacity, and fast hard disks accompanied by caching capabilities increase performance tremendously. In addition, multiprocessor servers drastically increase database performance and capacity.
Data-Compression Tools Database Access Scheduling Data Logging Load Distribution Multithreaded Architecture Managing the Database Table Organization Other Considerations Monitoring Performance Summary of Optimization for Microsoft SQL and MSDE
Data-Compression Tools TrendWorX32 SQL Data Logger supports a variety of data-compression tools, which can limit the amount of data stored in the database.
Deadband Data-Logging Filters
Deadband The TrendWorX32 SQL Data Logger supports absolute and relative deadband on a per-tag basis. Using the TrendWorX32 Logger Configurator, you can configure this individually for each tag, as shown below. Only those samples that are above the deadband will be actually data-logged.
ICONICS 30
Logging Tag Configuration Dialog Box
Data-Logging Filters The TrendWorX32 SQL Data Logger supports data-logging filters based on a statistical description of the available samples. You can configure the desired filter, on a per-tag basis, by choosing the desired type:
• Min
• Max
• Avg
• Standard Deviation
• Running Min
• Running Max
• Running Avg
• Moving Avg
• Moving Min
• Moving Max
• Totalizer
ICONICS 31
For the selected data-logging filter, TrendWorX32 SQL Data Logger will only log one sample to disk, which will be computed as follows:
• If the Calculation Period option is used, then all samples within the calculation period will be used to compute the actual sample that will be data-logged.
• If the Calculation Period option is not used, all samples within the log-to-disk interval will be used to compute the actual sample that will be data-logged.
Using the data-logging filters can greatly improve performance and historical database size requirements.
Database Access Scheduling The TrendWorX32 SQL Data Logger has flexible options for controlling the frequency of data logging to the database. Using these tools, you can control the frequency of database writes and spread them in such a way that not all groups write to the database at the same time. Internally, TrendWorX32 SQL Data Logger tries to achieve this to a certain degree, but the configuration gives you even more flexibility in doing so. In terms of configuration, TrendWorX32 SQL Data Logger allows you to control the interval at which data will be logged to the database, regardless of the data-collection interval.
Scheduling Database Access for Load Balancing
ICONICS 32
Using the Logging tab in the TrendWorX32 Logger Configurator, shown above, you can configure the system:
• On a per-group basis.
• To write to the database when a certain number of records has been collected.
• At a certain time.
• On interval.
• On a condition.
• Using a combination of options.
This way, you can "spread out" the write activity to the database and balance the data-logging load more successfully.
Note: TrendWorX32 SQL Data Logger can access the database for writes as fast as every 5 seconds.
Data Logging Load Distribution The TrendWorX32 SQL Data Logger tag database uses a hierarchical organization, which involves database groups and logging groups within each database group. This enables you to organize data-logging activity logically, in smaller loads, and in your desired areas of interest. It is recommended that you do not add more than 500 tags per group (depending on available hardware and the overall data-logging load, as well as the database type). This way the database tables will become more manageable, and the data-logging activity will not require extensive system resources. In general, for frequent data logging it is recommended that you configure your data logging activity such that the historical tables created will not exceed a size of 80 MB.
Note: Microsoft SQL Server and MSDE have database-maintenance capabilities even when active connections are open. In certain cases, for an above-average data-logging load it may be preferable to create databases with a large initial size in order to avoid frequent database expansion operations.
Multithreaded Architecture TrendWorX32 SQL Data Logger has a multithreaded architecture. This yields more responsive single-processor systems and increases the overall system performance of multiprocessor systems. The multithreaded architecture of the TrendWorX32 SQL Data Logger is designed around the database group. Each database group has a set of threads to log data to disk and to share the cataloging load across multiple threads. In addition, you can have multiple database groups logging data to the same database or a different database. Distributing the data-logging load across multiple database groups can yield better performance.
Managing the Database Table Organization TrendWorX32 SQL Data Logger provides a database organization and management scheme that allows you to control the database storage and table
ICONICS 33
creation for better performance. The Table Management tab in the TrendWorX32 Logger Configurator, shown below, allows you to set up an "archive" scheme, which can optimize historical replay and data logging.
Scheduling Historical Table Management for Load Balancing
For example, you could configure data-logging as follows:
• The data-logging load is 250 tags per second. • TrendWorX32 Viewer ActiveX historical viewers are configured to start
up with an initial display of 1 hour’s worth of data. • The historical data will be maintained for 7 days.
You can configure TrendWorX32 SQL Data Logger to create four tables per day by creating a new table every 6 hours and maintaining a total of 28 tables. This approach will:
• Speed up initial historical replay, because only the most recent table will be opened and the size of each table will remain reasonable.
• Speed up data logging, because each table will be a reasonable size. • Improve system maintenance and backup tasks by avoiding the
creation of enormous database tables. In general, for frequent data logging it is recommend that you configure the data logging activity such that the size of the historical tables will not exceed 80 MB.
Other Considerations For non-networked applications in which all GENESIS32 software is running on a single node, making sure that the database is not on the same hard drive as
ICONICS 34
the HMI displays can improve performance. Frequent display switching requires disk access, which can slow down data logging.
Data logging requires additional memory resources. In addition, databases allow you to control the amount of memory used. In the case of Microsoft SQL Server and MSDE memory is handled in a centralized fashion using the Microsoft SQL Server Enterprise manager for Microsoft SQL Server or the ICONICS MSDE Manager for MSDE.
Configuring Memory Management for Microsoft SQL Server
Microsoft SQL Server and MSDE introduce a dynamic memory-management scheme that uses system memory based on need and availability. In any case, it is recommended that for Microsoft SQL Server and MSDE data-logging applications you do not allocate more than two thirds of the total physical RAM available for database server memory usage. In addition, it is critical that the PC on which Microsoft SQL or MSDE is installed has virtual memory at least two times the total amount of physical RAM available.
Microsoft Access is entirely different. It utilizes memory on a per-connection basis, and it can easily consume a significant amount of system resources. For version 7.0, GENESIS32 modules and applications will automatically adjust the
ICONICS 35
Microsoft Jet Engine registry settings with default values. For data logging applications to Microsoft Access that require a high tag count, please contact ICONICS technical support on how to change these settings.
By setting a number other than 0 in the MaxBufferSize entry, you can limit the memory used by Microsoft Jet Engine on a per-connection basis. A setting of 8192 KB (in decimal form) provides a reasonable value for most Microsoft Access-based applications. Note that this setting may have to be set at all registry settings relating to Jet 3.x as well as to Jet 4.x engines.
Note: It is very critical that you adjust the default setting for MaxBufferSize. Many of the newer GENESIS32 modules use Microsoft Access (.mdb) files for configuration purposes, and they interact with Microsoft Access while in runtime mode. Adjusting the MaxBufferSize setting can greatly improve Microsoft Access/Jet Engine memory consumption.
Monitoring Performance The TrendWorX32 Logger Configurator has runtime tools for monitoring data-logging performance. This can help in determining whether the data-logging application is set up properly. You can view the statistics collected on a per-group basis during data logging by clicking the Get Statistics button in the TrendWorX32 Logger Configurator under each group. This opens the Group Statistics dialog box, shown below.
Monitoring Data-Logging Performance
These statistics show the time to:
• Connect to the database.
ICONICS 36
• Open a table for logging data. • Prepare data for logging. • Log historical data.
It also shows the total time of data logging.
In addition, the TrendWorX32 SQL Data Logger tracks the:
• Minimum time to open the target database table. • Maximum time to open the target database table. • Minimum time to log data. • Maximum time to log data.
These times will vary. However, if the total time of data logging is constantly increasing and is much larger than the configured time to access the database table for writes (set in the Logging tab of the data-logging group configuration) you may need to re-evaluate the data logging and hardware configuration.
Summary of Optimization for Microsoft SQL and MSDE The TrendWorX32 SQL Data Logger supports data logging to Microsoft SQL Server. Support for MSDE (Microsoft Data Engine), which is a Microsoft SQL Server compatible database server, was introduced in Version 6.00. Version 6.10 introduced support for Microsoft SQL Server 2000 and MSDE 2000.
The GENESIS32 product CD installs under the GENESIS32 program group a Tools directory, which contains the MSDE Manager. MSDE Manager is an administrative tool to be used with MSDE 2000 and 7.0 databases. It has support to install MSDE 2000 (default) or MSDE 7.0.
In terms of performance, several tests have shown the following:
• Best overall combination: Microsoft SQL Server 2000 (or MSDE 2000) and Windows 2000
• Next best: Microsoft SQL Server 7.0 (or MSDE 7.0) and Windows 2000
• Good performance: Microsoft SQL Server 7.0 (or MSDE 7.0), Win NT 4.0 with SP5 (or SP6)
Both Microsoft SQL Server 7.0 (or MSDE 7.0) and Microsoft SQL Server 2000 (or MSDE 2000) perform better using Microsoft Windows 2000. Microsoft SQL Server 2000 (or MSDE 2000) performs better than Microsoft SQL Server 7.0 (or MSDE 7.0). Data logging requires less table maintenance, and memory use overall is more reasonable (Microsoft SQL Server 7.0 utilizes much more memory). All this is done at the expense of hard disk space.
Microsoft SQL Server 2000 (or MSDE 2000) will achieve this performance by allocating much more disk space ahead of time so that it will not have to expand the database continuously. In addition, Microsoft SQL Server 2000 nor requires a minimum of 64 MB of RAM dedicated to it. However, during data logging Microsoft SQL Server 2000 (or MSDE 2000) will use much less memory than Microsoft SQL Server 7.0 (or MSDE 7.0).
ICONICS 37
Deploying Microsoft SQL Server 7.0 or Microsoft SQL Server 2000 (as well as MSDE) requires several simple steps at startup that are very important to overall data logging and system performance.
During Installation
When installing Microsoft SQL Server, (if possible) specify a different drive for the "masterdb" and "tempdb" databases of Microsoft SQL Server from the location of the actual historical database. If installing Microsoft SQL Server 7.0 or MSDE 7.0, please install the latest service pack, available on the GENESIS32 Product CD, under the Tools directory.
Note: When installing Microsoft SQL Server 2000 (or MSDE 2000), remember that TrendWorX32 Version works with Microsoft SQL Server 2000 in single-instance mode. Starting with Microsoft SQL Server 2000, you can install multiple instances of Microsoft SQL Server 2000 on the same computer. Each one is a separate install, having its own name (instance name). Thus, clients connect to it via instance name or server name.
After Installation
After installing Microsoft SQL Server, go to the Microsoft SQL Enterprise Manager (this does not apply to MSDE) and:
• Set the "tempdb" size to 120 MB and the transaction log to 20 MB.
• Set the "masterdb" size to 80 MB and the transaction log to 20 MB.
The initial sizes of "tempdb" and "masterdb" are small. Microsoft SQL Server will increase them on the fly, but it will consume resources. It is always better to start from a decent initial size. To perform this task, select each database, right-click to display the context menu, and select Properties. This opens the Master Properties dialog box, shown below, which enables you to adjust the database sizes.
ICONICS 38
Master Properties Dialog Box
Once the sizes have been modified, click OK to apply the changes.
Note: You may have to edit the Microsoft SQL Server registration properties inside the Microsoft SQL Enterprise manager to display all system objects so that the "masterdb" and "tempdb" are visible in the tree view. To do this, start the Microsoft SQL Enterprise manager, select the Microsoft SQL Server, right-click, and then select Edit SQL Server Registration Properties. This opens the Registered SQL Server Properties dialog box, shown below. Make sure that the Show System Databases option is checked.
ICONICS 39
Registered SQL Server Properties
Setting Server Memory Options
By default, Microsoft SQL Server and MSDE will be configured to use all available PC memory, which can cause problems with a heavy-duty load or an inadequately equipped PC.
You can use the Microsoft SQL Enterprise manager to adjust the server memory settings. For Microsoft SQL Server installations, start the Microsoft SQL Enterprise manager, select the Microsoft SQL Server, right-click, and then select Properties. This opens the SQL Server Properties dialog box, shown below. You can modify the server memory settings using the Memory tab of the SQL Server Properties dialog box.
ICONICS 40
SQL Server Properties
It is recommended that you use as a maximum value no more than two thirds of the total physical RAM available on the PC. For example, assume that the PC has 256 MB of RAM. Set the Microsoft SQL Server (or MSDE) RAM to a maximum value of for 128-168 MB of RAM.
Note: You may have to stop and restart the Microsoft SQL or MSDE servers for these changes to be applied.
Controlling Transaction Log size
For Microsoft SQL 2000 databases, go to the historical database Properties dialog box and select the Options tab, as shown in the figure below. Under Recovery Model, select Simple from the drop-down list, as shown in the figure below. This enables Transaction Log truncation so that the log will not increase in size.
ICONICS 41
Limiting the Transaction Log Size
For Microsoft SQL 7.0 databases, make sure that the Truncate Log on checkpoint option is checked in the Options tab of the database Properties dialog box, as shown in the figure below. In addition, the Auto Close, Select into / bulk copy, Auto create statistics and Auto update statistics options should be enabled.
ICONICS 42
Limiting the Transaction Log Size
Adjusting Virtual Memory Settings
Make sure that the PC has adequate virtual memory (paging file) for Microsoft SQL Server (or MSDE) and all other Windows applications. For example, assume that the PC has a total of 256 MB of RAM. Set Microsoft SQL Server (or MSDE) to use a maximum of 128 MB RAM. Make sure the paging file is at least 256 MB.
To adjust the virtual memory settings on your PC, select the My Computer icon on the desktop, right-click and select Properties from the pop-up menu. Once the System Properties dialog box is displayed, open the Advanced tab, as shown below.
ICONICS 43
Windows System Properties Dialog Box
Then click Performance Options to open the Performance Options dialog box, shown below.
Performance Options Dialog Box
Click Change to display the Virtual Memory settings dialog box, shown below. Here you can modify your virtual memory settings.
ICONICS 44
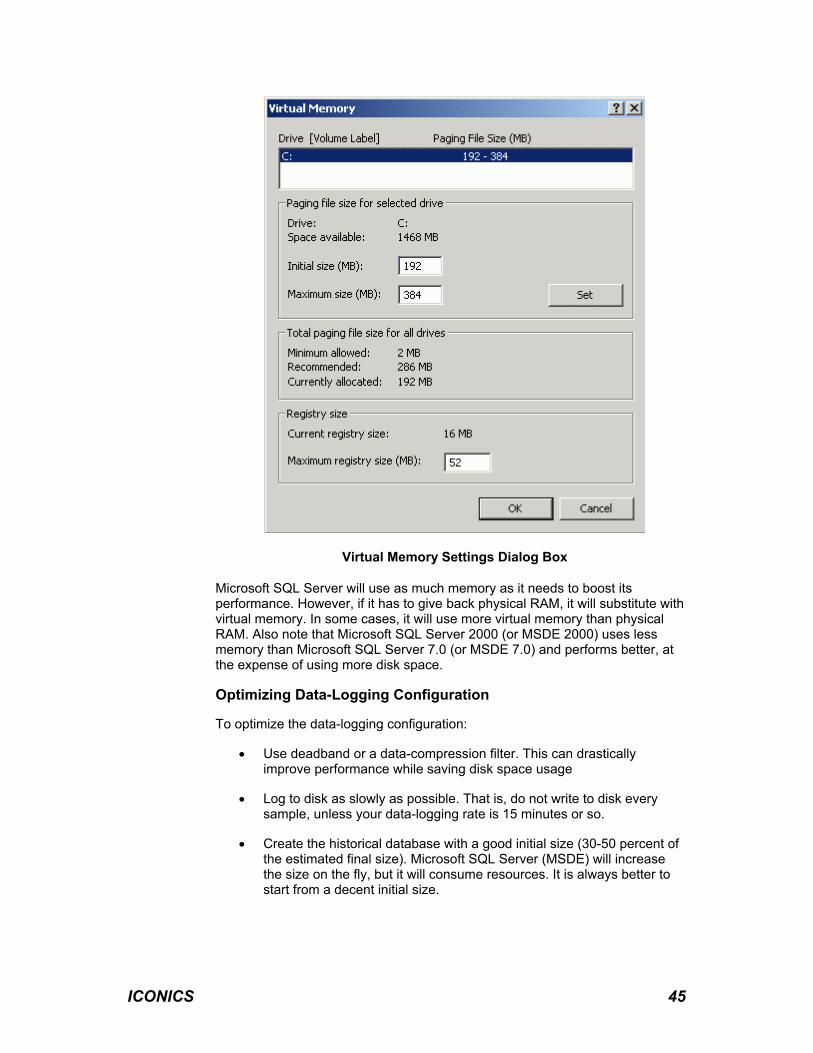
Virtual Memory Settings Dialog Box
Microsoft SQL Server will use as much memory as it needs to boost its performance. However, if it has to give back physical RAM, it will substitute with virtual memory. In some cases, it will use more virtual memory than physical RAM. Also note that Microsoft SQL Server 2000 (or MSDE 2000) uses less memory than Microsoft SQL Server 7.0 (or MSDE 7.0) and performs better, at the expense of using more disk space.
Optimizing Data-Logging Configuration
To optimize the data-logging configuration:
• Use deadband or a data-compression filter. This can drastically improve performance while saving disk space usage
• Log to disk as slowly as possible. That is, do not write to disk every sample, unless your data-logging rate is 15 minutes or so.
• Create the historical database with a good initial size (30-50 percent of the estimated final size). Microsoft SQL Server (MSDE) will increase the size on the fly, but it will consume resources. It is always better to start from a decent initial size.
ICONICS 45
• Avoid using many database groups to log to the same database. Each database group uses an independent connection to the database, which consumes more resources.
• Use fewer logging groups (with more tags per group) rather than many logging groups (with few tags per group). Microsoft SQL Server (MSDE) will fewer tables to maintain, so performance will be better.
• Do not let the size of data-logging tables exceed 80 MB. Create a new table instead. The bigger the tables get, the slower data logging will be.
• Run Microsoft SQL Server in Windows Server rather than Windows Workstation to increase performance.
Managing Database Storage Requirements
Within Microsoft SQL Server Enterprise manager, you can set up maintenance plans that can defragment the database and optimize and recompute table index information. Ideally, these plans should be activated during inactive data-logging periods. When applied to a database on a periodic basis, they can significantly improve database performance and reduce database disk space usage.
Example Configurations
Example 1. If you wanted to data log 100 signals per second, you would write to disk every minute or 60 samples, creating a new table every 4-6 hours.
Example 2. If you wanted to data log 500 signals per minute, you would write to disk no faster than every 5 minutes or five samples, creating a new table once a day or once a week.
Troubleshooting This section provides some useful tips for troubleshooting data-logging applications.
Database Driver Errors Inspecting Data-Logging Activity GenEvent Registrar and NT Event Logger Integration
Database Driver Errors Using a technology that has been incorporated into all ICONICS products, TraceWorX32 provides online diagnostics and tuning of applications running in the GENESIS32 system. TraceWorX32 is designed expressly for systems integrators, OEMs and customers who want to have tools for doing their own troubleshooting and diagnostics.
TraceWorX32 tracks the runtime activity for the TrendWorX32 SQL Data Logger and logs the runtime data to a log file based on user-configured trace levels. The log file provides a thorough, color-coded report detailing all activity for the application, including the time, the date, the severity level, and a description of the event or problem.
ICONICS 46
TraceWorX32 also features several options for reporting issues to technical support. If you are experiencing problems with any applications, the log file deployment options, such as compressing and e-mailing log files, are ideal for tracking and archiving data and sending detailed reports to technical support. Developers can use these reports to identify the source of the problems.
Please see the TraceWorX32 Help documentation for more information.
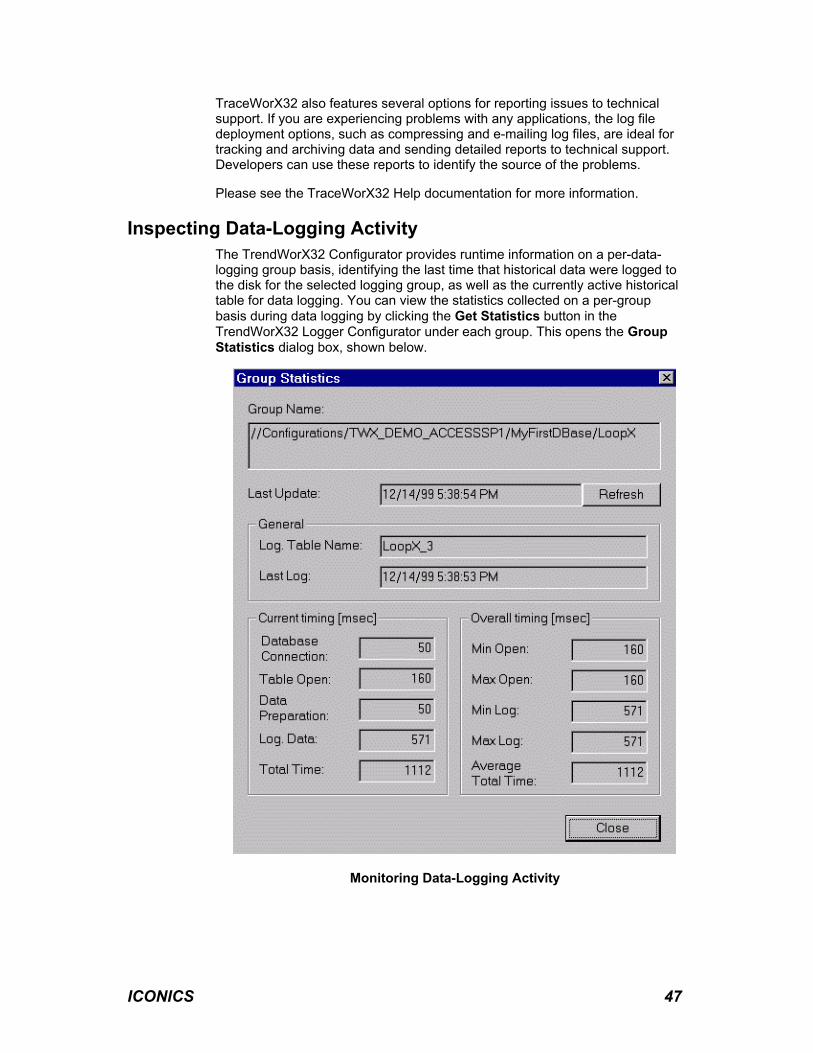
Inspecting Data-Logging Activity The TrendWorX32 Configurator provides runtime information on a per-data-logging group basis, identifying the last time that historical data were logged to the disk for the selected logging group, as well as the currently active historical table for data logging. You can view the statistics collected on a per-group basis during data logging by clicking the Get Statistics button in the TrendWorX32 Logger Configurator under each group. This opens the Group Statistics dialog box, shown below.
Monitoring Data-Logging Activity
ICONICS 47
GenEvent Registrar and NT Event Logger Integration The TrendWorX32 SQL Data Logger is interfaced to the GenEvent Registrar Server and, subsequently, to the NT Event Logger. Currently, the following events are posted:
• Started Logging (Severity 500)
• Stopped Logging (Severity 500)
• Error Starting Data Logging (Severity 800)
• Activated Database Group (Severity 600)
• Deactivated Database Group (Severity 600)
• Activated Logging Group (Severity 600)
• Deactivated Logging Group (Severity 600)
• Switched Database Connection (Severity 650)
• Failed to Activate (Severity 750)
• Failed to Deactivate (Severity 750)
• Errors in Loading Configuration (Severity 650)
• Failed to Switch Database (Severity 750)
• Missing Logging Tag (Severity 650)
• Lost Database Connection (Severity 800)
• Got Database Connection (Severity 500)
• Maximum Number of Logging Packets Reached (Severity 650)
• Lost Logging Packet (Severity 750)
• Retried to Log Data (Severity 650)
• Not Enough Client Units for Database Switching (Severity 500)
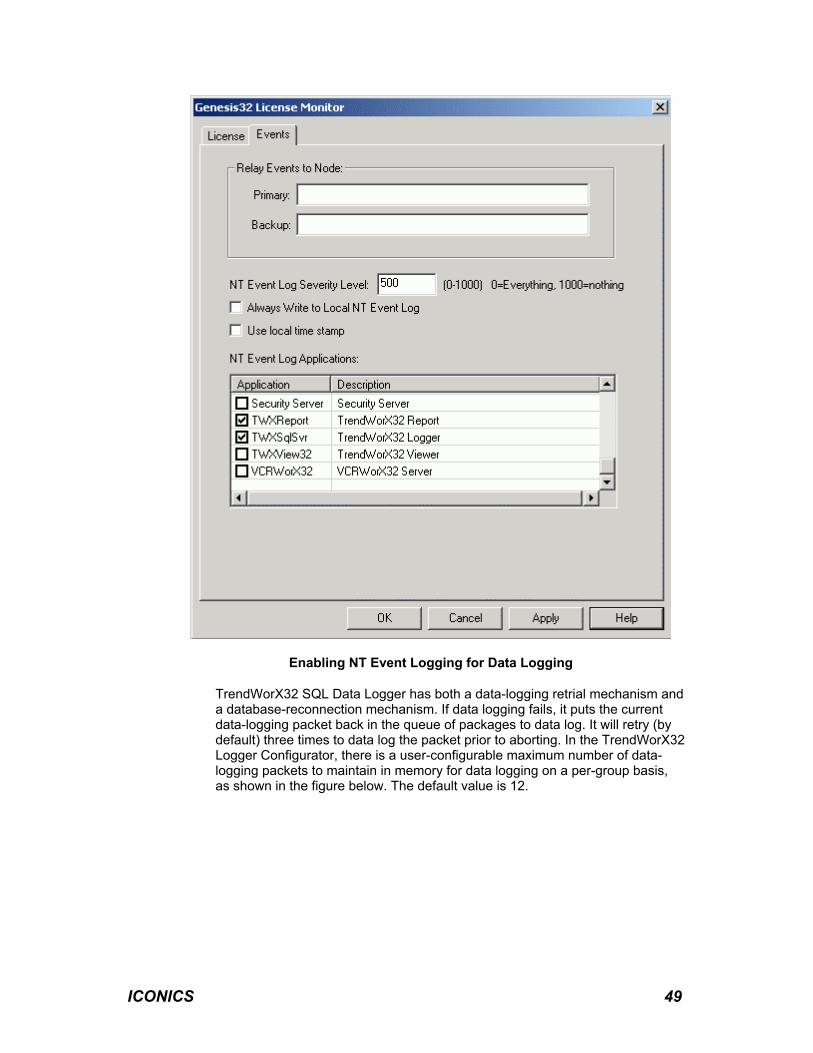
To activate the NT Event Logger, you need to enable this option under the GENESIS32 License Monitor, shown below, by checking Always Write to Local NT Event Log.
ICONICS 48
Enabling NT Event Logging for Data Logging
TrendWorX32 SQL Data Logger has both a data-logging retrial mechanism and a database-reconnection mechanism. If data logging fails, it puts the current data-logging packet back in the queue of packages to data log. It will retry (by default) three times to data log the packet prior to aborting. In the TrendWorX32 Logger Configurator, there is a user-configurable maximum number of data-logging packets to maintain in memory for data logging on a per-group basis, as shown in the figure below. The default value is 12.
ICONICS 49
Data-Logging Retrials Settings
The Max Logging Packets value controls the maximum number of data-logging packets to maintain in memory. The Retrials value controls the number of times the TrendWorX32 SQL Data Logger will retry data logging data in case of a failure. The Max Samples value controls the maximum number of samples to maintain in memory on a per-data-logging tag basis. The Retrial Delay value is the time between successive retrials.
By default, the TrendWorX32 SQL Data Logger will establish a connection to the database for logging and leave that connection open for the duration of the data-logging activity. To have the TrendWorX32 SQL Data Logger open a database connection only for the duration of writing a new logging packet to disk, you can change the Global Connection setting to 0. However, this is not recommended for high volume or frequent data-logging activity.
Note: The Max Logging Packets default value is set to 12. This assumes a small data-logging load. For larger data-logging applications, it may have to be reduced to a lesser value.
ICONICS 50
Security Integration The TrendWorX32 SQL Data Logger is interfaced to the ICONICS Security Server, and it provides support for the following security actions, as shown in the figure below.
ICONICS Security Server
In data-logging mode, you can log in to the ICONICS Security Server by choosing Login from the Security submenu of the Tools menu. The login function is only available in data-logging mode. This opens the ICONICS Security Login dialog box, shown below.
ICONICS Security Login
If you already have a user name and password, enter them and then click OK. Otherwise click Cancel. The ICONICS Security Login window opens, as shown below.
ICONICS 51
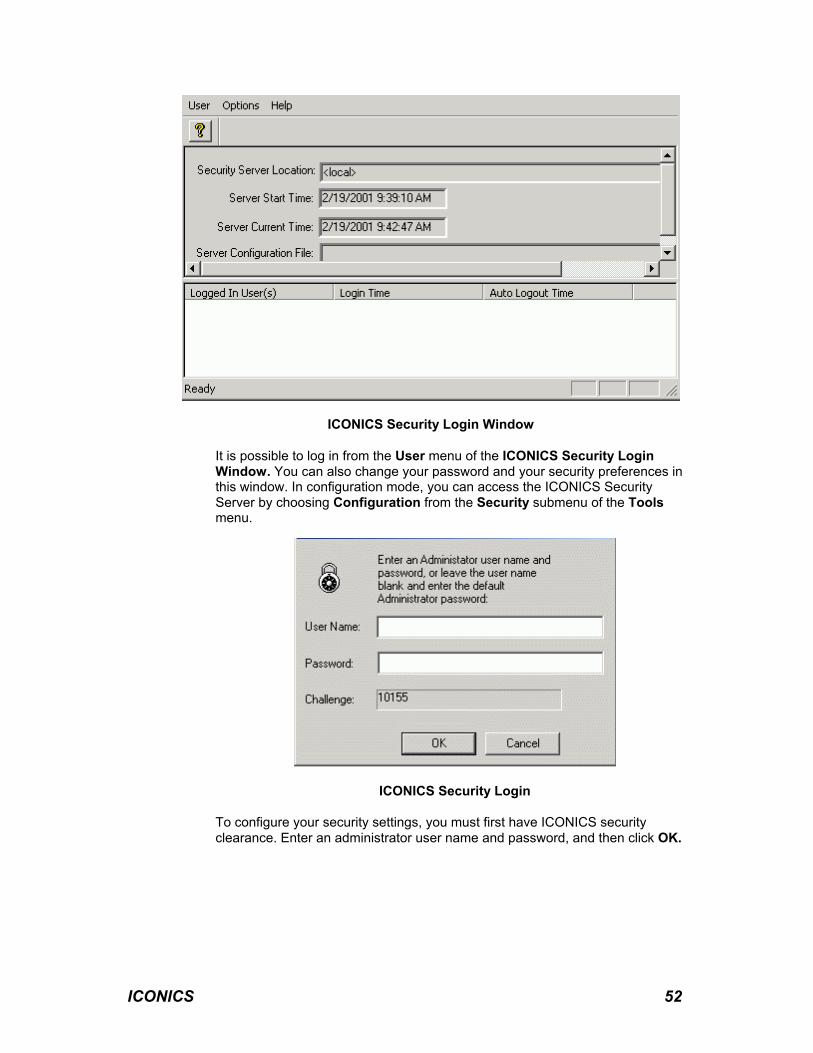
ICONICS Security Login Window
It is possible to log in from the User menu of the ICONICS Security Login Window. You can also change your password and your security preferences in this window. In configuration mode, you can access the ICONICS Security Server by choosing Configuration from the Security submenu of the Tools menu.
ICONICS Security Login
To configure your security settings, you must first have ICONICS security clearance. Enter an administrator user name and password, and then click OK.
ICONICS 52
Database Schema Key features of the TrendWorX32 SQL Data Logger data-logging engine include:
• Multiple databases support.
• Automatic data buffering.
• Extensive data-logging configuration.
• Data retrieval from OPC servers.
• Use of multithreading techniques.
For the actual data-logging mechanism, TrendWorX32 SQL Data Logger uses client/server database technology to perform compact batch updates to the underlying database, resulting in optimal use of available hardware and software resources. The database locks are placed in an optimal fashion, and the related tables can respond much better in multi-user scenarios.
Note: Batch updates are not currently supported for Oracle databases.
TrendWorX32 SQL Data Logger creates the necessary database schema to accommodate a various data-logging needs. For each physical database connection it will create the following database schema:
TrendWorX32 SQL Data Logger Database Schema
Tables
The application must have complete access to the database in order to edit or delete tables. If you change the name of the table on a per-group basis, TrendWorX32 SQL Data Logger will not delete the existing tables; this is left to the database administrator. In addition, under no circumstances should you change the order or the data type of the columns that are already created. With this in mind, it should be noted that you can append new columns at the end of
ICONICS 53
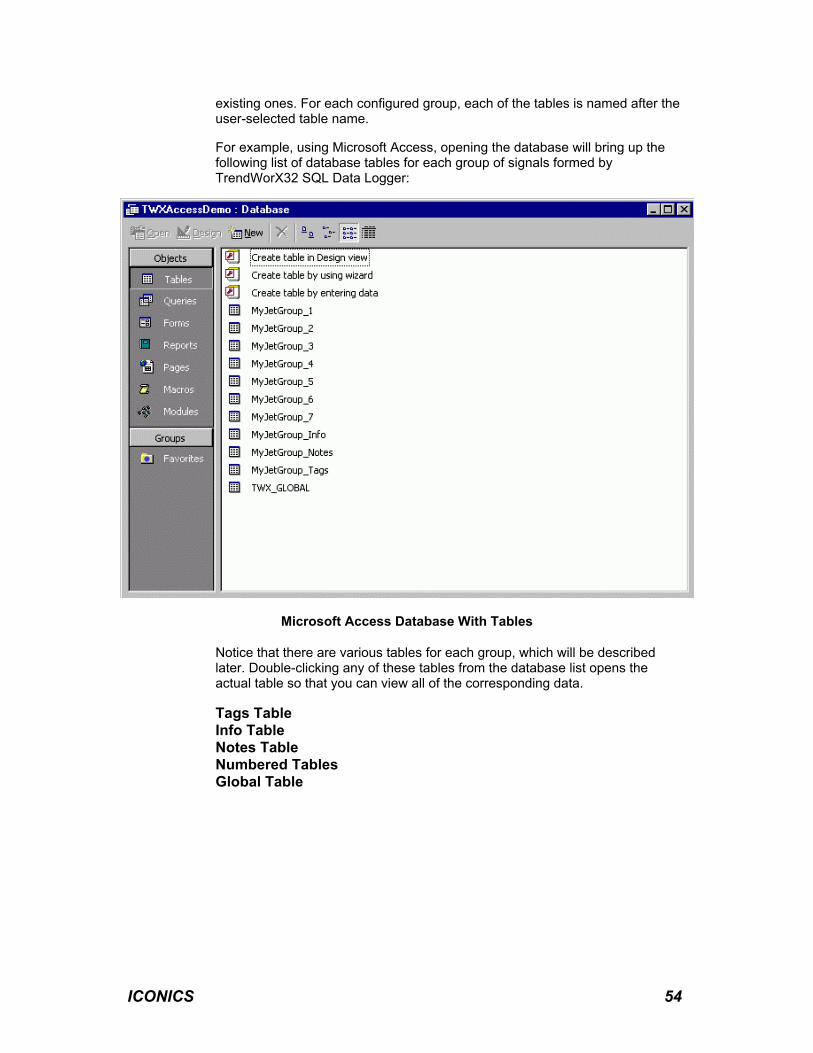
existing ones. For each configured group, each of the tables is named after the user-selected table name.
For example, using Microsoft Access, opening the database will bring up the following list of database tables for each group of signals formed by TrendWorX32 SQL Data Logger:
Microsoft Access Database With Tables
Notice that there are various tables for each group, which will be described later. Double-clicking any of these tables from the database list opens the actual table so that you can view all of the corresponding data.
Tags Table Info Table Notes Table Numbered Tables Global Table
ICONICS 54
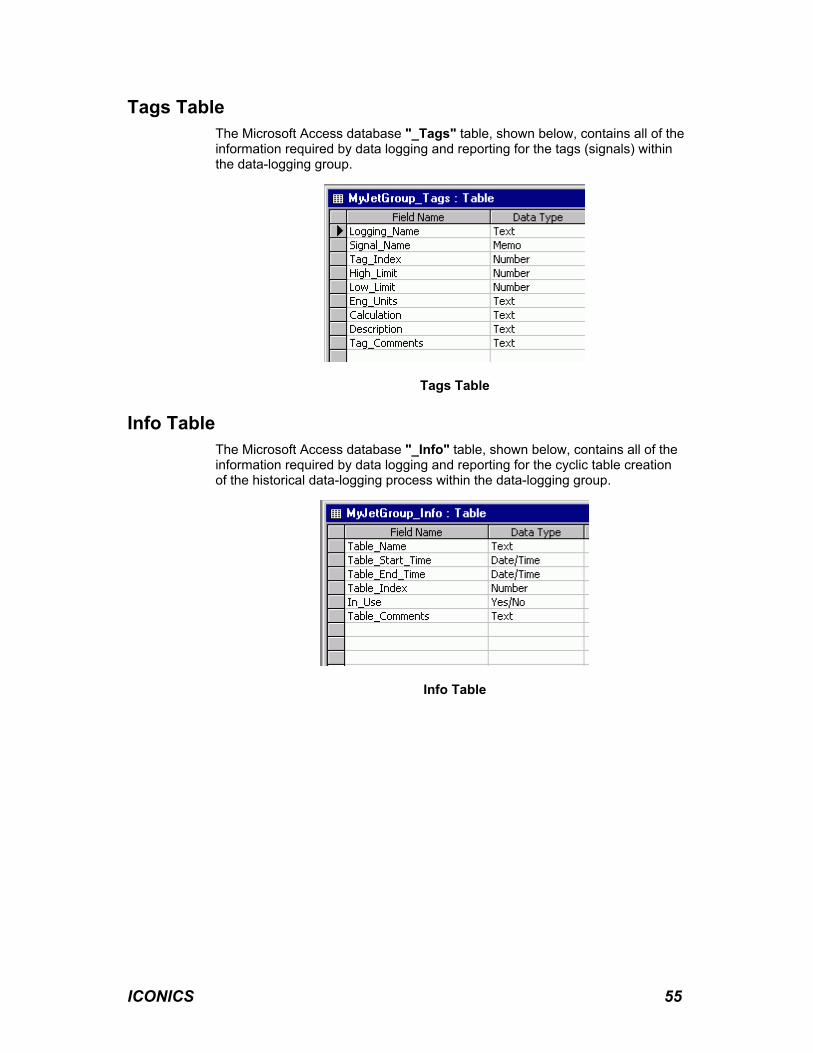
Tags Table The Microsoft Access database "_Tags" table, shown below, contains all of the information required by data logging and reporting for the tags (signals) within the data-logging group.
Tags Table
Info Table The Microsoft Access database "_Info" table, shown below, contains all of the information required by data logging and reporting for the cyclic table creation of the historical data-logging process within the data-logging group.
Info Table
ICONICS 55
Notes Table The Microsoft Access database "_Notes" table, shown below, contains all of the operator comments and batch/lot entries within the data-logging group.
Notes Table
Numbered Tables The Microsoft Access database Numbered tables ("_1," "_2," etc.), shown below, are the actual data-logging tables, which contain information for up to 36 samples per second.
Numbered Table
ICONICS 56
Global Table In addition, for each physical database, TrendWorX32 SQL Data Logger creates a Microsoft Access database Global table called "TWX_GLOBAL," shown below, that will be used to maintain database integrity across multiple data-logging nodes by ensuring that no two different groups will have data entered into the same table.
Global Table
Regardless of the end database choice, the TrendWorX32 SQL Data Logger can be deployed in various scenarios:
TrendWorX32 SQL Data Logger and Physical Database Residing on the Same Node
ICONICS 57
Trendworx32 SQL Data Logger Residing on a Different Node From the Database Server
Distributed TrendWorX32 SQL Data Logger Deployment
ICONICS 58
TrendWorX32 SQL Data Logger OLE Automation Interface The TrendWorX32 SQL Data Logger supports a dual COM interface for data logging manipulation through OLE Automation or DCOM. To use this new interface within a Visual Basic application (VBA), you must ensure that the VBA project has References to the ICONICS TrendWorX32 SQL library, as shown below.
Adding References to the TWX_SQL Type Library
Then you can use the methods and properties exposed. A simple call to create an instance of the server object within Visual Basic is as follows:
Dim mylog As TWXLogger
Set mylog = CreateObject("Iconics.TWXLogger.1")
The Data Logger exposes the following OLE automation methods and properties:
• bstrDBaseGroupName: Refers to the database group name, as it would appear in the Configurator database.
• bstrGroupName: Refers to the logging group name, as it would appear in the Configurator database.
• lConfigID: Refers to the configuration ID, as it would appear in the Configurator database.
• bstrConfigurationName: Refers to the configuration name, as it would appear in the Configurator database, corresponding to the "lConfigID."
• bstrODBCConnString: Refers to the ODBC connection string passed to the OLE DB provider for ODBC, as it would appear in the Configurator database.
• bstrOLEDBConnString: Refers to the OLE DB connection string passed to the OLE DB provider for Microsoft Access, Microsoft SQL Server (MSDE), or Oracle, as it would appear in the Configurator database.
• bstrConnectionString: Refers to the OLE DB connection string passed to the OLE DB provider for Microsoft Access used in establishing a configuration database connection for the TrendWorX32 SQL Data Logger.
Note: The "SwitchDatabase" method call can be used while during data logging to perform a hot database switch operation with the option to redirect pending writes to the new database connection. If the Data Logger cannot establish a database schema information on the new database, or the new database type requires more Client Units, which are not available due to the current level of ICONICS Licensing, this operation will fail.
ICONICS 64
OPC HDA COM Interface The TrendWorX32 SQL Data Logger Version 7.x was updated to be compliant with the latest OPC HDA specification. In general, the OPC HDA specification is an extended OPC specification, which includes an increased number of interfaces and methods, not all of them being mandatory.
Critical Note: Because of the compliance changes in historical replay and reporting, version 7.x or later historical replay or reporting may not produce identical results to existing 6.1x version reports and or historical replay screen captures for the same signals and time periods.
In addition to the Data Logger interface, the TrendWorX32 SQL Data Logger also implements the OPC Historical Data Access (HDA) interface. The following interfaces and methods are supported, including connection point support.
Version 7.x included an enhanced data-retrieval system, which utilizes a new approach to creating historical reports. The following is a summary of the changes for version 7.x:
• Data filter selection other than Raw will result in data time stamped at the beginning of each subinterval.
• When retrieving data using data filters other than Raw, subintervals for which there are no data because of no data-logging activity will be marked as “empty” slots at the corresponding time with an empty (VT_EMPTY) value. You can check the returned qualities for further processing.
• The historical qualities supported are as follows:
o OPCHDA_EXTRADATA 0x0001
More data may exist
o OPCHDA_INTERPOLATED 0x0002
Interpolated data value
o OPCHDA_RAW 0x0004
Raw data value
o OPCHDA_CALCULATED 0x0008
Calculated data value
o OPCHDA_NOBOUND 0x0010
No data found to provide upper or lower bound
o OPCHDA_NODATA 0x0020
No data collected. Archiving not active
o OPCHDA_DATALOST 0x0040
Calculation started/stopped/lost
o OPCHDA_CONVERSION 0x0080
Scaling / conversion error
o OPCHDA_PARTIAL 0x0100
Aggregate value is for an incomplete interval
ICONICS 65
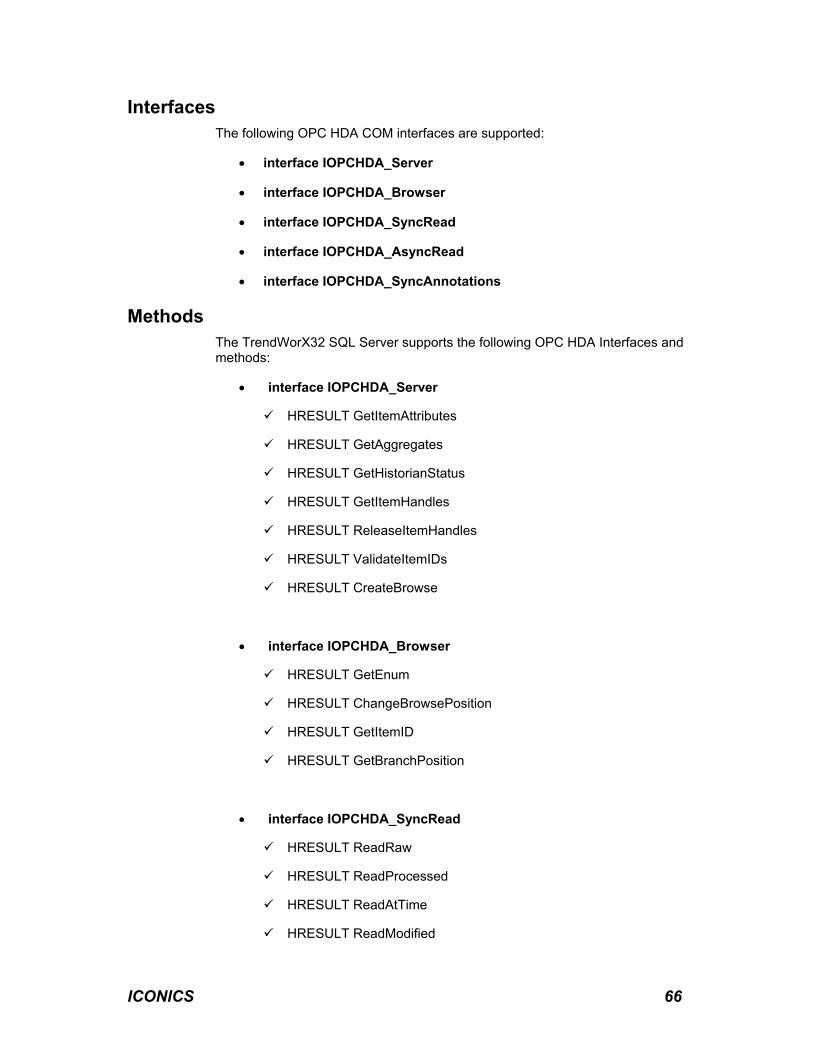
Interfaces The following OPC HDA COM interfaces are supported:
• interface IOPCHDA_Server
• interface IOPCHDA_Browser
• interface IOPCHDA_SyncRead
• interface IOPCHDA_AsyncRead
• interface IOPCHDA_SyncAnnotations
Methods The TrendWorX32 SQL Server supports the following OPC HDA Interfaces and methods:
• interface IOPCHDA_Server
HRESULT GetItemAttributes
HRESULT GetAggregates
HRESULT GetHistorianStatus
HRESULT GetItemHandles
HRESULT ReleaseItemHandles
HRESULT ValidateItemIDs
HRESULT CreateBrowse
• interface IOPCHDA_Browser
HRESULT GetEnum
HRESULT ChangeBrowsePosition
HRESULT GetItemID
HRESULT GetBranchPosition
• interface IOPCHDA_SyncRead
HRESULT ReadRaw
HRESULT ReadProcessed
HRESULT ReadAtTime
HRESULT ReadModified
ICONICS 66
HRESULT ReadAttribute
• interface IOPCHDA_AsyncRead
HRESULT ReadRaw
HRESULT ReadProcessed
HRESULT ReadAtTime
HRESULT ReadModified
HRESULT ReadAttribute
HRESULT Cancel
• interface IOPCHDA_SyncAnnotations
HRESULT QueryCapabilities
HRESULT Read
HRESULT Insert
ICONICS 67
MSDE Support TrendWorX32 SQL Data Logger supports MSDE (Microsoft Data Engine), which is a fully compatible Microsoft SQL Server engine, with the following limitations:
• The maximum database size is 2 GB.
• Performance may decrease if more than five connections are open to the database.
MSDE has the full core server functionality of Microsoft SQL Server, and MSDE databases can easily be upgraded to full Microsoft SQL Server databases. To install MSDE, you can use the GENESIS32 MSDE Manager or browse the GENESIS32 CD to get to the Tools folder, which has both MSDE 7.0 and MSDE 2000 installations.
The "setup.exe" can be used to install MSDE, create an empty database, and verify installation. Once you install MSDE, you should create an ODBC data source associated with this database. The key advantages of MSDE include:
• Fully compatible Microsoft SQL Server database engine
• Central and dynamic memory management across all database connections
• On-the-fly index maintenance and management
• Optimized query processing
• Automatic database space management
• Microsoft SQL Server database upgrade path
• Ability to use Microsoft Access 2000 as a front-end configuration tool
Note: Since MSDE has intelligent online maintenance features, including database expansion and contraction, it is recommended that physical writes to the database be spread over time to allow for better performance. For example, when the data-collection rate is 5 seconds, writing to disk can be set to 30 seconds (or every six samples).
Refer to the GENESIS32 MSDE Manager Help documentation for additional information.
ICONICS 68
Running TrendWorX32 SQL Data Logger As an NT Service You can register and run the TrendWorX32 SQL Data Logger as an NT Service. When TrendWorX32 SQL Data Logger is installed and running as a service, its functionality is modified with respect to the case where it is registered as a stand-alone COM server.
In general, TrendWorX32 SQL Data Logger can be registered and run as an NT service (under Windows NT and Windows 2000) as well as a stand-alone COM server. However, the following differences apply:
1. There will be only one instance (per node) of TrendWorX32 SQL Data Logger running under any condition.
2. If TrendWorX32 SQL Data Logger runs as stand-alone COM server:
• If it is started from the desktop and clients are connected to it, and if the user (through the application menus) chooses to exit, TrendWorX32 SQL Data Logger will "hide" its window, but will keep serving its clients. When the last client goes away, TrendWorX32 SQL Data Logger will shut down.
• If you try to double-click on TrendWorX32 SQL Data Logger executable from the Windows desktop while its application window is not visible and clients are connected to it, TrendWorX32 SQL Data Logger will not launch a second application instance, but it will show the existing window and, from there, it will close only from the menus.
3. If the TrendWorX32 SQL Data Logger is registered and running as an NT service:
• It will use as the service display name the "OEM" product name (if available).
• If you double-click on TrendWorX32 SQL Data Logger executable, it will not launch a second instance.
• Once TrendWorX32 SQL Data Logger starts as an NT Service, it will go into runtime (data logging) mode.
To configure TrendWorX32 SQL Data Logger to run as an NT Service, do the following:
1. Install GENESIS32 or TrendWorX32.
2. Use the TrendWorX32 Logger Configurator to configure your data-logging application.
3. Use the TrendWorX32 Logger Configurator to test data logging.
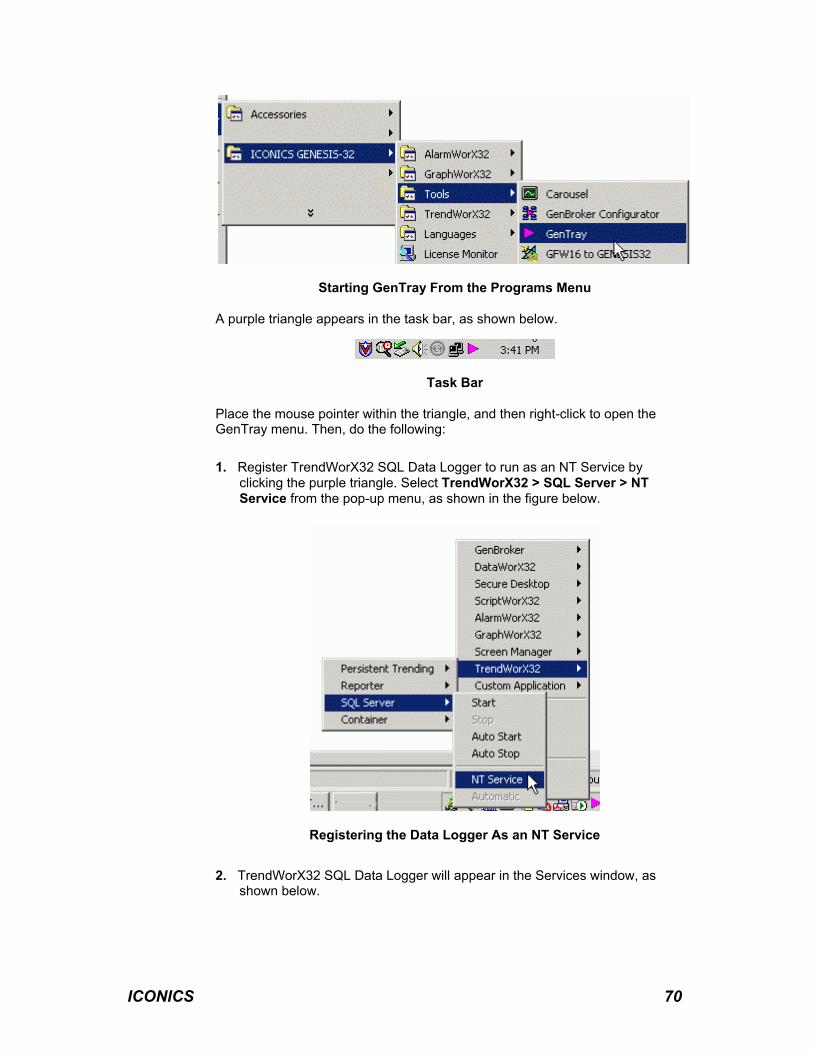
4. Once the application setup is completed, use the GenTray to register TrendWorX32 SQL Data Logger as an NT Service. To do this, start GenTray from the ICONICS GENESIS32 program group, under the Tools menu, as shown below.
ICONICS 69
Starting GenTray From the Programs Menu
A purple triangle appears in the task bar, as shown below.
Task Bar
Place the mouse pointer within the triangle, and then right-click to open the GenTray menu. Then, do the following:
1. Register TrendWorX32 SQL Data Logger to run as an NT Service by clicking the purple triangle. Select TrendWorX32 > SQL Server > NT Service from the pop-up menu, as shown in the figure below.
Registering the Data Logger As an NT Service
2. TrendWorX32 SQL Data Logger will appear in the Services window, as shown below.
ICONICS 70
Services Window
3. Use GenTray to set TrendWorX32 SQL Data Logger to start automatically as an NT service the next time the PC is rebooted. Click the purple triangle in the task bar. This opens a pop-up menu, as shown below. Select TrendWorX32 > SQL Server > Automatic from the pop-up menu, as shown in the figure below.
Automatic Setting in GenTray
When running the TrendWorX32 SQL Data Logger as an NT Service, special consideration must be given to ensure that, when it starts up as an NT service, TrendWorX32 SQL Data Logger has rights to access the database where the historical data logging will take place. When using GenTray to register TrendWorX32 SQL Data Logger as an NT Service, it is configured to run under the local system account. If remote historical replay is to be used, it may require adjusting DCOM settings for the account under which TrendWorX32 SQL Data
ICONICS 71
Logger will run as an NT Service, as well as adding rights to the historical database for the specific account. This can be done by having TrendWorX32 SQL Data Logger run in the context of a dedicated account and making sure that the same account has access to the database. (In the case of Microsoft SQL it will need to have database administrator rights to the historical database). The above account also must have rights to log in to the target client PC, where the historical replay will take place.