43
Brian Brazil Founder Your data is in Prometheus, now what?
| Date post: | 15-Apr-2017 |
| Category: |
Internet |
| Upload: | brian-brazil |
| View: | 1,995 times |
| Download: | 0 times |

Brian BrazilFounder
Your data is in Prometheus, now what?
Who am I?Engineer passionate about running software reliably in production.
● TCD CS Degree● Google SRE for 7 years, working on high-scale reliable systems such as
Adwords, Adsense, Ad Exchange, Billing, Database● Boxever TL Systems&Infrastructure, applied processes and technology to let
allow company to scale and reduce operational load● Contributor to many open source projects, including Prometheus, Ansible,
Python, Aurora and Zookeeper.● Founder of Robust Perception, making scalability and efficiency available to
everyone
Why monitor?
● Know when things go wrong○ To call in a human to prevent a business-level issue, or prevent an issue in advance
● Be able to debug and gain insight● Trending to see changes over time, and drive technical/business decisions● To feed into other systems/processes (e.g. QA, security, automation)
What is a time series?The value of something tracked over time.
For example temperature once a day, or requests to your API once a minute.
For example
my_api_requests: 5@1:00PM 2@1:01PM 18@1:02PM

What is a time series database?Simply put, a database for storing multiple time series.
It can optimise for the fact that many consecutive points in a time series will be requested at once, and patterns in the data also aid compression.
May also have some in-built aggregation and downsampling functions.
Also often used to refer to any system that can store data with a time-element, such as event logs (e.g. ELK stack). Not really a time series database in this form.
Monitoring?Lots of information about your system could be thought of in terms of time series, for example:
How many users are currently online?
How much disk is machine X using?
What's the average request latency?
How many requests are failing?

PrometheusInspired by Google’s Borgmon monitoring system.
Started in 2012 by ex-Googlers working in Soundcloud as an open source project, mainly written in Go. Publically launched in early 2015, and continues to be independent of any one company.
Over 100 companies have started relying on it since then.
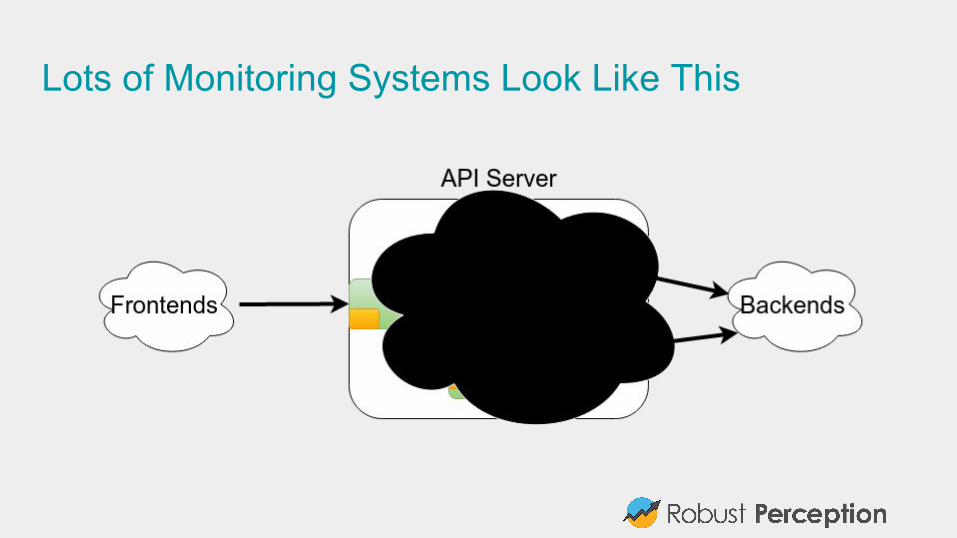
Lots of Monitoring Systems Look Like This
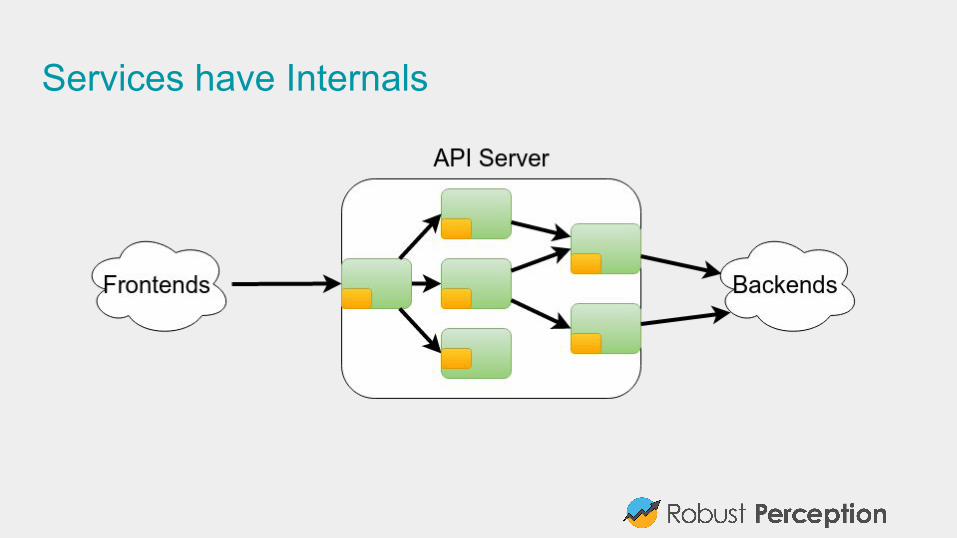
Services have Internals
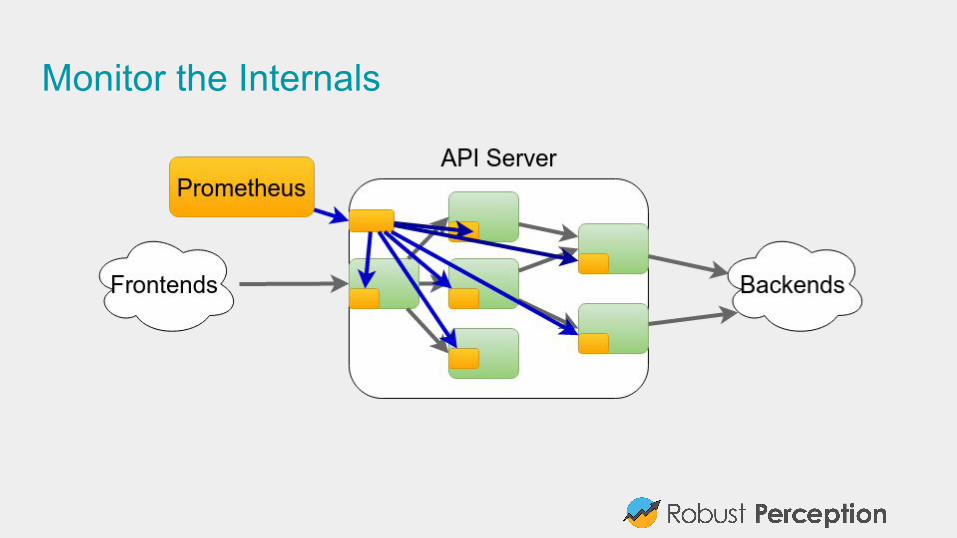
Monitor the Internals
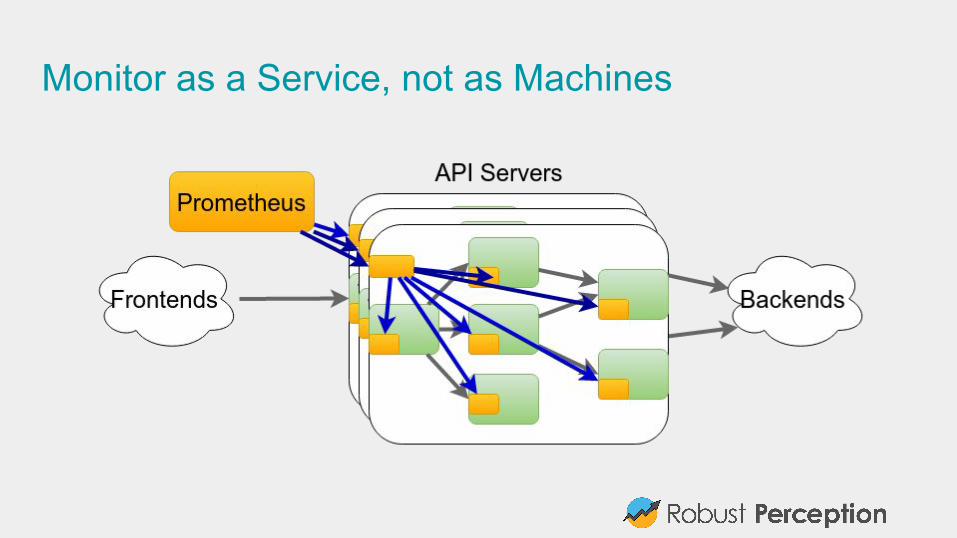
Monitor as a Service, not as Machines
Put another way...Prometheus is about pulling in lots of information about lots of instances of a service.
This is all tracked and stored over time, allowing for analysis.
Prometheus at it's core is a time series database.
Distinguishing TimeseriesPrometheus doesn’t use dotted.strings like metric.fintech.dublin.
Multi-dimensional labels instead like metric{industry=”fintech”,city=”dublin”}
Can aggregate, cut, and slice along them.
Can come from instrumentation, or be added based on the service you are monitoring.
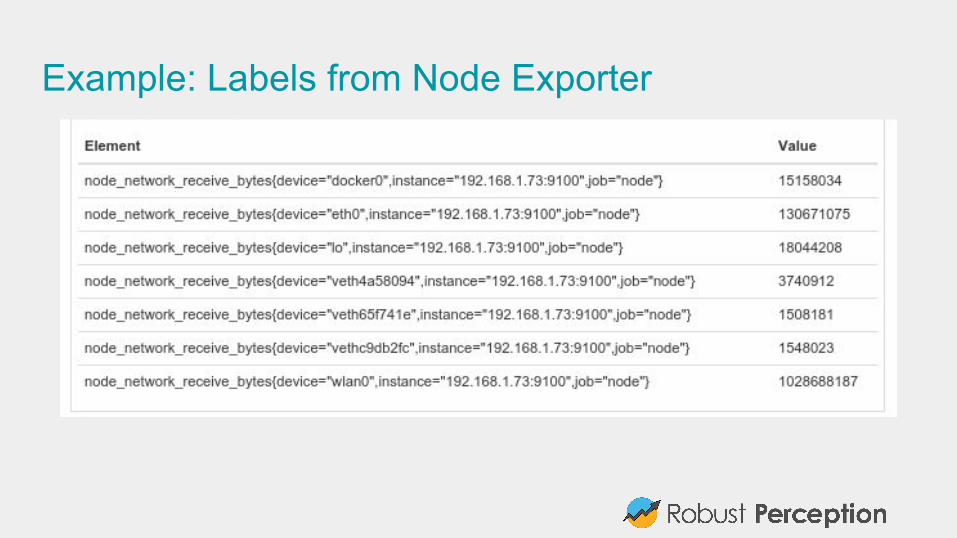
Example: Labels from Node Exporter
Instrumentation made easyPrometheus clients don’t just marshall data.
They take care of the nitty gritty details like concurrency and state tracking.
We take advantage of the strengths of each language.
In Python for example that means context managers and decorators.

Python Instrumentation Examplepip install prometheus_client
from prometheus_client import Summary, start_http_serverREQUEST_DURATION = Summary('request_duration_seconds', 'Request duration in seconds')
@REQUEST_DURATION.time()def my_handler(request): pass # Your code here
start_http_server(8000)
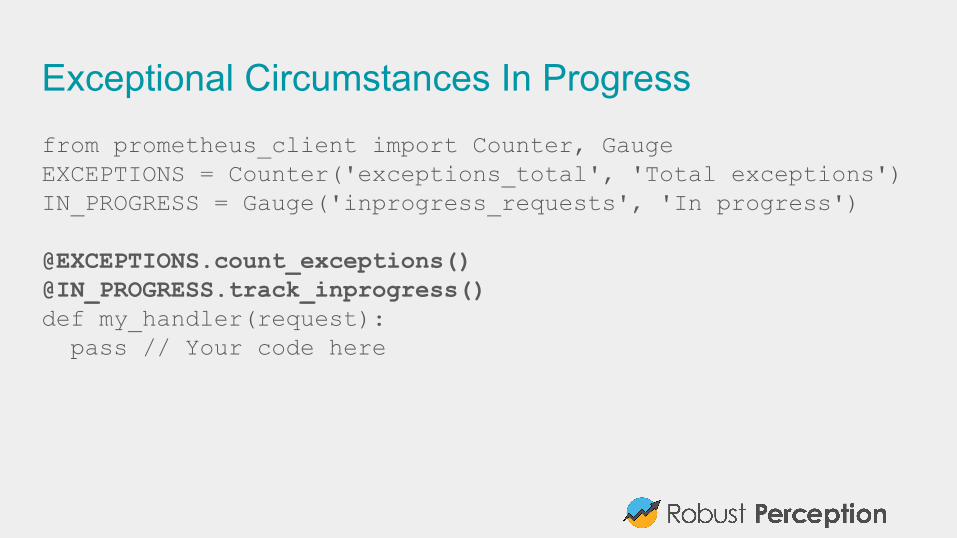
Exceptional Circumstances In Progressfrom prometheus_client import Counter, GaugeEXCEPTIONS = Counter('exceptions_total', 'Total exceptions')IN_PROGRESS = Gauge('inprogress_requests', 'In progress')
@EXCEPTIONS.count_exceptions()@IN_PROGRESS.track_inprogress()def my_handler(request): pass // Your code here
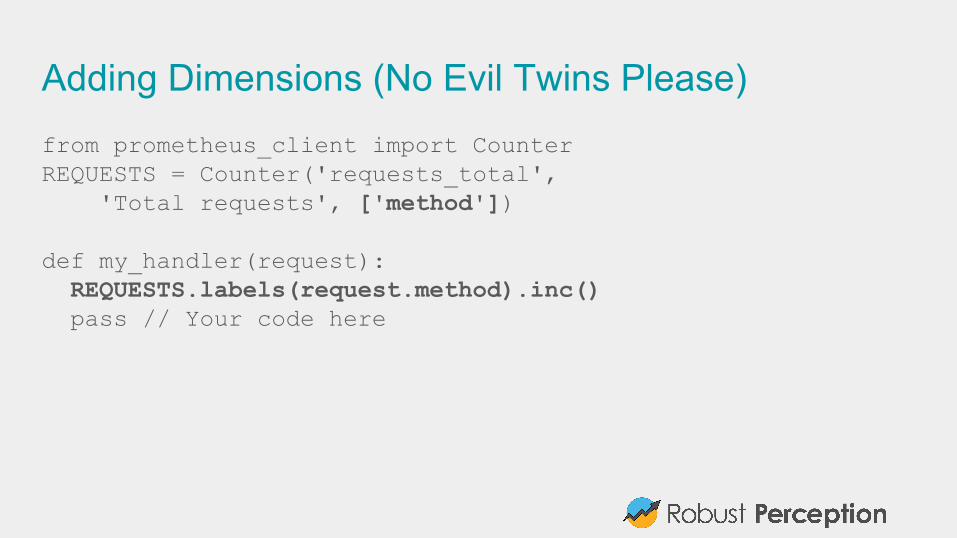
Adding Dimensions (No Evil Twins Please)from prometheus_client import CounterREQUESTS = Counter('requests_total', 'Total requests', ['method'])
def my_handler(request): REQUESTS.labels(request.method).inc() pass // Your code here

Inclusive MonitoringDon’t monitor just at the edges:
● Instrument client libraries● Instrument server libraries (e.g. HTTP/RPC)● Instrument business logic
Library authors get information about usage.
Application developers get monitoring of common components for free.
Dashboards and alerting can be provided out of the box, customised for your organisation!

Open ecosystemPrometheus client libraries don’t tie you into Prometheus.
For example the Python and Java clients can output to Graphite, with no need to run any Prometheus components.
This means that you as a library author can instrument with Prometheus, and your users with just a few lines of code can output to whatever monitoring system they want. No need for users to worry about a new standard.
This can be done incrementally.
It goes the other way tooIt’s unlikely that everyone is going to switch to Prometheus all at once, so we’ve integrations that can take in data from other monitoring systems and make it useful.
Graphite, Collectd, Statsd, SNMP, JMX, Dropwizard, AWS Cloudwatch, New Relic, Rsyslog and Scollector (Bosun) are some examples.
Prometheus and its client libraries can act a clearinghouse to convert between monitoring systems.
For example Zalando’s Zmon uses the Python client to parse Prometheus metrics from directly instrumented binaries such as the Node exporter.

CountersOne type of time series Prometheus has is a Counter
It only goes up
If we miss a scrape, it's still possible to see what the increase was during that period - lose granularity, not data. Other systems push diffs, not as reliable.
The rate() function also handles resets
Powerful Query LanguageCan multiply, add, aggregate, join, predict, take quantiles across many metrics in the same query. Can evaluate right now, and graph back in time.
Answer questions like:
● What’s the 95th percentile latency in the European datacenter?● How full will the disks be in 4 hours?● Which services are the top 5 users of CPU?
Can alert based on any query.
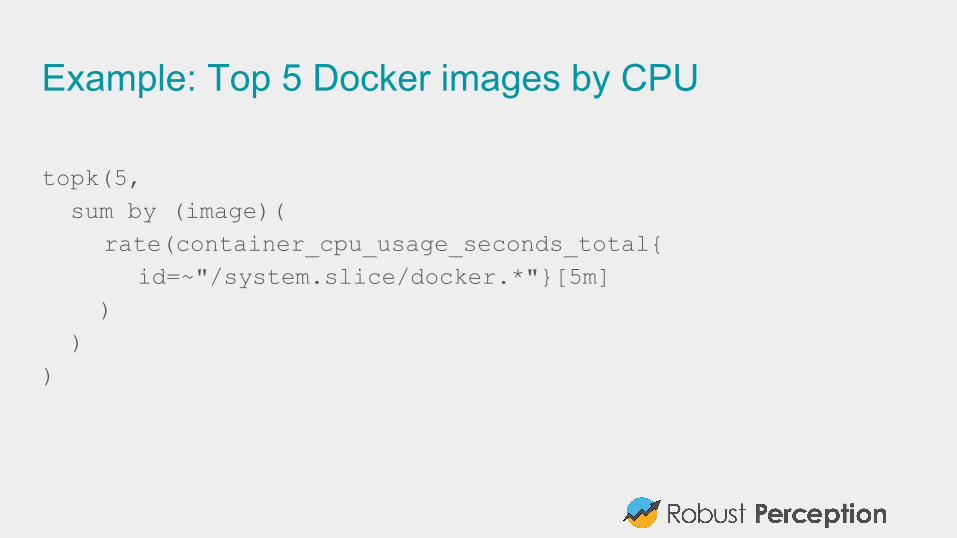
Example: Top 5 Docker images by CPU
topk(5, sum by (image)(
rate(container_cpu_usage_seconds_total{id=~"/system.slice/docker.*"}[5m]
) ))
Manageable and ReliableCore Prometheus server is a single binary.
Doesn’t depend on Zookeeper, Consul, Cassandra, Hadoop or the Internet.
Only requires local disk (SSD recommended). No potential for cascading failure.
Pull based, so easy to on run a workstation for testing and rogue servers can’t push bad metrics.
State not event based, so network blips only lose resolution - not data.
Advanced service discovery finds what to monitor.

ScalablePrometheus is easy to run, can give one to each team in each datacenter.
Federation allows pulling key metrics from other Prometheus servers.
When one job is too big for a single Prometheus server, can use sharding+federation to scale out. Needed with thousands of machines.
Easy to integrate withMany existing integrations: Java, JMX, Python, Go, Ruby, .Net, Machine, Cloudwatch, EC2, MySQL, PostgreSQL, Haskell, Bash, Node.js, SNMP, Consul, HAProxy, Mesos, Bind, CouchDB, Django, Mtail, Heka, Memcached, RabbitMQ, Redis, RethinkDB, Rsyslog, Meteor.js, Minecraft...
Graphite, Statsd, Collectd, Scollector, Munin, Nagios integrations aid transition.
It’s so easy, most of the above were written without the core team even knowing about them!
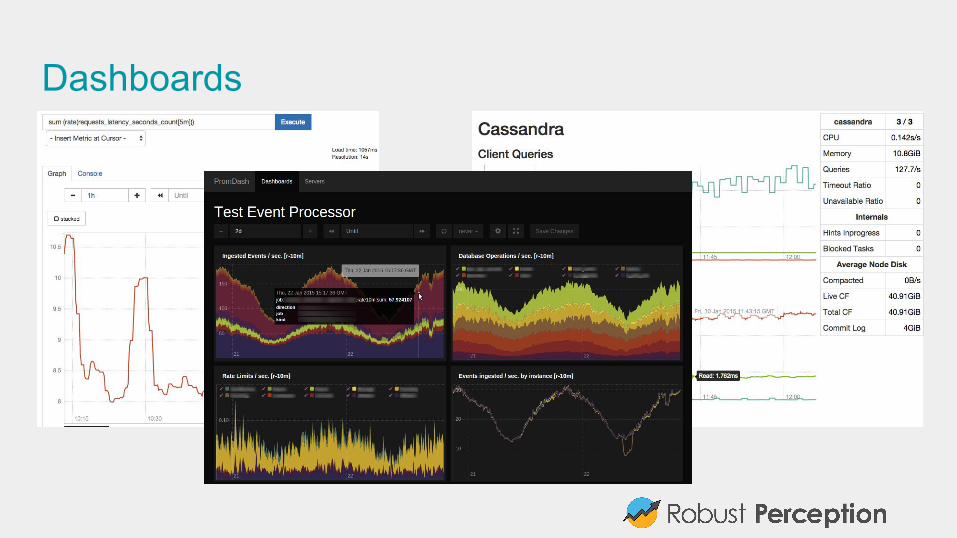
Dashboards

What to do with time series?With potentially millions of time series across your system, can be difficult to know what is and isn't useful.
What approaches help manage this complexity?
How do you avoid getting caught out?

#1: Choose your key statisticsUsers don't care that one of your machines is short of CPU.
Users care if the service is slow or throwing errors.
For your primary dashboards focus on high-level metrics that directly impact users.
#2: Use aggregationsThink about services, not machines.
Once you have more than a handful of machines, you should treat them as an amorphous blob.
Looking at the key statistics is easier for 10 services, than 10 services each of which is on 10 machines
Once you have isolated a problem to one service, then can see if one machine is the problem
#3: Avoid the Wall of GraphsDashboards tend to grow without bound. Worst I've seen was 600 graphs.
It might look impressive, but humans can't deal with that much data at once.(and they take forever to load)
Your services will have a rough tree structure, have a dashboard per service and talk the tree from the top when you have a problem. Similarly for each service, have dashboards per subsystem.
Rule of Thumb: Limit of 5 graphs per dashboard, and 5 lines per graph.

#4: Client-side quantiles aren't aggregatableMany instrumentation systems calculate quantiles/percentiles inside each process, and export it to the TSDB.
It is not statistically possible to aggregate these.
If you want meaningful quantiles, you should track histogram buckets in each process, aggregate those in your monitoring system and then calculate the quantile.
This is done using histogram_quantile() and rate() in Prometheus.
#5: Averages are easy to reason aboutQ: Say you have a service with two backends. If 95th percentile latency goes up due to one of the backends, what will you see in 95th percentile latency for that backend?
A: ?

#5: Averages are easy to reason aboutQ: Say you have a service with two backends. If 95th percentile latency goes up due to one of the backends, what will you see in 95th percentile latency for that backend?
A: It depends, could be no change. If the latencies are strongly correlated for each request across the backends, you'll see the same latency bump.
This is tricky to reason about, especially in an emergency.
Averages don't have this problem, as they include all requests.

#6: Costs and Benefits1s resolution monitoring of all metrics would be handy for debugging.
But is it ten time more valuable than 10s monitoring? And sixty times more valuable than 60s monitoring?
Monitoring isn't free. It costs resources to run, and resources in the services being monitored too. Quantiles and histograms can get expensive fast.
60s resolution is generally a good balance. Reserve 1s granularity or a literal handful of key metrics.

#7: Nyquist-Shannon Sampling TheoremTo reconstruct a signal you need a resolution that's at least double it's frequency.
If you've got a 10s resolution time series, you can't reconstruct patterns that are less than 20s long.
Higher frequency patterns can cause effects like aliasing, and mislead you.
If you suspect that there's something more to the data, try a higher resolution temporarily or start profiling.
#8: Correlation is not CausationLet's play a game called 2 4 6
I have a rule, and if you give me a sequence of numbers I'll tell you if it conforms to the rule. Can you figure out the rule?
(If you've played this before, don't spoil it)

#8: Correlation is not Causation - Confirmation BiasHumans are great at spotting patterns. Not all of them are actually there.
Always try to look for evidence that'd falsify your hypothesis.
If two metrics seem to correlate on a graph that doesn't mean that they're related.
They could be independent tasks running on the same schedule.Or if you zoom out there plenty of times when one spikes but not the other.Or one could be causing a slight increase in resource contention, pushing the other over the edge.

#9 Have a way to deal with non-critical alertsMost alerts don't justify waking up someone at night, but someone needs to look at them sometime.
Often they're sent to a mailing list, where everyone promptly filters them away.
Better to have some form of ticketing system that'll assign a single owner for each alert.
A daily email with all firing alerts that the oncall has to process can also work.

Final Word
It's easy to get in over your head when starting to appreciate to power of time series monitoring.
The one thing I'd say is to Keep it Simple.
Just like anything else, more complex doesn't automatically mean better.
What do we do?Robust Perception provides consulting and training to give you confidence in your production service's ability to run efficiently and scale with your business.
We can help you:
● Decide if Prometheus is for you● Manage your transition to Prometheus and resolve issues that arise● With capacity planning, debugging, infrastructure etc.
We are proud to be among the core contributors to the Prometheus project.
ResourcesOfficial Project Website: prometheus.io
Official Mailing List: [email protected]
Demo: demo.robustperception.io
Robust Perception Website: www.robustperception.io
Queries: [email protected]


