364
Your progressive partner Annual Report 2014 Hatton National Bank PLC

HA
TT
ON
NA
TIO
NA
L BA
NK
PLC –
AN
NU
AL R
EPOR
T 20
14
Your progressive
partnerAnnual Report 2014
Hatton National Bank PLC

Read the report online atwww.hnb.lk
SOARING INTO THE FUTURE. OUR RELATIONSHIPS GO FAR BEYOND
THE DAY-TO-DAY TRANSACTIONS WE DO; BEYOND THE IMMEDIATE
CONCERNS OF PROFITABILITY AND REVENUE.
IN SHORT, BEYOND BANKING.

Hatton National Bank is known to our many customers as their partner in progress. For over a century, we have brought financial security and trust to ordinary people’s lives through ground-breaking savings products like Pathum Vimana while projects such as Gami Pubuduwa have created wide-ranging livelihood opportunities for diverse communities throughout rural Sri Lanka.
Our 126 year history has seen us grow in multiple ways; in size, speed, strength and stability and with innovative new banking technologies through which we reach some of the remotest regions of the country. Today we are a bank that has steadily evolved along with the changing needs of the generations of Sri Lankans we serve. Our relationships go far beyond the day-to-day transactions we do; beyond the immediate concerns of profitability and revenue.
In short, relationships that transcend beyond banking.
This is how we have acquired the formidable stature we possess today as Sri Lanka’s most progressive bank, holding the loyalty and trust of thousands of stakeholders from all across the island.
Yourprogressive
partner

Hatton National Bank PLC2
To be the acknowledged leader and chosen partner in providing financial solutions through inspired people
VISION
Combining entrepreneurial spirit with empowered people and leading edge technology to constantly exceed stakeholder expectations
MISSION
• Treasure professional and personal integrity at all times• Demonstrate mutual respect in all our interactions• Passionate about everything we do • Committed to being customer centric• Courage to change, challenge and be different• Demonstrate unity in diversity
OUR VALUES
G4-56GRI G4 Key Performance Indicator
Annual Report 2014 3
Vision Mission 2Financial Highlights & Financial Goals / Performance 4The Story of HNB 6Accolades in 2014 8Operational Highlights 10Chairperson’s Message 12Managing Director’s Review of Operations 16Board of Directors 22Corporate Management 28Senior Management Team 30
Financial Calendar 194Chief Executive Officer’s and Chief Financial Officer’s Responsibility Statement 195Directors’ Responsibility for Financial Reporting 196Independent Auditors’ Report 197Income Statement 198Statement of Other Comprehensive Income 199Statement of Financial Position 200Statement of Changes in Equity 201Statement of Cash Flows 204Notes to the Financial Statements 206Compliance with Other Disclosure Requirements 324
Integrated Management Discussion & Analysis 34Reporting Parameters 34Introduction 38Formulating business strategy 38 Stakeholder Engagement 56Global economic environment: On the recovery track 59Sri Lankan Economy 61Banking Industry 63Outlook 64Financial and Operational Performance Review 65Performanceo of the Subsidiaries 87Deriving and Delivering Value with Our Human Capital 90Our Triple Bottom Line Approach for Sustainable Profitability 100GRI G4 Content Index 107
Independent Assurance Report 112
Your Board Room Governance Report 114Directors’ Statement on Internal Control 146Independent Assurance Report 148Human Resources & Remuneration Committee Report 149Nomination Committee Report 150Board Integrated Risk Management Committee Report 152Board Audit Committee Report 154Annual Report of the Board of Directors on the Affairs of the Company 156Directors’ Interest in Contracts with the Bank 166Risk Management 169Computation of Capital Adequacy Ratio 190
Income Statement in US Dollars 327Statement of Other Comprehensive Income in US Dollars 328Statement of Financial Position in US Dollars 329Analysis of Deposits 330Analysis of Loans and Receivables 331Province-wise Analysis of Deposits and Advances 332Sources and Utilisation of Income 333Value Added Statement 334Ten Year Statistical Summary 335Quarterly Statistics 336
Segmental Analysis 337Investor Relations 338Glossary of Financial / Banking Terms 346Notice of Meeting 352Form of Proxy [Voting] 355Form of Proxy [Non-Voting] 358Investor Feedback Form 359
ContentsAbout the Bank
Financial Reports Supplementary Information
Management Reports Governance Reports
Hatton National Bank PLC4
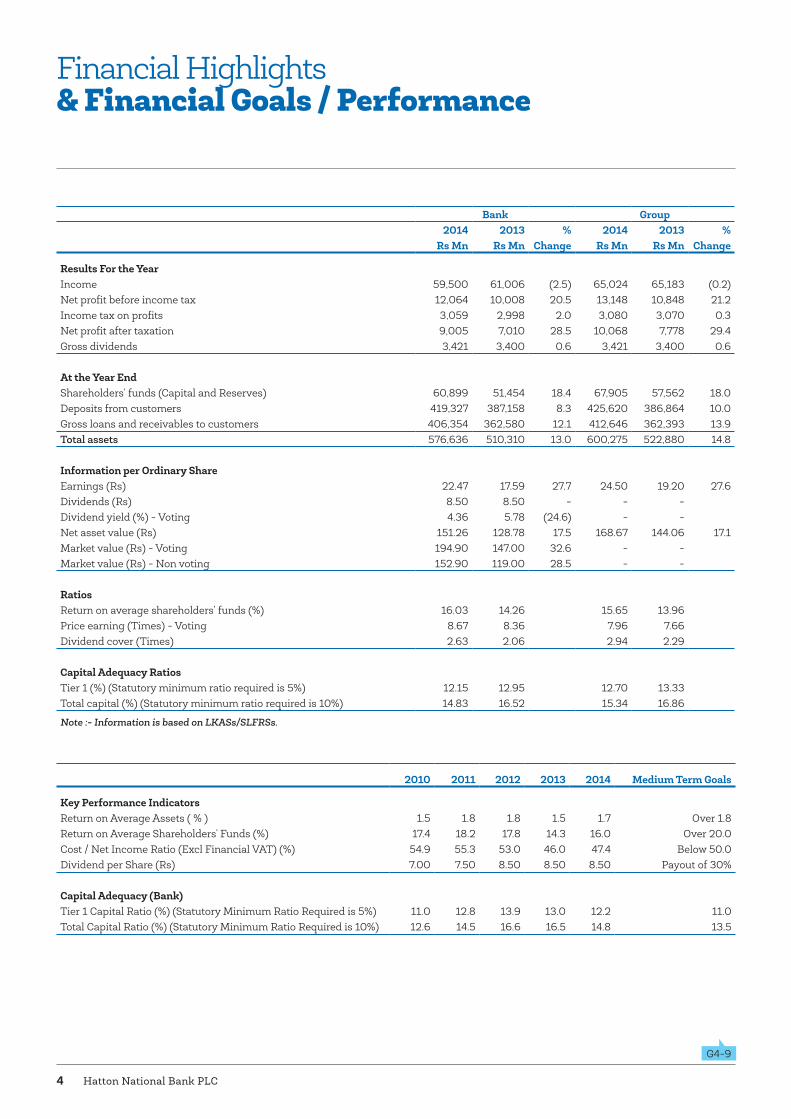
Financial Highlights& Financial Goals / Performance
Bank Group2014 2013 % 2014 2013 %
Rs Mn Rs Mn Change Rs Mn Rs Mn Change
Results For the YearIncome 59,500 61,006 (2.5) 65,024 65,183 (0.2)Net profit before income tax 12,064 10,008 20.5 13,148 10,848 21.2 Income tax on profits 3,059 2,998 2.0 3,080 3,070 0.3 Net profit after taxation 9,005 7,010 28.5 10,068 7,778 29.4 Gross dividends 3,421 3,400 0.6 3,421 3,400 0.6
At the Year EndShareholders’ funds (Capital and Reserves) 60,899 51,454 18.4 67,905 57,562 18.0 Deposits from customers 419,327 387,158 8.3 425,620 386,864 10.0 Gross loans and receivables to customers 406,354 362,580 12.1 412,646 362,393 13.9 Total assets 576,636 510,310 13.0 600,275 522,880 14.8
Information per Ordinary ShareEarnings (Rs) 22.47 17.59 27.7 24.50 19.20 27.6 Dividends (Rs) 8.50 8.50 - - - Dividend yield (%) - Voting 4.36 5.78 (24.6) - - Net asset value (Rs) 151.26 128.78 17.5 168.67 144.06 17.1 Market value (Rs) - Voting 194.90 147.00 32.6 - - Market value (Rs) - Non voting 152.90 119.00 28.5 - -
RatiosReturn on average shareholders’ funds (%) 16.03 14.26 15.65 13.96 Price earning (Times) - Voting 8.67 8.36 7.96 7.66 Dividend cover (Times) 2.63 2.06 2.94 2.29
Capital Adequacy RatiosTier 1 (%) (Statutory minimum ratio required is 5%) 12.15 12.95 12.70 13.33 Total capital (%) (Statutory minimum ratio required is 10%) 14.83 16.52 15.34 16.86
Note :- Information is based on LKASs/SLFRSs.
2010 2011 2012 2013 2014 Medium Term Goals
Key Performance IndicatorsReturn on Average Assets ( % ) 1.5 1.8 1.8 1.5 1.7 Over 1.8Return on Average Shareholders' Funds (%) 17.4 18.2 17.8 14.3 16.0 Over 20.0Cost / Net Income Ratio (Excl Financial VAT) (%) 54.9 55.3 53.0 46.0 47.4 Below 50.0Dividend per Share (Rs) 7.00 7.50 8.50 8.50 8.50 Payout of 30%
Capital Adequacy (Bank)Tier 1 Capital Ratio (%) (Statutory Minimum Ratio Required is 5%) 11.0 12.8 13.9 13.0 12.2 11.0 Total Capital Ratio (%) (Statutory Minimum Ratio Required is 10%) 12.6 14.5 16.6 16.5 14.8 13.5
G4-9

Annual Report 2014 5
16.0%
1.7%
ROE
ROA
10
3.16%
Rupees BillionGROUP PAT
GROUP ASSETS
Rupees Billion
COST /INCOME 47%

Hatton National Bank PLC6
Achievements
1888
Achievements
1971
Achievements
1989
Achievements
1970
Achievements
1993
Achievements
2001Established as ‘Hatton Bank’ to cater to the
booming tea industry
Incorporated as Hatton National Bank
subsequent to the acquisition of the local
operation of National Grindlays Bank
Launched the flagship brand ‘Pathum Vimana’ the first ever savings product with a reward scheme
Launched the world renowned microfinance operation ‘Gami Pubuduwa’ to cater to the grass root level contributing towards the nations goal of enhancing financial inclusion
Listed at the Colombo Stock Exchange
Set up the insurance subsidiary ‘HNB
Assurance’
OVER 125 YEARS OF EXPERIENCE HAVE GIVEN US THE CONFIDENCE TO FLY EVEN HIGHER IN THE YEARS AHEAD.
Annual Report 2014 7
Achievements
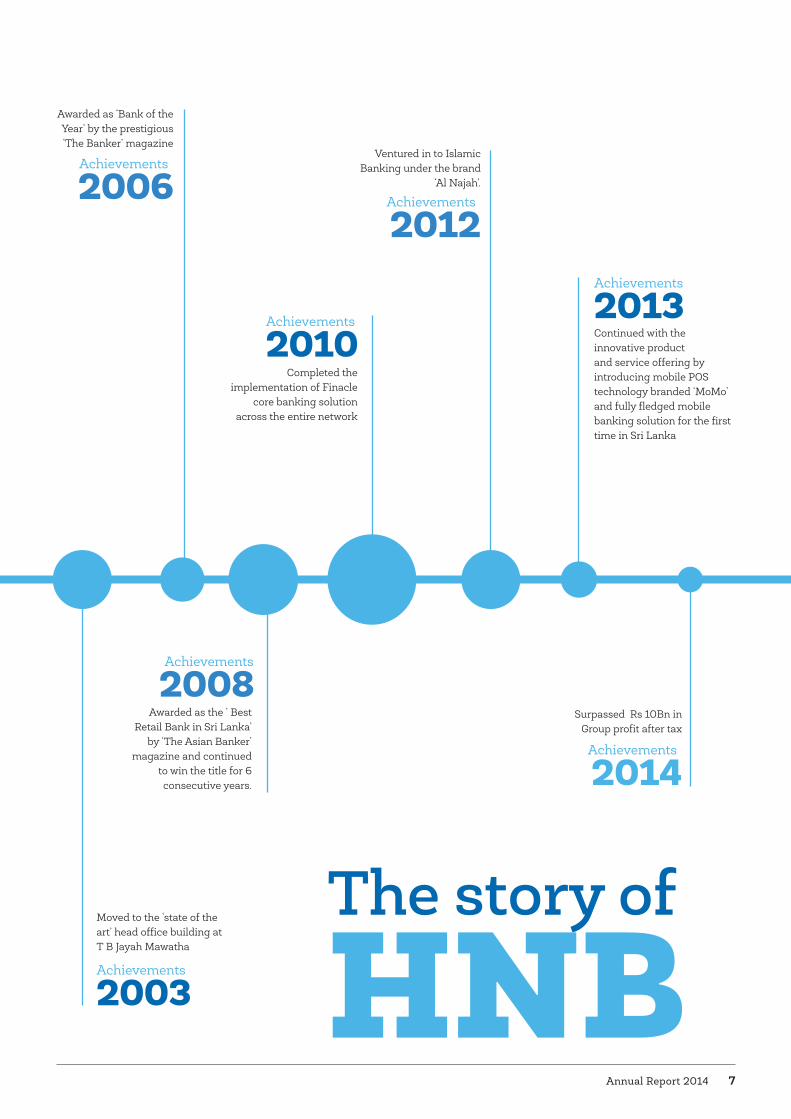
2003
Achievements
2006
Achievements
2010
Achievements
2013
Achievements
2008Achievements
2014
Achievements
2012
Moved to the ‘state of the art’ head office building at T B Jayah Mawatha
Completed the implementation of Finacle
core banking solution across the entire network
Continued with the innovative product and service offering by introducing mobile POS technology branded ‘MoMo’ and fully fledged mobile banking solution for the first time in Sri Lanka
Ventured in to Islamic Banking under the brand
‘Al Najah’.
Awarded as the ‘ Best Retail Bank in Sri Lanka’
by ‘The Asian Banker’ magazine and continued
to win the title for 6 consecutive years.
Surpassed Rs 10Bn in Group profit after tax
Awarded as ‘Bank of the Year’ by the prestigious ‘The Banker’ magazine

Hatton National Bank PLC8
ACCOLADESIN 2014
Ranked 5th in the Business Today Top 25
Global Commerce Excellence award in association with CBSL
Brand leadership award for Development Communication at the Global Brand Excellence Awards
Overall Brand Leadership Award at the Global Brand Excellence Awards
Ranked as the 5th most valuable brand in Sri Lanka by Brand Finance Lanka with a brand rating of AA+
Gold award for the ‘Emerging Islamic Finance Entity of the year’ by the Islamic Banking Unit for 2013/2014 at the Sri Lanka Islamic Banking and Finance Institute (SLBFI) Awards 2014
Overall Award for ‘Best Results Based Training’ at the Asia’s Training & Development Excellence Awards 2014 organised by the World HRD Congress
Award for Talent Management at the Asia’s Best Employer Brand Awards 2014 organised by the World HRD Congress
Merit Awards for ‘Talent Management’ and ‘People Development’ at the National HR Excellence Awards
Ranked amongst the ‘Top 10 Best Corporate Citizens’ at the Best Corporate Citizens Awards organised by Ceylon Chamber of Commerce
Chairperson Dr Ranee Jayamaha was awarded ‘Distinguished Director PLC’ Award by The Institute of Chartered Accountants of Sri Lanka and The Securities and Exchange Commission of Sri Lanka
Gold Award for ‘Corporate Governance’ at the Annual Report Awards organised by the Institute of Chartered Accountants of Sri Lanka
Bronze Award for overall reporting in the Banking Institutions Category at the Annual Report Awards organised by the
Institute of Chartered Accountants of Sri Lanka
Bronze Award for Corporate Social Responsibility at the Annual Report Awards organised by the Institute of Chartered Accountants of Sri Lanka
Certificate of Merit for the year 2013 in the Category ‘Private Sector Banks’ at the South Asian Federation of Accountants (SAFA) Annual Report Awards 2013
Adjudged Second Runner up under the category ‘SAARC Anniversary Award for Corporate Governance Disclosures’ at the South Asian Federation of Accountants (SAFA) Annual Report Awards 2013
HNB Jaffna Metro Branch Green Building was presented the Silver Flame Award in the Medium Scale Commercial Buildings category at the Sri Lanka National Energy Awards
HNB Kalmunai Green Building was awarded with “ICTAD Green Excellence Award – 2014” at the Mahabimani Award Ceremony
Awards won by HNB PLC
Annual Report 2014 9
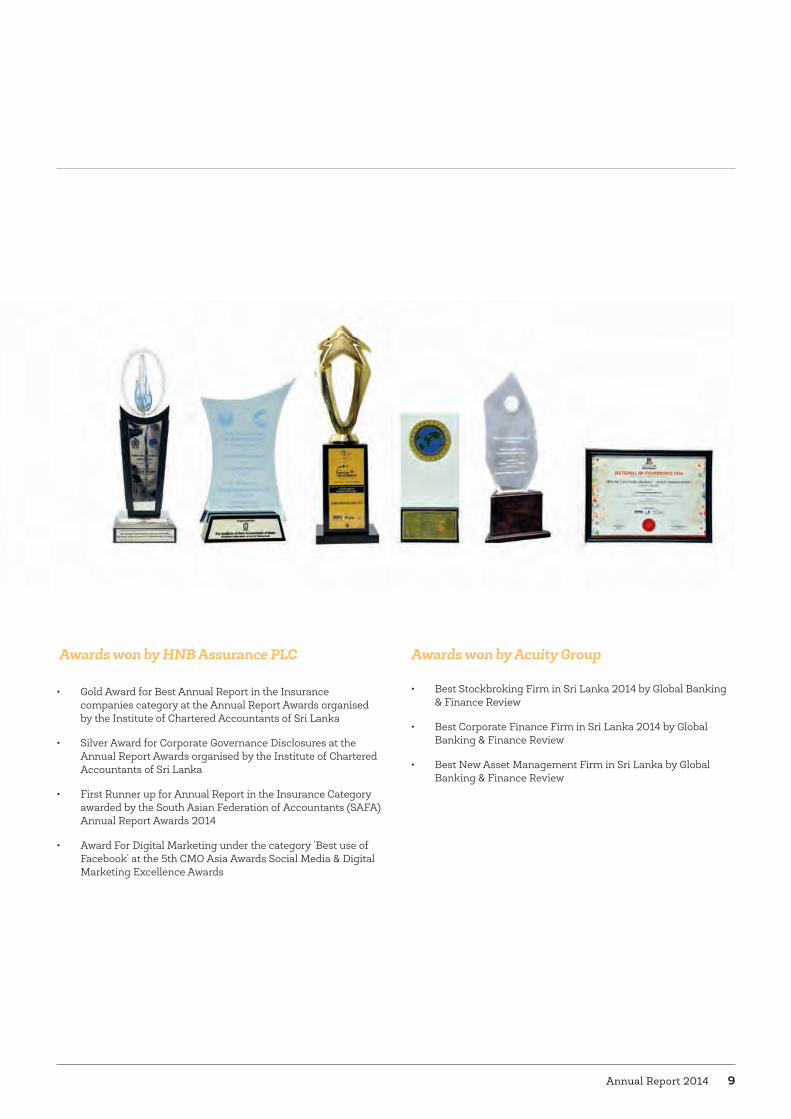
Awards won by HNB Assurance PLC
• Gold Award for Best Annual Report in the Insurance companies category at the Annual Report Awards organised by the Institute of Chartered Accountants of Sri Lanka
• Silver Award for Corporate Governance Disclosures at the Annual Report Awards organised by the Institute of Chartered Accountants of Sri Lanka
• First Runner up for Annual Report in the Insurance Category awarded by the South Asian Federation of Accountants (SAFA) Annual Report Awards 2014
• Award For Digital Marketing under the category ‘Best use of Facebook’ at the 5th CMO Asia Awards Social Media & Digital Marketing Excellence Awards
Awards won by Acuity Group
• Best Stockbroking Firm in Sri Lanka 2014 by Global Banking & Finance Review
• Best Corporate Finance Firm in Sri Lanka 2014 by Global Banking & Finance Review
• Best New Asset Management Firm in Sri Lanka by Global Banking & Finance Review
Hatton National Bank PLC10
Operational Highlights
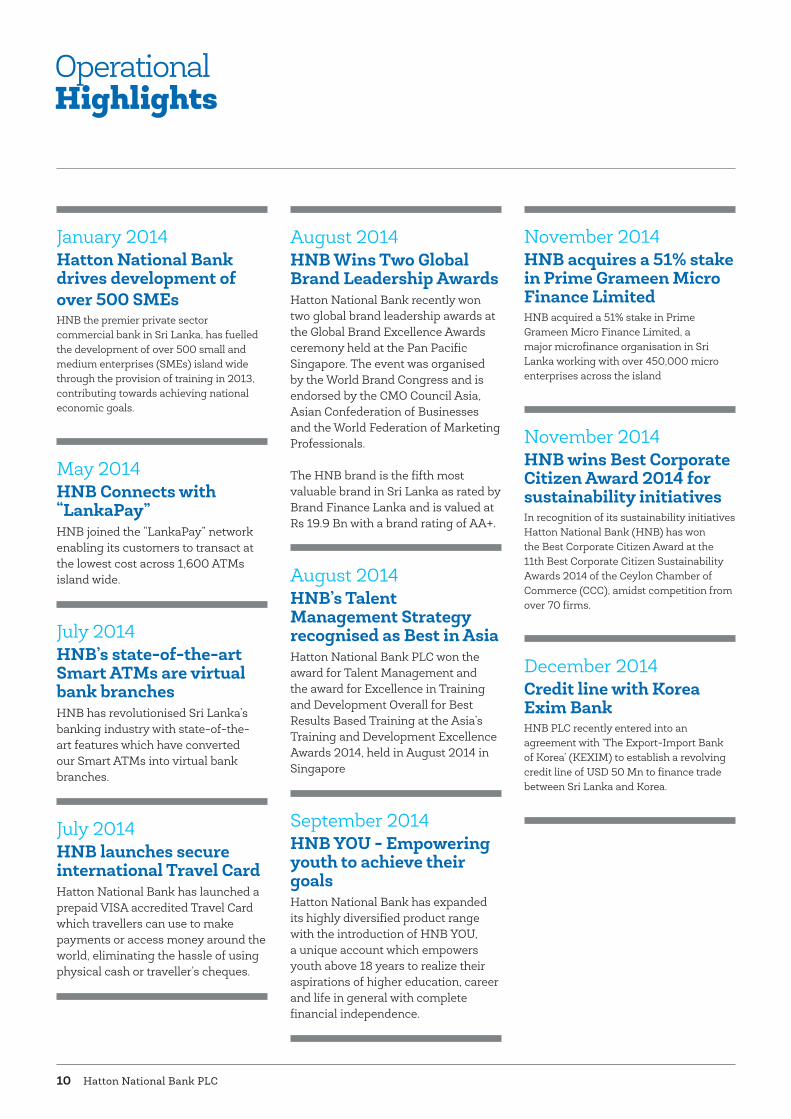
January 2014Hatton National Bank drives development of over 500 SMEs HNB the premier private sector commercial bank in Sri Lanka, has fuelled the development of over 500 small and medium enterprises (SMEs) island wide through the provision of training in 2013, contributing towards achieving national economic goals.
May 2014HNB Connects with “LankaPay” HNB joined the “LankaPay” network enabling its customers to transact at the lowest cost across 1,600 ATMs island wide.
July 2014HNB’s state-of-the-art Smart ATMs are virtual bank branches HNB has revolutionised Sri Lanka’s banking industry with state-of-the-art features which have converted our Smart ATMs into virtual bank branches.
July 2014HNB launches secure international Travel Card Hatton National Bank has launched a prepaid VISA accredited Travel Card which travellers can use to make payments or access money around the world, eliminating the hassle of using physical cash or traveller’s cheques.
August 2014HNB Wins Two Global Brand Leadership Awards Hatton National Bank recently won two global brand leadership awards at the Global Brand Excellence Awards ceremony held at the Pan Pacific Singapore. The event was organised by the World Brand Congress and is endorsed by the CMO Council Asia, Asian Confederation of Businesses and the World Federation of Marketing Professionals.
The HNB brand is the fifth most valuable brand in Sri Lanka as rated by Brand Finance Lanka and is valued at Rs 19.9 Bn with a brand rating of AA+.
August 2014HNB’s Talent Management Strategy recognised as Best in Asia Hatton National Bank PLC won the award for Talent Management and the award for Excellence in Training and Development Overall for Best Results Based Training at the Asia’s Training and Development Excellence Awards 2014, held in August 2014 in Singapore
September 2014HNB YOU - Empowering youth to achieve their goals Hatton National Bank has expanded its highly diversified product range with the introduction of HNB YOU, a unique account which empowers youth above 18 years to realize their aspirations of higher education, career and life in general with complete financial independence.
November 2014HNB acquires a 51% stake in Prime Grameen Micro Finance Limited HNB acquired a 51% stake in Prime Grameen Micro Finance Limited, a major microfinance organisation in Sri Lanka working with over 450,000 micro enterprises across the island
November 2014HNB wins Best Corporate Citizen Award 2014 for sustainability initiatives In recognition of its sustainability initiatives Hatton National Bank (HNB) has won the Best Corporate Citizen Award at the 11th Best Corporate Citizen Sustainability Awards 2014 of the Ceylon Chamber of Commerce (CCC), amidst competition from over 70 firms.
December 2014Credit line with Korea Exim Bank HNB PLC recently entered into an agreement with ‘The Export-Import Bank of Korea’ (KEXIM) to establish a revolving credit line of USD 50 Mn to finance trade between Sri Lanka and Korea.

A VISION MADE REAL EACH YEAR. OUR VISION TO SHAPE OUR FUTURE AND SERVE OUR CUSTOMERS AND STAKEHOLDERS BETTER WITH EACH PASSING YEAR REMAINS OUR GUIDING PRINCIPLE IN ALL THAT WE UNDERTAKE TO DO.
About the Bank

Hatton National Bank PLC12
Your progressivepartner
Chairperson’s message
Dear Stakeholder
It gives me great pleasure to welcome you to the forty sixth Annual General Meeting of Hatton National Bank PLC and present to you the Annual Report and Audited Financial Statements for the year ended 31st December 2014.
Performance in ContextYou will be pleased to note that your Bank has performed exceptionally over the last three years in respect of advances, deposits and profit after tax recording growth rates of 54%, 44% and 43% respectively.
The year under review was no exception and demonstrated resilience amidst the unfavourable global environment, decline in gold prices, reduction in interest margins, low credit growth and severe industry competition that posed numerous challenges to the entire industry.
Your Bank successfully weathered these external and domestic challenges and recorded Group assets of over Rs 600Bn while gross loans and advances surpassed Rs 400 Bn during the year. The market capitalisation as at the end of the year 2014 also reached Rs 60 Bn.
Accordingly, I am happy to announce a proposed final dividend of Rs 7.00 per share for both voting and non-voting shares in addition to the interim dividend
of Rs 1.50 per share, amounting to a total dividend of Rs 8.50 per share for the year.
The context of the economic environment is discussed at length in the Management Review that follows, but let me set out a broad overview of the salient points that provided and would continue to provide, the backdrop for the performance of your Bank.
The Global Economy The recovery of the global economy which began to take hold in October 2013 continued into 2014, albeit at a weaker than expected pace due to some setbacks. Accordingly, the IMF’s projections made in January 2015 for world growth have been revised downwards to 3.3%, reflecting challenges such as currency instabilities, concerns of stagnation and low inflation in the Euro area and in Japan; an escalation of geo political tensions in the Middle East and Ukraine; and the sharp slowdown of the Russian economy.
One of the most significant developments in the global landscape with considerable implications for global growth has been the sharp decline in world energy prices. The price of Brent Crude Oil (as per the US Energy Information data), declined by more than 43% from January to 31st December 2014. Although there is uncertainty on how long the supply shock driven price levels would persist, they are
expected to reverse only gradually and partially over the next year.
In Asia, growth prospects are still better than that of the USA and Europe, although China is expecting a growth below 7% in 2015. Asia is likely to benefit from lower oil prices and inflation which have opened up the scope for another round of monetary easing in the region.
Domestic Business EnvironmentContinuing on the momentum from 2013, the Sri Lankan economy grew at a robust pace in 2014, with real GDP growing by 7.7% during the first half of the year compared with a growth of 7.3% in 2013. The expansion in domestic economic activity and improved external demand were the key contributors to this growth momentum. Strong growth is expected to continue in 2015, which would average 7% in 2014 with same trends prevailing in 2015. Inflation remained well below 5% during the year. The policy stance of maintaining high growth momentum with low inflation in 2014 has led to an inevitable relaxation of the monetary policy, which was largely conducive to business. However, despite this low inflationary and low interest rate environment, credit growth did not accelerate during the first half of the year and that impacted net interest income in the banking industry. The banking sector credit growth which moderated largely on
Your Bank successfully weathered numerous external and domestic challenges and recorded Group assets of over Rs 600 Bn while gross loans and advances surpassed Rs 400 Bn during the year.

Annual Report 2014 13
Chairperson’sMessage online
Hatton National Bank PLC14
account of the pawning advances, picked up during the final quarter with total assets growing by 15.5% year on year as at end of November 2014 compared to 16.5% in 2013.
GovernanceYour Bank believes that the highest standards in governance are indispensable to creating long term value to its stakeholders and such standards must be pursued uncompromisingly. Corporate Governance is about instilling trust leading to effective, transparent and accountable governance by the Board and the Management.
HNB’s brand attributes and its heritage of over 125 years stands testimony to its sustainability and focus on good governance. The conformance and performance criteria stipulated for financial institutions are not viewed as “policing” tools but as a framework that supports better decision-making for the sustainability of the Bank.
In addition to the mandatory governance requirements, HNB has established its own set of internal benchmarks, processes and structures to meet accepted best practices in governance and to uphold the Bank’s well established reputation as a safe and sound Bank. These processes are detailed under the caption Governance Report on page 113 of this report. The Bank introduced greater transparency to its processes during the year.
Sustainable Approach to Business HNB’s social and sustainability initiatives during the year were driven by values that the Company espouses such as inclusivity and support to local entrepreneurship.
Our approach to sustainable business also means that we adopt a win-win strategy in partnership with customers, driven by the Company’s slogan – Partner in Progress. The Bank also strives to ensure that its team of employees respects the values and practices the highest ethical standards expected of them.
Looking AheadForeign Direct Investment will be a vital factor in determining the medium and long term growth prospects for Sri Lanka. It is thus encouraging that post war Sri Lanka is becoming increasingly more attractive as a destination for investment. Large scale development in thrust areas of the economy such as Transportation, Tourism and Health & Medical sectors also augurs well for growth and we remain buoyant on the prospects for Sri Lanka as it continues to move in the direction of realising its true potential. The garment and apparel exports are expected to remain a key contributor to growth. Agriculture remains as a prospective area which can be exploited through improved agro processing and enhanced value addition for export markets. Our Bank’s strong presence in these sectors through
SME lending will provide an opportunity to play its part by facilitating market and supply chain linkages.
As credit growth which has been on the rise since the second half of 2014 is expected to pick up further in 2015, we anticipate a more favourable environment for the profitability of the banking industry in 2015-16.
The projected rise in Sri Lanka’s per capita income, together with the improvements in the macro fundamentals would elevate Sri Lanka to an upper middle income status and will see the Country becoming structurally diversified with enhanced sustainability. Such an environment
would support a rising demand for more sophisticated financial markets, instruments, private banking as well as wealth management services with expectations of superior service. It would also create a need to move forward with advanced technology as well as mitigation of cyber risks. Your Bank’s strategic initiatives launched during the past two years, see it well poised to harness the opportunities in this future market for sophisticated banking services, requiring appropriate measures to minimise industry wide cyber threats.
Looking ahead, in an environment of intense competition and diminishing net interest income, driving sales growth and higher fee income generated through alternate channels of distribution, are key strategic imperatives for your Bank. As technology will continue to remain
Chairperson’sMessage
Our approach to sustainable business also means that we adopt a win-win strategy in partnership with customers, driven by the Company’s slogan – Partner in Progress.

Annual Report 2014 15
a key driver of sustainable growth, the significant investments effected by the Bank in cutting edge technology would enable it to realise the full potential of these advancements in the near future.
We also see the Bank’s SME and Development Banking expanding to contribute more to the Bank’s portfolio in 2015. The new funding partnerships with regional financial institutions, global development banks and regional export import banks which we have developed during the year will further strengthen our market leadership in this segment going forward. Our role in the Micro and SME sectors will continue to contribute to the nation’s progress not only through financial empowerment but also through capacity enhancements on technical and financial skills. The acquisition of a 51% stake in voting rights of Prime Grameen Micro Finance Ltd., is a further step towards these efforts. This is one of the key strategic investments made by the Bank over the recent past.
As we look to the year ahead and beyond, we will continue to review our strategies in keeping with the changing dynamics
of the economic, social, technological and natural environments.
It is envisaged that the banking sector of Sri Lanka will have at least five players with assets of Rs 1 trillion or more with a strong regional presence, and your Bank is well placed to reach this milestone in the next few years.
Reflecting our triple bottom line focus, the Group will continue to integrate social and environmental value creation into business strategy. It will leverage on and continue to strengthen relationships with all its stakeholders which include shareholders, customers, partners, principals, investors, regulators, employees and society at large.
AppreciationI would like to convey my sincere thanks and deep appreciation to my colleagues on the Board for their valuable input in guiding the Bank to new heights and for their support and cooperation in meeting numerous challenges. I also thank the entire team of employees led by the Managing Director/CEO for their
unreserved effort and commitment to the Bank’s sustained success. I extend my appreciation to the staff of HNB’s subsidiary companies for their cooperation and support. I take this opportunity to thank policy makers and regulators for their guidance whilst creating a conducive environment for business. My sincere gratitude to the shareholders and all other stakeholders for their support and the confidence placed in us to Partner their Progress for generations.
Ranee JayamahaChairperson
Reflecting our triple bottom line focus, the Group will continue to integrate social and environmental value creation into business strategy.
Hatton National Bank PLC16
Going beyondbanking
Managing director’s review of operations
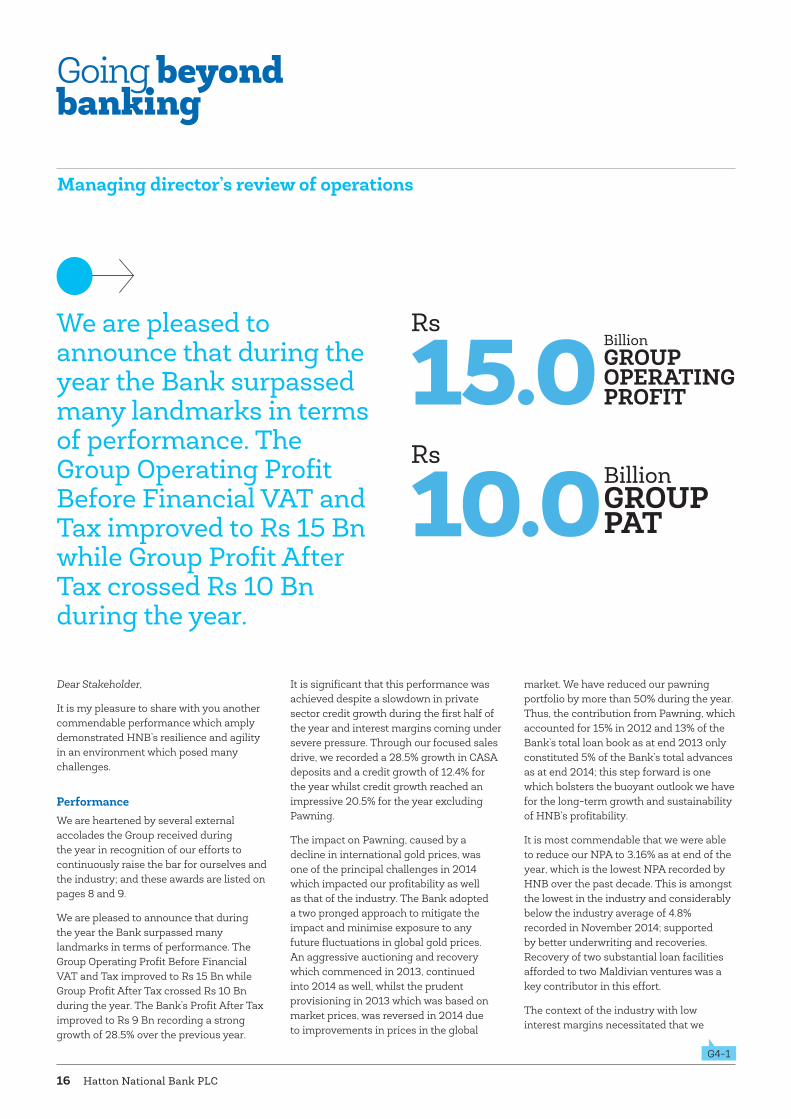
We are pleased to announce that during the year the Bank surpassed many landmarks in terms of performance. The Group Operating Profit Before Financial VAT and Tax improved to Rs 15 Bn while Group Profit After Tax crossed Rs 10 Bn during the year.
Dear Stakeholder,
It is my pleasure to share with you another commendable performance which amply demonstrated HNB’s resilience and agility in an environment which posed many challenges.
PerformanceWe are heartened by several external accolades the Group received during the year in recognition of our efforts to continuously raise the bar for ourselves and the industry; and these awards are listed on pages 8 and 9.
We are pleased to announce that during the year the Bank surpassed many landmarks in terms of performance. The Group Operating Profit Before Financial VAT and Tax improved to Rs 15 Bn while Group Profit After Tax crossed Rs 10 Bn during the year. The Bank’s Profit After Tax improved to Rs 9 Bn recording a strong growth of 28.5% over the previous year.
It is significant that this performance was achieved despite a slowdown in private sector credit growth during the first half of the year and interest margins coming under severe pressure. Through our focused sales drive, we recorded a 28.5% growth in CASA deposits and a credit growth of 12.4% for the year whilst credit growth reached an impressive 20.5% for the year excluding Pawning.
The impact on Pawning, caused by a decline in international gold prices, was one of the principal challenges in 2014 which impacted our profitability as well as that of the industry. The Bank adopted a two pronged approach to mitigate the impact and minimise exposure to any future fluctuations in global gold prices. An aggressive auctioning and recovery which commenced in 2013, continued into 2014 as well, whilst the prudent provisioning in 2013 which was based on market prices, was reversed in 2014 due to improvements in prices in the global
market. We have reduced our pawning portfolio by more than 50% during the year. Thus, the contribution from Pawning, which accounted for 15% in 2012 and 13% of the Bank’s total loan book as at end 2013 only constituted 5% of the Bank’s total advances as at end 2014; this step forward is one which bolsters the buoyant outlook we have for the long-term growth and sustainability of HNB’s profitability.
It is most commendable that we were able to reduce our NPA to 3.16% as at end of the year, which is the lowest NPA recorded by HNB over the past decade. This is amongst the lowest in the industry and considerably below the industry average of 4.8% recorded in November 2014; supported by better underwriting and recoveries. Recovery of two substantial loan facilities afforded to two Maldivian ventures was a key contributor in this effort.
The context of the industry with low interest margins necessitated that we
15.010.0
Rs
Rs
BillionGROUPOPERATING PROFIT
BillionGROUPPAT
G4-1

Annual Report 2014 17
Managing Director’sReview of Operations online
Hatton National Bank PLC18
develop alternative sources of income to sustain profitability and growth in the medium to long term. In this regard it is most encouraging that we have been able to increase our fee generating capacity year on year, as reflected by the 17% growth in fee income in 2014. Focus on strengthening HNB’s market leadership position in credit card merchant acquisition, increasing trade business, remittances from overseas, guarantee commissions and fees generated through new products and services offered using alternate channels supported this growth.
The year under review saw us re-engineering and re-designing several existing business processes and systems of the Bank, for which we had laid the groundwork in 2013. This initiative to facilitate operational excellence has twin fold objectives. The first being, to facilitate unparalleled service excellence and customer convenience; whilst the second is to achieve an optimisation of resources through general operational excellence across the Group. The challenge posed by intense competition and declining interest margins also necessitated that we achieve resource optimisation through economies of scale and greater efficiency. Amongst the significant Business Process Re-engineering (BPR) initiatives completed in 2014 were the centralisation of the retail credit processing and underwriting of the three largest regions of the Bank which make up more than 60% of the volumes. The regionalisation of the Small and Medium Enterprises (SME) cells to create 10 cells exclusively dedicated for SME facilities above Rs 10 Mn, was another which facilitated enhanced service and better relationship management in the SME business.
These concerted efforts as well as initiatives with regard to cost optimisation enabled us to bring our cost to income ratio down to 47.4%.
Your Progressive PartnerWe are proud to have taken upon ourselves the responsibility of being “your partner in progress” for over 125 years in enterprise. In doing so, we have also been committed to our progress; to be nimble enough to evolve with changing needs of the generations of Sri Lankans we serve; to
overcome challenges and to continuously enhance the value we create for all our stakeholders. Reflecting our Triple Bottom Line focus in enterprise, we believe that our progress and the progress of our stakeholders must go hand in hand.
Our approach of partnership also propels us to strive to serve our clients in the manner they prefer and with products to meet their aspirations. And thus, we appreciate that technological leadership is a sine qua non to deliver value to all our stakeholders amidst rapidly changing life styles, and paradigms. Recognizing the need, your Bank made significant investments into enhancing its technological capabilities over the past three years. And as was enumerated in my review of 2013, we placed cutting edge technology at the forefront of our delivery channels and operations. This focus has positioned us well today, to reach new milestones via new opportunities for engaging our customers and growing new streams of revenue. Following the pioneering launch of HNB MOMO –the mobile POS solution and the state of the art mobile application in 2013, the year in review saw us leveraging on these robust platforms and launching new product and service propositions to offer “New World Banking” for the Sri Lankan market. The Bank’s technological thrust has become a key enabler of all of our strategic imperatives, such as customer convenience, enhancing the service offering, increasing avenues for fee based income, cost optimization and minimising our carbon footprint.
Being progressive, to us, is also about constantly searching for new ways to help sustain a greener earth and uplift the wider communities which we are part of. We continued to enhance the application of the Bank’s green principles in lending, and obtain new green licenses with the support of DEG Germany.
“Progress” is also about partnering our customers as they progress through the different stages and ages in life. Our retail products cater to individuals through many life events, from the birth of a child to educational needs and retirement whilst in our SME sector we help foster the birth of enterprises and support them to grow to become large enterprises.
Partnering the nation’s progress Our involvement with the SME sector of the country dates back to the Bank’s origins in the small hillside town of Hatton, more than 125 years ago. Engaging with the SME sector since then has afforded us an opportunity to make a valuable contribution to achieving some of the nation’s macro economic goals, such as a more equitable distribution of income. This contribution we make to the country’s economic growth is one which we hold high, and is intrinsic to the long term approach to enterprise that we have adopted.
The international collaborations we have established have also been a key element of our success in the SME sector. A milestone reached during the year was being selected as the local partner for projects initiated by DEG and GIZ of Germany. These partnerships will further strengthen our leadership position in the SME sector. They are also recognition for the role we play in Sri Lanka’s economic progress, and an endorsement of the highest standards of governance and management at HNB.
Year 2014 saw the Bank celebrate the 25th anniversary of its widely acknowledged Micro Finance programme “Gami Pubuduwa”– the first ever micro finance initiative by a Bank in the country. This programme, since its inception in 1989 has enriched diverse communities across rural Sri Lanka. By opening doors for a segment of the population that hitherto
Managing Director’sReview of Operations
16%ROE

Annual Report 2014 19
1.7%
had no access to the banking system, we have been able to be a part of a rural awakening, across the country.
Our engagement with this sector extends beyond financial empowerment and the creation of wide ranging livelihood opportunities; to partnering enterprise development and social empowerment through enduring relationships and many capacity building initiatives.
Another key development during the year was the Bank’s acquisition of Prime Grameen Micro Finance Ltd. which has brought in an additional 200,000 clients. This acquisition will create many synergies to further bolster the Bank’s leadership role in the Micro Finance sector of the country and contribute considerably to Group profitability in the years ahead.
Relationships beyond transactions and our sustainable model As an institution that continues to foster savings and a spirit of entrepreneurship for generations of Sri Lankans, the Bank revels on its strength of nurturing enduring relationships. We believe that banking must go far beyond transactions. Being in the financial service industry underscores the importance of the quality of relationships we build with customers, investors, suppliers and amongst ourselves as a team of employees. The Bank’s ability to understand and meet client requirements
and exceed their expectations has been key to the position of market leadership it has gained over the years in many business verticals.
Sustainability underscores the importance of taking a longer-term perspective about our business, and consequences of today’s activities, and of global cooperation to reach viable solutions. Sustainable value creation for all our stakeholders is part of HNB’s corporate DNA and as a financial institution, we consider our business an avenue for wealth creation and a means of financial inclusion.
Our robust and advanced Risk Management framework plays a critical role in sustaining our reputation as a safe and sound Bank. The Risk Management function spearheaded the initiatives to refine our Pawning portfolio through prudent policies such as lower loan to value ratios. During the year, we continued to improve loan origination and appraisal systems with the testing of the BASEL advanced approach to credit risk measurement.
Our approach to sustainability has been nurtured and derived from key input obtained through stakeholder engagement; whether it be understanding the needs of consumers amidst rapidly changing markets and life styles, to issues that matter to the neighbourhoods we operate
in, or the broader context of macro economic objectives.
Being a financial institution, the adverse impacts we have on the environment are minimal. However, we recognise how we have the potential to make an enormous impact via our customers and business activities to make it a greener earth, and are always mindful of this responsibility. Good environmentalism also makes economic sense. The Bank’s Environmental and Social Management System (ESMS) which evaluates social and environmental risks associated with projects for lending will be fully implemented in the year ahead. Accordingly, our officers are provided extensive training to implement ESMS, to evaluate, and also adopt a participatory approach in helping clients resolve possible issues.
Our Human Capital The talents, drive and commitment of our people have been the corner stone of our sustained success and it is their passion and talents which have fuelled our innovations and progress. HNB’s 126 year presence has endowed it with a solid foundation of well embedded values and best practices which continue to define how it engages with its People.
The Bank’s strategic imperatives such as service excellence and a sales focus, for which the primary conduit would be our people, underscored the importance of investments in training and development to enhance the value of our most valued asset in 2014. The re-engineering of our processes and the infusion of technology have begun to facilitate empowerment of our people, and their redeployment from
As an institution that continues to foster savings and a spirit of entrepreneurship for generations of Sri Lankans, the Bank revels on its strength of nurturing enduring relationships. We believe that banking must go far beyond transactions. Being in the financial service industry underscores the importance of the quality of relationships we build with customers, investors, suppliers and amongst ourselves as a team of employees.
ROA

Hatton National Bank PLC20
operational and back office functions to more value generating activities across the Bank.
The Bank has initiated a programme to build a talent pool to support its succession plan. The programme identified and grouped high performing executives into three groups, branded as Aspire, Acumen and Catalysts. The “Catalysts” comprises senior management whilst “Acumen” and “Aspire” consist of middle level leaders and young leaders with high potential, respectively, and these groups are offered tailor made personal and management development programmes.
The year under review saw our HR initiatives also focus on facilitating greater dialogue between the management and staff, encouraging innovation, charting paths for career advancement and mentoring; for individuals to take on more responsibility and become leaders in the industry.
Future outlook and strategySri Lanka’s Banking industry will remain highly competitive with interest margins expected to be low in the near to medium term. Augmenting our fee based income is thus a key strategic imperative in the years ahead. While concentrating on key fee income generating activities, the Bank will continue to enhance the service offering through its robust digital platforms.
The pickup in credit growth since the second half of 2014 amidst moderate
inflation, augurs well for Sri Lanka’s economy and supports the optimistic outlook we have for 2015-2016. We expect demand for private sector credit to continue to move upwards in 2015, supported by the low interest rate regime which is likely to continue into 2015.
We expect moderate inflation, which is likely to remain in the mid single digits, to support an increase in disposable incomes and spur increased activity in the Personal Financial Services segment of the industry. This augurs well for the Bank to strengthen its leadership role in Sri Lanka’s retail banking market. The sharp decline in global oil prices which has now been passed onto benefit the Sri Lankan consumer, would also help support purchasing power in the immediate future. Moreover, a rising demand for life style products and the growth of the real estate market are opportunities we foresee.
Appreciating that technology is an imperative to enhance value creation and sustain our competitiveness in the context of rapidly changing lifestyles, and fast changing landscapes of the financial industry, we will continue to leverage on technology to delight our customers with product innovations and service excellence. The Bank will also continue to focus on maintaining technological leadership, looking to set new benchmarks. We have been a pioneer in introducing many technology driven channels in the Sri Lankan market and the new corporate campaign themed “New World Banking” launched in the first quarter of 2015, thus
aims to create market awareness of a whole new world of possibilities driven by technology, and our capacity to deliver what “customers want tomorrow, today”. This integrated campaign aims to create awareness about the array of innovative digital, electronic and mobile banking products we offer and highlights the special features of these comprehensive cross-platform systems.
Our BPR efforts will continue into 2015, enabling us make further strides towards operational excellence and customer convenience. One such initiative on the pipeline for implementation in 2015 is a branch Target Operating Model. This model would facilitate a more optimal allocation of human resources, by stipulating cadre based on an analysis of specific needs, volumes, market characteristics and potential of each location of our island wide branch network. We will also complete the centralization of the processing of retail credit.
The SME sector will continue to be an engine of growth for the Sri Lankan economy and the Bank’s SME sector will continue to be a key area of focus, enabling us to play an integral role in fuelling Sri Lanka’s journey towards becoming an upper middle income country. The Bank also envisages its retail banking franchises to benefit the SME and Micro Finance sectors. HNB with its strong SME relationships in urban and rural Sri Lanka will be the forefront in providing banking services to these customers.
Managing Director’sReview of Operations
Sri Lanka’s Banking industry will remain highly competitive with interest margins expected to be low in the near to medium term. Augmenting our fee based income, is thus, a key strategic imperative in the years ahead.
Annual Report 2014 21
We also foresee that Banks would seek to collaborate and forge partnerships across different retailing industries which have well established distribution channels, such as supermarkets and telecommunication companies. Amidst evolving market needs and life styles which would continue to demand the safety and security of banking but not necessarily a bank; we will look to capture and create win-win opportunities through these distribution networks, to expand our reach and enhance customer convenience.
Whilst supporting the macro economic growth story of Sri Lanka, we will also look to expand to a regional presence overseas over the next few years.
AppreciationI would like to express my sincere gratitude to our Chairperson and my colleagues on the Board for their guidance, constant support and for the confidence placed in me. My very sincere appreciation to our strong Hatna family for their unwavering commitment, passion and tireless efforts that continue to drive the Bank forward and support with resilience when needed. My heart felt gratitude to our customers
who have continued to build stronger relationships and place their trust in us enabling us to record sustainable performance year after year. I also extend a very sincere thank you to our shareholders, business associates and other stakeholders for their support and inspiration.
HNB - Your Future Bank Our rich heritage and strong brand promise of safety stability and strength, have been a sound platform for market leadership and
growth over the decades. We are proud to have partnered the progress of generations of Sri Lankans, and as we look to serve generations more, we will constantly re-evaluate what we do and how we do in the context of evolving landscapes. We will remain focused on the need to be nimble enough to respond to changing market needs, life styles and increasing competition.
The process of redesign and re-engineering, launched during the year, have begun to yield speed, standardization and customer convenience, of which the benefits we will fully reap in the years ahead. The technological thrust has bolstered the Bank’s competitive advantage with an excellent ATM network, mobile and
internet banking platform to complement our network of customer service centres, which is the largest amongst private commercial banks in the country. Whilst we are actively promoting a sales driven culture, it would be complimenting service excellence which is also a key strategic imperative of the Bank.
Buoyed by the progress we’ve made, establishing a sound platform for growth during the past few years, we look ahead with new vigour to capitalize on the
numerous opportunities we foresee; to be a partner in progress for our customers and investors whilst endeavouring to create value for the society reflecting our firm belief that all that we are a part of –the communities and the environment, are interdependent.
Jonathan AllesManaging Director/CEO
3.16%NPA
Our robust and advanced Risk Management framework plays a critical role in sustaining our reputation as a safe and sound Bank. The Risk Management function spearheaded the initiatives to refine our Pawning portfolio through prudent policies such as a lower loan to value ratios.
Hatton National Bank PLC22
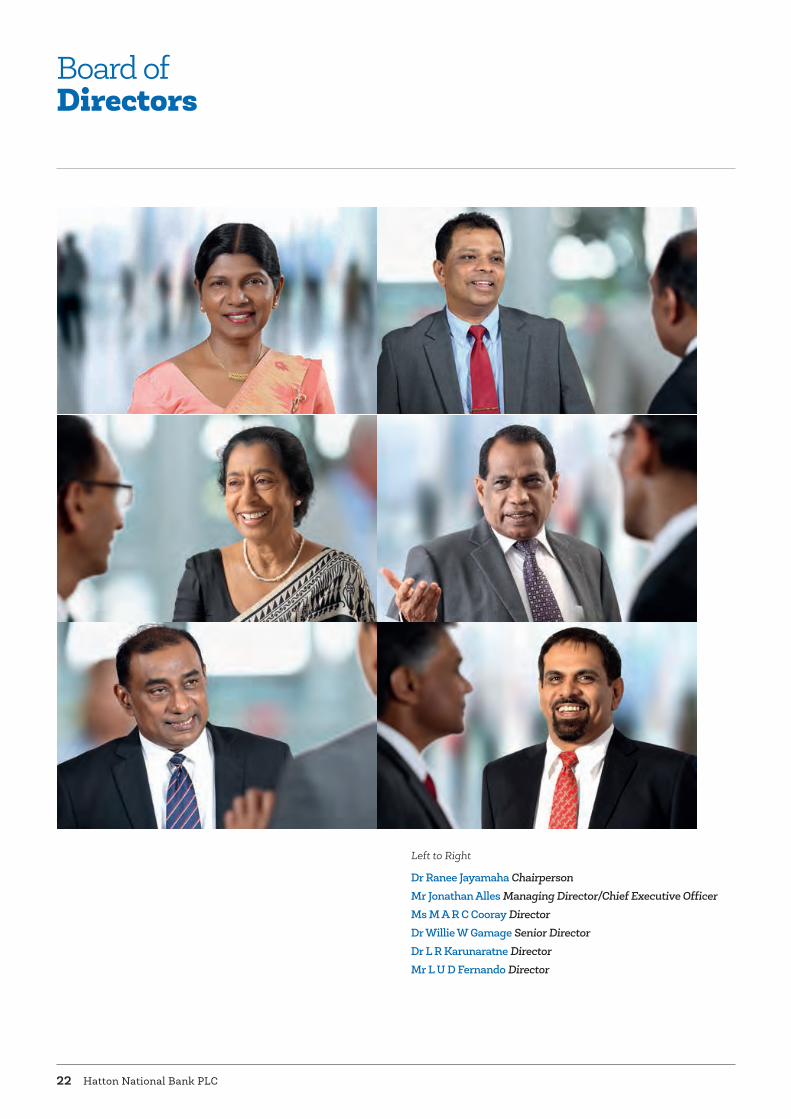
Board ofDirectors
Left to Right
Dr Ranee Jayamaha ChairpersonMr Jonathan Alles Managing Director/Chief Executive OfficerMs M A R C Cooray DirectorDr Willie W Gamage Senior DirectorDr L R Karunaratne DirectorMr L U D Fernando Director

Annual Report 2014 23
Left to Right
Mr Sujeewa Mudalige DirectorMiss D S C Jayawardena DirectorMr R S Captain DirectorMr Amal Cabraal DirectorMrs K A L Thushari Ranaweera Company Secretary

Hatton National Bank PLC24
ChairpersonDr Ranee Jayamaha(Non-Executive Director)
H N R
B.A. (Hons) (University of Ceylon, Peradeniya, Sri Lanka), MSc. (University of Stirling, U.K.), Ph.D (University of Bradford, U.K.), DUniv (University of Stirling, U.K.)
Appointed Director and the Chairperson on 31st March 2011. She is the Chairperson of HNB Assurance PLC, H N B General Insurance Ltd and Sithma Development (Pvt) Ltd and a Director of Overseas Realty (Ceylon) PLC and Mireka Capital Lanka (Pvt) Ltd. Dr Jayamaha had been the Deputy Governor in charge of Financial System Stability of the Central Bank of Sri Lanka from 2004 up to her retirement at end of May 2009. She has over 40 years of extensive experience in the fields of economics, banking, finance, regulation and administration, having held a number of positions in the Central Bank and outside.
On release from the Central Bank, she has served as Secretary - Presidential Commission on Finance & Banking, Advisor - Financial Sector Reform Committee, Ministry of Finance and Special Advisor (Economic) - Commonwealth Secretariat, London, U.K.
She has been a Member of the Securities and Exchange Commission of Sri Lanka, the Insurance Board of Sri Lanka, the Chairperson of the Credit Information Bureau of Sri Lanka and the National Payments Council. Dr Jayamaha has been a Member of the Working Group on General Payment System Development of the Bank for International Settlements, Member of the Global Payments Forum, Member of the Advisory Panel of the G-8 Remittances Working Group and Member of the Expert Panel of the Safeguard Assessment Policy Review 2010 of the IMF. She had been providing advisory services to a number of international financial institutions and Central Banks in the Region.
In 2012, the University of Stirling bestowed Dr Jayamaha with the Degree of Doctor of the University (DUniv) in recognition of her
distinguished career as one of the University’s first Master’s Graduates in Economics and as a person of great distinction in the fields of learning the arts and public affairs.
Managing Director/Chief Executive OfficerMr Jonathan Alles(Executive Director)
R
M.B.A. Finance (Stirling),A.I.B. Sri Lanka
He was appointed an Executive Director on 1st May 2013 and Managing Director/Chief Executive Officer on 1st July 2013.
Mr Alles holds an MBA from the University of Stirling, U.K. and is an Associate Member of the Institute of Bankers, Sri Lanka. He counts 28 years of banking experience having served International Banks and HSBC, Sri Lanka and also at Hatton National Bank during the period September 2002 to June 2005. Having returned to Sri Lanka from the UAE in September 2010, Mr Alles re-joined Hatton National Bank in the capacity of Chief Operating Officer.
Mr Alles is the Chairman of Sri Lanka Banks’ Association (Guarantee) Ltd, Financial Ombudsman Sri Lanka (Guarantee) Limited, Lanka Financial Services Bureau Ltd, Lanka Ventures PLC and Prime Grameen Micro Finance Ltd. He serves as a Director of Sithma Development (Pvt) Ltd, Acuity Partners (Pvt) Ltd, Acuity Stockbrokers (Pvt) Ltd, HNB Assurance PLC and H N B General Insurance Ltd.
Mr Alles is a member of Sri Lanka Institute of Directors and also serves as a member of the Advisory Committee of Sri Lanka Business & Biodiversity Platform.
Board ofDirectors
H Member of HR & Remuneration Committee
N Member of Nomination Committee
R Member of Board Integrated Risk Management Committee
A Member of Audit Committee

Annual Report 2014 25
DirectorMs M A R C Cooray(Non-Executive Director)
N R
B.A. (Hons) (University of Ceylon, Peradeniya, Sri Lanka) M.Sc (Strathclyde University, U.K.)
Appointed Director in February 2010 and was the Senior Director till the 30th of October 2014. She is a retired Deputy Governor of the Central Bank of Sri Lanka where she served for over 35 years. She is a Director of Ceylon Guardian Investment Trust PLC, Ceylon Investment PLC and Prime Grameen Micro Finance Limited.
On release from the Central Bank, she had served the Ministry of Finance in the capacity of Director General Fiscal Policy and Economic Affairs Department for nearly 6 years, represented the Government on the Boards of DFCC Bank, Sri Lanka Institute of Information Technology, Sri Lanka Telecom, Ceylon Electricity Board, De La Rue Currency and Security Print (Pvt) Ltd, Export Development Board, National Housing and Development Authority and represented the Monetary Board on West Coast Power (Pvt) Ltd.
She has functioned as the Vice Chairperson of the Institute of Bankers of Sri Lanka for 5 years and has served on a number of Committees at national level covering a variety of subjects representing the Ministry of Finance and the Central Bank. She has also represented the Central Bank and the Ministry of Finance at various international meetings/seminars.
Mrs Cooray has been involved extensively in policy making and implementing projects and programmes especially in the area of regional development and microfinance. She has wide experience in negotiating loans with multilateral and other donors as well as bilateral trade agreements on behalf of the Government. Her articles/papers have been published in professional journals.
Senior DirectorDr Willie W Gamage(Non-Executive Director)
H N
B.Sc (University College of London, U.K.), M.Sc (University of Colombo), PhD (Rajarata University)
Appointed Director on 31st March 2011. Dr Willie W. Gamage served as the Secretary to the Ministry of Botanical Gardens & Public Recreation, while serving as the Chairman/CEO of the Strategic Enterprise Management Agency (SEMA).
He has over 30 years of wide experience in the public, private and non-governmental organisations, having served several such organisations in different capacities. He has extensive experience in formulating and implementing several projects on poverty alleviation, local economic development, promoting alternative energy generation and enhancing capacities in public enterprises.
Dr Gamage has also contributed immensely to the local and regional development initiatives in the areas of Rural Water Supply and Sanitation, Small Scale Fisheries Development, Community Development, Municipal Solid Waste Management, Rural Enterprise Development and Rural Housing Development. Presently Dr Gamage serves as the Senior Director of the Bank.
DirectorDr L R Karunaratne(Non-Executive Director)
R A
B.E (India), T.Eng (CEI), MIE (Lon), MBA (U.K.), Ph.D (U.K.), FIIM (HK), FCIOB
Appointed Director in October 2011. Dr Rohan Karunaratne, a Consultant Engineer, is the incumbent President of the Ceylon Institute of Builders (CIOB), engaged in developing the construction industry and construction builders in Sri Lanka. Under his Presidency, the First World Green Building Conference in Sri Lanka was launched to introduce Green Building Concept to the construction industry. He is the Managing Director of A.K.K. Engineers (Pvt) Ltd,
Hatton National Bank PLC26
Board ofDirectors
an Engineering Company specialized in building construction, civil engineering, water supply and waste water, construction of swimming pools and now in road construction. He is the Chairman of Associated Motor Finance Co Ltd, Hybrid Airports (Pvt) Ltd, the Deputy Chairman of the International Institute of Management, a Director of Arpico Finance PLC and the Vice President of Sri Lanka-Myanmar Economic Co-operation Council.
He has over 30 years of experience in Civil Engineering, Building Construction, Engineering Consultancy, Construction Training, lecturing in Civil Construction, Designing & Planning. He was the past Chairman of the National Construction Association of Sri Lanka and was the first Chairman of Human Resources Development (Pvt) Ltd and Advance Construction Training Academy.
Dr Karunaratne holds a PhD in Management and a MBA from the Sussex University (UK). He is an Engineering Graduate in Civil Engineering and an advanced Diploma holder in HIET (Chennai - India). He is a Fellow of the International Institute of Management and a Fellow of the Ceylon Institute of Builders.
DirectorMr L U D Fernando(Non-Executive Director)
H R
MBA (Sri J), FCMA (U.K.)
Appointed Director in April 2012. Mr Fernando was the former Executive Director of Sri Lanka Insurance Corporation Limited and of The Lanka Hospitals Corporation PLC. He also had served on the Boards of Distilleries Company of Sri Lanka PLC, Pelwatte Sugar Industries PLC, Melstacorp Limited, Lanka Bell Limited, National Asset Management Limited, Continental Insurance Lanka Limited and the Boards of several other companies in the DCSL Group.
He is a Fellow of Chartered Institute of Management Accountants of United Kingdom. He has been awarded a Master’s degree in Business Administration by the Postgraduate Institute of Management of University of Sri Jayewardenepura.
DirectorMr Sujeewa Mudalige(Non-Executive Director)
H A
FCA (Sri Lanka),FCMA (UK),FCCA (UK),FCPA (Australia)
Appointed Director in April 2012. Mr Mudalige is a past President of the Institute of Chartered Accountants of Sri Lanka (CA – Sri Lanka) and is the Chairman of the Sri Lanka Accounting Standards Committee. Mr Mudalige has more than 25 years of experience in public accounting practice and in industry. He was a Member of the Securities and Exchange Commission of Sri Lanka (SEC) and chaired its audit committee. He is a Board Member of the Sri Lanka Accounting and Auditing Standards Monitoring Board (SLAASMB).
Mr Mudalige is the President of the Confederation of Asian and Pacific Accountants (CAPA), the largest regional body of accountants. The confederation includes the professional accountancy bodies of Asian and Pacific nations.
He is a Fellow of the Institute of Chartered Accountants of Sri Lanka (CA-SL), Fellow of the Chartered Institute of Management Accountants (CIMA-UK), Fellow of the Association of Chartered Certified Accountants (ACCA -UK) and Fellow of the Certified Public Accountants (CPA- Australia).
DirectorMiss D S C Jayawardena(Non-Executive Director)
R A
B.A. (Monash University, Australia),Certified Auditor (DNV-Norway),CIM – London,MCIM (U.K)Chartered Marketer
Appointed Director in April 2012. Miss D S C Jayawardena is a Director of Lanka Milk Foods (CWE) Plc., Lanka Dairies (Pvt) Ltd, Ambewela Livestock Company Ltd, Pattipola Livestock Company Ltd, Ambewela Products (Pvt) Ltd and Indo Lanka Exports (Pvt) Ltd, since 2009. During
H Member of HR & Remuneration Committee
N Member of Nomination Committee
R Member of Board Integrated Risk Management Committee
A Member of Audit Committee

Annual Report 2014 27
the recent past, she has also been appointed a Director of Stassen Exports (Pvt) Ltd, Milford Exports (Ceylon) (Pvt) Ltd, Stassen International (Pvt) Ltd, Stassen Natural Foods (Pvt) Ltd, Ceylon Garden Coir (Pvt) Ltd, Milford Developers (Pvt) Ltd, Stassen Foods (Pvt) Ltd and C B D Exports (Pvt) Ltd.
She has worked as an Intern for the Clinton Foundation in 2008.
Miss Jayawardena holds a B.A. (Commercial Law, Criminology, Sociology) from the Monash University, Australia, Professional Certificate in Marketing (CIM), Diploma in Marketing (CIM) and a Professional Postgraduate Diploma in Marketing (CIM). She is also a Certified Auditor (DNV-Norway), a Member of the Chartered Institute of Marketing (UK) (MCIM) and a Chartered Marketer.
DirectorMr R S Captain(Non-Executive Director)
N A
University of Miami, Florida
Appointed Director in April 2012. Mr R S Captain is a Director of Polypak Secco Ltd, Paints & General Industries Ltd, Paints & General Industries (Exports) Ltd,Polytex Garments Ltd, CIC Holdings PLC, Propertex Development Ltd, Austin Gloves (Ceylon) Ltd, CEI Plastics Ltd,Ranweli Ltd, Agriland Ltd, Forest Creek Park Ltd, Body Bar (Pvt) Ltd, Horahena Investments Ltd, Palmland Ltd, Parkland Ltd and Randiya Farms Ltd.
Mr Captain has had his Primary education at the Royal College and Secondary education (O/L & A/L) at Millfield, U.K. and the University of Miami, Florida
DirectorMr Amal Cabraal(Non-Executive Director)
H A
MBA (University of Colombo), FCIM (UK), Chartered Marketer
Appointed Director with effect from April 1st 2014. He is the former Chairman and Chief Executive Officer of Unilever Sri Lanka. He has over 3 decades of business experience in general management, marketing and sales and apart from Sri Lanka, he has served with Unilever in the United Kingdom, India and Bangladesh. He is an alumnus of INSEAD-France and holds an MBA from the University of Colombo, is a Chartered Marketer by profession and a Fellow of the Chartered Institute of Marketing - UK. He is an independent external Director of John Keells Holdings PLC, Ceylon Beverage Holdings PLC, Lion Brewery (Ceylon) PLC, S A Silva & Sons Ltd and also serves on the Supervisory Board of Associated Motorways Ltd. He is a committee member of the Ceylon Chamber of Commerce and serves on the Management Committee of the Mercantile Services Provident Society.
Company SecretaryMrs K A L Thushari RanaweeraAttorney at Law, Master’s Degree in Law (LLM) - University of Cambridge, United Kingdom.Diploma in International Affairs - Bandaranaike Centre for International Studies, Sri Lanka.
Appointed Company Secretary on 2nd January 2012. She is also the Deputy General Manager - Legal of the Bank. Mrs Ranaweera joined the Bank on 7th October 2010 and counts over 24 years of experience in the field of Banking.

Hatton National Bank PLC28
CorporateManagement
Left to Right
A J Alles M.B.A. - Finance (Stirling), A.I.B. (Sri Lanka)Managing Director / Chief Executive Officer
D P N Rodrigo M.B.A. (Cranfield), F.C.M.A.(UK), F.C.C.A. (UK)Chief Operating Officer
Ms I R D Thenabadu F.C.I.B. (London), F.C.M.A. (UK)Deputy General Manager - Credit & Transaction Banking
P D Hennayake M.B.A. (A.I.T.) Thailand, P.G. Dip. (Eng.), B.Sc. Eng. (Hons) Moratuwa, C.Eng., M.I.E. (Sri Lanka)Deputy General Manager - Services
A P L Fernando M.B.A. (Colombo), F.I.B. (Sri Lanka), Dip. in Bank Mgmt. Deputy General Manager - Development Banking
Ms K A L T Ranaweera Attorney at Law, LL.M. (Cambridge), Dip. in Int’l Affairs (BCIS)Deputy General Manager - Legal/Company Secretary
N H T I Perera A.C.A. (Sri Lanka)Deputy General Manager (Retail Banking & SME)
A Ratnasabapathy F.P.M.A.Assistant General Manager - Recoveries & Credit Quality Management
Annual Report 2014 29
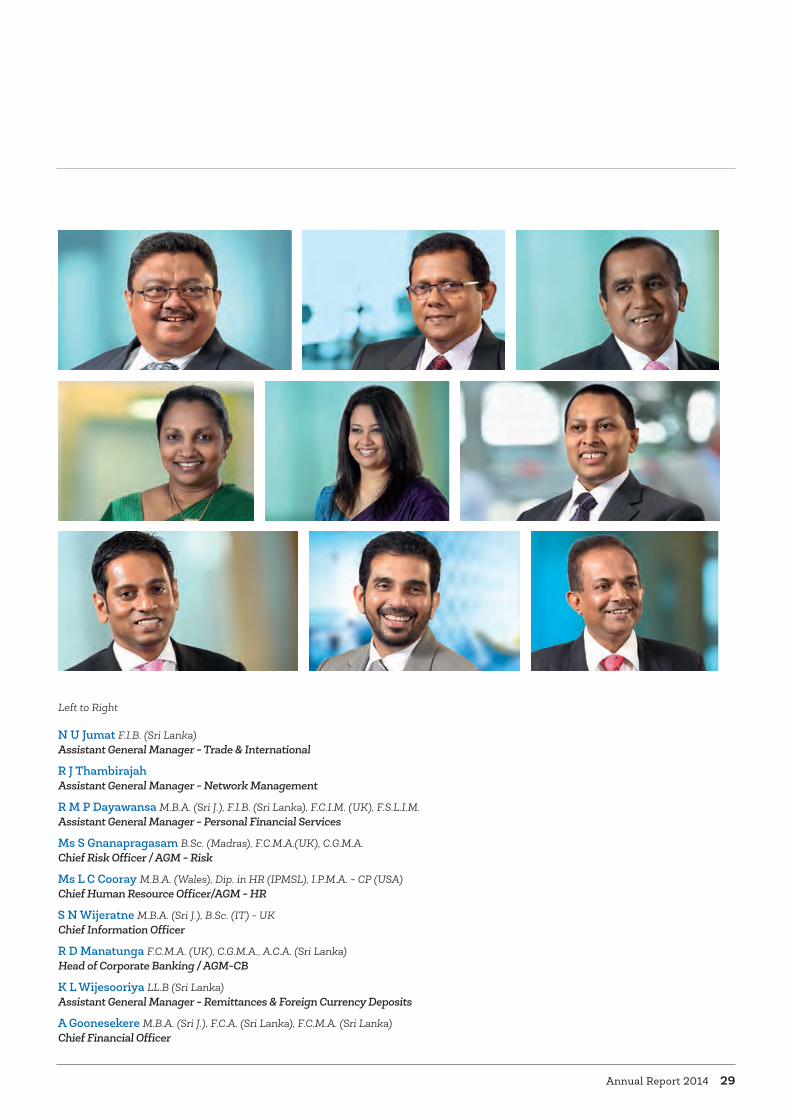
Left to Right
N U Jumat F.I.B. (Sri Lanka) Assistant General Manager - Trade & International
R J ThambirajahAssistant General Manager - Network Management
R M P Dayawansa M.B.A. (Sri J.), F.I.B. (Sri Lanka), F.C.I.M. (UK), F.S.L.I.M.Assistant General Manager - Personal Financial Services
Ms S Gnanapragasam B.Sc. (Madras), F.C.M.A.(UK), C.G.M.A.Chief Risk Officer / AGM - Risk
Ms L C Cooray M.B.A. (Wales), Dip. in HR (IPMSL), I.P.M.A. - CP (USA) Chief Human Resource Officer/AGM - HR
S N Wijeratne M.B.A. (Sri J.), B.Sc. (IT) - UKChief Information Officer
R D Manatunga F.C.M.A. (UK), C.G.M.A., A.C.A. (Sri Lanka)Head of Corporate Banking / AGM-CB
K L Wijesooriya LL.B (Sri Lanka)Assistant General Manager - Remittances & Foreign Currency Deposits
A Goonesekere M.B.A. (Sri J.), F.C.A. (Sri Lanka), F.C.M.A. (Sri Lanka) Chief Financial Officer

Hatton National Bank PLC30
1 V VijayakumarM.Sc. (I.T.) UK, A.I.B. (Sri Lanka), M.I.M.I.S. (Lond.),A.M.I.A.P. (Lond.), M.A.A.T. (Sri Lanka), M.B.C.S.Chief Manager - IT Operations
2 V RatnasabapathyA.C.I.B. (Lond.), A.C.S.I. (UK)Chief Manager - Risk
3 U N I ElapataB.A. (Hons) - Uni. of Texas (Austin)Chief Manager - Financial Institutions
4 Ms R PrabhakaranA.I.B. (Sri Lanka)Chief Manager - Treasury Operations
5 Ms N M C P WettasinhaAttorney-at-Law & Notary PublicChief Manager - Legal
6 W J T FernandoM.B.A. (Sri J), A.I.B. (Sri Lanka)Deputy Head - Network Management
7 A R UduwelaM.B.A. (Sri J.), B.Sc. Special (Pera.)Chief Manager - Operations
8 D S L Ferdinando A.D.C.M. (IBSL) Chief Manager - Corporate Banking
9 Ms K BalasubramaniamLL.B (Sri Lanka)Chief Manager - Human Resource Management
10 A V AbeygunasekaraM.B.A. (Colombo), B.Sc. (Colombo), A.C.M.A. (UK), A.C.I.Chief Manager - Treasury & Markets
11 M P Wickramasinghe M.B.A. (IT) (Moratuwa), M.Sc. (Colombo), B.Sc. (Pera.) Chief Manager/ Head of Cards & Electronic Delivery Channels
12 Ms M K RambukwellaM.B.A. (Sri J.), M. Sc. (Pera.), B.A. (Hons) - (Pera.), A.C.I.M. (UK), M.S.L.I.M., A.M.I.T.D.(Sri Lanka) Chief Manager - Learning & Development
13 W M C O Panditharatne Chief Manager - Procurement & Logistics
14 Ms A C De Silva GallageM.B.A. (Sri J.), B.B.A. (Special) - Colombo, A.C.M.A. (UK), C.G.M.A., C.P.A. (Australia), Dip. in Commerce (Uni of PNG), I.C.A. - LicentiateChief Manager - Finance
15 M K N S PereraM.B.A. (Manipal), Dip. in Marketing - L.B.S. (Sri Lanka)Chief Manager - Colombo Region
16 A G R Dissanayake B.B.A. (Colombo), A.C.M.A.(UK), C.F.A. (USA)Chief Manager - Planning & Investments
17 H J A Ferdinando Senior Manager - Centralized Operations
18 L S C L R FernandoA.I.B. (Sri Lanka) Senior Manager - SME
19 N M Kulatunga M.B.A. (Sri J.), A.I.B. (Sri Lanka) Senior Manager - Credit Administration
20 R L Maheswaran Regional Head - North Western Region
21 Ms G ArjunaF.C.M.A. (UK), F.C.P.A. (Australia), C.G.M.A. Senior Manager - Personal Financial Services
22 N Y LiyanageN.D.T. (Civil Eng.) - Moratuwa, P.G. Dip. in Project Mgmt. (Moratuwa), A.M.I.E. (Sri Lanka), M.S.S.E. (Sri Lanka)Senior Manager - Premises & Engineering
23 P ParananthanP.G. Exe.Dip. in Bank Mgmt. (IBSL)Senior Manager - Pawning
24 Ms A F M Fernando Senior Manager - Corporate Banking
25 N R Somasiri M.B.A. (Sri J.), B.Sc. (Colombo)Senior Manager - Credit Supervision & Recoveries
26 B V F MendisRegional Head - Greater Colombo Region
27 J N RupasingheSenior Manager - Systems Implementation
28 C S WeerasingheM.B.A. (Sri J), M.C.I.M. (UK)Senior Manager - Marketing & Communications
29 J C IlangantilekeM.B.A. (Manipal), B.A. (Hons) - Northumbria (UK), A.I.B. (Sri Lanka), C.I.M.A. Adv. Dip. M.A.Senior Manager - Trade Services
Senior ManagementTeam

Annual Report 2014 31
30 P D H MuthukumaranaM.B.A. (Sri J), P.G. Dip. in IT (SLIIT), M.B.C.S. (UK), M.I.E.T. (UK), M.I.E.E.E. (USA), C.S.M.Senior Manager - Enterprise Software
31 H L J P Bastiansz M.B.C.S. (UK), C.I.T.P. Senior Manager - Networks & Payment Systems
32 D DissanayakeRegional Head - South Western Region
33 R D R AmarasekaraDip. in Bank Mgmt. (IBSL) Senior Manager - Customer Relations & Business Dev. (Subsidiaries)
34 F MohamedMSc. (IT), (Uni. of Keele) - UKSenior Manager - IT Systems Security & Compliance
35 D I V SenadhiraAttorney-at-Law, M.B.A. (Sri J.), M.A.L.S. (Colombo)Regional Head - Central Region
36 L A M Hisham M.I.M. (Sri Lanka)Head of Islamic Banking
37 J Epasinghe M.B.A. (Australia), A.I.B. (SL), P.M.P.Head of Process Improvement & Change Management
38 N C RasiahM.B.A. (Australia), M.A. - Fin. Econ. (Colombo) B.Sc. (Colombo) A.I.B. (Sri Lanka)Regional Head - North Central Region
39 C JegarajahA.I.B. (Sri Lanka), C.I.M.A. Adv. Dip. M.A.Regional Head - Eastern Region
40 C B WijayaratneM.B.A. (Manipal), M.A. - Fin. Econ. (Colombo), F.I.B. (Sri Lanka), M.C.P.M.Compliance Officer
41 T D EdiriweeraLL.B , Attorney-at-Law, Notary Public & Commissioner for Oaths, M.I.C.M. (UK),F.I.C.M. (Sri Lanka)Senior Manager - Legal (Recoveries)
42 M S H NormanbhoyA.C.A. (Sri Lanka), A.C.M.A. (Sri Lanka) Senior Manager - Internal Audit
43 P GopikrishnanAI.B. (Sri Lanka), M.C.P.M.Deputy Regional Head - Colombo Region
44 M S AtapattuSenior Manager - City Office
45 J N WeerasingheSenior Manager - Cinnamon Gardens Branch
Managementreports
BEING A LEADER IS NOT JUST ABOUT BEING FIRST.ITS ALSO ABOUT THE STABILITY AND STRENGTH THAT MAKES US ONE OF THE MOST TRUSTED BANKS IN SRI LANKA.


Hatton National Bank PLC34
Reporting Parameters
About this report– Scope and reporting framework This year, Hatton National Bank presents its first integrated report, which contains data and information on aspects of our strategy, operations, and stakeholder management process, deemed as material to the sustainability of the Bank. This report covers mainly the performance of Hatton National Bank for the 12 month period from 01 January 2014 to 31 December 2014 as per the annual financial year reporting cycle of the Bank. The previous report published covered the Financial Year 2013.
Where relevant, the subsidiaries that make up the HNB Group have been included and wherever reference is made to subsidiaries, and the HNB Sustainability Foundation (a separate legal entity that acts as the Bank’s social development arm), it has been stated as such.
We have followed the Global Reporting Initiative Reporting Framework (GRI) in producing this report and have therefore included the GRI G4 key performance indicators. The sustainability information is presented “In accordance – Core” and includes disclosures pertaining to the Financial Services Sector Supplement. As per the process defined in G4 Sustainability Reporting Guidelines, the Report applies the four Principles for Defining Report Content: Materiality, Stakeholder Inclusiveness, Sustainability Context and Completeness.
The financial statements included in this report have been prepared in accordance with the Sri Lanka Accounting Standards in effect as at 31st December 2014. The Bank operates in compliance with the requirements of the Companies Act No. 7 of 2007 and the Banking Act. It is governed also by the Listing Rules of the Colombo Stock Exchange and is in compliance with the Code of Best Practice on Corporate Governance issued jointly by the Institute
of Chartered Accountants of Sri Lanka and the Securities and Exchange Commission of Sri Lanka.
Our endeavour has been to present an unbiased and accurate view of the Bank’s performance by adopting a balanced approach to reporting. Information is presented on the basis of comparability wherever possible, while positive and negative aspects of performance are discussed. We have made every effort to present the information in an understandable and accessible manner.
The Sustainability Reporting criteria mentioned in this report does not include any significant re-statement from the financial year 2013 and there were no significant changes in size, structure or ownership from the previous reporting period.
M/s Ernst & Young has provided an Independent Assurance Report on Hatton National Bank’s Integrated Report’s Sustainability Reporting Criteria. The Auditors review engagement was carried out in accordance with the International Standard on Assurance Engagements (ISAE 3000) and the Global Reporting Initiatives Sustainability Reporting Guidelines (“GRI Guidelines”).
The Bank recognises the critical role of stakeholder feedback in further enhancing its sustainability reporting frameworks. To facilitate better engagement and formal feedback, an Investor/Stakeholder Feedback Form is attached to this Report.
MaterialityThe Bank adopts an organic strategy review process that evolves based on the emerging sustainability needs of our stakeholders. We firmly believe that our success depends on knowing what matters to our stakeholders, and delivering it so they can do more. In this light, we constantly aim to define our approach to sustainability and are responsive to the fact that the materiality of sustainability issues and our response to them will evolve over time. As such, we:
• Monitor issues and spot trends that may impact future business
• Engage with stakeholders and build relationships to create an inclusive business in a bid to find common ground for more sustainable solutions
• Embed a long-term strategic sustainability culture throughout the Bank
• Integrate our sustainability approach across all business processes to obtain sustainable competitive advantages in the marketplace
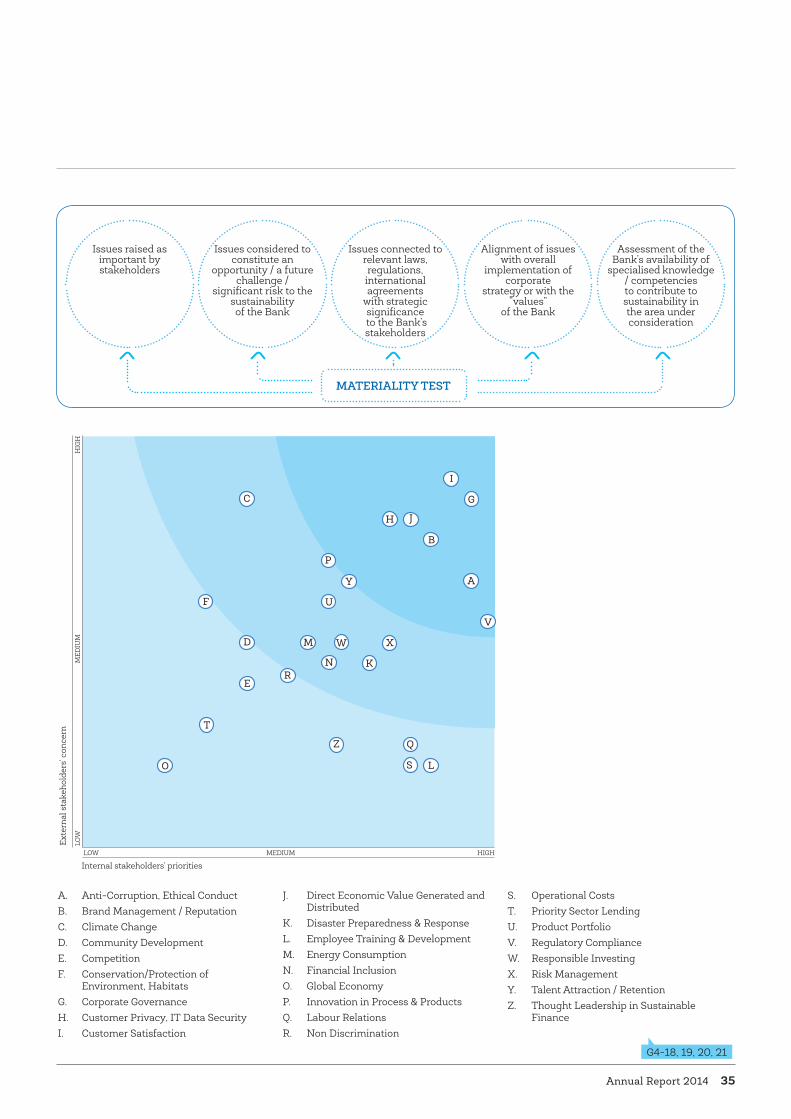
Thus, the materiality assessment process assists the prioritisation of the issues based on their potential impact on our business and their significance to our stakeholders. In turn, this process moulds future strategy development. These material aspects are more than primary topics for sustainability reporting. To an increasing degree, they also drive our strategic, planning and operations. We know that to remain a leader in our industry, we have to keep evolving and innovating in the ways our stakeholders care about most.
Integrated Management Discussion& Analysis
G4-13, 15, 18,19,20,21,22, 23, 28, 29, 30, 31, 32, 33
Annual Report 2014 35
Assessment of the Bank’s availability of
specialised knowledge / competencies to contribute to sustainability in the area under consideration
Alignment of issues with overall
implementation of corporate
strategy or with the “values”
of the Bank
Issues connected to relevant laws,regulations, international agreements
with strategic significance
to the Bank’s stakeholders
Issues considered to constitute an
opportunity / a future challenge /
significant risk to the sustainabilityof the Bank
Issues raised as important bystakeholders
MATERIALITY TEST
Exte
rnal
sta
keho
lder
s' co
ncer
n
LOW MEDIUM HIGH
Internal stakeholders' priorities
LOW
MED
IUM
HIG
H
C
P
Y
H J
I
G
B
A
V
X
K
W
U
M
NR
E
D
F
T
O
Z Q
S L
A. Anti-Corruption, Ethical Conduct B. Brand Management / ReputationC. Climate ChangeD. Community DevelopmentE. CompetitionF. Conservation/Protection of
Environment, HabitatsG. Corporate GovernanceH. Customer Privacy, IT Data SecurityI. Customer Satisfaction
J. Direct Economic Value Generated and Distributed
K. Disaster Preparedness & ResponseL. Employee Training & DevelopmentM. Energy ConsumptionN. Financial InclusionO. Global EconomyP. Innovation in Process & ProductsQ. Labour RelationsR. Non Discrimination
S. Operational CostsT. Priority Sector LendingU. Product PortfolioV. Regulatory ComplianceW. Responsible InvestingX. Risk ManagementY. Talent Attraction / RetentionZ. Thought Leadership in Sustainable
Finance
G4-18, 19, 20, 21
Hatton National Bank PLC36
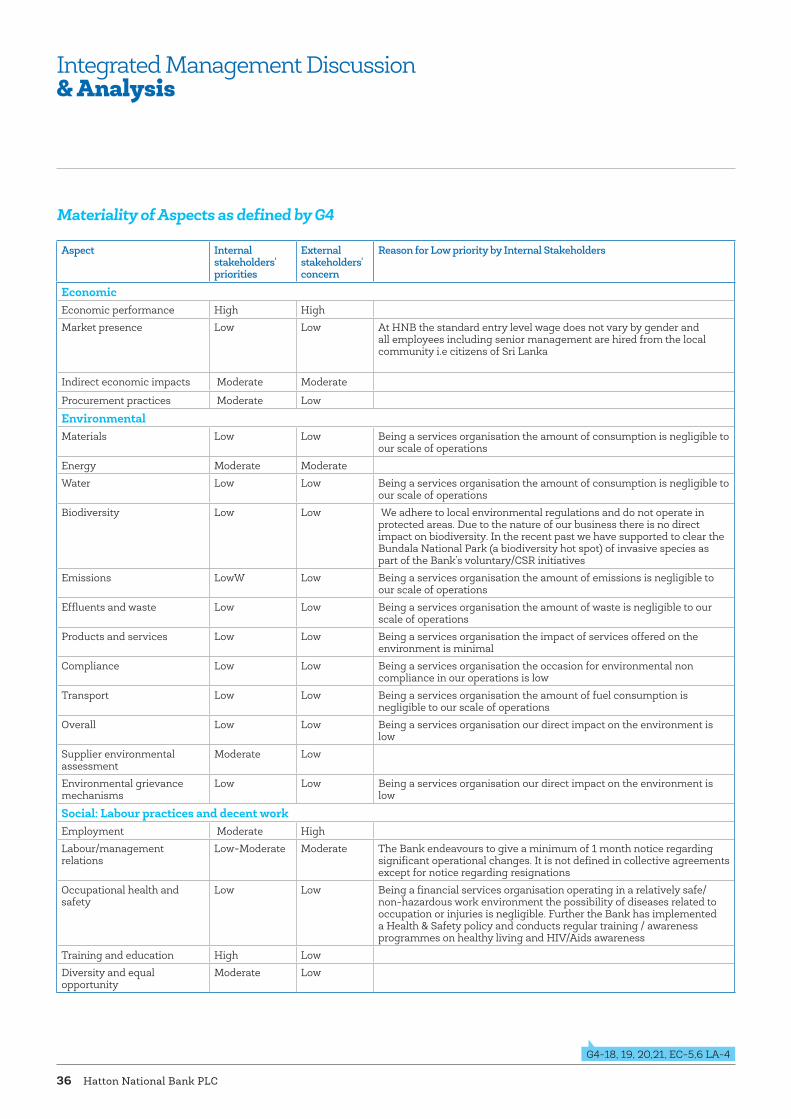
Materiality of Aspects as defined by G4
Aspect Internal stakeholders' priorities
External stakeholders' concern
Reason for Low priority by Internal Stakeholders
EconomicEconomic performance High High
Market presence Low Low At HNB the standard entry level wage does not vary by gender and all employees including senior management are hired from the local community i.e citizens of Sri Lanka
Indirect economic impacts Moderate Moderate
Procurement practices Moderate Low
EnvironmentalMaterials Low Low Being a services organisation the amount of consumption is negligible to
our scale of operations
Energy Moderate Moderate
Water Low Low Being a services organisation the amount of consumption is negligible to our scale of operations
Biodiversity Low Low We adhere to local environmental regulations and do not operate in protected areas. Due to the nature of our business there is no direct impact on biodiversity. In the recent past we have supported to clear the Bundala National Park (a biodiversity hot spot) of invasive species as part of the Bank’s voluntary/CSR initiatives
Emissions LowW Low Being a services organisation the amount of emissions is negligible to our scale of operations
Effluents and waste Low Low Being a services organisation the amount of waste is negligible to our scale of operations
Products and services Low Low Being a services organisation the impact of services offered on the environment is minimal
Compliance Low Low Being a services organisation the occasion for environmental non compliance in our operations is low
Transport Low Low Being a services organisation the amount of fuel consumption is negligible to our scale of operations
Overall Low Low Being a services organisation our direct impact on the environment is low
Supplier environmental assessment
Moderate Low
Environmental grievance mechanisms
Low Low Being a services organisation our direct impact on the environment is low
Social: Labour practices and decent workEmployment Moderate High
Labour/management relations
Low-Moderate Moderate The Bank endeavours to give a minimum of 1 month notice regarding significant operational changes. It is not defined in collective agreements except for notice regarding resignations
Occupational health and safety
Low Low Being a financial services organisation operating in a relatively safe/non-hazardous work environment the possibility of diseases related to occupation or injuries is negligible. Further the Bank has implemented a Health & Safety policy and conducts regular training / awareness programmes on healthy living and HIV/Aids awareness
Training and education High Low
Diversity and equal opportunity
Moderate Low
Integrated Management Discussion& Analysis
G4-18, 19, 20,21, EC-5,6 LA-4
Annual Report 2014 37
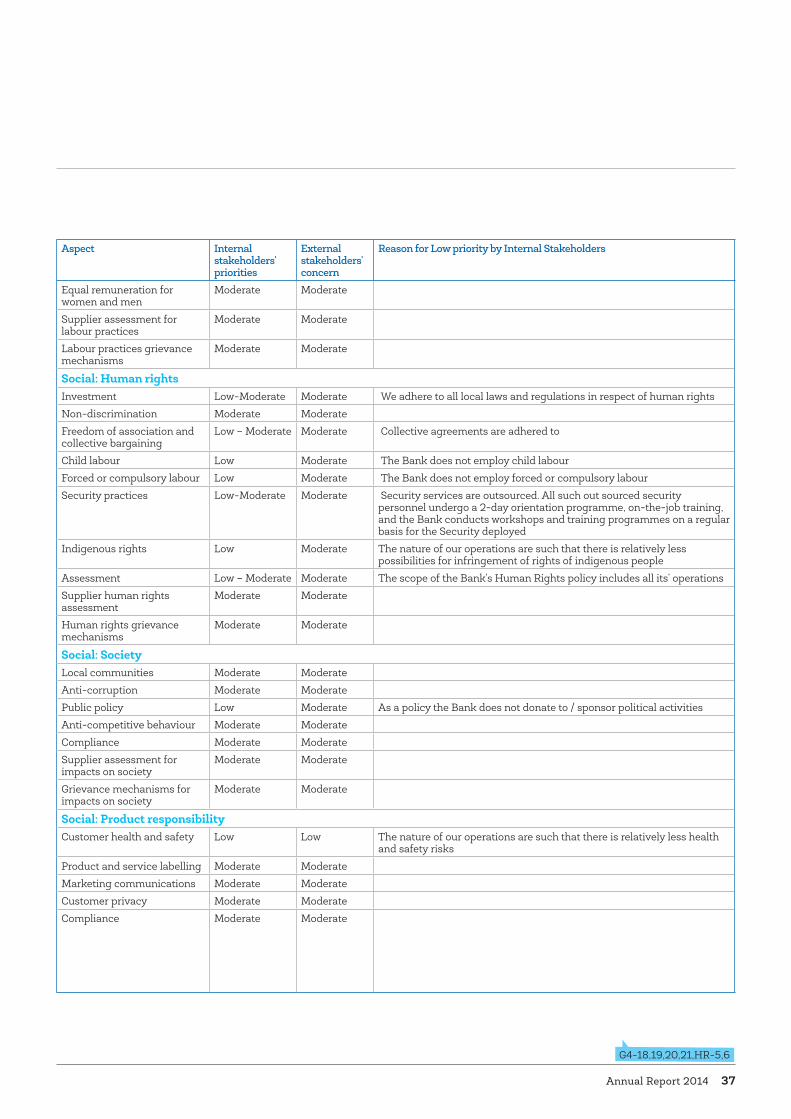
Aspect Internal stakeholders' priorities
External stakeholders' concern
Reason for Low priority by Internal Stakeholders
Equal remuneration for women and men
Moderate Moderate
Supplier assessment for labour practices
Moderate Moderate
Labour practices grievance mechanisms
Moderate Moderate
Social: Human rightsInvestment Low-Moderate Moderate We adhere to all local laws and regulations in respect of human rights
Non-discrimination Moderate Moderate
Freedom of association and collective bargaining
Low – Moderate Moderate Collective agreements are adhered to
Child labour Low Moderate The Bank does not employ child labour
Forced or compulsory labour Low Moderate The Bank does not employ forced or compulsory labour
Security practices Low-Moderate Moderate Security services are outsourced. All such out sourced security personnel undergo a 2-day orientation programme, on-the-job training, and the Bank conducts workshops and training programmes on a regular basis for the Security deployed
Indigenous rights Low Moderate The nature of our operations are such that there is relatively less possibilities for infringement of rights of indigenous people
Assessment Low – Moderate Moderate The scope of the Bank’s Human Rights policy includes all its’ operations
Supplier human rights assessment
Moderate Moderate
Human rights grievance mechanisms
Moderate Moderate
Social: SocietyLocal communities Moderate Moderate
Anti-corruption Moderate Moderate
Public policy Low Moderate As a policy the Bank does not donate to / sponsor political activities
Anti-competitive behaviour Moderate Moderate
Compliance Moderate Moderate
Supplier assessment for impacts on society
Moderate Moderate
Grievance mechanisms for impacts on society
Moderate Moderate
Social: Product responsibilityCustomer health and safety Low Low The nature of our operations are such that there is relatively less health
and safety risks
Product and service labelling Moderate Moderate
Marketing communications Moderate Moderate
Customer privacy Moderate Moderate
Compliance Moderate Moderate
G4-18,19,20,21,HR-5,6

Hatton National Bank PLC38
Integrated Reporting : The Bank has in place a process to identify material topics which the Directors and Management believe will have an impact on its ability to sustain growth over the medium to long term. This process has been influenced by the Bank’s Vision “To be the acknowledged leader and chosen partner in providing financial solutions through inspired people”; its Values and its Triple Bottom Line approach to business, taking into account the views and interests of the six key stakeholders namely, investors, customers, our employees, suppliers, the society and the natural environment. We strive to evaluate our performance in a wider context by including social and environmental dimensions to economic value creation. In this integrated report, the Sustainability Report included in our previous annual reports is not a standalone chapter but a part of the Management discussion and Analysis. This discussion also strives to collate and demonstrate the linkages amongst the different business units of the Bank, and how these adopt a seamless approach to crafting and achieving the Bank’s strategies.
Formulating Business Strategy The sustainable strategies presented below are an outcome of the annual strategic planning process and the insight gained from continuous engagement with our stakeholders. This year, the process of strategy formulation took on a more participatory approach which resulted in an inflow of input with, horizontal and vertical representation from across the different divisions and tiers, and the many locales. The process engaged three teams branded as “Catalysts”, “Acumen” and “Aspire”, comprising senior management, middle level leaders and young leaders with high potential, respectively. These three teams, together with the Bank’s corporate management team participated in a brainstorming exercise to shape HNB’s strategy for the next three years.
Management Review & Preview
Introduction This year’s annual report is HNB’s first “Integrated Report”, a natural evolution of our long-held belief that sustainable value creation is an integrated process, and is a result of the interplay among financial, human, intellectual and manufactured capital, as well as the natural environment and society within which the Bank operates. To enhance reporting credibility, the Bank also sought external assurance from Ernst & Young Sri Lanka.
A sustainable approach underscores the importance of taking a longer-term perspective about our business, the consequences of today’s activities, and of stakeholder cooperation to reach viable solutions.
As a financial institution, we consider it our business to help create, grow and protect wealth. Our promise of being a “partner in progress” extends not just to those that work directly with us, but also to the wider network of stakeholders influenced and impacted by our actions and indeed the nation as a whole. Hatton National Bank is committed to playing an integral role in the development of Sri Lanka and in fuelling its journey towards becoming an upper middle income country.
Integrated Management Discussion& Analysis

Annual Report 2014 39
Diminishing margins have validated our focus on driving sales and fee income, improving productivity through process re-engineering and improving service quality.
Over the past few years, the Bank has recognised technology as the key driver in implementing some of its strategies, and accordingly, has invested over Rs 1 Bn to upgrade the Bank’s IT platforms. Some of the specific initiatives to ensure we harness cutting edge technology to create value to our stakeholders will be discussed in the ensuing pages of the management discussion.
This technological thrust has become a key enabler of the Bank’s strategic imperatives such as customer convenience, driving sales, increasing fee income, cost optimisation and minimising our carbon footprint.
Cost optimisation, underscored by the context of diminishing margins and intensity of market competition, is also one of our key imperatives which is being bolstered through Business Process Re-engineering (BPR). The BPR exercise that commenced in the latter part of 2013 enabled by the technological
advancements over the last couple of years, has begun to yield the many benefits of economies of scale viz speed, standardisation and specialisation, to all our stakeholders. An increasing number of functions and processes will continue to be centralised and automated; yielding the convergence of a multitude of benefits, such as enhanced customer convenience, cost optimisation, increase in fee income as well as employee empowerment.
With the enhancement of the IT platform and the projects completed in 2013 and 2014, the objectives of our technology and digitisation will shift from productivity improvement to product and process innovation. As lifestyles evolve, we have identified Smart ATMs and Kiosks, Internet banking, cards, digital and mobile devices as some of the key technological channels to meet market demands.
Product innovation will continue to be a priority for the Bank. Identifying product and service gaps and filling in those gaps have been key responsibilities of the product development committee. The launch of HNB YOU was a step in this direction.
HNB’s brand equity has been a key competitive advantage and we will continue to harness it to create sustainable value for all our stakeholders. As Sri Lanka’s oldest private commercial bank with over 125 years in business, attributes of trust, stability and enduring strength have been synonymous with brand HNB. Whilst we will continue to reinforce and re-emphasise these brand attributes as key competitive advantages, we have also recognised the need to evolve, integrate and communicate additional brand attributes - of agility and technological advancement in order to stay nimble amidst rapidly changing life styles and consumer needs. Our strength and stability are well known, but the fact that we have also been pioneering technological advancements to create alternate delivery channels and enhance service, is less known. Creating market awareness of the Bank’s sub brand attributes to bridge this perception gap is a priority for the year ahead. The launch of “New World Banking” campaign is a step in this direction.
We are mindful that products and electronic media are easily replicable, and often at a lower cost than that of the initial innovation. We have hence identified service excellence as a strategic imperative to differentiate ourselves in order to sustain market leadership in Sri Lanka’s Banking sector.
Strategic Overview The seven strategic imperatives of the Bank presented are those we consider important to create value for key stakeholders of the Bank, in the context of the objectives, strengths and weaknesses of the Bank and the opportunities and risks in the environment it operates in. Whilst Technological Advancement and Service Excellence were key imperatives for 2013 and 2014 respectively, our strategic focus for the years 2015-2017 encompasses the Bank’s Processes, People and Technology.
Sri Lanka’s banking industry has been intensely competitive; and combined with an environment of declining interest rates since early 2014 has resulted in diminishing net interest margins. Low private sector credit growth during the year further exacerbated the pressure on net interest income.
The Bank’s strategies to overcome this challenge can be summarised thus:
Digital Transformation Operational Excellence
Sales Driven Culture
Expansion of fee incomeConversion from brick & mortar to digital channelsDigital marketing communications
Centralisation
Cost optimisation
Process re-engineering
Digital marketing
Incentivising
Redeployment of resources,
Direct sales agents
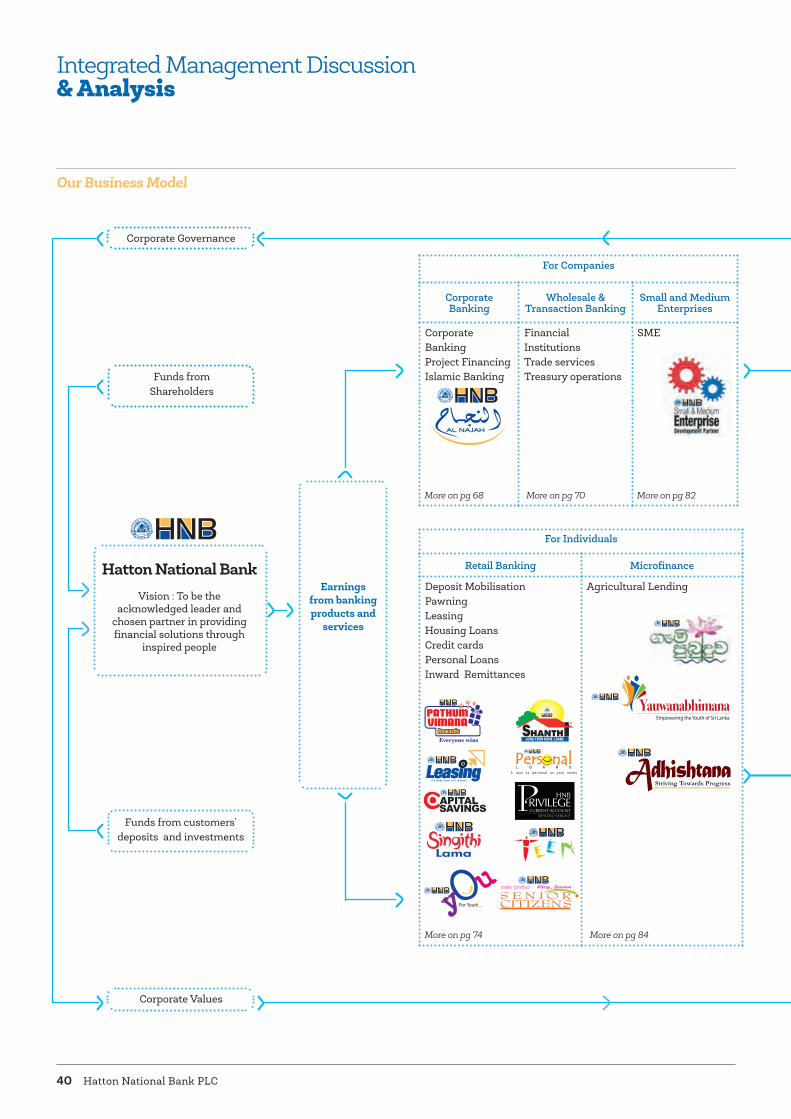
Hatton National Bank PLC40
Integrated Management Discussion& Analysis
For Individuals
Retail Banking Microfinance
Deposit MobilisationPawningLeasingHousing Loans Credit cards Personal LoansInward Remittances
Agricultural Lending Earnings from banking products and
services
Funds from Shareholders
Corporate Governance
Corporate Values
Vision : To be the acknowledged leader and
chosen partner in providing financial solutions through
inspired people
Funds from customers’ deposits and investments
Hatton National Bank
For Companies
Corporate Banking
Wholesale & Transaction Banking
Small and Medium Enterprises
Corporate Banking Project Financing Islamic Banking
Financial Institutions Trade services Treasury operations
SME
Our Business Model
More on pg 68
More on pg 74 More on pg 84
More on pg 70 More on pg 82
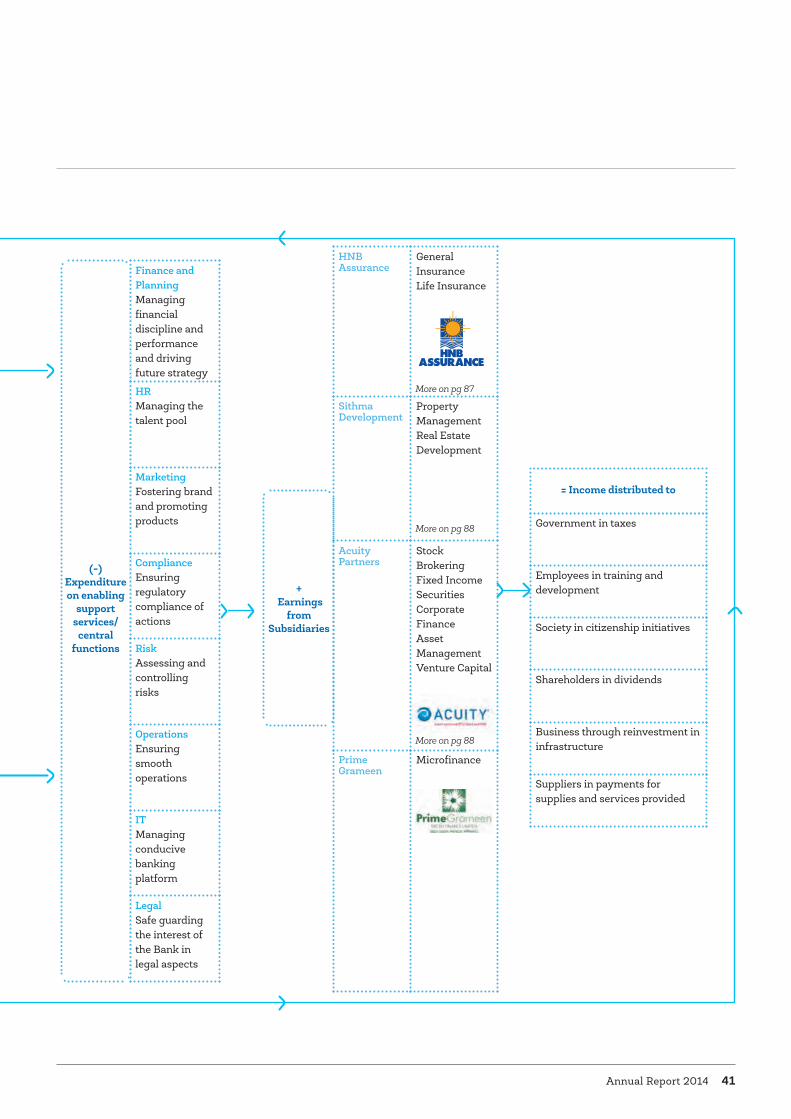
Annual Report 2014 41
HNB Assurance
General Insurance Life Insurance
Sithma Development
Property Management Real Estate Development
Acuity Partners
Stock Brokering Fixed Income SecuritiesCorporate FinanceAsset Management Venture Capital
Prime Grameen
Microfinance
(-)Expenditure on enabling
support services/
central functions
+ Earnings
from Subsidiaries
= Income distributed to
Government in taxes
Employees in training and development
Society in citizenship initiatives
Shareholders in dividends
Business through reinvestment in infrastructure
Suppliers in payments for supplies and services provided
Finance and PlanningManaging financial discipline and performance and driving future strategy
HRManaging the talent pool
Marketing Fostering brand and promoting products
ComplianceEnsuring regulatory compliance of actions
RiskAssessing and controlling risks
Operations Ensuring smooth operations
ITManaging conducive banking platform
LegalSafe guarding the interest of the Bank in legal aspects
More on pg 87
More on pg 88
More on pg 88
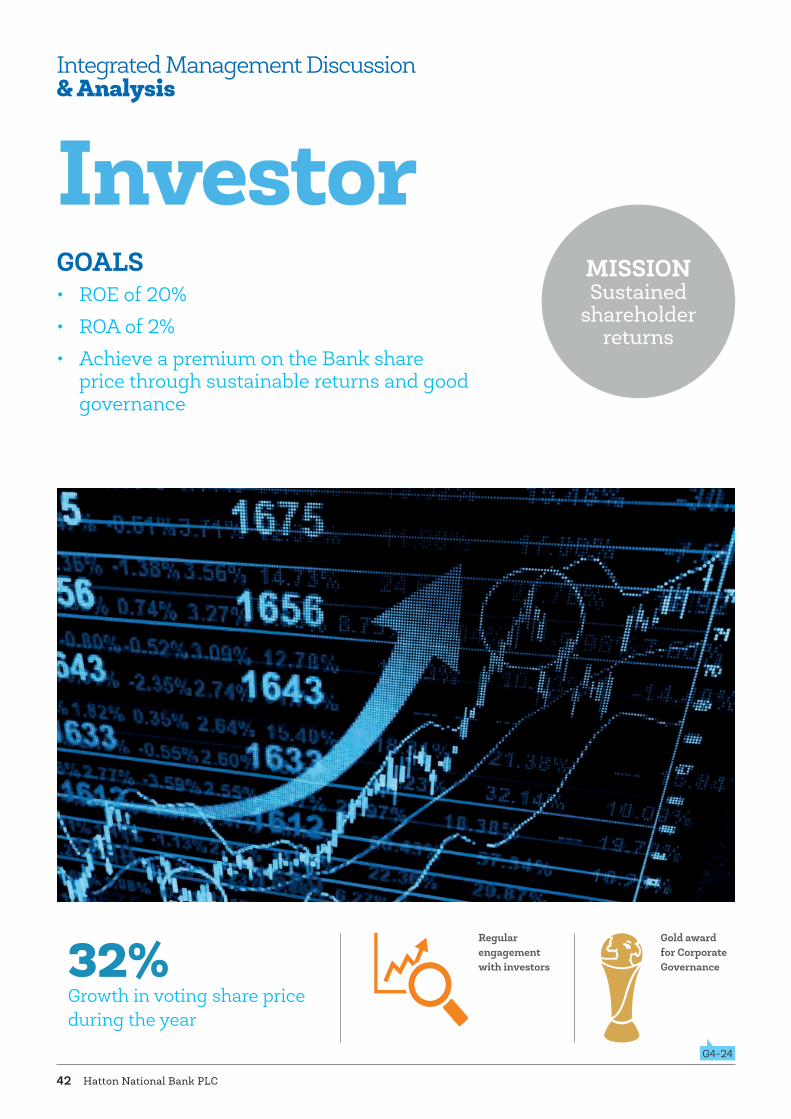
Hatton National Bank PLC42
Investor
32% Growth in voting share price during the year
Regular engagement with investors
Gold award for Corporate Governance
GOALS • ROE of 20% • ROA of 2%• Achieve a premium on the Bank share
price through sustainable returns and good governance
MISSION Sustained
shareholder returns
Integrated Management Discussion& Analysis
G4-24
Annual Report 2014 43
STRATEGIC IMPERATIVES
Embed a more sales driven culture and facilitate balance sheet growth
In 2014• Created teams dedicated for sales, at branches.• Deployed more staff to sales and marketing by relieving them of back office functions via the centralization and
automation. • Introduced performance related incentives for sales.• Increased empowerment of Branch Managers and Regional Managers.• Introduced a technology driven Lead Management Solution to track work-flows and provide oversight of business
opportunities.• Introduced sales dashboards for segments to track performance.• Provided training to non trade officers on the technical aspects of trade solutions, enabling sale of trade products
at branch level, which would yield benefits in 2015. • Strengthened the dedicated SME unit at head office to develop, monitor and implement strategies to drive SME
business across the network. • Invested in Prime Grameen to drive microfinance business with more focus and vigour.
Plans for 2015• Further strengthen sales capability for business segments through centralised sales teams.• Offer end to end solutions to corporate clients, adopting a seamless marketing approach.• Redefine the role of regional heads with more emphasis on sales. • Launch promotional campaigns overseas targeting expatriate population for inward remittance business and
financial products.• Leverage technology to drive trade and payroll business.• Further refine the incentive schemes for sales.• Obtain funding to drive balance sheet growth.
Increase fee incomeIn 2014• Aggressively deployed mobile and non-mobile POS devices to strengthen the market leadership position in
Merchant Acquiring.• Deployed resources to improve fee income from trade business.• Provide more convenience and choice to customers through electronic channels leading to new opportunities for
fee income.• Increased fee based revenue by 17% via the automation of transaction fees and penalty fees by eliminating
omissions that occur with manual application. • Conducted seasonal promotional campaigns to reach remitters from across key Middle Eastern and European
corridors as well as recipients.
Plans for 2015• Sales drives to increase Credit Card customer base. • Deployment of technology and skill development for trade processing. • Further enhance the scope of E banking and other fee based services to increase fee levying opportunities for the
Bank while improving customer convenience.• Leveraging technology to improve delivery standards on remittances.• Driving utility bill payments through e-channels.

Hatton National Bank PLC44
Reduce NPAs and further strengthen underwriting standardsIn 2014• Enhanced recovery efforts through appointment of a separate recovery manager for each region.• Upgrade credit skills of Account Relationship Managers (ARMs) and credit officers.• Concentrated on recovering large NPAs• ARMs built closer relationships with clients, enabling a more proactive approach and early identification of cash flow deficiencies.• Strengthened credit controls for customers who have a high propensity to fall into NPAs.• Strengthened the watch listing process.• Further improved the impairment models.
Plans for 2015• Implement a vigourous post credit review mechanism at regional level. • Provide extensive on the job training with specialized focus on cashflow based lending.• Continue to focus on recovering large NPAs.• Complete automation of the watch-listing process.• Improve underwriting standards.
Ensure cost optimisation and operational excellence through business process re-engineering
In 2014• Centralised the processing and underwriting of retail credit of the three largest regions which account for over 60% of the Bank’s
volumes yielding economies of scale.• Process improvements enabled re-deployment of staff to more value adding activities such as cross selling and marketing of fee
income products.• Centralisation of a number of back office functions has reduced staff overtime and transportation costs and yielded many cost
benefits. • Automation of certain treasury functions resulted in speedier compilation of reports and transactions. • Further expanded the outsourced cash loading to ATMs, which was hitherto limited to stand alone ATMs thereby reducing the
amount of idle cash in branches and relieving branch staff of cash balancing. • Introduced “Straight Through Processing” of inward remittances thus expediting transactions, eliminating human intervention
and deploying them for more value adding work.
Plans for 2015• Roll out the centralisation of retail credit processing and underwriting to the other seven regions.• Implement the Branch Target Operating Model (BTOM). • Centralisation of trade processing. • Introduce the Document Management System which will link all customer data across divisions and enable the storage and
accessibility of images, increasing safety of documents and greater control over customer management.
Continue to strengthen transparency, governance and communicationIn 2014• Participated in overseas and local investor forums / road shows.• Organised two webex sessions for investors.• Adhered to governance requirement and internal prudent guidelines developed on sector/ group exposures.• Detailed disclosures on governance in Annual Report 2013 which enabled the Bank to win the Gold Award for Corporate
Governance at the Annual Report Awards organised by CA Sri Lanka
Plans for 2015• Continue investor communication through road shows / investor meetings.• Organize an investor forum in early 2015.
Integrated Management Discussion& Analysis
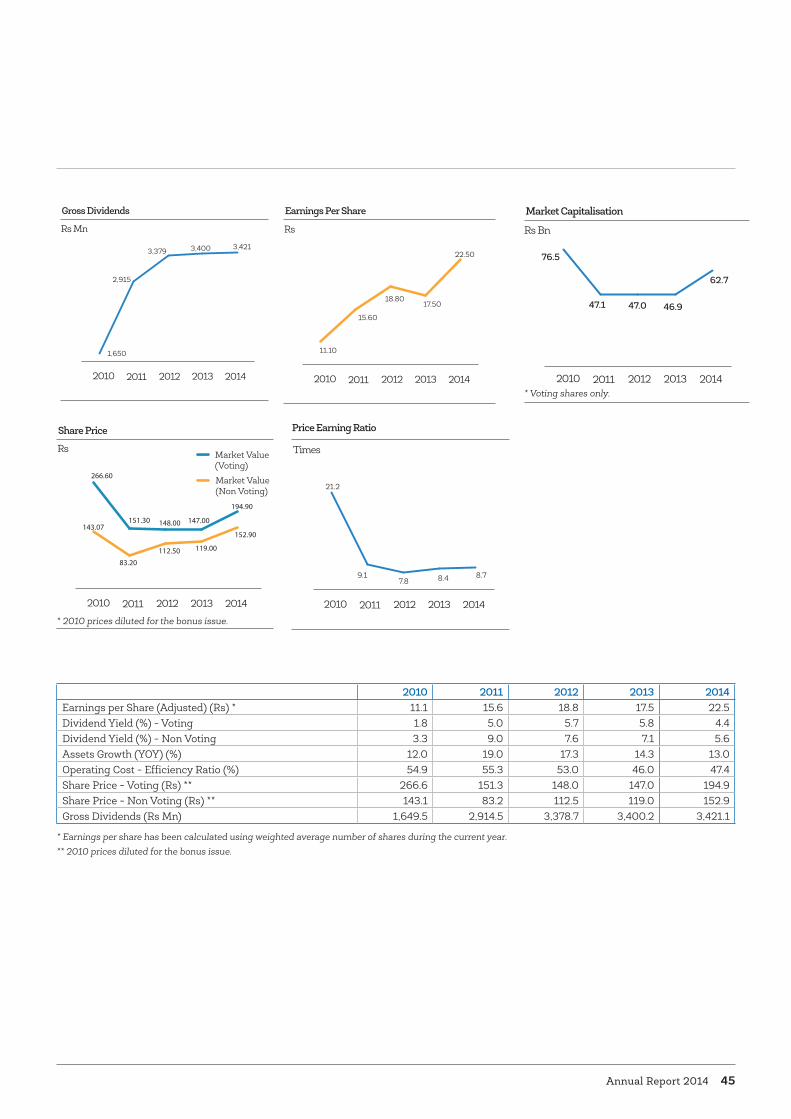
Annual Report 2014 45
Gross Dividends
Rs Mn
2010 2014201320122011
1,650
2,915
3,379 3,4213,400
Share Price
Rs
2010 2014201320122011
Market Value(Voting)
Market Value(Non Voting)
266.60
143.07
83.20112.50 119.00
152.90
151.30 148.00 147.00
194.90
Earnings Per Share
Rs
2010 2014201320122011
11.10
15.60
18.8017.50
22.50
Price Earning Ratio
5
10
15
20
25
Times
2010 2014201320122011
21.2
9.17.8 8.4 8.7
2010 2011 2012 2013 2014Earnings per Share (Adjusted) (Rs) * 11.1 15.6 18.8 17.5 22.5 Dividend Yield (%) - Voting 1.8 5.0 5.7 5.8 4.4 Dividend Yield (%) - Non Voting 3.3 9.0 7.6 7.1 5.6 Assets Growth (YOY) (%) 12.0 19.0 17.3 14.3 13.0 Operating Cost - Efficiency Ratio (%) 54.9 55.3 53.0 46.0 47.4 Share Price - Voting (Rs) ** 266.6 151.3 148.0 147.0 194.9 Share Price - Non Voting (Rs) ** 143.1 83.2 112.5 119.0 152.9 Gross Dividends (Rs Mn) 1,649.5 2,914.5 3,378.7 3,400.2 3,421.1
* Earnings per share has been calculated using weighted average number of shares during the current year. ** 2010 prices diluted for the bonus issue.
* 2010 prices diluted for the bonus issue.
* Voting shares only.
Market Capitalisation
2010 2014201320122011
76.5
47.1 47.0 46.9
62.7
Rs Bn

Hatton National Bank PLC46
249 Branches
450 ATMs
Serving customers through
and digital channels
Products ranging from new borns to senior citizens and from micro entrepreneurs to conglomerates
Improved service delivery through process improvements
CustomersGOALS • Rank amongst the best in the market surveys
carried out by research agencies• Achieve a score of over 80% ratings of “good”
and “very good” on mystery shopper surveys• Reduce customer service related complaints
by 25%
MISSION Constantly
exceed expectations in catering
to customer financial needs
Integrated Management Discussion& Analysis
G4-24, PR-5

Annual Report 2014 47
Understanding customer perceptions and communicating with customersIn 2014• Conducted market research to identify customer perceptions and feedback to continuously improve service standards• The Bank continued to track Brand Equity and measures were taken to address identified areas.• Enhanced presence in social media platforms such as Facebook and Twitter to provide information on new products and services and obtain
customer feedback• Ranked amongst top five banks in term of spending on marketing communications.
Plans for 2015• Launch phase I of corporate marketing campaign “New World Banking” in the 1st quarter of 2015, which will highlight choice and customer
convenience in using electronic and mobile banking solutions.• Continue to track the brand equity with research partner.• Increase use of mobile and other digital channels for marketing communications
Enhance customer convenience through E-channelsIn 2014• Enhanced the E banking platform facilitating new services.• Pioneered the installation of bulk cash deposit machines which have the ability of real time crediting of accounts.• Installed kiosk machines for utility bill payments• Introduced Direct File Upload facility for inward remittances enabling immediate credit to customer accounts.• Expanded the Home Counter• Launched Sri Lanka’s first ever Life Style Mobile App using Augmented Reality, enabling customers to check product information, promotions
and locate branches and ATMs.• Offered more choice and convenience to customers through a variety of electronic channels.
Plans for 2015• Introduce more ATMs with special features.• Improve delivery standards on inward remittances.• Upgrade the E banking platform to enhance features and functionalities.• Assist customers to adopt electronic channels for more convenience
Enhance the customer service propositionIn 2014• Introduced service/delivery standards both at process and approval levels.• Provided a speedier service through automation and centralisation of functions. Eg: a customer’s time required to open an account was reduced
from 30 minutes to 5 minutes.• Number of applications processed by the centralised back office unit increased from 1,200 to 1,800 a day.• Launched a new youth product ‘HNB YOU’ identifying the changing life styles in this important segment.• Launched a US Dollar Visa International Travel Card for the frequent overseas travellers.• Trained front line staff on service quality excellence.• Conducted mystery shopper surveys on branches to track service standards.• Greater emphasis was made on handling customer complaints, including sharing customer complaint experiences in the in-house magazine in
a separate column as ‘Incidentales’.
Plans for 2015• Continue to strengthen and leverage HNB’s correspondent banking relationships across the globe.• Increase number of frontline staff to serve customers.• Leverage on the strength of having CDCS qualified staff in the trade business and continue to sponsor staff to obtain CDCS qualifications.• Further improve processes to reduce service time. • BTOM to make branches customer service centres.
STRATEGIC IMPERATIVES

Hatton National Bank PLC48
100,944classroom training hours
• Aspire• Acumen• Catalyst
3-tiered leadership development track for hi-potentials
Overall Award for ‘Best Results Based Training’ for the 3rd consecutive year at the Asia’s Training & Development Excellence Awards 2014 organised by the World HRD Congress
EmployeesGOALS • Higher engagement score above Asia Pacific
Banks in HNB Seva Prathirawa• Continual increase of staff productivity and
retention year on year• Strengthen the HNB Employer Brand
MISSION Offer a unique
employee value proposition of
equal opportunity, stability and
security
Integrated Management Discussion& Analysis
G4-24

Annual Report 2014 49
Lean Organisation - Productivity enhancement for a leaner organisation In 2014• Introduction of flexible and alternative work contracts• “Reach Out”, mentorship programme• Operating model aligned to sustainable business
Plans for 2015• Up-skilling, multi skilling and enabling transformation in line with Bank’s strategic imperatives • Enhance value creation by employees • Optimal staff deployment based on branch target operating model
Seamless Learning - Migration from pedagogy to virtual learning and on site learning delivery
In 2014• Classroom to Virtual learning increased from 28% to 37%• 2,505 employees interacted on virtual learning platforms, an increase of 9% • Product and Compliance training modules introduced on e-learning in 2014• Work in progress to launch a trend setting e-learning solution
Plans for 2015• Over 50% of classroom learning to migrate to virtual platform• Connecting silver surfer learners and digital natives on a common virtual learning space• Strengthen existing core training portfolio with well researched and developed training modules
Talent Pipeline - Build a critical mass through succession planningIn 2014• HNB Leadership Academy offering Aspire, Acumen, Catalyst executive education and leadership development• 3-tiered leadership development track for hi-potentials, mid career and senior leaders• 360° structured development feedback and dedicated Master Coach for executive coaching
Plans for 2015• 2015 – Year of Knowledge and Learning• Inculcate coaching and mentoring as an integral role of a senior leader• Continual investment to strengthen HNB Leadership Academy
Future Organisation - Workforce alignment to future readiness for Gen Ys and Gen ZsIn 2014• HNB Seva Prathirawa engagement survey scoping multigenerational aspirations• Social media policy for employees• “Unleash” –ideas to the Board room innovation challenge for millenials• “Future Leaders” another first, well researched and internally developed leadership programme for Management Trainees
Plans for 2015• Accelerated sales and service centric skills development• Experiential learning on New World Banking
Agile Rewards - Superior rewards for superior performance and new recognition scheme for team based results
In 2014• Sales incentives to staff with further enhanced growth opportunities• Performance based pay and special team incentives for branch staff
Plans for 2015• Expansion of dedicated business development staff for multiple distribution channels• Enhanced earnings potential and financial security of employees
STRATEGIC IMPERATIVES

Hatton National Bank PLC50
Rs.7.2 BnTo all suppliers and service providers.
Fostering ethical practices among suppliers.
Green procurement policy
SuppliersGOALS • Transparent mechanism of selecting suppliers• Assist suppliers to improve their services and
products• Ensure suppliers have a sustainable business
model• Encourage ethical practices among suppliers
MISSION To nurture long term win-win partnerships
Integrated Management Discussion& Analysis
G4-12,24

Annual Report 2014 51
Ensure transparency in selecting suppliers In 2014• Developed processes to ensure supplier adherence to laid down procedures.
Plans for 2015• Improve speed and transparency of procurement process.
Develop long term relationships with selected suppliers In 2014• Provide credit facilities to suppliers.
• Broad basing the supplier base for key supplies.
• Outsourcing non core activities thereby increasing the number of partnerships.
• Ensure adherence to social and environmental norms when selecting suppliers.
Plans for 2015• Making payments made electronically to suppliers.
• Fostering ethical practices among suppliers.
Sustainable framework through green procurement policyIn 2014• Over 60% purchases from local suppliers at SME level.
Plans for 2015• Assist the suppliers to build a sustainable business model
STRATEGIC IMPERATIVES

Hatton National Bank PLC52
39,122 participants
Financial inclusion /entrepreneurship programmes.
Increased investment in micro finance
Top 10 Best Corporate Citizen Award
SocietyGOALS • To be perceived as the best corporate citizen in the
country
• To engage with the community at every level towards community development
• To act as a catalyst for positive change through action in healthcare, education and entrepreneurship
• To minimise poverty in the country through financial inclusion
MISSION Upliftment of
the communities in which we operate, the
society and the nation
Integrated Management Discussion& Analysis
G4-24, EC-7,8

Annual Report 2014 53
Financially empower new segments of the population In 2014• Invested in a dedicated micro finance entity.• Introduction of a new Small & Medium Enterprises Export Credit (SMEEC) Scheme to expand Trade related support to this sector.• Provided a special credit line for tea small holders and students from vocational training institutions.
Plans for 2015• Continue to fund large scale projects to build nation’s infrastructure.• Provide support to Prime Grameen to carry out their operations on a larger scale. • Attract foreign funding for local microfinance business and SME.
Build the nation’s human capital by supporting knowledge creation / education
In 2014• Continued to support 200 Nena Pubuduwa school libraries and 15 computer centres. • Upgraded the school computer centre at Weihena Kanista Vidyalaya, Galle.• Launched ‘Donate A Book Campaign’ engaging customers, employees and community.• Principal patron of the National Trust Sri Lanka..
Plans for 2015• Continue to support education at a national level
Supporting health and wellbeingIn 2014• Assistance to rural hospitals. • Water and Sanitation
_ Continuation of Sri Pada Project. _ Safe drinking water facilities to two schools._ Donation of 50 water tanks under the drought relief programme in Polonnaruwa.
• Maintenance of cancer counselling centre.• Financial assistance to 50 cancer patients.• HIV & AIDS
_ Community awareness programme in collaboration with national STD unit at Kilinochchi._ Membership for Lanka Business Coalition for HIV & AIDS.- Commemoration of World AIDS Day – awareness video for employees.
Plans for 2015• Continue to focus on pillars idendified - water, sanitation, HIV/Aids awareness and improving standards of rural hospitals.
Financial literacy and capacity building In 2014• To enhance entrepreneurial, financial management skills amongst SMEs the Bank organised seminars and workshops with the financial
assistance of SMEDeF credit line.• Two seminars on international trade were held for customers.• Conducted several programmes during the year to uplift micro entrepreneurs.
Plans for 2015• Build capacity and improve financial literacy, especially among disadvantaged segments in the market.
STRATEGIC IMPERATIVES

Hatton National Bank PLC54
492,567 kWh
Energy saving (Electricity) Green Pledge and continuous awareness programme on energy efficiency, eco- friendly behaviours
3rd fully fledged “green” building
EnvironmentGOALS • To promote environmental conservation at
the work place through the Green Pledge and minimise carbon foot print
• To promote responsible lending practices through green banking and green procurement
MISSION Sustenance
of the natural environment for
the betterment of all living beings
Integrated Management Discussion& Analysis
G4-24
Annual Report 2014 55
Integrate environmental conservation into our products, policies and daily operations
In 2014• Progressed towards implementation of an Environmental and Social Management System (ESMS) for lending decision making.• Continued to fund renewable energy projects.• Offered rebates on bill payments via electronic channels in place of the traditional which require more paper and visits to branches.• Offered concessionary rates on leasing facilities for hybrid vehicles.• Minimise use of paper in office and for meetings.• Minimise stockholdings to reduce wastage.
Plans for 2015• Strengthen the dedicated unit for appraisal and monitoring of environmental and social impacts of credit facility requests.
Nurture environmental consciousness in our people In 2014• Green Pledge.
- Awareness programme. - Donation of saplings to school children - in partnership with British Council Kandy to commemorate environment day
• Environmental Projects.- • - Commemoration of International Day for Bio diversity.
Plans for 2015• Focus on Green Banking.• Contribute to the 1 million tree campaign in partnership with the Rotary Club.
Minimise our carbon footprint In 2014• 3 R policy – Reduce, Reuse and Recycle towards all tangible resources.• 80% of employees have been converted to e-statements.• Automation of SWIFT transfers eliminating the printing of copies in triplicate saving 4,200 printouts per day.• Introduction of energy efficient lighting, signages and air conditioners.• Introduction of solar PV systems.
Plans for 2015• Convert 25% of our customers statement requirements to e-statements.• Transferring certain applications to a cloud environment reducing the requirement for servers and energy.• Expand LED lighting
STRATEGIC IMPERATIVES

Hatton National Bank PLC56
Stakeholder EngagementStakeholder and rationale for selection
Sustainable Business Objective
Channels of Communication
Reasons for Engagement
Key Topics / Issues Raised Our Responses / Achievements
InvestorsBeing the contributors of capital and entrepreneurship
To inspire investor confidence by balancing profitability and sustainable growth
To deliver returns on investment by reinvesting earnings and strengthening governance to support future growth momentum
To establish strong internal processes and policies to combat financial crime and poor quality lending
Annual General Meeting
Investor forums and Investor feedback forms (Ongoing)
Publications and announce ments on performance, launch of new products, services and banking access (When required)
Access to management via email/telephone (ongoing)
To review business performance against targets and benchmarks
To identify performance drivers, opportunities and risks
To review shareholder returns
To provide assurance on regulatory and statutory compliance
Increasing shareholder returns and growth
Performance drivers and business continuity
Share price and dividends
Strength of governance mechanisms
Dividends of Rs 3,421.2 Mn declared for 2014
Dedicated investor relations team
Investments in technology to position Bank at the helm of digital delivery
Inculcation of a sales driven culture
Business Process Re-engineering and strong cost management systems
Customers Being at the core of our customer-centric banking model
To treat customers fairly and safeguard their interests
To deliver quality service, with passion and dedication
To be a responsible lender and comply with all regulatory and statutory obligations
To make finance more accessible
To promote financial literacy
Monthly/quarterly customer meetings and customer visits/site visits
Annual site visits to factories, project sites and corporate establishments
Daily interaction via 250 customer centres located across the country
Customer surveys
Formal complaint management process and a centralised dedicated unit to manage and resolve customer complaints
Suggestion boxes at every customer centre
Feedback form on website
Access to Financial Ombudsman
To understand customer needs and expectations
To obtain feedback on the bank's products, service quality, reach and brand perception
To ascertain information for KYC requirements
To foster better awareness of product and service features and terms and conditions
Access and reach
Products and service offering
Greater customer convenience
Relationship management
Investment returns and cost of borrowing
Compliance
Formalised and Board approved customer charter
Multi channel distribution strategy for ease of access, physical presence at 250 locations across Sri Lanka and 415 ATMs
Special provisions for senior citizens and access for the disabled
Integrated Management Discussion& Analysis
G4-24, 25, 26, 27
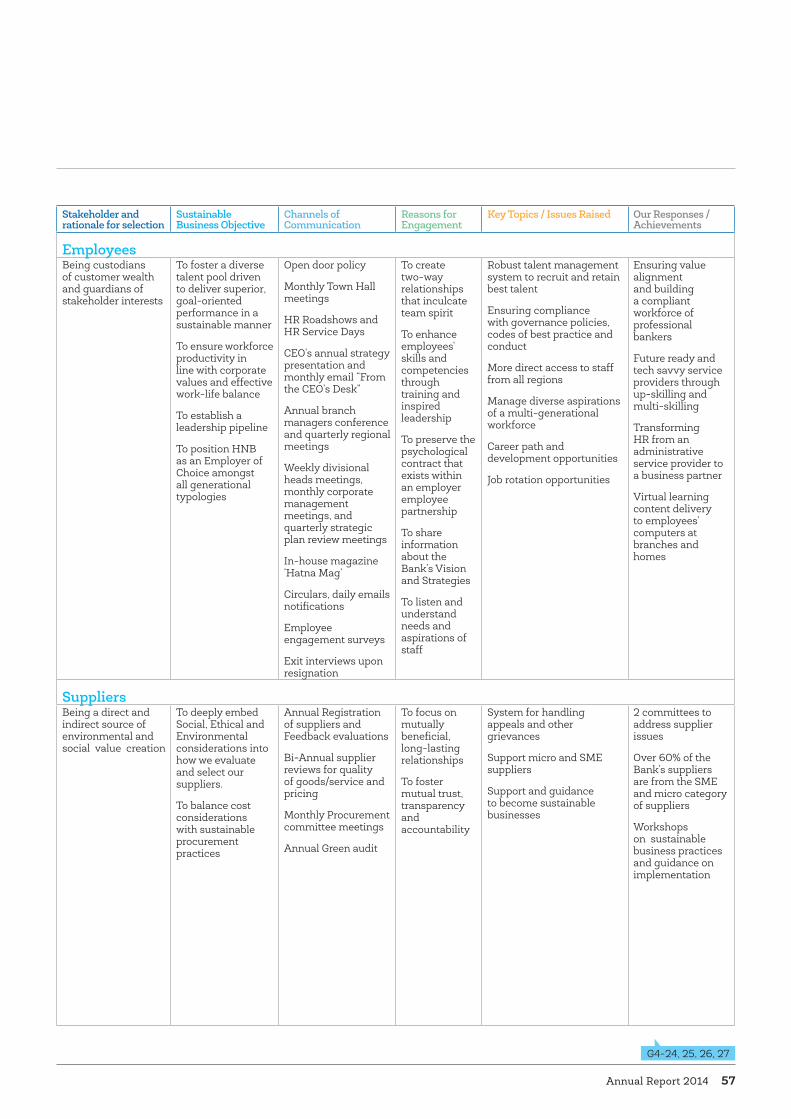
Annual Report 2014 57
Stakeholder and rationale for selection
Sustainable Business Objective
Channels of Communication
Reasons for Engagement
Key Topics / Issues Raised Our Responses / Achievements
Employees Being custodians of customer wealth and guardians of stakeholder interests
To foster a diverse talent pool driven to deliver superior, goal-oriented performance in a sustainable manner
To ensure workforce productivity in line with corporate values and effective work-life balance
To establish a leadership pipeline
To position HNB as an Employer of Choice amongst all generational typologies
Open door policy
Monthly Town Hall meetings
HR Roadshows and HR Service Days
CEO's annual strategy presentation and monthly email “From the CEO’s Desk”
Annual branch managers conference and quarterly regional meetings
Weekly divisional heads meetings, monthly corporate management meetings, and quarterly strategic plan review meetings
In-house magazine ‘Hatna Mag’
Circulars, daily emails notifications
Employee engagement surveys
Exit interviews upon resignation
To create two-way relationships that inculcate team spirit
To enhance employees' skills and competencies through training and inspired leadership
To preserve the psychological contract that exists within an employer employee partnership
To share information about the Bank’s Vision and Strategies
To listen and understand needs and aspirations of staff
Robust talent management system to recruit and retain best talent
Ensuring compliance with governance policies, codes of best practice and conduct
More direct access to staff from all regions
Manage diverse aspirations of a multi-generational workforce
Career path and development opportunities
Job rotation opportunities
Ensuring value alignment and building a compliant workforce of professional bankers
Future ready and tech savvy service providers through up-skilling and multi-skilling
Transforming HR from an administrative service provider to a business partner
Virtual learning content delivery to employees’ computers at branches and homes
Suppliers Being a direct and indirect source of environmental and social value creation
To deeply embed Social, Ethical and Environmental considerations into how we evaluate and select our suppliers.
To balance cost considerations with sustainable procurement practices
Annual Registration of suppliers and Feedback evaluations
Bi-Annual supplier reviews for quality of goods/service and pricing
Monthly Procurement committee meetings
Annual Green audit
To focus on mutually beneficial, long-lasting relationships
To foster mutual trust, transparency and accountability
System for handling appeals and other grievances
Support micro and SME suppliers
Support and guidance to become sustainable businesses
2 committees to address supplier issues
Over 60% of the Bank’s suppliers are from the SME and micro category of suppliers
Workshops on sustainable business practices and guidance on implementation
G4-24, 25, 26, 27

Hatton National Bank PLC58
Stakeholder and rationale for selection
Sustainable Business Objective
Channels of Communication
Reasons for Engagement
Key Topics / Issues Raised Our Responses / Achievements
Society Being the provider of our social license to operate
To engage with the community at every level towards community development
To act as a catalyst for positive change through action in healthcare, education and entrepreneurship
Employee involvement in local community projects (on need basis)
Continuous dialogue through network of customer centres (daily)
Visits by field officers to fishing and farmer communities (on need basis)
Visits to community leaders, village schools, places of worship and markets
To create sustainable, self sufficient communities through education, micro financing, entrepreneurial assistance and health
Financial awareness and access to funds
Links and connections to major supply chains for distribution
Access to IT facilities, books and literature to develop and enhance knowledge.
Basic infrastructure such as health care, access roads and schools
Gami Pubuduwa micro finance scheme to assist young entrepreneurs
Provide agricultural expertise and basic financial skills
Facilitate connections between rural entrepreneurs and the demand chain
HNB Sustainability Foundation to focus on community development
Establishment of school libraries and computer centres
Counselling centre at the National Cancer Institute
Community development through investment in remote rural areas
EnvironmentBeing the provider of the natural capital necessary for sustenance and existence
To promote environmental conservation at the work place through the Green Pledge
To promote responsible lending practices through green banking and green procurement
To implement an environmental management system
Efficiency meetings (monthly)
Site visits and Annual reviews of facilities
Registration of suppliers annually
Consultancy audits (on need basis)
To ensure a sustainable planet through conservation and preservation of the environment by introducing best practices
Climate change
Energy conservation
Reduction of carbon foot print
Green building and eco-friendly practices in Nittambuwa, Jaffna and Kalmunai
The Green Pledge taken by all staff, integrating environmentally friendly practices into daily operations
Green banking and Green procurement systems
Tree planting initiatives
Integrated Management Discussion& Analysis
G4-24, 25, 26, 27

Annual Report 2014 59
Global Economic Environment: On the Recovery Track The recovery of the global economy since October 2013 continued into 2014, although at a weaker than expected and at an uneven pace. IMF’s January 2015 projections for world growth have been revised downwards to 3.3% for 2014 (a revision of 0.3% since October 2014 projections, which followed a revision of 0.3% in April and a further 0.1% in July 2014) and strengthened to 3.5% for 2015. Developments since the October World Economic Outlook (WEO) have had conflicting implications for the growth forecasts. The downward revisions to growth for 2014 were primarily due to a weaker than expected performance in the first half of 2014, stemming from the legacies of the global financial crisis, and the uncertainty about the future.
Global growth is expected to receive a boost from lower oil prices, which have been driven by higher supply. But this boost is projected to be more than offset by negative factors including investment weakness in response to diminished expectations about medium-term growth which continue in many advanced and emerging market economies. The revisions also reflect a reassessment of prospects in China, Russia, the Euro area, and Japan as well as weaker activity in some major oil exporters because of the sharp drop in oil prices.
The IMF identifies four key developments which have shaped the global outlook since the release of its October 2014 WEO.
Firstly, the decline in oil prices by about 55% in US Dollar terms since September, which has boosted growth in oil importing countries.
Secondly, the marked growth divergence across major economies. Whilst the recovery in the United States is stronger than expected, economic performance in all other major economies—most notably Japan—fell short of expectations.
Third is the appreciation of the US Dollar by some 6% in real effective terms, in contrast to the Euro and the Yen which have depreciated by about 2% and 8%,
respectively. Currencies of many emerging markets have also weakened, particularly those of commodity exporters.
Fourthly, interest rates and risk spreads have risen in many emerging economies notably, amongst commodity exporters and risk spreads on high-yield bonds and other products exposed to energy prices. Long-term government bond yields have declined further in major advanced economies, reflecting safe haven effects and weaker activity in some markets.
The US in the limelight, leading global growth The United States is the only major economy for which growth projections have been raised. Growth in the USA rebounded ahead of expectations after the contraction in the first quarter of 2014, and unemployment declined further, while inflationary pressures stayed more subdued, also reflecting the dollar appreciation and the decline in oil prices. Growth is projected to exceed 3% in 2015–16, with increased domestic demand supported by lower oil prices, more
moderate fiscal adjustment, and continued support from an accommodative monetary policy stance, despite the projected gradual rise in interest rates. However, the recent Dollar appreciation is projected to reduce net exports.
The United Kingdom is expected to achieve 2.4% growth which is the highest amongst European nations in 2015, as per IMF estimates. The projections for growth in the Euro zone have been revised downwards since October for 2014 and 2015 respectively and estimated to be 1.2% in 2015, compared with a decline of 0.4% in 2013. This slow pace of recovery of the Euro area is mainly due to the slower implementation of financial recovery measures in some member nations such as Italy and Greece.
Despite prospects for a stronger recovery in 2015, several risks remain to dampen a full global economic recovery. These include shifts in sentiment and volatility in global financial markets, especially in emerging market economies, where lower oil prices have introduced external and balance sheet vulnerabilities to oil exporters; stagnation and low inflation which are still concerns in the Euro area and in Japan; and geo- political tension, high debt levels and high unemployment in certain regions.
World Growth Projections
% Change 2013 2014Projections
2015 2016World output 3.3 3.3 3.5 3.7Advanced economies 1.3 1.8 2.4 2.4USA 2.2 2.4 3.6 3.3Euro -0.5 0.8 1.2 1.4UK 1.7 2.6 2.7 2.4Japan 1.6 0.1 0.6 0.8CIS 2.2 0.9 -1.4 0.8Russia 1.3 0.6 -3.0 -1.0China 7.8 7.4 6.8 6.3India 5.0 5.8 6.3 6.5ASEAN 5.2 4.5 5.2 5.3Emerging & Developing Asia 6.6 6.5 6.4 6.2Emerging & Developing economies 4.7 4.4 4.3 4.7World Trade Volumes 3.4 3.1 3.8 5.3Imports by Advanced economies 2.0 3.0 3.7 4.8Imports by Emerging & Developing economies 5.5 3.6 3.2 6.1London Interbank Offered Rate (LIBOR) 0.4 0.3 0.7 1.9
Source : IMF
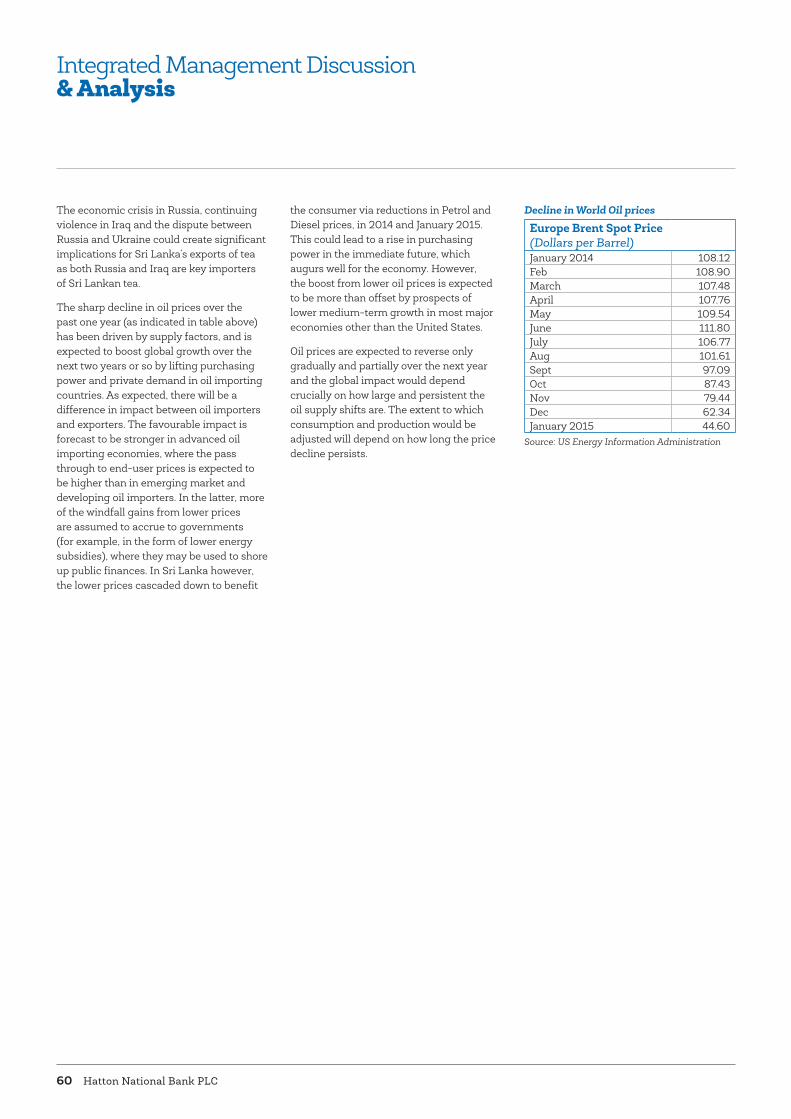
Hatton National Bank PLC60
The economic crisis in Russia, continuing violence in Iraq and the dispute between Russia and Ukraine could create significant implications for Sri Lanka’s exports of tea as both Russia and Iraq are key importers of Sri Lankan tea.
The sharp decline in oil prices over the past one year (as indicated in table above) has been driven by supply factors, and is expected to boost global growth over the next two years or so by lifting purchasing power and private demand in oil importing countries. As expected, there will be a difference in impact between oil importers and exporters. The favourable impact is forecast to be stronger in advanced oil importing economies, where the pass through to end-user prices is expected to be higher than in emerging market and developing oil importers. In the latter, more of the windfall gains from lower prices are assumed to accrue to governments (for example, in the form of lower energy subsidies), where they may be used to shore up public finances. In Sri Lanka however, the lower prices cascaded down to benefit
the consumer via reductions in Petrol and Diesel prices, in 2014 and January 2015. This could lead to a rise in purchasing power in the immediate future, which augurs well for the economy. However, the boost from lower oil prices is expected to be more than offset by prospects of lower medium-term growth in most major economies other than the United States.
Oil prices are expected to reverse only gradually and partially over the next year and the global impact would depend crucially on how large and persistent the oil supply shifts are. The extent to which consumption and production would be adjusted will depend on how long the price decline persists.
Decline in World Oil prices
Europe Brent Spot Price (Dollars per Barrel) January 2014 108.12Feb 108.90March 107.48April 107.76May 109.54June 111.80July 106.77Aug 101.61Sept 97.09Oct 87.43Nov 79.44Dec 62.34January 2015 44.60
Source: US Energy Information Administration
Integrated Management Discussion& Analysis

Annual Report 2014 61
Sri Lankan Economy
Continuing on a path of high growth Sri Lanka’s economy grew at a slightly higher pace than in 2013, by 7.7 % in real terms during the first half of 2014. Strengthening domestic economic activity and improving external demand contributed to this growth momentum. In the first quarter of 2014, the Agriculture sector grew by only 0.2 % due to adverse weather conditions, but the sector rebounded to record a growth of 6.4 % in the second quarter, resulting in a growth of 3.1 % in the first half of the year. The Industry sector grew by 12.4 % with the Construction, Mining & Quarrying, and Manufacturing sub sectors continuing to perform well. The Services sector grew by 6.1 % with improved performance in the Wholesale and retail trade, transport and communication, and hotels and restaurants sub sectors. The growth momentum is expected to continue in the second half of the year resulting in an annual real GDP growth rate of around 7.8 % in 2014.
It is also noteworthy that a significant portion of economic growth was derived from public sector investment in infrastructure which has traditionally been
funded by foreign bi-lateral and multilateral agencies.
Sri Lanka’s domestic savings are projected to increase to around 22.6% of GDP in 2014 from 20% in 2013 whilst gross investment is projected to reach 30.1 % of GDP in 2014, up from 29.6 % recorded in the previous year. National savings are projected to increase to 28.4 % of GDP from 25.7 % in 2013 with increased workers’ remittances. Private savings are expected to increase along with a reduction in government dis-savings. Public investment is expected to reach 6.7 % of GDP with continued government investment in infrastructure projects.
Sri Lanka’s unemployment rate year on year declined to 4.1 % during the first quarter of 2014 from 4.6 % in the first quarter of 2013. A key factor in this improvement was the decline in unemployment among females to 6.1 % in the first quarter of 2014, compared to 7.0 % in the corresponding period of the previous year. Similarly, unemployment amongst males declined from 3.3% to 3.0%.
External trade- supports a more favourable trade balance External merchandise trade, which rebound in the second half of 2013, continued to perform well during the first eleven months of 2014. Earnings from exports during the first eleven months of 2014 recorded an increase of 7.5% to US Dollars 10.1 Bn driven by textile and garments, tea and coconut exports. Favourable developments in major export markets, continuous improvements in domestic industries with new technologies, and an accommodative macroeconomic environment contributed to the improved performance in exports in 2014.
Expenditure on imports for the first eleven months of 2014 too increased by 7.1% to US Dollars 17.6 Bn, from US Dollars 16.5 Bn recorded in the corresponding period of 2013. Expenditure on imports too have increased for the first eleven months of 2014 by 7.1% to US Dollars 17.6 Bn. Increase in imports of food and beverages and motor vehicles contributed towards the surge in import expenditure despite a reduction in import of investment goods. Accordingly the trade deficit widened to US Dollars 7.5 Bn during the first eleven months of 2014 from US Dollars 7 Bn in the corresponding period of the previous year.
GDP GROWTH % Change1996-2005 avg 2006 2007 2008 2009 2010 2011 2012 2013 2014 2015 2016
4.3 4.7 6.8 6.0 3.5 8.0 8.2 6.3 7.3 7.0* 6.5* 6.5*Source: Central Bank of Sri Lanka; *IMF forecasts
Inflation
% YoY InflationAnnual Average Inflation
0
2
4
6
8
10
12
Jan-
11
Mar
-11
May
-11
Jul-1
1
Sep-
11
Nov
-11
Jan-
12
Mar
-12
May
-12
Jul-1
2
Sep-
12
Nov
-12
Jan-
13
Mar
-13
May
-13
Jul-1
3
Sep-
13
Nov
-13
Jan-
14
Mar
-14
May
-14
Jul-1
4
Sep-
14
Nov
-14
Dec
-14
GDP Growth
0123456789
%
200
6
200
7
200
8
200
9
2010
2011
2012
2013
2014
2015
2016

Hatton National Bank PLC62
Inflation –remains restrainedSri Lanka’s headline and core inflation remained below 5 % during the year while headline inflation (year-on-year) continued to record single digit levels for the 68th consecutive month. Core inflation remained equally subdued, indicating well contained demand driven inflationary pressures.
However, marginal variations in inflation were observed during the period due to domestic supply disruptions stemming from adverse weather conditions, although global commodity prices moderated. Year-on-year inflation was 3.3% in December 2014 while core inflation was recorded at 3.5%.
Interest Rates- bottoming out The relaxed monetary policy stance adopted by the Central Bank since December 2012 continued into 2014 facilitated by mild inflation and inflationary expectations. The decline in Sri Lanka’s inflation has structural as well as cyclical roots, and was able to sustain downward pressure on interest rates throughout 2014. The perceived slow adjustment in market interest rates after the initial policy rate reduction in December 2012 prompted the Central Bank to further reduce policy interest rates in May and October of 2013 and once again, in January 2014. The CBSL thus aimed to cushion any weakness in economic growth and spur private sector credit growth, which however continued to remain relatively subdued after the sharp deceleration in 2013.
In line with its policies unveiled in the “Road Map for 2014 and Beyond”, CBSL introduced several adjustments to
streamline the policy interest rate corridor at the beginning of the year. The CBSL established a Standing Rate Corridor (SRC) in place of the policy rate corridor while introducing Standing Deposit Facility Rate (SDFR) and Standing Lending Facility Rate (SLFR) that replaced, respectively, the Repurchase rate and the Reverse Repurchase rate of the Central Bank.
In this declining interest rate regime, the Average Weighted Fixed Deposit Rate (AWFDR), declined to 7.33 % as at December 2014 compared to 11.78 % at end 2013. Commercial banks’ lending rates also continued to adjust downward along with other market interest rates with some rigidity observed in rates applicable on longer term advances during the early part of the year. The weekly Average Weighted Prime Lending Rate (AWPR) declined significantly by 381 basis points to a historically low level of 6.33% as at end December 2014 from 10.13% at end December 2013.
Exchange Rate – stays stable The Sri Lankan Rupee remained stable against the US dollar during the first nine months of the year, appreciating marginally by 0.3 %. Continued inflow of foreign exchange by way of current, capital and financial flows helped maintain the stability of the Rupee during this period. Reflecting the cross currency exchange rate movements, the Sri Lankan Rupee appreciated against the Japanese Yen by 4.5%, the Pound Sterling by 1.8 % and the Euro by 9.1 %, while depreciating against the Indian Rupee by 0.3 % as at end September 2014.
Share Market – on the riseSri Lanka’s equity market achieved an improved performance during the first nine months of 2014. The price indices, namely the ASPI and the S&P SL20, as well as net foreign investment inflows increased during this period. The downward trend in domestic interest rates, sustained foreign investor participation and expectations of better corporate earnings, were factors which supported stock market activity. As a result, the All Share Price Index (ASPI) increased by 22.7 % surpassing the 7,000 mark during the period under review. The S&P SL20 index increased by 23.7 % in the first nine months of 2014. The price indices of all the sub-sectors recorded gains during the period under consideration. The market Price Earnings Ratio (PER) stood at 19.7 as at end September 2014, relatively higher than the PER of other Asian Stock exchanges.
Integrated Management Discussion& Analysis
Interest Rate Movement
%
02468
10121416
Jan-
11Fe
b-11
Mar
-11
Apr
-11
May
-11
Jun-
11Ju
l-11
Aug
-11
Sep-
11O
ct-1
1N
ov-1
1D
ec-1
1Ja
n-12
Feb-
12M
ar-1
2A
pr-1
2M
ay-1
2Ju
n-12
Jul-
12A
ug-1
2Se
p-12
Oct
-12
Nov
-12
Dec
-12
Jan-
13Fe
b-13
Mar
-13
Apr
-13
May
-13
Jun-
13Ju
l-13
Aug
-13
Sep-
13O
ct-1
3N
ov-1
3D
ec-1
3Ja
n-14
Feb-
14M
ar-1
4A
pr-1
4M
ay-1
4Ju
n-14
Jul-
14A
ug-1
4Se
p-14
Oct
-14
Nov
-14
Dec
-14
I Year TBAWPLRAWDR
ASPI
Rs
Jan-
14
Feb-
14
Mar
-14
Apr
-14
May
-14
Jun-
14
Jul-
14
Aug
-14
Sep-
14
Oct
-14
Nov
-14
Dec
-14
8,000
7,500
7,000
6,500
6,000
5,500
5,000
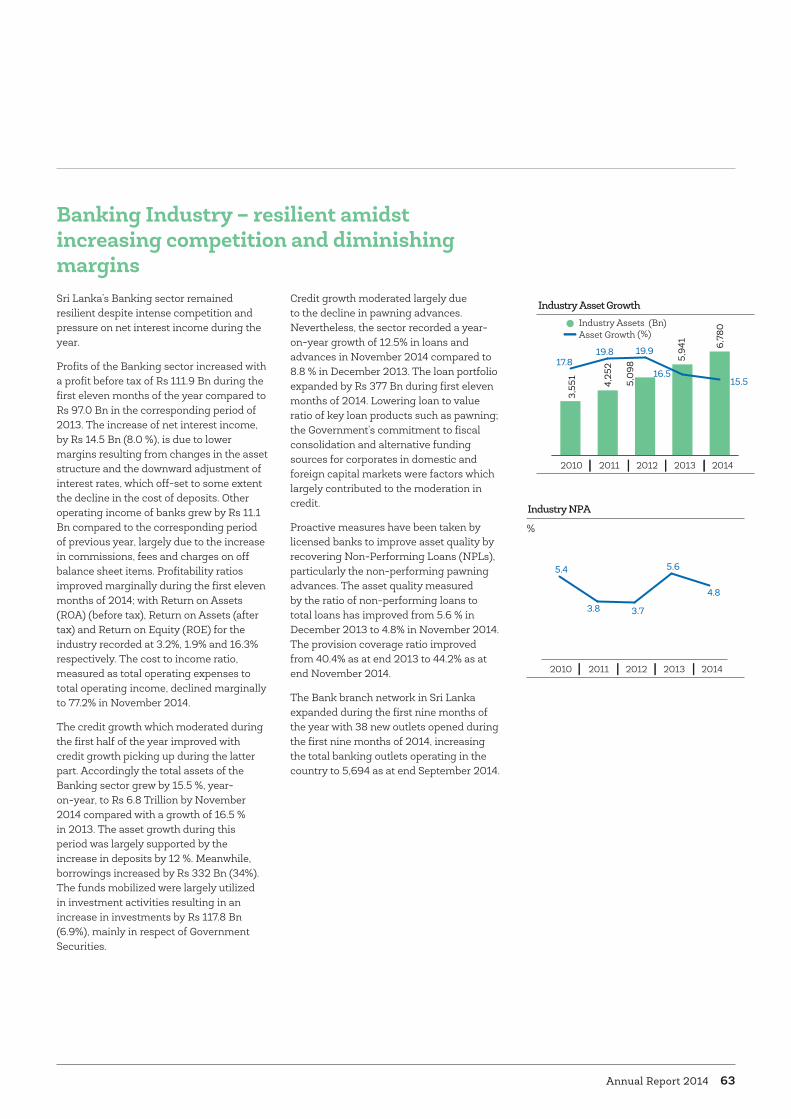
Annual Report 2014 63
Banking Industry – resilient amidst increasing competition and diminishing margins Sri Lanka’s Banking sector remained resilient despite intense competition and pressure on net interest income during the year.
Profits of the Banking sector increased with a profit before tax of Rs 111.9 Bn during the first eleven months of the year compared to Rs 97.0 Bn in the corresponding period of 2013. The increase of net interest income, by Rs 14.5 Bn (8.0 %), is due to lower margins resulting from changes in the asset structure and the downward adjustment of interest rates, which off-set to some extent the decline in the cost of deposits. Other operating income of banks grew by Rs 11.1 Bn compared to the corresponding period of previous year, largely due to the increase in commissions, fees and charges on off balance sheet items. Profitability ratios improved marginally during the first eleven months of 2014; with Return on Assets (ROA) (before tax), Return on Assets (after tax) and Return on Equity (ROE) for the industry recorded at 3.2%, 1.9% and 16.3% respectively. The cost to income ratio, measured as total operating expenses to total operating income, declined marginally to 77.2% in November 2014.
The credit growth which moderated during the first half of the year improved with credit growth picking up during the latter part. Accordingly the total assets of the Banking sector grew by 15.5 %, year-on-year, to Rs 6.8 Trillion by November 2014 compared with a growth of 16.5 % in 2013. The asset growth during this period was largely supported by the increase in deposits by 12 %. Meanwhile, borrowings increased by Rs 332 Bn (34%). The funds mobilized were largely utilized in investment activities resulting in an increase in investments by Rs 117.8 Bn (6.9%), mainly in respect of Government Securities.
Credit growth moderated largely due to the decline in pawning advances. Nevertheless, the sector recorded a year-on-year growth of 12.5% in loans and advances in November 2014 compared to 8.8 % in December 2013. The loan portfolio expanded by Rs 377 Bn during first eleven months of 2014. Lowering loan to value ratio of key loan products such as pawning; the Government’s commitment to fiscal consolidation and alternative funding sources for corporates in domestic and foreign capital markets were factors which largely contributed to the moderation in credit.
Proactive measures have been taken by licensed banks to improve asset quality by recovering Non-Performing Loans (NPLs), particularly the non-performing pawning advances. The asset quality measured by the ratio of non-performing loans to total loans has improved from 5.6 % in December 2013 to 4.8% in November 2014. The provision coverage ratio improved from 40.4% as at end 2013 to 44.2% as at end November 2014.
The Bank branch network in Sri Lanka expanded during the first nine months of the year with 38 new outlets opened during the first nine months of 2014, increasing the total banking outlets operating in the country to 5,694 as at end September 2014.
3,55
1
17.819.8 19.9
16.515.54,
252
5,0
98
5,94
1 6,78
0
Industry Asset Growth
2010 2011 2012 2013 2014
(Bn)(%)Asset Growth
Industry Assets
Industry NPA
2010 2011 2012 2013 2014
%
5.4
3.8 3.7
5.6
4.8

Hatton National Bank PLC64
Outlook - HNB well positioned to reap the rewards of our strategic initiatives Sri Lanka’s Banking industry would remain highly competitive in the near to medium term. The low interest rate regime which began in 2014 seems likely to continue into the first quarter of 2015. However, as interest rates in Sri Lanka seem to have bottomed out, an increase in credit growth seems likely over the next few months, and this in turn would spur a gradual and moderate rise in interest rates towards the latter part of 2015, facilitating slightly higher net interest income margins for the banking sector. The rise in demand for credit is likely to come from the Construction, Infrastructure, Tourism and Health sectors.
On a global landscape of geo- political tensions in certain key markets, frontier markets such as Sri Lanka backed by a strong economic growth story, political stability and positive social indicators, have become attractive destinations for foreign investor funds. Sri Lanka evidenced notable foreign inflows by way of investments into the Colombo Stock Exchange and Foreign Direct Investments (FDIs) for development projects and indirect investments across numerous other areas. These money flows led to increased money circulation in the country creating excess liquidity in the local markets.
Just as the industry and environment have been factors that shaped our strategies, many social and demographic trends will also influence our strategies and how we implement them in the next few years.
The projected rise in Sri Lanka’s per capita income to US Dollars 4,000 by 2016 and to US Dollars 6,000 by 2020, would create a need to be associated with more sophisticated and high quality brands; technological sophistication will be an important element of this trend. The Screen (whether it be a mobile telephone, a tablet or public display screen) will play
a dominant role in shopping, travel and banking decisions. Higher disposable income levels would lead to a higher demand for private and priority banking with expectations of superior service. We therefore anticipate greater opportunities in wealth management and investment advisory services.
Sri Lanka has a fast ageing population, with those over 60 years estimated to constitute 21.9% of the population by 2031, as per the World Bank’s Ageing Study. This demographic shift is likely to spur a demand for bundled senior citizens products and annuity pension plans, and the Group will look to cater to this need through its banking as well as insurance businesses.
Recent surveys have revealed Sri Lanka’s mobile penetration, in terms of the number of mobile phones in use, to exceed 21 Mn reflecting the ownership/use of more than one phone by each citizen. This, together with the proliferation of low cost smart phones, points to an increase in the demand for mobile banking applications and solutions, further reinforcing our technological thrust for sustainable growth.
As the rate of social media penetration rises rapidly, our preference for these channels will also be driven by their propensity to be more effective in reaching certain target groups. The social media trend of youth using platforms such as Facebook, myspace and Google+ as “Hangout” places, affords many an opportunity for sentiment analysis; letting us know the sentiments and thoughts of a customer at a given moment, in real time. Thus, we foresee real time offers which are customised to suit an individual at a given time, and predicting the next best action, to be valuable tools of marketing in the year ahead. Predicting future action and choices based on tracking of customer behaviour patterns,
lead generation, social listening and obtaining explicit and implicit sentiments on our brand are some of the significant opportunities that social media has created, which HNB is preparing to harness.
Another trend we foresee is the new generation of consumers demanding customised services to suit their individual needs and the specific devices they own. This poses a new set of technological challenges - for personalized service, especially in the Mobile and Internet banking delivery space. It is now evident that there will be a need for our customer interface to be common across all delivery channels and devices and this aspect is being incorporated into the Bank’s design of future delivery channels and interfaces. We envisage an increasing number of services to be integrated to provide online and real time functionality with easily adoptable and attractive interfaces.
The Bank’s strategic initiatives have begun to yield a multitude of impacts which converge to create a stronger platform for growth based on operational and service excellence, improving asset quality, development of alternate channels and a sales driven culture. HNB is thus well poised to harness the many opportunities that we foresee, supported by a stable environment conducive to growth.
Integrated Management Discussion& Analysis
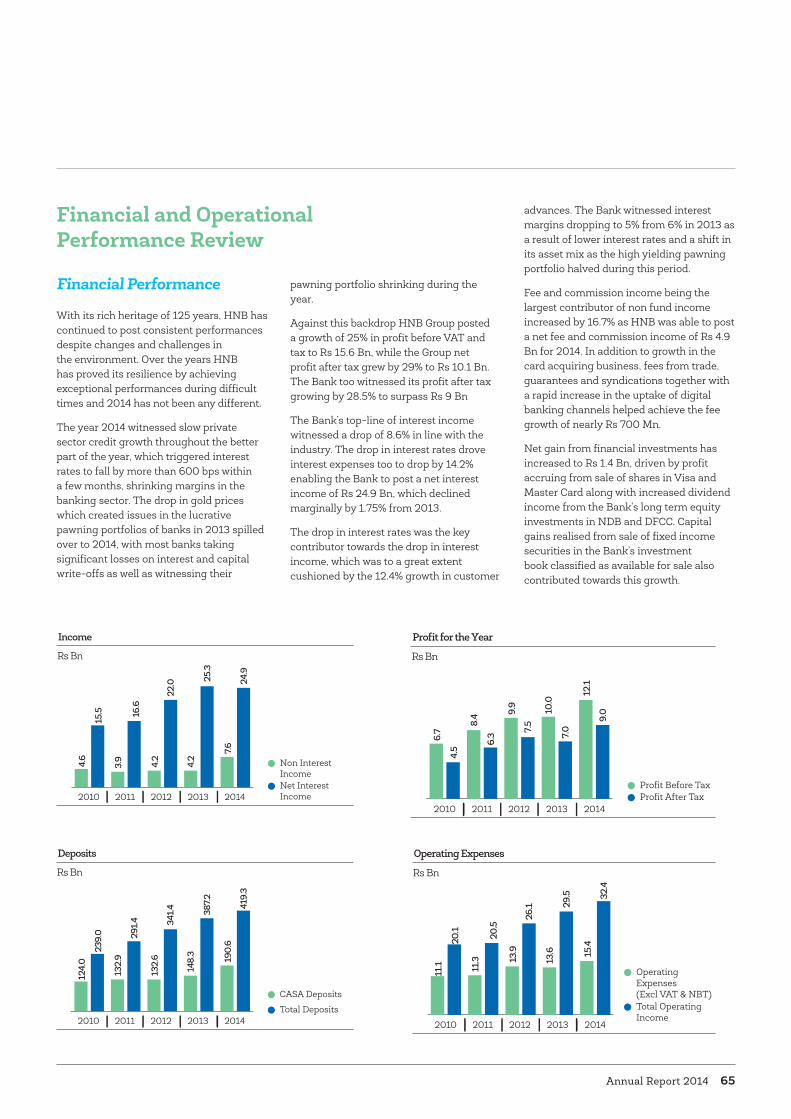
Annual Report 2014 65
Financial and Operational Performance Review
Financial Performance
With its rich heritage of 125 years, HNB has continued to post consistent performances despite changes and challenges in the environment. Over the years HNB has proved its resilience by achieving exceptional performances during difficult times and 2014 has not been any different.
The year 2014 witnessed slow private sector credit growth throughout the better part of the year, which triggered interest rates to fall by more than 600 bps within a few months, shrinking margins in the banking sector. The drop in gold prices which created issues in the lucrative pawning portfolios of banks in 2013 spilled over to 2014, with most banks taking significant losses on interest and capital write-offs as well as witnessing their
pawning portfolio shrinking during the year.
Against this backdrop HNB Group posted a growth of 25% in profit before VAT and tax to Rs 15.6 Bn, while the Group net profit after tax grew by 29% to Rs 10.1 Bn. The Bank too witnessed its profit after tax growing by 28.5% to surpass Rs 9 Bn
The Bank’s top-line of interest income witnessed a drop of 8.6% in line with the industry. The drop in interest rates drove interest expenses too to drop by 14.2% enabling the Bank to post a net interest income of Rs 24.9 Bn, which declined marginally by 1.75% from 2013.
The drop in interest rates was the key contributor towards the drop in interest income, which was to a great extent cushioned by the 12.4% growth in customer
advances. The Bank witnessed interest margins dropping to 5% from 6% in 2013 as a result of lower interest rates and a shift in its asset mix as the high yielding pawning portfolio halved during this period.
Fee and commission income being the largest contributor of non fund income increased by 16.7% as HNB was able to post a net fee and commission income of Rs 4.9 Bn for 2014. In addition to growth in the card acquiring business, fees from trade, guarantees and syndications together with a rapid increase in the uptake of digital banking channels helped achieve the fee growth of nearly Rs 700 Mn.
Net gain from financial investments has increased to Rs 1.4 Bn, driven by profit accruing from sale of shares in Visa and Master Card along with increased dividend income from the Bank’s long term equity investments in NDB and DFCC. Capital gains realised from sale of fixed income securities in the Bank’s investment book classified as available for sale also contributed towards this growth.
Deposits
Total Deposits
CASA Deposits
Rs Bn
124.
0
239.
0
132.
9
291.4
132.
6
341.4
148.
3
387.2
190.
6
419.
3
2012 2013 201420112010
Income
Net Interest Income
Non Interest Income
Rs Bn
4.6
15.5
3.9
16.6
4.2
22.0
4.2
25.3
7.6
24.9
2012 2013 201420112010
Profit for the Year
Profit After TaxProfit Before Tax
Rs Bn
6.7
4.5
8.4
6.3
9.9
7.5
10.0
7.0
12.1
9.0
2012 2013 201420112010
Operating Expenses
2012 2013 201420112010
Total Operating Income
Operating Expenses (Excl VAT & NBT)
Rs Bn
11.1
20.1
11.3
20.5
13.9
26.1
13.6
29.5
15.4
32.4

Hatton National Bank PLC66
The interest cost on swaps obtained to hedge exchange risk on foreign borrowings declined considerably along with the absolute number of swaps in effect. This along with gains recorded on treasury bonds/ bills held for trading contributed positively to improve the position compared to the previous year.
The total operating income of the Bank grew by 10% to Rs 32.4 Bn for the year ending 2014.
Asset Quality and ProvisioningProvisioning costs for the year reduced considerably by Rs 1.8 Bn, in line with the reduction in non performing loans. In 2014 the Bank continued its policies on mitigating losses accruing from falling gold prices through aggressive auctioning and aggressive recovery efforts across the Bank. The Bank also introduced changes
to its collective impairment computation by fine tuning models used for individually insignificant loans which reduced the provisioning requirements.
Aggressive recovery efforts throughout the year have consistently driven down the NPA ratio of the Bank which at the end of the year was at 3.16%, the lowest NPA recorded in HNB’s recent history and significantly lower than 4.8% recorded by the industry for November 2014. The Bank during the year was successful in recovering couple of large loans which were non performing for the last few years.
Operating ExpensesIncrease in operating expenses after adjusting for one off provision reversal in 2013 on account of ESBT stood at 2.1%, which is the lowest increase the Bank has witnessed in the recent past. Accordingly
the cost to income ratio for 2014 stood at 47.4% which is a significant improvement compared to the 2013 adjusted cost to income ratio of 52%. The improvement in the cost to income ratio is a testament of the Bank’s commitment to achieving process efficiency and operational excellence.
TaxationFinancial VAT for the period increased by 51% to Rs 2.5 Bn driven by higher operating profits coupled with introduction of terminal benefits during the year to the value addition while the introduction of Nation Building Tax of 2% also contributed towards the increase. The effective corporate tax rate reduced from 30.0% in 2013 to 25.4% in 2014 mainly due to the qualifying payment benefit from investment in Prime Grameen Micro
Integrated Management Discussion& Analysis
Capital Adequacy Ratio
Total capitalTier 1
%
10
.99
12.
64
12.7
6
14.5
1
13.8
5 16.6
3
12.9
5 16
.52
12.15 1
4.83
2012 2013 201420112010
Assets and Advances
Total Assets
Loans and Receivables (Net)
Rs Bn
202.
3 319.
7
257.
2
380.
5
302.
8
446.
4
352.
0
510.
3
395.
7
576.
6
2012 2013 201420112010
Profitability
%
2012 2013 201420112010
Return on EquityReturn on Avg Asset
17.4
5
18.2
2
17.7
5
14.2
6
16.0
3
1.50 1.79 1.82
1.47 1.66
NPA Ratio
2012 2013 201420112010
Gross Non Performing Loans
Net Non Performing Loans
1.95 2.
31
1.82
1.37 1.43
4.51
3.92
3.66
3.64
3.16
%
Annual Report 2014 67
Finance Limited and reversal of prior year excess provisions.
The strong performance for 2014 enabled the Bank to post a healthy improvement in its ROA to 1.7% compared to 1.5% in 2013 while the ROE of the Bank improved to 16% compared to 14.3% for the previous year.
Statement of Financial PositionThe Bank recorded a growth of Rs 66.3 Bn in total assets which amounted to an increase of 13%. HNB’s loan book grew by 12.4% while growth excluding pawning exceeded 20%. SME and Corporate Banking business verticals witnessed significant credit growth during the year contributing towards the overall loan growth in the Bank
The growth in assets was supported by and increase of Rs 32 Bn in deposits reflecting a 8.3% growth compared to the previous year. The Bank also increased its borrowings to complement the deposit growth during the year. HNB raised Rs 3 Bn by way of a debenture during 2014 at fairly attractive rates for tenors ranging from 3 to 10 years. In addition the Bank’s treasury has been able to secure short to medium term borrowing at very attractive rates for the offshore banking unit.
Increase in customer deposit for 2014 has been by growth in CASA deposits amounting to Rs 42.2 Bn, a 28.5% growth. The Bank with its aggressive rate cuts managed the growth in high cost deposit base thereby cushioning the drop in interest margins. In 2014 the Bank managed a CASA ratio of 45.4% compared to 38.3% in 2013.
Capital AdequacyThe Bank continued to remain as one of the best capitalized banks in the industry with tier I capital adequacy ratio at 12.1% and total capital adequacy ratio at 14.8%.
Group CompaniesAll Group companies recorded the best ever performance in terms of profitability during the year with HNB Assurance PLC, Sithma Development Pvt Ltd and Acuity Partners Pvt Ltd recording profit growth of 7%, 35% and 85% respectively. Accordingly the profits attributable to equity shareholders of the Group amounted to Rs 9.8 Bn which is a growth of 28% over the previous year. The ROA and ROE of the Group also improved to 1.75% and 15.7% compared to 1.56% and 14.0% in 2013. The Group surpassed an asset base of Rs 600 Bn during the year, which is a growth of 15% compared to 2013.

Hatton National Bank PLC68
Corporate Banking
Performance in 2014Despite a challenging economy and intense competition, during the year, HNB’s Corporate Banking business grew its loan portfolio by 30% year on year. It is particularly noteworthy that we were successful in supporting several significant and high profile transactions both in the private and public sectors. Moreover, the Corporate Banking division also played a leading role in financing several mega development projects, in areas such as construction, leisure, health and agri- related industries.
Corporate Banking focused mainly on deepening relationships with the Bank’s principal customers through a cohesive relationship management strategy which offers greater product depth as well as service excellence. A seamless approach to relationship management, where the Corporate Relationship Management team is joined by representatives of the Treasury, Trade and the Cash Management Divisions, has enabled us to offer customised end to end solutions to our clients.
Key strengths• The depth and breadth of our product
portfolio.
• The skills and depth of our Account Relationship Managers (ARMs) who are considered to be the best in the industry.
• A world class Electronic Data Interchange which offers convenience to streamline payments and cash management operations of corporates.
• Ability to provide banking solutions to customers across their entire value chain including supplier and distributor financing.
• Ability to undertake large and complex project financing engagements.
Focus for 2015• Launch of the state of the art e-banking
platform which will be the first amongst local banks.
• Support Corporates in their drive to expand business opportunities.
• Investments in advanced systems and up-skilling of staff to maintain an edge over competition.
• Establishment of a dedicated unit to appraise and monitor environmental and social impacts of credit facilities.
Key Challenges• Narrowing margins
• Low credit growth
OutlookLarge scale developmental projects and the growing international interest in Sri Lanka’s growth prospects augur well for a rise in credit growth in 2015-2016. The
gradual rise in credit growth during the latter half of 2014 combined with the market’s assessment that interest rates have bottomed out, is likely to influence a moderate increase in interest rates in 2015. This in turn would help ease some pressure on the Net Interest Income (NII) margins of the Banks.
As one of the foremost proponents of the post-war infrastructure development since 2009, HNB will continue to support the expansion in areas such as manufacturing, leisure, healthcare, water and road networks.
Towards this end, service excellence, benchmarking our products and services against global standards, and leveraging on the Bank’s island-wide network and relationships with corresponding banks overseas would also be priorities.
Supported by the wide expertise and experience in financing large scale transactions and developmental projects, HNB will continue to play a leadership role in large-scale funding in the next few years, in an environment which will remain most conducive. Reflecting our Triple Bottom Line focus, we will also actively seek opportunities to develop renewable energy solutions in the country, including wind power, waste to energy and solar energy.
With the anticipated growth expected to continue in 2015, and given our technological thrust and the key competitive advantages we have developed, we remain buoyant about the future.
HNB’s Corporate Banking sector offers customized total banking solutions for its clientele comprising multinational, large and mid market corporates. The broad
range of best in class financial solutions also includes project financing, which plays an integral role in supporting business in their expansion plans.
Integrated Management Discussion& Analysis
Corporate Banking - Loans and Advances
115
151
190
2012 2013 2014
Rs Mn
Corporate Banking - NPA
3.0
4
2.56
1.70
2012 2013 2014
%
G4-4, 8, 9, PR-3

Annual Report 2014 69
Islamic Banking We ventured in to Islamic banking under the brand “Al Najah” to cater to the rapidly growing Islamic banking market. Today “Al Najah” offers a broad spectrum of Shariah compliant products and services to its entire clientele.
PerformanceCumulative profits increased by a significant 218% compared to 2013. The deposits grew by 144% to Rs 3.8 Bn in 2014 whilst advances increased by 50% to Rs 3.14 Bn during the 12 months of 2014.
Selective marketing combined with stringent evaluation of Corporate, SME & Retail credit proposals enabled the unit to continue to achieve commendable growth, whilst also maintaining one of the lowest NPA’s in the industry.
Key strengths• The “‘first mover advantage”.
• A strong and dedicated team that is well experienced and competent in Shariah rules and regulations.
• The extensive branch network vis a vis other institutions offering Islamic financing to reach new markets.
• The size strength and brand equity of HNB in a market where most of the other players are smaller banks and financial institutions.
Challenges• Being a constantly growing and evolving
industry, likelihood of new entrants entering the market each year, thus increasing the levels of competition.
• Prevailing low interest rate environment resulting in thinning margins.
• Lack of investment avenues for excess funds in the unit, which in turn places greater pressure on maintaining satisfactory advance to deposit ratios. Suitable measures to be taken to introduce new products to the industry such as Islamic Bonds (Sukuk) and other money market products in concurrence with the Central Bank in order to attract more lucrative investors.
Focus for 2015• Identifying new markets in the regions
to set up regional offices to better cater to the growing customer base.
• Introducing a range of new products.
• Train employees to enhance skills in the area of Islamic Financing.
• Encouraging the use of debit cards, internet and mobile banking channels.
• Creating a more visible HNB Al Najah brand through marketing campaigns and advertising.
Outlook The present market in Sri Lanka, consists of seven commercial banks that offer Islamic financing as well as a number of financial and leasing institutions. The total deposit base is estimated to be Rs 48 Bn whilst the loan book is estimated to be Rs 45 Bn. The number of players is likely to increase in the next few years, thereby intensifying competition. Islamic financing is one of the fastest growing industries in the world, and in Sri Lanka. We have also recognised significant untapped potential in Sri Lanka for new products, and to integrate the country’s developmental needs.
HNB’s Islamic unit will actively seek to capitalise on the many opportunities and harness its potential by expanding the reach and range of products. Our marketing efforts will focus on dedicated marketing units in Colombo and on satellite marketing units at regional level. In addition, the period of the next 2-5 years is also likely to see us open a dedicated stand alone centre for Shariah compliant financing.
The Bank will continue to pursue a strategy of selective lending and stringent evaluation of credit whilst we will also give priority to industries such as agriculture, renewable energy and aquaculture. We intend to leverage on opportunities to raise funds via Shariah compliant instruments from international markets using the bank’s strong relationships with the international banking network. 0.
9
0.5
2.6
1.3
3.8
3.1
Islamic Banking- Deposits and Advances
2012 2013 2014
AdvancesDeposits
Rs Bn
G4-4, 8, 9, PR-3
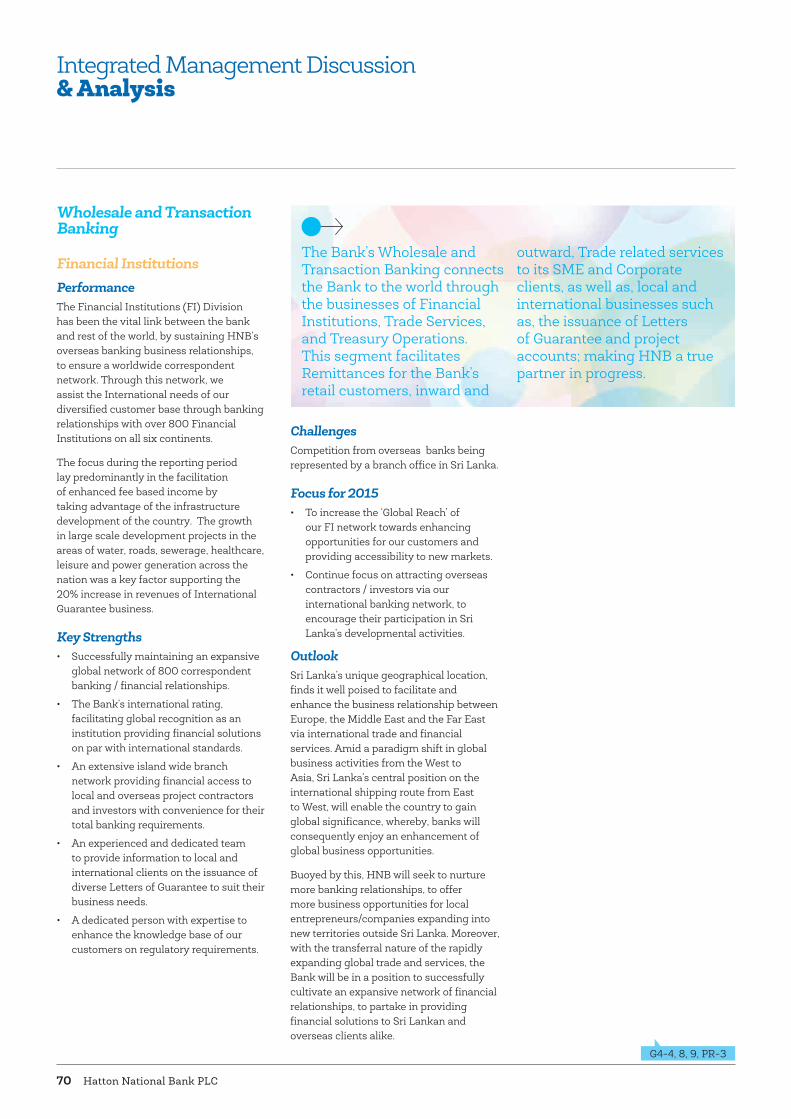
Hatton National Bank PLC70
Wholesale and Transaction Banking
Financial InstitutionsPerformanceThe Financial Institutions (FI) Division has been the vital link between the bank and rest of the world, by sustaining HNB’s overseas banking business relationships, to ensure a worldwide correspondent network. Through this network, we assist the International needs of our diversified customer base through banking relationships with over 800 Financial Institutions on all six continents.
The focus during the reporting period lay predominantly in the facilitation of enhanced fee based income by taking advantage of the infrastructure development of the country. The growth in large scale development projects in the areas of water, roads, sewerage, healthcare, leisure and power generation across the nation was a key factor supporting the 20% increase in revenues of International Guarantee business.
Key Strengths • Successfully maintaining an expansive
global network of 800 correspondent banking / financial relationships.
• The Bank’s international rating, facilitating global recognition as an institution providing financial solutions on par with international standards.
• An extensive island wide branch network providing financial access to local and overseas project contractors and investors with convenience for their total banking requirements.
• An experienced and dedicated team to provide information to local and international clients on the issuance of diverse Letters of Guarantee to suit their business needs.
• A dedicated person with expertise to enhance the knowledge base of our customers on regulatory requirements.
ChallengesCompetition from overseas banks being represented by a branch office in Sri Lanka.
Focus for 2015• To increase the ‘Global Reach’ of
our FI network towards enhancing opportunities for our customers and providing accessibility to new markets.
• Continue focus on attracting overseas contractors / investors via our international banking network, to encourage their participation in Sri Lanka’s developmental activities.
OutlookSri Lanka’s unique geographical location, finds it well poised to facilitate and enhance the business relationship between Europe, the Middle East and the Far East via international trade and financial services. Amid a paradigm shift in global business activities from the West to Asia, Sri Lanka’s central position on the international shipping route from East to West, will enable the country to gain global significance, whereby, banks will consequently enjoy an enhancement of global business opportunities.
Buoyed by this, HNB will seek to nurture more banking relationships, to offer more business opportunities for local entrepreneurs/companies expanding into new territories outside Sri Lanka. Moreover, with the transferral nature of the rapidly expanding global trade and services, the Bank will be in a position to successfully cultivate an expansive network of financial relationships, to partake in providing financial solutions to Sri Lankan and overseas clients alike.
The Bank’s Wholesale and Transaction Banking connects the Bank to the world through the businesses of Financial Institutions, Trade Services, and Treasury Operations. This segment facilitates Remittances for the Bank’s retail customers, inward and
outward, Trade related services to its SME and Corporate clients, as well as, local and international businesses such as, the issuance of Letters of Guarantee and project accounts; making HNB a true partner in progress.
Integrated Management Discussion& Analysis
G4-4, 8, 9, PR-3
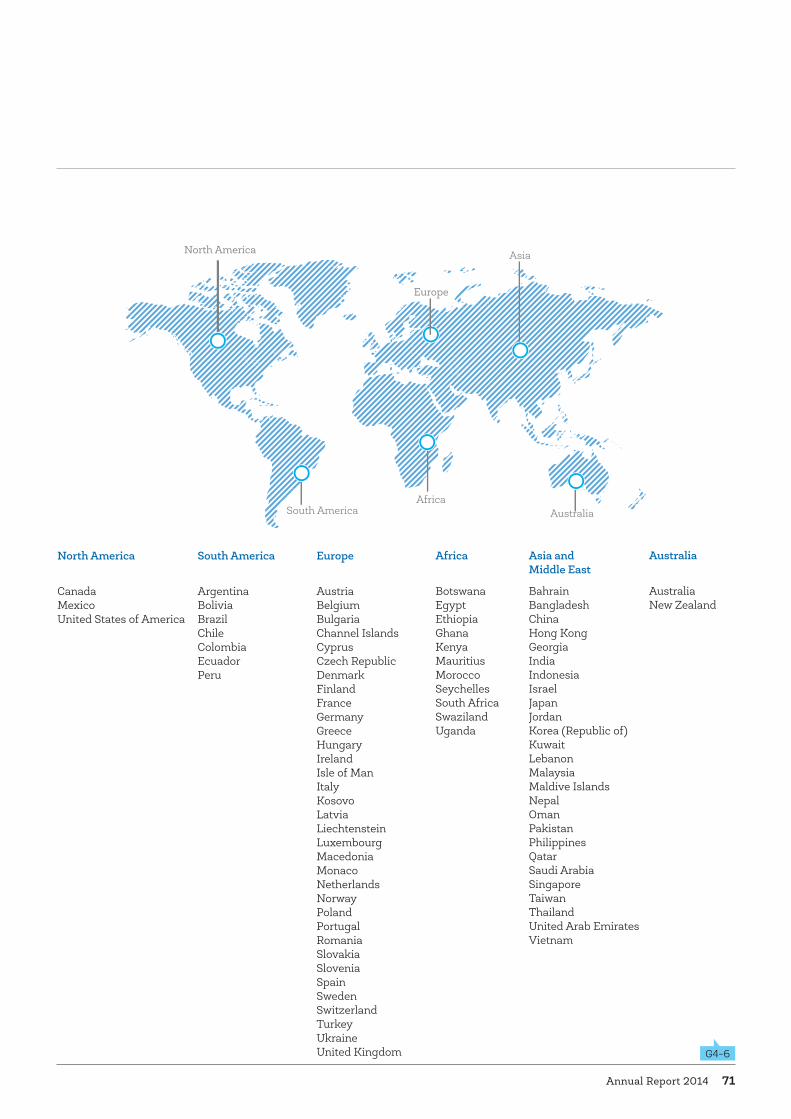
Annual Report 2014 71
North America
South AmericaAfrica
Europe
Asia
Australia
North America
CanadaMexicoUnited States of America
South America
ArgentinaBoliviaBrazilChile ColombiaEcuadorPeru
Europe
AustriaBelgium BulgariaChannel IslandsCyprusCzech RepublicDenmarkFinlandFranceGermanyGreeceHungaryIrelandIsle of ManItalyKosovoLatviaLiechtensteinLuxembourgMacedoniaMonacoNetherlandsNorwayPolandPortugalRomaniaSlovakiaSloveniaSpainSwedenSwitzerlandTurkeyUkraineUnited Kingdom
Africa
Botswana EgyptEthiopiaGhanaKenyaMauritiusMoroccoSeychellesSouth AfricaSwazilandUganda
Asia and Middle East
BahrainBangladeshChinaHong KongGeorgiaIndiaIndonesiaIsraelJapanJordanKorea (Republic of)KuwaitLebanonMalaysiaMaldive IslandsNepalOmanPakistanPhilippinesQatarSaudi ArabiaSingaporeTaiwanThailandUnited Arab EmiratesVietnam
Australia
AustraliaNew Zealand
G4-6

Hatton National Bank PLC72
Trade Services
PerformanceThe global market for Sri Lankan exports was mixed in 2014: the continuing political crisis in the Middle East and Ukraine negatively impacted Sri Lanka’s tea exports whilst the slower than expected recovery of the US and EU economies constrained demand for our garment exports in 2014. However, the Free Trade Arrangements with India and Pakistan were factors which bolstered trade flows and helped to offset some of the decline to the EU and Middle East. Fee and commission income from trade grew by 15.7% over the previous year. Increasing employee awareness of the potential for international trade and training of employees on marketing of trade solutions were some of the internal factors which contributed to a commendable performance during the year.
Key strengths• ISO 9001:2008 certification for trade
operations, which endorses HNB’s service excellence and quality of processes, is a key differentiator which has enabled the Bank to be the leader in the trade solutions market.
• 26 trade units which are strategically located throughout the island facilitating greater proximity to customers, and hence, greater insights and customised solutions.
• A global network of over 800 correspondent banks.
• Skills and competencies of our trade team and an increasing number of Certified Documentary Credit Specialists (CDCS) at HNB, whose specialized knowledge enables an advisory role and superior service to customers.
Challenges• Increasing the limit on advance
payment from US Dollars 10,000 to US Dollars 50,000 and the introduction of open account transactions for imports has resulted in a reduction in the volumes of trade business that flow through the banking system.
• The absence of a mandatory minimum tariff structure for banks has curtailed opportunity for price competitiveness.
• The need for knowledge of the numerous technical aspects of trade finance inhibits branch managers from confidently marketing trade solutions. The Bank took measures to address this issue in 2014, by commencing training of non trade officers across the branch network.
Focus for 2015• Garner new business from international
markets via stronger correspondent relationships in the Asia Pacific region.
• Continue to support the development of the export potential of the country, such as, supporting the SME sector to overcome a key constraint of providing collateral.
• Centralisation of trade processing
• Further enhance and expand facilities offered to trade customers for electronic trade transactions on the e-banking portal.
• Continue to train non trade officers on technical aspects of trade solutions, to support the sales and marketing thrust of the Bank.
Outlook As summarized previously, increasing the contribution from fee based income to augment the Bank’s net income is one of our strategic priorities; trade services will hence be a key area of our growth focus. Whilst the local environment is expected to support an increase in trade, the global market environment for Sri Lanka’s exports is likely to be mixed. The US economy, is showing signs of stronger recovery which augurs well for world trade. However, a resolution to the crisis in the Middle East (a key market for Sri Lankan tea) is likely to be prolonged, while the recovery of some of our export markets in the EU will also be slower than expected and could therefore inhibit trade growth in 2015.
HNB’s expertise, service standards and network see it well poised to harness Sri Lanka’s trade potential in 2015 and 2016, thereby establishing trade service as a key contributor to the fee income growth of the Bank.
Integrated Management Discussion& Analysis
Growth in fee income from Trade15.7%
G4-4, 8, 9, PR-3
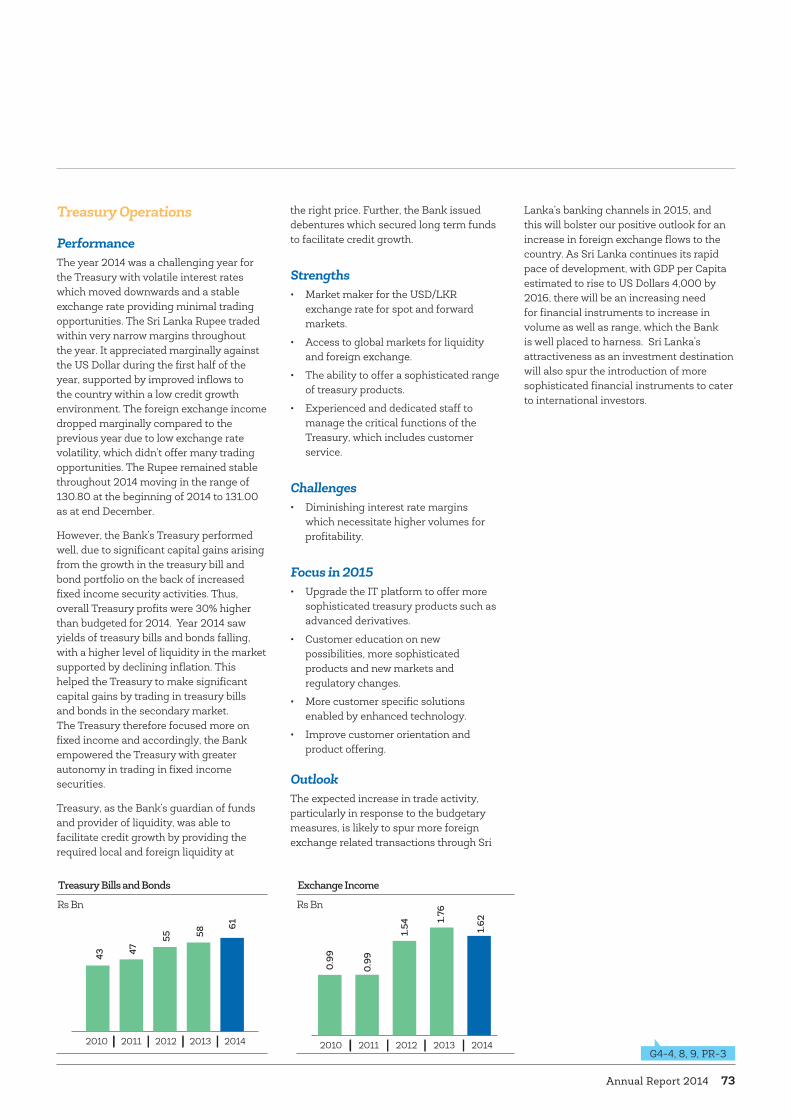
Annual Report 2014 73
Treasury Operations
PerformanceThe year 2014 was a challenging year for the Treasury with volatile interest rates which moved downwards and a stable exchange rate providing minimal trading opportunities. The Sri Lanka Rupee traded within very narrow margins throughout the year. It appreciated marginally against the US Dollar during the first half of the year, supported by improved inflows to the country within a low credit growth environment. The foreign exchange income dropped marginally compared to the previous year due to low exchange rate volatility, which didn’t offer many trading opportunities. The Rupee remained stable throughout 2014 moving in the range of 130.80 at the beginning of 2014 to 131.00 as at end December.
However, the Bank’s Treasury performed well, due to significant capital gains arising from the growth in the treasury bill and bond portfolio on the back of increased fixed income security activities. Thus, overall Treasury profits were 30% higher than budgeted for 2014. Year 2014 saw yields of treasury bills and bonds falling, with a higher level of liquidity in the market supported by declining inflation. This helped the Treasury to make significant capital gains by trading in treasury bills and bonds in the secondary market. The Treasury therefore focused more on fixed income and accordingly, the Bank empowered the Treasury with greater autonomy in trading in fixed income securities.
Treasury, as the Bank’s guardian of funds and provider of liquidity, was able to facilitate credit growth by providing the required local and foreign liquidity at
the right price. Further, the Bank issued debentures which secured long term funds to facilitate credit growth.
Strengths • Market maker for the USD/LKR
exchange rate for spot and forward markets.
• Access to global markets for liquidity and foreign exchange.
• The ability to offer a sophisticated range of treasury products.
• Experienced and dedicated staff to manage the critical functions of the Treasury, which includes customer service.
Challenges• Diminishing interest rate margins
which necessitate higher volumes for profitability.
Focus in 2015• Upgrade the IT platform to offer more
sophisticated treasury products such as advanced derivatives.
• Customer education on new possibilities, more sophisticated products and new markets and regulatory changes.
• More customer specific solutions enabled by enhanced technology.
• Improve customer orientation and product offering.
OutlookThe expected increase in trade activity, particularly in response to the budgetary measures, is likely to spur more foreign exchange related transactions through Sri
Lanka’s banking channels in 2015, and this will bolster our positive outlook for an increase in foreign exchange flows to the country. As Sri Lanka continues its rapid pace of development, with GDP per Capita estimated to rise to US Dollars 4,000 by 2016, there will be an increasing need for financial instruments to increase in volume as well as range, which the Bank is well placed to harness. Sri Lanka’s attractiveness as an investment destination will also spur the introduction of more sophisticated financial instruments to cater to international investors.
0.99
0.99
1.54
1.76
1.62
Exchange Income
2010 2011 2012 2013 2014
Rs Bn
43 47
55 58
61
Treasury Bills and Bonds
2010 2011 2012 2013 2014
Rs Bn
G4-4, 8, 9, PR-3

Hatton National Bank PLC74
Retail Banking
A focus on technology drives profitability
Performance The Bank’s Personal Financial Services reaped the dividends of the strategic initiatives to perform well in an extremely competitive environment. The Asset portfolio (excluding Pawning) grew by Rs 10.4 Bn whilst deposits grew by Rs 32.2 Bn.
In Deposit Mobilisation, HNB achieved the highest ever growth in its Current and Savings Accounts (CASA) with contributions coming from Demand Deposits, General Savings, and Capital Savings, and each growing by 18%, 22% and 80% respectively. Well thought out deposit mobilisation strategies such as targeting higher value accounts and the contribution by the branch sales team towards deposit mobilisation, were factors which contributed significantly to deposit growth during the year. Having identified a product gap, the Bank introduced “HNB You” to target youth between the ages of 18 to 30 years. This is an exclusively digital offering with account holders being mandatorily signed up for internet and mobile banking, with only e-statements and no paper statements being offered. The proposition also offers a range of exclusive benefits in keeping with the needs and aspirations of the youth segment.
The ‘Home Counter’ was another new delivery channel which has enabled door step deposit mobilisation for busy professionals and entrepreneurs. By relieving such professionals and business persons of the encumbrance of visiting a
bank at the end of their day to deposit their daily cash income, the Bank has created a win-win delivery channel. It has proven particularly popular amongst professionals such as doctors whose daily earnings in cash are collected by HNB branches based in reputed hospitals.
Another important aspect of the ‘Home Counter’ is garnering deposits and payments from our Micro Finance customers in rural Sri Lanka, thus eliminating the need for such customers to travel long distances to reach bank branches and also improving the collectability of advances granted to this segment.
During the year, the Bank also installed cash deposit machines with the instant deposit processing capability, resulting in accounts being instantly credited 24 hours of the day, 365 days of the year. These machines not only eliminate the need for a customer to stand in line at counters but have also placed us ahead of competition in terms of offering unmatched customer
convenience to our Retail as well as Corporate and SME customers.
The Personal Loans portfolio grew significantly by more than 83% to Rs 11.8 Bn supported by a focused market segmentation strategy delivered through an extensive range of product variants such as Education, Vehicles, etc customized to various professional/salaried segments and including features, to suit diverse financial needs of professionals and busy executives. The NPA ratio of just 1% in this portfolio highlights the quality of this business segment, which consists mainly of professionals and corporate executives.
HNB is a pioneer in the Housing Loans segment and our product branded ‘Shanthi’, which includes domestic and foreign currency loans, recorded a growth in excess of 10.2% with the portfolio reaching Rs 27.0 Bn with total disbursements amounting to Rs 9.1 Bn.
The Bank was successful in achieving its objective of maintaining portfolio quality during this year as well, with NPAs maintained well below industry averages. It
The Bank’s Retail Banking business constitutes the branch network and Lending and Investment products which include Leasing, Pawning, Housing Loans, Personal Loans, Credit Card services, Savings, Fixed Deposits and Current Accounts. True to our brand
promise, our products strive to partner an individual as he or she progresses through the different stages in life - from birth to childhood, student and adult life to senior citizen. The Retail Banking business also encompasses Inward and Outward Remittances.
Integrated Management Discussion& Analysis
Deposit Breakdown
0.5%19.4%68.1%
12.0% CorporateRetailSMEMicrofinance
Deposit Mix - CASA : FD
62%38%
FDCASA
54%46%
FDCASA
2013 2014
G4-4, 8, 9, PR-3G4-4, 8, 9, PR-3
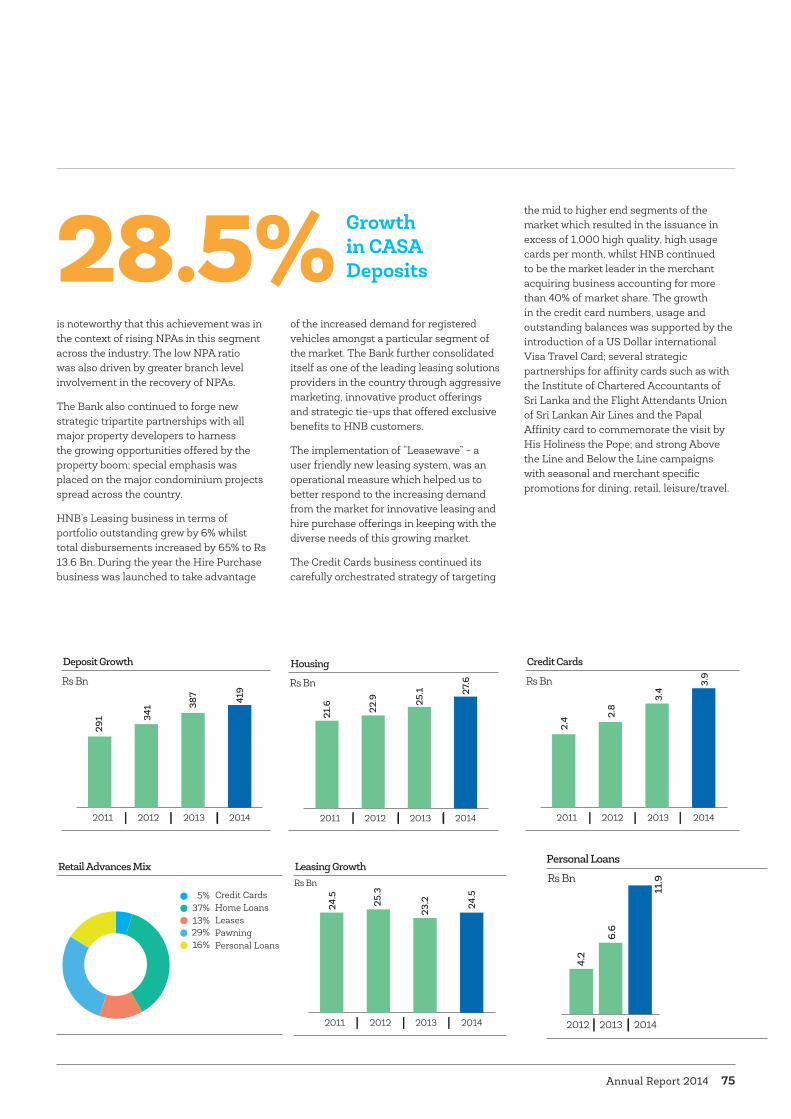
Annual Report 2014 75
is noteworthy that this achievement was in the context of rising NPAs in this segment across the industry. The low NPA ratio was also driven by greater branch level involvement in the recovery of NPAs.
The Bank also continued to forge new strategic tripartite partnerships with all major property developers to harness the growing opportunities offered by the property boom; special emphasis was placed on the major condominium projects spread across the country.
HNB’s Leasing business in terms of portfolio outstanding grew by 6% whilst total disbursements increased by 65% to Rs 13.6 Bn. During the year the Hire Purchase business was launched to take advantage
of the increased demand for registered vehicles amongst a particular segment of the market. The Bank further consolidated itself as one of the leading leasing solutions providers in the country through aggressive marketing, innovative product offerings and strategic tie-ups that offered exclusive benefits to HNB customers.
The implementation of “Leasewave” - a user friendly new leasing system, was an operational measure which helped us to better respond to the increasing demand from the market for innovative leasing and hire purchase offerings in keeping with the diverse needs of this growing market.
The Credit Cards business continued its carefully orchestrated strategy of targeting
the mid to higher end segments of the market which resulted in the issuance in excess of 1,000 high quality, high usage cards per month, whilst HNB continued to be the market leader in the merchant acquiring business accounting for more than 40% of market share. The growth in the credit card numbers, usage and outstanding balances was supported by the introduction of a US Dollar international Visa Travel Card; several strategic partnerships for affinity cards such as with the Institute of Chartered Accountants of Sri Lanka and the Flight Attendants Union of Sri Lankan Air Lines and the Papal Affinity card to commemorate the visit by His Holiness the Pope; and strong Above the Line and Below the Line campaigns with seasonal and merchant specific promotions for dining, retail, leisure/travel.
291 34
1 387 419
Deposit Growth
2011 2012 2013 2014
Rs Bn
Retail Advances Mix
13%37%
5%
16%29%
Credit CardsHome LoansLeasesPawning Personal Loans
25.1
21.6 22
.9
27.6
Housing
2011 2012 2013 2014
Rs Bn
3.4
2.4 2.
8
3.9
Credit Cards
2011 2012 2013 2014
Rs Bn
Personal Loans
4.2
6.6
11.9
2012 2013 2014
Rs Bn
291 34
1 23.224
.5
25.3
24.5
Leasing Growth
2011 2012 2013 2014
Rs Bn
Growth in CASA Deposits28.5%
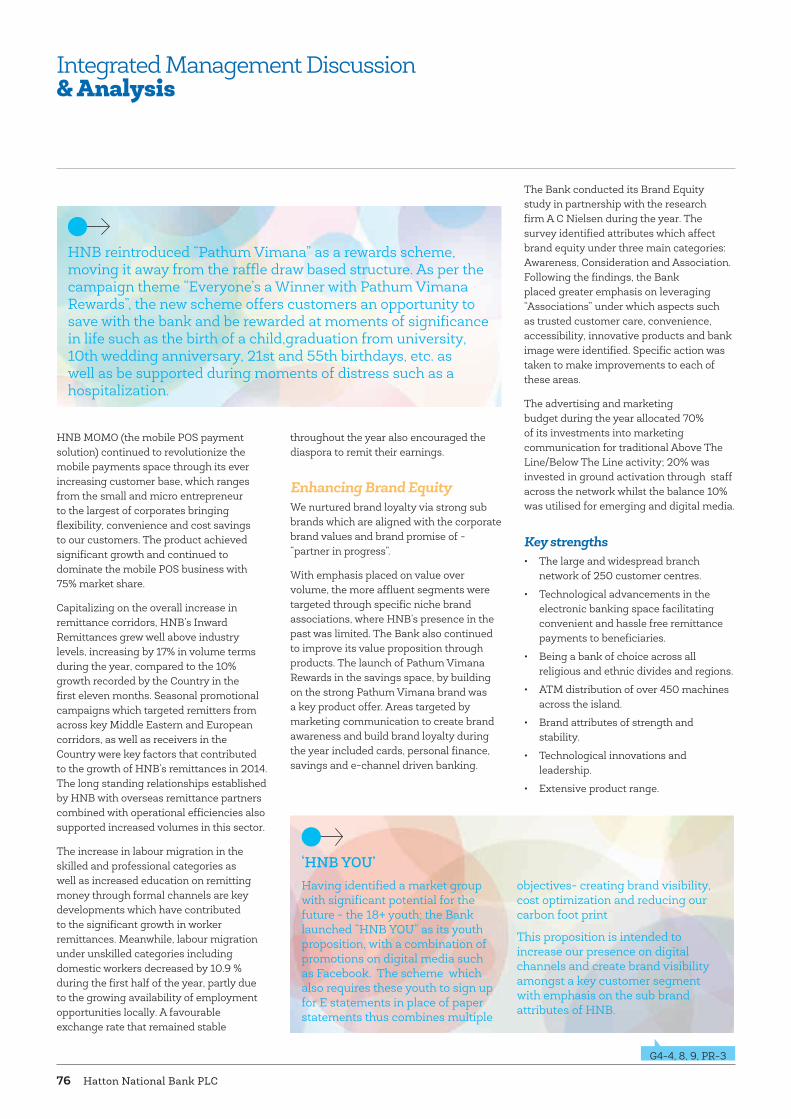
Hatton National Bank PLC76
Integrated Management Discussion& Analysis
HNB MOMO (the mobile POS payment solution) continued to revolutionize the mobile payments space through its ever increasing customer base, which ranges from the small and micro entrepreneur to the largest of corporates bringing flexibility, convenience and cost savings to our customers. The product achieved significant growth and continued to dominate the mobile POS business with 75% market share.
Capitalizing on the overall increase in remittance corridors, HNB’s Inward Remittances grew well above industry levels, increasing by 17% in volume terms during the year, compared to the 10% growth recorded by the Country in the first eleven months. Seasonal promotional campaigns which targeted remitters from across key Middle Eastern and European corridors, as well as receivers in the Country were key factors that contributed to the growth of HNB’s remittances in 2014. The long standing relationships established by HNB with overseas remittance partners combined with operational efficiencies also supported increased volumes in this sector.
The increase in labour migration in the skilled and professional categories as well as increased education on remitting money through formal channels are key developments which have contributed to the significant growth in worker remittances. Meanwhile, labour migration under unskilled categories including domestic workers decreased by 10.9 % during the first half of the year, partly due to the growing availability of employment opportunities locally. A favourable exchange rate that remained stable
throughout the year also encouraged the diaspora to remit their earnings.
Enhancing Brand Equity We nurtured brand loyalty via strong sub brands which are aligned with the corporate brand values and brand promise of - “partner in progress”.
With emphasis placed on value over volume, the more affluent segments were targeted through specific niche brand associations, where HNB’s presence in the past was limited. The Bank also continued to improve its value proposition through products. The launch of Pathum Vimana Rewards in the savings space, by building on the strong Pathum Vimana brand was a key product offer. Areas targeted by marketing communication to create brand awareness and build brand loyalty during the year included cards, personal finance, savings and e-channel driven banking.
The Bank conducted its Brand Equity study in partnership with the research firm A C Nielsen during the year. The survey identified attributes which affect brand equity under three main categories: Awareness, Consideration and Association. Following the findings, the Bank placed greater emphasis on leveraging “Associations” under which aspects such as trusted customer care, convenience, accessibility, innovative products and bank image were identified. Specific action was taken to make improvements to each of these areas.
The advertising and marketing budget during the year allocated 70% of its investments into marketing communication for traditional Above The Line/Below The Line activity; 20% was invested in ground activation through staff across the network whilst the balance 10% was utilised for emerging and digital media.
Key strengths • The large and widespread branch
network of 250 customer centres.
• Technological advancements in the electronic banking space facilitating convenient and hassle free remittance payments to beneficiaries.
• Being a bank of choice across all religious and ethnic divides and regions.
• ATM distribution of over 450 machines across the island.
• Brand attributes of strength and stability.
• Technological innovations and leadership.
• Extensive product range.
‘HNB YOU’ Having identified a market group with significant potential for the future - the 18+ youth; the Bank launched “HNB YOU” as its youth proposition, with a combination of promotions on digital media such as Facebook. The scheme which also requires these youth to sign up for E statements in place of paper statements thus combines multiple
objectives- creating brand visibility, cost optimization and reducing our carbon foot print
This proposition is intended to increase our presence on digital channels and create brand visibility amongst a key customer segment with emphasis on the sub brand attributes of HNB.
HNB reintroduced “Pathum Vimana” as a rewards scheme, moving it away from the raffle draw based structure. As per the campaign theme “Everyone’s a Winner with Pathum Vimana Rewards”, the new scheme offers customers an opportunity to save with the bank and be rewarded at moments of significance in life such as the birth of a child,graduation from university, 10th wedding anniversary, 21st and 55th birthdays, etc. as well as be supported during moments of distress such as a hospitalization.
G4-4, 8, 9, PR-3
Annual Report 2014 77
• Superior customer service.
• Long established agency arrangements and correspondent relationships with globally reputed banks/ exchange houses and worldwide remittance services.
Challenges• Low interest rate environment.
• Volatility in gold prices
• Recovery of NPAs in the retail space has been challenged by the change in the legal environment which prohibited parate execution for small loans.
• Intensely competitive market in both personal financial services and remittances.
Focus for 2015 • Driving usage of electronic channels.
• Centralising the credit underwriting and processing of the remaining 7 regions during the first half of 2015.
• Creating dedicated sales teams at branches and centralized locations.
• Launch of an outbound tele marketing capability
• Re-vamping our High Net Worth (HNW) offering.
• Extended hours of banking to suit varying customer requirements of different locations.
• Partnering Telcos for customer convenience and technological advancement.
• Intensifying focus on selling and marketing.
• Partnering the launch of the Electronic Bus ticket initiative.
Outlook for Retail Banking HNB will strengthen its capabilities to capitalise in a cashless, chequeless retail payments society. We see opportunities for financial inclusion and to bring in more customers to formal channels through new world banking. Whilst we will promote a “whole new world of banking”, our conventional channels will also continue to maintain their market leadership in the country.
Several environmental factors support the optimistic outlook we have for this sector. For one, the resurgence in the property market in post war Sri Lanka is expected to continue driving demand for housing loans both through tri-partite arrangements and standalone basic housing requirements.
The retail space for personal financial services, leasing, and credit cards remains highly competitive, with technology and service quality rather than price likely to be the differentiators in the year ahead.
The projected rise in Sri Lanka’s per capita income over the next few years augurs well for an increase in consumer spending and personal financial needs. Against this backdrop, the increasing demand amongst consumers for conveniences through cardless options and seamless digital channels offers many opportunities to grow fee income. The sales and marketing efforts of the retail banking space will address these areas in 2015.
We expect technology, and big analytics which could facilitate niche marketing and customised solutions, to be game changers in this space. Encouraged by the success of our innovations such as HNB MOMO, we are also looking to widen horizons in the
Expanding horizons with pioneering technology to redefine possibilities for the Sri Lankan customerHNB launched a state of the art mobile application which utilises cutting edge technology to redefine the relationship between the banking industry and its customers. The HNB Mobile App, available to both HNB customers as well as non customers, utilises Augmented Reality and QR Code technologies to enable users to interact with HNB in real time. The App also contains innovative and attractive features to ensure users are kept up-to-date about new products, services and special offers.
A unique attribute which differentiates this Application from standard mobile apps is its Map View feature which uses Augmented Reality, a technology which superimposes a computer-generated image on a user’s image of the real world, to provide a composite view. Map View creates a live 360° streetscape with icons communicating the distance to the nearest HNB ATMs and branches and to establishments which offer special promotions such as discounts and gifts to HNB customers.
HNB Eye is another novel feature of the App which utilises QR Codes, a machine-readable code typically used for storing URLs or other information; to enable reading by a smart phone. Although QR Codes have been employed in Sri Lanka before, HNB Eye takes this technology to a higher stage of its evolution by making the entire print area of press advertisements readable through smart phone scanning, instead of a small designated area on it. Videos and 3D animated objects which provide information to the customers are stored in these QR codes and can be accessed by simply scanning the code with a smart phone.
HNB Mobile App is available on both Android and iOS platforms with users afforded the option of logging in with their Google IDs or Facebook accounts or even browsing as an unregistered user. The App is customizable according to user requirements or preferences whilst its sleek design and sophisticated functionality make it highly user friendly.
Worker Remmittances to Country Vs HNB
20122011 2013 2014
HNBIndustry% Growth
25
23
16
23
7
29
10
17
G4-4, 8, 9, PR-3

Hatton National Bank PLC78
Integrated Management Discussion& Analysis
local market by building on technological capabilities such as Augmented Reality (see boxed story) to offer personalised solutions.
The convenience afforded by the launch of Cash Deposit machines in 2014, will be complemented by the introduction of Cheque Deposit machines in the year ahead. The pioneering initiative offers real time scrutiny and acceptance / return of cheques in Sri Lanka, all day every day of the year. Our self service devices such as payment kiosks -where bills can be paid for a fee - will also target non-bank customers.
The Bank’s focus on increasing the percentage of higher value customers will see it invest in the expansion and enhancement of the HNB Crystal and Club propositions which are the Bank’s HNW offerings.
The reduction in the Bank’s Pawning product exposure, to account for just 5% of the Bank’s lending portfolio, has resulted in minimizing the Bank’s vulnerability to fluctuations in global gold market prices.
Outlook for Inward Remittances It is projected that Sri Lanka’s Inward Remittances will reach US Dollars 10 Bn by 2020. Two Million Sri Lankans currently work overseas, constituting 17% of Sri Lanka’s working population. Worker remittances are likely to reflect an upward movement as the profile of Sri Lankan migrant workers shifts towards skilled manpower earning higher salaries
and perks, from being previously skewed towards unskilled female domestic workers.
We have identified considerable market potential amongst Sri Lankan expatriates across the globe. Thus, reaching beyond our shores to facilitate cross border solutions and serve these communities is an important aspect of our sustainability strategy. We will strive to create awareness of legitimate and secured channels for inward remittances and the Bank’s foreign currency housing loans amongst these communities. Our efforts to establish our brand presence will be well supported by the long standing relationships we have
established with banks and Exchange Houses in these countries. It is also encouraging that higher skilled employee remittances are projected to account for a larger share of Sri Lanka’s inward remittances.
A key competitive advantage in this business segment is the ease, speed and the variety of options we can offer customers for encashment of remittances. Electronic delivery channels such as the Ewallet, mobile money and cardless payments are hence, key channels of growth we have identified for the year ahead.
Transcending distances and time with Inland Remittances
Year 2014 saw HNB launch the transfer and encashment of remittances within Sri Lanka via the ATMs. Using a network of over 450 ATMs, customers as well as non HNB customers are now able to send a remittance to any person holding an active local mobile connection.
Equipped with 2 factor authentication, the process provides a PIN which is divided between the sender and the recipient. The recipient is only required to reach the nearest ATM to withdraw the money by combining his or her half of the PIN with the other half which is with the sender. This cardless service option enables even non HNB customers to enjoy this convenience of one of the best ATM networks in the country which guarantees cash on arrival 24 hours of the day with a track record of 99% uptime.
G4-4, 8, 9, PR-3

Annual Report 2014 79
Delivery ChannelsThe technological thrust and changing market needs necessitate that we provide more choice and convenience to customers. Accordingly, we diverted our investments into enhancing technological platforms instead of growing our brick and mortar channels. We will leverage on the strength we command through our well spread branch network and focus on driving sales and enhancing service quality to offer a superior offering to the customers.
On the digital front, our comprehensive e-banking platform and the fully fledged mobile banking solution were complemented by the launch of special purpose ATMs such as cash deposit machines, kiosks and cheque deposit machines. These cheque deposit machines offer real time scrutiny, acceptance and return of cheques in Sri Lanka, any time any day of the year while our self-service devices such as bill payment kiosks provide convenience to our customers as well as non-customers. Furthermore, we provided advanced functionalities by using latest technologies such as augmented reality. Our robust technological platforms together with our continuous focus on adopting world class technology and drive for innovation will enable us to provide an unparalleled proposition to customers.
Customer Touch-points
As at 31, December 2012 2013 2014
Customer Centres 247 250 249
HNB Student Banking centres 166 168 168
Village based Gami Pubuduwa Units 6 3 2
Branch based Gami Pubuduwa Units 114 121 125
Micro Banking Units 9 9 9
HNB Mobile Banking Service Units 2 0 1
Province Customer Centres No of ATMs
Central 25 41
Eastern 26 35
North Central 10 18
North Western 18 26
Northern 22 37
Sabaragamuwa 11 21
Southern 26 48
Uva 11 16
Western 100 208
Total 249 450
G4-4, 8, 9, PR-3

Hatton National Bank PLC80
Kandy 14Akurana DiganaGalahaGampola GelioyaKandy Kandy City Centre KatugasthotaKundasaleKurunduwatte Nawalapitiya PeradeniyaPilimathalawaRikillagaskada
Matale 3Dambulla GalewelaMatale
Nuwara Eliya 8Bogawanthalawa Ginigathhena Hatton Maskeliya Nuwara Eliya Pussellawa Ragala Talawakele
Ampara 11Akkaraipattu Ampara DehiattakandiyaKalmunaiKaraithivuNinthavurPottuvilSamanthuraiThandawenweliThirukkovilUhana
Batticaloa 5BatticaloaChenkaladyValachchenaiKaluwanchikudyKattankudy
Trincomalee 10Kantale KalladyKinniyaMarathamunaiMullipathanaMutturPeriyakade SerunuwaraTrincomaleeUppuveli
Anuradhapura 7Anuradhapura Anuradhapura New Town Kekirawa MedawachchiyaNochchiyagama PadaviparakramapuraThambuttegama
Polonnaruwa 3AralaganwilaMedirigiriyaPolonnaruwa
Kurunegala 9AlawwaGalgamuwaGiriullaHettipolaKuliyapitiyaKurunegalaKurunegala Metro
NorthernProvince
Sabaragamuwa Province
EasternProvince
Central Province
North Central Province
Uva Province
SouthernProvince
WesternProvince
North WesternProvince
Customer CentresATMs
2635
2541
1116
1121
2648
100208
1826
1018
2237
Customer Centre Network
Integrated Management Discussion& Analysis
G4-9 FS-13
Annual Report 2014 81
NikaweratiyaWariyapola
Puttalam 9AnamaduwaChilaw Dankotuwa MadampeMarawilaNorochcholePuttalamUddappuwaWennappuwa
Jaffna 13AtchchuveliChankanaiChavakachcheriChunnakkamJaffnaJaffna MetroKaithady KodikamamManipayNelliady Point PedroThirunelvelyVelanai
Kilinochchi 2KilinochchiKilinochchi North
Mannar 3Mannar MallaviNanattan
Mullaitivu 2MullaitivuMulliyawalai
Vavuniya 2KurumankaduVavuniya
Kegalle 4Mawanella KegallePinnawala Warakapola
Ratnapura 7Balangoda Embilipitiya
Godakawela KahawattaKalawanaPelmadullaRatnapura
Galle 9Ambalangoda BatapolaElpitiya GalleHikkaduwaKarapitiya Koggala PitigalaYakkalamulla
Hambantota 8Ambalantota Angunakolapelessa HambantotaMiddeniya SooriyawewaTangalle Tissamaharama Walasmulla
Matara 8AkuressaDeniyayaDevinuwara DickwellaHakmanaMatara UrubokkaWeligama
Badulla 6Badulla Bandarawela Haputale MahiyanganaPassaraWelimada
Monaragala 6Buttala Bibile Kataragama Monaragala SiyambalanduwaWellawaya
Colombo 61AluthkadeAthurugiriyaAvissawellaBambalapitiyaBoralesgamuwaBorellaCinnamon GardensCity OfficeDehiwelaDematagodaGrandpassGreenpathHanwellaHead Office BranchHomagamaHulftsdorpInternational Water Management Institute JampettahJayawardanapura Hospital KaduwelaKelaniyaKiribathgodaKirullaponeKohuwelaKollupitiyaKolonnawaKotahenaKottawaKotteMaharagamaMain Street Ext MalabeMaligawatteMaradanaMirihanaMoratumullaMoratuwaMount LaviniaMutwalNarahenpitaNawalaNawaloka Nawam MawathaNugegodaOverseas School of Colombo PadukkaPamankadaPanchikawattePeliyagoda PettahPiliyandalaRatmalana
Sea StreetSLPA Ext ThalangamaThalawathugodaThe Central ThimbirigasyayaWellawatteWijerama Ext World Trade Centre
Gampaha 30Airport Departure Counter Biyagama DelgodaDivulapitiya Ekala Gampaha GanemullaHendalaJa-Ela Kadawatha KandanaKatunayake Kirindiwela KochchikadeMarandagahamula Minuwangoda MirigamaNegombo Negombo Ext Negombo MetroNittambuwa PamunugamaPugodaRagama SeeduwaSri Lankan Airlines VeyangodaWattalaWeliweriyaYakkala
Kalutara 9AluthgamaBandaragamaBeruwalaHorana Ingiriya KalutaraMathugamaPanadura Wadduwa
Extension Offices Pay Offices
G4-9 FS-13

Hatton National Bank PLC82
SME
Performance HNB’s Small & Medium Enterprises (SME) sector achieved a moderate performance with the portfolio growing by 12.6% and total value of disbursements increasing by 33% to Rs 47.8 Bn during the year. This was despite a challenging environment for Sri Lanka’s SME sector, as its main sub sector of agriculture was impacted by adverse weather conditions and a decline in export demand due to political unrest in certain key export markets such as Russia, Ukraine and the Middle East. Moreover sanctions imposed by the EU on Sri Lanka’s fish imports also impacted the fishing industry.
However, several strategic initiatives by the Bank supported a strong performance that overcame the many environmental challenges. The Bank placed greater emphasis on expanding the contribution from its SME segment. For one, the Bank’s overall strategic imperative of a sales driven culture was translated into action via setting up of dedicated SME cells. The Bank also adopted a more centralised approach to marketing its SME solutions. It complemented the sales and marketing efforts of Regional and Branch Mangers during the year with an island wide launch of “HNB Small & Medium Enterprise Development Partner” (“HNB-SMED Partner”) promotion.
Severe droughts during the first quarter of the year and floods during the last quarter, impacted crop production, and hence hampered recoveries of loan payments in this sector. Moreover, a sharp decline in tea prices by approximately Rs 100 a kg
during the year, adversely impacted small and medium tea factories, which are a key customer segment. In addition, reduced market prices of rice, following an increase in imports, found rice millers curtailing their milling activities until prices became more favourable to suppliers. On the other hand, an increase in demand in the global market for some commodities such as fresh fish, cinnamon and coconut based products supported Sri Lanka’s SME sector.
The Bank’s efforts to continuously enhance customer convenience using technology, saw it providing its SME clients a doorstep cash collection facility. This facility provided through selected branches of the island wide network, enables the instant online updating of customer accounts upon acceptance of cash by bank officers.
Key strengths• A strong culture of SME lending since
the Bank’s beginnings in 1889.
• Wide geographic spread of our branch network.
• Partnerships with leading international funding agencies.
• Online credit approval system for all facilities, which has expedited service to customers, specially supported by 10 dedicated SME Cells.
• Empowered structure for regional and branch level credit approval.
• Skills and competencies at branches and regional SME cells which includes 149 field staff including 47 agricultural officers to handle agro related facilities.
• Recognition as a participating bank for many re finance schemes.
• Ability to offer a comprehensive financial package with pre-approved limits.
• Representation of risk division at each stage of the SME lending process.
Challenges• A highly competitive environment.
• Lack of formal accounting practices and managerial skills within these enterprises.
• Non availability of tax concessions for certain SMEs despite being an important economic sector.
• High cost of infrastructure such as electricity that inhibits growth of new the SMEs.
• Ineffectiveness of the administrative mechanism to support the development of SMEs by the Government.
• The heavy inflow of certain imported substitutes that discouraged some SMEs.
Focus for 2015• Promote electronic channels such as
internet banking and mobile banking.
• Open three new fully dedicated SME centres.
• Strengthen the SME cells with industry expertise and knowledge eg: tea, rubber, garments and other agri based industries.
• Implement the energy conservation funding line in collaboration with GIZ in the Districts of Northern, Eastern, North Central and Southern Provinces.
The Bank’s SME sector constitutes enterprises/customers with an annual turnover of less than Rs 600 Mn and exposure of less than Rs 200 Mn. The SME sector contributed 33% to the Bank’s income and loan book.
Integrated Management Discussion& Analysis
Door step cash collection facility offering convenience to customers.
G4-4, 8, 9, PR-3 FS-14

Annual Report 2014 83
• Introduction of new funding lines under distributor / supplier financing.
• Ensure uniformity of delivery standards of SME credit throughout our network.
• Further improve credit quality through more proactive measures to manage NPAs.
• Incentivising SME business development staff.
Outlook The SME sector has been high on the nation’s development agenda and is expected to account for an increasing share of Sri Lanka’s GDP in the next few years. Thus, the Bank’s objectives, which are also aligned with the national agenda for economic development, would strive for its SME business to account for an increasing share of its profitability and balance sheet growth.
We will intensify our focus in these SME sectors in the next few years and capitalise on the numerous opportunities that remain
untapped. The Bank’s long standing SME attuned culture and experience will be significant advantages in capitalising on this potential.
At the same time, the environment for SME remains highly competitive as several industry players compete to capture the potential of the sector. We anticipate that pricing will remain a key driver in attracting new businesses and retaining existing relationships. However, we will aim to leverage on service excellence as a differentiator in this space while striving to be a true “partner in progress” by empowering economically disadvantaged segments of the population across the country.
The low interest environment is also likely to promote investment in the SME sector in the first half of 2015; and we are well geared to cater to this anticipated increase in demand in terms of value as well as diversity of options. We also expect that the SME sector will see more cash flow based lending in place of security based
lending. This would empower many viable SMEs, which are unable to provide tangible security for their funding requirements, to approach Banks rather than resort to informal lending at very high costs.
The Bank will focus on its strategic drive to promote internet and mobile banking in this sector as well, as they not only offer more cost effective solutions for the more cost conscious entrepreneur but also free up time for branch personnel to offer more advisory services and tailor made solutions to suit the multiple needs of this segment. The doorstep cash collection facility for SME customers launched in 2014, will be also extended to encompass cash dispensation as well as bill payments in the year ahead.
Fostering entrepreneurship
Mr Sarath Dharmasiri, better known as PRASAD Mudalali is today a leading textile trader and a well known personality in the areas of Piliyandala and Homagama. His life story is one which exemplifies how hard work, acumen, faith and determination combined with access to the right support at the right time can transform one’s life. Prasad Textiles is today a household name in these towns.
Mr Dharmasiri’s life began in a small village in the Sabaragamuwa province and 35 years ago when he lost his father
whilst still a small child, he accompanied his mother from Kegalle to Colombo in search of employment to support their family. A person his mother knew in Pamunuwa, Maharagama was engaged in textile trading on a small scale and offered him food and lodgings in exchange for his helping out in the shop and with house work. Not being paid a salary, he longed to earn an income and decided he would one day start his own business.
A few years after and now married, Mr. Dharmasiri, along with his wife launched a tailoring shop in Nugegoda. He soon began to distribute his clothes to shops, carrying his products in the bus. Often walking barefoot he walked on the grassy edges of the street to avoid the heated asphalt on the pavement or the road. His present venture - “PRASAD TEXTILES”, was launched in 1989 on a very small scale.
Mr Dharmasiri describes how the “initial lessons in entrepreneurship” his mother imparted had helped him in his own enterprise.
Mr Dharmasiri began to expand his business and acquired his own premises with which he decided to venture into the construction of a 5 storied shopping complex – the largest at the time, in Piliyandala and Homagama. For his requirement for finances he turned to HNB which he knew was one the largest banks in the country and a partner he could trust. In 1992 he obtained his first loan of a Rs 100,000 under the Bank’s self-development loan scheme and laid the foundation for this shopping complex.
His success to become a leading textile merchant and owner of one of the largest textile complexes in the city of Maharagama, is one which is inspiring and to us as the catalyst - most rewarding.
It is most heartening that Mr Dharmasiri has not only displayed unusual business acumen but also humane qualities as a social worker whose service is much appreciated by the communities.
G4-4, 8, 9, PR-3 FS-14

Hatton National Bank PLC84
Development Banking
Performance HNB’s “Gami Pubuduwa” the renowned Micro Finance arm, launched in 1989 celebrated its milestone of 25 years in 2014.
The Gami Pubuduwa programme in 2014 reached a portfolio of Rs 6.5 Bn serving over 19,000 rural entrepreneurs. It carried out many capacity building initiatives across the country, which ranged from farmer skills development and technical and financial knowledge dissemination to creating market linkages. These are discussed under the review of our Social Capital.
The Bank’s Agri Fin initiative, which is supported by the World Bank, was able to facilitate 100 programmes reaching over 2,500 farmers and Micro entrepreneurs across the country, also affording them exposure to the latest practices and innovations. Under this initiative, the Bank rewarded the 44 best performing field officers with overseas exposure in Thailand and India, where they gained practical insights into the latest developments in commercial agriculture, post-harvest technology, micro irrigation, agri machinery and equipment and solar energy for farming activities.
During the year under review, the Development Banking portfolio grew by 40% to Rs 21.6 Bn. The Bank’s island wide network, with a strong presence outside the Western province supported the disbursement of Rs 13 Bn in loans to the micro and agro sectors, reaching a total clientele of nearly 35,000. The strength
of our field force and the impact of the overseas exposure they gained, were key internal drivers of our performance in this sector.
In addition, favourable government policies towards this sector, special schemes by the Central Bank and donor funding, also supported a commendable performance despite some negative impacts on agriculture, caused by adverse weather during the first part of the year as well as the last quarter.
Key Strengths • A strong and long established
specialized Development Banking arm.
• The Bank’s resourceful field force network.
• Ability to reach rural masses in hitherto un-accessed geographical locations.
• Many rural customer centres manned by experienced field officers.
• Being a participating bank for many donor funded refinance and interest subsidy schemes.
• Strong local and international collaborations Eg: World Bank, IFAD, SEEP, BTWP.
Challenges • Lack of entrepreneurial skills and
financial literacy amongst clientele.
• Lending by finance companies and microfinance entities without proper assessment resulting in multiple funding and diversion towards consumption, creating a divergence from income generating economic activity and sustainable wealth creation.
• Influence of donations and grants that dampens the entrepreneurial spirit and encourages a dependent mentality.
• Lack of a mechanism to monitor progress upon clients graduating to next level resulting in neglect of relationship and even exit.
• Relatively low use of technology by micro entrepreneurs in comparison to the high mobile penetration levels.
Focus for 2015 • Conduct more customer product
awareness and financial literacy programmes.
• Promoting greater use of technology by clients as well as field force network
Integrated Management Discussion& Analysis
The Bank’s Development Banking sector constitutes Microfinance (Gami Pubuduwa), Agricultural lending and the lower end of the SME segment. The Bank not only provides credit as well as insurance and savings solutions for income generating activity but also facilitates financial literacy and entrepreneur development to build capacities and uplift Sri Lanka’s rural economy.
Educational Background of Customers*
23%6%
27%
41%
1 - 5 Grade6 - 10 GradeGCE O/L
2%1%
GCE A/LDiplomaDegree
Gender (Main Promoter)*
69%31% Female
Male
Main Purpose of Loan*
Rs Bn
5% Equipment
4% Machinery
3% Vehicle
85% Working Capital
3% Building
G4-4, 8, 9, EC-7,8, SO-1, PR-3 FS-14* Analysis of Gami Pubuduwa portfolio
Annual Report 2014 85
* Analysis of Gami Pubuduwa portfolio
• Provision technology to increase customer convenience and service, for example more cash deposit machines with real time crediting.
• Enhance our reach through new client relationships.
• Explore avenues for more linkages, partnerships and value chain financing to cater to this sector.
• Introduce new credit lines to cater to specific sectors.
• Introduce mechanism to maintain relationships even after client graduates to higher level.
Outlook The Bank will facilitate technology driven growth of its Development Financing sector to harness the many opportunities in income and employment generating ventures. These include the introduction of the online transfer of data by field officers to facilitate expeditious approvals, encouraging clientele to use the Bank’s technological facilities and the enhancement of our service proposition through technological innovations.
We will also seek to build on the strength of partnerships with leading international funding agencies and create new partnerships with leading corporates to expand markets and create market linkages for long term growth. We expect the agro based industries to continue to be a key driver of Sri Lanka’s growth trajectory, and will encourage higher value addition in this sector for sustainable profitability. The Bank will also focus on increasing lending to promote environmentally beneficial projects such as Green Micro financing, bio gas and solar energy generation.
Sri Lanka’s market is seeing an increasing trend towards consumer lending by lower end financial institutions, resulting in a divergence from income generating activities and the developmental objectives of the nation. In keeping with our triple bottom line approach to business, we will strive to generate awareness of a more sustainable and long term approach through regular interactions with existing and potential customers. Entrepreneurial skills, financial management and literacy programmes will hence be expanded in the year ahead.
Sector*Rs Bn
AgriculturalAnimal productsCivil EngineeringHotel & CateringLight EngineeringManufacturingMedical serviceMiscellaneousTextileTradingTransportFood processing
3%
34%
16%
1%2%3%10%
1%
7%
5%
16%
2%
Employment Generation - No. of employees including promoter*
5%3%
3%
1 to 56 to 10Above 10
Age (main promoter)*
12% 26 to 30
36% 31 to 40
4% 18 to 25
11% 51 to 60
1% > 61 years
36% 41 to 50
Partnering entrepreneurship
Mr W T J S K Gurudegara is a young entrepreneur, who launched his business “Ishara Traders” 11 years ago, by obtaining a small loan under the HNB Gami Pubuduwa scheme. Ishara Traders today packs herbal medicine, curry powder, cloth detergent, lime paste and produces incense sticks and wicks for the market. At the start of his business Mr. Gurugedera delivered his products in a steel box on his motor cycle to shops in the area. Today he has 05 mini delivery trucks and employs 40 people including a disabled female from the area. The business which began as a registered sole entity is today a registered partnership with his spouse.
G4-4, 8, 9, EC-7,8, SO-1, PR-3 FS-14

Hatton National Bank PLC86
Integrated Management Discussion& Analysis
Partnering lives that inspire …
Mathan Sarogini was born in December 1979 at Muththaiyankaddu, (a village 45 km south of Mullativu) as the youngest in a family of 6 engaged in farming. She managed to be educated up to Year 8 under difficult conditions.
With the loss of her father at the tender age of 12 Years, the only income they earned was her mother’s daily wage as a labourer. She had 3 siblings. Muththaiyankaddu being at the heart of the war torn areas, Sarogini lost a brother and her only sister during the war whilst her other brother migrated illegally to Switzerland and has had no contact with the family since. As the conflict escalated, Sarogini’s mother like many parents at the time arranged a marriage for her daughter in 1994, when she was just 15 years of age. Sarogini gave birth to a daughter and a son in 1995 and 1997 respectively.
The final phase of the war saw Sarogini’s family being forced to move from place to place and end up in a welfare camp in Vavuniya, with her two children and belongings in a small sack. She was also separated from her husband during this last displacement in Mulliwaikal.
An year after the war ended she returned in 2010 and was resettled in a temporary hut in her village with her two children and her mother. Earning a living to provide the basics for her family was almost an insurmountable challenge, and as all her friends and family were in the same situation she had to depend on the rations provided by several NGOs operating in that area.
In September 2011, HNB opened its Customer center in Mullaitivu and in January 2012, HNB conducted a Customer awareness meeting in Muththaiyankaddu at which Mrs Sarogini was one of the active participants. Following the awareness created by the Bank’s field officer, Sarogini opened a Savings account in February 2012. Little did she realize at the time that it would be a turning point in her life.
Before long, she approached the Bank for a loan facility to setup a small scale dairy farm and after evaluation of her proposal & field visits, HNB provided a loan of Rs 120,000 in March to purchase two cows and construct a cattle shed. HNB’s field officer, an Agriculture graduate, provided the required technical advice and guidance whilst the Bank also initiated linkages with milk collecting companies.
Within a month of starting her venture Sarogini was collecting milk. She delivered 5 litres daily on her bicycle to the Oddusuddan milk collection point for which she collected her payment every 10 days. She managed her Spartan income carefully allocating for her family expenses, loan repayment as well as for future savings. With her savings she purchased a sewing machine with which she generates an additional income from dress making.
With the opening of the Mulliyawalai branch in March 2013, HNB moved closer to Mrs Sarogini’s home. She settled her first loan in entirety in March 2013 and the second loan of Rs 200,000 was disbursed through Mulliyawalai branch, to purchase three more cows, expand the cattle shed and to develop the grass land. The expansion enabled her to increase output to 23 litres per day.
As her savings also increased Sarogini purchased a motorcycle to transport her milk and to take her son and daughter to school. At the time she also received a grant with Indian Government assistance to construct a permanent house and completed construction with the addition of her savings.
Today, Sarogini’s daughter who passed her Advanced Level examination is studying for a degree to graduate as a Teacher whilst her
son is studying for the Advanced Level in the field of Technology
Her second loan was also settled in September 2014 and she obtained a third loan of Rs 400,000 to purchase four more cows and expand the cattle shed.
Today Sarogini manages a medium scale dairy farm with ten cows and five young calves in a well maintained permanent Cattle shed and collects a minimum of 30 litres of milk per day. She has also been generating an additional income through sewing with the two sewing machines and other required tools and equipment she owns with which she is able to sew ladies and children’s dresses.
In addition she has also expanded to include backyard poultry with 25 birds and seasonal paddy and ground nut cultivation with the support of hired labour. She owns three acres of paddy land in Muthuvinayagapuram and two acres of residential land.
Mrs Sarogini was the winner of the best dairy farmer award of Northern Region in 2013.
She acknowledges with gratitude the role played by Hatton National Bank by being a partner in the truest sense -from times of adversity to help her progress and to meet her aspirations; HNB is humbly proud and inspired to have played a part in this inspiring saga.
G4-4, 8, 9, PR-3 FS-14

Annual Report 2014 87
PERFORMANCE OF THE SUBSIDIARIES
HNB Assurance PLCAs per section 53 of the Regulation of Insurance Industry (Amendment) Act No. 3 of 2011, which required all Insurance Companies to segregate their long term insurance business and the general insurance business into two separate companies by 1st January 2015, HNB Assurance PLC incorporated a fully owned subsidiary company, in the name of HNB General Insurance Limited (PB 5167). Following approval and registration of the new company to carryout General Insurance business, HNBA PLC transferred its General Insurance business to HNB General Insurance Ltd. with effect from 1st January 2015 and the Company has now commenced issuing General Insurance policies under the new company.
Performance In terms of Gross Written Premium (GWP)HNB Assurance (HNBA) performed better than the market. The Company’s GWP in Life grew by 16%, at a considerably higher pace than the market growth of 9% whilst market share increased from 5% to 5.3%. The company’s market ranking rose from 7th to 6th position in 2014. Market
Capitalisation also increased from Rs 2.6 Bn to Rs 4.2 Bn, which marks a 59% growth over the previous year.
GWP growth in General Insurance increased by 25% vis a vis market growth in GWP while market share overall increased from 3.3% to 4%.
It is particularly noteworthy that HNBA’s new business growth in Life rose by a remarkable 43% during the year.
The Company’s consolidated turnover increased by 20% whilst Profit After Tax increased to Rs 418 Mn with a growth of 7%. Enhanced focus on the separate lines of business (facilitated by the segregation of Life and General distribution networks) was a key internal factor that helped improve performance during the year.
The Company’s ratings of A ‘lka’ for National Insurer Financial Strength Rating, and A ‘lka’ for National Long – Term Rating were reaffirmed during the year. Further, the Company’s new fully owned subsidiary was also awarded the same ratings from early January 2015 onwards.
The global industry environment remained stable, with no adverse impact
on reinsurers. This, combined with a significant drop in world oil prices led to a positive industry landscape worldwide.
The improved performance of the Colombo Stock Exchange resulted in increased income which also increased the demand for Insurance.
However, despite the high growth in GDP during the year, low growth seen in private sector credit and the erosion of purchasing power had a negative impact on the insurance industry.
The year under review saw intense price competition and larger companies experienced a slowdown while medium sized companies gained market share.
HNBA launched several new products such as ‘My Pension’ and three new Single Premium Investment Policies, whilst the products ‘My Child’ and ‘My Life’ were re-launched during the year.
The Company also entered into several strategic alliances with Non Bank Financial Institutions including Central Finance, Sinhaputhra Finance and Alliance Finance for General Insurance and extended the Takaful business line to Non-Motor Insurance.
During the year, the Company consolidated its network presence with the existing branches split into Life and General business units, with a minimal addition of new staff.
Strengths • HNB brand equity
• The Bancassurance network
• The branch network
• Digital marketing
• IT infrastructure and technological advantage in customer service
• Moving into the new RBC regime in both Life and General Insurance businesses.
Challenges• Increase in overheads due to
segregation of Life and General businesses
• Intense price competitiveness of the market.
• Increase in motor and medical claims
HNB Assurance - the Bank’s insurance subsidiary, together with its new fully owned Subsidiary HNB General Insurance Ltd, offer both Life and General Insurance products. HNB Assurance holds 6th position in market share in Life Insurance while HNB General Insurance Ltd is ranked 8th in market share in General Insurance.
PAT and PBT
2012 2013 2014
PBTPATRs Mn
394
351
425
389 43
9
418
ROE and Dividend Payout
2012 2013 2014
Dividend PayoutROE%
39.2 41
.8
19.0
45.0
18.0
17.3

Hatton National Bank PLC88
Integrated Management Discussion& Analysis
• Possible inflationary pressures which could further erode purchasing power
• Poor public perceptions of the insurance industry
Focus for 2015• Enhancing customer convenience
through e-Life, Customer apps, payment options at a number of banks, Mobile payment options Dialog Ez cash, Mobitel M Cash and HNB MOMO
• Enabling the Life and General businesses to stand alone as separate entities under the new regulatory environment
OutlookThe low interest rates pose a challenge in generating investment returns. However, we also expect this to stimulate lending activity which in turn will create a demand for insurance. It will also encourage people to look at long term investment opportunities such as Life Insurance and pension products more positively.
The increasing imports of hybrid vehicles is likely to continue perhaps at a slower pace due to the increase in taxes. HNB Assurance has been well equipped to meet the insurance needs of hybrid vehicles at very competitive prices and is hence well poised to benefit from this growth market. Similarly the Company is also preparing to meet the demand for insurance for electric vehicles.
Life Insurance penetration level in the Sri Lankan market is relatively low and thus offers opportunity for growth. Moreover, a growing population will spur demand for health and retirement solutions. An increase in migrant workers, with higher disposable income and a projected rise in per capita income over the next few years also augur well for insurance products. We have thus identified Life Insurance, Pensions, Motor Insurance and Marine Insurance as key growth markets for the future. HNBA will look for growth opportunities through mergers and acquisitions, strategic alliances and new channels by exploring opportunities locally and overseas and will also look to leverage IT to improve customer service, generate leads and enhance staff productivity.
We expect the industry segregation that becomes effective from 1st January 2015, under the Regulation of the Insurance Industry (Amendment) Act No. 3 of 2011 to pave the way for healthier competition.
Sithma Development Pvt. Ltd.The Company’s Revenue increased by Rs 92.7 Mn whilst Profit After Tax increased by 35% to Rs 506 Mn. and ROE improved to 7.64%
The ability of the unparalleled facilities at HNB Towers to attract higher rental coupled with the reduction in cost of funds due to lower interest rates and repayment of borrowings, enabled Sithma Development to record the highest ever profit during the year.
In line with our sales oriented and customer friendly culture, we have introduced processes to strengthen relationships with tenants.
Strengths• Brand image as an up market grade A
office building developer.
• High standards of facilities management at HNB Towers
• Technological leadership- technically advanced building
• Experienced and customer friendly staff.
Challenges• Increasing competition as more Grade A
office space is built around Colombo
Focus for 2015• Optimise energy efficiency.
• Migrate to energy efficient lighting.
• Improve tenant satisfaction.
Outlook Increasing investments and economic activity is driving an expansion in office space amongst our tenants and the Grade A office space that we own sees us well poised to leverage these opportunities. We also envisage harnessing growth opportunities for high quality and energy efficient property development in the sub urban and other locales out of Colombo. Enhancing the environmental friendliness and energy efficiencies of our new and existing properties will be a key priority for the next few years.
Acuity Partners
Performance Acuity Partners performed exceptionally well in 2014 despite lackluster market conditions which prevailed mostly during the first half of the year under review. Group profitability increased to Rs 448 Mn from Rs 241 Mn the previous year. Growth was driven primarily by the Company’s
Sithma Development Pvt. Ltd. is the Bank’s subsidiary which owns, and manages the rental of premium office space at the HNB Towers.
Sithma - Profit After Tax
273
374
506
2012 2013 2014
Rs Mn
Acuity Partners - Profit After Tax
96
241
448
2012 2013 2014
Rs Mn
Annual Report 2014 89
subsidiaries Lanka Ventures and Acuity Securities. Corporate Finance reported a significantly improved performance and Acuity Stockbrokers made a commendable contribution despite challenging equity market conditions. Guardian Acuity Asset Management (GAAM) (a joint venture between Acuity Partners and Ceylon Guardian Investment Trust) continued to consolidate its position within the industry by significantly increasing the assets under its management.
In line with the Group’s strategic priority to drive sales, the company renewed the emphasis on cross selling opportunities and synergies, which arise from a full service investment banking model, whilst strengthening the core marketing function.
Following two consecutive years of subdued market sentiments, the Colombo Stock Exchange (CSE) S&P SL 20 Index gained 25.3% for the year to close at 4,089.14 points with the bulk of the gains accruing in the latter half of the year. The recovery in share prices was driven by net foreign purchasing of Rs 21,431 Mn, largely of blue chip stocks which enabled turnover levels to recover to Rs 1,407.9 Mn. Market activity was again subdued in the penultimate months of the year on account of political uncertainty following the announcement of elections but is now expected to improve in the post election environment.
The partial recovery of the equity market enabled Acuity Stockbrokers to improve its financial performance during the year. However, this brief window of opportunity in the equity markets was not prolonged enough to enable any significant roll out of IPOs which have traditionally accounted for a greater share of Corporate Finance revenues.
The declining interest rate environment enabled the primary dealership, Acuity Securities, to increase profitability significantly, supported by bond trading gains. Corporate Finance improved its market share in the listed debenture space and placed a 5 year corporate debenture at the lowest yield for the year, whilst securing other debt raising mandates. Corporate Finance also concluded a number of Mergers and Acquisitions which
contributed substantially to the profitability of this business segment.
Competition within the Stock Broking industry remained intense. Following the issue of a large number of new broking licenses since 2009, a disproportionate number of players have exerted pressure on the share market. Pressures have also come to bear on the profitability of existing players who have invested heavily in branch expansion and research whilst maintaining staff resources and service standards through some of the most difficult periods for the industry.
On the Corporate Finance / Investment Banking front, a lack of regulation or capital requirements has led to the emergence of many boutique style operators which has further eroded margins, whilst fees still remained amongst the lowest in the region. The Fund Management segment also witnessed intense competition with the entry of many unlicensed and unregulated fund managers whilst low entry barriers to the regulated segment of the industry have led to an influx of many new unit trusts and unit trust management companies.
As a frontier market, the Sri Lankan capital market has traditionally been negatively correlated with global markets. Volatile conditions in global markets did not have a major impact on the local market which was driven by opportunities arising out of the strengthening Sri Lankan economy.
Strengths• Our unrivalled reputation
• Decades of experience in capital markets and investment banking
• The brand equity and support of our joint parent companies, HNB and DFCC Bank
Challenges • Establishing stability in the country for
investor confidence.
• Ensuring interest rate stability as a key criteria for raising debt.
Focus for 2015 • Harnessing the high potential
opportunities identified in the space of Private Equity.
OutlookThe Private Equity space has been identified as a potential growth sphere which would allow Acuity to build on our existing experience in the field through Lanka Ventures.
We expect Sri Lankan capital markets to continue to develop, supported by sustained levels of high GDP growth. Recent road shows conducted by regulators and industry participants have raised Sri Lanka’s profile and that of its capital markets as a leading contender on the global frontier market space.
In addition, regulatory developments such as the proposed new central clearing system are most welcome international best practices as they will ensure that settlement cycles remain unhindered by defaults due to the requirement that cash margins be in place before a purchase. Moreover, the introduction of book building for IPOs will further support development of the industry.
Acuity Partners (Pvt) Ltd.- a joint venture between HNB and DFCC Bank with 50% ownership, is a leading full service Investment Bank in Sri Lanka. It offers integrated one stop full service solutions for Stock Broking, Fixed Income Securities, Corporate Finance, Asset Management and Venture Capital and enjoys significant market share in all product lines.

Hatton National Bank PLC90
Deriving and Delivering Value with Our Human CapitalThe 4,451 strong team that makes up HNB has been the cornerstone of the competitive advantage it has sustained for over 125 years in business. Whether it is service excellence, building brand value, or constant innovation, the people factor of HNB comes out strong on every front. We have successfully surmounted different challenges over time and adapt to changing environments with agility, and continue to embrace our core values as we take great strides towards a future of opportunity.
HNB’s staff is respected for their knowledge, capability and commitment to building relationships beyond transactions.
Enabling the Hatna family in their pursuit of excellence, the Bank’s Human Resources function has transformed from an administrator to a synergistic business “Partner in Progress”. The accolades we have won over the years are an endorsement of some of the best practices and the excellence we have achieved.
The HR initiatives during the year under review laid emphasis on partnering to progress on the Bank’s key strategic imperatives and are hence discussed here vis a vis those strategies. Given the integrated form of reporting this year, and the Bank’s triple bottom line approach to business, some of the specific HR initiatives were incorporated into the discussion in the preceding MD&A discussion of corporate strategies.
The strategies identified by and for HR, in order to support the strategic imperatives of the bank could be summarised under the following pillars:
Strategic Pillars for HR
Com
pete
nt, E
ngag
ed a
nd
Mot
ivat
ed T
eam
Desired Outcome Straction
Lean Organisation Workforce management and restructure for a leaner organisation
Seamless Learning Migration from pedagogy to virtual learning and on site learning delivery
Talent Pipeline Build a critical mass through succession planning
Future Organisation Workforce alignment to future readiness for Gen Ys and Gen Zs
Agile Rewards Superior rewards for superior performance and new recognition scheme for team based results
Integrated Management Discussion& Analysis
Strengths, Challenges and Opportunities
Key strengths of our HR • Unity in diversity of our multi-cultural
workforce
• Experience, depth, tacit knowledge and expertise
• A culture of mutual respect and trust
• High employee engagement amply demonstrated with a low attrition score of < 4%
• The HATNA family culture
• HNB’s grow talent model nurtures home grown expertise
• State of the art Learning & Development Centre
• E learning portal and e-library
• HNB’s in demand status as an employer of choice
• Competent and qualified team of HR professionals
Challenges • Balancing the needs and aspirations of a
multigenerational workforce
• Resource deployment across the widely spread branch footprint
• Rapid adaptation from a brick and mortar channel to a virtual platform
Opportunities• Robust leadership development track for
high potentials and mid senior leaders
• Meeting Millennials’ aspirations with HNB’s new world banking
• Convenient continuous development with virtual learning platforms
• Enhanced growth avenues through ‘sales culture’
• Accelerated progression within an efficient succession plan
Focus for 2015• Upskilling, multi skilling and
transforming in line with strategic imperatives of the Bank
• Complete centralisation of identified functions
• Appointment of dedicated sales officers for multiple distribution channels
• Enhance customer and service orientation via training for skills and attitude
• Increase value creation by employees
• Establish an index measure for healthy workforce and employee welfare
• Optimal staff deployment in branches in line with branch target operating model
• Increase coaching and mentoring commitment of senior management team
• Enhance the earnings potential and financial security of employees

Annual Report 2014 91
New HR Initiatives in 2014 :
“Reach-Out” A special Coaching and Mentoring Programme designed to pay focused attention and develop and improve staff members through a coaching/mentoring process with emphasis on technical skills, selling skills, speed of delivery and overall productivity.
The unique feature of this programme is that it has given senior management officers of the Bank an opportunity to contribute with all sincerity towards the work and personal progress of a coworker. It goes beyond a mere coaching process but is also a challenge for the mentor to help motivate the assigned mentee through a process of mutual respect and understanding, and for both to feel a sense of reward.
HR Service Day An open day concept held once a month where staff members are able to meet HR Managers to seek guidance, advice or clarifications on matters such as career progression, higher education, benefits,
grievances and transfers etc. A half days duty leave is provided for employees who wish to avail themselves of this facility.
Employee Focus Groups Quarterly meetings with the MD/CEO and a cross section of employees across ranks, including multi union representatives, to establish a two way communication platform, facilitating a healthy dialogue on common issues. The prompt resolution or consideration of issues has helped to enhance employee trust and confidence. Discussions during the year included key areas such as - Low hanging fruit to achieve efficiency and effectiveness; the Bank’s product proposition; Structure, Process and People.
“Unleash – Ideas to the Board Room” To sustain an innovative culture at HNB this programme creates a forum for young innovators and also facilitates the commercialisation of the innovations. During the year, the activities under “Unleash” included a one-day workshop of high energy and fun filled sessions for 304 trainees which covered topics on
motivation, self-branding and experience sharing by two high achievers Bathya and Santhush and the Unleash Business Case Challenge 2014 – where the trainees worked in groups to solve real life business challenges involving market research and preparation of business plans. Each group is supported by buddies (management trainees) and mentors (senior/experienced managers).
Safe & Secure TomorrowA seminar was conducted for employees on planning personal investments and fund management, healthy living and home safety and security. The overall objective of the programme was to equip employees to plan for their retirements and was originally targeted for those over 45 years of age. It attracted 165 participants of all ages.
Rewarding performanceEvery employee participates in the formal performance management and career development review process. The Bank follows an annual review cycle for all employees excepting banking trainees whose performance is reviewed on a quarterly basis. The measurement of values, conduct and behavior is an integral part of this assessment process.
The Bank’s ‘Executive Performance Development System’ – a balanced scorecard approach - manages the performance of executives and senior management staff ensuring timely, unbiased, transparent and multi level evaluation of performance, on the basis of merit. We believe that clearly defined responsibilities, accountability and effective performance management are critical to delivering our business strategy and help each individual add value. By evaluating their contribution, we can reward our people for superior performance and identify and address their development needs.
In terms of the Junior Executives and below categories, annual performance review ratings are linked to the performance of individuals. Limitations had been identified in terms of linking the performance to the reward for these categories of staff as they are not on variable pay plans due to
The Accolades won in 2014:
• Overall Award for ‘Best Results Based Training’ for the third consecutive year at the Asia’s Training & Development Excellence Awards 2014 organised by the World HRD Congress
• Award for Talent Management at the Asia’s Best Employer Brand Awards 2014 organised by the World HRD Congress
• Merit Awards for “Talent Management” and “People Development” at the National HR Excellence Awards organised by the Institute of Personnel Management (IPM) Sri Lanka
• The “PQHRM Professional of the Year’ award was won by Manager Industrial Relations Mr. G C Mendis. The “PQHRM HR Professional of the Year” award is presented by the Institute of Personnel Management (IPM) Sri Lanka, for exemplifying excellence in the recipient’s career
• Runner-up at the ‘Great HR Debate 2014’, organised by the Institute of Personnel Management (IPM) Sri Lanka..
G4-LA-10,11
Hatton National Bank PLC92
unionised collective bargaining. This has been circumvented by creating a thrust towards performance based rewards for sales in the form of incentives. Branch sales score cards, recognition schemes and sales awards nights are directly linked to sales performance and organised monthly, quarterly and annually.
During the year, we also fine tuned and expanded our rewards scheme for branch managers to incorporate their efforts which did not directly impact the bottom lines of the branch or region, such as referrals and leads directed to head office or another branch for product solutions which were not offered by his or her respective branch, for example recommending Islamic financial solutions which are not offered by all branches.
Priority was also given to build capacities of our frontline staff to cross-sell and promote fee based income and achieve higher customer satisfaction ratings in mystery audits of branches. This would in turn form the foundation to drive the corporate marketing and direct banking communication platforms which are key
customer related strengths of the Bank products. They would also support twin fold strategic objectives - of enhancing fee income and driving overall sales.
The table below lists programmes which supported our focus on a sales driven culture during 2014. Amongst the other incentives programmes introduced for individual as well as team level recognition schemes is the selection of the ‘Sales Person of the Month”.
The Bank is an equal opportunity employer and does not tolerate any form of unfair discrimination. We monitor income differentials within and across job bands and levels to ensure that our remuneration practices do not discriminate on the basis of race, gender or disability. The ratio of basic salary at entry level for men and women is 1:1.
There is no standard entry level wage imposed by regulation The Bank partakes in various salary surveys and results have shown that we are one of the highest remunerators compared to our peers. For staff in the grades of junior management
and below, rewards are determined on the basis of collective bargaining.
The Bank does not recruit temporary or part-time employees. Benefits provided to full time employees including career progression opportunities are determined on the achievement of business goals, especially for executives and above, through the annual performance management system. For junior management and below grades, internal and external pressures are managed through a process of collective bargaining with emoluments being revised periodically.
Benefits available to all employees• Non-contributory pension scheme for
staff in the junior executives and below grades and executives who have not opted for pension buy back
• Contributory pension scheme for Widows/Widowers and Orphan for staff in the junior executives and below grades and executives who have not opted for pension buy back
• Private Provident Fund with the option for increased contribution
• Loans for employees at concessionary rates of interest for 2 houses, motor vehicles, education, wedding as well as service loans, investment loans, computer loans, furniture loans, pilgrimage loans, festival advances, distress loans, funeral loans
• Annual Health Check Ups
• Medical, Personal Accident, Life Insurance
• Reimbursement of Surgical/hospitalisation expenses and other Medical Expenses
• Non–Surgical Expenses Schemes such as Spectacle, Dentures/Nerve filling & Hearing Aids
• Maternity grants
• Scholarships for children of staff members
• Honorarium payments on successful completion of professional qualification
• Payment of membership subscriptions of professional bodies for executive staff
• Financial relief for staff members and their next of kin for serious illnesses; OPD and hospitalisation medical benefits extended to the immediate family members; OPD benefits for parents
• Holiday bungalows
• Payment on transfers
• Travel allowances
• Uniforms and shoes
• Individual high performers incentives for marketing and selling of bank products
• Awards for high performing teams overall
• Attendance/Incentive Bonus
• Recognition of long standing employees - 25 years’ service Awards
• Awards for knowledge development - Inter Branch Quiz Competitions
• Awards for best housekeeping practices – 5 S and green offices
• Individual commendation letters
• Awards for outstanding staff suggestions – Unleash
Integrated Management Discussion& Analysis
G4-EC-5,LA-2,13

Annual Report 2014 93
Values, Ethics, Compliance training and awarenessThe Bank’s 6 Values, Code of Ethics, Employee Code of Conduct, Compliance & Integrity programme, training on AML/KYC, Green Pledge training and awareness initiatives and Competency Tests on the topic entrench compliance and values-based behaviour at every level of the Bank. Further as the Bank operates in a highly regulated sector with a strong anti corruption system, all operations are assessed for risks related to corruption and all staff members are required to complete mandatory regulatory and business compliance training. Our interventions are delivered through various means, including staff induction programmes, e-learning and competency tests. During the year there were no incidents of corruption reported.
Towards offering unique Employee Value Proposition As we seek to become an Employer of First Choice we will leverage on the strengths of our HR culture and our attributes whilst addressing those which need strengthening.
Employee surveys are valuable tools which tells us how employees feel about their work, environment and the Bank, and thus enable us to respond, fine tune and enhance the workplace environment and culture. During the year, HNB conducted 2 employee surveys. The first survey was branded as “Seva Prathirawa” and encompassed all employees, rather than a sample, achieving a participation rate of 87%, and scoring a satisfaction level of 58% which surpassed the average score of Asia Pacific Banks whilst the other was the Great Place to Work Survey’.
The “Seva Prathirawa” survey was conducted in partnership with one of the world’s leading HR firms - AON Hewitt,
was internationally benchmarked and facilitated in all three languages with the options of responding online or via pen and paper, and had a record participation rate of 87%. It assessed a range of hygiene and motivational factors whilst questions directly related to strategy covered brand alignment, innovation, customer service, diversity, management and communication.
The Bank, in its 2015 HR strategic plan has set out a road map with objectives and time lines spread across the next one year, to address concerns expressed and reach a higher score at the next survey.
Enabling “Service Excellence” as a competitive advantage for sustainable profitabilityTowards this end, sales and customer service training received highest priority on the Bank’s HR training and development agenda for 2014. A range of training programmes was carried out during the year to nurture a customer orientation in pursuit of service excellence. The programmes (listed below) aimed to hone practical skills and behaviour as well as inculcate a service mindset.
• 700 staff members were assessed for sales, business development and PR skills and given a structured job rotation across the branch footprint.
• A sales score card was introduced for every branch and Sales Person of the Month was launched as a recognition scheme to attract incentives, both team and individual.
• A master class was conducted on Advanced Sales Negotiations, Developing Customer Service Skills for Increased Satisfaction and Repeat Business Opportunities.
• 595 frontline staff were trained on “Essence” – a custom designed programme to develop customer service skills for increased customer satisfaction which would ensure repeat business opportunities
• 662 staff members were trained on advanced sales negotiations driving the Sales Culture strategy of the Bank through branch based sales teams and Achievement Oriented Thinking and Team Spirit to drive Sales.
Achieving customer service excellence requires that a customer centric approach permeate our corporate culture; and we strongly believe that service excellence must begin at home. Accordingly, internal service delivery is monitored and ensured via annual departmental and employee surveys. In the HR department for example, service level targets were established under each HR vertical which resulted in a significant reduction in the turnaround time in responding to requests and queries
25 years service awards Unleash Training programme - inspirational leadership
Bolstering a sales driven approach- training programmes in 2014No. of programmes
conductedNo. of training
hoursNo. of
participantsAdvanced sales negotiations 11 88 432Sales, Business Development, PR skills and a structured job rotation scheme
1 8 84
Total 12 96 516
G4-56, SO-3,4,5
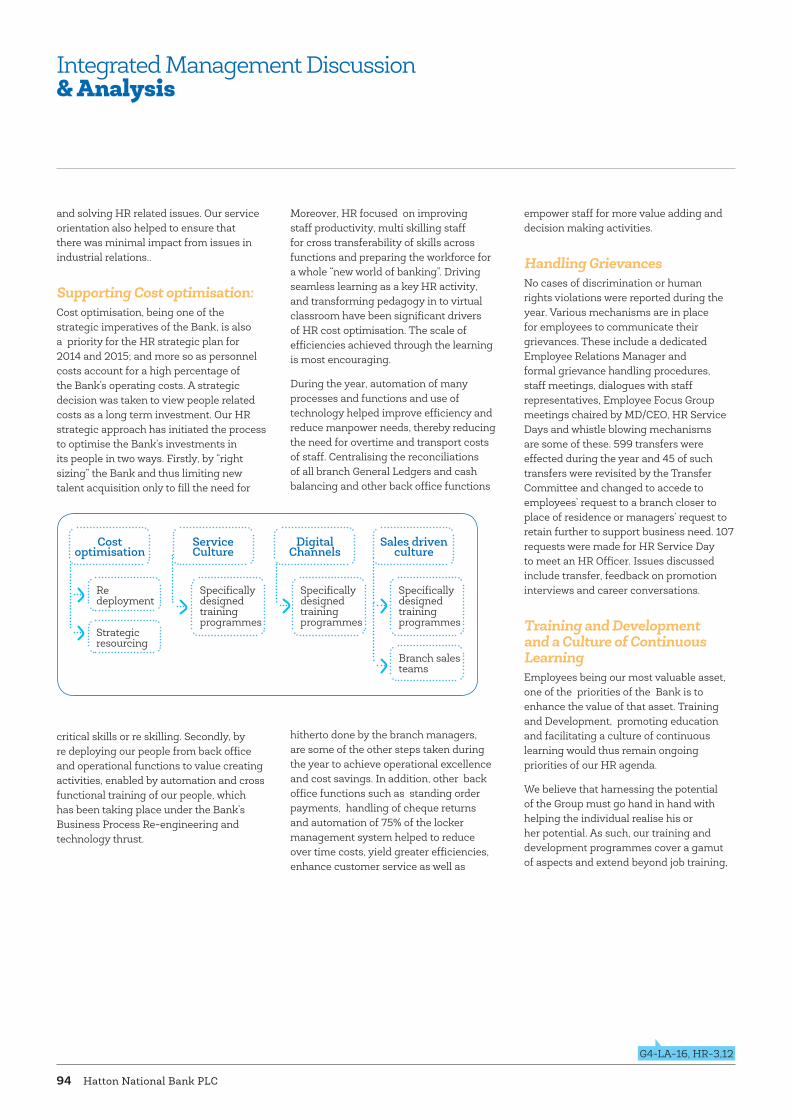
Hatton National Bank PLC94
Integrated Management Discussion& Analysis
and solving HR related issues. Our service orientation also helped to ensure that there was minimal impact from issues in industrial relations..
Supporting Cost optimisation:Cost optimisation, being one of the strategic imperatives of the Bank, is also a priority for the HR strategic plan for 2014 and 2015; and more so as personnel costs account for a high percentage of the Bank’s operating costs. A strategic decision was taken to view people related costs as a long term investment. Our HR strategic approach has initiated the process to optimise the Bank’s investments in its people in two ways. Firstly, by “right sizing” the Bank and thus limiting new talent acquisition only to fill the need for
critical skills or re skilling. Secondly, by re deploying our people from back office and operational functions to value creating activities, enabled by automation and cross functional training of our people, which has been taking place under the Bank’s Business Process Re-engineering and technology thrust.
Moreover, HR focused on improving staff productivity, multi skilling staff for cross transferability of skills across functions and preparing the workforce for a whole “new world of banking”. Driving seamless learning as a key HR activity, and transforming pedagogy in to virtual classroom have been significant drivers of HR cost optimisation. The scale of efficiencies achieved through the learning is most encouraging.
During the year, automation of many processes and functions and use of technology helped improve efficiency and reduce manpower needs, thereby reducing the need for overtime and transport costs of staff. Centralising the reconciliations of all branch General Ledgers and cash balancing and other back office functions
hitherto done by the branch managers, are some of the other steps taken during the year to achieve operational excellence and cost savings. In addition, other back office functions such as standing order payments, handling of cheque returns and automation of 75% of the locker management system helped to reduce over time costs, yield greater efficiencies, enhance customer service as well as
empower staff for more value adding and decision making activities.
Handling GrievancesNo cases of discrimination or human rights violations were reported during the year. Various mechanisms are in place for employees to communicate their grievances. These include a dedicated Employee Relations Manager and formal grievance handling procedures, staff meetings, dialogues with staff representatives, Employee Focus Group meetings chaired by MD/CEO, HR Service Days and whistle blowing mechanisms are some of these. 599 transfers were effected during the year and 45 of such transfers were revisited by the Transfer Committee and changed to accede to employees’ request to a branch closer to place of residence or managers’ request to retain further to support business need. 107 requests were made for HR Service Day to meet an HR Officer. Issues discussed include transfer, feedback on promotion interviews and career conversations.
Training and Development and a Culture of Continuous LearningEmployees being our most valuable asset, one of the priorities of the Bank is to enhance the value of that asset. Training and Development, promoting education and facilitating a culture of continuous learning would thus remain ongoing priorities of our HR agenda.
We believe that harnessing the potential of the Group must go hand in hand with helping the individual realise his or her potential. As such, our training and development programmes cover a gamut of aspects and extend beyond job training,
Cost optimisation
Service Culture
Digital Channels
Sales driven culture
Re deployment
Specifically designed training programmes
Specifically designed training programmes
Specifically designed training programmes
Branch sales teams
Strategic resourcing
G4-LA-16, HR-3,12
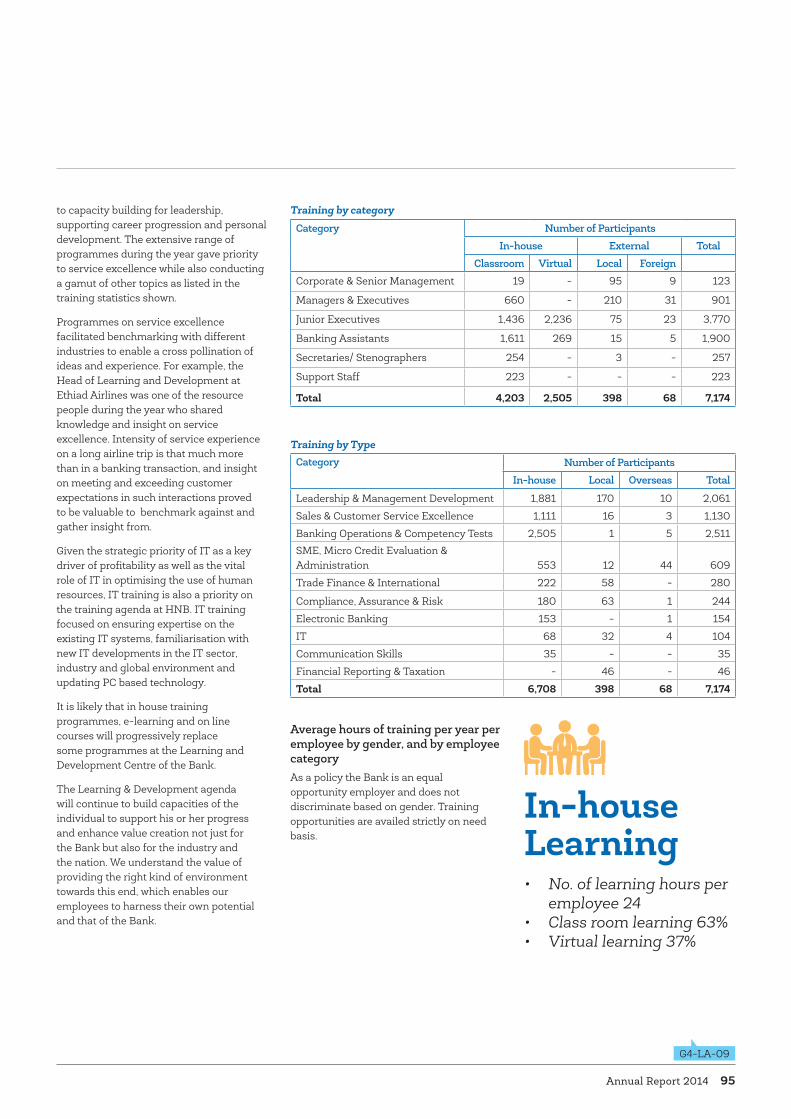
Annual Report 2014 95
to capacity building for leadership, supporting career progression and personal development. The extensive range of programmes during the year gave priority to service excellence while also conducting a gamut of other topics as listed in the training statistics shown.
Programmes on service excellence facilitated benchmarking with different industries to enable a cross pollination of ideas and experience. For example, the Head of Learning and Development at Ethiad Airlines was one of the resource people during the year who shared knowledge and insight on service excellence. Intensity of service experience on a long airline trip is that much more than in a banking transaction, and insight on meeting and exceeding customer expectations in such interactions proved to be valuable to benchmark against and gather insight from.
Given the strategic priority of IT as a key driver of profitability as well as the vital role of IT in optimising the use of human resources, IT training is also a priority on the training agenda at HNB. IT training focused on ensuring expertise on the existing IT systems, familiarisation with new IT developments in the IT sector, industry and global environment and updating PC based technology.
It is likely that in house training programmes, e-learning and on line courses will progressively replace some programmes at the Learning and Development Centre of the Bank.
The Learning & Development agenda will continue to build capacities of the individual to support his or her progress and enhance value creation not just for the Bank but also for the industry and the nation. We understand the value of providing the right kind of environment towards this end, which enables our employees to harness their own potential and that of the Bank.
Average hours of training per year per employee by gender, and by employee categoryAs a policy the Bank is an equal opportunity employer and does not discriminate based on gender. Training opportunities are availed strictly on need basis.
Training by category
Category Number of ParticipantsIn-house External Total
Classroom Virtual Local ForeignCorporate & Senior Management 19 - 95 9 123
Managers & Executives 660 - 210 31 901
Junior Executives 1,436 2,236 75 23 3,770
Banking Assistants 1,611 269 15 5 1,900
Secretaries/ Stenographers 254 - 3 - 257
Support Staff 223 - - - 223
Total 4,203 2,505 398 68 7,174
Training by TypeCategory Number of Participants
In-house Local Overseas Total
Leadership & Management Development 1,881 170 10 2,061
Sales & Customer Service Excellence 1,111 16 3 1,130
Banking Operations & Competency Tests 2,505 1 5 2,511SME, Micro Credit Evaluation & Administration 553 12 44 609
Trade Finance & International 222 58 - 280
Compliance, Assurance & Risk 180 63 1 244
Electronic Banking 153 - 1 154
IT 68 32 4 104
Communication Skills 35 - - 35
Financial Reporting & Taxation - 46 - 46
Total 6,708 398 68 7,174
• No. of learning hours per employee 24
• Class room learning 63%• Virtual learning 37%
In-house Learning
G4-LA-09

Hatton National Bank PLC96
Integrated Management Discussion& Analysis
Recruiting and Retaining Talent in a fast evolving climateOur People Philosophy focuses on attracting, developing and building a pool of talented, dynamic and a motivated human resource base with the right competencies to proactively meet our mission and objectives, whilst inculcating an entrepreneurial spirit, innovation and commitment to change within the Bank.
The Bank does not hire anyone under the legal stipulated age of 18 and all recruitment including senior management is hired from the local community i.e from within Sri Lanka to date.
The Bank reviews its recruitment and selection processes and streamlines them to meet evolving business needs. Since May 2013, the need to “right size” the organisation and focus on optimising all its resources required that we refrain from making entry level recruitments and recruitment is at present limited to fill a need for critical skills.
Our future talent resourcing efforts especially for entry level candidates of Gen Y would be designed to align with the changing environment, the Bank’s evolving needs and new brand attributes. We have identified the need for out of the box thinking to reach a tech savvy generation Y. The need to foster a more sales and marketing driven and customer oriented culture prompts us to look for recent graduates who have benefitted from exposure to a multitude of disciplines such as marketing and accounting to complement Banking qualifications. We would look at new channels for recruitment
advertising to reach youth with the skills, attributes and attitudes we seek. For instance, the introduction of QR codes for accessibility of an advertisement for job vacancies is one which is in the pipeline.
In our plans for talent retention and development, we have also identified the need to stimulate and sustain interest in Banking qualifications, considering how tedious the banking manuals and operational back office functions can seem for younger new recruits. A new Learning Management System that is interactive and integrated with social media is being developed and would be launched in the year ahead.
Methods of Employee Engagement: The Group promotes employee camaraderie via many formal as well as informal channels. Some of the informal channels during the year include sports, staff trips and socials involving employees and their families, annual Christmas parties, Christmas Carols and other religious functions including the annual Vesak Lantern Competition.
Sales Awards NightHNB Toastmasters Club installation
HR Service Day
(Open Day)
HR Policies
HR RoadshowsTaking HR to
the islandwide branch
network
Employee Relations Manager
UnleashInnovation programme
for under 25s
Grievance Handling
Mechanism
Reach Outfor those in
need of extra performance
guidance
Whistle Blowing
Internal and External Training
Opportunities
G4-EC-6

Annual Report 2014 97
Recruitments 2014 - by Age
38% 45-50 Yrs.12% 35-40 Yrs.
50% 25-35 Yrs.
Recruitments 2014 - by Gender
37% Female63% Male
Employee Turnover 2014 - by Age
14% < 2526% 25-3522% 35-4533% 45-55
5% > 55
Employee Turnover 2014 - by Gender
31% Female
69% Male
Employee Turnover 2014 - by Region
5%5%4%5%5%2%4%2%
67%1%
Central EasternNorth CentralNorth WesternNorthernSabaragamuwaSouthernUvaWesternOverseas
Service Analysis Category Number of Years Service
< 2 2-5 5-10 10-15 15-20 20-25 25-30 30-35 > 35 TotalCorporate Management 2 5 2 - 1 1 2 3 1 17Senior Management 3 2 2 2 4 7 10 13 - 43Managers & Executives 18 40 44 65 185 182 66 43 - 643Officers 6 31 191 204 449 201 34 12 - 1,128Banking Assistants 740 475 364 128 188 54 16 5 - 1,970Trainees 71 1 - - - - - - - 72Secretaries - 1 21 58 123 82 19 5 - 309Support Staff - - 1 22 102 74 36 15 1 251Contract Staff 12 - 5 - - 1 - - - 18Total 852 555 630 479 1,052 602 183 96 2 4,451
Employee Profile
G4-9,10 LA-1,12
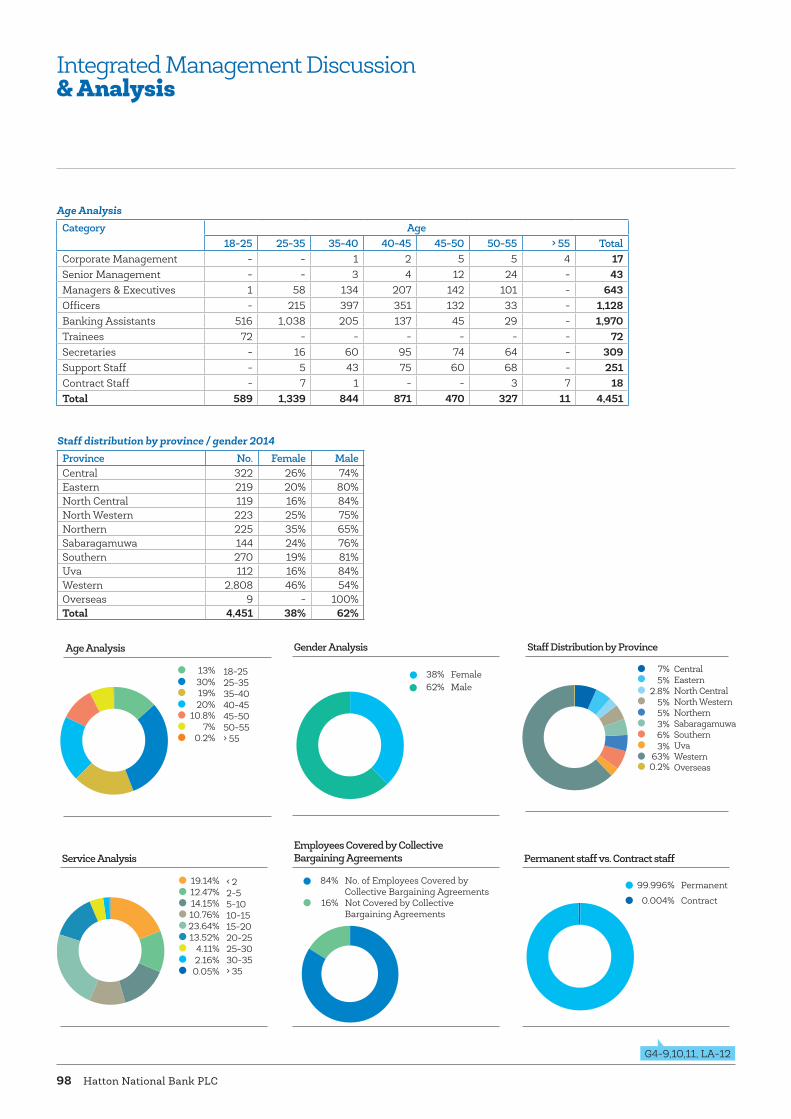
Hatton National Bank PLC98
Integrated Management Discussion& Analysis
Age Analysis
13%30%19%20%
10.8%7%
0.2%
18-2525-3535-4040-4545-5050-55> 55
Gender Analysis
62% Male38% Female
Staff Distribution by Province
7%5%
2.8%5%5%3%6%3%
63%0.2%
Central EasternNorth CentralNorth WesternNorthernSabaragamuwaSouthernUvaWesternOverseas
Employees Covered by Collective Bargaining Agreements
84% No. of Employees Covered by Collective Bargaining Agreements
16% Not Covered by Collective Bargaining Agreements
Permanent staff vs. Contract staff
99.996% Permanent
0.004% Contract
Service Analysis
19.14%12.47%14.15%10.76%23.64%13.52%
4.11%2.16%0.05%
< 22-55-1010-1515-2020-2525-3030-35> 35
Age Analysis Category Age
18-25 25-35 35-40 40-45 45-50 50-55 > 55 TotalCorporate Management - - 1 2 5 5 4 17Senior Management - - 3 4 12 24 - 43Managers & Executives 1 58 134 207 142 101 - 643Officers - 215 397 351 132 33 - 1,128Banking Assistants 516 1,038 205 137 45 29 - 1,970Trainees 72 - - - - - - 72Secretaries - 16 60 95 74 64 - 309Support Staff - 5 43 75 60 68 - 251Contract Staff - 7 1 - - 3 7 18Total 589 1,339 844 871 470 327 11 4,451
Staff distribution by province / gender 2014Province No. Female MaleCentral 322 26% 74%Eastern 219 20% 80%North Central 119 16% 84%North Western 223 25% 75%Northern 225 35% 65%Sabaragamuwa 144 24% 76%Southern 270 19% 81%Uva 112 16% 84%Western 2,808 46% 54%Overseas 9 - 100%Total 4,451 38% 62%
G4-9,10,11, LA-12

Annual Report 2014 99
Achievements in Sports
Athletics• 31st Annual Athletic Mercantile Athletic
Championship 2014
7 Gold medals
5 Silver medals
5 Bronze medals
Badminton • Mercantile Novices Veteran Doubles
Runner-up
• Mercantile Badminton Doubles Tournament - Grand Slam Winner
• Mercantile Open Badminton tournament - Overall Winners
• Mercantile Team Championship - Overall Winners
• Men’s Singles Winner
• Men’s Doubles Winner
• Mixed Doubles Winner
• Veteran Singles Runner-up
• Veteran Doubles Winner
• Women’s Singles Runner-up
• Men’s ‘A’ Division Runner-up
• Men’s ‘E’ Division Third Place
• Men’s Veteran ‘A’ Division Winner
• Men’s H1 Division H2 Division Third Place
• Women’s ‘A’ Division Runner-up
• Men’s Veteran ‘B’ Division Runner-up
Basketball (Men’s) • Mercantile 5 ’A’ Side Tournament - 2014
- Runner-up (Plate Category)
• Mercantile League Tournament - 2014 (‘A’ Division) - Runner-up
Basketball (Women)• Mercantile knockout tournament
2013/14 -Champions
• Mercantile league tournament 2014 - Champions
• Mercantile 5 – a side tournament 2014 - 1st runner-up
• Masters basketball open club 2014 - 1st runner-up
Netball• Champions-sport line.com-
intercompany netball championship
• Champions-Mercantile League Tournament
Hockey • Champion-Mercantile league
tournament (‘A’ Division)
• Runners-up-Mercantile knockout tournament (‘A’ Division)
• Champion- Mercantile-7A side tournament (‘A’ Division)
Sports Fiesta HNB Choristers

Hatton National Bank PLC100
Our Triple Bottom Line Approach for Sustainable ProfitabilityWe firmly believe that strategic social responsibility is a catalyst to long term development of the nation. Our sustainability ethos is one that is deeply embedded in the overall business strategy and therefore intrinsic to the way in which the Bank conducts its business.
Our value to customers in their pursuit of wealth creation also extends to our experience and expertise, access to corresponding relationships with banks across the globe and strong relationships with exchange houses which support export development and trade related services.
HNB’s growth has included a strategy of supporting the SME (Small and Medium Scale Enterprises) sector, a strategy driven by one of our key pillars - Entrepreneurship and Supporting Enterprise. Providing financial support to the SME sector has given us an opportunity to make a valuable contribution to achieving some of the nation’s macro economic goals such as, reducing the geographical disparities in income distribution, and empowering those who otherwise have no access to formal channels of credit. Our island wide branch network has also helped in employment generation, making us an integral part of empowering and enriching many rural communities across the country.
Sustainability is at the very core of the Bank’s corporate strategy. By integrating social and environmental responsibility into core business processes and stakeholder management, the Bank recognises its ability to achieve the ultimate goal of creating both social and corporate value. We are committed to serve all strata of society and through careful customer segmentation provide financial access and services across the continuum of socio-demographic groups.
We believe sustainability management is an important precautionary approach to economic, social and environmental risk management. By implementing screening and risk rating procedures, exclusion lists, rigourous loan covenants and adherence to the green pledge we integrate responsible environmental practices into our core business and serve as a conduit for behavioural and attitudinal change in our key stakeholders.
We subscribe to the GRI Reporting Framework, which serves as a universally recognised framework for reporting on an organisation’s economic, environmental and social performance.
The HNB Sustainability Foundation was established in 2009 as an independent body to manage the community development initiatives of the Bank.
During 2014, our projects continued to be focused on four key pillars namely Education, Health, Environment and Entrepreneurship and are aligned to the Millennium Development Goals.
Integrated Management Discussion& Analysis
Sustainability Strategy
Build an open and honest
culture
Engage actively with stakeholders
Enhance business
performance
Contribute to national
development
Process for Sustainability
126 Years of Trusted
Partnerships
Environment Conservation
Community Development
Economic Performance
Supporting Enterprise
Green Banking
Green Procurement
Responsible Lending
Healthcare
Fair Banking EntrepreneurshipEmployee
Excellence Education
Thrust areas of our sustainability effort :
G4-14,15, EC-7,8

Annual Report 2014 101
Our commitment to sustainable business practices
Measurement Achievement
Grievances about human rights impacts and discriminations filed, addressed, and resolved through formal grievance mechanisms
No significant incidents recorded during the year
under review
Legal actions for anti-competitive behaviour, anti-trust, and monopoly practices and their outcomes
Significant fines and total number of non-monetary sanctions for non-compliance with laws and regulations
Negative impact on local communities due to business operations and grievances about impacts on society filed, addressed, and resolved through formal grievance mechanisms
Incidents of non-compliance with regulations and voluntary codes concerning product and service information and labelling
Incidents of non-compliance with regulations and voluntary codes concerning marketing communications, including advertising, promotion, and sponsorship
Substantiated complaints regarding breaches of customer privacy and losses of customer data
Significant fines for non-compliance with laws and regulations concerning the provision and use of products and services
Membership in AssociationsThe Bank is a member and/or represented at a number of membership forums with the objective of having access to new insights, trends and research on various business related topics pertaining to
the management of economic, social and environmental impacts, continuous learning and development and to influence sustainable business practices; a few of which are listed below
Corporate Memberships Corporate Training Partners Significant Involvement by our Key Management Personnel
• American Chamber of Commerce (Amcham)
• Asian Bankers Association• Association of Compliance Officers of
Banks, Sri Lanka • Banking with the Poor Network,
Singapore• Credit Information Bureau• CSR Sri Lanka• Employers Federation of Ceylon• International Chamber of Commerce
Sri Lanka• Lanka Business Coalition for HIV/
AIDS• Lanka Swift User Group• Sri Lanka Banks Association• Sri Lanka Business and Bio Diversity
Platform • Sri Lanka Forex Association• The Ceylon Chamber of Commerce• The Clearing Association of Bankers• The Institute of Bankers of Sri Lanka• The National Chamber of Commerce,
Sri Lanka
• The Chartered Institute of Management Accountants (UK) - Sri Lanka Division
• Institute of Chartered Accountants of Sri Lanka (CA Sri Lanka)
• Association of Compliance Officers of Banks, Sri Lanka - Vice President
• Association of Professional Bankers, Sri Lanka - President, Treasurer
• Association of Human Resource Professionals - President
• Credit Information Bureau -Alternate Director
• Sri Lanka Banks Association - Chairman• Sri Lanka Business and Bio Diversity
Platform - Advisiory Committee Member• Trade Finance Association of Bankers -
Assit. Secretary
G4-16 HR-3,4,12 SO-2,7,8,11 PR-4, 7, 8,9
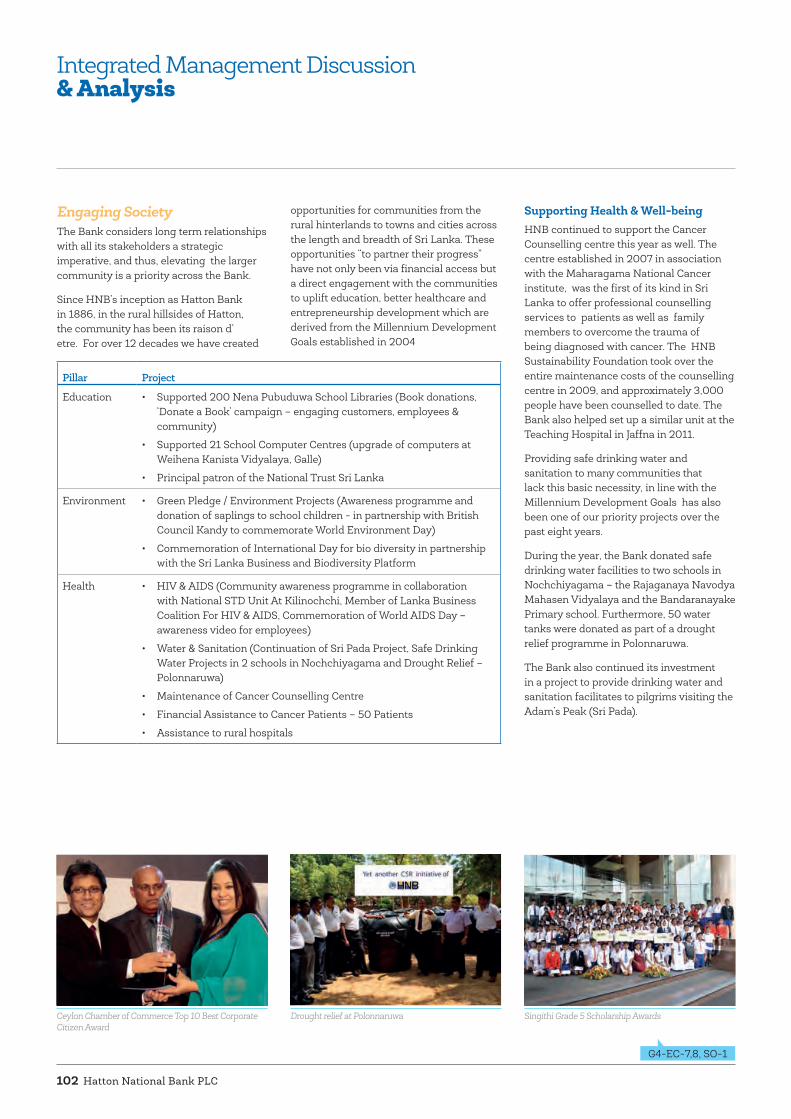
Hatton National Bank PLC102
Integrated Management Discussion& Analysis
Engaging Society The Bank considers long term relationships with all its stakeholders a strategic imperative, and thus, elevating the larger community is a priority across the Bank.
Since HNB’s inception as Hatton Bank in 1886, in the rural hillsides of Hatton, the community has been its raison d’ etre. For over 12 decades we have created
opportunities for communities from the rural hinterlands to towns and cities across the length and breadth of Sri Lanka. These opportunities “to partner their progress” have not only been via financial access but a direct engagement with the communities to uplift education, better healthcare and entrepreneurship development which are derived from the Millennium Development Goals established in 2004
Pillar Project
Education • Supported 200 Nena Pubuduwa School Libraries (Book donations, ‘Donate a Book’ campaign – engaging customers, employees & community)
• Supported 21 School Computer Centres (upgrade of computers at Weihena Kanista Vidyalaya, Galle)
• Principal patron of the National Trust Sri Lanka
Environment • Green Pledge / Environment Projects (Awareness programme and donation of saplings to school children - in partnership with British Council Kandy to commemorate World Environment Day)
• Commemoration of International Day for bio diversity in partnership with the Sri Lanka Business and Biodiversity Platform
Health • HIV & AIDS (Community awareness programme in collaboration with National STD Unit At Kilinochchi, Member of Lanka Business Coalition For HIV & AIDS, Commemoration of World AIDS Day – awareness video for employees)
• Water & Sanitation (Continuation of Sri Pada Project, Safe Drinking Water Projects in 2 schools in Nochchiyagama and Drought Relief – Polonnaruwa)
• Maintenance of Cancer Counselling Centre
• Financial Assistance to Cancer Patients – 50 Patients
• Assistance to rural hospitals
Supporting Health & Well-being HNB continued to support the Cancer Counselling centre this year as well. The centre established in 2007 in association with the Maharagama National Cancer institute, was the first of its kind in Sri Lanka to offer professional counselling services to patients as well as family members to overcome the trauma of being diagnosed with cancer. The HNB Sustainability Foundation took over the entire maintenance costs of the counselling centre in 2009, and approximately 3,000 people have been counselled to date. The Bank also helped set up a similar unit at the Teaching Hospital in Jaffna in 2011.
Providing safe drinking water and sanitation to many communities that lack this basic necessity, in line with the Millennium Development Goals has also been one of our priority projects over the past eight years.
During the year, the Bank donated safe drinking water facilities to two schools in Nochchiyagama – the Rajaganaya Navodya Mahasen Vidyalaya and the Bandaranayake Primary school. Furthermore, 50 water tanks were donated as part of a drought relief programme in Polonnaruwa.
The Bank also continued its investment in a project to provide drinking water and sanitation facilitates to pilgrims visiting the Adam’s Peak (Sri Pada).
Ceylon Chamber of Commerce Top 10 Best Corporate Citizen Award
Drought relief at Polonnaruwa Singithi Grade 5 Scholarship Awards
G4-EC-7,8, SO-1
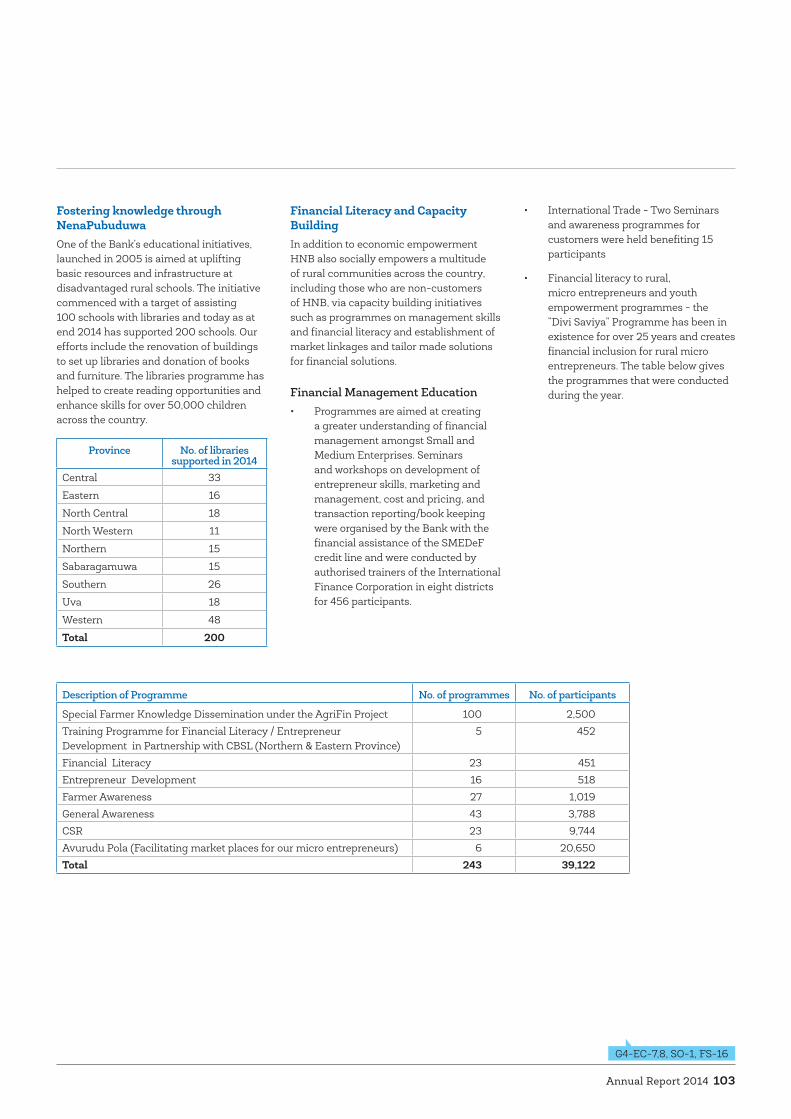
Annual Report 2014 103
Fostering knowledge through NenaPubuduwaOne of the Bank’s educational initiatives, launched in 2005 is aimed at uplifting basic resources and infrastructure at disadvantaged rural schools. The initiative commenced with a target of assisting 100 schools with libraries and today as at end 2014 has supported 200 schools. Our efforts include the renovation of buildings to set up libraries and donation of books and furniture. The libraries programme has helped to create reading opportunities and enhance skills for over 50,000 children across the country.
Province No. of libraries supported in 2014
Central 33
Eastern 16
North Central 18
North Western 11
Northern 15
Sabaragamuwa 15
Southern 26
Uva 18
Western 48
Total 200
Financial Literacy and Capacity Building In addition to economic empowerment HNB also socially empowers a multitude of rural communities across the country, including those who are non-customers of HNB, via capacity building initiatives such as programmes on management skills and financial literacy and establishment of market linkages and tailor made solutions for financial solutions.
Financial Management Education• Programmes are aimed at creating
a greater understanding of financial management amongst Small and Medium Enterprises. Seminars and workshops on development of entrepreneur skills, marketing and management, cost and pricing, and transaction reporting/book keeping were organised by the Bank with the financial assistance of the SMEDeF credit line and were conducted by authorised trainers of the International Finance Corporation in eight districts for 456 participants.
• International Trade - Two Seminars and awareness programmes for customers were held benefiting 15 participants
• Financial literacy to rural, micro entrepreneurs and youth empowerment programmes - the “Divi Saviya” Programme has been in existence for over 25 years and creates financial inclusion for rural micro entrepreneurs. The table below gives the programmes that were conducted during the year.
Description of Programme No. of programmes No. of participants
Special Farmer Knowledge Dissemination under the AgriFin Project 100 2,500Training Programme for Financial Literacy / Entrepreneur Development in Partnership with CBSL (Northern & Eastern Province)
5 452
Financial Literacy 23 451Entrepreneur Development 16 518Farmer Awareness 27 1,019General Awareness 43 3,788CSR 23 9,744Avurudu Pola (Facilitating market places for our micro entrepreneurs) 6 20,650Total 243 39,122
G4-EC-7,8, SO-1, FS-16
Hatton National Bank PLC104
EnvironmentBeing a Bank, our enterprise has a relatively minimal direct impact on the environment, due to the nature of our business, the comparatively lower consumption of natural resources for our direct activities, and the low carbon footprint of our business activities. However, we also recognise that we have the potential to make an enormous impact via our customers and through our business activities to make it a greener earth, and are always mindful of this responsibility. We believe that climate change is an opportunity to spur the and adoption of clean and renewable sources of energy. For instance in 2014 in order to promote fuel efficiency and less environmentally damaging vehicles, we offered a concessionary interest rate for lease of hybrid vehicles under “HNB Leasing”.
By integrating climate change into its business strategy, the Bank has knit climate change mitigation imperatives into its operations, lending portfolio, risk management frameworks, and reporting and disclosures.
The Bank’s Environmental and Social Management System (ESMS) provides the policy framework, implementation process and a monitoring mechanism to ensure that the financing extended to our customers are used to set up and fund operations which are economically and socially sustainable, eco friendly and do not harm bio diversity via their outputs in the form of emissions, effluents, waste etc.
The Environmental Impact Assessment Report (EIA) or Initial Environmental Examination Report (IEE) is reviewed, as an integral part of the environmental and social assessment. The Bank’s offer for credit facilities is subject to compliance
of all environmental and social conditions imposed by the project approving authority. Forced labour and child labour are excluded activities in our credit policy. Our officers have been trained and updated to ensure effective implementation of the ESMS.
Five ESMS training programmes were conducted during 2014 as listed in the table below.
Environmental issues such as climate change can directly impact our business. For example, in lending to the agriculture sector which is affected by the change in weather patterns which are becoming more erratic due to environmental impacts. The year under review saw drought conditions at the beginning followed by widespread floods at the end of 2014, impact crops and hence our recoveries in the SME’s and the agricultural sector.
Towards minimising our Carbon Footprint The Bank adopts a 3R policy –Reduce, Reuse, Recycle - towards all tangible resources including furniture and paper amongst others.
We work hard to reduce our own impact on the environment and have laid considerable emphasis on the achievement and measurement of this impact. The Bank’s Green Pledge serves as the fundamental base for impact reduction and is the catalyst for behavioural change both within and outside the organisation.
The Bank has always invested in technologies considering its Green Pledge. During the year under review, more emphasis was made on consolidation and virtualisation of our IT systems rather than expanding infrastructure. We are also considering the transfer of some of our applications (where the safety of customer data will not be compromised), to a Cloud environment, thus reducing the requirement for servers and hence the consumption of energy and space occupation considerably.
Encouraged by the energy saving achieved through the replacement of standard lighting, with LED lighting over the past few years, we will also expand LED lighting in the year ahead as well.
Integrated Management Discussion& Analysis
ESMS Training for Employees - 2014
Region / Reach No. of ParticipantsBranch Managers Conference – All branch managers, regional heads, senior management, corporate management
370
Colombo Region 20Central Region 22Uva / Sabaragamuwa Region 27Northern Region 30Total 469
Green Pledge 2014Commemoration of World Environment Day in partnership with the British Council, Kandy to create awareness amongst school children and to distribute saplings
Lead sponsor for an awareness programme on bio diversity to commemorate the ‘International Day for Bio Diversity’
Actively participate in the work of the Sri Lanka Business and Biodiversity Platform
Introduced the “HNB Sustainability Bulletin” for employees
Launched the “one million tree stories” campaign in partnership with the Rotary Club
G4-EC-2
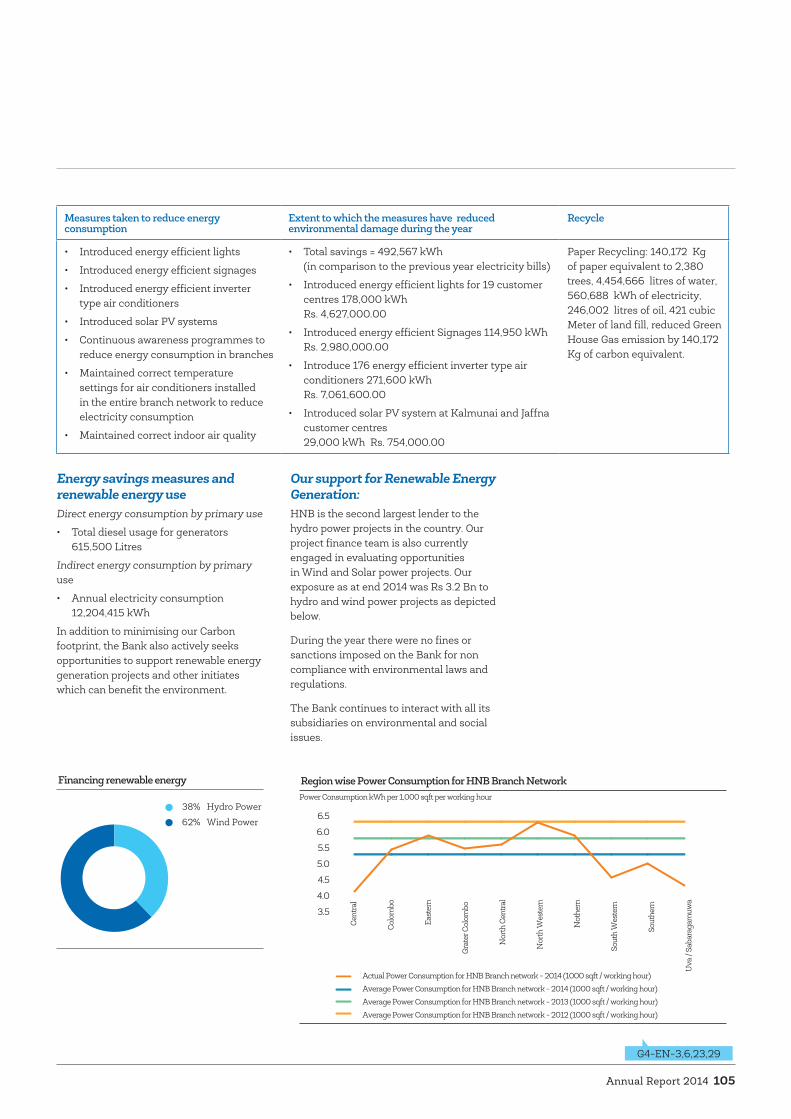
Annual Report 2014 105
Energy savings measures and renewable energy useDirect energy consumption by primary use
• Total diesel usage for generators 615,500 Litres
Indirect energy consumption by primary use
• Annual electricity consumption 12,204,415 kWh
In addition to minimising our Carbon footprint, the Bank also actively seeks opportunities to support renewable energy generation projects and other initiates which can benefit the environment.
Our support for Renewable Energy Generation:HNB is the second largest lender to the hydro power projects in the country. Our project finance team is also currently engaged in evaluating opportunities in Wind and Solar power projects. Our exposure as at end 2014 was Rs 3.2 Bn to hydro and wind power projects as depicted below.
During the year there were no fines or sanctions imposed on the Bank for non compliance with environmental laws and regulations.
The Bank continues to interact with all its subsidiaries on environmental and social issues.
Measures taken to reduce energy consumption
Extent to which the measures have reduced environmental damage during the year
Recycle
• Introduced energy efficient lights
• Introduced energy efficient signages
• Introduced energy efficient inverter type air conditioners
• Introduced solar PV systems
• Continuous awareness programmes to reduce energy consumption in branches
• Maintained correct temperature settings for air conditioners installed in the entire branch network to reduce electricity consumption
• Maintained correct indoor air quality
• Total savings = 492,567 kWh (in comparison to the previous year electricity bills)
• Introduced energy efficient lights for 19 customer centres 178,000 kWh Rs. 4,627,000.00
• Introduced energy efficient Signages 114,950 kWh Rs. 2,980,000.00
• Introduce 176 energy efficient inverter type air conditioners 271,600 kWh Rs. 7,061,600.00
• Introduced solar PV system at Kalmunai and Jaffna customer centres 29,000 kWh Rs. 754,000.00
Paper Recycling: 140,172 Kg of paper equivalent to 2,380 trees, 4,454,666 litres of water, 560,688 kWh of electricity, 246,002 litres of oil, 421 cubic Meter of land fill, reduced Green House Gas emission by 140,172 Kg of carbon equivalent.
Financing renewable energy
38% Hydro Power
62% Wind Power
Region wise Power Consumption for HNB Branch Network
3.5
4.0
4.5
5.0
5.5
6.0
6.5
Cent
ral
Colo
mbo
East
ern
Grat
er C
olom
bo
Nor
th C
entra
l
Nor
th W
este
rn
Not
hern
Sout
h W
este
rn
Sout
hern
Uva
/ Sa
bara
gam
uwa
Actual Power Consumption for HNB Branch network - 2014 (1000 sqft / working hour)
Average Power Consumption for HNB Branch network - 2014 (1000 sqft / working hour)
Average Power Consumption for HNB Branch network - 2013 (1000 sqft / working hour)
Average Power Consumption for HNB Branch network - 2012 (1000 sqft / working hour)
Power Consumption kWh per 1,000 sqft per working hour
G4-EN-3,6,23,29
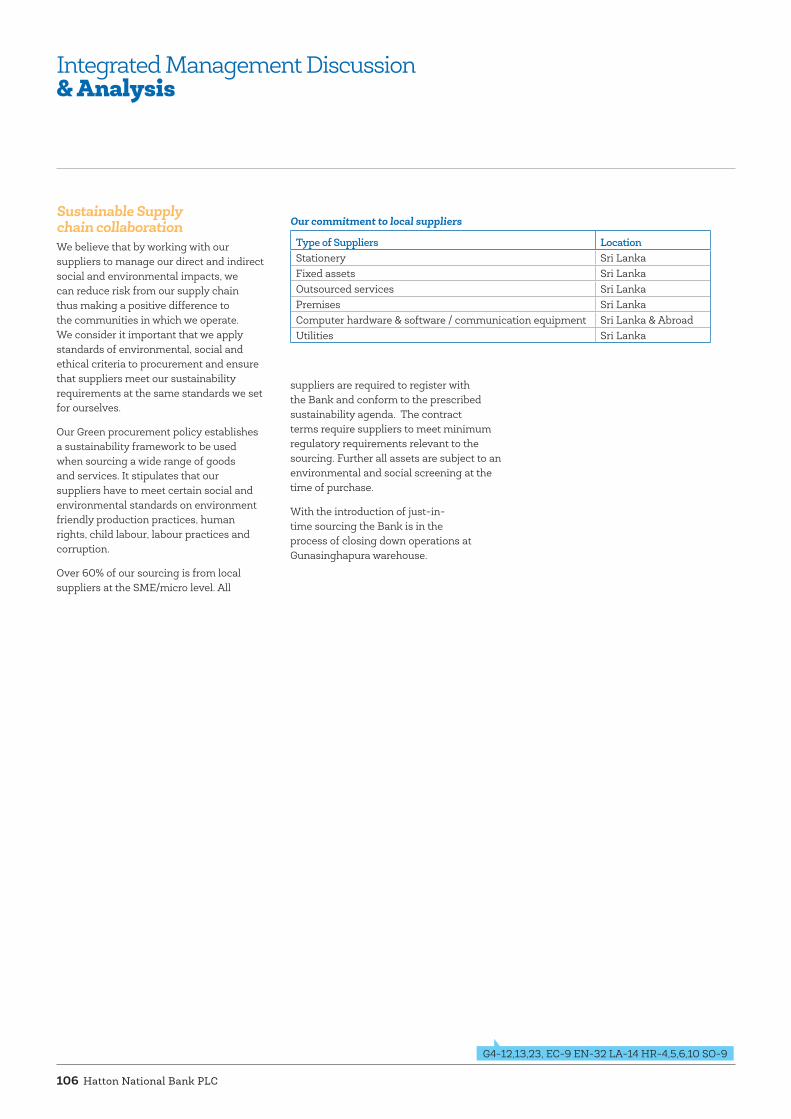
Hatton National Bank PLC106
Integrated Management Discussion& Analysis
Sustainable Supply chain collaboration We believe that by working with our suppliers to manage our direct and indirect social and environmental impacts, we can reduce risk from our supply chain thus making a positive difference to the communities in which we operate. We consider it important that we apply standards of environmental, social and ethical criteria to procurement and ensure that suppliers meet our sustainability requirements at the same standards we set for ourselves.
Our Green procurement policy establishes a sustainability framework to be used when sourcing a wide range of goods and services. It stipulates that our suppliers have to meet certain social and environmental standards on environment friendly production practices, human rights, child labour, labour practices and corruption.
Over 60% of our sourcing is from local suppliers at the SME/micro level. All
suppliers are required to register with the Bank and conform to the prescribed sustainability agenda. The contract terms require suppliers to meet minimum regulatory requirements relevant to the sourcing. Further all assets are subject to an environmental and social screening at the time of purchase.
With the introduction of just-in-time sourcing the Bank is in the process of closing down operations at Gunasinghapura warehouse.
Our commitment to local suppliers
Type of Suppliers LocationStationery Sri LankaFixed assets Sri LankaOutsourced services Sri LankaPremises Sri LankaComputer hardware & software / communication equipment Sri Lanka & AbroadUtilities Sri Lanka
G4-12,13,23, EC-9 EN-32 LA-14 HR-4,5,6,10 SO-9

Annual Report 2014 107
GRI G4 Content IndexGRI G4 Content Index for General Standard Disclosures
GENERAL STANDARD DISCLOSURESGeneral Standard Disclosures
Disclosure Item Page Number External Assurance
STRATEGY AND ANALYSISG4-1 Statement of the MD/CEO 16 112
ORGANIZATIONAL PROFILEG4-3 Name of the organization. Inner Back Cover 112G4-4 Primary brands, products, and services. 68-86 112G4-5 Location of the organization’s headquarters. Inner Back Cover 112G4-6 Countries where organization operates 71 112G4-7 Nature of Ownership and Legal Form Inner Back Cover 112G4-8 Markets served 68-86 112G4-9 Scale of the organization 4,68-89, 97-98, 175 112G4-10 Employee Profile 97-98 112G4-11 Percentage of employees covered by collective bargaining agreements 98 112G4-12 Organization’s supply chain. 50-51, 106 112G4-13 Significant changes during the year 34, 106 112G4-14 Precautionary approach or principle 100 112G4-15 Externally developed charters, principles, or other initiatives to which the organization
subscribes or which it endorses34, 100 112
G4-16 Memberships of associations 101 112
IDENTIFIED MATERIAL ASPECTS AND BOUNDARIESG4-17 Entities included in the organization’s consolidated financial statements or equivalent
documentsInner Back Cover 112
G4-18 Defining the report content and the Aspect Boundaries 34-37 112G4-19 Material Aspects 34-37 112G4-20 Aspect Boundary within the organization 34-37 112G4-21 Aspect Boundary outside the organization 34-37 112G4-22 Effect of any restatements of information provided in previous reports 34 112G4-23 Significant changes from previous reporting periods 34,106 112STAKEHOLDER ENGAGEMENTG4-24 Stakeholder groups engaged by the organization 42-58 112G4-25 Basis for identification and selection of stakeholders 56-58 112G4-26 Organization’s approach to stakeholder engagement 56-58 112G4-27 Key topics and concerns raised through stakeholder engagement 56-58 112REPORT PROFILEG4-28 Reporting period 34 112G4-29 Date of most recent previous report 34 112G4-30 Reporting cycle 34 112G4-31 Contact point for questions regarding the report or its contents 34,359 112G4-32 The ‘in accordance’ option the organization has chosen 34 112G4-33 External assurance 34,112 112GOVERNANCEG4-34 Governance structure of the organization 115 112ETHICS AND INTEGRITYG4-56 Organization’s values, principles, standards and norms of behaviour such as codes of
conduct and codes of ethics2, 93 112
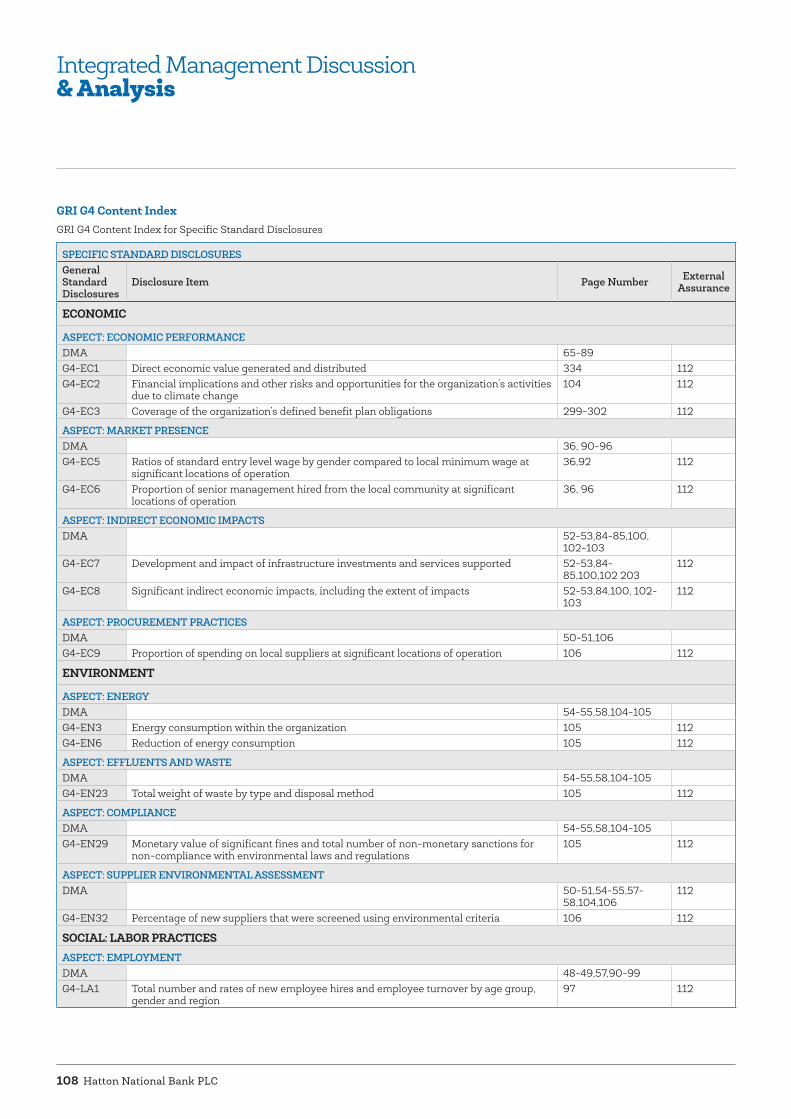
Hatton National Bank PLC108
Integrated Management Discussion& Analysis
GRI G4 Content IndexGRI G4 Content Index for Specific Standard Disclosures
SPECIFIC STANDARD DISCLOSURESGeneral Standard Disclosures
Disclosure Item Page Number External Assurance
ECONOMIC
ASPECT: ECONOMIC PERFORMANCEDMA 65-89G4-EC1 Direct economic value generated and distributed 334 112G4-EC2 Financial implications and other risks and opportunities for the organization’s activities
due to climate change104 112
G4-EC3 Coverage of the organization’s defined benefit plan obligations 299-302 112
ASPECT: MARKET PRESENCEDMA 36, 90-96G4-EC5 Ratios of standard entry level wage by gender compared to local minimum wage at
significant locations of operation36,92 112
G4-EC6 Proportion of senior management hired from the local community at significant locations of operation
36, 96 112
ASPECT: INDIRECT ECONOMIC IMPACTSDMA 52-53,84-85,100,
102-103G4-EC7 Development and impact of infrastructure investments and services supported 52-53,84-
85,100,102 203112
G4-EC8 Significant indirect economic impacts, including the extent of impacts 52-53,84,100, 102-103
112
ASPECT: PROCUREMENT PRACTICESDMA 50-51,106G4-EC9 Proportion of spending on local suppliers at significant locations of operation 106 112
ENVIRONMENT
ASPECT: ENERGYDMA 54-55,58,104-105G4-EN3 Energy consumption within the organization 105 112G4-EN6 Reduction of energy consumption 105 112
ASPECT: EFFLUENTS AND WASTEDMA 54-55,58,104-105G4-EN23 Total weight of waste by type and disposal method 105 112
ASPECT: COMPLIANCEDMA 54-55,58,104-105G4-EN29 Monetary value of significant fines and total number of non-monetary sanctions for
non-compliance with environmental laws and regulations105 112
ASPECT: SUPPLIER ENVIRONMENTAL ASSESSMENTDMA 50-51,54-55,57-
58,104,106112
G4-EN32 Percentage of new suppliers that were screened using environmental criteria 106 112
SOCIAL: LABOR PRACTICESASPECT: EMPLOYMENTDMA 48-49,57,90-99G4-LA1 Total number and rates of new employee hires and employee turnover by age group,
gender and region97 112

Annual Report 2014 109
SPECIFIC STANDARD DISCLOSURESGeneral Standard Disclosures
Disclosure Item Page Number External Assurance
G4-LA2 Benefits provided to full-time employees that are not provided to temporary or part-time employees, by significant locations of operation
92 112
ASPECT: LABOR/MANAGEMENT RELATIONSDMA 36,48-49,57,90-99G4-LA4 Minimum notice periods regarding operational changes, including whether these are
specified in collective agreements36 112
ASPECT: OCCUPATIONAL HEALTH AND SAFETYDMA 36,48-49,57,90-99
ASPECT: TRAINING AND EDUCATIONDMA 48-49,57,90-99G4-LA9 Average hours of training per year per employee by gender, and by employee category 95 112G4-LA10 Programs for skills management and lifelong learning that support the continued
employability of employees and assist them in managing career endings91 112
G4-LA11 Percentage of employees receiving regular performance and career development reviews, by gender and by employee category
91 112
ASPECT: DIVERSITY AND EQUAL OPPORTUNITYDMA 48-49,57,90-99G4-LA12 Composition of governance bodies and breakdown of employees per employee
category according to gender, age group, minority group membership, and other indicators of diversity
97-98 112
ASPECT: EQUAL REMUNERATION FOR WOMEN AND MENDMA 36,48-49,57,90-99G4-LA13 Ratio of basic salary and remuneration of women to men by employee category, by
significant locations of operation92 112
ASPECT: SUPPLIER ASSESSMENT FOR LABOR PRACTICESDMA 50-51,57,106G4-LA14 Percentage of new suppliers that were screened using labor practices criteria 106 112
ASPECT: LABOUR PRACTICES GRIEVANCE MECHANISMSDMA 57,90-99G4-LA16 Number of grievances about labor practices filed, addressed, and resolved through
formal grievance mechanisms94 112
SOCIAL: HUMAN RIGHTS
ASPECT: INVESTMENTDMA 37
ASPECT: NON-DISCRIMINATIONDMA 101G4-HR3 Total number of incidents of discrimination and corrective actions taken 101 112
ASPECT: FREEDOM OF ASSOCIATION AND COLLECTIVE BARGAININGDMA 37G4-HR4 Operations and suppliers identified in which the right to exercise freedom of
association and collective bargaining may be violated or at significant risk, and measures taken to support these rights
101,106 112
ASPECT: CHILD LABORDMA 37G4-HR5 Operations and suppliers identified as having significant risk for incidents of child
labor, and measures taken to contribute to the effective abolition of child labor37, 106 112
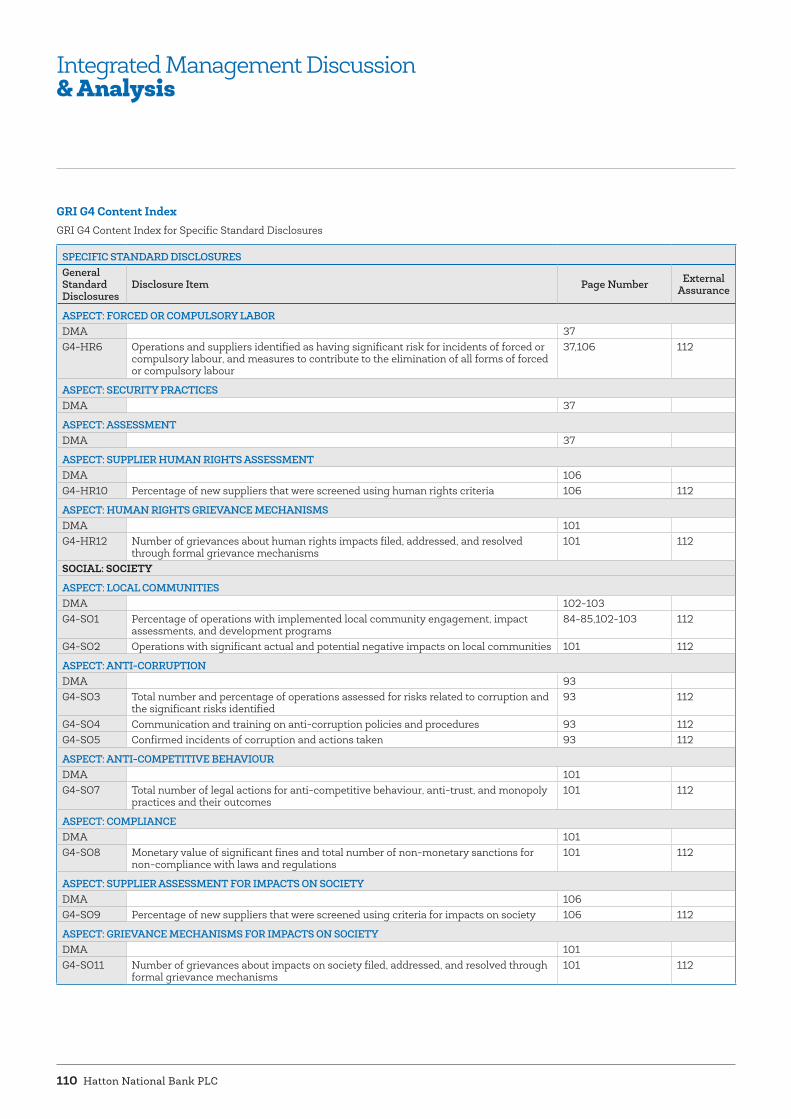
Hatton National Bank PLC110
SPECIFIC STANDARD DISCLOSURESGeneral Standard Disclosures
Disclosure Item Page Number External Assurance
ASPECT: FORCED OR COMPULSORY LABORDMA 37G4-HR6 Operations and suppliers identified as having significant risk for incidents of forced or
compulsory labour, and measures to contribute to the elimination of all forms of forced or compulsory labour
37,106 112
ASPECT: SECURITY PRACTICESDMA 37
ASPECT: ASSESSMENTDMA 37
ASPECT: SUPPLIER HUMAN RIGHTS ASSESSMENTDMA 106G4-HR10 Percentage of new suppliers that were screened using human rights criteria 106 112
ASPECT: HUMAN RIGHTS GRIEVANCE MECHANISMSDMA 101G4-HR12 Number of grievances about human rights impacts filed, addressed, and resolved
through formal grievance mechanisms101 112
SOCIAL: SOCIETY
ASPECT: LOCAL COMMUNITIESDMA 102-103G4-SO1 Percentage of operations with implemented local community engagement, impact
assessments, and development programs84-85,102-103 112
G4-SO2 Operations with significant actual and potential negative impacts on local communities 101 112
ASPECT: ANTI-CORRUPTIONDMA 93G4-SO3 Total number and percentage of operations assessed for risks related to corruption and
the significant risks identified93 112
G4-SO4 Communication and training on anti-corruption policies and procedures 93 112G4-SO5 Confirmed incidents of corruption and actions taken 93 112
ASPECT: ANTI-COMPETITIVE BEHAVIOURDMA 101G4-SO7 Total number of legal actions for anti-competitive behaviour, anti-trust, and monopoly
practices and their outcomes101 112
ASPECT: COMPLIANCEDMA 101G4-SO8 Monetary value of significant fines and total number of non-monetary sanctions for
non-compliance with laws and regulations101 112
ASPECT: SUPPLIER ASSESSMENT FOR IMPACTS ON SOCIETYDMA 106G4-SO9 Percentage of new suppliers that were screened using criteria for impacts on society 106 112
ASPECT: GRIEVANCE MECHANISMS FOR IMPACTS ON SOCIETYDMA 101G4-SO11 Number of grievances about impacts on society filed, addressed, and resolved through
formal grievance mechanisms101 112
Integrated Management Discussion& Analysis
GRI G4 Content IndexGRI G4 Content Index for Specific Standard Disclosures

Annual Report 2014 111
SPECIFIC STANDARD DISCLOSURESGeneral Standard Disclosures
Disclosure Item Page Number External Assurance
SOCIAL: PRODUCT RESPONSIBILITY
ASPECT: PRODUCT AND SERVICE LABELLINGDMA 68-86G4-PR3 Type of product and service information required by the organization’s procedures for
product and service information and labelling, and percentage of significant product and service categories subject to such information requirements
68-86 112
G4-PR4 Total number of incidents of non-compliance with regulations and voluntary codes concerning product and service information and labelling, by type of outcomes
101 112
G4-PR5 Results of surveys measuring customer satisfaction 46 112
ASPECT: MARKETING COMMUNICATIONSDMA 101G4-PR7 Total number of incidents of non-compliance with regulations and voluntary codes
concerning marketing communications, including advertising, promotion, and sponsorship, by type of outcomes
101 112
ASPECT: CUSTOMER PRIVACYDMA 46,47,56,101G4-PR8 Total number of substantiated complaints regarding breaches of customer privacy and
losses of customer data101 112
ASPECT: COMPLIANCEDMA 101G4-PR9 Monetary value of significant fines for non-compliance with laws and regulations
concerning the provision and use of products and services101 112
FSSSFS6 Percentage of the portfolio for business lines by specific region, size
(eg. Micro/SME/large) and by sector175
FS13 Access points in low populated or economically disadvantaged areas by type 79, 80, 81 112FS14 Initiatives to improve access to financial services for disadvantaged people 82-86 112FS16 Initiatives to enhance financial literacy by type of beneficiary. 103 112

Hatton National Bank PLC112
Independent AssuranceReport
Independent Assurance Report to the Board of Directors of Hatton National Bank on the Sustainability Reporting Under the Integrated Annual Report- 2014
Introduction and scope of the engagementThe management of Hatton National Bank (“the Bank”) engaged us to provide an independent assurance on the following elements of the sustainability reporting indicators under the annual report- 2014 (“the Report”).• Reasonable assurance on the information
on financial performance as specified on page 334 of the Report.
• Limited assurance on other information presented in the Report, prepared in accordance with the requirements of the Global Reporting Initiative G4 ‘In accordance’ - Core guidelines.
Basis of our work and level of assurance We performed our procedures to provide limited assurance in accordance with International Standard on Assurance Engagements (ISAE 3000): ‘Assurance Engagements Other than Audits or Reviews of Historical Financial Information’.
The evaluation criteria used for this limited assurance engagement are based on the Sustainability Reporting Guidelines (“GRI Guidelines”) and related information in particular, the requirements to achieve GRI G4 ‘In accordance’ - Core guideline publication, publicly available at GRI’s global website at “www.globalreporting.org”.
Our engagement provides limited assurance as well as reasonable assurance. A limited assurance engagement is substantially less in scope than a reasonable assurance engagement conducted in accordance with ISAE-3000 and consequently does not enable to obtain assurance that we would become aware of all significant matters that might be identified in a reasonable assurance
engagement. Accordingly, we do not express an opinion providing reasonable assurance.
Management of the Bank’s responsibility for the ReportThe management of the bank is responsible for the preparation of the self-declaration, the information and statements contained within the Report, and for maintaining adequate records and internal controls that are designed to support the sustaining reporting process in line with the GRI Sustainability Reporting Guidelines.
Ernst & Young’s responsibilityOur responsibility is to express a conclusion as to whether we have become aware of any matter that causes us to believe that the Report is not prepared in accordance with the requirements of the Global Reporting Initiative G4 ‘In accordance’ - Core guidelines. This report is made solely to the Bank in accordance with our engagement letter dated 08 January 2015. We disclaim any assumption of responsibility for any reliance on this report to any person other than the bank or for any purpose other than that for which it was prepared. In conducting our engagement, we have complied with the independence requirements of the Code for Ethics for Professional Accountants issued by the CASL.
Key assurance procedures We planned and performed our procedures to obtain the information and explanations considered necessary to provide sufficient evidence to support our limited assurance conclusions. Key assurance procedures included:• Interviewing relevant the bank’s personnel
to understand the process for collection, analysis, aggregation and presentation of data.
• Reviewing and validation of the information contained in the Report.
• Checking the calculations performed by the bank on a sample basis through recalculation.
• Reconciling and agreeing the data on financial performance are properly derived from the bank’s audited financial statements for the year ended 31 December 2014.
• Comparison of the content of the Report against the criteria for a Global Reporting Initiative G4 ‘In accordance’ - Core guidelines.
Our procedures did not include testing electronic systems used to collect and aggregate the information.
Limitations and considerationsEnvironmental and social performance data are subject to inherent limitations given their nature and the methods used for determining, calculating and estimating such data.
ConclusionBased on the procedures performed, as described above, we conclude that; • The information on financial performance
as specified on page 334 of the Report are properly derived from the audited financial statements of the Bank for the year ended 31 December 2014.
• Nothing has come to our attention that causes us to believe that other information presented in the Report are not fairly presented, in all material respects, in accordance with the Bank’s sustainability practices and policies some of which are derived from GRI-G4-‘In accordance’ Core Sustainability Reporting Guidelines.
20th February 2015Colombo

INTEGRITY AT THE HEART OF ALL WE DO. GOOD GOVERNANCE IS THE FOUNDATION UPON WHICH OUR BUSINESS IS BUILT, DRIVEN BY GLOBAL BEST PRACTICE AND THE HIGHEST BANKING STANDARDS AND ETHICS.
Governancereports
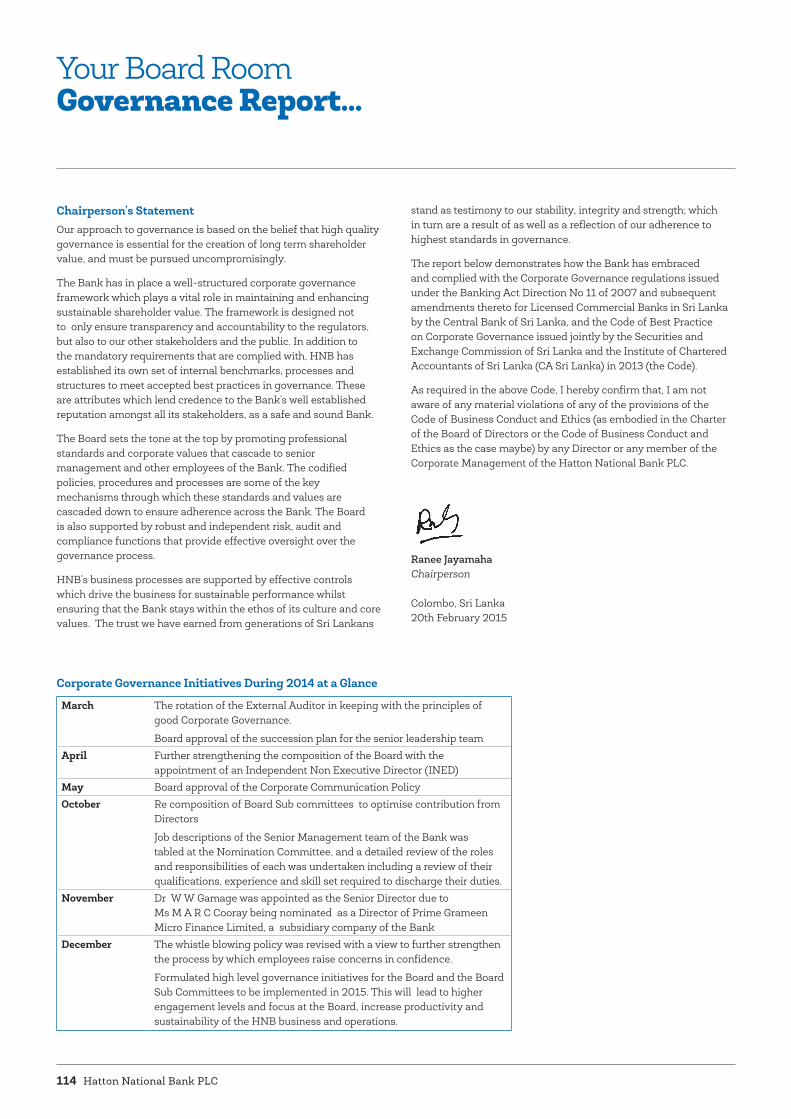
Hatton National Bank PLC114
Chairperson’s Statement Our approach to governance is based on the belief that high quality governance is essential for the creation of long term shareholder value, and must be pursued uncompromisingly.
The Bank has in place a well-structured corporate governance framework which plays a vital role in maintaining and enhancing sustainable shareholder value. The framework is designed not to only ensure transparency and accountability to the regulators, but also to our other stakeholders and the public. In addition to the mandatory requirements that are complied with, HNB has established its own set of internal benchmarks, processes and structures to meet accepted best practices in governance. These are attributes which lend credence to the Bank’s well established reputation amongst all its stakeholders, as a safe and sound Bank.
The Board sets the tone at the top by promoting professional standards and corporate values that cascade to senior management and other employees of the Bank. The codified policies, procedures and processes are some of the key mechanisms through which these standards and values are cascaded down to ensure adherence across the Bank. The Board is also supported by robust and independent risk, audit and compliance functions that provide effective oversight over the governance process.
HNB’s business processes are supported by effective controls which drive the business for sustainable performance whilst ensuring that the Bank stays within the ethos of its culture and core values. The trust we have earned from generations of Sri Lankans
stand as testimony to our stability, integrity and strength; which in turn are a result of as well as a reflection of our adherence to highest standards in governance.
The report below demonstrates how the Bank has embraced and complied with the Corporate Governance regulations issued under the Banking Act Direction No 11 of 2007 and subsequent amendments thereto for Licensed Commercial Banks in Sri Lanka by the Central Bank of Sri Lanka, and the Code of Best Practice on Corporate Governance issued jointly by the Securities and Exchange Commission of Sri Lanka and the Institute of Chartered Accountants of Sri Lanka (CA Sri Lanka) in 2013 (the Code).
As required in the above Code, I hereby confirm that, I am not aware of any material violations of any of the provisions of the Code of Business Conduct and Ethics (as embodied in the Charter of the Board of Directors or the Code of Business Conduct and Ethics as the case maybe) by any Director or any member of the Corporate Management of the Hatton National Bank PLC.
Ranee JayamahaChairperson
Colombo, Sri Lanka20th February 2015
Your Board RoomGovernance Report...
Corporate Governance Initiatives During 2014 at a Glance
March The rotation of the External Auditor in keeping with the principles of good Corporate Governance.
Board approval of the succession plan for the senior leadership teamApril Further strengthening the composition of the Board with the
appointment of an Independent Non Executive Director (INED) May Board approval of the Corporate Communication Policy October Re composition of Board Sub committees to optimise contribution from
Directors
Job descriptions of the Senior Management team of the Bank was tabled at the Nomination Committee, and a detailed review of the roles and responsibilities of each was undertaken including a review of their qualifications, experience and skill set required to discharge their duties.
November Dr W W Gamage was appointed as the Senior Director due to Ms M A R C Cooray being nominated as a Director of Prime Grameen Micro Finance Limited, a subsidiary company of the Bank
December The whistle blowing policy was revised with a view to further strengthen the process by which employees raise concerns in confidence.
Formulated high level governance initiatives for the Board and the Board Sub Committees to be implemented in 2015. This will lead to higher engagement levels and focus at the Board, increase productivity and sustainability of the HNB business and operations.
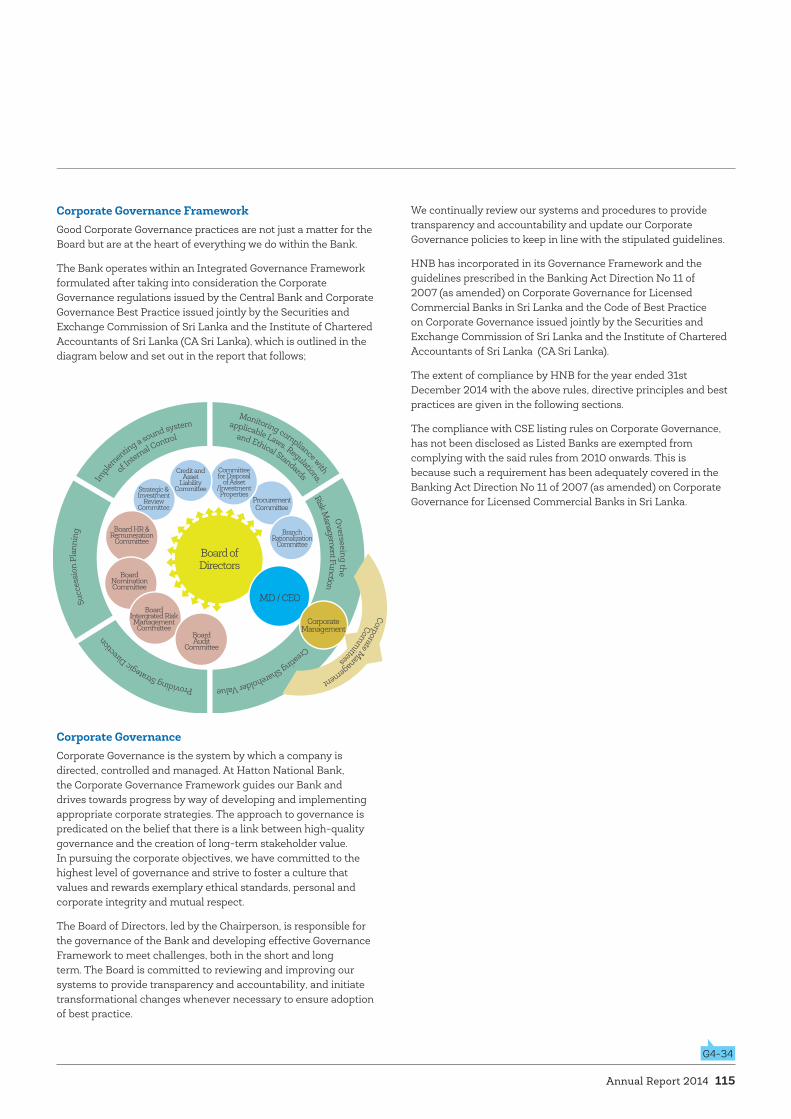
Annual Report 2014 115
Corporate Governance FrameworkGood Corporate Governance practices are not just a matter for the Board but are at the heart of everything we do within the Bank.
The Bank operates within an Integrated Governance Framework formulated after taking into consideration the Corporate Governance regulations issued by the Central Bank and Corporate Governance Best Practice issued jointly by the Securities and Exchange Commission of Sri Lanka and the Institute of Chartered Accountants of Sri Lanka (CA Sri Lanka), which is outlined in the diagram below and set out in the report that follows;
Corporate GovernanceCorporate Governance is the system by which a company is directed, controlled and managed. At Hatton National Bank, the Corporate Governance Framework guides our Bank and drives towards progress by way of developing and implementing appropriate corporate strategies. The approach to governance is predicated on the belief that there is a link between high-quality governance and the creation of long-term stakeholder value. In pursuing the corporate objectives, we have committed to the highest level of governance and strive to foster a culture that values and rewards exemplary ethical standards, personal and corporate integrity and mutual respect.
The Board of Directors, led by the Chairperson, is responsible for the governance of the Bank and developing effective Governance Framework to meet challenges, both in the short and long term. The Board is committed to reviewing and improving our systems to provide transparency and accountability, and initiate transformational changes whenever necessary to ensure adoption of best practice.
We continually review our systems and procedures to provide transparency and accountability and update our Corporate Governance policies to keep in line with the stipulated guidelines.
HNB has incorporated in its Governance Framework and the guidelines prescribed in the Banking Act Direction No 11 of 2007 (as amended) on Corporate Governance for Licensed Commercial Banks in Sri Lanka and the Code of Best Practice on Corporate Governance issued jointly by the Securities and Exchange Commission of Sri Lanka and the Institute of Chartered Accountants of Sri Lanka (CA Sri Lanka).
The extent of compliance by HNB for the year ended 31st December 2014 with the above rules, directive principles and best practices are given in the following sections.
The compliance with CSE listing rules on Corporate Governance, has not been disclosed as Listed Banks are exempted from complying with the said rules from 2010 onwards. This is because such a requirement has been adequately covered in the Banking Act Direction No 11 of 2007 (as amended) on Corporate Governance for Licensed Commercial Banks in Sri Lanka.
Monitoring compliance with
applicable Laws, Regulations,
and Ethical StandardsImplem
enting a sound system
of Internal Control
Succ
essi
on P
lann
ing
Providing Strategic Dire
ction Creating Shareholder Value
Overseeing the
Risk Managem
ent Function
Board of Directors
MD / CEO
Corporate Management
BoardAudit
Committee
Board Intergrated Risk Management
Committee
Board Nomination Committee
Board HR & Remuneration
Committee
Strategic &Investment
Review Committee
Credit andAsset
LiabilityCommittee
Committee for Disposal
of Asset /Investment Properties
Branch Rationalization
Committee
Procurement Committee
Corporate Management
Comm
ittees
G4-34

Hatton National Bank PLC116
SECTION ONE CODE OF BEST PRACTICE ON CORPORATE GOVERNANCE ISSUED BY THE SECURITIES AND EXCHANGE COMMISSION OF SRI LANKA (SEC) AND THE INSTITUTE OF CHARTERED ACCOUNTANTS OF SRI LANKA (CA SRI LANKA)
Statement of Compliance The disclosures below reflect HNB’s level of conformance with the above Code which comprises of seven (7) fundamental principles. These are namely: A. Directors B. Directors’ Remuneration C. Relations with Shareholders D. Accountability and Audit E. Institutional Investors F. Other Investors andG. Sustainability Reporting
The structures in place, the conformance with the requirement and expectations of the said Code are tabulated below under the said seven fundamental principles.
Corporate Governance Principles
SEC & CA Sri Lanka Code Reference
Adoption Status
HNB’s Extent of Compliance in 2014
A. DIRECTORS
A.1. The Board The Bank should be headed by a Board, which should direct, lead and control the Bank
All Directors with the exception of the MD / CEO serve the Bank in a Non Executive capacity. The Board consists of professionals in the fields of Banking, Accounting, Management, Economics, Engineering, Marketing and Business. All Directors possess the skills, experience and knowledge complemented with a high sense of integrity and independent judgment. The Board gives leadership in setting the strategic direction and establishing a sound control framework for the successful functioning of the Bank. The Board’s composition reflects sound balance of independence and anchors shareholder commitment. 1. Board Meetings A.1.1 Adopted The Board usually meets on monthly intervals, but meets more frequently whenever
it is necessary.
The Board met fifteen (15) times during the year. Scheduled Board and Committee meetings were arranged well in advance and all Directors were expected to attend each Board meeting. Any instance of non-attendance at Board meetings were generally related to prior business, personal commitments or illness.
The attendance at Board meetings held in 2014 is set out on page 145.
Attendance at Board meetings during 2014
1. Dr Ranee Jayamaha 2. Mr Jonathan Alles3. Dr W W Gamage4. Ms M A R C Cooray 5. Dr L R Karunaratne6. Mr L U D Fernando7. Mr Sujeewa Mudalige8. Ms D S C Jayawardena9. Mr Rusi S. Captain10. Mr D A Cabraal
Meetings attendedMeetings not attended 1 2 3 4 5 6 7 8 9 10
0123456789
101112131415
Note: Mr D A Cabraal joined the Board w.e.f. 01st April 2014.
Your Board RoomGovernance Report...

Annual Report 2014 117
Corporate Governance Principles
SEC & CA Sri Lanka Code Reference
Adoption Status
HNB’s Extent of Compliance in 2014
2. Board Responsibilities
A.1.2 Adopted The Board Charter sets out the responsibility of the Board.
The Board is responsible to the shareholders for creating and delivering long term sustainable shareholder value through the oversight of business.
The Board has provided strategic direction to the development of short, medium and long term strategy which is aimed at promoting the long term success of the Bank. The business strategy is reviewed at least on a quarterly basis by the Board with updates at each Board meeting on execution of the agreed strategy by the management.
The Board has put in place a Corporate Management team led by the MD / CEO with the required skills, experience and knowledge necessary to implement the business strategy of the Bank. The names and the qualifications of the Corporate Management team are provided on pages 28 and 29. The Board has also implemented a structured approach towards succession planning of the Corporate Management and Senior Management team during the past couple of years. In mid 2014, changes were made to the Corporate and Senior Management structure and reporting lines as part of Bank’s strategy on succession planning.
The Board recognises its’ responsibility for the Bank’s system of internal control and for reviewing its effectiveness on a continuous basis. These systems manage the risk of the Bank’s business and ensure that the financial information on which business decisions are made and published is reliable. It also ensures that the Bank’s assets are safeguarded against unauthorised use or disposition.
The Board is satisfied with the integrity of financial information and the robustness of the financial controls and systems of risk management of the Bank.
3. Compliance with laws and access to independent professional advice
A.1.3 Adopted The Board collectively as well the Directors individually, recognise their duty to comply with laws of the country which are applicable to the Bank. The Board of Directors ensures that procedures and processes are in place to ensure that the Bank complies with all applicable laws and regulations.
A procedure has been put in place for Directors to seek independent professional advice, in furtherance of their duties, at the Bank’s expense. This will be coordinated through the Board Secretary, as and when it is requested. In 2014 there were four (4)of such requests by the Board members which were attended to by the Bank.
4. Board Secretary A.1.4 Adopted All Directors have access to the Board Secretary, who is an Attorney-at-Law by profession.
Her services were available to all Directors, particularly the Non Executive Directors who needed additional support to ensure they receive timely and accurate information to fulfil their duties. The Board Secretary had provided the Board with support and advice relating to corporate governance matters, Board procedures and applicable rules and regulations during the year. Further, she assisted the Chairperson and MD / CEO in determining the annual Board plan.
5. Independent judgment
A. 1.5 Adopted Non Executive Directors are responsible for bringing independent and objective judgment, and scrutinising the recommendations/ proposals made by the Corporate Management led by the MD / CEO, on issues of strategy, performance, resources utilisation and business conduct. The Board promotes an environment whereby challenging contribution from the Non Executive Directors is welcomed and encouraged, combined with full support for and empowerment of the MD / CEO in implementing decisions.

Hatton National Bank PLC118
Corporate Governance Principles
SEC & CA Sri Lanka Code Reference
Adoption Status
HNB’s Extent of Compliance in 2014
6. Dedication of adequate time and effort by the Board and Board Committees
A.1.6 Adopted The Chairperson and members of the Board have dedicated adequate time for the fulfilment of their duties as Directors of the Bank. In addition to attending Board meetings, they have attended Sub-Committee meetings and also have contributed to decision making via circular resolution where necessary. The Board Sub-Committees include: - Audit Committee - Board Integrated Risk Management Committee - Human Resources & Remuneration Committee - Nomination Committee - Credit / Asset & Liability Committee - Procurement Committee - Committee for Disposal of Asset / Investment Properties - Strategic & Investment Review Committee- Branch Rationalisation Committee
Further, as and when it was required the Board appointed special Sub-Committees to look into specific matters.
7. Training for Directors
A.1.7 Adopted The Board of Directors recognises the need for continuous training and expansion of knowledge and undertakes such professional development as they consider necessary in assisting them to carry out their duties as Directors.
An induction programme had been organised for the director appointed during the year, to familiarise him with the Bank’s strategy, risk appetite, operations and internal control.
The Directors have attended the following programmes during the year.
Programme Conducted byNew Developments on Board Audit Committee Responsibilities and Important Changes to Accounting Standards
M/s Ernst & Young
Strategy Transformation at the Board Level Sri Lanka Institute of DirectorsSymposium on the Role of an Independent Director
Securities and Exchange Commission
Sri Lanka Economic Summit 2014 Ceylon Chamber of CommerceTechnical Seminar for Bank Directors Central Bank of Sri LankaBank Directors’ Symposium 2014 Central Bank of Sri Lanka
A.2. Chairperson and Chief Executive Officer There should be a clear division of responsibilities between the Chairperson and Chief Executive to ensure a balance of power and authority, in such a way that any individual has no unfettered powers of decisions.
The roles of the Chairperson and Chief Executive Officer are segregated at HNB. The Chairperson’s main responsibility is to lead, direct and manage the Board to ensure that it operates effectively and fully discharges its legal and regulatory responsibilities. MD / CEO is responsible for the day-to-day operations of the Bank.8. Division of
responsibilities of the Chairperson and MD / CEO
A.2.1 Adopted The roles of the Chairperson and Chief Executive are separate. The role of the Chief Executive is to manage the day-to-day running of the Bank. The Board has delegated this responsibility to the Chief Executive and he then leads the Corporate Management team in making and executing operational decisions. The Chief Executive is also responsible for recommending strategy to the Board.
Your Board RoomGovernance Report...

Annual Report 2014 119
Corporate Governance Principles
SEC & CA Sri Lanka Code Reference
Adoption Status
HNB’s Extent of Compliance in 2014
A.3. Chairperson’s Role The Chairperson should lead and manage the Board, ensuring that it discharges its legal and regulatory responsibilities effectively and fully and preserves order and facilitates the effective discharge of the Board function.
The profile of the Chairperson is given on page 24.9. Role of the
ChairpersonA.3.1 Adopted The Chairperson is responsible for leadership of the Board and ensuring
effectiveness in all aspects of its role. The Chairperson of HNB is a Non Executive Director, elected by the Board. The Chairperson’s role encompasses: - Ensuring that the new Board Members are given appropriate induction,
covering terms of appointment, duties and responsibilities. - Leading the Board and managing the business of the Board while taking full
account of the issues and concerns of the Board.- Approving the agenda for each meeting prepared by the Board Secretary.- Ensuring that the Board members receive accurate, timely and clear
information, in particular about the Bank’s performance to enable the Board to take sound decisions, monitor efficiently and provide advice to promote success of the Bank.
- Ensuring regular meetings, the minutes of which are accurately recorded and where appropriate include the individual and collective views of the Directors.
- Facilitates and encourages discussions amongst all Directors where decisions are needed on matters of risk and strategy.
- Encouraging effective participation of all Directors in the decision making process to optimise contribution.
- Representing the views of the Board to the public. - Initiates the process for self assessment of the Board from its members and
uses the meaningful feedback to further improve the effectiveness of the Board.
A.4. Financial Acumen The Board should ensure the availability within it of those with sufficient financial acumen and knowledge to offer guidance on matters of finance.
The Board is equipped with members having sufficient financial acumen and knowledge. 10. Availability of
sufficient financial acumen and knowledge
A.4 Adopted All Directors possess financial acumen and knowledge through the experience gained from leading large private and public enterprises coupled with their academic and professional background.
The details of their qualifications and experience have been set out on pages 24 to 27.
A.5. Board BalanceThere should be balance of Executive and Non Executive Directors so that no individual or small group of individuals can dominate the Board’s decision-taking.
All Directors are Non Executive Directors except for the MD / CEO. Each of them bring to the Board, wide experience and the ability to exercise independence and judgment when taking informed decisions. 11. Presence of
Non Executive Directors
A.5.1 Adopted All Directors are Non Executive Directors except for the MD / CEO.
The requirement as per the Code has been complied with throughout 2014.
Executive Vs Non Executive Directors
1 Excutive Director Non Excutive Directors9

Hatton National Bank PLC120
Corporate Governance Principles
SEC & CA Sri Lanka Code Reference
Adoption Status
HNB’s Extent of Compliance in 2014
12. Independent Directors
A.5.2 Adopted Four (4) Non Executive Directors are independent as defined by the Code as at 31st December 2014
Independent Vs Non Independent Directors
6 Non Independent Directors Independent Directors4
The requirement as per the Code has been complied with throughout 2014.
Dr Ranee Jayamaha is considered non independent as she holds office as the Chairperson of two (2) subsidiary companies of the Bank. However, her non independent status was countered by the existence of a Senior Director designated by the Board.
13. Criteria to evaluate Independence of Non Executive Directors
A.5.3 Adopted Please refer Section A.5.5 below.
The Board considers Non Executive Director’s independence on an annual basis, as part of each Director’s performance evaluation. The Board reviewed the independence of each Non Executive Director in 2014 and concluded that each of them continues to demonstrate these essential behaviours.
14. Signed declaration of independence by the Non Executive Directors
A.5.4 Adopted All Non Executive Directors of the Bank have made written submissions as to their independence against the specified criteria set out by the Bank, which is in line with the requirements of Schedule J of the Code.
15. Determination of independence of the Directors by the Board
A.5.5 Adopted The Board has determined that the submission of declaration/s by the Non Executive Directors, as to their independence, as fair representation and will continue to evaluate their submission annually. Circumstances have not arisen for the determination of independence by the Board, beyond the criteria set out in the Code. The following Directors are Independent as at 31st December 2014;Dr W W GamageDr L R KarunaratneMr Sujeewa MudaligeMr D A Cabraal
Ms M A R C Cooray was an Independent Director up to 30th October 2014. On 30th October, with her experience in the Micro Finance business segment, Ms Cooray was nominated as a Director of Prime Grameen Micro Finance Limited, a subsidiary company of the Bank. As a result she is considered to be a Non Independent Director of the Bank from the date of appointment to the Board of the subsidiary company, as per the provisions set out in the Direction on Cooperate Governance for Licensed Commercial Banks issued by the CBSL. The change in status of Ms Cooray also resulted in the appointment of Dr W W Gamage as the Senior Independent Director with effect from 1st November 2014.
16. Alternate Director A.5.6 Adopted The requirement as per the Code has been met at the time of appointing of Alternate Directors during 2014
17. Senior independent Director
A.5.7 N/A Although the requirement to appoint a Senior Independent Director does not arise under this Code, the following Directors functioned as Senior Independent Director during 2014, to meet the requirement under Rule 3(5) (ii) of the CBSL Direction on Corporate Governance.Ms M A R C Cooray (up to 30th October 2014)Dr W W Gamage (appointed w.e.f. 01st November 2014)
Please refer Section A.5.5 above
Your Board RoomGovernance Report...

Annual Report 2014 121
Corporate Governance Principles
SEC & CA Sri Lanka Code Reference
Adoption Status
HNB’s Extent of Compliance in 2014
18. Confidential discussion with the Senior Independent Director
A.5.8 N/A Please refer above comment.
19. Meeting of Non Executive Directors
A.5.9 Adopted The Chairperson meets with the Non Executive Directors without the presence of the Executive Director, on a need basis. The Non Executive Directors met once (01) times without the presence of the Executive Director during 2014.
20. Recording of concerns in Board Minutes
A.5.10 Adopted All concerns raised and wished to be recorded have been documented in sufficient detail.
A.6. Supply of InformationManagement should provide time bound information in a form and of quality appropriate to enable the Board to discharge its duties.
Financial and non-financial information are analysed and presented to the Board to make informed and accurate decisions. 21. Information to
the Board by the Management
A.6.1 Adopted The Board was provided with timely and appropriate information by the Management by way of Board papers and proposals. The Board sought additional information as and when necessary. Members of the Corporate and Senior Management team made presentations to Directors on important issues relating to strategy, risk management, recoveries endeavours, audit and new legal developments. The Chairperson ensured that all Directors were briefed on issues arising at Board meetings. The Directors have free and open contact with the Corporate and Senior Management of the Bank.
22. Adequate time for effective Board meetings
A.6.2 Adopted The Board papers are usually sent to the Directors at least a week before the respective Board meetings giving adequate time for Directors to study the related papers and prepare for a meaningful discussion at the respective meetings.
A.7. Appointments to the BoardA formal and transparent procedure should be followed for the appointment of new Directors to the Board. The Nomination Committee assesses the suitability of the prospective nominees to the Board and recommends persons found to be “fit and proper” for consideration of the entire Board. Upon completion of this process, names are referred to the Director of the Bank Supervision Department of the Central Bank of Sri Lanka for approval as a “fit and proper” person, prior to the appointment. Mr D A Cabraal was appointed as an Independent Non Executive Director w.e.f. 01st April 2014. The profile of Mr Cabraal is given on page 27. 23. Nomination
CommitteeA.7.1 Adopted The Nomination Committee made recommendations to the Board on all new
appointments. The Terms of Reference for the members of the Nomination Committee are similar to the one set out in Schedule A to the Code. The following Directors served on the Nomination Committee during 2014. The MD / CEO attends these meetings by invitation. Dr Ranee Jayamaha Dr L R Karunaratne (resigned w.e.f. 31st October 2014)Dr W W Gamage Ms M A R C CoorayMr Rusi S. Captain (appointed w.e.f. 31st October 2014)
Dr L R Karunaratne served as the Chairman of the above Committee upto 31st October 2014. Dr Ranee Jayamaha was appointed the Chairperson of the Nomination Committee w.e.f. 31st October 2014.
Job descriptions of the Senior Management Team of the Bank was tabled at the Nomination Committee meeting in October and a detailed review of the roles and responsibilities of each was undertaken including a review of their qualifications, experience and skill set required to discharge their duties.
A formal Board approved procedure to appoint MD / CEO, KMPs and Directors is in place.
The Nomination Committee report is given on pages 150 and 151.

Hatton National Bank PLC122
Corporate Governance Principles
SEC & CA Sri Lanka Code Reference
Adoption Status
HNB’s Extent of Compliance in 2014
24. Assessment of Board Composition by the Nomination Committee
A.7.2 Adopted The Nomination Committee carries out continuous review of the structure, size and composition (including the skills, knowledge, experience and independence required of Directors) of the Board to address and challenge adequately key risks and decisions that confront, or may confront, the Board and makes recommendations to the Board with regard to any changes.
25. Disclosure of details of new Directors to shareholders
A.7.3 Adopted Details of new Directors are disclosed to the shareholders at the time of their appointment by way of public announcements as well as in the Annual Report. Prior approval for appointment of new Directors is obtained from the Director of Bank Supervision of CBSL and notification is sent to Colombo Stock Exchange. All new appointments as well as continuing Directorships are reviewed by the Nomination Committee. The Directors are required to report any substantial changes in their professional responsibilities and business associations to the Nomination Committee, which will examine the facts and circumstances and make recommendations to the Board.
A.8. Re - election All Directors should submit themselves for re-election at regular intervals and at least once in every three years, and all Non Executive Directors should be appointed for a specific term and subject to re-election.26. Appointment of
Non Executive Directors
A.8.1 Adopted Articles of Association of the Bank require each Director other than the MD / CEO and any nominee Director, to retire by rotation once in every three years and they are required to stand for re-election by the shareholders at the Annual General Meeting. The proposed re-election of Directors is subject to prior review by the full Board.
Dr Ranee Jayamaha, Ms D S C Jayawardena and Mr Rusi S. Captain will retire by rotation at the AGM under the Articles of Association of the Bank. Dr Ranee Jayamaha, Ms D S C Jayawardena and Mr Rusi S. Captain have offered themselves for re-election, with the unanimous support of the Board.
Mr D A Cabraal also joined the Board as an Independent Non Executive Director during 2014.
27. Election of Directors by the shareholders
A.8.2 Adopted Please refer to comments above.
A.9. Appraisal of Board Performance The Board should periodically appraise its own performance against the pre set targets in order to ensure that the Board responsibilities are satisfactorily discharged.28. Appraisal of Board
performanceA.9.1 Adopted Goals and targets of the Board of Directors have been clearly set out and evaluated
at the end of the year by the members.
Further each member of the Board carried out a self assessment of his / her own effectiveness as an individual as well as effectiveness of the Board as a team for the year 2014. The outcome of the assessment was tabled at a meeting of the Board in January 2015. The Sub-Committees, except for the Audit Committee, carries out a self assessment process annually, in accordance with the pre-set criteria, to ensure they function effectively and efficiently with the objective of facilitating continuous improvement individually and collectively in the performance of the Board.
The Audit Committee evaluation was conducted by the Non Executive Chairperson, with individual assessments from the members of the Audit Committee, MD / CEO, COO, CFO, Senior Manager - Internal Audit, and the External Auditor, in accordance with international best practices.
Your Board RoomGovernance Report...

Annual Report 2014 123
Corporate Governance Principles
SEC & CA Sri Lanka Code Reference
Adoption Status
HNB’s Extent of Compliance in 2014
29. Annual self evaluation of the Board and its Committees
A.9.2 Adopted Refer to comments given for Section A.9.1
30. Disclosure of the method of Appraisal of Board and Board Sub Committee performance
A.9.3 Adopted Refer to comments given for Section A.9.1
A.10. Disclosure of Information in respect of DirectorsDetails in respect of each Director should be disclosed in the Annual Report for the benefit of the shareholders.31. Details in respect
of DirectorsA.10.1 Adopted Details of the Directors are given on pages 22 to 27 Directors’ attendance at the
Board and Board Sub-committee meetings are given on page 145.
The total number of Board seats (excluding directorship in HNB) held by each director as at 31st December 2014, can be summarised as follows;
Name of Director Directorship Status No of Board seats held
in listed companies
No of Board seats held in unlisted companies
Exec
utiv
e Ca
paci
ty
Non
Exe
cutiv
e Ca
paci
ty
Exec
utiv
e Ca
paci
ty
Non
Exe
cutiv
e Ca
paci
ty
Dr Ranee Jayamaha Non Executive Chairperson
- 2 - 3
Mr Jonathan Alles Managing Director / CEO - 4 - 6Dr W W Gamage Senior Independent Non
Executive Director- - - 1
Ms M A R C Cooray Non Executive Director - 2 - 1Dr L R Karunaratne Independent Non
Executive Director- 1 1 2
Mr L U D Fernando Non Executive Director - - - -Mr Sujeewa Mudalige Non Executive Director - - - -Ms D S C Jayawardena Non Executive Director - 1 - 13Mr Rusi S. Captain Non Executive Director - 1 15 -Mr D A Cabraal Independent Non
Executive Director- 3 - 1
A.11. Appraisal of the CEOThe Board of Director should at least annually assess the performance of the Chief Executive Officer.32. Targets for MD /
CEOA.11.1 Adopted The MD / CEO’s performance objectives are aligned with business sustainability of
the Bank. The performance targets for the MD / CEO are set at the commencement of every year by the full Board which are in line with the short, medium and long term objectives of the Bank.
33. Evaluation of the performance of the MD / CEO
A.11.2 Adopted There is an on going process to evaluate the performance of MD / CEO against the financial and non financial targets set as described above, which is followed by a formal annual review by the Board at the end of each financial year.
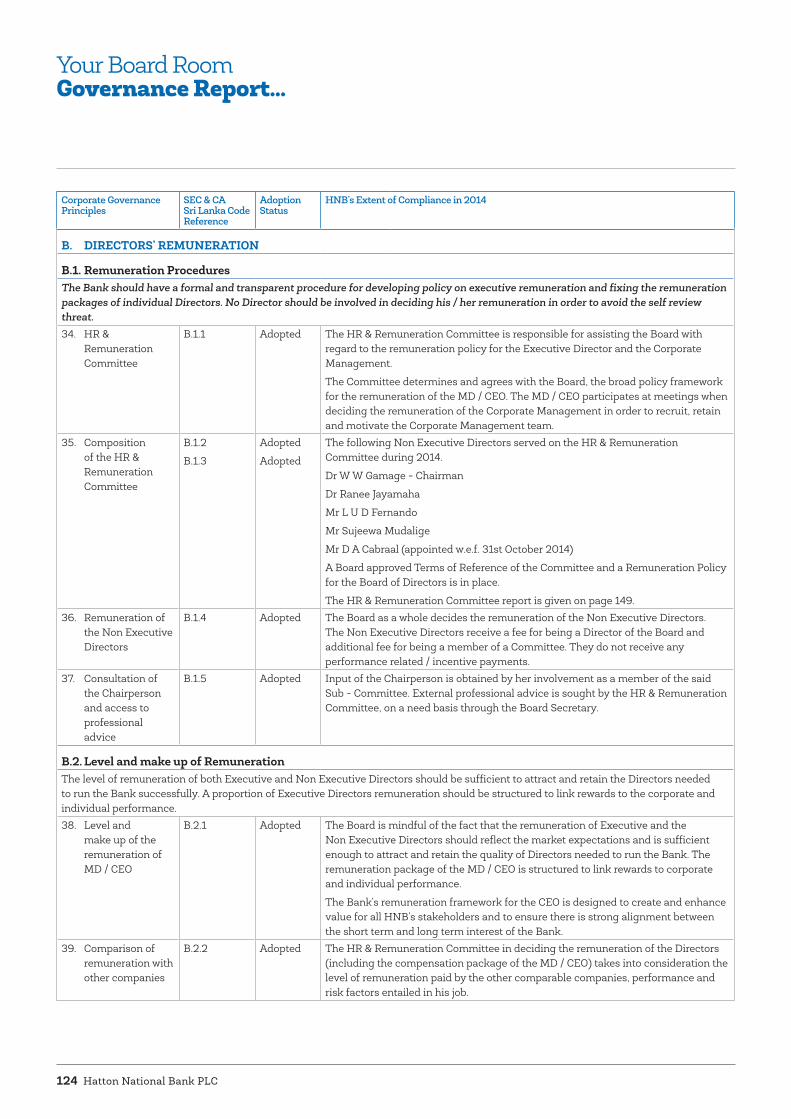
Hatton National Bank PLC124
Corporate Governance Principles
SEC & CA Sri Lanka Code Reference
Adoption Status
HNB’s Extent of Compliance in 2014
B. DIRECTORS’ REMUNERATION
B.1. Remuneration Procedures The Bank should have a formal and transparent procedure for developing policy on executive remuneration and fixing the remuneration packages of individual Directors. No Director should be involved in deciding his / her remuneration in order to avoid the self review threat. 34. HR &
Remuneration Committee
B.1.1 Adopted The HR & Remuneration Committee is responsible for assisting the Board with regard to the remuneration policy for the Executive Director and the Corporate Management.
The Committee determines and agrees with the Board, the broad policy framework for the remuneration of the MD / CEO. The MD / CEO participates at meetings when deciding the remuneration of the Corporate Management in order to recruit, retain and motivate the Corporate Management team.
35. Composition of the HR & Remuneration Committee
B.1.2
B.1.3
Adopted
Adopted
The following Non Executive Directors served on the HR & Remuneration Committee during 2014.
Dr W W Gamage - Chairman
Dr Ranee Jayamaha
Mr L U D Fernando
Mr Sujeewa Mudalige
Mr D A Cabraal (appointed w.e.f. 31st October 2014)
A Board approved Terms of Reference of the Committee and a Remuneration Policy for the Board of Directors is in place.
The HR & Remuneration Committee report is given on page 149.36. Remuneration of
the Non Executive Directors
B.1.4 Adopted The Board as a whole decides the remuneration of the Non Executive Directors. The Non Executive Directors receive a fee for being a Director of the Board and additional fee for being a member of a Committee. They do not receive any performance related / incentive payments.
37. Consultation of the Chairperson and access to professional advice
B.1.5 Adopted Input of the Chairperson is obtained by her involvement as a member of the said Sub - Committee. External professional advice is sought by the HR & Remuneration Committee, on a need basis through the Board Secretary.
B.2. Level and make up of RemunerationThe level of remuneration of both Executive and Non Executive Directors should be sufficient to attract and retain the Directors needed to run the Bank successfully. A proportion of Executive Directors remuneration should be structured to link rewards to the corporate and individual performance.38. Level and
make up of the remuneration of MD / CEO
B.2.1 Adopted The Board is mindful of the fact that the remuneration of Executive and the Non Executive Directors should reflect the market expectations and is sufficient enough to attract and retain the quality of Directors needed to run the Bank. The remuneration package of the MD / CEO is structured to link rewards to corporate and individual performance.
The Bank’s remuneration framework for the CEO is designed to create and enhance value for all HNB’s stakeholders and to ensure there is strong alignment between the short term and long term interest of the Bank.
39. Comparison of remuneration with other companies
B.2.2 Adopted The HR & Remuneration Committee in deciding the remuneration of the Directors (including the compensation package of the MD / CEO) takes into consideration the level of remuneration paid by the other comparable companies, performance and risk factors entailed in his job.
Your Board RoomGovernance Report...
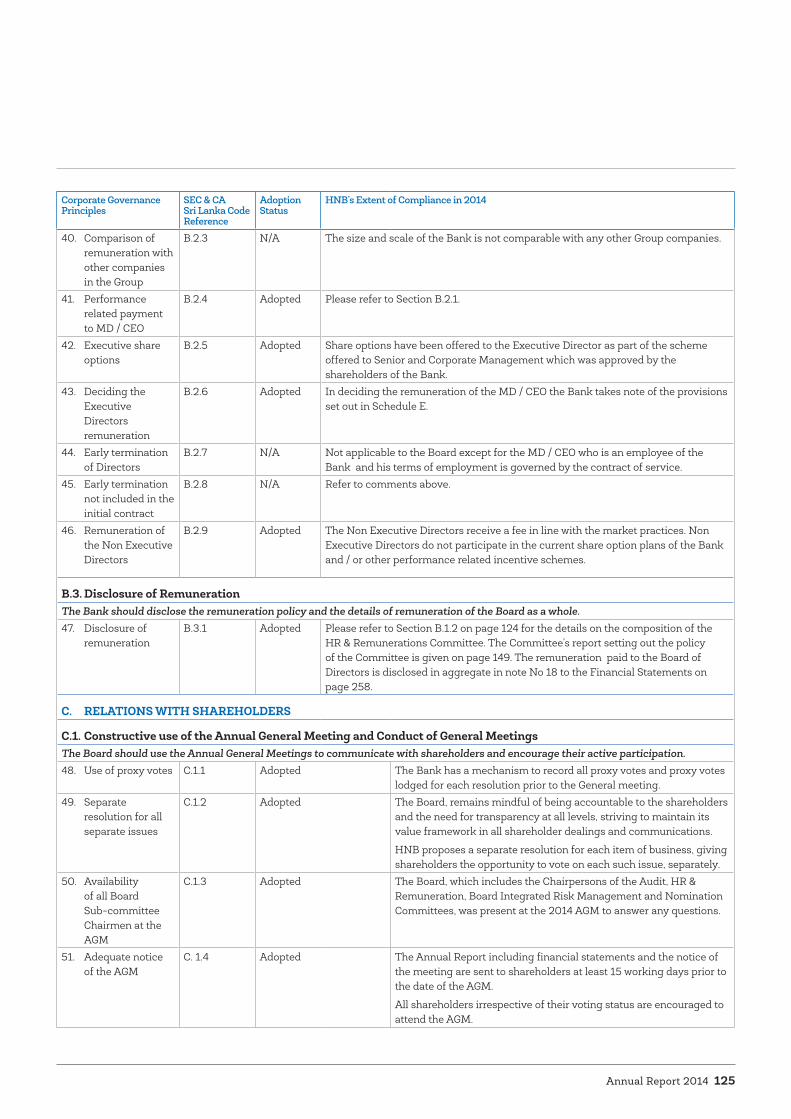
Annual Report 2014 125
Corporate Governance Principles
SEC & CA Sri Lanka Code Reference
Adoption Status
HNB’s Extent of Compliance in 2014
40. Comparison of remuneration with other companies in the Group
B.2.3 N/A The size and scale of the Bank is not comparable with any other Group companies.
41. Performance related payment to MD / CEO
B.2.4 Adopted Please refer to Section B.2.1.
42. Executive share options
B.2.5 Adopted Share options have been offered to the Executive Director as part of the scheme offered to Senior and Corporate Management which was approved by the shareholders of the Bank.
43. Deciding the Executive Directors remuneration
B.2.6 Adopted In deciding the remuneration of the MD / CEO the Bank takes note of the provisions set out in Schedule E.
44. Early termination of Directors
B.2.7 N/A Not applicable to the Board except for the MD / CEO who is an employee of the Bank and his terms of employment is governed by the contract of service.
45. Early termination not included in the initial contract
B.2.8 N/A Refer to comments above.
46. Remuneration of the Non Executive Directors
B.2.9 Adopted The Non Executive Directors receive a fee in line with the market practices. Non Executive Directors do not participate in the current share option plans of the Bank and / or other performance related incentive schemes.
B.3. Disclosure of Remuneration The Bank should disclose the remuneration policy and the details of remuneration of the Board as a whole.47. Disclosure of
remunerationB.3.1 Adopted Please refer to Section B.1.2 on page 124 for the details on the composition of the
HR & Remunerations Committee. The Committee’s report setting out the policy of the Committee is given on page 149. The remuneration paid to the Board of Directors is disclosed in aggregate in note No 18 to the Financial Statements on page 258.
C. RELATIONS WITH SHAREHOLDERS
C.1. Constructive use of the Annual General Meeting and Conduct of General MeetingsThe Board should use the Annual General Meetings to communicate with shareholders and encourage their active participation. 48. Use of proxy votes C.1.1 Adopted The Bank has a mechanism to record all proxy votes and proxy votes
lodged for each resolution prior to the General meeting.49. Separate
resolution for all separate issues
C.1.2 Adopted The Board, remains mindful of being accountable to the shareholders and the need for transparency at all levels, striving to maintain its value framework in all shareholder dealings and communications.
HNB proposes a separate resolution for each item of business, giving shareholders the opportunity to vote on each such issue, separately.
50. Availability of all Board Sub-committee Chairmen at the AGM
C.1.3 Adopted The Board, which includes the Chairpersons of the Audit, HR & Remuneration, Board Integrated Risk Management and Nomination Committees, was present at the 2014 AGM to answer any questions.
51. Adequate notice of the AGM
C. 1.4 Adopted The Annual Report including financial statements and the notice of the meeting are sent to shareholders at least 15 working days prior to the date of the AGM.
All shareholders irrespective of their voting status are encouraged to attend the AGM.

Hatton National Bank PLC126
Corporate Governance Principles
SEC & CA Sri Lanka Code Reference
Adoption Status
HNB’s Extent of Compliance in 2014
52. Procedures of voting at General Meetings
C.1.5 Adopted Voting procedures at General Meetings are circulated to the shareholders.
C.2. Communication with ShareholdersThe Board should implement effective communication with shareholders53. Channel to reach
all shareholders of the company
C.2.1 Adopted The primary modes of communication between HNB and the shareholders are the Annual Report and AGM. Information is provided to the shareholders prior to the AGM to give them an opportunity to exercise the prerogative to raise any issues relating to the business of HNB, either verbally or in writing prior to the AGM.
The Bank will post on its website (www.hnb.net) copies of annual reports, interim reports, stock information, stock exchange announcements etc. These will be posted on the website as soon as practicable after they have been released to the stock exchange.
54. Policy and methodology for communication with shareholders
C.2.2 Adopted The Bank will focus on open communication and fair disclosure, with emphasis on the integrity, timeliness and relevance of the information provided. The Bank will ensure information is communicated accurately and in such a way as to avoid the creation or continuation of a false market.
55. Implementation of the policy and methodology for communication with shareholders
C.2.3 Adopted The Board has approved a formal Corporate Communication Policy in May 2014, with a view to build up global trust in HNB’s Corporate Brand. This policy was communicated to all staff members in July 2014.
Shareholders are consulted on their preference to receive the Annual Report from the Bank either by means of a CD or in hardcopy form. Shareholders may at any time elect to receive Annual Report from the Bank in printed form. Printed copies will be provided without charge.
56. Contact person in relation to shareholders’ matters.
C.2.4
C.2.6
Adopted Shareholders may, at any time, direct questions, request for publicly available information and provide comments and suggestions to Directors or Management of the Bank. Such questions, requests and comments should be addressed to the Company Secretary.
57. Process to make all Directors aware of major issues and concerns of shareholders
C.2.5 Adopted The Company Secretary shall maintain a record of all correspondence received and will deliver as soon as practicable such correspondence to the Board or individual director/s as applicable.
The Board or individual director/s, as applicable, will generate an appropriate response to all validly received shareholder correspondence and will direct the Company Secretary to send the response to the particular shareholder.
58. The process responding to shareholder matters
C.2.7 Adopted Refer to comments given for Section C.2.5
C.3. Major and Material TransactionsDirectors should disclose to shareholders all proposed material transactions which would materially alter the net asset position of the Bank, if entered into.59. Major transactions C.3.1 Adopted During 2014,the Bank had not engaged in or committed to any
‘Major related party transaction which materially affected HNB’s net asset base.
Your Board RoomGovernance Report...
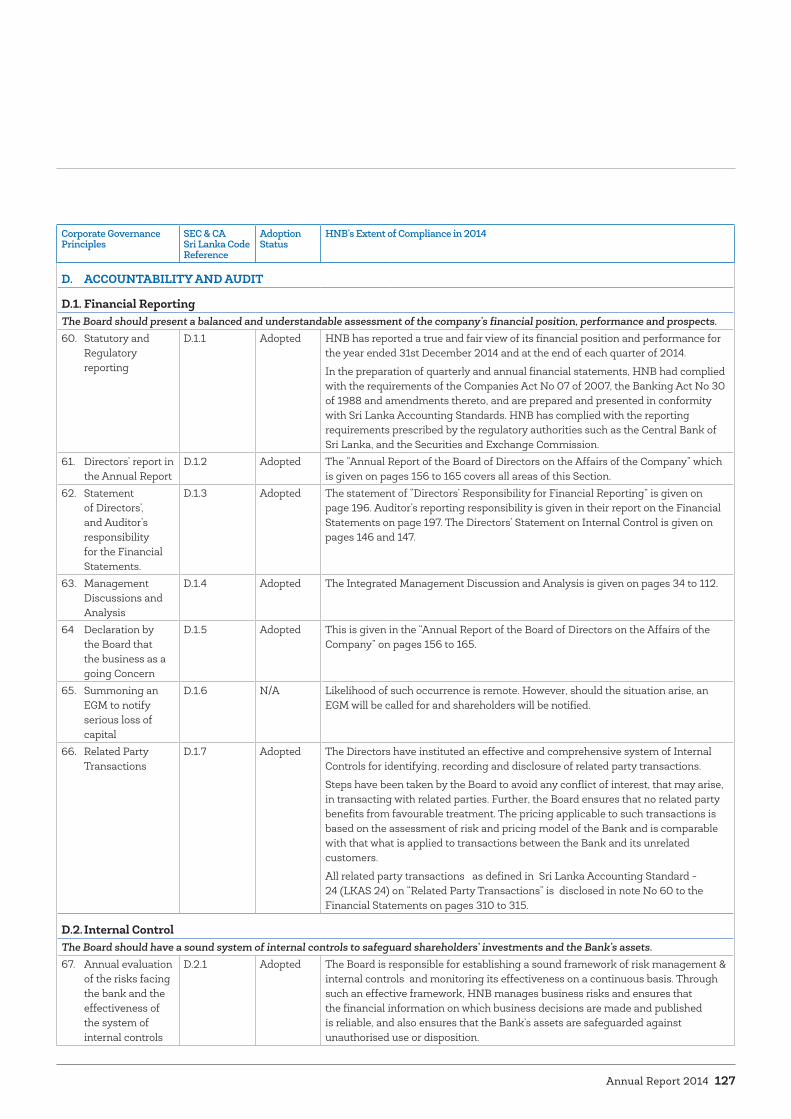
Annual Report 2014 127
Corporate Governance Principles
SEC & CA Sri Lanka Code Reference
Adoption Status
HNB’s Extent of Compliance in 2014
D. ACCOUNTABILITY AND AUDIT
D.1. Financial ReportingThe Board should present a balanced and understandable assessment of the company’s financial position, performance and prospects.60. Statutory and
Regulatory reporting
D.1.1 Adopted HNB has reported a true and fair view of its financial position and performance for the year ended 31st December 2014 and at the end of each quarter of 2014.
In the preparation of quarterly and annual financial statements, HNB had complied with the requirements of the Companies Act No 07 of 2007, the Banking Act No 30 of 1988 and amendments thereto, and are prepared and presented in conformity with Sri Lanka Accounting Standards. HNB has complied with the reporting requirements prescribed by the regulatory authorities such as the Central Bank of Sri Lanka, and the Securities and Exchange Commission.
61. Directors’ report in the Annual Report
D.1.2 Adopted The “Annual Report of the Board of Directors on the Affairs of the Company” which is given on pages 156 to 165 covers all areas of this Section.
62. Statement of Directors’, and Auditor’s responsibility for the Financial Statements.
D.1.3 Adopted The statement of “Directors’ Responsibility for Financial Reporting” is given on page 196. Auditor’s reporting responsibility is given in their report on the Financial Statements on page 197. The Directors’ Statement on Internal Control is given on pages 146 and 147.
63. Management Discussions and Analysis
D.1.4 Adopted The Integrated Management Discussion and Analysis is given on pages 34 to 112.
64 Declaration by the Board that the business as a going Concern
D.1.5 Adopted This is given in the “Annual Report of the Board of Directors on the Affairs of the Company” on pages 156 to 165.
65. Summoning an EGM to notify serious loss of capital
D.1.6 N/A Likelihood of such occurrence is remote. However, should the situation arise, an EGM will be called for and shareholders will be notified.
66. Related Party Transactions
D.1.7 Adopted The Directors have instituted an effective and comprehensive system of Internal Controls for identifying, recording and disclosure of related party transactions.
Steps have been taken by the Board to avoid any conflict of interest, that may arise, in transacting with related parties. Further, the Board ensures that no related party benefits from favourable treatment. The pricing applicable to such transactions is based on the assessment of risk and pricing model of the Bank and is comparable with that what is applied to transactions between the Bank and its unrelated customers.
All related party transactions as defined in Sri Lanka Accounting Standard - 24 (LKAS 24) on “Related Party Transactions” is disclosed in note No 60 to the Financial Statements on pages 310 to 315.
D.2. Internal ControlThe Board should have a sound system of internal controls to safeguard shareholders’ investments and the Bank’s assets.67. Annual evaluation
of the risks facing the bank and the effectiveness of the system of internal controls
D.2.1 Adopted The Board is responsible for establishing a sound framework of risk management & internal controls and monitoring its effectiveness on a continuous basis. Through such an effective framework, HNB manages business risks and ensures that the financial information on which business decisions are made and published is reliable, and also ensures that the Bank’s assets are safeguarded against unauthorised use or disposition.

Hatton National Bank PLC128
Corporate Governance Principles
SEC & CA Sri Lanka Code Reference
Adoption Status
HNB’s Extent of Compliance in 2014
68. Internal audit function
D.2.2 Adopted The Bank has its in-house Internal Audit function.
69. Review of the process and effectiveness of risk management and internal controls by the Audit Committee
D.2.3 Adopted The Internal Audit Division of the Bank carries out regular reviews on the internal control system including internal control over financial reporting.
The Audit Committee monitors, reviews and evaluates the effectiveness of the risk management and internal control system including the internal controls over financial reporting.
In the year 2014, the Board of Directors was satisfied with the effectiveness of the system of internal controls of the Bank. Refer the Directors’ Statement on Internal Control on pages 146 and 147 for details.
The External Auditors of the Bank have independently reviewed the report of the Directors referred to above and have issued a report which is given on page 148.
70. Responsibilities of Directors in maintain a sound system of internal Control
D.2.4 Adopted The Directors’ responsibility for maintaining a sound system of internal control is given in the Directors’ Statement on Internal Control on pages 146 and 147.
D.3. Audit CommitteeThe Board should have a formal and transparent arrangements in selecting and applying the accounting policies, financial reporting and internal control principles and maintaining an appropriate relationship with the Bank’s External Auditor.71. Composition
of the Audit Committee
D.3.1 Adopted The following Directors served on the Audit Committee during 2014. Mr Sujeewa Mudalige - ChairmanMs M A R C Cooray (resigned w.e.f. 31st October 2014)Dr L R Karunaratne Ms D S C Jayawardena Mr Rusi S. Captain Mr D A Cabraal (appointed w.e.f. 31st October 2014)
The said Committee met eight (08) times during the year.
The Board Secretary functions as the Secretary to the Audit Committee. The Directors, CEO, COO, CFO, AGM - Risk, Senior Manager - Internal Audit, Compliance Officer and the External Auditor attend meetings on invitation.
72. Review of Objectivity of the External Auditor
D.3.2 Adopted The Audit Committee monitors and reviews the External Auditor’s independence, objectivity and the effectiveness of the audit process taking into account relevant professional and regulatory requirements.
The Committee sets out the policy for the engagement of the External Auditor to provide non-audit services, taking into account :
(a) Relevant regulations with regard to the provision of non-audit services and the guidelines issued by the Central Bank of Sri Lanka
(b) The External Auditor’s skills and experience for providing the particular non-audit service.
(c) The nature of non-audit services, the related fee levels individually and in aggregate relative to the audit firm.
The Audit Committee reviewed the policy for engagement of the external auditor to provide non audit services. The revised policy was approved by the Board in January 2015.
The Audit Committee has the primary responsibility for making recommendations on the appointment, re-appointment or removal of the External Auditor in-line with professional standards and regulatory requirements.
Your Board RoomGovernance Report...
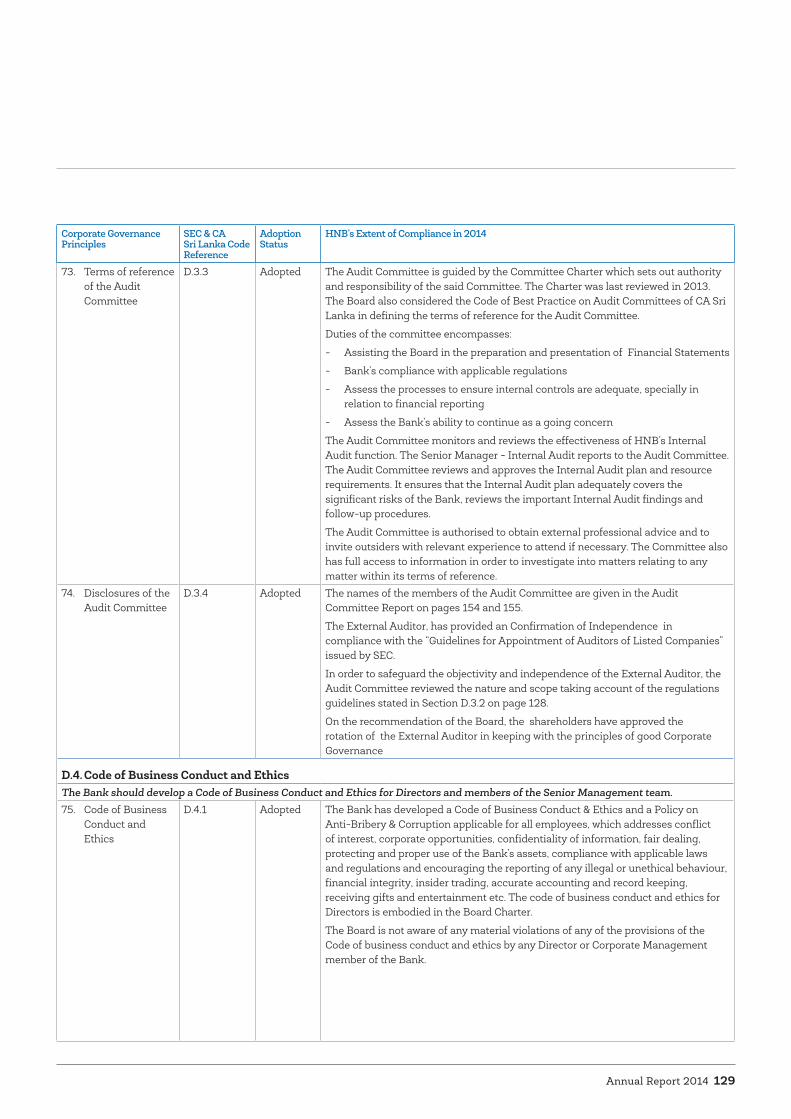
Annual Report 2014 129
Corporate Governance Principles
SEC & CA Sri Lanka Code Reference
Adoption Status
HNB’s Extent of Compliance in 2014
73. Terms of reference of the Audit Committee
D.3.3 Adopted The Audit Committee is guided by the Committee Charter which sets out authority and responsibility of the said Committee. The Charter was last reviewed in 2013. The Board also considered the Code of Best Practice on Audit Committees of CA Sri Lanka in defining the terms of reference for the Audit Committee.
Duties of the committee encompasses:
- Assisting the Board in the preparation and presentation of Financial Statements
- Bank’s compliance with applicable regulations
- Assess the processes to ensure internal controls are adequate, specially in relation to financial reporting
- Assess the Bank’s ability to continue as a going concern
The Audit Committee monitors and reviews the effectiveness of HNB’s Internal Audit function. The Senior Manager - Internal Audit reports to the Audit Committee. The Audit Committee reviews and approves the Internal Audit plan and resource requirements. It ensures that the Internal Audit plan adequately covers the significant risks of the Bank, reviews the important Internal Audit findings and follow-up procedures.
The Audit Committee is authorised to obtain external professional advice and to invite outsiders with relevant experience to attend if necessary. The Committee also has full access to information in order to investigate into matters relating to any matter within its terms of reference.
74. Disclosures of the Audit Committee
D.3.4 Adopted The names of the members of the Audit Committee are given in the Audit Committee Report on pages 154 and 155.
The External Auditor, has provided an Confirmation of Independence in compliance with the “Guidelines for Appointment of Auditors of Listed Companies” issued by SEC.
In order to safeguard the objectivity and independence of the External Auditor, the Audit Committee reviewed the nature and scope taking account of the regulations guidelines stated in Section D.3.2 on page 128.
On the recommendation of the Board, the shareholders have approved the rotation of the External Auditor in keeping with the principles of good Corporate Governance
D.4. Code of Business Conduct and EthicsThe Bank should develop a Code of Business Conduct and Ethics for Directors and members of the Senior Management team.75. Code of Business
Conduct and Ethics
D.4.1 Adopted The Bank has developed a Code of Business Conduct & Ethics and a Policy on Anti-Bribery & Corruption applicable for all employees, which addresses conflict of interest, corporate opportunities, confidentiality of information, fair dealing, protecting and proper use of the Bank’s assets, compliance with applicable laws and regulations and encouraging the reporting of any illegal or unethical behaviour, financial integrity, insider trading, accurate accounting and record keeping, receiving gifts and entertainment etc. The code of business conduct and ethics for Directors is embodied in the Board Charter.
The Board is not aware of any material violations of any of the provisions of the Code of business conduct and ethics by any Director or Corporate Management member of the Bank.
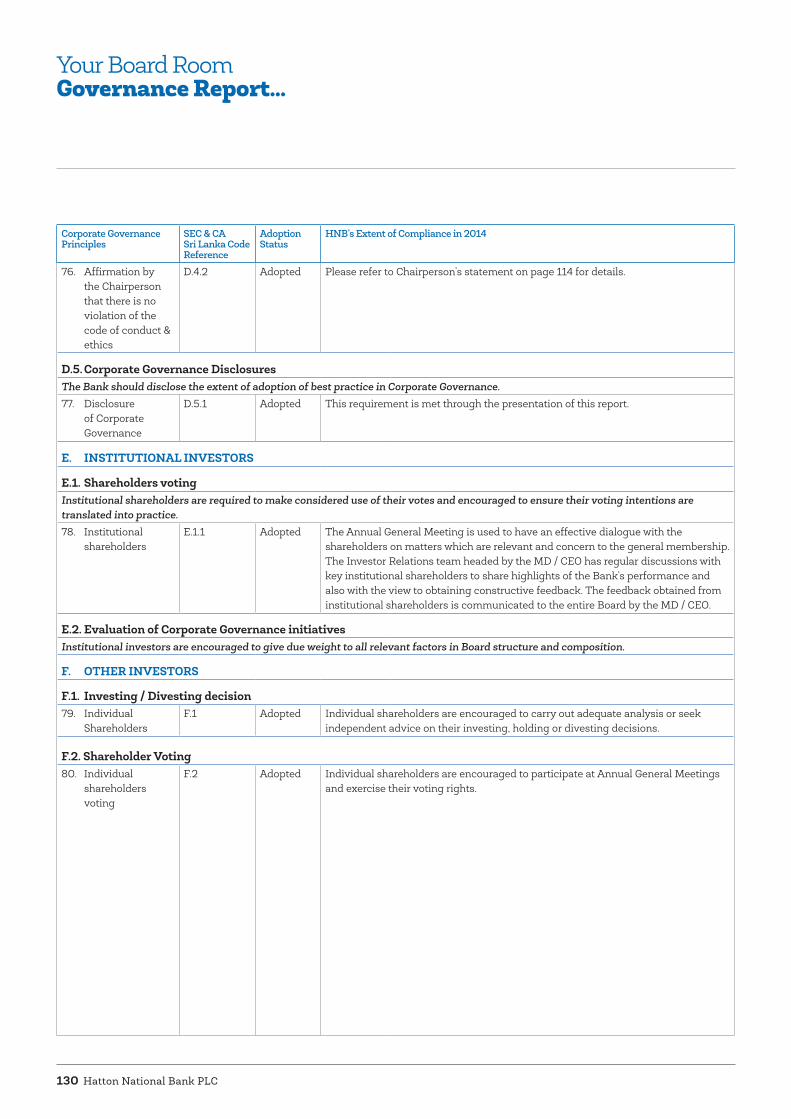
Hatton National Bank PLC130
Corporate Governance Principles
SEC & CA Sri Lanka Code Reference
Adoption Status
HNB’s Extent of Compliance in 2014
76. Affirmation by the Chairperson that there is no violation of the code of conduct & ethics
D.4.2 Adopted Please refer to Chairperson’s statement on page 114 for details.
D.5. Corporate Governance Disclosures The Bank should disclose the extent of adoption of best practice in Corporate Governance. 77. Disclosure
of Corporate Governance
D.5.1 Adopted This requirement is met through the presentation of this report.
E. INSTITUTIONAL INVESTORS
E.1. Shareholders voting Institutional shareholders are required to make considered use of their votes and encouraged to ensure their voting intentions are translated into practice. 78. Institutional
shareholdersE.1.1 Adopted The Annual General Meeting is used to have an effective dialogue with the
shareholders on matters which are relevant and concern to the general membership. The Investor Relations team headed by the MD / CEO has regular discussions with key institutional shareholders to share highlights of the Bank’s performance and also with the view to obtaining constructive feedback. The feedback obtained from institutional shareholders is communicated to the entire Board by the MD / CEO.
E.2. Evaluation of Corporate Governance initiatives Institutional investors are encouraged to give due weight to all relevant factors in Board structure and composition.
F. OTHER INVESTORS
F.1. Investing / Divesting decision 79. Individual
ShareholdersF.1 Adopted Individual shareholders are encouraged to carry out adequate analysis or seek
independent advice on their investing, holding or divesting decisions.
F.2. Shareholder Voting80. Individual
shareholders voting
F.2 Adopted Individual shareholders are encouraged to participate at Annual General Meetings and exercise their voting rights.
Your Board RoomGovernance Report...
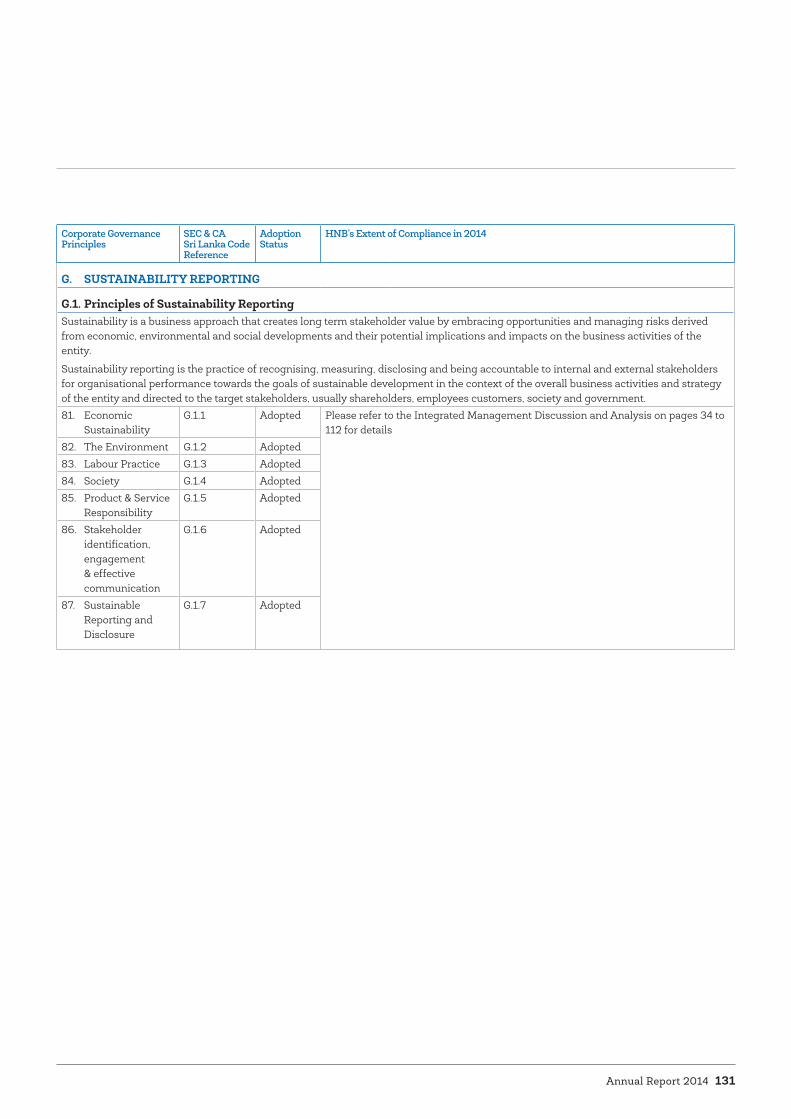
Annual Report 2014 131
Corporate Governance Principles
SEC & CA Sri Lanka Code Reference
Adoption Status
HNB’s Extent of Compliance in 2014
G. SUSTAINABILITY REPORTING
G.1. Principles of Sustainability Reporting Sustainability is a business approach that creates long term stakeholder value by embracing opportunities and managing risks derived from economic, environmental and social developments and their potential implications and impacts on the business activities of the entity.
Sustainability reporting is the practice of recognising, measuring, disclosing and being accountable to internal and external stakeholders for organisational performance towards the goals of sustainable development in the context of the overall business activities and strategy of the entity and directed to the target stakeholders, usually shareholders, employees customers, society and government. 81. Economic
Sustainability G.1.1 Adopted Please refer to the Integrated Management Discussion and Analysis on pages 34 to
112 for details82. The Environment G.1.2 Adopted83. Labour Practice G.1.3 Adopted84. Society G.1.4 Adopted85. Product & Service
Responsibility G.1.5 Adopted
86. Stakeholder identification, engagement & effective communication
G.1.6 Adopted
87. Sustainable Reporting and Disclosure
G.1.7 Adopted
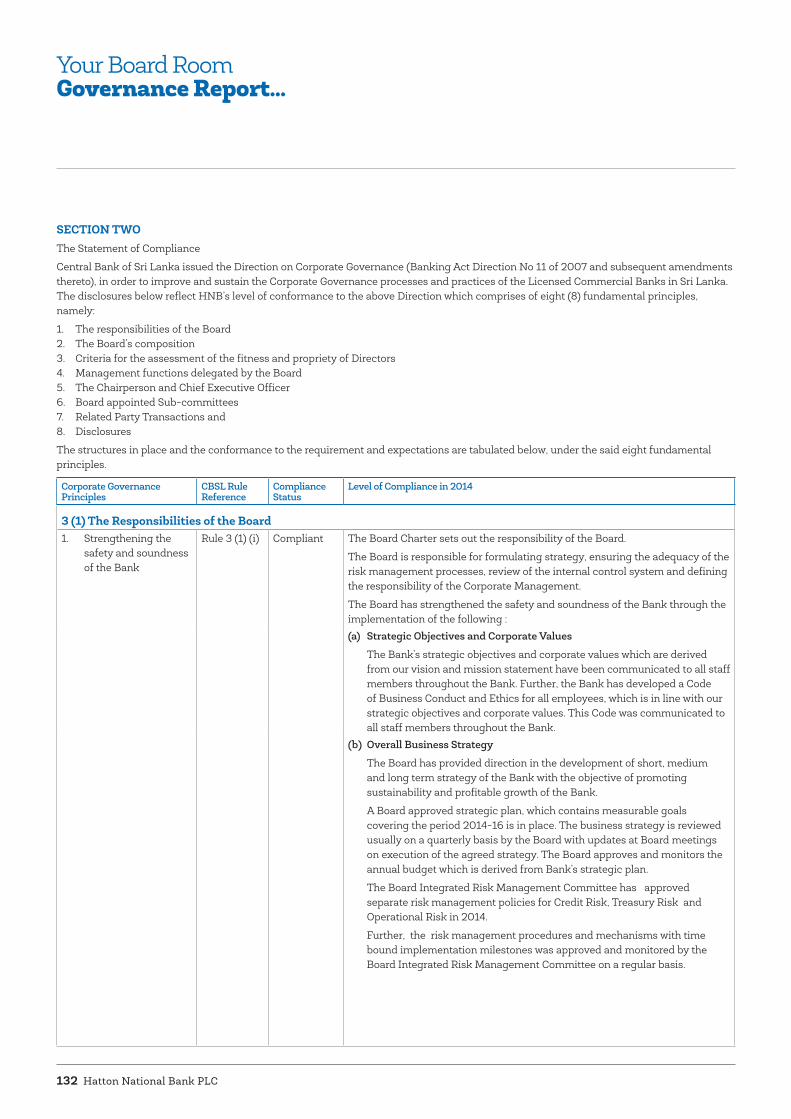
Hatton National Bank PLC132
SECTION TWO The Statement of Compliance
Central Bank of Sri Lanka issued the Direction on Corporate Governance (Banking Act Direction No 11 of 2007 and subsequent amendments thereto), in order to improve and sustain the Corporate Governance processes and practices of the Licensed Commercial Banks in Sri Lanka. The disclosures below reflect HNB’s level of conformance to the above Direction which comprises of eight (8) fundamental principles, namely:
1. The responsibilities of the Board 2. The Board’s composition 3. Criteria for the assessment of the fitness and propriety of Directors 4. Management functions delegated by the Board 5. The Chairperson and Chief Executive Officer 6. Board appointed Sub-committees 7. Related Party Transactions and 8. Disclosures
The structures in place and the conformance to the requirement and expectations are tabulated below, under the said eight fundamental principles.
Corporate Governance Principles
CBSL Rule Reference
Compliance Status
Level of Compliance in 2014
3 (1) The Responsibilities of the Board 1. Strengthening the
safety and soundness of the Bank
Rule 3 (1) (i) Compliant The Board Charter sets out the responsibility of the Board.
The Board is responsible for formulating strategy, ensuring the adequacy of the risk management processes, review of the internal control system and defining the responsibility of the Corporate Management.
The Board has strengthened the safety and soundness of the Bank through the implementation of the following :(a) Strategic Objectives and Corporate Values
The Bank’s strategic objectives and corporate values which are derived from our vision and mission statement have been communicated to all staff members throughout the Bank. Further, the Bank has developed a Code of Business Conduct and Ethics for all employees, which is in line with our strategic objectives and corporate values. This Code was communicated to all staff members throughout the Bank.
(b) Overall Business Strategy
The Board has provided direction in the development of short, medium and long term strategy of the Bank with the objective of promoting sustainability and profitable growth of the Bank.
A Board approved strategic plan, which contains measurable goals covering the period 2014-16 is in place. The business strategy is reviewed usually on a quarterly basis by the Board with updates at Board meetings on execution of the agreed strategy. The Board approves and monitors the annual budget which is derived from Bank’s strategic plan.
The Board Integrated Risk Management Committee has approved separate risk management policies for Credit Risk, Treasury Risk and Operational Risk in 2014.
Further, the risk management procedures and mechanisms with time bound implementation milestones was approved and monitored by the Board Integrated Risk Management Committee on a regular basis.
Your Board RoomGovernance Report...
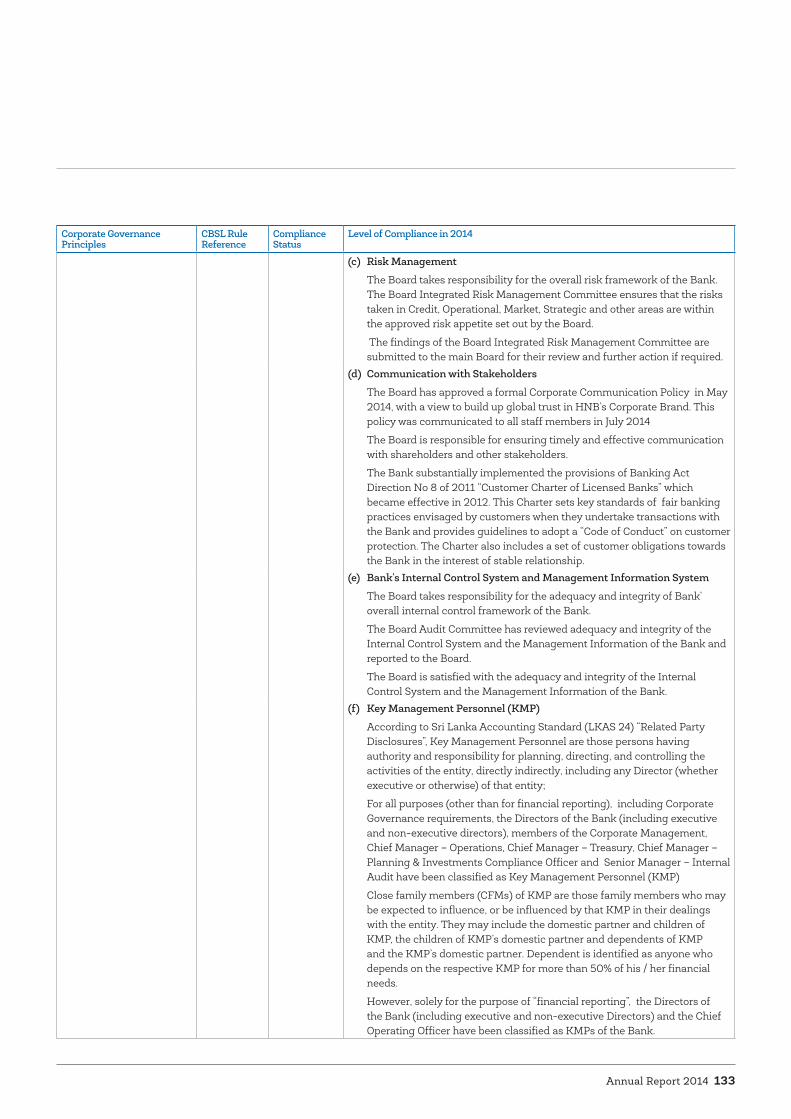
Annual Report 2014 133
Corporate Governance Principles
CBSL Rule Reference
Compliance Status
Level of Compliance in 2014
(c) Risk Management
The Board takes responsibility for the overall risk framework of the Bank. The Board Integrated Risk Management Committee ensures that the risks taken in Credit, Operational, Market, Strategic and other areas are within the approved risk appetite set out by the Board.
The findings of the Board Integrated Risk Management Committee are submitted to the main Board for their review and further action if required.
(d) Communication with Stakeholders
The Board has approved a formal Corporate Communication Policy in May 2014, with a view to build up global trust in HNB’s Corporate Brand. This policy was communicated to all staff members in July 2014
The Board is responsible for ensuring timely and effective communication with shareholders and other stakeholders.
The Bank substantially implemented the provisions of Banking Act Direction No 8 of 2011 “Customer Charter of Licensed Banks” which became effective in 2012. This Charter sets key standards of fair banking practices envisaged by customers when they undertake transactions with the Bank and provides guidelines to adopt a “Code of Conduct” on customer protection. The Charter also includes a set of customer obligations towards the Bank in the interest of stable relationship.
(e) Bank’s Internal Control System and Management Information System
The Board takes responsibility for the adequacy and integrity of Bank’ overall internal control framework of the Bank.
The Board Audit Committee has reviewed adequacy and integrity of the Internal Control System and the Management Information of the Bank and reported to the Board.
The Board is satisfied with the adequacy and integrity of the Internal Control System and the Management Information of the Bank.
(f) Key Management Personnel (KMP)
According to Sri Lanka Accounting Standard (LKAS 24) “Related Party Disclosures”, Key Management Personnel are those persons having authority and responsibility for planning, directing, and controlling the activities of the entity, directly indirectly, including any Director (whether executive or otherwise) of that entity;
For all purposes (other than for financial reporting), including Corporate Governance requirements, the Directors of the Bank (including executive and non-executive directors), members of the Corporate Management, Chief Manager – Operations, Chief Manager – Treasury, Chief Manager – Planning & Investments Compliance Officer and Senior Manager – Internal Audit have been classified as Key Management Personnel (KMP)
Close family members (CFMs) of KMP are those family members who may be expected to influence, or be influenced by that KMP in their dealings with the entity. They may include the domestic partner and children of KMP, the children of KMP’s domestic partner and dependents of KMP and the KMP’s domestic partner. Dependent is identified as anyone who depends on the respective KMP for more than 50% of his / her financial needs.
However, solely for the purpose of “financial reporting”, the Directors of the Bank (including executive and non-executive Directors) and the Chief Operating Officer have been classified as KMPs of the Bank.
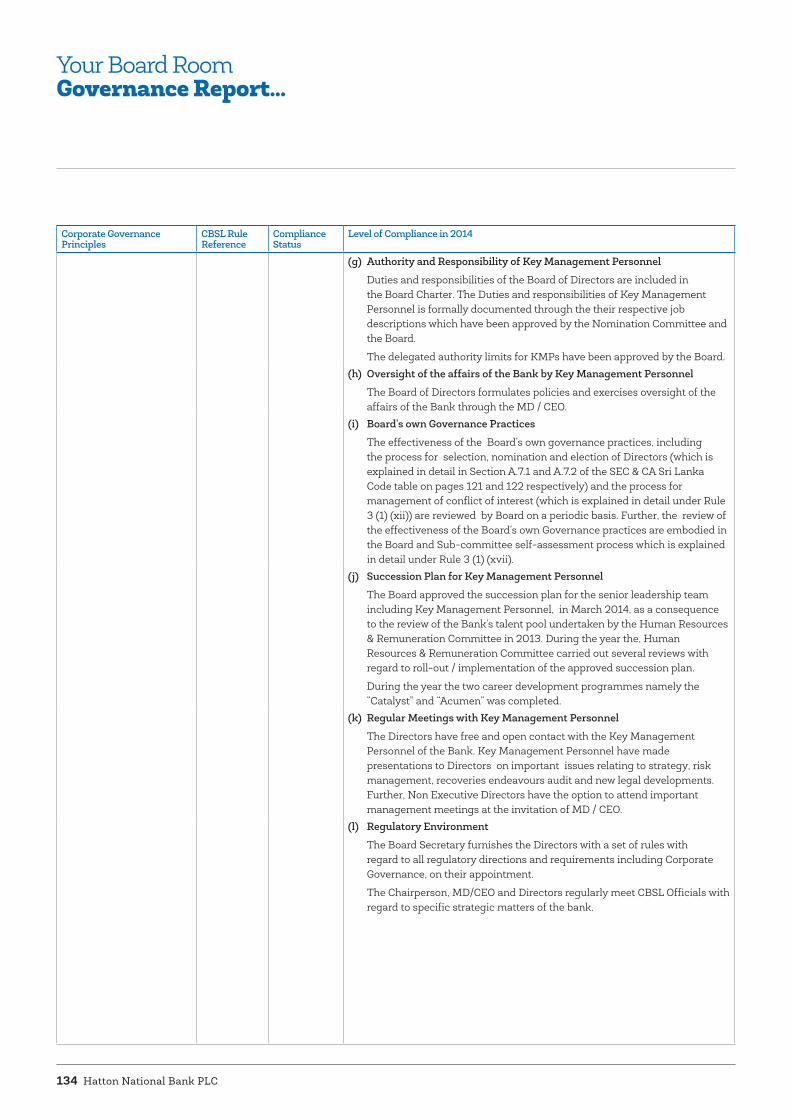
Hatton National Bank PLC134
Corporate Governance Principles
CBSL Rule Reference
Compliance Status
Level of Compliance in 2014
(g) Authority and Responsibility of Key Management Personnel
Duties and responsibilities of the Board of Directors are included in the Board Charter. The Duties and responsibilities of Key Management Personnel is formally documented through the their respective job descriptions which have been approved by the Nomination Committee and the Board.
The delegated authority limits for KMPs have been approved by the Board. (h) Oversight of the affairs of the Bank by Key Management Personnel
The Board of Directors formulates policies and exercises oversight of the affairs of the Bank through the MD / CEO.
(i) Board’s own Governance Practices
The effectiveness of the Board’s own governance practices, including the process for selection, nomination and election of Directors (which is explained in detail in Section A.7.1 and A.7.2 of the SEC & CA Sri Lanka Code table on pages 121 and 122 respectively) and the process for management of conflict of interest (which is explained in detail under Rule 3 (1) (xii)) are reviewed by Board on a periodic basis. Further, the review of the effectiveness of the Board’s own Governance practices are embodied in the Board and Sub-committee self-assessment process which is explained in detail under Rule 3 (1) (xvii).
(j) Succession Plan for Key Management Personnel
The Board approved the succession plan for the senior leadership team including Key Management Personnel, in March 2014, as a consequence to the review of the Bank’s talent pool undertaken by the Human Resources & Remuneration Committee in 2013. During the year the, Human Resources & Remuneration Committee carried out several reviews with regard to roll-out / implementation of the approved succession plan.
During the year the two career development programmes namely the “Catalyst” and “Acumen” was completed.
(k) Regular Meetings with Key Management Personnel
The Directors have free and open contact with the Key Management Personnel of the Bank. Key Management Personnel have made presentations to Directors on important issues relating to strategy, risk management, recoveries endeavours audit and new legal developments. Further, Non Executive Directors have the option to attend important management meetings at the invitation of MD / CEO.
(l) Regulatory Environment
The Board Secretary furnishes the Directors with a set of rules with regard to all regulatory directions and requirements including Corporate Governance, on their appointment.
The Chairperson, MD/CEO and Directors regularly meet CBSL Officials with regard to specific strategic matters of the bank.
Your Board RoomGovernance Report...

Annual Report 2014 135
Corporate Governance Principles
CBSL Rule Reference
Compliance Status
Level of Compliance in 2014
(m) Hiring and Oversight of the External Auditor
Article 53 (iv) of Bank’s Articles of Association states the general procedure for appointment of the External Auditor by the bank.
The Audit Committee has the primary responsibility for making recommendations to the Board on the appointment, re-appointment or removal of the External Auditor in-line with professional standards and regulatory requirements.
On the recommendation of the Board, the shareholders have approved the rotation of the External Auditor in keeping with the principles of good Corporate Governance at the last AGM.
The Audit Committee sets out the policy for the engagement of the External Auditor to provide non-audit services. The Audit Committee reviewed the policy for engagement of the external auditor during the year under review. The revised policy was approved by the Board in January 2015.
2. Chairperson and CEO Rule 3 (1) (ii) Compliant The Board has appointed the Chairperson and the Chief Executive Officer. The roles of the Chairperson and the Chief Executive are separate and are in line with Rule 3 (5).
3. Board Meetings Rule 3 (1) (iii)
Compliant The Board usually meets on monthly intervals, but meets more frequently whenever it is necessary.
The Board met fifteen (15) times during the year.
The attendance at Board meetings held in 2014 is set out on page 145.4. Board’s procedure for
inclusion of proposals by all Directors in the agenda
Rule 3 (1) (iv)
Compliant The Board approved procedure is in place to enable all directors to include matters and proposals in the agenda on promotion of business and management of risk and other areas relevant to the progress of the Bank for regular board meetings.
5. Notice of Meetings Rule 3 (1) (v) Compliant The Directors are given adequate time and usually at least seven (7) days of notice is given for regular Board meetings. For all other meetings a reasonable notice period is given.
6. Non attendance of Directors
Rule 3 (1) (vi)
Compliant All Directors have attended at least two thirds (2/3) of the meetings held during 2014. Further no Director has been absent from three consecutive regular Board meetings during 2014.
7. Board Secretary Rule 3 (1) (vii) Rule 3 (1) (viii)
Compliant The Board has appointed a Company Secretary who is an Attorney at Law by profession and satisfies the provisions of section 43 of the Banking Act No.30 of 1988.
All Directors have access to the Board Secretary. The Board Secretary had provided the Board with support and advice relating to corporate governance matters, Board procedures and applicable rules and regulations during the year.
8. Minutes of the Meetings
Rule 3 (1) (ix) Rule 3 (1) (x)
Compliant The Minutes of the Board meetings are maintained in sufficient detail by the Board Secretary, and is open for inspection by any Director.
9. Independent professional advice
Rule 3 (1) (xi)
Compliant A Board approved procedure has been put in place for Directors to seek independent professional advice, in furtherance of their duties, at the Bank’s expense. This will be coordinated through the Board Secretary, as and when it is requested.

Hatton National Bank PLC136
Corporate Governance Principles
CBSL Rule Reference
Compliance Status
Level of Compliance in 2014
10. Conflicts of Interest Rule 3 (1) (xii)
Compliant Article 40 of Articles of Association addresses the provision with regard to this requirement. The Board is conscious of its obligations to ensure that Directors avoid conflicts of interest (both real and apparent) between their duty to HNB and their other interests. The Board has taken steps to ensure that conflicts and potential conflicts of interest of Directors are disclosed to the Board. Any Director with a material personal interest in a matter being considered by the Board, declares his / her interest and unless the Board resolves otherwise, he / she does not participate in discussions or vote on that specific matter.
11. Formal schedule of matters
Rule 3(1) (xiii)
Compliant The Board reserves for itself a formal schedule of matters on which it takes the ultimate decision.
12. Situation of Insolvency
Rule 3(1) (xiv)
N/A This situation has not arisen during the year.
13. Capital adequacy Rule 3 (1) (xv)
Compliant The Bank has been fully compliant with the capital adequacy requirements issued by the Monetary Board during 2014.
14. Corporate Governance Report
Rule 3 (1) (xvi)
Compliant This requirement is met through the presentation of this report.
15. Annual self assessment by the Directors
Rule 3 (1) (xvii)
Compliant Individual Directors carried out an annual self-assessment of their own performance and the effectiveness of the Board as a whole. The summary findings together with areas for future improvement has been tabled at the Board meeting for discussion and endorsement by the full Board in January 2015 .
3 (2) The Board’s Composition16. Number of Directors Rule 3 (2) (i) Compliant The Board comprised of ten (10) Directors as 31st December 2014 (nine (09)
Directors as at 31st December 2013).17. Period of service of a
Director Rule 3 (2) (ii) Compliant The total period of service of all Non Executive Directors does not exceed nine
(9) years.18. Appointment of
an employee as a Director
Rule 3 (2) (iii)
Compliant Mr Jonathan Alles (MD / CEO) is the only employee appointed to the Board as at date, as such the number of Executive Directors does not exceed one third (1/3) of the number of Directors of the Board throughout the year.
19. Independent Non Executive Director
Rule 3 (2) (iv)
Compliant The Board includes four (4) Independent Non Executive Directors as per the definition of this Direction, which is more than one third (1/3) of the Board. The Board considers Non Executive Directors’ independence on an annual basis, based on the self declaration and as part of each Director’s self assessment.
Ms M A R C Cooray was an Independent Director up to 30th October 2014. On 30th October Ms Cooray was nominated as a Director of Prime Grameen Micro Finance Limited, a subsidiary company of the Bank. As a result she is considered to be a Non Independent Director of the Bank from the date of appointment to the Board of the subsidiary company, as per the provisions set out in the Direction on Cooperate Governance for Licensed Commercial Banks issued by the CBSL, The change in status of Ms Cooray also resulted in the appointment of Dr W W Gamage as the Senior Independent Director with effect from 1st November 2014.
20. Alternative Director Rule 3 (2) (v) Compliant During the year all alternate directors appointed to represent Independent Non Executive directors were independent.
Your Board RoomGovernance Report...Your Board RoomGovernance Report...

Annual Report 2014 137
Corporate Governance Principles
CBSL Rule Reference
Compliance Status
Level of Compliance in 2014
21. Credibility, skills and experience of Non Executive Directors
Rule 3 (2) (vi)
Compliant The Board consists of professionals in the fields of Banking, Accounting, Management, Economics, Engineering, Marketing and Business. All Directors possess the skills, experience and knowledge complemented with a high sense of integrity and independent judgment. The Board gives leadership in setting the strategic direction and establishing a sound control framework for the successful functioning of the Bank. The Board’s composition reflects sound balance of independence and anchors shareholder commitment.
Please refer pages 24 to 27 for the profiles of the Non Executive Directors.22. Presence of Non
Executive Directors in Board Meetings
Rule 3 (2) (vii)
Compliant At all Board meetings convened during the year, more than one half (1/2) of the Directors present were Non Executive Directors.
23. Details of Directors Rule 3 (2) (viii)
Compliant Please refer page 145 for the details of the Directors and their categories.
24. Appointment of new Directors
Rule 3 (2) (ix)
Compliant The Nomination Committee assesses the suitability of the prospective nominees to the Board and recommends persons found to be “fit and proper” for consideration of the entire Board. Upon completion of this process, names are referred to the Director of the Bank Supervision Department of the Central Bank of Sri Lanka for approval as a “fit and proper” person, prior to the appointment.
Mr D A Cabraal was appointed as an Independent Non Executive Director w.e.f. 01st April 2014.
The profile of Mr Cabraal is given on page 27.25. Appointment to fill a
casual vacancyRule 3 (2) (x) N/A As per Article 36 of Bank’s Articles of Association all members elected to fill
casual vacancies of the Board shall hold office till the next AGM and then be eligible for re-election.
This situation has not arisen during the year.
26. Resignation / removal of a Director
Rule 3 (2) (xi)
N/A Resignations of Directors and the reasons are informed to CBSL and shareholders as per CSE requirements.
No Directors have resigned or have been removed during the year.
27. Appointments to other Banks
Rule 3 (2) (xii)
Compliant None of the Directors are either employees or Directors of other Banks.
3 (3) Criteria to assess the fitness and propriety of Directors.28. Directors over 70
Years of age Rule 3 (3) (i) Compliant All Directors are below the age of Seventy (70) years as at 31st December 2014.
29. Holding of office in more than 20 companies
Rule 3 (3) (ii) Compliant No Director holds office as a Director in more than 20 companies.

Hatton National Bank PLC138
Corporate Governance Principles
CBSL Rule Reference
Compliance Status
Level of Compliance in 2014
3 (4) The Management function delegated by the Board30. Delegation of work to
the managementRule 3 (4) (i) Compliant As per Article 38(iii) of the Articles of Association of the Bank the Board
may delegate to, entrust to and confer upon a committee of Directors or to a Director, or to any officer/employee of the company any of the powers exercisable by which it is permitted to delegate.
The Board annually evaluates the delegated authority process to ensure that the delegation of work does not materially affect the ability of the Board as a whole in discharging its’ functions.
The financial authority manual and the credit delegation authority are reviewed annually by the Board as part of its delegation of authority to the Management through the MD / CEO.
31. Extent of Delegation Rule 3 (4) (ii) Compliant Please refer comments above.32. Evaluation of the
delegated processRule 3 (4) (iii)
Compliant Please refer comments on rule 3(4)(i) above.
3 (5) The Chairperson and Chief Executive Officer33. Division of
Responsibilities of the Chairperson and MD / CEO
Rule 3 (5) (i) Compliant The roles of the Chairperson and Chief Executive Officer are separate.
34. Chairperson preferably be an Independent Director and if not designate a Senior Director
Rule 3 (5) (ii) Compliant Dr Ranee Jayamaha is considered non independent as she holds office as the Chairperson of two (2) subsidiary companies of the Bank. However, her non independent status was countered by the existence of a Senior Director designated by the Board.
The following Directors functioned as Senior Independent Director during 2014,
Ms M A R C Cooray (up to 30th October 2014)
Dr W W Gamage (appointed w.e.f. 01st November 2014)
A Board approved terms of reference for the Senior Director is in place.35. Relationship between
Chairperson and CEO and other Directors
Rule 3 (5) (iii)
Compliant As declared by the Directors, there are no material relationship between the Chairperson / CEO and / or other members of the Board which will impair their respective roles.
36. Role of the Chairperson and CEO
Rule 3 (5) (iv) to Rule 3 (5)(xi)
Compliant The Chairperson’s main responsibility is to lead, direct and manage the Board to ensure that it operates effectively and fully discharges its legal and regulatory responsibilities. The MD / CEO is responsible for the day-to-day operations of the Bank.
Please refer Section A.2 and A.3 of the SEC & CA Sri Lanka Code table on page 118 and 119 respectively for detailed information.
3 (6) Board appointed Committees37. Board appointed four
Sub - committeesRule 3 (6) (i) Compliant There are four (4) Board appointed Sub-committees including the Audit
Committee, Board Integrated Risk Management Committee, Human Resources & Remuneration Committee and Nomination Committee, which are prescribed by the CBSL Direction (mandatory Sub-Committees).
In addition the Bank has established five (5) committees to assist the Bank’s Operations/ decision making process. These committees include the Credit / Asset & Liability Committee, Procurement Committee, Committee for Disposal of Asset / Investment Properties, Strategic & Investment Review Committee and Branch Rationalisation Committee.
Meeting minutes and recommendations of the Sub - Committees are submitted to the Board by the respective secretaries of the Sub-Committees.
Your Board RoomGovernance Report...

Annual Report 2014 139
Corporate Governance Principles
CBSL Rule Reference
Compliance Status
Level of Compliance in 2014
38. Audit Committee38.01 Chairman of the
Audit CommitteeRule 3 (6) (ii) (a)
Compliant Mr Sujeewa Mudalige (Independent Non Executive Director) is the Chairman of the Audit Committee. Mr Mudalige is a fellow member of the Institute of Chartered Accountants of Sri Lanka (CA Sri Lanka), the Chartered Institute of Management Accountants (CIMA - UK), Fellow of the Association of Chartered Certified Accountants (ACCA - UK) and Fellow of the Certified Public Accountants (CPA - Australia) He is a past president of the Institute of Chartered Accountants of Sri Lanka (CA Sri Lanka).
38.02 Composition of the Audit Committee
Rule 3 (6) (ii) (b)
Compliant Majority of the members of the Audit Committee are Independent Non Executive Directors.
38.03 Recommendation to the Board
Rule 3 (6) (ii) (c)
Compliant The Audit Committee has the primary responsibility for making recommendations to the Board on the, appointment, re-appointment or removal of the External Auditor in-line with professional standards and regulatory requirements. The committee also evaluates and makes recommendations to Board with regard to the audit fee.
On the recommendation of the Board, the shareholders have approved the rotation of the External Auditor in keeping with the principles of good Corporate Governance at the last AGM.
The Committee also reviews accounting policies to determine the most appropriate accounting policies after considering all options available
38.04 Monitoring and review of the External Auditor’s independence, objectivity and the effectiveness
Rule 3 (6) (ii) (d)
Compliant The Audit Committee monitors and reviews the External Auditor’s independence, objectivity and the effectiveness of the audit process taking into account relevant professional and regulatory requirements.
38.05 Policy for the engagement of the External Auditor to provide non-audit services
Rule 3 (6) (ii) (e)
The Committee sets out the policy for the engagement of the External Auditor to provide non-audit services.
The Audit Committee reviewed the policy for engagement of the external auditor to provide non audit services. The revised policy was approved by the Board in January 2015.
Please refer Section D.3.2 of the SEC & CA Sri Lanka Code table on pages 128 for further details
38.06 Nature and Scope of External Audit
Rule 3 (6) (ii) (f)
Compliant The Committee met with the External Auditor three (3) times during the year to discuss their audit approach and procedures including matters relating to the scope of the audit and auditor’s independence.
38.07 Review of Financial Information of the Bank
Rule 3 (6) (ii) (g)
Compliant The Audit Committee has reviewed the Bank’s Annual Report and quarterly Financial Statements before the submission to the Board for approval.
38.08 Meeting with External Auditors
Rule 3 (6) (ii) (h) and (l)
Compliant The Committee met the External Auditor twice without the presence of the Executive Director and Corporate Management.
38.09 External Auditor’s Management Letter
Rule 3 (6) (ii) (i)
Compliant During the year, the Audit Committee reviewed the year end Management Letter for 2013, and the responses thereto with the External Auditor and the Corporate Management team.
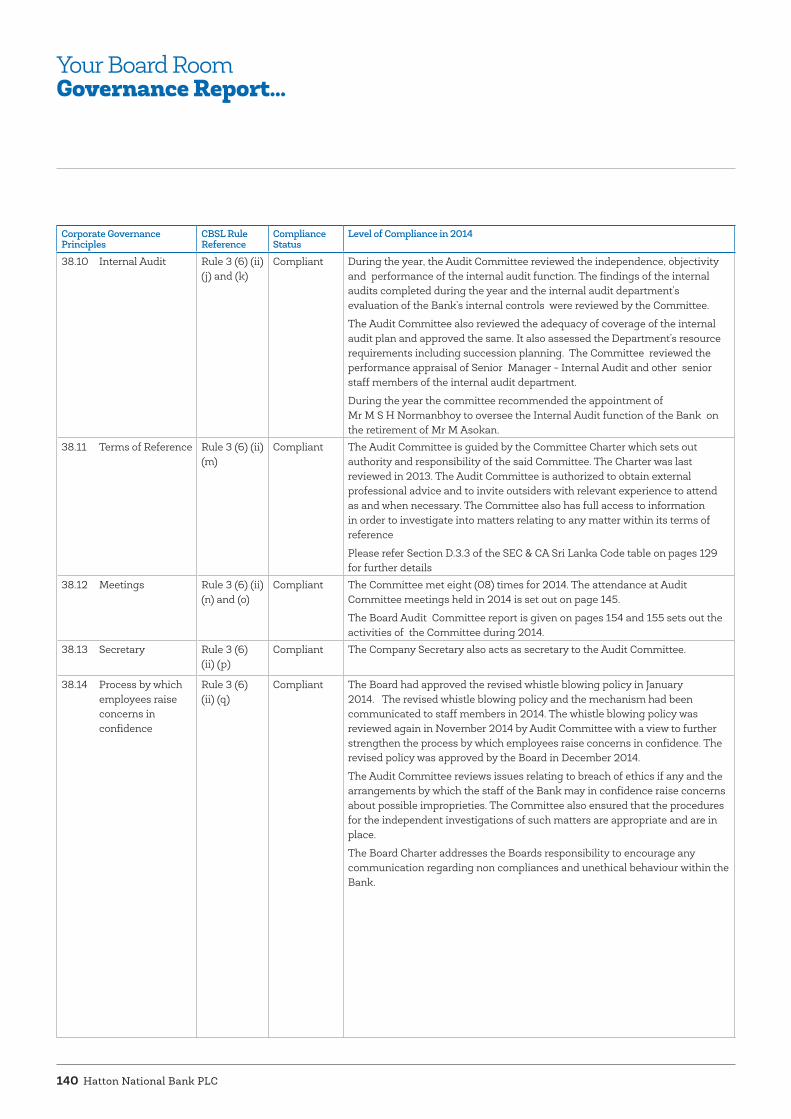
Hatton National Bank PLC140
Corporate Governance Principles
CBSL Rule Reference
Compliance Status
Level of Compliance in 2014
38.10 Internal Audit Rule 3 (6) (ii) (j) and (k)
Compliant During the year, the Audit Committee reviewed the independence, objectivity and performance of the internal audit function. The findings of the internal audits completed during the year and the internal audit department’s evaluation of the Bank’s internal controls were reviewed by the Committee.
The Audit Committee also reviewed the adequacy of coverage of the internal audit plan and approved the same. It also assessed the Department’s resource requirements including succession planning. The Committee reviewed the performance appraisal of Senior Manager - Internal Audit and other senior staff members of the internal audit department.
During the year the committee recommended the appointment of Mr M S H Normanbhoy to oversee the Internal Audit function of the Bank on the retirement of Mr M Asokan.
38.11 Terms of Reference Rule 3 (6) (ii) (m)
Compliant The Audit Committee is guided by the Committee Charter which sets out authority and responsibility of the said Committee. The Charter was last reviewed in 2013. The Audit Committee is authorized to obtain external professional advice and to invite outsiders with relevant experience to attend as and when necessary. The Committee also has full access to information in order to investigate into matters relating to any matter within its terms of reference
Please refer Section D.3.3 of the SEC & CA Sri Lanka Code table on pages 129 for further details
38.12 Meetings Rule 3 (6) (ii) (n) and (o)
Compliant The Committee met eight (08) times for 2014. The attendance at Audit Committee meetings held in 2014 is set out on page 145.
The Board Audit Committee report is given on pages 154 and 155 sets out the activities of the Committee during 2014.
38.13 Secretary Rule 3 (6) (ii) (p)
Compliant The Company Secretary also acts as secretary to the Audit Committee.
38.14 Process by which employees raise concerns in confidence
Rule 3 (6) (ii) (q)
Compliant The Board had approved the revised whistle blowing policy in January 2014. The revised whistle blowing policy and the mechanism had been communicated to staff members in 2014. The whistle blowing policy was reviewed again in November 2014 by Audit Committee with a view to further strengthen the process by which employees raise concerns in confidence. The revised policy was approved by the Board in December 2014.
The Audit Committee reviews issues relating to breach of ethics if any and the arrangements by which the staff of the Bank may in confidence raise concerns about possible improprieties. The Committee also ensured that the procedures for the independent investigations of such matters are appropriate and are in place.
The Board Charter addresses the Boards responsibility to encourage any communication regarding non compliances and unethical behaviour within the Bank.
Your Board RoomGovernance Report...

Annual Report 2014 141
Corporate Governance Principles
CBSL Rule Reference
Compliance Status
Level of Compliance in 2014
39. Human resources / Remuneration Committee
Rule 3 (6) (iii)
Compliant The Human Resources & Remuneration Committee is chaired by an Independent Non-Executive Director and has four (4) other Non-Executive Directors as its members, two of whom are also Independent.
The Committee met eight (8) times during the year.
The Committee reviews all significant human resource policies and initiatives, salary structures, promotions and terms and conditions relating to staff at senior management level with information and recommendations from the MD/CEO and AGM – HR.
A Remuneration Policy for the Board of Directors was revised in March 2014.
The goals and targets of the Board of Directors have been clearly set out and evaluated at the end of the year.
The goals and targets for the MD/CEO and the senior leadership team are documented under the Balance Score Card system.
The committee deliberates upon and recommends to the Board of Directors the remuneration packages, annual increments and bonuses of the MD /CEO, COO, members of the Corporate Management and senior management staff, having evaluated their performance against the set goals and targets.
The MD / CEO attends Human resources & Remuneration Committee by invitation. The MD /CEO is not present at the time his performance is being discussed.
Please refer Section B.1.1 and A.11 of the SEC & CA Sri Lanka Code table on pages 124 and 123 respectively for further details
40. Nomination Committee
Rule 3 (6) (iv) (a) to (e)
Compliant The Committee considers and recommends the re-election of the Directors to the Board. The Committee also set criteria of the succession of the CEO. A formal procedure to appoint MD / CEO, KMPs and Directors is in place.
During the year the Nomination Committee reviewed the additional/ new expertise and succession arrangements for the Senior Management Cadre in line with Bank’s strategic objectives and specific recommendations were made to the Board to fill the gaps with a time bound plan.
Job descriptions of the Senior Management Team of the Bank was tabled at the Nomination Committee meeting in October and a detailed review of the roles and responsibilities of each was undertaken including a review of their qualifications, experience and skill set required to discharge their duties.
Each director carries out an assessment of “fitness and propriety” to serve as a Director of the Bank. These declarations reviewed by the Nomination Committee prior to onward transmission to the Director Bank Supervision of the Central Bank of Sri Lanka.
The Terms of Reference of the was reviewed by the in January 2014 and suitable amendments were introduced.
Please refer Section A.7.1 and A.7.2 of the SEC & CA Sri Lanka Code table on pages 121 and 122 respectively for further details.
41. Chairman of the Nomination Committee
Rule 3 (6) (iv) (f)
Compliant up to 30.10.2014Non Compliant from 31.10.2014 -18.01.2015Compliant from 19.01.2015
The Nomination Committee was chaired by an independent director, Dr. Rohan Karunaratne until 30th October 2014 and constituted with a majority of Independent Directors. However, the composition was changed with effect from 31st October 2014 with the restructuring of the Board Sub-committees. Dr W W Gamage was to take over as the Chairman of the newly constituted nomination committee but since his availability was uncertain for a limited period, Dr Ranee Jayamaha was requested to be the Chairperson and was appointed to the post as an interim measure. On 19th January Dr W W Gamage was appointed as the Chairman of the Committee.
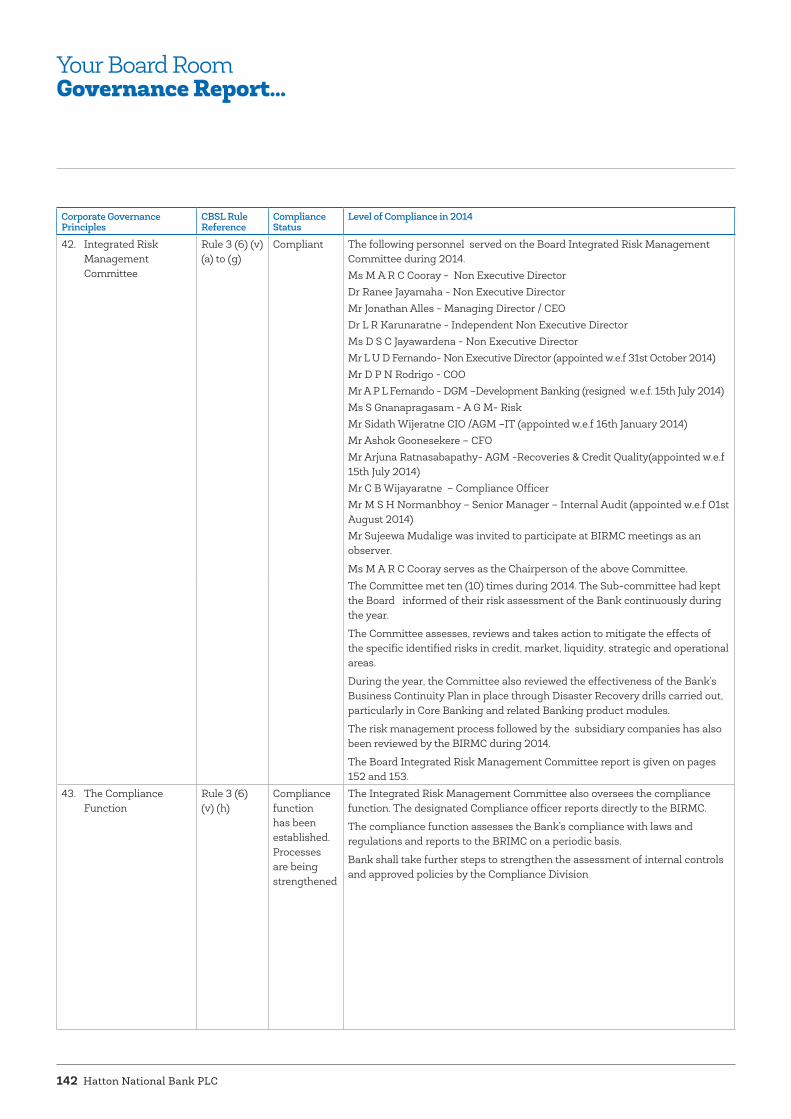
Hatton National Bank PLC142
Corporate Governance Principles
CBSL Rule Reference
Compliance Status
Level of Compliance in 2014
42. Integrated Risk Management Committee
Rule 3 (6) (v) (a) to (g)
Compliant The following personnel served on the Board Integrated Risk Management Committee during 2014.Ms M A R C Cooray - Non Executive DirectorDr Ranee Jayamaha - Non Executive DirectorMr Jonathan Alles - Managing Director / CEO Dr L R Karunaratne - Independent Non Executive Director Ms D S C Jayawardena - Non Executive Director Mr L U D Fernando- Non Executive Director (appointed w.e.f 31st October 2014)Mr D P N Rodrigo - COOMr A P L Fernando - DGM –Development Banking (resigned w.e.f. 15th July 2014)Ms S Gnanapragasam - A G M- Risk Mr Sidath Wijeratne CIO /AGM –IT (appointed w.e.f 16th January 2014)Mr Ashok Goonesekere – CFOMr Arjuna Ratnasabapathy- AGM -Recoveries & Credit Quality(appointed w.e.f 15th July 2014) Mr C B Wijayaratne – Compliance OfficerMr M S H Normanbhoy – Senior Manager – Internal Audit (appointed w.e.f 01st August 2014)Mr Sujeewa Mudalige was invited to participate at BIRMC meetings as an observer.
Ms M A R C Cooray serves as the Chairperson of the above Committee.The Committee met ten (10) times during 2014. The Sub-committee had kept the Board informed of their risk assessment of the Bank continuously during the year.
The Committee assesses, reviews and takes action to mitigate the effects of the specific identified risks in credit, market, liquidity, strategic and operational areas.
During the year, the Committee also reviewed the effectiveness of the Bank’s Business Continuity Plan in place through Disaster Recovery drills carried out, particularly in Core Banking and related Banking product modules.
The risk management process followed by the subsidiary companies has also been reviewed by the BIRMC during 2014.
The Board Integrated Risk Management Committee report is given on pages 152 and 153.
43. The Compliance Function
Rule 3 (6) (v) (h)
Compliance function has been established. Processes are being strengthened
The Integrated Risk Management Committee also oversees the compliance function. The designated Compliance officer reports directly to the BIRMC.
The compliance function assesses the Bank’s compliance with laws and regulations and reports to the BRIMC on a periodic basis.
Bank shall take further steps to strengthen the assessment of internal controls and approved policies by the Compliance Division
Your Board RoomGovernance Report...

Annual Report 2014 143
Corporate Governance Principles
CBSL Rule Reference
Compliance Status
Level of Compliance in 2014
3 (7) Related Party Transactions44. Avoiding conflicts
of interest in related party transaction and favourable treatment
Rule 3 (7) (i) Rule 3 (7) (ii) Rule 3 (7) (iii)
Compliant level to be strengthened
A formal policy had been formulated and approved by the Board in February 2014, to enhance the transparency of Related Party Transactions.
Steps have been taken by the Board to avoid any conflicts of interest, that may arise, in transacting with related parties as per the definition of this Direction and Sri Lanka Accounting Standard - 24 (LKAS 24) on “Related Party Transactions”. Further, the Board ensures that no related party benefits from favourable treatment. The pricing applicable to such transactions is based on the assessment of risk and pricing model of the Bank and is comparable with that what is applied to transactions between the Bank and its unrelated customers.
The net accommodation granted to each category of related parties as a percentage of the Bank’s regulatory capital is given under Rule 3 (8) (ii) (e).
The Bank is further proposing to improve its core banking system to strengthen the capturing and extraction of data with regard to government related entities..
45. Accommodation to Directors and / or their close relatives
Rule 3 (7) (iv)
Compliant All accommodations to Directors and / or their close relatives are approved by at least 2/3 of the Board. The Director concerned is not a part of the approval process. All accommodations to Directors and / or their close relatives are secured by security which is prescribed by the Monetary Board.
46. Appointment of Director subsequent to approval of facilities to him / her
Rule 3 (7) (v) Compliant The Bank is compliant with this rule for 2014.
47. Accommodation to employees
Rule 3 (7) (vi) Rule 3 (7) (vii)
Compliant Accommodation has not been given to employees on a favourable basis other than the general schemes applicable to all employees of the Bank.
3 (8) Disclosures48. Financial reporting,
statutory and regulatory reporting
Rule 3 (8) (i) Compliant The Financial Statements for the year ended 31st December 2014, are in conformity with all rules and regulatory requirements and for the quarters then ended have been published in the newspapers in all three languages.
49. Minimum disclosure in the Annual Report
Rule 3 (8) (ii) Compliant (a) Compliance with applicable accounting standards and regulatory requirements has been reported under the “Directors’ Responsibility for Financial Reporting” on page 196, the “CEO’s and CFO’s Responsibility Statement” on page 195 and note No 2.1 (Statement of Compliance) to the Financial Statements on page 206.
(b) Directors’ report on the effectiveness of the internal control system over financial reporting is given under the Directors’ Statement on Internal Control on pages 146 and 147.
(c) The Assurance Report issued by the External Auditor on the Internal Control over Financial Reporting based on “SLSAE 3050 – Assurance Reports for Banks on Directors’ Statement on Internal Controls” issued by the Institute of Chartered Accountants of Sri Lanka (CA Sri Lanka) is given on page 148. The recommendations made by the Auditors where relevant, will be dealt with in 2015.
(d) Details of the Directors are given on pages 22 to 27 Directors’ transactions with the Bank have been disclosed in note No 60 to the Financial Statements on pages 310 to 315. The remuneration paid to the Board of Directors is disclosed in aggregate in note No. 18 to the Financial Statements on page 258.
Hatton National Bank PLC144
Corporate Governance Principles
CBSL Rule Reference
Compliance Status
Level of Compliance in 2014
(e) The net accommodation granted to each category of related parties is given below as a percentage of the Bank’s regulatory capital.
Category of Related Party Transactions (Rs Mn) %- Key Management Personnel (KMP) and their close family Members 271 0.47- Subsidiaries 200 0.35- Joint Venture 3,330 5.78- Entities controlled by KMPs and their close Family Members 14,048 24.37- Government of Sri Lanka/ Entities Controlled, Jointly Controlled, Significantly Influenced by the Government of Sri Lanka 24,796 43.02
(f) The aggregate amount of remuneration paid during 2014 to Key Management Personnel (including their close family members) and the transaction with Key Management Personnel (including their close family members) are given below (Rs Mn) - Remuneration Paid 276.95 - Loans and Advances 329.30 - Deposits 467.84 - Investments 154.48
(g) The external auditors have performed procedures set out in Sri Lanka Standards on Related Service 4400 issued by the Institute of Chartered Accountants of Sri Lanka (SLSRS 4400), to meet the compliance requirement of the Corporate Governance directive. Their findings presented in their report dated 20th February 2015 addressed to the Board are consistent with the matters disclosed above and did not identify any inconsistencies to those reported above by the Board. The recommendations made by the Auditors where relevant will be dealt with in 2015.
(h) There were no material non - compliance to prudential requirements, regulations, laws and internal controls affecting the Bank.
(i) There were no supervisory concerns on lapses in the Bank’s risk management system or non compliance with this Direction that have been pointed out by the Director of the Bank Supervision Department of the CBSL and requiring disclosure to the public.
50. Transitional and other general provisions
Rule 3 (9) Compliant The Bank has complied with the transitional and other general provisions.
Report from External Auditors The external auditors have performed procedures set out in Sri Lanka Standards on Related Service 4400 issued by the Institute of Chartered Accountants of Sri Lanka (SLSRS 4400 to meet the compliance requirement of the Corporate Governance directive. Their findings presented in their report dated 20th February 2015 addressed to the Board are consistent with the matters disclosed above and did not identify any inconsistencies to those reported above by the Board.
Jonathan Alles Ranee JayamahaManaging Director / Chief Executive Officer Chairperson
Colombo, Sri Lanka20th February 2015
Your Board RoomGovernance Report...

Annual Report 2014 145
Board and the Committee Attendance The number of meetings of the Board, Board appointed Sub - committees and individual attendance by members is shown below.
Names Directorship Status
Boar
d
Aud
it Co
mm
ittee
Nom
inat
ion
Com
mitt
ee
HR
&
Rem
uner
atio
n Co
mm
ittee
Boar
d In
tegr
ated
R
isk
Man
agem
ent
Com
mitt
ee
Stra
tegi
c Re
view
Co
mm
ittee
Cred
it Co
mm
ittee
Bran
ch
Rat
iona
lizat
ion
Com
mitt
ee
Proc
urem
ent
Com
mitt
ee
Total No. Meetings 15 8 4 8 10 3 4 3 12Dr Ranee Jayamaha Non Executive Chairperson 15/15 5a 4/4 7/8 10/10 3/3 4/4 2a 11/12Mr Jonathan Alles Managing Director / CEO 15/15 5a 3a 8a 7/10 3/3 1/4 2/3 ***8/12Dr W W Gamage Senior Independent
Non Executive Director10/15 - 3/4 7/8 - - 0/4 - 1/2
Ms M A R C Cooray Non Executive Director 15/15 6/6 1a
4/4 - 10/10 2/3 4/4 **2/3 -
Dr L R Karunaratne Independent Non Executive Director
14/15 *6/8 4/4 - 9/10 1/3 4/4 3/3 **11/12
Mr L U D Fernando Non Executive Director 15/15 - - 7/8 0/1 1/2 1/4 2/3 2/21a
Mr Sujeewa Mudalige Independent Non Executive Director
13/15 8/8 2a 8/8 7a 1/12a
3/4 2a -
Ms D S C Jayawardena Non Executive Director 15/15 6/8 - - 8/10 - 4/4 2/3 9/12Mr Rusi S. Captain Non Executive Director 11/15 3/8 - - - 1/2 - - -Mr D A Cabraal Independent
Non Executive Director10/10 2/2
4a- 2/2
2a- 1/1
1a- 1a -
The papers relating to Credit are circulated to the members of the respective Board appointed Sub-committees set out below. If a Director has an interest in the relevant subject matter under consideration, he / she declares his / her interest to the respective Committee and withdraws from the approval process.;
Names Total No of Credit papers approved
in 2014
Total No of papers approved in 2014 391
Dr Ranee Jayamaha 378
Mr. Jonathan Alles 354
Dr W W Gamage 257
Ms M A R C Cooray 271
Dr L R Karunaratne 136
Mr L U D Fernando 27
Mr Sujeewa Mudalige 156
Ms D S C Jayawardena 19
Mr Rusi S. Captain 24
Mr D A Cabraal 52
Key:* In addition 2 meetings were attended by alternate director** In addition 1 meeting was attended by alternate director*** In addition 3 meetings were attended by alternate directora meetings attended by invitation ¢ Chairman/Chairperson of the Board/respective sub-committee as at 31.12.2014

Hatton National Bank PLC146
ResponsibilityAs per Section 3 (8) (ii) (b) of Banking Act Direction No: 11 of 2007, the Board of Directors present this report on internal control mechanisms of the Bank.
The Board of Directors (“Board”) is responsible for the adequacy and effectiveness of Hatton National Bank PLC’s (“the Bank”) system of internal controls. However, such a system is designed to manage the Bank’s key areas of risk within an acceptable risk profile, rather than eliminate the risk of failure to achieve the business objectives and policies of the Bank. Accordingly, the system of internal controls can only provide a reasonable but not absolute assurance against material misstatement of management and financial information and records or against financial losses or fraud.
The Board has established an on-going process for identifying, evaluating and managing the significant risks faced by the Bank and this process includes enhancing the system of internal controls as and when there are changes to business environment or regulatory guidelines.
The process is regularly reviewed by the Board in accordance with the guidance for Directors of Banks on the Directors’ Statement on Internal Control issued by the Institute of Chartered Accountants of Sri Lanka (CA Sri Lanka). As per the said guidance, significant processes affecting significant accounts of the Bank were assessed along with the key risk areas of the Bank.
The management assists the Board in the implementation of the Board’s policies and procedures on risk and control by identifying and assessing the risks faced by the Bank, and in the design, operation and monitoring of suitable internal controls to mitigate and control these risks.
The Board is of the view that the system of internal controls in place is sound and adequate to provide a reasonable assurance regarding the reliability of financial reporting, and that the preparation of financial statements for external purposes is in accordance with relevant accounting principles and regulatory requirements.
Key Internal Control ProcessesThe key processes that have been established in reviewing the adequacy and integrity of the system of internal controls include the following:
• The Board Sub Committees are established to assist the Board in ensuring:
- the effectiveness of the Bank’s daily operations.
- that the Bank’s operations are in accordance with the corporate objectives and strategies.
- that the operations of the Bank are in line with the annual budget as well as the policies and business directions that have been approved by the Board.
• The Internal Audit Division of the Bank checks for compliance with policies and procedures and the effectiveness of the internal control systems and highlights significant findings in respect of any non-compliance. Audits are carried out on majority of units and branches, the frequency of which is determined by the level of risk assessed by the internal audit, to provide an independent and objective report on operational and management activities of these units and branches. The annual audit plan is reviewed and approved by the Audit Committee and the findings of the audits are submitted to the Audit Committee for review at their periodic meetings.
• The Audit Committee of the Bank reviews internal control issues identified by the Internal Audit Division, the external auditors, regulatory authorities and management; and evaluates the adequacy and effectiveness of the risk management and internal control systems. They also review the internal audit function with particular emphasis on the scope of audits and quality of the same. The minutes of the Audit Committee meetings are tabled for the information of the Board on a periodic basis. Further details of the activities undertaken by the Audit Committee of the Bank are set out in the Audit Committee Report on pages 154 to 155.
• The Board Integrated Risk Management Committee (BIRMC) is established to assist the Board to oversee the overall management of principal areas of risk of the Bank. The Management Risk Committee which includes representation from all key business and operating units of the Bank, assists the Board with the implementation of policies advocated at the Board Integrated Risk Management Committee (BIRMC).
• Operational committees have also been established with appropriate empowerment to ensure effective management and supervision of the Bank’s core areas of business operations. These committees include the Human Resource Management Committee, the Credit Policy Committee, Investment Committee, the Information Technology Steering Committee and the Executive Risk Management Committee.
In assessing the internal control system over financial reporting, identified officers of the Bank collated all procedures and controls that are connected with significant accounts and disclosures of the financial statements of the Bank. These in turn were observed and checked by the internal audit department for suitability of design and effectiveness on an on going basis. The Bank adopted the new Sri Lanka Accounting Standards Comprising LKAS & SLFRS in 2012. Since adoption of such Sri Lanka Accounting Standards, progressive improvements on processes to comply with new requirements of recognition, measurement, classification and disclosure are being made whilst, further strengthening of processes will take place pertaining to impairment of loans and advances and financial statement disclosures. They also recognized the need to introduce an automated financial reporting process to more effectively comply with the requirements of recognition, measurement, classification and disclosures of financial instruments. The assessment did not include subsidiaries of the Bank.
The recommendations made by the external auditors in connection with the internal control system in previous years were reviewed during the year and appropriate steps have been taken to implement rectify
Directors’ Statement onInternal Control
Annual Report 2014 147
them. The recommendations made by the external auditors in 2013 in connection with the internal control system are being addressed at present.
ConfirmationBased on the above processes, the Board confirms that the financial reporting system of the Bank has been designed to provide a reasonable assurance regarding the reliability of financial reporting and
the preparation of financial statements for external purposes has been done in accordance with Sri Lanka Accounting Standards and regulatory requirements of the Central Bank of Sri Lanka.
Review of the Statement by External AuditorsThe external auditor, Messrs Ernst & Young, have reviewed the above Directors’ Statement on Internal Control for the year
ended 31st December 2014 and reported to the Board that nothing has come to their attention that causes them to believe that the statement is inconsistent with their understanding of the process adopted by the Board in the review of the design and effectiveness of the internal control system of the Bank. Their Report on the Statement of Internal Control is given on page 148 of this Annual Report.
By order of the Board
Sujeewa MudaligeChairman - Audit Committee
Jonathan Alles Ranee JayamahaManaging Director / ChairpersonChief Executive Officer
Colombo, Sri Lanka20th February 2015

Hatton National Bank PLC148
Independent AssuranceReport
TO THE BOARD OF DIRECTORS OF HATTON NATIONAL BANK PLCReport on the Directors’ Statement on Internal Control over Financial Reporting
We were engaged by the Board of Directors of Hatton National Bank PLC (the “Bank”) to provide assurance on the Directors’ Statement on Internal Control over Financial Reporting (the “Statement”) included in the annual report for the year ended 31 December 2014.
Management’s responsibilityManagement is responsible for the preparation and presentation of the Statement in accordance with the “Guidance for Directors of Banks on the Directors’ Statement on Internal Control” issued in compliance with section 3(8)(ii)(b) of the Banking Act Direction No. 11 of 2007, by the Institute of Chartered Accountants of Sri Lanka.
Our responsibilities and compliance with SLSAE 3050Our responsibility is to issue a report to the Board on the Statement based on the work performed. We conducted our engagement in
accordance with Sri Lanka Standard on Assurance Engagements (SLSAE) 3050 – Assurance Report for Banks on Directors’ Statement on Internal Control issued by the Institute of Chartered Accountants of Sri Lanka.
Summary of work performedWe conducted our engagement to assess whether the Statement is supported by the documentation prepared by or for Directors; and appropriately reflected the process the Directors have adopted in reviewing the system of internal control over financial reporting of the Bank.
The procedures performed were limited primarily to inquiries of Bank personnel and the existence of documentation on a sample basis that supported the process adopted by the Board of Directors.
SLSAE 3050 does not require us to consider whether the Statement covers all risks and controls or to form an opinion on the effectiveness of the Bank’s risk and control procedures. SLSAE 3050 also does not require us to consider whether the processes described to deal with material internal control aspects of any significant problems disclosed in
the annual report will, in fact, remedy the problems.
Our conclusionBased on the procedures performed, nothing has come to our attention that causes us to believe that the Statement included in the annual report is inconsistent with our understanding of the process the Board of Directors has adopted in the review of the design and effectiveness of internal control over financial reporting of the Bank.
20th February 2015Colombo
Annual Report 2014 149
Human Resources & Remuneration Committee Report
Composition of the CommitteeThe Human Resources & Remuneration Committee (“the Committee”), appointed by and responsible to the Board of Directors comprises five Non-Executive Directors of whom three including the Chairman are Independent Directors. Two members are Non-Independent. The following Directors serve on the HR & Remuneration Committee:
Dr Willie W Gamage (IND / NED) - Chairman
Dr Ranee Jayamaha (NIND / NED)
Mr L U D Fernando (NIND / NED)
Mr Sujeewa Mudalige (IND / NED)
Mr Amal Cabraal (IND / NED) (Appointed w.e.f. 31st October 2014)
(IND - Independent Director, NIND – Non-Independent Director and NED - Non Executive Director)
Brief profiles of the Directors are given on pages 24 to 27 of the Annual Report.
The Managing Director / Chief Executive Officer (MD / CEO) who is responsible for the overall management of the Bank, attends meetings and participates in the Committee meetings by invitation. The MD / CEO took part in all deliberations except when his own interest, performance and compensation were discussed.
The Chief Human Resource Officer/AGM (Human Resources) functions as the Secretary to the Committee.
PolicyThe Bank’s remuneration policy aims to attract, motivate and retain management in a competitive environment with the appropriate professional, managerial and operational expertise necessary to achieve the objectives of the Bank.
It is the focus of the Committee to ensure that the total remuneration package is sufficiently competitive to attract the best available talent to the Bank.
The remuneration of the MD / CEO, COO and corporate management is designed to create and enhance value for all stakeholders of the Bank and to ensure alignment between the short and long term interests of the Bank and its management.
ScopeThe Committee is vested with power to examine, evaluate and recommend to the Board of Directors on any matter that may affect the human resources management of the Bank within its Terms of Reference (TOR) and any other matters as may be referred to it by the Board.
The Committee sets targets and goals for the Directors, MD/CEO and the Key Management Personnel annually. It reviews all significant Human Resource policies and initiatives, salary structures and terms and conditions relating to staff at senior management level. In this process, necessary information and recommendations are obtained from the MD/CEO and Chief Human Resource Officer/AGM (Human Resources). The Committee deliberates upon and recommends to the Board of Directors the remuneration packages, annual increments and bonuses of the MD/CEO, COO, members of the corporate management and senior management staff, having evaluated their performance against the set goals and targets.
The organisational structure is also reviewed periodically and adjustments are made according to the focus of the Strategic Plan. An ongoing priority is to ensure proper succession for key posts. In doing so, the aspirations for career progression of Management are taken into account.
Recruitments and promotions of staff at management level are also considered and approved based on proposals submitted by the MD/CEO and Chief Human Resource Officer/AGM (Human Resources) following a formal process of evaluation and thereafter recommended to the Board for ratification. When necessary, interviews are held to assess the core competencies of applicants for key posts.
Reports of meetings of the Committee with its recommendations are referred to the Board for discussion and ratified or otherwise acted upon by the Board of Directors.
During the year under review, Terms of Reference for this Committee together with certain other HR policies were formalized and ratified by the Board on presentation.
MeetingsThe Committee met eight (08) times during 2014. Other Board Members may attend meetings on invitation.
Attendance at the meetings is given in table on page 145 of the Annual Report.
FeesAll Non-Executive Directors receive a monthly fee for participation in the deliberations of the Board including attendance at meetings as per the Director’s Remuneration Policy. They may also receive fees for attending sub-committee meetings, and/or meetings of subsidiary boards. They do not receive any performance or incentive payments.
Professional Advice The Committee has the authority to seek external professional advice on matters within its purview.
Committee EvaluationThe Committee completed the evaluation process with self-assessment in 2014, which was conducted by the Chairman and Committee Members and was deemed to be satisfactory.
Dr Willie W GamageChairman Human Resources & Remuneration Committee
Colombo, Sri Lanka20th February 2015

Hatton National Bank PLC150
Nomination CommitteeReport
Composition of the Nomination CommitteeThe Nomination Committee (“the Committee”) comprises of four Non-Executive Directors appointed by the Board of Directors of the Bank. The following Directors serve / served on the Nomination Committee during the year under reference:
Dr Willie W Gamage - Chairman (IND / NED) (Appointed w.e.f 19th January 2015)
Dr Ranee Jayamaha (NIND/NED) – (Appointed as Chairperson during the period of 31st October 2014 to 19th January 2015)*
Ms M A R C Cooray (NIND/NED)
Mr R S Captain (NIND/NED) (Appointed w.e.f. 31st October 2014)
*[Dr Ranee Jayamaha held this position during 31st October 2014 to 19th January 2015, where Director - Dr Willie W Gamage’s availability was uncertain].
Dr L R Karunaratne (IND / NED) – (Chairman till 31st October 2014 and resigned w.e.f.31st October 2014 with the re-constitution of Board Sub-Committees)
(IND - Independent Director, NIND – Non Independent Director and NED - Non Executive Director)
Brief profiles of the members of the Committee are given on pages 24 to 27 of the Annual Report.
The Board Secretary functions as the Secretary to the Nomination Committee.
Committee Responsibilities The Nomination Committee is responsible for reviewing the composition of the Board and Board Sub - Committees to ensure that they are properly constituted and balanced in terms of skills, experience and diversity. In addition to these, the Committee is entrusted with the responsibility of:
• Recommending to the Board on appointing new Directors and Key Management Personal (KMP) and ensuring the implementation of the approved procedure in selecting such Directors and Key Management Personnel;
• Recommending the re - election of current Directors to the Board of Directors taking into account the performance and contribution made by such Directors towards the overall discharge of responsibilities of the Board;
• Reviewing criteria such as qualifications, experience and key attributes required for eligibility to be considered for appointment or promotion to the post of Managing Director/CEO and/or the Key Management positions;
• Ensuring that the Directors, Managing Director/CEO and the Key Management Personnel are fit and proper persons to hold office as required by the Banking Act and other applicable statutes;
• Considering and recommending from time to time the requirements of additional/new expertise and the succession arrangements for retiring Directors and Key Management Personnel with a view to providing advice and recommendations to the Board or the Chairman (as the case may be) on any such appointment;
The Terms of Reference (TOR) of the Nomination Committee which was adopted by the Board of Directors in 2012 was further refined in 2013 and 2014. Thereafter it was reviewed and amended by the members at its meeting held on 19th January 2015 as per the latest intimations by the regulator on the improvement of Corporate Governance for the banking industry.
Committee Meetings and How it Discharged its Duties The Nomination Committee met four (04) times during the year under review, and its main focus was on the following:
Board Composition • Identified skill gaps at Board level
and made recommendations for the appointment of a new Director;
• Re-structured the Board statutory and non - statutory Sub - Committees twice during the year and set out
clear guidelines/principles on the constitution of such Committees;
• Assessed the fitness and propriety of the Directors holding office in terms of the provisions of the Banking Act and the Directions of the Monetary Board relating to Corporate Governance;
• Recommended the re - appointment of Directors who retired by rotation after considering their respective contributions during the previous year;
Succession Planning • Continuously assessed the adequacy
of the expertise available at the Senior Management level; specifically discussed succession planning for the positions of Key Management Personnel of the Bank and reviewed potential candidates for these roles;
• Reviewed the bank’s succession and talent management programme below Board level;
• Reviewed and discussed the processes, overall methodology and contingency plans in place for senior strategic roles;
Board Effectiveness• Reviewed and recommended all
new appointments to the Boards of subsidiary and associate companies of the Bank.
• Reviewed and recommended all strategic recruitments to the Senior Management cadre of the Bank;
• Job Descriptions (the JDs) of the Key Management Personnel were analysed in detail and the Committee was satisfied that the JDs are in line with the respective qualifications, experience and key attributes set - forth by the Committee pertaining to each office of KMP;
• Recommended that combined meetings of the Board and the management to be held in order to ensure that the Directors contribute effectively to the finalisation of the three year Strategic Plan prepared by the Bank;

Annual Report 2014 151
Committee Attendance Attendance by the Committee members at the meetings is given in the table on page 145 of the Annual Report. The Chief Executive Officer also attended one (01) meeting by invitation.
Re-election / Re-appointment of Directors at the 46th Annual General Meeting The names of Dr Ranee Jayamaha - Chairperson, Directors - Ms D S C Jayawardena, Mr R S Captain and Mr Amal Cabraal were proposed for re - election/re - appointment at the 46th Annual General Meeting to be held on 30th March 2015 and the Committee decided to recommend the said names to be approved by the full Board.
Committee Effectiveness • The performance of the Committee is
reviewed each year as part of the Board effectiveness review.
• The Committee completed the self - assessment for the year 2014, which was conducted by the Chairman and Committee Members and the review concluded that the Committee continues to operate effectively.
Dr Willie W Gamage ChairmanNomination Committee
Colombo, Sri Lanka20th February 2015
Hatton National Bank PLC152
Board Integrated Risk ManagementCommittee Report
At the end of 2014, the Board Integrated Risk Management Committee (BIRMC) comprised of thirteen members, of which five members were Non-Executive Directors.
Ms M A R C Cooray, Chairperson (NIND / NED)
Dr Ranee Jayamaha (NIND / NED)
Dr L R Karunaratne (IND / NED)
Ms D S C Jayawardena (NIND / NED)
Mr L U D Fernando (NIND / NED) Appointed w.e.f. 31st October 2014
Mr Jonathan Alles, Managing Director / CEO
Mr D P N Rodrigo, Chief Operating Officer
Mrs Shanti Gnanapragasam, Chief Risk Officer / AGM-Risk
Mr Sidath Wijeratne, Chief Information Officer / AGM-IT Appointed w.e.f. 16th January 2014
Mr Ashok Goonesekere, Chief Financial Officer
Mr Arjuna Ratnasabapathy, Assistant General Manager - Recoveries and Credit Quality Management Appointed w.e.f. 15th July 2014
Mr C B Wijayaratne, Compliance Officer
Mr Murtaza Normanbhoy, Senior Manager - Internal Audit Appointed w.e.f. 1st August 2014
Mr Sujeewa Mudalige (IND/NED) was invited to participate at the meetings as an observer
Brief profiles of the Directors representing the Committee are given on pages 24 to 27 of the Annual Report.
(IND - Independent Director, NIND - Non Independent Director and NED - Non Executive Director)
ComplianceThe BIRMC was established as a Committee of the Board, in compliance with Section 3 (6) of the Banking Act Direction
No. 11 of 2007, on “Corporate Governance for Licensed Commercial Banks in Sri Lanka”. The composition and the scope of work of the Committee are in conformity with the provisions of the aforementioned Direction.
The Bank has adopted an Integrated Risk Management (IRM) framework in line with the Central Bank of Sri Lanka Banking Act Direction No. 7 of 2011.
The Primary Responsibilities of the Committee The terms of reference set out by the Board of Directors, include the following:
• To ensure that the Bank has a comprehensive risk management framework, appropriate compliance policies and systems in place.
• To assess all risk types, including but not limited to: credit, market, liquidity, operational and strategic/reputational risks to the Bank through appropriate risk indicators and management information.
• To ensure risk decisions are taken in accordance with established delegated authorities and corrective actions are taken to mitigate risks taken beyond the risk tolerance set by the Committee, on the basis of Bank’s policies and regulatory and supervisory requirements.
• To monitor and assess the effectiveness of the Bank’s Risk Management System and the robustness of the risk management function.
• Periodically assess performance against internally defined risk appetite.
• To review the Bank’s compliance report on money laundering and action taken in relation to report.
• Review issues raised by Internal Audit that impact upon the Risk Management framework.
• To review progress on the Basel II and Basel III Roadmap implementations.
The Year in RetrospectDuring 2014, the Bank was able to achieve greater compliance with regulatory requirements and internal risk management processes. Some of the accomplishments of the BIRMC are given below:
• The BIRMC reviewed the credit risk strategy of the Bank and the credit approval structure to accommodate internal organisational needs and changes. Improvements were also made in the credit appraisal process through an on-line approval mechanism.
• Clear progress achieved in the reduction of non-performing assets (NPA), through continuous monitoring, rigorous attention to credit quality and relentless recovery efforts.
• Improved coverage and presentation of risk indicators to the Board
• Initiatives were made on a number of fronts in respect of Pillar 1 and Pillar 2 of the Basel II framework.
– The Bank’s Internal Capital Adequacy Assessment Process (ICAAP) was refined to include the identification and assessment of additional risks including compliance risk, strategy/business risk and group risk.
– Development and refinement of the stress testing framework in respect of interest rate risk and liquidity risk.
– New key risk indicators (KRIs) introduced for the monitoring of operational risk.
• Significant improvement in compliance risk monitoring
– Development of a compliance risk matrix.
Annual Report 2014 153
– Enhancement of the processes relating to the anti-money laundering system.
– Spot compliance checks covering key compliance requirements carried out in several branches.
– Staff awareness programs on compliance related issues further intensified towards creating an effective compliance culture within the Bank.
– Due diligence carried out on all Correspondent Banking and Exchange House Relationships
– Screening of customers and transactions against local and international sanction lists was introduced.
MeetingsEight (08) meetings were held and at least one in each quarter. Attendance at the meetings are given in table on page 145 of the Annual Report. The discussions and conclusions reached at the meeting are recorded in minutes and circulated to the Board of Directors for information and advice. The Chairman of the Committee also briefs the Board of Directors on the main findings of the Committee at each Board meeting.
Professional AdviceThe Committee has the authority to seek external professional advice on matters within its purview.
Appreciation
The Committee wishes to thank Mr A P L Fernando, DGM-Development Banking for the cooperation extended and work done in his former role as DGM- Recoveries
& Credit Quality Management. Mr A P L Fernando resigned from the Committee w.e.f. 15th July 2014. .
Committee EvaluationThe Committee completed the evaluation process with self-assessment in 2014 which was deemed to be satisfactory.
Ms M A R C Cooray ChairpersonBoard Integrated Risk Management Committee
Colombo, Sri Lanka20th February 2015
Hatton National Bank PLC154
Board AuditCommittee Report
Composition of the CommitteeThe Audit Committee (“the Committee”), appointed by and responsible to the Board of Directors comprises of five Non Executive Directors with three of them are Independent and two Non Independent Directors.
The following members serve / served on the Audit Committee:
Mr Sujeewa Mudalige (IND / NED) - Chairman
Mr R S Captain (NIND / NED)
Ms D S C Jayawardena (NIND / NED)
Dr L R Karunarathne (IND / NED)
Mr Amal Cabraal (IND/NED) Appointed w.e.f. 31st October 2014
Ms M A R C Cooray (NIND / NED) Resigned w.e.f. 30th October 2014 (IND - Independent Director, NIND - Non Independent Director and NED - Non Executive Director)
Each of the members of the Committee has a depth of financial expertise and collectively the Committee has considerable financial experience on which to draw. More information on experience of and brief profiles of the members are given on pages 24 to 27 of the Annual Report.
The Board Secretary functions as the Secretary to the Audit Committee.
Audit Committee Responsibilities The Committee is mainly responsible for:
(i) Monitoring the integrity of the Bank’s financial reporting and satisfying itself that any significant financial judgements by the management are sound.
(ii) Monitoring the Bank’s internal controls including controls relating to financial statement reporting; and
(iii) Monitoring and reviewing the activities and performance of the internal, external and outsourced auditor/s, including monitoring their independence and objectivity.
Meetings For the purpose of discharging the above duties the Audit Committee met eight (08) times during the year. Attendance by the Committee members at each
of these meetings is given in the table on page 145 of the Annual Report. The Managing Director / Chief Executive Officer, Chief Financial Officer, Senior Manager - Internal Audit and other relevant Senior Management team members also attended these meetings by invitation. On the invitation of the Committee, the Engagement Partner of the Bank’s external auditors, Messrs Ernst & Young attended three (03) Committee meetings during the year.
The Committee is conscious of the need to keep its knowledge up to date and Committee members participated at presentations and workshops conducted internally and externally on relevant topics.
Any individual member of the Committee had the opportunity to raise specific issue at the meetings. The undersigned was in regular contact with the management including the Chief Financial Officer and Senior Manager – Internal Audit during 2014 on matters coming under the purview of the Committee.
Financial ReportingThe Committee, as part of its responsibility to oversee the Bank’s financial reporting process on behalf of the Board of Directors, has reviewed and discussed with the management, the annual and the quarterly financial statements prior to their release. The review included the extent of compliance with the Sri Lanka Accounting Standards, the Companies Act No 7 of 2007, the Banking Act No 30 of 1988 and amendments thereto. The Committee also reviews the effectiveness of the Financial Reporting Systems in place to ensure reliability of the information provided and the accounting policies to determine the most appropriate accounting policies after considering all choices available. With the support of the external auditor it also assess whether the disclosures made under the financial reporting is balanced and fair. Matters of special interest in the current environment and the processes that support certifications of the financial statements by the Bank’s Chief Executive Officer and Chief Financial Officer were also brought up for discussion.
Risks and Internal ControlsAdditionally, the Committee also assessed the effectiveness of the Bank’s internal control over financial reporting as of 31st December 2014, as required by the Banking Act Direction No 11 of 2007, Corporate Governance for Licensed Commercial Banks in Sri Lanka, Subsection 3(8)(ii)(b), based on the “Guidance for Directors of Banks on the Directors’ Statement on Internal Control” issued by the Institute of Chartered Accountants of Sri Lanka (CA Sri Lanka). The result of the assessment is given on pages 146 and 147, “Directors’ Statement on Internal Control” of the Annual Report.
The external auditors have issued an Assurance Report on Directors’ Statement on Internal Controls. The report is given on page 148 of the Annual Report.
The Committee has reviewed the processes for identification, recording, evaluation and management of all significant risks throughout the Bank and other Group entities.
Corporate Governance ReportAs required by the Banking Act Direction No 11 of 2007, Corporate Governance for Licensed Commercial Banks in Sri Lanka, Annual Corporate Governance Report for 2014 is provided on pages 114 to 145. The external auditors have performed procedures set out in Sri Lanka Standards on Related Service 4400 (SLSRS 4400) issued by the Institute of Chartered Accountants of Sri Lanka (CA Sri Lanka), to meet the compliance requirement of the Corporate Governance Directive. Their findings presented in their report dated 20th February 2015, addressed to the Board are consistent with the matters disclosed above and did not identify any inconsistencies to those reported by the Board on pages 114 to 145.
External AuditMessrs Ernst & Young were appointed as the external auditor at the last Annual General Meeting held on 28th March 2014.
The Audit Committee undertook the annual evaluation of the independence and objectivity of the external auditor and the effectiveness of the audit process.

Annual Report 2014 155
The Committee met with the external auditor three (03) times during the year to discuss their audit approach and procedures, including matters relating to the scope of the audit and auditor’s independence. The Committee reviewed the audited financial statements with the external auditor who is responsible for expressing an opinion on its conformity with the Sri Lanka Accounting Standards.
The Committee reviewed the Interim Management Letters issued by the external auditor together with the management responses thereto. Committee also followed up action points taken by the Management in improving the financial reporting based on the 2013 Management Letter by previous auditor Messrs KPMG.
The Committee met the external auditors twice (02) during the year without the presence of MD/CEO and the corporate management to ensure that there was no limitation of scope in relation to the audit and to allow for full disclosure of any incidents which could have had a negative impact on the effectiveness of the external audit, and concluded that there was no cause for concern.
The Committee sets out the policy for the engagement of the external auditor to provide non - audit services. The Audit Committee reviewed the policy for engagement of the external auditor to provide non-audit services. The revised policy was approved by the Board on 19th January 2015. Further, the Audit Committee was of the view that such services were not within the category of services identified as prohibited under:
1. The guidelines issued by the Central Bank of Sri Lanka, for external auditors, relating to their statutory duties in terms of Section 39 of Banking Act No 30 of 1988 and amendments thereto.
2. The Guidelines for Listed Companies on Audit and Audit Committees issued by the Securities and Exchange Commission of Sri Lanka.
The Letter of Representation issued to the external auditor by the Board and Letter of Independence Confirmation issued by the external auditor was tabled at the Audit Committee Meeting held on 20th February 2015.
Messrs Ernst & Young also acts as the Tax Advisor of the Bank and assist the Bank in managing its taxes effectively.
Internal AuditTo fulfil its responsibility to monitor the effectiveness of internal audit function, the Committee received regular report from the Senior Manager -Internal Audit, setting out the internal audit function’s view of the control environment and performance against any key indicators. During the year, the Audit Committee reviewed the independence, objectivity & performance of the internal audit function, the findings of the internal audits completed and their evaluation of the Bank’s internal control including internal control systems. The Audit Committee also reviewed the adequacy of the frequency and coverage of the internal audit plan and approved the same. It also assessed the Internal Audit Department’s resource requirements including succession planning.
Regulatory ComplianceThe Committee reviewed the procedures established by management for compliance with the requirements of regulatory authorities. The Compliance Officer of the Bank who has oversight of the compliance function, submitted quarterly reports to the Audit Committee on the extent to which the Bank was in compliance with the regulatory requirements.
Whistle-blowing Policy The whistle blowing policy was reviewed again in November 2014 by the Audit Committee with a view to further strengthen the process by which employees raise concerns in confidence. The revised policy was approved by the Board in December 2014.
Professional Advice The Committee has the authority to seek external professional advice on matters within its purview.
Committee EvaluationThe annual evaluation of the Committee was conducted by the Non-Executive Chairperson, with contributions from the individual assessments by the members of the Audit Committee, Managing Director / CEO, Chief Operating Officer, Chief Financial Officer, Senior Manager - Internal Audit and the external auditor in accordance with international best practices and was deemed to be satisfactory.
Sujeewa MudaligeChairmanAudit Committee
Colombo, Sri Lanka20th February 2015
Hatton National Bank PLC156
Annual Report of the Board of Directorson the Affairs of the Company
1. GeneralThe Board of Directors of Hatton National Bank PLC has pleasure in presenting its Annual Report to the shareholders for the financial year ended 31st December 2014, together with the audited financial statements of the Bank, consolidated financial statements of the Group for that year and the Auditor’s Report on those financial statements, conforming to the requirements of the Companies Act No 7 of 2007 and the Banking Act No 30 of 1988. The financial statements were reviewed and approved by the Board of Directors on 20th February 2015.
This Report includes the information as required by the Companies Act No 7 of 2007, Banking Act Direction No 11 of 2007 (Corporate Governance for Licensed
Commercial Banks and subsequent amendments thereto) and Listing Rules of the Colombo Stock Exchange (CSE). The Report is also guided by the recommended best practices on Corporate Governance.
Hatton National Bank PLC (“the Bank”) is a Licensed Commercial Bank registered under the Banking Act No 30 of 1988 and was incorporated as a public limited liability company in Sri Lanka on 5th March 1970 under the Companies Ordinance No 51 of 1938. The Bank was re-registered as required under the provisions of the Companies Act No 7 of 2007 on 27th September 2007. The re-registration number of the Bank is PQ 82.
The ordinary shares (both voting and non-voting) and unsecured subordinated/senior redeemable debentures of the Bank
are listed on the main board of the Colombo Stock Exchange in Sri Lanka.
The Bank has been assigned a National Long Term Rating of AA-(lka) with a Stable Outlook by Fitch Ratings Lanka Ltd and a foreign currency issuer rating of B1 by Moody’s which is on par with the sovereign rating of B1 of Sri Lanka. This is the first ever international rating obtained by a Sri Lankan Bank.
The registered office as well as the Head Office of the Bank is at No 479, T B Jayah Mawatha, Colombo 10, Sri Lanka.
Section 168 of the Companies Act No. 07 of 2007, requires the following information to be published in the Annual Report prepared for the year under review.
Information required to be disclosed as per the Companies Act No. 07 of 2007 Reference to the Companies Act
Level of compliance by the Bank
The nature of the business of the Bank and the Group Section 168 (1) (a) Refer section 3 on page 156
Signed financial statements of the Bank and the Group for the accounting period completed
Section 168 (1) (b) Refer section 7 on page 157
Auditor’s Report on financial statements of the Bank and the Group Section 168 (1) (c) Refer section 9 on page 157
Changes in accounting policies made during the accounting period Section 168 (1) (d) Refer section 10 on page 157
Particulars of entries in the interests register made during the accounting period Section 168 (1) (e) Refer section 36 on page 162
Remuneration and other benefits paid to the Directors during the accounting period Section 168 (1) (f) Refer section 40 on page 163
Total amount of donations made by the Bank during the accounting period Section 168 (1) (g) Refer section 15 on page 159
Information on Directorate of the Bank and its subsidiaries/joint ventures during and at the end of the accounting period
Section 168 (1) (h) Refer section 28 and 32 on page 160
Amounts payable to the auditor as audit fees and fees for other services rendered during the accounting period as a separate disclosure
Section 168 (1) (i) Refer section 53 on page 165
Auditor’s relationship or any interest with the Bank and its subsidiaries Section 168 (1) (j) Refer section 53 on page 165
Annual Report of the Board signed on behalf of the Board by two Directors and the Company Secretary
Section 168 (1) (k) Refer section 56 on page 165
2. Vision, Mission and Corporate Conduct
The Bank’s Vision and Mission statements are given on page 2 of the report. The business activities of the Bank are conducted in keeping with the highest level of ethical standards in achieving its Vision and Mission. Bank’s Code of Ethics reflects our commitment to high standards of business conduct and ethics.
3. Principal ActivitiesThe principal activities of the Bank and the Group during the year were general banking, development banking, offshore banking, mortgage financing, lease and hire purchase financing, corporate banking, dealing in government securities and listed equities, pawn broking, e - banking facilities, Islamic banking, custodian banking for mobile banking, stock broking, providing life and general insurance
services, micro financing, other financial services and property development. There were no significant changes in the nature of the principal activities of the Bank and the Group during the financial year under review.
The names of the Bank’s subsidiaries and their nature of principle activities are given in Note 1.1.2 to the financial statements and are found on page 206.
Annual Report 2014 157
4. Changes to the Group StructureThe Bank acquired a stake of 51% of voting rights in Prime Grameen Micro Finance Limited on 7th November 2014. Further, Sithma Development (Pvt) Ltd, Bank’s fully owned subsidiary disposed its stake of 49.99% in Splendor Media (Pvt) Ltd on the same day.
5. Review of OperationsA review of the operations of the Bank during the financial year 2014 and results of its operations are contained in the Chairperson’s Message (pages 12 to 15) the Managing Director’s Review (pages 16 to 21) and the Integrated Management Discussion & Analysis (pages 34 to 111). These reports form an integral part of the Annual Report of the Board of Directors.
6. Future DevelopmentsAn overview of the future developments of the Bank is given in the Chairperson’s Message (pages 12 to 15), the Managing Director’s Review (pages 16 to 21) and the Integrated Management Discussion & Analysis (pages 34 to 111).
7. Financial StatementsThe financial statements of the Bank and the Group have been prepared in accordance with Sri Lanka Accounting Standards laid down by the Institute of Chartered Accountants of Sri Lanka (CA Sri Lanka) and they comply with the requirements of Companies Act No 7 of 2007 and Banking Act No 30 of 1988.
The financial statements of the Bank and the Group for the year ended 31st December 2014 duly signed by the Chief Financial Officer, two of the Directors of the Bank and the Company Secretary are given in pages 198 to 322, which form an integral part of the Annual Report of the Board of Directors.
8. Directors’ Responsibility for Financial Reporting
The Directors are responsible for the preparation of the financial statements of the Bank to present a true and fair view of its state of affairs. The Directors are of the view that these financial statements have been prepared in conformity with the requirements of the Sri Lanka Accounting Standards, (SLFRSs and LKASs), Companies Act No 7 of 2007, Sri Lanka Accounting and Auditing Standards Act No 15 of 1995, Banking Act No 30 of 1988 (as amended), Banking Act Direction No 11 of 2007 (Corporate Governance for Commercial Banks in Sri Lanka as amended) and the Listing Rules of the CSE. The Statement of Directors’ Responsibility for Financial Reporting is given on page 196 and forms an integral part of the Annual Report of the Board of Directors.
9. Auditors’ ReportBank’s auditors, Messrs Ernst & Young, carried out the audit on the financial statements of the Bank and the consolidated financial statements of the Group for the year ended 31st December 2014 and their report on those financial statements is given on page 197 of this Annual Report.
10. Significant Accounting PoliciesThe significant accounting policies adopted in the preparation of the financial statements are given on pages 210 to 236.
11. Going ConcernThe Board is satisfied that the Bank has adequate resources to continue its operations in the foreseeable future. Therefore, the Bank continues to adopt the “going concern” basis in preparing these financial statements.
12. IncomeThe income of the Group for 2014 was Rs 65,023,846,000/- (2013: Rs 65,183,483,000/-) while the Bank’s income was Rs 59,500,495,000/- (2013: Rs 61,006,414,000/-). An analysis of the income is given in Note 10 to the financial statements.
13. Financial Results and Appropriations
The Bank has recorded a growth in profit before tax of 20.5% and a growth in profit after tax of 28.5% in 2014. The Group’s profit before tax recorded a growth of 21.2% and a growth in profit after tax of 29.4% in 2013.
The Bank’s total other comprehensive income for the year was Rs 12,486,813,000/- (2013: Rs 7,446,457,000/-) while the Group has recorded a total other comprehensive income of Rs 13,566,025,000/- for the year (2013: Rs 8,226,653,000/-).
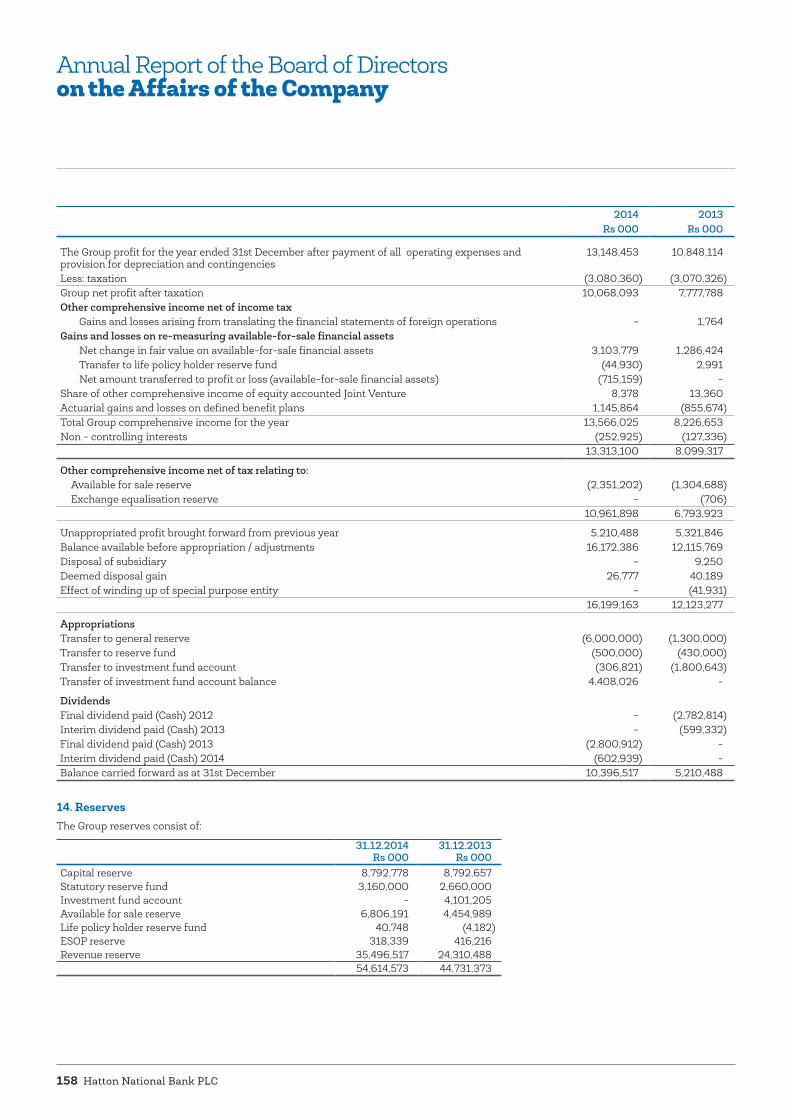
Hatton National Bank PLC158
2014Rs 000
2013Rs 000
The Group profit for the year ended 31st December after payment of all operating expenses and provision for depreciation and contingencies
13,148,453 10,848,114
Less: taxation (3,080,360) (3,070,326)Group net profit after taxation 10,068,093 7,777,788 Other comprehensive income net of income tax Gains and losses arising from translating the financial statements of foreign operations - 1,764 Gains and losses on re-measuring available-for-sale financial assets Net change in fair value on available-for-sale financial assets 3,103,779 1,286,424 Transfer to life policy holder reserve fund (44,930) 2,991 Net amount transferred to profit or loss (available-for-sale financial assets) (715,159) -Share of other comprehensive income of equity accounted Joint Venture 8,378 13,360Actuarial gains and losses on defined benefit plans 1,145,864 (855,674) Total Group comprehensive income for the year 13,566,025 8,226,653 Non - controlling interests (252,925) (127,336) 13,313,100 8,099,317
Other comprehensive income net of tax relating to: Available for sale reserve (2,351,202) (1,304,688) Exchange equalisation reserve - (706)
10,961,898 6,793,923
Unappropriated profit brought forward from previous year 5,210,488 5,321,846Balance available before appropriation / adjustments 16,172,386 12,115,769 Disposal of subsidiary - 9,250 Deemed disposal gain 26,777 40,189Effect of winding up of special purpose entity - (41,931)
16,199,163 12,123,277
AppropriationsTransfer to general reserve (6,000,000) (1,300,000)Transfer to reserve fund (500,000) (430,000)Transfer to investment fund account (306,821) (1,800,643)Transfer of investment fund account balance 4,408,026 -
DividendsFinal dividend paid (Cash) 2012 - (2,782,814)Interim dividend paid (Cash) 2013 - (599,332)Final dividend paid (Cash) 2013 (2,800,912) -Interim dividend paid (Cash) 2014 (602,939) -Balance carried forward as at 31st December 10,396,517 5,210,488
14. ReservesThe Group reserves consist of:
31.12.2014 Rs 000
31.12.2013 Rs 000
Capital reserve 8,792,778 8,792,657 Statutory reserve fund 3,160,000 2,660,000 Investment fund account - 4,101,205Available for sale reserve 6,806,191 4,454,989 Life policy holder reserve fund 40,748 (4,182)ESOP reserve 318,339 416,216Revenue reserve 35,496,517 24,310,488
54,614,573 44,731,373
Annual Report of the Board of Directorson the Affairs of the Company
Annual Report 2014 159
The movement in these reserves is shown in the Statement of Changes in Equity on pages 201 to 203 of the Annual Report.
Further, the Directors propose to transfer Rs 500,000,000 (2013: Rs 430,000,000/-) to the statutory reserve fund, and Rs 6,000,000,000 (2013: Rs 1,300,000/-) to the general reserve account.
15. Corporate DonationsDuring the year, the Bank made donations amounting to Rs 1,159,687 (2013: Rs 23,900,712/- ) in terms of the resolution passed at the last Annual General Meeting. Donations made by the Group during the year amounted to Rs 2,059,000 (2013: Rs 24,228,000/-). The Bank did not make any donations to Government approved charities in 2014 while in 2013 a sum of Rs 2,000,000/- was donated to Government approved charities.
16. TaxationThe income tax rate applicable on the Bank’s domestic operations and FCBU on-shore & off-shore banking operations is 28% (2013:28%).
It is the Bank’s policy to provide for deferred taxation on all known temporary differences under the liability method.
The Bank is also liable for Financial Services VAT at 12% (2013:12%) and NBT on Financial Services VAT at 2% from 1st January 2014.
The Bank is liable to pay Crop Insurance Levy on a quarterly basis at 1% (2013:1%) on after tax profit to the National Insurance Trust Fund Board.
17. Statutory PaymentsThe Directors, to the best of their knowledge and belief, are satisfied that all statutory payments in relation to the Government and the employees have been made up to date.
18. Dividends on Ordinary SharesAn interim dividend of Rs 1.50 per share (2013: Rs 1.50) was paid on 16th December 2014 to the holders of the ordinary shares (both voting and non-voting) for the financial year 2014. A part of the interim dividend paid for the year represents a
redistribution of the exempt dividends received by the Bank and will therefore be free of income tax in the hands of the shareholders. On this basis 44.1% of the interim dividend paid for 2014 is subject to income tax.
The Directors recommend that a final cash dividend of Rs 7.00 per share (2013: Rs 7.00 per share) on both voting and non-voting shares of the Bank, be paid for the financial year ended 31st December 2014.
The Board of Directors was satisfied that the Bank would meet the solvency test immediately after the interim dividend was paid on 16th December 2014 and the final dividend proposed which will be paid in April 2015 in terms of the provisions of the Companies Act No 7 of 2007 and Listing Rules of the CSE. The Board provided the Statements of Solvency to the auditors and obtained Certificates of Solvency from the auditors in respect of each dividend payment conforming to the statutory provision.
19. Capital ExpenditureThe total capital expenditure on acquisition of investment property, property, plant and equipment and intangible assets of the Bank and the Group amounted to Rs 645,368,000/- and Rs 752,255,000/- respectively (2013 Bank: Rs 952,411,000/- and Group: Rs 1,020,117,000/-). Details are given in Notes and to the financial statements. The capital expenditure approved and contracted for and not contracted for as at Balance Sheet date are given in Note 59 (b) to the financial statements.
20. Property, Plant and Equipment (PPE)
Details of property, plant and equipment are given in Note 39 to the financial statements.
21. Net Book Value of Freehold Properties
The net book values of freehold properties owned by the Bank and the Group as at 31st December 2014 are included in the accounts at Rs 7,166,488,000/- and Rs 14,344,743,000/- respectively (2013 Bank: Rs 7,168,211,000/- and Group: Rs 13,693,605,000/-).
A panel of Chartered Valuers / Licensed Surveyors carried out a revaluation of the Bank’s freehold properties in 2012. The details of freehold properties owned by the Bank are given in Note 39 (a) to the financial statements.
22. Outstanding LitigationIn the opinion of the Directors and the Bank’s Lawyers, pending litigation against the Bank disclosed in Note 59 (d) of the financial statements will not have a material impact on the financial position of the Bank or its future operations.
23. Events after the Reporting DateNo circumstances have arisen since the Statement of Financial Position date which would require adjustments to, or disclosure in, the accounts, except those disclosed in Note 64 to the financial statements.
24. Stated Capital and DebenturesThe stated capital of the Bank as at 31st December 2014 was Rs. 13,289,992,000/- consisting of 402,597,656 ordinary shares, which is the aggregate of 321,736,509 (voting shares) and 80,861,147 (non-voting shares). (2013: Rs 12,830,268,000/-consisting of 399,555,201 ordinary shares, which is the aggregate of 319,353,829 – voting shares and 80,201,372 - non-voting shares.)
The Bank issued 3,042,455 ordinary shares during the year, 2,382,680 shares (voting) at a consideration of Rs 307,076,000/- and 659,775 shares (non-voting) at a consideration of Rs 54,771,000/- under the approved Employee Share Option Plan (ESOP). Therefore, the Stated Capital increase of the Bank due to employees exercising their options under ESOP amounted to Rs 361,847,000/- (2013: Rs 250,789,000/-). During the year Rs 97,877,000 got transferred from ESOP reserve to stated capital on account of share options exercised till date. The total increase in the stated capital during the year is Rs 459,724,000/- (2013: Rs 250,789,000/-).
The Bank had issued unsecured, subordinated, redeemable debentures to the value of Rs 8,385,102,000/- as at 31st December 2014. (2013: Rs 8,607,558,000/-). The details of unsecured, subordinated,

Hatton National Bank PLC160
Annual Report of the Board of Directorson the Affairs of the Company
redeemable debentures issued and redeemed during the year 2013 and those outstanding as at 31st December 2014 are given in Note 53 (a) i to the financial statements.
Further, the Bank had issued unsecured, senior, redeemable debentures to the value of Rs 4,451,407,000/- as at 31st December 2014 (2013 : Rs 1,418,775,000/-). In December 2014, the Bank issued 30,000,000 senior, listed, unsecured, redeemable debentures with 3,5 and 10 year maturities and raised Rs 3,000,000,000/-. The details of this debenture are given in Note 47 to the financial statements.
25. Share InformationInformation relating to earnings, dividend, net assets and market price per share is given on page 4 of the Annual Report. Information on share trading is given on page 339 of the Annual Report.
26. ShareholdingsAs at 31st December 2014 there were 4,376 and 10,772 registered voting and non-voting shareholders respectively (2013: voting 4,401 and non-voting 11,107). Information on the distribution of shareholding and the respective percentages is indicated on pages 338 and 339 of the Annual Report. The twenty largest voting and non-voting shareholders of the Bank as at 31st December 2014, together with an analysis are given on pages 342 to 343 of the Annual Report.
27. Equitable Treatment to Shareholders
The Bank has at all times ensured that all shareholders (both voting and non-voting) are treated equitably except for the right to vote.
28. The Board of DirectorsThe Board of Directors of the Bank consists of ten (2013: nine) Directors with wide financial and commercial knowledge and experience. The following Directors held office as at the Statement of Financial Position date and their brief profiles appear on pages 24 to 27 of the Annual Report.
Name of the Director Status
Dr Ranee Jayamaha – Chairperson NIND / NEDMs M A R C Cooray NIND / NED* – Ceased to be the Senior Independent
Director w.e.f. 31st October 2014 Dr Willie W Gamage Senior Director
IND / NED – Appointed as the Senior Director w.e.f. 1st November 2014
Dr L R Karunaratne IND / NEDMr L U D Fernando NIND / NED**Mr Sujeewa Mudalige IND / NEDMs D S C Jayawardena NIND / NEDMr R S Captain NIND / NED Mr Amal Cabraal IND / NED – Appointed as a Director w.e.f. 1st April 2014Mr Jonathan Alles (MD/CEO) ED
(IND - Independent Director, NIND - Non Independent Director, NED - Non Executive Director and ED - Executive Director)* Director – Ms M A R C Cooray’s independence status changed with effect from 1st
November 2014, due to her appointment as a Director of the Bank’s Subsidiary – Prime Grameen Micro Finance Limited but she continues to be a member of the Board as a Non-Independent Director.
** Director - Mr L U D Fernando has declared that with effect from 1st January 2014, he shall be a Non-Independent / Non Executive Director.
29. Retirement / Resignation of Directors
There were no Directors retired or resigned from their respective offices.
30. Appointment of DirectorsMr Amal Cabraal was appointed to the Board on 1st April 2014 as an Independent/Non-Executive Director.
31. Retirement by rotation and re-election / re-appointment of Directors
(1) Chairperson – Dr Ranee Jayamaha, Director – Ms D S C Jayawardena, Director – Mr R S Captain are subject to retirement by rotation in terms of articles of 34; and (2) Director - Mr Amal Cabraal is subject to re-election at the Annual General Meeting in terms of Article 36 of the Articles of Association of the Bank and will offer themselves for re-election under the said Articles.
32. List of Directors of Subsidiaries and Joint Ventures of the Bank
Subsidiaries
HNB Assurance PLCDr Ranee Jayamaha - ChairpersonMr M H de Silva - Managing DirectorMr M U de SilvaMr S C RatwatteMr Jonathan AllesMr J A P M JayasekeraMr K BalasundaramMr D P N Rodrigo Ms S N Wickramasinghe Dr S Selliah
Sithma Development (Pvt) LtdDr Ranee Jayamaha - ChairpersonMr Piyal Hennayake - Director/CEOMr Jonathan Alles Mr A P L Fernando Mr Ashok Goonesekere
Prime Grameen Micro Finance Limited Mr Jonathan Alles - ChairmanMr B Premalal – Deputy ChairmanMr B M D C Prabath – MD/CEOMs H K S R PereraMs M A R C CoorayMr N H T I PereraMr A L SomaratneMr W M Karunaratne (Tendered resignation) Ms L L C C Thambiah
Annual Report 2014 161
Joint VenturesAcuity Partners (Pvt) LtdMr A R Fernando - Chairman Mr M R Abeywardena - CEOMr Jonathan AllesMr T W de SilvaMr D A B EllepolaMs C M M S GunawardenaMs I R D Thenabadu Mr D P N Rodrigo
33. Register of Directors and Secretaries
As required under Section 223 (1) of the Companies Act No 7 of 2007, the Bank maintains a Register of Directors and Secretaries which contain the name, surname, former name (if any), residential address, business, occupation, dates of appointment and dates of resignation (if applicable) of each Director and the Secretary.
34. Board Sub-CommitteesThe Board while assuming the overall responsibility and accountability for the management oversight of the Bank has also appointed Board Sub-Committees to ensure oversight and control over certain affairs of the Bank, conforming to the Banking Act Direction No 11 of 2007 issued by the Monetary Board of the Central Bank of Sri Lanka, on “Corporate Governance for Licensed Commercial Banks of Sri Lanka”. Accordingly, the following mandatory Sub-Committees have been constituted by the Board:
Audit Committee comprises:Mr Sujeewa Mudalige - ChairmanDr L R KarunaratneMs D S C JayawardenaMr R S Captain Mr Amal Cabraal
Ms M A R C Cooray who was appointed, as a member of the Audit Committee on 9th May 2011 and as the Senior Director of the Bank on 17th May 2013, resigned from the Audit Committee with effect from 30th October 2014. She also stepped down from her office as the Senior Director with effect from 31st October 2014 upon her being appointed as a nominee Director to Prime Grameen Micro Finance Limited.
The Report of the Audit Committee is given on page 154 to 155 and forms part of the Annual Report of the Board of Directors.
Nomination Committee comprises:Dr Ranee Jayamaha – Chairperson (appointed Chairperson w.e.f. 30.10.2014)* Dr Willie W Gamage Ms M A R C CoorayMr R S Captain
* (Dr Ranee Jayamaha held this position during the period 31.10.2014 to 19.01.2015 when Dr Willie W Gamage’s availability was uncertain. Dr Gamage was appointed as the chairman of this committee w.e.f. 19.01.2015)
The Report of the Nomination Committee is given on page 150 to 151 and forms part of the Annual Report of the Board of Directors.
Human Resources & Remuneration Committee comprises:Dr Willie W Gamage - Chairman Dr Ranee JayamahaMr L U D FernandoMr Sujeewa Mudalige Mr Amal Cabraal
The Report of the Human Resources & Remuneration Committee is given on page 149 and forms part of the Annual Report of the Board of Directors.
Board Integrated Risk Management Committee comprises:Ms M A R C Cooray - ChairpersonDr Ranee JayamahaDr L R KarunaratneMs D S C JayawardenaMr L U D FernandoMr Jonathan Alles - MD/CEOMr D P N Rodrigo - Chief Operating OfficerMs Shanti Gnanapragasam – Chief Risk Officer/AGM (Risk)Mr Sidath Wijeratne – Chief Information Officer/AGM (IT)Mr Ashok Goonesekere - Chief Financial OfficerMr Arjuna Ratnasabapathy – AGM (Recoveries & Credit Quality Management)Mr C B Wijayaratne – Compliance Officer Mr Murtaza Normanbhoy – Senior Manager (Internal Audit)
The Report of the Integrated Risk Management Committee is given on page 152 to 153 and forms part of the Annual Report of the Board of Directors.
Mr Jonathan Alles - MD/CEO, Mr D P N Rodrigo - Chief Operating Officer, Ms Shanti Gnanapragasam – Chief Risk Officer/AGM (Risk), Mr Sidath Wijeratne - Chief Information Officer/AGM (IT), Mr Ashok Goonesekere - Chief Financial Officer, Mr Arjuna Ratnasabapathy – AGM (Recoveries & Credit Quality Management), Mr C B Wijayaratne – Compliance Officer and Mr Murtaza Normanbhoy – Senior Manager (Internal Audit) represented the Management on the Committee.
Apart from the mandatory Board Sub-Committees, the Board has appointed five other non-mandatory Sub-Committees namely the Board Credit/Assets & Liability Committee, Strategy & Investment Review Committee, Procurement Committee, Committee for Disposal of Assets/Investment Properties and Branch Rationalization Committee to ensure effective discharge of its duties. The composition of these Committees was as follows:-
Credit/Assets & Liability Committee: Dr Ranee Jayamaha – Chairperson (appointed Chairperson w.e.f. 30.10.2014)Ms M A R C CoorayMr Sujeewa MudaligeMr Amal Cabraal - Management OfficersMr Jonathan Alles - MD/CEOMr D P N Rodrigo - Chief Operating OfficerMs I R D Thenabadu - Deputy General Manager (Credit & Transaction Banking)Mr Ruwan Manatunga – Head of Corporate Banking/AGM (Corporate Banking)Ms Shanti Gnanapragasam – Chief Risk Officer/AGM (Risk)
Strategic & Investment Review Committee :Mr Amal Cabraal – Chairman (appointed Chairman w.e.f. 30.10.2014)Dr Ranee Jayamaha Ms M A R C Cooray Dr L R Karunaratne Mr Sujeewa Mudalige
Management OfficersMr Jonathan Alles - MD/CEOMr D P N Rodrigo - Chief Operating OfficerMr Rajive Dissanayake - Chief Manager (Planning & Investments)

Hatton National Bank PLC162
Annual Report of the Board of Directorson the Affairs of the Company
37. Directors’ Interests in the Ordinary Shares (Voting and Non-Voting)The shareholdings of Directors were as follows:
As at 31st December 2014
No of Shares
As at 31st December 2013
No of Shares
Dr Ranee Jayamaha 101 101
Mr. Jonathan Alles 2,000 2,000
Ms M A R C Cooray 5,312 5,312
Dr Willie W Gamage 101 101
Dr L R Karunaratne 1,018 1,018
Mr L U D Fernando 2,667 2,667
Mr Sujeewa Mudalige - -
Ms D S C Jayawardena 500 500
Mr R S Captain 6,007 6,007
Mr. Amal Cabraal - -
** There has been no change in the interests in shares of the Directors mentioned above, between 31st December 2014 and 20th February 2015, being the date of this Report. There are no arrangements enabling the Non Executive Directors of the Bank to acquire shares of the Bank other than via the market.
Procurement Committee:Dr L R Karunaratne – Chairman (appointed Chairman w.e.f. 30.10.2014)Dr Ranee Jayamaha Ms D S C JayawardenaMr L U D FernandoDr Willie W Gamage
Management OfficersMr Jonathan Alles - MD/CEOMr D P N Rodrigo - Chief Operating OfficerMr Piyal Hennayake - Deputy General Manager (Services)
Committee for Disposal of Assets/ Investment Properties
Up to Rs. 10.0 MnDr Ranee Jayamaha - ChairpersonMr Jonathan Alles - MD/CEO
Over Rs. 10.0 Mn(Any two of the following)Dr L R KarunaratneMr L U D FernandoMs D S C Jayawardena
Branch Rationalization Committee:Mr L U D Fernando – Chairman (appointed Chairman w.e.f. 30.10.2014)Ms D S C JayawardenaDr Willie W GamageMr R S Captain
Management OfficersMr Jonathan Alles - MD/CEOMr D P N Rodrigo - Chief Operating OfficerMr Thimal Perera – Deputy General Manager (Retail & SME Banking)Mr Rohan Thambirajah – AGM (Network Management)
35. Directors’ MeetingsThe details of the Directors’ meetings which comprise Board meetings, Audit Committee meetings, Nomination Committee meetings, Human Resource & Remuneration Committee meetings and Board Integrated Risk Management Committee meetings and the attendance of Directors at these meetings are given on page 145 of the Annual Report. Furthermore, the Directors contributed towards policy advocacy and direction by participating in the deliberations of the Board appointed Sub-Committees on Strategic & Investment Review, Credit/Assets & Liability, Disposal of Assets/Investment Properties, Branch Rationalisation and Procurement. In furtherance of the deliberations of the Board, special Committees consisting of Board members were also constituted from time to time to attend to specific tasks.
36. Directors’ Interest Register and Directors’ Interest in Contracts or Proposed Contracts
The Bank maintains the Directors’ Interest Register as required under the provisions of Section 168 (1) (e) of the Companies Act No 7 of 2007. Directors of the Bank have made necessary declarations of their interest in contracts or proposed contracts, in terms of the Sections 192 (1) and 192 (2) of the said Companies Act. These interests have been recorded in the Interest Register which is available for inspection in terms of the Act. The particulars of the Directors’ Interest in Contracts are given on pages 166 to 168 of the Annual Report and form an integral part of the Annual Report of the Board of Directors. The Directors have no direct or indirect interest in a contract or a proposed contract with the Company other than those disclosed.
In terms of article 40 of the Articles of Association the directors did not (i) participate at the discussions or in the approving process; (ii) vote on matters or contracts in which they were interested.
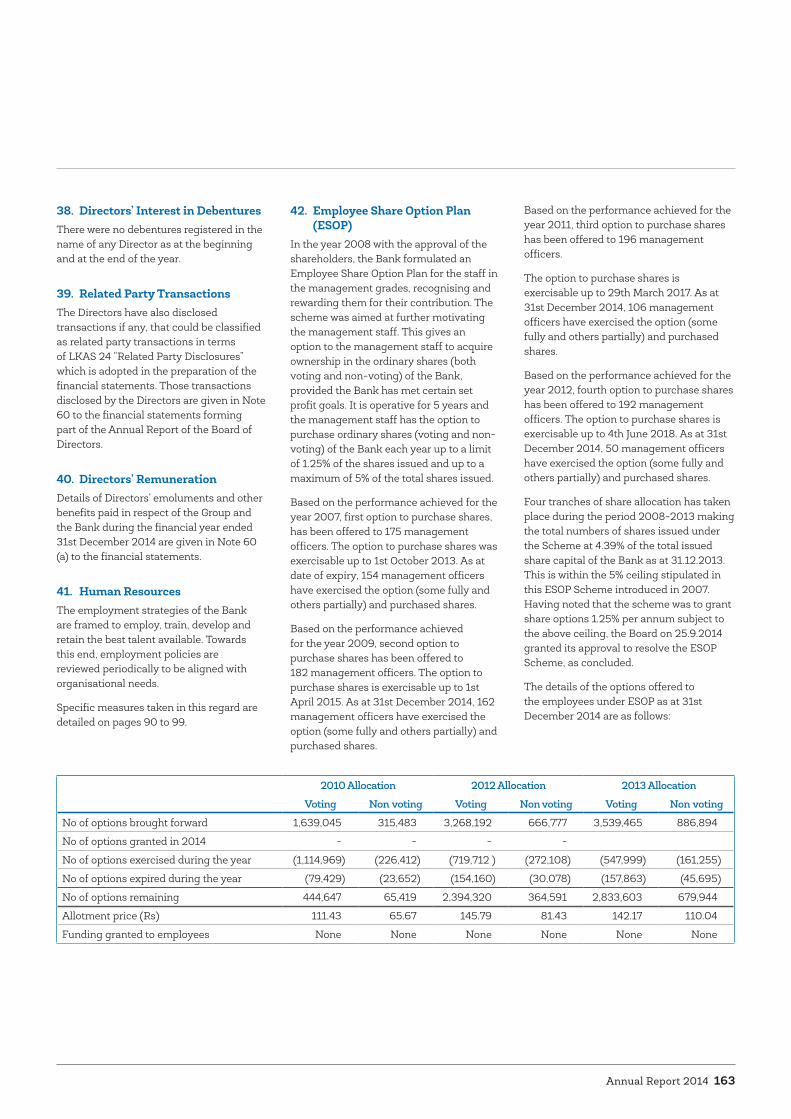
Annual Report 2014 163
38. Directors’ Interest in DebenturesThere were no debentures registered in the name of any Director as at the beginning and at the end of the year.
39. Related Party TransactionsThe Directors have also disclosed transactions if any, that could be classified as related party transactions in terms of LKAS 24 “Related Party Disclosures” which is adopted in the preparation of the financial statements. Those transactions disclosed by the Directors are given in Note 60 to the financial statements forming part of the Annual Report of the Board of Directors.
40. Directors’ RemunerationDetails of Directors’ emoluments and other benefits paid in respect of the Group and the Bank during the financial year ended 31st December 2014 are given in Note 60 (a) to the financial statements.
41. Human ResourcesThe employment strategies of the Bank are framed to employ, train, develop and retain the best talent available. Towards this end, employment policies are reviewed periodically to be aligned with organisational needs.
Specific measures taken in this regard are detailed on pages 90 to 99.
42. Employee Share Option Plan (ESOP)
In the year 2008 with the approval of the shareholders, the Bank formulated an Employee Share Option Plan for the staff in the management grades, recognising and rewarding them for their contribution. The scheme was aimed at further motivating the management staff. This gives an option to the management staff to acquire ownership in the ordinary shares (both voting and non-voting) of the Bank, provided the Bank has met certain set profit goals. It is operative for 5 years and the management staff has the option to purchase ordinary shares (voting and non-voting) of the Bank each year up to a limit of 1.25% of the shares issued and up to a maximum of 5% of the total shares issued.
Based on the performance achieved for the year 2007, first option to purchase shares, has been offered to 175 management officers. The option to purchase shares was exercisable up to 1st October 2013. As at date of expiry, 154 management officers have exercised the option (some fully and others partially) and purchased shares.
Based on the performance achieved for the year 2009, second option to purchase shares has been offered to 182 management officers. The option to purchase shares is exercisable up to 1st April 2015. As at 31st December 2014, 162 management officers have exercised the option (some fully and others partially) and purchased shares.
Based on the performance achieved for the year 2011, third option to purchase shares has been offered to 196 management officers.
The option to purchase shares is exercisable up to 29th March 2017. As at 31st December 2014, 106 management officers have exercised the option (some fully and others partially) and purchased shares.
Based on the performance achieved for the year 2012, fourth option to purchase shares has been offered to 192 management officers. The option to purchase shares is exercisable up to 4th June 2018. As at 31st December 2014, 50 management officers have exercised the option (some fully and others partially) and purchased shares.
Four tranches of share allocation has taken place during the period 2008-2013 making the total numbers of shares issued under the Scheme at 4.39% of the total issued share capital of the Bank as at 31.12.2013. This is within the 5% ceiling stipulated in this ESOP Scheme introduced in 2007. Having noted that the scheme was to grant share options 1.25% per annum subject to the above ceiling, the Board on 25.9.2014 granted its approval to resolve the ESOP Scheme, as concluded.
The details of the options offered to the employees under ESOP as at 31st December 2014 are as follows:
2010 Allocation 2012 Allocation 2013 Allocation
Voting Non voting Voting Non voting Voting Non voting
No of options brought forward 1,639,045 315,483 3,268,192 666,777 3,539,465 886,894
No of options granted in 2014 - - - -
No of options exercised during the year (1,114,969) (226,412) (719,712 ) (272,108) (547,999) (161,255)
No of options expired during the year (79,429) (23,652) (154,160) (30,078) (157,863) (45,695)
No of options remaining 444,647 65,419 2,394,320 364,591 2,833,603 679,944
Allotment price (Rs) 111.43 65.67 145.79 81.43 142.17 110.04
Funding granted to employees None None None None None None
Hatton National Bank PLC164
Annual Report of the Board of Directorson the Affairs of the Company
43. Environmental ProtectionTo the best of knowledge of the Board, the Bank has complied with the relevant environmental laws and regulations. The Bank has not engaged in any activity that is harmful or hazardous to the environment. Specific measures taken to protect the environment are given on pages 104 to 106.
44. Risk Management and Internal Control
44.1 Risk ManagementThe Bank has an ongoing process in place to identify, evaluate and manage the risks that are faced by the Bank. This process is detailed in the Risk Management Report on pages 169 to 189 The Directors on a regular basis review the above mentioned process through the Board Integrated Risk Management Committee (BIRMC).
44.2 Internal ControlThe Board considers that strong internal controls are integral to the sound management of the Bank and it is committed to maintain strict financial, operational and risk management controls over all its activities.
The Directors are ultimately responsible for the Bank’s system of internal control and for reviewing its effectiveness. Such a system is designed to manage, rather than eliminate, the risk of failure to achieve business objectives and can provide only reasonable and not absolute assurance against material misstatement or loss. There is an on going process for identifying, recording, evaluating and managing the risks that are faced by the Bank, and the Directors have reviewed this process, through the Board Audit Committee.
The Board of Directors is satisfied with the effectiveness of the system of internal control for the year under review and up to the date of approval of the Annual Report and financial statements.
45. Directors’ Statement on Internal Control
The Board has issued a report on the internal control mechanism of the Bank as per Section 3 (8) (ii) (b) of Banking Act Direction No 11 of 2007 on Corporate Governance. The Board has confirmed that the financial
reporting system has been designed to provide reasonable assurance regarding the reliability of the financial reporting, and that the preparation of financial statements for external purposes has been done in accordance with relevant accounting principles and regulatory requirements. The above report, which forms an integral part of the Annual Report of the Board of Directors, is given on page 146 to 147.
The Board has obtained an assurance report from the external auditors on Directors’ Statement on Internal Control which is given on page 148 of the Annual Report.
46. Corporate GovernanceIn the management of the Bank, the Directors have placed emphasis on conforming to the best corporate governance practices and procedures. Accordingly, systems and structures have been introduced / improved from time to time to enhance risk management measures and to improve accountability and transparency. A separate report on Corporate Governance is given on pages 114 to 145.
As required by Section 3(8) (ii) (g) of the Direction No 11 of 2007 of the Banking Act on Corporate Governance for Licensed Commercial Banks, issued by the Central Bank of Sri Lanka, the Board of Directors confirms that all the findings of the “Factual Findings Reports” of auditors issued under “Sri Lanka Related Services Practice Statement 4400” have been presented in auditor’s report dated 20th February 2015, addressed to the Board of Directors.
47. Appraisal of Board PerformanceThe Bank has in place a robust scheme whereby the Directors perform a self-assessment of the Board’s conduct annually by answering a self-assessment questionnaire. The responses to the self-assessment questionnaire are evaluated by the Chairman and any action, recommendations and/or concerns are discussed with the Board and accordingly noted and action taken where deemed appropriate.
48. Insurance and IndemnityPursuant to a decision of the Board, the Bank obtained an Insurance Policy to cover Directors’ liability.
49. Compliance with Laws and Regulations
The Bank has at all times ensured that it complied with the applicable laws and regulations including the Listing Rules of the CSE as a listed company. Compliance Officer who reports to Board Integrated Risk Management Committee, tables a report on compliance at the quarterly meetings of the Board Audit Committee.
50. Material Foreseeable Risk Factors (As per Rule No. 7.6 (VI) of the Listing Rules of the Colombo Stock Exchange)
Information pertaining to the material foreseeable risk factors, that require disclosures as per the Rule No. 7.6 (vi) of the Listing Rules of the Colombo Stock Exchange are discussed in the Risk Management Review in pages 169 to 189.
51. Material Issues Pertaining to Employees and Industrial Relations Pertaining to the Bank (As per Rule No. 7.6 (VII) of the Listing Rules of the Colombo Stock Exchange)
There were no material issues pertaining to employees and industrial relations pertaining to the Bank that occurred during the year under review which need to be disclosed.
52. Operational ExcellenceThe Bank achieved greater efficiency, service and quality in its banking operations, credit underwriting as well as non-banking operations through a focused drive of initiatives in operational efficiency, cost optimization, business process re-engineering and optimization of latest technology. In 2014, many of these initiatives were completed with greater emphasis placed on enabling the Bank to achieve better focus on sales and services by moving operational tasks to specialized teams where efficiency is derived through economies of scale due to better service, specialization and standardization.
Annual Report 2014 165
53. AuditorsThe Bank’s auditors during the period under review were Messrs Ernst & Young, Chartered Accountants while Messrs KPMG were the auditors for the financial year 2013. Audit fees and reimbursement of expenses paid to Messrs Ernst & Young during the year under review by the Bank and the Group amounted to Rs 9,850,000/- (2013: Rs 8,932,000/- KPMG) and Rs 14,458,000/- (2013: Rs 10,761,000/- KPMG) respectively. Further Rs 4,330,000 (2013: Rs 5,634,000/- KPMG) and Rs 5,169,000/- (2013: Rs 6,750,000/- KPMG) were paid by the Bank and the Group respectively for audit related and non-audit services including reimbursement of expenses.
Based on the declaration provided by Messrs Ernst & Young, and as far as the Directors are aware, the auditors do not have any relationship or interest with the Bank that in our judgment, may reasonably be thought to have a bearing on their independence within the meaning of the Code of Professional Conduct and Ethics issued by the Institute of Chartered Accountants of Sri Lanka (CA Sri Lanka), applicable on the date of this Report.
A resolution relating to re-appointment of auditors and authorising the Directors to fix their remuneration, will be proposed at the forthcoming Annual General Meeting.
54. First Integrated Annual ReportThe Bank has taken the initiative to present its first Integrated Annual Report for the year ended 31 December 2014. Integrated
reporting brings together material information about the Bank’s strategy, governance, performance and prospects in a way that reflect the commercial, social and environmental context within which it operates. It provides a clear and concise representation of how the Bank demonstrates stewardship and how it creates and sustains value.
In complying with the good governance practices, the Annual Report of the Bank is dispatched as soon as possible after the end of the financial year and completion of the audit.
In compliance with the Colombo Stock Exchange Listing Rules, the Annual Reports have been distributed in the form of a CD-ROM (a soft copy) as well as in the form of a printed report.
55. Notice of Annual General MeetingThe 46th Annual General Meeting of the Bank is convened on Monday 30th March 2015, at 10.00 in the forenoon, at the Auditorium on Level 22 of “HNB Towers” (Registered Office), No 479, T B Jayah Mawatha, Colombo 10. The Notice of the 46th Annual General Meeting is enclosed.
56. Acknowledgement of the Contents of the Report
As required by Section 168 (1) (k) of the Companies Act No. 07 of 2007, the Board of Directors hereby acknowledges the contents of this Annual Report.
For and on behalf of the Board of Directors.
Jonathan Alles Ranee JayamahaManaging Director / ChairpersonChief Executive Officer
K A L Thushari RanaweeraDeputy General Manager(Legal) / Company Secretary
Colombo, Sri Lanka20th February 2015

Hatton National Bank PLC166
Directors’ Interest in Contractswith the Bank
Related party transactions as required by LKAS 24 “Related Party Disclosures”, are detailed in Note 60 to the financial statements. In addition, the Bank carries out transactions in the ordinary course of its business at commercial rates with entities in which a Key Management Personnel (KMP) of the Bank is the Chairman or a Director of such entities, the details of which are given below.
Also this complies with the requirements of section 168 of the Companies Act. No. 07 of 2007 and directions issued under section 47 (3), (4), (5) and (6) of the Banking Act No. 30 of 1988.
1. Lending Transactions with the Bank
Director/Company Name of the Director/ Relationship
Nature of Transaction
Aggregate Amount of Accommodation SecurityAs at 31st
December 2014As at 31st
December 2013Limit Outstanding Limit Outstanding
Rs.Mn Rs.Mn Rs.Mn Rs.Mn(A) Ms D S C Jayawardena
Ambewela LivestockCompany Ltd
Director OverdraftLetters of CreditTotal
50.0010.0060.00
34.87 -
34.87
50.0010.0060.00
7.46 -
7.46
Quoted shares of DCSLCorporate guarantee
Ambewela Products(Pvt) Ltd
Director OverdraftLetters of CreditTotal
100.0050.00
150.00
88.16 -
88.16
100.0050.00
150.00
77.21-
77.21
Quoted shares of DCSLCorporate guarantee
Ceylon Garden Coir (Pvt) Ltd
Director Letter of CreditTotal
10.0010.00
--
--
--
Quoted shares of DCSLCorporate guarantee
Lanka Dairies(Pvt) Ltd
Director OverdraftLetters of CreditLetters of GuaranteeTotal
200.00100.00
25.00325.00
186.18-
- 186.18
200.00100.00
25.00325.00
17.90-
- 17.90
Quoted shares of DCSLCorporate guarantee
Lanka Milk Foods (CWE)PLC
Director OverdraftLetters of CreditLetter of GuaranteeLetters of Guarantee Term LoanTotal
300.00600.00
*(70.00)30.00
500.001430.00
221.48 179.93
-51.75
500.00953.16
300.00600.00
*(70.00)30.00
-930.00
51.53 - -
31.65-
83.18
Quoted shares of DCSLCorporate guaranteeClean
Milford Exports (Ceylon) Ltd
Director Letters of CreditNeg. of Doc billsOverdraftLetters of GuaranteeTotal
50.00200.00
10.0040.00
300.00
----
----
----
Quoted shares of DCSLCorporate guarantee
Pattipola LivestockCompany Ltd
Director OverdraftLetters of CreditTotal
50.0010.0060.00
29.78 -
29.78
50.0010.0060.00
3.34-
3.34
Quoted shares of DCSLCorporate guarantee
Stassen natural Foods (Pvt) Ltd
Director OverdraftLetter of CreditLetters of GuaranteeNego.of Doc. BillsTotal
10.0050.0015.00
200.00275.00
2.33-
15.00-
17.33
----
----
Quoted shares of DCSLCorporate guarantee
Stassen Int’l (Pvt) Ltd Director OverdraftLetter of CreditLetters of GuaranteeNego.of Doc. BillsTotal
300.00150.00125.00
500.001075.00
33.640.40
55.00-
89.04
----
----
Quoted shares of DCSLCorporate guarantee
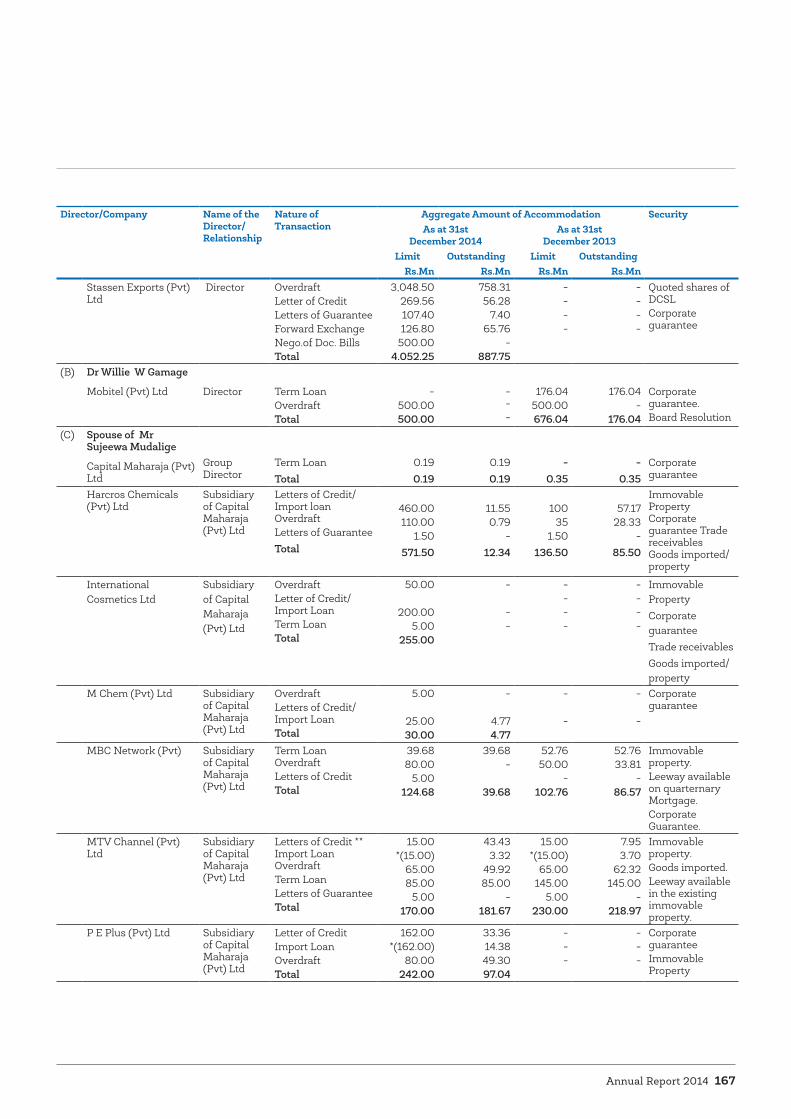
Annual Report 2014 167
Director/Company Name of the Director/ Relationship
Nature of Transaction
Aggregate Amount of Accommodation SecurityAs at 31st
December 2014As at 31st
December 2013Limit Outstanding Limit Outstanding
Rs.Mn Rs.Mn Rs.Mn Rs.MnStassen Exports (Pvt) Ltd
Director OverdraftLetter of CreditLetters of GuaranteeForward ExchangeNego.of Doc. BillsTotal
3,048.50269.56107.40126.80
500.004.052.25
758.3156.28
7.4065.76
-887.75
----
----
Quoted shares of DCSLCorporate guarantee
(B) Dr Willie W Gamage
Mobitel (Pvt) Ltd Director Term LoanOverdraftTotal
-500.00500.00
- - -
176.04500.00676.04
176.04 -
176.04
Corporate guarantee.Board Resolution
(C) Spouse of Mr Sujeewa Mudalige
Capital Maharaja (Pvt) Ltd
Group Director
Term LoanTotal
0.190.19
0.190.19
-0.35
-0.35
Corporate guarantee
Harcros Chemicals (Pvt) Ltd
Subsidiary of Capital Maharaja (Pvt) Ltd
Letters of Credit/Import loan Overdraft Letters of GuaranteeTotal
460.00110.00
1.50 571.50
11.550.79
-12.34
10035
1.50136.50
57.1728.33
-85.50
Immovable Property Corporate guarantee Trade receivables Goods imported/property
International Cosmetics Ltd
Subsidiary of Capital Maharaja (Pvt) Ltd
OverdraftLetter of Credit/ Import LoanTerm LoanTotal
50.00
200.005.00
255.00
-
--
----
----
Immovable PropertyCorporate guaranteeTrade receivablesGoods imported/property
M Chem (Pvt) Ltd Subsidiary of Capital Maharaja (Pvt) Ltd
Overdraft Letters of Credit/ Import LoanTotal
5.00
25.0030.00
-
4.774.77
-
-
-
-
Corporate guarantee
MBC Network (Pvt) Subsidiary of Capital Maharaja (Pvt) Ltd
Term Loan Overdraft Letters of CreditTotal
39.68 80.00
5.00124.68
39.68-
39.68
52.76 50.00
-102.76
52.76 33.81
-86.57
Immovable property.Leeway available on quarternary Mortgage.Corporate Guarantee.
MTV Channel (Pvt) Ltd
Subsidiary of Capital Maharaja (Pvt) Ltd
Letters of Credit ** Import Loan Overdraft Term Loan Letters of GuaranteeTotal
15.00*(15.00)
65.0085.00 5.00
170.00
43.43 3.32
49.92 85.00
- 181.67
15.00 *(15.00)
65.00 145.00
5.00 230.00
7.953.70
62.32 145.00
- 218.97
Immovable property.Goods imported.Leeway available in the existing immovable property.
P E Plus (Pvt) Ltd Subsidiary of Capital Maharaja (Pvt) Ltd
Letter of CreditImport LoanOverdraft Total
162.00*(162.00)
80.00242.00
33.3614.3849.3097.04
---
---
Corporate guaranteeImmovable Property
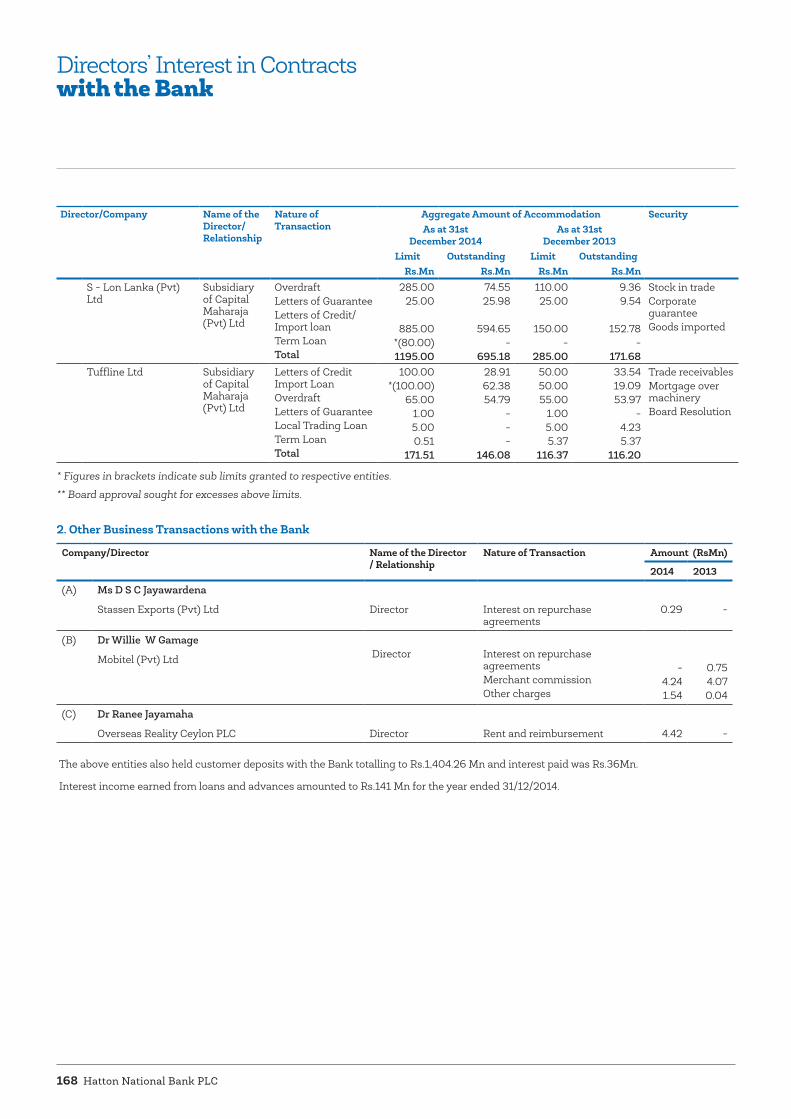
Hatton National Bank PLC168
Director/Company Name of the Director/ Relationship
Nature of Transaction
Aggregate Amount of Accommodation SecurityAs at 31st
December 2014As at 31st
December 2013Limit Outstanding Limit Outstanding
Rs.Mn Rs.Mn Rs.Mn Rs.MnS - Lon Lanka (Pvt) Ltd
Subsidiary of Capital Maharaja (Pvt) Ltd
OverdraftLetters of GuaranteeLetters of Credit/Import loanTerm LoanTotal
285.0025.00
885.00
*(80.00)1195.00
74.5525.98
594.65-
695.18
110.00 25.00
150.00 -
285.00
9.369.54
152.78
-171.68
Stock in tradeCorporate guaranteeGoods imported
Tuffline Ltd Subsidiary of Capital Maharaja (Pvt) Ltd
Letters of CreditImport LoanOverdraftLetters of GuaranteeLocal Trading LoanTerm LoanTotal
100.00*(100.00)
65.00 1.00 5.00 0.51
171.51
28.9162.38 54.79
- -
- 146.08
50.0050.00 55.00
1.00 5.00 5.37
116.37
33.5419.09 53.97
- 4.23 5.37
116.20
Trade receivablesMortgage over machineryBoard Resolution
* Figures in brackets indicate sub limits granted to respective entities.
** Board approval sought for excesses above limits.
2. Other Business Transactions with the Bank
Company/Director Name of the Director / Relationship
Nature of Transaction Amount (RsMn)
2014 2013
(A) Ms D S C Jayawardena
Stassen Exports (Pvt) Ltd
Director Interest on repurchase agreements
0.29 -
(B) Dr Willie W Gamage
Mobitel (Pvt) Ltd Director Interest on repurchase agreements Merchant commissionOther charges
-4.241.54
0.754.070.04
(C) Dr Ranee Jayamaha
Overseas Reality Ceylon PLC Director Rent and reimbursement 4.42 -
The above entities also held customer deposits with the Bank totalling to Rs.1,404.26 Mn and interest paid was Rs.36Mn.
Interest income earned from loans and advances amounted to Rs.141 Mn for the year ended 31/12/2014.
Directors’ Interest in Contractswith the Bank
Annual Report 2014 169
RiskManagement
IntroductionAlmost all business decisions contain an element of risk. Therefore understanding and managing risk is fundamental to a bank’s strategic planning and decision making process.
HNB’s risk management stance is to proactively assist the business in delivering superior shareholder value by providing a prudent but enabling risk appetite framework. The Bank’s capacity to identify, assess and mitigate the risks it faces has enabled it to develop and grow over the years, ultimately reflecting a strong corporate governance and risk management culture.
HNB’s risk management framework has remained resilient throughout 2014, amidst a challenging macroeconomic environment. Over the past year, the Bank has taken a number of initiatives to strengthen its risk management capabilities. Some of these initiatives include adopting a faster and more efficient system-driven credit approval
and disbursement process, improved watch-listing of customers, fine-tuning of key risk indicators (KRIs) for operational risk, development of a compliance risk dashboard and refinement of the stress testing framework to assess the impact of changes in financial factors on the Bank’s portfolios, its funding requirements and capital adequacy ratios.
Regulatory Environment In response to the global financial crisis in 2008, governments and regulators worldwide have dedicated their efforts to design and implement measures aimed at reducing the impact of a future financial crisis in their respective countries.
A sound risk management framework is fundamental to the prudent management of Banks. The Basel II framework has been embedded in the supervisory process of the Central Bank of Sri Lanka (CBSL) since 2008. With the issuance of the direction on “Integrated Risk Management (IRM) Framework for Licensed Banks” in 2011, the CBSL formulated clear guidelines
on the management of risk, covering credit, interest rate, liquidity, market and operational risks as well as stress testing. The IRM direction was amended in 2014 to include the Baseline Security Standard for Information Security Management.
Further measures were taken by the CBSL to enhance the risk management processes of banks in Sri Lanka. The Internal Capital Adequacy Assessment Process (ICAAP) was implemented in 2013 requiring banks to link their risk management processes to the management of capital. More recently in 2014, the CBSL introduced the revised guidelines for the measurement of Operational Risk as well as a comprehensive Stress Testing framework for banks.
With the formalisation of the Liquidity Coverage Ratio (LCR) in 2015 which is based on the Basel III Liquidity Standards, the regulator hopes to set yet another milestone to improve the capital and risk management processes of local banks and promote a more resilient banking sector.
Implementation of the Basel II FrameworkThe following section presents an overview of the level of compliance achieved by HNB with the Basel II framework.
The three pillars of Basel II:
Pillar 1 addresses the minimum regulatory capital requirements for the three main risk types that a bank may face: credit risk, market risk and operational risk.
☞ Credit risk requirements can be calculated using three different levels of sophistication, i.e. standardised approach, foundation IRB and advanced IRB. IRB stands for “Internal Rating-Based Approach”.
• HNB uses the standardised approach as per current regulatory requirements. The IRB methods are being tested and plausibility data checks being carried out in the systems
☞ For market risk there are two methods, the standardised approach and the internal model approach (IMA).
• The Bank uses the standardised approach as per current regulatory requirements.
• The requirements under the IMA model using value at risk (VaR) methodology have also been calculated. However as the results are very similar due to the Bank’s very small trading book i.e. 1% of total assets, a parallel run is done once a year for comparative purposes.
☞ For operational risk, there are three different approaches, the basic indicator approach (BIA), the standardised approach (TSA) and the advanced measurement approach (AMA). Banks in Sri Lanka are allowed to apply the TSA or the alternative standardised approach (ASA) after approval has been obtained from the CBSL. The ASA was introduced by the regulator to facilitate the grouping of business lines.
• Currently, the Bank applies the BIA model for the measurement of operational risk with a parallel run being carried out for the ASA. Based on results the Bank hopes to move to the ASA in 2015.
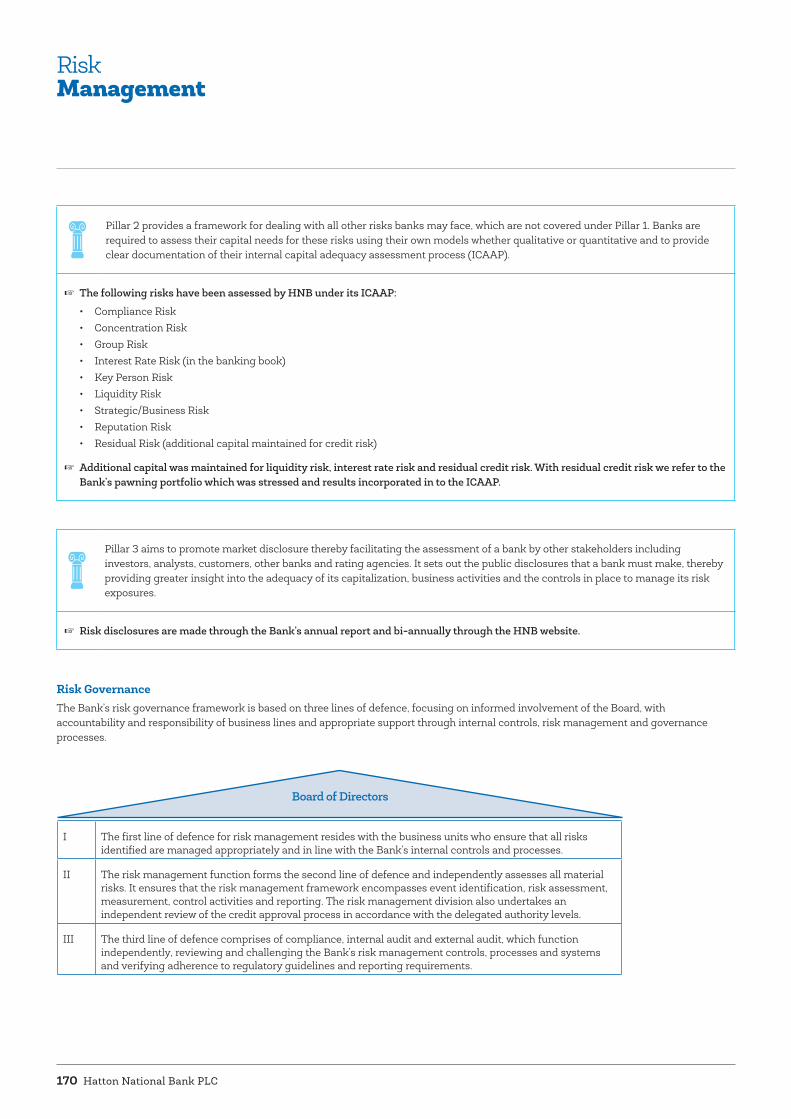
Hatton National Bank PLC170
Board of Directors
Pillar 2 provides a framework for dealing with all other risks banks may face, which are not covered under Pillar 1. Banks are required to assess their capital needs for these risks using their own models whether qualitative or quantitative and to provide clear documentation of their internal capital adequacy assessment process (ICAAP).
☞ The following risks have been assessed by HNB under its ICAAP:
• Compliance Risk• Concentration Risk• Group Risk• Interest Rate Risk (in the banking book)• Key Person Risk• Liquidity Risk• Strategic/Business Risk • Reputation Risk• Residual Risk (additional capital maintained for credit risk)
☞ Additional capital was maintained for liquidity risk, interest rate risk and residual credit risk. With residual credit risk we refer to the Bank’s pawning portfolio which was stressed and results incorporated in to the ICAAP.
Pillar 3 aims to promote market disclosure thereby facilitating the assessment of a bank by other stakeholders including investors, analysts, customers, other banks and rating agencies. It sets out the public disclosures that a bank must make, thereby providing greater insight into the adequacy of its capitalization, business activities and the controls in place to manage its risk exposures.
☞ Risk disclosures are made through the Bank’s annual report and bi-annually through the HNB website.
Risk Governance The Bank’s risk governance framework is based on three lines of defence, focusing on informed involvement of the Board, with accountability and responsibility of business lines and appropriate support through internal controls, risk management and governance processes.
I The first line of defence for risk management resides with the business units who ensure that all risks identified are managed appropriately and in line with the Bank’s internal controls and processes.
II The risk management function forms the second line of defence and independently assesses all material risks. It ensures that the risk management framework encompasses event identification, risk assessment, measurement, control activities and reporting. The risk management division also undertakes an independent review of the credit approval process in accordance with the delegated authority levels.
III The third line of defence comprises of compliance, internal audit and external audit, which function independently, reviewing and challenging the Bank’s risk management controls, processes and systems and verifying adherence to regulatory guidelines and reporting requirements.
RiskManagement

Annual Report 2014 171
HNB’s approach to managing risk is to combine the specialized knowledge of its business units and risk professionals with the experience of the Bank’s corporate management and it’s Board. HNB’s Board is ultimately responsible for risk management and sets the tone at the top for an effective management of risk through its strategic goals and high-level objectives.
In discharging its risk governance responsibility, HNB’s Board operates through two key committees:
1. The Board Integrated Risk Management Committee (BIRMC) and
2. The Board Audit Committee (BAC).
The Board Integrated Risk Management Committee (BIRMC) sets the Bank’s risk appetite and policy guidelines and assists the Board in fulfilling its responsibilities relating to the oversight of HNB’s risk management strategies, policies and processes that have the potential to impact significantly the Bank’s earnings performance, capital protection and reputation. The approach involves active
monitoring of the level of risk exposure against the Bank’s risk appetite.
Under supervision of the BIRMC, the Bank’s Non-Performing Advances (NPA) as a % of Loans and Advances reached a record low in 2014, as the Bank was able to intensify its recovery efforts leading to the settlement of several NPAs.
The Board Audit Committee (BAC) provides its assessment on the effectiveness of internal audit and external disclosure in line with accounting policies and financial reporting to the Board.
Several Executive Management Committees each with specialized focus support the BIRMC and are responsible for the coordination of risk matters for the different business areas (see Risk Governance Structure page 172).
In order to strengthen surveillance on its Group entities, the Bank has established subsidiary level Risk Management Committees and instituted a reporting framework for the individual companies. HNB’s Group entities report to the Bank’s BIRMC on risk matters.
HNB’s Risk Management Division is independent of the business units it monitors. It plays a central role in monitoring the Bank’s risk appetite and partners with the business lines to ensure that risk management is truly ingrained in HNB’s corporate culture. The Bank’s Chief Risk Officer (CRO) reports directly to the BIRMC. The CRO has a secondary reporting line to the Chief Operating Officer (COO) on administrative matters.
A separate Recoveries and Credit Quality Management Division is responsible for ensuring the accuracy of classifications on non-performing loans and provisioning per regulatory requirements. The team also manages problem credits and drives recovery efforts across the Bank.
Key functions of the BIRMC
☞ Establish the risk culture of the Bank and provide direction on risk management enhancements in the day to day decision making process.
☞ Review and approve the Bank’s risk appetite and risk parameters, covering all types, levels, and concentrations of risk.
☞ Promote constructive discussions on risk matters with the CRO and other committee members, challenging management on risk-related decisions and processes.
☞ Review compliance and regulatory risk issues.
☞ Obtain reasonable assurance and be confident that management has identified the relevant risks that could affect the ability of the business to achieve its strategic goals.
☞ Review progress on the Basel II framework. and implementation of Basel III
☞ Review the Bank’s Disaster Recovery and Business Continuity Plan

Hatton National Bank PLC172
Risk AppetiteHNB’s risk appetite can be expressed as the amount of risk the Bank is willing to accept in pursuit of its return objectives. The risk appetite framework is overseen by HNB’s Board and adherence is monitored and controlled by the Risk Management function. Key performance and risk measures are tracked and reported regularly to the Board, the responsible Committees and Corporate Management with escalation at each level depending on the severity of the breach.
The Bank’s risk appetite is monitored quantitatively through risk measures such as prudent risk limits, capital adequacy requirements and stress testing. Qualitative monitoring takes place through sound policies, procedures and controls meant to limit risk. The defined risk tolerance limits provide a basis for controlling the Bank’s business activities. It sets boundaries aligning the Bank’s business strategy with stakeholder expectations.
Risk Management and Monitoring HNB’s risk management framework incorporates active management and monitoring of credit, liquidity, market and operational risks. The Bank also monitors interest rate risk (in the banking book) as well as compliance risk on a regular basis. Other risk areas identified and monitored are concentration risk, group risk and business/strategy risk.
RiskManagement
Risk Governance Structure
Board Audit Committee
Compliance Officer
Risk Management Division
Credit Risk (Commercial
& Retail)
Business Units
Credit Administration
Credit Risk Monitoring
Market Risk
Operational Risk
Special Projects
Board of Directors
Board Integrated Risk Management Committee
Chief Risk Officer
Chief Operating Officer
Executive Risk Management
Committee
Management Committees
Asset & Liability Management
Committee
Credit Policy Committee
Investment Committee
IT Steering Committee
Direct line of reportingIndirect line of reporting
Managing Director / CEO

Annual Report 2014 173
Credit Risk Credit risk can be defined as the risk of a potential loss to the Bank when a borrower or counterparty fails to complete its contractual obligations when they fall due.
Granting loans and advances is the core business of HNB and as such credit risk is its most material risk. The credit risk that we face arises primarily from Corporate Banking, SMEs and Retail exposures. Given the scale and materiality of the Bank’s loan book, managing the credit quality of the lending portfolio is a key focus area with the objective of minimising probable losses and maintaining credit risk exposure within acceptable parameters. The Bank’s credit portfolio remains well diversified by customer, business segment and sector.
Credit Risk Policy HNB’s Credit Policy approved by the Board Credit /Assets & Liabilities Committee (BCALC) plays a central and strategic role in managing daily business activities. The policy defines the principles encompassing client selection, due diligence, early alert reporting, tolerable levels of concentration risk and portfolio monitoring, in line with the Bank’s risk appetite. The approach is to avoid large credit risk on a counterparty or portfolio level by applying stringent underwriting standards combined with sound collateralisation where feasible.
The policy is reviewed regularly by the BCALC and updated throughout the year to ensure consistency with the Bank’s business strategy. A monthly Credit Policy Committee meeting chaired by the Chief Executive Officer drives policy decisions and implementation plans.
Credit System and Approval Structure The Bank’s credit system provides the foundation for an efficient, automated credit appraisal process that allows easy access to details on any given facility. The system is used for Corporate, SME and Retail customer segments across the network. The credit system ensures that a basis for decision, including case comments, current credit exposure and financial statements is created and stored. Credit exposure is based on real-time information, and a credit file is electronically routed to the appropriate
Manager or Committee. The delegated credit approval structure and the associated processes ensure the efficient administration and control of the lending limits given to the officers in the approval cycle.
Credit Rating Models
Corporate and SME Rating ModelsThe Bank uses four credit rating models to rate its corporate clients and SMEs, focusing on aspects of operating risks, financial risks and account/facility conduct.
For corporates and SMEs, nine rating grades from AAA to C have been defined. A rating of ‘AA’ implies for example a very high credit worthiness and very low expectation of credit risk. It indicates a very strong capacity for timely payment of financial commitments and is not significantly vulnerable to foreseeable adverse industry and economic conditions. The rating further denotes a high level of professionalism in management and growing financial position.
Retail Rating ModelsUnlike the rating models for Corporate and SME, the scoring models for the retail segment were developed using the Bank’s internal portfolio characteristics and the account behaviour observed therein. Some of the significant variables derived for instance for the retail segment home loan model are age, gender, civil status, number of dependents, net worth (assets minus liabilities) and income.
Corporate Banking Portfolio based on Internal Risk Rating
2013
2014
0%
5%
10%
15%
20%
25%
30%
AAA AA A BBB CCC andbelow
BB B
The quality of the Bank’s corporate loan book improved in the investment grade category (AAA to BBB) to 80% in 2014 as compared to 77% in 2013. Areas of focus have been the high risk accounts (internally risk rated B and below) and increased watch-listing.
The following chart shows the quality of the corporate banking portfolio based on internal risk ratings.

Hatton National Bank PLC174
Credit ProcessesThe Bank’s credit processes can be summarised as follows:
Loan Origination and Risk Appraisal
Screening and appraisal where the evaluation focuses on the borrower’s ability to meet his or her obligations in a timely manner with collateral and guarantees forming an important part of the credit risk mitigation process.
Credit Approval and Sanction Guidelines for loan approvals / renewals by adopting a committee based approval structure, where all approving signatories carry equal responsibility for credit risk.
Credit Administration and Disbursement
HNB’s Corporate Banking loan portfolio is administered through a centralized Credit Administration Division which ensures efficient and effective post sanction customer support including disbursement, settlements, processing renewal notices and advising customers on interest rate amendments.
Credit Measurement and Monitoring
The Credit Risk Monitoring Division measures and tracks the status of the credit portfolio, undertakes impact studies and detects early warning signals pointing to a deterioration in the financial health of a borrower.
A credit risk dashboard is prepared monthly to review high level credit portfolio concentration and assess performance against internal limits (board risk appetite) and regulatory requirements.
An internally developed Business Intelligence System (‘KPI Wizard’) is in place to evaluate credit risk indicators at branch, regional and bank level.
Accountability for credit risk performance is vested with individual business units and unhealthy trends addressed at all levels.
Recoveries Problem credits and Non Performing Advances are managed by the Recoveries and Credit Quality Division. The team is responsible for all aspects of an overdue facility, follow up of rescheduled facilities, monitoring the value of the applicable collateral and liquidation, scrutiny of legal documents and liaising with the customer until all recovery matters are finalized.
This division’s activities are seamlessly integrated with Credit Administration and Credit Risk Management to ensure effective follow up.
Back Office recovery functions representing non performing advances classification, rescheduling, provisioning and valuation of collateral on delinquent assets is centralised to ensure standardisation and accuracy.
Credit Concentration RiskCredit concentration risk is the risk of a loss to the Bank as a result of excessive build-up of exposure to a single counterparty or counterparty segment, industry, product or geographical location. This concentration typically exists where a number of counterparties are engaged in similar activities and have similar characteristics, which could result in their inability to meet contractual obligations being similarly affected by changes in economic or environmental conditions.
The monitoring of credit concentration is an integral part of the credit risk monitoring
process. Methodology based on indexing techniques such as the Herfindahl-Hirschman Index (HHI), analysis of key ratios, internally developed limit models and stress tests are applied to measure and monitor credit concentration in the Bank’s loan portfolio.
To manage industry concentration in its loan portfolio, the Bank has developed a credit model to define limits for the key industries where exposure is high and/or industries where the Bank sees potential for high growth. The model is based on factors involving industry as a % of core capital, top 20 customer exposure, industry risk rating
and industry exposure relative to country GDP. Regulatory limits for single borrower and selective industry types add another dimension to measuring and monitoring credit concentration risk. The individual industry limits are monitored and reported in the credit risk dashboard.
Furthermore, sensitivity analysis on the likelihood of the Bank’s top 20 customers going into default and the impact of this event on the Bank’s capital adequacy ratio (CAR) is assessed and results monitored on a regular basis. (See Stress Testing section pages 187 to 189).
RiskManagement

Annual Report 2014 175
Geographical Concentration
WesternSouthernUvaNorth CentralNorth Western
73%
70%
4%
2%2%
5%
3%5%
3%6%
4%2%2%4%
3%3%
3%6%
EasternNorthernSabaragamuwa Central
2014 2013
Growth of the credit portfolio continued across all provinces in 2014. The high distribution in the Western Province is mainly due to project accounts being booked in Head Office.
Industry Concentration
Agriculture & FishingManufacturingTourismTransportConstructionTraders New Economy
6%
3%
6%
2%
15%21%
1%
11%
6%
6%1% 4% 5%
12%
10%
14%18%
1%
9%
5%
6%
11%1%
15%
1% 10%
Financial and Business Serv.InfrastructureOther ServicesCredit CardPawningOther
20132014
Apart from pawning which decreased to 4% in 2014 as compared to 11% in 2013, the industrial concentration of the Bank’s credit portfolio remained broadly consistent with 2013.
Exposure by Counterparty
Large Corporates >Rs.1bnMid Market Rs. 200mn -1bnSME Rs.100mn -200mnSME Rs.15mn-100mnSME < Rs.15mn /Individuals
17%
5%
17%
6%16%
11%
6%
7%
3%
6%5%
23%
14%13%
4%
7%
3%
13%
6%18%
Development LoansHousingPersonal LoansPawningLeasing
2014 2013
Credit growth was mainly led by Large Corporates in Construction and Financial Services, including Government Agencies. Exposure to SMEs also increased mostly in the trading sector. Pawning on the other hand has decreased significantly in volume due to a more cautious lending regime for gold backed products following the collapse of gold prices in 2013.
Material Exposure
Credit Portfolio Excluding Material ExposureMaterial Exposure as a % of Total Exposure
82%
18%
84%
16%
20132014
The material exposure of the loan book has decreased by 2% in 2014, as compared to 2013.
Credit Risk MitigationThe Bank uses a range of strategies to actively mitigate credit risk such as netting and set-off, use of collateral and risk transfer through insurance. Detailed policies and processes are in place to ensure that credit risk mitigation is appropriately applied and recorded.
Collateral Collateral is a key factor used by the Bank to mitigate credit risk when granting loans. Collateral can be seen as security provided by borrowers in the form of an asset or third party obligation which helps the Bank to mitigate a possible credit loss in the event of a default. It also ensures a satisfactory degree of protection for
G4-9, FS-6
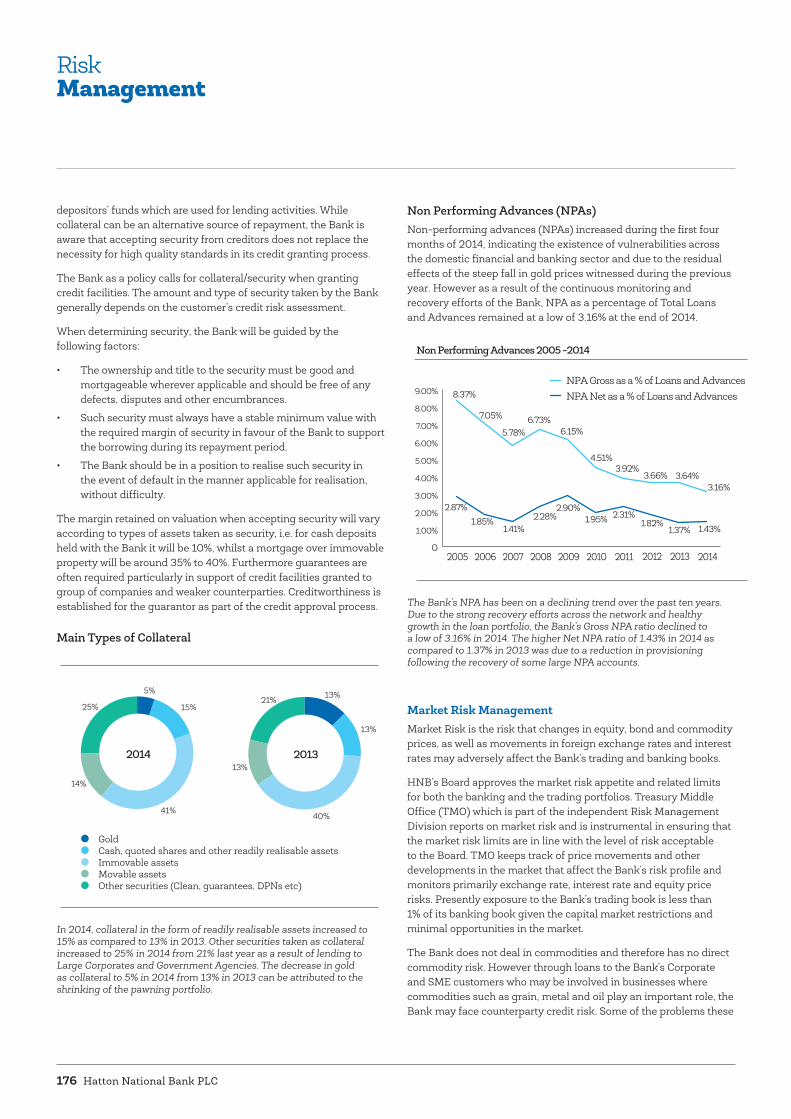
Hatton National Bank PLC176
depositors’ funds which are used for lending activities. While collateral can be an alternative source of repayment, the Bank is aware that accepting security from creditors does not replace the necessity for high quality standards in its credit granting process.
The Bank as a policy calls for collateral/security when granting credit facilities. The amount and type of security taken by the Bank generally depends on the customer’s credit risk assessment.
When determining security, the Bank will be guided by the following factors:
• The ownership and title to the security must be good and mortgageable wherever applicable and should be free of any defects, disputes and other encumbrances.
• Such security must always have a stable minimum value with the required margin of security in favour of the Bank to support the borrowing during its repayment period.
• The Bank should be in a position to realise such security in the event of default in the manner applicable for realisation, without difficulty.
The margin retained on valuation when accepting security will vary according to types of assets taken as security, i.e. for cash deposits held with the Bank it will be 10%, whilst a mortgage over immovable property will be around 35% to 40%. Furthermore guarantees are often required particularly in support of credit facilities granted to group of companies and weaker counterparties. Creditworthiness is established for the guarantor as part of the credit approval process.
Main Types of Collateral
GoldCash, quoted shares and other readily realisable assetsImmovable assetsMovable assetsOther securities (Clean, guarantees, DPNs etc)
41%
14%
25%
5%
15%
40%
13%
21% 13%
13%
2014 2013
In 2014, collateral in the form of readily realisable assets increased to 15% as compared to 13% in 2013. Other securities taken as collateral increased to 25% in 2014 from 21% last year as a result of lending to Large Corporates and Government Agencies. The decrease in gold as collateral to 5% in 2014 from 13% in 2013 can be attributed to the shrinking of the pawning portfolio.
Non Performing Advances (NPAs) Non-performing advances (NPAs) increased during the first four months of 2014, indicating the existence of vulnerabilities across the domestic financial and banking sector and due to the residual effects of the steep fall in gold prices witnessed during the previous year. However as a result of the continuous monitoring and recovery efforts of the Bank, NPA as a percentage of Total Loans and Advances remained at a low of 3.16% at the end of 2014.
Non Performing Advances 2005 -2014
0
1.00%
2.00%
3.00%
4.00%
5.00%
6.00%
7.00%
8.00%
9.00%
2005 2006 2007 2008 2009 2010 2011 20132012
NPA Gross as a % of Loans and AdvancesNPA Net as a % of Loans and Advances
2014
8.37%
7.05% 6.73%6.15%
4.51%3.92%
3.66% 3.64%3.16%
5.78%
2.87%1.85%
1.41%2.28%
2.90%1.95% 2.31%
1.82%1.37% 1.43%
The Bank’s NPA has been on a declining trend over the past ten years. Due to the strong recovery efforts across the network and healthy growth in the loan portfolio, the Bank’s Gross NPA ratio declined to a low of 3.16% in 2014. The higher Net NPA ratio of 1.43% in 2014 as compared to 1.37% in 2013 was due to a reduction in provisioning following the recovery of some large NPA accounts.
Market Risk Management Market Risk is the risk that changes in equity, bond and commodity prices, as well as movements in foreign exchange rates and interest rates may adversely affect the Bank’s trading and banking books.
HNB’s Board approves the market risk appetite and related limits for both the banking and the trading portfolios. Treasury Middle Office (TMO) which is part of the independent Risk Management Division reports on market risk and is instrumental in ensuring that the market risk limits are in line with the level of risk acceptable to the Board. TMO keeps track of price movements and other developments in the market that affect the Bank’s risk profile and monitors primarily exchange rate, interest rate and equity price risks. Presently exposure to the Bank’s trading book is less than 1% of its banking book given the capital market restrictions and minimal opportunities in the market.
The Bank does not deal in commodities and therefore has no direct commodity risk. However through loans to the Bank’s Corporate and SME customers who may be involved in businesses where commodities such as grain, metal and oil play an important role, the Bank may face counterparty credit risk. Some of the problems these
RiskManagement
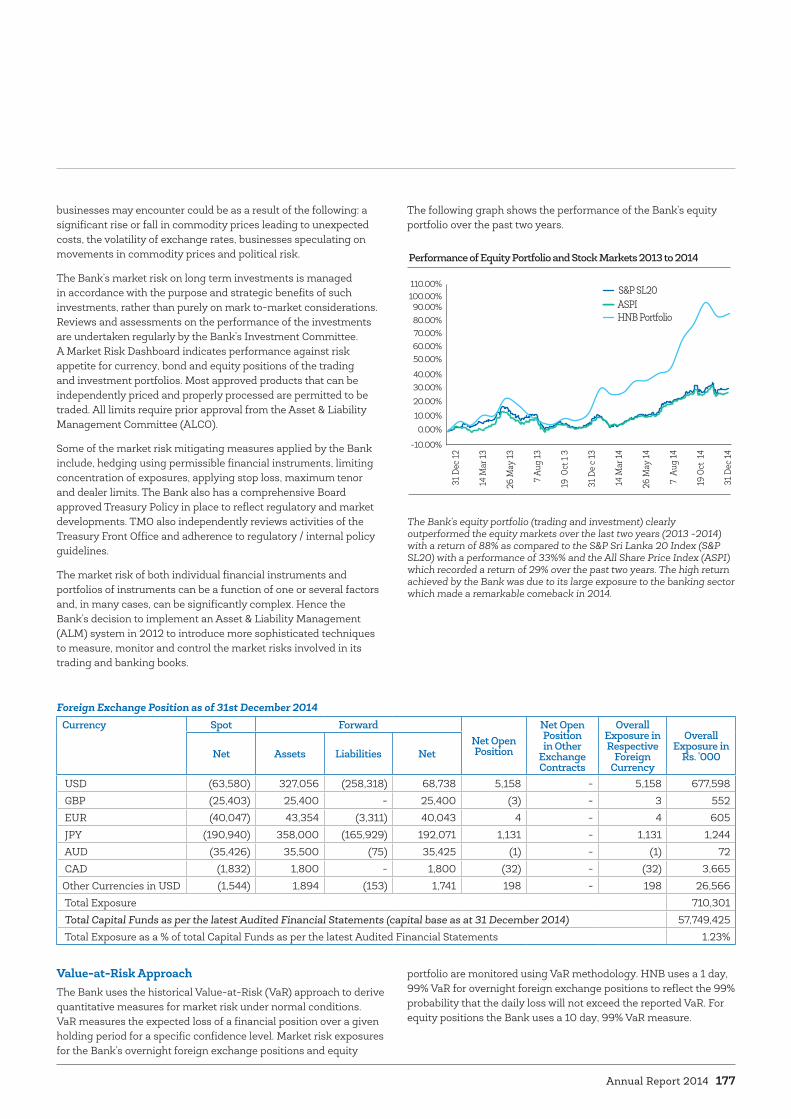
Annual Report 2014 177
businesses may encounter could be as a result of the following: a significant rise or fall in commodity prices leading to unexpected costs, the volatility of exchange rates, businesses speculating on movements in commodity prices and political risk.
The Bank’s market risk on long term investments is managed in accordance with the purpose and strategic benefits of such investments, rather than purely on mark to-market considerations. Reviews and assessments on the performance of the investments are undertaken regularly by the Bank’s Investment Committee. A Market Risk Dashboard indicates performance against risk appetite for currency, bond and equity positions of the trading and investment portfolios. Most approved products that can be independently priced and properly processed are permitted to be traded. All limits require prior approval from the Asset & Liability Management Committee (ALCO).
Some of the market risk mitigating measures applied by the Bank include, hedging using permissible financial instruments, limiting concentration of exposures, applying stop loss, maximum tenor and dealer limits. The Bank also has a comprehensive Board approved Treasury Policy in place to reflect regulatory and market developments. TMO also independently reviews activities of the Treasury Front Office and adherence to regulatory / internal policy guidelines.
The market risk of both individual financial instruments and portfolios of instruments can be a function of one or several factors and, in many cases, can be significantly complex. Hence the Bank’s decision to implement an Asset & Liability Management (ALM) system in 2012 to introduce more sophisticated techniques to measure, monitor and control the market risks involved in its trading and banking books.
The following graph shows the performance of the Bank’s equity portfolio over the past two years.
Performance of Equity Portfolio and Stock Markets 2013 to 2014
-10.00%
0.00%10.00%
20.00%30.00%40.00%
50.00%60.00%70.00%
110.00%
90.00%80.00%
100.00%
31 D
ec 12
14 M
ar 13
26 M
ay 13
7 Au
g 13
19 O
ct 1
3
31 D
e c 1
3
14 M
ar 14
26 M
ay 14
7 A
ug 14
19 O
ct 1
4
31 D
ec 14
S&P SL20ASPIHNB Portfolio
The Bank’s equity portfolio (trading and investment) clearly outperformed the equity markets over the last two years (2013 -2014) with a return of 88% as compared to the S&P Sri Lanka 20 Index (S&P SL20) with a performance of 33%% and the All Share Price Index (ASPI) which recorded a return of 29% over the past two years. The high return achieved by the Bank was due to its large exposure to the banking sector which made a remarkable comeback in 2014.
Foreign Exchange Position as of 31st December 2014 Currency Spot Forward
Net Open Position
Net Open Position in Other
Exchange Contracts
Overall Exposure in Respective
Foreign Currency
Overall Exposure in
Rs. '000Net Assets Liabilities Net
USD (63,580) 327,056 (258,318) 68,738 5,158 - 5,158 677,598 GBP (25,403) 25,400 - 25,400 (3) - 3 552 EUR (40,047) 43,354 (3,311) 40,043 4 - 4 605 JPY (190,940) 358,000 (165,929) 192,071 1,131 - 1,131 1,244 AUD (35,426) 35,500 (75) 35,425 (1) - (1) 72 CAD (1,832) 1,800 - 1,800 (32) - (32) 3,665 Other Currencies in USD (1,544) 1,894 (153) 1,741 198 - 198 26,566 Total Exposure 710,301 Total Capital Funds as per the latest Audited Financial Statements (capital base as at 31 December 2014) 57,749,425 Total Exposure as a % of total Capital Funds as per the latest Audited Financial Statements 1.23%
Value-at-Risk ApproachThe Bank uses the historical Value-at-Risk (VaR) approach to derive quantitative measures for market risk under normal conditions. VaR measures the expected loss of a financial position over a given holding period for a specific confidence level. Market risk exposures for the Bank’s overnight foreign exchange positions and equity
portfolio are monitored using VaR methodology. HNB uses a 1 day, 99% VaR for overnight foreign exchange positions to reflect the 99% probability that the daily loss will not exceed the reported VaR. For equity positions the Bank uses a 10 day, 99% VaR measure.

Hatton National Bank PLC178
Value at Risk Analysis Dec-14 Dec-13
Value at Risk (VaR) Value at Risk (VaR)
Foreign Currency Risk* (USD net open position)Rs. (99%, 1 day) Rs. (99%, 1 day)
746,768 0.11% 1,573,561 0.17%
Value at Risk (VaR) Value at Risk (VaR)
Equity Risk (Trading portfolio) Rs. (99%, 10 days) Rs. (99%, 10 days)22,801,643 4.19% 15,777,600 5.19%
* Over 95% of the Bank’s foreign currency risk is to the USD.
Although VaR is a valuable guide to risk, the Bank is aware of its limitations such as the use of historical data as a proxy for estimating future events, which may not encompass all potential events, particularly those which are extreme in nature, the assumption that all positions can be liquidated in 1 or 10 days and the use of a 99% confidence level which does not take into account losses that might occur beyond this level of confidence.
Internal Model Approach (IMA)Capital computations for market risk under Pillar I of the Basel II Accord define two broad approaches, the standardised or internal models approach (IMA). Currently the CBSL has directed banks to adopt the former “Standardised Measurement Method” approach for the computation of required capital for market risk. However a roadmap for implementation of the IT infrastructure to enable banks to move to the advance approach has also been provided.
The Internal Models Approach (IMA) has several incremental qualitative and quantitative requirements. In order for banks to qualify to use IMA, they will need to develop the market risk charge based on daily value at risk (VaR).
To analyse the position of HNB in the event of adopting IMA, the Bank started computing the capital charge for market risk since 2013. Due to the size of the trading portfolio (1% of banking book) and the resulting minimal impact on CAR observed in the past two years (2013 and 2014) when applying IMA, the Bank will continue to use the standardised approach in computing the market risk charge weighing the consequences of added value and cost effectiveness in implementing IMA.
Market Risk charge under IMA (Trading Book)Product IMA
ApproachCurrent
ApproachDifference
Rs Mn Rs Mn Rs Mn
Foreign Exchange & Gold 60.28 70.60 10.32Equity 199.72 67.46 -132.25Interest Rate Products 0.58 0.07 -0.51Total 260.58 138.14 -122.44Capital 57,749 57,749Risk Weighted Assets 389,473 389,350Capital Adequacy Ratio 14.83% 14.83% 0.005%
Interest Rate Risk (Banking Book)Interest rate risk in the banking book arises from the structural interest rate risk caused by the differing re-pricing characteristics of the bank’s assets and liabilities.
The Bank is exposed to interest rate risk arising from a fixed rate liability book where re-pricing is slower than the majority of loan portfolio on fixed rates (notable exceptions being the entire corporate banking portfolio and some mid-market exposures on floating rates. However, almost the entire deposit base contractually or otherwise can be re-priced within a year which is an additional strength, which serves to reduce our vulnerability to interest rate risks. Interest rate risk is assessed through regular review of net interest yields by product to ensure interest rate margins and spreads are maintained and revisiting asset and liability pricing in line with our expectations on the interest yield curve.
The Bank’s ALM system is used to monitor the gap between the Bank’s interest rate sensitive assets (RSA) and interest rate sensitive liabilities (RSL) for the different maturity buckets. This allows the Bank to determine the change in the Bank’s interest income due to a change in interest rates.
While gap analysis is a useful one, the Bank does recognize its limitations for instance option features of deposit instruments and loans are not readily available, interest rate on assets and liabilities do not always move in the same magnitude and speed, re-pricing of investments or funds may roll over at rates significantly different to current rates.
RiskManagement
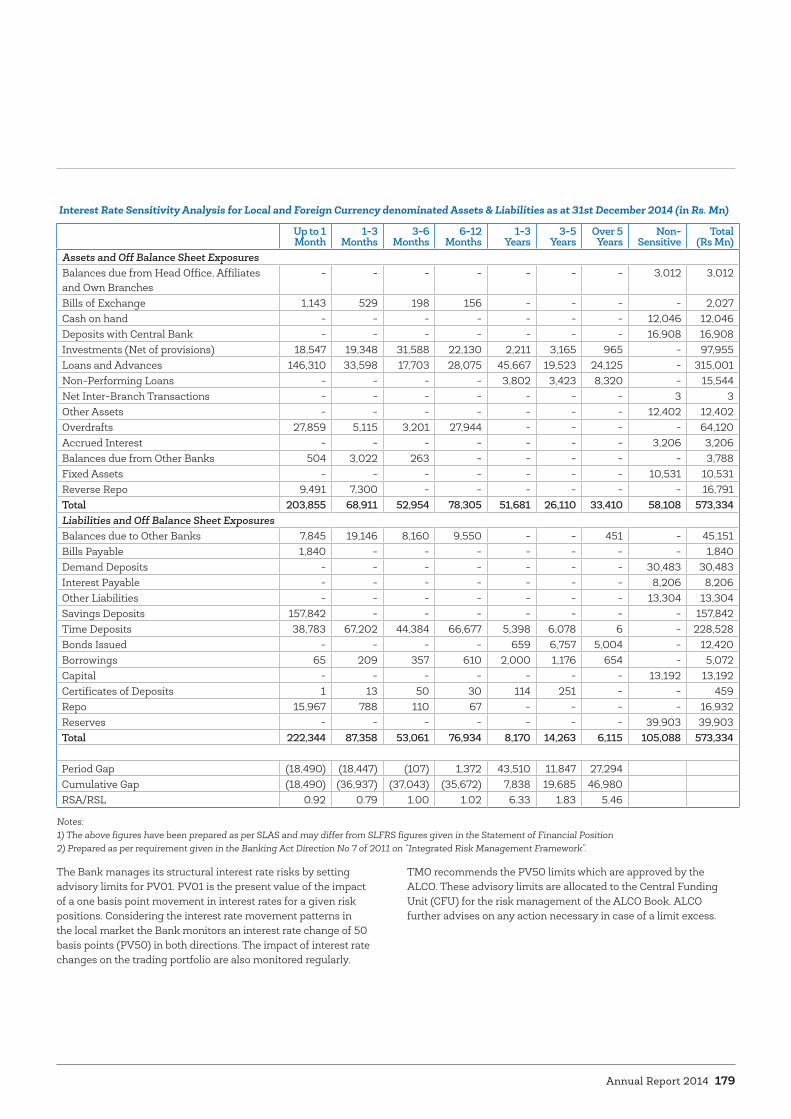
Annual Report 2014 179
Interest Rate Sensitivity Analysis for Local and Foreign Currency denominated Assets & Liabilities as at 31st December 2014 (in Rs. Mn)
Up to 1 Month
1-3 Months
3-6 Months
6-12 Months
1-3 Years
3-5 Years
Over 5 Years
Non-Sensitive
Total (Rs Mn)
Assets and Off Balance Sheet ExposuresBalances due from Head Office, Affiliates and Own Branches
- - - - - - - 3,012 3,012
Bills of Exchange 1,143 529 198 156 - - - - 2,027 Cash on hand - - - - - - - 12,046 12,046 Deposits with Central Bank - - - - - - - 16,908 16,908 Investments (Net of provisions) 18,547 19,348 31,588 22,130 2,211 3,165 965 - 97,955 Loans and Advances 146,310 33,598 17,703 28,075 45,667 19,523 24,125 - 315,001 Non-Performing Loans - - - - 3,802 3,423 8,320 - 15,544 Net Inter-Branch Transactions - - - - - - - 3 3 Other Assets - - - - - - - 12,402 12,402 Overdrafts 27,859 5,115 3,201 27,944 - - - - 64,120 Accrued Interest - - - - - - - 3,206 3,206 Balances due from Other Banks 504 3,022 263 - - - - - 3,788 Fixed Assets - - - - - - - 10,531 10,531 Reverse Repo 9,491 7,300 - - - - - - 16,791 Total 203,855 68,911 52,954 78,305 51,681 26,110 33,410 58,108 573,334 Liabilities and Off Balance Sheet Exposures Balances due to Other Banks 7,845 19,146 8,160 9,550 - - 451 - 45,151 Bills Payable 1,840 - - - - - - - 1,840 Demand Deposits - - - - - - - 30,483 30,483 Interest Payable - - - - - - - 8,206 8,206 Other Liabilities - - - - - - - 13,304 13,304 Savings Deposits 157,842 - - - - - - - 157,842 Time Deposits 38,783 67,202 44,384 66,677 5,398 6,078 6 - 228,528 Bonds Issued - - - - 659 6,757 5,004 - 12,420 Borrowings 65 209 357 610 2,000 1,176 654 - 5,072 Capital - - - - - - - 13,192 13,192 Certificates of Deposits 1 13 50 30 114 251 - - 459 Repo 15,967 788 110 67 - - - - 16,932 Reserves - - - - - - - 39,903 39,903 Total 222,344 87,358 53,061 76,934 8,170 14,263 6,115 105,088 573,334
Period Gap (18,490) (18,447) (107) 1,372 43,510 11,847 27,294 Cumulative Gap (18,490) (36,937) (37,043) (35,672) 7,838 19,685 46,980 RSA/RSL 0.92 0.79 1.00 1.02 6.33 1.83 5.46
Notes:1) The above figures have been prepared as per SLAS and may differ from SLFRS figures given in the Statement of Financial Position2) Prepared as per requirement given in the Banking Act Direction No 7 of 2011 on “Integrated Risk Management Framework”.
The Bank manages its structural interest rate risks by setting advisory limits for PV01. PV01 is the present value of the impact of a one basis point movement in interest rates for a given risk positions. Considering the interest rate movement patterns in the local market the Bank monitors an interest rate change of 50 basis points (PV50) in both directions. The impact of interest rate changes on the trading portfolio are also monitored regularly.
TMO recommends the PV50 limits which are approved by the ALCO. These advisory limits are allocated to the Central Funding Unit (CFU) for the risk management of the ALCO Book. ALCO further advises on any action necessary in case of a limit excess.

Hatton National Bank PLC180
Liquidity Risk ManagementLiquidity risk arises when the Bank cannot maintain or generate sufficient funds to meet its payment obligations as they fall due or can only do so at a material loss. This can arise when counterparties who provide funding to the Bank withdraw or do not roll over a line of funding or as a result of a general disruption in financial markets which lead to normal liquid assets becoming illiquid.
The main sources of the Bank’s funding are capital, core deposits from retail and commercial clients, wholesale deposits and access to borrowed funds from the interbank money market. The Bank also maintains a portfolio of readily marketable securities to further strengthen its liquidity position. The Bank’s loan book is comfortably financed by retail deposits. Hence reliance on wholesale deposits and the interbank market is low. The lack of long term borrowing instruments at affordable cost results in some maturity mismatch in the asset book (borrow short and lend long).
HNB manages liquidity risk in accordance with regulatory guidelines and international best practices. A Board approved Liquidity Policy is in place to manage liquidity on a day-to-day basis. Furthermore a Contingency Funding Plan to deal with a crisis situation is part of the Liquidity Management process. Contractual maturity of assets and liabilities, liquidity ratios to include adherence to regulatory requirements and monthly liquidity forecasts generated from the ALM system are reviewed at ALCO meetings. Furthermore liquidity stress tests are carried out to assess the impact of extreme events.
TMO under the purview of the Chief Risk Officer monitors the asset-liability position with oversight and supervision from the ALCO. A monthly liquidity gap is computed for each currency together with the overall gap position. Liquidity gap is based on the expected realisation of the assets and liabilities, which are determined based on contractual maturities as well as behavioural assumptions. The net liquidity position reported for the month is monitored against the pre-set limits which have been approved by the ALCO.
The following table shows the liquidity gap analysis (contractual) for the Bank’s foreign currency assets and liabilities.
Liquidity Gap Analysis (contractual) for Foreign Currency denominated Assets and Liabilities as at 31st December 2014 (in Mn) Up to 1
Month1-3
Months3-6
Months6-9
Months9-12
Months1-3 Years 3-5 Years Over 5
YearsTotal
Total Assets 28,861 22,039 33,484 10,867 8,914 23,584 14,789 4,845 147,384Total Liabilities 38,381 24,283 22,315 11,150 10,213 14,801 11,426 10,805 143,375Net Liquidity Gap (9,520) (2,244) 11,169 (283) (1,300) 8,783 3,363 (5,960) 4,009 Cumulative Gap (9,520) (11,764) (594) (878) (2,177) 6,606 9,969 4,009 8,018
The Bank also monitors liquidity gaps based on the behavioural analysis of the Bank’s assets and liabilities with the following assumptions:
• Behaviour of fixed deposit roll-overs based on historical roll-over patterns
• Unutilised overdrafts are assumed to be utilised on straight line basis over a year
• Undisbursed loans to be disbursed 75% within the year and 25% within one to three years.
• 40% of the pawning advances will be rolled over
Liquidity Gap based on the Behavioural Analysis of the Bank’s Assets and Liabilities as at 31st December 2014
-100,000
-80,000
-60,000
-40,000
-20,000
0
20,000
40,000
60,000
80,000
100,000Rs Mn Rs Mn
Up to 1M
Net Liquidity Gap Cumulative Gap
1-3M 3-6M 6-9M Over 5Y9-1Y 1-3Y 3-5Y
-80,000
-60,000
-40,000
-20,0000
20,000
40,000
60,000
80,000
1,00,000
- 100,000
The consolidated liquidity gap for the Bank as at 31st December 2014 based on behavioural analysis shows no significant gaps in the short term (up to 1 year). However a maturity mismatch exists in the asset book in the 3-5 Year and over 5 Year maturity brackets.
RiskManagement

Annual Report 2014 181
Liquidity RatiosThe following table includes some of the ratios of liquidity risk that the Bank monitors. Limits are applied in order to monitor the liquidity movements in the Bank’s assets and liabilities.
Ratios Limits Dec-14 Dec-13
Net Loans/ Total Assets max 75% 68.62% 68.97%Gross Loans/ Customer Deposits*
max 90% 96.91% 93.65%
Large Deposits/ Earning Assets
max 10% 6.06% 7.87%
Liquid Assets/ Short Term Liabilities
max 50% 51.28% 57.11%
Purchase funds / Total Assets
max 10% 10.86% 7.93%
Commitments / Total Loans
max 75% 65.57% 49.93%
Statutory Liquid Asset Ratio (LAR)
min 20% 22.81% 23.32%
* The Gross Loans to Customer Deposits ratio is above the set internal limit. The Bank has covered the loan book by interbank borrowing. All limits are internal advisory limits apart from LAR which is a statutory requirement.
Basel III ImplementationFollowing the consultation paper issued by the Central Bank of Sri Lanka in 2014 on the implementation of the Basel III Liquidity Coverage Ratio (LCR), the Bank shows comfortable ratios in the observation period for both the All Currency and the LKR Requirements as per December 2014 reporting.
Liquidity Coverage Ratios (LCR )
Limits Position as per December 2014
Reporting
All Currency Requirement min 60% 159%LKR Currency Requirement min 60% 241%
Operational Risk Management Operational Risk is the risk of losses incurring due to human errors, frauds, inadequate or failed internal processes or systems or external events including legal risk. Legal risk arises when the Bank’s business are not conducted in accordance with applicable laws, when the Bank may be liable for damages to third parties or when contractual obligations may be enforced against the Bank resulting from legal proceedings.
The objective of the Operational Risk Management (ORM) Division is to establish sound control practices to increase the effectiveness of the Bank’s resources and minimize financial losses. Operational risk is monitored on a regular basis and the operational risk management policy framework is embedded in the daily activities of all employees.
Working in conjunction with business unit managers, the ORM Division has developed tools to assist in identifying, measuring, monitoring and reporting operational risk. Risk identification techniques include highlights of audit reports, discussions with
network management, branch visits and operational risk review meetings conducted across branches.
Key Risk Indicators HNB has identified a number of Key Risk Indicators (KRIs) for the different business units in order to increase transparency of operations and identify possible sources of risk to the Bank. The information derived from these KRIs act as an early warning signal to identify a potential event that may harm our daily business activities and consequently have an impact on the Bank.
A high level operational risk dashboard is prepared monthly for monitoring purposes and for circulation to Senior Management and the Board. All branch and head office losses over a pre-defined Rupee threshold are reported. Furthermore, tolerance limits for operational losses and KRIs covering lapses and trends in credit and general operations, cash and pawning, legal, card centre, complaint management and information systems are monitored.
The KRIs contribute to an assessment of the operational risk profile of the Bank. The main purpose is to assist management by providing an early-warning indicator of potential risk exposures and/or a potential breakdown of controls.
Trend in Operational Losses Reported
Rs Mn
2010 2011 2012 2013 2014
Recoveries as a % of Operational LossesTotal Losses (Rs. Mn)
00
200
400
600
800
1000
050
100150200250300350400 100%
80%
60%
40%
20%
0%
82
2867
398
66
34%33%27%23%
33%
0
50
100
150
200
250
300
350
400
An analysis of the last 5 years operational losses shows a mixed picture with losses increasing in 2013 above the expected average losses. Operational losses decreased to Rs. 66 Mn in 2014 as compared to Rs. 398 Mn in 2013. The largest contributor to operational losses in 2014 was in the area of external frauds.

Hatton National Bank PLC182
Operational Losses Alert LevelsOperational loss levels are tracked monthly against the internal alert level. The internal alert level has been defined as 2% of turnover for total losses.
2014 2013 Alert
0.00% 0.50% 1.00% 1.50% 2.00% 2.50%
0.11%
0.69%
2.00%Tota
l Ope
ratio
nal L
osse
s
Comparison of total losses with the internal alert level over the past 2 years, show a low level of losses (0.11% in 2014 and 0.69% in 2013) in comparison to actual turnover.
The Bank uses the Basel II defined event types for loss classification and a comprehensive loss tracking database is in place containing over 5 years of information, analysed by business lines and loss incident matrix. Significant loss incidents are analysed for root causes and lessons learnt. This process includes gathering information on external events occurring in the banking industry to ensure similar incidents do not happen to HNB.
Operational Losses as per Basel II Loss Classification
Internal FraudsExternal FraudsEmployment Practice & Work Place SafetyClients Products & Business PracticesDamage to Physical AssetsBusiness Disruption & System FailuresExecution Delivery & Process Management
93%
3% 4%
43%21%
28%9%
20132014
In 2014, operational losses were spread across four loss event categories, the remaining categories showing no losses. The largest amount of losses, i.e. 43%, were attributable to “External Frauds”. The largest loss in this category was due to a fraudulent merchant activity amounting to Rs. 6.3 Mn of which Rs. 3.3. Mn was recovered during the year. In 2013, 93% of losses were in the loss event type “Execution Delivery & Process Management”.
Insurance Insurance continues to be the key risk mitigation tool for Operational Risk. The adequacy and effectiveness of insurance coverage is independently reviewed by the ORM division at least annually. Particular attention is given to low frequency high severity events for example earthquakes and other natural disasters and also to high frequency low impact events such as counterfeit notes, fake and stolen pawning articles. The Bank has also retained market expertise in order to assess and improve the insurance coverage of its risks.
Operational Loss Recoveries through Insurance
Rs Mn
2010 2011 2012 2013 2014
Recoveries through Insurance as a % of premium paidTotal Premiums Paid (Rs. Mn)
100%
80%
60%
40%
20%
0%0
10
20
13%
27% 31%46%
54
3530 30 28
33%
30
40
50
60
Insurance premiums and collections show a steady improvement from 2010 to 2013 a result of an effective monitoring of insurance claims, settlements, rejections and withdrawals on a regular basis. There are claims still pending for 2014, hence a lower recovery through insurance shown as compared to previous years.
Risk Mitigation Action• Regular meetings with regional management, branches and
support functions to ensure effectiveness of Operational Risk Meetings across the network and adequate follow up of issues identified for implementation.
• Periodic review of information security to ensure data availability, confidentiality and integrity.
• System disruptions reviewed during the year through operational KRIs.
• Due diligence continued on Mobile Banking where HNB acts as custodian bank to a leading telecommunications company
• Review of insurance adequacy and effectiveness
• Monitoring of legal cases and recovery process
• Review of operational risk processes during the year and update in line with regulatory developments and internal decisions.
RiskManagement
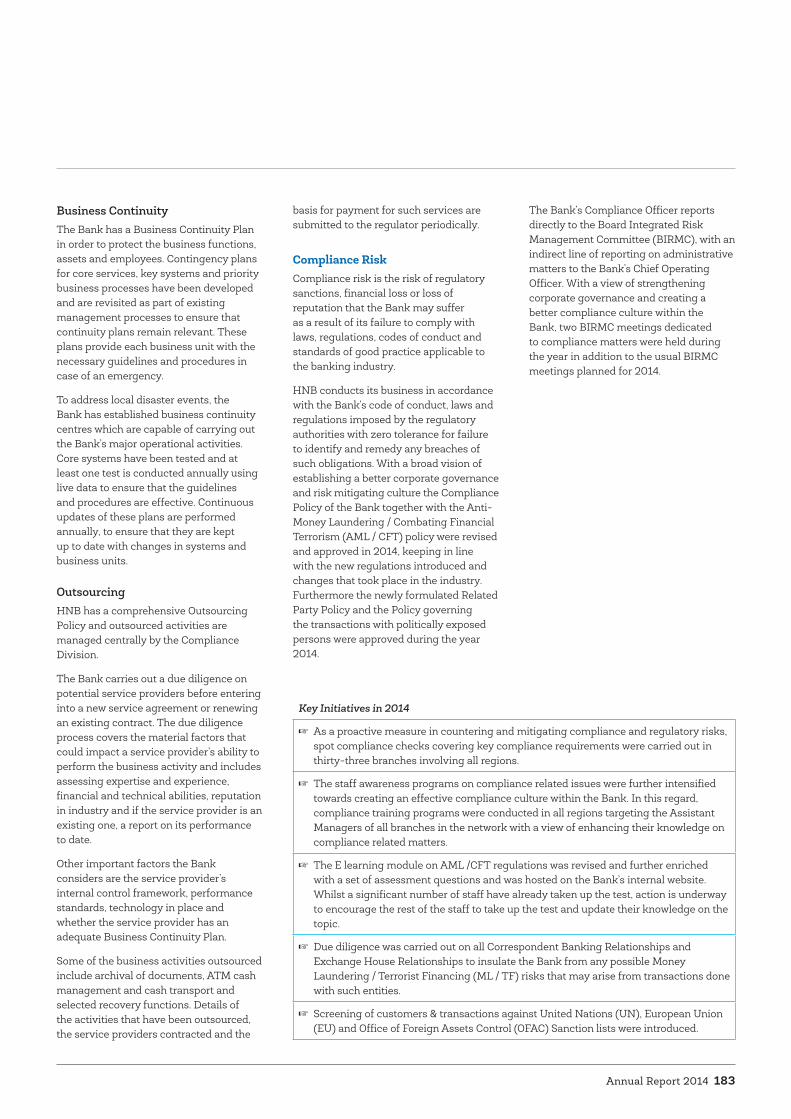
Annual Report 2014 183
Business Continuity The Bank has a Business Continuity Plan in order to protect the business functions, assets and employees. Contingency plans for core services, key systems and priority business processes have been developed and are revisited as part of existing management processes to ensure that continuity plans remain relevant. These plans provide each business unit with the necessary guidelines and procedures in case of an emergency.
To address local disaster events, the Bank has established business continuity centres which are capable of carrying out the Bank’s major operational activities. Core systems have been tested and at least one test is conducted annually using live data to ensure that the guidelines and procedures are effective. Continuous updates of these plans are performed annually, to ensure that they are kept up to date with changes in systems and business units.
Outsourcing HNB has a comprehensive Outsourcing Policy and outsourced activities are managed centrally by the Compliance Division.
The Bank carries out a due diligence on potential service providers before entering into a new service agreement or renewing an existing contract. The due diligence process covers the material factors that could impact a service provider’s ability to perform the business activity and includes assessing expertise and experience, financial and technical abilities, reputation in industry and if the service provider is an existing one, a report on its performance to date.
Other important factors the Bank considers are the service provider’s internal control framework, performance standards, technology in place and whether the service provider has an adequate Business Continuity Plan.
Some of the business activities outsourced include archival of documents, ATM cash management and cash transport and selected recovery functions. Details of the activities that have been outsourced, the service providers contracted and the
basis for payment for such services are submitted to the regulator periodically.
Compliance RiskCompliance risk is the risk of regulatory sanctions, financial loss or loss of reputation that the Bank may suffer as a result of its failure to comply with laws, regulations, codes of conduct and standards of good practice applicable to the banking industry.
HNB conducts its business in accordance with the Bank’s code of conduct, laws and regulations imposed by the regulatory authorities with zero tolerance for failure to identify and remedy any breaches of such obligations. With a broad vision of establishing a better corporate governance and risk mitigating culture the Compliance Policy of the Bank together with the Anti-Money Laundering / Combating Financial Terrorism (AML / CFT) policy were revised and approved in 2014, keeping in line with the new regulations introduced and changes that took place in the industry. Furthermore the newly formulated Related Party Policy and the Policy governing the transactions with politically exposed persons were approved during the year 2014.
The Bank’s Compliance Officer reports directly to the Board Integrated Risk Management Committee (BIRMC), with an indirect line of reporting on administrative matters to the Bank’s Chief Operating Officer. With a view of strengthening corporate governance and creating a better compliance culture within the Bank, two BIRMC meetings dedicated to compliance matters were held during the year in addition to the usual BIRMC meetings planned for 2014.
Key Initiatives in 2014
☞ As a proactive measure in countering and mitigating compliance and regulatory risks, spot compliance checks covering key compliance requirements were carried out in thirty-three branches involving all regions.
☞ The staff awareness programs on compliance related issues were further intensified towards creating an effective compliance culture within the Bank. In this regard, compliance training programs were conducted in all regions targeting the Assistant Managers of all branches in the network with a view of enhancing their knowledge on compliance related matters.
☞ The E learning module on AML /CFT regulations was revised and further enriched with a set of assessment questions and was hosted on the Bank’s internal website. Whilst a significant number of staff have already taken up the test, action is underway to encourage the rest of the staff to take up the test and update their knowledge on the topic.
☞ Due diligence was carried out on all Correspondent Banking Relationships and Exchange House Relationships to insulate the Bank from any possible Money Laundering / Terrorist Financing (ML / TF) risks that may arise from transactions done with such entities.
☞ Screening of customers & transactions against United Nations (UN), European Union (EU) and Office of Foreign Assets Control (OFAC) Sanction lists were introduced.

Hatton National Bank PLC184
RiskManagement
Conformity to regulations introduced in 2014
Date issued Mandatory Regulations/Directions/Determinations Bank's Present Status01.01.2014 Bank Supervision Dept. Sri Lanka Deposit Insurance and Liquidity Support Scheme Operating
InstructionsCompliant
02.01.2014 Bank Supervision Dept. The General Direction No.03 of 2013 - Service Norms and Standard Times for Accepting Cheque Deposits and Crediting Cheque Proceeds
Compliant
02.01.2014 Domestic Operations Dept.
Margin requirements against Letters of Credit for importation of Motor Vehicles
Compliant
02.01.2014 Domestic Operations Dept.
Operating Instructions on Open Market Operations of the Central Bank of Sri Lanka
Compliant
17.01.2014 Currency Dept. Colour card /Label system for different category of currency note bundles
Compliant
28.01.2014 International Operations Net Open Position return Compliant30.01.2014 Payment and settlement Dept.
Business Continuity Management and Disaster Recovery Site Operations 2014
Compliant
13.02.2014 Dept. of Supervision of non-banking financial institutions
The Finance Leasing Regulation No.1 of 2014 Compliant
13.02.2014 Public Debt Dept. Expression of Interest to serve as a Designated agent for issuance of Sri Lanka Development Bonds (SLDBs) March 2014
Compliant
17.02.2014 Bank Supervision Dept. Definition of liquid assets under section 86 of the Banking act no. 30 of 1988, as amended
Compliant
25.02.2014 Payment and settlement Dept.
General Direction no.01 of 2014 on Fees Chargeable on the transactions effected through the Common ATM Switch(CAS)
Compliant
07.03.2014 Domestic Operations Dept.
Online Money Market Monitoring System Compliant
31.03.2014 Bank Supervision Dept. Implementation of the Standardised Approach on computation of risk weighted amount for operational risk under BASEL II Capital Adequacy framework
Parallel run in process for ASA* in addition to existing BIA** method
02.04.2014 CBSL Appointment of Cargills Bank Limited as a Participant in the LankaSettle system
Noted
03.04.2014 Bank Supervision Dept. Reporting of post Tsunami remittances received through NGOs and Non NGOs to the CBSL
Compliant
28.04.2014 Economic Research Dept.
Monthly survey on new loans and deposits 2014 Compliant
28.05.2014 Exchange Control Dept. Foreign Travel Cards (FTC) Compliant28.05.2014 Exchange Control Dept. Special Foreign Investment Deposit Accounts (SFIDA) Compliant28.05.2014 Exchange Control Dept. Remittance of funds in advance to obtain student visa Compliant28.05.2014 Exchange Control Dept. Resident Foreign Currency Account(RFC) Compliant28.05.2014 Exchange Control Dept. Resident Non Nationals' Foreign Currency Account(RNNFC) Compliant28.05.2014 Exchange Control Dept. Foreign Currency Accounts for International Services Providers and
their Employees(FCAISPE)Compliant
28.05.2014 Exchange Control Dept. Foreign Exchange Earners' Account (FEEA) Compliant28.05.2014 Exchange Control Dept. Accommodation to holders of Foreign Exchange Earners' Account Compliant28.05.2014 Exchange Control Dept. Credit facilities to importers resident in Sri Lanka by suppliers resident
outside Sri LankaCompliant
28.05.2014 Exchange Control Dept. Letters of credit Compliant05.06.2014 Bank Supervision Dept. Banking act directions no. 1 of 2014 on Regulatory Framework on
Valuation of Immovable Property of Licensed Commercial Banks and Licensed Specialised Banks
Compliant
* ASA - Alternative Standardised Approach** BIA – Basic Indicator Approach

Annual Report 2014 185
Conformity to regulations introduced in 2014
Date issued Mandatory Regulations/Directions/Determinations Bank's Present Status17.06.2014 Regional Development Dept.
Credit guarantee scheme for pawning advances Compliant
20.06.2014 Currency Dept. Calibration of cash processing machines for detection of counterfeit notes
Compliant
25.06.2014 Financial Intelligence Unit
Prevention & Suppression of terrorism and Terrorism and Terrorist Financing Obligations of Reporting Institutions
Compliant
26.06.2014 Bank Supervision Dept. Banking Act Directions No. 2 of 2014 – Amendment to Banking Act Directions No. 7 of 2007 on Maximum Amount of Accommodation
Compliant
26.06.2014 Bank Supervision Dept. Banking Act Directions No. 4 of 2014 – Amendment to Directions on Integrated Risk Management (IRM) Framework for Licensed Banks and attachment on Baseline Security Standard for Information Security Management
Compliant
21.07.2014 Currency Dept. Guidelines on cash transactions with the CBSL Compliant31.07.2014 Bank Supervision Dept. Investment Fund Account Compliant04.09.2014 Payment & Settlement Dept.
General Direction No.02 of 2014 – Operations of the Common Electronic Fund Transfer Switch
The Bank has finalised the technical requirements to facilitate fund transfers through the HNB ATM network to member bank accounts
26.09.2014 Bank Supervision Dept. Investment Fund Account Compliant29.09.2014 Exchange Control Dept. Loans to Foreign Exchange Earners Accounts (FEEA) holders Compliant30.09.2014 Bank Supervision Dept. Guidelines on Stress Testing of Licensed Commercial Banks and
Licensed Specialised BanksCompliant
10.10.2014 Monetary Board Guidelines on the ascertainment of cost of acquisition/merger of financial institutions, and the claimability of unabsorbed input VAT and matters connected therewith
Compliant
16.10.2014 Bank Supervision Dept. Recovery of Accommodation to Exporters Compliant27.10.2014 Exchange Control Dept. Opening and maintaining Accounts in Chinese Renminbi (RMB) Compliant27.11.2014 Financial Intelligence Unit
Reporting of Foreign Inward Remittances Compliant
28.11.2014 Bank Supervision Dept. Sri Lanka Deposit Insurance and Liquidity Support Scheme Regulations
Compliant
02.12.2014 Exchange Control Dept. Diplomatic Rupee Accounts for Foreign Diplomatic Missions, Diplomatic Personnel and their family members in Sri Lanka
Compliant
18.12.2014 Bank Supervision Dept. Banking Act Determination no.1 of 2014 Annual Licensed Fee of Licensed Commercial Banks and Licensed Specialized Banks (2015 to 2016)
Compliant
23.12.2014 Bank Supervision Dept. Financial Sector Consolidation - Stamp Duty Gazette Extraordinary 1889/48 dated 21 November 2014
Compliant
23.12.2014 Bank Supervision Dept. Enhancement of Minimum Capital requirement of Banks Compliant30.12.2014 Bank Supervision Dept. Operating Instructions on the Special Interest Scheme for Senior
Citizens over 60 years of ageCompliant
31.12.2014 Exchange Control Dept. Issuance of Foreign Currency Notes for travelling purposes Compliant
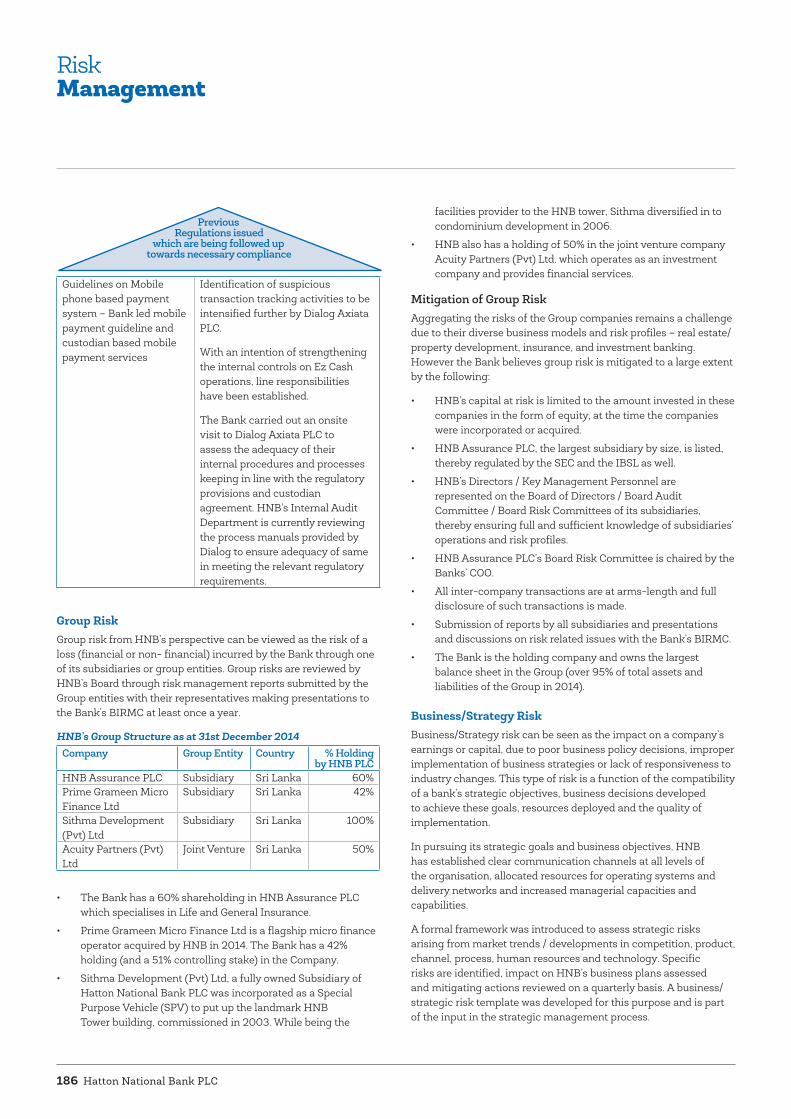
Hatton National Bank PLC186
RiskManagement
Group Risk Group risk from HNB’s perspective can be viewed as the risk of a loss (financial or non- financial) incurred by the Bank through one of its subsidiaries or group entities. Group risks are reviewed by HNB’s Board through risk management reports submitted by the Group entities with their representatives making presentations to the Bank’s BIRMC at least once a year.
• The Bank has a 60% shareholding in HNB Assurance PLC which specialises in Life and General Insurance.
• Prime Grameen Micro Finance Ltd is a flagship micro finance operator acquired by HNB in 2014. The Bank has a 42% holding (and a 51% controlling stake) in the Company.
• Sithma Development (Pvt) Ltd, a fully owned Subsidiary of Hatton National Bank PLC was incorporated as a Special Purpose Vehicle (SPV) to put up the landmark HNB Tower building, commissioned in 2003. While being the
facilities provider to the HNB tower, Sithma diversified in to condominium development in 2006.
• HNB also has a holding of 50% in the joint venture company Acuity Partners (Pvt) Ltd. which operates as an investment company and provides financial services.
Mitigation of Group Risk Aggregating the risks of the Group companies remains a challenge due to their diverse business models and risk profiles – real estate/property development, insurance, and investment banking. However the Bank believes group risk is mitigated to a large extent by the following:
• HNB’s capital at risk is limited to the amount invested in these companies in the form of equity, at the time the companies were incorporated or acquired.
• HNB Assurance PLC, the largest subsidiary by size, is listed, thereby regulated by the SEC and the IBSL as well.
• HNB’s Directors / Key Management Personnel are represented on the Board of Directors / Board Audit Committee / Board Risk Committees of its subsidiaries, thereby ensuring full and sufficient knowledge of subsidiaries’ operations and risk profiles.
• HNB Assurance PLC’s Board Risk Committee is chaired by the Banks’ COO.
• All inter-company transactions are at arms-length and full disclosure of such transactions is made.
• Submission of reports by all subsidiaries and presentations and discussions on risk related issues with the Bank’s BIRMC.
• The Bank is the holding company and owns the largest balance sheet in the Group (over 95% of total assets and liabilities of the Group in 2014).
Business/Strategy RiskBusiness/Strategy risk can be seen as the impact on a company’s earnings or capital, due to poor business policy decisions, improper implementation of business strategies or lack of responsiveness to industry changes. This type of risk is a function of the compatibility of a bank’s strategic objectives, business decisions developed to achieve these goals, resources deployed and the quality of implementation.
In pursuing its strategic goals and business objectives, HNB has established clear communication channels at all levels of the organisation, allocated resources for operating systems and delivery networks and increased managerial capacities and capabilities.
A formal framework was introduced to assess strategic risks arising from market trends / developments in competition, product, channel, process, human resources and technology. Specific risks are identified, impact on HNB’s business plans assessed and mitigating actions reviewed on a quarterly basis. A business/strategic risk template was developed for this purpose and is part of the input in the strategic management process.
Previous Regulations issued
which are being followed up towards necessary compliance
Guidelines on Mobile phone based payment system – Bank led mobile payment guideline and custodian based mobile payment services
Identification of suspicious transaction tracking activities to be intensified further by Dialog Axiata PLC.
With an intention of strengthening the internal controls on Ez Cash operations, line responsibilities have been established.
The Bank carried out an onsite visit to Dialog Axiata PLC to assess the adequacy of their internal procedures and processes keeping in line with the regulatory provisions and custodian agreement. HNB’s Internal Audit Department is currently reviewing the process manuals provided by Dialog to ensure adequacy of same in meeting the relevant regulatory requirements.
HNB’s Group Structure as at 31st December 2014 Company Group Entity Country % Holding
by HNB PLCHNB Assurance PLC Subsidiary Sri Lanka 60%Prime Grameen Micro Finance Ltd
Subsidiary Sri Lanka 42%
Sithma Development (Pvt) Ltd
Subsidiary Sri Lanka 100%
Acuity Partners (Pvt) Ltd
Joint Venture Sri Lanka 50%

Annual Report 2014 187
Reputational Risk Reputational risk results from damage to the Bank’s image among stakeholders due to negative publicity regarding the Bank’s business practices or management, and whether true or false, it can result in a loss of revenue or decline in shareholder confidence. HNB considers reputational risk as the consequence of a failure to manage its key risks and emerging new risk areas.
With rapidly changing technology, banks are becoming more exposed to new channels of risk. As we innovate and create products and services to facilitate our customers’ ease of doing business, banks need to, not only manage cyber risks but also to minimize system failures and fallouts which could affect customer service, brand loyalty and reputation.
As awareness is growing on the changing nature of risk and cyber risk is receiving more and more attention in the media, banks need to get together with the regulator in order to form a common platform where system security issues and breaches can be discussed and information exchanged on methods which could be applied to protect organisations from cyber attacks , also learning from the experiences of the more technology advanced nations.
HNB has taken reasonable care in addressing the cyber threats which may impact its business and reputation. Cyber security strategies are adopted by the Bank as per the industry standards and best practices.
In addition to the monitoring of system downtimes by the IT Division and remedial action being taken on a real time basis, the Operational Risk Division independently monitors system downtimes through several key risk indicators, analyses cause and impact, and makes recommendations for preventive action.
The Bank is therefore committed to managing reputational risk by:
• promoting strong corporate governance and risk management practices at all levels of the organisation
• understanding how different aspects of its business activities affect stakeholders’ perception of the organisation and therefore communicating effectively in the form of timely and accurate financial reports and news bulletins
• maintaining strong media presence, valuable client service and investor relationships
• complying with current laws and regulations.
• engaging third parties to conduct surveys on customer services, investor perceptions and employee satisfaction.
• promoting corporate social responsibility (CSR) through ethical banking practices, environmental awareness and a commitment to the local community
• maintaining a Business Continuity Plan (BCP) to ensure the continuation of operations in a crisis.
• On-going review, development and introduction of security strategies, policies, procedures and methods to countermeasure the threats that surface every day in all dimensions of technology engagement.
Stress TestingFormulated under the Integrated Risk Management (IRM) framework and supported by the implementation of the Internal Capital Adequacy Assessment Process (ICAAP), HNB’s stress testing framework has continuously evolved in depth and coverage. The focus being to assess how the Bank’s portfolios would react if business conditions deteriorated significantly and the consequent impact of these risk scenarios on our capital base. Stress testing may reveal a reduction in surplus capital or a shortfall in capital under specific scenarios. This may then serve as a leading indicator to the Bank to follow different avenues such as raise additional capital, reduce capital outflows/increase capital inflows or adjust the Bank’s risk appetite.
With its stress testing initiatives, the Bank hopes to support a number of value-added business processes such as the assessment of potential changes in the risk profile of the Bank, capital planning and management, and strengthening communication with internal and external stakeholders. The Bank’s stress testing is updated regularly and reviewed at least annually by the BIRMC. The appropriateness of the stress scenarios and the severity of the relevant scenarios are also reviewed and recommendations made by the Committee for appropriate follow-up action.
Stress Testing Methodology and ResultsThe Bank uses a number of sensitivity tests to measure the impact on the value of its portfolios due to extreme market movements, applying low, moderate and high impact shocks on hypothetical scenarios.
Management reviews the outcomes of the stress tests and where necessary, determines appropriate mitigating actions such as limiting exposures or reviewing and changing risk limits in order to manage the risks induced by potential stresses. Stress tests scenarios are recommended by the Risk Division and approved by the ALCO.
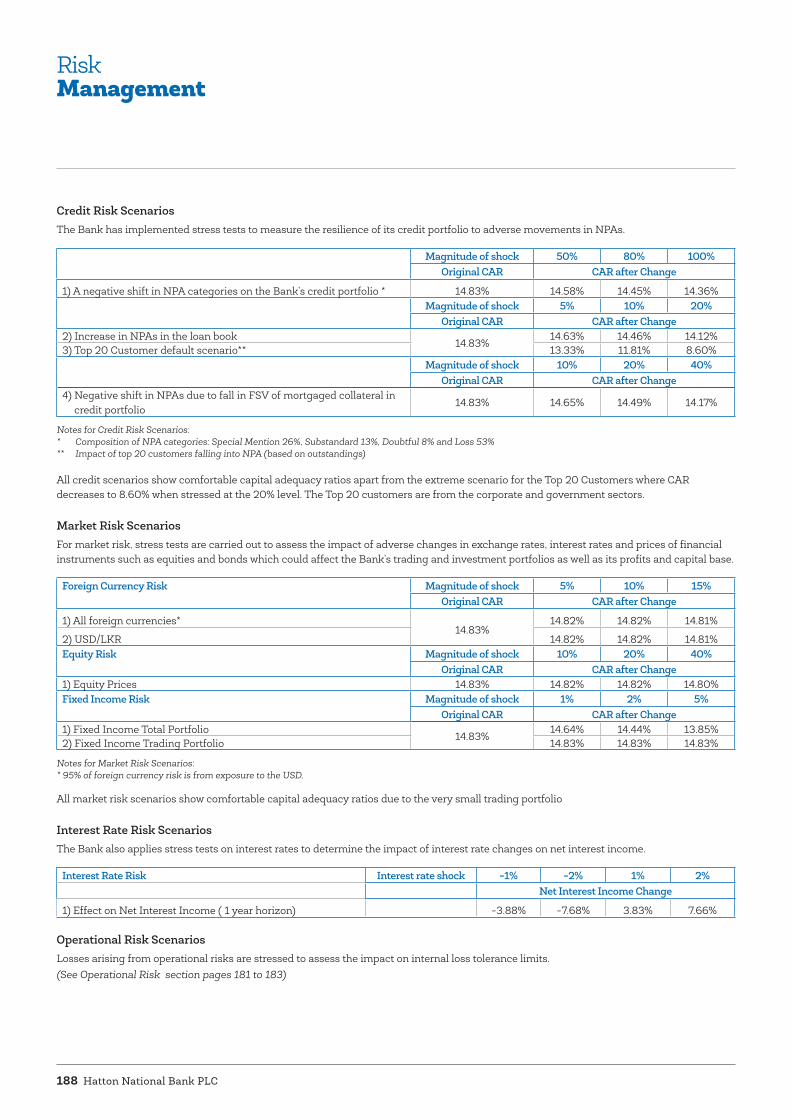
Hatton National Bank PLC188
RiskManagement
Credit Risk ScenariosThe Bank has implemented stress tests to measure the resilience of its credit portfolio to adverse movements in NPAs.
Magnitude of shock 50% 80% 100%Original CAR CAR after Change
1) A negative shift in NPA categories on the Bank’s credit portfolio * 14.83% 14.58% 14.45% 14.36%Magnitude of shock 5% 10% 20%
Original CAR CAR after Change2) Increase in NPAs in the loan book
14.83%14.63% 14.46% 14.12%
3) Top 20 Customer default scenario** 13.33% 11.81% 8.60%Magnitude of shock 10% 20% 40%
Original CAR CAR after Change4) Negative shift in NPAs due to fall in FSV of mortgaged collateral in
credit portfolio14.83% 14.65% 14.49% 14.17%
Notes for Credit Risk Scenarios:* Composition of NPA categories: Special Mention 26%, Substandard 13%, Doubtful 8% and Loss 53%** Impact of top 20 customers falling into NPA (based on outstandings)
All credit scenarios show comfortable capital adequacy ratios apart from the extreme scenario for the Top 20 Customers where CAR decreases to 8.60% when stressed at the 20% level. The Top 20 customers are from the corporate and government sectors.
Market Risk ScenariosFor market risk, stress tests are carried out to assess the impact of adverse changes in exchange rates, interest rates and prices of financial instruments such as equities and bonds which could affect the Bank’s trading and investment portfolios as well as its profits and capital base.
Foreign Currency Risk Magnitude of shock 5% 10% 15%Original CAR CAR after Change
1) All foreign currencies*14.83%
14.82% 14.82% 14.81%
2) USD/LKR 14.82% 14.82% 14.81%Equity Risk Magnitude of shock 10% 20% 40%
Original CAR CAR after Change1) Equity Prices 14.83% 14.82% 14.82% 14.80%Fixed Income Risk Magnitude of shock 1% 2% 5%
Original CAR CAR after Change1) Fixed Income Total Portfolio
14.83%14.64% 14.44% 13.85%
2) Fixed Income Trading Portfolio 14.83% 14.83% 14.83%
Notes for Market Risk Scenarios:* 95% of foreign currency risk is from exposure to the USD.
All market risk scenarios show comfortable capital adequacy ratios due to the very small trading portfolio
Interest Rate Risk ScenariosThe Bank also applies stress tests on interest rates to determine the impact of interest rate changes on net interest income.
Interest Rate Risk Interest rate shock -1% -2% 1% 2%Net Interest Income Change
1) Effect on Net Interest Income ( 1 year horizon) -3.88% -7.68% 3.83% 7.66%
Operational Risk ScenariosLosses arising from operational risks are stressed to assess the impact on internal loss tolerance limits.(See Operational Risk section pages 181 to 183)

Annual Report 2014 189
Liquidity Risk ScenariosStress tests are carried out to measure the resilience of the Bank’s portfolios to a drop in liquidity. This also involved a liquidity stress simulation over a period of 3 consecutive days to assess the tolerance level of the Bank to a liquidity crisis.
The Bank believes that such a severe liquidity crisis event could be triggered off by any one or more of the following events taking place.
• Loss of reputation due to rumors of a large loss, fraud, management misdemeanor.
• Severe rating downgrade (3-4 notches or to below investment grade)
• News/Speculation of an impending takeover / merger.
• Large regulatory penalty / qualification of accounts by Auditors/ other compliance related loss of reputation.
Some of the Stress testing scenarios analysed by the Bank include:
1. Loss of short term liquidity in the local market
2. Global banking crisis which could affect liquidity
3. Worst case scenario comprising of a culmination of different stress situations
As per the Bank’s Contingency Funding Plan (CFP), trigger points of impending liquidity stress scenarios will be monitored by Treasury Middle Office with relevant Business Units and Management will be immediately alerted to activate the CFP.
Way ForwardAs HNB’s operations grow in size and complexity, the Bank’s risk management framework is reviewed regularly to ensure its effectiveness and robustness, which is
essential in fulfilling our obligation to all our stakeholders.
We assess the risks originating from our business activities (our people, processes and systems) that we can control as well as the risks originating externally that we need to respond to (economic, regulatory, competition and technology). Going forward, we will continue our risk management initiatives across the network and support and share best practices with our customers and business partners.
Note: All figures in the risk management section have been prepared as per SLAS unless otherwise stated and may differ from SLFRS figures. For more details on Risk Management please refer to the Financial Risk Management section on pages 237 to 249.
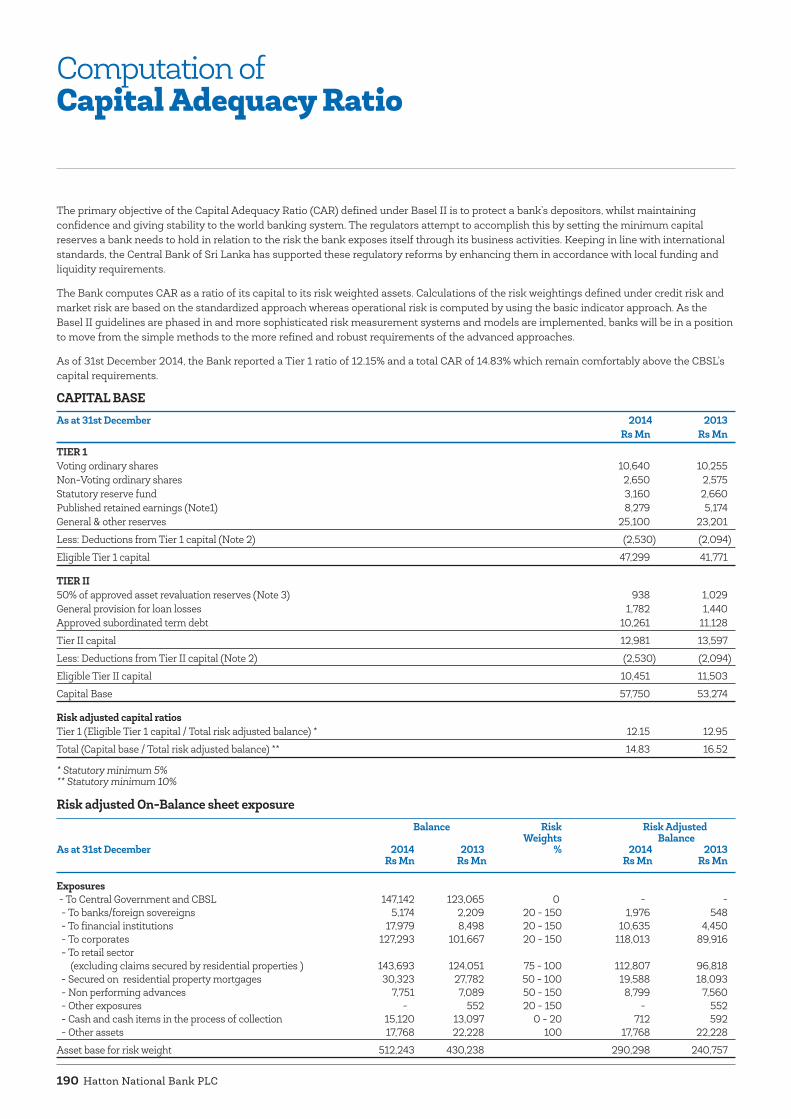
Hatton National Bank PLC190
Computation ofCapital Adequacy Ratio
The primary objective of the Capital Adequacy Ratio (CAR) defined under Basel II is to protect a bank’s depositors, whilst maintaining confidence and giving stability to the world banking system. The regulators attempt to accomplish this by setting the minimum capital reserves a bank needs to hold in relation to the risk the bank exposes itself through its business activities. Keeping in line with international standards, the Central Bank of Sri Lanka has supported these regulatory reforms by enhancing them in accordance with local funding and liquidity requirements.
The Bank computes CAR as a ratio of its capital to its risk weighted assets. Calculations of the risk weightings defined under credit risk and market risk are based on the standardized approach whereas operational risk is computed by using the basic indicator approach. As the Basel II guidelines are phased in and more sophisticated risk measurement systems and models are implemented, banks will be in a position to move from the simple methods to the more refined and robust requirements of the advanced approaches.
As of 31st December 2014, the Bank reported a Tier 1 ratio of 12.15% and a total CAR of 14.83% which remain comfortably above the CBSL’s capital requirements.
CAPITAL BASEAs at 31st December 2014 2013 Rs Mn Rs Mn TIER 1 Voting ordinary shares 10,640 10,255 Non-Voting ordinary shares 2,650 2,575 Statutory reserve fund 3,160 2,660 Published retained earnings (Note1) 8,279 5,174 General & other reserves 25,100 23,201
Less: Deductions from Tier 1 capital (Note 2) (2,530) (2,094)
Eligible Tier 1 capital 47,299 41,771 TIER II 50% of approved asset revaluation reserves (Note 3) 938 1,029 General provision for loan losses 1,782 1,440 Approved subordinated term debt 10,261 11,128
Tier II capital 12,981 13,597
Less: Deductions from Tier II capital (Note 2) (2,530) (2,094)
Eligible Tier II capital 10,451 11,503
Capital Base 57,750 53,274 Risk adjusted capital ratios Tier 1 (Eligible Tier 1 capital / Total risk adjusted balance) * 12.15 12.95
Total (Capital base / Total risk adjusted balance) ** 14.83 16.52
* Statutory minimum 5% ** Statutory minimum 10%
Risk adjusted On-Balance sheet exposure Balance Risk Risk Adjusted Weights Balance As at 31st December 2014 2013 % 2014 2013 Rs Mn Rs Mn Rs Mn Rs Mn
Exposures - To Central Government and CBSL 147,142 123,065 0 - - - To banks/foreign sovereigns 5,174 2,209 20 - 150 1,976 548 - To financial institutions 17,979 8,498 20 - 150 10,635 4,450 - To corporates 127,293 101,667 20 - 150 118,013 89,916 - To retail sector (excluding claims secured by residential properties ) 143,693 124,051 75 - 100 112,807 96,818 - Secured on residential property mortgages 30,323 27,782 50 - 100 19,588 18,093 - Non performing advances 7,751 7,089 50 - 150 8,799 7,560 - Other exposures - 552 20 - 150 - 552 - Cash and cash items in the process of collection 15,120 13,097 0 - 20 712 592 - Other assets 17,768 22,228 100 17,768 22,228
Asset base for risk weight 512,243 430,238 290,298 240,757
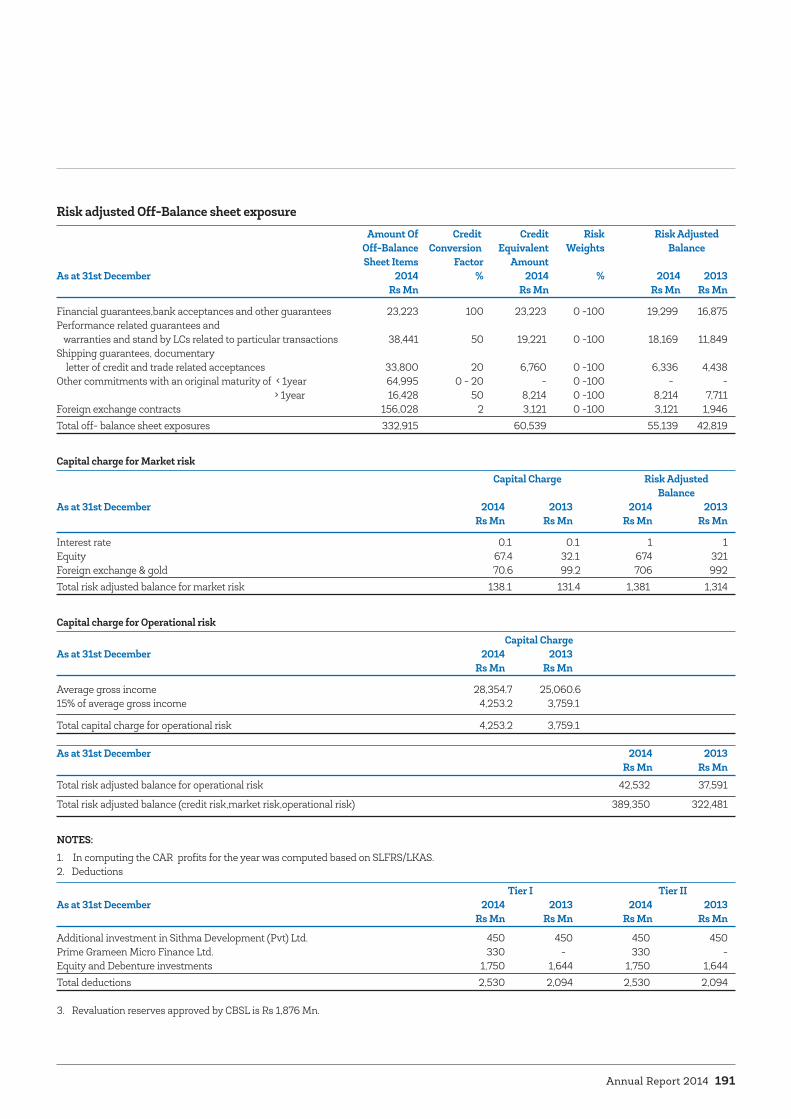
Annual Report 2014 191
Risk adjusted Off-Balance sheet exposure Amount Of Credit Credit Risk Risk Adjusted Off-Balance Conversion Equivalent Weights Balance Sheet Items Factor Amount As at 31st December 2014 % 2014 % 2014 2013 Rs Mn Rs Mn Rs Mn Rs Mn
Financial guarantees,bank acceptances and other guarantees 23,223 100 23,223 0 -100 19,299 16,875 Performance related guarantees and warranties and stand by LCs related to particular transactions 38,441 50 19,221 0 -100 18,169 11,849 Shipping guarantees, documentary letter of credit and trade related acceptances 33,800 20 6,760 0 -100 6,336 4,438 Other commitments with an original maturity of < 1year 64,995 0 - 20 - 0 -100 - - > 1year 16,428 50 8,214 0 -100 8,214 7,711 Foreign exchange contracts 156,028 2 3,121 0 -100 3,121 1,946 Total off- balance sheet exposures 332,915 60,539 55,139 42,819
Capital charge for Market risk Capital Charge Risk Adjusted Balance As at 31st December 2014 2013 2014 2013 Rs Mn Rs Mn Rs Mn Rs Mn
Interest rate 0.1 0.1 1 1 Equity 67.4 32.1 674 321 Foreign exchange & gold 70.6 99.2 706 992 Total risk adjusted balance for market risk 138.1 131.4 1,381 1,314
Capital charge for Operational risk Capital ChargeAs at 31st December 2014 2013 Rs Mn Rs Mn
Average gross income 28,354.7 25,060.6 15% of average gross income 4,253.2 3,759.1
Total capital charge for operational risk 4,253.2 3,759.1
As at 31st December 2014 2013 Rs Mn Rs MnTotal risk adjusted balance for operational risk 42,532 37,591
Total risk adjusted balance (credit risk,market risk,operational risk) 389,350 322,481
NOTES:1. In computing the CAR profits for the year was computed based on SLFRS/LKAS.2. Deductions
Tier I Tier II As at 31st December 2014 2013 2014 2013 Rs Mn Rs Mn Rs Mn Rs Mn
Additional investment in Sithma Development (Pvt) Ltd. 450 450 450 450 Prime Grameen Micro Finance Ltd. 330 - 330 - Equity and Debenture investments 1,750 1,644 1,750 1,644 Total deductions 2,530 2,094 2,530 2,094
3. Revaluation reserves approved by CBSL is Rs 1,876 Mn.

Financialreports
BUILT ON A STRONG PLATFORM OF STRENGTH AND STABILITY, WE LOOK FORWARD TO THE FUTURE WITH CONFIDENCE AND PROMISE.

Hatton National Bank PLC194
FinancialCalendar - 2014
45th Annual General Meeting held on 28th March 2014
Rs 7/- per share Final Dividend for 2013 paid on 08th April 2014
Rs 1/50 per share Interim Dividend for 2014 paid on 12th December 2014
Audited Financial Statements signed on 20th February 2015
46th Annual General Meeting to be held on 30th March 2015
Rs 7/- per share Final Dividend for 2014 payable in * April 2015
Interim Financial Statements published in terms of Rule 8.3 of the Colombo Stock Exchange and as per the requirements of the Central Bank of Sri Lanka:
1st Quarter Interim Results released on 13th May 2014
2nd Quarter Interim Results released on 12th August 2014
3rd Quarter Interim Results released on 14th November 2014
Proposed Financial Calendar - 2015
Interim Dividend for 2015 to be payable in ** December 2015
47th Annual General Meeting to be held in March 2016
Final Dividend for 2015 to be payable in *** April 2016
Interim Financial Statements to be published in terms of Rule 8.3 of the Colombo Stock Exchange and as per the requirements of the Central Bank of Sri Lanka:
1st Quarter Interim Results to be released in May 2015
2nd Quarter Interim Results to be released in August 2015
3rd Quarter Interim Results to be released in November 2015
* Subject to confirmation by Shareholders ** Subject to confirmation by Directors*** Subject to confirmation by Directors and Shareholders

Annual Report 2014 195
Chief Executive Officer’s and Chief Financial Officer’sResponsibility Statement
The financial statements of Hatton National Bank PLC (“the Bank”) and the consolidated financial statements of the Bank and its subsidiaries as at 31st December 2014 are prepared and presented in compliance with the requirements of the following:
• Sri Lanka Accounting Standards issued by the Institute of Chartered Accountants of Sri Lanka (CA Sri Lanka),
• Companies Act No 7 of 2007,
• Sri Lanka Accounting and Auditing Standards Act No 15 of 1995,
• Banking Act No 30 of 1988 (as amended),
• Listing Rules of the Colombo Stock Exchange,
• Banking Act Direction No 11 of 2007 on Corporate Governance for Licensed Commercial Banks in Sri Lanka (as amended from time to time) and
• Code of Best Practice on Corporate Governance issued jointly by the Institute of Chartered Accountants of Sri Lanka (CA Sri Lanka) and the Securities and Exchange Commission of Sri Lanka
The formats used in the preparation of the financial statements and disclosures made comply with the formats prescribed by the Central Bank of Sri Lanka.
The Accounting Policies used in the preparation of the financial statements are appropriate and are consistently applied by the Group. There are no departures from the prescribed Accounting Standards in their adoption. Comparative information has been reclassified wherever necessary to comply with the current presentation.
The significant accounting policies and estimates that involved a high degree of judgment and complexity were discussed with the Audit Committee and external auditors.
The Board of Directors and the management of the Bank accept responsibility for the integrity and objectivity of these financial statements. The estimates and judgments relating to the financial statements were made on a prudent and reasonable basis; in order that the financial statements reflect in a true and fair manner, the form and substance of transactions and that the Bank’s state of affairs is reasonably presented. To ensure this, the Bank has taken proper and sufficient care in installing a system of internal control and accounting records, for safeguarding assets and for preventing and detecting frauds as well as other irregularities, which is reviewed, evaluated and updated on an on going basis. It is confirmed that the Bank has adequate resources to continue its operations in the foreseeable future. Therefore, the Bank will continue to adopt the ‘going concern’ basis in preparing these financial statements.
Our internal auditor has conducted periodic audits to provide reasonable assurance that the established policies and procedures of the Bank were consistently followed. However, there are inherent limitations that should be recognised in weighing the assurances provided by any system of internal controls and accounting. Further your Board assessed the effectiveness of the Bank’s internal controls over financial reporting during the year ended 31st December 2014, as required by the Banking Act Direction No 11 of 2007, result of which is given on page 146 to 147 in the Annual Report, the “Directors’ Statement on Internal Control”. External auditor’s Assurance Report on the “Directors’ Statement on Internal Control” is given on page 148 of the Annual Report.
The financial statements of the Group for the year 2014 were audited by Messrs Ernst & Young, Chartered Accountants, the
independent external auditors. Their report is given on page 197 of the Annual Report. The financial statements for the year 2013 were audited by Messrs KPMG, Chartered Accountants.
The Audit Committee of the Bank meets periodically with the internal audit team and the independent external auditor to review their audit plans, assess the manner in which these auditors are performing their responsibilities and to discuss their reports on internal controls and financial reporting issues. To ensure complete independence, the external auditor and the internal auditor have full and free access to the members of the Audit Committee to discuss any matter of substance. The details of which are given in the ‘Audit Committee Report’ on pages 154 to 155.
The Audit Committee approves the audit and non audit services provided by external auditor, Messrs Ernst & Young, in order to ensure that the provision of such services does not impair Ernst & Young’s independence.
We confirm that,
- the Bank and its subsidiaries have complied with all applicable laws, regulations and prudential requirements;
- there are no material non compliances ; and
- there are no material litigations that are pending against the Group other than those disclosed in the Note 59 (d) to the financial statements in this Annual Report.
Jonathan AllesManaging Director / Chief Executive Officer
Ashok GoonesekereChief Financial Officer
Colombo, Sri Lanka20th February 2015

Hatton National Bank PLC196
The responsibility of the Directors in relation to the financial statements of the Bank and its subsidiaries prepared in accordance with the provisions of the Companies Act No 7 of 2007 is set out in the following statement.
The responsibilities of the external auditor in relation to the financial statements are set out in the report of the auditors given on page 197 of the Annual Report.
As per the provisions of sections 150 (1), 151, 152 and 153 (1) & (2) of the Companies Act No 7 of 2007, the Directors are required to prepare financial statements for each financial year and place them before a General Meeting. The financial statements comprise the Statement of Financial Position as at 31st December 2014, and the Statement of Comprehensive Income, Statement of Changes in Equity and Statement of Cash Flows for the year then ended and notes thereto.
The financial statements of the Bank and its subsidiaries give a true and fair view of:
1. the state of affairs of the Bank and its subsidiaries as at 31st December 2014; and
2. the profit or loss of the Bank and its subsidiaries for the financial year then ended.
In preparing these financial statements, the Directors are required to ensure that:
1. appropriate accounting policies have been selected and applied in a consistent manner and material departures, if any, have been disclosed and explained;
2. judgments and estimates have been made which are reasonable and prudent; and
3. all applicable accounting standards, as relevant, have been complied with;
The Directors are also required to ensure that the Bank and its subsidiaries have adequate resources to continue in operation to justify applying the going concern basis in preparing these financial statements.
Further, the Directors have a responsibility to ensure that the Companies within the Group maintain sufficient accounting records to disclose, with reasonable accuracy the financial position of the Bank and its subsidiaries.
Financial statements prepared and presented in this report have been prepared based on new Sri Lanka Accounting Standards (SLFRS) which
Directors’ Responsibility for Financial Reporting
came to effect from January 01, 2012 and are consistent with the underlying books of account and are in conformity with the requirements of Sri Lanka Accounting Standards, Companies Act No 7 of 2007, Sri Lanka Accounting and Auditing Standard Act No 15 of 1995, Banking Act No 30 of 1988 amendments thereto, Banking Act Direction No 11 of 2007 on Corporate Governance for Licensed Commercial Banks in Sri Lanka (as amended from time to time), the Listing Rules of the Colombo Stock Exchange and the Code of Best Practice on Corporate Governance issued jointly by the Institute of Chartered Accountants of Sri Lanka (CA Sri Lanka) and the Securities and Exchange Commission of Sri Lanka (SEC).
In addition, these financial statements comply with the prescribed format issued by the Central Bank of Sri Lanka for the preparation of annual financial statements of Licensed Commercial Banks.
The Directors have also instituted effective and comprehensive systems of internal control for identifying, recording, evaluating and managing the significant risks faced by the Bank throughout the year and it is being under regular review of the Board of Directors. This comprises internal reviews, internal audit and the whole system of financial and other controls required to carry on the business of banking in an orderly manner, safeguard its assets, prevent and detect frauds and other irregularities and secure as far as practicable the accuracy and reliability of the records. The results of such reviews carried out during the year ended 31st December 2014 are given on pages 146 to 147 of the Annual Report, “Directors’ Statement on Internal Control”. External Auditor’s Assurance Report on the “Directors’ Statement on Internal Control” is given on page 148 of the Annual Report.
The Directors have taken appropriate steps to ensure that the Bank and Group maintain proper books of accounts and review the financial reporting system directly by them at their regular meetings and also through the Board Audit Committee, the report of the said Committee is given on pages 154 to 155. The Board of Directors also approves the interim financial statements prior to their release following a review and recommendation by the Board Audit Committee.
The Board of Directors accepts responsibility for the integrity and objectivity of the financial statements presented in this Annual Report.
Directors are required to prepare the financial statements and provide the Bank’s external auditor, Messrs Ernst & Young, with every opportunity to carry out whatever reviews and sample checks on the system of internal control they may consider appropriate and necessary for expressing their independent audit opinion on the financial statements.
The financial statements of the Bank and the Group have been certified by the Bank’s Chief Financial Officer, the officer responsible for their preparation, as required by the Sections 150 (1) (b) and 152 (1) (b) of the Companies Act. Also the financial statements of the Bank and the Group have been signed by two Directors and the Company Secretary of the Bank on February 20th, 2015 as required by Sections 150 (1) (c) and 152 (1) (c) of the Companies Act.
Further, as required by Section 56 (2) of the Companies Act No 7 of 2007, the Directors have confirmed that the Bank, based on the information available, satisfies the solvency test immediately after the distribution of dividends, in accordance with Section 57 of the Companies Act No 7 of 2007, and has obtained a certificate from the auditors, prior to declaring a final dividend of Rs 7.00 per share for this year to be paid in April 2015.
The Directors to the best of their knowledge and belief, are satisfied that all statutory payments in relation to all relevant regulatory and statutory authorities which were due and payable by the Bank and its subsidiaries as at the Statement of Financial Position date have been paid or where relevant provided for.
The Directors are of the view that they have discharged their responsibilities as set out in this statement.
By order of the Board
K A L Thushari RanaweeraDeputy General Manager (Legal) / Company Secretary
Colombo, Sri Lanka20th February 2015

Annual Report 2014 197
Independent Auditors’Report
TO THE SHAREHOLDERS OF HATTON NATIONAL BANK PLC
Report on the Financial Statements We have audited the accompanying financial statements of Hatton National Bank PLC, (the “Bank”), and the consolidated financial statements of the Bank and its subsidiaries (the “Group”), which comprise the statement of financial position as at 31 December 2014, and the statement of income and other comprehensive income, statement of changes in equity and, cash flow statement for the year then ended, and a summary of significant accounting policies and other explanatory information.
Board’s Responsibility for the Financial StatementsThe Board of Directors (the “Board”) is responsible for the preparation of these financial statements that give a true and fair view in accordance with Sri Lanka Accounting Standards, and for such internal control as Board determines is necessary to enable the preparation of financial statements that are free from material misstatement, whether due to fraud or error.
Auditors’ ResponsibilityOur responsibility is to express an opinion on these financial statements based on our audit. We conducted our audit in accordance with Sri Lanka Auditing Standards. Those standards require that we comply with ethical requirements and plan and perform the audit to obtain reasonable assurance about whether the financial statements are free from material misstatement.
An audit involves performing procedures to obtain audit evidence about the amounts and disclosures in the financial statements. The procedures selected depend on the auditors’ judgment, including the assessment of the risks of material misstatement of the financial statements, whether due to fraud or error. In making those risk assessments, the auditors consider internal control relevant to the Bank’s preparation of the financial statements that give a true and fair view in order to design audit procedures that are appropriate in the circumstances, but not for the purpose of expressing an opinion on the effectiveness of the Bank’s internal control. An audit also includes evaluating the appropriateness of accounting policies used and the reasonableness of accounting estimates made by Board, as well as evaluating the overall presentation of the financial statements.
We believe that the audit evidence we have obtained is sufficient and appropriate to provide a basis for our audit opinion.
OpinionIn our opinion, the consolidated financial statements give a true and fair view of the financial position of the Group as at 31 December 2014, and of its financial performance and cash flows for the year then ended in accordance with Sri Lanka Accounting Standards.
Other MatterThe financial statements of the Bank for the year ended 31 December 2013 were audited by another auditor who expressed an unmodified opinion on those statements on 21 February 2014.
Report on Other Legal and Regulatory Requirements As required by Section 163(2) of the Companies Act No. 7 of 2007, we state the following:
a) The basis of opinion and scope and limitations of the audit are as stated above.
b) In our opinion :
- We have obtained all the information and explanations that were required for the audit and, as far as appears from our examination, proper accounting records have been kept by the Bank.
- The financial statements of the Bank give a true and fair view of the financial position as at 31 December 2014, and of its financial performance and cash flows for the year then ended in accordance with Sri Lanka Accounting Standards.
- The financial statements of the Bank and the Group, comply with the requirements of Section 151 and 153 of the Companies Act No. 07 of 2007.
20th February 2015Colombo

Hatton National Bank PLC198
IncomeStatement
Bank Group For the year ended 31st December 2014 2013 2014 2013 Restated Note Rs 000 Rs 000 Rs 000 Rs 000
Gross income 10 59,500,495 61,006,414 65,023,846 65,183,483
Interest income 51,868,333 56,770,713 53,062,579 57,364,012Less: Interest expenses 26,966,826 31,423,945 27,077,830 31,403,749Net interest income 11 24,901,507 25,346,768 25,984,749 25,960,263 Fee and commission income 4,976,212 4,263,200 5,196,099 4,348,213 Less: Fee and commission expenses 98,329 82,081 617,275 465,083 Net fee and commission income 12 4,877,883 4,181,119 4,578,824 3,883,130 Net interest, fee and commission income 29,779,390 29,527,887 30,563,573 29,843,393 Net loss from trading 13 (570,720) (1,815,061) (441,618) (1,782,580)Net gain from financial investments 14 1,398,025 246,591 1,493,975 292,429 Other operating income (net) 15 1,828,645 1,540,971 5,712,811 4,961,409 Total operating income 32,435,340 29,500,388 37,328,741 33,314,651 Less: Impairment charge for loans and other losses 16 2,491,520 4,270,686 2,532,808 4,326,864 Net operating income 29,943,820 25,229,702 34,795,933 28,987,787 Less : Operating expenses Personnel expenses 17 7,407,015 5,453,778 8,108,200 5,962,095 Other expenses 18 7,971,000 8,108,508 11,132,010 10,616,021 Total operating expenses 15,378,015 13,562,286 19,240,210 16,578,116 Operating profit before Value Added Tax (VAT) and Nation Building Tax (NBT) on financial services 14,565,805 11,667,416 15,555,723 12,409,671 Less: Value Added Tax (VAT) and Nation Building Tax (NBT) on financial services 19 2,501,876 1,659,755 2,550,247 1,659,755 Operating profit after Value Added Tax (VAT) and Nation Building Tax (NBT) on financial services 12,063,929 10,007,661 13,005,476 10,749,916 Share of profits of associate and joint venture (net of income tax) 20 - - 142,977 98,198 PROFIT BEFORE INCOME TAX 12,063,929 10,007,661 13,148,453 10,848,114 Less: Income tax expense 21 3,058,655 2,997,555 3,080,360 3,070,326 PROFIT FOR THE YEAR 9,005,274 7,010,106 10,068,093 7,777,788 Profit attributable to: Equity holders of the Bank 9,005,274 7,010,106 9,819,595 7,650,466 Non-controlling interests - - 248,498 127,322 PROFIT FOR THE YEAR 9,005,274 7,010,106 10,068,093 7,777,788 Earnings per share 22 Basic earnings per ordinary share (Rs) 22.47 17.59 24.50 19.20 Diluted earnings per ordinary share (Rs) 22.37 17.55 24.39 19.15
Dividend per share Dividend per share: Gross (Rs) *8.50 8.50 *8.50 8.50 The notes to the financial statements from pages 206 to 322 form an integral part of these financial statements. *Calculated on interim dividend paid and final dividend proposed, which is to be approved at the Annual General Meeting.

Annual Report 2014 199
Statement of Other Comprehensive Income
Bank Group For the year ended 31st December 2014 2013 2014 2013 Restated Rs 000 Rs 000 Rs 000 Rs 000
PROFIT FOR THE YEAR 9,005,274 7,010,106 10,068,093 7,777,788
OTHER COMPREHENSIVE INCOME FOR THE YEAR, NET OF TAX
Other comprehensive income to be reclassified to income statement
Available-for-sale financial assets: Net change in fair value during the year 3,027,688 1,294,197 3,144,503 1,286,424 Transfer to life policy holder reserve fund - - (44,930) 2,991 Net amount transferred to profit or loss (available-for-sale financial assets) (645,437) - (715,159) -Deferred tax effect on above (40,724) - (40,724) -Share of other comprehensive income of equity accounted joint venture - - 8,378 13,360Total other comprehensive income to be reclassified to income statement 2,341,527 1,294,197 2,352,068 1,302,775
Other comprehensive income not to be reclassified to income statement
Gains and losses arising from translating the financial statements of foreign operations - - - 1,764 Actuarial gains / (losses) on defined benefit plans 1,140,012 (857,846) 1,144,366 (855,674)Deferred tax effect on above - - 1,498 -Total other comprehensive income not to be reclassified to income statement 1,140,012 (857,846) 1,145,864 (853,910)
OTHER COMPREHENSIVE INCOME FOR THE YEAR NET OF TAX 3,481,539 436,351 3,497,932 448,865 TOTAL COMPREHENSIVE INCOME FOR THE YEAR 12,486,813 7,446,457 13,566,025 8,226,653 Total comprehensive income attributable to: Equity holders of the Bank 12,486,813 7,446,457 13,313,100 8,099,317 Non-controlling interests - - 252,925 127,336 TOTAL COMPREHENSIVE INCOME FOR THE YEAR 12,486,813 7,446,457 13,566,025 8,226,653
The notes to the financial statements from pages 206 to 322 form an integral part of these financial statements.

Hatton National Bank PLC200
Statement ofFinancial Position
Bank Group As at 31st 31st 31st 31st 1st December December December December January 2014 2013 2014 2013 2013 Restated Restated Note Rs 000 Rs 000 Rs 000 Rs 000 Rs 000
ASSETS Cash and cash equivalents 25 13,141,295 11,624,645 13,421,850 11,621,193 8,840,646 Balances with central banks 26 16,907,538 16,366,368 16,907,538 16,366,368 19,950,040 Placements with banks 27 3,789,538 1,246,612 5,096,455 2,990,100 11,538,323 Reverse repurchase agreements 16,930,572 6,278,832 19,575,253 6,980,280 500,771 Derivative financial instruments 28 178,370 174,573 178,370 174,573 344,552 Other financial assets held for trading 29 551,371 652,312 1,052,727 986,391 888,432 Non-current assets held for sale 30 30,238 - 30,238 - - Loans and receivables to customers 31 395,699,387 351,965,376 401,281,976 351,776,782 301,607,714 Financial investments - Available-for-sale 32 67,842,229 63,391,086 69,443,057 64,035,975 59,269,037 Financial investments - Held-to-maturity 33 - - 955,421 931,681 1,567,968 Financial investments - Loans and receivables 34 36,166,064 33,104,536 38,846,129 35,103,762 20,904,172 Investment in associates 35 - - - 28,864 24,388 Investment in joint venture 36 655,000 655,000 1,196,544 1,046,274 920,176 Investment in subsidiaries 37 3,017,285 2,357,285 - - - Investment properties 38 392,088 346,478 1,042,386 160,864 164,598 Property, plant and equipment 39 9,304,665 9,521,496 18,290,365 17,769,878 17,785,548 Intangible assets and goodwill 40 802,728 994,677 1,089,759 1,048,866 617,284 Deferred tax assets 48 287,384 767,826 199,315 655,769 - Other assets 41 10,940,270 10,863,335 11,668,060 11,202,118 12,577,054 Total assets 576,636,022 510,310,437 600,275,443 522,879,740 457,500,703
LIABILITIES Due to banks 42 43,428,762 34,934,218 43,504,729 34,934,218 22,956,431 Derivative financial instruments 43 630,598 748,962 630,598 748,962 1,436,443 Securities sold under repurchase agreements 16,983,545 4,132,602 16,983,545 4,132,602 4,601,484 Due to customers 44 419,327,123 387,158,390 425,620,382 386,864,044 342,355,430 Dividends payable 45 587,078 426,347 587,078 426,347 221,455 Other borrowings 46 4,345,285 4,530,499 4,345,285 4,530,499 4,642,984 Debt securities issued 47 4,451,407 1,418,775 4,842,627 1,399,184 - Current tax liabilities 3,297,530 3,040,108 3,394,992 3,075,251 1,798,379Deferred tax liabilities 48 - - - - 1,186,369 Insurance provision - Life 49 - - 5,562,649 4,348,491 3,626,239 Insurance provision - General 50 - - 1,279,139 1,011,101 969,441 Other provisions 1,810,892 2,934,131 2,123,089 3,020,306 4,336,069 Other liabilities 51 9,221,380 7,675,990 10,085,587 8,236,151 8,819,396 Subordinated term debts 53 11,653,759 11,856,561 11,677,046 11,781,703 7,736,695 Total liabilities 515,737,359 458,856,583 530,636,746 464,508,859 404,686,815
EQUITY Stated capital 54 13,289,992 12,830,268 13,289,992 12,830,268 12,579,479 Statutory reserves 55 3,160,000 6,761,205 3,160,000 6,761,205 4,530,562 Retained earnings 56 7,808,059 3,465,419 10,396,517 5,210,488 5,321,846 Other reserves 57 36,640,612 28,396,962 41,058,056 32,759,680 29,615,888 Total equity attributable to equity holders of the Bank 60,898,663 51,453,854 67,904,565 57,561,641 52,047,775 Non-controlling interests 58 - - 1,734,132 809,240 766,113 Total equity 60,898,663 51,453,854 69,638,697 58,370,881 52,813,888 Total liabilities and equity 576,636,022 510,310,437 600,275,443 522,879,740 457,500,703 Contingent liabilities and commitments 59 339,722,332 239,703,923 339,722,332 239,703,923 202,819,429 Net assets value per share (Rs) 64 151.26 128.78 168.67 144.06 131.02
The notes to the financial statements from pages 206 to 322 form an integral part of these financial statements.
I certify that these financial statements are in compliance with the requirements of Companies Act No 7 of 2007.
Ashok Goonesekere Chief Financial Officer
For and on behalf of the Board
Jonathan Alles Ranee Jayamaha K A L Thushari Ranaweera Managing Director / Chairperson Deputy General Manager (Legal) / Chief Executive Officer Company Secretary
20th February 2015 Colombo
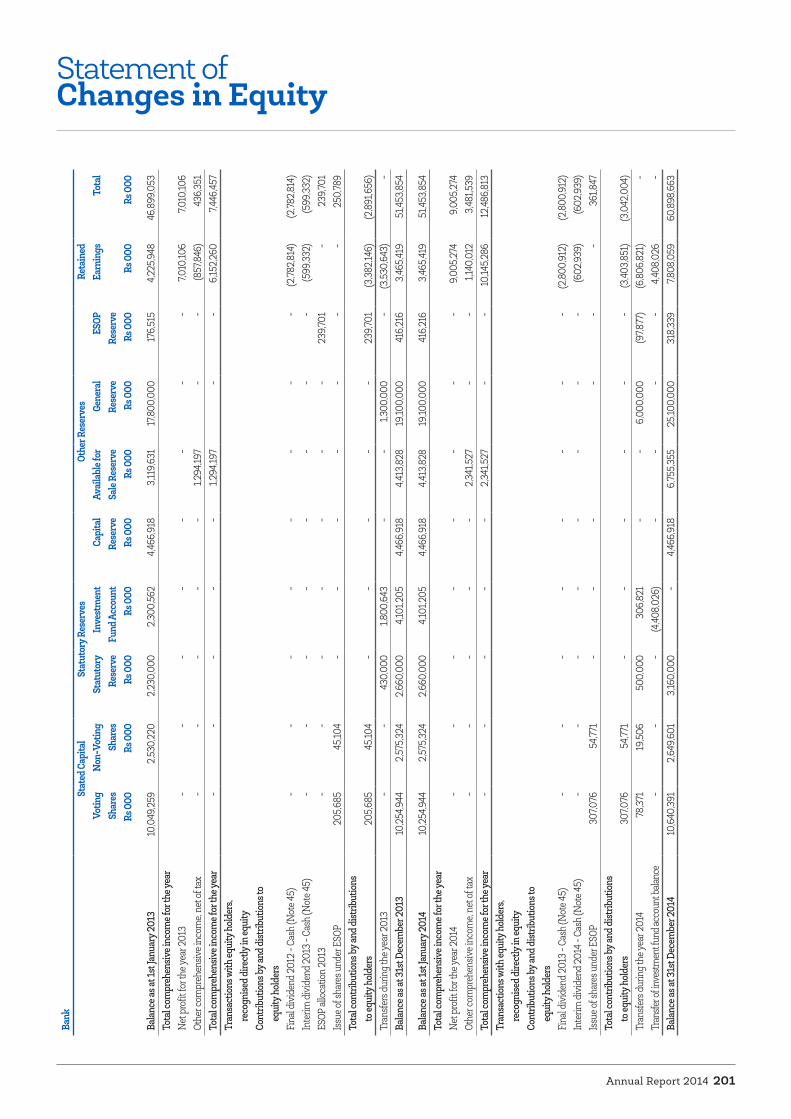
Annual Report 2014 201
Statement ofChanges in Equity
Bank
Stat
ed C
apita
lSt
atut
ory R
eser
ves
Othe
r Res
erve
sRe
tain
edVo
ting
Non
-Vot
ing
Stat
utor
yIn
vest
men
t Ca
pita
l Av
ailab
le fo
r G
ener
al
ESOP
Earn
ings
Tota
l Sh
ares
Sh
ares
Re
serv
eFu
nd A
ccou
ntRe
serv
e Sa
le Re
serv
e R
eser
ve
Rese
rve
Rs 0
00Rs
000
Rs 0
00Rs
000
Rs 0
00Rs
000
Rs 0
00Rs
000
Rs 0
00Rs
000
Balan
ce as
at 1s
t Jan
uary
2013
10,0
49,25
9 2,
530,
220
2,23
0,00
0 2,
300,
562
4,46
6,91
8 3
,119,6
31
17,8
00,0
00
176,
515
4,22
5,948
46
,899
,053
To
tal c
ompr
ehen
sive i
ncom
e for
the y
ear
Net p
rofit
for t
he ye
ar 20
13 -
- -
- -
- -
- 7,
010,
106
7,01
0,10
6 Ot
her c
ompr
ehen
sive i
ncom
e, ne
t of t
ax -
- -
- -
1,29
4,197
-
- (8
57,8
46)
436,
351
Tota
l com
preh
ensiv
e inc
ome f
or th
e yea
r -
- -
- -
1,29
4,197
-
- 6
,152,2
60
7,44
6,45
7 Tr
ansa
ctio
ns w
ith eq
uity
hold
ers,
re
cogn
ised d
irect
ly in
equi
tyCo
ntrib
utio
ns by
and d
istrib
utio
ns to
eq
uity
hold
ers
Fina
l div
iden
d 201
2 - C
ash
(Not
e 45)
- -
- -
- -
- -
(2,78
2,814
) (2
,782,8
14)
Inte
rim di
vide
nd 20
13 -
Cash
(Not
e 45)
- -
-
- -
- -
- (5
99,33
2) (5
99,33
2)ES
OP al
locat
ion
2013
- -
- -
- -
- 23
9,701
-
239,7
01
Issue
of sh
ares
und
er E
SOP
205,6
85
45,10
4 -
- -
- -
- -
250,
789
Tota
l con
tribu
tions
by an
d dist
ribut
ions
to eq
uity
hold
ers
205,6
85
45,10
4 -
- -
- -
239,7
01
(3,38
2,146
) (2
,891
,656
)Tr
ansfe
rs du
ring t
he ye
ar 20
13 -
- 43
0,00
0 1,
800,
643
- -
1,30
0,00
0 -
(3,53
0,64
3) -
Balan
ce as
at 31
st D
ecem
ber 2
013
10,25
4,944
2,
575,3
24
2,66
0,00
0 4,
101,2
05
4,46
6,91
8 4,
413,8
28
19,10
0,00
0 41
6,21
6 3
,465,4
19
51,45
3,854
Balan
ce as
at 1s
t Jan
uary
2014
10,25
4,944
2,
575,3
24
2,66
0,00
0 4,
101,2
05
4,46
6,91
8 4,
413,8
28
19,10
0,00
0 41
6,21
6 3
,465,4
19
51,45
3,854
To
tal c
ompr
ehen
sive i
ncom
e for
the y
ear
Net p
rofit
for t
he ye
ar 20
14 -
- -
- -
- -
- 9
,005
,274
9,0
05,27
4 Ot
her c
ompr
ehen
sive i
ncom
e, ne
t of t
ax -
- -
- -
2,34
1,527
-
- 1,
140,
012
3,48
1,539
To
tal c
ompr
ehen
sive i
ncom
e for
the y
ear
- -
- -
- 2,
341,5
27
- -
10,14
5,286
12
,486,
813
Tran
sact
ions
with
equi
ty ho
lder
s,
reco
gnise
d dire
ctly
in eq
uity
Cont
ribut
ions
by an
d dist
ribut
ions
to
equi
ty ho
lder
sFi
nal d
ivid
end 2
013
- Cas
h (N
ote 4
5) -
- -
- -
- -
- (2
,800
,912
) (2
,800
,912
)In
terim
divi
dend
2014
- Ca
sh (N
ote 4
5) -
- -
- -
- -
- (6
02,9
39)
(602
,939
)Iss
ue of
shar
es u
nder
ESO
P 3
07,0
76
54,77
1 -
- -
- -
- 3
61,8
47
Tota
l con
tribu
tions
by an
d dist
ribut
ions
to eq
uity
hold
ers
307
,076
54
,771
- -
- -
- -
(3,40
3,851
) (3
,042
,004
)Tr
ansfe
rs du
ring t
he ye
ar 20
14 78
,371
19,50
6 50
0,00
0 3
06,8
21 -
- 6
,000
,000
(9
7,877
) (6
,806
,821
) -
Tran
sfer o
f inve
stmen
t fun
d acc
ount
balan
ce-
--
(4,40
8,02
6)-
--
-4,4
08,0
26-
Balan
ce as
at 31
st D
ecem
ber 2
014
10,6
40,39
1 2,
649,6
01
3,16
0,00
0 -
4,46
6,91
8 6
,755,3
55
25,10
0,00
0 3
18,33
9 7,
808,
059
60,
898,
663
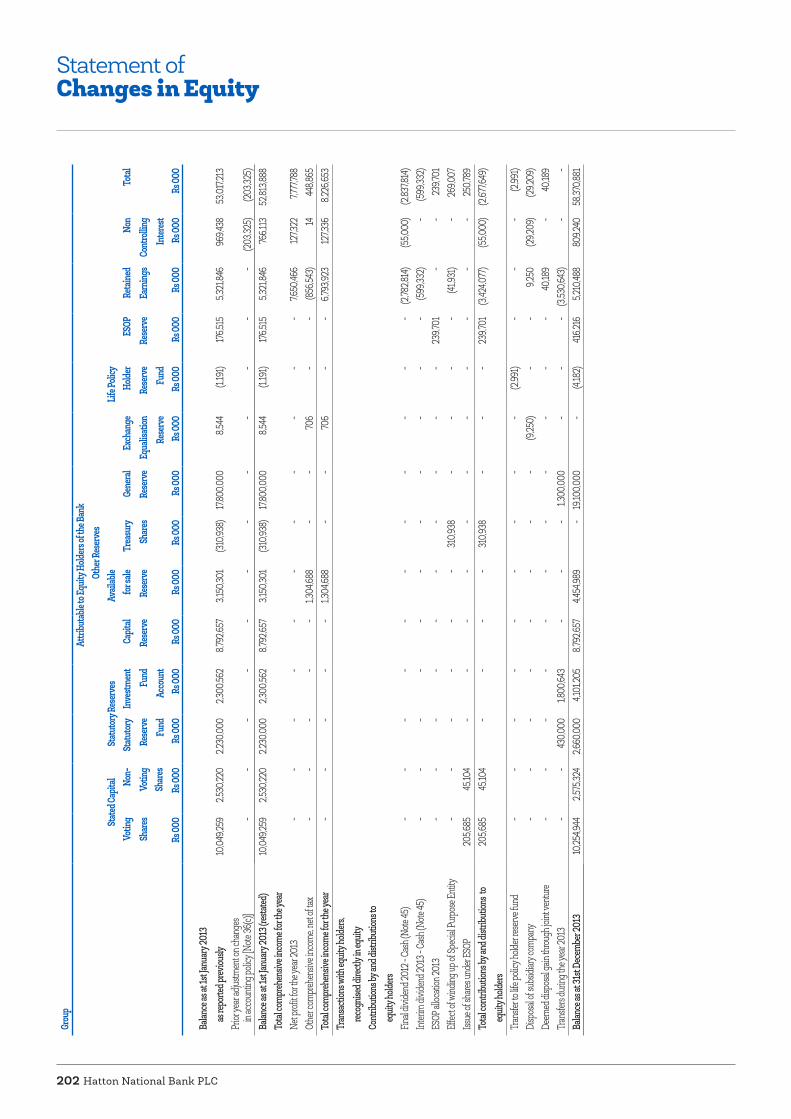
Hatton National Bank PLC202
Grou
pAt
tribu
table
to Eq
uity H
olders
of th
e Ban
kOt
her R
eserv
esSt
ated C
apita
lSt
atutor
y Res
erves
Avail
able
Life P
olicy
Votin
g Sh
ares
Non-
Votin
gSt
atutor
yRe
serv
eFu
nd
Inve
stmen
tFu
ndAc
coun
t
Capit
al Re
serv
e for
sale
Rese
rve
Trea
sury
Share
s Ge
neral
Re
serv
e Ex
chan
geEq
ualis
ation
Rese
rve
Holde
rRe
serv
eFu
nd
ESOP
Rese
rve
Retai
ned
Earn
ings
Non
Cont
rollin
gIn
teres
t
Total
Share
sRs
000
Rs 00
0Rs
000
Rs 00
0 Rs
000
Rs 00
0 Rs
000
Rs 00
0 Rs
000
Rs 00
0 Rs
000
Rs 00
0 Rs
000
Rs 00
0
Balan
ce as
at 1s
t Janu
ary 20
13
as
repo
rted p
reviou
sly 10
,049,2
59
2,53
0,220
2,
230,0
00
2,30
0,562
8,
792,6
57
3,15
0,301
(3
10,93
8) 17
,800,0
00
8,54
4 (1
,191)
176,5
15
5,32
1,846
96
9,438
53
,017,2
13
Prior
year
adjus
tmen
t on c
hang
es
in
acco
untin
g poli
cy [N
ote 36
(c)]
--
--
--
--
--
--
(203
,325)
(203
,325)
Balan
ce as
at 1s
t Janu
ary 20
13 (re
stated
) 10
,049,2
59
2,53
0,220
2,
230,0
00
2,30
0,562
8,
792,6
57
3,15
0,301
(3
10,93
8) 17
,800,0
00
8,54
4 (1
,191)
176,5
15
5,32
1,846
76
6,113
52
,813,8
88
Total
com
preh
ensiv
e inc
ome f
or th
e yea
r Ne
t profi
t for th
e yea
r 201
3 -
- -
- -
- -
- -
- -
7,650
,466
127,3
22
7,777
,788
Othe
r com
prehe
nsive
inco
me,
net o
f tax
- -
- -
- 1,3
04,68
8 -
- 70
6 -
- (8
56,54
3) 14
44
8,865
To
tal co
mpr
ehen
sive i
ncom
e for
the y
ear
- -
- -
- 1,3
04,68
8 -
- 70
6 -
- 6,
793,9
23
127,3
36
8,22
6,653
Tr
ansa
ction
s with
equit
y hold
ers,
recog
nised
direc
tly in
equit
yCo
ntrib
ution
s by a
nd di
stribu
tions
to
eq
uity h
olders
Fin
al div
idend
2012
- Cas
h (No
te 45
) -
- -
- -
- -
- -
- -
(2,78
2,814
) (5
5,000
) (2
,837,8
14)
Interi
m di
viden
d 201
3 - Ca
sh (N
ote 45
) -
- -
- -
- -
- -
- -
(599
,332)
- (5
99,33
2)ES
OP al
locati
on 20
13 -
- -
- -
- -
- -
- 23
9,701
-
- 23
9,701
Ef
fect o
f wind
ing up
of Sp
ecial
Purp
ose E
ntity
- -
- -
- -
310,9
38
- -
- -
(41,9
31)
- 26
9,007
Iss
ue of
share
s und
er ES
OP
205,6
85
45,10
4 -
- -
- -
- -
- -
- -
250,7
89
Total
cont
ribut
ions b
y and
distr
ibutio
ns to
eq
uity h
olders
20
5,685
45
,104
- -
- -
310,9
38
- -
- 23
9,701
(3
,424,0
77)
(55,0
00)
(2,67
7,649
)
Tran
sfer to
life p
olicy
holde
r rese
rve fu
nd
- -
- -
- -
- -
- (2
,991)
- -
- (2
,991)
Disp
osal
of su
bsidi
ary co
mpa
ny
- -
- -
- -
- -
(9,25
0) -
- 9,
250
(29,2
09)
(29,2
09)
Deem
ed di
spos
al ga
in thr
ough
joint
ventu
re -
- -
- -
- -
- -
- -
40,18
9 -
40,18
9 Tr
ansfe
rs du
ring t
he ye
ar 20
13 -
- 43
0,000
1,8
00,64
3 -
- -
1,300
,000
- -
- (3
,530,6
43)
- -
Balan
ce as
at 31
st De
cem
ber 2
013
10,25
4,944
2,
575,3
24
2,66
0,000
4,
101,2
05
8,79
2,657
4,
454,9
89
- 19
,100,0
00
- (4
,182)
416,2
16
5,21
0,488
80
9,240
58
,370,8
81
Statement ofChanges in Equity

Annual Report 2014 203
Grou
pAt
tribu
table
to Eq
uity H
olders
of th
e Ban
kOt
her R
eserv
esSt
ated C
apita
lSt
atutor
y Res
erves
Avail
able
Life P
olicy
Votin
g Sh
ares
Non-
Votin
gSt
atutor
yRe
serv
eFu
nd
Inve
stmen
tFu
ndAc
coun
t
Capit
al Re
serv
e for
sale
Rese
rve
Trea
sury
Share
s Ge
neral
Re
serv
e Ex
chan
geEq
ualis
ation
Rese
rve
Holde
rRe
serv
eFu
nd
ESOP
Rese
rve
Retai
ned
Earn
ings
Non
Cont
rollin
gIn
teres
t
Total
Share
sRs
000
Rs 00
0Rs
000
Rs 00
0 Rs
000
Rs 00
0 Rs
000
Rs 00
0 Rs
000
Rs 00
0 Rs
000
Rs 00
0 Rs
000
Rs 00
0
Balan
ce as
at 1s
t Janu
ary 20
14 10
,254,9
44
2,57
5,324
2,
660,0
00
4,10
1,205
8,
792,6
57
4,45
4,989
-
19,10
0,000
-
(4,18
2) 41
6,216
5,
210,4
88
809,2
40
58,37
0,881
To
tal co
mpr
ehen
sive i
ncom
e for
the y
ear
Net p
rofit fo
r the y
ear 2
014
- -
- -
- -
- -
- -
- 9,
819,5
95
248,4
98
10,06
8,093
Ot
her c
ompre
hens
ive in
com
e, ne
t of ta
x -
- -
- -
2,35
1,202
-
- -
- -
1,142
,303
4,42
7 3,
497,9
32
Total
com
preh
ensiv
e inc
ome f
or th
e yea
r -
- -
- -
2,351
,202
- -
- -
- 10
,961,8
98
252,9
25
13,56
6,025
Tr
ansa
ction
s with
equit
y hold
ers,
rec
ognis
ed di
rectly
in eq
uity
Cont
ribut
ions b
y and
distr
ibutio
ns to
equit
y hold
ers
Final
divide
nd 20
13 - C
ash (
Note
45)
- -
- -
- -
- -
- -
- (2
,800,9
12)
(65,0
00)
(2,86
5,912
)Int
erim
divid
end 2
014 -
Cash
(Note
45)
- -
- -
- -
- -
- -
- (6
02,93
9) -
(602
,939)
Issue
of sh
ares u
nder
ESOP
30
7,076
54
,771
- -
- -
- -
- -
- -
- 36
1,847
To
tal co
ntrib
ution
s by a
nd di
stribu
tions
to eq
uity h
olders
30
7,076
54
,771
- -
- -
- -
- -
- (3
,403,8
51)
(65,0
00)
(3,10
7,004
)Tr
ansfe
r to lif
e poli
cy ho
lder re
serve
fund
-
--
--
--
--
44,93
0 -
--
44,93
0 De
emed
disp
osal
gain
throu
gh jo
int ve
nture
--
--
--
--
--
- 26
,777
- 26
,777
Defer
red ta
x on r
evalu
ation
of
pro
perty
, plan
t and
equip
men
t-
--
- 12
1 -
--
--
--
167
288
Share
of no
n con
trollin
g inte
rest o
n in
vestm
ent in
subs
idiary
--
--
--
--
--
--
736,8
00
736,8
00
Tran
sfers
durin
g the
year
2014
78,37
119
,506
500,0
00 30
6,821
--
-6,0
00,00
0-
-(97
,877)
(6,80
6,821
) -
- Tr
ansfe
r of in
vestm
ent fu
nd ac
coun
t bala
nce
--
-(4,
408,0
26)
--
--
--
-4,4
08,02
6-
-Ba
lance
as at
31st
Dece
mbe
r 201
4 10
,640,3
91
2,64
9,601
3,
160,0
00
- 8,
792,7
78
6,80
6,191
-
25,10
0,000
-
40,74
8 31
8,339
10
,396,5
17
1,734
,132
69,63
8,697
The n
otes t
o the
finan
cial st
atem
ents
from
page
206 t
o 322
form
an in
tegral
part o
f thes
e fina
ncial
state
men
ts.

Hatton National Bank PLC204
Statement ofCash Flows
Bank Group For the year ended 31st December 2014 2013 2014 2013 Restated Rs 000 Rs 000 Rs 000 Rs 000
Cash flows from operating activities Interest and commission receipts 58,459,603 56,662,642 59,237,182 56,886,504 Interest payments (31,065,772) (31,927,052) (31,163,966) (31,917,851)Receipts from other operating activities 1,742,375 1,848,832 5,736,461 5,246,493 Cash payments to employees (7,085,900) (6,947,716) (7,747,437) (7,332,296)Recovery of loans written off in prior years 8,913 8,295 8,913 8,295 Cash payments to other operating activities (10,234,794) (9,570,581) (11,813,945) (11,149,917)Operating profit before changes in operating assets and liabilities [Note (a)] 11,824,425 10,074,420 14,257,208 11,741,228
(Increase) / decrease in operating assets Reverse repurchase agreements (10,513,871) (6,226,870) (10,945,922) (6,479,509)Deposits held for regulatory or monetary control purpose (541,170) 3,567,095 (541,170) 3,567,095 Loans and receivables to other customers (46,909,728) (51,735,528) (48,122,441) (52,368,957)Other short term assets (528,076) 763,225 (677,976) 722,460 (58,492,845) (53,632,078) (60,287,509) (54,558,911)Increase / (decrease) in operating liabilities Securities sold under repurchase agreements 12,822,441 (461,595) 12,822,441 (461,595)Deposits from customers 34,850,988 43,322,311 35,416,711 43,316,675 Other liabilities 1,340,779 421,940 1,454,515 387,268 49,014,208 43,282,656 49,693,667 43,242,348 Net cash generated from / (used in) operating activities before income tax 2,345,788 (275,002) 3,663,366 424,665 Income taxes paid (1,222,240) (2,889,691) (1,281,374) (2,927,327)Net cash generated from / (used in) operating activities 1,123,548 (3,164,693) 2,381,992 (2,502,662)
Cash flows from investing activities Dividend income 368,830 362,509 269,037 280,047 Dividend income received from associates - - 438 147 Net proceeds from sale, maturity and purchase of financial investments (4,170,141) (15,854,115) (5,581,636) (15,775,760)Purchase of property, plant and equipment (645,368) (952,411) (752,255) (1,020,117)Purchase of intangible assets (104,687) (671,888) (120,477) (681,059)Improvements to investment properties (51,010) (2,202) - (993)Net proceeds from sale of associate company - - 30,519 -Proceeds from deemed disposal of subsidiary company by joint venture - - 26,777 40,189 Net cash effect on acquisition of subsidiary [Note 40 (b)] (660,000) - (342,294) - Net cash effect on disposal of subsidiary [Note (b)] - 56,158 - 9,920 Proceeds from sale of property, plant and equipment 49,942 18,397 50,876 22,398 Net cash used in investing activities (5,212,434) (17,043,552) (6,419,015) (17,125,228)
Cash flows from financing activities Increase/ (decrease) in subordinated term debts (318,581) 3,725,177 (318,581) 3,665,513 Increase of debt securities issued 3,000,000 1,354,300 2,949,854 1,334,709 Increase of long term borrowings 8,358,214 11,857,794 8,268,933 11,863,799 Dividends paid (3,243,120) (3,177,254) (3,308,120) (3,232,254)Proceeds from issue of shares under ESOP 361,847 250,789 361,847 250,789 Debenture issue expenses (9,898) (22,342) (9,898) (22,342)Net cash generated from financing activities 8,148,462 13,988,464 7,944,035 13,860,214 Net increase/ (decrease) in cash and cash equivalents 4,059,576 (6,219,781) 3,907,012 (5,767,676)Cash and cash equivalents at the beginning of the year 12,871,257 19,091,038 14,611,293 20,378,969 Cash and cash equivalents at the end of the year [Note (c)] 16,930,833 12,871,257 18,518,305 14,611,293
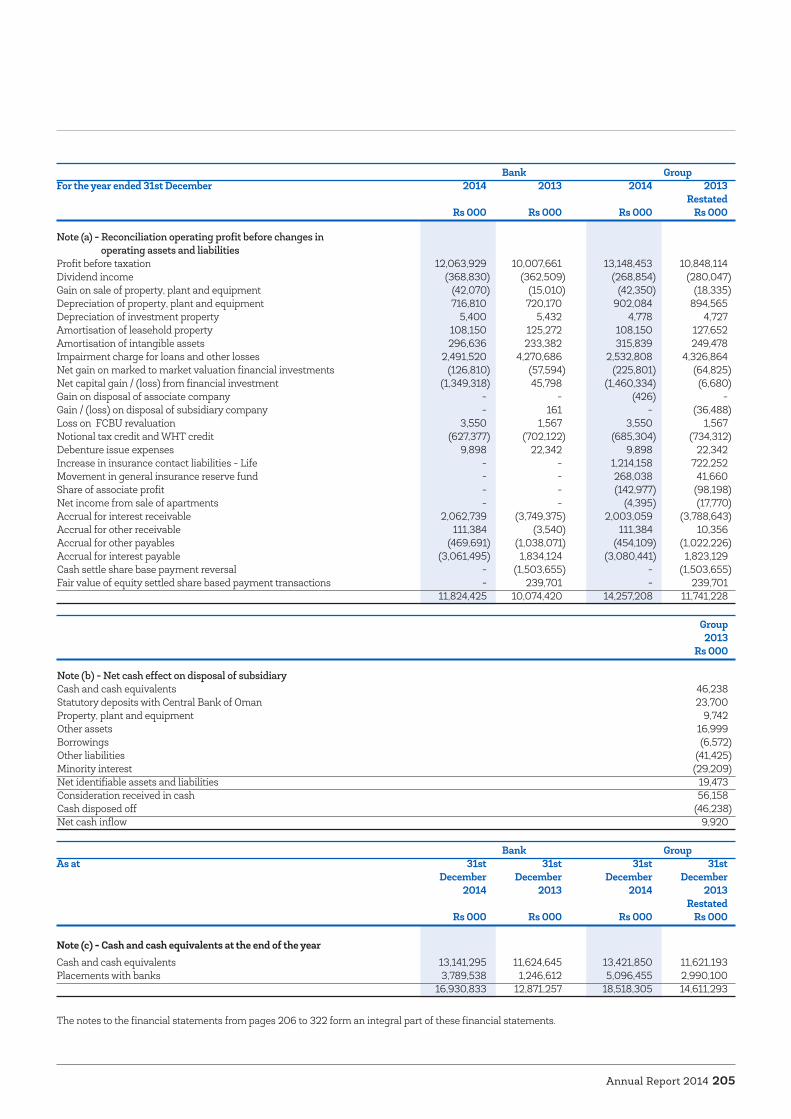
Annual Report 2014 205
Bank Group For the year ended 31st December 2014 2013 2014 2013 Restated Rs 000 Rs 000 Rs 000 Rs 000
Note (a) - Reconciliation operating profit before changes in operating assets and liabilities Profit before taxation 12,063,929 10,007,661 13,148,453 10,848,114 Dividend income (368,830) (362,509) (268,854) (280,047)Gain on sale of property, plant and equipment (42,070) (15,010) (42,350) (18,335)Depreciation of property, plant and equipment 716,810 720,170 902,084 894,565 Depreciation of investment property 5,400 5,432 4,778 4,727 Amortisation of leasehold property 108,150 125,272 108,150 127,652 Amortisation of intangible assets 296,636 233,382 315,839 249,478 Impairment charge for loans and other losses 2,491,520 4,270,686 2,532,808 4,326,864 Net gain on marked to market valuation financial investments (126,810) (57,594) (225,801) (64,825)Net capital gain / (loss) from financial investment (1,349,318) 45,798 (1,460,334) (6,680)Gain on disposal of associate company - - (426) - Gain / (loss) on disposal of subsidiary company - 161 - (36,488)Loss on FCBU revaluation 3,550 1,567 3,550 1,567 Notional tax credit and WHT credit (627,377) (702,122) (685,304) (734,312)Debenture issue expenses 9,898 22,342 9,898 22,342 Increase in insurance contact liabilities - Life - - 1,214,158 722,252 Movement in general insurance reserve fund - - 268,038 41,660 Share of associate profit - - (142,977) (98,198)Net income from sale of apartments - - (4,395) (17,770) Accrual for interest receivable 2,062,739 (3,749,375) 2,003,059 (3,788,643)Accrual for other receivable 111,384 (3,540) 111,384 10,356 Accrual for other payables (469,691) (1,038,071) (454,109) (1,022,226)Accrual for interest payable (3,061,495) 1,834,124 (3,080,441) 1,823,129 Cash settle share base payment reversal - (1,503,655) - (1,503,655)Fair value of equity settled share based payment transactions - 239,701 - 239,701 11,824,425 10,074,420 14,257,208 11,741,228
Group 2013 Rs 000
Note (b) - Net cash effect on disposal of subsidiaryCash and cash equivalents 46,238 Statutory deposits with Central Bank of Oman 23,700 Property, plant and equipment 9,742 Other assets 16,999 Borrowings (6,572)Other liabilities (41,425)Minority interest (29,209)Net identifiable assets and liabilities 19,473 Consideration received in cash 56,158 Cash disposed off (46,238)Net cash inflow 9,920
Bank Group As at 31st 31st 31st 31st December December December December 2014 2013 2014 2013 Restated Rs 000 Rs 000 Rs 000 Rs 000
Note (c) - Cash and cash equivalents at the end of the year Cash and cash equivalents 13,141,295 11,624,645 13,421,850 11,621,193Placements with banks 3,789,538 1,246,612 5,096,455 2,990,100 16,930,833 12,871,257 18,518,305 14,611,293
The notes to the financial statements from pages 206 to 322 form an integral part of these financial statements.

Hatton National Bank PLC206
1. REPORTING ENTITYHatton National Bank PLC (the “Bank”) is a public quoted company incorporated on 5th March 1970 with limited liability and domiciled in Sri Lanka. It is a licensed commercial bank registered under the Banking Act No. 30 of 1988 and amendments thereto. The Bank was re-registered under the Companies Act No. 07 of 2007. The registered office of the Bank is situated at No 479, T B Jayah Mawatha, Colombo 10. The shares of the Bank have a primary listing on the Colombo Stock Exchange. The staff strength of the Bank as at 31st December 2014 was 4,451 (2013-4,604).
The consolidated financial statements of the Bank for the year ended 31st December 2014 include the Bank and its subsidiaries (together referred to as the “Group” and individually as “Group entities”) and the Group’s interest in its joint venture. The financial statements of all companies in the Group have a common financial year which ends on December 31st except for Prime Grameen (Pvt) Ltd, a subsidiary of the bank and Lanka Ventures PLC, a subsidiary of Acuity Partners (Pvt) Limited, the joint venture, whose financial year ends on March 31st .
Hatton National Bank PLC is the ultimate parent of the Group.
There were no significant changes in the nature of the principal activities of the Bank and the Group during the financial year under review.
1.1 Principal Activities and Nature of Operations
1.1.1 BankThe principal activities of the Bank continued to be banking and related activities such as accepting deposits, corporate and retail banking, personal financial services, off shore banking, foreign currency operations, trade services, investment banking, development banking, rural finance, project finance, dealing in government securities, leasing, islamic banking etc.
1.1.2 Subsidiaries
Name of Subsidiary
Principal Activities
HNB Assurance PLC
Insurance services
Sithma Development (Pvt) Ltd
Construction and letting of premises for commercial purposes and related services
Prime Grameen Micro Finance Ltd.*
Micro finance
* The Bank acquired a 42.16% holding in Prime Grameen Micro Finance Ltd on 7th November 2014.
1.1.3 Joint Venture
Name of Joint Venture
Principal Activities
Acuity Partners (Pvt) Ltd
Operating as an investment company and providing financial services
2. BASIS OF PREPARATION
2.1 Statement of ComplianceThe consolidated financial statements of the Group and the separate financial statements of the Bank which comprise the statement of financial position, income statement, statement of other comprehensive income, statement of changes in equity, statement of cash flows and notes thereto, have been prepared in accordance with Sri Lanka Accounting Standards (commonly referred as “SLFRS” ) laid down by the Institute of Chartered Accountants of Sri Lanka (CA Sri Lanka), and comply with the requirements of Companies Act No 7 of 2007, Banking Act No 30 of 1988, Insurance Industry Act No 43 of 2000 and, Finance Business Act No 42 of 2011 and amendments thereto.
2.2 Responsibility for Financial StatementsThe Board of Directors is responsible for the preparation and presentation of the financial statements of the Group and the Bank as per Sri Lanka Accounting Standards and the provisions of the Companies Act No 07 of 2007.
2.3 Approval of Financial Statements by DirectorsThe financial statements of the Group and the Bank were authorised for issue by the Board of Directors in accordance with the resolution of the Directors on 20th February 2015.
2.4 Basis of MeasurementThe financial statements have been prepared on the historical cost basis and applied consistently with no adjustments being made for inflationary factors affecting the financial statements, except for the following;
• Derivative financial instruments are measured at fair value
• Financial instruments classified as fair value through profit and loss are measured at fair value
• Available-for-sale financial assets are measured at fair value
• Freehold land and buildings are measured at cost at the time of acquisition and subsequently at revalued amounts (except investment properties), which are the fair values at the date of revaluation
• Non-current assets held for sale are measured at lower of its carrying amount and fair value less costs to sell
• Liability for defined benefit obligations is recognised as the present value of the defined benefit obligation less the fair value of the plan assets.
Notes to theFinancial Statements

Annual Report 2014 207
2.5 Functional and Presentation CurrencyThe financial statements of the Group and the Bank are presented in Sri Lankan Rupees (LKR), which is the currency of the primary economic environment in which Group operates (Group’s functional currency). Financial information presented in Sri Lankan Rupees has been rounded to the nearest thousand unless indicated otherwise.
Each entity in the Group determines its own functional currency and items included in the financial statements of each individual entity are measured using that functional currency. There was no change in the Group’s presentation and functional currency during the year under review.
2.6 Presentation of Financial StatementsThe assets and liabilities of the Group and the Bank presented in the statements of financial position are grouped by nature and listed in an order that reflects their relative liquidity and maturity pattern. An analysis on recovery or settlement within 12 months after the reporting date (current) and more than 12 months after the reporting date (non-current) is presented in Note 61 to the financial statements.
2.7 Significant Accounting Judgements, Estimates and AssumptionsThe preparation of financial statements in conformity with Sri Lanka Accounting Standards requires management to make judgements, estimates and assumptions that affect the application of accounting policies and the reported amounts of assets, liabilities, income and expenses as well as the disclosure of contingent liabilities. Actual results may differ from these estimates.
Estimates and underlying assumptions are reviewed on an on-going basis. Revisions to accounting estimates are recognised in the period in which the estimate is revised and in any future periods affected.
The most significant areas of estimation, uncertainty and critical judgements in applying accounting policies that have most significant effect on the amounts recognised in the financial statements of the Group and the Bank are as follows:
2.7.1 Going ConcernThe Directors have made an assessment of the Group’s ability to continue as a going concern and are satisfied that it has the resources to continue in business for the foreseeable future. Furthermore, Board is not aware of any material uncertainties that may cast significant doubt upon the Group’s ability to continue as a going concern and they do not intend either to liquidate or to cease operations of the Group. Therefore, the financial statements continue to be prepared on the going concern basis.
2.7.2 Fair value of Financial InstrumentsWhere the fair values of financial assets and financial liabilities recorded on the statement of financial position cannot be derived from active markets, they are determined using a variety of valuation techniques that include the use of mathematical models. The inputs to these models are derived from observable market data where possible, but if this is not available, judgement is required to establish fair values. The valuation of financial instruments is described in more detail in Note 8 to the financial statements.
2.7.3 Impairment Losses on Loans and AdvancesThe Group and the Bank review their individually significant loans and advances at each reporting date to assess whether an impairment loss should be recorded in the income statement. In particular, management judgement is required in the estimation of the amount and timing of future cash flows when determining the impairment loss. These estimates are based on assumptions about a number of factors and actual results may differ, resulting in future changes to the impairment allowance made.
Loans and advances that have been assessed individually and found not to be impaired and all individually insignificant loans and advances are then assessed collectively, by categorising them into groups of assets with similar credit risk characteristics, to determine whether a provision should be made due to incurred loss events for which there is objective evidence, but the effects of which are not yet evident. The collective assessment takes account of data from the loan portfolio such as number of days in arrears and judgements on the effect of concentrations of risks and economic data (including levels of unemployment, inflation, interest rates, exchange rates etc.).
The impairment loss on loans and advances is disclosed in Note 16 to the financial statements.
2.7.4 Impairment of Available for Sale InvestmentsThe Group and the Bank review their debt securities classified as available for sale investments at each reporting date to assess whether they are impaired. This requires similar judgements as applied to the individual assessment of loans and advances.

Hatton National Bank PLC208
Notes to theFinancial Statements
The Group and Bank also record impairment charges on available for sale equity investments when there has been a significant or prolonged decline in the fair value below their cost. The determination of what is ‘significant’ or ‘prolonged’ requires judgement. In making this judgement, the Group and Bank evaluate, among other factors, historical share price movements and duration and extent to which the fair value of an investment is less than its cost.
The impairment loss on available for sale investments is disclosed in Note 16 to the financial statements.
2.7.5 Impairment of Investments in Subsidiaries and Other Financial AssetsThe Group and the Bank follow the guidance of Sri Lanka Accounting Standard (LKAS 36) – “Impairment of Assets” and Sri Lanka Accounting Standard (LKAS 39) – “Financial instruments Recognition and Measurement” in determining whether an investment or a financial asset is impaired. This determination requires significant judgement. The Group and the Bank evaluate, among other factors, the duration and extent to which the fair value of an investment or a financial asset is less than its cost and the financial health of the near-term business outlook for the investment or a financial asset, including factors such as industry and sector performance, changes in technology and operational and financing cash flows.
2.7.6 Impairment of GoodwillThe Group estimates the value in use of the Cash-Generating Units (CGU) to which goodwill has been allocated in order to determine whether goodwill is impaired. The value-in-use calculation requires the entity to estimate the future cash flows expected to arise from the CGU and
a suitable discount rate in order to calculate present value. The carrying amount of goodwill as at 31 December 2014 is Rs 122.9 Mn (2013 : Nil).
2.7.7 Deferred Tax AssetsDeferred tax assets are recognised in respect of loan impairment allowances which will be recovered in the foreseeable future and tax losses to the extent that it is probable that future taxable profit will be available against which the losses can be utilised. Judgement is required to determine the amount of deferred tax assets that can be recognised, based upon the likely timing and level of future taxable profits, together with future tax planning strategies.
Details on deferred tax assets are disclosed in Note 48 to the financial statements.
2.7.8 Defined Benefit ObligationThe cost of the defined benefit pension plan is determined using an actuarial valuation. The actuarial valuation involves making assumptions about discount rates, expected rates of return on assets, future salary increases, mortality rates and future pension increases. Due to the long term nature of these plans, such estimates are subject to significant uncertainty. All assumptions are reviewed at each reporting date.
In determining the appropriate discount rate, management considers the interest rates of Sri Lanka Government bonds with maturities corresponding to the expected duration of the defined benefit obligation. Future salary increases and pension increases are based on expected future inflation rates and expected future salary increment rate of the Group or the Bank.
Details of the key assumptions used in the estimates are contained in Note 52 (c) to the financial statements.
2.7.9 Fair Value of Property, Plant and EquipmentThe land and buildings of the Group and the Bank are reflected at fair value. The Group engaged independent valuers to determine fair value of land and buildings in terms of Sri Lanka Accounting Standard (SLFRS 13) “Fair Value Measurement”. When current market prices of similar assets are available, such evidence is considered in estimating fair values of these assets.
The methods used to determine the fair value of the land and buildings, are further explained in Note 3.8.4 to the financial statements
2.7.10 Useful Life time of Property, Plant and Equipment, Investment Properties and Intangible AssetsThe Group and the Bank review the residual values, useful lives and methods of depreciation of property, plant and equipment, investment properties and intangible assets at each reporting date. Judgement of the management is exercised in the estimation of these values, rates, methods and hence they are subject to uncertainty.
2.7.11 Commitments and Contingencies All discernible risks are accounted for in determining the amount of all known liabilities.
Contingent liabilities are possible obligations whose existence will be confirmed only by uncertain future events or present obligations where the transfer of economic benefit is not probable or cannot be reliably measured. Contingent liabilities are not recognised in the statement of financial position but are disclosed unless they are remote.
Annual Report 2014 209
2.7.12 Classification of Investment PropertiesManagement requires using its judgment to determine whether a property qualifies as an investment property. The Group and Bank has developed criteria so it can exercise its judgment consistently. A property that is held to earn rentals or for capital appreciation or both, and which generates cash flows largely independently of the other assets held by the Group and the Bank are accounted for as investment properties. On the other hand, a property that is used for operations or in the process of providing services or for administrative purposes and which do not directly generate cash flows as a standalone asset are accounted for as property, plant and equipment. The Group and the Bank assess on an annual basis, the accounting classification of its properties taking into consideration the current use of such properties.
2.7.13 Valuation of Insurance Contract Liabilities – Life Insurance of Subsidiary HNB Assurance PLC (HNBA)The liability for life insurance contracts with Discretionary Participation Features (DPF) is either based on current assumptions or on assumptions established at the inception of the contract, reflecting the best estimate at the time increased with a margin for risk and adverse deviation. All contracts are subject to a liability adequacy test, which reflect management’s best current estimate of future cash flows.
The main assumptions used relate to mortality, morbidity, longevity, investment returns, expenses, lapse and surrender rates and discount rates. For those contracts that insure risk related to longevity, prudent allowance is made for expected future mortality improvements, as well as wide ranging changes to life style, which could result in significant changes to the expected future mortality exposure.
Estimates are also made as to future investment income arising from the assets backing life insurance contracts. These estimates are based on current market returns, as well as expectations about future economic and financial developments.
Assumptions on future expense are based on current expense levels, adjusted for expected expense inflation, if appropriate.
Lapse and surrender rates are based on HNBA’s historical experience of lapses and surrenders.
Discount rates are based on current industry risk rates, adjusted for the HNBA’s own risk exposure.
2.7.14 Valuation of Insurance Contract Liabilities – General Insurance of Subsidiary HNB Assurance PLC (HNBA)The estimates of general insurance contracts have to be made both for the expected ultimate cost of claims reported at the reporting date and for the expected ultimate cost of claims Incurred, But Not yet Reported, at the reporting date (IBNR). It can take a significant period of time before the ultimate claims cost can be established with certainty. The main assumption underlying estimating the amounts of outstanding claims is the past claims development experience.
Large claims are usually separately addressed, either by being reserved at the face value of loss adjuster estimates or separately projected in order to reflect their future development. In most cases, no explicit assumptions are made regarding future rates of claims inflation or loss ratios.
All General Insurance contracts are subject to a Liability Adequacy Test (LAT). The LAT was carried out by Messrs. NMG Consulting Ltd, Singapore.
2.7.15 Deferred Acquisition Cost (DAC)An impairment review is performed at each reporting date or more frequently when an indication of impairment arises. When the recoverable amount is less than the carrying value, an impairment loss is recognised in the income statement. No such indication of impairment was experienced during the year.
DAC is derecognised when the related contracts are either settled or disposed of.
2.7.16 TaxationThe Group and the Bank are subject to income tax and judgment was required to determine the total provision for current, deferred and other taxes due to the uncertainties that exists with respect to the interpretation of the applicability of tax laws, at the time of preparation of these financial statements.
Uncertainties also exist with respect to the interpretation of complex tax regulations and the amount and timing of future taxable income. Given the wide range of business relationships and the long term nature and complexity of existing contractual agreements, differences arising between the actual results and the assumptions made, or future changes to such assumptions, could necessitate future adjustments to tax income and expense amounts that were initially recorded, and deferred tax amounts in the period in which the determination is made.
2.7.17 Share-based paymentsThe Group and the Bank measures the cost of equity settled transactions with employees by reference to the fair value of the equity instruments at the date at which they are granted. Estimating fair value for share based payment transactions requires determination of the most appropriate valuation model, which is dependent on the terms and conditions of the grant.

Hatton National Bank PLC210
Notes to theFinancial Statements
This estimate also requires determination of the most appropriate inputs to the valuation model including the expected life of the share option, volatility and dividend yield and making assumptions about them. The assumptions and models used for estimating fair value for share based payment transactions are disclosed in Note 54 (c) i.
2.7.18 Provisions for Liabilities and ContingenciesThe Group and the Bank receive legal claims against it in the normal course of business. Management has made judgements as to the likelihood of any claim succeeding in making provisions. The time of concluding legal claims is uncertain, as is the amount of possible outflow of economic benefits.
2.8 Changes in Accounting PoliciesThe accounting policies adopted are consistent with those of the previous financial year. There have been no significant effect to the accounting policies due to the adoption of Sri Lanka Accounting Standard (SLFRS 10) - ‘Consolidated Financial Statements’, and Sri Lanka Accounting Standard (SLFRS 12) ‘Disclosure of Interests in Other Entities’. Changes to the disclosure requirements on the adoption of Sri Lanka Accounting Standard (SLFRS 13) - ‘Fair Value Measurement’ have been disclosed under Note 8.
The impact of Sri Lanka Accounting Standard (SLFRS 11) – ‘Joint Arrangements’ is discussed below.
SLFRS 11 replaces Sri Lanka Accounting Standard (LKAS 31) – “Interest in Joint Ventures” and SIC 13 – “Jointly Controlled Entities – Non-Monetary Contributions by Ventures”. SLFRS 11 classifies a joint arrangement as either a joint operation or a joint venture based on the parties’ rights and obligations under the arrangement. SLFRS 11
removed the option to account for Jointly Controlled Entities (JCEs) using proportionate consolidation method. Instead, JCEs that meet the definition of a joint venture must be accounted for using the equity method. The effect of this change to the consolidated financial statements of the Group is given in Note 2.8.1 to the financial statements.
2.8.1 Investment in Joint VentureUpon adoption of SLFRS 11, the Group has determined its interest in Acuity Partners (Pvt) Ltd to be classified as a joint venture under SLFRS 11 and it is required to be accounted for using the equity method.
Prior to the transition to SLFRS 11, Acuity Partners (Pvt) Ltd was classified as a jointly controlled entity and the Group’s share of the assets, liabilities, revenue, income and expenses was proportionately consolidated in the consolidated financial statements.
Impact of change in Accounting Policy
The transition was applied retrospectively as required by SLFRS 11 and the comparative information for the immediately preceding period (2013) is restated. The effect of applying SLFRS 11 on the consolidated financial statements is disclosed in Note 65 (d) to the financial statements.
2.9 Materiality and AggregationFinancial assets and financial liabilities are offset and the net amount is reported in the statement of financial position only when there is a legally enforceable right to offset the recognised amounts and there is an intention to settle on a net basis, or to realise the assets and settle the liability simultaneously. Income and expenses are not offset in the income statement unless required or permitted by an accounting standard or interpretation, and as specifically disclosed in the accounting policies of the Group and the Bank.
2.10 Comparative InformationThe comparative information is re-classified wherever necessary to conform with the current year’s classification in order to provide a better presentation. The details of such re-classifications have been provided in Note 65 to the financial statements.
3. SIGNIFICANT ACCOUNTING POLICIESThe significant accounting policies set out below have been applied consistently to all periods presented in these financial statements of the Group and the Bank, unless otherwise indicated. The accounting policies have been consistently applied by the Group entities where applicable and deviations if any have been disclosed accordingly.
3.1 Basis of ConsolidationThe Bank’s financial statements comprise the amalgamation of the financial statements of the Domestic Banking unit (DBU) and the Foreign Currency Banking Unit (FCBU). The Group’s financial statements comprise consolidation of the financial statements of the bank, its subsidiaries in terms of the Sri Lanka Accounting Standard (SLFRS 10) - “Consolidated Financial Statements” and the proportionate share of the profit or loss and net assets of its joint venture in terms of the Sri Lanka Accounting Standard (SLFRS 11) - “Joint Arrangements”.
3.1.1 Business Combinations and GoodwillBusiness combinations are accounted for using the Acquisition method as per the requirements of Sri Lanka Accounting Standard (SLFRS 3) - “Business Combinations”. When the Group acquires a business, it assesses the financial assets and liabilities assumed for appropriate classification and designation in accordance with the contractual terms, economic circumstances and pertinent conditions as at the acquisition date.
Annual Report 2014 211
The Group measures goodwill as the fair value of the consideration transferred including the recognised amount of any non-controlling interest in the acquiree, less the net recognised amount (generally fair value) of the identifiable assets acquired and liabilities assumed, all measured as of the acquisition date. When the excess is negative, a bargain purchase gain is recognised immediately in profit or loss. Acquisition related costs are expensed as incurred and included in other expenses. Goodwill is initially measured at cost and subsequently at cost less any accumulated impairment losses in accordance with the Sri Lanka Accounting Standard (SLFRS 3) - “Business Combinations”.
Goodwill has to be reviewed for impairment annually or more frequently if events or circumstances indicate that the carrying value may be impaired.
The Group elects on a transaction by transaction basis whether to measure non-controlling interest at its fair value, or at its proportionate share of the recognised amount of the identifiable net assets, at the acquisition date.
The consideration transferred does not include amounts related to the settlement of pre-existing relationships. Such amounts are generally recognised in profit or loss.
3.1.2 SubsidiariesSubsidiaries are entities that are controlled by the Group. Control is achieved when the Group is exposed, or has rights, to variable returns from its involvement with the investee and has the ability to affect those returns through its power over the investee. Specifically, the Group controls an investee if, and only if, the Group has:
• Power over the investee
• Exposure or rights to variable returns from its involvement with the investee
• The ability to use its power over the investee to affect its returns
Generally, there is a presumption that a majority of voting rights results in control. To support this presumption and when the Group has less than a majority of the voting or similar rights of an investee, the Group considers all relevant facts and circumstances in assessing whether it has power over an investee, including:
• The contractual arrangement with the other vote holders of the investee
• Rights arising from other contractual arrangements
• The Group’s voting rights and potential voting rights
The Group reassesses whether or not it controls an investee if facts and circumstances indicate that there are changes to one or more of the above.
The financial statements of subsidiaries are included in the consolidated financial statements from the date that control commences until the date that control ceases. Where Subsidiaries have been sold or acquired during the year, assets, liabilities, income and expenses of the said subsidiary are included in the consolidated financial statements from the date the Group gains control until the date the Group ceases to control the subsidiary.
When necessary, adjustments are made to the financial statements of subsidiaries to bring their accounting policies in line with the Group’s accounting policies. All intra-group assets and liabilities, equity, income, expenses and cash flows relating to transactions between members of Group are eliminated in full on consolidation.
Non-controlling interests represent the portion of profit or loss and net assets of the subsidiaries not owned directly or indirectly by the
Bank. The non-controlling interest is presented in the consolidated statement of financial position within equity, separately from the equity attributable to the equity holders of the Bank. non-controlling interest in the profit or loss of the Group is disclosed separately in the consolidated statement of comprehensive income.
Any losses applicable to the non-controlling interest are allocated against the interests of the non-controlling interest even if this results in a deficit balance.
A change in the ownership interest of a subsidiary without a loss of control is accounted for as an equity transaction. Upon the loss of control, the Group derecognises the assets (including goodwill) and liabilities of the subsidiary, any non-controlling interests and the other components of equity related to the subsidiary. Any surplus or deficit arising on the loss of control is recognised in the statement of changes in equity. If the Group retains any interest in the previous subsidiary, then such interest is measured at fair value at the date that control is lost. Subsequently, it is accounted for as an equity-accounted investee or in accordance with the Group’s accounting policy for financial instruments depending on the level of influence retained.
There are no significant restrictions on the ability of the subsidiaries to transfer funds to the Bank in the form of cash dividends or repayment of loans and advances. All subsidiaries of the Bank as at the reporting date have been incorporated in Sri Lanka.
A list of subsidiaries within the Group is provided in Note 37 to the financial statements and the details of non-controlling interests are given in Note 58 to the financial statements.

Hatton National Bank PLC212
Notes to theFinancial Statements
3.1.3 Special Purpose Entity (SPE)Special purpose entities (SPEs) are entities that are created to accomplish a narrow and well defined objective. A SPE is consolidated if, based on an evaluation of the substance of its relationship with the Group and the SPE’s risks and rewards, the Group concludes that it controls the SPE.
The Bank operated an Employee Share Ownership Plan covering specific employees who after having served for a minimum service period are allotted a specific number of shares of the Bank. HNB had set up a trust, Employee Share Benefit Trust (ESBT) to administer the plan and had given an overdraft to the Trust at concessional rate of interest. The Trust had purchased equity shares (non-voting) of HNB from open market for meeting the obligations under the Plan. Accordingly, the ESBT had been treated as a SPE and included in the consolidated financial statements up to 31st March 2013.
As per the Colombo Stock Exchange (CSE) Rule 5.6.10 all share benefits schemes which had been introduced by the companies listed in the CSE had to be wound up prior to 01st March 2015. Complying with the said rule, Board of Directors approved to transfer the shares in the trust to eligible employees upon settling the outstanding loan, accrued interest and taxes relating thereto. The said decision was communicated to all the eligible employees. Accordingly, the Bank discontinued its treatment of the ESBT as a special purpose entity in the consolidated financial statements with effect from June 2013.
3.1.4 Associates and Joint VentureAn associate is an entity in which the Group has significant influence, but no control over the financial and operating policies. Significant influence is the power to participate in the financial and operating policy
decisions of the investee, but does not have the control or joint control over those policies.
Joint venture is a type of joint arrangement whereby the parties that have joint control of the arrangement have rights to the net assets of the joint venture. Joint control is the contractually agreed sharing of control of an arrangement, which exists only when decisions about the relevant activities require unanimous consent of the parties sharing control.
The Group determines significant influence or joint control by taking into account similar considerations necessary to determine control over subsidiaries.
The Group’s investment in associate and joint venture are accounted for using the equity method and are recognised initially at cost. The carrying amount of the investment is adjusted to recognise changes in the Group’s share of net assets of the associate or joint venture since the acquisition date. Goodwill relating to the associate or joint venture is included in the carrying amount of the investment and is not tested for impairment individually.
The statement of profit or loss reflects the Group’s share of the results of operations of the associate or joint venture. Any change in OCI of those investees is presented as part of the Group’s OCI. In addition, when there has been a change recognised directly in the equity of the associate or joint venture, the Group recognises its share of any changes, when applicable, in the statement of changes in equity. Unrealised gains and losses resulting from transactions between the Group and the associate or joint venture are eliminated to the extent of the interest in the associate or joint venture.
The aggregate of the Group’s share of profit or loss of an associate and a joint venture is shown on the face of the statement of profit or loss outside operating profit and represents profit or loss after tax and non-controlling interests in the subsidiaries of the associate or joint venture.
The financial statements of the associate or joint venture are prepared for the same reporting period as the Group. When necessary, adjustments are made to bring the accounting policies in line with those of the Group.
At each reporting date, the Group determines whether there is objective evidence that the investment in associate or joint venture is impaired. If there is such evidence, the Group calculates the amount of impairment as the difference between the recoverable amount of the associate or joint venture and its carrying value, and then recognises the loss as ‘Share of profit of an associate and a joint venture’ in the income statement.
When the Group’s share of losses exceeds its interest in the associate, the carrying amount of that interest, including any long term investments, is reduced to nil and the recognition of further losses is discontinued except to the extent that the Group has an obligation or has made payments on behalf of the associate. If the associate subsequently reports profits, the Group resumes recognising its share of those profits only after its share of the profits equals the share of losses not recognised.
The Group discontinues the use of the equity method from the date that it ceases to have significant influence over an associate or joint control over the joint venture and accounts for the investment in accordance with the Group’s accounting policy for financial instruments. Any difference between the carrying amount of the

Annual Report 2014 213
associate or joint venture upon loss of significant influence or joint control and the fair value of the retained investment and proceeds from disposal is recognised in profit or loss.
There are no significant restrictions on the ability of the associate to transfer funds to the Group in the form of cash dividends or repayment of loans and advances.
Details of the associates within the Group are provided in Note 35 to the financial statements and the details of the joint venture are provided in Note 36 to the financial statements.
3.1.5 Transactions Eliminated on ConsolidationIntra-group balances, transactions and income and expenses arising from intra-group transactions are eliminated in preparing the consolidated financial statements. Unrealised gains arising from transactions with equity accounted investees are eliminated to the extent of the Group’s interest in the investee. Unrealised losses are eliminated in the same way as unrealised gains, except that they are only eliminated to the extent that there is no evidence of impairment.
3.1.6 Material Gains or Losses, Provisional Values or Error CorrectionsThere were no material gains or losses, provisional values or error corrections recognised during the year in respect of business combinations that took place in previous periods.
3.2 Foreign Currency3.2.1 Foreign Currency Transactions
and BalancesTransactions in foreign currencies are translated into the functional currency, which is Sri Lankan Rupees (LKR), using the middle rates of exchange prevailing at the dates on which the transactions were affected.
Monetary assets and liabilities denominated in foreign currencies at the reporting date are retranslated to Sri Lankan Rupees, using the middle rates of exchange prevailing at that date. All differences arising on non-trading activities are taken to ”other operating income” in the income statement.
The foreign currency gain or loss on monetary items is the difference between amortised cost in the functional currency at the beginning of the period, adjusted for effective interest and payments during the period, and the amortised cost in foreign currency translated at the middle rates of exchange prevailing at the end of the reporting period. Foreign currency differences arising on retranslation are recognised in the income statement, except for differences arising on the retranslation of available-for-sale equity instruments, a financial liability designated as a hedge of the net investment in a foreign operation, or qualifying cash flow hedges, which are recognised in ‘other comprehensive Income’.
Non-monetary assets and liabilities denominated in foreign currencies that are measured at fair value are retranslated to Sri Lankan Rupees at the exchange rates at the date that the fair value was determined. Non monetary items that are measured in terms of historical cost in a foreign currency are translated using the exchange rates at the date of the transaction.
Foreign exchange differences arising on the settlement or reporting of monetary items at rates different from those which were initially recorded are dealt with in the income statement.
Forward exchange contracts are valued at the forward market rates prevailing on the reporting date. Resulting net unrealised gains or losses are dealt with in the income statement.
3.3 Financial Instruments – Initial Recognition, Classification and Subsequent Measurement
3.3.1 Date of RecognitionAll financial assets and liabilities are initially recognised on the trade date, i.e., the date that the Group becomes a party to the contractual provisions of the instrument. This includes “regular way trades”. Regular way trades means purchases or sales of financial assets that require delivery of assets within the time frame generally established by regulation or convention in the market place.
3.3.2 Recognition and Initial measurement of financial instrumentsThe classification of financial instruments at initial recognition depends on their purpose and characteristics and the management’s intention in acquiring them. Detailed explanations of the classification of financial instruments are given in Note 3.3.3 and 3.3.4 to the financial statements.
All financial instruments are measured initially at their fair value plus transaction costs that are directly attributable to acquisition or issue of such financial instruments except in the case of financial assets and financial liabilities at fair value through profit or loss according to Sri Lanka Accounting Standard (LKAS 39) - “Financial Instruments: Recognition and Measurement”. Transaction costs in relation to financial assets and financial liabilities at fair value through profit or loss are dealt with through Income Statement.
In respect of financial assets and liabilities held at fair value through profit or loss, any changes in fair value from the trade date to settlement date are accounted in the income statement, while for available-for-sale financial assets, any changes in fair value from the trade date to settlement date are accounted in the other comprehensive income.
Hatton National Bank PLC214
Notes to theFinancial Statements
3.3.2 (a) “Day 1” Profit or Loss
When the transaction price differs from the fair value of other observable current market transactions in the same instrument, or based on a valuation technique whose variables include only data from observable markets, the Group recognises the difference between the transaction price and fair value (a Day 1 profit or loss) over the tenor of the financial instrument using the Effective Interest Rate (EIR) method. In cases where fair value is determined using data which is not observable, the difference between the transaction price and model value is only recognised in the income statement when the inputs become observable, or when the instrument is derecognised.
3.3.3 Classification and Subsequent Measurement of Financial AssetsAt inception a financial asset is classified in one of the following categories:
• Financial assets at fair value through profit or loss
- Financials assets held for trading
- Financials assets designated at fair value through profit or loss
• Loans and receivables
• Held to maturity financial assets
• Available-for-sale financial assets
The subsequent measurement of financial assets depends on their classification.
3.3.3 (a) Financial Assets at Fair Value through Profit or Loss
A financial asset is classified as fair value through profit or loss if it is held for trading or is designated at fair value through profit or loss.
3.3.3 (a) (i) Financial Assets held for Trading
Financial assets are classified as held for trading if they are acquired principally for the purpose of selling or repurchasing in the near term
or holds as a part of a portfolio that is managed together for short term profit or position taking. This category also includes derivative financial instruments entered into by the Group that are not designated as hedging instruments in hedge relationships.
Financial assets held for trading are recorded in the statement of financial position at fair value. Changes in fair value are recognised in ‘net gain / (loss) from trading’. Interest and dividend income are recorded in ‘net gain / (loss) from trading’ according to the terms of the contract, or when the right to receive the payment has been established.
The Group evaluates its financial assets held for trading, other than derivatives, to determine whether the intention to sell them in the near term is still appropriate. When the Group is unable to trade these financial assets due to inactive markets and management’s intention to sell them in the foreseeable future significantly changes, the Group may elect to reclassify these financial assets.
Financial assets held for trading include instruments such as government securities, equity instruments etc. that have been acquired principally for the purpose of selling or repurchasing in the near term and derivatives, including separated embedded derivatives unless they are designated as effective hedging instruments.
Details of financial assets held for trading are given in Note 29 to the financial statements.
Derivatives Recorded at Fair Value through Profit or Loss
Derivatives are financial instruments that derive their value in response to changes in interest rates, financial instrument prices, commodity prices, foreign exchange rates, credit risk and indices. Derivatives are categorised as trading unless they are
designated as hedging instruments. The Bank uses derivatives such as forward foreign exchange contracts and currency swaps. Bank has not designated any derivatives as hedging instruments and has not followed hedge accounting as at the reporting date. All derivatives are initially recognised and subsequently measured at fair value, with all revaluation gains or losses recognised in income statement under ‘net gain / (loss) from trading’ (Note 13). Derivatives are recorded at fair value and carried as assets when their fair value is positive and as liabilities when their fair value is negative. Changes in the fair value of derivatives are included in ‘net gain / (loss) from trading’. Fair value is determined using the forward market rates ruling on the reporting date.
Derivatives embedded in other financial instruments are treated as separate derivatives and recorded at fair value if their economic characteristics and risks are not closely related to those of the host contract, and the host contract is not itself held for trading or designated at fair value through profit or loss. The embedded derivatives separated from the host are carried at fair value in the trading portfolio with changes in fair value recognised in the income statement.
Details of derivatives recorded at fair value through profit or loss are given in Notes 28 and 43 to the financial statements.
3.3.3 (a) (ii) Financial Assets Designated at Fair Value through Profit or Loss
The Group designates financial assets as fair value through profit or loss when;
• The designation eliminates or significantly reduces measurement or recognition inconsistency that would otherwise arise from measuring the assets on a different basis

Annual Report 2014 215
• The assets are part of a group of financial assets, financial liabilities or both, which are managed and their performance evaluated on a fair value basis, in accordance with a documented risk management or investment strategy
• The asset contains one or more embedded derivatives which significantly modify the cash flows that would otherwise be required by the contract.
Financial assets designated at fair value through profit or loss are recorded in the statement of financial position at fair value. Changes in fair value are recorded in ‘net gain / (loss) on financial assets and liabilities designated at fair value through profit or loss’ in the income statement. Interest earned or incurred is accrued in ‘interest income’ using the Effective Interest Rate (EIR), while dividend income is recorded in other operating income when the right to the payment has been established.
The Group has not designated any financial assets upon initial recognition at fair value through profit or loss as at the reporting date.
3.3.3 (b) Loans and Receivables
Loans and receivables include non-derivative financial assets with fixed or determinable payments that are not quoted in an active market, other than:
• Those that the Bank intends to sell immediately or in the near term and those that the Bank, upon initial recognition, designates as at fair value through profit or loss
• Those that the Bank, upon initial recognition, designates as available-for-sale
• Those for which the Bank may not recover substantially all of its initial investment, other than due to credit deterioration
After initial measurement, loans and receivables are subsequently measured at amortised cost using the
EIR, less allowance for impairment. Amortised cost is calculated by taking into account any discount or premium on acquisition and fees and costs that are an integral part of the EIR. The amortisation is included in ‘interest income’ in the income statement. The losses arising from impairment are recognised in ‘impairment charge for loans and other losses’ in the income statement.
Loans and advances to customers, bills of exchange, commercial papers, lease receivables and other financial investments such as investments in Sri Lanka Development bonds and unquoted debt instruments are classified as loans and receivables.
3.3.3 (c) Held-to-maturity Financial Assets (HTM)
Held-to-maturity investments are non-derivative assets with fixed or determinable payments and fixed maturity that the Group has the positive intention and ability to hold to maturity and which were not designated as at fair value through profit or loss or as available-for-sale.
After initial measurement held-to-maturity investments are subsequently measured at amortised cost using the EIR less impairment. Amortised cost is calculated by taking into account any discount or premium on acquisition and fees that are an integral part of the EIR. The amortisation is included in ‘interest income’ in the income statement. The losses arising from impairment of such investments are recognised in ‘impairment charge for loans and other losses’ in the income statement.
A sale or reclassification of a more than insignificant amount of held-to-maturity investments would result in the reclassification of all held-to-maturity investments as available-for-sale, and would prevent the Group from classifying investment securities as held-to-maturity for the current and the following two financial years. However, sales
and reclassifications in any of the following circumstances would not trigger a reclassification:
• sales or reclassifications that are so close to maturity that changes in the market rate of interest would not have a significant effect on the financial asset’s fair value
• sales or reclassifications after the Group has collected substantially all of the asset’s original principal and
• sales or reclassifications attributable to non-recurring isolated events beyond the Group’s control that could not have been reasonably anticipated.
Details of financial investments - held-to-maturity are given in Note 33 to the financial statements.
3.3.3 (d) Available-for-sale Financial Assets (AFS)
Available-for-sale investments include equity and debt securities. Equity investments classified as ‘available for sale’ are those which are neither classified as ‘held for trading’ nor ‘designated at fair value through profit or loss’. Debt securities in this category are intended to be held for an indefinite period of time and may be sold in response to needs for liquidity or in response to changes in the market conditions. The Group has not designated any loans or receivables as available-for-sale.
After initial measurement, available-for-sale financial investments are subsequently measured at fair value.
Unrealised gains and losses are recognised directly in equity via ‘other comprehensive income’ in the ‘available for sale reserve’. When the investment is disposed of, the cumulative gain or loss previously recognised in equity is recognised in the income statement in ‘net gain / (loss) from financial investments’. Where the Bank holds more than one investment in the same security, they are deemed to be disposed of
Hatton National Bank PLC216
on a first–in first–out basis. Interest earned whilst holding available-for-sale financial investments is reported as ‘interest income’ using the EIR. Dividends earned whilst holding available-for-sale financial investments are recognised in the income statement as ‘net gain / (loss) from financial investments’ when the right of the payment has been established. The losses arising from impairment of such investments are recognised in the income statement in ‘Impairment losses on financial investments’ and removed from the ‘Available-for-sale reserve’.
Details of financial investments - available-for-sale are given in Note 32 to the financial statements.
3.3.3 (e) Cash and Cash Equivalents
Cash and cash equivalents includes cash in hand, balances with banks and money at call and short notice that are subject to an insignificant risk of changes in their fair value, and are used by the Group and the Bank in the management of its short term commitments. They are brought to financial statements at their face values or gross values. Cash and cash equivalents are carried at amortised cost in the statement of financial position.
For the purpose of the statement of cash flow, cash and cash equivalents consist of cash and short term deposits as defined above net of unfavourable nostro balances.
Details of cash and cash equivalents are given in Note 25 to the financial statements.
3.3.3 (f) Balances with Central Banks
The Monetary Law Act requires that all commercial banks operating in Sri Lanka to maintain a statutory reserve equal to 6% (2013:6%) against all deposit liabilities denominated in Sri Lankan Rupees (LKR). The details of reserve requirements are given in Note 26 to the financial statements.
3.3.4 Classification and Subsequent Measurement of Financial LiabilitiesAt inception, a financial liability is classified in one of the following categories:
• Financial liabilities at fair value through profit or loss
- Financial liabilities held for trading
- Financial liabilities designated at fair value through profit or loss
• At amortised cost
The subsequent measurement of financial liabilities depends on their classification.
3.3.4 (a) Financial Liabilities at Fair Value through Profit or Loss
Financial liabilities at fair value through profit or loss include financial liabilities held for trading and financial liabilities designated upon initial recognition as at fair value through profit or loss. Subsequent to initial recognition, financial liabilities at fair value through profit or loss are measured at fair value, and changes there in recognised in income statement.
Financial Liabilities held for Trading
Financial liabilities are classified as held for trading if they are acquired principally for the purpose of selling or repurchasing in the near term or holds as a part of a portfolio that is managed together for short term profit or position taking. This category includes derivative financial instruments entered into by the Group that are not designated as hedging instruments in hedge relationships.
Separated embedded derivatives are also classified as held for trading unless they are designated as effective hedging instruments.
Gains or losses in liabilities held for trading are recognised in the income statement.
Financial Liabilities Designated at Fair Value through Profit or Loss
The Group designates financial liabilities at fair value through profit or loss in the following circumstances:
• Such designation eliminates or significantly reduces measurement or recognition inconsistency that would otherwise arise from measuring the liabilities
• The liabilities are part of a group of financial liabilities, financial assets or both, which are managed and their performance evaluated on a fair value basis, in accordance with a documented risk management or investment strategy
• The liability contains one or more embedded derivatives that significantly modify the cash flows that would otherwise have been required under the contract.
The Group has not designated any financial liabilities upon initial recognition as at fair value through profit or loss as at the reporting date.
3.3.4 (b) Financial Liabilities at Amortised Cost
Financial liabilities issued by the Group that are not designated as fair value through profit or loss are classified as liabilities under ‘due to banks’, ‘due to customers’, ‘other borrowings’, ‘debt securities issued’ and ‘subordinated term debts’ as appropriate, where the substance of the contractual arrangement results in the Group having an obligation either to deliver cash or another financial asset to another entity, or to exchange financial assets or financial liabilities with another entity, under conditions that are potentially unfavourable to the entity or settling the obligation by delivering variable number of entity’s own equity instruments
After initial recognition, such financial liabilities are substantially measured at amortised cost using the EIR method. Amortised cost is
Notes to theFinancial Statements
Annual Report 2014 217
calculated by taking into account any discount or premium on the issue and costs that are integral part of the EIR. The EIR amortisation is included in ‘interest expenses’ in the income statement. Gains and losses are recognised in the income statement when the liabilities are derecognised.
The details of the Group’s financial liabilities at amortised cost are shown in Note 42, 44, 46, 47 and 53 to the financial statements.
3.3.5 Reclassifications of financial instrumentsThe Group does not reclassify any financial instrument into the ‘fair value through profit or loss’ category after initial recognition. Further the Group does not reclassify any financial instrument out of the ‘fair value through profit or loss’ category if upon initial recognition it was designated as at fair value through profit or loss. The Group reclassifies non–derivative financial assets out of the ‘held-for-trading’ category and into the ‘available-for-sale’, ‘loans and receivables’, or ‘held-to-maturity’ categories as permitted by the Sri Lanka Accounting Standard (LKAS 39) “Financial Instruments: Recognition and Measurement”. Further, in certain circumstances, the Group is permitted to reclassify financial instruments out of the ‘available-for-sale’ category and into the ‘loans and receivables’ or ‘held- to-maturity’ category.
Reclassifications are recorded at fair value at the date of reclassification, which becomes the new amortised cost.
For a financial asset reclassified out of the available-for-sale category, any previous gain or loss on that asset that has been recognised in equity is amortised to profit or loss over the remaining life of the investment using the EIR. Any difference between the new amortised cost and the expected cash flows is also
amortised over the remaining life of the asset using the EIR. If the asset is subsequently determined to be impaired, then the amount recorded in equity is recycled to the income statement.
The Group may reclassify a non–derivative trading asset out of the ‘held for trading’ category and into the ‘loans and receivables’ category if it meets the definition of loans and receivables and the Bank has the intention and ability to hold the financial asset for the foreseeable future or until maturity. If a financial asset is reclassified, and if the Bank subsequently increases its estimates of future cash receipts as a result of increased recoverability of those cash receipts, the effect of that increase is recognised as an adjustment to the EIR from the date of the change in estimate.
Reclassification is at the election of management, and is determined on an instrument by instrument basis.
3.3.6 Derecognition of financial assets and financial liabilities
(i) Financial Assets
A financial asset (or, where applicable a part of a financial asset or part of a group of similar financial assets) is derecognised when:
• the rights to receive cash flows from the asset have expired
• the Group has transferred its rights to receive cash flows from the asset or
• has assumed an obligation to pay the received cash flows in full without material delay to a third party under a ‘pass–through’ arrangement; and either:
• the Group has transferred substantially all the risks and rewards of the asset
or
• the Group has neither transferred nor retained substantially all the risks and rewards of the asset, but has transferred control of the asset
On derecognition of a financial asset, the difference between the carrying amount of the asset (or the carrying amount allocated to the portion of the asset transferred), and consideration received (including any new asset obtained less any new liability assumed) and any cumulative gain or loss that had been recognised in other comprehensive income is recognised in profit or loss.
When the Group has transferred its rights to receive cash flows from an asset or has entered into a pass–through arrangement, and has neither transferred nor retained substantially all of the risks and rewards of the asset nor transferred control of the asset, the asset is recognised to the extent of the Group’s continuing involvement in the asset. In that case, the Group also recognises an associated liability. The transferred asset and the associated liability are measured on a basis that reflects the rights and obligations that the Group has retained.
Continuing involvement that takes the form of a guarantee over the transferred asset is measured at the lower of the original carrying amount of the asset and the maximum amount of consideration that the Group could be required to repay.
(ii) Financial Liabilities
A financial liability is derecognised when the obligation under the liability is discharged or cancelled or expired. Where an existing financial liability is replaced by another from the same lender on substantially different terms, or the terms of an existing liability are substantially modified, such an exchange or modification is treated as a derecognition of the original liability and the recognition of a new liability. The difference between the carrying value of the original financial liability and the consideration paid is recognised in the income statement.

Hatton National Bank PLC218
3.3.7 Repurchase and Reverse Repurchase AgreementsSecurities sold under agreements to repurchase at a specified future date are not derecognised from the statement of financial position as the Group retains substantially all of the risks and rewards of ownership. The corresponding cash received is recognised in the consolidated statement of financial position as an asset with a corresponding obligation to return it, including accrued interest as a liability’ under ‘securities sold under repurchase agreements’, reflecting the transaction’s economic substance as a loan to the Group. The difference between the sale and repurchase prices is treated as interest expense and is accrued over the life of agreement using the EIR.
Conversely, securities purchased under agreements to resell at a specified future date are not recognised in the statement of financial position. The consideration paid, including accrued interest, is recorded in the statement of financial position, within “securities purchased under resale agreements”, reflecting the transaction’s economic substance as a loan by the Group. The difference between the purchase and resale prices is recorded in net interest income and is accrued over the life of the agreement using the EIR.
3.3.8 Offsetting of Financial InstrumentsFinancial assets and liabilities are offset and the net amount presented in the statement of financial position when, and only when, the Group has a legal right to set off the recognised amounts and it intends either to settle on a net basis or to realise the asset and settle the liability simultaneously.
Income and expenses are presented on a net basis only when permitted under Sri Lanka Accounting Standards, or for gains and losses arising from a group of similar transactions such as in the Group’s trading activity.
3.3.9 Determination of Fair ValueFair value is the price that would be received to sell an asset or paid to transfer a liability in an orderly transaction between market participants at the measurement date. The fair value measurement is based on the presumption that the transaction to sell the asset or transfer the liability takes place either:
• in the principal market for the asset or liability or
• in the absence of a principal market, in the most advantageous market for the asset or liability.
All assets and liabilities for which fair value is measured or disclosed in the financial statements are categorised within the fair value hierarchy, described as follows, based on the lowest level input that is significant to the fair value measurement as a whole:
• Level 1 - Quoted (unadjusted) market prices in active markets for identical assets or liabilities
• Level 2 - Valuation techniques for which the lowest level input that is significant to the fair value measurement is directly or indirectly observable
• Level 3 - Valuation techniques for which the lowest level input that is significant to the fair value measurement is unobservable
Level 1
When available, the Group measures the fair value of an instrument using quoted prices in an active market for that instrument or dealer price quotations (assets and long positions are measured at a bid price, liabilities and short positions are measured at an asking price), without any deduction for transaction costs. A market is regarded as active if quoted prices are readily and regularly available and represent actual and regularly occurring market transactions on an arm’s length basis.
Level 2
If a market for a financial instrument is not active, then the Group establishes fair value using a valuation technique. Valuation techniques include using recent arm’s length transactions between knowledgeable, willing parties (if available), reference to the current fair value of other instruments that are substantially the same, discounted cash flow analysis and option pricing models. The chosen valuation technique makes maximum use of market inputs, relies as little as possible on estimates specific to the Group, incorporates all factors that market participants would consider in setting a price, and is consistent with accepted economic methodologies for pricing financial instruments. Inputs to valuation techniques reasonably represent market expectations and measures of the risk-return factors inherent in the financial instrument. The Group calibrates valuation techniques and tests them for validity using prices from observable current market transactions in the same instrument or based on other available observable market data.
The best evidence of the fair value of a financial instrument at initial recognition is the transaction price, i.e. the fair value of the consideration given or received, unless the fair value of that instrument is evidenced by comparison with other observable current market transactions in the same instrument, i.e. without modification or repackaging, or based on a valuation technique whose variables include only data from observable markets. When transaction price provides the best evidence of fair value at initial recognition, the financial instrument is initially measured at the transaction price and any difference between this price and the value initially obtained from a valuation model is subsequently recognised in profit or loss on an appropriate
Notes to theFinancial Statements

Annual Report 2014 219
basis over the life of the instrument but not later than when the valuation is supported wholly by observable market data or the transaction is closed out.
Level 3
Certain financial instruments are recorded at fair value using valuation techniques in which current market transactions or observable market data are not available. Their fair value is determined using a valuation model that has been tested against prices or inputs to actual market transactions and using the Bank’s best estimate of the most appropriate model assumptions. Models are adjusted to reflect the spread for bid and ask prices to reflect costs to close out positions, credit and debit valuation adjustments, liquidity spread and limitations in the models. Also, profit or loss calculated when such financial instruments are first recorded (day 1 profit or loss) is deferred and recognised only when the inputs become observable or on derecognition of the instrument.
Fair values reflect the credit risk of the instrument and include adjustments to take account of the credit risk of the Group entity and the counterparty where appropriate. Fair value estimates obtained from models are adjusted for any other factors, such as liquidity risk or model uncertainties; to the extent that the Group believes a third-party market participant would take them into account in pricing a transaction.
3.3.10 Impairment of Financial AssetsAt each reporting date, the Group assesses whether there is objective evidence that financial assets not carried at fair value through profit or loss are impaired. A financial asset or a group of financial assets is deemed to be impaired if, and only if, there is objective evidence of impairment as a result of one or more events that have occurred after the initial recognition of the asset (an incurred loss event),
and that the loss event has an impact on the estimated future cash flows of the financial asset or the group of financial assets that can be reliably estimated.
Objective evidence that financial assets (including equity securities) are impaired can include and not limited to: significant financial difficulty of the borrower or issuer, default or delinquency by a borrower, restructuring of a loan or advance by the Group on terms that the Group would not otherwise consider, indications that a borrower or issuer will enter bankruptcy, the disappearance of an active market for a security, or other observable data relating to a group of assets such as adverse changes in the payment status of borrowers or issuers in the group, or economic conditions that correlate with defaults in the group. In addition, for an investment in an equity security, a significant or prolonged decline in its fair value below its cost is objective evidence of impairment.
Impairment of Financial Assets Carried at Amortised Cost
The Group considers objective evidence of impairment for loans and advances to customers and held-to-maturity investments at both a specific asset and collective level. All individually significant loans and advances to customers and held-to-maturity investments are first assessed for specific impairment. All individually significant loans and advances to customers and held-to-maturity investments found not to be specifically impaired are then collectively assessed for any impairment that has been incurred but not yet identified. Assets that are individually assessed for impairment and for which an impairment loss is recognised are not included in a collective assessment of impairment. Loans and advances to customers and held-to-maturity investments that are not individually significant
are collectively assessed for impairment by grouping together loans and advances to customers and held-to-maturity investment with similar risk characteristics.
If there is objective evidence that an impairment loss has been incurred, impairment losses on assets carried at amortised cost are measured as the difference between the carrying amount of the financial asset and the present value of estimated future cash flows discounted at the asset’s original effective interest rate. If the loan has a variable interest rate, the discount rate for measuring any impairment loss is the current effective interest rate. If the Group has reclassified trading assets to loans and receivables, the discount rate for measuring any impairment loss is the new effective interest rate determined at the date of reclassification. The impairment allowances on individually significant accounts are reviewed more regularly when circumstances require. This normally encompasses re-assessment of the enforceability of any collateral held and the timing and amount of actual and anticipated receipts. Individually assessed impairment allowances are only released when there is reasonable and objective evidence of a reduction in the established loss estimate. Interest on impaired assets continues to be recognised through the unwinding of the discount.
The calculation of the present value of the estimated future cash flows of a collateralised financial asset reflects the cash flows that may result from the foreclosure less costs of obtaining and selling the collateral, whether or not foreclosure is probable. The methodology and the assumptions used for estimating future cash flows are reviewed regularly to reduce any difference between loss estimates and actual loss experience.
Hatton National Bank PLC220
The carrying amount of the asset is reduced through the use of an allowance account and the amount of the loss is recognised in the income statement. Interest income continues to be accrued on the reduced carrying amount and is accrued using the rate of interest used to discount the future cash flows for the purpose of measuring the impairment loss and recorded as part of ‘interest income’.
For the purpose of collective evaluation of impairment, financial assets are grouped on a basis which takes in to consideration credit risk characteristics such as asset type, industry past–due status and other relevant factors.
Future cash flows on a group of financial assets that are collectively evaluated for impairment are estimated on the basis of historical loss experience for assets with credit risk characteristics similar to those in the group. Historical loss experience is adjusted on the basis of current observable data to reflect the effects of current conditions on which the historical loss experience is based and to remove the effects of conditions in the historical period that do not exist currently.
Estimates of changes in future cash flows reflect, and are directionally consistent with, changes in related observable data from year to year (such as changes in unemployment rates, property prices, commodity prices, payment status, or other factors that are indicative of incurred losses in the group and their magnitude). The methodology and assumptions used for estimating future cash flows are reviewed regularly to reduce any differences between loss estimates and actual loss experience.
Details of impairment losses on financial assets carried at amortised cost are given in Note 16 to the financial statements.
Available for sale Financial Investments
For available-for-sale financial investments, the Group assesses at each reporting date whether there is objective evidence that an investment is impaired.
In the case of debt instruments classified as available-for-sale, the Group assesses individually whether there is objective evidence of impairment based on the same criteria as financial assets carried at amortised cost. However, the amount recorded for impairment is the cumulative loss measured as the difference between the amortised cost and the current fair value, less any impairment loss on that investment previously recognised in the income statement. Future interest income is based on the reduced carrying amount and is accrued using the rate of interest used to discount the future cash flows for the purpose of measuring the impairment loss. The interest income is recorded as part of interest income as ‘loan and receivables to customers’. If, in a subsequent period, the fair value of a debt instrument increases and the increase can be objectively related to a credit event occurring after the impairment loss was recognised in the income statement, the impairment loss is reversed through the income statement.
In the case of equity investments classified as available-for-sale, objective evidence would also include a ‘significant’ or ‘prolonged’ decline in the fair value of the investment below its cost. Where there is evidence of impairment, the cumulative loss measured as the difference between the acquisition cost and the current fair value, less any impairment loss on that investment previously recognised in the income statement is removed from equity and recognised in the income statement. Impairment losses on equity
investments are not reversed through the income statement, increases in the fair value after impairment are recognised in ‘other comprehensive income’.
The Group writes off certain financial investments – available-for-sale when they are determined to be uncollectible.
Collateral Valuation
The Group seeks to use collateral, where possible, to mitigate its risks on financial assets. The collateral comes in various forms such as cash, gold, securities, letters of credit/guarantees, real estate, receivables, inventories, other non-financial assets and credit enhancements such as netting arrangements. The fair value of collateral is generally assessed, at a minimum, at inception and based on the Bank’s approved valuation policy.
To the extent possible, the Group uses active market data for valuing financial assets, held as collateral. Other financial assets which do not have a readily determinable market value are valued using models. Non-financial collateral, such as real estate, is valued based on data provided by third parties such as independent professional valuers.
Collateral repossessed
The Group’s policy is to sell the repossessed assets at the earliest possible opportunity. Such collateral repossessed are held on a memorandum basis without derecognising the underlying receivable.
Rescheduled Loans
Loans whose original terms have been modified including those subject to forbearance strategies are considered rescheduled loans. This may involve extending the payment arrangements and the agreement of new loan conditions.
Notes to theFinancial Statements

Annual Report 2014 221
If the renegotiations are on terms that are not consistent with those readily available in the market, this provides objective evidence of impairment. Once the terms have been renegotiated, any impairment is measured using the EIR as calculated before the modification of terms and the loan/advance is no longer considered past due. Management continually reviews renegotiated loans and advances to ensure that all criteria are met and the future payments are likely to occur. The loans continue to be subjected to an individual or collective impairment assessment, calculated using the loan’s original EIR.
3.3.11 Reversal of ImpairmentIf the amount of an impairment loss decreases in a subsequent period, and the decrease can be related objectively to an event occurring after the impairment was recognised, the excess is written back by reducing the financial asset impairment allowance account accordingly. The write-back is recognised in the income statement.
3.3.12 Write-off of Financial Assets carried at Amortised CostFinancial assets (and the related impairment allowance accounts) are normally written off, either partially or in full, when there is no realistic prospect of recovery. Where financial assets are secured, this is generally after receipt of any proceeds from the realisation of security. If a write-off is later recovered, the recovery is credited to “Impairment charge for loans and other losses”.
3.4 Non-current Assets Held for Sale and Disposal GroupsNon-current assets that are expected to be recovered primarily through sale rather than through continuing use are classified as “held-for-sale”. These are assets which are available for immediate sale in their present
condition, subject to only the terms that are usual and customary for sale of such assets. Their sale is highly probable and the management has committed to the sale and the sale is expected to have been completed within one year from the date of classification.
Non-current assets held for sale are presented separately on the face of the statement of financial position at the lower of its carrying amount and fair value less costs to sell. Thereafter, the Group assesses at each reporting date or more frequently, if events or changes in circumstances indicate that the investment is impaired. The Group recognises an impairment loss for any initial or subsequent write down of the assets to fair value less cost to sell and also recognises a gain for any subsequent increase in fair value less cost to sell of an asset, only to the extent of the cumulative impairment losses that have been recognised previously. Impairment losses on initial classification as held for sale and subsequent gains and losses on re-measurement are recognised in income statement.
Assets classified as non-current assets held for sale are neither amortised nor depreciated.
In the income statement of the reporting period, and of the comparable period of the previous reporting period, income and expenses from discontinued operations if any are reported separately from income and expenses from continued operations, down to the level of profit after taxes, even when the Group retains a non-controlling interest in the subsidiary after the sale. The resulting profit or loss (after taxes) is reported separately in the income statement.
Details of non-current assets held for sale are given in Note 30 to the financial statements.
3.5 Finance and Operating LeasesThe determination of whether an arrangement is a lease, or contains a lease, is based on the substance of the arrangement and requires an assessment of whether the fulfilment of the arrangement is dependent on the use of a specific asset or assets and the arrangement conveys a right to use the asset.
Finance Lease
Assets leased to customers which transfer substantially all the risks and rewards associated with ownership other than legal title, are classified as finance leases. Leasing balances are stated in the statement of financial position after deduction of unearned lease income and the impairment for rentals doubtful of recovery. Amounts receivable under finance leases are classified as lease receivables and presented within loans and receivables to customers in the statement of financial position.
Identification and Measurement of Impairment for Lease Receivables
Lease receivables are collectively assessed for impairment as stated above in Note 3.3.10 to the financial statements.
Operating Lease
Operating leases are those leasing arrangements that do not transfer to the Bank, substantially all the risks and rewards incidental to ownership of the leased items.
When the Bank is the lessee, leased assets are not recognised on the statement of financial position, Rentals payable under operating leases are accounted for on a straight line basis over the periods of the leases and are included in ‘other operating expenses’.
Hatton National Bank PLC222
3.6 Intangible AssetsAn intangible asset is an identifiable non-monetary asset without physical substance held for use in the production or supply of goods or services, for rental to others or for administrative purposes.
Details of intangible assets are given in Note 40 to the financial statements.
3.6.1 Basis of RecognitionAn intangible asset is recognised if it is probable that the future economic benefits that are attributable to the asset will flow to the Group and the cost of the assets can be measured reliably. An intangible asset is initially measured at cost. The cost of intangible assets acquired in a business combination is the fair value as at the date of acquisition.
3.6.1 (a) Goodwill
Goodwill that arises upon the acquisition of subsidiaries is included in intangible assets. Goodwill is measured at initial recognition in accordance with Note 3.1.1.
Subsequent measurement
Goodwill is measured at cost less accumulated impairment losses. In respect of equity accounted investees, the carrying amount of goodwill is included in the carrying amount of the investment, and an impairment loss in such investment is not allocated to any asset, including goodwill, that forms part of the carrying amount of the equity accounted investee.
Any gain on bargain purchase is recognised immediately in profit or loss.
3.6.1 (b) Software
All computer software costs incurred, licensed for use by the Group, which are not integrally related to associated hardware, which can be clearly
identified, reliably measured and it’s probable that they will lead to future economic benefits, are included in the ‘statement of financial position’ under the category ‘intangible assets’ and carried at cost less accumulated amortisation and any accumulated impairment losses.
3.6.1 (c) License
The amount that would be required to obtain a license to operate a registered finance business is recognised as license in the financial statements.
3.6.2 Subsequent ExpenditureExpenditure incurred on software is capitalised only when it is probable that this expenditure will enable the asset to generate future economic benefits in excess of its originally assessed standard of performance and this expenditure can be measured and attributed to the asset reliably. All other expenditure is expensed as incurred.
3.6.3 AmortisationThe useful lives of intangible assets are assessed as either finite or infinite. Intangible assets, with finite lives, are amortised on a straight line basis in the income statement from the date when the asset is available for use, over the best estimate of the useful economic lives based on a pattern in which the asset’s economic benefits are consumed by the Group, at the rates specified below:
Class of Asset % per annum
Computer software 16.67
Those assets are assessed for impairment whenever there is an indication that the intangible asset may be impaired.
Expenditure on an intangible item that was initially recognised as an expense by the Group in previous annual financial statements or interim financial statements are
not recognised as part of the cost of an intangible asset at a later date. Amortisation methods, useful lives and residual values are reviewed at each reporting date and adjusted if appropriate.
Goodwill and intangible assets with infinite useful lives such as license are not amortised, but are assessed for impairment annually. The assessment of infinite life is reviewed annually to determine whether the infinite life continues to be supportable.
3.6.4 DerecognitionAn intangible asset is derecognised on disposal or when no future economic benefits are expected from its use and subsequent disposal. Gains or losses arising from derecognition of an intangible asset are measured as the difference between the net disposal proceeds and the carrying amount of the asset and are recognised in the income statement.
3.7 Investment PropertiesInvestment properties are properties held either to earn rental income or for capital appreciation or both but not for sale in the ordinary course of business, used in the production or supply of goods or services or for administrative purposes.
Details of investment properties are given in Note 38 to the financial statements.
3.7.1 Basis of RecognitionAn investment property is recognised if it is probable that future economic benefits that are associated with the investment property will flow to the Group and cost of the investment property can be reliably measured.
When a portion of the property is held to earn rentals or for capital appreciation and another portion that is held for use in the production
Notes to theFinancial Statements

Annual Report 2014 223
or supply of goods or services or for administrative purposes, the Group accounts for the portions separately if these portions could be sold separately (or leased out separately under a finance lease). If the portions could not be sold separately, the property is treated as investment property only if an insignificant portion is held for use in the production or supply of goods or services or for administrative purposes.
Where the Group provides ancillary services to the occupants of a property it holds, the Group treats such a property as investment property if the services are insignificant to the arrangement as a whole.
3.7.2 MeasurementAn investment property is measured initially at its cost. The cost of a purchased investment property comprises of its purchase price and any directly attributable expenditure. The cost of a self-constructed investment property is its cost at the date when the construction or development is complete.
The Group applies the cost model for investment properties in accordance with Sri Lanka Accounting Standard (LKAS 40) - “Investment Property”. Accordingly, land classified as investment properties are stated at cost less any accumulated impairment losses and buildings classified as investment properties are stated at cost less any accumulated depreciation and any accumulated impairment losses.
Group determines the fair value of its investment properties annually for disclosure purposes by using independent valuers who are not connected with the Bank and such fair values have been disclosed under Note 38 to the financial statements as required by Sri Lanka Accounting Standard (LKAS 40) - “Investment Property”.
3.7.3 DepreciationDepreciation is provided on a straight line basis over the estimated life of the class of asset from the date of purchase up to the date of disposal.
Class of Asset % per annum
Hatton National Bank PLCFreehold buildings[Refer Note 39 (a)]
2.5
Sithma Development (Pvt) Ltd*Freehold buildings[Refer Note 39 (b)]
2.5
Plant, machinery and equipmentintegral to freehold buildingsreferred to above
20
* Sithma Development (Pvt) Ltd
The HNB towers which is owned by Sithma Development (Pvt) Ltd (“Sithma”), is leased to occupants including the Bank. However, the ancillary services provided by Sithma Development (Pvt) Ltd to the occupants of HNB towers, is a significant component of the arrangement as a whole. Therefore, HNB towers is not classified as investment property in the financial statements of Sithma, but has been classified under property, plant and equipment in accordance with Sri Lanka Accounting Standard (LKAS 40) - “Investment Property”.
3.7.4 DerecognitionInvestment properties are derecognised when disposed of, or permanently withdrawn from use because no future economic benefits are expected. Gains or losses arising from derecognition of an investment property are measured as the difference between the net disposal proceeds and the carrying amount of the asset and are recognised in profit or loss.
Transfers are made to and from investment properties only when there is a change in use.
3.7.5 Investment Property Leased within the GroupAny property leased out to parent or subsidiary is considered as owner-occupied from the perspective of the group and adjustments are made for consolidation purposes and changes are disclosed in Note 38 (b) to the financial statements.
3.8 Property, Plant and EquipmentProperty, plant and equipment are tangible items that are held for use in the production or supply of goods or services, for rental to others or for administrative purposes and are expected to be used during more than one period.
Details of property, plant and equipment are given in Note 39 to the financial statements.
3.8.1 Basis of RecognitionProperty, plant and equipment are recognised if it is probable that future economic benefits associated with the assets will flow to the Group and cost of the asset can be reliably measured.
3.8.2 MeasurementAn item of property, plant and equipment that qualifies for recognition as an asset is initially measured at its cost. Cost includes expenditure that is directly attributable to the acquisition of the asset and cost incurred subsequently to add to, replace part of, or service it. The cost of self-constructed assets includes the cost of materials and direct labour, any other costs directly attributable to bringing the asset to a working condition for its intended use and the costs of dismantling and removing the items and restoring the site on which they are located. Purchased software that is integral to the functionality of the related

Hatton National Bank PLC224
equipment is capitalised as part of computer equipment.
When parts of an item of property or equipment have different useful lives, they are accounted for as separate items (major components) of property, plant and equipment.
3.8.3 Cost ModelThe Group applies cost model to property, plant and equipment except for freehold land and buildings and records at cost of purchase or construction together with any incidental expenses thereon less accumulated depreciation and any accumulated impairment losses.
3.8.4 Revaluation ModelThe Group applies the revaluation model to the entire class of freehold land and buildings. Such properties are carried at a revalued amount, being their fair value at the date of revaluation less any subsequent accumulated depreciation and subsequent accumulated impairment losses. Freehold land and buildings of the Group are revalued at least once in every three years on a roll over basis to ensure that the carrying amounts do not differ materially from the fair values at the reporting date. On revaluation of an asset, any increase in the carrying amount is recognised in other comprehensive income and accumulated in equity, under capital reserve or used to reverse a previous revaluation decrease relating to the same asset, which was charged to the income statement. In this circumstance, the increase is recognised as income to the extent of the previous write down. Any decrease in the carrying amount is recognised as an expense in the income statement or debited in the other comprehensive income to the extent of any credit balance existing in the capital reserve in respect of that asset. The decrease recognised in other comprehensive income reduces the amount accumulated in
equity under capital reserves. Any balance remaining in the revaluation reserve in respect of an asset is transferred directly to retained earnings on retirement or disposal of the asset.
3.8.5 Reclassification to Investment PropertyWhen the use of property changes from owner-occupied to investment property, the property is re-measured to fair value and reclassified as investment property. Any gain arising on re-measurement is recognised in profit or loss to the extent that it reverses a previous impairment loss on the specific property, with any remaining gain recognised in other comprehensive income and presented in revaluation reserve in equity. Any loss is recognised immediately in profit or loss.
3.8.6 Subsequent CostsThe subsequent cost of replacing a component of an item of property, plant and equipment is recognised in the carrying amount of the item if it is probable that the future economic benefits embodied within that part will flow to the Group and its cost can be reliably measured. The costs of day to day servicing of property, plant and equipment are charged to the income statement as incurred. Costs incurred in using or redeploying an item is not included under carrying amount of an item.
3.8.7 DerecognitionThe carrying amount of an item of property, plant and equipment is derecognised on disposal or when no future economic benefits are expected from its use or disposal. The gain or loss arising from the de-recognition of an item of property, plant and equipment which is calculated as the difference between the carrying amount and the net disposal proceeds is included in the income statement when the item is derecognised.
When replacement costs are recognised in the carrying amount of an item of property, plant and equipment, the remaining carrying amount of the replaced part is derecognised. Major inspection costs are capitalised. At each such capitalisation, the remaining carrying amount of the previous cost of inspections is derecognised.
3.8.8 DepreciationThe Group provides depreciation from the date the assets are available for use up to the date of disposal, at the following rates on a straight line basis over the periods appropriate to the estimated useful lives based on the pattern in which the asset’s future economic benefits are expected to be consumed by the Group of the different types of assets, except for which are disclosed separately. Depreciation of an asset ceases at the earlier of the date that the asset is classified as held for sale or the date that the asset is derecognised. Depreciation does not cease when the assets become idle or is retired from active use unless the asset is fully depreciated.
Hatton National Bank PLC and its Subsidiary Companies (except for Sithma Development (Pvt) Ltd)
Class of Asset % per annum
Freehold buildings 2.5
Motor vehicles 25
Computer equipment 16.7
Office equipment 20
Furniture and fittings 10
Fixtures 10
Improvements to leasehold buildings
over the lease period
Depreciation is not provided for freehold land.
Notes to theFinancial Statements

Annual Report 2014 225
Sithma Development (Pvt) Ltd
Class of Asset % per annum
Freehold buildings - Sithma building
1
Generators, generator panels and associated power cables
2
Chillers, cooling towers and associated equipment
4
Lifts and escalator 4
Building management systems
4
Plant and machinery 20
Equipment 20
Furniture and fittings 10
Depreciation methods, useful lives and residual values are reassessed at each reporting date and adjusted if appropriate.
3.8.9 Capital Work-in-Progress
These are expenses of a capital nature directly incurred in the construction of buildings, major plant and machinery and system development, awaiting capitalisation. Capital work-in-progress would be transferred to the relevant asset when it is available for use i.e. when it is in the location and condition necessary for it to be capable of operating in the manner intended by management. Capital work-in-progress is stated at cost less any accumulated impairment losses.
3.8.10 Borrowing Costs
Borrowing costs that are directly attributable to the acquisition, construction or production of a qualifying asset have been capitalised as part of the cost of the asset in accordance with Sri Lanka Accounting Standard (LKAS 23) - “Borrowing Costs”. A qualifying asset is an asset which takes substantial period of time to get ready for its intended use or sale. Capitalisation of borrowing costs ceases when substantially all the activities
necessary to prepare the qualifying asset for its intended use are completed. Other borrowing costs are recognised in the income statement in the period in which they incur.
3.9 Fiduciary AssetsThe Group provides trust and other fiduciary services that result in the holding or investing of assets on behalf of its clients. Assets held in a fiduciary capacity are not reported in these financial statements as they do not belong to the Group.
3.10 Impairment of Non-financial AssetsThe carrying amounts of the Group’s non-financial assets, other than deferred tax assets, are reviewed at each reporting date to determine whether there is any indication of impairment. If any such indication exists, or when annual impairment testing for an asset is required, the Group estimates the asset’s recoverable amount. For goodwill and intangible assets that have indefinite useful lives or that are not yet available for use, the recoverable amount is estimated each year at the same time. An impairment loss is recognised if the carrying amount of an asset or its Cash Generating Unit (CGU) exceeds its estimated recoverable amount.
The recoverable amount of an asset or CGU is the greater of its value in use and its fair value less costs to sell. In assessing value in use, the estimated future cash flows are discounted to their present value using a pre-tax discount rate that reflects current market assessments of the time value of money and the risks specific to the asset or CGU.
For the purpose of impairment testing, assets that cannot be tested individually are grouped together into the smallest group of assets that generate cash inflows from continuing use that are largely independent of the cash inflows of other assets or CGU. Subject to an
operating segment ceiling test, for the purposes of goodwill impairment testing, CGUs to which goodwill has been allocated are aggregated so that the level at which impairment testing is performed reflects the lowest level at which goodwill is monitored for internal reporting purposes. Goodwill acquired in a business combination is allocated to groups of CGUs that are expected to benefit from the synergies of the combination.
The Group’s corporate assets do not generate separate cash inflows and are utilised by more than one CGU. Corporate assets are allocated to CGUs on a reasonable and consistent basis and tested for impairment as part of the testing of the CGU to which the corporate asset is allocated.
Impairment losses are recognised in the income statement, except for property previously revalued where the gain or loss on revaluation was taken to equity. In this case, the impairment is also recognised in equity up to the extent of any previously recognised revaluation gains. Impairment losses recognised in respect of CGUs are allocated first to reduce the carrying amount of any goodwill allocated to the CGU (group of CGUs) and then to reduce the carrying amount of the other assets in the CGU (group of CGUs) on a pro rata basis.
An impairment loss in respect of goodwill is not reversed. In respect of other assets, impairment losses recognised in prior periods are assessed at each reporting date for any indications that the loss has decreased or no longer exists. An impairment loss is reversed if there has been a change in the estimates used to determine the recoverable amount. An impairment loss is reversed only to the extent that the asset’s carrying amount does not exceed the carrying amount that would have been determined, net of depreciation or amortisation, if no impairment loss had been recognised.

Hatton National Bank PLC226
3.11 Deposits, Borrowings, Debt Securities Issued and Subordinated LiabilitiesDeposits, borrowings, debt securities issued and subordinated term debts are the Group’s sources of debt funding
3.11.1 Due to BanksThese represents refinance borrowings, call and time deposits and borrowings from banks. Subsequent to initial recognition deposits are measured at their amortised cost using the effective interest method. Interest paid/payable on these borrowings are recognised in the income statement.
Details of the due to banks are given in Note 42 to the financial statements.
3.11.2 Due to CustomersThese include non-interest bearing deposits, savings deposits, term deposits, deposits payable at call and certificate of deposits. Subsequent to initial recognition, deposits are measured at their amortised cost using the effective interest method, except where the Group designates liabilities at fair value through profit or loss. Interest paid/payable on these borrowings are recognised in the income statement.
Details of due to customers are given in Note 44 to the financial statements.
3.11.3 Debt Securities Issued and Subordinated Term DebtsThese represent the funds borrowed by the Group for long term funding requirements. Subsequent to initial recognition debt securities issued and subordinated term debts are measured at their amortised cost using the effective interest method. Interest paid/payable on these borrowings are recognised in the income statement.
Details of debt securities issued and subordinated term debts are given in Note 47 and Note 53 to the financial statements.
3.12 Dividends PayableProvision for final dividends is recognised at the time the dividend recommended and declared by the Board of Directors, is approved by the shareholders. Interim dividends payable is recognised when the Board approves such dividend in accordance with the Companies Act No. 7 of 2007.
Dividend for the year that are declared after the reporting date are given in Note 64 (a) to the financial statements as an event after the reporting period in accordance with the Sri Lanka Accounting Standard (LKAS 10) – “Events after the reporting period”.
3.13 Employee Retirement Benefits
3.13.1 Defined Benefit PlanA defined benefit plan is a post employment benefit plan other than a defined contribution plan.
3.13.1 (a) Pension Fund
The Bank operates an approved Pension Fund to facilitate the following payments for permanent staff of the Bank:
a) Pensions to Retiring Staff
Pensionable staff members who are in the permanent carder are eligible to draw pension from the pension fund as per the Trust Deed dated 24th September 1981.
b) Benefits to Staff who Opted for the Optional Scheme for Pension introduced in 2005
Staff members who opted for the optional scheme for pension introduced in 2005 are eligible for the payment in accordance with the terms and conditions agreed upon.
c) Gratuity
The gratuity would be the payments to staff who satisfy the criteria as per the Gratuity Act No 12 of 1983
at the time of leaving the services of the Bank without pension rights. Payment of gratuities to employees who have completed more than five years of service is under the said act covered through the Bank’s own non-contributory pension scheme which is in force.
The Bank’s obligation in respect of defined benefit pension plan is calculated by estimating the amount of future benefit that employees have earned in return for their service in the current and prior periods, and discounting that benefit to determine its present value, then deducting the fair value of any plan assets to determine the net amount to be shown in the statement of financial position. The value of any defined benefit asset is restricted to the present value of any economic benefits available in the form of refunds from the plan or reductions in the future contributions to the plan. In order to calculate the present value of economic benefits, consideration is given to any minimum funding requirements that apply to any plan in the Bank. An economic benefit is available to the Bank if it is realisable during the life of the plan, or on settlement of the plan liabilities.
The Bank determines the net interest expense / (income) on the net defined benefit liability / (asset) by applying the discount rate used to measure the defined benefit obligation at the beginning of the annual period to the net defined benefit liability / (asset) at the beginning of the annual period.
The discount rate is the yield at the reporting date on government bonds that have maturity dates approximating to the terms of the Bank’s obligations. The calculation is performed by a qualified actuary using the Projected Unit Credit method.
Notes to theFinancial Statements
Annual Report 2014 227
The Bank recognises the total actuarial gains and losses that arise in calculating the Bank’s obligation in respect of a plan in other comprehensive income during the period in which it occurs.
The demographic assumptions underlying the valuation are retirement age (55 yrs), early withdrawals from service and retirement on medical grounds, death before and after retirement etc. The assets of the fund are held separately from those of the Bank’s assets and are administered independently by the trustees of the fund.
Details of pension fund are given in Note 52 (c) to the financial statements.
3.13.1 (b) Gratuity Obligation
The subsidiaries of the Bank do not operate pension fund and make a provision for gratuity obligation. These liabilities are assessed either by actuarial valuations or by the use of gratuity formula.
3.13.1 (b) Other Long-term Employee Benefits
The Bank’s net obligation in respect of long-term employee benefits other than pension fund is the amount of future benefit that employees have earned in return for their service in the current and prior periods. That benefit is discounted to determine its present value. The discount rate is the yield at the reporting date on government bonds that have maturity dates approximating to the terms of the Bank’s obligation. The calculation is performed using the Projected Unit Credit method. Any actuarial gains and losses are recognised in profit or loss in the period in which they arise. The Bank’s liability towards the portion of the accumulated leave which is expected to be utilised beyond one year from the end of the reporting period is treated as other long term employee benefits.
3.13.1 (c) Widows’, Widowers’ and Orphans’ Pension Fund
The Bank operates a separate Widows’, Widowers’ and Orphans’ Pension Scheme (WW & OP) which was established with effect from 1st September 1995. The contributions are from employees only and the Bank does not have any legal or constructive obligation towards the above scheme.
Details of Widows’, Widowers’ and Orphans’ Pension Fund are given in Note 52 (d) to the financial statements.
3.13.1 (d) Employees’ Provident Fund - Bank
Employees’ Provident Fund is an approved private provident fund which has been set up to meet the provident fund liabilities of the Bank to which the Bank and employees contribute 12% and 8% respectively on the salary of each employee. Staff members who are members of the fund are entitled to receive a minimum interest rate which is the higher of one year fixed deposit rate of HNB or National Savings Bank on their balance on a semi-annual basis. Accordingly this obligation was treated as a defined benefit liability and an actuarial valuation was conducted to value the Bank’s obligation of the same.
3.13.2 Defined Contribution PlansA defined contribution plan is a post-employment plan under which an entity pays fixed contributions into a separate entity (a fund) and will have no legal or constructive obligation to pay a further contribution if the fund does not hold sufficient assets to pay all employee benefits relating to employee services in the current and prior periods. Obligations for contributions to defined contribution plans are recognised as an expense in the income statement as and when they are due.
3.13.2 (a) Employees’ Provident Fund – Group Companies
The Group entities and their employees contribute 12% and 8% respectively on the salary of each employee to Employees’ Provident Fund [except for the Bank as explained in note 3.13.1 (d)].
3.13.2 (b) Employees’ Trust Fund
The Bank and the Group contribute 3% of the salary of each employee to the Employees’ Trust Fund.
3.13.3 Share Based Payment Transactions
3.13.3 (a) Cash Settled Share Based Payment Transactions
The Employee Share Benefit Trust (ESBT) was treated as a cash settled share based payment scheme. It was introduced in 2005 and offered shares to executive and high rank officers of the Bank. The shares allotted to the respective employee under the plan remained within the plan while the beneficial interest was with the employee. At the time the employee leaves the Bank, the difference between the issue price and the market price was paid to the employee. Therefore the said Employee Share Benefit Trust had no potential dilutive effect on the earnings per share of the Bank. The fair value of the amount payable to employees in respect of share appreciation rights settled in cash was recognised as an expense with a corresponding increase in liabilities. The liability was re-measured at each reporting date. Any changes in the fair value of the liability were recognised as personnel expenses in profit or loss. The trust was treated as a subsidiary and the shares held by the trust were treated as treasury shares which were eliminated against reserves in the consolidated statement of financial position.

Hatton National Bank PLC228
The Bank obtained clearance from Colombo Stock Exchange and Securities and Exchange Commission to liquidate the ESBT during the year ended 31st December 2013. Accordingly, the Bank discontinued its treatment of the ESBT as a special purpose entity in the consolidated financial statements. Further the liability created for the increase in share appreciation rights up to the date of winding up of the Trust was extinguished through income statement during 2013 under personnel expenses.
3.13.3 (b) Equity Settled Share Based Payment Transactions
Fair value of equity-settled share-based payment awards granted to employees on the grant date is recognised as an employee expense, with a corresponding increase in equity, over the period in which the employees unconditionally become entitled to the awards. The amount recognised as an expense is adjusted to reflect the number of share awards for which the related service and non-market performance vesting conditions are expected to be met such that, the amount ultimately recognised as an expense is based on the number of share awards that do meet the related service and non-market performance conditions at the vesting date. For share-based payment awards with non-vesting conditions, the grant-date fair value of the share-based payment is measured to reflect such conditions and there is no true-up for difference between expected and actual outcomes.
At the Annual General Meeting held on 28th March 2008, a resolution was passed to formulate an Employee Share Option Plan (ESOP) apart from the Employee Share Benefit Trust, enabling the staff in the management rank and above of the Bank to take part in the voting and non-voting ordinary shares of the Bank. The total
number of share options available to the eligible employees per year will be 1.25% of shares issued by the Bank up to a maximum limit of 5% of the shares issued (both voting and non-voting) by the Bank in 4 years. The benefits under ESOP will accrue to eligible employees of the Bank in any particular year only if the conditions set out in the ESOP are met.
An eligible employee will qualify to receive share options in a particular year by achieving a positive performance rating in the annual performance assessment. The amount of share options to be granted to each qualified eligible employee will depend on his/her seniority in the Bank. This employee share option plan has potential dilutive effect on the earnings per share of the Bank.
Details of share options are given in Note 54 (c) to the financial statements.
3.14 Other Short Term Employee BenefitsShort-term employee benefit obligations are measured on an undiscounted basis and are expensed as the related service is provided. A liability is recognised for the amount expected to be paid under short term cash bonus or profit-sharing plans, if the Group has a present legal or constructive obligation to pay this amount as a result of past service provided by the employee and the obligation can be estimated reliably.
3.15 ProvisionsA provision is recognised if, as a result of a past event, the Group has a present legal or constructive obligation that can be estimated reliably, and it is probable that an outflow of economic benefits will be required to settle the obligation. The amount recognised is the best estimate of the consideration required to settle the present
obligation at the reporting date, taking in to account the risks and uncertainties surrounding the obligation at that date. Where a provision is measured using the cash flows estimated to settle the present obligation, its carrying amount is determined based on the present value of those cash flows.
A provision for onerous contracts is recognised when the expected benefits to be derived by the Group from a contract are lower than the unavoidable cost of meeting its obligations under the contract. The provision is measured at the present value of the lower of expected cost of terminating the contract and the expected net cost of continuing with the contract. Before a provision is established, the Group recognises any impairment loss on the assets associated with that contract.
When the Group expects some or all of a provision to be reimbursed, for example, under an insurance contract, the reimbursement is recognised as a separate asset, but only when the reimbursement is virtually certain. The expense relating to a provision is presented in the income statement net of any reimbursement.
3.16 Operational Risk EventsProvisions for operational risk events are recognised for losses incurred by the Group which do not relate directly to amounts of principal outstanding for loans and advances.
The amount recognised as a provision is the best estimate of the expenditure required to settle the present obligation as at the reporting date, taking into account the risks and uncertainties that surround the events and circumstances that affect the provision.
Notes to theFinancial Statements

Annual Report 2014 229
3.17 Commitments and ContingenciesContingent liabilities are possible obligations whose existence will be confirmed only by uncertain future events or present obligations where the transfer of economic benefit is not probable or cannot be reliably measured.
To meet the financial needs of customers, the Bank enters into various irrevocable commitments and contingent liabilities. These consist of financial guarantees, letters of credit and other undrawn commitments to lend. Letters of credit and guarantees commit the Bank to make payments on behalf of customers in the event of a specific act, generally related to the import or export of goods. Guarantees and standby letters of credit carry a similar credit risk to loans. Operating lease commitments of the Bank (as a lessor and as a lessee) and pending legal claims against the Bank too form part of commitments of the Bank. Contingent liabilities are not recognised in the statement of financial position but are disclosed unless they are remote. But these contingent liabilities do contain credit risk and are therefore form part of the overall risk of the Bank.
All discernible risks are accounted for in determining the amount of all known liabilities. The Bank’s share of any contingencies and capital commitments of a subsidiary, associate or joint venture for which the Bank is also liable severally or otherwise are also included with appropriate disclosures.
Details of commitments and contingencies are given in Note 59 to the financial statements.
3.17.1 Financial Guarantees
In the ordinary course of business, the group gives financial guarantees, consisting of letters of credit, guarantees and acceptances.
Financial guarantees are initially recognised in the financial statements within ‘other liabilities’ at fair value, being the premium received. Subsequent to initial recognition, the Bank’s liability under each guarantee is measured at the higher of the amount initially recognised less cumulative amortisation recognised in the income statement, and the best estimate of expenditure required to settle any financial obligation arising as a result of the guarantee.
Any increase in the liability relating to financial guarantees is recorded in the income statement in Credit loss expense. The premium received is recognised in the income statement in ‘net fees and commission income’ on a straight line basis over the life of the guarantee.
3.17.2 Legal Claims
Litigation is a common occurrence in the banking industry due to the nature of the business undertaken. The Group has formal controls and policies for managing legal claims. Once professional advice has been obtained and the amount of loss reasonably estimated, the Bank makes adjustments to account for any adverse effects which the claims may have on its financial standing. There were no pending litigations against the Bank as at 31st December 2014 which would have a material impact on the financial statements other than those disclosed under Note 59 (d) to the financial statements.
Recognition of Income and Expenses
Revenue is recognised to the extent that it is probable that the economic benefits will flow to the Bank and the revenue can be reliably measured. The following specific recognition criteria must also be met before revenue is recognised.
3.18 Interest Income and ExpensesInterest income and expenses are recognised in the income statement using the Effective Interest Rate (EIR) method for all financial instruments measured at amortised cost, interest bearing financial assets classified as available for sale and financial instruments designated at fair value through profit or loss. The EIR is the rate that exactly discounts the estimated future cash payments and receipts through the expected life of the financial asset or liability (or, where appropriate, a shorter period) to the carrying amount of the financial asset or liability. When calculating the EIR, the Group estimates future cash flows considering all contractual terms of the financial instrument, but not future credit losses.
The calculation of the EIR takes into account all contractual terms of the financial instrument (for example, prepayment options) and includes all transaction costs and fees that are an integral part of the EIR. Transaction costs include incremental costs that are directly attributable to the acquisition or issue of a financial asset or liability.
The carrying amount of the financial asset or financial liability is adjusted if the Bank revises its estimates of payments or receipts. The adjusted carrying amount is calculated based on the original EIR and the change in carrying amount is recorded as interest income for financial assets and interest expense for financial liabilities. However, for a reclassified financial asset for which the Bank subsequently increases its estimates of future cash receipts as a result of increased recoverability of those cash receipts, the effect of that increase is recognised as an adjustment to the EIR from the date of the change in estimate.
Hatton National Bank PLC230
Once the recorded value of a financial asset or a group of similar financial assets has been reduced due to an impairment loss, interest income continues to be recognised using the rate of interest used to discount the future cash flows for the purpose of measuring the impairment loss.
3.19 Fee and Commission Income and ExpensesFees and commission income and expenses that are integral to the EIR on a financial asset or liability are included in the measurement of the EIR.
Fees and commission income, including account servicing fees, investment management fees, sales commission, placement fees and syndication fees are recognised as the related services performed. Fees and commission earned for the provision of services over a period of time are accrued over that period.
Other fees and commission expenses relate mainly to transaction and service fees, which are expensed as the services are received. Fee and commission expenses are recognised on an accrual basis.
3.20 Net Trading IncomeResults arising from trading activities include all realised and unrealised gains and losses from changes in fair value and related interest income or expense, dividends and foreign exchange differences for financial assets and financial liabilities held for trading.
3.21 Dividend IncomeDividend income is recognised in profit or loss on an accrual basis when the Bank’s right to receive the dividend is established. This
is usually on the ex-dividend date for equity securities. Dividends are presented in Note 13 ‘net gain / (loss) from trading’, Note 14 ‘net gain / (loss) from financial investments’ or Note 15 ‘other operating income’ based on the underlying classification of the equity investment.
3.22 Lease IncomeIn terms of the provisions of the Sri Lanka Accounting Standard (LKAS 17) – “Leases”, the recognition of finance income on leasing is accounted based on a pattern reflecting a constant periodic rate of return on capital outstanding. The excess of aggregate lease rentals receivable over the cost of the leased assets constitutes the total unearned lease income at the commencement of a lease. The unearned lease income is taken into income over the term of the lease commencing with the month in which the lease is executed using effective interest rate.
3.23 Discounts on Bills of ExchangeIncome on discounting bills of exchange is recognised proportionately over the period of the instrument.
3.24 Profit / (Loss) from Sale of Property, Plant and EquipmentProfit /(loss) from sale of property, plant and equipment is recognised in the period in which the sale occurs and is classified as other operating income.
3.25 Profit / (Loss) from Sale of Investment PropertiesAny profits or losses on retirement or disposal of investment properties are recognised in the month of retirement or disposal.
3.26 Rental IncomeRental income is recognised on an accrual basis.
3.27 Revenue Recognition on Sale of Apartments – Residential Apartment ComplexRevenue from sale of apartments is recognised in profit or loss when significant risks and rewards of ownership transfer to the buyer.
3.28 Lease Payments
3.28.1 Operating LeasesPayments to be made under each operating lease agreement are recognised in profit or loss on a straight line basis over the term of the lease.
4. TAX EXPENSEAs per Sri Lanka Accounting Standard (LKAS 12) – “Income taxes”, tax expense is the aggregate amount included in determination of profit or loss for the period in respect of current and deferred taxes. Income tax expense is recognised in the income statement, except to the extent it relates to items recognised directly in Other Comprehensive Income (OCI), in which case it is recognised in OCI.
4.1 Current TaxationCurrent tax assets and liabilities consist of amounts expected to be recovered from or paid to the taxation authorities in respect of the current as well as prior years. The tax rates and tax laws used to compute the amount are those that are enacted or substantively enacted on the reporting date
Accordingly, provision for taxation is made on the basis of the accounting profit for the year as adjusted for taxation purposes in accordance with the provisions of the Inland Revenue Act No 10 of 2006 and the amendments thereto, at the rates specified in Note 21 (f) to the financial statements.
Notes to theFinancial Statements
Annual Report 2014 231
4.2 Deferred TaxDeferred tax is provided on temporary differences at the reporting date between the tax bases of assets and liabilities and their carrying amounts for financial reporting purposes for all Group entities.
Deferred tax liabilities are recognised for all taxable temporary differences, except:
• When the deferred tax liability arises from the initial recognition of goodwill or an asset or liability in a transaction that is not a business combination and, at the time of the transaction, affects neither the accounting profit nor taxable profit or loss
• In respect of taxable temporary differences associated with investments in subsidiaries, associates and interests in joint ventures, when the timing of the reversal of the temporary differences can be controlled and it is probable that the temporary differences will not reverse in the foreseeable future.
Deferred tax assets are recognised for all deductible temporary differences, carry forward of unused tax credits and unused tax losses (if any), to the extent that it is probable that taxable profit will be available against which the deductible temporary differences and the unused tax credits and unused tax losses carried forward can be utilised except;
• When the deferred tax asset relating to the deductible temporary difference arises from the initial recognition of an asset or liability in a transaction, that is not a business combination and, at the time of the transaction, affects neither the accounting profit nor taxable profit or loss
• In respect of deductible temporary differences associated with investments in subsidiaries, associates and interests in joint ventures, deferred tax assets are recognised only to the extent that it is probable that the temporary differences will reverse in the foreseeable future and taxable profit will be available against which the temporary differences can be utilised.
The carrying amount of deferred tax assets is reviewed at each reporting date, and reduced to the extent that it is no longer probable that sufficient taxable profit will be available to allow all or part of the deferred tax asset to be utilised. Unrecognised deferred tax assets are re-assessed at each reporting date and are recognised to the extent that it has become probable that future taxable profits will allow the deferred tax asset to be recovered.
Deferred tax assets and liabilities are measured at the tax rates, that are expected to apply in the year when the asset is realised or the liability is settled, based on tax rates (and tax laws) that have been enacted or substantively enacted at the reporting date. The rates applicable as at reporting date are given in Note 21 (f) to the financial statements.
Deferred tax relating to items recognised directly in equity are also recognised in equity, through OCI and not in the income statement.
Deferred tax assets and deferred tax liabilities are offset if a legally enforceable right exists to set off current tax assets against current tax liabilities and the deferred taxes relate to the same taxable entity and the same taxation authority.
Details of the deferred tax assets and liabilities as at the reporting date are given in Note 48 to the financial statements.
4.3 Withholding Tax on Dividends (WHT)Dividend distributed out of taxable profit of the local subsidiaries attracts a 10% deduction at source and is not available for set off against the tax liability of the Bank.
Withholding tax that arises from the distribution of dividends by the Bank is recognised at the same time as the liability to pay the related dividend is recognised.
4.4 Value Added Tax on Financial Services (VAT)VAT on financial services is calculated in accordance with Value Added Tax Act No 14 of 2002 and subsequent amendments thereto.
VAT on financial services is payable at 12% on operating profit before value added tax and nation building tax on financial services adjusted for emoluments of employees and economic depreciation.
4.5 Economic Service Charges (ESC)With effect from 1st April 2012 as per the ESC amendment Act No 11 of 2012, ESC is payable at 0.25% on exempt turnover of the Bank and is deductible from income tax payable. ESC is not payable on turnover on which income tax is payable.
4.6 Nation Building Tax on Financial Services (NBT)NBT on financial services is calculated in accordance with Nation Building Tax (Amendment) Act No. 10 of 2014. NBT on financial services is payable at 2% on same base subjected to value added tax on financial services.
Hatton National Bank PLC232
5 OTHERS
5.1 Earnings per Share (EPS)The Group presents basic and diluted Earnings per Share (EPS) data for its ordinary shares. Basic EPS is calculated by dividing the profit or loss attributable to ordinary shareholders of the Bank by the weighted average number of ordinary shares outstanding during the period. Diluted EPS is determined by adjusting the profit or loss attributable to the ordinary shareholders and the weighted average number of ordinary shares outstanding for the effects of all dilutive potential ordinary shares, which comprise share options granted to employees.
Details of earnings per share are given in Note 22 to the financial statements.
5.2 Segment ReportingAn operating segment is a component of the Group that engages in business activities from which it may earn revenues and incur expenses, including revenues and expenses that relate to transactions with any of the Group’s other components, whose operating results are reviewed regularly by the chief operating decision maker to make decisions about resources allocated to each segment and assess its performance, and for which discrete financial information is available.
Group’s activities have been segregated into five different segments (banking, leasing / hire purchase, property, insurance and others) based on the business activities that each unit is engaged in for purpose of reviewing the operating results of the Group as well as to make decisions about resource allocation. The operating results of the Bank is split between banking and leasing / hire purchase
activities. Property and insurance represent the operating results and financial position of the subsidiaries, Sithma Development (Pvt) Ltd and HNB Assurance PLC respectively. Operating results and financial position of Prime Grameen Micro Finance Ltd and Majan Exchange LLC (disposed in 2013) is presented as others.
Management monitors the operating results of its business units separately for the purpose of making decisions about resource allocation and performance assessment. Segment performance is evaluated based on operating profits or losses which, in certain respects, are measured differently from operating profits or losses in the consolidated financial statements.
Inter segment transactions are accounted for at fair market prices, charged to inter-bank counterparts for similar services on an arm’s length basis. Such transfers are eliminated on consolidation.
Income taxes are not allocated to operating segments. Other expenses which cannot be directly identified against a particular business segment have been treated as consolidation adjustments.
No revenue from transactions with a single external customer or counter party amounted to 10% or more of the Bank’s total revenue in 2014 or in 2013.
Details of segment reporting are given in Note 62 to the financial statements.
5.3 Cash Flow StatementThe cash flow statement has been prepared using the direct method of preparing cash flows in accordance with the Sri Lanka Accounting Standard (LKAS 7) - “Statement of
Cash Flows” whereby gross cash receipts and gross cash payments of operating activities, finance activities and investing activities have been recognised. Cash and cash equivalents comprise short term, highly liquid investments that are readily convertible to known amounts of cash and are subject to an insignificant risk of change in value. The cash and cash equivalent include cash in hand, balances with banks, placements with banks, money at call and short notice.
5.4 Regulatory Provisions5.4 (a) Deposit Insurance Scheme
In terms of the Banking Act Direction No 5 of 2010 “Insurance of Deposit Liabilities” issued on 27th September 2010 and subsequent amendments there to, all licensed commercial banks are required to insure their deposit liabilities in the Deposit Insurance Scheme operated by the Monetary Board in terms of Sri Lanka Deposit Insurance Scheme Regulations No 1 of 2010 issued under Sections 32A to 32E of the Monetary Law Act with effect from 1st October 2010. The said scheme was renamed as the “Sri Lanka Deposit Insurance and Liquidity Support Scheme” as per the Sri Lanka Deposit Insurance and Liquidity Support Scheme Regulation No 1 of 2013. Deposits to be insured include demand, time and savings deposit liabilities and exclude the following;
- deposit liabilities to member institutions
- deposit liabilities to Government of Sri Lanka
- deposit liabilities to Directors, key management personnel and other related parties as defined in Banking Act Direction No 11 of 2007 on Corporate Governance of Licensed Commercial Banks
Notes to theFinancial Statements

Annual Report 2014 233
- deposit liabilities held as collateral against any accommodation granted
- deposit liabilities falling within the meaning of abandoned property in terms of the Banking Act and dormant deposits in terms of the Finance Companies Act funds of which have been transferred to Central Bank of Sri Lanka.
Licensed commercial banks are required to pay a premium of 0.10% on eligible deposit liabilities if the Bank maintains a capital adequacy ratio of 14% or above as at the end of the immediately preceding financial year and a premium of 0.125% on eligible deposit liabilities of all other licensed commercial banks calculated on the total amount of eligible deposits as at the end of the quarter within a period of 15 days from the end of the quarter.
5.4 (b) Investment Fund AccountAs proposed in the budget proposals of 2011, every person or partnership who is in the business of banking or financial services was required to establish and operate an Investment Fund Account.
As and when taxes are paid after 1st January 2011, Licensed Commercial Banks were required to transfer the following funds to the Investment Fund Account and build a permanent fund in the bank.
• 8% of the profits calculated for the payment of Value Added Tax (VAT) on financial services on dates as specified in the VAT Act for payment of VAT
• 5% of the profit before tax calculated for payment of income tax purposes on dates specified in Section 113 of the Inland Revenue Act for the self-assessment payments of tax
Licensed commercial banks could utilise the funds in the Investment Fund Account in the following manner;
• Invest in long term government securities and/or bonds with maturities not less than seven years
• Lend on maturities not less than five years at interest rates not exceeding 5 year treasury bond rates plus 2% for purposes specified in the Guidelines issued on operations of the Investment Fund Account.
The operations of the Investment Fund Account were discontinued w.e.f 1st October 2014 and the remaining balance was transferred to the retained earnings.
Details on investment fund account are given in Note 55 (b) to the financial statements.
5.4 (C) Crop Insurance LevyIn terms Section 15 of the Finance Act No 12 of 2013, all institutions under the purview of Banking Act No 30 of 1988, Finance Companies Act No 78 of 1988 and Regulation of Insurance Industry Act No 43 of 2000 are required to pay 1% of the profit after tax as Crop Insurance Levy to the National Insurance Trust Fund Board effective from 01st April 2013.
5.5 Events Occurring after the Reporting PeriodEvents after the reporting period are those events, favourable and unfavourable, that occur between the reporting date and the date the financial statements are authorised for issue.
All material and important events that occurred after the reporting date, including the final dividend declared on ordinary shares have been considered and appropriate disclosures are made in Note 64 to the financial statements.
6 SIGNIFICANT ACCOUNTING POLICIES THAT ARE SPECIFIC TO THE BUSINESS OF THE SUBSIDIARY – HNB ASSURANCE PLC (HNBA)As permitted by Sri Lanka Accounting Standard (SLFRS 4) - “Insurance Contracts”, HNBA continues to apply the existing accounting policies for insurance contracts that were applied prior to the adoption of SLFRS.
6.1 Product ClassificationSLFRS 4 requires contracts written by insurers to be classified as either “insurance contracts” or “investment contracts” depending on the level of insurance risk transferred.
Insurance contracts are those contracts where the entity (the insurer) has accepted significant insurance risk from another party (the policyholders) by agreeing to compensate the policyholders if a specified uncertain future event (the insured event) adversely affects the policyholders. As a general guideline, HNBA determines whether it has significant insurance risk, by comparing benefits paid with benefits payable if the insured event did not occur. Insurance contracts can also transfer financial risk.
Investment contracts are those contracts that transfer significant financial risk and no significant insurance risk. Financial risk is the risk of a possible future change in one or more of a specified interest rate, financial instrument price, commodity price, foreign exchange rate, index of price or rates, credit rating or credit index or other variable, provided in the case of a non-financial variable that the variable is not specific to a party to the contract.
Hatton National Bank PLC234
Once a contract has been classified as an insurance contract, it remains an insurance contract for the remainder of its lifetime, even if the insurance risk reduces significantly during this period, unless all rights and obligations are extinguished or expired. Investment contracts can, however, be reclassified as insurance contracts after inception if insurance risk becomes significant.
All the products sold by HNBA are insurance contracts and therefore classified as insurance contracts under Sri Lanka Accounting Standard (SLFRS 4) - Insurance Contracts. Thus, HNBA does not have any investment contracts within its product portfolio as at the reporting date.
6.2 Deferred Acquisition Costs (DAC)Those direct and indirect costs incurred during the financial period arising from the writing or renewing of insurance contracts are deferred and amortised over the period in which the related revenues are earned. All other acquisition costs are recognised as an expense when incurred.
The DAC is applicable only to general insurance contracts. No DAC is calculated for life insurance contracts as the acquisition costs are incurred in line with the revenues earned.
In line with the available regulatory guidelines from the Insurance Board of Sri Lanka (IBSL), the DAC is calculated based on the 1/24th basis.
An impairment review is performed at each reporting date or more frequently when an indication of impairment arises. When the recoverable amount is less than the carrying value, an impairment loss is recognised in the income statement. No such indication of impairment was experienced during the year.
DAC is derecognised when the related contracts are either settled or disposed of.
6.3 ReinsuranceHNBA cedes insurance risk in the normal course of business to recognised reinsurers through formal reinsurance arrangements.
Reinsurance assets include the balances due from reinsurance companies for paid and unpaid losses and loss adjustment expenses. Amounts recoverable from reinsurers are estimated in a manner consistent with the outstanding claims provision or settled claims associated with the reinsurer’s policies and are in accordance with the related reinsurance contract.
Reinsurance is recorded gross in the statement of financial position unless a right to offset exists.
Reinsurance assets are reviewed for impairment at each reporting date, or more frequently, when an indication of impairment arises during the reporting year. Impairment occurs when there is objective evidence as a result of an event that occurred after initial recognition of the reinsurance asset, that the entity may not receive all outstanding amounts due under the terms of the contract and the event has a reliably measurable impact on the amounts that the entity will receive from the reinsurer. The impairment loss, if any is recorded in the statement of financial position.
Ceded reinsurance arrangements do not relieve the entity from its obligations to policyholders.
Reinsurance assets or liabilities are derecognised when the contractual rights are extinguished or expired or when the contract is transferred to another party.
6.4 Premium ReceivableInsurance receivables from general insurance are recognised when due and measured on initial recognition at the fair value of the consideration receivable. Collectability of premiums is reviewed on an ongoing basis.
According to the Premium Payment Warranty (PPW) directive issued by the Insurance Board of Sri Lanka (IBSL), all general insurance policies are issued subject to PPW and are cancelled upon the expiry of 60 days if not settled.
Due life insurance premiums (only the premiums due in the 30 day grace period) are recognised at each reporting date and will be reversed if the premiums are not settled during the subsequent month, and thus the policies will be lapsed as per the entity policy.
6.5 Insurance Contract Liabilities
6.5.1 Insurance Provision - Life InsuranceLife insurance liabilities are recognised when contracts are entered into and premiums are charged. These liabilities are measured by using the net premium method as specified by the Insurance Board of Sri Lanka (IBSL) based on the recommendation of the Independent Consultant Actuary. The liability is determined as the sum of the discounted value of the expected future benefits, less the discounted value of the expected future premiums that would be required to meet the future cash outflows based on the valuation assumptions used. The liability is computed based on IBSL specified guidelines and current assumptions which vary based on the contract type.
Furthermore, adjustments are performed to capture the likely liabilities that may arise due to currently lapsed contracts getting revived in the future.
Notes to theFinancial Statements

Annual Report 2014 235
Liability Adequacy Test (LAT)
As required by Sri Lanka Accounting Standard (SLFRS 4) - ‘Insurance Contracts’, the entity performed a Liability Adequacy Test (LAT) in respect of life insurance contract liabilities with the assistance of an external actuary. In performing the LAT, current best estimates of future contractual cash flows, including related cash flows such as claims handling and policy administration expenses, policyholder options and guarantees, as well as investment income from assets backing such liabilities, are used.
6.5.2 Insurance Provision – General InsuranceGeneral insurance contract liabilities include the outstanding claims provision including IBNR and IBNER, the provision for unearned premium and the provision for premium deficiency.
The outstanding claims provision is based on the estimated ultimate cost of all claims incurred but not settled at the reporting date, whether reported or not, together with related claims handling costs and reduction for the expected value of salvage and other recoveries. Delays can be experienced in the notification and settlement of certain types of claims, therefore, the ultimate cost of these cannot be known with certainty at the reporting date.
The valuation of unearned premium reserves are measured in accordance with guidelines of the Regulation of Insurance Industry Act, No. 43 of 2000 (i.e. based on the 1/24th basis).
The Incurred But Not Reported (IBNR) and Incurred But Not Enough Reported (IBNER) claims reserve are actuarially computed.
The liability is IBNR and IBNER discounted for the time value of money. No provision for equalisation or catastrophe reserves is recognised.
The liabilities are derecognised when the obligation to pay a claim expires, is discharged or is cancelled.
Liability Adequacy Test (LAT)
As required by Sri Lanka Accounting Standard (SLFRS 4)- ‘Insurance Contracts’, the entity performed a Liability Adequacy Test (LAT) in respect of General Insurance contract liabilities with the assistance of the external actuary.
6.6 Title Insurance ReserveTitle insurance reserve is maintained by the entity to pay potential claims arising from the title insurance policies. Title insurance policies are normally issued for a long period such as 5 years or more. Thus, no profit is recognised in the first year of the policy given the higher probability of claims occurring in the first two years. From the 2nd year onwards, profit is recognised by amortising the premium received over a five year period using the straight line method. Profit in the first year will be recognised in the 2nd year and therefore it is periodically recognised.
If the corresponding loan of the title insurance policy issued is settled before the maturity, full premium of such policies remaining as at the date of settlement of such loan is recognised in profits upon confirmation of the same by the respective Bank.
6.7 Revenue Recognition6.7.1 Insurance Premiums
Life Insurance Business
Gross recurring premiums on life insurance contracts are recognised as revenue when payable by the policyholder (policies within the 30 day grace period are considered as due). Premiums received in advance are not recorded as revenue and recorded as liability until the premium is due unless otherwise the relevant policy conditions require
such premiums to be recognised as income. Benefits and expenses are provided against such revenue to recognise profits over the estimated life of the policies.
For single premium business, revenue is recognised on the date on which the policy is effective.
General Insurance Business
Gross general insurance written premiums comprise the total premiums received /receivable for the whole period of cover provided by contracts entered into during the accounting period. Gross written premium is generally recognised is written upon inception of the policy. Upon inception of the contract, premiums are recorded as written and are earned primarily on a pro-rata basis over the term of the related policy coverage.
Rebates that form part of the premium rate, such as no-claim rebates, are deducted from the gross premium.
Unearned premiums are those proportions of premiums written in a year that relate to periods of risk after the reporting date. Unearned premiums are calculated on 1/24th basis in accordance with the Regulation of Insurance Industry Act, No. 43 of 2000. However, for those contracts for which the period of risk differs significantly from the contract period, premiums are earned over the period of risk in proportion to the amount of insurance protection provided. The proportion attributable to subsequent periods is deferred as a provision for unearned premiums which is included under liabilities.
6.7.2 Reinsurance PremiumsGross reinsurance premiums on insurance contracts are recognised as an expense on the earlier of the date when premiums are payable or when the policy becomes effective.
Hatton National Bank PLC236
Reinsurance premiums are decided based on rates agreed with reinsurers.
Unearned reinsurance premiums are those proportions of premiums written in a year that relate to periods of risk after the reporting date. Unearned reinsurance premiums are deferred over the term of the underlying direct insurance policies for risks-attaching contracts (using 1/24th basis in accordance with the Regulation of Insurance Industry Act, No 43 of 2000).
6.7.3 Fees and Commission IncomeInsurance and investment contract policyholders are charged for policy administration services and other contract fees. These fees are recognised as revenue upon receipt or becoming due.
6.8 Benefits, Claims and Expenses
6.8.1 Gross Benefits and Claims
Life Insurance Business
Claims by death and maturity are charged against revenue on notification of death or on expiry of the term. The interim payments and surrenders are accounted for only at the time of settlement.
Expenses on life insurance relates to the acquisition expenses and expenses for maintenance of life insurance business, investment related expenses not treated as a part of the capital cost of investment, etc which are accounted on accrual basis.
General Insurance Business
General insurance claims include all claims occurring during the year, whether reported or not, together with claims handling costs that are directly related to the processing and settlement of claims, a reduction for the value of salvage and other recoveries, and any adjustments to claims outstanding from previous years. Claims outstanding are assessed by review of individual claim files and estimating changes in the ultimate cost of settling claims.
The provision in respect of Claims Incurred But Not Reported (IBNR) and Claims Incurred But Not Enough Reported (IBNER) is actuarially valued to ensure a more realistic estimation of the future liability based on the past experience and trends. Actuarial valuations are performed on a semi-annual basis.
Whilst the Directors of HNBA consider that the provisions for claims are fairly stated on the basis of information currently available, the ultimate liability will vary as a result of subsequent information and events. This may result in adjustments to the amounts provided. Such amounts are reflected in the financial statements for that period.
The methods used to estimate claims and the estimates made are reviewed regularly.
6.8.2 Reinsurance Claims
Reinsurance claims are recognised when the related gross insurance claim is recognised according to the terms of the relevant contract.
6.8.3 Deferred Acquisition Expenses
Acquisition expenses, representing commissions, which vary with and are directly related to the production of business, are deferred and amortised over the period in which the related written premiums are earned.
Reinsurance commission is also treated in the same manner within deferred acquisition costs.
6.9 Actuarial Valuation of Life Insurance FundThe Directors of HNBA agree to the long term insurance provision for the entity at the year-end on the recommendations of the Independent Consultant Actuary following his annual investigation of the life insurance business. The actuarial valuation takes into account all liabilities and is based on assumptions recommended by the independent consultant actuary.
6.10 Premium Income (GWP) and Other Sundry Sales Related TaxesRevenues, expenses and assets are recognised net of the amount of sales taxes and premium taxes except where the premium or sales tax incurred on the purchase of assets or services is not recoverable from the taxation authority, in which case, the sales tax is recognised as a part of the cost of acquisition of the asset or as a part of the expense item, as applicable.
Outstanding net amounts of sales or premium tax recoverable from, or payable to, the taxation authority are included as a part of receivables or payables in the statement of financial position.
Notes to theFinancial StatementsNotes to theFinancial Statements

Annual Report 2014 237
7 FINANCIAL RISK MANAGEMENT
7.1 Introduction and OverviewThe Bank manages its exposure to the risks integral to its activities through a process of proper risk identification, analysis, measurement and continuous monitoring. The Bank is exposed to the following risks arising from financial instruments:
• Credit risk
• Liquidity risk
• Market risk
• Operational risk
The Bank’s exposure to each of the above risks, objectives, policies and processes associated with measuring and managing such risks, and its strategy on capital management is detailed below. Since the Bank (ultimate parent) accounts for more than 95% of the total assets, liabilities, income and expenses of the Group, only the Bank’s exposure has been discussed under this note.
7.2 Risk Management FrameworkThe Board of Directors has overall responsibility for the establishment and oversight of the Bank’s risk management framework. In discharging its governance responsibility it operates through two key committees, the Board Integrated Risk Management Committee (BIRMC) and the Audit Committee.
The BIRMC provides the Board, the assurance that risk management strategies, policies and processes are in place to manage events / outcomes that have the potential to impact significantly on earnings performance, reputation and capital. The approach entails active monitoring of the level of risk exposure against the parameters set in the risk appetite. The BIRMC also assists the Board by assessing and approving significant credit and other transactions beyond the discretion of executive management.
The following executive management sub - committees, each with specialised focus, support the BIRMC and are responsible for the co-ordination of risk matters for each of the areas of risk management:
• Executive risk management committee
• Asset and liability committee
• Credit policy committee
• Investment committee
• IT steering committee
The audit committee is responsible for monitoring compliance with the Bank’s risk management policies and procedures, and for reviewing the adequacy of the risk management framework in relation to the risks faced by the Bank. The audit committee is assisted in these functions by internal audit department.
Internal audit department undertakes both regular and ad-hoc reviews of risk management controls and procedures, the results of which are reported to the audit committee.
The audit committee provides its assessment on the effectiveness of internal audit and external disclosure of accounting policies and financial reporting to the Board.
Risk management policies and systems are reviewed regularly to reflect changes in market conditions, products and services offered.

Hatton National Bank PLC238
7 FINANCIAL RISK MANAGEMENT (Contd.)7.3.1 Credit Risk
Credit risk is the risk of financial loss to the Bank if a customer or counterparty to a financial instrument fails to meet its contractual obligations, and arises principally from the Bank’s loans and advances to customers and banks and investment in debt and equity securities. For risk management reporting purposes, the Bank considers and consolidates all elements of credit risk exposure (such as individual obligor default risk, industry risk and geographical risk etc.).
For risk management purposes, credit risk arising on trading assets is managed independently and information thereon is disclosed below.
The credit risk policy plays a central role in managing daily business activities. The Bank has developed a policy which defines the principles encompassing client selection, due diligence, early alert reporting, tolerable levels of concentration risk and portfolio monitoring in line with Bank’s risk appetite. The approach is to avoid a large credit risk on a counterparty or portfolio level by applying stringent underwriting standards combined with sound collateralisation where feasible. The policy is reviewed at least annually and approved by the Board Credit / Assets and Liabilities Committee (BCALC) ensuring consistency with the Bank’s business strategy.
A monthly credit policy meeting chaired by the Chief Executive Officer, drives policy decisions and implementation plans.
Bank manages credit risk by focusing on following stages;
The loan origination process comprises initial screening and credit appraisal. The evaluation focuses on the borrower’s ability to meet its obligations in a timely manner. Efforts are made to ensure consistent standards are maintained in credit approval. Collateral and guarantees form an important part of the credit risk mitigation process and internal policy dictates margins in Bank’s favour by type of security offered, standards for periodic valuations and assessment of realisable value of collateral.
A suite of internal risk rating models (scientifically developed with the assistance of external consultants) are in place for corporate and retail customer segments. The internal risk rating is an important part of the risk assessment of customers and is incorporated in the credit decision process. Significant strides have been made in internalising this approach with a view to giving due prominence to lending based on cash flow repayment ability as distinct from collateral based lending.
The Bank has established clear guidelines for loan approvals / renewals by adopting a committee based approval structure, where all approval signatories carry equal responsibility for credit risk. Individual credit facilities beyond a minimum threshold require an independent risk signatory with no revenue targets in respective committees.
HNB’s corporate banking loan portfolio is administered through a centralised credit administration division which ensures efficient and effective post sanction customer support including disbursement, settlements, processing renewal notices and advising customers on interest rate amendments. This division independently reports to the risk management unit to ensure the availability of clear segregation of duties from business origination. The unit further ensures that the disbursements happen only after stipulated conditions have been met and relevant security documents are obtained.
To safeguard the Bank against possible losses, problem loans need to be identified early. The credit risk management division measures and tracks the status of the credit portfolio, undertakes impact studies and detects early warning signals pointing to deterioration in the financial health of a borrower.
A credit risk dashboard is prepared monthly to review high level credit portfolio concentration and assess performance against internal limits (board risk appetite) and regulatory requirements. An internally developed business intelligence system (‘KPI Wizard’) is in place to evaluate credit risk indicators at branch, regional, zonal and Bank level. Accountability for credit risk performance is vested with individual business units and unhealthy trends addressed at all levels.
Problem loans are managed by the recoveries and credit quality division. This unit is responsible for all aspects of an overdue facility, restructuring of the credit, monitoring the value of the applicable collateral and liquidation, scrutiny of legal documents and liaising with the customer until all recovery matters are finalised. This division’s activities are seamlessly integrated with credit administration and credit risk management to ensure effective follow up and learning transfer.
Notes to theFinancial Statements

Annual Report 2014 239
7 FINANCIAL RISK MANAGEMENT (Contd.)7.3.1 Credit Risk (Contd.)
Back office recovery functions representing problem loans classification, rescheduling, provisioning and valuation of collateral on delinquent assets is centralised to ensure standardisation and accuracy. The Bank strictly conforms to regulatory requirements in problem loan classification and management.
Regular audits of business units are undertaken by internal audit in order to ensure smooth functioning of each of these stages.
Impairment assessment
The methodology adopted by the Bank in respect of impairment assessment is given in Note 3.3.10
Derivative financial instruments
Credit risk arising from derivative financial instruments is, at any time, limited to those with positive fair values, as recorded on the statement of financial position. With gross–settled derivatives, the Bank is also exposed to a settlement risk, being the risk that the Bank honours its obligation, but the counterparty fails to deliver the counter value.
Credit related commitments risks
The Bank makes available to its customers guarantees that may require that the Bank makes payments on their behalf and enters into commitments to extend credit lines to secure their liquidity needs. Letters of credit and guarantees (including standby letters of credit) commit the Bank to make payments on behalf of customers in the event of a specific act, generally related to the import or export of goods. Such commitments expose the Bank to similar risks to loans and are mitigated by the same control processes and policies.
7.3.1 (a) Maximum Exposure to Credit Risk
The following table shows the maximum exposure to credit risk and net exposure to credit risk by class of financial asset.
As at 31st December 2014 Maximum Net exposure exposure to to credit risk credit risk
Rs 000 Rs 000
Placements with banks 3,789,538 3,789,538Reverse repurchase agreements 16,930,572 -Derivative financial instruments 178,370 178,370Other financial assets held for trading 551,371 551,371Loans and receivables to customers 406,353,665 141,133,124Financial investments - Available-for-sale 67,842,229 67,842,229Financial investments - Loans and receivables 36,166,064 35,369,035Other assets 1,954,191 1,954,191 533,766,000 250,817,858Guarantees, letter of credit and acceptances 95,464,322 91,368,650
Collateral and other credit enhancements
The amount and type of collateral required depends on an assessment of the credit risk of the counterparty. Guidelines are in place covering the acceptability and valuation of each type of collateral.
The general creditworthiness of customers tends to be the most relevant indicator of credit quality of a loan. However, collateral provides additional security and the Bank generally requests large borrowers to provide same. The Bank may take collateral in the form of a first charge over real estate and residential properties, floating charges over all corporate assets and other liens and guarantees.
The Bank’s policy is to pursue timely realisation of the collateral in an orderly manner. The proceeds are used to reduce or repay the outstanding claim. The Bank generally does not use non-cash collateral for its own operations.

Hatton National Bank PLC240
7 FINANCIAL RISK MANAGEMENT (Contd.)7.3.1 Credit Risk (Contd.)
7.3.1 (b) Credit Quality by Class of Financial Assets
The Bank manages the credit quality of loans and receivables based on an internal credit rating system while the other financial assets are managed based on the external credit ratings of the counterparty. The table below shows the credit quality by class of asset for all financial assets exposed to credit risk based on the credit ratings.
As at 31st December 2014
Neither Past Due but not Impaired
High Grade Standard Grade
Sub-Standard
Grade
Unrated Exposures not Subject to
Rating
Past Due but not Impaired
Past Due and Impaired
Individually Impaired
Total
Rs 000 Rs 000 Rs 000 Rs 000 Rs 000 Rs 000 Rs 000 Rs 000 Rs 000
Financial AssetsCash and cash equivalents 13,141,295 - - - - - - - 13,141,295
Balances with Central Bank of Sri Lanka 16,907,538 - - - - - - - 16,907,538
Placements with banks 2,738,538 1,051,000 - - - - - - 3,789,538
Reverse repurchase agreements 16,930,572 - - - - - - - 16,930,572
Derivative financial instruments 84,075 4,259 90,036 - - - - - 178,370
Other financial assets held for trading
Government securities 7,088 - - - - - - - 7,088
Equity securities 294,292 34,824 215,167 - - - - - 544,283
Loans and receivables to other customers 81,665,075 86,677,662 5,819,460 1,974,024 132,851,179 80,323,418 7,269,907 9,772,940 406,353,665
Financial investments - Available-for-sale
Government securities 59,212,841 - - - - - - - 59,212,841
Equity securities - Quoted 8,324,444 - - 270,300 - - - - 8,594,744
Equity securities - Unquoted - - - 34,644 - - - - 34,644
Financial investments - Loans and receivables
Government securities 30,598,313 - - - - - - - 30,598,313
Debt securities - Quoted 4,160,825 1,406,926 - - - - - - 5,567,751
Debt securities - Unquoted - - - - - - - - -
Other assets - - - - 1,954,191 - - - 1,954,191
234,064,896 89,174,671 6,124,663 2,278,968 134,805,370 80,323,418 7,269,907 9,772,940 563,814,833
Notes to theFinancial Statements
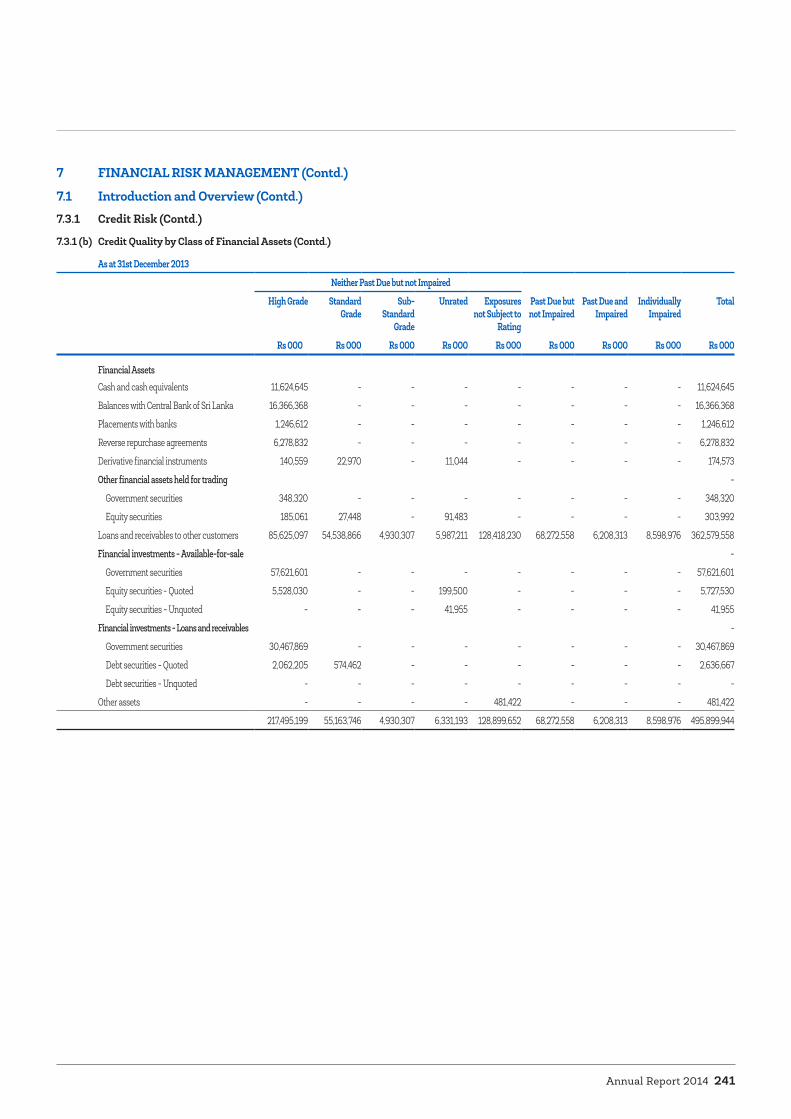
Annual Report 2014 241
7 FINANCIAL RISK MANAGEMENT (Contd.)
7.1 Introduction and Overview (Contd.)7.3.1 Credit Risk (Contd.)
7.3.1 (b) Credit Quality by Class of Financial Assets (Contd.)
As at 31st December 2013
Neither Past Due but not Impaired
High Grade Standard Grade
Sub-Standard
Grade
Unrated Exposures not Subject to
Rating
Past Due but not Impaired
Past Due and Impaired
Individually Impaired
Total
Rs 000 Rs 000 Rs 000 Rs 000 Rs 000 Rs 000 Rs 000 Rs 000 Rs 000
Financial AssetsCash and cash equivalents 11,624,645 - - - - - - - 11,624,645
Balances with Central Bank of Sri Lanka 16,366,368 - - - - - - - 16,366,368
Placements with banks 1,246,612 - - - - - - - 1,246,612
Reverse repurchase agreements 6,278,832 - - - - - - - 6,278,832
Derivative financial instruments 140,559 22,970 - 11,044 - - - - 174,573
Other financial assets held for trading -
Government securities 348,320 - - - - - - - 348,320
Equity securities 185,061 27,448 - 91,483 - - - - 303,992
Loans and receivables to other customers 85,625,097 54,538,866 4,930,307 5,987,211 128,418,230 68,272,558 6,208,313 8,598,976 362,579,558
Financial investments - Available-for-sale -
Government securities 57,621,601 - - - - - - - 57,621,601
Equity securities - Quoted 5,528,030 - - 199,500 - - - - 5,727,530
Equity securities - Unquoted - - - 41,955 - - - - 41,955
Financial investments - Loans and receivables -
Government securities 30,467,869 - - - - - - - 30,467,869
Debt securities - Quoted 2,062,205 574,462 - - - - - - 2,636,667
Debt securities - Unquoted - - - - - - - - -
Other assets - - - - 481,422 - - - 481,422
217,495,199 55,163,746 4,930,307 6,331,193 128,899,652 68,272,558 6,208,313 8,598,976 495,899,944

Hatton National Bank PLC242
7 FINANCIAL RISK MANAGEMENT (Contd.)7.3 Credit Risk (Contd.)7.3.1 Loans and Receivables to Other Customers (Contd.)
Allowances for impairment
The Bank established an allowance for impairment losses on assets carried at amortised cost/available for sale that represents its estimate of incurred losses in its loan and investment debt/equity security portfolio. The main components of this allowance are a specific loss component that relates to individually significant exposures and for assets measured at amortised cost, a collective loan loss allowance established for groups of homogeneous assets as well as for individually significant exposures that were subject to individual assessment for impairment but not found to be individually impaired and exposures found to be impaired but not provided. Assets carried at fair value through profit or loss are not subject to impairment testing as the measure of fair value reflects the credit quality of each asset.
The Bank regards a loan and advance or a debt security (individually significant) as impaired where there is objective evidence that a loss event has occurred since initial recognition and such loss event has an impact on future estimated cash flows from the asset. In addition, other loans are considered impaired if they are overdue for 180 days or more.
Movement of the impairment provision during the year is given in Note 31 (b) to the financial statements.
Past due but not impaired loans
Past due but not impaired loans are those for which contractual interest or principal payments are past due, but the Bank believes that impairment is not appropriate on the basis of the stage of collection of amounts owed to the Bank.
7.3.1 (c) Age Analysis of Financial Assets that are Past Due but not Impaired
As at 31st December 2014 2013 Rs 000 Rs 000
Past due but not impaired 1-30 days 62,865,058 51,433,716 31-60 days 14,956,651 9,628,346 61-90 days 1,269,795 5,541,125 91-120 days 409,806 469,613 121-150 days 474,408 420,165 151-180 days 347,700 779,593 80,323,418 68,272,558
Rescheduled loans
Rescheduled loans are loans that have been restructured due to deterioration in the borrower’s financial position, where the Bank has made concessions by agreeing to terms and conditions that are more favourable to the borrower compared to the original contract. The Bank implements forbearance policy in order to maximise collection opportunities and minimise the risk of default. Under the Bank’s forbearance policy, loan forbearance is granted on a selective basis in situations where the debtor is currently in default on its debt, or where there is a high risk of default, there is evidence that the debtor made all the reasonable effort to pay under the original contractual terms and they are expected to be able to meet the revised terms. The revised terms usually include extending maturity, changing timing of interest payments and amendments to the terms of loan covenants. Both retail and corporate loans are subject to the forbearance policy. Once the loan is restructured, it remains in this category independent of satisfactory performance after restructuring. At the time of restructuring the loan, the Bank determines the fair value of the loan and carrying value is brought down to reflect the fair value charging the difference, if any to the income statement under impairment for loans and other losses.
During the year ended 31st December 2014, the Bank restructured loans and advances with a carrying value of Rs 6,095.33 Mn (2013 - Rs 1,184.67 Mn) and recognised an impairment of Rs 238.66 Mn (2013 - Rs 82 Mn) in the income statement.
The Board Audit Committee regularly reviews reports on forbearance activities.
Write-off policy
The Bank writes off a loan or an investment in debt / equity security balance and any related allowances for impairment losses, when it determines that the loan or security is uncollectible. This determination is made after considering information such as the occurrence of significant changes in the borrower’s/issuer’s financial position such that the borrower / issuer can no longer pay the obligation or that proceeds from collateral will not be sufficient to pay back the entire exposure. For standardised loans with smaller balances, write-off decisions generally are based on a product-specific past due status.
Notes to theFinancial Statements
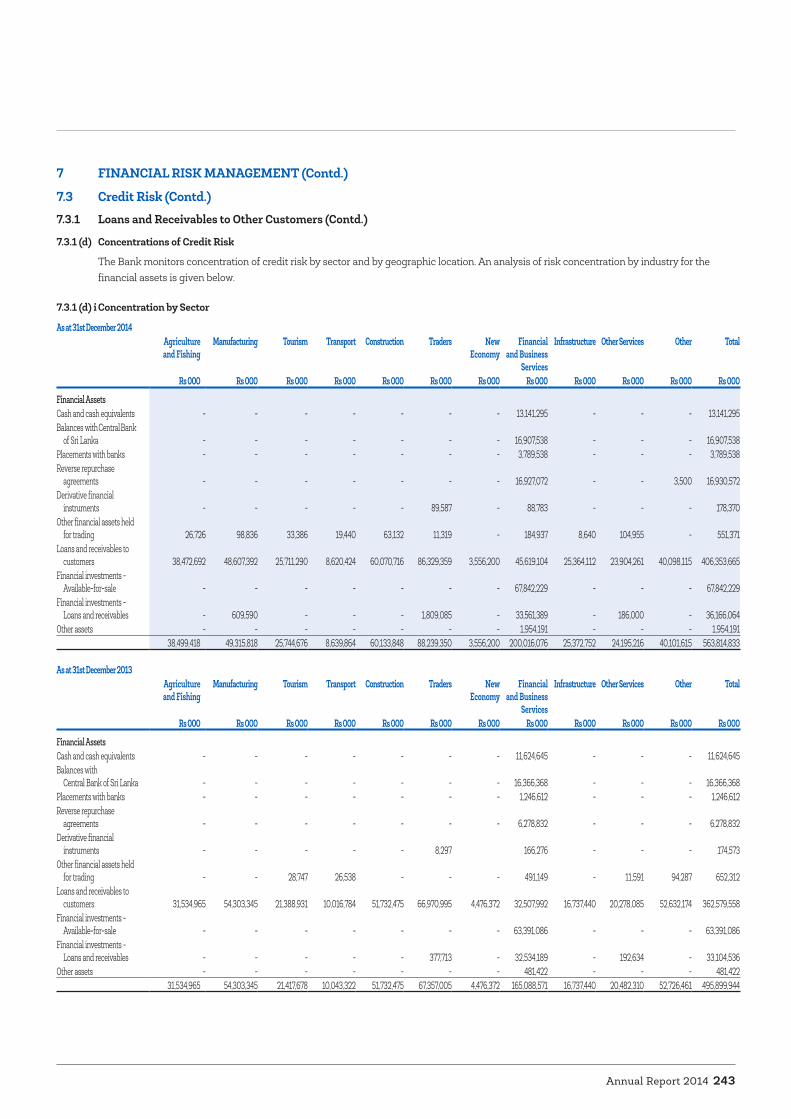
Annual Report 2014 243
7 FINANCIAL RISK MANAGEMENT (Contd.)
7.3 Credit Risk (Contd.)7.3.1 Loans and Receivables to Other Customers (Contd.)
7.3.1 (d) Concentrations of Credit Risk
The Bank monitors concentration of credit risk by sector and by geographic location. An analysis of risk concentration by industry for the financial assets is given below.
7.3.1 (d) i Concentration by Sector
As at 31st December 2014Agriculture and Fishing
Manufacturing Tourism Transport Construction Traders New Economy
Financial and Business
Services
Infrastructure Other Services Other Total
Rs 000 Rs 000 Rs 000 Rs 000 Rs 000 Rs 000 Rs 000 Rs 000 Rs 000 Rs 000 Rs 000 Rs 000
Financial AssetsCash and cash equivalents - - - - - - - 13,141,295 - - - 13,141,295 Balances with Central Bank of Sri Lanka - - - - - - - 16,907,538 - - - 16,907,538 Placements with banks - - - - - - - 3,789,538 - - - 3,789,538 Reverse repurchase agreements - - - - - - - 16,927,072 - - 3,500 16,930,572 Derivative financial instruments - - - - - 89,587 - 88,783 - - - 178,370 Other financial assets held for trading 26,726 98,836 33,386 19,440 63,132 11,319 - 184,937 8,640 104,955 - 551,371 Loans and receivables to customers 38,472,692 48,607,392 25,711,290 8,620,424 60,070,716 86,329,359 3,556,200 45,619,104 25,364,112 23,904,261 40,098,115 406,353,665 Financial investments - Available-for-sale - - - - - - - 67,842,229 - - - 67,842,229 Financial investments - Loans and receivables - 609,590 - - - 1,809,085 - 33,561,389 - 186,000 - 36,166,064 Other assets - - - - - - - 1,954,191 - - - 1,954,191
38,499,418 49,315,818 25,744,676 8,639,864 60,133,848 88,239,350 3,556,200 200,016,076 25,372,752 24,195,216 40,101,615 563,814,833
As at 31st December 2013Agriculture and Fishing
Manufacturing Tourism Transport Construction Traders New Economy
Financial and Business
Services
Infrastructure Other Services Other Total
Rs 000 Rs 000 Rs 000 Rs 000 Rs 000 Rs 000 Rs 000 Rs 000 Rs 000 Rs 000 Rs 000 Rs 000
Financial AssetsCash and cash equivalents - - - - - - - 11,624,645 - - - 11,624,645 Balances with Central Bank of Sri Lanka - - - - - - - 16,366,368 - - - 16,366,368 Placements with banks - - - - - - - 1,246,612 - - - 1,246,612 Reverse repurchase agreements - - - - - - - 6,278,832 - - - 6,278,832 Derivative financial instruments - - - - - 8,297 166,276 - - - 174,573 Other financial assets held for trading - - 28,747 26,538 - - - 491,149 - 11,591 94,287 652,312 Loans and receivables to customers 31,534,965 54,303,345 21,388,931 10,016,784 51,732,475 66,970,995 4,476,372 32,507,992 16,737,440 20,278,085 52,632,174 362,579,558 Financial investments - Available-for-sale - - - - - - - 63,391,086 - - - 63,391,086 Financial investments - Loans and receivables - - - - - 377,713 - 32,534,189 - 192,634 - 33,104,536 Other assets - - - - - - - 481,422 - - - 481,422
31,534,965 54,303,345 21,417,678 10,043,322 51,732,475 67,357,005 4,476,372 165,088,571 16,737,440 20,482,310 52,726,461 495,899,944

Hatton National Bank PLC244
7 FINANCIAL RISK MANAGEMENT (Contd.)7.3 Credit Risk (Contd.)7.3.1 Loans and Receivables to Other Customers (Contd.)
7.3.1 (d) ii Concentration by LocationConcentration of loans and advances by location is given below.
As at 31st December 2014 31st December 2013 Rs 000 % Rs 000 %
Western 270,149,328 66.48 228,202,553 62.94Southern 20,043,752 4.93 17,887,161 4.93Uva 6,713,917 1.65 6,920,048 1.91North Central 21,511,517 5.29 20,877,513 5.76North Western 32,243,356 7.93 29,113,603 8.03Eastern 9,829,857 2.42 10,325,024 2.85Northern 11,781,822 2.90 15,380,716 4.24Sabaragamuwa 8,803,110 2.17 7,384,986 2.04Central 23,437,268 5.77 22,186,182 6.12Overseas 1,839,738 0.46 4,301,772 1.18 406,353,665 100.00 362,579,558 100.00
Concentration by location for loans and advances is measured based on the location of the customer centre that granted the facility, which has a high correlation with the location of the borrower except for loans granted by the Foreign Currency Banking Unit (FCBU).
Exposure to MaldivesBank has granted Rs 1.6 Bn to Maldives based projects as at 31st December 2014 (2013 : 4.02 Bn). All these loans have been considered as significant loans and analysed individually. When the Bank has identified objective evidence of impairment of these loans, future cash flows have been estimated giving due consideration for specific industry, country risk factors etc. and availability of collateral. Analysis of the gross and net carrying values of the loans granted to Maldivian projects is given below.
As at 31st December 2014 2013 Rs 000 Rs 000
Gross carrying value as at 31st December 1,602,772 4,023,274Provision for impairment (110,169) (173,480)Net carrying value as at 31st December 1,492,603 3,849,794
Total unutilised overdrafts approved to above customers as at 31st December 2014 amounts to Rs 788.25 Mn (2013 : Rs 784.65 Mn).
7.3.1. (e) Commitments and GuaranteesThe Bank enters into various irrevocable commitments and contingent liabilities in order to meet the financial needs of the customer. These obligations contain credit risk and form part of the overall risk of the Bank even though they are not recognised on the statement of financial position.
The table below shows the Bank’s maximum credit risk exposure for commitments and guarantees.
The maximum exposure to credit risk relating to acceptances, documentary credit and guarantees is the amount the Bank would have to pay in the event those are called upon. The maximum exposure to credit risk relating to loan commitments is the full amount of the commitment. In both cases, the maximum risk exposure is significantly greater than the amount recognised as a liability in the statement of financial position.
As at 31st 31st December December 2014 2013
Rs 000 Rs 000
Acceptances 10,830,595 7,714,530Documentary credit 17,915,813 11,189,689Guarantees 66,717,914 51,404,604Undrawn commitments to lend 81,422,987 65,632,953 176,887,309 135,941,776
Notes to theFinancial Statements
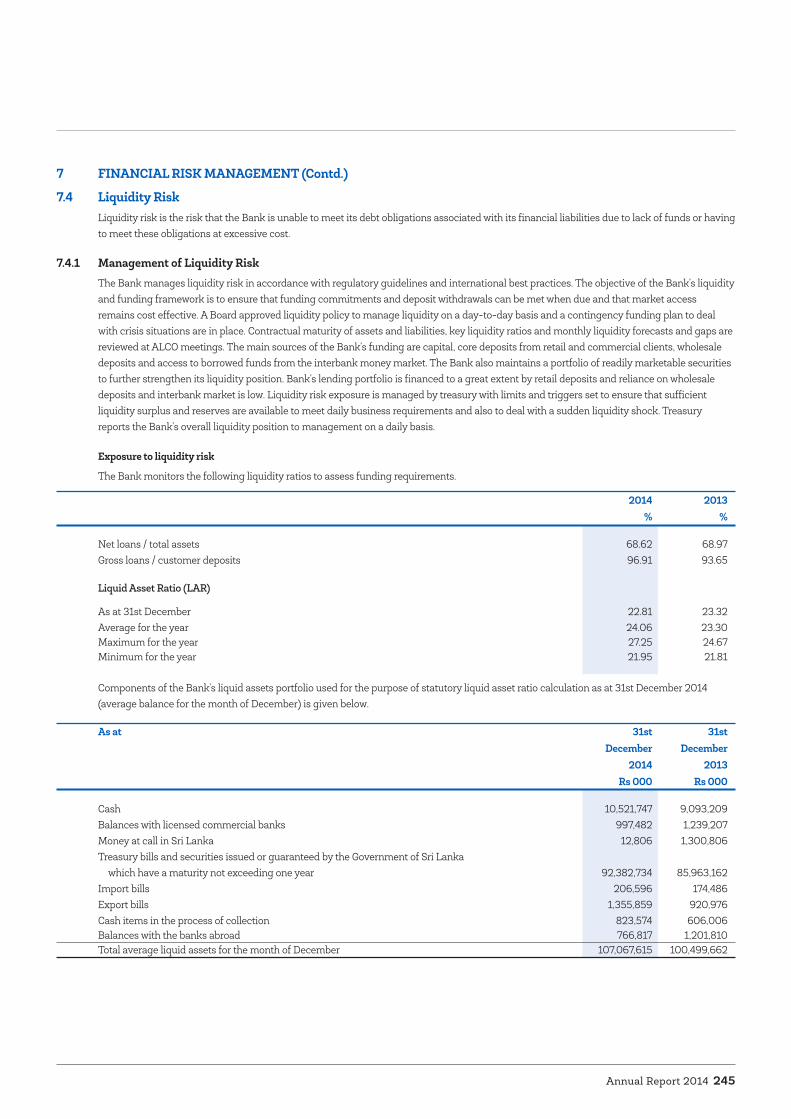
Annual Report 2014 245
7 FINANCIAL RISK MANAGEMENT (Contd.)
7.4 Liquidity RiskLiquidity risk is the risk that the Bank is unable to meet its debt obligations associated with its financial liabilities due to lack of funds or having to meet these obligations at excessive cost.
7.4.1 Management of Liquidity RiskThe Bank manages liquidity risk in accordance with regulatory guidelines and international best practices. The objective of the Bank’s liquidity and funding framework is to ensure that funding commitments and deposit withdrawals can be met when due and that market access remains cost effective. A Board approved liquidity policy to manage liquidity on a day-to-day basis and a contingency funding plan to deal with crisis situations are in place. Contractual maturity of assets and liabilities, key liquidity ratios and monthly liquidity forecasts and gaps are reviewed at ALCO meetings. The main sources of the Bank’s funding are capital, core deposits from retail and commercial clients, wholesale deposits and access to borrowed funds from the interbank money market. The Bank also maintains a portfolio of readily marketable securities to further strengthen its liquidity position. Bank’s lending portfolio is financed to a great extent by retail deposits and reliance on wholesale deposits and interbank market is low. Liquidity risk exposure is managed by treasury with limits and triggers set to ensure that sufficient liquidity surplus and reserves are available to meet daily business requirements and also to deal with a sudden liquidity shock. Treasury reports the Bank’s overall liquidity position to management on a daily basis.
Exposure to liquidity risk
The Bank monitors the following liquidity ratios to assess funding requirements.
2014 2013 % %
Net loans / total assets 68.62 68.97Gross loans / customer deposits 96.91 93.65
Liquid Asset Ratio (LAR)
As at 31st December 22.81 23.32Average for the year 24.06 23.30Maximum for the year 27.25 24.67Minimum for the year 21.95 21.81
Components of the Bank’s liquid assets portfolio used for the purpose of statutory liquid asset ratio calculation as at 31st December 2014 (average balance for the month of December) is given below.
As at 31st 31st December December 2014 2013
Rs 000 Rs 000
Cash 10,521,747 9,093,209Balances with licensed commercial banks 997,482 1,239,207Money at call in Sri Lanka 12,806 1,300,806Treasury bills and securities issued or guaranteed by the Government of Sri Lanka which have a maturity not exceeding one year 92,382,734 85,963,162Import bills 206,596 174,486Export bills 1,355,859 920,976Cash items in the process of collection 823,574 606,006Balances with the banks abroad 766,817 1,201,810Total average liquid assets for the month of December 107,067,615 100,499,662

Hatton National Bank PLC246
7 FINANCIAL RISK MANAGEMENT (Contd.)
7.4 Liquidity Risk (Contd.)
7.4.1 Management of Liquidity Risk (Contd.)Monthly liquidity gap is reported to ALCO by Treasury for each currency together with the overall gap position. Liquidity gap is based on the expected realisation of the assets and liabilities which have been determined based on historical behaviour. Net liquidity position reported for the month is monitored against the pre set limits which have been approved by the ALCO.
The Bank also holds debt and equity securities which are not considered as liquid assets but for which there is an active and liquid market. These assets can be readily sold to meet any unexpected liquidity requirements. Detailed analysis of the debt and equity securities held by the Bank as at 31st December 2014 is presented under credit risk. No assets have been pledged as collateral for borrowings other than treasury bills and bonds which are pledged against repurchase transactions. Details of treasury bills and bonds pledged as collateral against repurchase transactions are disclosed under Note 32 (j) to the financial statements.
Analysis of financial assets and liabilities by remaining contractual maturities
The table below summarises the maturity profile of the undiscounted cash flows of the Bank’s financial assets and liabilities as at 31st December. Repayments which are subject to notice are treated as if notice were to be given immediately. However, the Bank expects that many customers will not request repayment on the earliest date it could be required to pay and the table does not reflect the expected cash flows indicated by its deposit retention history.
Contractual maturities of undiscounted cash flows of financial assets and financial liabilities
31st December 2014
Upto 3 months 3 - 12 months 1 - 3 years 3 - 5 years More than 5 years Total Rs 000 Rs 000 Rs 000 Rs 000 Rs 000 Rs 000
Financial Assets Cash and cash equivalents 13,141,295 - - - - 13,141,295 Balances with Central Bank of Sri Lanka - - - - 16,907,538 16,907,538 Placements with banks 3,537,402 265,008 - - - 3,802,410 Reverse repurchase agreements 16,999,870 - - - - 16,999,870 Derivative financial instruments 157,363 21,007 - - - 178,370 Other financial assets held for trading 544,283 7,197 - - - 551,480 Loans and receivables to other customers 124,206,365 103,811,410 136,282,990 71,327,200 73,213,411 508,841,376 Financial investments - Available-for-sale 18,273,923 42,145,173 111,659 - 8,629,388 69,160,143 Financial investments - Loans and receivables 3,038,416 14,325,489 11,412,395 10,977,750 - 39,754,050 Other assets - - 1,954,191 - - 1,954,191 Total undiscounted financial assets 179,898,917 160,575,284 149,761,235 82,304,950 98,750,337 671,290,723
Financial Liabilities Due to banks 16,312,324 11,784,521 10,936,557 6,299,381 849,338 46,182,121 Derivative financial instruments 344,624 285,974 - - - 630,598 Securities sold under repurchase agreements 16,828,679 185,230 - - - 17,013,909 Due to other customers 297,700,530 112,592,220 7,407,870 9,458,270 6,170 427,165,060 Dividends payable 587,078 - - - - 587,078 Other borrowings 97,244 4,382,001 95,308 - - 4,574,553 Debt securities issued - 391,607 941,917 3,509,246 2,759,030 7,601,800 Other liabilities 373,925 - - - - 373,925 Subordinated term debts - 1,139,625 2,787,172 5,560,087 8,686,235 18,173,119 Total undiscounted financial liabilities 332,244,404 130,761,178 22,168,824 24,826,984 12,300,773 522,302,163
Net undiscounted financial assets/(liabilities) (152,345,487) 29,814,106 127,592,411 57,477,966 86,449,564 148,988,560
Notes to theFinancial Statements

Annual Report 2014 247
7 FINANCIAL RISK MANAGEMENT (Contd.)7.4 Liquidity Risk (Contd.)7.4.1 Management of Liquidity Risk (Contd.)
The table below shows the contractual expiry by maturity of the Bank’s contingent liabilities and commitments.
Upto 3 months 3 - 12 months 1 - 3 years 3 - 5 years More than 5 years Total Rs 000 Rs 000 Rs 000 Rs 000 Rs 000 Rs 000
Acceptances 9,442,430 1,388,165 - - - 10,830,595Documentary credit 16,376,894 1,523,654 15,265 - - 17,915,813Guarantees 12,835,187 23,081,270 22,590,308 4,011,844 4,199,305 66,717,914Undrawn commitments to lend 65,323,100 1,172,008 1,187,486 3,142,706 10,597,687 81,422,987 103,977,611 27,165,097 23,793,059 7,154,550 14,796,992 176,887,309
The Bank expects that not all of the contingent liabilities or commitments will be drawn before expiry of the commitments.
7.5 Market RiskMarket risk is the risk that changes in market prices, such as interest rates, equity prices, foreign exchange rates and credit spreads (not relating to changes in the obligor’s or issuer’s credit standing) will affect the Bank’s income or the value of its holdings of financial instruments. The objective of the Bank’s market risk management is to manage and control market risk exposures within acceptable parameters in order to ensure the Bank’s solvency while optimising the return on risk.
7.5.1 Management of Market RiskThe Bank separates its exposure to market risk between trading and non-trading portfolios. Trading portfolio includes financial assets and liabilities that are managed on a fair value basis. All foreign exchange positions within the Bank are treated as part of the Bank’s trading portfolios for risk management purposes. Non trading portfolio is managed in accordance with the purpose and strategic benefits of such investments, rather than purely on fair value basis.
The Bank has a Board approved market risk management policy. Treasury middle office monitors the Bank’s compliance with the above policy and ensures that the Bank’s market risk limits are in line with the level of risk acceptable to the Board. The Bank employs a range of tools to monitor and limit market risk exposures which are discussed below.
7.5.2 Exposure to Market RiskThe principal tool used to measure and control market risk exposure within the Bank is Value at Risk (VaR). The VaR of a portfolio is the estimated loss that will arise on the portfolio over a specified period of time (holding period) from an adverse market movement with a specified probability (confidence level). The VaR model used by the Bank is based upon a 99 percent confidence level and assumes 1-day and a 10-day holding period. The VaR model used is based mainly on historical simulation. Taking account of market data from the previous two years, and observed relationships between different markets and prices, the model generates a wide range of plausible future scenarios for market price movements.
Although VaR is an important tool for measuring market risk, the assumptions on which the model is based give rise to some limitations, including the following:
• The 1-day and 10-day holding periods assumes that it is possible to hedge or dispose of positions within those period. This may not be the case for illiquid assets or in situations in which there is severe general market liquidity
• A 99 percent confidence level does not reflect losses that may occur beyond this level. Even within the model used there is a one percent probability that losses could exceed the VaR.
• VaR is calculated on an end-of-day basis and does not reflect exposures that may arise on positions during the trading day.
• The use of historical data as a basis for determining the possible range of future outcomes may not always cover all possible scenarios, especially those of an exceptional nature.
• The VaR measure is dependent upon the Bank’s position and the volatility of market prices. The VaR of an unchanged position reduces if market price volatility declines and vice versa.
The Bank uses VaR limits for foreign exchange and equity risks. The overall structure of VaR limits is subject to review and approval by ALCO. VaR limits are allocated to portfolios. VaR is measured at least monthly and reported to ALCO.
The Bank’s VaR models are subject to regular validation by Treasury Mid Office (TMO) to ensure that they continue to perform as expected, and that assumptions used in model development are still appropriate.

Hatton National Bank PLC248
7 FINANCIAL RISK MANAGEMENT (Contd.)
7.5 Market Risk (Contd.)7.5.2 Exposure to Market Risk (Contd.)
A summary of the VaR position of the Bank as at 31 December and during the period is as follows:
As at 31st December Average Maximum Minimum
Rs 000 Rs 000 Rs 000 Rs 000
2014Foreign currency risk (USD NOP)* 747 684 2,145 81Equity risk 22,802 18,806 22,802 14,548
2013Foreign currency risk (USD NOP)* 1,574 3,378 5,449 207Equity risk 15,778 26,799 39,275 15,778
* Only USD exposure has been considered as it represents over 95% of the foreign currency transactions.
The limitations of the VaR methodology are recognised by supplementing VaR limits with other risk measures. The Bank uses a wide range of stress tests to model the financial impact of a variety of exceptional market scenarios such as changes in exchange rates, interest rates and prices of financial instruments such as equities and bonds. The results of the stress tests are reviewed by ALCO.
7.5.3 Exposure to Interest Rate RiskThe principal risk to which non-trading portfolios are exposed is the risk of loss from fluctuations in the future cash flows or fair values of financial instruments because of a change in market interest rates. The Bank manages the interest rate risk against interest rate gap limits which is supplemented by monitoring the sensitivity of the Bank’s financial assets and liabilities to various rate scenarios. Net interest yields are also calculated for each product to ensure adequate margins are kept.
The Bank holds treasury bills and bonds with shorter maturities, thus the impact of interest rate changes on treasury bill and bond prices are very minimal. Modified duration of both the trading and non trading portfolios as at 31st December is given below.
As at 31st 31st December December 2014 2013
Trading 0.5075 0.7825Non trading 0.8309 0.9793
Modified duration follows the concept that the interest rates and bond prices move in opposite directions. This determines the effect that a 100 basis point (1%) change in interest rates will have on the price of a bond.
An analysis of the Bank’s sensitivity to an increase or decrease in market interest rates assuming a constant financial position (as at 31st December 2014) is as follows:
Decrease of Decrease of Increase of Increase of 100 bps 200 bps 100 bps 200 bps
Rs 000 Rs 000 Rs 000 Rs 000
Effect on net interest income for the year ending 31st December 2015 based on the portfolio as at 31st December 2014 716,675 1,405,566 701,237 1,402,578
Notes to theFinancial Statements

Annual Report 2014 249
7 FINANCIAL RISK MANAGEMENT (Contd.)
7.6 Capital ManagementThe Bank’s capital management objectives can be summarised as follows:
• Maintain sufficient capital to meet minimum regulatory capital requirements
• Hold sufficient capital to support the Bank’s risk appetite
• Allocate capital to businesses to support the Bank’s strategic objectives
• Ensure that the Bank maintains capital in order to achieve debt rating objectives and to withstand the impact of potential stress events
Regulatory capital
The Bank manages its capital considering regulatory capital requirements. The Central Bank of Sri Lanka (CBSL) sets and monitors capital requirements for licensed banks in Sri Lanka based on the Basel Framework. Thus the Bank’s operations are directly supervised by the CBSL and the Bank is required to comply with the provisions of the Basel II framework in respect of regulatory capital and capital to cover any additional risk. Commercial banks in Sri Lanka need to maintain a minimum capital adequacy ratio (CAR) of 10% and a core capital ratio (Tier 1) of at least 5% . Historically the Bank has been maintaining CAR well above the regulatory minimum.
8 FAIR VALUE OF ASSETS AND LIABILITIES
8.1 Assets and Liabilities Recorded at fair valueA description of how fair values are determined for financial instruments that are recorded at fair value using valuation techniques is summarised below which incorporates the bank’s estimate of assumptions that a market participant would make when valuing the instruments.
Derivative financial instruments
Derivative products valued using a valuation technique with market observable inputs are mainly forward foreign exchange contracts and currency swaps. The most frequently applied valuation techniques include forward pricing models. The model incorporates various inputs including foreign exchange spot and forward premiums.
Financial investments – Available for sale
Government debt securities classified as financial investments - Available for sale are valued using current yield rates or market rates published by the Central Bank of Sri Lanka and quoted equities classified as financial investments - Available for sale are valued using quoted market prices in the active markets as at the reporting date.
Other financial assets held for trading
Financial assets held for trading consist of Government debt securities and quoted equities. Government debt securities are valued using yield curves published by the Central Bank of Sri Lanka while quoted equities are valued using quoted market price in active markets as at the reporting date.
Property, plant and equipment
Fair value of the land and buildings (revalued amount) is determined using the current replacement cost basis of valuation, which as a basis of valuation is the sum of;
1). The open market value of the land for its existing use plus
2). The current gross replacement cost of the buildings and their site works less an allowance for all appropriate factors such as age, condition, functional and environmental obsolescence which result in the existing property being worthless than a new replacement.

Hatton National Bank PLC250
8 FAIR VALUE OF ASSETS AND LIABILITIES (Contd.)
8.2 Valuation ModelThe fair values are measured using the fair value hierarchy described in Note 3.3.9.
For all financial instruments where fair values are determined by reference to externally quoted prices or observable pricing inputs to models, independent price determination or validation is obtained. In an inactive market, direct observation of a traded price may not be possible. In these circumstances, the Bank uses alternative market information to validate the financial instrument’s fair value, with greater weight given to information that is considered to be more relevant and reliable.
Fair value of land and buildings was determined based on the current replacement cost basis as explained in the Note 8.1. The independent valuers provide the fair value of the Bank’s land and buildings at least once in every three years according to the bank’s policy. Therefore the fair value existing from the recent valuation is considered as the fair value at the reporting date.
8.3 Assets and Liabilities Measured at Fair Value - Fair Value HierarchyThe following table shows an analysis of assets and liabilities recorded at fair value by level of the fair value hierarchy into which the fair value measurement is categorized. The amounts are based on the value recognized in the statement of financial position in the financial statements
As at 31st December 2014 - Bank Fair Value Measurement Using Quoted Prices Significant Significant in Active Observable Unobservable Markets Inputs Inputs
(Level 1) (Level 2) (Level 3) Total Rs 000 Rs 000 Rs 000 Rs 000
Financial assets measured at fair value Derivative financial instruments Currency swaps - 23,400 - 23,400 Forward foreign exchange contracts - 154,970 - 154,970 - 178,370 - 178,370 Financial asset held for trading Quoted shares 544,283 - - 544,284 Government of Sri Lanka treasury bills and bonds 7,088 - - 7,088 551,371 - - 551,371 Financial investments available for sale Quoted shares and units 8,594,744 - - 8,594,744 Unquoted shares - - 34,644 34,644 Government of Sri Lanka treasury bills and bonds 59,212,841 - - 59,212,841 67,807,585 - 34,644 67,842,229 Non-financial assets measured at fair value Freehold land and building - - 7,166,488 7,166,488 Non current assets held for sale - - 30,238 30,238 - - 7,196,732 7,196,732 Financial liabilities measured at fair value Derivative financial instruments Currency swaps - 515,496 - 515,496 Forward foreign exchange contracts - 115,102 - 115,102 - 630,598 - 630,598
Notes to theFinancial Statements

Annual Report 2014 251
8 FAIR VALUE OF ASSETS AND LIABILITIES (Contd.)
8.3 Assets and Liabilities Measured at Fair Value - Fair Value Hierarchy (Contd.) As at 31st December 2013 - Bank Fair Value Measurement Using Quoted Prices Significant Significant in Active Observable Unobservable Markets Inputs Inputs
(Level 1) (Level 2) (Level 3) Total Rs 000 Rs 000 Rs 000 Rs 000
Financial asset measured at fair value Derivative financial instruments Currency swaps - 39,059 - 39,059 Forward foreign exchange contracts - 135,514 - 135,514 - 174,573 - 174,573 Financial asset held for trading Quoted shares 303,992 - - 303,992 Government of Sri Lanka treasury bills and bonds 348,320 - - 348,320 652,312 - - 652,312 Financial investments available for sale Quoted shares and units 5,727,530 - - 5,727,530 Unquoted shares - - 41,955 41,955 Government of Sri Lanka treasury bills and bonds 57,621,601 - - 57,621,601 63,349,131 - 41,955 63,391,086 Non-financial assets measured at fair value Freehold land and building - - 7,168,211 7,168,211 - - 7,168,211 7,168,211 Financial liabilities measured at fair value Derivative financial instruments Currency swaps - 636,475 - 636,475 Forward foreign exchange contracts - 112,487 - 112,487 - 748,962 - 748,962
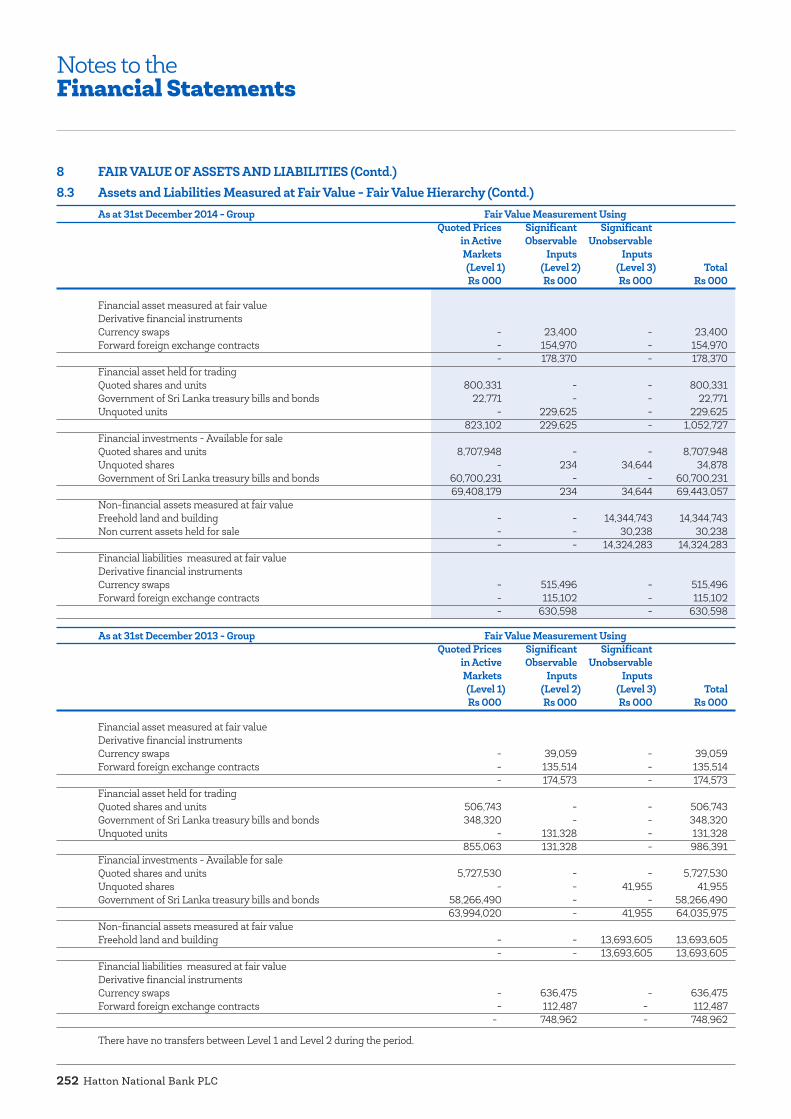
Hatton National Bank PLC252
8 FAIR VALUE OF ASSETS AND LIABILITIES (Contd.)8.3 Assets and Liabilities Measured at Fair Value - Fair Value Hierarchy (Contd.)
As at 31st December 2014 - Group Fair Value Measurement Using Quoted Prices Significant Significant in Active Observable Unobservable Markets Inputs Inputs
(Level 1) (Level 2) (Level 3) Total Rs 000 Rs 000 Rs 000 Rs 000
Financial asset measured at fair value Derivative financial instruments Currency swaps - 23,400 - 23,400 Forward foreign exchange contracts - 154,970 - 154,970 - 178,370 - 178,370 Financial asset held for trading Quoted shares and units 800,331 - - 800,331 Government of Sri Lanka treasury bills and bonds 22,771 - - 22,771 Unquoted units - 229,625 - 229,625 823,102 229,625 - 1,052,727 Financial investments - Available for sale Quoted shares and units 8,707,948 - - 8,707,948 Unquoted shares - 234 34,644 34,878 Government of Sri Lanka treasury bills and bonds 60,700,231 - - 60,700,231 69,408,179 234 34,644 69,443,057 Non-financial assets measured at fair value Freehold land and building - - 14,344,743 14,344,743 Non current assets held for sale - - 30,238 30,238 - - 14,324,283 14,324,283 Financial liabilities measured at fair value Derivative financial instruments Currency swaps - 515,496 - 515,496 Forward foreign exchange contracts - 115,102 - 115,102 - 630,598 - 630,598
As at 31st December 2013 - Group Fair Value Measurement Using Quoted Prices Significant Significant in Active Observable Unobservable Markets Inputs Inputs
(Level 1) (Level 2) (Level 3) Total Rs 000 Rs 000 Rs 000 Rs 000
Financial asset measured at fair value Derivative financial instruments Currency swaps - 39,059 - 39,059 Forward foreign exchange contracts - 135,514 - 135,514 - 174,573 - 174,573 Financial asset held for trading Quoted shares and units 506,743 - - 506,743 Government of Sri Lanka treasury bills and bonds 348,320 - - 348,320Unquoted units - 131,328 - 131,328 855,063 131,328 - 986,391 Financial investments - Available for sale Quoted shares and units 5,727,530 - - 5,727,530 Unquoted shares - - 41,955 41,955 Government of Sri Lanka treasury bills and bonds 58,266,490 - - 58,266,490 63,994,020 - 41,955 64,035,975 Non-financial assets measured at fair value Freehold land and building - - 13,693,605 13,693,605 - - 13,693,605 13,693,605 Financial liabilities measured at fair value Derivative financial instruments Currency swaps - 636,475 - 636,475 Forward foreign exchange contracts - 112,487 - 112,487 - 748,962 - 748,962
There have no transfers between Level 1 and Level 2 during the period.
Notes to theFinancial Statements

Annual Report 2014 253
8 FAIR VALUE OF ASSETS AND LIABILITIES (Contd.)8.4 Level 3 Fair Value Measurement8.4 (a) Reconciliation of Fair Value of Assets Classified as “Level 3” in the Fair Value Hierarchy
8.4 (a) i Unquoted Equity Securities accounted as Financial Investments - Available for Sale
2014 2013 Rs 000 Rs 000
Balance at 1st January 41,955 27,456 Impairment provision during the year (7,311) (2,051) Investments made during the year - 16,550Balance at 31st December 34,644 41,955
Rs 7.3 Mn impairment provision was made during the year in respect of investment in Ram Ratings Lanka Ltd and recorded under impairment charges for loans and other losses.
8.4 (a) ii Property, Plant and Equipment
The reconciliation of property, plant and equipment is given in Note 39 to the financial statements.
8.4 (b) Unobservable inputs used in measuring Fair ValueThe table below sets out information about significant unobservable inputs used in measuring financial instruments categorised as Level 3 in the fair value hierarchy as at 31st December 2014.
Type of Instrument Fair Values as at 31st December 2014 Rs 000
Valuation Technique
Significant Unobservable Inputs
Range of Stimates (Weighted Average) for Unobservable Inputs
Fair Value Measurement Sensitivity to Unobservable Inputs
Freehold land and buildings and non current assets held for sale
7,196,732 Currentreplacement cost basis
Land-Rate per perch Buildings - Rate per sq.ft.
Rs 0.15 Mn - Rs 10 Mn
Rs 35 - Rs 16,000
Significant increases /(decreases) in estimated price per sqft and perch in isolation would result in a significantly higher / (lower) fair value
8.5 Fair Value of Financial Assets and Liabilities not carried at Fair ValueThe following describes the methodologies and assumptions used to determine fair values for those financial instruments which are not already recorded at fair value in the financial statements:
Assets for which fair value approximates carrying value
For financial assets and financial liabilities that have a short term maturity, it is assumed that the carrying amounts approximate their fair value. This assumption is also applied to demand deposits, and savings accounts which do not have a specific maturity.
Fixed rate financial instruments
The fair value of fixed rate financial assets and liabilities carried at amortised cost are estimated by comparing the contractual interest rates with current market rates prevailing as at the reporting date for similar financial instruments. The estimated fair value of fixed interest bearing deposits is based on discounted cash flows using prevailing market interest rates for deposits of similar maturity as at the reporting date. For quoted debt issued, the fair values are determined based on quoted market prices. For notes issued where quoted market prices are not available, a discounted cash flow model is used based on a current interest rate yield curve appropriate for the remaining term to maturity and credit spreads.
The following table summarises the carrying amounts and the Bank’s estimate of fair values of those financial assets and liabilities not presented in the statement of financial position at fair value. The fair values in the table below may be different from the actual amounts that will be received / paid on the settlement or maturity of the financial instrument. For certain instruments, the fair value may be determined using assumptions which are not observable in the market. This table does not include the fair values of non–financial assets and liabilities.

Hatton National Bank PLC254
8 FAIR VALUE OF ASSETS AND LIABILITIES (Contd.)8.5 Fair Value of Financial Assets and Liabilities not carried at Fair Value (Contd.)
BankAs at 31st December 2014 Fair Value
Carrying Value Level 1 Level 2 Level 3 Total Value Rs 000 Rs 000 Rs 000 Rs 000 Rs 000
Financial Assets Loans and receivables to other customers 395,699,387 - 396,829,288 - 396,829,288 Financial investments - Loans and receivables 36,166,064 - 36,250,178 - 36,250,178
Financial Liabilities Due to customers 419,327,123 - 422,342,200 - 422,342,200 Debt securities issued 4,451,407 - 3,977,873 - 3,977,873 Subordinated term debts 11,653,759 - 13,181,586 - 13,181,586
As at 31st December 2013 Fair Value Carrying Value Level 1 Level 2 Level 3 Total Value Rs 000 Rs 000 Rs 000 Rs 000 Rs 000
Financial Assets Loans and receivables to other customers 351,965,376 - 351,917,834 - 351,917,834 Financial investments - Loans and receivables 33,104,536 - 33,104,536 - 33,104,536
Financial Liabilities Due to customers 387,158,390 - 387,158,390 - 387,158,390 Debt securities issued 1,418,775 - 1,418,775 - 1,418,775 Subordinated term debts 11,856,561 - 11,856,561 - 11,856,561
GroupAs at 31st December 2014 Fair Value
Carrying Value Level 1 Level 2 Level 3 Total Value Rs 000 Rs 000 Rs 000 Rs 000 Rs 000
Financial Assets Loans and receivables to other customers 401,281,976 - 402,286,580 - 402,286,580 Financial investments - Held to Maturity 955,421 993,490 - - 993,490 Financial investments - Loans and receivables 38,846,129 - 38,904,035 - 38,904,035
Financial Liabilities Due to customers 425,620,382 - 428,729,862 - 428,729,862 Debt securities issued 4,842,627 - 4,367,021 - 4,367,021 Subordinated term debts 11,677,046 - 13,206,482 - 13,206,482
As at 31st December 2013 Fair Value Carrying Value Level 1 Level 2 Level 3 Total Value Rs 000 Rs 000 Rs 000 Rs 000 Rs 000
Financial assets Loans and receivables to other customers 351,776,782 - 351,729,237 - 351,729,237 Financial investments - Held to Maturity 931,681 948,081 - - 948,081 Financial investments - Loans and receivables 35,103,762 - 35,047,708 - 35,047,708
Financial Liabilities Due to customers 386,864,044 - 386,864,044 - 386,864,044 Debt securities issued 1,399,184 - 1,400,043 - 1,400,043 Subordinated term debts 11,781,703 - 11,795,218 - 11,795,218
Notes to theFinancial Statements

Annual Report 2014 255
8 FAIR VALUE OF ASSETS AND LIABILITIES (Contd.)
8.5 Fair Value of Financial Assets and Liabilities not carried at Fair Value (Contd.)The following table lists those financial instruments for which their carrying amounts are a reasonable approximation of fair values because, those are short term in nature or re-priced to current market rates frequently:
Assets Liabilities Cash and cash equivalents Due to banks Balances with Central Bank of Sri Lanka Securities sold under repurchase agreements Placements with banks Other borrowings Securities purchased under resale agreements Dividends payable Other assets Other liabilities Reclassification of financial assets There have been no reclassifications during 2014 and 2013.
9 NEW ACCOUNTING STANDARDS ISSUED BUT NOT EFFECTIVE AS AT REPORTING DATEThe following SLFRSs have been issued by the Institute of Chartered Accountants of Sri Lanka that have an effective date in the future and have not been applied in preparing these Financial Statements. Those SLFRS will have an effect on the accounting policies currently adopted by the Group and may have an impact on the future Financial Statements.
Sri Lanka Accounting Standard (SLFRS 9) –“Financial Instruments: Classification and Measurement”
In December 2014, the CA Sri Lanka issued the final version of SLFRS 9 Financial Instruments which reflects all phases of the Financial Instruments project and replaces LKAS 39 Financial Instruments: Recognition and Measurement. The standard introduces new requirements for classification and measurement, impairment and hedge accounting. SLFRS 9 is effective for annual periods beginning on or after 1st January 2018, with early application permitted. Retrospective application is required, but comparative information is not compulsory. The adoption of SLFRS 9 will have an effect on the classification and measurement of the Group’s financial assets, but no impact on the classification and measurement of the Group’s financial liabilities.
Sri Lanka Accounting Standard (SLFRS 14) –“Regulatory Deferral Accounts”
The scope of this standard is limited to first-time adopters of SLFRS that already recognise regulatory deferral account balances in their financial statements. Consequently, the financial statements of rate regulated entities that already apply SLFRS, or that do not otherwise recognise such balances, will not be affected by this standard. This standard is effective for the annual periods beginning on or after 01 January 2016.
Sri Lanka Accounting Standard (SLFRS 15) –“Revenue from Contracts with Customers”
SLFRS 15 establishes a comprehensive framework for determining whether, how much and when revenue is recognised. It replaces existing revenue recognition guidance, including Sri Lanka Accounting Standard (LKAS 18) – “Revenue”, Sri Lanka Accounting Standard (LKAS 11) – “Construction Contracts” and IFRIC 13 – “Customer Loyalty Programmes”. This standard is effective for the annual periods beginning on or after 01 January 2017.
The Group will adopt these standards when they become effective. Pending the completion of detailed review, the financial impact is not reasonably estimable as at the date of publication of these Financial Statements.

Hatton National Bank PLC256
Bank Group For the year ended 31st December 2014 2013 2014 2013 Restated
Rs 000 Rs 000 Rs 000 Rs 000
10 GROSS INCOME Interest income [Note 11 (a)] 51,868,333 56,770,713 53,062,579 57,364,012 Fee and commission income 4,976,212 4,263,200 5,196,099 4,348,213 Net loss from trading (Note 13) (570,720) (1,815,061) (441,618) (1,782,580)Net gain from financial investments (Note 14) 1,398,025 246,591 1,493,975 292,429 Other operating income (Note 15) 1,828,645 1,540,971 5,712,811 4,961,409 59,500,495 61,006,414 65,023,846 65,183,483
11 NET INTEREST INCOME 11 (a) Interest Income
Cash and cash equivalents 3,862 78 6,605 13,015 Placements with banks 29,939 346,805 206,460 528,590 Securities purchased under resale agreements 583,367 55,037 636,931 101,524 Loans and receivables to customers 43,201,739 47,445,379 43,683,919 47,421,558 Interest income accrued on impaired financial assets 377,601 229,791 377,601 229,791 Other financial assets - Held for trading 162,100 96,214 166,030 97,748 Financial investments - Held to maturity - - 98,026 136,867 Financial investments - Available for sale 5,779,836 6,984,540 5,905,250 7,116,390 Financial investments - Loans and receivables 1,670,949 1,477,584 1,968,780 1,625,939 Other interest income 58,940 135,285 12,977 92,590 Total interest income 51,868,333 56,770,713 53,062,579 57,364,012
11 (b) Interest Expenses Due to banks 1,467,308 1,623,215 1,470,883 1,623,215 Securities sold under repurchase agreements 502,408 408,695 502,408 408,695 Deposits from customers (due to customers) 23,095,687 27,678,797 23,205,122 27,664,510 Other borrowings 449,739 583,779 449,739 584,552 Debt securities issued 202,784 64,475 204,163 61,211 Subordinated term debts 1,223,360 1,009,300 1,219,975 1,005,882 Other interest expenses 25,540 55,684 25,540 55,684 Total interest expenses 26,966,826 31,423,945 27,077,830 31,403,749 Net interest income 24,901,507 25,346,768 25,984,749 25,960,263
11 (c) Net Interest Income from Sri Lanka Government SecuritiesInterest income 7,846,121 8,291,626 8,314,319 8,560,343 Less : Interest expenses 502,408 408,695 502,408 408,695 Net interest income from Sri Lanka Government securities 7,343,713 7,882,931 7,811,911 8,151,648
Notional tax credit for withholding tax on Government securities on secondary market transactions Section 137 of the Inland Revenue Act No 10 of 2006 provides that a company which derives interest income from the secondary market transactions in Government securities be entitled to a notional tax credit (being one ninth of the net interest income) provided such interest income forms part of the statutory income of the company for that year of assessment
Accordingly, net income earned from secondary market transactions in Government securities for the year by the Bank / Group has been grossed up in the financial statements and the resulting notional tax credit amounted to Rs 600 Mn (2013 : Rs 672 Mn) for the Bank and Rs 658 Mn (2013 : Rs 712 Mn) for the Group.
Notes to theFinancial Statements
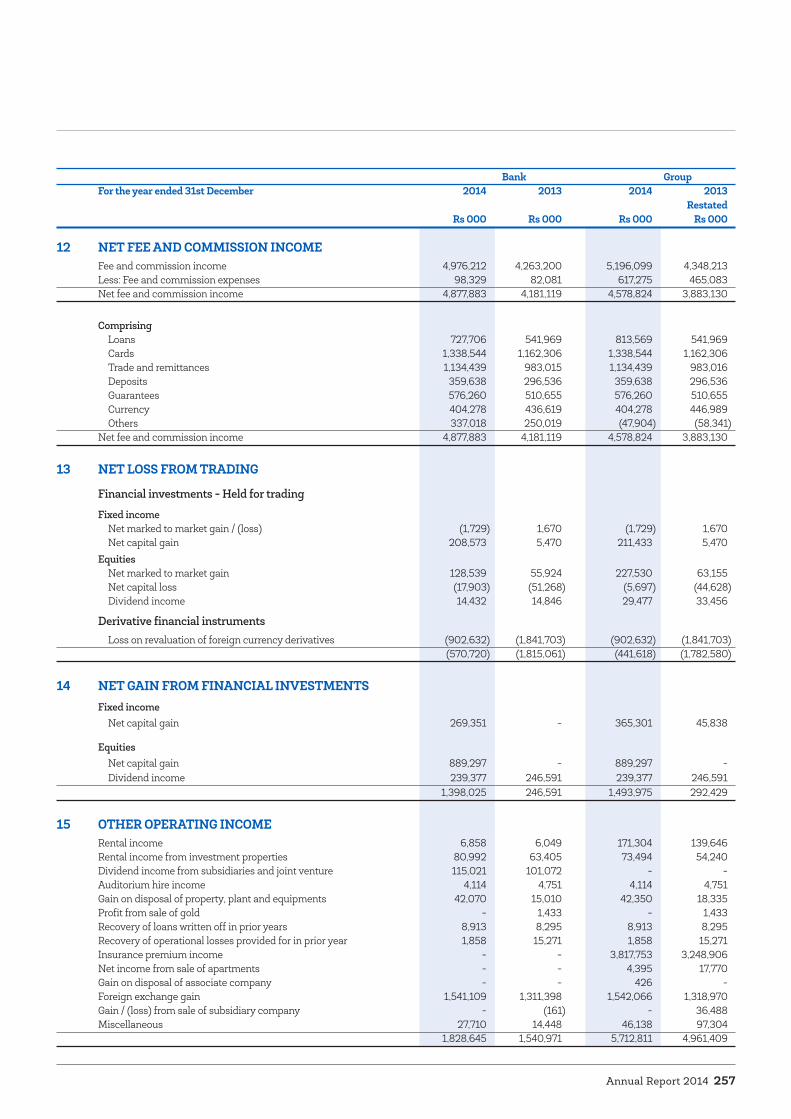
Annual Report 2014 257
Bank Group For the year ended 31st December 2014 2013 2014 2013 Restated
Rs 000 Rs 000 Rs 000 Rs 000
12 NET FEE AND COMMISSION INCOMEFee and commission income 4,976,212 4,263,200 5,196,099 4,348,213 Less: Fee and commission expenses 98,329 82,081 617,275 465,083 Net fee and commission income 4,877,883 4,181,119 4,578,824 3,883,130
Comprising Loans 727,706 541,969 813,569 541,969 Cards 1,338,544 1,162,306 1,338,544 1,162,306 Trade and remittances 1,134,439 983,015 1,134,439 983,016 Deposits 359,638 296,536 359,638 296,536 Guarantees 576,260 510,655 576,260 510,655 Currency 404,278 436,619 404,278 446,989 Others 337,018 250,019 (47,904) (58,341)Net fee and commission income 4,877,883 4,181,119 4,578,824 3,883,130
13 NET LOSS FROM TRADING
Financial investments - Held for trading
Fixed income Net marked to market gain / (loss) (1,729) 1,670 (1,729) 1,670 Net capital gain 208,573 5,470 211,433 5,470 Equities Net marked to market gain 128,539 55,924 227,530 63,155 Net capital loss (17,903) (51,268) (5,697) (44,628) Dividend income 14,432 14,846 29,477 33,456
Derivative financial instruments
Loss on revaluation of foreign currency derivatives (902,632) (1,841,703) (902,632) (1,841,703) (570,720) (1,815,061) (441,618) (1,782,580)
14 NET GAIN FROM FINANCIAL INVESTMENTSFixed income Net capital gain 269,351 - 365,301 45,838
Equities Net capital gain 889,297 - 889,297 - Dividend income 239,377 246,591 239,377 246,591 1,398,025 246,591 1,493,975 292,429
15 OTHER OPERATING INCOMERental income 6,858 6,049 171,304 139,646 Rental income from investment properties 80,992 63,405 73,494 54,240 Dividend income from subsidiaries and joint venture 115,021 101,072 - - Auditorium hire income 4,114 4,751 4,114 4,751 Gain on disposal of property, plant and equipments 42,070 15,010 42,350 18,335 Profit from sale of gold - 1,433 - 1,433 Recovery of loans written off in prior years 8,913 8,295 8,913 8,295 Recovery of operational losses provided for in prior year 1,858 15,271 1,858 15,271 Insurance premium income - - 3,817,753 3,248,906 Net income from sale of apartments - - 4,395 17,770 Gain on disposal of associate company - - 426 - Foreign exchange gain 1,541,109 1,311,398 1,542,066 1,318,970 Gain / (loss) from sale of subsidiary company - (161) - 36,488 Miscellaneous 27,710 14,448 46,138 97,304 1,828,645 1,540,971 5,712,811 4,961,409

Hatton National Bank PLC258
Bank Group For the year ended 31st December 2014 2013 2014 2013 Restated
Rs 000 Rs 000 Rs 000 Rs 000
16 IMPAIRMENT CHARGE / (REVERSAL) FOR LOANS AND OTHER LOSSES Loans and receivables to other customers Individual impairment 617,545 239,582 625,373 239,582 Collective impairment 1,688,681 4,039,203 1,704,719 4,039,260 Direct write offs 970 - 970 - Others 183,459 42,265 183,459 42,265 Financial investments - Available-for-sale 7,311 2,051 7,311 2,051 Financial investments - Loans and receivables (6,446) 3,706 (6,446) 3,706 Property, plant and equipment - - 8,203 -Advanced payment on software - - 9,219 -Investment in subsidiary company - (56,121) - - 2,491,520 4,270,686 2,532,808 4,326,864
17 PERSONNEL EXPENSESSalaries and bonus 5,759,017 5,437,466 6,374,439 5,881,926 Contributions to Employees’ Provident Fund 475,700 459,245 523,807 494,999 Contributions to Employees’ Trust Fund 118,640 112,065 130,666 121,003 Contribution to defined benefit plan [Note 17 (a)] 496,131 467,227 521,761 486,392 Equity-settled share based payment transactions - 239,701 - 239,701 Cash-settled share based payment reversal - (1,503,655) - (1,503,655)Increase in liability for EPF interest guarantee 4,079 16,585 4,079 16,585 Increase / (decrease) in liability for accumulated leave (13,339) 18,264 (13,339) 18,264 Others 566,787 206,880 566,787 206,880 7,407,015 5,453,778 8,108,200 5,962,095
17 (a) Contribution to Defined Benefit Plan Current service cost 507,915 529,628 507,915 529,628 Interest on obligation 1,127,245 994,318 1,127,245 994,318 Expected return on plan assets (1,139,029) (1,056,719) (1,139,029) (1,056,719)Provision for gratuities - - 25,630 19,165 496,131 467,227 521,761 486,392
18 OTHER EXPENSESDirectors’ emoluments 68,666 68,096 71,565 70,636 Auditors’ remuneration [Note 18 (a)] 14,180 14,566 19,627 17,511 Legal expenses and professional fees 75,112 80,083 76,592 80,442 Depreciation of investment property (Note 38) 5,400 5,432 4,778 4,727 Depreciation of property, plant and equipment 716,810 720,170 902,084 894,565 Amortisation of intangible assets (Note 40) 296,636 233,382 315,839 249,478 Amortisation of leasehold property 108,150 125,272 108,150 127,652 Provision for operational risk event losses 11,315 243,214 11,315 243,214 Advertising and related expenses 273,886 350,151 353,627 398,469 Donations 1,160 23,901 2,059 24,228 Debenture issue expenses 9,898 22,342 9,898 22,342 Direct operating expenses on investment property 3,142 4,312 9,163 11,616 Net claims incurred - - 1,573,104 1,568,210 Change in contract liabilities - Life fund - - 1,192,273 724,829 Deposit insurance premium 378,545 335,730 378,545 335,730 Crop insurance levy 81,831 56,628 84,774 60,437 Office administration and establishment expenses 5,092,105 4,919,161 4,932,339 4,633,987 Other overhead expenses 834,164 906,068 1,086,278 1,147,948 7,971,000 8,108,508 11,132,010 10,616,021
Notes to theFinancial Statements

Annual Report 2014 259
Bank Group For the year ended 31st December 2014 2013 2014 2013 Restated
Rs 000 Rs 000 Rs 000 Rs 000
18 OTHER EXPENSES (Contd.)18 (a) Auditors’ Remuneration
Audit fees and expenses 9,850 8,932 14,458 10,761 Audit related fee and expenses 1,440 4,318 2,279 5,434 Non-audit expenses 2,890 1,316 2,890 1,316 14,180 14,566 19,627 17,511
19 VALUE ADDED TAX (VAT) AND NATION BUILDING TAX (NBT) ON FINANCIAL SERVICESValue added tax on financial services 2,149,971 1,659,755 2,191,591 1,659,755Nation building tax on financial services 351,905 - 358,656 - 2,501,876 1,659,755 2,550,247 1,659,755
20 SHARE OF PROFITS OF ASSOCIATE AND JOINT VENTURE (NET OF INCOME TAX)Share of profits of associate before income tax 2,148 5,196 Income tax on share of operating results of associate (485) (573)Share of profits of associate (net of income tax) (Note 35) 1,663 4,623
Share of profit of joint venture before income tax 176,347 119,686Income tax on share of operating results of joint venture (35,033) (26,111)Share of profit of joint venture (net of income tax) [Note 36 (b)] 141,314 93,575Share of profit of associate and joint venture (net of income tax) 142,977 98,198
21 INCOME TAX EXPENSE 21 (a) Current Tax Expense
Current tax on profit for the year 2,980,204 4,763,601 3,051,825 4,798,743Under / (over) provision in previous years (361,267) 112,891 (361,267) 113,719 2,618,937 4,876,492 2,690,558 4,912,462
21 (b) Deferred Tax Expense Recognition of deferred tax liability [Note 48 (a) i and 48 (a) ii] 278,032 155,512 311,743 192,311 Recognition / (reversal) of deferred tax asset [Note 48 (b)] 161,686 (2,034,449) 78,059 (2,034,447) 439,718 (1,878,937) 389,802 (1,842,136)Total income tax expense [Note 21 (d)] 3,058,655 2,997,555 3,080,360 3,070,326
Effective tax rate 25.35% 29.95% 23.43% 28.30%Effective tax rate (excluding deferred tax) 21.71% 48.73% 20.46% 45.28%
21 (c) Current Tax on Profit for the year - Subsidiaries HNB Assurance PLC 12,012 35,151Prime Grameen Micro Finance Ltd 59,609 -Total 71,621 35,151
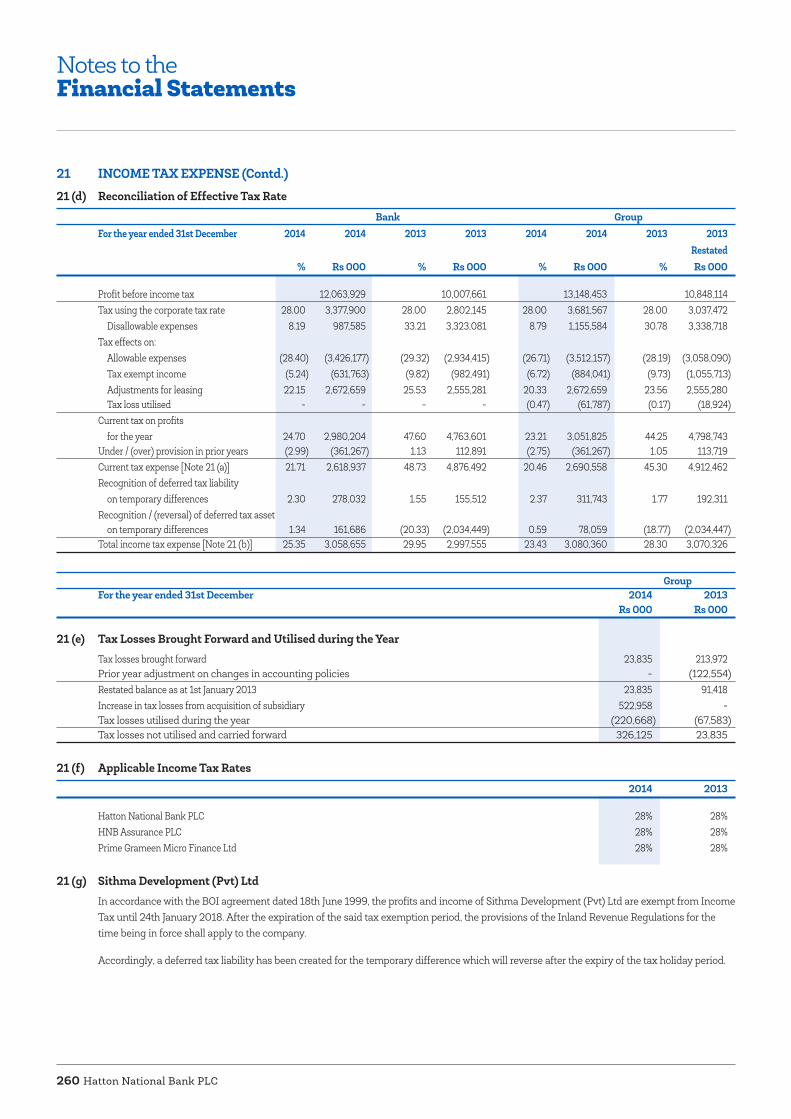
Hatton National Bank PLC260
21 INCOME TAX EXPENSE (Contd.)21 (d) Reconciliation of Effective Tax Rate
Bank Group For the year ended 31st December 2014 2014 2013 2013 2014 2014 2013 2013 Restated
% Rs 000 % Rs 000 % Rs 000 % Rs 000
Profit before income tax 12,063,929 10,007,661 13,148,453 10,848,114 Tax using the corporate tax rate 28.00 3,377,900 28.00 2,802,145 28.00 3,681,567 28.00 3,037,472 Disallowable expenses 8.19 987,585 33.21 3,323,081 8.79 1,155,584 30.78 3,338,718Tax effects on: Allowable expenses (28.40) (3,426,177) (29.32) (2,934,415) (26.71) (3,512,157) (28.19) (3,058,090) Tax exempt income (5.24) (631,763) (9.82) (982,491) (6.72) (884,041) (9.73) (1,055,713) Adjustments for leasing 22.15 2,672,659 25.53 2,555,281 20.33 2,672,659 23.56 2,555,280 Tax loss utilised - - - - (0.47) (61,787) (0.17) (18,924)Current tax on profits for the year 24.70 2,980,204 47.60 4,763,601 23.21 3,051,825 44.25 4,798,743 Under / (over) provision in prior years (2.99) (361,267) 1.13 112,891 (2.75) (361,267) 1.05 113,719 Current tax expense [Note 21 (a)] 21.71 2,618,937 48.73 4,876,492 20.46 2,690,558 45.30 4,912,462 Recognition of deferred tax liability on temporary differences 2.30 278,032 1.55 155,512 2.37 311,743 1.77 192,311 Recognition / (reversal) of deferred tax asset on temporary differences 1.34 161,686 (20.33) (2,034,449) 0.59 78,059 (18.77) (2,034,447)Total income tax expense [Note 21 (b)] 25.35 3,058,655 29.95 2,997,555 23.43 3,080,360 28.30 3,070,326
Group For the year ended 31st December 2014 2013
Rs 000 Rs 000
21 (e) Tax Losses Brought Forward and Utilised during the YearTax losses brought forward 23,835 213,972 Prior year adjustment on changes in accounting policies - (122,554)Restated balance as at 1st January 2013 23,835 91,418 Increase in tax losses from acquisition of subsidiary 522,958 -Tax losses utilised during the year (220,668) (67,583)Tax losses not utilised and carried forward 326,125 23,835
21 (f) Applicable Income Tax Rates
2014 2013
Hatton National Bank PLC 28% 28%HNB Assurance PLC 28% 28%Prime Grameen Micro Finance Ltd 28% 28%
21 (g) Sithma Development (Pvt) Ltd In accordance with the BOI agreement dated 18th June 1999, the profits and income of Sithma Development (Pvt) Ltd are exempt from Income Tax until 24th January 2018. After the expiration of the said tax exemption period, the provisions of the Inland Revenue Regulations for the time being in force shall apply to the company.
Accordingly, a deferred tax liability has been created for the temporary difference which will reverse after the expiry of the tax holiday period.
Notes to theFinancial Statements

Annual Report 2014 261
22 EARNINGS PER SHARE 22 (a) Basic Earnings per Share
Basic Earnings per Share (Basic EPS) has been calculated by dividing the profit for the year attributable to equity holders of the Bank by the weighted average number of ordinary shares outstanding (both voting and non-voting) during the year, as per Sri Lanka Accounting Standard (LKAS 33) “Earnings per Share”.
Bank Group 2014 2013 2014 2013
Amount used as the numerator Profit attributable to equity holders of the Bank (Rs 000) 9,005,274 7,010,106 9,819,596 7,650,466
Number of ordinary shares used as the denominator Weighted average number of ordinary shares outstanding during the year used as the denominator for basic EPS (‘000) 400,798 398,450 400,798 398,450Basic earnings per ordinary share (Rs) 22.47 17.59 24.50 19.20
22 (b) Diluted Earnings per ShareDiluted Earnings per Share (Diluted EPS) as at the reporting date was calculated by dividing the profit attributable to equity holders of the Bank by the weighted average number of ordinary shares outstanding during the year, after adjusting for the effects of all potentially dilutive weighted average number of ordinary shares that would be issued on the conversion of all the dilutive ESOPs into ordinary shares.
The details of the options granted, exercised and expired under Employee Share Option Plan during the year are given in Note 54 (c) i.
Bank Group 2014 2013 2014 2013
Amount used as the numerator Profit attributable to equity holders of the Bank (Rs 000) 9,005,274 7,010,106 9,819,596 7,650,466
Number of ordinary shares used as the denominatorWeighted average number of ordinary shares outstanding during the year used as the denominator for Basic EPS (‘000) 400,798 398,450 400,798 398,450
Effect of dilution:Weighted average number of potential ordinary shares 8,773 9,736 8,773 9,736 outstanding under ESOP (‘000)Weighted average number of potential ordinary shares that would have been issued at average market price (‘000) (7,007) (8,649) (7,007) (8,649)Weighted average number of potential ordinary shares that would have been issued for no consideration under ESOP 1,766 1,087 1,766 1,087Weighted average number of ordinary shares outstanding during the year used as the denominator for Diluted EPS (‘000) 402,564 399,537 402,564 399,537Diluted earnings per ordinary share (Rs) 22.37 17.55 24.39 19.15

Hatton National Bank PLC262
23 DIVIDENDS PAID AND PROPOSED 2014 2013
Gross Dividend Net Gross Dividend Net Dividend Tax Dividend Dividend Tax Dividend
Rs 000 Rs 000 Rs 000 Rs 000 Rs 000 Rs 000
Interim dividends paid Rs 1.50 cash dividend per share declared and paid in 2013 - - - 599,332 26,270 573,062Rs 1.50 cash dividend per share declared and paid in 2014 602,939 26,496 576,443 - - -Final dividends paid Rs 7.00 cash dividend per share declared in 2012 and paid in 2013 - - - 2,782,814 266,831 2,515,983Rs 7.00 cash dividend per share declared in 2013 and paid in 2014 2,800,912 277,092 2,523,820 - - - Total dividends paid 3,403,851 303,588 3,100,263 3,382,146 293,101 3,089,045
23 (a) Proposed DividendsThe Directors recommend that a final cash dividend of Rs 7 per share (2013 : Rs 7.00 per share) on both voting and non-voting shares of the Bank, be paid for the financial year ended 31st December 2014.
Further this dividend is to be approved at the Annual General Meeting to be held on 30th March 2015. In accordance with Sri Lanka Accounting Standard (LKAS 10), “Events after the reporting period”, this proposed final dividend has not been recognised as a liability as at 31st December 2014. Under the Inland Revenue Act No 10 of 2006, a withholding tax of 10% has been imposed on dividends declared. An interim dividend of Rs 1.50 per share (2013 : Rs 1.50) was paid to the shareholders on 12th December 2014. Final dividends proposed for the year 2014 amounts to Rs 2,818.18 Mn (2013 : Rs 2,800.91 Mn).
24 ANALYSIS OF FINANCIAL INSTRUMENTS BY MEASUREMENT BASIS The carrying amounts of financial instruments by category as defined in Sri Lanka Accounting Standard (LKAS 39) - “Financial Instruments - Recognition and Measurement” under headings of the statement of financial position are summarised below.
24 (a) Analysis of Financial Instruments by Measurement Basis - Bank As at 31st December 2014
Held for Amortised Available Total Trading Cost for Sale Carrying Amount
Rs 000 Rs 000 Rs 000 Rs 000
Assets Cash and cash equivalents - 13,141,295 - 13,141,295 Balances with Central Bank of Sri Lanka - 16,907,538 - 16,907,538 Placements with banks - 3,789,538 - 3,789,538 Reverse repurchase agreements - 16,930,572 - 16,930,572 Derivative financial instruments 178,370 - - 178,370 Other financial assets held for trading 551,371 - - 551,371 Loans and receivables to customers - 395,699,387 - 395,699,387 Financial investments - Available-for-sale - - 67,842,229 67,842,229 Financial investments - Loans and receivables - 36,166,064 - 36,166,064 Other assets 1,954,191 1,954,191 Total financial assets 729,741 484,588,585 67,842,229 553,160,555
Notes to theFinancial Statements

Annual Report 2014 263
24 ANALYSIS OF FINANCIAL INSTRUMENTS BY MEASUREMENT BASIS (Contd.)
24 (a) Analysis of Financial Instruments by Measurement Basis - Bank (Contd.) As at 31st December 2014
Held for Amortised Available Total Trading Cost for Sale Carrying Amount
Rs 000 Rs 000 Rs 000 Rs 000
Liabilities Due to banks - 43,428,762 - 43,428,762 Derivative financial instruments 630,598 - - 630,598 Securities sold under repurchase agreements - 16,983,545 - 16,983,545 Due to customers - 419,327,123 - 419,327,123 Other borrowings - 4,345,285 - 4,345,285 Debt securities issued - 4,451,407 - 4,451,407 Subordinated term debts - 11,653,759 - 11,653,759 Dividends payable - 587,078 - 587,078 Other liabilities - 373,925 - 373,925 Total financial liabilities 630,598 501,150,884 - 501,781,482
As at 31st December 2013
Held for Amortised Available Total Trading Cost for Sale Carrying Amount
Rs 000 Rs 000 Rs 000 Rs 000
Assets Cash and cash equivalents - 11,624,645 - 11,624,645 Balances with Central Bank of Sri Lanka - 16,366,368 - 16,366,368 Placements with banks - 1,246,612 - 1,246,612 Reverse repurchase agreements - 6,278,832 - 6,278,832 Derivative financial instruments 174,573 - - 174,573 Other financial assets held for trading 652,312 - - 652,312 Loans and receivables to customers - 351,965,376 - 351,965,376 Financial investments - Available-for-sale - - 63,391,086 63,391,086 Financial investments - Loans and receivables - 33,104,536 - 33,104,536 Other assets - 481,422 - 481,422 Total financial assets 826,885 421,067,791 63,391,086 485,285,762
Liabilities Due to banks - 34,934,218 - 34,934,218 Derivative financial instruments 748,962 - - 748,962 Securities sold under repurchase agreements - 4,132,602 - 4,132,602 Due to customers - 387,158,390 - 387,158,390 Other borrowings - 4,530,499 - 4,530,499 Debt securities issued - 1,418,775 - 1,418,775 Subordinated term debts - 11,856,561 - 11,856,561 Dividends payable - 426,347 - 426,347 Other liabilities - 422,607 - 422,607 Total financial liabilities 748,962 444,879,999 - 445,628,961
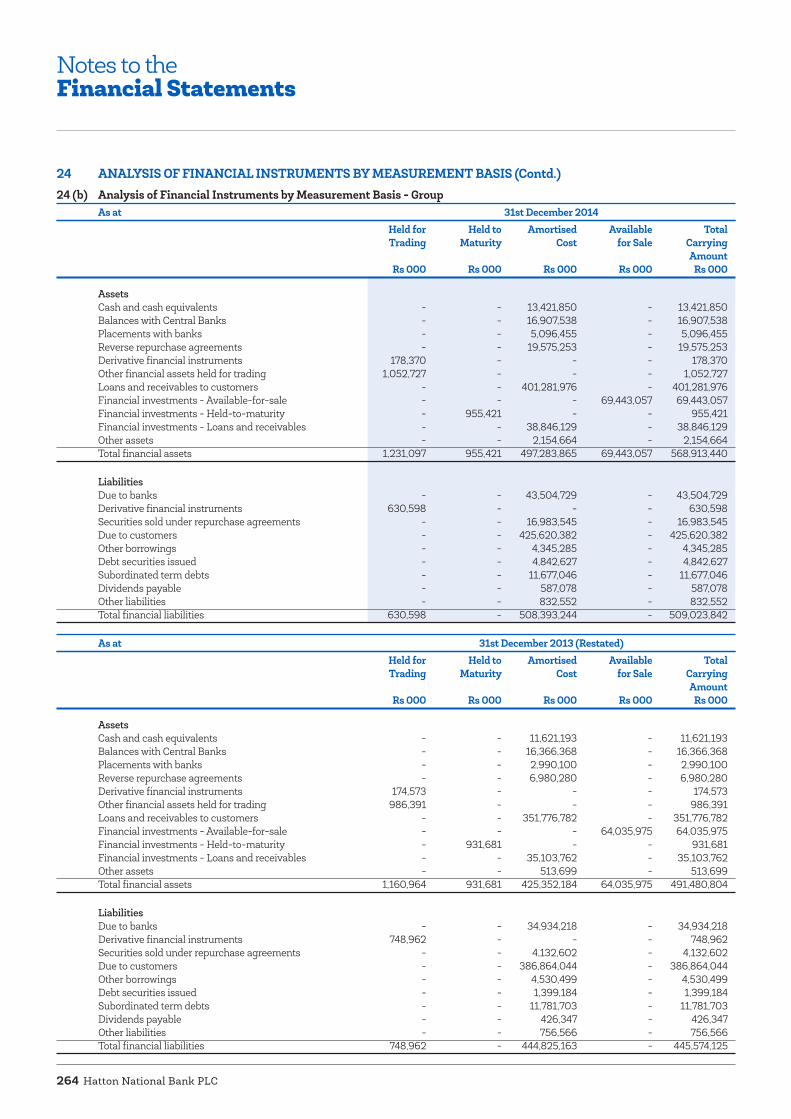
Hatton National Bank PLC264
24 ANALYSIS OF FINANCIAL INSTRUMENTS BY MEASUREMENT BASIS (Contd.)24 (b) Analysis of Financial Instruments by Measurement Basis - Group
As at 31st December 2014 Held for Held to Amortised Available Total Trading Maturity Cost for Sale Carrying Amount
Rs 000 Rs 000 Rs 000 Rs 000 Rs 000
Assets Cash and cash equivalents - - 13,421,850 - 13,421,850 Balances with Central Banks - - 16,907,538 - 16,907,538 Placements with banks - - 5,096,455 - 5,096,455 Reverse repurchase agreements - - 19,575,253 - 19,575,253 Derivative financial instruments 178,370 - - - 178,370 Other financial assets held for trading 1,052,727 - - - 1,052,727 Loans and receivables to customers - - 401,281,976 - 401,281,976 Financial investments - Available-for-sale - - - 69,443,057 69,443,057 Financial investments - Held-to-maturity - 955,421 - - 955,421 Financial investments - Loans and receivables - - 38,846,129 - 38,846,129 Other assets - - 2,154,664 - 2,154,664 Total financial assets 1,231,097 955,421 497,283,865 69,443,057 568,913,440
Liabilities Due to banks - - 43,504,729 - 43,504,729 Derivative financial instruments 630,598 - - - 630,598 Securities sold under repurchase agreements - - 16,983,545 - 16,983,545 Due to customers - - 425,620,382 - 425,620,382 Other borrowings - - 4,345,285 - 4,345,285 Debt securities issued - - 4,842,627 - 4,842,627 Subordinated term debts - - 11,677,046 - 11,677,046 Dividends payable - - 587,078 - 587,078 Other liabilities - - 832,552 - 832,552 Total financial liabilities 630,598 - 508,393,244 - 509,023,842
As at 31st December 2013 (Restated) Held for Held to Amortised Available Total Trading Maturity Cost for Sale Carrying Amount
Rs 000 Rs 000 Rs 000 Rs 000 Rs 000
Assets Cash and cash equivalents - - 11,621,193 - 11,621,193 Balances with Central Banks - - 16,366,368 - 16,366,368 Placements with banks - - 2,990,100 - 2,990,100 Reverse repurchase agreements - - 6,980,280 - 6,980,280 Derivative financial instruments 174,573 - - - 174,573 Other financial assets held for trading 986,391 - - - 986,391 Loans and receivables to customers - - 351,776,782 - 351,776,782 Financial investments - Available-for-sale - - - 64,035,975 64,035,975 Financial investments - Held-to-maturity - 931,681 - - 931,681 Financial investments - Loans and receivables - - 35,103,762 - 35,103,762 Other assets - - 513,699 - 513,699 Total financial assets 1,160,964 931,681 425,352,184 64,035,975 491,480,804
Liabilities Due to banks - - 34,934,218 - 34,934,218 Derivative financial instruments 748,962 - - - 748,962 Securities sold under repurchase agreements - - 4,132,602 - 4,132,602 Due to customers - - 386,864,044 - 386,864,044 Other borrowings - - 4,530,499 - 4,530,499 Debt securities issued - - 1,399,184 - 1,399,184 Subordinated term debts - - 11,781,703 - 11,781,703 Dividends payable - - 426,347 - 426,347 Other liabilities - - 756,566 - 756,566 Total financial liabilities 748,962 - 444,825,163 - 445,574,125
Notes to theFinancial Statements
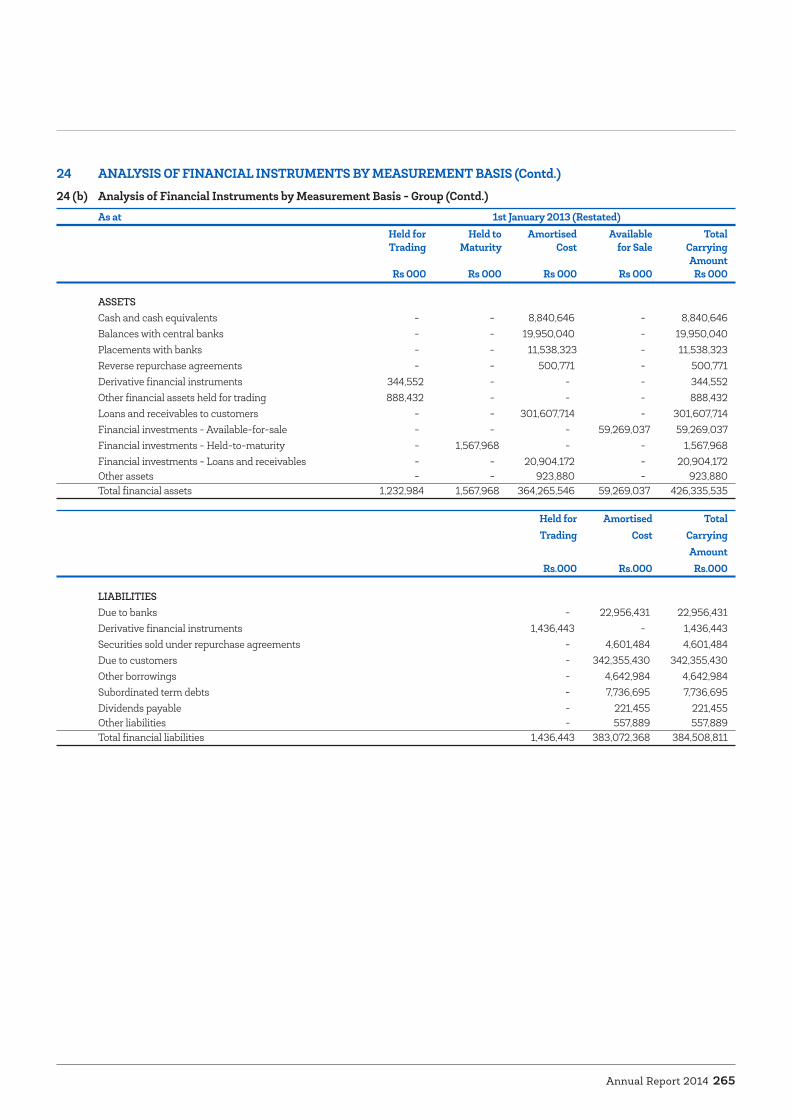
Annual Report 2014 265
24 ANALYSIS OF FINANCIAL INSTRUMENTS BY MEASUREMENT BASIS (Contd.)24 (b) Analysis of Financial Instruments by Measurement Basis - Group (Contd.)
As at 1st January 2013 (Restated) Held for Held to Amortised Available Total Trading Maturity Cost for Sale Carrying Amount
Rs 000 Rs 000 Rs 000 Rs 000 Rs 000
ASSETS Cash and cash equivalents - - 8,840,646 - 8,840,646 Balances with central banks - - 19,950,040 - 19,950,040 Placements with banks - - 11,538,323 - 11,538,323 Reverse repurchase agreements - - 500,771 - 500,771 Derivative financial instruments 344,552 - - - 344,552 Other financial assets held for trading 888,432 - - - 888,432 Loans and receivables to customers - - 301,607,714 - 301,607,714 Financial investments - Available-for-sale - - - 59,269,037 59,269,037 Financial investments - Held-to-maturity - 1,567,968 - - 1,567,968 Financial investments - Loans and receivables - - 20,904,172 - 20,904,172 Other assets - - 923,880 - 923,880 Total financial assets 1,232,984 1,567,968 364,265,546 59,269,037 426,335,535
Held for Amortised Total Trading Cost Carrying Amount
Rs.000 Rs.000 Rs.000
LIABILITIES Due to banks - 22,956,431 22,956,431 Derivative financial instruments 1,436,443 - 1,436,443 Securities sold under repurchase agreements - 4,601,484 4,601,484 Due to customers - 342,355,430 342,355,430 Other borrowings - 4,642,984 4,642,984 Subordinated term debts - 7,736,695 7,736,695 Dividends payable - 221,455 221,455 Other liabilities - 557,889 557,889 Total financial liabilities 1,436,443 383,072,368 384,508,811

Hatton National Bank PLC266
25 CASH AND CASH EQUIVALENTS Bank Group
As at 31st 31st 31st 31st 1st December December December December January 2014 2013 2014 2013 2013 Restated Restated
Rs 000 Rs 000 Rs 000 Rs 000 Rs 000
Local currency in hand 11,560,814 10,136,170 11,580,610 10,137,177 7,767,989 Foreign currency in hand 484,835 698,795 484,835 698,795 610,628 Balances with banks 1,095,646 789,680 1,356,405 785,221 462,029 13,141,295 11,624,645 13,421,850 11,621,193 8,840,646
All cash and cash equivalent balances held by the Group entities were available for use by the Group.
26 BALANCES WITH CENTRAL BANKS Bank Group
As at 31st 31st 31st 31st 1st December December December December January 2014 2013 2014 2013 2013 Restated Restated
Rs 000 Rs 000 Rs 000 Rs 000 Rs 000
Statutory balance with Central Bank of Sri Lanka 16,907,538 16,366,368 16,907,538 16,366,368 19,933,463 Statutory balance with Central Bank of Oman - - - - 16,577 16,907,538 16,366,368 16,907,538 16,366,368 19,950,040
As required by the provisions of Section 93 of the Monetary Law Act, a cash balance is maintained with the Central Bank of Sri Lanka as explained in Note 3.3.3 (f) The minimum cash reserve requirement on rupee deposit liabilities was 6% as at 31st December 2014 (2013 : 6%).
There are no reserve requirements for deposit liabilities of the Foreign Currency Banking Unit and foreign currency deposits liabilities in the Domestic Banking Unit.
Bank GroupAs at 31st 31st 31st 31st 1st December December December December January 2014 2013 2014 2013 2013 Restated Restated
Rs 000 Rs 000 Rs 000 Rs 000 Rs 000
27 PLACEMENTS WITH BANKS Placements - within Sri Lanka 3,285,708 1,000,000 4,592,625 2,743,488 10,571,945Placements - outside Sri Lanka 503,830 246,612 503,830 246,612 966,378 3,789,538 1,246,612 5,096,455 2,990,100 11,538,323
Notes to theFinancial Statements

Annual Report 2014 267
28 DERIVATIVE FINANCIAL INSTRUMENTS Bank Group
As at 31st 31st 31st 31st December December December December 2014 2013 2014 2013 Restated
Rs 000 Rs 000 Rs 000 Rs 000
Foreign currency derivatives Currency swaps Sales 2,133 - 2,133 - Purchases 21,267 39,059 21,267 39,059 Forward foreign exchange contracts Sales 152,175 84,671 152,175 84,671 Purchases 2,795 50,843 2,795 50,843 178,370 174,573 178,370 174,573
29 OTHER FINANCIAL ASSETS HELD FOR TRADING As at Fair Value Fair Value Fair Value 31st December 31st December 1st January 2014 2013 2013 Restated Restated
Rs 000 Rs 000 Rs 000
Quoted shares - Bank [Note 29 (a)] 544,283 303,992 452,847Government of Sri Lanka treasury bills - Bank [Note 29 (b)] 5,404 346,739 19,790Government of Sri Lanka treasury bonds - Bank [Note 29 (c)] 1,684 1,581 1,446Total other financial assets held for trading - Bank 551,371 652,312 474,083
Quoted shares - Subsidiaries [Note 29 (d)] 245,741 195,143 215,668Government of Sri Lanka treasury bonds - Subsidiaries [Note 29 (e)] 15,683 - 51,290Quoted units in unit trusts - Subsidiaries [Note 29 (f)] 10,307 7,608 7,550Unquoted units in unit trusts - Subsidiaries [Note 29 (g)] 229,625 131,328 139,841Total other financial assets held for trading - Subsidiaries 501,356 334,079 414,349Total other financial assets held for trading - Group 1,052,727 986,391 888,432

Hatton National Bank PLC268
29 (a) Quoted Shares Held by the Bank As at 31st December 2014 31st December 2013 No of Cost of % of Fair No of Cost of % of Fair Ordinary Investment Total Value Ordinary Investment Total Value
Shares Rs 000 Cost Rs 000 Shares Rs 000 Cost Rs 000
Banks, Finance and Insurance Ceylinco Insurance PLC - - - - 15,600 10,128 2.85 20,904National Development Bank PLC 250,000 65,925 11.91 62,500 270,000 48,934 13.78 43,335Nations Trust Bank PLC 294,354 28,700 5.19 28,552 346,800 19,833 5.58 21,571Peoples Leasing and Finance PLC 1,000,000 21,000 3.79 24,500 - - - - Sampath Bank PLC 263,634 65,487 11.82 62,297 263,634 59,745 16.82 45,319Singer Finance (Lanka) PLC - - - - 1,000,004 13,807 3.89 11,700Beverage, Food and Tobacco Cargills (Ceylon) PLC 73,982 12,207 2.20 11,319 - - - - Distilleries Company of Sri Lanka PLC 190,019 40,896 7.38 39,904 100,019 18,714 5.27 19,304Chemicals and Pharmaceuticals Chemical Industries (Colombo) PLC 676,396 58,170 10.50 57,494 - - - - Construction and Engineering Access Engineering PLC 1,528,500 50,529 9.12 49,065 - - - - Diversified Holdings Aitken Spence PLC 150,030 16,385 2.96 15,528 348,000 57,764 16.26 35,600Ceylon Theatres PLC 25,000 4,013 0.72 3,575 - - - - Hayleys PLC - - - - 63,969 23,807 6.7 18,743John Keells Holdings PLC 198,762 50,307 9.08 49,691 5,230 1,102 0.31 1,189Sunshine Holdings PLC 669,661 31,809 5.74 36,162 694,661 20,737 5.84 19,450Footwear and Textiles Hayleys Mgt Knitting Mills PLC 82,657 1,496 0.27 1,438 - - - - Hotels and Travels Ahot Properties 207,476 14,918 2.69 14,067 - - - - Aitken Spence Hotel Holdings PLC 425,301 36,139 6.52 33,386 225,301 16,952 4.77 15,748Asian Hotels & Properties PLC - - - - 202,476 14,714 4.14 12,999Manufacturing Ceylon Grain Elevators PLC 651,844 28,681 5.18 26,726 - - - - Motors United Motors PLC 187,643 19,796 3.57 19,440 233,409 26,825 7.55 26,539Power & Energy Vallibel Power Erathna PLC 1,200,000 7,515 1.36 8,639 1,998,409 22,157 6.24 11,591Total 8,075,259 553,973 100 544,283 5,767,512 355,219 100 303,992 Unrealised loss from marked to market valuation (9,690) (51,227) Total quoted shares - Bank 544,283 544,283 303,992 303,992
Notes to theFinancial Statements

Annual Report 2014 269
29 OTHER FINANCIAL ASSETS HELD FOR TRADING (Contd.)
29 (b) Government of Sri Lanka Treasury Bills Held by the Bank As at 31st December 2014 31st December 2013 Cost of Fair Cost of Fair Investment Value Investment Value Rs 000 Rs 000 Rs 000 Rs 000 Face Value Year of Carrying Maturity Value (Rs 000)
Rs 5 Mn 2015 5,404 5,408 5,404 345,047 346,739Unrealised gain / (loss) from marked to market valuation (4) 1,692Total Government of Sri Lanka treasury bills - Bank 5,404 5,404 346,739 346,739
29 (c) Government of Sri Lanka Treasury Bonds Held by the BankAs at 31st December 2014 31st December 2013 Cost of Fair Cost of Fair Investment Value Investment Value Rs 000 Rs 000 Rs 000 Rs 000 Face Value Year of Carrying Maturity Value (Rs 000)
Rs 2 Mn 2015 1,684 1,675 1,684 1,492 1,581Unrealised gain from marked to market valuation 9 89Total Government of Sri Lanka treasury bonds - Bank 1,684 1,684 1,581 1,581
29 (d) Quoted Shares Held by Subsidiaries
As at 31st December 2014 31st December 2013 1st January 2013No of
Ordinary Shares
Cost of Investment
Rs 000
% of Total Cost
Fair Value
Rs 000
No of Ordinary
Shares
Cost of Investment
Rs 000
% of Total Cost
Fair Value
Rs 000
No of Ordinary
Shares
Cost of Investment
Rs 000
% of Total Cost
Fair Value
Rs 000
Commercial Bank of Ceylon PLC - - - 34,627 4,132 1.72 4,169 147,164 17,921 6.57 15,158 Hemas Holdings PLC 71,700 3,331 1.64 5,327 321,000 14,106 5.86 10,914 321,000 14,106 5.17 8,667 John Keells Holdings PLC 47,494 10,185 5.01 11,874 91,794 18,335 7.62 20,865 87,556 17,827 6.54 19,254 John Keells Holdings PLC - Warrants 2015 - - - 4,078 - - 326 - - - John Keells Holdings PLC - Warrants 2016 - - - 4,078 - - 385 - - - Dialog Axiata PLC - - - - - - - 217,500 5,243 1.92 1,805 National Development Bank PLC 78,200 9,519 4.68 19,550 78,200 9,519 3.96 12,551 78,200 9,519 3.49 10,784 John Keells Hotels PLC - - - 92,700 1,564 0.65 1,159 92,700 1,564 0.57 1,279 Royal Ceramic Lanka PLC 128,000 19,819 9.75 14,963 183,000 26,095 10.84 15,482 183,000 26,095 9.57 18,117 ACL Cables PLC 50,000 3,555 1.75 3,820 50,000 3,555 1.48 3,245 50,000 3,555 1.30 3,370 Dipped Products PLC - - - 19,500 1,829 0.76 1,755 19,500 1,829 0.67 2,145 Peoples Leasing & Finance PLC 912,800 16,430 8.08 22,364 932,800 16,790 6.98 12,500 1,162,800 20,930 7.68 15,349 DFCC Bank 30,000 3,765 1.85 6,570 30,000 3,436 1.43 3,870 43,000 5,390 1.98 4,855 Seylan Bank PLC - (Non Voting) 390,283 14,636 7.20 22,441 410,283 15,445 6.42 12,719 399,999 15,445 5.66 14,040 Palm Garden Hotels PLC 23,000 4,537 2.23 1,840 23,000 4,537 1.89 1,440 23,000 4,537 1.66 3,220 The Lighthouse Hotel PLC - - - 21,400 1,433 0.60 942 21,400 1,433 0.53 1,136 Sampath Bank PLC 78,422 17,088 8.40 18,531 78,422 17,088 7.10 13,481 76,125 17,088 6.27 15,263

Hatton National Bank PLC270
29 OTHER FINANCIAL ASSETS HELD FOR TRADING (Contd.)29 (d) Quoted Shares Held by the Subsidiaries (Contd.)
29 (e) Government of Sri Lanka Treasury Bonds Held by Subsidiaries
As at 31st December 2014 31st December 2013 1st January 2013Face Value Year of Carrying Cost of Fair Cost of Fair Cost of Fair
Maturity Value (Rs 000)
Investment Value Investment Value Investment ValueRs 000 Rs 000 Rs 000 Rs 000 Rs 000 Rs 000
Rs 16 Mn 2021 15,683 16,370 15,683 - - 51,199 51,290Unrealised gain / (loss) Mn from marked to market valuation (687) - - - 91 Total Government of Sri Lanka treasury bonds - Subsidiaries 15,683 15,683 - - 51,290 51,290
29 (f) Quoted Units in Unit Trusts Held by Subsidiaries
As at 31st December 2014 31st December 2013 1st January 2013No. of Cost of Fair No. of Cost of Fair No. of Cost of Fair Units Investment Value Units Investment Value Units Investment Value
Rs 000 Rs 000 Rs 000 Rs 000 Rs 000 Rs 000
Namal Acuity Value Fund 114,400 7,203 10,307 114,400 7,203 7,608 114,400 7,203 7,550Unrealised gain from marked to market valuation 3,104 405 347Total quoted units - Subsidiaries 10,307 10,307 7,608 7,608 7,550 7,550
As at 31st December 2014 31st December 2013 1st January 2013No of
Ordinary Shares
Cost of Investment
Rs 000
% of Total Cost
Fair Value
Rs 000
No of Ordinary
Shares
Cost of Investment
Rs 000
% of Total Cost
Fair Value
Rs 000
No of Ordinary
Shares
Cost of Investment
Rs 000
% of Total Cost
Fair Value
Rs 000
Nations Trust Bank PLC 253,261 17,120 8.42 24,566 275,000 18,229 7.57 17,105 275,000 18,229 6.69 15,400 Richard Pieris and Company PLC 962,851 13,457 6.62 8,184 1,375,000 17,228 7.16 8,663 1,375,000 17,228 6.32 10,725 CIC Holdings PLC 185,000 15,731 7.74 15,725 95,000 9,603 3.99 4,551 95,000 9,603 3.52 6,109 Distilleries Company of Sri Lanka PLC 60,000 10,648 5.24 12,600 60,000 10,648 4.42 11,580 60,000 10,648 3.90 9,960 Haycarb PLC 20,500 3,547 1.74 3,547 20,500 3,547 1.47 3,891 20,500 3,547 1.30 3,508 Tokyo Cement Company (Lanka) PLC 461,359 20,177 9.92 29,942 443,202 19,402 8.06 12,631 402,912 19,402 7.12 11,523 Kelani Cables PLC 44,300 5,035 2.48 3,960 44,300 5,035 2.09 3,279 44,300 5,035 1.85 3,105 Laugfs Gas PLC - (Voting Shares) - - - - 135,000 6,114 2.54 3,834 175,000 7,927 2.91 4,480 Renuka Holdings PLC - - - - 50,877 2,121 0.88 1,557 50,877 2,121 0.78 1,837 Textured Jersey Lanka PLC - - - - - - - - 428,500 6,428 2.36 3,814 PC House PLC - - - - - - - - 82,820 911 0.33 447 Dolphin Hotels PLC 19,500 1,829 0.90 2,789 59,900 2,196 0.91 2,690 149,900 5,506 2.02 5,471 Vallibel One PLC 375,000 6,764 3.33 8,963 375,000 6,766 2.81 6,185 - - - - Access Engineering PLC 255,000 6,163 3.03 8,185 - - - - - - - Chevron Lubricants Lanka PLC - - - - 12,599 1,899 0.79 3,374 24,000 3,617 1.33 4,847 Total 4,446,670 203,336 100 245,741 5,321,260 240,652 100 195,143 6,106,753 272,684 100 215,668 Unrealised gain /(loss) from marked to market valuation - 42,405 - - - (45,509) - - - (57,016) - -Total quoted shares - Subsidiaries - 245,741 - 245,741 - 195,143 - 195,143 - 215,668 - 215,668
Notes to theFinancial Statements
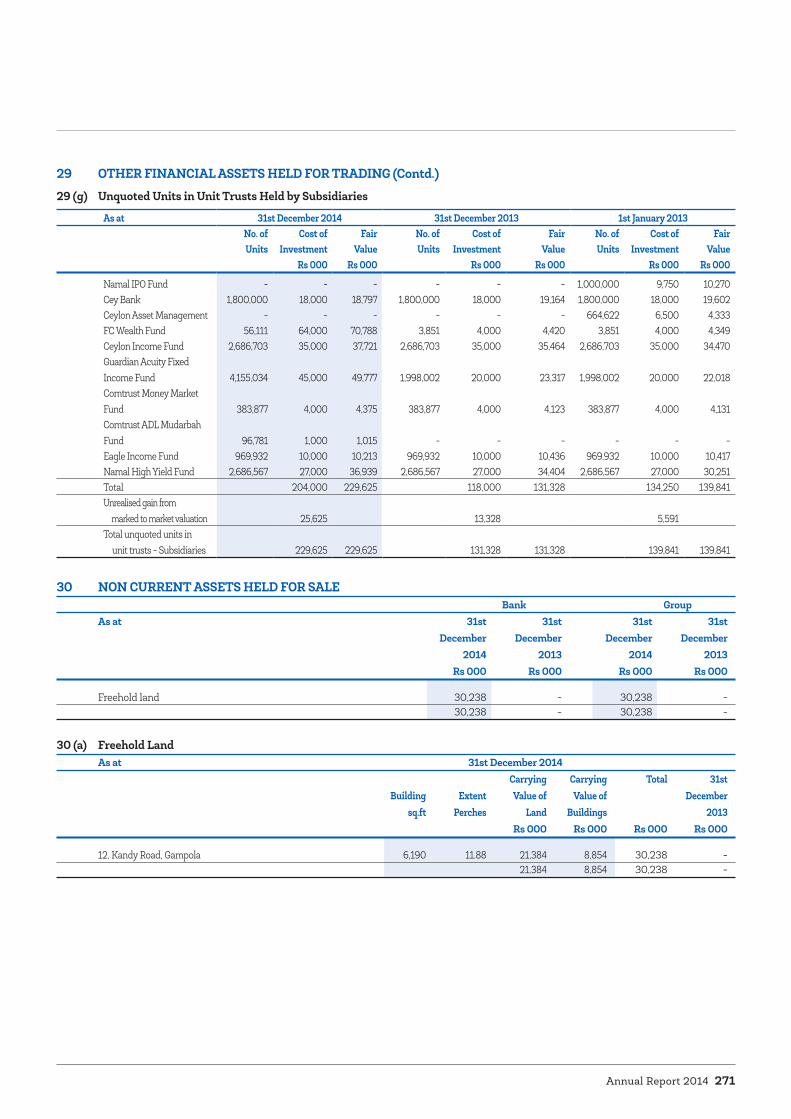
Annual Report 2014 271
29 OTHER FINANCIAL ASSETS HELD FOR TRADING (Contd.)29 (g) Unquoted Units in Unit Trusts Held by Subsidiaries
As at 31st December 2014 31st December 2013 1st January 2013No. of Cost of Fair No. of Cost of Fair No. of Cost of Fair Units Investment Value Units Investment Value Units Investment Value
Rs 000 Rs 000 Rs 000 Rs 000 Rs 000 Rs 000
Namal IPO Fund - - - - - - 1,000,000 9,750 10,270 Cey Bank 1,800,000 18,000 18,797 1,800,000 18,000 19,164 1,800,000 18,000 19,602 Ceylon Asset Management - - - - - - 664,622 6,500 4,333 FC Wealth Fund 56,111 64,000 70,788 3,851 4,000 4,420 3,851 4,000 4,349 Ceylon Income Fund 2,686,703 35,000 37,721 2,686,703 35,000 35,464 2,686,703 35,000 34,470 Guardian Acuity Fixed Income Fund 4,155,034 45,000 49,777 1,998,002 20,000 23,317 1,998,002 20,000 22,018 Comtrust Money Market Fund 383,877 4,000 4,375 383,877 4,000 4,123 383,877 4,000 4,131 Comtrust ADL Mudarbah Fund 96,781 1,000 1,015 - - - - - -Eagle Income Fund 969,932 10,000 10,213 969,932 10,000 10,436 969,932 10,000 10,417 Namal High Yield Fund 2,686,567 27,000 36,939 2,686,567 27,000 34,404 2,686,567 27,000 30,251 Total 204,000 229,625 118,000 131,328 134,250 139,841Unrealised gain from marked to market valuation 25,625 13,328 5,591 Total unquoted units in unit trusts - Subsidiaries 229,625 229,625 131,328 131,328 139,841 139,841
30 NON CURRENT ASSETS HELD FOR SALE Bank Group
As at 31st 31st 31st 31st December December December December 2014 2013 2014 2013
Rs 000 Rs 000 Rs 000 Rs 000
Freehold land 30,238 - 30,238 - 30,238 - 30,238 -
30 (a) Freehold LandAs at 31st December 2014 Carrying Carrying Total 31st Building Extent Value of Value of December sq.ft Perches Land Buildings 2013
Rs 000 Rs 000 Rs 000 Rs 000
12, Kandy Road, Gampola 6,190 11.88 21,384 8,854 30,238 - 21,384 8,854 30,238 -
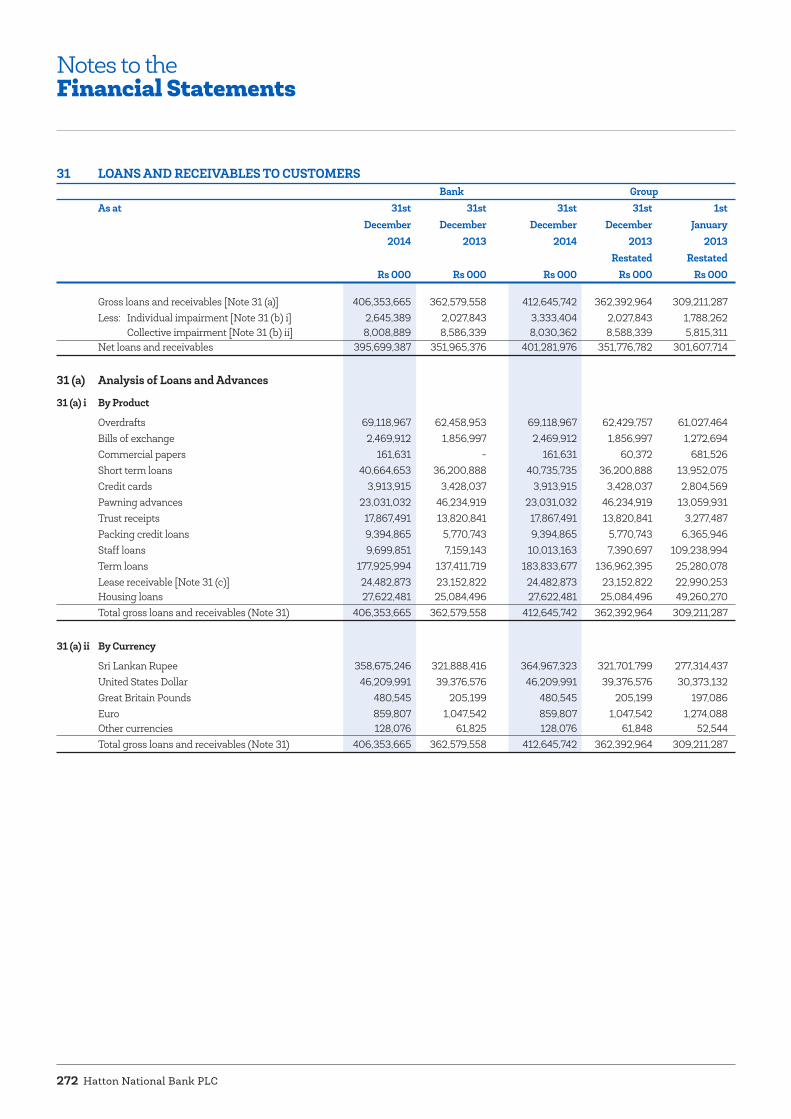
Hatton National Bank PLC272
31 LOANS AND RECEIVABLES TO CUSTOMERS Bank Group
As at 31st 31st 31st 31st 1st December December December December January 2014 2013 2014 2013 2013 Restated Restated
Rs 000 Rs 000 Rs 000 Rs 000 Rs 000
Gross loans and receivables [Note 31 (a)] 406,353,665 362,579,558 412,645,742 362,392,964 309,211,287Less: Individual impairment [Note 31 (b) i] 2,645,389 2,027,843 3,333,404 2,027,843 1,788,262 Collective impairment [Note 31 (b) ii] 8,008,889 8,586,339 8,030,362 8,588,339 5,815,311Net loans and receivables 395,699,387 351,965,376 401,281,976 351,776,782 301,607,714
31 (a) Analysis of Loans and Advances
31 (a) i By Product
Overdrafts 69,118,967 62,458,953 69,118,967 62,429,757 61,027,464Bills of exchange 2,469,912 1,856,997 2,469,912 1,856,997 1,272,694Commercial papers 161,631 - 161,631 60,372 681,526Short term loans 40,664,653 36,200,888 40,735,735 36,200,888 13,952,075Credit cards 3,913,915 3,428,037 3,913,915 3,428,037 2,804,569Pawning advances 23,031,032 46,234,919 23,031,032 46,234,919 13,059,931Trust receipts 17,867,491 13,820,841 17,867,491 13,820,841 3,277,487Packing credit loans 9,394,865 5,770,743 9,394,865 5,770,743 6,365,946Staff loans 9,699,851 7,159,143 10,013,163 7,390,697 109,238,994Term loans 177,925,994 137,411,719 183,833,677 136,962,395 25,280,078Lease receivable [Note 31 (c)] 24,482,873 23,152,822 24,482,873 23,152,822 22,990,253Housing loans 27,622,481 25,084,496 27,622,481 25,084,496 49,260,270Total gross loans and receivables (Note 31) 406,353,665 362,579,558 412,645,742 362,392,964 309,211,287
31 (a) ii By Currency
Sri Lankan Rupee 358,675,246 321,888,416 364,967,323 321,701,799 277,314,437United States Dollar 46,209,991 39,376,576 46,209,991 39,376,576 30,373,132Great Britain Pounds 480,545 205,199 480,545 205,199 197,086Euro 859,807 1,047,542 859,807 1,047,542 1,274,088Other currencies 128,076 61,825 128,076 61,848 52,544Total gross loans and receivables (Note 31) 406,353,665 362,579,558 412,645,742 362,392,964 309,211,287
Notes to theFinancial Statements

Annual Report 2014 273
31 LOANS AND RECEIVABLES TO CUSTOMERS (Contd.)31 (b) Movement in Allowance for Impairment Losses
31 (b) i Movement in Individual Impairment Allowance for Loans and Advances Bank Group
2014 2013 2014 2013 Rs 000 Rs 000 Rs 000 Rs 000
Balance as at 1st January 2,027,843 1,788,262 2,027,843 1,788,262Increase in individual impairment allowance from acquisition of subsidiary - - 680,187 -Net impairment charge for the year 499,299 171,439 507,127 171,439 Interest accrued on impaired loans and receivables 118,247 68,142 118,247 68,142 Balance as at 31st December (Note 31) 2,645,389 2,027,843 3,333,404 2,027,843
31 (b) ii Movement in Collective Impairment Allowance for Loans and Advances Bank Group
2014 2013 2014 2013 Rs 000 Rs 000 Rs 000 Rs 000
Balance as at 1st January 8,586,339 5,815,311 8,588,339 5,815,311Increase in collective impairment allowance from acquisition of subsidiary - - 3,435 -Net impairment charge for the year 1,688,681 4,039,203 1,704,719 4,041,203Write-off during the year (2,266,131) (1,268,175) (2,266,131) (1,268,175)Balance as at 31st December (Note 31) 8,008,889 8,586,339 8,030,362 8,588,339
31 (b) iii Movement in Allowance for Impairment Losses - Product wise - Bank
2014 2013 Lease and Loans and Pawning Total Total Hire Purchases Receivables
Rs 000 Rs 000 Rs 000 Rs 000 Rs 000
Balance as at 1st January 546,730 9,189,245 878,207 10,614,182 7,603,573Net impairment charge for the year 11,632 718,278 1,458,069 2,187,979 4,210,642Amounts written off (17,107) (154,277) (2,094,747) (2,266,131) (1,268,175)Interest accrued on impaired loans and receivables - 118,247 - 118,247 68,142Balance as at 31st December 541,255 9,871,493 241,529 10,654,277 10,614,182
31 (b) iv Movement in Allowance for Impairment Losses - Product wise - Group
2014 2013 Lease and Loans and Pawning Total Total Hire Purchases Receivables
Rs 000 Rs 000 Rs 000 Rs 000 Rs 000
Balance as at 1st January 546,730 9,191,245 878,207 10,616,182 7,603,573 Increase in allowance for impairment losses from acquisition of subsidiary - 683,622 - 683,622 - Net impairment charge for the year 11,632 742,145 1,458,069 2,211,846 4,212,642 Amounts written off (17,107) (154,277) (2,094,747) (2,266,131) (1,268,175)Interest accrued on impaired loans and receivables - 118,247 - 118,247 68,142 Balance as at 31st December 541,255 10,580,982 241,529 11,363,766 10,616,182
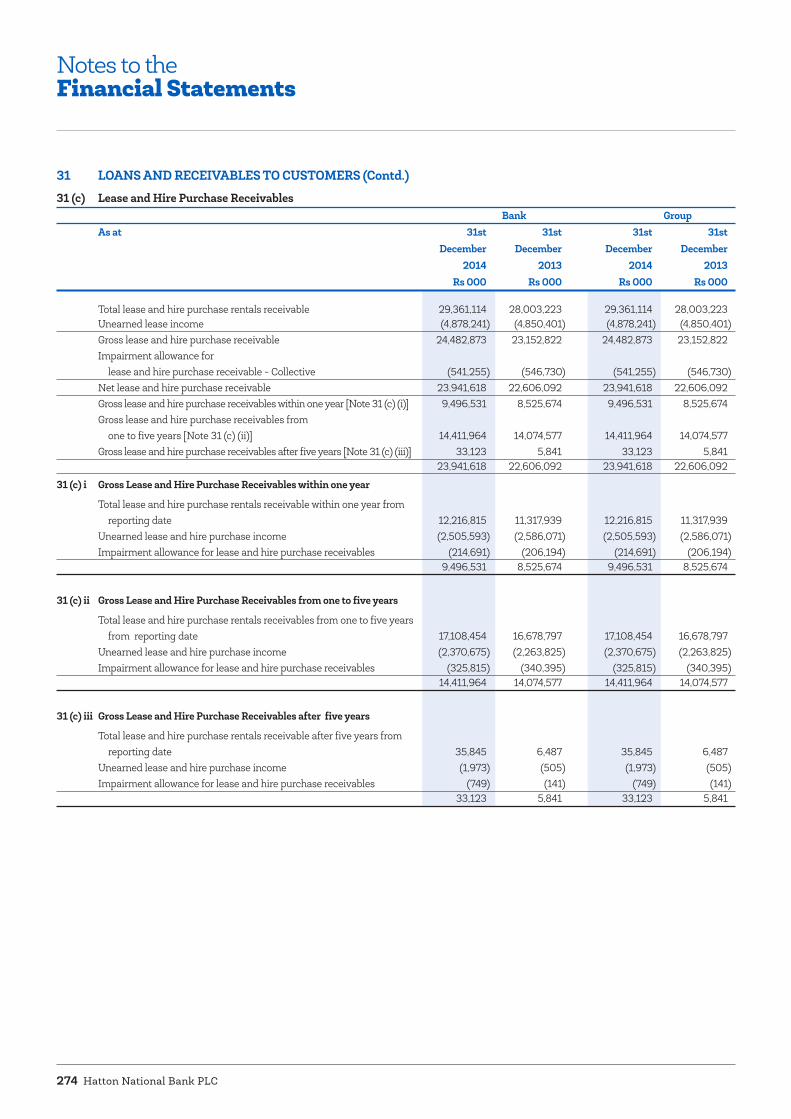
Hatton National Bank PLC274
31 LOANS AND RECEIVABLES TO CUSTOMERS (Contd.)31 (c) Lease and Hire Purchase Receivables Bank Group
As at 31st 31st 31st 31st December December December December 2014 2013 2014 2013
Rs 000 Rs 000 Rs 000 Rs 000
Total lease and hire purchase rentals receivable 29,361,114 28,003,223 29,361,114 28,003,223 Unearned lease income (4,878,241) (4,850,401) (4,878,241) (4,850,401)Gross lease and hire purchase receivable 24,482,873 23,152,822 24,482,873 23,152,822 Impairment allowance for lease and hire purchase receivable - Collective (541,255) (546,730) (541,255) (546,730)Net lease and hire purchase receivable 23,941,618 22,606,092 23,941,618 22,606,092 Gross lease and hire purchase receivables within one year [Note 31 (c) (i)] 9,496,531 8,525,674 9,496,531 8,525,674 Gross lease and hire purchase receivables from one to five years [Note 31 (c) (ii)] 14,411,964 14,074,577 14,411,964 14,074,577 Gross lease and hire purchase receivables after five years [Note 31 (c) (iii)] 33,123 5,841 33,123 5,841 23,941,618 22,606,092 23,941,618 22,606,092
31 (c) i Gross Lease and Hire Purchase Receivables within one year
Total lease and hire purchase rentals receivable within one year from reporting date 12,216,815 11,317,939 12,216,815 11,317,939 Unearned lease and hire purchase income (2,505,593) (2,586,071) (2,505,593) (2,586,071)Impairment allowance for lease and hire purchase receivables (214,691) (206,194) (214,691) (206,194) 9,496,531 8,525,674 9,496,531 8,525,674
31 (c) ii Gross Lease and Hire Purchase Receivables from one to five years
Total lease and hire purchase rentals receivables from one to five years from reporting date 17,108,454 16,678,797 17,108,454 16,678,797 Unearned lease and hire purchase income (2,370,675) (2,263,825) (2,370,675) (2,263,825)Impairment allowance for lease and hire purchase receivables (325,815) (340,395) (325,815) (340,395) 14,411,964 14,074,577 14,411,964 14,074,577
31 (c) iii Gross Lease and Hire Purchase Receivables after five years
Total lease and hire purchase rentals receivable after five years from reporting date 35,845 6,487 35,845 6,487 Unearned lease and hire purchase income (1,973) (505) (1,973) (505)Impairment allowance for lease and hire purchase receivables (749) (141) (749) (141) 33,123 5,841 33,123 5,841
Notes to theFinancial Statements

Annual Report 2014 275
32 FINANCIAL INVESTMENTS - AVAILABLE-FOR-SALEAs at Fair Value Fair Value Fair Value 31st December 31st December 1st January 2014 2013 2013 Restated Restated
Rs 000 Rs 000 Rs 000
Quoted shares - Bank [Note 32 (a)] 8,324,444 5,528,030 4,677,518Quoted units - Bank [Note 32 (b)] 270,300 199,500 198,000Unquoted shares - Bank [Note 32 (c)] 34,644 41,955 27,456Government of Sri Lanka treasury bonds - Bank [Note 32 (d)] 102,814 18,605,583 5,587,415Government of Sri Lanka treasury bills - Bank [Note 32 (e)] 59,110,027 39,016,018 47,804,967Total financial investments - Available-for-sale - Bank 67,842,229 63,391,086 58,295,356 Government of Sri Lanka treasury bonds - Subsidiaries [Note 32 (f)] 1,345,026 480,353 767,222 Government of Sri Lanka treasury bills - Subsidiaries [Note 32 (g)] 142,364 164,536 206,459 Quoted shares - Subsidiaries [Note 32 (h)] 113,204 - - Unquoted shares - Subsidiaries [Note 32 (i)] 234 - - Total financial investments - Available-for-sale - Subsidiaries 1,600,828 644,889 973,681 Total financial investments - Available-for-sale - Group 69,443,057 64,035,975 59,269,037
32 (a) Quoted Shares Held by the Bank As at 31st December 2014 31st December 2013 No of Cost of Fair No of Cost of Fair Ordinary Investment Value Ordinary Investment Value
Shares Rs 000 Rs 000 Shares Rs 000 Rs 000
DFCC Bank 32,396,140 942,651 7,094,755 32,396,140 942,651 4,195,300 National Development Bank PLC 4,282,200 694,519 1,070,550 4,282,200 694,519 687,293 Nations Trust Bank PLC 1,640,604 156,938 159,139 - - - Visa Inc. - - - 21,008 - 611,773 MasterCard Inc. - - - 3,081 - 33,664 Total quoted shares - Bank 1,794,108 8,324,444 1,637,170 5,528,030
32 (b) Quoted Units in Unit Trusts Held by the BankNamal Acuity Value Fund 3,000,000 150,000 270,300 3,000,000 150,000 199,500 Total quoted units in unit trusts - Bank 150,000 270,300 150,000 199,500
32 (c) Unquoted Shares Held by the BankAs at 31st December 2014 31st December 2013 No of Cost of Fair No of Cost of Fair Shares Investment Value Shares Investment Value
Rs 000 Rs 000 Rs 000 Rs 000
Credit Information Bureau of Sri Lanka 5,300 530 530 5,300 530 530 Fitch Ratings Lanka Ltd 62,500 625 625 62,500 625 625 Lanka Clear (Pvt) Ltd 2,200,000 22,000 22,000 2,200,000 22,000 22,000 Lanka Financial Services Bureau 225,000 2,250 2,250 225,000 2,250 2,250 Ram Ratings Lanka Ltd* 1,379,182 16,550 9,239 1,379,182 16,550 16,550 Magpek Exports Ltd** 359,000 14,360 - 359,000 14,360 -S.W.I.F.T* 21 2,051 - 21 2,051 - Allowance for impairment (23,722) (16,411) Total unquoted shares - Bank 34,644 34,644 41,955 41,955
* Directors carried out an impairment assessment of the unquoted share investments held by the Bank as at 31st December 2014 and concluded that an impairment provision of Rs. 7.31 Mn is to be made against the investment in Ram Ratings Lanka Ltd. (An impairment provision of Rs. 2.051 Mn has been made against the investment in S.W.I.F.T in 2013).
** Delisted shares

Hatton National Bank PLC276
32 FINANCIAL INVESTMENTS - AVAILABLE-FOR-SALE (Contd.)32 (d) Government of Sri Lanka Treasury Bonds Held by the Bank
As at 31st December 2014 31st December 2013Face Value Year of Carrying Cost of Fair Cost of Fair Maturity Value Investment Value Investment Value
Rs 000 Rs 000 Rs 000 Rs 000 Rs 000
Rs 100 Mn 2017 102,814 100,346 102,814 18,385,989 18,605,583Total Government of Sri Lanka treasury bonds - Bank 100,346 102,814 18,385,989 18,605,583
32 (e) Government of Sri Lanka Treasury Bills Held by the BankFace Value Year of Carrying Maturity Value
Rs 000
Rs 60,406 Mn 2015 59,110,027 58,967,053 59,110,027 38,762,150 39,016,018Total Government of Sri Lanka treasury bills - Bank 58,967,053 59,110,027 38,762,150 39,016,018
32 (f) Government of Sri Lanka Treasury Bonds Held by SubsidiariesAs at 31st December 2014 31st December 2013 1st January 2013 Face Value Year of Carrying Cost of Fair Cost of Fair Cost of Fair Maturity Value Investment Value Investment Value Investment Value
Rs 000 Rs 000 Rs 000 Rs 000 Rs 000 Rs 000 Rs 000
Rs. 100 Mn 2015 143,138 Rs. 150 Mn 2016 105,182 Rs. 100 Mn 2017 154,309 Rs. 147 Mn 2018 105,306 Rs. 100 Mn 2019 158,984 Rs. 50 Mn 2021 100,997 Rs. 275 Mn 2022 54,205 Rs. 50 Mn 2024 323,101 Rs. 100 Mn 2029 63,741 Rs. 100 Mn 2044 136,063 Total Government of Sri Lanka treasury bonds - Subsidiaries 1,276,830 1,345,026 464,080 480,353 742,269 767,222
32 (g) Government of Sri Lanka Treasury Bills Held by SubsidiariesAs at 31st December 2014 31st December 2013 1st January 2013 Face Value Year of Carrying Cost of Fair Cost of Fair Cost of Fair Maturity Value Investment Value Investment Value Investment Value
Rs 000 Rs 000 Rs 000 Rs 000 Rs 000 Rs 000 Rs 000
Rs. 145Mn 2015 142,364 135,467 142,364 162,541 164,536 205,170 206,459Total Government of Sri Lanka treasury bills - Subsidiaries 135,467 142,364 162,541 164,536 205,170 206,459
32 (h) Quoted Shares - SubsidiariesAs at 31st December 2014 No of Cost of Fair Shares Investment Value
Rs 000 Rs 000
Seylan Bank PLC - (Non Voting) 297,000 14,999 17,078 Tokyo Cement Company (Lanka) PLC 404,843 22,740 26,274 Royal Ceramics Lanka PLC 83,000 10,071 9,705 Vallibel One PLC 301,877 7,860 7,215 Lanka IOC PLC 345,000 20,004 20,700 Overseas Realty (Ceylon) PLC 544,669 13,602 14,325 Sampath Bank PLC 67,000 15,921 15,832 Distilleries Company of Sri Lanka PLC 9,883 2,059 2,075 Total quoted shares - Subsidiaries 107,256 113,204
Notes to theFinancial Statements

Annual Report 2014 277
32 FINANCIAL INVESTMENTS - AVAILABLE-FOR-SALE (Contd.)32 (i) Unquoted Shares - Subsidiaries
As at 31st December 2014 No of Cost of Fair Shares Investment Value
Rs 000 Rs 000
Credit Information Bureau of Sri Lanka 100 234 234Standard Credit Lanka (Formerly Ceylinco Investment and Reality Ltd) 38,458,474 38,692 - Allowance for impairment (38,692) Total unquoted shares - Subsidiaries 234 234
32 (j) Assets Pledged as Security The following amount of financial investments - Available-for-sale is pledged as security for re-purchase agreements entered into by the Bank / Group.
Bank GroupAs at 31st 31st 31st 31st December December December December 2014 2013 2014 2013 Restated
Rs 000 Rs 000 Rs 000 Rs 000
Treasury bills 16,848,705 4,016,567 16,848,705 4,016,567Treasury bonds 83,426 116,034 83,426 116,034 16,932,131 4,132,601 16,932,131 4,132,601
33 FINANCIAL INVESTMENTS - HELD-TO-MATURITY Group
As at 31st December 31st December 1st January 2014 2013 2013 Restated Restated
Rs 000 Rs 000 Rs 000
Government of Sri Lanka treasury bills - Subsidiaries [Note 33 (a)] 172,754 - 34,902Government of Sri Lanka treasury bonds - Subsidiaries [Note 33 (b)] 782,667 931,681 1,533,066Total financial investments - Held-to-maturity - Group 955,421 931,681 1,567,968
33 (a) Government of Sri Lanka Treasury Bills Held by Subsidiaries As at 31st December 2014 31st December 2013 1st January 2013 Face Value Year of Carrying Cost of Cost of Cost of Maturity Value Investment Investment Investment
Rs 000 Rs 000 Rs 000 Rs 000
Rs 175 Mn 2016 172,754 172,754 - 34,902Total Government of Sri Lanka treasury bills - Subsidiaries 172,754 - 34,902
33 (b) Government of Sri Lanka Treasury Bonds Held by SubsidiariesAs at 31st December 2014 31st December 2013 1st January 2013 Face Value Year of Carrying Cost of Cost of Cost of Maturity Value Investment Investment Investment
Rs 000 Rs 000 Rs 000 Rs 000
Rs 300 Mn 2016 298,502 Rs 310 Mn 2015 320,955 Rs 175 Mn 2018 163,210 Total Government of Sri Lanka treasury bonds - Subsidiaries 782,667 931,681 1,533,066
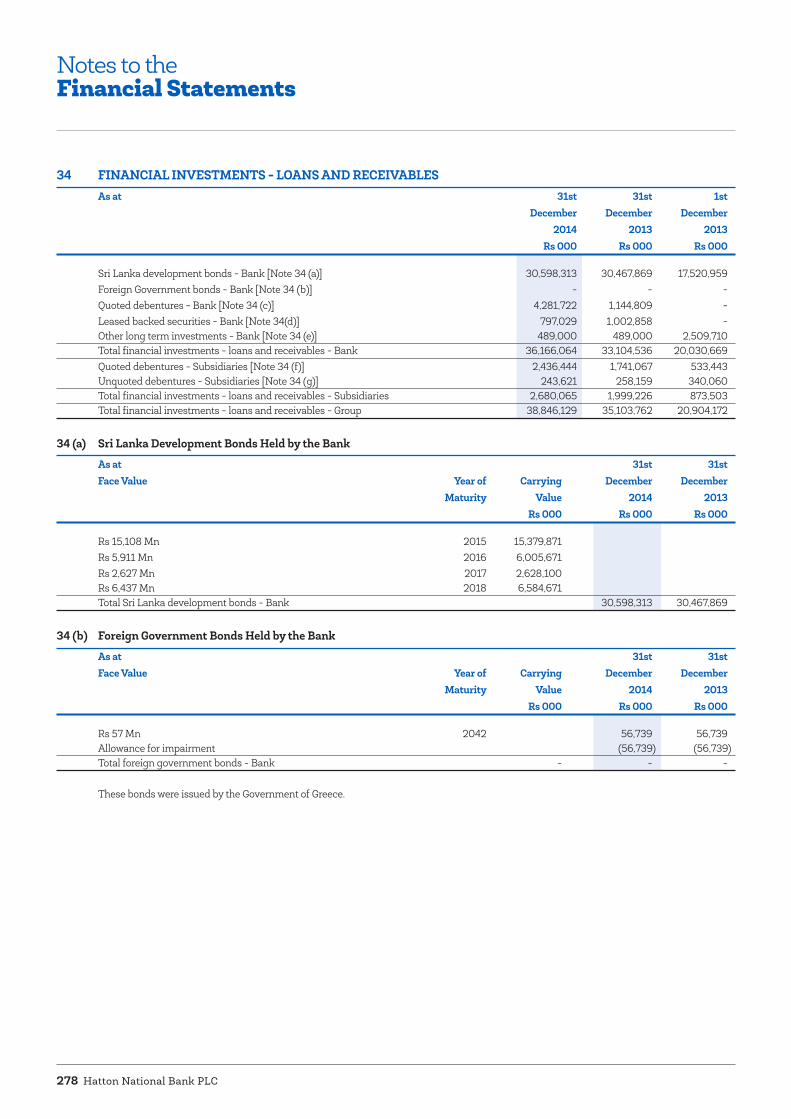
Hatton National Bank PLC278
34 FINANCIAL INVESTMENTS - LOANS AND RECEIVABLESAs at 31st 31st 1st December December December 2014 2013 2013
Rs 000 Rs 000 Rs 000
Sri Lanka development bonds - Bank [Note 34 (a)] 30,598,313 30,467,869 17,520,959 Foreign Government bonds - Bank [Note 34 (b)] - - - Quoted debentures - Bank [Note 34 (c)] 4,281,722 1,144,809 - Leased backed securities - Bank [Note 34(d)] 797,029 1,002,858 - Other long term investments - Bank [Note 34 (e)] 489,000 489,000 2,509,710 Total financial investments - loans and receivables - Bank 36,166,064 33,104,536 20,030,669 Quoted debentures - Subsidiaries [Note 34 (f)] 2,436,444 1,741,067 533,443 Unquoted debentures - Subsidiaries [Note 34 (g)] 243,621 258,159 340,060 Total financial investments - loans and receivables - Subsidiaries 2,680,065 1,999,226 873,503 Total financial investments - loans and receivables - Group 38,846,129 35,103,762 20,904,172
34 (a) Sri Lanka Development Bonds Held by the Bank
As at 31st 31st Face Value Year of Carrying December December Maturity Value 2014 2013
Rs 000 Rs 000 Rs 000
Rs 15,108 Mn 2015 15,379,871 Rs 5,911 Mn 2016 6,005,671 Rs 2,627 Mn 2017 2,628,100 Rs 6,437 Mn 2018 6,584,671 Total Sri Lanka development bonds - Bank 30,598,313 30,467,869
34 (b) Foreign Government Bonds Held by the Bank
As at 31st 31st Face Value Year of Carrying December December Maturity Value 2014 2013
Rs 000 Rs 000 Rs 000
Rs 57 Mn 2042 56,739 56,739Allowance for impairment (56,739) (56,739)Total foreign government bonds - Bank - - -
These bonds were issued by the Government of Greece.
Notes to theFinancial Statements
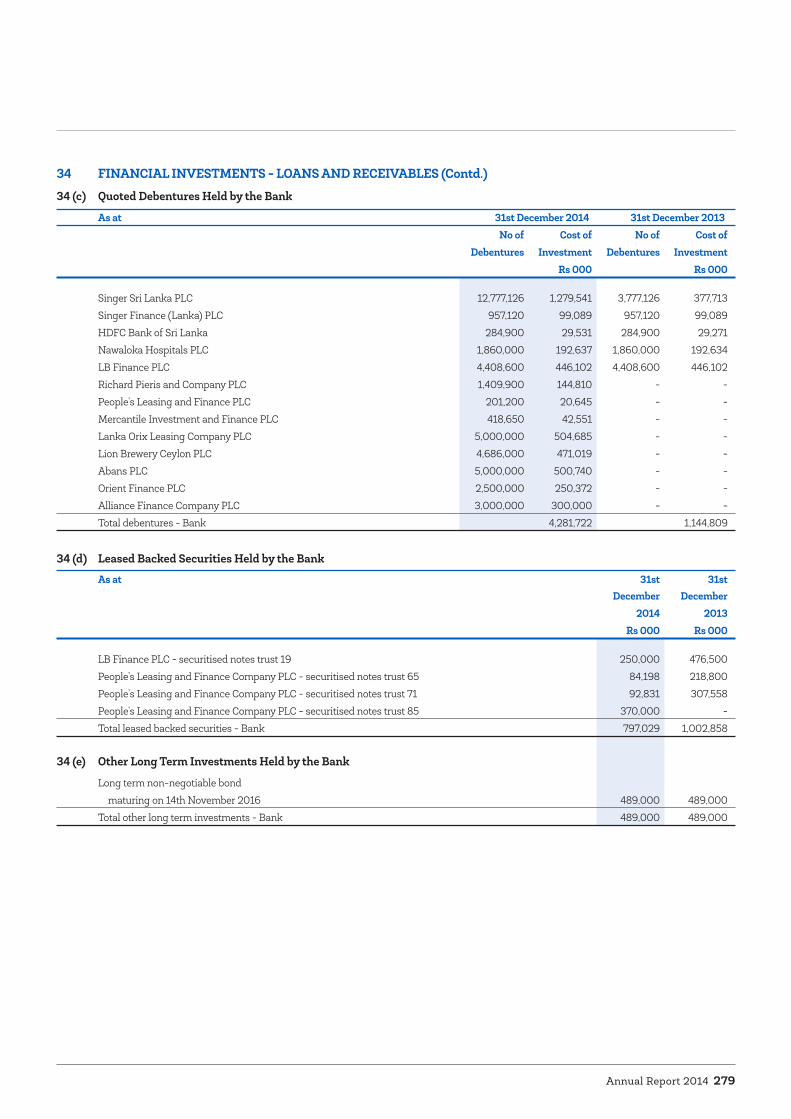
Annual Report 2014 279
34 FINANCIAL INVESTMENTS - LOANS AND RECEIVABLES (Contd.)34 (c) Quoted Debentures Held by the Bank
As at 31st December 2014 31st December 2013 No of Cost of No of Cost of Debentures Investment Debentures Investment
Rs 000 Rs 000
Singer Sri Lanka PLC 12,777,126 1,279,541 3,777,126 377,713Singer Finance (Lanka) PLC 957,120 99,089 957,120 99,089HDFC Bank of Sri Lanka 284,900 29,531 284,900 29,271Nawaloka Hospitals PLC 1,860,000 192,637 1,860,000 192,634LB Finance PLC 4,408,600 446,102 4,408,600 446,102Richard Pieris and Company PLC 1,409,900 144,810 - - People’s Leasing and Finance PLC 201,200 20,645 - - Mercantile Investment and Finance PLC 418,650 42,551 - - Lanka Orix Leasing Company PLC 5,000,000 504,685 - - Lion Brewery Ceylon PLC 4,686,000 471,019 - -Abans PLC 5,000,000 500,740 - -Orient Finance PLC 2,500,000 250,372 - -Alliance Finance Company PLC 3,000,000 300,000 - -Total debentures - Bank 4,281,722 1,144,809
34 (d) Leased Backed Securities Held by the Bank
As at 31st 31st December December 2014 2013
Rs 000 Rs 000
LB Finance PLC - securitised notes trust 19 250,000 476,500People’s Leasing and Finance Company PLC - securitised notes trust 65 84,198 218,800People’s Leasing and Finance Company PLC - securitised notes trust 71 92,831 307,558People’s Leasing and Finance Company PLC - securitised notes trust 85 370,000 -Total leased backed securities - Bank 797,029 1,002,858
34 (e) Other Long Term Investments Held by the Bank
Long term non-negotiable bond maturing on 14th November 2016 489,000 489,000Total other long term investments - Bank 489,000 489,000

Hatton National Bank PLC280
34 FINANCIAL INVESTMENTS - LOANS AND RECEIVABLES (Contd.)34 (f) Quoted Debentures Held by Subsidiaries
As at 31st December 2014 31st December 2013 1st January 2013 No of Cost of No of Cost of No of Cost of Debentures Investment Debentures Investment Debentures Investment
Rs 000 Rs 000 Rs 000
DFCC Bank 432,700 49,813 5,000 5,697 5,000 5,698 Lanka Orix Leasing Company PLC 1,300,000 135,419 750,000 79,475 750,000 79,475 Merchant Bank of Sri Lanka PLC 2,344,700 258,940 1,384,700 145,800 675,000 71,515 Sampath Bank PLC 1,396,500 149,439 1,160,800 121,611 283,100 29,334 Singer (Sri Lanka) PLC 1,022,170 103,910 752,170 77,121 302,170 30,217 Bank of Ceylon 1,740,000 179,634 1,600,000 163,655 1,800,000 183,039 Nations Trust Bank PLC 581,500 61,940 581,500 58,399 17,000 18,764 Urban Development Authority 1,124,200 115,401 1,124,200 115,401 1,124,200 115,401 LB Finance PLC 851,000 97,830 851,000 86,219 - - Lion Brewery (Ceylon) PLC 96,000 99,333 96,000 99,333 - - National Development Bank PLC 498,000 55,687 498,000 50,021 - - Nawaloka Hospitals PLC 550,000 56,940 550,000 56,962 - - People’s Leasing and Finance Company PLC 375,700 42,848 500,000 55,578 - - Seylan Bank PLC 1,700,000 182,077 1,200,000 135,899 - - Softlogic Holdings PLC 1,373,900 143,943 920,000 95,613 - - Hemas Holdings PLC 907,900 93,573 - - - - Richard Pieris and Company PLC 563,900 58,777 - - - - Abans PLC 1,850,000 195,114 1,400,000 140,605 - - Mercantile Investments And Finance PLC 114,100 11,594 - - - - Pan Asia Banking Corporation PLC 665,857 67,680 - - - - Siyapatha Finance Limited 1,000,000 100,171 - - - - HDFC Bank of Sri Lanka 798,900 89,313 798,900 82,178 - - Hayleys PLC 45,000 45,180 110,000 113,951 - - Central Finance Company PLC 40,400 41,888 55,500 57,549 - - Total quoted debentures - Subsidiaries 21,372,427 2,436,444 14,337,770 1,741,067 4,956,470 533,443
34 (g) Unquoted Debentures Held by Subsidiaries As at 31st December 2014 31st December 2013 1st January 2013 No of Cost of No of Cost of No of Cost of Debentures Investment Debentures Investment Debentures Investment
Rs 000 Rs 000 Rs 000
Abans (Pvt) Ltd 25,000 25,825 25,000 25,927 100,000 101,068 People’s Leasing and Finance Company PLC 750,000 75,587 750,000 79,424 750,000 75,000 National Development Bank PLC 40,000 40,000 40,000 40,100 40,000 41,233 Singer (Sri Lanka) PLC 490,000 50,269 490,000 50,269 490,000 50,248 Siyapatha Finance PLC 364,000 51,940 377,500 62,439 385,000 72,511 Total unquoted debentures - Subsidiaries 243,621 258,159 340,060
Notes to theFinancial Statements
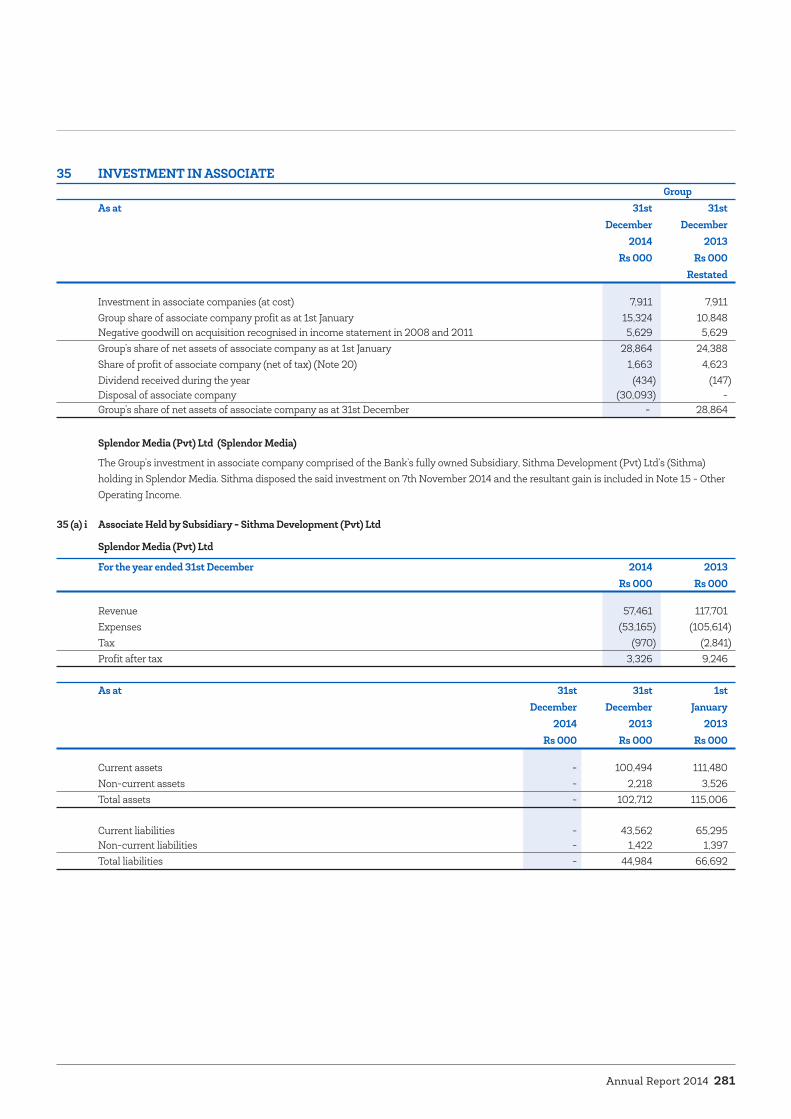
Annual Report 2014 281
35 INVESTMENT IN ASSOCIATE Group
As at 31st 31st December December 2014 2013 Rs 000 Rs 000
Restated
Investment in associate companies (at cost) 7,911 7,911 Group share of associate company profit as at 1st January 15,324 10,848 Negative goodwill on acquisition recognised in income statement in 2008 and 2011 5,629 5,629 Group’s share of net assets of associate company as at 1st January 28,864 24,388 Share of profit of associate company (net of tax) (Note 20) 1,663 4,623 Dividend received during the year (434) (147)Disposal of associate company (30,093) - Group’s share of net assets of associate company as at 31st December - 28,864
Splendor Media (Pvt) Ltd (Splendor Media)
The Group’s investment in associate company comprised of the Bank’s fully owned Subsidiary, Sithma Development (Pvt) Ltd’s (Sithma) holding in Splendor Media. Sithma disposed the said investment on 7th November 2014 and the resultant gain is included in Note 15 - Other Operating Income.
35 (a) i Associate Held by Subsidiary - Sithma Development (Pvt) Ltd
Splendor Media (Pvt) Ltd
For the year ended 31st December 2014 2013 Rs 000 Rs 000
Revenue 57,461 117,701Expenses (53,165) (105,614)Tax (970) (2,841)Profit after tax 3,326 9,246
As at 31st 31st 1st December December January 2014 2013 2013
Rs 000 Rs 000 Rs 000
Current assets - 100,494 111,480Non-current assets - 2,218 3,526Total assets - 102,712 115,006
Current liabilities - 43,562 65,295Non-current liabilities - 1,422 1,397Total liabilities - 44,984 66,692
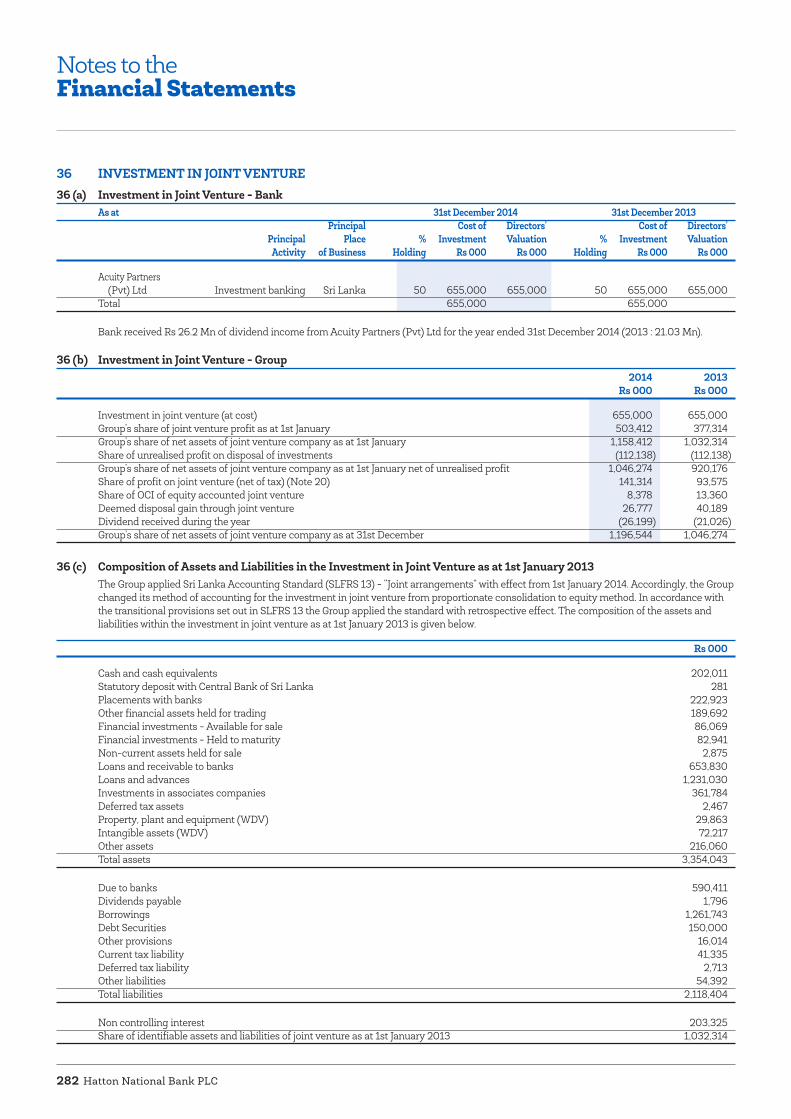
Hatton National Bank PLC282
36 INVESTMENT IN JOINT VENTURE36 (a) Investment in Joint Venture - Bank
As at 31st December 2014 31st December 2013 Principal Cost of Directors’ Cost of Directors’ Principal Place % Investment Valuation % Investment Valuation
Activity of Business Holding Rs 000 Rs 000 Holding Rs 000 Rs 000
Acuity Partners (Pvt) Ltd Investment banking Sri Lanka 50 655,000 655,000 50 655,000 655,000Total 655,000 655,000
Bank received Rs 26.2 Mn of dividend income from Acuity Partners (Pvt) Ltd for the year ended 31st December 2014 (2013 : 21.03 Mn).
36 (b) Investment in Joint Venture - Group 2014 2013
Rs 000 Rs 000
Investment in joint venture (at cost) 655,000 655,000 Group’s share of joint venture profit as at 1st January 503,412 377,314 Group’s share of net assets of joint venture company as at 1st January 1,158,412 1,032,314 Share of unrealised profit on disposal of investments (112,138) (112,138)Group’s share of net assets of joint venture company as at 1st January net of unrealised profit 1,046,274 920,176Share of profit on joint venture (net of tax) (Note 20) 141,314 93,575 Share of OCI of equity accounted joint venture 8,378 13,360 Deemed disposal gain through joint venture 26,777 40,189 Dividend received during the year (26,199) (21,026)Group’s share of net assets of joint venture company as at 31st December 1,196,544 1,046,274
36 (c) Composition of Assets and Liabilities in the Investment in Joint Venture as at 1st January 2013The Group applied Sri Lanka Accounting Standard (SLFRS 13) - “Joint arrangements” with effect from 1st January 2014. Accordingly, the Group changed its method of accounting for the investment in joint venture from proportionate consolidation to equity method. In accordance with the transitional provisions set out in SLFRS 13 the Group applied the standard with retrospective effect. The composition of the assets and liabilities within the investment in joint venture as at 1st January 2013 is given below.
Rs 000
Cash and cash equivalents 202,011 Statutory deposit with Central Bank of Sri Lanka 281 Placements with banks 222,923 Other financial assets held for trading 189,692 Financial investments - Available for sale 86,069 Financial investments - Held to maturity 82,941 Non-current assets held for sale 2,875 Loans and receivable to banks 653,830 Loans and advances 1,231,030 Investments in associates companies 361,784 Deferred tax assets 2,467 Property, plant and equipment (WDV) 29,863 Intangible assets (WDV) 72,217 Other assets 216,060 Total assets 3,354,043
Due to banks 590,411 Dividends payable 1,796 Borrowings 1,261,743 Debt Securities 150,000 Other provisions 16,014 Current tax liability 41,335 Deferred tax liability 2,713 Other liabilities 54,392 Total liabilities 2,118,404
Non controlling interest 203,325 Share of identifiable assets and liabilities of joint venture as at 1st January 2013 1,032,314
Notes to theFinancial Statements

Annual Report 2014 283
36 INVESTMENT IN JOINT VENTURE (Contd.)36 (d) Summarised Financial Statements of Joint Venture - Acuity Partners (Pvt) Ltd
For the year ended 31st December 2014 2013 Rs 000 Rs 000
Revenue 916,313 583,650Profit after tax 448,246 241,982Other comprehensive income 19,345 40,699Total comprehensive income 467,591 282,681
As at 31st 31st 1st December December January
2014 2013 2013 Rs 000 Rs 000 Rs 000
Current assets 7,000,804 5,727,237 5,436,304Non current assets 3,299,730 2,143,016 1,513,627Current liabilities 5,915,668 4,414,520 3,720,387Non current liabilities 575,605 514,691 716,145
37 INVESTMENT IN SUBSIDIARIES37 (a) Quoted
As at 31st December 2014 31st December 2013 Principal Cost of Directors’ Cost of Directors’ Principal Place % Investment Valuation % Investment Valuation
Activity of Business Holding Rs 000 Rs 000 Holding Rs 000 Rs 000
HNB Assurance PLC (29,993,000 shares) Insurance Sri Lanka 60.00 384,285 2,504,416 60.00 384,285 1,574,633Total quoted subsidiaries 384,285 384,285
37 (b) Unquoted As at 31st December 2014 31st December 2013 Principal Cost of Directors’ Cost of Directors’ Principal Place % Investment Valuation % Investment Valuation
Activity of Business Holding Rs 000 Rs 000 Holding Rs 000 Rs 000
Sithma Development (Pvt) Ltd Property Sri Lanka 100.00 1,973,000 1,973,000 100.00 1,973,000 1,973,000 (206,000,000 ordinary shares) developmentPrime Grameen Micro Finance Limited Micro-finance Sri Lanka 42.16 660,000 660,000 - - - (724,904,118 ordinary shares)Total unquoted subsidiaries 2,633,000 1,973,000Total for the Bank [37 (a) and 37 (b)] 3,017,285 2,357,285
Prime Grameen Micro Finance Limited
On 7th November 2014, the Bank acquired a stake of 51% in the voting rights of Prime Grameen Micro Finance Limited. Accordingly the said investment is accounted for as an investment in subsidiaries as at 31st December 2014. However, Bank’s holding in the said company amounts to 42.16%.
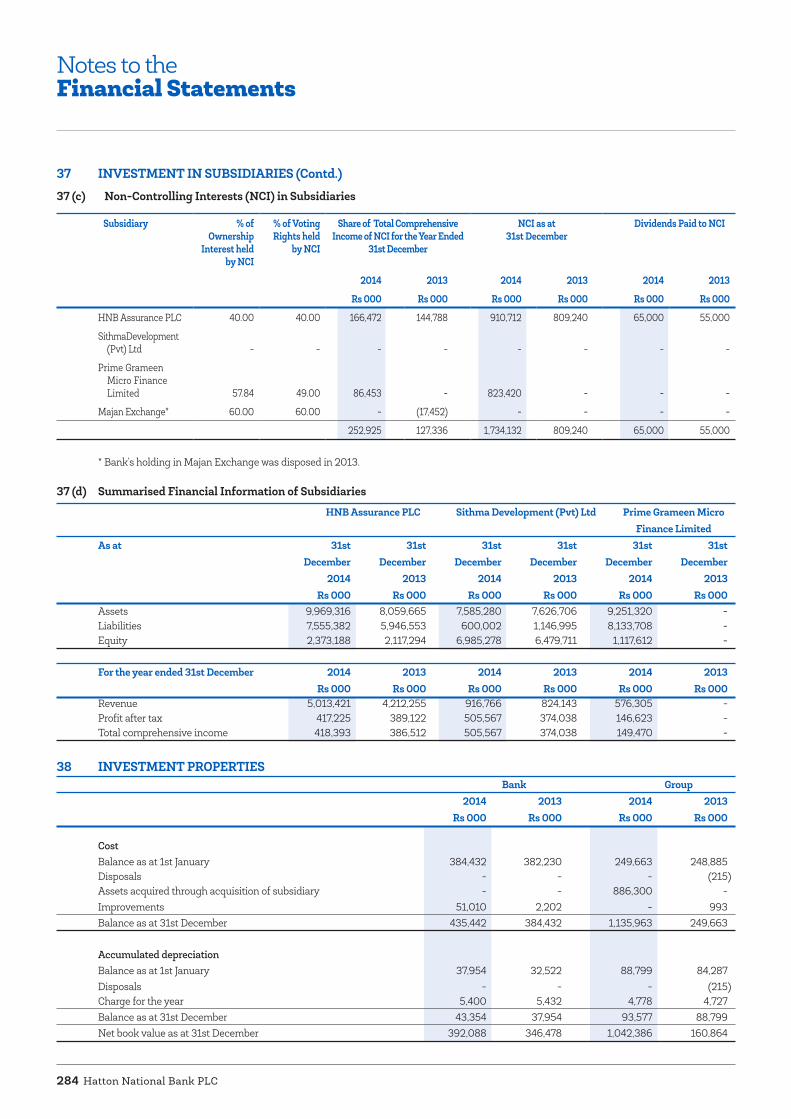
Hatton National Bank PLC284
37 INVESTMENT IN SUBSIDIARIES (Contd.)37 (c) Non-Controlling Interests (NCI) in Subsidiaries
Subsidiary % of Ownership
Interest held by NCI
% of Voting Rights held
by NCI
Share of Total Comprehensive Income of NCI for the Year Ended
31st December
NCI as at 31st December
Dividends Paid to NCI
2014 2013 2014 2013 2014 2013
Rs 000 Rs 000 Rs 000 Rs 000 Rs 000 Rs 000
HNB Assurance PLC 40.00 40.00 166,472 144,788 910,712 809,240 65,000 55,000
Sithma Development (Pvt) Ltd - - - - - - - -
Prime Grameen Micro Finance Limited 57.84 49.00 86,453 - 823,420 - - -
Majan Exchange* 60.00 60.00 - (17,452) - - - -
252,925 127,336 1,734,132 809,240 65,000 55,000
* Bank’s holding in Majan Exchange was disposed in 2013.
37 (d) Summarised Financial Information of Subsidiaries
HNB Assurance PLC Sithma Development (Pvt) Ltd Prime Grameen Micro Finance Limited As at 31st 31st 31st 31st 31st 31st December December December December December December 2014 2013 2014 2013 2014 2013 Rs 000 Rs 000 Rs 000 Rs 000 Rs 000 Rs 000Assets 9,969,316 8,059,665 7,585,280 7,626,706 9,251,320 -Liabilities 7,555,382 5,946,553 600,002 1,146,995 8,133,708 -Equity 2,373,188 2,117,294 6,985,278 6,479,711 1,117,612 -
For the year ended 31st December 2014 2013 2014 2013 2014 2013 Rs 000 Rs 000 Rs 000 Rs 000 Rs 000 Rs 000Revenue 5,013,421 4,212,255 916,766 824,143 576,305 - Profit after tax 417,225 389,122 505,567 374,038 146,623 -Total comprehensive income 418,393 386,512 505,567 374,038 149,470 -
38 INVESTMENT PROPERTIES Bank Group
2014 2013 2014 2013 Rs 000 Rs 000 Rs 000 Rs 000
Cost Balance as at 1st January 384,432 382,230 249,663 248,885Disposals - - - (215) Assets acquired through acquisition of subsidiary - - 886,300 - Improvements 51,010 2,202 - 993Balance as at 31st December 435,442 384,432 1,135,963 249,663
Accumulated depreciationBalance as at 1st January 37,954 32,522 88,799 84,287Disposals - - - (215)Charge for the year 5,400 5,432 4,778 4,727Balance as at 31st December 43,354 37,954 93,577 88,799Net book value as at 31st December 392,088 346,478 1,042,386 160,864
Notes to theFinancial Statements

Annual Report 2014 285
38 INVESTMENT PROPERTIES (Contd.)38 (a) Valuation of Investment Properties - Bank
As at 31st December 2014 Cost / Carrying Amount Fair Value Building Land (Net Book Building Extent (Cost) Value) Total Land Building Total sq.ft Perches Rs 000 Rs 000 Rs 000 Rs 000 Rs 000 Rs 000
23 & 23 1/1, Independence Avenue, Colombo 7 [Note 38 (b) i] 10,645 105.10 37,081 38,049 75,130 739,000479 T B Jayah Mawatha, Colombo 10 [Note 38 (b) ii] Land 112.96 126,480 - 126,480 131,449 - 131,44921, 21A, 23 & 25, Janadhipathi Mawatha, Colombo 1 [Note 38 (b) ii] Land 26.62 34,888 - 34,888 133,100 - 133,10010, Sri Uttarananda Mawatha, Colombo 3 [Note 38 (b) iii] 57,917 40.00 72,000 83,590 155,590 320,000 254,834 574,834 270,449 121,639 392,088 1,578,383
38 (b) Valuation of Investment Properties - GroupAs at 31st December 2014 Cost / Carrying Amount Fair Value Building Land (Net Book Building Extent (Cost) Value) Total Land Building Total sq.ft Perches Rs 000 Rs 000 Rs 000 Rs 000 Rs 000 Rs 000
Through the Bank23 & 23 1/1, Independence Avenue, Colombo 7* [Note 38 (b) i] 10,645 105.10 37,081 38,049 75,130 739,000
Through the Subsidiary - Sithma Development (Pvt) Ltd21, 21A, 23 & 25, Janadhipathi Mawatha, Colombo 1 41,688 - - 80,956 80,956 - 196,767 196,767
Through the Subsidiary - Prime Grameen Micro Finance Ltd [Note 38 (b) iv]No. 249, Stanley Thilekaratne Mawatha, Pagoda, Negegoda 24,952 39.60 151,063 407,937 559,000 151,063 407,937 559,000 Vihara Road, Rankewatte, Matale Land 15.00 9,000 - 9,000 9,000 - 9,000 44/1, Service Road, Puttalam Land 25.60 12,800 - 12,800 12,800 - 12,800 465/1, Old Police Station Road, Kahathuduwa, Polgasowita 20,494 182.59 49,008 71,992 121,000 49,008 71,992 121,000 67/1, Mahinda Place, Kirulapone, Colombo 5 5,786 8.00 25,267 90,733 116,000 25,267 90,733 116,000 6, Abaya Place, 7th Lane, Anuradapura Land 13.52 20,000 - 20,000 20,000 - 20,000 10/11, Galle Road, Moratuwa Land 23.00 34,500 - 34,500 34,500 - 34,500 Adampodaivayal, Adampodaimalaikadu, Trincomalee Land 724.00 14,000 - 14,000 14,000 - 14,000 352,719 689,667 1,042,386 1,822,067
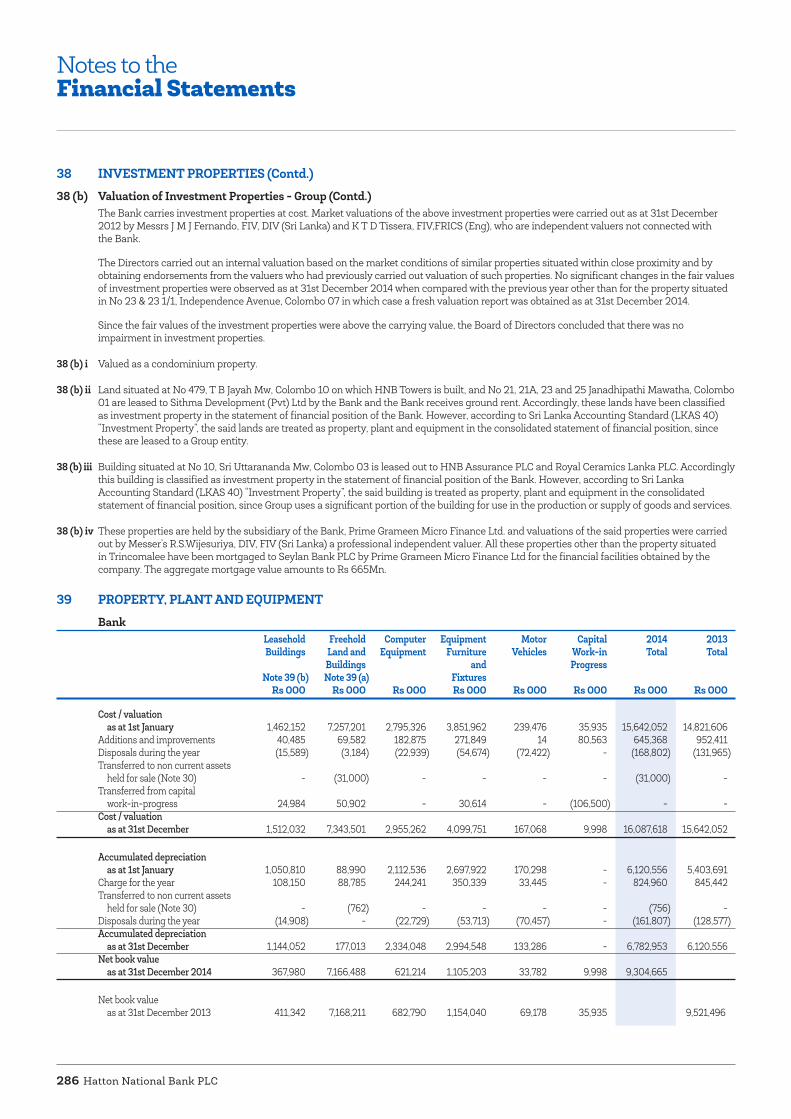
Hatton National Bank PLC286
38 INVESTMENT PROPERTIES (Contd.)38 (b) Valuation of Investment Properties - Group (Contd.)
The Bank carries investment properties at cost. Market valuations of the above investment properties were carried out as at 31st December 2012 by Messrs J M J Fernando, FIV, DIV (Sri Lanka) and K T D Tissera, FIV,FRICS (Eng), who are independent valuers not connected with the Bank.
The Directors carried out an internal valuation based on the market conditions of similar properties situated within close proximity and by obtaining endorsements from the valuers who had previously carried out valuation of such properties. No significant changes in the fair values of investment properties were observed as at 31st December 2014 when compared with the previous year other than for the property situated in No 23 & 23 1/1, Independence Avenue, Colombo 07 in which case a fresh valuation report was obtained as at 31st December 2014.
Since the fair values of the investment properties were above the carrying value, the Board of Directors concluded that there was no impairment in investment properties.
38 (b) i Valued as a condominium property.
38 (b) ii Land situated at No 479, T B Jayah Mw, Colombo 10 on which HNB Towers is built, and No 21, 21A, 23 and 25 Janadhipathi Mawatha, Colombo 01 are leased to Sithma Development (Pvt) Ltd by the Bank and the Bank receives ground rent. Accordingly, these lands have been classified as investment property in the statement of financial position of the Bank. However, according to Sri Lanka Accounting Standard (LKAS 40) “Investment Property”, the said lands are treated as property, plant and equipment in the consolidated statement of financial position, since these are leased to a Group entity.
38 (b) iii Building situated at No 10, Sri Uttarananda Mw, Colombo 03 is leased out to HNB Assurance PLC and Royal Ceramics Lanka PLC. Accordingly this building is classified as investment property in the statement of financial position of the Bank. However, according to Sri Lanka Accounting Standard (LKAS 40) “Investment Property”, the said building is treated as property, plant and equipment in the consolidated statement of financial position, since Group uses a significant portion of the building for use in the production or supply of goods and services.
38 (b) iv These properties are held by the subsidiary of the Bank, Prime Grameen Micro Finance Ltd. and valuations of the said properties were carried out by Messer’s R.S.Wijesuriya, DIV, FIV (Sri Lanka) a professional independent valuer. All these properties other than the property situated in Trincomalee have been mortgaged to Seylan Bank PLC by Prime Grameen Micro Finance Ltd for the financial facilities obtained by the company. The aggregate mortgage value amounts to Rs 665Mn.
39 PROPERTY, PLANT AND EQUIPMENT Bank
Leasehold Freehold Computer Equipment Motor Capital 2014 2013 Buildings Land and Equipment Furniture Vehicles Work-in Total Total Buildings and Progress Note 39 (b) Note 39 (a) Fixtures
Rs 000 Rs 000 Rs 000 Rs 000 Rs 000 Rs 000 Rs 000 Rs 000
Cost / valuation as at 1st January 1,462,152 7,257,201 2,795,326 3,851,962 239,476 35,935 15,642,052 14,821,606 Additions and improvements 40,485 69,582 182,875 271,849 14 80,563 645,368 952,411 Disposals during the year (15,589) (3,184) (22,939) (54,674) (72,422) - (168,802) (131,965)Transferred to non current assets held for sale (Note 30) - (31,000) - - - - (31,000) - Transferred from capital work-in-progress 24,984 50,902 - 30,614 - (106,500) - - Cost / valuation as at 31st December 1,512,032 7,343,501 2,955,262 4,099,751 167,068 9,998 16,087,618 15,642,052
Accumulated depreciation as at 1st January 1,050,810 88,990 2,112,536 2,697,922 170,298 - 6,120,556 5,403,691 Charge for the year 108,150 88,785 244,241 350,339 33,445 - 824,960 845,442 Transferred to non current assets held for sale (Note 30) - (762) - - - - (756) - Disposals during the year (14,908) - (22,729) (53,713) (70,457) - (161,807) (128,577)Accumulated depreciation as at 31st December 1,144,052 177,013 2,334,048 2,994,548 133,286 - 6,782,953 6,120,556 Net book value as at 31st December 2014 367,980 7,166,488 621,214 1,105,203 33,782 9,998 9,304,665
Net book value as at 31st December 2013 411,342 7,168,211 682,790 1,154,040 69,178 35,935 9,521,496
Notes to theFinancial Statements
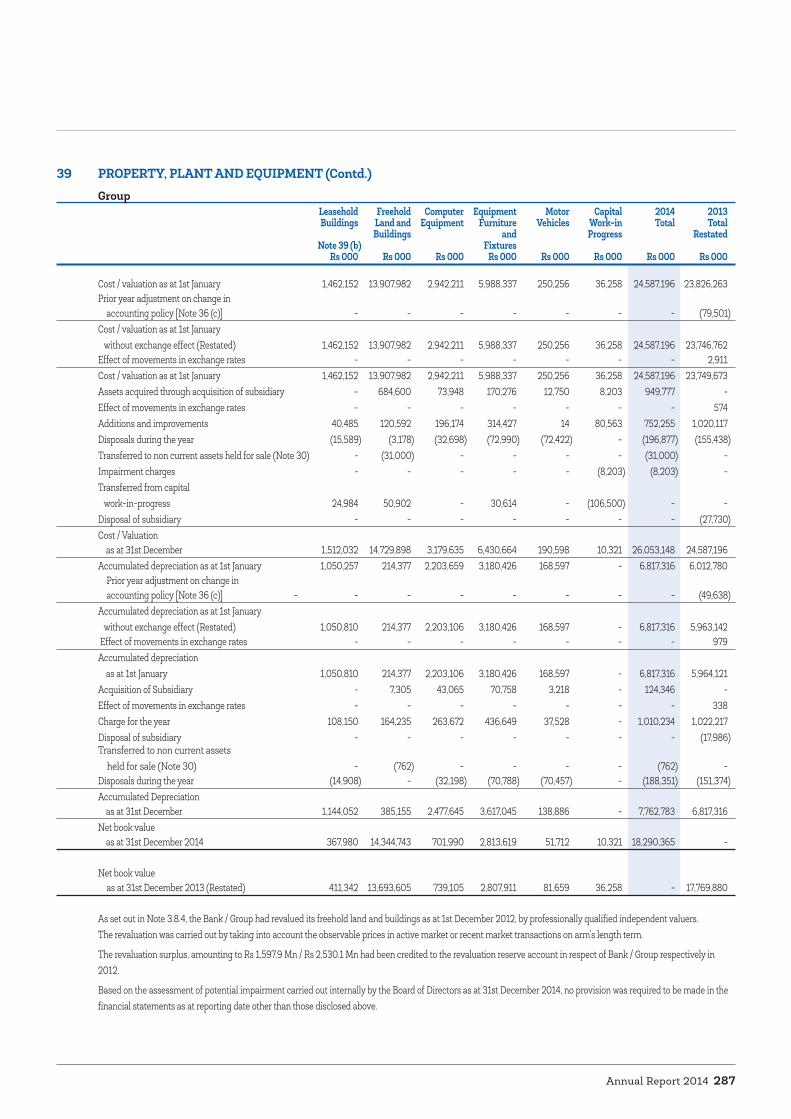
Annual Report 2014 287
39 PROPERTY, PLANT AND EQUIPMENT (Contd.) Group
Leasehold Freehold Computer Equipment Motor Capital 2014 2013 Buildings Land and Equipment Furniture Vehicles Work-in Total Total Buildings and Progress Restated Note 39 (b) Fixtures Rs 000 Rs 000 Rs 000 Rs 000 Rs 000 Rs 000 Rs 000 Rs 000
Cost / valuation as at 1st January 1,462,152 13,907,982 2,942,211 5,988,337 250,256 36,258 24,587,196 23,826,263 Prior year adjustment on change in accounting policy [Note 36 (c)] - - - - - - - (79,501)Cost / valuation as at 1st January without exchange effect (Restated) 1,462,152 13,907,982 2,942,211 5,988,337 250,256 36,258 24,587,196 23,746,762 Effect of movements in exchange rates - - - - - - - 2,911 Cost / valuation as at 1st January 1,462,152 13,907,982 2,942,211 5,988,337 250,256 36,258 24,587,196 23,749,673 Assets acquired through acquisition of subsidiary - 684,600 73,948 170,276 12,750 8,203 949,777 - Effect of movements in exchange rates - - - - - - - 574 Additions and improvements 40,485 120,592 196,174 314,427 14 80,563 752,255 1,020,117 Disposals during the year (15,589) (3,178) (32,698) (72,990) (72,422) - (196,877) (155,438)Transferred to non current assets held for sale (Note 30) - (31,000) - - - - (31,000) - Impairment charges - - - - - (8,203) (8,203) - Transferred from capital work-in-progress 24,984 50,902 - 30,614 - (106,500) - - Disposal of subsidiary - - - - - - - (27,730)Cost / Valuation as at 31st December 1,512,032 14,729,898 3,179,635 6,430,664 190,598 10,321 26,053,148 24,587,196 Accumulated depreciation as at 1st January 1,050,257 214,377 2,203,659 3,180,426 168,597 - 6,817,316 6,012,780 Prior year adjustment on change in accounting policy [Note 36 (c)] - - - - - - - - (49,638)Accumulated depreciation as at 1st January without exchange effect (Restated) 1,050,810 214,377 2,203,106 3,180,426 168,597 - 6,817,316 5,963,142 Effect of movements in exchange rates - - - - - - - 979Accumulated depreciation as at 1st January 1,050,810 214,377 2,203,106 3,180,426 168,597 - 6,817,316 5,964,121Acquisition of Subsidiary - 7,305 43,065 70,758 3,218 - 124,346 - Effect of movements in exchange rates - - - - - - - 338 Charge for the year 108,150 164,235 263,672 436,649 37,528 - 1,010,234 1,022,217 Disposal of subsidiary - - - - - - - (17,986)Transferred to non current assets held for sale (Note 30) - (762) - - - - (762) - Disposals during the year (14,908) - (32,198) (70,788) (70,457) - (188,351) (151,374)Accumulated Depreciation as at 31st December 1,144,052 385,155 2,477,645 3,617,045 138,886 - 7,762,783 6,817,316Net book value as at 31st December 2014 367,980 14,344,743 701,990 2,813,619 51,712 10,321 18,290,365 -
Net book value as at 31st December 2013 (Restated) 411,342 13,693,605 739,105 2,807,911 81,659 36,258 - 17,769,880
As set out in Note 3.8.4, the Bank / Group had revalued its freehold land and buildings as at 1st December 2012, by professionally qualified independent valuers. The revaluation was carried out by taking into account the observable prices in active market or recent market transactions on arm’s length term.
The revaluation surplus, amounting to Rs 1,597.9 Mn / Rs 2,530.1 Mn had been credited to the revaluation reserve account in respect of Bank / Group respectively in 2012.
Based on the assessment of potential impairment carried out internally by the Board of Directors as at 31st December 2014, no provision was required to be made in the financial statements as at reporting date other than those disclosed above.

Hatton National Bank PLC288
39 PROPERTY, PLANT AND EQUIPMENT (Contd.) 39 (a) Freehold Land and Buildings - Bank
As at 31st 31st Cost / Cost / December December Buildings Extent Valuation of Valuation of Total Accumulated 2014 2013 Sq.ft. (perches) Land Buildings Value Depreciation Net Book Net Book Value Value
Rs 000 Rs 000 Rs 000 Rs 000 Rs 000 Rs 000
14, Main Street, Akkaraipattu. 9,097 17.00 23,000 25,057 48,057 1,457 46,600 47,26094/1, New Galle Road, Ambalangoda. 5,081 29.90 65,000 15,047 80,047 987 79,060 79,49930, Maithripala Senanayake Mawatha, Anuradhapura. 9,505 58.99 65,114 29,623 94,737 2,077 92,660 93,53715, 15 1/1, Udayaraja Mawatha, Badulla. 5,680 27.75 35,000 13,142 48,142 926 47,216 46,63824, Maharagama Road, Boralesgamuwa. 5,107 29.55 59,022 32,458 91,480 1,928 89,552 91,967 16, Janadhipathi Mawatha, Colombo 1. 44,807 84.00 168,000 134,989 302,989 10,199 292,790 294,188 285, Galle Road, Colombo 04. 16,170 20.00 150,000 75,672 225,672 5,913 219,759 222,519100 & 102, Galle Road, Colombo 06. 16,082 36.05 180,250 110,510 290,760 7,404 283,356 286,92153/1, D S Senanayake Mawatha, Colombo 08. 10,102 28.00 119,000 89,012 208,012 5,401 202,611 205,20990, Vinayalankara Mawatha, Colombo 10. 10,250 249.00 996,000 37,600 1,033,600 2,183 1,031,417 1,032,476168, Panchikawatta Road, Colombo 10. 16,366 22.55 78,900 83,705 162,605 4,755 157,850 160,17860, Sea Street Colombo 11. 9,608 6.93 55,440 42,428 97,868 3,197 94,671 96,24688, Main Street, Colombo 11. 3,708 - - 54,362 54,362 3,106 51,256 51,623149-151, Main Street, Colombo 11. 11,460 13.03 130,000 75,060 205,060 5,662 199,398 198,330 11, Mohandiram’s Road, Colombo 12. 7,377 45.14 96,800 23,698 120,498 1,794 118,704 119,549182, St Joseph Street, Colombo 14. 11,221 24.00 66,000 71,015 137,015 4,523 132,492 134,700700/B, Anuradhapura Road, Dambulla. 7,456 94.50 80,325 20,497 100,822 1,259 99,563 100,1813, Wakwella Road, Galle. 7,035 13.80 41,000 19,125 60,125 1,437 58,688 59,271148, Colombo Road, Gampaha. 16,779 25.00 50,000 158,240 208,240 9,267 198,973 203,470142, Kandy Road, Gampola. 12,130 17.05 34,000 96,818 130,818 5,226 125,592 124,50412, Kandy Road, Gampola. * - - - - - - - 33,645Bank House -No 295/6, Dimbulla Road Hatton. 4,113 53.80 16,140 6,503 22,643 369 22,274 22,267Cottage-78, Dimbulla Road, Hatton. 2,114 42.20 13,752 2,747 16,499 207 16,292 16,393No 88,90 & 90A, Dimbula Road, Hatton 6,028 15.68 28,208 9,791 37,999 739 37,260 37,62416, Mount Road Hatton. 5,088 160.00 24,000 6,028 30,028 453 29,575 29,770 73, Old Negombo Road, Kanuwana Ja-Ela. 5,017 19.00 33,200 21,989 55,189 1,590 53,599 54,349 177, 179 Ponnampalam Rd Jaffna. 30,776 62.36 276,000 299,681 575,681 10,071 565,610 528,974772 A, Main Street, Kahawatte. 10,554 16.14 16,000 26,263 42,263 1,416 40,847 41,11830A, Batticaloa Road Kalmunai. 7,000 25.10 19,800 56,128 75,928 3,345 72,583 73,383
Notes to theFinancial Statements
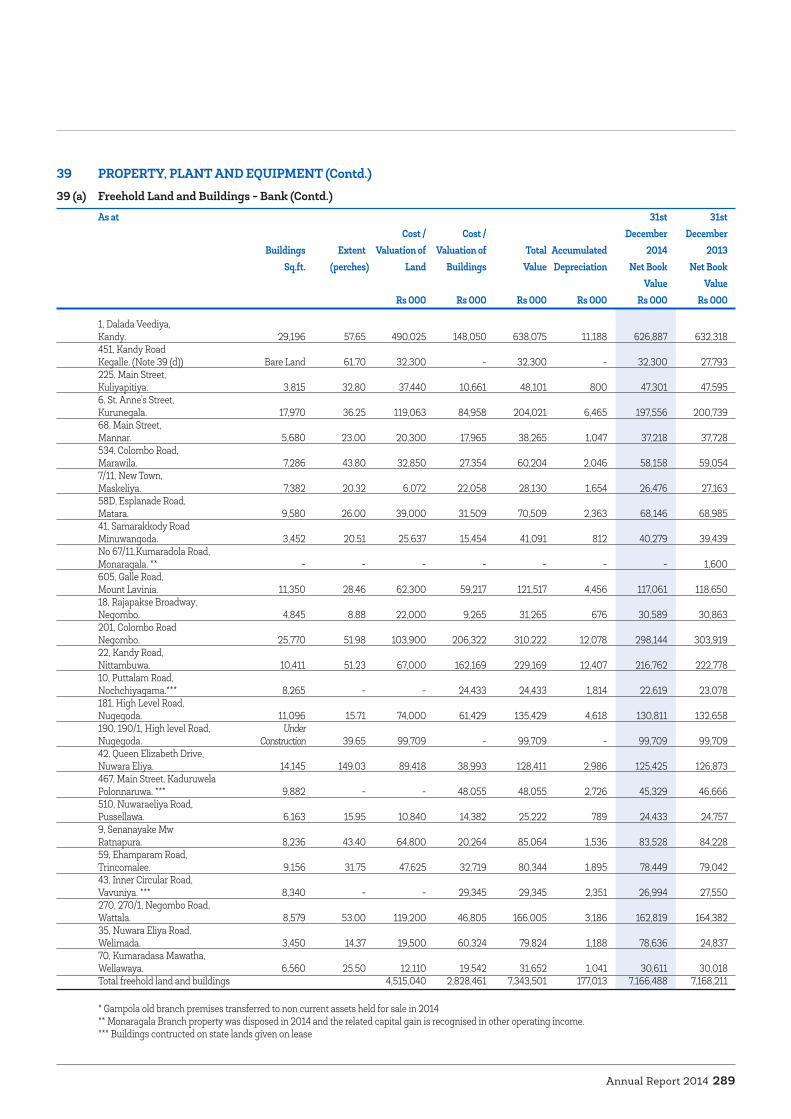
Annual Report 2014 289
39 PROPERTY, PLANT AND EQUIPMENT (Contd.) 39 (a) Freehold Land and Buildings - Bank (Contd.)
As at 31st 31st Cost / Cost / December December Buildings Extent Valuation of Valuation of Total Accumulated 2014 2013 Sq.ft. (perches) Land Buildings Value Depreciation Net Book Net Book Value Value
Rs 000 Rs 000 Rs 000 Rs 000 Rs 000 Rs 000
1, Dalada Veediya, Kandy. 29,196 57.65 490,025 148,050 638,075 11,188 626,887 632,318451, Kandy Road Kegalle. (Note 39 (d)) Bare Land 61.70 32,300 - 32,300 - 32,300 27,793225, Main Street, Kuliyapitiya. 3,815 32.80 37,440 10,661 48,101 800 47,301 47,5956, St. Anne’s Street, Kurunegala. 17,970 36.25 119,063 84,958 204,021 6,465 197,556 200,73968, Main Street, Mannar. 5,680 23.00 20,300 17,965 38,265 1,047 37,218 37,728534, Colombo Road, Marawila. 7,286 43.80 32,850 27,354 60,204 2,046 58,158 59,0547/11, New Town, Maskeliya. 7,382 20.32 6,072 22,058 28,130 1,654 26,476 27,16358D, Esplanade Road, Matara. 9,580 26.00 39,000 31,509 70,509 2,363 68,146 68,98541, Samarakkody Road Minuwangoda. 3,452 20.51 25,637 15,454 41,091 812 40,279 39,439No 67/11,Kumaradola Road, Monaragala. ** - - - - - - - 1,600605, Galle Road, Mount Lavinia. 11,350 28.46 62,300 59,217 121,517 4,456 117,061 118,65018, Rajapakse Broadway, Negombo. 4,845 8.88 22,000 9,265 31,265 676 30,589 30,863201, Colombo Road Negombo. 25,770 51.98 103,900 206,322 310,222 12,078 298,144 303,91922, Kandy Road, Nittambuwa. 10,411 51.23 67,000 162,169 229,169 12,407 216,762 222,77810, Puttalam Road, Nochchiyagama.*** 8,265 - - 24,433 24,433 1,814 22,619 23,078181, High Level Road, Nugegoda. 11,096 15.71 74,000 61,429 135,429 4,618 130,811 132,658190, 190/1, High level Road, Under Nugegoda. Construction 39.65 99,709 - 99,709 - 99,709 99,709 42, Queen Elizabeth Drive, Nuwara Eliya. 14,145 149.03 89,418 38,993 128,411 2,986 125,425 126,873467, Main Street, Kaduruwela Polonnaruwa. *** 9,882 - - 48,055 48,055 2,726 45,329 46,666510, Nuwaraeliya Road, Pussellawa. 6,163 15.95 10,840 14,382 25,222 789 24,433 24,7579, Senanayake Mw Ratnapura. 8,236 43.40 64,800 20,264 85,064 1,536 83,528 84,228 59, Ehamparam Road, Trincomalee. 9,156 31.75 47,625 32,719 80,344 1,895 78,449 79,04243, Inner Circular Road, Vavuniya. *** 8,340 - - 29,345 29,345 2,351 26,994 27,550270, 270/1, Negombo Road, Wattala. 8,579 53.00 119,200 46,805 166,005 3,186 162,819 164,38235, Nuwara Eliya Road, Welimada. 3,450 14.37 19,500 60,324 79,824 1,188 78,636 24,83770, Kumaradasa Mawatha, Wellawaya. 6,560 25.50 12,110 19,542 31,652 1,041 30,611 30,018Total freehold land and buildings 4,515,040 2,828,461 7,343,501 177,013 7,166,488 7,168,211
* Gampola old branch premises transferred to non current assets held for sale in 2014 ** Monaragala Branch property was disposed in 2014 and the related capital gain is recognised in other operating income. *** Buildings contructed on state lands given on lease

Hatton National Bank PLC290
39 PROPERTY, PLANT AND EQUIPMENT (Contd.) 39 (b) Leasehold Buildings Bank Group
As at 31st December 2014 31st 31st December 2014 31st December December 2013 2013 Cost of Accumulated Net Book Net Book Cost of Accumulated Net Book Net Book Buildings Depreciation Value Value Buildings Depreciation Value Value Restated Restated
Rs 000 Rs 000 Rs 000 Rs 000 Rs 000 Rs 000 Rs 000 Rs 000
01 - 05 years 564,779 542,073 22,706 40,547 564,779 542,073 22,706 40,547 06 - 10 years 882,989 556,388 326,601 348,152 882,989 556,388 326,601 348,152 11 - 15 years 50,113 34,384 15,729 19,006 50,113 34,384 15,729 19,006 16 - 20 years 14,151 11,207 2,944 3,637 14,151 11,207 2,944 3,637 Total 1,512,032 1,144,052 367,980 411,342 1,512,032 1,144,052 367,980 411,342
39 (c) Fully Depreciated Property, Plant and Equipment - BankThe initial cost of fully depreciated property, plant and equipment which are still in use as at reporting date is as follows.
As at 31st 31st December December 2014 2013
Rs 000 Rs 000
Motor vehicles 44,456 100,336Leasehold buildings 254,202 416,323Computer equipments 1,133,133 1,207,843Equipment, furniture and fixtures 1,692,211 1,713,312Intangible assets 614,091 620,091
39 (d) Temporarily Idle Property, Plant and Equipment - BankA land worth of Rs 32.3 Mn was idle as at 31st December 2014 as this land was not identified as available for immediate use.
Notes to theFinancial Statements

Annual Report 2014 291
40 INTANGIBLE ASSETS AND GOODWILL Bank Group
2014 2013 2014 2013 Restated
Rs 000 Rs 000 Rs 000 Rs 000
Cost Balance as at 1st January 2,468,847 1,796,959 2,608,449 2,005,378Prior year adjustment on change in accounting policy [Note 36 (c)] - - - (77,988)Restated balance as at 1st January 2,468,847 1,796,959 2,608,449 1,927,390Additions and improvements during the year 104,687 671,888 120,477 681,059Intangible assets acquired through acquisition of subsidiary - - 250,196 -Balance as at 31st December 2,573,534 2,468,847 2,979,122 2,608,449
Accumulated amortisation Balance as at 1st January 1,474,170 1,240,788 1,559,583 1,315,876Prior year adjustment on change in accounting policy [Note 36 (c)] - - - (5,771)Restated balance as at 1st January 1,474,170 1,240,788 1,559,583 1,310,105Amortisation for the year 296,636 233,382 315,839 249,478Intangible assets acquired through acquisition of subsidiary - - 13,941 -Balance as at 31st December 1,770,806 1,474,170 1,889,363 1,559,583Net book value as at 31st December 802,728 994,677 1,089,759 1,048,866
40 (a) Analysis of Intangible AssetsComputer Software 802,728 994,677 866,818 1,048,866Goodwill * - - 122,941 -Licence [Note 3.6.1 (c)] - - 100,000 - 802,728 994,677 1,089,759 1,048,866
* Goodwill amounting to Rs 122.94 Mn has been recognised in respect of acquisition of Prime Grameen Micro Finance Ltd. The details on purchase consideration allocation is given in Note 40 (b).
The Bank carried out an impairment assessment as at 31st December 2014 on the goodwill recognised on acquisition of Prime Grameen Micro Finance Ltd and concluded that there is no impairment based on the future earnings projections.

Hatton National Bank PLC292
40 INTANGIBLE ASSETS AND GOODWILL (Contd.)40 (b) Purchase Consideration Allocation
The acquisition of Prime Grameen Micro Finance Ltd had the following effect on the Group’s assets and liabilities on acquisition date.
Pre- Acquisition Fair Value Recognised Carrying Amounts Adjustments Values on Acquisition
Rs 000 Rs 000 Rs 000
Cash and cash equivalents 317,706 - 317,706 Loans and receivables to customers 4,588,932 - 4,588,932 Reverse repurchase agreements 1,495,877 - 1,495,877 Financial Investments - Available-for-sale 234 - 234 Financial Investments - Held-to-maturity 47,195 - 47,195 Investment properties 886,300 - 886,300 Intangible assets 13,311 - 13,311 Licence - 100,000 100,000 Property, plant and equipment 825,429 - 825,429 Other assets 208,846 - 208,846 Due to banks (49,066) - (49,066)Due to customers (6,005,786) - (6,005,786)Other borrowings (116,181) - (116,181)Debt securities issued (668,391) 206,004 (462,387)Current tax liabilities (48,370) - (48,370)Deferred tax liabilities (27,714) - (27,714)Other liabilities (400,467) - (400,467)Subordinated term debts (100,000) - (100,000) 967,855 306,004 1,273,859 Non controlling interest (559,807) (176,993) (736,800)Net Identifiable assets and liabilities 537,059 Goodwill on acquisition 122,941 Consideration paid in cash 660,000 Cash acquired (317,706)Net cash outflow - Group 342,294
Pre-acquisition carrying amounts were determined based on applicable SLFRSs immediately before the acquisition and the goodwill recognised on the acquisition is attributable mainly to the skills and service quality of the acquired business work force gained through being in the micro finance business for long period.
Notes to theFinancial Statements

Annual Report 2014 293
41 OTHER ASSETS Bank Group
As at 31st 31st 31st 31st 1st December December December December January 2014 2013 2014 2013 2013 Restated Restated
Rs 000 Rs 000 Rs 000 Rs 000 Rs 000
Deposits and prepayments * 959,527 1,202,352 572,423 778,458 1,119,465 Items in transit 3,602,445 2,989,722 3,602,445 2,989,722 3,237,945 VAT recoverable 151,400 913,884 151,400 913,884 1,379,435 Items held for use 33,740 44,813 33,740 44,813 52,152 Inventory - residential apartment complex - - - 20,989 162,990 Receivable from pension fund 1,533,954 107,127 1,533,954 107,127 513,748 Unamortised cost on staff loans 3,177,586 4,692,214 3,192,019 4,702,104 4,062,079 Other debtors 1,481,618 913,223 2,582,079 1,645,021 2,049,240 10,940,270 10,863,335 11,668,060 11,202,118 12,577,054
* An impairment allowance of Rs 9.2 Mn has been recognised in respect of pre payments made for software in Prime Grameen Micro Finance Ltd under Note 16 “Impairment charge / (reversal) for loans and other losses”.
42 DUE TO BANKS Bank Group
As at 31st 31st 31st 31st 1st December December December December January 2014 2013 2014 2013 2013 Restated Restated
Rs 000 Rs 000 Rs 000 Rs 000 Rs 000
Call and time deposits 4,222,932 4,558,609 4,222,932 4,558,609 530,000 Refinance borrowings 4,696,226 5,312,578 4,696,226 5,312,578 6,085,541 Foreign bank borrowings 26,190,296 19,145,680 26,190,296 19,145,680 11,845,824 Local bank borrowings 8,319,308 5,917,351 8,395,275 5,917,351 4,495,066 43,428,762 34,934,218 43,504,729 34,934,218 22,956,431
43 DERIVATIVE FINANCIAL INSTRUMENTS Bank Group
As at 31st 31st 31st 31st December December December December 2014 2013 2014 2013
Rs 000 Rs 000 Rs 000 Rs 000
Foreign currency derivatives Currency swaps Sales 5,119 1,447 5,119 1,447 Purchases 510,377 635,028 510,377 635,028
Forward foreign exchange contracts Sales 23,157 8,284 23,157 8,284 Purchases 91,945 104,203 91,945 104,203 630,598 748,962 630,598 748,962

Hatton National Bank PLC294
44 DUE TO CUSTOMERS Bank Group
As at 31st 31st 31st 31st 1st December December December December January 2014 2013 2014 2013 2013 Restated Restated
Rs 000 Rs 000 Rs 000 Rs 000 Rs 000
Local currency deposits 352,732,715 323,925,015 359,128,926 323,734,485 281,680,670 Foreign currency deposits 66,594,408 63,233,375 66,491,456 63,129,559 60,674,760 419,327,123 387,158,390 425,620,382 386,864,044 342,355,430
44 (a) Analysis of Due to Customers
44 (a) i By Product
Current account deposits 32,608,645 23,837,932 32,220,067 23,676,895 23,268,139Savings deposits 157,946,623 124,510,240 158,803,308 124,503,573 109,169,526 Time deposits 225,812,375 233,084,720 231,637,527 232,958,078 200,643,065 Certificates of deposit 1,374,807 3,928,076 1,374,807 3,928,076 8,054,895 Margin deposits 1,584,673 1,797,422 1,584,673 1,797,422 1,219,805 419,327,123 387,158,390 425,620,382 386,864,044 342,355,430
44 (a) ii By Currency
Sri Lankan Rupee 352,732,715 323,925,015 359,128,926 323,734,485 281,680,670 United States Dollar 49,335,862 47,663,556 49,232,910 47,559,740 45,527,509 Great Britain Pound 5,685,523 4,279,913 5,685,523 4,279,913 4,313,126 Euro 6,905,604 6,385,675 6,905,604 6,385,675 5,815,462 Australian Dollar 3,885,325 4,259,666 3,885,325 4,259,666 4,254,395 Other currencies 782,094 644,565 782,094 644,565 764,268 419,327,123 387,158,390 425,620,382 386,864,044 342,355,430
45 DIVIDENDS PAYABLE Bank Group
2014 2013 2014 2013 Restated
Rs 000 Rs 000 Rs 000 Rs 000
Balance as at 1st January 426,347 221,455 426,347 223,251Prior year adjustment on change in accounting policy [Note 36 (c)] - - - (1,796)Restated balance as at 1st January 426,347 221,455 426,347 221,455Final cash dividends declared in the prior year 2,800,912 2,782,814 2,865,912 2,837,814 Interim dividends declared during the year 602,939 599,332 602,939 599,332 Dividends paid (3,243,120) (3,177,254) (3,308,120) (3,232,254)Balance as at 31st December 587,078 426,347 587,078 426,347
Notes to theFinancial Statements

Annual Report 2014 295
46 OTHER BORROWINGS Bank Group
As at 31st 31st 31st 31st 1st December December December December January 2014 2013 2014 2013 2013 Restated Restated
Rs 000 Rs 000 Rs 000 Rs 000 Rs 000
Refinance borrowings 193,090 301,961 193,090 301,961 343,025 Others 4,152,195 4,228,538 4,152,195 4,228,538 4,299,959 4,345,285 4,530,499 4,345,285 4,530,499 4,642,984
47 DEBT SECURITIES ISSUED Bank Group
As at 31st 31st 31st 31st December December December December 2014 2013 2014 2013
Rs 000 Rs 000 Rs 000 Rs 000
Debt securities issued by the Bank [Note 47 (a)] 4,451,407 1,418,775 4,380,240 1,399,184Debt securities issued by subsidiary [Note 47 (b)] - - 462,387 - 4,451,407 1,418,775 4,842,627 1,399,184
47 (a) Debt Securities issued by the Bank Bank Group Colombo Interest Face Value Interest Rate Repayment Issue Date Maturity Date As at As at As at As at Stock Payment Rs 000 Terms 31.12.2014 31.12.2013 31.12.2014 31.12.2013 Exchange Frequency Rs 000 Rs 000 Rs 000 Rs 000 Listing
(i) Year of issuance 2013* Listed Annually 2,000,000 8% 10 Years 30th Aug 2013 29th Aug 2023 1,451,407 1,418,775 1,432,670 1,399,184(ii) Year of issuance 2014* Listed Semi Annually 158,720 6.88% 3 Years 15th Dec 2014 15th Dec 2017 158,720 - 158,720 - Semi Annually 2,757,240 7.75% 5 Years 15th Dec 2014 15th Dec 2019 2,757,240 - 2,724,810 - Semi Annually 84,040 8.33% 10 Years 15th Dec 2014 15th Dec 2024 84,040 - 64,040 -Total debt securities issued - Bank 4,451,407 1,418,775 4,380,240 1,399,184
Due within one year - - - -Due after one year 4,451,407 1,418,775 4,380,240 1,399,184Total debt securities issued - Bank (Note 47) 4,451,407 1,418,775 4,380,240 1,399,184
47 (b) Debt Securities issued by Subsidiary Bank Group Colombo Interest Face Value Interest Rate Repayment Issue Date Maturity Date As at As at As at As at Stock Payment Rs 000 Terms 31.12.2014 31.12.2013 31.12.2014 31.12.2013 Exchange Frequency Rs 000 Rs 000 Rs 000 Rs 000 Listing
(i) Year of issuance 2011** Not Listed Monthly 665,000 1 Yr Avg TB rate 20 Years 30th Jun 2014 30th Jun 2034 - - 462,387 - Total debt securities issued - Subsidiary (Note 47) - - 462,387 -
* HNB Assurance PLC, subsidiary of the Bank has invested Rs 71.17 Mn in debt securities issued by the Bank.** Debenture issued by Prime Grameen Micro Finance Ltd. Capital repayment will commence from 2024.
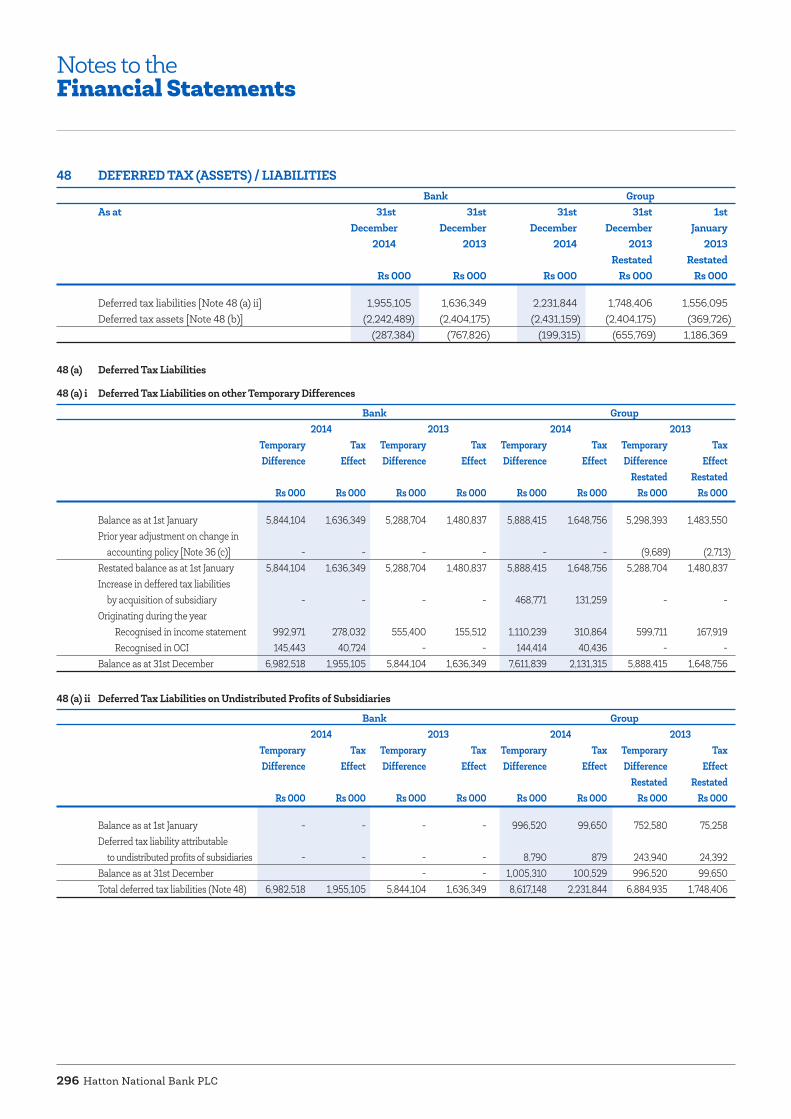
Hatton National Bank PLC296
48 DEFERRED TAX (ASSETS) / LIABILITIES Bank Group
As at 31st 31st 31st 31st 1st December December December December January 2014 2013 2014 2013 2013 Restated Restated
Rs 000 Rs 000 Rs 000 Rs 000 Rs 000
Deferred tax liabilities [Note 48 (a) ii] 1,955,105 1,636,349 2,231,844 1,748,406 1,556,095 Deferred tax assets [Note 48 (b)] (2,242,489) (2,404,175) (2,431,159) (2,404,175) (369,726) (287,384) (767,826) (199,315) (655,769) 1,186,369
48 (a) Deferred Tax Liabilities
48 (a) i Deferred Tax Liabilities on other Temporary Differences
Bank Group 2014 2013 2014 2013 Temporary Tax Temporary Tax Temporary Tax Temporary Tax Difference Effect Difference Effect Difference Effect Difference Effect Restated Restated Rs 000 Rs 000 Rs 000 Rs 000 Rs 000 Rs 000 Rs 000 Rs 000
Balance as at 1st January 5,844,104 1,636,349 5,288,704 1,480,837 5,888,415 1,648,756 5,298,393 1,483,550 Prior year adjustment on change in accounting policy [Note 36 (c)] - - - - - - (9,689) (2,713)Restated balance as at 1st January 5,844,104 1,636,349 5,288,704 1,480,837 5,888,415 1,648,756 5,288,704 1,480,837 Increase in deffered tax liabilities by acquisition of subsidiary - - - - 468,771 131,259 - -Originating during the year Recognised in income statement 992,971 278,032 555,400 155,512 1,110,239 310,864 599,711 167,919 Recognised in OCI 145,443 40,724 - - 144,414 40,436 - -Balance as at 31st December 6,982,518 1,955,105 5,844,104 1,636,349 7,611,839 2,131,315 5,888,415 1,648,756
48 (a) ii Deferred Tax Liabilities on Undistributed Profits of Subsidiaries
Bank Group 2014 2013 2014 2013 Temporary Tax Temporary Tax Temporary Tax Temporary Tax Difference Effect Difference Effect Difference Effect Difference Effect Restated Restated Rs 000 Rs 000 Rs 000 Rs 000 Rs 000 Rs 000 Rs 000 Rs 000
Balance as at 1st January - - - - 996,520 99,650 752,580 75,258Deferred tax liability attributable to undistributed profits of subsidiaries - - - - 8,790 879 243,940 24,392Balance as at 31st December - - 1,005,310 100,529 996,520 99,650Total deferred tax liabilities (Note 48) 6,982,518 1,955,105 5,844,104 1,636,349 8,617,148 2,231,844 6,884,935 1,748,406
Notes to theFinancial Statements
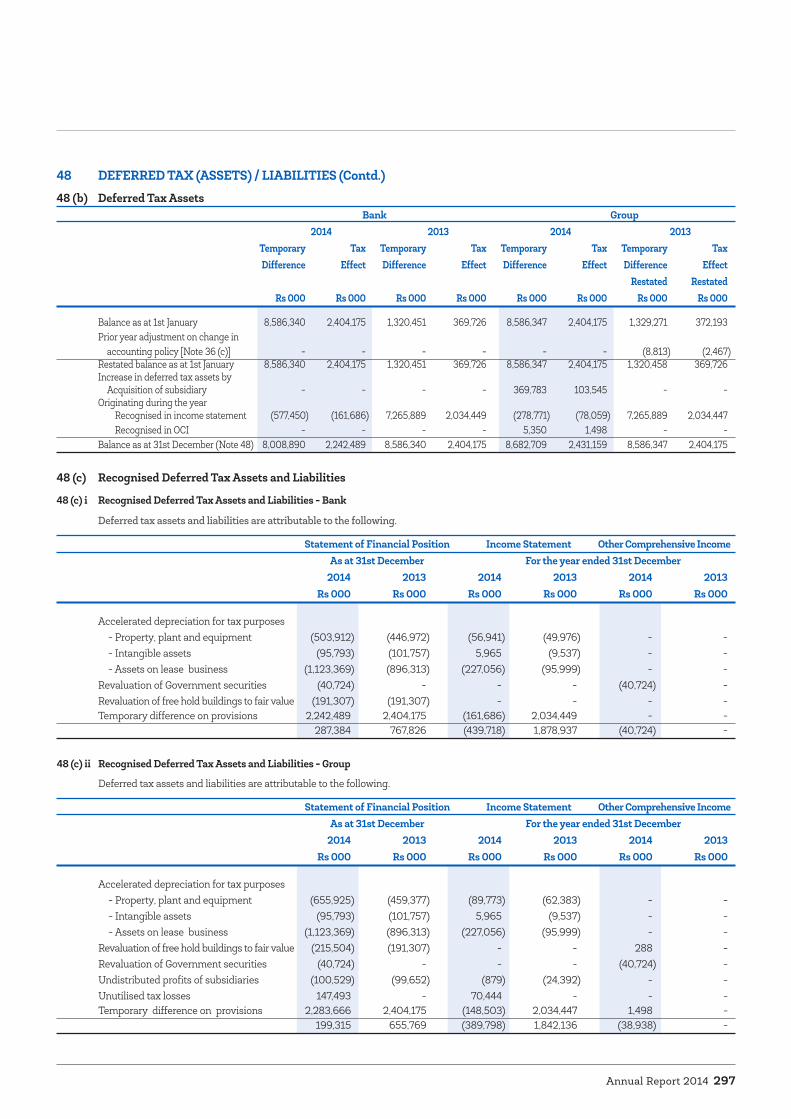
Annual Report 2014 297
48 DEFERRED TAX (ASSETS) / LIABILITIES (Contd.)48 (b) Deferred Tax Assets
Bank Group 2014 2013 2014 2013 Temporary Tax Temporary Tax Temporary Tax Temporary Tax Difference Effect Difference Effect Difference Effect Difference Effect Restated Restated Rs 000 Rs 000 Rs 000 Rs 000 Rs 000 Rs 000 Rs 000 Rs 000
Balance as at 1st January 8,586,340 2,404,175 1,320,451 369,726 8,586,347 2,404,175 1,329,271 372,193Prior year adjustment on change in accounting policy [Note 36 (c)] - - - - - - (8,813) (2,467)Restated balance as at 1st January 8,586,340 2,404,175 1,320,451 369,726 8,586,347 2,404,175 1,320,458 369,726Increase in deferred tax assets by Acquisition of subsidiary - - - - 369,783 103,545 - -Originating during the year Recognised in income statement (577,450) (161,686) 7,265,889 2,034,449 (278,771) (78,059) 7,265,889 2,034,447 Recognised in OCI - - - - 5,350 1,498 - -Balance as at 31st December (Note 48) 8,008,890 2,242,489 8,586,340 2,404,175 8,682,709 2,431,159 8,586,347 2,404,175
48 (c) Recognised Deferred Tax Assets and Liabilities
48 (c) i Recognised Deferred Tax Assets and Liabilities - Bank
Deferred tax assets and liabilities are attributable to the following.
Statement of Financial Position Income Statement Other Comprehensive Income As at 31st December For the year ended 31st December
2014 2013 2014 2013 2014 2013 Rs 000 Rs 000 Rs 000 Rs 000 Rs 000 Rs 000
Accelerated depreciation for tax purposes - Property, plant and equipment (503,912) (446,972) (56,941) (49,976) - - - Intangible assets (95,793) (101,757) 5,965 (9,537) - - - Assets on lease business (1,123,369) (896,313) (227,056) (95,999) - - Revaluation of Government securities (40,724) - - - (40,724) - Revaluation of free hold buildings to fair value (191,307) (191,307) - - - - Temporary difference on provisions 2,242,489 2,404,175 (161,686) 2,034,449 - - 287,384 767,826 (439,718) 1,878,937 (40,724) -
48 (c) ii Recognised Deferred Tax Assets and Liabilities - Group
Deferred tax assets and liabilities are attributable to the following.
Statement of Financial Position Income Statement Other Comprehensive Income As at 31st December For the year ended 31st December
2014 2013 2014 2013 2014 2013 Rs 000 Rs 000 Rs 000 Rs 000 Rs 000 Rs 000
Accelerated depreciation for tax purposes - Property, plant and equipment (655,925) (459,377) (89,773) (62,383) - - - Intangible assets (95,793) (101,757) 5,965 (9,537) - - - Assets on lease business (1,123,369) (896,313) (227,056) (95,999) - - Revaluation of free hold buildings to fair value (215,504) (191,307) - - 288 - Revaluation of Government securities (40,724) - - - (40,724) - Undistributed profits of subsidiaries (100,529) (99,652) (879) (24,392) - - Unutilised tax losses 147,493 - 70,444 - - - Temporary difference on provisions 2,283,666 2,404,175 (148,503) 2,034,447 1,498 - 199,315 655,769 (389,798) 1,842,136 (38,938) -

Hatton National Bank PLC298
Notes to theFinancial Statements
49 INSURANCE PROVISION-LIFEThe insurance provision - Life balance represents the life fund of the subsidiary HNB Assurance PLC, which is carrying out life and general insurance business.
This balance represents the amounts attributable to life policy holders included in the Group’s net assets. The valuation of the insurance provision - Life as at 31st December 2014 was made by Mr M Poopalanathan, AIA, of Messrs Actuarial and Management Consultants (Pvt) Ltd for and on behalf of HNB Assurance PLC.
The life fund stands at Rs 5,562.6 Mn as at 31st December 2014 (2013 : Rs 4,348.5 Mn) and in the opinion of the Actuary this amount is adequate to cover the liabilities pertaining to the long term insurance business of HNB Assurance PLC, as per the actuary’s report dated 9th February 2015.
50 INSURANCE PROVISION - GENERAL Group
As at 31st 31st 31st 31st December December December December 2014 2014 2013 2013
Rs 000 Rs 000 Rs 000 Rs 000
Unearned premium Gross 1,187,153 936,283Reinsurance (209,325) (183,046)Net 977,828 753,237Deferred acquisition expenses - - Reserve for title insurance 16,866 22,370Unexpired risk reserve - - 994,694 775,607Claims outstanding - Gross 228,229 182,147 Claims incurred but not reported - Gross 56,216 284,445 53,347 235,494Total 1,279,139 1,011,101

Annual Report 2014 299
51 OTHER LIABILITIES Bank Group
As at 31st 31st 31st 31st 1st December December December December January 2014 2013 2014 2013 2013 Restated Restated
Rs 000 Rs 000 Rs 000 Rs 000 Rs 000
Cheques sent on clearing 3,614,037 3,091,688 3,614,037 3,091,688 3,215,781 Bills payable 1,958,253 1,758,922 1,958,253 1,758,922 1,430,578 Items in transit 3,458 47,153 3,458 47,153 123,225 Refundable deposits and advances* - - 14,969 76,826 138,236 Balance held o/a of Pension Fund 198,095 289,305 198,095 289,305 237,474 Balance held o/a of Widows’, Widowers’ and Orphans’ Pension Fund (WW&OP) 110,402 54,627 110,402 54,627 16,878 Balance held o/a of Employees’ Provident Fund (EPF) 65,428 79,035 65,428 79,035 105,143 Liability for EPF interest rate guarantee [Note 52 (a)] 38,360 34,281 38,360 34,281 17,696 Liability for leave accrual plan [Note 52 (b)] 114,099 127,438 114,099 127,438 109,174 Liability for cash settled share based payment - - - - 1,320,451 Provision for retiring benefits - - 181,824 59,051 44,348 Payable to vendors for lease equipments 692,735 288,011 692,735 288,011 144,605 Other creditors 2,426,513 1,905,530 3,093,927 2,329,814 1,915,807 9,221,380 7,675,990 10,085,587 8,236,151 8,819,396
52 EMPLOYEE BENEFITS 52 (a) Provision for EPF Interest Rate Guarantee Plan - Bank / Group
EPF is an approved provident fund which has been set up to meet the provident fund liabilities of the Bank. Staff members who are members of the fund are entitled to receive a minimum interest rate higher of one year fixed deposit rate of HNB or National Savings Bank on their balance on a semi annual basis. Accordingly, this obligation was treated as a defined benefit liability and an actuarial valuation was conducted to value the Bank’s obligation of same with the following actuarial assumptions.
As at 31st 31st December December 2014 2013
Discount rate 9.25% 10.00%Future salary increase 8.51% 9.69%
Bank 2014 2013
Rs 000 Rs 000
Present value of obligation as at 1st January 34,281 17,696 Provision made during the year 4,079 16,585Present value of obligation as at 31st December 38,360 34,281
G4-EC-3

Hatton National Bank PLC300
52 EMPLOYEE BENEFITS (Contd.) 52 (b) Provision for Leave Accrual Plan - Bank / Group
Employees are entitled to accumulate annual leave up to a maximum of ninety days and such accumulated leave to be utilised prior to their retirement. This has been treated as an other long term benefit in terms of Sri Lanka Accounting Standards (LKAS 19) “Employee benefits” and an actuarial valuation has been conducted on the same with the following assumptions.
As at 31st 31st December December 2014 2013Discount rate 9.25% 10.00%Future salary increase 8.51% 9.69%
Bank 2014 2013
Rs 000 Rs 000
Present value of obligation as at 1st January 127,438 109,174 Provision / (reversal) made during the year (13,339) 18,264 Present value of obligation as at 31st December 114,099 127,438
52 (c) Pension Fund - BankAn actuarial valuation of the pension fund was carried out as at 31st December 2014 by Mr M Poopalanathan, AIA, Messrs Actuarial and Management Consultants (Pvt) Ltd, a firm of professional actuaries. The valuation method used by the actuaries to value the fund is the “Projected Unit Credit Method”, the method recommended by the Sri Lanka Accounting Standard (LKAS 19) “Employee Benefits”.
The Bank contributes 20% of the basic salary to the pension fund in respect of all employees. (2013: pensionable employees - 24.34%, employees opted for optional scheme - 23%)
The assets of the fund, which are independently administered by the trustees as per the provision of the Trust Deed are held separately from those of the Bank.
No additional provision has been made in the financial statements of the Bank for gratuities to employees who have completed five or more years of service, payable under the payment of Gratuity Act No 12 of 1983 as the Bank contributes for all permanent employees to its own non-contributory pension scheme, which is in force.
52 (c) i Net Asset / (Liability) Recognised in the Statement of Financial Position As at 31st 31st December December 2014 2013
Present value of funded obligation 11,486,841 11,272,452 Total present value of obligations 11,486,841 11,272,452 Fair value of plan assets (13,020,795) (11,390,292)Present value of net surplus (1,533,954) (117,840)Recognised asset for defined benefit obligations (1,533,954) (117,840)
The Bank is expecting to recover the above surplus by way of reduced future contributions to the pension fund and accordingly the Bank recognised a net receivable of Rs 1,533.95 Mn from the pension fund as the present value of the reduction in future contributions.
52 (c) ii Fair Value of Plan Assets consist of the following As at 31st 31st December December 2014 2013
Equity securities and debentures 2,251,042 564,534 Government securities 5,173,249 2,106,867 Balance with Hatton National Bank PLC 198,095 289,305 Fixed deposits 5,282,200 7,827,588 Others 116,209 601,998 13,020,795 11,390,292
Notes to theFinancial Statements

Annual Report 2014 301
52 EMPLOYEE BENEFITS (Contd.)52 (c) Pension Fund - Bank (Contd.)
52 (c) iii Movement in the Present Value of Defined Benefit Obligations As at 31st 31st December December 2014 2013
Liability for defined benefit obligations as at 1st January 11,272,452 9,469,694 Current service cost 507,915 529,628 Interest on obligation 1,127,245 994,318 Actuarial (gains)/losses (797,298) 962,102 Benefits paid by the plan (623,473) (683,290)Liability for defined benefit obligations as at 31st December 11,486,841 11,272,452
52 (c) iv Movement in Fair Value of Plan Assets Fair value of plan assets as at 1st January 11,390,292 10,063,990 Expected return on plan assets 1,139,029 1,056,719 Contributions paid into plan 772,233 848,617 Benefits paid by the plan (623,473) (683,290)Actuarial gains 342,714 104,256 Fair value of plan assets as at 31st December 13,020,795 11,390,292
52 (c) v Actuarial Assumptions As at 31st 31st December December 2014 2013
Discount rate 9.25% 10.00%Expected return on plan assets as at 1st January 10.00% 10.50%Future salary increment rate 8.51% 9.69%Future pension increments Nil Nil Increase in cost of living allowance 8.51% 10.00%
Normal retirement age 55 years 55 yearsMortality 1967-70 1967-70 Mortality Table Mortality Table issued by the issued by the Institute of Institute of Actuaries Actuaries
The average duration of the pension fund obligation is 23 years as at 31st December 2014 (2013 - 23 years).
52 (c) vi Sensitivity of Assumptions Employed on Actuarial Valuation
Assumptions regarding discount rate and salary increment rate have a significant effect on the amounts recognised in statement of comprehensive income and statement of financial position.
The following table demonstrates the sensitivity of a reasonably possible change in such assumptions with all other variables held constant, in the actuarial valuation of the pension fund as at 31st December 2014.
Increase / (decrease) in Discount Rate
Increase / (decrease) in Salary Increment Rate
Sensitivity Effect on Statement of Comprehensive Income
Increase / (decrease) in Results for the year
Rs 000
Sensitivity Effect on Pension Fund Surplus
Increase / (decrease)
Rs 000
+1% 1,020,631 1,020,631
-1% (1,253,393) (1,253,393)
+1% (746,797) (746,797)
-1% 658,433 658,433
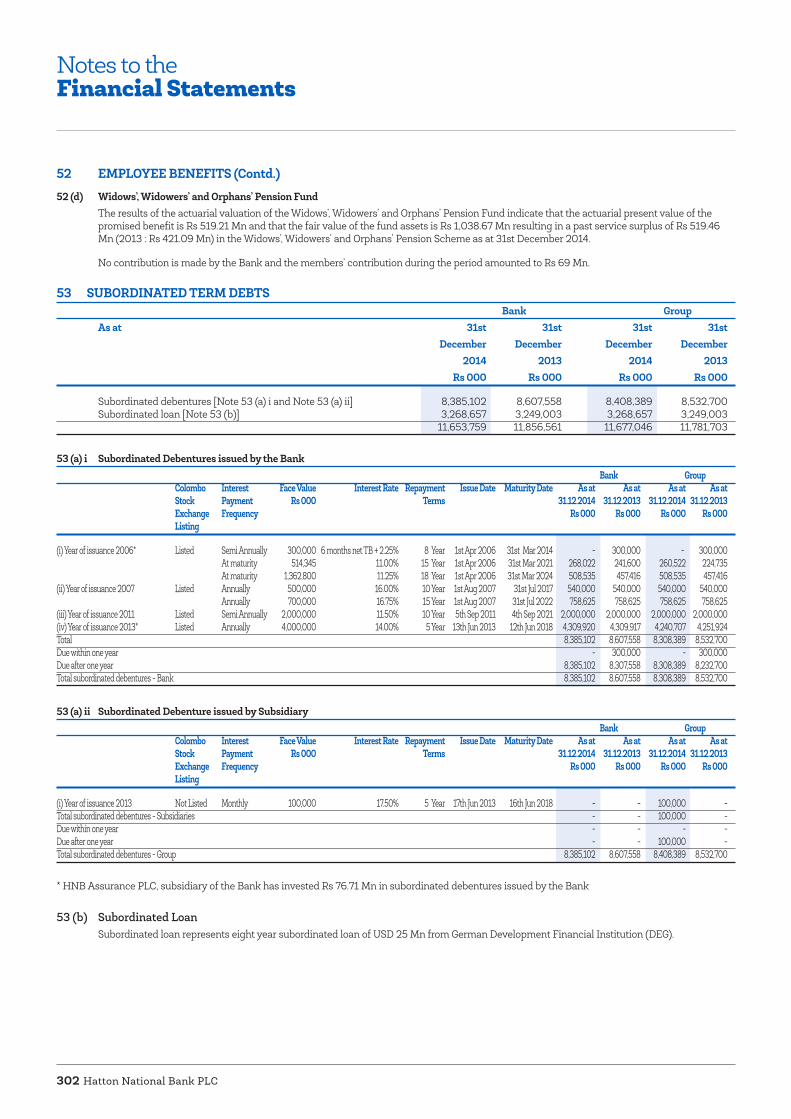
Hatton National Bank PLC302
52 EMPLOYEE BENEFITS (Contd.)52 (d) Widows’, Widowers’ and Orphans’ Pension Fund
The results of the actuarial valuation of the Widows’, Widowers’ and Orphans’ Pension Fund indicate that the actuarial present value of the promised benefit is Rs 519.21 Mn and that the fair value of the fund assets is Rs 1,038.67 Mn resulting in a past service surplus of Rs 519.46 Mn (2013 : Rs 421.09 Mn) in the Widows’, Widowers’ and Orphans’ Pension Scheme as at 31st December 2014.
No contribution is made by the Bank and the members’ contribution during the period amounted to Rs 69 Mn.
53 SUBORDINATED TERM DEBTS Bank Group
As at 31st 31st 31st 31st December December December December 2014 2013 2014 2013
Rs 000 Rs 000 Rs 000 Rs 000
Subordinated debentures [Note 53 (a) i and Note 53 (a) ii] 8,385,102 8,607,558 8,408,389 8,532,700Subordinated loan [Note 53 (b)] 3,268,657 3,249,003 3,268,657 3,249,003 11,653,759 11,856,561 11,677,046 11,781,703
53 (a) i Subordinated Debentures issued by the Bank Bank Group Colombo Interest Face Value Interest Rate Repayment Issue Date Maturity Date As at As at As at As at Stock Payment Rs 000 Terms 31.12.2014 31.12.2013 31.12.2014 31.12.2013 Exchange Frequency Rs 000 Rs 000 Rs 000 Rs 000 Listing
(i) Year of issuance 2006* Listed Semi Annually 300,000 6 months net TB + 2.25% 8 Year 1st Apr 2006 31st Mar 2014 - 300,000 - 300,000 At maturity 514,345 11.00% 15 Year 1st Apr 2006 31st Mar 2021 268,022 241,600 260,522 224,735 At maturity 1,362,800 11.25% 18 Year 1st Apr 2006 31st Mar 2024 508,535 457,416 508,535 457,416(ii) Year of issuance 2007 Listed Annually 500,000 16.00% 10 Year 1st Aug 2007 31st Jul 2017 540,000 540,000 540,000 540,000 Annually 700,000 16.75% 15 Year 1st Aug 2007 31st Jul 2022 758,625 758,625 758,625 758,625(iii) Year of issuance 2011 Listed Semi Annually 2,000,000 11.50% 10 Year 5th Sep 2011 4th Sep 2021 2,000,000 2,000,000 2,000,000 2,000,000(iv) Year of issuance 2013* Listed Annually 4,000,000 14.00% 5 Year 13th Jun 2013 12th Jun 2018 4,309,920 4,309,917 4,240,707 4,251,924Total 8,385,102 8,607,558 8,308,389 8,532,700Due within one year - 300,000 - 300,000Due after one year 8,385,102 8,307,558 8,308,389 8,232,700Total subordinated debentures - Bank 8,385,102 8,607,558 8,308,389 8,532,700
53 (a) ii Subordinated Debenture issued by Subsidiary Bank Group Colombo Interest Face Value Interest Rate Repayment Issue Date Maturity Date As at As at As at As at Stock Payment Rs 000 Terms 31.12.2014 31.12.2013 31.12.2014 31.12.2013 Exchange Frequency Rs 000 Rs 000 Rs 000 Rs 000 Listing
(i) Year of issuance 2013 Not Listed Monthly 100,000 17.50% 5 Year 17th Jun 2013 16th Jun 2018 - - 100,000 -Total subordinated debentures - Subsidiaries - - 100,000 -Due within one year - - - -Due after one year - - 100,000 -Total subordinated debentures - Group 8,385,102 8,607,558 8,408,389 8,532,700
* HNB Assurance PLC, subsidiary of the Bank has invested Rs 76.71 Mn in subordinated debentures issued by the Bank
53 (b) Subordinated LoanSubordinated loan represents eight year subordinated loan of USD 25 Mn from German Development Financial Institution (DEG).
Notes to theFinancial Statements

Annual Report 2014 303
54 STATED CAPITAL In accordance with Section 58 of Companies Act No 7 of 2007, which became effective from 3rd May 2007, share capital and share premium have been classified as stated capital.
54 (a) Stated Capital - Bank / Group
2014 2013 Rs 000 Rs 000
Voting ordinary shares Balance as at 1st January 10,254,944 10,049,259Issue of shares under ESOP 307,076 205,685Transfer from ESOP reserve * 78,371 -Balance as at 31st December 10,640,391 10,254,944
Non-voting ordinary sharesBalance as at 1st January 2,575,324 2,530,220Issue of shares under ESOP 54,771 45,104Transfer from ESOP reserve * 19,506 -Balance as at 31st December 2,649,601 2,575,324Stated capital as at 31st December 13,289,992 12,830,268
54 (b) Reconciliation of Number of Shares
2014 2013
Voting ordinary sharesBalance as at 1st January 319,353,829 317,650,102 Issue of shares under ESOP 2,382,680 1,703,727 Balance as at 31st December 321,736,509 319,353,829
Non-voting ordinary shares Balance as at 1st January 80,201,372 79,596,347 Issue of shares under ESOP 659,775 605,025Balance as at 31st December 80,861,147 80,201,372 Total number of shares as at 31st December 402,597,656 399,555,201
* Fair value of options on the grant date relating to options exercised as at 31st December 2014 has been transferred from the ESOP reserve to stated capital during the year.
The non-voting shares rank pari passu in respect of all rights with the ordinary shares of the Bank except voting rights on resolutions passed at general meetings.If the Bank fails to pay dividends for three consecutive years, these shares will automatically be converted into voting ordinary shares.
54 (c) Share-Based Payment TransactionsOn 28th March 2008 the Bank established an Employee Share Option Scheme that entitles employees in the rank of management and above to purchase shares in the Bank. Holders of vested options are entitled to purchase shares at the given exercise prices.
The recognition and measurement principles in Sri Lanka Accounting Standard (SLFRS 2) “Share Based Payment” have not been applied to the grants made in 2008 and 2010 based on the transitional provisions available in SLFRS 2. The standard is applied for share options granted after 1st January 2012 and have not been vested on the effective date of SLFRS 2.
The Bank made two further grants under the Employee Share Option Scheme on 30th March 2012 and 05th June 2013, which are recognised and measured in terms of SLFRS 2.
All options are to be settled by physical delivery of shares.
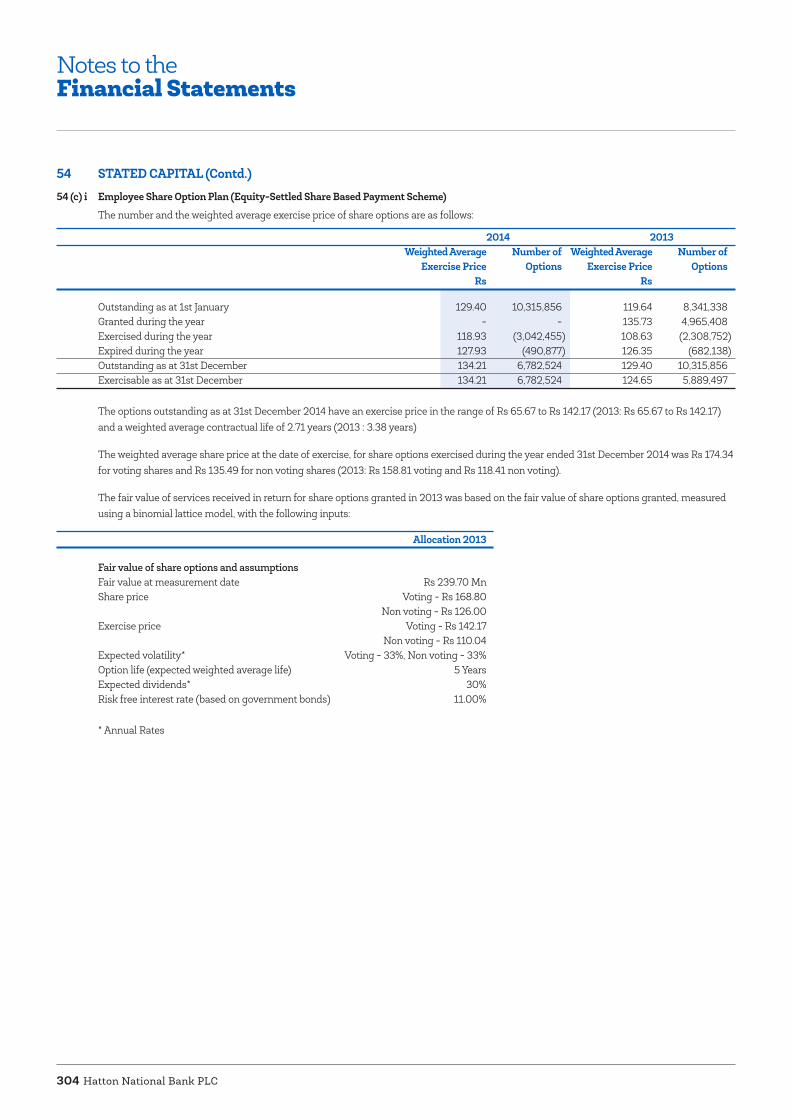
Hatton National Bank PLC304
54 STATED CAPITAL (Contd.) 54 (c) i Employee Share Option Plan (Equity-Settled Share Based Payment Scheme)
The number and the weighted average exercise price of share options are as follows:
2014 2013 Weighted Average Number of Weighted Average Number of
Exercise Price Options Exercise Price Options Rs Rs
Outstanding as at 1st January 129.40 10,315,856 119.64 8,341,338Granted during the year - - 135.73 4,965,408Exercised during the year 118.93 (3,042,455) 108.63 (2,308,752)Expired during the year 127.93 (490,877) 126.35 (682,138)Outstanding as at 31st December 134.21 6,782,524 129.40 10,315,856Exercisable as at 31st December 134.21 6,782,524 124.65 5,889,497
The options outstanding as at 31st December 2014 have an exercise price in the range of Rs 65.67 to Rs 142.17 (2013: Rs 65.67 to Rs 142.17) and a weighted average contractual life of 2.71 years (2013 : 3.38 years)
The weighted average share price at the date of exercise, for share options exercised during the year ended 31st December 2014 was Rs 174.34 for voting shares and Rs 135.49 for non voting shares (2013: Rs 158.81 voting and Rs 118.41 non voting).
The fair value of services received in return for share options granted in 2013 was based on the fair value of share options granted, measured using a binomial lattice model, with the following inputs:
Allocation 2013
Fair value of share options and assumptions Fair value at measurement date Rs 239.70 Mn Share price Voting - Rs 168.80 Non voting - Rs 126.00 Exercise price Voting - Rs 142.17 Non voting - Rs 110.04 Expected volatility* Voting - 33%, Non voting - 33% Option life (expected weighted average life) 5 Years Expected dividends* 30% Risk free interest rate (based on government bonds) 11.00%
* Annual Rates
Notes to theFinancial Statements
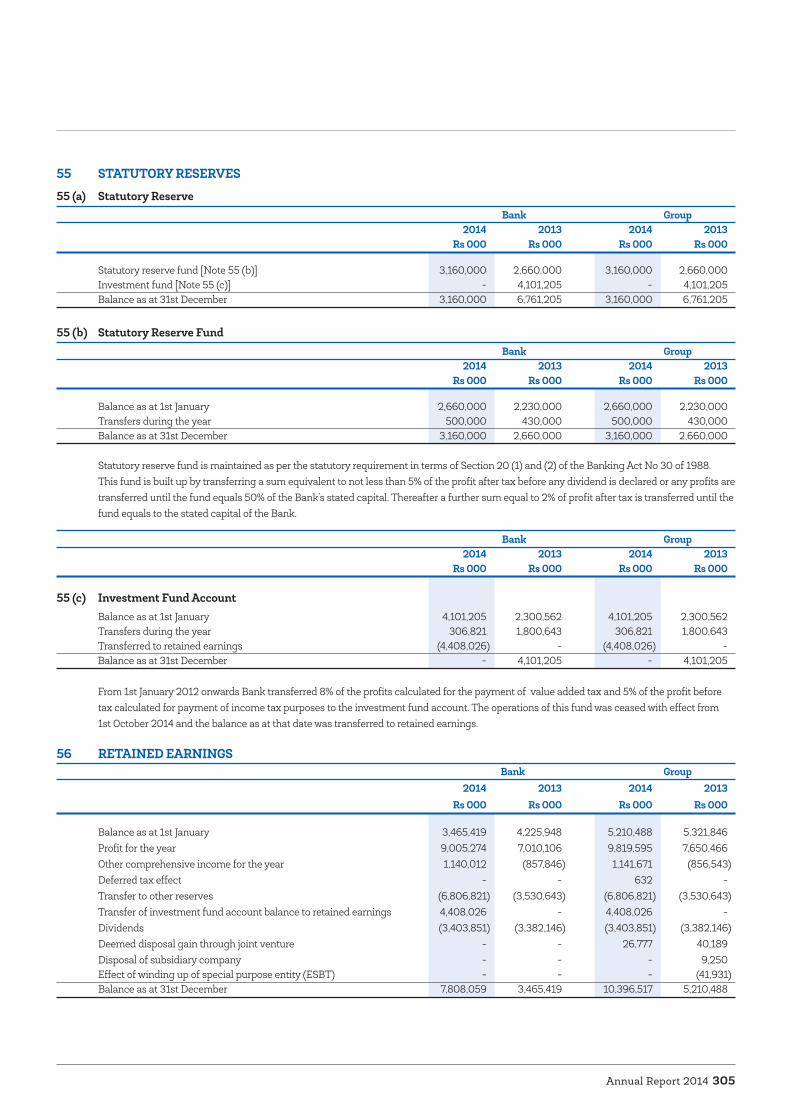
Annual Report 2014 305
55 STATUTORY RESERVES55 (a) Statutory Reserve Bank Group
2014 2013 2014 2013 Rs 000 Rs 000 Rs 000 Rs 000
Statutory reserve fund [Note 55 (b)] 3,160,000 2,660,000 3,160,000 2,660,000 Investment fund [Note 55 (c)] - 4,101,205 - 4,101,205 Balance as at 31st December 3,160,000 6,761,205 3,160,000 6,761,205
55 (b) Statutory Reserve Fund Bank Group
2014 2013 2014 2013 Rs 000 Rs 000 Rs 000 Rs 000
Balance as at 1st January 2,660,000 2,230,000 2,660,000 2,230,000 Transfers during the year 500,000 430,000 500,000 430,000 Balance as at 31st December 3,160,000 2,660,000 3,160,000 2,660,000
Statutory reserve fund is maintained as per the statutory requirement in terms of Section 20 (1) and (2) of the Banking Act No 30 of 1988.This fund is built up by transferring a sum equivalent to not less than 5% of the profit after tax before any dividend is declared or any profits are transferred until the fund equals 50% of the Bank’s stated capital. Thereafter a further sum equal to 2% of profit after tax is transferred until the fund equals to the stated capital of the Bank.
Bank Group 2014 2013 2014 2013
Rs 000 Rs 000 Rs 000 Rs 000
55 (c) Investment Fund AccountBalance as at 1st January 4,101,205 2,300,562 4,101,205 2,300,562Transfers during the year 306,821 1,800,643 306,821 1,800,643Transferred to retained earnings (4,408,026) - (4,408,026) -Balance as at 31st December - 4,101,205 - 4,101,205
From 1st January 2012 onwards Bank transferred 8% of the profits calculated for the payment of value added tax and 5% of the profit before tax calculated for payment of income tax purposes to the investment fund account. The operations of this fund was ceased with effect from 1st October 2014 and the balance as at that date was transferred to retained earnings.
56 RETAINED EARNINGS Bank Group
2014 2013 2014 2013 Rs 000 Rs 000 Rs 000 Rs 000
Balance as at 1st January 3,465,419 4,225,948 5,210,488 5,321,846Profit for the year 9,005,274 7,010,106 9,819,595 7,650,466Other comprehensive income for the year 1,140,012 (857,846) 1,141,671 (856,543)Deferred tax effect - - 632 -Transfer to other reserves (6,806,821) (3,530,643) (6,806,821) (3,530,643)Transfer of investment fund account balance to retained earnings 4,408,026 - 4,408,026 -Dividends (3,403,851) (3,382,146) (3,403,851) (3,382,146)Deemed disposal gain through joint venture - - 26,777 40,189Disposal of subsidiary company - - - 9,250Effect of winding up of special purpose entity (ESBT) - - - (41,931)Balance as at 31st December 7,808,059 3,465,419 10,396,517 5,210,488
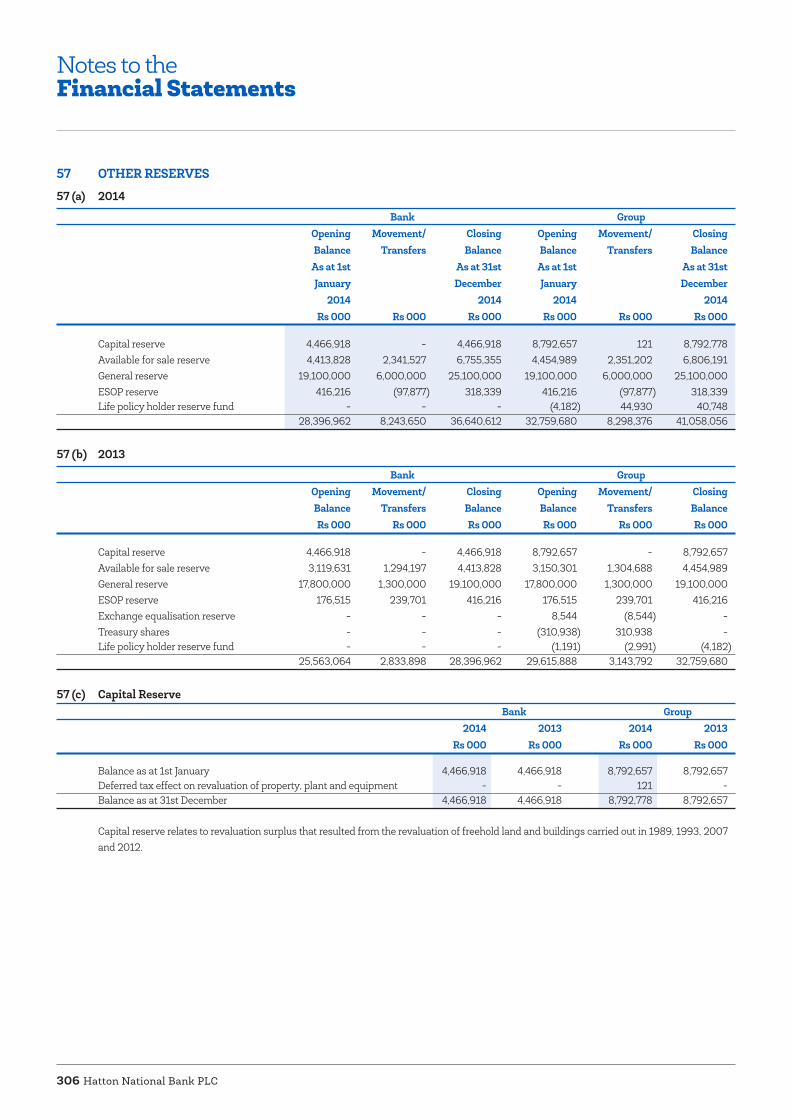
Hatton National Bank PLC306
57 OTHER RESERVES57 (a) 2014
Bank Group Opening Movement/ Closing Opening Movement/ Closing Balance Transfers Balance Balance Transfers Balance As at 1st As at 31st As at 1st As at 31st January December January December 2014 2014 2014 2014
Rs 000 Rs 000 Rs 000 Rs 000 Rs 000 Rs 000
Capital reserve 4,466,918 - 4,466,918 8,792,657 121 8,792,778Available for sale reserve 4,413,828 2,341,527 6,755,355 4,454,989 2,351,202 6,806,191General reserve 19,100,000 6,000,000 25,100,000 19,100,000 6,000,000 25,100,000ESOP reserve 416,216 (97,877) 318,339 416,216 (97,877) 318,339Life policy holder reserve fund - - - (4,182) 44,930 40,748 28,396,962 8,243,650 36,640,612 32,759,680 8,298,376 41,058,056
57 (b) 2013
Bank Group Opening Movement/ Closing Opening Movement/ Closing Balance Transfers Balance Balance Transfers Balance
Rs 000 Rs 000 Rs 000 Rs 000 Rs 000 Rs 000
Capital reserve 4,466,918 - 4,466,918 8,792,657 - 8,792,657 Available for sale reserve 3,119,631 1,294,197 4,413,828 3,150,301 1,304,688 4,454,989 General reserve 17,800,000 1,300,000 19,100,000 17,800,000 1,300,000 19,100,000 ESOP reserve 176,515 239,701 416,216 176,515 239,701 416,216 Exchange equalisation reserve - - - 8,544 (8,544) - Treasury shares - - - (310,938) 310,938 - Life policy holder reserve fund - - - (1,191) (2,991) (4,182) 25,563,064 2,833,898 28,396,962 29,615,888 3,143,792 32,759,680
57 (c) Capital Reserve Bank Group
2014 2013 2014 2013 Rs 000 Rs 000 Rs 000 Rs 000
Balance as at 1st January 4,466,918 4,466,918 8,792,657 8,792,657 Deferred tax effect on revaluation of property, plant and equipment - - 121 - Balance as at 31st December 4,466,918 4,466,918 8,792,778 8,792,657
Capital reserve relates to revaluation surplus that resulted from the revaluation of freehold land and buildings carried out in 1989, 1993, 2007 and 2012.
Notes to theFinancial Statements

Annual Report 2014 307
57 OTHER RESERVES (Contd.) 57 (d) Available-for-sale Reserve Bank Group
2014 2013 2014 2013 Rs 000 Rs 000 Rs 000 Rs 000
Balance as at 1st January 4,413,828 3,119,631 4,454,989 3,150,301Net change in fair value during the year 3,027,688 1,294,197 3,107,085 1,304,688Net amount transferred to profit or loss on disposal of available for sale financial assets (645,437) - (715,159) -Deferred tax effect (40,724) - (40,724) -Balance as at 31st December 6,755,355 4,413,828 6,806,191 4,454,989
The available for sale reserve comprises of the cumulative net change in fair value of available-for-sale financial investments until the assets are derecognised or impaired.
57 (e) General Reserve Bank Group
2014 2013 2014 2013 Rs 000 Rs 000 Rs 000 Rs 000
Balance as at 1st January 19,100,000 17,800,000 19,100,000 17,800,000Transfer during the year 6,000,000 1,300,000 6,000,000 1,300,000Balance as at 31st December 25,100,000 19,100,000 25,100,000 19,100,000
General reserve comprises of the amounts appropriated by the Board of Directors as a general banking reserve.
57 (f) ESOP Reserve Bank Group
2014 2013 2014 2013 Rs 000 Rs 000 Rs 000 Rs 000
Balance as at 1st January 416,216 176,515 416,216 176,515Allocations during the year - 239,701 - 239,701Transfer to stated capital (97,877) - (97,877) -Balance as at 31st December 318,339 416,216 318,339 416,216
ESOP reserve consists of the liability recognised on account of the ESOP allocations granted in 2012 and 2013 [Note 3.13.3 (b)]
57 (g) Exchange Equalisation Reserve Bank Group
2014 2013 2014 2013 Rs 000 Rs 000 Rs 000 Rs 000
Balance as at 1st January - - - 8,544 Gains / (losses) arising from translating the financial statements of foreign operations - - - 706 Disposal of subsidiary company - - - (9,250)Balance as at 31st December - - - -
Exchange equalisation reserve consists of foreign exchange differences resulting from translating the financial statements of foreign subsidiary company to functional currency of the Group (Sri Lankan Rupees).
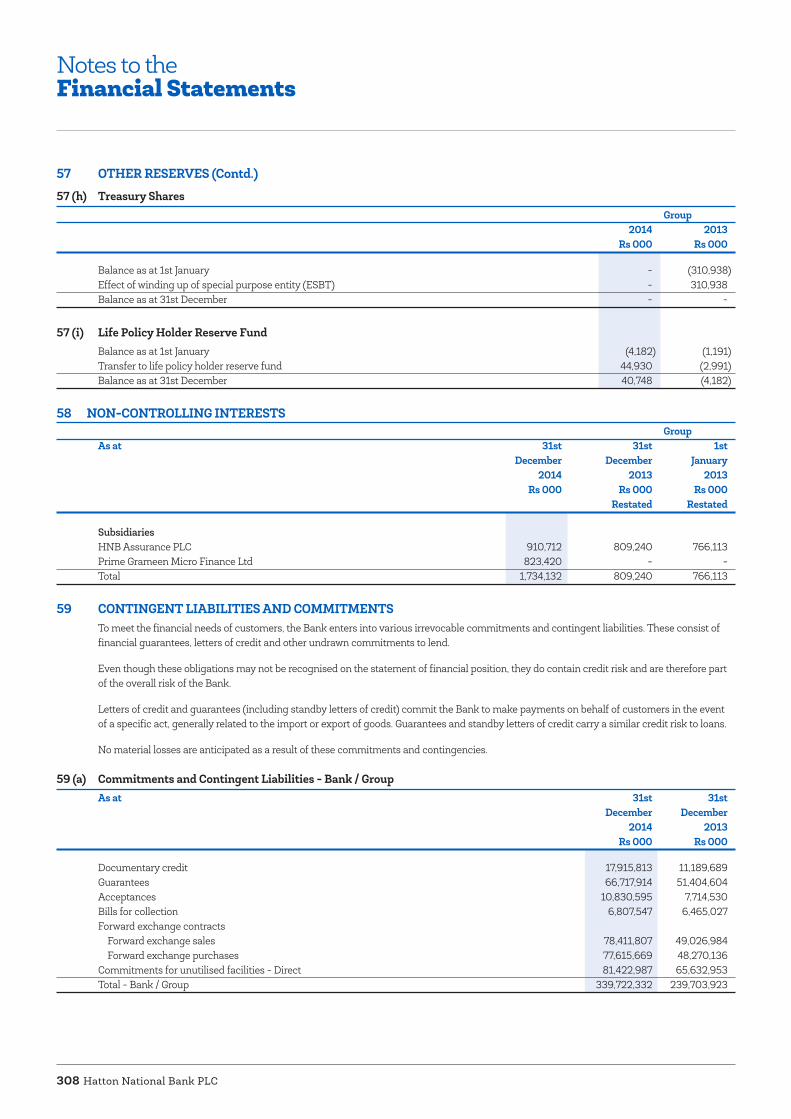
Hatton National Bank PLC308
57 OTHER RESERVES (Contd.) 57 (h) Treasury Shares Group
2014 2013 Rs 000 Rs 000
Balance as at 1st January - (310,938)Effect of winding up of special purpose entity (ESBT) - 310,938Balance as at 31st December - -
57 (i) Life Policy Holder Reserve FundBalance as at 1st January (4,182) (1,191)Transfer to life policy holder reserve fund 44,930 (2,991)Balance as at 31st December 40,748 (4,182)
58 NON-CONTROLLING INTERESTS Group
As at 31st 31st 1st December December January 2014 2013 2013 Rs 000 Rs 000 Rs 000
Restated Restated
Subsidiaries HNB Assurance PLC 910,712 809,240 766,113Prime Grameen Micro Finance Ltd 823,420 - -Total 1,734,132 809,240 766,113
59 CONTINGENT LIABILITIES AND COMMITMENTS To meet the financial needs of customers, the Bank enters into various irrevocable commitments and contingent liabilities. These consist of financial guarantees, letters of credit and other undrawn commitments to lend.
Even though these obligations may not be recognised on the statement of financial position, they do contain credit risk and are therefore part of the overall risk of the Bank.
Letters of credit and guarantees (including standby letters of credit) commit the Bank to make payments on behalf of customers in the event of a specific act, generally related to the import or export of goods. Guarantees and standby letters of credit carry a similar credit risk to loans.
No material losses are anticipated as a result of these commitments and contingencies.
59 (a) Commitments and Contingent Liabilities - Bank / Group As at 31st 31st December December 2014 2013
Rs 000 Rs 000
Documentary credit 17,915,813 11,189,689Guarantees 66,717,914 51,404,604Acceptances 10,830,595 7,714,530Bills for collection 6,807,547 6,465,027Forward exchange contracts Forward exchange sales 78,411,807 49,026,984 Forward exchange purchases 77,615,669 48,270,136Commitments for unutilised facilities - Direct 81,422,987 65,632,953Total - Bank / Group 339,722,332 239,703,923
Notes to theFinancial Statements
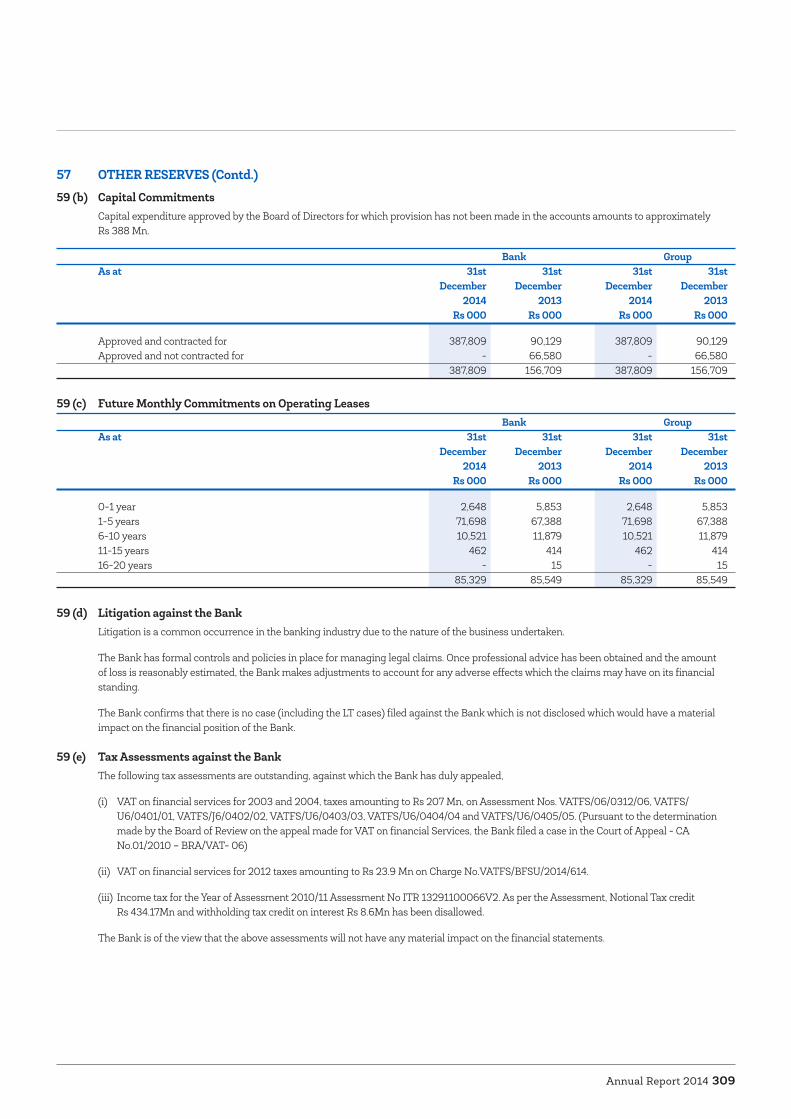
Annual Report 2014 309
57 OTHER RESERVES (Contd.) 59 (b) Capital Commitments
Capital expenditure approved by the Board of Directors for which provision has not been made in the accounts amounts to approximately Rs 388 Mn.
Bank Group As at 31st 31st 31st 31st December December December December 2014 2013 2014 2013
Rs 000 Rs 000 Rs 000 Rs 000
Approved and contracted for 387,809 90,129 387,809 90,129Approved and not contracted for - 66,580 - 66,580 387,809 156,709 387,809 156,709
59 (c) Future Monthly Commitments on Operating Leases Bank Group
As at 31st 31st 31st 31st December December December December 2014 2013 2014 2013
Rs 000 Rs 000 Rs 000 Rs 000
0-1 year 2,648 5,853 2,648 5,8531-5 years 71,698 67,388 71,698 67,3886-10 years 10,521 11,879 10,521 11,87911-15 years 462 414 462 41416-20 years - 15 - 15 85,329 85,549 85,329 85,549
59 (d) Litigation against the Bank Litigation is a common occurrence in the banking industry due to the nature of the business undertaken.
The Bank has formal controls and policies in place for managing legal claims. Once professional advice has been obtained and the amount of loss is reasonably estimated, the Bank makes adjustments to account for any adverse effects which the claims may have on its financial standing.
The Bank confirms that there is no case (including the LT cases) filed against the Bank which is not disclosed which would have a material impact on the financial position of the Bank.
59 (e) Tax Assessments against the Bank The following tax assessments are outstanding, against which the Bank has duly appealed,
(i) VAT on financial services for 2003 and 2004, taxes amounting to Rs 207 Mn, on Assessment Nos. VATFS/06/0312/06, VATFS/U6/0401/01, VATFS/J6/0402/02, VATFS/U6/0403/03, VATFS/U6/0404/04 and VATFS/U6/0405/05. (Pursuant to the determination made by the Board of Review on the appeal made for VAT on financial Services, the Bank filed a case in the Court of Appeal - CA No.01/2010 – BRA/VAT- 06)
(ii) VAT on financial services for 2012 taxes amounting to Rs 23.9 Mn on Charge No.VATFS/BFSU/2014/614.
(iii) Income tax for the Year of Assessment 2010/11 Assessment No ITR 13291100066V2. As per the Assessment, Notional Tax credit Rs 434.17Mn and withholding tax credit on interest Rs 8.6Mn has been disallowed.
The Bank is of the view that the above assessments will not have any material impact on the financial statements.
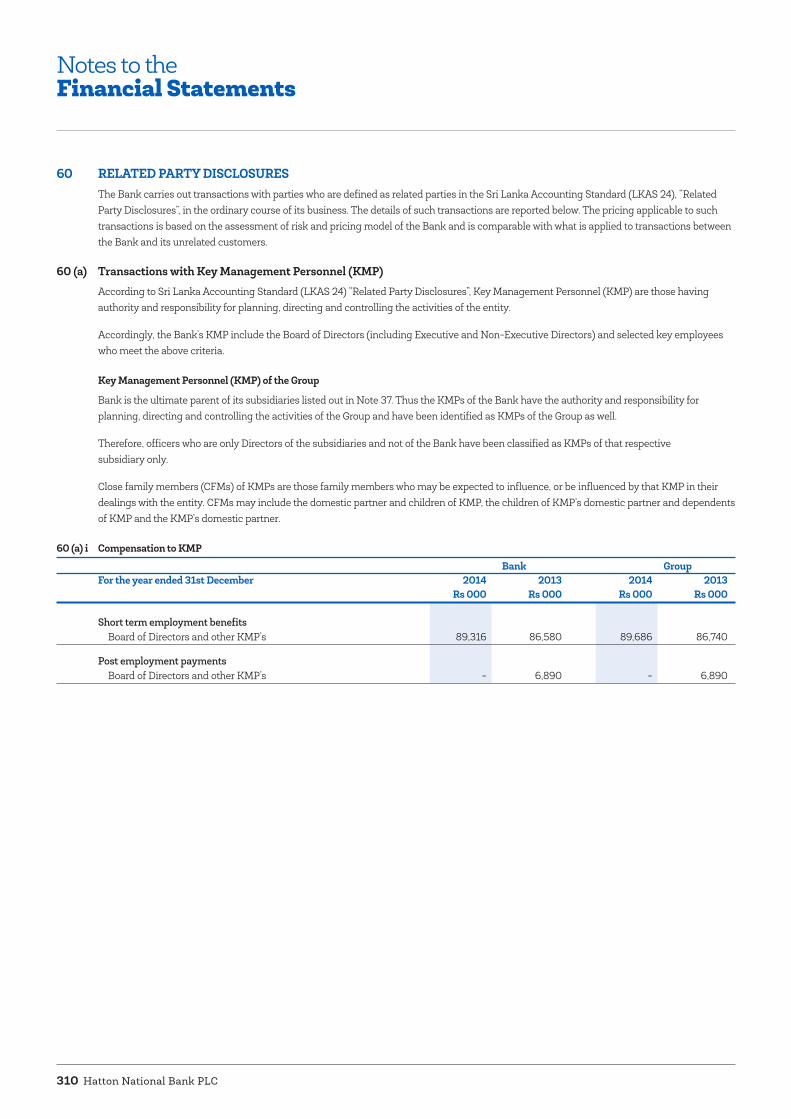
Hatton National Bank PLC310
60 RELATED PARTY DISCLOSURES The Bank carries out transactions with parties who are defined as related parties in the Sri Lanka Accounting Standard (LKAS 24), “Related Party Disclosures”, in the ordinary course of its business. The details of such transactions are reported below. The pricing applicable to such transactions is based on the assessment of risk and pricing model of the Bank and is comparable with what is applied to transactions between the Bank and its unrelated customers.
60 (a) Transactions with Key Management Personnel (KMP) According to Sri Lanka Accounting Standard (LKAS 24) “Related Party Disclosures”, Key Management Personnel (KMP) are those having authority and responsibility for planning, directing and controlling the activities of the entity.
Accordingly, the Bank’s KMP include the Board of Directors (including Executive and Non-Executive Directors) and selected key employees who meet the above criteria.
Key Management Personnel (KMP) of the Group
Bank is the ultimate parent of its subsidiaries listed out in Note 37. Thus the KMPs of the Bank have the authority and responsibility for planning, directing and controlling the activities of the Group and have been identified as KMPs of the Group as well.
Therefore, officers who are only Directors of the subsidiaries and not of the Bank have been classified as KMPs of that respective subsidiary only.
Close family members (CFMs) of KMPs are those family members who may be expected to influence, or be influenced by that KMP in their dealings with the entity. CFMs may include the domestic partner and children of KMP, the children of KMP’s domestic partner and dependents of KMP and the KMP’s domestic partner.
60 (a) i Compensation to KMP
Bank Group For the year ended 31st December 2014 2013 2014 2013
Rs 000 Rs 000 Rs 000 Rs 000
Short term employment benefits Board of Directors and other KMP’s 89,316 86,580 89,686 86,740
Post employment payments Board of Directors and other KMP’s - 6,890 - 6,890
Notes to theFinancial Statements
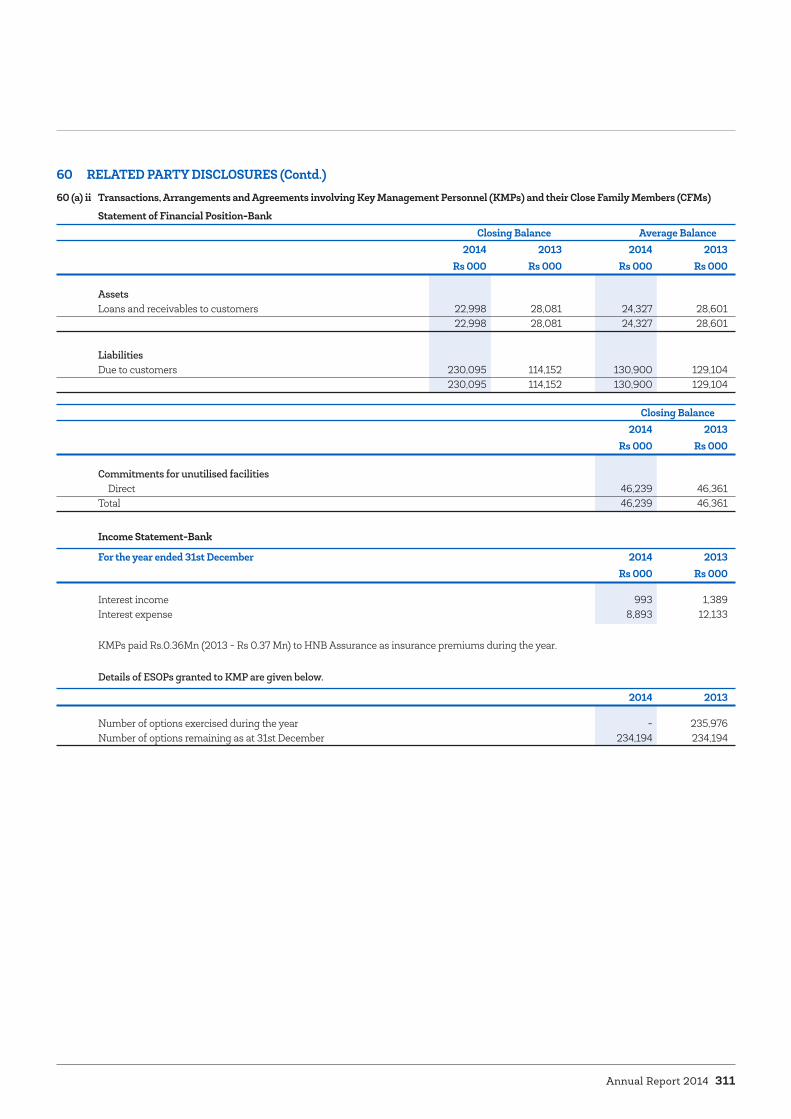
Annual Report 2014 311
60 RELATED PARTY DISCLOSURES (Contd.)60 (a) ii Transactions, Arrangements and Agreements involving Key Management Personnel (KMPs) and their Close Family Members (CFMs)
Statement of Financial Position-Bank Closing Balance Average Balance
2014 2013 2014 2013 Rs 000 Rs 000 Rs 000 Rs 000
Assets Loans and receivables to customers 22,998 28,081 24,327 28,601 22,998 28,081 24,327 28,601
LiabilitiesDue to customers 230,095 114,152 130,900 129,104 230,095 114,152 130,900 129,104
Closing Balance 2014 2013
Rs 000 Rs 000
Commitments for unutilised facilities Direct 46,239 46,361Total 46,239 46,361
Income Statement-Bank
For the year ended 31st December 2014 2013 Rs 000 Rs 000
Interest income 993 1,389Interest expense 8,893 12,133
KMPs paid Rs.0.36Mn (2013 - Rs 0.37 Mn) to HNB Assurance as insurance premiums during the year.
Details of ESOPs granted to KMP are given below.
2014 2013
Number of options exercised during the year - 235,976Number of options remaining as at 31st December 234,194 234,194

Hatton National Bank PLC312
60 RELATED PARTY DISCLOSURES (Contd.)60 (a) iii Transactions, Arrangements and Agreements with Entities which are controlled and/or jointly controlled by the KMP’s or their Close
Family Members (CFMs)
Statement of Financial Position-Bank
Closing Balance Average Balance 2014 2013 2014 2013
Rs 000 Rs 000 Rs 000 Rs 000
Assets Loans and receivables to customers 3,786,657 276,290 4,287,765 2,843,973 Financial investments - Available for sale and loans and receivables 521,156 - 499,896 - 4,307,813 276,290 4,787,661 2,843,973
LiabilitiesSecurities sold under repurchase agreements 900,000 - 250,000 -Due to customer 3,601,786 42,554 2,680,159 83,526 4,501,786 42,554 2,930,159 83,526
Commitments and contingencies
Closing Balance 2014 2013
Rs 000 Rs 000
Commitments for unutilised facilities Direct 10,762,280 3,473,170 Indirect 179,020 92,940Guarantees 59,290 49,560Letter of credits 193,181 120,380Total 11,193,771 3,736,050
Income Statement-Bank
For the year ended 31st December 2014 2013 Rs 000 Rs 000
Interest income 529,894 360,785 Interest expense 148,152 3,922 Other expenses 2,725 2,591
Notes to theFinancial Statements
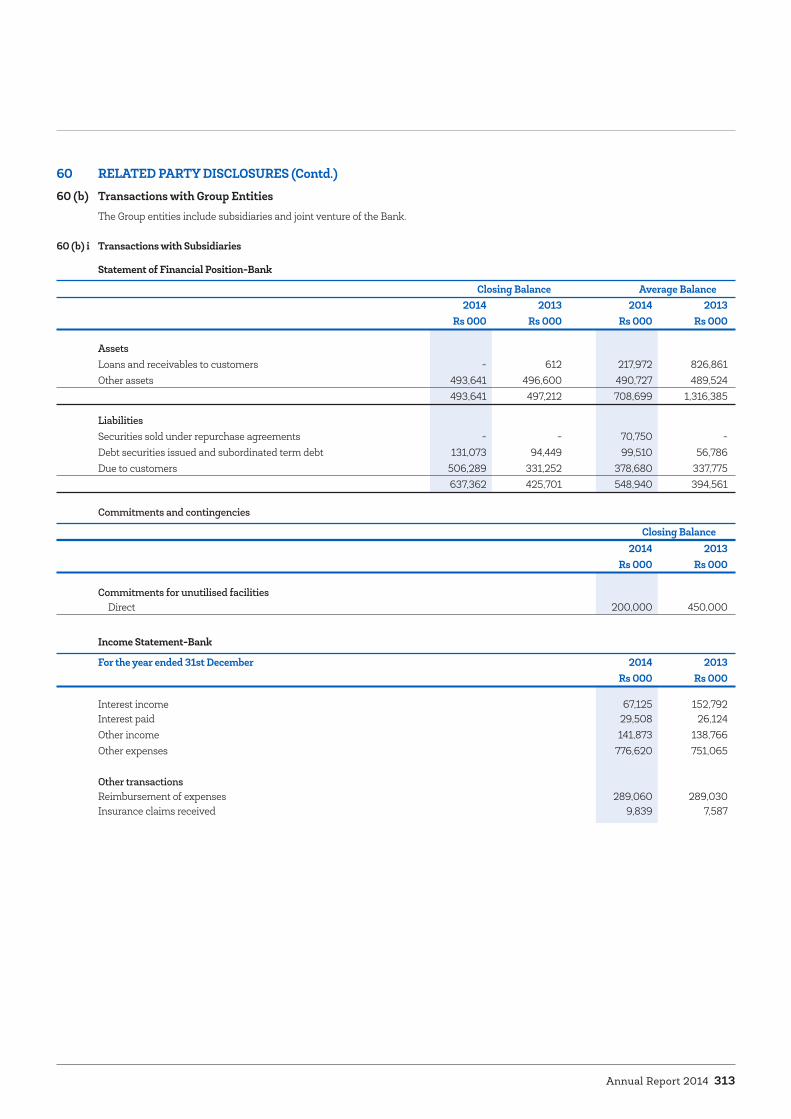
Annual Report 2014 313
60 RELATED PARTY DISCLOSURES (Contd.)60 (b) Transactions with Group Entities
The Group entities include subsidiaries and joint venture of the Bank.
60 (b) i Transactions with Subsidiaries
Statement of Financial Position-Bank
Closing Balance Average Balance 2014 2013 2014 2013
Rs 000 Rs 000 Rs 000 Rs 000
Assets Loans and receivables to customers - 612 217,972 826,861Other assets 493,641 496,600 490,727 489,524 493,641 497,212 708,699 1,316,385
LiabilitiesSecurities sold under repurchase agreements - - 70,750 -Debt securities issued and subordinated term debt 131,073 94,449 99,510 56,786Due to customers 506,289 331,252 378,680 337,775 637,362 425,701 548,940 394,561
Commitments and contingencies
Closing Balance 2014 2013
Rs 000 Rs 000
Commitments for unutilised facilities Direct 200,000 450,000
Income Statement-Bank
For the year ended 31st December 2014 2013 Rs 000 Rs 000
Interest income 67,125 152,792Interest paid 29,508 26,124Other income 141,873 138,766Other expenses 776,620 751,065
Other transactions Reimbursement of expenses 289,060 289,030Insurance claims received 9,839 7,587

Hatton National Bank PLC314
60 RELATED PARTY DISCLOSURES (Contd.)60 (b) Transactions with Group Entities (Contd.)
60 (b) ii Transactions with the Joint Venture
Statement of Financial Position-Bank Closing Balance Average Balance
2014 2013 2014 2013 Rs 000 Rs 000 Rs 000 Rs 000
Assets Loans and receivables to customers - - 19,786 9,711 - - 19,786 9,711
Liabilities Due to customers 115,010 131,223 49,443 37,575 Securities sold under repurchase agreements 83,000 5,020 70,860 19,840 198,010 136,243 120,303 57,415
Commitments and Contingencies Closing Balance
2014 2013 Rs 000 Rs 000
Commitments for unutilised facilities Direct 3,330,000 1,230,000 3,330,000 1,230,000
Income Statement-Bank For the year ended 31st December 2014 2013
Rs 000 Rs 000
Interest income 1,213 1,581Interest paid 820 1,131 Other income 12,370 10,221Other expenses 7,880 18,404
60 (c) Transactions with Post Employment Benefit Plans of the Bank
Statement of Financial Position-Bank Closing Balance Average Balance
2014 2013 2014 2013 Rs 000 Rs 000 Rs 000 Rs 000
Liabilities Due to customers 6,004,185 14,516,416 5,671,984 10,125,597 Debt securities issued and subordinated term debts 106,299 76,299 78,436 25,712 Securities sold under repurchase agreements 425,000 - 1,536,546 - 6,535,484 14,592,715 7,286,966 10,151,309
Equity Stated capital 112,051 86,570 98,127 86,564 112,051 86,570 98,127 86,564
Income Statement-Bank For the year ended 31st December 2014 2013
Rs 000 Rs 000
Interest Expense 1,308,001 1,329,733
Other Transactions Dividend paid 5,405 5,400Contribution made 1,234,293 1,307,718
Notes to theFinancial Statements

Annual Report 2014 315
60 RELATED PARTY DISCLOSURES (Contd.)60 (d) Transactions with Government of Sri Lanka/ Entities Controlled, Jointly Controlled, Significantly Influenced by the
Government of Sri LankaThe Government of Sri Lanka indirectly holds more than 25% of the voting rights of the Bank as at 31st December 2014 through Sri Lanka Insurance Corporation Ltd , Employees Provident Fund , National Savings Bank and Employees Trust Fund. Accordingly the Bank has considered Government of Sri Lanka and other entities which are controlled, jointly controlled or significantly influenced by the Government of Sri Lanka (government related entities) as related parties according to Sri Lanka Accounting Standard (LKAS 24) “ Related Party Disclosures”.
During the year ended 31st December 2014, the Bank has carried out transactions with the Government of Sri Lanka and other Government related entities in the ordinary course of its business, the details of which are given below. The pricing applicable to such transactions was based on the assessment of risk and pricing model of the Bank and was comparable with what was applied to transactions between the Bank and its unrelated customers.
Statement of Financial Position-Bank Closing Balance Average balance
2014 2013 2014 2013 Rs 000 Rs 000 Rs 000 Rs 000
Assets Financial investments - Held for trading and available for sale 83,373,000 80,784,000 91,266,760 79,791,660 Balances with Central Bank 16,907,538 16,366,368 18,403,587 19,404,153Reverse repurchase agreements 16,300,000 5,900,000 3,638,410 3,260,680 Loans and receivables to customers 23,773,965 13,619,787 18,005,238 8,398,119 Placement with banks 15,000 - 605,279 1,279,658 Financial investments - loans and receivables 552,370 526,358 671,295 729,142 140,921,873 117,196,513 132,590,569 112,863,412
Liabilities Due to customer 5,365,015 4,741,074 5,474,816 2,384,504 Due to banks 1,741,030 4,373,256 2,831,892 2,641,636Debt securities issued and subordinated term debts 6,097,256 3,518,981 3,812,506 3,157,071Securities sold under repurchase agreements 79,000 2,310,050 3,799,410 5,580,190Other borrowings 4,000,000 4,000,000 4,000,000 4,000,000 Taxation 3,297,530 3,040,108 2,816,740 2,412,443 20,579,831 21,983,469 22,735,364 20,175,844
Commitments and Contingencies
Balance as at 31st December 2014 2013
Forward foreign exchange contracts Sales - SLR 000 14,835,690 16,918,750 Purchases - USD 000 110,000 125,000
Commitments for unutilised facilities Direct - SLR 000 26,663,219 21,882,380
Income Statement-BankFor the year ended 31st December 2014 2013 Rs 000 Rs 000
Interest income 8,654,918 8,123,427Interest expense 1,266,021 1,340,160Tax expenses (Income tax, financial VAT, NBT, ESC etc.) 5,163,745 6,659,404
Transactions which are not individually significantApart from the transactions listed above the Bank has carried out transaction with the Government of Sri Lanka and other Government related entities in the form of utility bills, telephone charges, deposit insurance payments, crib charges etc. The total of such payment made during the year ended 31st December 2014 was Rs. 376.18 Mn.

Hatton National Bank PLC316
61 MATURITY ANALYSIS The table below shows an analysis of assets and liabilities analysed according to when they are expected to be recovered or settled.
61 (a) As at 31st December 2014 Bank Group
Within After Total Within After Total 12 months 12 months 12 months 12 months
Rs 000 Rs 000 Rs 000 Rs 000 Rs 000 Rs 000
Assets Cash and cash equivalents 13,141,295 - 13,141,295 13,421,850 - 13,421,850 Balances with Central Bank of Sri Lanka - 16,907,538 16,907,538 - 16,907,538 16,907,538 Placements with banks 3,789,538 - 3,789,538 4,274,326 822,129 5,096,455 Reverse repurchase agreements 16,930,572 - 16,930,572 19,575,253 - 19,575,253 Derivative financial instruments 178,370 - 178,370 178,370 - 178,370 Other financial assets held for trading 551,371 - 551,371 1,052,727 - 1,052,727 Non-current assets held for sale 30,238 - 30,238 30,238 - 30,238 Loans and receivables to customers 176,751,845 218,947,542 395,699,387 182,021,359 219,260,617 401,281,976 Financial investments - Available-for-sale 59,110,027 8,732,202 67,842,229 59,357,808 10,085,249 69,443,057 Financial investments - Held-to-maturity - - - 493,709 461,712 955,421 Financial investments - Loans and receivables 16,306,985 19,859,079 36,166,064 16,757,371 22,088,758 38,846,129 Investment in joint venture - 655,000 655,000 - 1,196,544 1,196,544 Investments in subsidiaries - 3,017,285 3,017,285 - - - Investment properties - 392,088 392,088 - 1,042,386 1,042,386 Property, plant and equipment - 9,304,665 9,304,665 - 18,290,365 18,290,365 Intangible assets and goodwill - 802,728 802,728 - 1,089,759 1,089,759 Deferred tax assets - 287,384 287,384 - 199,315 199,315 Other assets 5,156,049 5,784,221 10,940,270 6,086,905 5,581,155 11,668,060 Total assets 291,946,290 284,689,732 576,636,022 303,249,916 297,025,527 600,275,443
Liabilities Due to banks 26,979,000 16,449,762 43,428,762 27,044,294 16,460,435 43,504,729 Derivative financial instruments 630,598 - 630,598 630,598 - 630,598 Securities sold under repurchase agreements 16,983,545 - 16,983,545 16,983,545 - 16,983,545 Due to customers 405,951,411 13,375,712 419,327,123 410,117,899 15,502,483 425,620,382 Dividends payable 587,078 - 587,078 587,078 - 587,078 Other borrowings 4,236,810 108,475 4,345,285 4,236,810 108,475 4,345,285 Debt securities issued 54,356 4,397,051 4,451,407 54,356 4,788,271 4,842,627 Current tax liabilities 3,297,530 - 3,297,530 3,394,992 - 3,394,992 Insurance provision - Life - - - 1,096,930 4,465,719 5,562,649 Insurance provision - General - - - 1,279,139 - 1,279,139 Other provisions 1,810,892 - 1,810,892 2,072,815 50,274 2,123,089 Other liabilities 8,912,958 308,422 9,221,380 9,446,808 638,779 10,085,587 Subordinated term debts 411,446 11,242,313 11,653,759 411,446 11,265,600 11,677,046 Shareholders’ funds - 60,898,663 60,898,663 - 69,638,697 69,638,697 Total liabilities 469,855,624 106,780,398 576,636,022 477,356,710 122,918,793 600,275,443
Maturity gap (177,909,334) 177,909,334 (174,106,794) 174,106,794
Cumulative gap (177,909,334) - (174,106,794)
Notes to theFinancial Statements

Annual Report 2014 317
61 MATURITY ANALYSIS (Contd.)61 (a) As at 31st December 2013 Bank Group
Within After Total Within After Total 12 months 12 months 12 months 12 months
Rs 000 Rs 000 Rs 000 Rs 000 Rs 000 Rs 000
Assets Cash and cash equivalents 11,624,645 - 11,624,645 11,621,193 - 11,621,193 Balances with Central Bank of Sri Lanka - 16,366,368 16,366,368 - 16,366,368 16,366,368 Placements with banks 1,246,612 - 1,246,612 2,876,474 113,626 2,990,100 Reverse repurchase agreements 6,278,832 - 6,278,832 6,980,280 - 6,980,280 Derivative financial instruments 174,573 - 174,573 174,573 - 174,573 Other financial assets held for trading 652,312 - 652,312 986,391 - 986,391 Loans and receivables to customers 177,746,668 174,218,708 351,965,376 178,390,184 173,386,598 351,776,782 Financial investments - Available-for-sale 57,621,602 5,769,484 63,391,086 57,919,495 6,116,480 64,035,975 Financial investments - Held-to-maturity - - - 102,140 829,541 931,681 Financial investments - Loans and receivables 3,244,014 29,860,522 33,104,536 3,244,014 31,859,748 35,103,762 Investments in associates - - - - 28,864 28,864 Investment in joint venture - 655,000 655,000 - 1,046,275 1,046,274 Investments in subsidiaries - 2,357,285 2,357,285 - - - Investment properties - 346,478 346,478 - 160,864 160,864 Property, plant and equipment - 9,521,496 9,521,496 - 17,769,880 17,769,880 Goodwill and other intangible assets - 994,677 994,677 - 1,048,866 1,048,866 Deferred tax assets - 767,826 767,826 - 655,769 655,769 Other assets 4,226,196 6,637,139 10,863,335 4,995,453 6,206,665 11,202,118 Total assets 262,815,454 247,494,983 510,310,437 267,290,197 255,589,543 522,879,740
Liabilities Due to banks 17,737,380 17,196,838 34,934,218 17,737,381 17,196,837 34,934,218 Derivative financial instruments 748,962 - 748,962 748,962 - 748,962 Securities sold under repurchase agreements 4,132,602 - 4,132,602 4,132,602 - 4,132,602 Due to customers 376,112,511 11,045,879 387,158,390 375,818,165 11,045,879 386,864,044 Dividends payable 426,347 - 426,347 426,347 - 426,347 Other borrowings 530,499 4,000,000 4,530,499 456,249 4,074,250 4,530,499 Debt securities issued - 1,418,775 1,418,775 - 1,399,184 1,399,184 Current tax liabilities 3,040,108 - 3,040,108 3,075,251 - 3,075,251 Insurance provision - Life - - - - 4,348,491 4,348,491 Insurance provision - General - - - 1,011,101 - 1,011,101 Other provisions 1,567,846 1,366,285 2,934,131 1,654,024 1,366,282 3,020,306 Other liabilities 7,514,271 161,719 7,675,990 7,975,747 260,404 8,236,151 Subordinated term debts 708,543 11,148,018 11,856,561 708,543 11,073,160 11,781,703 Shareholders’ funds - 51,453,854 51,453,854 - 58,370,881 58,370,881 Total liabilities 412,519,069 97,791,368 510,310,437 413,744,372 109,135,368 522,879,740
Maturity gap (149,703,615) 149,703,615 (146,454,175) 146,454,175
Cumulative gap (149,703,615) (146,454,175)
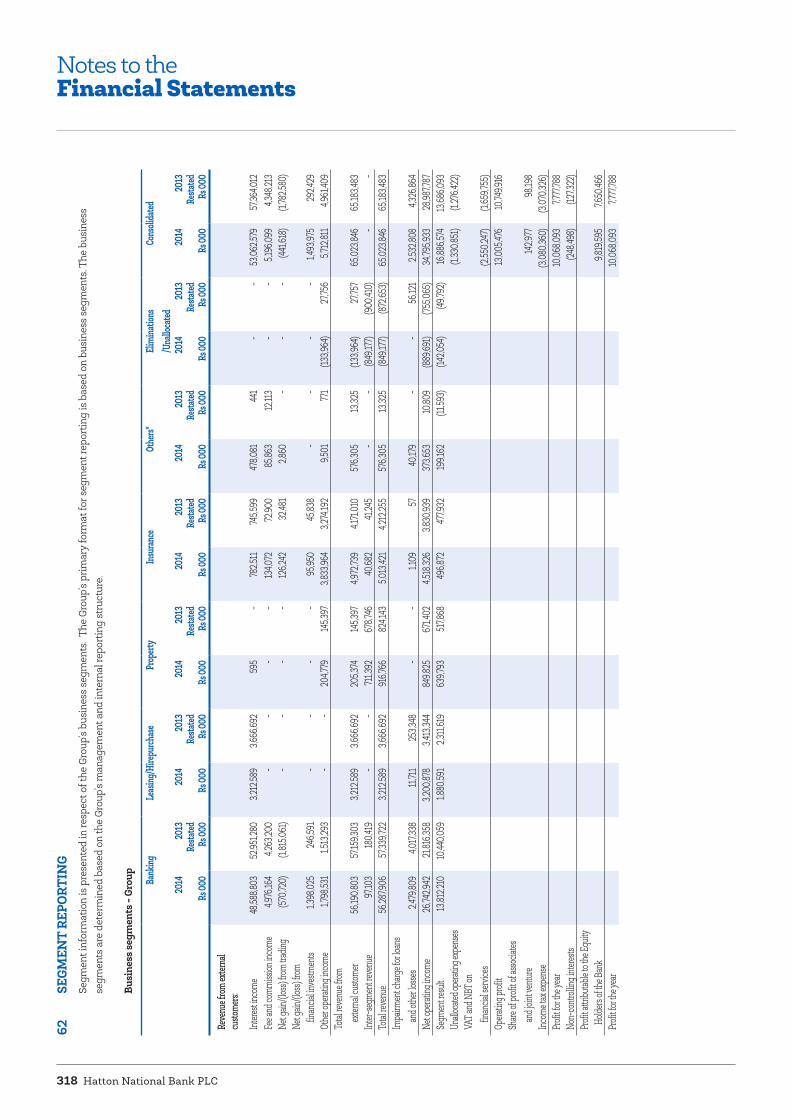
Hatton National Bank PLC318
62
SE
GMEN
T RE
PORT
ING
Segm
ent i
nfor
mat
ion
is p
rese
nted
in re
spec
t of t
he G
roup
’s bu
sine
ss s
egm
ents
. The
Gro
up’s
prim
ary
form
at fo
r seg
men
t rep
ortin
g is
bas
ed o
n bu
sine
ss s
egm
ents
. The
bus
ines
s se
gmen
ts a
re d
eter
min
ed b
ased
on
the
Grou
p’s
man
agem
ent a
nd in
tern
al re
port
ing
stru
ctur
e.
Busi
ness
segm
ents
- Gr
oup
Bank
ingLe
asing
/Hire
purch
ase
Prop
erty
Insu
rance
Othe
rs*Eli
mina
tions
/U
nallo
cated
Cons
olida
ted
2014
2013
2014
2013
2014
2013
2014
2013
2014
2013
2014
2013
2014
2013
Resta
tedRe
stated
Resta
tedRe
stated
Resta
tedRe
stated
Resta
tedRs
000
Rs 00
0Rs
000
Rs 00
0Rs
000
Rs 00
0Rs
000
Rs 00
0Rs
000
Rs 00
0Rs
000
Rs 00
0Rs
000
Rs 00
0
Reve
nue f
rom ex
terna
l cu
stome
rs:
Intere
st inc
ome
48,58
8,803
52
,951,2
80 3,
212,5
89
3,666
,692
595
- 78
2,511
745,5
99 47
8,081
44
1 -
- 53
,062,5
79
57,36
4,012
Fe
e and
comm
ission
inco
me 4,
976,1
64
4,263
,200
- -
- -
134,0
72
72,90
0 85
,863
12,11
3 -
- 5,
196,0
99
4,34
8,213
Ne
t gain
/(los
s) fro
m tra
ding
(570
,720)
(1,81
5,061
) -
- -
- 12
6,242
32
,481
2,86
0 -
- -
(441
,618)
(1,78
2,580
)Ne
t gain
/(los
s) fro
m
finan
cial in
vestm
ents
1,398
,025
246,5
91 -
- -
- 95
,950
45,83
8 -
- -
- 1,4
93,97
5 29
2,429
Ot
her o
perat
ing in
come
1,798
,531
1,513
,293
- -
204,7
79
145,3
97 3,
833,9
64
3,274
,192
9,50
1 77
1 (1
33,96
4)27
,756
5,71
2,811
4,96
1,409
To
tal re
venu
e from
exter
nal c
ustom
er 56
,190,8
03
57,15
9,303
3,21
2,589
3,6
66,69
2 20
5,374
14
5,397
4,97
2,739
4,1
71,01
057
6,305
13,32
5 (13
3,964
)27
,757
65,02
3,846
65
,183,4
83Int
er-se
gmen
t reve
nue
97,10
3 18
0,419
- -
711,3
92
678,7
46 40
,682
41,24
5 -
- (8
49,17
7) (9
00,41
0) -
- To
tal re
venu
e 56
,287,9
06
57,33
9,722
3,21
2,589
3,
666,6
92
916,7
66
824,1
43 5,
013,4
21
4,212
,255
576,3
05
13,32
5 (8
49,17
7) (8
72,65
3) 65
,023,8
46
65,18
3,483
Impa
irmen
t cha
rge fo
r loan
s
and o
ther lo
sses
2,47
9,809
4,0
17,33
8 11
,711
253,3
48
- -
1,109
57
40
,179
- -
56,12
1 2,
532,8
08
4,32
6,864
Ne
t ope
rating
inco
me 26
,742,9
42
21,81
6,358
3,20
0,878
3,4
13,34
4 84
9,825
67
1,402
4,51
8,326
3,8
30,93
9 37
3,653
10
,809
(889
,691)
(755
,065)
34,79
5,933
28
,987,7
87
Segm
ent re
sult
13,81
2,210
10
,440,0
59 1,8
80,59
1 2,3
11,61
9 63
9,793
51
7,868
496,8
72
477,9
32 19
9,162
(1
1,593
) (1
42,05
4) (4
9,792
) 16
,886,5
74
13,68
6,093
Un
alloc
ated o
perat
ing ex
pens
es
(1,33
0,851
) (1
,276,4
22)
VAT a
nd N
BT on
finan
cial se
rvice
s (2
,550,2
47)
(1,65
9,755
)Op
eratin
g profi
t 13
,005,4
76
10,74
9,916
Sh
are of
profi
t of a
ssocia
tes
an
d join
t ven
ture
142,9
77
98,19
8Inc
ome t
ax ex
pens
e (3
,080,3
60)
(3,07
0,326
)Pr
ofit fo
r the y
ear
10,06
8,093
7,7
77,78
8 No
n-co
ntroll
ing in
teres
ts (2
48,49
8) (1
27,32
2)Pr
ofit a
ttribu
table
to the
Equit
y H
olders
of th
e Ban
k 9,
819,5
95
7,650
,466
Profi
t for th
e yea
r 10
,068,0
93
7,777
,788
Notes to theFinancial Statements

Annual Report 2014 319
Bank
ingLe
asing
/Hire
purch
ase
Prop
erty
Insu
rance
Othe
rs*Eli
mina
tions
/U
nallo
cated
Cons
olida
ted
2014
2013
2014
2013
2014
2013
2014
2013
2014
2013
2014
2013
2014
2013
Resta
tedRe
stated
Resta
tedRe
stated
Resta
tedRe
stated
Resta
tedRs
000
Rs 00
0Rs
000
Rs 00
0Rs
000
Rs 00
0Rs
000
Rs 00
0Rs
000
Rs 00
0Rs
000
Rs 00
0Rs
000
Rs 00
0Ot
her c
ompre
hens
ive
inc
ome ,
net o
f tax
3,48
1,539
43
6,351
- -
- -
1,168
(2
,610)
6,84
7 -
8,37
8 15
,124
3,49
7,932
44
8,865
To
tal Co
mpreh
ensiv
e inc
ome
13,56
6,025
8,
226,6
53
Non c
ontro
lling i
nteres
ts (2
52,92
5) (1
27,33
6)To
tal co
mpreh
ensiv
e inc
ome
attrib
utable
to th
e Equ
ity
Holde
rs of
the Ba
nk 13
,313,1
00
8,099
,317
Segm
ent a
ssets
527,2
64,74
6 46
2,198
,251
23,94
1,618
22
,606,0
90 7,5
85,28
0 7,6
26,70
6 9,
969,3
16
8,059
,665
9,25
1,320
-
(149
,211)
(759
,784)
577,8
63,06
9 49
9,730
,928
Inves
tmen
t in as
socia
tes
1,196
,544
1,046
,274
Unall
ocate
d asse
ts 21
,215,8
30
22,10
2,538
Total
Asse
ts 60
0,275
,443
522,8
79,74
0Se
gmen
t liab
ilities
46
5,225
,102
410,3
17,35
6 23
,941,6
18
22,60
6,090
600,0
02
1,146
,995
7,555
,382
5,946
,553
8,13
3,708
-
(1,38
9,706
) (1
,441,2
68)
504,0
66,10
6 43
8,575
,726
Unall
ocate
d liab
ilities
26
,570,6
40
25,93
3,133
Total
liabil
ities
530,6
36,74
6 46
4,508
,859
Cash
flows
from
ope
rating
activ
ities
2,49
0,188
(5
,982,3
58)
(1,36
6,640
)2,8
17,66
5 62
8,878
61
1,961
854,0
29
236,3
96 1,9
01,78
6 -
(2,12
6,249
) (1
86,32
6) 2,
381,9
92
(2,50
2,662
)Ca
sh flo
ws fro
m
inve
sting
activ
ities
(5,21
2,434
) (17
,043,5
52)
- -
30,51
9 (1
0,856
) (6
25,58
9) (2
00,88
3) 1,4
78,25
6 -
(2,08
9,767
)13
0,063
(6,41
9,015
) (1
7,125
,228)
Cash
flows
from
fi
nanc
ing ac
tivitie
s 8,
148,4
62
13,98
8,464
- -
(502
,982)
(505
,001)
(162
,500)
(137
,500)
(214
,493)
- 67
5,548
51
4,251
7,944
,035
13,86
0,214
Ca
pital
expe
nditu
re 79
2,823
1,5
28,97
5 8,
242
97,52
6 -
10,85
6 53
,538
64,81
2 18
,129
- -
- 87
2,732
1,7
02,16
9 De
precia
tion
830,1
63
848,1
41 19
7 2,7
33 13
2,544
13
1,355
40,81
4 36
,812
8,65
4 -
2,64
0 7,9
03 1,0
15,01
2 1,0
26,94
4 Am
ortiza
tion
280,1
14
223,9
94 16
,522
9,388
68
68 17
,975
16,02
8 1,1
60
- -
- 31
5,839
24
9,478

Hatton National Bank PLC320
63 NET ASSETS VALUE PER ORDINARY SHARE Bank Group
As at 31st December 2014 2013 2014 2013
Amount used as the numerator: Shareholders’ funds (Rs 000) 60,898,667 51,453,854 67,904,565 57,561,641Number of ordinary shares used as the denominator: Total number of shares 402,597,656 399,555,201 402,597,656 399,555,201Net assets value per share (Rs) 151.26 128.78 168,67 144.06
64 EVENTS OCCURRING AFTER THE REPORTING PERIODThere are no events occurring after the reporting date which require adjustments to or disclosure in the financial statements, other than those disclosed below:
64 (a) Proposed Dividends Refer Note 23 (a).
64 (b) Super Gains TaxAccording to the interim budget presented to the Parliament on 29th January 2015 (which was passed in the Parliament on 7th February 2015) a tax of 25% will be imposed on the profits of any company exceeding Rs 2,000 Mn earned in the year of assessment 2013/14 as a one off tax, which is yet to be enacted.
64 (c) Transfer of General Insurance Business to HNB General Insurance Ltd by HNB Assurance PLC (HNBA), Bank’s fully Owned SubsidiaryHNBA transferred its general insurance business to the new fully owned subsidiary company HNB general insurance Ltd w.e.f. 1st January 2015 in line with the segregation guidelines issued by the Insurance Board of Sri Lanka (IBSL).
Accordingly, HNB Assurance PLC has become a Life Insurance Company w.e.f. 1st January 2015 and HNB General Insurance Ltd, is a licensed General Insurance Company.
Notes to theFinancial Statements

Annual Report 2014 321
65 COMPARATIVE INFORMATION The presentation and classification of the following items in these financial statements are amended to ensure the comparability with the current year.
Bank
65 (a) Note As disclosed Current Adjustment previously Presentation
Rs 000 Rs 000 Rs 000
Income Statement Income 65 (a) i,ii 60,073,685 61,006,414 (932,729)Interest income 65 (a) i 55,749,193 56,770,713 (1,021,520)Fee and commission income 65 (a) ii 4,351,992 4,263,200 88,792 Impairment charge/(reversal) for loans and other losses 65 (a) i 3,249,166 4,270,686 (1,021,520)Other expenses 65 (a) ii 8,197,298 8,108,508 88,790
65 (a) i Reclassification of pawning interest losses from auctions of Rs 1,021 Mn as impairment charge / (reversal) for loans and other losses.
65 (a) ii Set off of expenses relating to generating commission income of Rs 88.79 Mn included in other expenses against fee and commission income.
65 (b) As disclosed Current Adjustment previously Presentation
Rs 000 Rs 000 Rs 000
Statement of Financial Position Reverse repurchase agreements - 6,278,832 (6,278,832)Loans and receivables to banks 6,267,809 - 6,267,809 Loans and receivables to customers 351,976,401 351,965,376 11,025
65 (b) i Reclassification of reverse repurchase agreements included in loans and receivables to banks and customers.
65 (c) Note As disclosed Current Adjustment previously Presentation
Rs 000 Rs 000 Rs 000
Statement of Financial Position Securities sold under repurchase agreements 65 (c) i - 4,132,602 (4,132,602)Due to customers 65 (c) ii 385,360,970 387,158,390 (1,797,420)Other borrowings 65 (c) i 8,663,102 4,530,500 4,132,602 Other provisions 65 (c) iii 2,919,320 2,934,132 (14,812)Other liabilities 65 (c) ii,iii 9,488,222 7,675,910 1,812,312
65 (c) i Reclassification of securities sold under repurchase agreements included on other borrowings of Rs 4,132.6 Mn.
65 (c) ii Reclassification of margin deposits of Rs 1,797 Mn included in other liabilities as due to customers.
65 (c) iii Reclassification of other provisions of Rs 14.8 Mn included in other liabilities.

Hatton National Bank PLC322
Notes to theFinancial Statements
65 COMPARATIVE INFORMATION (Contd.)65 (d) Group
The reclassifications in the Bank’s financial statements discussed above will have the same effect on the Group. Apart from these reclassifications the Group’s financial statements were changed as a result of the change in accounting policy on accounting for joint venture company, Acuity Partners (Pvt) Ltd as discussed in Note 2.8.1. The effect on this accounting policy change as at 31st December 2013 is summarised below.
Rs.000
AssetsCash and cash equivalents 33,096 Statutory deposit with Central Bank of Sri Lanka 197 Placements with banks 93,485 Other financial assets held for trading 1,581,745 Financial investments - Available for sale 234,119 Financial investments - Held to maturity 72,820 Non-current assets held for sale Loans and receivable to banks 413,734 Loans and advances 420,218 Investments in associates companies 553,251 Deferred tax assets 422 Property, plant and equipment 21,282 Intangible assets 72,139 Other assets 319,111 Total assets 3,815,619
Liabilities Due to banks 426,708 Dividends payable 1,796 Borrowings 1,665,377 Debt securities 131,111 Other provisions 22,035 Current tax liability 59,157 Deferred tax liability Other liabilities 57,888 Total liabilities 2,364,072
Non controlling interest 293,135 Group’s share of net assets of joint venture company as at December 2013 1,158,412Share of unrealised profit on disposal of investments (112,138)Group’s share of net assets of joint venture company 1,046,274
66 DIRECTORS’ RESPONSIBILITY STATEMENTThe Board of Directors of the Bank is responsible for the preparation and presentation of these financial statements.
Please refer to page 196 for the statement of the Directors’ Responsibility for Financial Reporting.

Annual Report 2014 323
Compliance with Other Disclosure Requirements .........................................324
Income Statement in US Dollars ............................................................................327
Statement of Other Comprehensive Income in US Dollars........................328
Statement of Financial Position in US Dollars .................................................329
Analysis of Deposits ................................................................................................... 330
Analysis of Loans and Receivables....................................................................... 331
Province-wise Analysis of Deposits and Advances ......................................332
Sources and Utilisation of Income ........................................................................333
Value Added Statement .............................................................................................334
Ten Year Statistical Summary .................................................................................335
Quarterly Statistics ......................................................................................................336
Segmental Analysis .....................................................................................................337
Investor Relations.........................................................................................................338
Glossary of Financial / Banking Terms ...............................................................346
Supplementary Information

Hatton National Bank PLC324
Bank’s level of compliance with the other disclosure requirements given in the specified format for the preparation of annual financial statements of licensed commercial banks issued by the Central Bank of Sri Lanka is detailed below.
1. Information about the significance of financial instruments for financial position and performance1.1 Statement of Financial Position1.1.1 Disclosures on categories of financial assets and financial liabilities Note 24 to the financial statements1.1.2 Other disclosures
(i) Special disclosures about financial assets and financial liabilities designated to be measured at fair value through profit or loss, including disclosures about credit risk and market risk, changes in fair values attributable to these risks and the methods of measurement
N/A
(ii) Reclassifications of financial instruments from one category to another N/A(iii) Information about financial assets pledged as collateral and about financial or non-
financial assets held as collateralNote 32 (j) and 38 (b) to the financial statements
(iv) Reconciliation of the allowance account for credit losses by class of financial assets Note 31 (b) to the financial statements(v) Information about compound financial instruments with multiple embedded
derivativesN/A
(vi) Breaches of terms of loan agreements N/A1.2 Statement of Comprehensive Income1.2.1 Disclosures on items of income, expense, gains and losses Note 11, 12,13, 14, 15, 16, 17 and 18 to the
financial statements1.2.2 Other disclosures
(i) Total interest income and total interest expense for those financial instruments that are not measured at fair value through profit and loss
Note 11 to the financial statements
(ii) Fee income and expense Note 12 to the financial statements(iii) Amount of impairment losses by class of financial assets Note 16 to the financial statements(iv) Interest income on impaired financial assets Note 11 (a) to the financial statements
1.3 Other disclosures1.3.1 Accounting policies for financial instruments Note 3.3 to the financial statements1.3.2 Information on hedge accounting N/A1.3.3 Information about the fair values of each class of financial asset and
financial liability, along with:Note 8 to the financial statements
(i) Comparable carrying amounts Note 8 to the financial statements(ii) Description of how fair value was determined Note 8 to the financial statements(iii) The level of inputs used in determining fair value Note 8 to the financial statements(iv) Reconciliations of movements between levels of fair value measurement hierarchy,
additional disclosures for financial instruments that fair value is determined using level 3 inputs
Note 8 to the financial statements
(v) Information if fair value cannot be reliably measured N/A2. Information about the nature and extent of risks arising from financial instruments2.1 Qualitative disclosures2.1.1 Risk exposures for each type of financial instrument Note 7 to the financial statements and “Risk
Management section”2.1.2 Management’s objectives, policies, and processes for managing those risks Note 7 to the financial statements and “Risk
Management section”2.1.3 Changes from the prior period “Risk Management section”
2.2 Quantitative disclosures2.2.1 Summary of quantitative data about exposure to each risk at the reporting
dateNote 7 to the financial statements
Compliance withOther Disclosure Requirements

Annual Report 2014 325
2.2.2 Disclosures about credit risk, liquidity risk, market risk, operational risk, interest rate risk and how these risks are managed(i) Credit Risk(a) Maximum amount of exposure (before deducting the value of collateral), description
of collateral, information about credit quality of financial assets that are neither past due nor impaired and information about credit quality of financial assets
Note 7.3 to the financial statements and “Risk Management section”
(b) For financial assets that are past due or impaired, disclosures on age, factors considered in determining as impaired and the description of collateral on each class of financial asset
Note 7.3 to the financial statements
(c) Information about collateral or other credit enhancements obtained or called Note 7.3 to the financial statements and “Risk Management section”
(d) For other disclosures, refer Banking Act Direction No. 7 of 2011 on Integrated Risk Management Framework for Licensed Banks (Section H)
Note 7.3 to the financial statements and “Risk Management section”
(ii) Liquidity Risk(a) A maturity analysis of financial liabilities Note 61 to the financial statements(b) Description of approach to risk management Note 7.4 to the financial statements and “Risk
Management section”(c) For other disclosures, refer Banking Act Direction No. 7 of 2011 on Integrated Risk
Management Framework for Licensed Banks (Section H)Note 7.4 to the financial statements and “Risk Management section”
(iii) Market Risk(a) A sensitivity analysis of each type of market risk to which the entity is exposed Note 7.5 to the financial statements and “Risk
Management section”(b) Additional information, if the sensitivity analysis is not representative of the entity’s
risk exposureNote 7.5 to the financial statements and “Risk Management section”
(c) For other disclosures, refer Banking Act Direction No. 7 of 2011 on Integrated Risk Management Framework for Licensed Banks (Section H)
Note 7.5 to the financial statements and “Risk Management section”
(iv) Operational Risk Refer Banking Act Direction No. 7 of 2011 on Integrated Risk Management
Framework for Licensed Banks (Section H)“Risk Management section”
(v) Equity risk in the banking book Note 7.5 to the financial statements and “Risk Management section”
(a) Qualitative disclosures *Differentiation between holdings on which capital gains are expected and those
taken under other objectives including for relationship and strategic reasons.Note 3.3 to the financial statements
*Discussion of important policies covering the valuation and accounting of equity holdings in the banking book.
Note 3.3 to the financial statements
(b) Quantitative disclosures *Value disclosed in the statement of financial position of investments, as well as the
fair value of those investments; for quoted securities, a comparison to publicly quoted share values where the share price is materially different from fair value.
Note 8, 29, 32 and 33 to the financial statements
*The types and nature of investments. Note 29, 32 and 33 to the financial statements * The cumulative realised gains/(losses) arising from sales and liquidations in the
reporting period.Note 13 and 14 to the financial statements
(vi) Interest rate risk in the banking book Note 7.5.3 to the financial statements and “Risk Management section”
(a) Qualitative disclosures Nature of interest rate risk in the banking book (IRRBB) and key assumptions Note 7.5.3 to the financial statements and “Risk
Management section”(b) Quantitative disclosures The increase/(decline) in earnings or economic value (or relevant measure used by
management) for upward and downward rate shocks according to management’s method for measuring IRRBB, broken down by currency (as relevant).
“Risk Management section”
2.2.3 Information on concentrations of risk “Risk Management section”
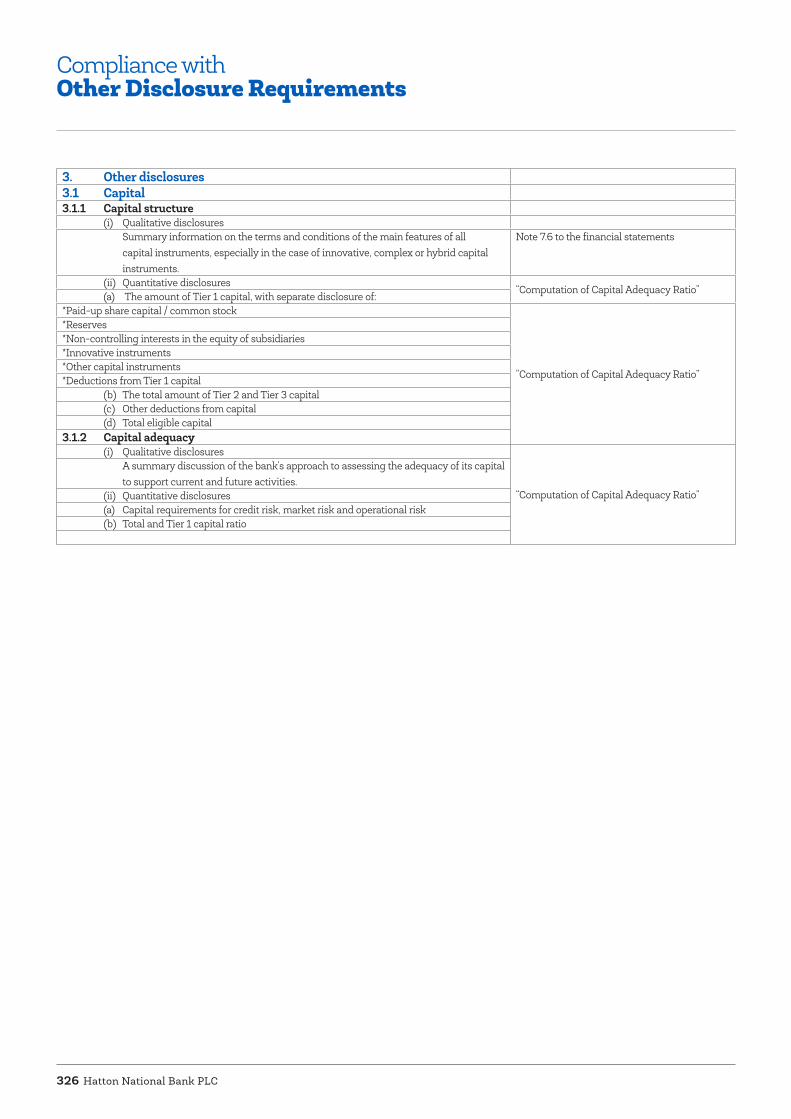
Hatton National Bank PLC326
3. Other disclosures3.1 Capital3.1.1 Capital structure
(i) Qualitative disclosures Summary information on the terms and conditions of the main features of all
capital instruments, especially in the case of innovative, complex or hybrid capital instruments.
Note 7.6 to the financial statements
(ii) Quantitative disclosures“Computation of Capital Adequacy Ratio”
(a) The amount of Tier 1 capital, with separate disclosure of:*Paid-up share capital / common stock
“Computation of Capital Adequacy Ratio”
*Reserves*Non-controlling interests in the equity of subsidiaries*Innovative instruments*Other capital instruments*Deductions from Tier 1 capital
(b) The total amount of Tier 2 and Tier 3 capital(c) Other deductions from capital(d) Total eligible capital
3.1.2 Capital adequacy(i) Qualitative disclosures
“Computation of Capital Adequacy Ratio”
A summary discussion of the bank’s approach to assessing the adequacy of its capital to support current and future activities.
(ii) Quantitative disclosures(a) Capital requirements for credit risk, market risk and operational risk(b) Total and Tier 1 capital ratio
Compliance withOther Disclosure Requirements
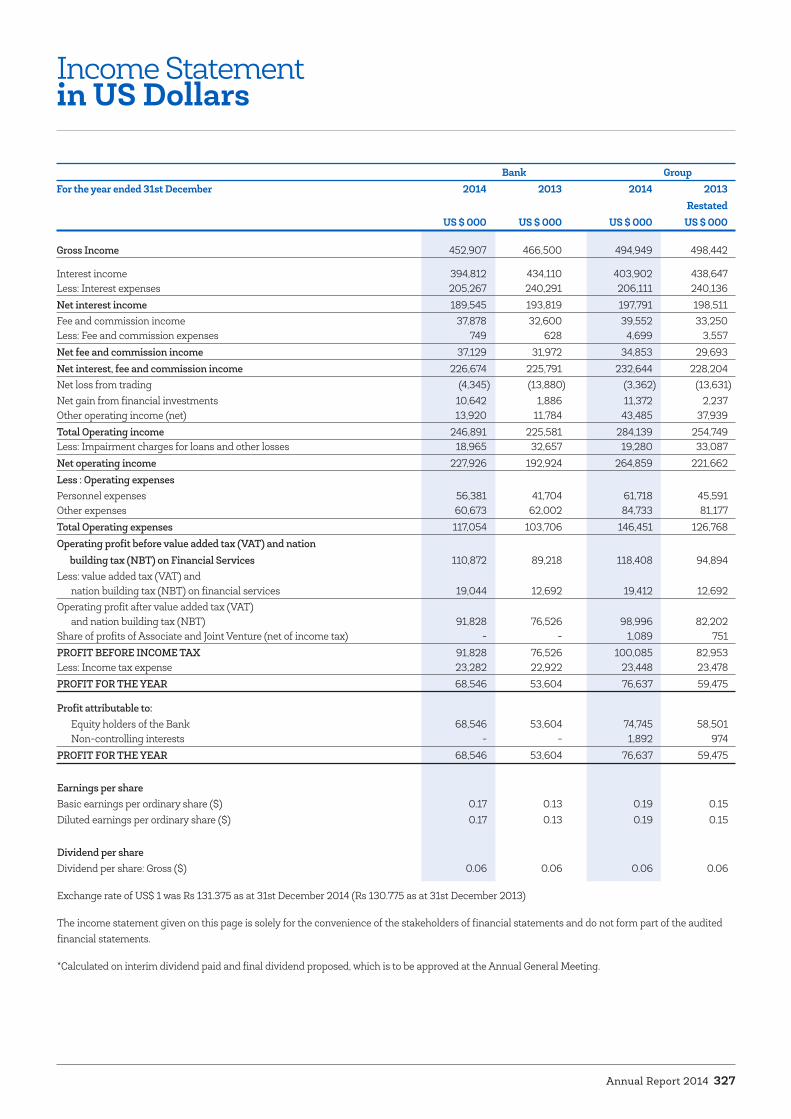
Annual Report 2014 327
Income Statementin US Dollars
Bank Group For the year ended 31st December 2014 2013 2014 2013 Restated US $ 000 US $ 000 US $ 000 US $ 000
Gross Income 452,907 466,500 494,949 498,442
Interest income 394,812 434,110 403,902 438,647 Less: Interest expenses 205,267 240,291 206,111 240,136 Net interest income 189,545 193,819 197,791 198,511 Fee and commission income 37,878 32,600 39,552 33,250 Less: Fee and commission expenses 749 628 4,699 3,557 Net fee and commission income 37,129 31,972 34,853 29,693 Net interest, fee and commission income 226,674 225,791 232,644 228,204 Net loss from trading (4,345) (13,880) (3,362) (13,631)Net gain from financial investments 10,642 1,886 11,372 2,237 Other operating income (net) 13,920 11,784 43,485 37,939 Total Operating income 246,891 225,581 284,139 254,749 Less: Impairment charges for loans and other losses 18,965 32,657 19,280 33,087 Net operating income 227,926 192,924 264,859 221,662 Less : Operating expenses Personnel expenses 56,381 41,704 61,718 45,591 Other expenses 60,673 62,002 84,733 81,177 Total Operating expenses 117,054 103,706 146,451 126,768 Operating profit before value added tax (VAT) and nation building tax (NBT) on Financial Services 110,872 89,218 118,408 94,894 Less: value added tax (VAT) and nation building tax (NBT) on financial services 19,044 12,692 19,412 12,692 Operating profit after value added tax (VAT) and nation building tax (NBT) 91,828 76,526 98,996 82,202 Share of profits of Associate and Joint Venture (net of income tax) - - 1,089 751 PROFIT BEFORE INCOME TAX 91,828 76,526 100,085 82,953 Less: Income tax expense 23,282 22,922 23,448 23,478 PROFIT FOR THE YEAR 68,546 53,604 76,637 59,475
Profit attributable to: Equity holders of the Bank 68,546 53,604 74,745 58,501 Non-controlling interests - - 1,892 974 PROFIT FOR THE YEAR 68,546 53,604 76,637 59,475 Earnings per share Basic earnings per ordinary share ($) 0.17 0.13 0.19 0.15 Diluted earnings per ordinary share ($) 0.17 0.13 0.19 0.15 Dividend per share Dividend per share: Gross ($) 0.06 0.06 0.06 0.06
Exchange rate of US$ 1 was Rs 131.375 as at 31st December 2014 (Rs 130.775 as at 31st December 2013)
The income statement given on this page is solely for the convenience of the stakeholders of financial statements and do not form part of the audited financial statements.
*Calculated on interim dividend paid and final dividend proposed, which is to be approved at the Annual General Meeting.

Hatton National Bank PLC328
Statement of Other Comprehensive Incomein US Dollars
Bank Group For the year ended 31st December 2014 2013 2014 2013 Restated US $ 000 US $ 000 US $ 000 US $ 000
PROFIT FOR THE YEAR 68,546 53,604 76,637 59,475 OTHER COMPREHENSIVE INCOME FOR THE YEAR, NET OF TAX Other comprehensive income to be reclassified to income statement Available-for-sale financial assets: Net change in fair value during the year 23,047 9,897 23,936 9,837 Transfer to life policy holder reserve fund - - (342) 23 Net amount transferred to profit or loss (available-for-sale financial assets) (4,913) - (5,444) - Deferred tax effect on above (310) - (310) -Share of other comprehensive income of equity accounted Joint Venture - - 64 103 Total other comprehensive income to be reclassified to income statement 17,824 9,897 17,904 9,963 Other comprehensive income not to be reclassified to income statement Gains and losses arising from translating the financial statements of foreign operations - - - 14 Actuarial gains / (losses) on defined benefit plans 8,678 (6,560) 8,711 (6,544)Deferred tax effect on above - - 12 -Total other comprehensive income not to be reclassified to income statement 8,678 (6,560) 8,723 (6,530)OTHER COMPREHENSIVE INCOME FOR THE YEAR, NET OF TAX 26,502 3,337 26,627 3,433 TOTAL COMPREHENSIVE INCOME FOR THE YEAR 95,048 56,941 103,264 62,908 Total comprehensive income attributable to: Equity holders of the Bank 95,048 56,941 101,337 61,934 Non-controlling interests - - 1,927 974 Total comprehensive income for the year 95,048 56,941 103,264 62,908
Exchange rate of US$ 1 was Rs 131.375 as at 31st December 2014 (Rs 130.775 as at 31st December 2013)
The statement of comprehensive income given on this page is solely for the convenience of the stakeholders of financial statements and do not form part of the audited financial statements.
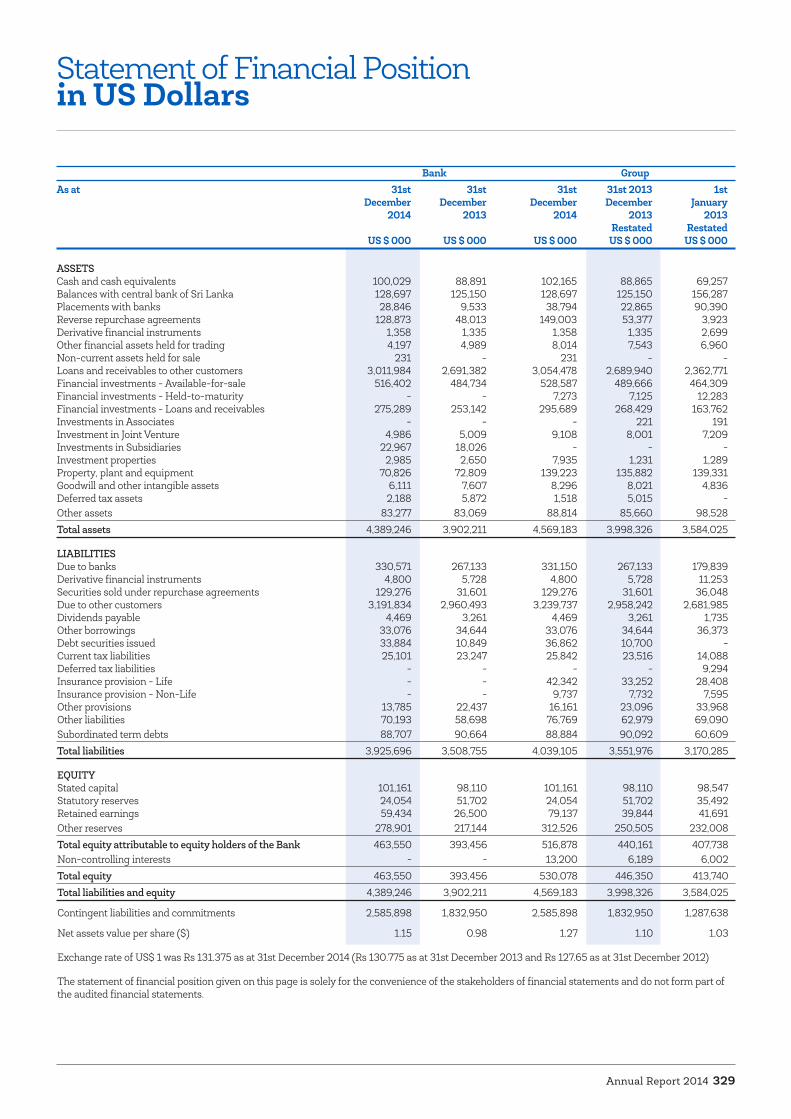
Annual Report 2014 329
Bank Group As at 31st 31st 31st 31st 2013 1st December December December December January 2014 2013 2014 2013 2013 Restated Restated US $ 000 US $ 000 US $ 000 US $ 000 US $ 000
ASSETS Cash and cash equivalents 100,029 88,891 102,165 88,865 69,257 Balances with central bank of Sri Lanka 128,697 125,150 128,697 125,150 156,287 Placements with banks 28,846 9,533 38,794 22,865 90,390 Reverse repurchase agreements 128,873 48,013 149,003 53,377 3,923 Derivative financial instruments 1,358 1,335 1,358 1,335 2,699 Other financial assets held for trading 4,197 4,989 8,014 7,543 6,960 Non-current assets held for sale 231 - 231 - - Loans and receivables to other customers 3,011,984 2,691,382 3,054,478 2,689,940 2,362,771 Financial investments - Available-for-sale 516,402 484,734 528,587 489,666 464,309 Financial investments - Held-to-maturity - - 7,273 7,125 12,283 Financial investments - Loans and receivables 275,289 253,142 295,689 268,429 163,762 Investments in Associates - - - 221 191 Investment in Joint Venture 4,986 5,009 9,108 8,001 7,209 Investments in Subsidiaries 22,967 18,026 - - - Investment properties 2,985 2,650 7,935 1,231 1,289 Property, plant and equipment 70,826 72,809 139,223 135,882 139,331 Goodwill and other intangible assets 6,111 7,607 8,296 8,021 4,836 Deferred tax assets 2,188 5,872 1,518 5,015 - Other assets 83,277 83,069 88,814 85,660 98,528 Total assets 4,389,246 3,902,211 4,569,183 3,998,326 3,584,025
LIABILITIES Due to banks 330,571 267,133 331,150 267,133 179,839 Derivative financial instruments 4,800 5,728 4,800 5,728 11,253 Securities sold under repurchase agreements 129,276 31,601 129,276 31,601 36,048 Due to other customers 3,191,834 2,960,493 3,239,737 2,958,242 2,681,985 Dividends payable 4,469 3,261 4,469 3,261 1,735 Other borrowings 33,076 34,644 33,076 34,644 36,373 Debt securities issued 33,884 10,849 36,862 10,700 - Current tax liabilities 25,101 23,247 25,842 23,516 14,088 Deferred tax liabilities - - - - 9,294 Insurance provision - Life - - 42,342 33,252 28,408 Insurance provision - Non-Life - - 9,737 7,732 7,595 Other provisions 13,785 22,437 16,161 23,096 33,968 Other liabilities 70,193 58,698 76,769 62,979 69,090 Subordinated term debts 88,707 90,664 88,884 90,092 60,609 Total liabilities 3,925,696 3,508,755 4,039,105 3,551,976 3,170,285
EQUITY Stated capital 101,161 98,110 101,161 98,110 98,547 Statutory reserves 24,054 51,702 24,054 51,702 35,492 Retained earnings 59,434 26,500 79,137 39,844 41,691 Other reserves 278,901 217,144 312,526 250,505 232,008 Total equity attributable to equity holders of the Bank 463,550 393,456 516,878 440,161 407,738 Non-controlling interests - - 13,200 6,189 6,002 Total equity 463,550 393,456 530,078 446,350 413,740 Total liabilities and equity 4,389,246 3,902,211 4,569,183 3,998,326 3,584,025
Contingent liabilities and commitments 2,585,898 1,832,950 2,585,898 1,832,950 1,287,638
Net assets value per share ($) 1.15 0.98 1.27 1.10 1.03
Exchange rate of US$ 1 was Rs 131.375 as at 31st December 2014 (Rs 130.775 as at 31st December 2013 and Rs 127.65 as at 31st December 2012)
The statement of financial position given on this page is solely for the convenience of the stakeholders of financial statements and do not form part of the audited financial statements.
Statement of Financial Positionin US Dollars

Hatton National Bank PLC330
2010 2011 2012 2013 2014 Rs 000 Rs 000 Rs 000 Rs 000 Rs 000
Analysis of Total Deposits Local currency deposits 196,671,010 243,138,771 280,644,471 323,925,015 352,732,715 Foreign currency deposits 42,362,773 48,217,807 60,779,515 63,233,375 66,594,407
239,033,783 291,356,578 341,423,986 387,158,390 419,327,122
Product wise analysis of Deposits Current 25,008,108 21,771,048 23,390,690 23,837,932 32,608,645 Savings 99,020,314 111,121,508 109,176,640 124,510,240 157,946,623 Time 115,005,361 158,464,022 208,856,656 238,810,218 228,771,854
239,033,783 291,356,578 341,423,986 387,158,390 419,327,122
Analysis ofDeposits
Analysis of Total Deposits
Foreign currency deposits
Local currency deposits
Rs Bn
197
42
243
48
280
61
324
63
353
66
2012 2013 201420112010
Analysis of Product-wise Deposits
CurrentSavingsTime
Rs Bn
2511
5
2215
8
2320
9
2423
9
32
99 111
109
124 15
822
9
2012 2013 201420112010
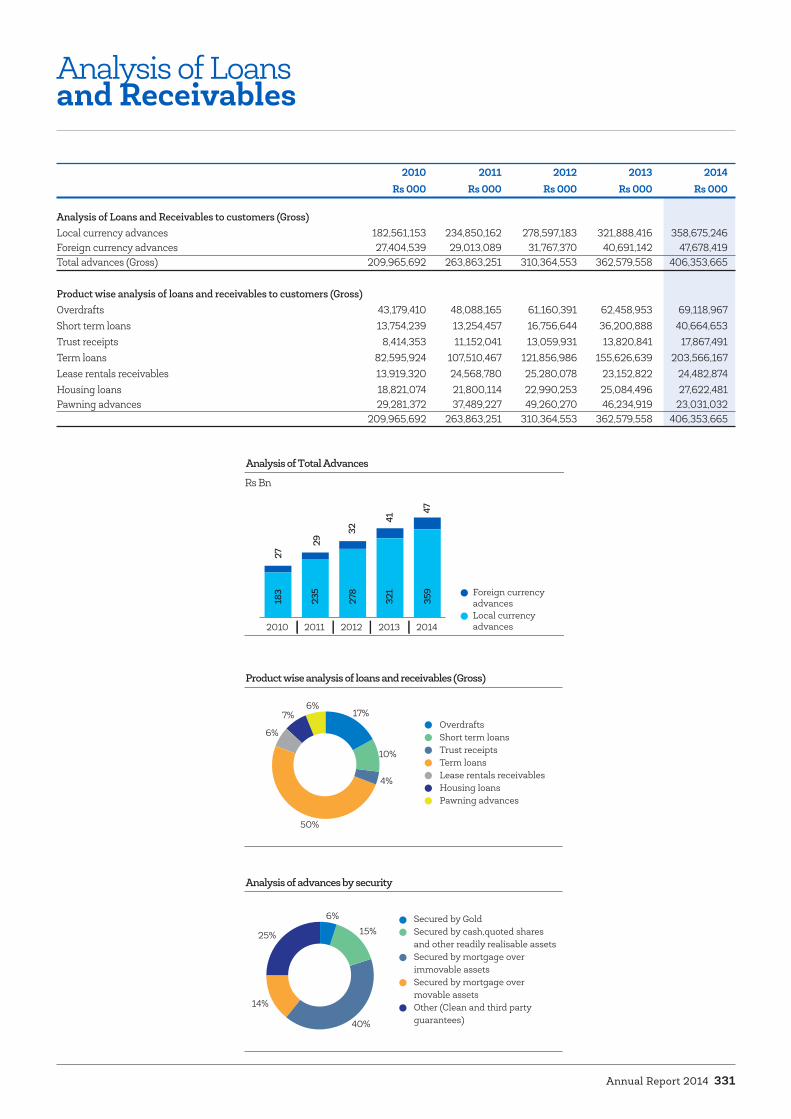
Annual Report 2014 331
2010 2011 2012 2013 2014 Rs 000 Rs 000 Rs 000 Rs 000 Rs 000
Analysis of Loans and Receivables to customers (Gross) Local currency advances 182,561,153 234,850,162 278,597,183 321,888,416 358,675,246 Foreign currency advances 27,404,539 29,013,089 31,767,370 40,691,142 47,678,419 Total advances (Gross) 209,965,692 263,863,251 310,364,553 362,579,558 406,353,665
Product wise analysis of loans and receivables to customers (Gross) Overdrafts 43,179,410 48,088,165 61,160,391 62,458,953 69,118,967 Short term loans 13,754,239 13,254,457 16,756,644 36,200,888 40,664,653 Trust receipts 8,414,353 11,152,041 13,059,931 13,820,841 17,867,491 Term loans 82,595,924 107,510,467 121,856,986 155,626,639 203,566,167 Lease rentals receivables 13,919,320 24,568,780 25,280,078 23,152,822 24,482,874 Housing loans 18,821,074 21,800,114 22,990,253 25,084,496 27,622,481 Pawning advances 29,281,372 37,489,227 49,260,270 46,234,919 23,031,032 209,965,692 263,863,251 310,364,553 362,579,558 406,353,665
Analysis of Loansand Receivables
Analysis of Total Advances
Rs Bn
27
29
32
41
183
235
278
321
359
47
2012 2013 201420112010Local currency advances
Foreign currency advances
Product wise analysis of loans and receivables (Gross)
4%
10%
17%OverdraftsShort term loansTrust receiptsTerm loansLease rentals receivablesHousing loansPawning advances
7%
6%
50%
6%
Analysis of advances by security
40%
15%
6% Secured by GoldSecured by cash,quoted shares and other readily realisable assetsSecured by mortgage over immovable assetsSecured by mortgage over movable assetsOther (Clean and third party guarantees)
14%
25%
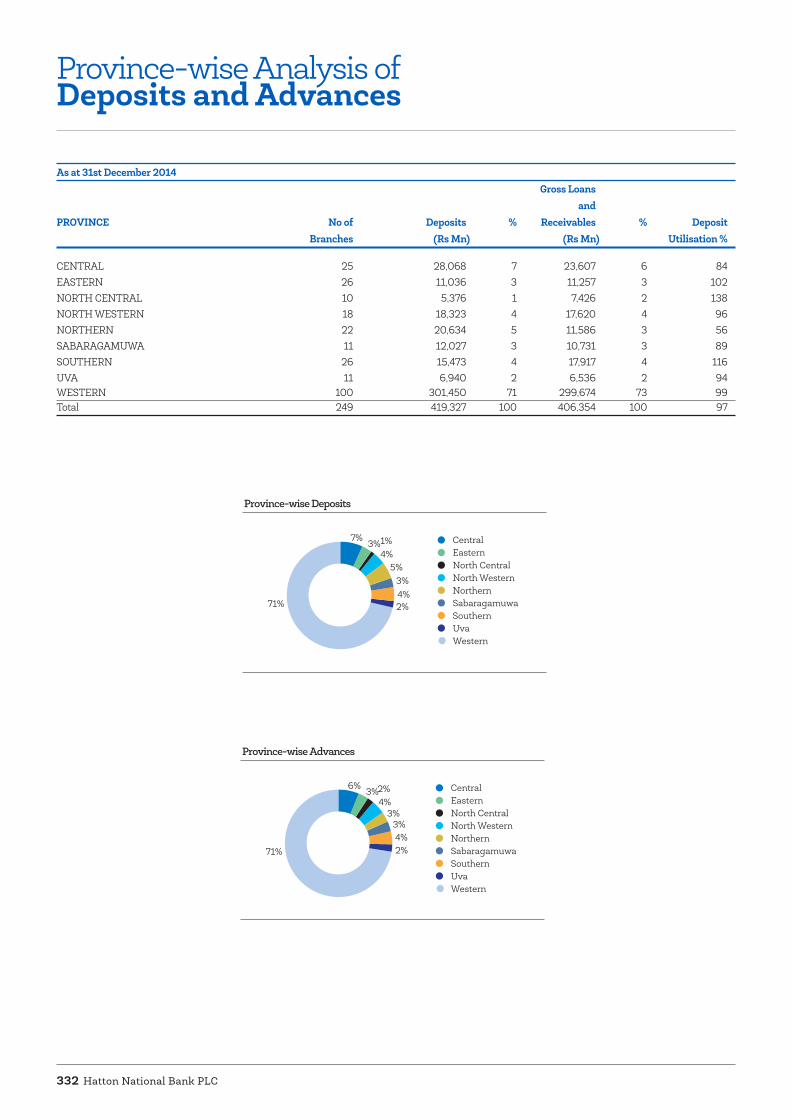
Hatton National Bank PLC332
As at 31st December 2014 Gross Loans and PROVINCE No of Deposits % Receivables % Deposit Branches (Rs Mn) (Rs Mn) Utilisation %
CENTRAL 25 28,068 7 23,607 6 84 EASTERN 26 11,036 3 11,257 3 102 NORTH CENTRAL 10 5,376 1 7,426 2 138 NORTH WESTERN 18 18,323 4 17,620 4 96 NORTHERN 22 20,634 5 11,586 3 56 SABARAGAMUWA 11 12,027 3 10,731 3 89 SOUTHERN 26 15,473 4 17,917 4 116 UVA 11 6,940 2 6,536 2 94 WESTERN 100 301,450 71 299,674 73 99 Total 249 419,327 100 406,354 100 97
Province-wise Analysis ofDeposits and Advances
Province-wise Advances
4%2%
3%2%4%
3%3%
6%
71%
Central Eastern North Central North Western Northern Sabaragamuwa Southern Uva Western
Province-wise Deposits
4%2%
3%1%4%
5%3%
7%
71%
Central Eastern North Central North Western Northern Sabaragamuwa Southern Uva Western
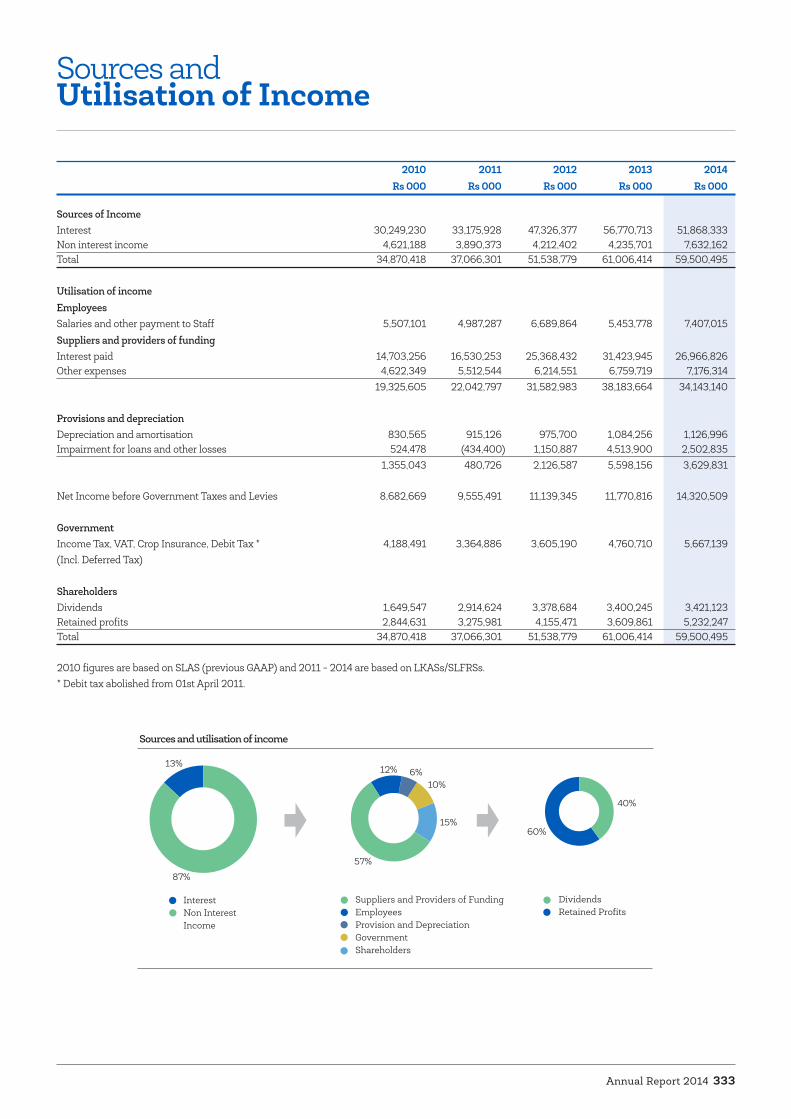
Annual Report 2014 333
2010 2011 2012 2013 2014 Rs 000 Rs 000 Rs 000 Rs 000 Rs 000
Sources of Income Interest 30,249,230 33,175,928 47,326,377 56,770,713 51,868,333 Non interest income 4,621,188 3,890,373 4,212,402 4,235,701 7,632,162 Total 34,870,418 37,066,301 51,538,779 61,006,414 59,500,495
Utilisation of income Employees Salaries and other payment to Staff 5,507,101 4,987,287 6,689,864 5,453,778 7,407,015 Suppliers and providers of funding Interest paid 14,703,256 16,530,253 25,368,432 31,423,945 26,966,826 Other expenses 4,622,349 5,512,544 6,214,551 6,759,719 7,176,314 19,325,605 22,042,797 31,582,983 38,183,664 34,143,140
Provisions and depreciation Depreciation and amortisation 830,565 915,126 975,700 1,084,256 1,126,996 Impairment for loans and other losses 524,478 (434,400) 1,150,887 4,513,900 2,502,835 1,355,043 480,726 2,126,587 5,598,156 3,629,831
Net Income before Government Taxes and Levies 8,682,669 9,555,491 11,139,345 11,770,816 14,320,509
Government Income Tax, VAT, Crop Insurance, Debit Tax * 4,188,491 3,364,886 3,605,190 4,760,710 5,667,139 (Incl. Deferred Tax)
Shareholders Dividends 1,649,547 2,914,624 3,378,684 3,400,245 3,421,123 Retained profits 2,844,631 3,275,981 4,155,471 3,609,861 5,232,247 Total 34,870,418 37,066,301 51,538,779 61,006,414 59,500,495
2010 figures are based on SLAS (previous GAAP) and 2011 - 2014 are based on LKASs/SLFRSs. * Debit tax abolished from 01st April 2011.
Sources andUtilisation of Income
Sources and utilisation of income
13%
InterestNon Interest Income
87%
12% 6%10%
15%
57%
Suppliers and Providers of FundingEmployeesProvision and DepreciationGovernmentShareholders
60%
40%
DividendsRetained Profits
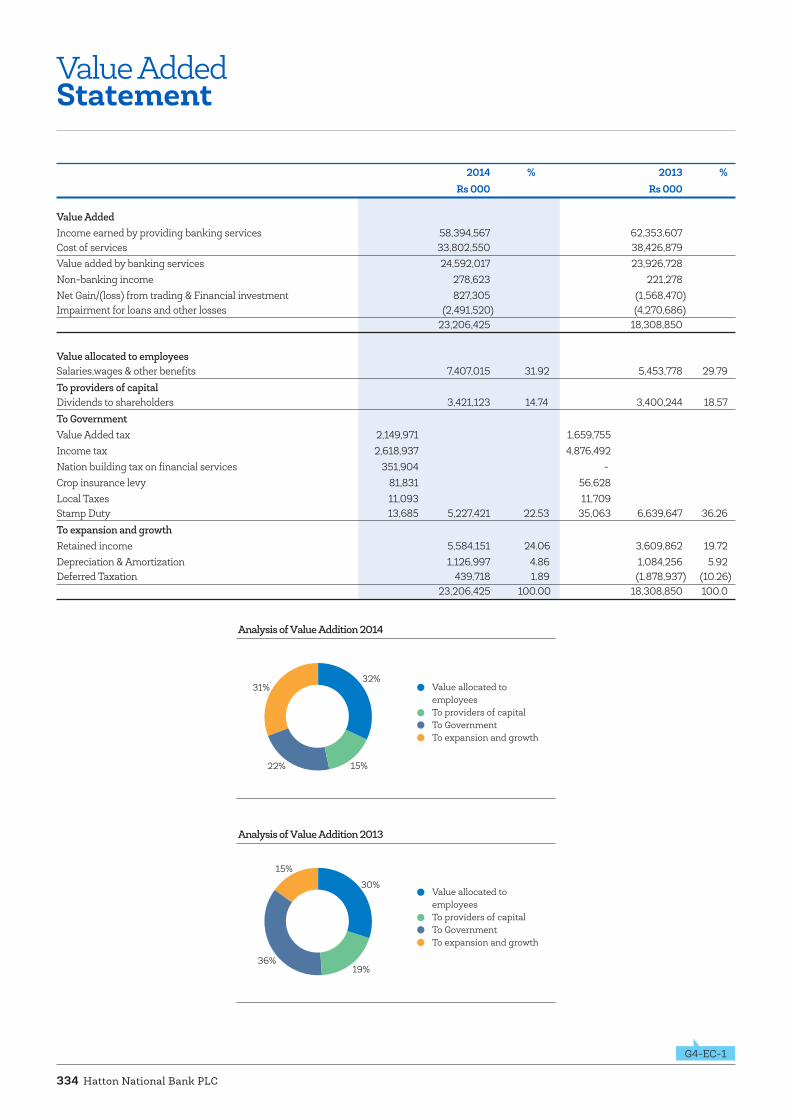
Hatton National Bank PLC334
Value AddedStatement
2014 % 2013 % Rs 000 Rs 000
Value Added Income earned by providing banking services 58,394,567 62,353,607 Cost of services 33,802,550 38,426,879 Value added by banking services 24,592,017 23,926,728 Non-banking income 278,623 221,278 Net Gain/(loss) from trading & Financial investment 827,305 (1,568,470) Impairment for loans and other losses (2,491,520) (4,270,686) 23,206,425 18,308,850
Value allocated to employees Salaries,wages & other benefits 7,407,015 31.92 5,453,778 29.79To providers of capital Dividends to shareholders 3,421,123 14.74 3,400,244 18.57 To Government Value Added tax 2,149,971 1,659,755 Income tax 2,618,937 4,876,492 Nation building tax on financial services 351,904 - Crop insurance levy 81,831 56,628 Local Taxes 11,093 11,709 Stamp Duty 13,685 5,227,421 22.53 35,063 6,639,647 36.26 To expansion and growth Retained income 5,584,151 24.06 3,609,862 19.72Depreciation & Amortization 1,126,997 4.86 1,084,256 5.92Deferred Taxation 439,718 1.89 (1,878,937) (10.26) 23,206,425 100.00 18,308,850 100.0
Analysis of Value Addition 2014
15%
32%Value allocated to employeesTo providers of capitalTo Government To expansion and growth
31%
22%
Analysis of Value Addition 2013
19%
30%Value allocated to employeesTo providers of capitalTo Government To expansion and growth
15%
36%
G4-EC-1

Annual Report 2014 335
Ten YearStatistical Summary
Year ended 31st December (Rs Mn) 2005 2006 2007 2008 2009 2010 2011 2012 2013 2014
OPERATING RESULTS Income 16,674 21,168 29,565 36,615 38,811 34,870 37,066 51,539 61,006 59,500 Interest income 14,130 18,452 26,250 32,431 34,620 30,249 33,176 47,326 56,771 51,868 Interest expense 7,281 9,797 15,190 19,752 20,040 14,703 16,530 25,368 31,424 26,967 Non interest income 2,544 2,716 3,315 4,184 4,191 4,621 3,890 4,213 4,236 7,633 Operating expenses (Incl. impairment, financial VAT and NBT) 7,543 8,352 10,040 12,078 12,853 13,436 12,148 16,295 19,575 20,470 Profit before income tax 1,850 3,019 4,335 4,785 5,918 6,731 8,388 9,876 10,008 12,064 Income tax on profit 195 799 1,313 1,566 1,566 2,267 2,123 2,342 2,998 3,059 Profit after taxation 1,655 2,220 3,022 3,219 4,352 4,464 6,265 7,534 7,010 9,005
LIABILITIES AND SHAREHOLDERS’ FUNDS Customer deposits 128,284 147,557 175,660 186,770 210,507 239,034 291,357 341,424 387,158 419,327 Refinance borrowings 2,712 3,583 5,750 6,424 6,169 6,436 7,045 6,429 5,615 4,889 Other liabilities 23,463 31,687 32,472 42,064 38,774 42,572 42,923 50,495 66,083 91,521 Deferred tax liabilities 314 314 606 872 939 891 1,175 1,111 - - Shareholders’ funds 11,239 12,930 18,419 20,581 23,900 30,775 37,984 46,899 51,454 60,899 Total 166,012 196,071 232,907 256,711 280,289 319,708 380,484 446,358 510,310 576,636
ASSETS Loans and receivables to customers (Net) 112,500 133,460 160,343 174,808 169,639 202,253 257,198 302,761 351,965 395,699 Cash, short term funds and statutory deposits with the Central Bank of Sri Lanka 24,400 30,200 32,565 35,149 38,216 30,600 33,446 39,024 29,238 33,838 Property, plant and equipment 3,059 2,908 6,083 6,866 7,180 7,428 7,835 9,418 9,521 9,305 Deferred tax assets - - - - - 506 315 - 768 287 Other assets 26,053 29,503 33,916 39,888 65,254 78,921 81,690 95,155 118,818 137,506 Total 166,012 196,071 232,907 256,711 280,289 319,708 380,484 446,358 510,310 576,636
RATIOS Return on average shareholders funds (%) 16 18 19 17 20 16 18 18 14 16 Income growth (%) 21 27 40 24 6 (10) 6 39 18 (2)Return on average assets (%) 1.0 1.2 1.4 1.3 1.6 1.5 1.8 1.8 1.5 1.7 Dividend cover (Times) 3.5 3.8 3.7 3.4 2.8 2.7 2.1 2.2 2.1 2.6 Property, plant and equipment to shareholders’ funds (%) 27 22 33 33 30 24 21 20 19 15 Total assets to shareholders’ funds (Times) 15 15 13 12 12 10 10 10 10 9 Liquid assets to liabilities (%) 24 22 22 22 29 24 22 22 23 23
SHARE INFORMATION Market value per share (Rs) -Voting 112.50 155.75 122.50 69.75 170.25 399.90 151.30 148.00 147.00 194.90 -Non Voting 41.50 70.00 53.25 32.00 104.75 214.60 83.20 112.50 119.00 152.90 Earnings per share (Rs) 14.05 18.86 12.83 13.67 18.47 18.84 16.60 18.94 17.59 22.47 Earnings per share (Adjusted) (Rs) * 4.13 5.54 7.54 8.03 10.86 11.14 15.63 18.80 17.49 22.47 Price earnings ratio 8.01 8.26 9.55 5.10 9.22 21.23 9.11 7.81 8.36 8.67 Net assets per share (Adjusted) (Rs) ** 27.92 32.12 45.75 51.12 59.36 76.44 94.35 116.49 127.80 151.26 Dividend per share (Rs) 4.00 5.00 3.50 4.00 6.50 7.00 7.50 8.50 8.50 8.50 Gross dividends (Rs Mn) 471 589 824 942 1,533 1,650 2,915 3,379 3,400 3,421
OTHER INFORMATION No of employees 4,259 4,287 4,334 4,395 4,302 4,352 4,584 4,679 4,604 4,451 No of customer centres 148 151 167 177 186 205 240 247 250 249 No of student banking centres 152 152 152 152 153 159 164 166 168 168 No of other financial centres 113 113 114 114 115 121 123 132 134 137
* Earnings per share has been adjusted for weighted Average number of shares outstanding during the current year.
** Net Assets per share has been computed for the current number of shares issued as at 31st December 2014
Highlighted Information is based on LKASs/SLFRSs.
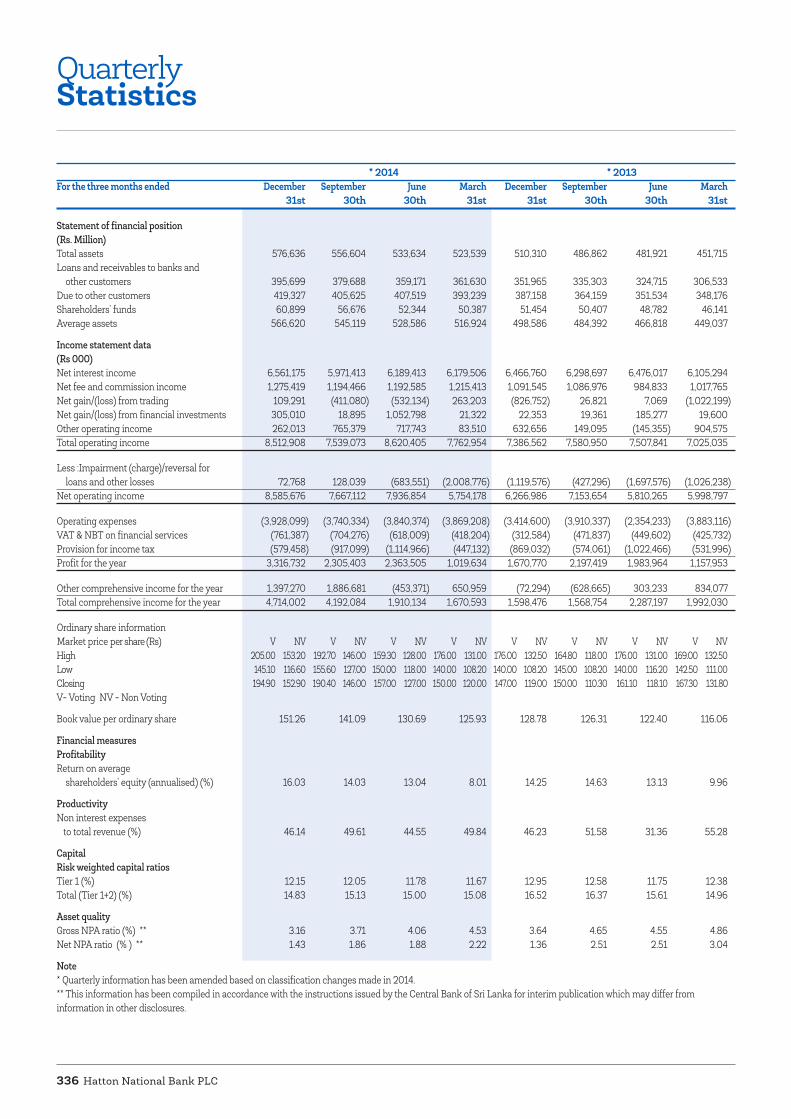
Hatton National Bank PLC336
QuarterlyStatistics
* 2014 * 2013For the three months ended December September June March December September June March 31st 30th 30th 31st 31st 30th 30th 31st
Statement of financial position (Rs. Million) Total assets 576,636 556,604 533,634 523,539 510,310 486,862 481,921 451,715 Loans and receivables to banks and other customers 395,699 379,688 359,171 361,630 351,965 335,303 324,715 306,533 Due to other customers 419,327 405,625 407,519 393,239 387,158 364,159 351,534 348,176 Shareholders’ funds 60,899 56,676 52,344 50,387 51,454 50,407 48,782 46,141 Average assets 566,620 545,119 528,586 516,924 498,586 484,392 466,818 449,037
Income statement data (Rs 000) Net interest income 6,561,175 5,971,413 6,189,413 6,179,506 6,466,760 6,298,697 6,476,017 6,105,294 Net fee and commission income 1,275,419 1,194,466 1,192,585 1,215,413 1,091,545 1,086,976 984,833 1,017,765 Net gain/(loss) from trading 109,291 (411,080) (532,134) 263,203 (826,752) 26,821 7,069 (1,022,199)Net gain/(loss) from financial investments 305,010 18,895 1,052,798 21,322 22,353 19,361 185,277 19,600 Other operating income 262,013 765,379 717,743 83,510 632,656 149,095 (145,355) 904,575 Total operating income 8,512,908 7,539,073 8,620,405 7,762,954 7,386,562 7,580,950 7,507,841 7,025,035
Less :Impairment (charge)/reversal for loans and other losses 72,768 128,039 (683,551) (2,008,776) (1,119,576) (427,296) (1,697,576) (1,026,238)Net operating income 8,585,676 7,667,112 7,936,854 5,754,178 6,266,986 7,153,654 5,810,265 5,998,797
Operating expenses (3,928,099) (3,740,334) (3,840,374) (3,869,208) (3,414,600) (3,910,337) (2,354,233) (3,883,116)VAT & NBT on financial services (761,387) (704,276) (618,009) (418,204) (312,584) (471,837) (449,602) (425,732)Provision for income tax (579,458) (917,099) (1,114,966) (447,132) (869,032) (574,061) (1,022,466) (531,996)Profit for the year 3,316,732 2,305,403 2,363,505 1,019,634 1,670,770 2,197,419 1,983,964 1,157,953
Other comprehensive income for the year 1,397,270 1,886,681 (453,371) 650,959 (72,294) (628,665) 303,233 834,077 Total comprehensive income for the year 4,714,002 4,192,084 1,910,134 1,670,593 1,598,476 1,568,754 2,287,197 1,992,030
Ordinary share information Market price per share (Rs) V NV V NV V NV V NV V NV V NV V NV V NV High 205.00 153.20 192.70 146.00 159.30 128.00 176.00 131.00 176.00 132.50 164.80 118.00 176.00 131.00 169.00 132.50 Low 145.10 116.60 155.60 127.00 150.00 118.00 140.00 108.20 140.00 108.20 145.00 108.20 140.00 116.20 142.50 111.00 Closing 194.90 152.90 190.40 146.00 157.00 127.00 150.00 120.00 147.00 119.00 150.00 110.30 161.10 118.10 167.30 131.80 V- Voting NV - Non Voting
Book value per ordinary share 151.26 141.09 130.69 125.93 128.78 126.31 122.40 116.06
Financial measures Profitability Return on average shareholders’ equity (annualised) (%) 16.03 14.03 13.04 8.01 14.25 14.63 13.13 9.96
Productivity Non interest expenses to total revenue (%) 46.14 49.61 44.55 49.84 46.23 51.58 31.36 55.28
Capital Risk weighted capital ratios Tier 1 (%) 12.15 12.05 11.78 11.67 12.95 12.58 11.75 12.38 Total (Tier 1+2) (%) 14.83 15.13 15.00 15.08 16.52 16.37 15.61 14.96
Asset quality Gross NPA ratio (%) ** 3.16 3.71 4.06 4.53 3.64 4.65 4.55 4.86 Net NPA ratio (% ) ** 1.43 1.86 1.88 2.22 1.36 2.51 2.51 3.04
Note * Quarterly information has been amended based on classification changes made in 2014. ** This information has been compiled in accordance with the instructions issued by the Central Bank of Sri Lanka for interim publication which may differ from information in other disclosures.

Annual Report 2014 337
SegmentalAnalysis
Business Segments Banking Leasing/Hirepurchase Property Insurance Others Total
2014 2013 2014 2013 2014 2013 2014 2013 2014 2013 2014 2013
Rs 000 Rs 000 Rs 000 Rs 000 Rs 000 Rs 000 Rs 000 Rs 000 Rs 000 Rs 000 Rs 000 Rs 000
Interest 48,655,744 53,104,021 - - 595 - 808,971 766,568 478,081 441 49,943,391 53,871,030
Leasing /Fee & Commission / Premium / Rent 5,068,176 4,337,405 3,212,589 3,666,692 892,840 830,856 3,966,047 3,342,082 91,911 12,113 13,231,563 12,189,148
Net Gain/(loss) from Trading & financial investment 827,305 (1,568,470) - - - - 222,192 78,319 2,860 - 1,052,357 (1,490,151)
Other operating income 1,736,681 1,466,766 - - 23,331 (6,713) 16,211 25,286 3,453 771 1,779,676 1,486,110
Total Revenue 56,287,906 57,339,722 3,212,589 3,666,692 916,766 824,143 5,013,421 4,212,255 576,305 13,325 66,006,987 66,056,137
Segmental Analysis 2013
6%1%6%
87%
BankingLeasingPropertyInsurance
18%
82%
InterestLeasing /Fee & Commision / Premiun / Rent
Segmental Analysis 2014
8%1%5%1%
85%
BankingLeasingPropertyOthersInsurance
4%
20%
76%
InterestLeasing /Fee & Commision / Premiun / RentNet gain/loss from trading and financial investment and other operating income

Hatton National Bank PLC338
1 STOCK EXCHANGE LISTINGThe issued ordinary shares of Hatton National Bank PLC are listed with the Colombo Stock Exchange. The audited Income Statement for the year ended 31st December 2014 and the audited Balance Sheet of the Bank as at date have been submitted to the Colombo Stock Exchange within three months of the Balance Sheet date.
Stock Exchange code for Hatton National Bank PLC shares is “HNB”. Reuter code of Hatton national Bank PLC is “HNBL”
2 ORDINARY SHAREHOLDERS SHARE INFORMATION - VOTING
There were 4,376 registered Voting Shareholders as at 31st December 2014 (2013 - 4,401) distributed as follows.
Resident Non-Resident Total
No of Share
holders
No of Shares % No of Share
holders
No of Shares % No of Share
holders
No of Shares %
1 - 1,000 2,511 717,874 0.34 33 12,846 0.01 2,544 730,720 0.24
1,001 - 10,000 1,199 3,970,680 1.87 34 145,410 0.16 1,233 4,116,090 1.36
10,001 - 100,000 460 13,399,998 6.32 27 1,036,936 1.14 487 14,436,934 4.76
100,001 - 1,000,000 58 16,019,709 7.56 23 9,682,985 10.62 81 25,702,694 8.48
Over 1,000,000 10 177,784,066 83.90 21 80,281,841 88.07 31 258,065,907 85.16
4,238 211,892,327 100.00 138 91,160,018 100.00 4,376 303,052,345* 100.00
ANALYSIS OF SHAREHOLDERS
Resident / Non-Resident
31st December 2014 31st December 2013
No of Shareholders
No of Shares % No of Share holders
No of Shares %
Resident 4,238 211,892,327 69.92 4,289 228,577,199 76.02
Non-Resident 138 91,160,018 30.08 112 72,092,466 23.98
Total 4,376 303,052,345* 100.00 4,401 300,669,665 100.00
Individuals / Institutions
31st December 2014 31st December 2013
No of Shareholders
No of Shares % No of Share holders
No of Shares %
Individuals 4,055 51,684,426 17.05 4,106 54,100,147 17.99
Institutions 321 251,367,919 82.95 295 246,569,518 82.01
Total 4,376 303,052,345 * 100.00 4,401 300,669,665 100.00
As at 31/12/2014 the average size of holding of ordinary shareholding was 69,253 voting shares. (31/12/2013 - 68,318 voting shares)
Disclosure as required under Rule 7.13.1 of the Colombo Stock Exchange - Public Holding in the voting share capital of the Company was 61% and it was held amongst 4,349 public shareholders.
* 18,684,164 shares remain unregistered arising from a direction given by the Central Bank of Sri Lanka (CBSL) dated 26th August 2010 in terms of Sec. 12(IC)(c) of the Banking Act, and these unregistered shares are not included herein.
InvestorRelations
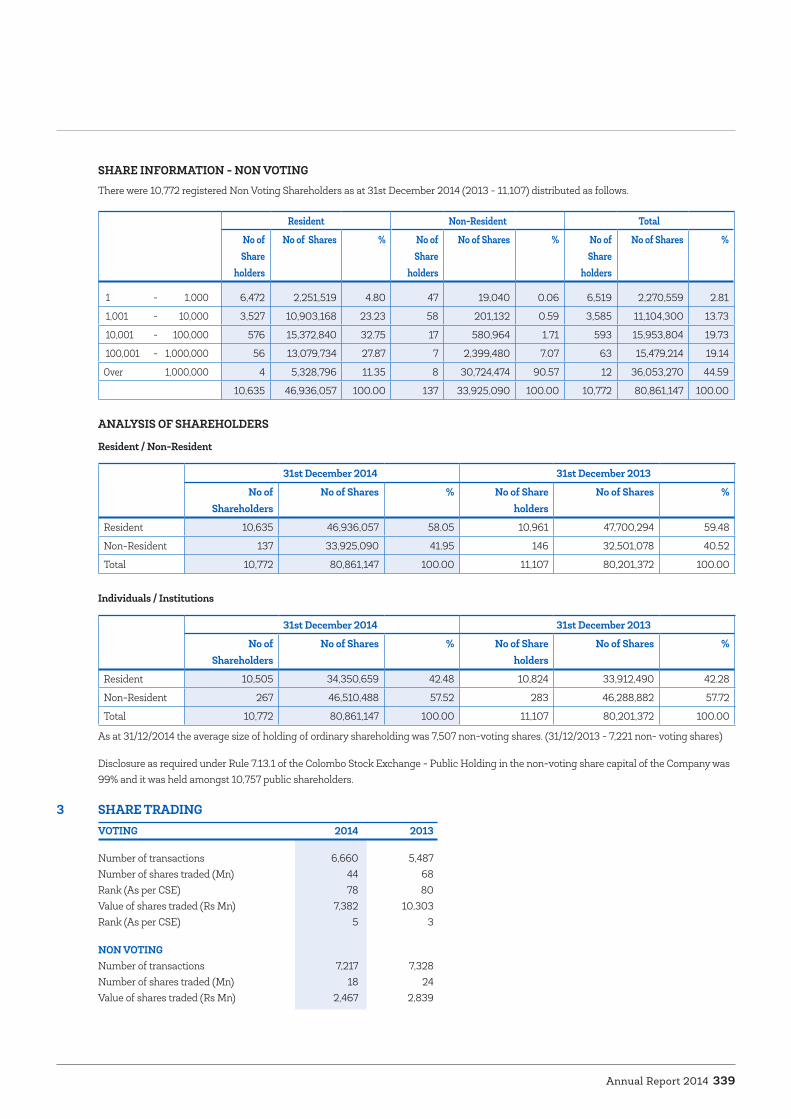
Annual Report 2014 339
SHARE INFORMATION - NON VOTINGThere were 10,772 registered Non Voting Shareholders as at 31st December 2014 (2013 - 11,107) distributed as follows.
Resident Non-Resident Total
No of Share
holders
No of Shares % No of Share
holders
No of Shares % No of Share
holders
No of Shares %
1 - 1,000 6,472 2,251,519 4.80 47 19,040 0.06 6,519 2,270,559 2.81
1,001 - 10,000 3,527 10,903,168 23.23 58 201,132 0.59 3,585 11,104,300 13.73
10,001 - 100,000 576 15,372,840 32.75 17 580,964 1.71 593 15,953,804 19.73
100,001 - 1,000,000 56 13,079,734 27.87 7 2,399,480 7.07 63 15,479,214 19.14
Over 1,000,000 4 5,328,796 11.35 8 30,724,474 90.57 12 36,053,270 44.59
10,635 46,936,057 100.00 137 33,925,090 100.00 10,772 80,861,147 100.00
ANALYSIS OF SHAREHOLDERS
Resident / Non-Resident
31st December 2014 31st December 2013
No of Shareholders
No of Shares % No of Share holders
No of Shares %
Resident 10,635 46,936,057 58.05 10,961 47,700,294 59.48
Non-Resident 137 33,925,090 41.95 146 32,501,078 40.52
Total 10,772 80,861,147 100.00 11,107 80,201,372 100.00
Individuals / Institutions
31st December 2014 31st December 2013
No of Shareholders
No of Shares % No of Share holders
No of Shares %
Resident 10,505 34,350,659 42.48 10,824 33,912,490 42.28
Non-Resident 267 46,510,488 57.52 283 46,288,882 57.72
Total 10,772 80,861,147 100.00 11,107 80,201,372 100.00
As at 31/12/2014 the average size of holding of ordinary shareholding was 7,507 non-voting shares. (31/12/2013 - 7,221 non- voting shares)
Disclosure as required under Rule 7.13.1 of the Colombo Stock Exchange - Public Holding in the non-voting share capital of the Company was 99% and it was held amongst 10,757 public shareholders.
3 SHARE TRADINGVOTING 2014 2013
Number of transactions 6,660 5,487 Number of shares traded (Mn) 44 68 Rank (As per CSE) 78 80 Value of shares traded (Rs Mn) 7,382 10,303 Rank (As per CSE) 5 3
NON VOTING Number of transactions 7,217 7,328 Number of shares traded (Mn) 18 24 Value of shares traded (Rs Mn) 2,467 2,839

Hatton National Bank PLC340
4 DIVIDENDS 2014 2013
Interim 1.50 Paid in December 2014 1.50 Paid in December 2013Final - Cash Dividend 7.00 Proposed to be paid in April 2015 7.00 Paid in April 2014Dividend payout ratio 37.99 48.50
5 EARNINGS 2014 2013
Earnings per share (Rs) 22.47 17.59 Price earnings ratio (Times) 8.67 8.36
6 MARKET VALUE Highest Lowest Year End Rs. Rs. Rs. 2010 - Voting 445.00 168.00 399.90 - Non Voting 260.00 105.00 214.60 2011 - Voting 410.00 120.00 151.30 - Non Voting 228.00 79.00 83.20 2012 - Voting 170.00 130.00 148.00 - Non Voting 121.70 77.50 112.50 2013 - Voting 176.00 140.00 147.00 - Non Voting 132.50 108.20 119.00 2014 - Voting 205.00 145.10 194.90 - Non Voting 153.20 116.60 152.90
7 MARKET CAPITALISATION ( AS AT 31ST DECEMBER) Capital & HNB Market CSE Market HNB Market Market Reserves Capitalisation Capitalisation Capitalization as a Capitalization Rs Mn Rs Mn Rs Mn % of CSE Market Ranking
Capitalization
2010 30,775 76,491 2,210,452 3.46 72011 37,984 47,116 2,213,873 2.13 102012 46,899 47,012 2,167,134 2.17 112013 51,454 46,945 2,459,897 1.91 112014 60,899 62,697 3,104,864 2.02 11
* HNB Market Capitalization includes only Voting shares
Dividend per Share and Dividend Yield
Dividend Yield
Dividend Per Share
Rs %
7.00
1.75
4.96
5.74 5.78
4.36
7.50
8.50
8.50
8.50
2012 2013 201420112010
Net Assets per Share and Closing Price per Share
Closing Price Per Share (Voting Shares)* 2010 prices diluted for the bonus issue
Net Asset Per Share
Rs
114.
61
266.
60
97.7
5
151.3
0
118.
06
148.
00
128.
78
147.0
0
151.2
6 194.
90
2012 2013 201420112010
Shareholders' Funds and Market Capitalisation
Market Capitalisation(both voting andnon-voting shares)
ShareholdersFunds
Rs Mn
30,7
75
86,5
12
37,9
84 53,5
38
46,8
99
55,
967
51,4
54
56,4
89
60,8
99
75,0
61
2012 2013 201420112010
InvestorRelations

Annual Report 2014 341
8 INFORMATION ON MOVEMENT IN SHARE CAPITALYear Issue Basis No of Shares
Prior to public issue 50,0001971 Public issue 220,0001977 Rights issue (@ Rs 10/-) 42:50 230,0001980 Rights issue (@ Rs 10/-) 1:1 500,0001982 Bonus 1:1 1,000,0001988 Bonus 1:1 2,000,0001990 Bonus 1:2 2,000,0001993 Bonus 1:1 6,000,0001996 Bonus 2:3 8,000,0001998 Bonus 1:2 10,000,0001999 Bonus 2:3 20,000,0001999 Rights (non voting @ Rs 70/-) 3:10 15,000,0002002 Bonus 1:10 6,500,0002004 Rights (voting @ Rs 55.00 and non voting @ Rs 33.00) 2:5 28,600,0002005 Issue of underlying shares for GDR - 17,664,7002007 Bonus 1:1 117,764,7002009 Shares issued under ESOP 240,7472010 Shares issued under ESOP 2,198,8752011 Sub division of shares 1:2 119,179,7822011 Rights (voting @ Rs 219.50 and non voting @ Rs 119.50) 1:10 21,858,8512011 Private placement of unsubscribed rights 8,975,7002011 Shares issued under ESOP 613,4882012 Scrip Dividend 7,890,5282012 Shares issued under ESOP 759,0782013 Shares issued under ESOP 2,308,7522014 Shares issued under ESOP 3,042,455Total 402,597,656
9 PRICE VOLUME CHART
100
150
200
250
300
Volume Traded
Share PriceRs.
Janu
ary
10
Dec
embe
r 10
Dec
embe
r 11
Dec
embe
r 12
Dec
embe
r 13
Dec
embe
r 14
Volume (Right)Diluted Price (Left)
30,000,000
25,000,000
20,000,000
15,000,000
10,000,000
5,000,000
0

Hatton National Bank PLC342
10 20 MAJOR SHAREHOLDERS (VOTING) OF THE BANK AS AT 31ST DECEMBER 2014
Name % on total capital
% on total voting capital
No. of Shares 2014
No. of Shares 2013
1. Sri Lanka Insurance Corporation Ltd. 11.83 14.81 47,635,487 47,635,487
2. Employees Provident Fund 7.91 9.90 31,836,612 31,836,612
3. Milford Exports (Ceylon) Limited 6.42 **8.03 25,828,280 25,828,280
4. Mr.Sohli Edelji Captain 5.89 7.37 23,705,220 23,705,220
5. Stassen Exports Ltd 5.56 **6.96 22,387,096 22,387,096
6. Sonetto Holdings Limited 3.65 4.57 14,697,921 14,697,921
7. HSBC Int’l Nominees Ltd-JPMLU-Franklin Templeton Investment 3.45 4.31 13,876,398 13,876,398
8. Distilleries Company of Sri Lanka PLC 2.49 **3.11 10,016,272 10,016,272
9. National Savings Bank 2.33 2.91 9,371,940 9,371,940
10. Citi Group Global Markets Ltd Agency Trading Prop. Sec. 2.18 2.72 8,764,778 7,582,044
11. Standard Chartered Bank Singapore S/A HL Bank Singapore 1.59 2.00 6,420,188 6,320,188
12. The Bank of New York Mellon SA/NV-CF Ruffer Total return Fund 1.28 1.60 5,138,289 5,138,289
13. The Bank of New York Mellon SA/NV-CF Ruffer Absolute return 0.86 1.07 3,448,972 3,448,972
14. Ms.Leesha Anne Captain 0.71 0.89 2,870,020 2,870,020
15. BNY-CF Ruffer Investment Funds : CF Ruffer Pacific Fund 0.65 0.82 2,628,518 2,628,518
16. HSBC INTL Nom Ltd-UBS AG Zurich 0.65 0.81 2,619,841 3,154,940
17. Mellon Bank N. A. - Frontier Market Opportunities Master Fund 0.64 0.80 2,580,973 310,200
18. Employees Trust Fund Board 0.60 0.76 2,436,964 3,346,644
19. Mellon Bank N.A. - Frontier Market Select Fund II 0.54 0.67 2,165,000 755,000
20. BNYM SA/NV-Blackrock Frontiers Investment Trust PLC 0.53 0.66 2,129,201 2,107,451
Sub total 59.76 74.77 240,557,970 237,017,492
* Unregistered Shares 4.64 5.81 18,684,164 18,684,164
Balance held by 4,356 voting shareholders 15.52 19.42 62,494,375 63,652,173
(Total voting shareholders- 4,376)
Total voting shares 79.92 100.00 321,736,509 319,353,829
Shares held by 10,772 Non-voting shareholders 20.08 80,861,147 80,201,372
Total No. of Ordinary shares 100.00 402,597,656 399,555,201
* 18,684,164 shares remain unregistered arising from a direction given by the Central Banka of Sri Lanka (CBSL) dated 26th August 2010 in terms of Sec 12(1C)(c) of the Banking Act.
** Pursuant to the provisions of the Banking Act Directions No. 1 of 2007, the total collective voting rights in the Bank, of Milford Exports (Ceylon) Limited, Stassen Exports Limited and Distilleries Company of Sri Lanka (who collectively hold 18.10% of the voting shares of the Bank) are limited to 10% of the total voting rights of the Bank with effect from 15th March 2012 as the voting rights in excess of such percentage is deemed invalid from that date.
InvestorRelations
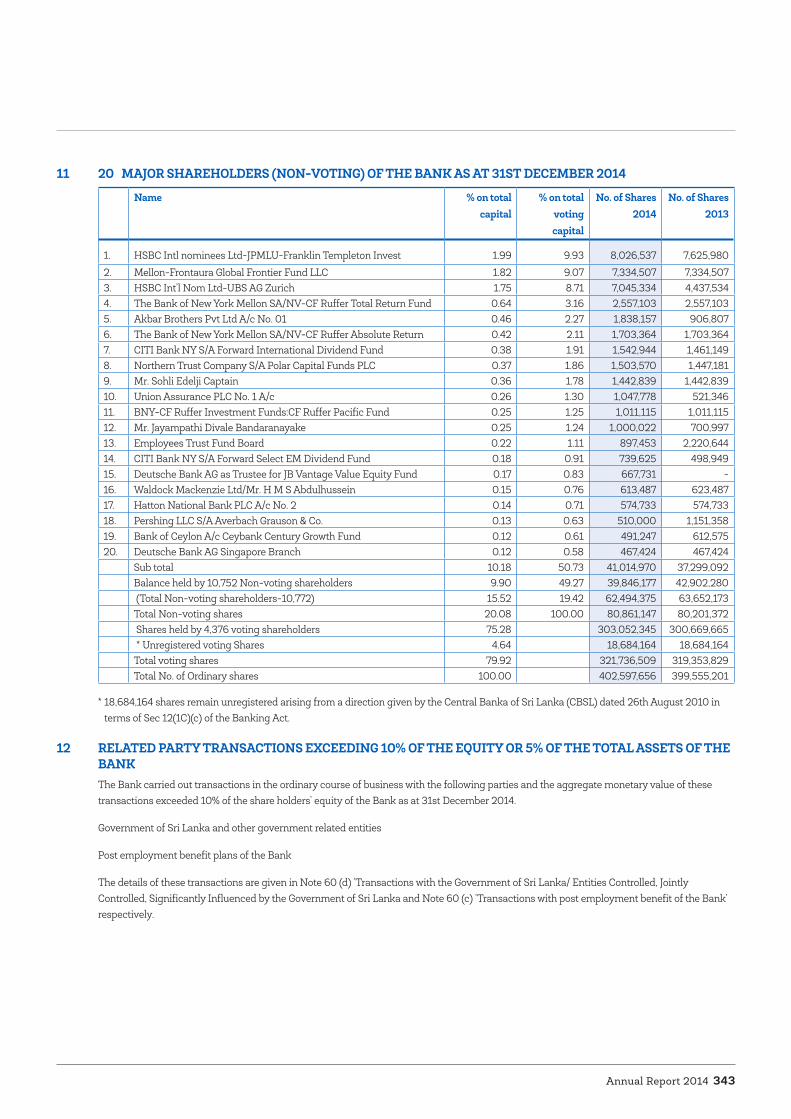
Annual Report 2014 343
11 20 MAJOR SHAREHOLDERS (NON-VOTING) OF THE BANK AS AT 31ST DECEMBER 2014
Name % on total capital
% on total voting capital
No. of Shares 2014
No. of Shares 2013
1. HSBC Intl nominees Ltd-JPMLU-Franklin Templeton Invest 1.99 9.93 8,026,537 7,625,9802. Mellon-Frontaura Global Frontier Fund LLC 1.82 9.07 7,334,507 7,334,5073. HSBC Int’l Nom Ltd-UBS AG Zurich 1.75 8.71 7,045,334 4,437,5344. The Bank of New York Mellon SA/NV-CF Ruffer Total Return Fund 0.64 3.16 2,557,103 2,557,1035. Akbar Brothers Pvt Ltd A/c No. 01 0.46 2.27 1,838,157 906,8076. The Bank of New York Mellon SA/NV-CF Ruffer Absolute Return 0.42 2.11 1,703,364 1,703,3647. CITI Bank NY S/A Forward International Dividend Fund 0.38 1.91 1,542,944 1,461,1498. Northern Trust Company S/A Polar Capital Funds PLC 0.37 1.86 1,503,570 1,447,1819. Mr. Sohli Edelji Captain 0.36 1.78 1,442,839 1,442,83910. Union Assurance PLC No. 1 A/c 0.26 1.30 1,047,778 521,34611. BNY-CF Ruffer Investment Funds:CF Ruffer Pacific Fund 0.25 1.25 1,011,115 1,011,11512. Mr. Jayampathi Divale Bandaranayake 0.25 1.24 1,000,022 700,99713. Employees Trust Fund Board 0.22 1.11 897,453 2,220,64414. CITI Bank NY S/A Forward Select EM Dividend Fund 0.18 0.91 739,625 498,94915. Deutsche Bank AG as Trustee for JB Vantage Value Equity Fund 0.17 0.83 667,731 -16. Waldock Mackenzie Ltd/Mr. H M S Abdulhussein 0.15 0.76 613,487 623,48717. Hatton National Bank PLC A/c No. 2 0.14 0.71 574,733 574,73318. Pershing LLC S/A Averbach Grauson & Co. 0.13 0.63 510,000 1,151,35819. Bank of Ceylon A/c Ceybank Century Growth Fund 0.12 0.61 491,247 612,57520. Deutsche Bank AG Singapore Branch 0.12 0.58 467,424 467,424
Sub total 10.18 50.73 41,014,970 37,299,092Balance held by 10,752 Non-voting shareholders 9.90 49.27 39,846,177 42,902,280 (Total Non-voting shareholders-10,772) 15.52 19.42 62,494,375 63,652,173Total Non-voting shares 20.08 100.00 80,861,147 80,201,372 Shares held by 4,376 voting shareholders 75.28 303,052,345 300,669,665 * Unregistered voting Shares 4.64 18,684,164 18,684,164Total voting shares 79.92 321,736,509 319,353,829Total No. of Ordinary shares 100.00 402,597,656 399,555,201
* 18,684,164 shares remain unregistered arising from a direction given by the Central Banka of Sri Lanka (CBSL) dated 26th August 2010 in terms of Sec 12(1C)(c) of the Banking Act.
12 RELATED PARTY TRANSACTIONS EXCEEDING 10% OF THE EQUITY OR 5% OF THE TOTAL ASSETS OF THE BANKThe Bank carried out transactions in the ordinary course of business with the following parties and the aggregate monetary value of these transactions exceeded 10% of the share holders’ equity of the Bank as at 31st December 2014.
Government of Sri Lanka and other government related entities
Post employment benefit plans of the Bank
The details of these transactions are given in Note 60 (d) ‘Transactions with the Government of Sri Lanka/ Entities Controlled, Jointly Controlled, Significantly Influenced by the Government of Sri Lanka and Note 60 (c) ‘Transactions with post employment benefit of the Bank’ respectively.

Hatton National Bank PLC344
13 DEBENTURE INFORMATION HNB DEBENTURES 2006
i) Market Value
12 months ended 31st December 2014
These debentures have not traded during the year ended 31st December 2014
ii) Interest Rate
12 months ended 31st December 2014 2013 Interest Interest Annual Rate of Annual Rate of Amount Coupon Effective comparable Amount Coupon Effective comparable
Rs 000 Rate % Rate % Govt. Security % Rs 000 Rate % Rate % Govt. Security %
15 year Fixed Rate (11.00% p.a.) 268,022 0 11.00 8.53 241,600 0 11.00 11.3918 year Fixed Rate (11.25% p.a.) 508,535 0 11.25 8.94 457,416 0 11.25 11.94
HNB DEBENTURES 2007
i) Market Value
12 months ended 31st December 2014
These debentures have not traded during the year ended 31st December 2014
ii) Interest Rate
12 months ended 31st December 2014 2013 Interest Interest Annual Rate of Annual Rate of Amount Coupon Effective comparable Amount Coupon Effective comparable
Rs 000 Rate % Rate % Govt. Security % Rs 000 Rate % Rate % Govt. Security %
10 year Fixed Rate (16.00% p.a.) 540,000 16.00 16.00 7.71 540,000 16.00 16.00 10.2215 year Fixed Rate (11.00% p.a.) 758,625 16.75 16.75 8.76 758,625 16.75 16.75 11.64
HNB DEBENTURES 2011
i) Market Value
12 months ended 31st December 2014
These debentures have not traded during the year ended 31st December 2014
ii) Interest Rate
12 months ended 31st December 2014 2013 Interest Interest Annual Rate of Annual Rate of Amount Coupon Effective comparable Amount Coupon Effective comparable
Rs 000 Rate % Rate % Govt. Security % Rs 000 Rate % Rate % Govt. Security %
10 year Fixed Rate (11.50% p.a.) 2,000,000 11.50 11.83 8.55 2,000,000 11.50 11.83 11.39
InvestorRelations

Annual Report 2014 345
HNB DEBENTURES 2013
i) Market Value 12 months ended 31st December 2014
These debentures have not traded during the year ended 31st December 2014
ii) Interest Rate12 months ended 31st December 2014 2013 Interest Interest Annual Rate of Annual Rate of Amount Coupon Effective comparable Amount Coupon Effective comparable
Rs 000 Rate % Rate % Govt. Security % Rs 000 Rate % Rate % Govt. Security %
5 year Fixed Rate (14.00% p.a.) 4,309,920 14.00 14.00 7.06 4,309,917 14.00 14.00 9.78
Note: HNB Debenture information is listed under Subordinated Term Debts, Note 53 (a) i of the Financial Position.
HNB SENIOR DEBENTURES 2013
i) Market Value Traded Yield12 months ended 31st December 2014 12 months ended 31st December 2014
Highest Lowest Last Traded Highest Lowest Last Traded Rs Rs Rs % % %
83.77 70.13 70.13 14.18 10.80 14.18
ii) Interest Rate12 months ended 31st December 2014 2013 Interest Interest Annual Rate of Annual Rate of Amount Coupon Effective comparable Amount Coupon Effective comparable
Rs 000 Rate % Rate % Govt. Security % Rs 000 Rate % Rate % Govt. Security %
10 year Fixed Rate 1,451,407 8.00 14.25 7.97 1,418,775 8.00 14.25 10.66
HNB SENIOR DEBENTURES 2014
i) Market Value12 months ended 31st December 2014
These debentures have not traded during the year ended 31st December 2014
ii) Interest Rate12 months ended 31st December
12 months ended 31st December 2014 2013 Interest Interest Annual Rate of Annual Rate of Amount Coupon Effective comparable Amount Coupon Effective comparable
Rs 000 Rate % Rate % Govt. Security % Rs 000 Rate % Rate % Govt. Security %
03 year Fixed Rate (6.88% p.a.) 158,720 6.88 7.00 7.01 - - - -05 year Fixed Rate (7.75% p.a.) 2,757,240 7.75 7.90 7.29 - - - -10 year Fixed Rate (8.33% p.a.) 84,040 8.33 8.50 8.14 - - - -
Note: HNB Senior Debenture information is listed under Debt Securities issued, Note 47 of the Financial Position.
Ratios 2014 2013
Listed Debentures to Equity Ratio (%) 21.08 19.49Listed Debentures Interest Cover (Times) 10.47 11.88Liquidity Asset Ratio (LAR) 22.81 23.32
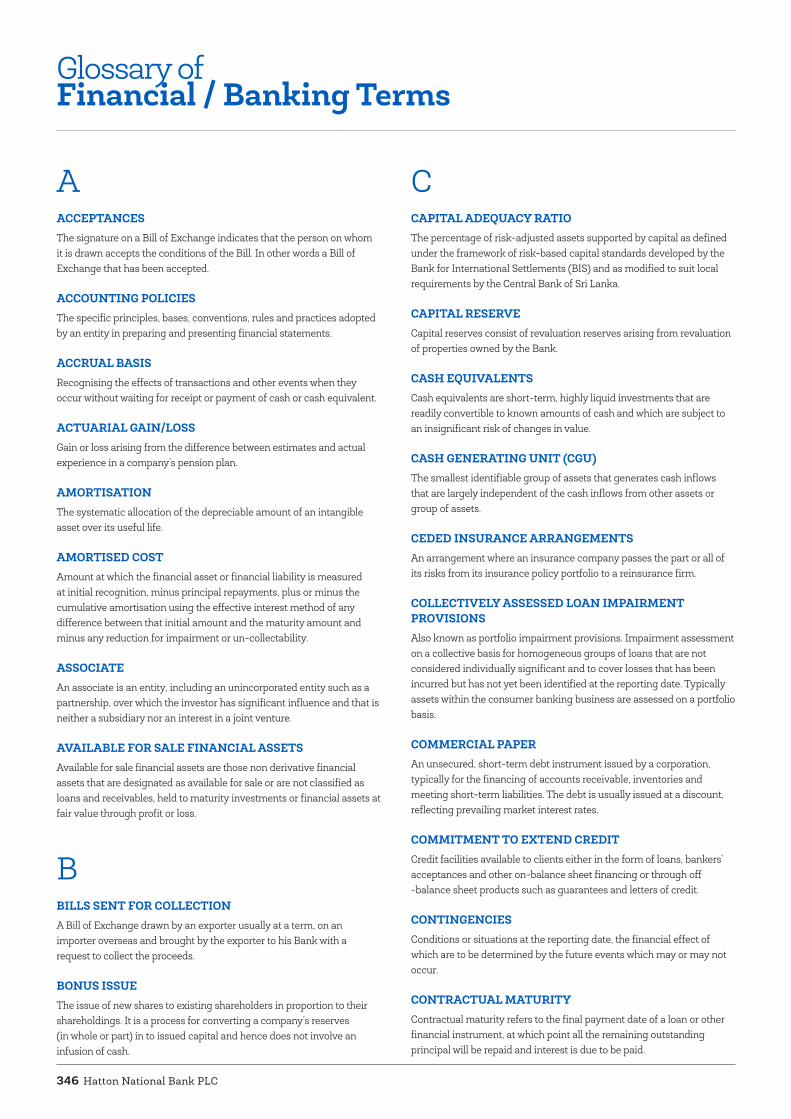
Hatton National Bank PLC346
Glossary ofFinancial / Banking Terms
AACCEPTANCESThe signature on a Bill of Exchange indicates that the person on whom it is drawn accepts the conditions of the Bill. In other words a Bill of Exchange that has been accepted.
ACCOUNTING POLICIESThe specific principles, bases, conventions, rules and practices adopted by an entity in preparing and presenting financial statements.
ACCRUAL BASISRecognising the effects of transactions and other events when they occur without waiting for receipt or payment of cash or cash equivalent.
ACTUARIAL GAIN/LOSSGain or loss arising from the difference between estimates and actual experience in a company’s pension plan.
AMORTISATIONThe systematic allocation of the depreciable amount of an intangible asset over its useful life.
AMORTISED COSTAmount at which the financial asset or financial liability is measured at initial recognition, minus principal repayments, plus or minus the cumulative amortisation using the effective interest method of any difference between that initial amount and the maturity amount and minus any reduction for impairment or un-collectability.
ASSOCIATEAn associate is an entity, including an unincorporated entity such as a partnership, over which the investor has significant influence and that is neither a subsidiary nor an interest in a joint venture.
AVAILABLE FOR SALE FINANCIAL ASSETSAvailable for sale financial assets are those non derivative financial assets that are designated as available for sale or are not classified as loans and receivables, held to maturity investments or financial assets at fair value through profit or loss.
B
BILLS SENT FOR COLLECTIONA Bill of Exchange drawn by an exporter usually at a term, on an importer overseas and brought by the exporter to his Bank with a request to collect the proceeds.
BONUS ISSUEThe issue of new shares to existing shareholders in proportion to their shareholdings. It is a process for converting a company’s reserves (in whole or part) in to issued capital and hence does not involve an infusion of cash.
CCAPITAL ADEQUACY RATIOThe percentage of risk-adjusted assets supported by capital as defined under the framework of risk-based capital standards developed by the Bank for International Settlements (BIS) and as modified to suit local requirements by the Central Bank of Sri Lanka.
CAPITAL RESERVECapital reserves consist of revaluation reserves arising from revaluation of properties owned by the Bank.
CASH EQUIVALENTSCash equivalents are short-term, highly liquid investments that are readily convertible to known amounts of cash and which are subject to an insignificant risk of changes in value.
CASH GENERATING UNIT (CGU)The smallest identifiable group of assets that generates cash inflows that are largely independent of the cash inflows from other assets or group of assets.
CEDED INSURANCE ARRANGEMENTSAn arrangement where an insurance company passes the part or all of its risks from its insurance policy portfolio to a reinsurance firm.
COLLECTIVELY ASSESSED LOAN IMPAIRMENT PROVISIONSAlso known as portfolio impairment provisions. Impairment assessment on a collective basis for homogeneous groups of loans that are not considered individually significant and to cover losses that has been incurred but has not yet been identified at the reporting date. Typically assets within the consumer banking business are assessed on a portfolio basis.
COMMERCIAL PAPERAn unsecured, short-term debt instrument issued by a corporation, typically for the financing of accounts receivable, inventories and meeting short-term liabilities. The debt is usually issued at a discount, reflecting prevailing market interest rates.
COMMITMENT TO EXTEND CREDITCredit facilities available to clients either in the form of loans, bankers’ acceptances and other on-balance sheet financing or through off -balance sheet products such as guarantees and letters of credit.
CONTINGENCIESConditions or situations at the reporting date, the financial effect of which are to be determined by the future events which may or may not occur.
CONTRACTUAL MATURITYContractual maturity refers to the final payment date of a loan or other financial instrument, at which point all the remaining outstanding principal will be repaid and interest is due to be paid.
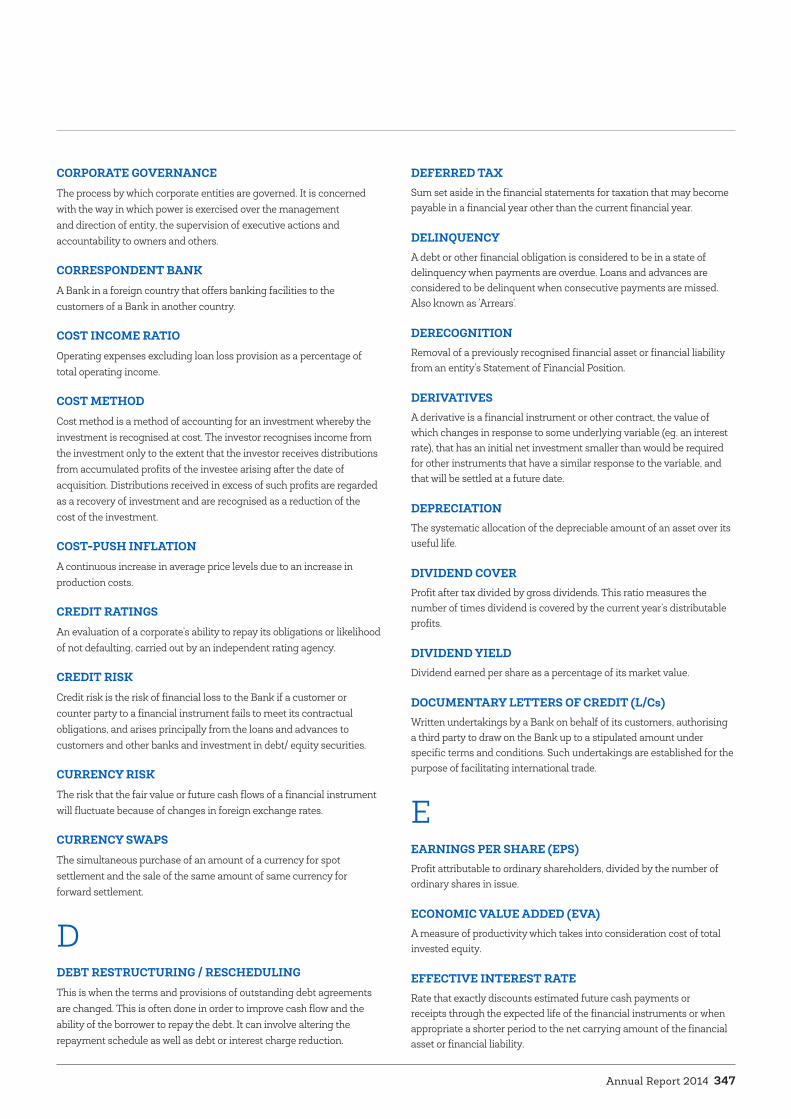
Annual Report 2014 347
CORPORATE GOVERNANCEThe process by which corporate entities are governed. It is concerned with the way in which power is exercised over the management and direction of entity, the supervision of executive actions and accountability to owners and others.
CORRESPONDENT BANKA Bank in a foreign country that offers banking facilities to the customers of a Bank in another country.
COST INCOME RATIOOperating expenses excluding loan loss provision as a percentage of total operating income.
COST METHODCost method is a method of accounting for an investment whereby the investment is recognised at cost. The investor recognises income from the investment only to the extent that the investor receives distributions from accumulated profits of the investee arising after the date of acquisition. Distributions received in excess of such profits are regarded as a recovery of investment and are recognised as a reduction of the cost of the investment.
COST-PUSH INFLATIONA continuous increase in average price levels due to an increase in production costs.
CREDIT RATINGSAn evaluation of a corporate’s ability to repay its obligations or likelihood of not defaulting, carried out by an independent rating agency.
CREDIT RISKCredit risk is the risk of financial loss to the Bank if a customer or counter party to a financial instrument fails to meet its contractual obligations, and arises principally from the loans and advances to customers and other banks and investment in debt/ equity securities.
CURRENCY RISKThe risk that the fair value or future cash flows of a financial instrument will fluctuate because of changes in foreign exchange rates.
CURRENCY SWAPSThe simultaneous purchase of an amount of a currency for spot settlement and the sale of the same amount of same currency for forward settlement.
DDEBT RESTRUCTURING / RESCHEDULINGThis is when the terms and provisions of outstanding debt agreements are changed. This is often done in order to improve cash flow and the ability of the borrower to repay the debt. It can involve altering the repayment schedule as well as debt or interest charge reduction.
DEFERRED TAXSum set aside in the financial statements for taxation that may become payable in a financial year other than the current financial year.
DELINQUENCYA debt or other financial obligation is considered to be in a state of delinquency when payments are overdue. Loans and advances are considered to be delinquent when consecutive payments are missed. Also known as ‘Arrears’.
DERECOGNITIONRemoval of a previously recognised financial asset or financial liability from an entity’s Statement of Financial Position.
DERIVATIVESA derivative is a financial instrument or other contract, the value of which changes in response to some underlying variable (eg. an interest rate), that has an initial net investment smaller than would be required for other instruments that have a similar response to the variable, and that will be settled at a future date.
DEPRECIATIONThe systematic allocation of the depreciable amount of an asset over its useful life.
DIVIDEND COVERProfit after tax divided by gross dividends. This ratio measures the number of times dividend is covered by the current year’s distributable profits.
DIVIDEND YIELDDividend earned per share as a percentage of its market value.
DOCUMENTARY LETTERS OF CREDIT (L/Cs)Written undertakings by a Bank on behalf of its customers, authorising a third party to draw on the Bank up to a stipulated amount under specific terms and conditions. Such undertakings are established for the purpose of facilitating international trade.
EEARNINGS PER SHARE (EPS)Profit attributable to ordinary shareholders, divided by the number of ordinary shares in issue.
ECONOMIC VALUE ADDED (EVA)A measure of productivity which takes into consideration cost of total invested equity.
EFFECTIVE INTEREST RATERate that exactly discounts estimated future cash payments or receipts through the expected life of the financial instruments or when appropriate a shorter period to the net carrying amount of the financial asset or financial liability.

Hatton National Bank PLC348
EFFECTIVE TAX RATEIncome tax expense for the year divided by the profit before tax.
EQUITY INSTRUMENTEquity instrument is any contract that evidences a residual interest in the assets of an entity after deducting all of its liabilities.
EQUITY METHODThe equity method is a method of accounting whereby the investment is initially recognised at cost and adjusted thereafter for the post-acquisition changes in the investor’s share of net assets of the investee. The profit or loss of the investor includes the investor’s share of the profit or loss of the investee.
EMBEDDED DERIVATIVESAn embedded derivative is a component of a hybrid (combined) instrument that also includes a non-derivative host contract with the effect that some of the cash flows of the combined instrument vary in a way similar to a stand-alone derivative.
ESOP (EMPLOYEE SHARE OPTION PLAN)A method of giving employees shares in the business for which they work.
EX-DIVIDEND DATEA classification of trading shares when a declared dividend belongs to the seller rather than the buyer. A stock will be given ex-dividend status if a person has been confirmed by the company to receive the dividend payment. The date on or after which a security is traded without a previously declared dividend or distribution.
FFAIR VALUEFair value is the amount for which an asset could be exchanged between a knowledgeable, willing buyer and a knowledgeable, willing seller in an arm’s length transaction.
FINANCE LEASEA lease in which the lessee acquires all the financial benefits and risks attaching to ownership of the asset under lease.
FINANCIAL ASSET OR FINANCIAL LIABILITY AT FAIR VALUE THROUGH PROFIT OR LOSSFinancial asset or financial liability that is held for trading or upon initial recognition designated by the entity as ‘at fair value through profit or loss’.
FINANCIAL INSTRUMENTFinancial Instrument is any contract that gives rise to a financial asset of one entity and a financial liability or equity instrument of another entity.
FINANCIAL RISKThe risk of a possible future change in one or more of a specified interest rate, financial instrument price, commodity price, foreign exchange rate, index of prices or rates or credit rating or credit index or other variable provided in the case of a non financial variable that the variable is not specific to the party to the contract.
FOREIGN EXCHANGE INCOMEThe gain recorded when assets or liabilities denominated in foreign currencies are translated into Sri Lankan Rupees on the reporting date at prevailing rates which differ from those rates in force at inception or on the previous reporting date. Foreign exchange income also arises from trading in foreign currencies.
FORWARD EXCHANGE CONTRACTAgreement between two parties to exchange one currency for another at a future date at a rate agreed upon today.
GGOODWILLAn asset representing the future economic benefits arising from other assets acquired in a business combination that are not individually identified and separately recognized.
GROSS DIVIDENDSThe portion of profit inclusive of tax withheld distributed to shareholders.
GROUPA group is a parent and all its subsidiaries.
GUARANTEESPrimarily represent irrevocable assurances that a bank will make payments in the event that its customer cannot meet his / her financial obligations to third parties. Certain other guarantees represent non-financial undertakings such as bid and performance bonds.
HHEDGINGA strategy under which transactions are effected with the aim of providing cover against the risk of unfavourable price movements (interest rate, foreign exchange rate, commodity prices, etc.).
HELD TO MATURITY INVESTMENTSNon derivative financial assets with fixed or determinable payments and fixed maturity that an entity has the positive intention and ability to hold to maturity.
Glossary ofFinancial / Banking Terms
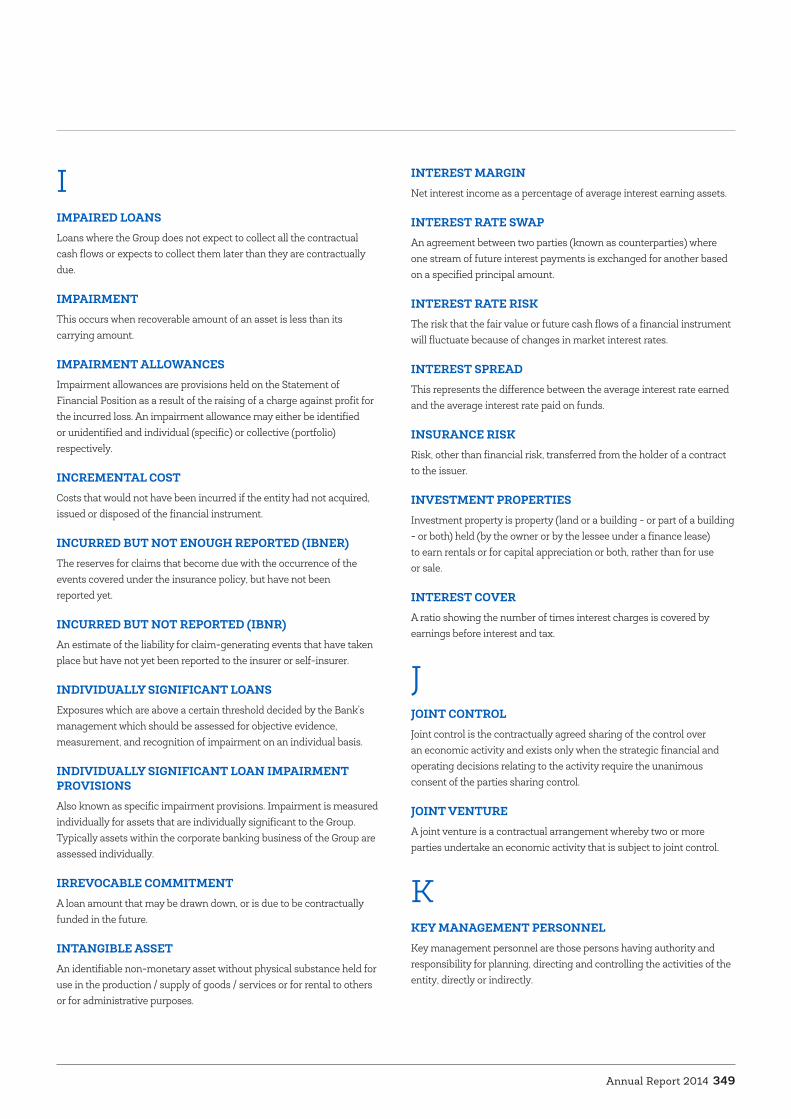
Annual Report 2014 349
IIMPAIRED LOANSLoans where the Group does not expect to collect all the contractual cash flows or expects to collect them later than they are contractually due.
IMPAIRMENTThis occurs when recoverable amount of an asset is less than its carrying amount.
IMPAIRMENT ALLOWANCESImpairment allowances are provisions held on the Statement of Financial Position as a result of the raising of a charge against profit for the incurred loss. An impairment allowance may either be identified or unidentified and individual (specific) or collective (portfolio) respectively.
INCREMENTAL COSTCosts that would not have been incurred if the entity had not acquired, issued or disposed of the financial instrument.
INCURRED BUT NOT ENOUGH REPORTED (IBNER)The reserves for claims that become due with the occurrence of the events covered under the insurance policy, but have not been reported yet.
INCURRED BUT NOT REPORTED (IBNR)An estimate of the liability for claim-generating events that have taken place but have not yet been reported to the insurer or self-insurer.
INDIVIDUALLY SIGNIFICANT LOANSExposures which are above a certain threshold decided by the Bank’s management which should be assessed for objective evidence, measurement, and recognition of impairment on an individual basis.
INDIVIDUALLY SIGNIFICANT LOAN IMPAIRMENT PROVISIONSAlso known as specific impairment provisions. Impairment is measured individually for assets that are individually significant to the Group. Typically assets within the corporate banking business of the Group are assessed individually.
IRREVOCABLE COMMITMENTA loan amount that may be drawn down, or is due to be contractually funded in the future.
INTANGIBLE ASSETAn identifiable non-monetary asset without physical substance held for use in the production / supply of goods / services or for rental to others or for administrative purposes.
INTEREST MARGINNet interest income as a percentage of average interest earning assets.
INTEREST RATE SWAPAn agreement between two parties (known as counterparties) where one stream of future interest payments is exchanged for another based on a specified principal amount.
INTEREST RATE RISKThe risk that the fair value or future cash flows of a financial instrument will fluctuate because of changes in market interest rates.
INTEREST SPREADThis represents the difference between the average interest rate earned and the average interest rate paid on funds.
INSURANCE RISKRisk, other than financial risk, transferred from the holder of a contract to the issuer.
INVESTMENT PROPERTIESInvestment property is property (land or a building - or part of a building - or both) held (by the owner or by the lessee under a finance lease) to earn rentals or for capital appreciation or both, rather than for use or sale.
INTEREST COVERA ratio showing the number of times interest charges is covered by earnings before interest and tax.
JJOINT CONTROLJoint control is the contractually agreed sharing of the control over an economic activity and exists only when the strategic financial and operating decisions relating to the activity require the unanimous consent of the parties sharing control.
JOINT VENTUREA joint venture is a contractual arrangement whereby two or more parties undertake an economic activity that is subject to joint control.
KKEY MANAGEMENT PERSONNELKey management personnel are those persons having authority and responsibility for planning, directing and controlling the activities of the entity, directly or indirectly.

Hatton National Bank PLC350
LLETTER OF CREDIT (L/C)Written undertakings by a Bank on behalf of its customer (typically an importer), authorising a third party (e.g. an exporter) to draw drafts on the Bank up to a stipulated amount under specific terms and conditions. Such undertakings are established for the purpose of facilitating international trade.
LIABILITY ADEQUACY TEST (LAT)Assessment on each reporting date whether the recognized insurance liabilities are adequate, using current estimates of future cash flows under the insurance contract.
LIQUID ASSETSAssets that are held in cash or in a form that can be converted to cash readily, such as deposits with other Banks, Bills of Exchange and Treasury Bills.
LIQUIDITY RISKThe risk that an entity will encounter difficulty in meeting obligations associated with financial liabilities.
LOANS AND RECEIVABLESNon derivative financial assets with fixed or determinable payments that are not quoted in an active market other than those intends to sell immediately or in the near term and designated as fair value through profit or loss or available for sale on initial recognition.
LOSS GIVEN DEFAULT (LGD)LGD is the percentage of an exposure that a lender expects to loose in the event of obligor default.
MMARKET CAPITALISATIONNumber of ordinary shares in issue multiplied by the market value of each share at the year end.
MARKET RISKThis refers to the possibility of loss arising from changes in the value of a financial instrument as a result of changes in market variables such as interest rates, exchange rates, credit spreads and other asset prices.
MATERIALITYThe relative significance of a transaction or an event, the omission or misstatement of which could influence the decisions of users of financial statements.
NNET ASSET VALUE PER SHAREShareholders’ funds divided by the number of ordinary shares in issue.
NET-INTEREST INCOMEThe difference between what a Bank earns on assets such as loans and securities and what it pays on liabilities such as deposits, refinance funds and inter-bank borrowings.
NON CONTROLLING INTERESTEquity in a subsidiary not attributable, directly or indirectly to a parent.
NET PREMIUM METHODA Net Premium Valuation is an actuarial calculation, used to place a value on the liabilities of a life insurer.
OOFF BALANCE SHEET TRANSACTIONSTransactions that are not recognised as assets or liabilities in the Statement of Financial Position, but which give rise to contingencies and commitments.
ONEROUS CONTRACTA type of contract where the costs involved with fulfilling the terms and conditions of the contract are higher than the amount of economic benefit received.
OPERATIONAL RISKThis refers to the risk of loss resulting from inadequate or failed internal processes, people and systems, or from external events.
PPARENTA parent is an entity that has one or more subsidiaries.
PAST DUEA financial asset is past due when a counterparty has failed to make a payment when contractually due.
PRICE EARNINGS RATIO (P/E RATIO)Market price of an ordinary share divided by earnings per share (EPS).
PROBABILITY OF DEFAULT (PD)PD is an internal estimate for each borrower grade of the likelihood that an obligor will default on an obligation.
PRUDENCEInclusion of a degree of caution in the exercise of judgement needed in making the estimates required under conditions of uncertainty, such that assets or income are not overstated and liabilities or expenses are not understated.
Glossary ofFinancial / Banking Terms

Annual Report 2014 351
RREGULAR WAY TRADESA type of trade that is settled through the regular settlement cycle required for the particular investment being traded. The settlement cycle is the time that the regulations of the securities market allows for the buyer to complete payment and for the seller to deliver the goods being purchased.
REPURCHASE AGREEMENTThis is a contract to sell and subsequently repurchase government securities at a given price on a specified future date.
RETURN ON AVERAGE ASSETS (ROAA)Profit after tax expressed as a percentage of average total assets, used along with ROE, as a measure of profitability and as a basis of intra-industry performance comparison.
RETURN ON AVERAGE EQUITY (ROAE)Profit after tax less preferred share dividends if any, expressed as a percentage of average ordinary shareholders’ equity.
REVENUE RESERVEReserves set aside for future distribution and investment.
REVERSE REPURCHASE AGREEMENTTransaction involving the purchase of government securities by a Bank or dealer and resale back to the seller at a given price on a specific future date.
RIGHTS ISSUEIssue of shares to the existing shareholders at an agreed price, generally lower than market price.
RISK-WEIGHTED ASSETSUsed in the calculation of risk-based capital ratios. The face amount of lower risk assets is discounted using risk weighting factors in order to reflect a comparable risk per rupee among all types of assets. The risk inherent in off –balance sheet instruments is also recognised, first by adjusting notional values to balance sheet (or credit) equivalents and then by applying appropriate risk weighting factors.
SSEGMENT REPORTINGSegment reporting indicates the contribution to the revenue derived from business segments such as banking operations, leasing operations, stock broking and securities dealings, property and insurance.
SHAREHOLDERS’ FUNDSShareholders’ funds consist of stated capital, statutory reserves, capital and revenue reserves.
SPECIFIC IMPAIRMENT PROVISIONSImpairment is measured individually for loans that are individually significant to the Bank.
STATUTORY RESERVE FUNDReserve created as per the provisions of the Banking Act No. 30 of 1988.
SUBSIDIARYA subsidiary is an entity, including an unincorporated entity such as a partnership, that is controlled by another entity (known as the parent).
SUBSTANCE OVER FORMThe consideration that the accounting treatment and the presentation in financial statements of transactions and events should be governed by their substance and financial reality and not merely by legal form.
TTIER I CAPITALConsists of the sum total of paid up ordinary shares, non cumulative, non redeemable preference shares, share premium, statutory reserve fund, published retained profits, general and other reserves, less goodwill.
TIER II CAPITALConsists of the sum total of revaluation reserves, general provisions, hybrid capital instruments and approved subordinated debentures.
TOTAL CAPITALTotal capital is the sum of Tier I capital and Tier II capital.
TRANSACTION COSTSIncremental costs that is directly attributable to the acquisition, issue or disposal of a financial asset or financial liability.
UUNEARNED PREMIUM RESERVEThe premium corresponding to the time period remaining on an insurance policy.
UNIT TRUSTAn undertaking formed to invest in securities under the terms of a trust deed.
VVALUE ADDEDValue added is the wealth created by providing banking services less the cost of providing such services. The value added is allocated among the employees, the providers of capital, to government by way of taxes and retained for expansion and growth.
YYIELD TO MATURITYDiscount rate which the present value of future cash flows would equal the security’s current price.

Hatton National Bank PLC352
Notice is hereby given that the Forty Sixth (46th) Annual General Meeting of Hatton National Bank PLC (the “Bank”) is convened on Monday, the Thirtieth (30th) day of March 2015 at the Auditorium on Level 22 of “HNB Towers” at No. 479, T.B. Jayah Mawatha, Colombo 10, at 10.00 in the forenoon when the following business will be transacted:
i. To receive and consider the Annual Report of the Board of Directors along with the Financial Statements of the Bank for the year ended 31st December 2014 and the Auditors’ Report thereon.
ii. To declare a final dividend of Rs. 7.00 per share for the year 2014 to the shareholders as recommended by the Directors and thereafter to consider and if thought fit, to pass the following resolution:
Ordinary Resolution “IT IS HEREBY RESOLVED THAT a final dividend of Rs. 7.00
per share, on both voting and non-voting shares of the Bank, for the financial year ended 31.12.2014, shall be declared”.
iii. To re-elect Dr Ranee Jayamaha, who retires at the Annual General Meeting, as a Director of the Bank in terms of Article 34 of the Articles of Association of the Bank.
iv. To re-elect Miss D S C Jayawardena, who retires at the Annual General Meeting, as a Director of the Bank in terms of Article 34 of the Articles of Association of the Bank.
v. To re-elect Mr R S Captain, who retires at the Annual General Meeting, as a Director of the Bank in terms of Article 34 of the Articles of Association of the Bank.
vi. To re-elect Mr D A Cabraal, as a Director of the Bank in terms of Article 36 of the Articles of Association of the Bank.
vii. To re-appoint Messrs Ernst & Young (Chartered Accountants) as the Bank’s Auditors for the ensuing year and to authorise the Directors to fix their remuneration.
viii. To authorise the Directors to determine payments for the year 2015 for charitable and other purposes.
By order of the Board of Hatton National Bank PLC,
K A L Thushari Ranaweera (Mrs)Deputy General Manager (Legal) /Board Secretary
Colombo, Sri Lanka.20th February 2015
Notes :
1. A member entitled to attend or attend and vote at the meeting, is entitled to appoint a proxy to attend or attend and vote as the case may be, in his stead.
2. A proxy need not be a member of the Company. The Form of Proxy is enclosed.
3. The completed Form of Proxy should be deposited with the Board Secretary at the Registered Office of the Company at No. 479, T.B. Jayah Mawatha, Colombo 10 (at “HNB Towers”, Level 18), not less than 48 hours before the time appointed for holding the meeting.
Notice ofMeeting

Annual Report 2014 353
Notes

Hatton National Bank PLC354
Notes

Annual Report 2014 355
I/We .............................................................................................................................................................................................................................................................................. of
......................................................................................................................................................... being *a member/members of the Hatton National Bank PLC,
hereby appoint ....................................................................................................................................................................................................................................................... of
...................................................................................................................................................................................................................................... or failing him/her Ranee
Jayamaha or failing her, Antonio Jonathan Alles or failing him, Mirihana Arachchige Rose Chandralatha Cooray or failing her, William
Wijesinghe Gamage or failing him, Lokuwithanage Rohan Karunaratne or failing him, Lintotage Udaya Damien Fernando or failing him,
Don Tiburtius Sujeewa Handapangoda Mudalige or failing him, Don Sanjivani Clarinda Jayawardena or failing her, Rusi Sohli Captain, or
failing him, Damian Amal Cabraal, as *my/our proxy, to represent *me/us at the Forty Sixth (46th) Annual General Meeting of the Bank
to be held at the Auditorium on Level 22 of “HNB Towers” at No. 479, T B Jayah Mawatha, Colombo 10, on the Thirtieth (30th) day of
March, 2015 at 10.00 in the forenoon and at any adjournment thereof.
(i) To declare the recommended dividend of Rs. 7.00 per share as the final dividend for 2014 and to adopt the relevant Resolution set out in the Notice of Meeting
In favour
Against
(ii) To re-elect Dr Ranee Jayamaha as a Director of the Bank In favour
Against
(iii) To re-elect Miss D S C Jayawardena as a Director of the Bank In favour
Against
(iv) To re-elect Mr R S Captain as a Director of the Bank In favour
Against
(v) To re-elect Mr D A Cabraal as a Director of the Bank In favour
Against
(vi) To re-appoint Messrs Ernst & Young (Chartered Accountants) as the Bank’s Auditors for the ensuing year/authorise the Directors to fix their remuneration
In favour
Against
(vii) To authorise the Directors to determine payments for charitable and other purposes In favour
Against
Mark your preference with “✓”
Signed this .................................................................... day ..................................... 2015.
Signature/s ................................................................................................................................ ................................................................................................................................ ................................................................................................................................
Please provide the following details:
Shareholder’s NIC No / Company Registration No. : .........................................................................................................................................................................
Folio No / Number of Shares held : .........................................................................................................................................................................
Proxy holder’s NIC No (if not a Director) : .........................................................................................................................................................................
Note - See reverse hereof for instructions to complete the proxy* Delete inappropriate words
Form ofProxy [Voting]
Hatton National Bank PLC356
INSTRUCTIONS TO COMPLETE PROXY
1. The full name and the registered address of the shareholder appointing the Proxy should be legibly entered in the Form of Proxy, duly signed and dated.
2. The completed Proxy should be deposited with the Board Secretary, at the Registered Office of the Bank at No. 479, T B Jayah Mawatha, Colombo 10 (“HNB Towers”, Level 18), not less than 48 hours before the time appointed for holding the Meeting.
3. The Proxy shall -
(a) in the case of an individual, be signed by the shareholder or by his attorney, and if signed by an attorney, a notarially certified copy of the Power of Attorney should be attached to the completed Proxy if it has not already been registered with the Bank.
(b) in the case of a company or corporate body, either be under its Common Seal or signed by its attorney or by an officer on behalf of the Company or corporate body in accordance with the Articles of Association or the Constitution of that Company or corporate body.
The Bank may, but shall not be bound to, require evidence of the authority of any such attorney or officer.
(c) in the case of joint-holders, the first joint-holder has the power to sign the proxy without the concurrence of the other joint-holder/s.
4. Every alteration or addition to the Proxy must be duly authenticated by the full signature of the shareholder, signing the Proxy. Such signature should as far as possible be placed in proximity to the alteration or addition intended to be authenticated.
Form ofProxy [Voting]

Annual Report 2014 357
I/We .............................................................................................................................................................................................................................................................................. of
......................................................................................................................................................... being *a member/members of the Hatton National Bank PLC,
hereby appoint ....................................................................................................................................................................................................................................................... of
............................................................................................................................................................................................................................................... or failing him/her
Ranee Jayamaha or failing her, Antonio Jonathan Alles or failing him, Mirihana Arachchige Rose Chandralatha Cooray or failing her,
William Wijesinghe Gamage or failing him, Lokuwithanage Rohan Karunaratne or failing him, Lintotage Udaya Damien Fernando or
failing him, Don Tiburtius Sujeewa Handapangoda Mudalige or failing him, Don Sanjivani Clarinda Jayawardena or failing her, Rusi Sohli
Captain, or failing him, Damian Amal Cabraal, as *my/our proxy, to represent *me/us at the Forty Sixth (46th) Annual General Meeting of
the Bank to be held at the Auditorium on Level 22 of “HNB Towers” at No. 479, T B Jayah Mawatha, Colombo 10, on the Thirtieth (30th)
day of March, 2015 at 10.00 in the forenoon and at any adjournment thereof.
Signed this .................................................................... day ..................................... 2015.
Signature/s ................................................................................................................................ ................................................................................................................................ ................................................................................................................................
Please provide the following details:
Shareholder’s NIC No / Company Registration No. : .........................................................................................................................................................................
Folio No / Number of Shares held : .........................................................................................................................................................................
Proxy holder’s NIC No (if not a Director) : .........................................................................................................................................................................
Note - See reverse hereof for instructions to complete the proxy* Delete inappropriate words
Form ofProxy [Non-Voting]Form ofProxy [Non-Voting]

Hatton National Bank PLC358
INSTRUCTIONS TO COMPLETE PROXY
1. The full name and the registered address of the shareholder appointing the Proxy should be legibly entered in the Form of Proxy, duly signed and dated.
2. The completed Proxy should be deposited with the Board Secretary, at the Registered Office of the Bank at No. 479, T B Jayah Mawatha, Colombo 10 (“HNB Towers”, Level 18), not less than 48 hours before the time appointed for holding the Meeting.
3. The Proxy shall -
(a) in the case of an individual, be signed by the shareholder or by his attorney, and if signed by an attorney, a notarially certified copy of the Power of Attorney should be attached to the completed Proxy if it has not already been registered with the Bank.
(b) in the case of a company or corporate body, either be under its Common Seal or signed by its attorney or by an officer on behalf of the Company or corporate body in accordance with the Articles of Association or the Constitution of that Company or corporate body.
The Bank may, but shall not be bound to, require evidence of the authority of any such attorney or officer.
(c) in the case of joint-holders, the first joint-holder has the power to sign the proxy without the concurrence of the other joint-holder/s.
4. Every alteration or addition to the Proxy must be duly authenticated by the full signature of the shareholder, signing the Proxy. Such signature should as far as possible be placed in proximity to the alteration or addition intended to be authenticated.
Form ofProxy [Non-Voting]
Annual Report 2014 359
InvestorFeedback Form
To request information or submit a comment / query to the Company, please complete the following and return this page to -
Chief Manager – Planning & Investments, Hatton National Bank PLC, No. 479, T.B. Jayah Mawatha (Darley Road) Colombo 10. Sri Lanka Email : [email protected]
Name : .........................................................................................................................................................................................................................................
Permanent Mailing Address : ..........................................................................................................................................................................................................................................
Contact Numbers - (Tel) : .............................. .......................... .................................................... Country Code Area Code Number
- (Fax) : .............................. .......................... .................................................... Country Code Area Code Number
E-mail : ..........................................................................................................................................................................................................................................
Name of Company : ..........................................................................................................................................................................................................................................(If Applicable)
Designation : ..........................................................................................................................................................................................................................................(If Applicable)
Company Address : ..........................................................................................................................................................................................................................................(If Applicable)
Queries / Comments
Please tick ( ) the appropriate box Yes No
Would you like to receive soft copies of the HNB annual and interim reports via e-mail?
Would you like to receive news and press releases of HNB via e-mail?
Would you like to receive any information on our products / services?
G4-31

AUDITORSErnst & YoungChartered Accountants201, De Saram PlaceColombo 10, Sri Lanka.
INVESTOR INFORMATIONInstitutional Investors, Stock Brokers and Security Analysts requiring financial information should contact the Chief Manager (Planning & Investments)at: “HNB Towers”, Level 16, No. 479, T B Jayah Mawatha (Darley Road), Colombo 10, Sri Lanka.
Telephone : +94 11 2661555,Fax : +94 11 2662815 e-mail : [email protected]
JOINT VENTURE COMPANIES Acuity Partners (Pvt) Ltd 50.00%(Financial Services)
SUBSIDIARY COMPANIESHNB Assurance PLC 60.00%(Insurance Services)
Sithma Development (Pvt) Ltd 100.00%(Property Development)Prime Grameen Micro Finance Limited 51%(Microfinance)
NAME OF COMPANYHATTON NATIONAL BANK PLC
LEGAL FORMA public limited Company incorporated on 5th March 1970 under the Laws of the Republic of Sri Lanka. The Company was re-registered under the Companies Act No 7 of 2007 on 27th September 2007. It is a Licensed Commercial Bank under the Banking Act.
COMPANY REGISTRATION NUMBERPQ 82 (previous PBS 613)
ACCOUNTING YEAR END31st December
STOCK EXCHANGE LISTING The ordinary shares and the unsecured subordinated redeemable debentures of the Bank are listed on the Colombo Stock Exchange in Sri Lanka.
REGISTERED OFFICE"HNB Towers"No. 479, T B Jayah Mawatha (Darley Road),P O Box 837, Colombo 10, Sri Lanka.
HEAD OFFICE“HNB Towers”, No. 479, T B Jayah Mawatha (Darley Road), P O Box 837, Colombo 10, Sri Lanka.
Cable Address : HATNABANKTelephone Nos : +94 11 2664664 +94 11 2662772 +94 11 4764764Fax Nos : +94 11 2662832 Swift : Bic Code – HBLILKLXe-mail : [email protected] : www.hnb.net
CREDIT RATINGS The Bank has been assigned a national long term rating of AA-(lka) by Fitch Ratings Lanka Limited and a Foreign Currency Issuer rating of B1 by Moody's Investors Service.
BOARD OF DIRECTORSDr Ranee Jayamaha (Chairperson)Mr Jonathan Alles (Managing Director / CEO)Ms M A R C CoorayDr W W Gamage (Senior Director)Dr L R KarunaratneMr L U D FernandoMr D T S H MudaligeMs D S C JayawardenaMr Rusi S CaptainMr D A Cabraal
BOARD SECRETARYMs K A L Thushari RanaweeraAttorney-at-Law, LL.M (Cambridge), Dip in Int’l Affairs (BCIS)
AUDIT COMMITTEEMr D T S H Mudalige (Chairman)Mr Rusi S CaptainMs D S C JayawardenaDr L R KarunaratneMr D A Cabraal
NOMINATION COMMITTEEDr W W Gamage (Chairman)Dr Ranee JayamahaMs M A R C Cooray Mr Rusi S Captain
HR & REMUNERATION COMMITTEEDr W W Gamage (Chairman) Dr Ranee Jayamaha Mr L U D FernandoMr D T S H MudaligeMr D A Cabraal
BOARD INTEGRATED RISK MANAGEMENT COMMITTEEMs M A R C Cooray (Chairperson)*Dr Ranee Jayamaha*Dr L Rohan Karunaratne*Ms D S C Jayawardena*Mr L U D Fernando*Mr Jonathan Alles, Managing Director/CEO**
Mr D P N Rodrigo, Chief Operating Officer ***Ms Shanti Gnanapragasam, Chief Risk Officer/AGM-Risk***Mr Sidath Wijeratne, Chief Information Officer/AGM (IT)***Mr Ashok Goonesekere, Chief Financial Officer***Mr Arjuna Ratnasabapathy, Asst General Manager (Recoveries & Credit Quality Management)***Mr C B Wijayaratne, Compliance Officer***Mr Murtaza Normanbhoy, Senior Manager (Internal Audit)*** Representatives of the Board** Representatives of the Board & the Management*** Representatives of the Management
Corporateinformation
Designed & produced by
Digital Plates & Printing by Aitken Spence Printing & Packaging (Pvt) LtdPhotography by Wildlight (Pvt) Ltd

HA
TT
ON
NA
TIO
NA
L BA
NK
PLC –
AN
NU
AL R
EPOR
T 20
14
“HNB Towers”No 479, T B Jayah Mawatha (Darley Road),
P O Box 837, Colombo 10, Sri Lanka
Cable Address : HATNABANKTelephone Nos : +94 11 2664664 +94 11 2662772 +94 11 4764764
Fax : +94 11 2662832 Swift : Bic Code – HBLILKLXE-mail : [email protected]
Web : www.hnb.net


