“Yours is Better!” Participant Response Bias in HCI Nicola Dell † Vidya Vaidyanathan ‡ Indrani Medhi § Edward Cutrell § William Thies § †University of Washington ‡San Jose State University §Microsoft Research India [email protected][email protected]{indranim,cutrell,thies}@microsoft.com ABSTRACT Although HCI researchers and practitioners frequently work with groups of people that differ significantly from themselves, little attention has been paid to the effects these differences have on the evaluation of HCI systems. Via 450 interviews in Bangalore, India, we measure participant response bias due to interviewer demand characteristics and the role of social and demographic factors in influencing that bias. We find that respondents are about 2.5x more likely to prefer a technological artifact they believe to be developed by the interviewer, even when the alternative is identical. When the interviewer is a foreign researcher requiring a translator, the bias towards the interviewer’s artifact increases to 5x. In fact, the interviewer’s artifact is preferred even when it is degraded to be obviously inferior to the alternative. We conclude that participant response bias should receive more attention within the CHI community, especially when designing for underprivileged populations. Author Keywords HCI4D; ICTD; demand characteristics; interviewer effects; bias; culture; social status; methods ACM Classification Keywords H5.m. Information Interfaces and Presentation (e.g., HCI): Miscellaneous; General Terms Design, Human Factors INTRODUCTION The rapid proliferation of technological devices throughout the world has allowed a diverse range of previously unreached user groups to gain access to digital technology. The discipline of human-computer interaction (HCI) has embraced the study of these diverse user groups and HCI researchers have proposed a variety of methodologies targeting their specific needs. For example, a growing number of researchers are investigating the ways in which disabled Permission to make digital or hard copies of all or part of this work for personal or classroom use is granted without fee provided that copies are not made or distributed for profit or commercial advantage and that copies bear this notice and the full citation on the first page. To copy otherwise, or republish, to post on servers or to redistribute to lists, requires prior specific permission and/or a fee. CHI’12, May 5–10, 2012, Austin, Texas, USA. Copyright 2012 ACM 978-1-4503-1015-4/12/05...$10.00. Figure 1. Interviewing an auto rickshaw driver in Bangalore, India. When shown two technologies by a foreign interviewer (with translator), rickshaw drivers preferred the one they believed to be developed by the interviewer, even when it was obviously inferior. people interact with computer systems [15]; researchers in child-computer interaction explore how computer systems are used by children, particularly in the context of education [24]; cross-cultural HCI looks at what happens when designers and users come from different cultural backgrounds [12] and the relatively new field of human- computer interaction for development (HCI4D) looks at the relationship between humans and technology in the context of international development [1]. Although the methods and objectives of these research domains may vary significantly, they share the characteristic that there are increasingly large differences between the investigators and the people under investigation. These differences may stem from variations in ethnicity, education, age, income and other sociodemographic characteristics. In this paper, we discuss the increasingly common situation in which the investigators have higher social status and social power than the people they investigate. An increasing amount of anecdotal evidence [1] [18] suggests that in such situations, participants may be particularly susceptible to a type of response bias known as demand characteristics. Demand characteristics refer to aspects of a study that may convey the investigator’s hypothesis to participants who then adjust their behavior in relation to what they perceive to be the investigator’s expectations [22]. Demand characteristics are an important consideration in any research that involves Session: The Tools of the Trade CHI 2012, May 5–10, 2012, Austin, Texas, USA 1321
Transcript
“Yours is Better!”Participant Response Bias in HCI
Nicola Dell† Vidya Vaidyanathan‡ Indrani Medhi§ Edward Cutrell§ William Thies§
†University of Washington ‡San Jose State University §Microsoft Research [email protected][email protected] {indranim,cutrell,thies}@microsoft.com
ABSTRACTAlthough HCI researchers and practitioners frequentlywork with groups of people that differ significantly fromthemselves, little attention has been paid to the effects thesedifferences have on the evaluation of HCI systems. Via450 interviews in Bangalore, India, we measure participantresponse bias due to interviewer demand characteristics andthe role of social and demographic factors in influencing thatbias. We find that respondents are about 2.5x more likely toprefer a technological artifact they believe to be developedby the interviewer, even when the alternative is identical.When the interviewer is a foreign researcher requiring atranslator, the bias towards the interviewer’s artifact increasesto 5x. In fact, the interviewer’s artifact is preferred evenwhen it is degraded to be obviously inferior to the alternative.We conclude that participant response bias should receivemore attention within the CHI community, especially whendesigning for underprivileged populations.
ACM Classification KeywordsH5.m. Information Interfaces and Presentation (e.g., HCI):Miscellaneous;
General TermsDesign, Human Factors
INTRODUCTIONThe rapid proliferation of technological devices throughoutthe world has allowed a diverse range of previouslyunreached user groups to gain access to digital technology.The discipline of human-computer interaction (HCI) hasembraced the study of these diverse user groups andHCI researchers have proposed a variety of methodologiestargeting their specific needs. For example, a growing numberof researchers are investigating the ways in which disabled
Permission to make digital or hard copies of all or part of this work forpersonal or classroom use is granted without fee provided that copies arenot made or distributed for profit or commercial advantage and that copiesbear this notice and the full citation on the first page. To copy otherwise, orrepublish, to post on servers or to redistribute to lists, requires prior specificpermission and/or a fee.CHI’12, May 5–10, 2012, Austin, Texas, USA.Copyright 2012 ACM 978-1-4503-1015-4/12/05...$10.00.
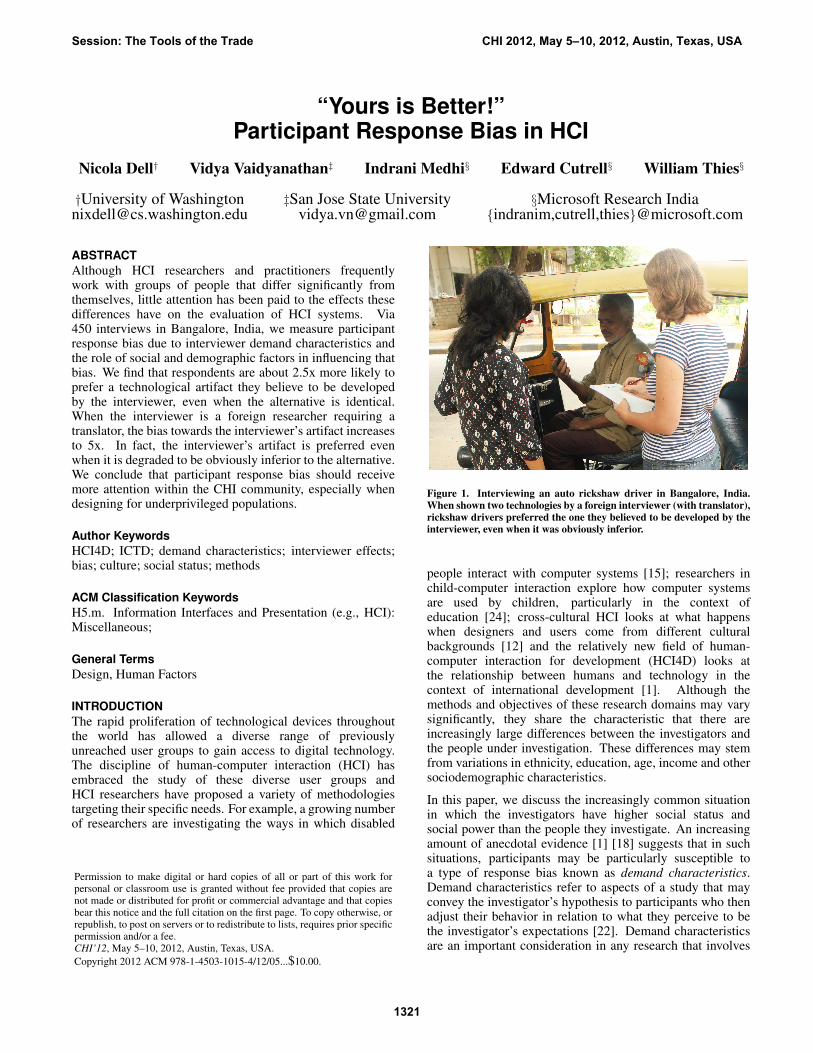
Figure 1. Interviewing an auto rickshaw driver in Bangalore, India.When shown two technologies by a foreign interviewer (with translator),rickshaw drivers preferred the one they believed to be developed by theinterviewer, even when it was obviously inferior.
people interact with computer systems [15]; researchers inchild-computer interaction explore how computer systemsare used by children, particularly in the context ofeducation [24]; cross-cultural HCI looks at what happenswhen designers and users come from different culturalbackgrounds [12] and the relatively new field of human-computer interaction for development (HCI4D) looks atthe relationship between humans and technology in thecontext of international development [1]. Although themethods and objectives of these research domains may varysignificantly, they share the characteristic that there areincreasingly large differences between the investigators andthe people under investigation. These differences may stemfrom variations in ethnicity, education, age, income and othersociodemographic characteristics.
In this paper, we discuss the increasingly common situationin which the investigators have higher social status andsocial power than the people they investigate. An increasingamount of anecdotal evidence [1] [18] suggests that in suchsituations, participants may be particularly susceptible toa type of response bias known as demand characteristics.Demand characteristics refer to aspects of a study that mayconvey the investigator’s hypothesis to participants who thenadjust their behavior in relation to what they perceive to bethe investigator’s expectations [22]. Demand characteristicsare an important consideration in any research that involves
Session: The Tools of the Trade CHI 2012, May 5–10, 2012, Austin, Texas, USA
1321
human participants and may have a large effect on the studyof humans and computer systems.
Although the psychology community acknowledges theeffects of demand characteristics, there has been littleexamination of their effects on the design and evaluation ofHCI systems. Qualitative research presented by Brown etal. highlights some of the ways that participants may altertheir usage of a system to fit the investigators’ expectations[5], but there is a lack of research in HCI that quantifies theextent to which demand characteristics may affect participantbehavior. As a result, the significance of the response bias thatmay result from investigator demand characteristics in HCIremains unknown. In addition, there is a scarcity of researchthat explores how the social and demographic profiles ofinvestigators and participants influence the ways in whichparticipants respond to demand characteristics.
This paper presents a quantitative analysis of demandcharacteristics in an HCI setting. As shown in Figure 1,we focus on the developing-world context, in which thereare frequently large differences between researchers andparticipants, and investigate the impact of varying socialand demographic factors on the observed effects. For ourexperiments, we recruited a total of 450 male participantsfrom two distinct population groups in Bangalore, India,and employed two different interviewers to record participantpreferences as they interacted with technological devices.
Our work makes four core contributions to the CHIcommunity. First, we survey existing literature to bringdemand characteristics and their known effects to theattention of HCI researchers. Second, we show that ifparticipants believe that a particular technological artifactis favored by the interviewer, their responses are biasedto favor it as well. Third, we demonstrate that if theinterviewer is a foreign researcher who requires a translator,responses are even more biased towards the technologyfavored by the interviewer. Finally, we show that for a foreigninterviewer with translator, participants report a preferencefor an obviously inferior technology. Our intention isto sensitize researchers regarding the critical and under-appreciated role of demand characteristics, especially wheninteracting with underprivileged populations.
BACKGROUND AND RELATED WORKBefore discussing in detail the nature of demand character-istics, it is important to note that this is only one of severalbiases that merit attention in studies with human participants.Other biases include social desirability bias, which occurswhen a participant tends to respond in ways that make herlook good [23] [25] and evaluator bias, which occurs whenthe results of a study vary depending on the evaluator ana-lyzing the experimental data [13]. There are also a variety ofbiases that may be attributed to participant survey methodolo-gies, such as acquiescing or extreme responding [23].
We focus on three categories of related research. First, wedraw on psychology literature to discuss the nature of demandcharacteristics and their effects as well as work that focuseson social influence. Then, we examine several public health
studies that look at participant response bias resulting frominterviewer characteristics. Finally, we discuss relevant workwithin the HCI and HCI4D communities.
PsychologyDemand characteristics were first defined by psychologistMartin Orne in 1959 as “the scuttlebutt about the experiment,its setting, implicit and explicit instructions, the person ofthe experimenter, subtle cues provided by him, and, ofparticular importance, the experimental procedure itself. Allof these cues are interpreted in the light of the subject’s pastlearning and experience” [22]. In a series of psychologicalexperiments performed with undergraduates, experimentersfound that participants would willingly perform almost anytask, regardless of how meaningless, boring or uncomfortableit was, since they had knowingly and willingly placedthemselves under the control of the experimenter [20]. Inaddition, participants in an experiment often share with theexperimenter the hope that the study will be successful [22].Frequently, a participant will want to ensure that she makesa useful contribution to the study and so will strive to bea ‘good’ participant and provide the experimenter with the‘right’ results. Alternatively, a participant may resent theexperimenter and actively work to disprove the hypothesis.In either case, a participant should not be viewed merely asa passive responder, but rather as an active agent with a realstake in the outcome of the study.
Although researchers have acknowledged that there maybe a connection between demand characteristics and thetendency for participants to respond in ways confirmingthe experimenter’s hypothesis, few have designed studiesspecifically to quantify this effect. One notable exception is a2008 study by Nichols and Maner in the US that investigatedthe extent to which possessing knowledge of the study’shypothesis affected participant behavior [21]. The findingssuggest that demand characteristics may make experimentaleffects appear more substantial than they actually are.
Demand characteristics cannot be eliminated from anystudy. In the absence of obvious demand characteristics,participants will guess the experimental hypothesis andalter their behavior accordingly [22]. Thus, instead oftrying to eliminate demand characteristics, it is better totake them into account, study their effect, and manipulatethem if necessary. Psychologists have proposed severaltechniques to disguise the purpose of the study or detectparticipants that guess the real hypothesis. These techniquesinclude using the post-experimental inquiry [26], non-deceptive obfuscation [31] and a so-called red herringtechnique [17]. Nevertheless, few studies have directlyexamined the effects of demand characteristics or sought toidentify factors that may increase or decrease the likelihoodthat participants’ succumb to demand characteristics [21].Additionally, different participant populations are likelyto respond to demand characteristics in different ways,and it is important to study under what circumstances,in what kind of experimental contexts, and with whatkind of participant populations, demand characteristicsbecome significant in determining participant behavior [22].
Session: The Tools of the Trade CHI 2012, May 5–10, 2012, Austin, Texas, USA
1322
However, most research investigating demand characteristicshas been performed with undergraduates in the United States.To the best of our knowledge, no psychology experimentshave specifically investigated the extent to which demandcharacteristics might affect studies performed in developingcountries or with disadvantaged communities.
A number of psychological studies examine the influenceof social status on decision-making and social conformity.Strodtbeck and Lipinski [27] found that jury members ofhigher socioeconomic status were more likely to be electedas jury foremen than members of lower socioeconomicstatus. Kirchler and Davis [16] studied the effects of statusdifferences on group consensus and found that participantsof higher status changed their individual opinions andpreferences less often than those of lower status. Finally,Asch [2] performed experiments to study the social andpersonal conditions that cause participants to resist or to yieldto group pressures, and found that participants conformedwith answers given by other people in the group even thoughthe answers chosen were objectively and noticeably wrong.
Public HealthPublic health programs frequently define their target popula-tions by ethnicity, gender, age and other sociodemographiccharacteristics, and there are several relevant studies explor-ing how interviewer characteristics might affect public healthdata. Davis et al. review studies in the US that show race,ethnicity and gender effects [8]. In this context, response biasappears to be most likely to occur when survey items queryattitudes about sociodemographic characteristics or respon-dents’ engagement in sensitive behaviors [14] [30].
Several other studies analyze public health survey data indeveloping countries. Bignami-Van Assche et al. examineddata collected by local interviewers in Kenya and Malawiand conclude that interviewer gender may affect participantresponses to sensitive questions [4]. Weinreb found thatrespondents in Kenya admitted telling untruths to strangerinterviewers because the interviewers were not known by thecommunity and their motives were therefore suspect [29].Bernhart et al. found that the tendency of respondents towithhold critical comment hampered the collection of patientsatisfaction data by government workers in health centersin Indonesia [3]. The paper suggests that more usefulinformation might be obtained by asking participants aboutevents and behaviors, rather than for their opinions.
HCI and HCI4DGiven the importance of usability studies in HCI, it issurprising that there has been so little attention paid tothe effects that demand characteristics may have on theirreliability. In both field trials and laboratory testing, users arefrequently aware of the researcher’s role in the study and thehypotheses under investigation. Although we acknowledgethat it might be impossible to hide a study’s true purpose,participant comments and suggestions are frequently taken atface value and the potential for participant response bias isignored. A notable exception is the field of child computer
interaction in which papers stress that even where there is nodeliberate intervention the interviewer has an effect [24].
We found only one study that specifically addresses demandcharacteristics in HCI. In a ‘trial of trials’ Brown et al. foundthat participants changed their system usage partly to giveresearchers ‘good’ data [5]. The authors argue that demandcharacteristics are a part of what makes field trials possibleand may be exploited to encourage participant usage. Thepaper also suggests that the need for researchers to presenttheir systems as successful is problematic, and that it wouldbe better to postpone the evaluation of technologies untilthey can be better understood by users. While our findingsare aligned with Brown et al., we go beyond qualitativeobservations and contribute a rigorous measurement of theinfluence of demand characteristics in an HCI setting.
There is a growing body of work that explores the roleof culture in HCI. Most of this work addresses the designof global interfaces that can accommodate users’ culturaldifferences [9] [10]. One particularly relevant study byVatrapu et al. examines the effects of culture in structuredinterviews in the US [28]. Two groups of Indian graduatestudents were asked to evaluate a website, and the group withan Indian interviewer provided more feedback and identifiedmore culturally sensitive materials than the group with a USinterviewer. While this study is similar to ours at a highlevel, there are a number of key differences. First, in ourstudy participants interact with two technological artifactsrather than a single website. Since we know the full extentof the differences between the artifacts, we are able tocompare participant responses between different interviewersas well as in relation to ground truth information. Second,in the study by Vatrapu et al., the differences between thetwo participant groups relate mainly to the identification ofculturally sensitive materials. In contrast, our experimentsrelate to purely technological artifacts. Finally, their studyinvolved 16 students while we interview 450 participants.
There are also a number of papers that discuss the role ofculture in the developing world. Irani mentions that culturaldifferences between usability evaluators and participants canaffect evaluation outcomes [12]. Ho et al. find thatthe hierarchical structure of some societies causes users towithhold criticism from researchers [11]. Chavan encouragesparticipants to submit critical feedback by situating userstudies within dramatic storylines [6].
The relatively new subfield of HCI4D targets the design andevaluation of systems that promote international development.Several recent papers anecdotally mention that foreign re-searchers may affect the results of HCI4D studies. Anokwaet al. had difficulty eliciting negative feedback from usersand discuss the importance of gathering data from multiplesources [1]. Ledlie discusses how projects can be hamperedby a lack of cultural insight and suggests methods for obtain-ing critical feedback from participants [18]. Table 1 summa-rizes the papers discussed in this section and highlights thescarcity of research that quantifies participant response biasdue to demand characteristics in an HCI setting. Our papertargets this gap, providing rigorous (and sobering!) experi-
Session: The Tools of the Trade CHI 2012, May 5–10, 2012, Austin, Texas, USA
1323
Psychology Public Health HCI
Orne ’62 Williams ’68 Read ’05Sawyer ’75 Johnson ’94 Chavan ’05
Qualitative Laney ’08 Bernhart ’99 Vatrapu ’06and/or Zizzo ’08 Weinreb ’06 Anokwa ’09Anecdotal Davis ’10 Ho ’09
Irani ’10Ledlie ’10Brown ’11
Milgram ’63 Williams ’68 Vatrapu ’06Rosnow ’73 Johnson ’94
Table 1. Summary of related research on participant response bias.We target the highlighted scarcity of quantitative research exploringparticipant response bias due to demand characteristics in HCI.
mental data to guide the design of future studies and to helpinterpret studies that have already been completed.
EXPERIMENTAL DESIGNFrequently, the aim of a research project in HCI isto introduce a new technological artifact into a targetcommunity, explore the design issues associated with the newtechnology, and evaluate the potential for the technology toimpact the community. The nature of HCI research oftenrequires researchers to spend considerable time in the fieldinteracting with users. However, in many cases, researchersare not members of the target community and may differfrom users in ethnicity, language, culture and socioeconomicstatus. As discussed in the previous section, researcherdemand characteristics have the potential to impact theresponses obtained from users, and we wanted to quantify thiseffect. Specifically, we formulated the following hypotheses:
H.1 If participants believe that the interviewer favors atechnology, their responses will be biased to favor it as well.
H.2 If the interviewer is a foreign researcher requiring atranslator, participants’ responses will be even more biasedtowards the technology favored by the interviewer.
H.3 Participants will express a preference for an obviouslyinferior technology if they believe it is favored by theinterviewer.
To test our hypotheses, we recruited a total of 450participants and conducted a field study in Bangalore, Indiathat comprised two main experiments. In Experiment 1,which was designed to test H.1 and H.2, participants wereshown an identical video clip on each of two identicalsmartphones, one after the other. We purposely introduceddemand characteristics by having the interviewer clearlyassociate herself to one of the phones by telling participantsthat she was working to improve the video player on thatphone. Within this scenario we investigated if changing
Experiment 1: Identical VideosRickshaw Drivers Univ. Students
Foreign Interviewer† 50 50
Local Interviewer 50 50
Experiment 2: Degraded VideoRickshaw Drivers Univ. Students
Without Association‡ 50 50
Foreign Interviewer† 50 50
Local Interviewer 50 0*
† The foreign interviewer interacted with rickshaw drivers withthe aid of a translator.
‡ This condition represented a baseline that minimized demandcharacteristics by removing phrases from the script (in bold) thatassociated one video to the interviewer.
* Because the results obtained from Experiment 1 showedno significant differences between the foreign and localinterviewers with university students, we performed thisexperiment with only one of the interviewers.
Table 2. Number of people interviewed for each experimental condition.
the social and demographic profiles of the interviewers andthe participants affected the extent to which participantssuccumbed to demand characteristics. To do this, interviewswere conducted with two interviewers (a foreign, Caucasianinterviewer and a local, Indian interviewer) and two sets ofparticipants (auto rickshaw drivers and university students).
Experiment 2 tested H.1, H.2 and H.3 by obviously degradingone of the video clips and seeing if participants stated apreference for the degraded video clip when it was associatedwith the interviewer. For quick reference, Table 2 summarizesall the experimental conditions that we tested. The rest ofthis section discusses the general experimental procedure andthe characteristics of the different interviewers and participantpopulations. In subsequent sections we discuss additionaldetails and variations in procedures that were specific to eachexperimental condition.
Experimental ProcedureData collection was performed over a period of 5 weeks inJuly and August 2011. Our experiments utilized a betweensubjects design with a sample size of 50 for each experimentalcondition. Individual participant interviews were conductedfrom Monday to Saturday, between 12pm and 4pm, witheach interview lasting between two and three minutes. Weemployed the same general interview procedure across allexperimental conditions. In advance of the interviews, weuploaded a 21 second video clip of a popular local musicvideo to each of two identical Windows smartphones. Thevideo clip had a resolution of 640 x 480 pixels per frameand 30 frames per second. The phones were set to useexactly the same video player, as well as identical volume andbrightness levels. Individual interviews were administered by
Session: The Tools of the Trade CHI 2012, May 5–10, 2012, Austin, Texas, USA
1324
reading the following script to participants (the exact phrasesintroducing demand characteristics are highlighted in bold):
“Thank you for participating in my experiment. I am acomputer science researcher and I’m trying to improve videoplayers on mobile phones. I want you to watch a short videoon these two phones and tell me which one looks better, or ifthey look the same. The same video will play on both phones,but this phone uses my new player [indicate phone]. Pleasetell me your honest opinion and please concentrate because Iwill play each video only once. Do you have any questions?Ok, watch this one first. This one uses my new player [playvideo]. Now watch this one [play video]. Which one do youthink looks better or do they look the same? Why? Thanksvery much!”
In each experimental condition, the order in which the videoassociated to the interviewer was played was randomized toprevent any bias due to ordering effects. The interviewerrecorded participant responses and comments on paper forlater analysis and aggregation. Responses were coded intothree distinct classes: those that favored the video associatedwith the interviewer, those that favored the video notassociated with the interviewer, and those that said the twovideos looked the same. We included the option of “same”because we expected that it would provide more nuanced datathan a forced-choice paradigm in which participants wererequired to state a preference for one video. However, thispaper focuses on responses that preferred one video to theother, and leaves detailed analysis of “same” responses forfuture work.
InterviewersSince we wanted to vary the social status of the interviewersrelative to the participants, we conducted interviews usingtwo different female, graduate student interviewers: a 29-year-old, English-speaking Caucasian, referred to from nowon as the foreign interviewer, and a 33-year-old, Kannada-and English-speaking Indian referred to from now on asthe local interviewer. The local interviewer grew up in thesame neighborhood in Bangalore in which the interviewswere conducted. As a result, in addition to speaking thelocal language, she was identifiable as a local member of thecommunity through her dress and knowledge of the customsof the area. In contrast, the foreign interviewer was notborn in India, and had spent approximately one month inBangalore at the time that the experiments were performed.Thus, she was distinguishable as an outsider by her ethnicity,language, dress and unfamiliarity with the local customs.
Since participants in one of the groups (auto rickshaw drivers)spoke limited English, the foreign interviewer required atranslator to interact with them. For consistency, weutilized the local interviewer as the translator. The needfor a translator necessarily required the presence of twointerviewers for the interactions with the foreign interviewerbut only one for the interactions with the local interviewer. Itis well known that the presence of multiple interviewers mayhave an affect on participant conformity [2]. However, sincethe presence of a translator is a common occurrence in many
HCI4D projects, and since part of our goal is to emulate arealistic HCI4D setting, any response bias resulting from thepresence of two interviewers, rather than a single interviewer,would also be a factor in HCI4D projects and as such is partof the effect that we are trying to measure.
The social status of local and foreign interviewers differedin the eyes of low-income individuals in India. Althoughforeigners are perceived differently in different countries,in India Caucasians are usually perceived as having a highsocial status. This owes partly to India’s history as a colonyunder British rule. Also, independent of its past, Caucasianvisitors are likely to have an education and income thatis higher than the local mean, and are usually fluent inEnglish, a language associated with prestige and opportunity.In addition, during interviews with rickshaw drivers, thepresence of the translator further elevated the social status ofthe foreign interviewer.
ParticipantsParticipants were recruited from two distinct social groupsthat we chose on the basis of availability and social statusrelative to the interviewers. The first group consisted ofmale university students from the Indian Institute of Science(IISc), an elite scientific graduate institute in India. Werestricted participation to male students since the otherparticipant population (rickshaw drivers) is composed ofmales. Since both of the interviewers were graduate students,the social status of this population was relatively well-matched to that of the interviewers. In addition, all IIScstudents speak English and typically have experience usingand understanding sophisticated technology. We recruiteda total of 200 male university students aged 19 to 41(M=25 years, SD=3.8 years). Recruitment was performed oncampus at IISc by approaching individuals and asking themto participate in a research project. Participants that agreedwere then interviewed immediately. Individual interviewswere done in English by either the foreign interviewer or thelocal interviewer. Participants were not compensated, otherthan being thanked for their time.
The second participant group consisted of local auto rickshawdrivers. Auto rickshaws are 3-wheeled vehicles that providecheap transportation in India. In Bangalore, rickshaw driversare men who usually have some high-school education anda daily income of between US $5 and $10. Rickshawdrivers typically possess cheap mobile phones but do nothave extensive experience with sophisticated technology.As a result, the socio-demographic difference between therickshaw drivers and the interviewers was greater than itwas between the university students and the interviewers.Most rickshaw drivers in Bangalore speak Kannada, the locallanguage in the Indian state of Karnataka.
All rickshaw drivers were recruited by the local intervieweron a single street in Bangalore. The local interviewer stoodon the side of the road and hailed passing auto rickshaws.Rickshaw drivers that stopped were then invited to participatein the experiment. Depending on the condition, the foreigninterviewer would step up at this point or the local interviewer
Session: The Tools of the Trade CHI 2012, May 5–10, 2012, Austin, Texas, USA
1325
Auto ExperimenterChoice Count Autowalla Foreign with translatorLocal onlyN+V Assoc 35 Associated 35 19N+V Non-‐Assoc 7 Unassociated 7 9N+V Same 8 Same 8 22V only Assoc 19V only Non-‐Assoc 9V only Same 22
IISc ExperimenterChoice Count IISc Foreign only Local onlyN only Assoc 25 Associated 25 24N only Non-‐Assoc 11 Unassociated 11 14N only Same 14 Same 14 12V only Assoc 24 IISc Experiment 1-‐IISc (Combined interviewers)V only Non-‐Assoc 14 Preferred interviewer's video103V only Same 12 Preferred other video 41
Thought videos looked the same56
Auto ExperimenterChoice Count Autowalla Foreign with translatorLocal onlyN+V-‐Assoc Degrade 27 Low-‐quality 27 18N+V-‐Assoc Normal 19 High-‐quality 19 29N+V-‐Assoc Same 4 Same 4 3V only-‐AssocDegrade 18V only-‐AssocNormal 29V only-‐AssocSame 3No Assoc Degrade 4No Assoc Normal 38No Assoc Same 8
IISc ExperimenterChoice Count IISc Foreign only No associationN-‐Assoc Degrade 10 Low-‐quality 10 1N-‐Assoc Normal 38 High-‐quality 38 47N-‐Assoc Same 2 Same 2 2No Assoc Degrade 1No Assoc Normal 47No Assoc Same 2
Auto-‐No AssocExperimenterChoice Count Autowalla Foreign + LocalLocal OnlyN+V First 11 First 11 12N+V Second 23 Second 23 20N+V Same 16 Same 16 18V only First 12V only Second 20V only Same 18
IISc-‐No AssocExperimenterChoice Count IISc Foreign No AssociationN+V First 9 First 9 10
103
41 56
0
20
40
60
80
100
120 Num
ber o
f parXcipants Preferred interviewer's video
Preferred other video Thought videos looked the same
Figure 2. Results of Experiment 1: Preferences stated by participantswhen shown identical video clips (combined across all conditions).
would begin the experiment. In both cases, the rickshawdriver remained seated in the vehicle. We simplified theinterview script slightly to make it easier for rickshaw driversto understand. Specifically, in the second sentence of thescript, the phrase “I am a computer science researcher” waschanged to “I am a computer scientist”. Other than this smallchange, the interview script was identical to that used forthe university students. A total of 250 male rickshaw driversaged 19 to 72 (M=37 years, SD=11.2 years) were interviewed.Participants were compensated for their time with a small giftworth about $1. However, a large number of participantsrefused to accept compensation, and as a result we ceasedcompensation for the rickshaw drivers in Experiment 2.
EXPERIMENT 1: RESPONSE TO IDENTICAL VIDEOSExperiment 1 recorded participants’ preferences when shownan identical video clip on each of two identical smartphones,with the interviewer associating herself to one of the videoclips as described in the previous section. The experimentutilized a 2x2 factorial design in which we varied both theinterviewer (foreign and local) and the participants (rickshawdrivers and university students).
The results of the experiment are summarized in Figure 2,which shows participant responses aggregated across allconditions. As expected, participants who expressed apreference for either video were more likely to choose thevideo associated with the interviewer. For this paper, wedefine the response bias as the ratio between the numberof participants who preferred the interviewer’s video tothe number of participants who preferred the other video.Averaging across all conditions, the response bias was 2.5x.
Detailed results for each condition appear in Figure 3.While there was a response bias in all cases, the magnitudeof the bias varied with the interviewer and participantgroup. The largest bias occurred when the foreign researcherinterviewed rickshaw drivers: there was a 5x bias in favorof the interviewer’s video (Figure 3a). The smallest bias,1.7x, occurred in the opposite configuration, when the localresearcher interviewed university students (Figure 3d). Theother conditions showed intermediate response biases of 2.3xwith the foreign interviewer and university students (Figure3b) and 2.1x with the local interviewer and rickshaw drivers(Figure 3c).
Autowalla Foreign with translatorLocal onlyPreferred interviewer's video 35 19Preferred other video 7 9 Rickshaw -‐ identical -‐ foreignThought videos looked the same8 22
IISc Foreign only Local onlyAssociated 25 24Unassociated 11 14Same 14 12
Autowalla Foreign with translatorLocal only No associationPrefers low-‐quality video 27 18 4High-‐quality 19 29 38 Rickshaw -‐ degraded -‐ foreignSame 4 3 8
IISc Foreign only No associationPreferred low-‐quality video 10 1Preferred high-‐quality video 38 47Thought videos looked the same2 2
AXIS TITLES FOR DEGRADED VIDEO AXIS TITLES FOR IDENTICAL VIDEOS
19
9
22
0
10
20
30
40
50
Num
ber o
f peo
ple
Preferred interviewer's video Preferred other video Thought videos looked the same
1
47
2 0
10
20
30
40
50
Num
ber o
f peo
ple
Preferred low-‐quality video Preferred high-‐quality video Thought videos looked the same
4
38
8 0
10
20
30
40
50
Num
ber o
f peo
ple
35
7 8
0
10
20
30
40
50
Num
ber o
f peo
ple
27 19
4
0
10
20
30
40
50
Num
ber o
f peo
ple
† The foreign interviewer interacted with rickshaw drivers withthe aid of a translator.
Figure 3. Participants’ responses when shown two identical videos.
Testing H.1: Presence of Response BiasTo evaluate Hypothesis 1, we compare to the null hypothesisthat interviewer association does not impact participantresponses, i.e., that the same number of people choose theinterviewer’s video as the other video, and the responsebias is 1. The null hypothesis is strongly rejected for theaggregate responses, as reflected in Figure 2 (χ2(1, n =144) = 26.7, p < 0.001). At a finer granularity, the biasis also significant in the case of the foreign interviewer,interacting either with rickshaw drivers (χ2(1, n = 44) =18.7, p < 0.001) or university students (χ2(1, n = 36) =5.4, p = 0.02). The bias observed with the local interviewerwas borderline-significant in the case of rickshaw drivers(χ2(1, n = 28) = 3.6, p = 0.06) and not significant inthe case of university students (χ2(1, n = 38) = 2.6, p =0.10). However, pooling across both participant groups doesreveal a significant bias in response to the local interviewer(χ2(1, n = 66) = 6.1, p = 0.01).
Testing H.2: Impact of Foreign InterviewerHypothesis 2 states that the response bias increases whenthe interviewer is a foreign researcher requiring a translator.The only condition satisfying this criterion is that of theforeign interviewer with rickshaw drivers. Thus, to test thishypothesis, we compare the response bias observed with theforeign interviewer and rickshaw drivers to conditions witha different interviewer (local instead of foreign) or differentparticipants (university students instead of rickshaw drivers).
Our results suggest a trend that is consistent with thehypothesis: the bias between foreign interviewer andrickshaw drivers is 5x (Figure 3a), but it decreases to 2.1xwhen replacing the foreign interviewer with a local one
Session: The Tools of the Trade CHI 2012, May 5–10, 2012, Austin, Texas, USA
1326
Figure 4. A single frame from the high quality video clip (left) and the low quality, degraded video clip (right).
(Figure 3c), or to 2.3x when replacing rickshaw driverswith university students (Figure 3b). To evaluate thesignificance of this trend, we utilize 2x2 contingency tables,in which the variables are video chosen (Interviewer’s, Other)and, depending on the test, interviewer (Foreign, Local)or participant (Rickshaw Driver, University Student). ForExperiment 1, we do not find a significant relationshipbetween the video chosen and the interviewer (χ2(1, n =70) = 2.28, p = 0.13) or the participant group (χ2(1, n =78) = 2.11, p = 0.15)). However, this effect is significant inExperiment 2, as described in the next section.
EXPERIMENT 2: RESPONSE TO A DEGRADED VIDEOWe designed Experiment 2 to measure the extent ofparticipant response bias in the face of an obviously poortechnological artifact. To do this, rather than showingparticipants identical video clips, we made one of the videoclips noticeably worse than the other and had the interviewerassociate herself to the degraded clip. Specifically, theresolution of one of the clips was decreased from 640 x 480to 120 x 90 pixels per frame (the media player scaled bothvideos to the full screen width of 800 x 480.) Additionally,the video frame rate was halved, from 30 to 15 frames persecond. The audio, brightness, content and length of thevideo clips remained unchanged. Sample video frames fromthe original, high-quality video clip and the degraded, low-quality clip are shown in Figure 4. For our experiments, weloaded the low-quality video clip on one smartphone and thehigh-quality clip on the other.
To ensure that the video clip had been sufficiently degradedso as to be noticeably different from the original, high-qualityclip, we performed an experiment in which participants wereshown the two video clips one after the other without theinterviewer associating herself to either clip. To achieve this,we modified the interview script by removing the phrasesfrom the script (emphasized in bold) that associated the videoto the interviewer. The rest of the interview script remainedunchanged. The order in which the low-quality clip wasplayed was randomized to avoid order effects.
Following this, interviews were conducted in which theinterviewer associated herself to the low-quality clip. The
experimental procedure and interview script used wereidentical to those described for Experiment 1. As inExperiment 1, interviews were conducted for two sets ofinterviewers (foreign and local) and two sets of participants(rickshaw drivers and university students). However, wedid not evaluate the condition in which the local researcherinterviews university students. Since the results obtainedfrom Experiment 1 showed no significant differences betweenthe foreign interviewer and the local interviewer with theuniversity students, we felt that performing this experimentwith only one of the interviewers was sufficient.
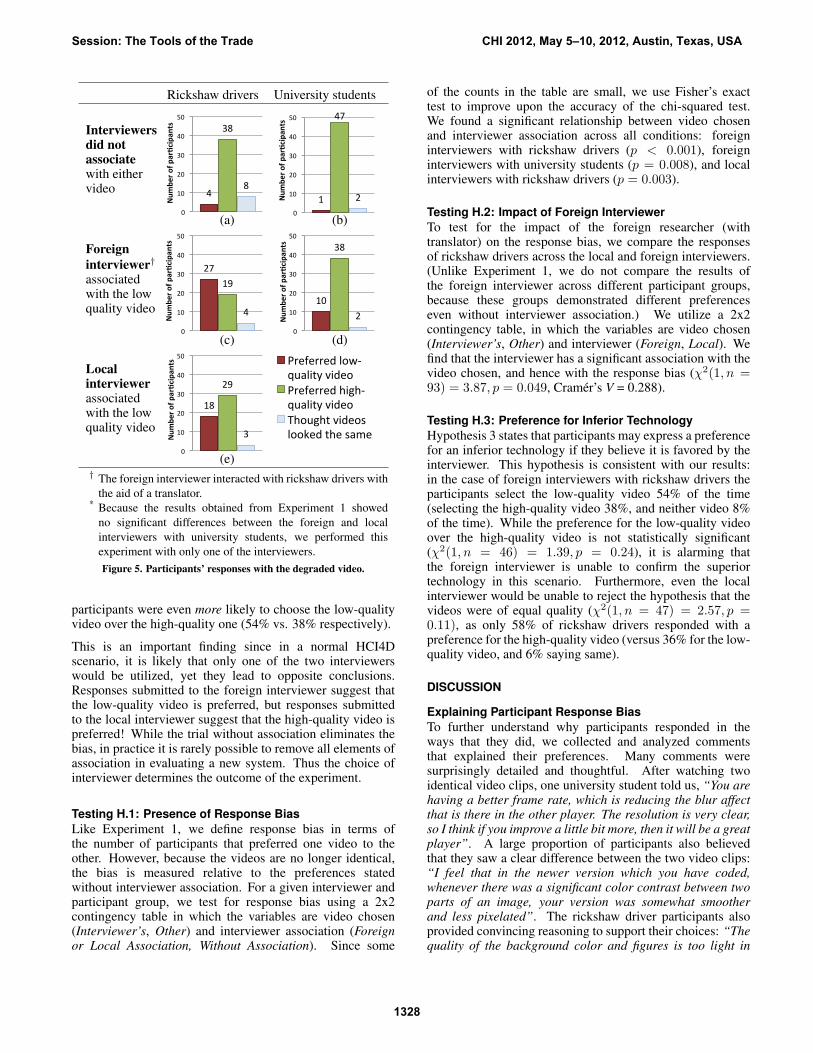
Overview of ResultsThe results of Experiment 2 appear in Figure 5. When the twovideos were presented without the interviewer associating toeither video, university students (Figure 5b) overwhelminglychose the high-quality clip (about 95%). Rickshaw driversusually chose the high-quality clip (about 75%), though theysaid they looked the same about 15% of the time (Figure 5a).
When the interviewer associated herself to the degradedvideo, the degree of response bias varied by participantgroup. In the case of university students (Figure 5d), mostparticipants still selected the high-quality clip (about 75%).However, almost 20% of participants chose the low-quality(associated) clip, an order of magnitude more than when itwas unassociated.
The response bias is more dramatic in the case of rickshawdrivers. When the interviewer was associated with the low-quality clip (collapsing across foreign and local interviewers),rickshaw drivers were almost as likely to choose theinterviewer’s (low-quality) clip as the other (high-quality)clip, 45% and 48%, respectively. However, as in Experiment1, there was a dramatic difference between how participantsresponded to the local interviewer alone compared to theforeign interviewer with local translator. When the low-quality clip was associated with the local interviewer alone,participants were 4.5 times more likely to select it than whenit was unassociated (Figure 5e), though they still usuallypreferred the high-quality video (36% low-quality vs. 58%high-quality). But when the low-quality video was associatedwith the foreign interviewer (Figure 5c), this ratio flipped:
Session: The Tools of the Trade CHI 2012, May 5–10, 2012, Austin, Texas, USA
Autowalla Foreign with translatorLocal onlyPreferred interviewer's video 35 19Preferred other video 7 9 Rickshaw -‐ identical -‐ foreignThought videos looked the same8 22
IISc Foreign only Local onlyAssociated 25 24Unassociated 11 14Same 14 12
Autowalla Foreign with translatorLocal only No associationPrefers low-‐quality video 27 18 4High-‐quality 19 29 38 Rickshaw -‐ degraded -‐ foreignSame 4 3 8
IISc Foreign only No associationPreferred low-‐quality video 10 1Preferred high-‐quality video 38 47Thought videos looked the same2 2
AXIS TITLES FOR DEGRADED VIDEO AXIS TITLES FOR IDENTICAL VIDEOS
19
9
22
0
10
20
30
40
50
Num
ber o
f peo
ple
Preferred interviewer's video Preferred other video Thought videos looked the same
1
47
2 0
10
20
30
40
50
Num
ber o
f peo
ple
Preferred low-‐quality video Preferred high-‐quality video Thought videos looked the same
4
38
8 0
10
20
30
40
50
Num
ber o
f peo
ple
35
7 8
0
10
20
30
40
50
Num
ber o
f peo
ple
27 19
4
0
10
20
30
40
50
Num
ber o
f peo
ple
Localinterviewerassociatedwith the lowquality video
(e)† The foreign interviewer interacted with rickshaw drivers with
the aid of a translator.* Because the results obtained from Experiment 1 showed
no significant differences between the foreign and localinterviewers with university students, we performed thisexperiment with only one of the interviewers.Figure 5. Participants’ responses with the degraded video.
participants were even more likely to choose the low-qualityvideo over the high-quality one (54% vs. 38% respectively).
This is an important finding since in a normal HCI4Dscenario, it is likely that only one of the two interviewerswould be utilized, yet they lead to opposite conclusions.Responses submitted to the foreign interviewer suggest thatthe low-quality video is preferred, but responses submittedto the local interviewer suggest that the high-quality video ispreferred! While the trial without association eliminates thebias, in practice it is rarely possible to remove all elements ofassociation in evaluating a new system. Thus the choice ofinterviewer determines the outcome of the experiment.
Testing H.1: Presence of Response BiasLike Experiment 1, we define response bias in terms ofthe number of participants that preferred one video to theother. However, because the videos are no longer identical,the bias is measured relative to the preferences statedwithout interviewer association. For a given interviewer andparticipant group, we test for response bias using a 2x2contingency table in which the variables are video chosen(Interviewer’s, Other) and interviewer association (Foreignor Local Association, Without Association). Since some
of the counts in the table are small, we use Fisher’s exacttest to improve upon the accuracy of the chi-squared test.We found a significant relationship between video chosenand interviewer association across all conditions: foreigninterviewers with rickshaw drivers (p < 0.001), foreigninterviewers with university students (p = 0.008), and localinterviewers with rickshaw drivers (p = 0.003).
Testing H.2: Impact of Foreign InterviewerTo test for the impact of the foreign researcher (withtranslator) on the response bias, we compare the responsesof rickshaw drivers across the local and foreign interviewers.(Unlike Experiment 1, we do not compare the results ofthe foreign interviewer across different participant groups,because these groups demonstrated different preferenceseven without interviewer association.) We utilize a 2x2contingency table, in which the variables are video chosen(Interviewer’s, Other) and interviewer (Foreign, Local). Wefind that the interviewer has a significant association with thevideo chosen, and hence with the response bias (χ2(1, n =93) = 3.87, p = 0.049, Cramer’s V = 0.288).
Testing H.3: Preference for Inferior TechnologyHypothesis 3 states that participants may express a preferencefor an inferior technology if they believe it is favored by theinterviewer. This hypothesis is consistent with our results:in the case of foreign interviewers with rickshaw drivers theparticipants select the low-quality video 54% of the time(selecting the high-quality video 38%, and neither video 8%of the time). While the preference for the low-quality videoover the high-quality video is not statistically significant(χ2(1, n = 46) = 1.39, p = 0.24), it is alarming thatthe foreign interviewer is unable to confirm the superiortechnology in this scenario. Furthermore, even the localinterviewer would be unable to reject the hypothesis that thevideos were of equal quality (χ2(1, n = 47) = 2.57, p =0.11), as only 58% of rickshaw drivers responded with apreference for the high-quality video (versus 36% for the low-quality video, and 6% saying same).
DISCUSSION
Explaining Participant Response BiasTo further understand why participants responded in theways that they did, we collected and analyzed commentsthat explained their preferences. Many comments weresurprisingly detailed and thoughtful. After watching twoidentical video clips, one university student told us, “You arehaving a better frame rate, which is reducing the blur affectthat is there in the other player. The resolution is very clear,so I think if you improve a little bit more, then it will be a greatplayer”. A large proportion of participants also believedthat they saw a clear difference between the two video clips:“I feel that in the newer version which you have coded,whenever there was a significant color contrast between twoparts of an image, your version was somewhat smootherand less pixelated”. The rickshaw driver participants alsoprovided convincing reasoning to support their choices: “Thequality of the background color and figures is too light in
Session: The Tools of the Trade CHI 2012, May 5–10, 2012, Austin, Texas, USA
1328
that player while the quality of the color and graphics isbetter in [your] one. Will [your] new player be introducedin the market?” Additionally, several participants seemedanxious to give us a genuine answer: “I’ve given you myhonest opinion, so please don’t be cross with me if it wasn’tthe right one”. These comments suggest that participants didnot just tell the interviewer the ‘right’ response while secretlythinking otherwise, but rather that participants seemed togenuinely believe the interviewer’s artifact to be superiorand identified convincing reasons to justify their choice.These findings have important implications for researchersand indicate that even detailed and convincing participantopinions cannot be taken at face value.
RecommendationsOur primary recommendation is that researchers pay moreattention to the types of response bias that might result fromworking with any participant population and actively takesteps to minimize this bias. To do this, it is important thatinterviewers dissociate themselves as much as possible fromany particular design or solution. Our findings indicate thatif participants are aware of the interviewer’s personal stakein the outcome of the study, the results are more likely to beaffected by demand characteristics. Additionally, collectingand reporting subjective information from participants asa primary method of evaluation is problematic and shouldbe avoided. We have shown that even though participantcomments might be detailed, well thought out and deliveredwith conviction, they do not necessarily reflect the meritof the solutions at hand. As far as possible, the focus ofparticipant interviews and feedback should be on obtainingfactual, rather than subjective, information [3]. Using implicitmetrics [7] or triangulation [19] to validate the data collectedcould further increase confidence in the results of the study.
Our findings also suggest that minimizing the differencesbetween the interviewer and the participants could helpto mitigate the response bias resulting from interviewerdemand characteristics. A large number of existing ofHCI4D research papers extol the practice of ‘field work’ inwhich researchers spend time with potential users in thosecircumstances in which the technology might take hold [1][18]. While we do not dispute the value of field work orthe benefits of establishing rapport with users, we stress thatcare must be taken to understand the complications and errorthat may result from the influence of researchers working incommunities that are vastly different from their own.
Generalization and LimitationsOur experiments focus on the ways in which social anddemographic factors may affect participant response bias dueto demand characteristics. However, this is only one aspectof demand characteristics, and there are undoubtedly manymore that could play an influential role on the outcome of astudy. For example, research suggests that gender might bean important factor that could influence participant responses[8]. However, in this study we have specifically avoidedexamining the extent to which gender may play a role in anybias observed. All of our participants were male and all of
the interviewers were female. A separate study would berequired to understand the ways in which response bias mightbe affected by participant and interviewer gender.
Additionally, social status and ethnicity are influential socialcharacteristics in many cultures, but their exact effects arelikely to vary from culture to culture. Our experience inIndia has been that Westerners are often afforded special orpreferential treatment, but research performed in rural Kenyasuggests that outsiders there may be treated with hostilityand suspicion [29]. Furthermore, our experiments only dealwith situations in which the social status of the intervieweris either the same as or higher than the participants. Furtherresearch is required to investigate the nature and magnitudeof participant bias in other contexts.
The analysis in this paper focused on the case in whichparticipants expressed a preference for one video or another,without paying much attention to the cases in whichthe videos were judged to be the same. The “same”responses contain valuable information and represent afruitful opportunity for follow-up analysis. For example, inthe case of the local interviewer and the rickshaw drivers,there is a strong preference for “same”, which could beevidence of a partial response bias amongst participantswho otherwise would have chosen the video that was notassociated with the interviewer. More sophisticated analysistools could quantify this effect.
Finally, the experiments presented in this paper have beenconducted within a particular culture and city, and withtwo specific participant populations. Since we wantedto emulate a realistic HCI4D setting, one of the chosenparticipant populations required the presence of a locallanguage translator for the interactions with the foreigninterviewer. As a result, we are unable to determine whetherthe response bias we observed was caused primarily bythe large difference in social status between the foreigninterviewer and the rickshaw drivers, by the addition of atranslator, or both. Further research is required to teaseapart the extent to which these different factors individuallyinfluence participant responses.
CONCLUSIONSAs the field of HCI embraces the globalization of technology,researchers and practitioners are increasingly working withgroups of people that differ significantly from themselves.This paper brings the notion of demand characteristics to theattention of the CHI community and explores the effects thatthey may have on participant responses. Via experimentswith 450 participants in Bangalore, India, we showed that(1) if participants believe that a particular technologicalartifact is favored by the interviewer, their responses arebiased to favor it as well, (2) the bias due to interviewerdemand characteristics is exaggerated much further when theinterviewer is a foreign researcher requiring a translator, and(3) in response to a foreign interviewer with a translator,participants of lower social status report a preference for anobviously inferior technology, which they otherwise do notprefer. Until now, the significance of demand characteristics
Session: The Tools of the Trade CHI 2012, May 5–10, 2012, Austin, Texas, USA
1329
in HCI has remained largely unexplored and undervalued.We have demonstrated that it is crucial for researchers andpractitioners to pay more attention to the role of social statusand the effects that demand characteristics may have in thedesign and analysis of studies involving human participants.
ACKNOWLEDGEMENTSWe would like to thank Sara Kiesler for going above andbeyond the call of duty to improve this paper. We alsowant to acknowledge Mary Czerwinski, Jonathan Donner,Jonathan Grudin, Brandon Lucia, Anne Oeldorf-Hirsch,Nimmi Rangaswamy and all of our participants for theirvaluable contributions to this research.
REFERENCES1. Anokwa, Y., Smyth, T., Ramachandran, D., Sherwani, J.,
Schwartzman, Y., Luk, R., Ho, M., Moraveji, N., andDeRenzi, B. Stories from the Field: Reflections on HCI4DExperiences. ITID 5, 4 (2009).
2. Asch, S. Effects of Group Pressure Upon the Modificationand Distortion of Judgements. In H. Guetzkow (ed.)Groups, Leadership, and Men (1951).
3. Bernhart, M., Wiadnyana, I., Wihardjo, H., and Pohan, I.Patient Satisfaction in Developing Countries. SocialScience and Medicine 48 (1999).
4. Bignami-Van Assche, S., Reniers, G., and Weinreb, A. AnAssessment of the KDICP and MDICP Data Quality.Demographic Research S1, 2 (2002).
5. Brown, B., Reeves, S., and Sherwood, S. Into the Wild:Challenges and Opportunities for Field Trial Methods. InCHI (2005).
6. Chavan, A. Another Culture, Another Method. In CHI(2005).
7. Czerwinski, M., Horvitz, E., and Cutrell, E. SubjectiveDuration Assessment: An Implicit Probe for SoftwareUsability. In IHM-HCI Conference (2001).
8. Davis, R., Couper, M., Janz, N., Caldwell, C., andResnicow, K. Interviewer Effects in Public Health Surveys.Health Education Research 25, 1 (2010).
9. Evers, V. Cross-Cultural Understanding of Metaphors inInterface Design. In Proc. Cultural Attitudes towardsTechnology and Communication (1998).
10. Evers, V., and Day, D. The Role of Culture in InterfaceAcceptance. In INTERACT’97 (1997).
11. Ho, M., Smyth, T., Kam, M., and Dearden, A.Human-Computer Interaction for Development: The Past,Present, and Future. ITID 5, 4 (2009).
12. Irani, L. HCI on the Move: Methods, Culture, Values. InCHI Extended Abstracts (2010).
13. Jacobsen, N. The Evaluator Effect in Usability Studies:Problem Detection and Severity Judgments. In Proc. of theHuman Factors and Ergonomics Society 42nd AnnualMeeting (1998).
14. Johnson, T., and J, P. Interviewer Effects on Self-ReportedSubstance Use Among Homeless Persons. Addict Behavior19 (1994).
15. Kane, S., Wobbrock, J., and Ladner, R. Usable Gestures forBlind People: Understanding Preference and Performance.In CHI (2011).
16. Kirchler, E., and Davis, J. The Influence of Member StatusDifferences and Task Type on Group Consensus andMember Position Change. Personality and SocialPsychology 51, 1 (1986).
17. Laney, C., Kaasa, S., Morris, E., Berkowitz, S., Bernstein,D., and Loftus, E. The Red Herring technique: AMethodological Response to the Problem of DemandCharacteristics. Psychological Research 72 (1962).
18. Ledlie, J. Huzzah for my Thing: Evaluating a Pilot of aMobile Service in Kenya. Qual Meets Quant, London, UK(2010).
19. Mackay, W. Triangulation within and across HCIdisciplines. Human-Computer Interaction 13, 3 (1998).
20. Milgram, S. Behavioral Study of Obedience. Abnormal andSocial Psychology 67, 4 (1963).
21. Nichols, A., and Maner, J. The Good Subject Effect:Investigating Participant Demand Characteristics. GeneralPsychology 135 (2008).
22. Orne, M. On the Social Psychology of the PsychologicalExperiment: With Particular Reference to DemandCharacteristics and their Implications. AmericanPsychologist 17 (1962).
23. Paulhus, D. Measurement and Control of Response Bias. J.P. Robinson, P. R. Shaver and L. S. Wrightsman eds.Measures of personality and social psychological attitudes(1991).
24. Read, J., and Fine, K. Using Survey Methods for Designand Evaluation in Child Computer Interaction. In Workshopon Child Computer Interaction: Methodological Researchat Interact (2005).
25. Rosnow, R., Goodstadt, B., Suls, J., and Gitter, G. More onthe social psychology of the experiment: When complianceturns to self-defense. Personality and Social Psychology 27,3 (1973).
26. Sawyer, A. Detecting Demand Characteristics inLaboratory Experiments in Consumer Research: The Caseof Repetition-Affect Research. Advances in ConsumerResearch Volume 02, eds. Mary Jane Schlinger:Association for Consumer Research (1975).
27. Strodtbeck, F., and Lipinski, R. Becoming First amongEquals: Moral Considerations in Jury Foreman Selection.Personality and Social Psychology 49, 4 (1985).
28. Vatrapu, R., and Perez-Quinones, M. Culture and UsabilityEvaluation: The Effects of Culture in Structured Interviews.Usability Studies 1 (2006).
29. Weinreb, A. The Limitations of Stranger-Interviewers inRural Kenya. American Sociological Review 71 (2006).
30. Williams, J. Interviewer Role Performance: a Further Noteon Bias in the Information Interview. Public OpinionQuarterly 32 (1968).
31. Zizzo, D. Experimenter Demand Effects in EconomicExperiments. Available at SSRN:http://ssrn.com/abstract=1163863 (last accessed09/03/2011), 2008.
Session: The Tools of the Trade CHI 2012, May 5–10, 2012, Austin, Texas, USA