38
YourSay Community Panel Transport & City Services Survey Summary Report 27 April 2021

YourSay Community Panel
Transport & City Services Survey
Summary Report
27 April 2021

2
Background: Transport Canberra and City Services (TCCS) utilised the YourSay
Community Panel to undertake research with the ACT community about a range of services
they provide. This included questions relating to use and experiences with public transport
and active travel, bulky waste collection, and dog registration.
Purpose: The findings from the survey will help TCCS and the ACT Government more
broadly to plan and refine policies and programs according to how Canberrans are engaging
with services. Results will also help to inform communication and messaging approaches
about these services to the public.
Timeframe: The survey took place between 24 Feb-1 March 2021.
Sample: 1,766 YourSay Community Panel members completed the survey.
Weighting: The results have been weighted to reflect relative population proportions based
on Australian Bureau of Statistics (ABS) Census figures.
Rounding: In single choice questions, results may not add up to 100% due to rounding.
Limitations: The methodology is biased towards those with internet and computer literacy.

3
Sample profile (unweighted)
n=1,766
59%
39%
1%
1%
6%
15%
19%
17%
21%
19%
5%
Female
Male
Non-binary
Prefer not to say
16-24
25-34
35-44
45-54
55-64
65-74
75+
GenderRegion
Age
13%
25%
18%
9%9%
10%
17%
* Totals may not add up to 100% due to rounding
Travel methods

5
Car use is dominant though active options and public transport
also emerge for travel to some activities
Q. How are you travelling for the following activities? – any activity
32%
18%
95%
2%
17%
64%
25%
7%
n=1,766
Bus
Light rail
Car / passenger
Motorcycle
Taxi / Rideshare
Walk
Cycle
eScooter

6
Car is the dominant form of transport for all activities
n=1,766
12%
7%
88%
1%
2%
43%
11%
3%
Bus
Light rail
Car / passenger
Motorcycle
Taxi / Rideshare
Walk
Cycle
eScooter
ShoppingSocial
activities
Visiting
friends /
family
Sport &
recreationMedical
appts
Q. How are you travelling for the following activities? *
18%
13%
89%
1%
14%
36%
14%
5%
10%
6%
93%
1%
5%
24%
10%
2%
10%
4%
77%
2%
2%
41%
20%
2%
11%
5%
87%
1%
4%
20%
6%
1%
* Percentages based on all who gave a response (i.e. excluding ‘not applicable’ for each activity)

7
Work and education are the most common purpose for which
public transport is used
n=1,766
22%
9%
77%
2%
2%
17%
15%
3%
Bus
Light rail
Car / passenger
Motorcycle
Taxi / Rideshare
Walk
Cycle
eScooter
Paid work
Voluntary
or support
work
Education
School
drop-off /
pick-up
Community
services
Q. How are you travelling for the following activities? *
12%
4%
84%
1%
1%
18%
8%
0%
25%
9%
73%
1%
1%
19%
15%
1%
8%
1%
84%
0%
0%
23%
8%
0%
13%
8%
84%
0%
4%
19%
6%
1%
* Percentages based on all who gave a response (i.e. excluding ‘not applicable’ for each activity)

Public transport

9
Around half of Canberrans are using public transport
n=1,766
25%
24%
50%
Yes - currently use
Yes - have used in past 3 months
No
Q. Do you currently use public transport (bus or light rail) or
have you done so in the last 3 months?
10
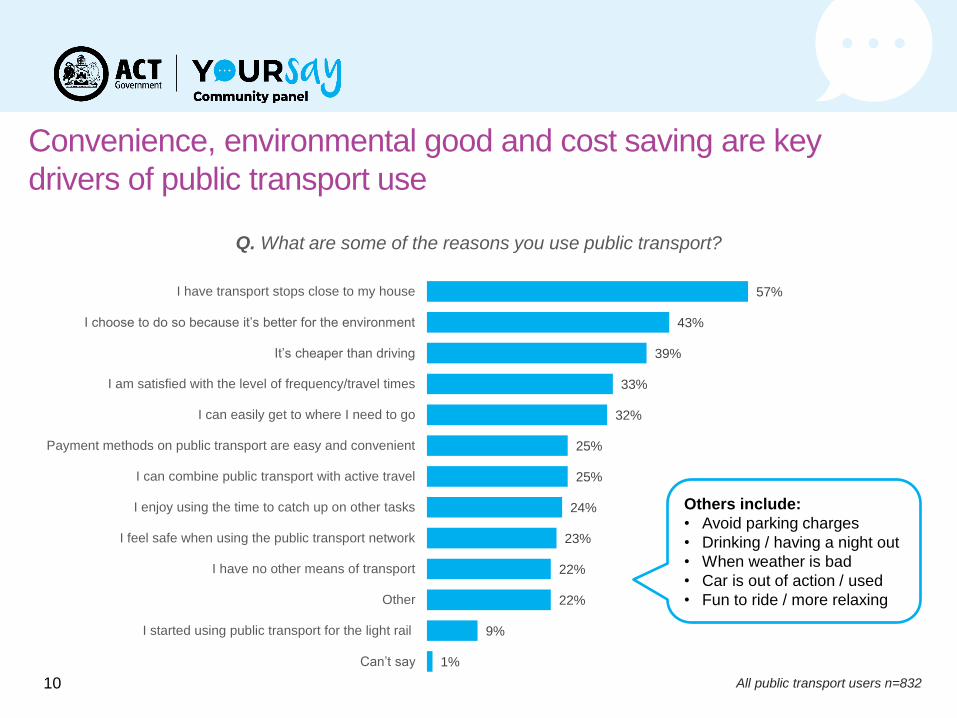
Convenience, environmental good and cost saving are key
drivers of public transport use
Q. What are some of the reasons you use public transport?
57%
43%
39%
33%
32%
25%
25%
24%
23%
22%
22%
9%
1%
I have transport stops close to my house
I choose to do so because it’s better for the environment
It’s cheaper than driving
I am satisfied with the level of frequency/travel times
I can easily get to where I need to go
Payment methods on public transport are easy and convenient
I can combine public transport with active travel
I enjoy using the time to catch up on other tasks
I feel safe when using the public transport network
I have no other means of transport
Other
I started using public transport for the light rail
Can’t say
All public transport users n=832
Others include:
• Avoid parking charges
• Drinking / having a night out
• When weather is bad
• Car is out of action / used
• Fun to ride / more relaxing

11
Expansion of light rail, service frequency, and service information
all key aspects which users feel could improve experience
Q. What are some of the things to do with public transport you feel could be improved?
58%
46%
44%
41%
39%
39%
28%
23%
19%
18%
17%
15%
7%
3%
An expanded light rail network
Shorter travel times/more frequent services (weekdays)
An environmentally friendly electric bus fleet
Timely service information and updates
Shorter travel times/more frequent services (weekends)
The ability to pay using my phone
Greater connectivity with the bike/footpath network
Safer stops and interchanges
An on-demand service that takes me where I need
Other
Ease of use
Stops closer to my house
Cleaner services
None
All public transport users n=832
Others include:
• More direct / express routes
• Stops closer to me
• Cheaper / subsidised fares
• Better facilities (stops,
shelters, interchanges)
• Park and ride options
• An app / live tracking
12
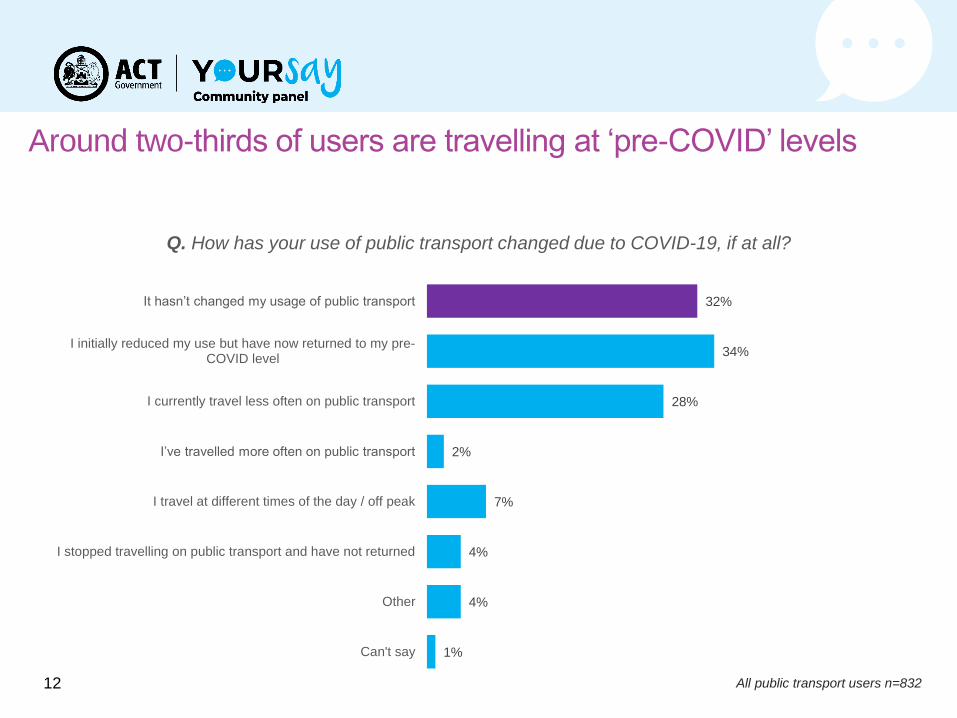
Around two-thirds of users are travelling at ‘pre-COVID’ levels
Q. How has your use of public transport changed due to COVID-19, if at all?
32%
34%
28%
2%
7%
4%
4%
1%
It hasn’t changed my usage of public transport
I initially reduced my use but have now returned to my pre-COVID level
I currently travel less often on public transport
I’ve travelled more often on public transport
I travel at different times of the day / off peak
I stopped travelling on public transport and have not returned
Other
Can't say
All public transport users n=832

13
Additional cleaning and health messaging have majority support
for continuing after COVID-19
Q. Of the current COVID-19 safety measures in place on public transport which do you
believe should continue into the future (post COVID-19)?
64%
63%
48%
35%
33%
7%
5%
6%
3%
Additional cleaning on board and at stops and stations
Customer public transport etiquette messaging (e.g. do nottravel if unwell)
Encouragement of physical distancing on board and at stopsand stations
Use of rear doors on buses at all stops (unless low floor accessis required)
No cash on buses – MyWay or pre-paid tickets only
Closure of bus front seats
Other
None
Can’t say
All public transport users n=832

14
Convenience factors are common barriers to use, with travel
time having a key bearing
Q. Why do you not use public transport at the moment?
58%
46%
43%
35%
30%
23%
21%
18%
14%
12%
9%
8%
8%
6%
5%
Travel time is too long
I prefer to drive
I don’t have light rail close to my house
Services don’t go where I need to go
Services are not frequent enough
Other
Stops are too far from my house
The service is not flexible enough
I prefer to walk/ride/e-scoot
It’s too hard to work out how to use the service
It is too expensive
I do not know how or where to buy a ticket
I don’t need to travel
Info about services not accessible or timely
Public transport isn’t safe
Non-public transport users n=926
Others include:
• Concerns due to COVID-19
• Accessibility, mobility issues
• Services too busy, packed
• Doesn’t run when needed
• Weather – too hot / cold to wait
• Need to drive for school drop-
off / pick-up
15
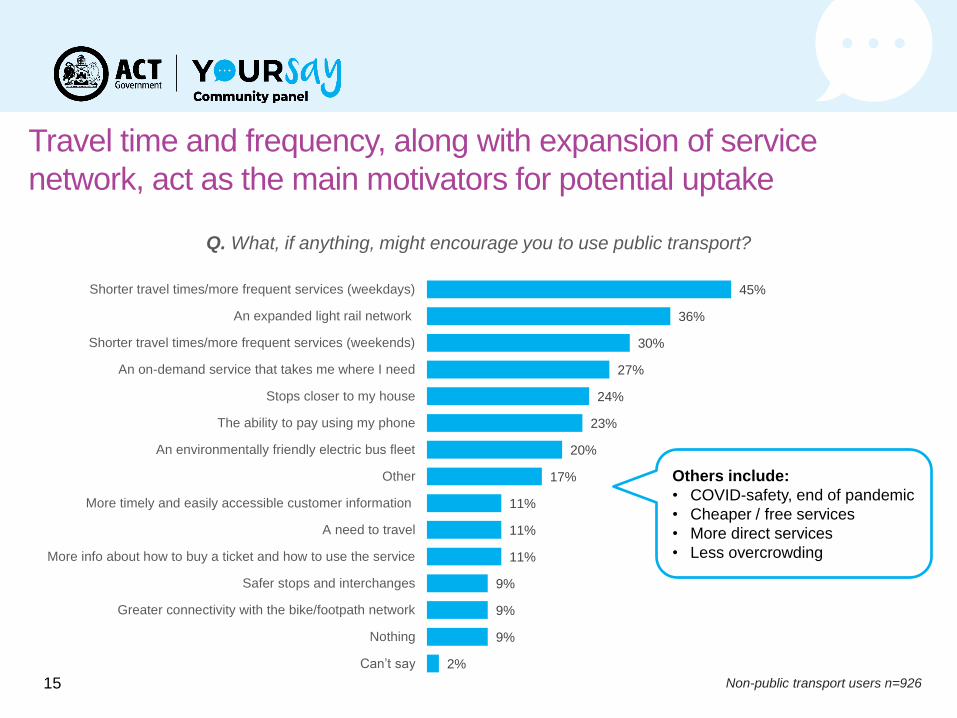
Travel time and frequency, along with expansion of service
network, act as the main motivators for potential uptake
Q. What, if anything, might encourage you to use public transport?
45%
36%
30%
27%
24%
23%
20%
17%
11%
11%
11%
9%
9%
9%
2%
Shorter travel times/more frequent services (weekdays)
An expanded light rail network
Shorter travel times/more frequent services (weekends)
An on-demand service that takes me where I need
Stops closer to my house
The ability to pay using my phone
An environmentally friendly electric bus fleet
Other
More timely and easily accessible customer information
A need to travel
More info about how to buy a ticket and how to use the service
Safer stops and interchanges
Greater connectivity with the bike/footpath network
Nothing
Can’t say
Non-public transport users n=926
Others include:
• COVID-safety, end of pandemic
• Cheaper / free services
• More direct services
• Less overcrowding

16
Just over six in ten Canberrans will consider using public
transport in the next six months
n=1,766
38% 24% 26% 8% 4%
Q. Do you think you will use or consider using public transport in the next six months?
Definitely Probably Probably not Definitely not Can't say
17
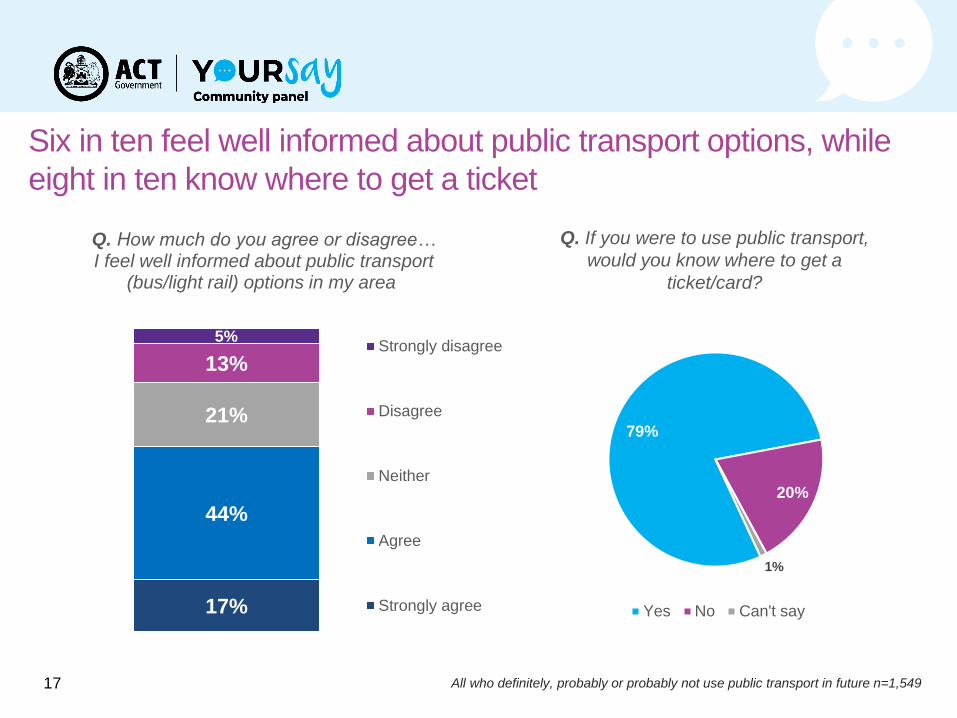
Six in ten feel well informed about public transport options, while
eight in ten know where to get a ticket
All who definitely, probably or probably not use public transport in future n=1,549
79%
20%
1%
Yes No Can't say17%
44%
21%
13%
5%
Q. How much do you agree or disagree… I feel well informed about public transport
(bus/light rail) options in my area
Strongly disagree
Disagree
Neither
Agree
Strongly agree
Q. If you were to use public transport,
would you know where to get a
ticket/card?

18
Transport Canberra website is the ‘go to’ source for information,
supplemented by point of use sources
Q. Where would you go to get information about services and ticketing?
80%
32%
32%
20%
18%
16%
13%
13%
11%
9%
7%
6%
2%
1%
Transport Canberra website
Information at interchanges
Information at stops
Our Canberra website
Friends/family/word of mouth
Access Canberra contact centre
QR code at stop / app about services
Information at ticket vendors
Transport Canberra social media
Other website/other social media
Other
Our Canberra newsletter
Information from a letterbox drop
Not sure
Older residents tend to
be more likely than
others to seek info from
Our Canberra and
Access Canberra
Social media as a
preference is higher
among younger
Canberrans
All who definitely, probably or probably not use public transport in future n=1,549

Active travel

20
Four in ten Canberrans participate in active travel as part of
their daily commute
n=1,766
41%
45%
15%
Yes No Not applicable
Q. Do you walk / run / cycle or e-scoot as part of your daily commute?

21
Walking is most common, while two-thirds combine active travel
with public transport use
Q. What mode of active travel do you use?
83%
40%
9%
5%
1%
Walk
Bike
E-scooter or other electricdevice (e.g. electric skateboard)
Run
Other
All who engage in active travel n=678 / All who engage in active travel and use public transport n=423
63%35%
2%
Yes No Can't say
Q. Do you combine any of this
active travel with public transport?

22
Convenience and necessity are the main barriers to people
engaging in active travel
All who do not engage in active travel n=739
Q. Why don’t you walk / run / cycle or e-scoot as part of your daily commute?
42%
33%
32%
26%
19%
13%
8%
8%
7%
6%
6%
2%
Not convenient
Don't have time
I have no need to
Other
I don’t feel safe riding on the road
Health reasons
Don’t feel safe on e-scooters or other electric devices
I don’t know where the cycle paths go/how to navigate them
Cost of hiring e-scooters
I don’t have access to end of trip/pedestrian facilities
Not enough bike paths
Not thought about it before
Others include:
• Not commuting much,
work from home
• Long distance to cover
• Safety concerns
• Cost of bikes / eScooters
• Need to travel to different
places during the day

Bulky waste collection

24
Eight in ten Canberrans have heard of the free bulky waste
collection service
Q. How did you hear about the bulky waste
collection service?
53%
36%
31%
19%
18%
14%
11%
3%
1%
2%
Our Canberra newsletter
In the local media
ACT Government social media
Online (e.g. website, online search)
Word of mouth
Letterbox drop
Other social media post
Other
Outdoor advertising (e.g. local shops)
Can't say
n=1,766 / those aware n=1490
80%
20%
Yes No
Q. Before today, had you heard about
the bulky waste collection service?

25
Eight in ten of those eligible for the service have not used it yet,
largely because they have not needed to
Q. Why have you not used the bulky waste
collection service to date?
65%
20%
12%
11%
5%
5%
5%
4%
2%
1%
I haven’t needed a bulky waste collection
Other
It was easier to deal with / dispose of bulkywaste myself
I didn’t know the service was available to me
The service would not take the items that Iwanted to be collected
The booking process was too difficult
I didn’t know where I could leave items for collection
I am unable to physically move my items
The booking availability was not what Iexpected
Can’t say
Eligible n=793 / not used n=641
11%7%
81%
Yes, and I booked it online
Yes, and I booked it over the phone
No
Q. Have you used the ACT
Government’s free bulky waste
collection service?
Others include:
• Not got round to it /
time to do it
• Need to go through
body corp / strata
• Feel like not available
in my area yet
26
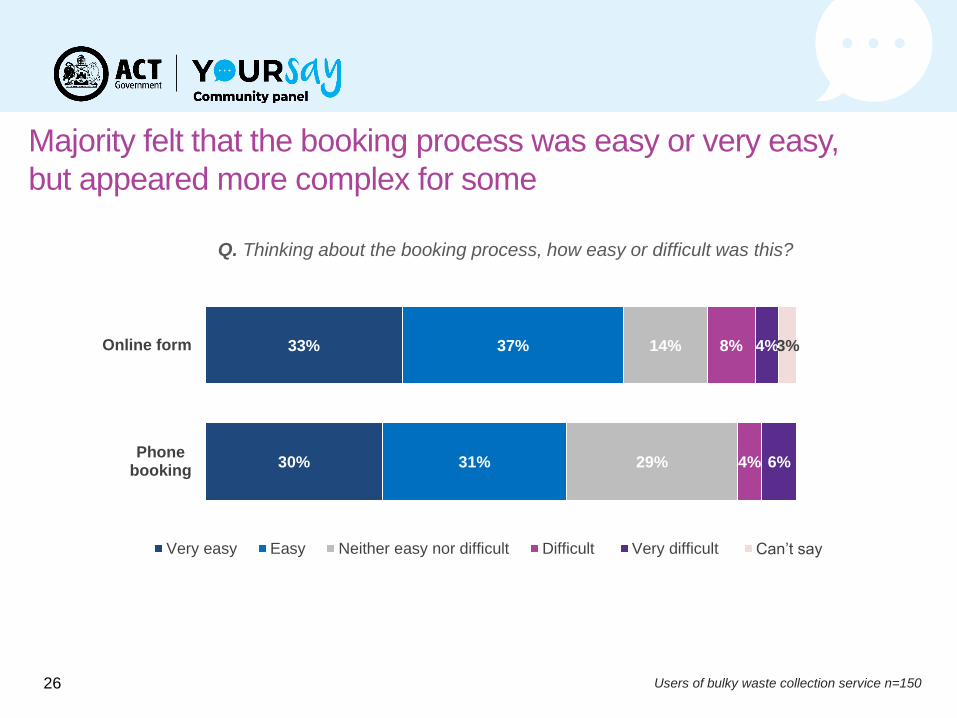
Majority felt that the booking process was easy or very easy,
but appeared more complex for some
Users of bulky waste collection service n=150
33%
30%
37%
31%
14%
29%
8%
4%
4%
6%
3%Online form
Phonebooking
Q. Thinking about the booking process, how easy or difficult was this?
Very easy Easy Neither easy nor difficult Difficult Very difficult Can’t say

27
User experience is highly positive – if anything, weakest area
appears to be the ease of arranging the collection
41%
53%
53%
61%
53%
47%
59%
41%
42%
35%
32%
32%
34%
34%
39%
38%
8%
9%
10%
4%
6%
10%
1%
14%
6%
3%
3%
5%
3%
3%
Met your needs
Saved you money
Saved you time
Was more convenient for you
Allowed you to get rid of things that you would not havebeen able to otherwise
Was good for the environment
Provided a valuable service
Was straightforward to arrange
Q. How much do you agree or disagree that the bulky waste collection service…
Strongly agree Agree Neither agree nor disagree Disagree Strongly disagree Can’t say
Users of bulky waste collection service n=150

28
Widespread endorsement of service among those who have
used it, with strong likelihood to use again
83% 11% 3%
Q. How likely would you be to use the service again in the future?
Very likely Likely Neither likely nor unlikely Unlikely Very unlikely
Users of bulky waste collection service n=150

29
Almost three-quarters suggest they will use the bulky waste
service once available to them
40% 33% 13% 6% 5%
Q. How likely do you think you are to use the bulky waste collection service once it becomes available in your area?
Very likely Likely Neither likely nor unlikely Unlikely Very unlikely Can't say
Currently not eligible for bulky waste service n=864

30
Around 4 in 10 say they’ll use the service in the first three months
Q. Once the bulky waste service is available in your area, how soon do you think you will
make a booking?
14%
28%
22%
22%
9%
5%
Within the first two weeks
Within the first three months
Within the first six months
At any time before the one free collection per annual yearcomes to an end
I don’t think I will make a booking this year
Can’t say
All likely or neither likely nor unlikely to use service n=779

31
Our Canberra and a letterbox drop are most preferred means to
hear about availability of service
Q. How would you like to hear from us when the bulky waste collection service is rolled
out to your area?
59%
56%
46%
37%
19%
18%
13%
13%
2%
Our Canberra newsletter (print or online)
Letterbox drop
ACT Government social media
ACT Government website
Other local media
Local radio
Other social media
Outdoor advertising (e.g. local shops)
Other
All likely or neither likely nor unlikely to use service n=779

32
‘Save a trip to the tip’ is most favoured message to encourage
uptake of service
Q. Please select the messages you feel would most likely motivate you to book a bulky
waste collection
All non-users of service n=1,616
67%
55%
35%
17%
6%
5%
6%
3%
Save a trip to the tip
Book your free bulky waste collection today
Clear out the clutter these holidays
Bulky waste be gone
Take a break from your bulky waste
I have another idea for a message
None of the above
Can’t say

Dog registration

34
Around a third of Canberrans own dogs, significantly higher in
Tuggeranong
33%
66%
Yes No
n=1,766
Q. Do you currently own
a dog/s?
48%
36%
32%
32%
28%
26%
23%
Tuggeranong
Weston & Molonglo
Belconnen
Woden
Inner North
Inner South
Gungahlin
Ownership by region

35
Large majority of dog owners are aware of need and have current
registration
Dog owners n =568
92%
4%
4%
Yes No Can't say
92%
8%
1%
Yes No Can't say
Q. Are you aware that your
dog/s need to be registered?
Q. Are your dog/s currently
registered?

36
Biggest reason for non-registration is not having got round to it *
Q. Why are your dog/s not currently registered?
59%
36%
32%
26%
I have not gotten around to it yet
I do not think it is necessary
I do not want to pay a fee
Other
Dog owners without current registration n=22* Low base – treat results with caution

37
Direct email, text or letter is the most preferred option for
communication about dog registration
Q. How could the ACT Government best communicate with you about the need to keep its
details up to date?
79%
40%
29%
24%
21%
20%
15%
7%
7%
4%
2%
1%
1%
1%
SMS / text message
Letter in the mail
ACT Government social media
Our Canberra printed newsletter to households
Information at pet shops/vets/dog clubs
Signage at dog parks
Signage at key dog walking locations
Advertising on TV/radio/press
Our Canberra online
Other
Website
Other social media
Can't say
All dog owners n=568


