138
YOUTH EDUCATION INVESTMENT AND LABOR MARKET OUTCOMES IN THE PHILIPPINES SURVEY REPORT JULY 2019

Youth Education Investment and Labor Market Outcomes in the PhilippinesSurvey Report
This report presents fi ndings from a survey in the Philippines on what shapes young people’s decisions about their education. The survey focused on students’ choice of track in senior high school—academic, technical-vocational and livelihood, sports, or arts and design—their choice of college course, and their occupational preferences and expectations. It was conducted by the Asian Development Bank in collaboration with the Philippine Department of Education. Its results highlight the most infl uential considerations and information sources for students and households. This report aims to help enhance career guidance programs and long-term labor market outcomes.
About the Asian Development Bank
ADB is committed to achieving a prosperous, inclusive, resilient, and sustainable Asia and the Pacifi c, while sustaining its e� orts to eradicate extreme poverty. Established in 1966, it is owned by 68 members—49 from the region. Its main instruments for helping its developing member countries are policy dialogue, loans, equity investments, guarantees, grants, and technical assistance.
About the Philippines Department of Education
DepEd’s mission is to protect and promote the right of every Filipino to quality, equitable, culture-based, and complete basic education. The department formulates, implements, and coordinates policies, plans, programs and projects in the areas of formal and non-formal basic education. It supervises all elementary and secondary education institutions, including alternative learning systems, both public and private; and provides for the establishment and maintenance of a complete, adequate, and integrated system of basic education relevant to the goals of national development.
ASIAN DEVELOPMENT BANK6 ADB Avenue, Mandaluyong City1550 Metro Manila, Philippineswww.adb.org
DEPARTMENT OF EDUCATIONDepEd Complex, Meralco Avenue, Pasig City1600 Metro Manila, Philippineswww.deped.gov.ph
YOUTH EDUCATION INVESTMENT AND LABOR MARKET OUTCOMES IN THE PHILIPPINESSURVEY REPORT
JULY 2019


Youth Education invEstmEnt and Labor markEt outcomEs in thE PhiLiPPinEsSurvey report
JuLy 2019

© 2019 Asian Development Bank Department of Education6 ADB Avenue, Mandaluyong City DepEd Complex, Meralco Avenue, Pasig City1550 Metro Manila, Philippines 1600 Metro Manila, PhilippinesTel +63 2 632 4444; Fax +63 2 636 2444 Tel +63 2 633 7206/636 6549; Fax +63 2 631 8494www.adb.org www.deped.gov.ph
Some rights reserved. Published in 2019.
ISBN 978-92-9261-686-1 (print), 978-92-9261-687-8 (electronic)Publication Stock No. TCS190267-2DOI: http://dx.doi.org/10.22617/TCS190267-2
The views expressed in this publication are those of the authors and do not necessarily reflect the views and policies of the Asian Development Bank (ADB) or its Board of Governors or the governments they represent or the Department of Education of the Government of the Philippines (DepEd).
Neither ADB nor DepEd guarantee the accuracy of the data included in this publication and accept no responsibility for any consequence of their use. The mention of specific companies or products of manufacturers does not imply that they are endorsed or recommended by ADB nor DepEd in preference to others of a similar nature that are not mentioned.
By making any designation of or reference to a particular territory or geographic area, or by using the term “country” in this document, neither ADB nor DepEd intend to make any judgments as to the legal or other status of any territory or area.
This work is available under the Creative Commons Attribution-NonCommercial 3.0 IGO license (CC BY-NC 3.0 IGO) https://creativecommons.org/licenses/by-nc/3.0/igo/. By using the content of this publication, you agree to be bound by the terms of this license. For attribution, translations, adaptations, and permissions, please read the provisions and terms of use at https://www.adb.org/terms-use#openaccess.
This CC license does not apply to non-ADB or non-DepEd copyright materials in this publication. If the material is attributed to another source, please contact the copyright owner or publisher of that source for permission to reproduce it. Neither ADB nor DepEd can be held liable for any claims that arise as a result of your use of the material.
Please contact [email protected] if you have questions or comments with respect to content, or if you wish to obtain copyright permission for your intended use that does not fall within these terms, or for permission to use the ADB logo. Please contact DepEd directly for permission to use the DepEd logo.
Corrigenda to ADB publications may be found at http://www.adb.org/publications/corrigenda.
Notes: In this publication, “$” refers to United States dollars.ADB recognizes “Korea” as the Republic of Korea.
On the cover: Various initiatives and programs of the private and public sectors are geared toward supporting and empowering young people and improving their access to education.Cover photos by Ariel Javellana and Veejay Villaranca for ADB.
Creative Commons Attribution-NonCommercial 3.0 IGo license (CC By-NC 3.0 IGo)
iii
Contents
Tables, Figures, and Boxes ivForeword viiAcknowledgments viiiAbbreviations xExecutive Summary xi
I. Introduction 1II. Youth Education Investment and Labor Market Outcomes Survey 4 Overview 4 Survey Implementation 10III. Key Findings 14 Profile of Sample 14 Career Guidance 17 Choice of Senior High School Track 25 Choice of College Major 34 Occupational Preferences and Expectations 39 Other Findings 42IV. Summary 62 Insights from Currently Employed Adults 63 Considerations in Making Educational Investment 63
and Career Planning Decisions Primary Sources of Information When Making Educational Investment 64
and Career Planning Decisions Other Contextual Considerations and Resource Complementarity 64 Potential Areas for Future Research 65
Appendixes 1 School Questionnaire 66 2 Household Questionnaire 77 3 Student Questionnaire 99 4 Data Cleaning Steps Undertaken 117
References 119

iv
tables, Figures, and Boxes
Tables 1 Proportion of Schools Offering a Specific Type of Guidance Service 18 2 Proportion of Schools Citing a Specific Priority in Providing Guidance Programs 18 3 Proportion of Schools Citing a Specific Source of Career Guidance 19
Information Shared with Students, by School Type 4 Proportion of Household Members Citing Availability of Specific Information 21
while Choosing Career Path 5 Proportion of Household Members Indicating Preference to Have Had 24
Specific Information Available while Choosing Career Path, by Survey Area 6.a Preferred Track versus Track Likely to Be Taken Given Current Circumstances 30
in National Capital Region (Proportion of Grade 9 and 10 students) 6.b Preferred Track versus Track Likely to Be Taken Given Current Circumstances 30
in Ilocos Sur (Proportion of Grade 9 and 10 students) 6.c Preferred Track versus Track Likely to Be Taken Given Current Circumstances 31
in Eastern Samar (Proportion of Grade 9 and 10 students) 6.d Preferred Track versus Track Likely to Be Taken Given Current Circumstances 31
in Davao del Sur (Proportion of Grade 9 and 10 students) 7 Proportion of Parents Identifying a Specific Major Consideration 33
in the Choice of Child’s Track, by Survey Area 8 Proportion of Students Preferring a Specific Occupation by Age 30, 40
by School Type 9 Proportion of Households with Information on Potential Financial Aid 42
for Children in Senior High School, by Survey Area and Locality 10.a Proportion of Grade 9 Students Who Qualified for Educational Service 45
Contracting Program but Did Not Take It Up for a Specific Reason 10.b Proportion of Grade 10 Students Who Qualified for Educational Service 46
Contracting Program but Did Not Take It Up for a Specific Reason 11.a Proportion of Schools Citing Limited Funds for Facilities and Teaching Personnel 47
as a Main Reason Why School Does Not Offer a Specific Track or Strand, by Survey Area
11.b Proportion of Schools with Available Funding that Cite Difficulty Finding 47 Specialized Teaching Personnel as One of the Main Reasons for Not Offering a Specific Track or Strand, by School Type
11.c Proportion of Schools with Available Funding that Cite Difficulty Finding 48 Specialized Teaching Personnel as One of the Main Reasons for Not Offering a Specific Track or Strand, by Survey Area
12.a Proportion of Schools Citing a Specific Issue as a Major Constraint 50 for the School, by School Type
12.b Proportion of Schools Citing a Specific Issue as a Major Constraint 51 for the School, by Survey Area
13 Distribution of Transferees and Would-Be Transferees, 52 by Locality and School Type
14.a Proportion of Students Citing a Specific Reason for Transferring 53 from Another School, by Grade Level

vtables, Figures, and Boxes
14.b Proportion of Students Citing a Specific Reason for Transferring 53 from Another School, by Grade Level and School Type
14.c Proportion of Students Identifying Specific Reasons for Transferring 54 from Another School, by Grade Level and Locality
15.a Proportion of Students Identifying Specific Reasons for Transferring 55 to Another School, by Grade Level
15.b Proportion of Students Identifying Specific Reasons for Transferring 56 to Another School, by Grade Level and Locality
Figures 1 Components of Survey Instrument 10 2.a Profile of Sampled Schools, by Survey Area 14 2.b Number of Sampled Schools, by Survey Area and School Type 15 3.a Profile of Sampled Students, by Location 15 3.b Profile of Sampled Students, by Gender 15 4.a Profile of Sampled Households, by Income Bracket 16 4.b Profile of Sampled Households, by Educational Attainment 16 5 Profile of Sampled Households, by Work Status 17 6 Average Hours of Personalized Help Received by Students 19
from Career Guidance Counselors 7 Types of Information Received in Career Guidance, by School Type 20 8.a Proportion of Household Members Citing Availability 21
of “Labor Market Information” while Choosing Career Path, by Survey Area and Locality
8.b Proportion of Household Members Citing Availability of Information 22 on “Types of Occupations and Training That Fit Personal Interests” while Choosing Career Path, by Survey Area and Locality
8.c Proportion of Household Members Citing Availability of Information 23 on “Types of Occupations and Training That Fit Wage Preferences” while Choosing Career Path, by Survey Area and Locality
8.d Proportion of Household Members Citing Availability of Information 23 on “Types of Occupations and Training That Fit Skills” while Choosing Career Path, by Survey Area and Locality
8.e Proportion of Household Members Citing Availability of “Information 24 on Schools That Can Provide Quality Education Given Preferences” while Choosing Career Path, by Area and Locality
9.a Distribution of Students by Intended or Chosen Track and Survey Area 26 9.b Distribution of Students by Intended or Chosen Track and School Type 26 9.c Distribution of Students by Intended or Chosen Track and Locality 27 9.d Distribution of Students by Intended or Chosen Track, by Survey Area and Gender 27 10 Proportion of Students Identifying a Major Consideration for Choosing a Track, 28
by Survey Area 11.a Proportion of Students Citing a Specific Major Source of Information They Used 29
or Planned to Use in Choosing a Track, by Locality and Gender 11.b Proportion of Students Citing a Specific Major Source of Information They Used 29
or Planned to Use in Choosing a Track, by Survey Area 12 Students’ Preferred Track versus Parents’ or Guardians’ Preferred Track 32 13 Proportion of Parents Identifying a Specific Major Consideration 32
in the Choice of Child’s Track, by Locality

vi tables, Figures, and Boxes
14 Proportion of Students Identifying Specific Reasons for Not Proceeding 33 to Senior High School
15.a Proportion of Students Preferring Specific Courses, by School Type 34 15.b Proportion of Students Preferring Specific Courses, by Gender 35 16 Proportion of Students Identifying a Specific Major Consideration 35
for Choosing a College Major, by School Type 17 Proportion of Households Citing a Specific Source of Information 36
as One of the Three Major Sources of Information Used in Choosing Postsecondary Education
18 Proportion of Students Reporting They Will Be Able to Take Up 37 Preferred Course Given Current Circumstances
19 Proportion of Parents Expecting Their Children to Continue 38 on to Postsecondary Education, by Survey Area and Locality
20 Proportion of Parents Citing a Specific Factor for Their Children Not Continuing 39 with Postsecondary Education, by Locality
21 Proportion of Parents Identifying a Specific Type of Work That They Expect 41 Their Child to Do in Adulthood, by Locality
22 Proportion of High School Students Who Are Voucher Recipients, by Survey Area 43 23 Proportion of Students in Private High Schools Who Are Educational Service 44
Contracting Program Grantees, by Survey Area 24.a Proportion of Public Schools Citing Limited Demand from Students 49
as One of the Main Reasons Why School Does Not Offer a Specific Track or Strand
24.b Proportion of Private Schools Citing Limited Demand from Students 49 as One of the Main Reasons Why School Does Not Offer a Specific Track or Strand
25 Distribution of Transferees and Would-Be Transferees for Each Grade Level 52 26 Proportion of Households Reporting That an Unexpected Event 57
Affected Education-Related Decisions, by Survey Area 27 Proportion of Households Reporting That an Unexpected Event 57
Will Still Affect Education-Related Decisions in the Following Year 28 Households’ Assessment of Usefulness of Formal Education 58
in Current Primary Work 29 Proportion of Workers Who Think Their Educational Attainment Exceeds 59
the Minimum Required for Their Current Job, by Survey Area and Locality 30 Proportion of Workers Who Think Their Educational Attainment 59
Is Below the Minimum Level for Their Current Job, by Survey Area 31 Proportion of Workers Citing That Their Current Work Is Their Desired Career, 60
by Survey Area 32 Proportion of Workers Citing That Their Current Work Is Their Desired Career, 60
by Area and Highest Educational Attainment 33 Proportion of Workers Citing That Their Current Work Is Their Desired Career, 61
by Income Quintile
Boxes 1 Basic Education System and Career Guidance Programs 4 2 National Career Assessment Examination 12

vii
Foreword
The implementation of the K to 12 Basic Education Program in the Philippines aims to ensure that students are well prepared for tertiary education, skills development, employment, and entrepreneurship. The accompanying senior high school program requires students and their families to make a new series of decisions about education and potential career investments within the basic education system. These educational decisions may ultimately affect students’ long-term labor market prospects and, as such, their consequences need to be understood so that appropriate policies and initiatives can be designed to optimize outcomes.
To understand the factors that shape decisions about youth education and career expectations, the Asian Development Bank (ADB), in partnership with the Department of Education of the Philippines, implemented the Youth Education Investment and Labor Market Outcomes Survey (YEILMOS) in 2017. The survey gathered data from 238 schools; 3,172 junior and senior high school students; and 2,819 households randomly selected in the National Capital Region as well as provinces of Ilocos Sur, Eastern Samar, and Davao del Sur.
The YEILMOS builds on ADB’s efforts to understand and bridge the information gaps that can limit gains from education investments. Insights into systematic information collection, management, and use for better education outcomes—initially published in a special chapter of ADB’s Key Indicators for Asia and the Pacific 2015—particularly guided the design of the YEILMOS. This report summarizes the survey methodology, results, experiences, and other insights drawn from the 2-year survey implementation.
Key findings from the YEILMOS point to family members, particularly parents and guardians, as being the major source of information used by students when making education and career investment decisions. Hence, when providing career guidance information, it is important for educational institutions and other relevant government agencies to target not only students but also parents and guardians. In addition to providing advice on the types of jobs that align with students’ interests and skills, it is important that career guidance programs share information about the costs of different educational programs, access to financial support and employment opportunities. Such information can give students a better understanding of the types of jobs demanded by the labor market, allowing them to adjust their expectations about the courses and careers that fit their interests, capabilities, and employment preferences.
The YEILMOS is intended as a first step toward producing baseline statistics on how educational decisions are made and how these decisions affect labor market outcomes. As the survey was created to contribute to education policy in the Philippines, advocates and policymakers can examine the data and use findings of this report to better align education decisions and investments with desired labor market outcomes.
Yasuyuki SawadaChief Economist and Director GeneralEconomic Research and Regional Cooperation DepartmentAsian Development Bank
viii
Acknowledgments
This study was conducted by the Economic Research and Regional Cooperation Department of the Asian Development Bank. The project team was led by Arturo Martinez Jr. under the overall direction of Rana Hasan. Natalie Chun conceptualized the Youth Education Investment and Labor Market Outcomes Survey, while Arturo Martinez, Jr. and Lakshman Nagraj Rao led the implementation of the survey, analysis of the results, and preparation of this report. The project team members, which include Glenita Amoranto, Lilac Florentino, and Jude Roque, worked very closely with the Department of Education of the Philippines in implementing all stages of the survey under the leadership of Secretary Leonor Briones and close guidance of Undersecretary for Planning, Field Operations, and Human Resources and Organizational Development Jesus Mateo.
Lovelaine Basillote provided input to the survey design, ensuring that the modules captured the factors that students and households take into account when making educational investment and career-planning decisions, as well as accounting for other realities in the families’ macroeconomic environment that impact the decision-making process. The project design and implementation also immensely benefitted from a series of technical discussions with Roger Masapol, Ella Naliponguit, Jose Ramon Albert, Elvin Uy, Ma. Lourdes Pantoja, Marieta Atienza, Mariel Bayangos, Ma. Victoria Necessito, Ruby Ann Manalo, Anne Caresse Sia Pua, Evelyn Relor, Reuben dela Cruz, Kennedy Gallardo, Emiljohn Sentillas, and Michael Manangu. Marietta Atienza and Dennis Gale Merlin extended administrative support in the development of the sampling frame.
Smart Research Services, Inc., led by Waldomar Canales, collected data. Lynette Perez and Lovelaine Basillote gave invaluable help during the training of survey team leaders and enumerators. Real-Time Analytics, headed by Le Dang Trung, provided innovative input in the development of the computer-assisted personal interviewing survey as well as the construction of a digital database used in real-time monitoring of the survey operations. Participants in the survey results’ dissemination forum also provided input that was used in finalizing this report.
In addition to project team members, Lovelaine Basillote contributed significantly to the preparation of this publication. Donna Lampa provided editing services, ensuring coherence and consistency. Paul Dent conducted manuscript editing, while Hammed Bolotaolo copyedited and Layla Yasmin Amar proofread the report. Ma. Roselia Babalo, Aileen Gatson, Karen Firshan, Ephraim Cuya, Raymond Adofina, Jan Arvin Lapuz, Ron Durante, Marymell Martillan, Lea Rotairo, Madeline Dumaua-Cabauatan, and Katrina Miradora provided administrative support in the conduct of survey-related activities.
Rhommel Rico conceptualized the cover design, and Principe Nicdao typeset the report. The publishing team within the bank’s Department of Communications performed overall compliance checks, while the Logistics Management Unit of the Office of Administrative Services facilitated the timely printing of the publication. We also thank Maricris Tobias, Joseph Albert Niño Bulan, and Oth Marulou Gagni for their assistance on other administrative matters.
ixAcknowledgments
We thank Kathleen Farrin, Elisabetta Gentile, Lynette Perez, Tania Rajadel, and Ye Xu for their technical advice and detailed reviews throughout the study, and Emily Beam, Alex Eble, Arnulfo Empleo, Glenda Granadozin, and Hessel Oosterbeek for their inputs on other research areas that could be pursued based on the key findings of the study.
Finally, sincere thanks must go to the Department of Education staff, school heads, and administrators for their invaluable support during the field operations. And, of course, we are very grateful to all students and parents who participated in the survey.
Kaushal JoshiOfficer-in-Charge and Principal StatisticianStatistics and Data Innovation Unit
x
Abbreviations
ABM accountancy, business, and managementADB Asian Development BankCGP career guidance programDepEd Department of EducationESC educational service contractingGAS general academic strandGDP gross domestic product HUMSS humanities and social sciencesICT information and communication technologyNCR National Capital RegionSHS senior high schoolSTEM science, technology, engineering, and mathematicsTVL technical-vocational and livelihoodYEILMOS Youth Education Investment and Labor Market Outcomes Survey

xi
executive Summary
The adoption and implementation by the Philippines of the K to 12 Basic Education Program includes extending basic education beyond kindergarten from 10 years to 12 years. This move has ushered in a number of educational reforms, one of which is the introduction of senior high school (SHS). Whereas the country’s previous high school system prepared Filipino students primarily to pursue certificate or diploma courses or degree programs after high school, the introduction of SHS is meant to produce graduates equipped not only for postsecondary education but also for work and entrepreneurship, should this be their desired path after graduation.
SHS students go through a core curriculum and take specialized subjects under one of four tracks: academic, technical-vocational and livelihood (TVL), sports, or arts and design. Choosing from these tracks means that, 2 years before finishing high school, students and their families must make additional decisions about educational investment and career planning. As such, it becomes necessary to explore how such decisions, which can affect long-term labor market outcomes, are made. It means determining what types of information households and students use in decision-making, and finding out which information sources have the most influence and are most used.
The Asian Development Bank and the Department of Education of the Philippines conducted the Youth Education Investment and Labor Market Outcomes Survey (YEILMOS) to fill this knowledge gap. The survey was conducted in 2017 to collect baseline data on factors that influence young people’s education investment decisions and career expectations. It was designed to inform refinements to the SHS career guidance program (CGP). It aims to lay the foundation for a follow-up survey that will help assess the impact of education and career choices and investments on labor market outcomes.
To ensure the representation of major island groups and metropolitan centers, the YEILMOS was conducted across four areas: Ilocos Sur for Luzon, Eastern Samar for Visayas, Davao del Sur for Mindanao, and the National Capital Region (NCR). Schools that offered grades 9–11 were randomly drawn from the Enhanced Basic Education Information System and Learner Information System, and were further stratified by type of school (i.e., public or private). A total of 238 schools took part in the study, from which 3,172 students stratified by grade and gender were interviewed. As part of the survey, 2,819 parents or guardians of respondent students were also interviewed.
Key findings from the survey were as follows:
Career guidance programs. CGPs in public and private schools generally gave priority to helping students identify which SHS track to take, rather than providing information and assistance on financial aid options. Students reported receiving information that mainly focused on the types of occupations and training that matched their interests and skills (i.e., what they like, what they can do, what values they have) as well as data on which schools best aligned with their career choices and could provide quality education.

xii executive Summary
CGPs varied depending on the type and setting of the schools. Private and urban schools tended to offer, and gave priority to, career guidance activities and information that provided enhanced industry access and significant financial and technical resources.
Choice of senior high school track. The academic track was the predominant choice for both students and parents. Moreover, the majority of students who indicated a preference for the non-academic tracks (TVL, sports, or arts and design) had parents who reportedly preferred that their children take up the academic track instead. This is noteworthy because family members, especially parents, ranked the highest among the sources of information students use when choosing a track. Peers, relatives, and teachers followed, while guidance counselors ranked low when students were asked to identify major sources influencing their choice of SHS track.
Students reported that their track preferences were based primarily on their interest in the field and personal strengths and/or skills, which are same factors cited by parents as influencing their track preferences for their children. Interestingly, fewer than 10% of students reported costs and financial considerations as basis in choosing the SHS track they prefer to take.
Choice of college major. About 85% of student respondents expected to go to college and to take courses in personal services, engineering and engineering trades, teacher training and education science, and health. Students from private schools preferred professional college majors (health, engineering, business administration, law, and computing), while public school students preferred degrees related to teacher training and security services.
Interest in the career field and personal strengths and/or skills were important factors that students considered when choosing both the SHS track and college major. However, they rarely factored in costs of schooling and financial concerns when selecting their college major. Students and their parents also assessed employment prospects and wage considerations before making a choice.
Even when choosing a college major, social circles remained the main source of information for students. Parents, peers, and relatives rank highest in terms of information sources most used, while guidance counselors rank the lowest.
Occupational preferences and expectations. Most students preferred to be working as professionals by age 30, and their parents shared this expectation. Parents also preferred their child to work in the city and expected their monthly salary to be in the ₱20,000–₱30,000 range as a minimum.
Other findings. Although more than half of the surveyed private school students received tuition subsidies, very few parents reported awareness of financial assistance programs and a majority cited financial limitation as the primary factor for not sending their children to postsecondary school. Many parents also under- or over-estimated the cost of postsecondary education.
Schools cited lack of funds, personnel, and student demand as the main reasons for not offering particular tracks, especially the more resource-intensive courses such as (i) science, technology, engineering, and mathematics (STEM) (often requiring laboratories); and (ii) TVL (often requiring specialist equipment, facilities, and consumables). Public schools mainly cited lack of funds and specialized teaching personnel as being the inhibitors to offering some tracks, while private schools mainly cited lack of student demand.

xiiiexecutive Summary
Many of the students who were either planning to transfer, or had recently transferred, to a different school for senior high were in the 11th grade, lived in highly urbanized areas (the National Capital Region and Davao del Sur), and/or studied in private schools. These students had common reason for their recent or planned transfer: they wanted to enroll in a school that offered their preferred SHS track and had better educational facilities.
About 65% of the employed adults (who resided in the same households as the surveyed students) found their formal education useful in their current employment, and nearly half of these respondents reported being overqualified for their present job.
Based on these findings, the study puts forward some program and policy implications that could serve as input to the refinement of the CGPs for SHS. These include the following:
(i) The current CGP highlight personal attributes and interests to guide students in their choice of SHS track. It might also be useful to emphasize possible postsecondary outcomes (mainly tertiary education and/or employment) and available financial assistance programs. Doing so may provide a more holistic and comprehensive basis for good career choices.
(ii) Because career guidance activities require significant resources and access to employers or economic activities, they tend to be more available in private and urban schools. Education policymakers could explore programs to ensure that all students, especially those in rural and remote areas, have equitable access to career guidance activities, regardless of school type or location.
(iii) Immediate family and social circles are frequently cited by students and parents as the main source of information when making career choices. The influence of relatives and peers might therefore be more properly harnessed by factoring it into career guidance activities. Some CGP modules may be refined to facilitate parent–child discussions on important considerations when choosing an SHS track or college major. To bridge current information gaps, initiatives could also be developed to inform parents of actual college costs and assist them in applying for financial assistance.
(iv) Since some students who are inclined to choose nonacademic tracks might find themselves in conflict with the preferences of their parents, CGPs could be refined to provide adequate, updated, and timely information on potential labor market outcomes and corresponding competency requirements. Such information could work to assure students and parents of the viability of all tracks and postsecondary options.


1
IIntroduction
The Philippines, a country of over 100 million people, has experienced significant economic growth during the second decade of the new millennium. With growth in gross domestic product (GDP) averaging 6.2% from 2010 to 2015, it is considered one of the fastest growing economies in Asia (NEDA 2017). This growth has been attributed to sound economic fundamentals, increased investor confidence, rising domestic consumption, and improved foreign remittances. The country’s relatively young population and growing workforce are also projected to give the Philippines a demographic dividend in the coming years.
To sustain the country’s growth and continually increase its competitiveness, it is important that concerning youth unemployment and underemployment are addressed.1 People aged 15–24 years comprise half of the total unemployed in the Philippines, and the country’s youth unemployment rate of 18.3% in 2016 was substantially higher than the Association of Southeast Asian Nations average of 12% (PSA 2016).2 The Asian Development Bank (ADB) has drawn estimates from the Philippines Labor Force Survey (1991–2008) and the longitudinal database constructed from a survey of 500 households in Metro Manila and Cebu, two highly urbanized areas in the country, indicate that in 2013, one in four youth aged 15–24 was not in employment, education, or training (ADB 2018). It is also estimated that one in every six employed Filipinos hopes to work more hours.
These figures may indicate a mismatch between the supply of skills and available job opportunities in the Philippines. The lack of decent work and good-quality jobs drives up competition for employment and places youth at high risk of unemployment or underemployment. At the same time, there are concerns about the quality of education in the country. Employers in information technology, business process management, and other services sector generally hire more than half of the country’s young and/or new entrants to the labor market. These employers report a hiring rate of only 7%-8%, citing the lack of qualified skills as the main challenge in hiring (ITBPAP 2016).
Although obtaining education and training does not guarantee viable employment, policy initiatives in education access and quality remain important because studies show that number of years of schooling is positively correlated with potential wages and negatively correlated with risk of poverty. The World Bank estimates that in the Philippines, wage workers with a secondary education have an in-work poverty risk of 10%, while it is negligible for those with a tertiary degree (World Bank 2016). Moreover, the quality of education and training is positively correlated with GDP per capita growth. Countries with significant knowledge capital as evidenced by high scores in international standardized exams such as the Programme for International Student Assessment (PISA) also have high per capita income (Hanushek and Peterson 2014).
Investments targeted to increase education access and quality have thus been made in recent years. In line with global commitments and international standards, government spending on
1 The United Nations defines “youth” as persons between the ages of 15 and 24 years.2 Philippine Statistics Authority. 2016. Annual Labor and Employment Estimates. Metro Manila.
youth education Investment and Labor Market outcomes in the philippines2
education as a percentage of GDP rose to 2.9% in 2016, up from 2.6% in 2015 and 2.4% in 2014 (Briones 2016). Additional resources for more classrooms, better teachers, and improved learning materials have also been allocated.
Moreover, the country adopted the K to 12 Basic Education Program, which covers kindergarten and 12 years of basic education. The introduction of senior high school (SHS) through the K to 12 Basic Education Program ushered in a lot of educational reforms specific to postsecondary outcomes and curriculum. Whereas the previous high school system prepared Filipino students primarily to pursue certificate or diploma courses or degree programs after 4 years in high school, the K to 12 Program is designed for preparedness for other desired postsecondary paths like employment and entrepreneurship. SHS students need to go through a core curriculum as well as take specialized subjects under one of four tracks on offer: academic, technical-vocational and livelihood (TVL), sports, and arts and design. Two of the four tracks—academic and TVL—are further divided into strands from which SHS students would also need to choose.3
Various mechanisms to provide financial support have been put in place to ensure that education is accessible even for the economically challenged segments of the population. For instance, the conditional cash transfer program called the Pantawid Pamilyang Pilipino Program was also implemented to encourage low-income families to send their children to school and keep them there, while a voucher program to subsidize SHS education in private schools has likewise helped widen access to education. To help students and their families make informed education and career decisions, the Philippines’ Department of Education (DepEd) has also recently rolled out SHS career guidance programs (CGPs).
Such initiatives have led to significant improvements in school participation, with more youth of school-going age enrolling and fewer dropping out (Albert 2016). Enrollment in grade 11 is also significantly higher than the average enrollment in college after grade 10 in the previous system, with around 1.5 million enrolled grade 11 students for the academic year 2016–2017 versus the college enrollment of approximately 600,000 before the implementation of the new system (DepEd 2018).
The challenge now is to get enrolled students to find education meaningful and beneficial so that they complete their schooling, as lack of interest is often cited as the main reason for dropping out of school. As seen in other country contexts, this could mean that students either disengage from the learning content or underestimate the benefits of education to their future (Bonilla, Bottan, and Ham 2016).4 If the students disengage from the learning content, policies that try to understand and improve student motivation and facilitate transitions between education levels would need to be explored. If the students underestimate the benefits of education, research and policies that provide information on actual labor market outcomes could be considered to empower students and households to adjust their education investment and career planning based on more realistic post-education expectations. Either way, given scarce resources, evidence on education quality and relevance needs to be bolstered to better optimize future policy initiatives.
Raising the quality of education requires a commitment to evidence-based policy decisions and accountability. It means promoting financial efficiency that delivers better skill outcomes
3 DepEd. Senior High School. http://www.deped.gov.ph/k-to-12/faq/senior-high-school.4 L. Bonilla, N. Bottan, and A. Ham. 2016. Information Policies and Higher Education Choices: Experimental Evidence
from Colombia. http://www.cedlas-er.org/sites/default/files/aux_files/ham.pdf.

Introduction 3
per dollar of public investment, expanding educational delivery and access, and generating conditions for learning on the job (ADB 2015). In the context of the SHS program, choosing from the available tracks means that, 2 years before finishing high school, students and their families must make new and additional decisions about educational investment and career planning. It therefore becomes necessary to explore how such decisions, which can affect long-term labor market outcomes, are made. It means determining what types of information households and students use in decision-making, and finding out which information sources have the most influence and are most often used.
To help fill these knowledge gaps, ADB partnered with DepEd and conducted the Youth Education Investment and Labor Market Outcomes Survey (YEILMOS) in the Philippines. Designed to gather vital information pertaining to educational investments and expected labor market outcomes, the survey collected baseline data on factors that influence youth education investment decisions and career expectations. The YEILMOS is intended to complement ongoing efforts by the Government of the Philippines to enhance the country’s education system and labor market, specifically through the use of CGPs. In particular, the YEILMOS was designed to address the following research questions:
• What factors do students and their families take into account when making educational investment and career planning decisions?
• What are their primary sources of information when making such decisions?• What other realities in their macroeconomic environment impact on decision-making
around educational investment and career planning?
4
IIyouth education Investment and Labor Market outcomes Survey
overviewBox 1 presents a background on the basic education system in the Philippines, including the newly implemented K to 12 Basic Education Program and CGPs. Under the K to 12 Basic Education Program, families need to make additional education decisions within the basic education system as students move from junior high school to SHS, and from SHS to postsecondary education. They need to choose which SHS track and strand to take, whether to transfer from public to private schools or vice versa, and whether to seek employment or take up postsecondary education after graduating from SHS.
Box 1: Basic Education System and Career Guidance Programs
The Enhanced Basic Education Act of 2013 mandated the implementation of the K to 12 Basic Education Program in the Philippines. The K to 12 Basic Education Program involves 1 year of kindergarten followed by 12 years of compulsory basic education—6 years of primary education, 4 years of junior high school education, and 2 years of senior high school (SHS) education.
Figure: Basic Education System in the Philippines
employment
Senior High School 2 Years
Junior High School 4 Years
primary education 6 Years
Kindergarten 1 Year
entrepeneurshipMiddle-Level Skills
DevelopmentHigher education
Compulsory Education Options after completing Upper Secondary EducationPossible Pathways
Source: Youth Education Investment and Labor Market Outcomes Survey research team.
continued on next page

youth education Investment and Labor Market outcomes Survey 5
Prior to the implementation of the K to 12 Basic Education Program, high school in the Philippines entailed just 4 years of education. After high school, graduates were able to pursue 2 years of vocational education or 4 to 6 years of tertiary education under bachelors’ programs. Estimates from the Annual Poverty Indicators Survey suggest that, among youths aged 15-19 years in 2014, 33% were studying in high school (of whom, 5% were studying in high school while working), less than 2% were taking certificate or technical vocational courses, and about 29% were in college (of whom , 4% were studying in college while working).
Data collected from the Annual Poverty Indicator Survey also show that 21% of youths aged 15-19 in 2014 were working (and not studying), and 15% were neither studying nor working. There is also evidence suggesting that a significant number of those who graduated through the old high school system do not possess the skills needed to enter and become productive members of the labor force.
Working with the Commission on Higher Education and Technical Education and Skills Development Authority, the Philippines’ Department of Education (DepEd) enhanced the basic education curriculum to ensure global competitiveness of the Filipino graduates. This entailed incorporating into the basic education curriculum some of the general education subjects that were originally taught in college.
SHSs retain mathematics, science, and language as core subjects, but students are able to pursue a degree of specialization thanks to the four educational tracks offered in SHS: academic, technical-vocational and livelihood (TVL), sports, or arts and design. Two tracks are further divided into strands as shown in the table below. For the academic track, there are four strands available: accountancy, business, and management; science, technology, engineering, and mathematics; humanities and social sciences; and a general academic strand. For the TVL track, the four strands available are home economics, information and communication technology, agri-fishery arts, and industrial arts. In general, the academic track is designed for students who wish to advance to specialized fields in college, while TVL courses aim to increase the students’ chances of moving directly to employment in decent jobs.
Prior to the implementation of the K to 12 Basic Education Program, decisions about career planning were mostly made after completing the basic education program. The introduction of SHS, however, prompts students and their families to start making such decisions while still in the basic education system.
Table B1.1: Senior High School Track and Strand Offerings
Track Strand Sample Subjects
Academic Accountancy, business, and management Business Finance, Principles ofMarketing
Science, technology, engineering, and mathematics
Basic Calculus,General Chemistry 1
Humanities and social sciences Creative Writing,Philippines Politics and Governance
General academic strand Social Science 1,Applied Economics
Pre-baccalaureate maritime Introduction to Maritime Career; Empowerment Technologies; Inquiries, Investigations, and Immersion
Technical-Vocational and Livelihood (TVL)
Home economics Food and Beverage Services (National Certificate [NC] II), Wellness Massage (NC II)
Box 1 continued
continued on next page

youth education Investment and Labor Market outcomes in the philippines6
Track Strand Sample Subjects
Information and communication technology
Animation (NC II), Contact Center Services (NC II)
Agri-fishery arts Animal Production (NC II),Crop Production (NC I)
Industrial arts Consumer Electronics Servicing (NC II), Electrical Installation and Maintenance (NC II)
Sports Human Movement,Sports Officiating, Activity Management
Arts and Design Developing Filipino Identity in the Arts,Leadership and Management inDifferent Arts Fields
Career guidance and counseling programs. As part of the transition made to the K to 12 Basic Education Program, the Government of the Philippines has worked to strengthen DepEd’s CGPs. Working with the Department of Labor and Employment (DOLE), the Technical Education and Skills Development Authority, and the Commission on Higher Education, DepEd regularly conducts career advocacy activities for students at the secondary level.
Some of the key practices of CGPs include the general orientation of students during the start of classes in Grade 7, the administration of the high school occupational interest inventory in Grade 8, and the administration of the National Career Assessment Examination in Grade 9. DepEd’s comprehensive guidance program also carries out career action plans and, toward the end of both junior high school and SHS, provides information and counseling to help secondary education students make career decision of students. DepEd teachers, tagged as teacher advocates, augment the need for licensed career and employment guidance counselors in public high schools. Each teacher advocate is trained to conduct career advocacy activities to high school students to ensure a comprehensive and extensive implementation of the school’s CGP.
DepEd’s CGPs for SHS are oriented toward helping students with their choice of tracks and career planning as shown in the table below. Regional administrators are then tasked to operationalize these modules and train their guidance counselors and advocates for in-school implementation.
Table B1.2: Main Objectives of Senior High School Career Guidance Programs
Grade Objectives Modules
10 (i) Assist senior high school (SHS) entrants in making informed decisions regarding their choice of SHS track
(ii) Promote awareness in the importance of choosing a track that suits their skills and interests, and matches the available resources and needs of the society
1. Embarking on a Journey of Self-Awareness2. Examining the Destinations3. Charting Your Own Course
continued on next page
continued on next page
Box 1 continued
youth education Investment and Labor Market outcomes Survey 7
Grade Objectives Modules
11 (i) Apply decision-making skills to career-planning course selection and career transitions
(ii) Realize that the changing workplace requires lifelong learning and acquiring new skills
1. Road to the Right Choice2. Releasing the Power Within3. Reaffirming the Chosen Track4. Fit Me Right5. Rising Toward the Reality of My Dreams6. Up, Up in the Ladder of My Career7. Beginning the Journey Where I Am8. I Plan to Succeed
Sources: Government of the Philippines, Department of Education. 2017. Implementation of Grade 11 Career Guidance Program for School Year 2017–2018. http://www.deped.gov.ph/2017/10/18/october-18-2017-dm-165-s-2017-implementation-of-grade-11-career-guidance-program-for-school-year-2017-2018/; Government of the Philippines, Department of Education. 2015. Senior High School Career Guidance Program and Early Registration. http://www.deped.gov.ph/wp-content/uploads/2015/08/DO_s2015_41.pdf.
Department of Labor and Employment’s career guidance programs. In addition to CGPs provided through schools, private institutions and government agencies also provide career-related information to students. DOLE’s career guidance and employment coaching is one of the notable programs of the government. It is implemented by the Bureau of Local Employment in the country’s geographic regions, targeting high school and college students. It is conducted in partnership with public employment service offices, a local government office, and school-based guidance counselor networks in the form of workshops and seminars that provide students with labor market information. The seminars are designed to help students make career choices based on labor market needs, rather than on what might be popular, thereby increasing the chances of finding a good job after graduation.
For these seminars, DOLE has developed two modules that offer complementary perspectives: the Career Guide for High School Students and the Employment Guide for College Students and Jobseekers. Since these career workshops are often conducted by local government representatives and school teachers, rather than trained career specialists or licensed guidance counselors, the modules provide a consistent approach to effective career planning and employment coaching for students who are about to graduate.
Box 1 continued
Table B1.2 continued
The expansion of student and household educational decisions under the K to 12 Basic Education Program brings about the need for data that could be used to further refine policy initiatives such as CGPs for SHS. Refinements to CGPs could keep families from making misinformed decisions that result in long-term adverse impacts on education investments and labor market outcomes.
When looking at optimized decision-making in education, an economic theory of demand and supply could be of guidance. The decisions of the parents and students on the type and quantity of educational investments will depend on their perceived returns to education. In other words, the higher the perceived returns are to schooling, the more inclined the parents and students are to invest in education. Increased demand for education could theoretically lead to increased supply, all else equal. However, the quantity and quality of supply could also constrain demand, as the availability of quality educational choices might hinder access to education. Decision-making
youth education Investment and Labor Market outcomes in the philippines8
could thus be informed by a better understanding of education demand and supply, and the perceived returns to educational investments.5
Some nuances need to be taken into account, however, as students in urban and rural areas face different challenges when making crucial educational decisions. The wider access to information and range of choices that living in an urban area affords a student could make the decision-making process more complex. Social stratification also becomes an issue because poor students in urban areas face additional cost implications of access to good education as well as information acquisition. For students in rural areas, the issue is the lack of information and educational options due to location. Even with the right information, the distance of good schools from a student’s hometown could be a limiting factor.
While quality surveys on the labor market in the Philippines exist,6 there remains limited evidence on how educational decisions that could affect career expectations are made. The Asian Development Bank (ADB) aimed to address this research gap by partnering with the Department of Education (DepEd) to conduct the Youth Education Investment and Labor Market Outcomes Survey (YEILMOS). Students, households, and school heads were interviewed to gather baseline data on factors that influence youth’s education-related choices and investments such as socioeconomic and family background, information about and expectation of available jobs and wage returns, credit or financial constraints, school services and availability of financial aid, and other behavioral factors (e.g., risk aversion).
Students were asked questions on formal schooling, postsecondary education, CGP, internship, career plans, and parent involvement in education. Questions on formal schooling revolved around students’ access to quality education. For example, questions on whether a student has access to financial aid, advanced classes and preferred SHS tracks, one-on-one career counseling, and computers and online connectivity were asked. This is because the availability of institutional support could lower barriers to entry, increase student integration, and positively affect a student’s decision to persist in school and pursue further education (Jensen 2011).
An understanding of the demand for education is important in determining policies for future education investments. As such, questions regarding postsecondary education, personal and parental career preferences, expectations, and the likelihood of pursuing education beyond high school were raised. Students were also asked about the usefulness of DepEd’s current CGPs for SHS and their modes of information delivery. Since exposure to the workplace may also impact educational investments and career planning, data on internship and on-the-job training experiences, if any, were likewise collected. Finally, because the likelihood of persisting in school and transitioning to higher education increases with higher levels of parental involvement, students were also asked about the frequency with which parents look at report cards, discuss educational experiences, and participate in school activities and meetings.
5 An interesting discussion on economic theory as guide to education supply and demand policies can be found in A. Banerjee et al. 2013. Expanding Access and Increasing Student Learning in Post-Primary Education in Developing Countries: A Review of the Evidence. J-PAL Post-Primary Education Initiative Review Paper. Boston, MA: Abdul Latif Jameel Poverty Action Lab (J-PAL). pp. 5–8.
6 For some examples, see the World Bank’s Skills Toward Employment and Productivity Survey and the International Labour Organization’s School-to-Work Transition Survey.

youth education Investment and Labor Market outcomes Survey 9
In countries like the Philippines where families face additional costs to education and limited access to credit, parents play a big role in decision-making and calculating the returns to education, albeit this role decreases as the learner grows older (Banerjee et al. 2013). Therefore, households were asked about socioeconomic status, formal schools and types of training received, unexpected events recently experienced, educational requirement for current occupation, types and sources of information obtained on career prospects, parent involvement in children’s education, and career expectations.
Details about socioeconomic status and educational attainment were gathered because parental level of education and income are positively correlated with education investments (Asad, Iqbal, and Tasneem 2015). As education levels go up, incomes become more stable and education is given more priority. In a study by the Philippine Institute for Development Studies, those in the fifth income quintile are four times more likely than those in the bottom quintile to have attained higher education (Albert, Dumagan, and Martinez 2015). Parents were also asked about unexpected events that could negatively impact educational investments, such as natural disasters that could cause significant credit constraints that lead parents to pull their children out of school. The state of a family’s housing and access to clean water and sanitation were also explored given the difficulty for families with informal housing to provide a clean and comfortable environment for their children and to sustain their education due to continued risk of eviction.7 To validate students’ responses to parental involvement, similar questions on parent participation in school-related activities were asked of parents and guardians.
Given the positive correlation between quality and availability of education and student persistence and informed career planning, suggested by Watts and Fretwell in 2004, school heads were asked about available school resources, staffing specific to career guidance and counseling, and types of information provided through CGPs. Data on the number of teaching and nonteaching staff as well as the qualifications of teaching personnel were collected. Because school and teacher quality and governance have an impact on good student outcomes,8 particularly in terms of enrollment, persistence, and postsecondary outcomes, questions on how often the curriculum is updated and the level of autonomy school administrators have to hire personnel, make curricular decisions, and acquire facilities were also asked. School administrators were also asked about mechanisms in place to facilitate the involvement of parents, which could increase student outcomes, to consolidate information from students and households (Kremer, Brannen, and Glennerster 2013). Lastly, school heads provided information on their school’s CGP to validate if what is being offered by the schools is similar to the experiences of student respondents.
Ultimately, the YEILMOS aims to inform policy and program initiatives intended to help students and households make informed educational decisions and career plans. In particular, ADB hopes that the survey results could be used in refining the design of the CGPs for SHS, a worthwhile initiative given the potential of these programs to reduce socioeconomic stratification in, and maximize the benefits of education decisions and investments.
7 In Kenya, a deworming program significantly increased enrollment, probability of passing primary leavers exam, and adult wages. Kremer and Holla (2009) and Baird et al. (2012), p. 34.
8 A discussion on existing evidence may be found in A. Banerjee et al. Expanding Access and Increasing Student Learning in Post-Primary Education in Developing Countries: A Review of the Evidence. J-PAL Post-Primary Education Initiative Review Paper. Boston, MA: Abdul Latif Jameel Poverty Action Lab (J-PAL), pp. 39–45

youth education Investment and Labor Market outcomes in the philippines10
Survey Implementation Survey instrument. The staff of ADB’s Economic Research and Regional Cooperation Department, in coordination with the staff from DepEd’s Policy Research and Development Division, developed the draft questionnaires. Inputs from other education experts within ADB and DepEd were incorporated in the design of the survey instrument. Key components of the questionnaire are identified in Figure 1.
The survey instruments were pilot tested to ensure that the survey is detailed enough to answer and understand the key factors affecting educational investments and decisions, and concise enough to encourage school principals, head teachers, students, and households to participate in the survey. The inputs from the pilot test were used to refine the questions for clarity and to develop guidelines for the training of enumerators.
Survey design. The sampling strategy is informed by key questions, costs available to administer the survey, and targeted population. While there is interest in making the sample nationally representative, the survey was rolled out only in selected areas due to resource constraints.
A total of 250 public and private schools were initially selected randomly to participate in the survey. The total number of target schools was allocated proportionately across the selected survey areas, stratified by locality (urban and rural). Some of the initially targeted schools were unable to participate in the survey due to various administrative reasons and were thus randomly replaced with schools of the same type and from the same location where possible. After field operations, a total of 238 schools participated in the survey.
Student rosters for sampled schools were derived from DepEd’s administrative database. The rosters served as sampling frames to randomly select students. Students who were unable to participate in the survey were randomly replaced with other students of the same gender and from same grade level and school. Thereafter, parents and guardians of interviewed students were identified as target respondents of the survey’s household module.
Figure 1: Components of Survey Instrument
School Manager
• Mandatory career programs•Funding•Facilities•Teacher capacity
Student
•Formal schooling•Internships taken during school•Educational expectations•College choice•Occupation choice
Household
•Socioeconomic background•Private educational
investments•Information on labor market
and education•Perceived constraints to
educational investments
Source: Youth Education Investment and Labor Market Outcomes Survey.

youth education Investment and Labor Market outcomes Survey 11
Respondents. The survey instrument has three modules: school, student, and household. For the school module, data were collected from school principals and/or head teachers. Five randomly selected students in each grade level (9, 10, 11) per school were interviewed for the student module. The parents and guardians of interviewed students served as respondents for the household module. Other adult household members were also interviewed for selected questions in the household module.
Interview protocol. The interview protocol required interviewing target respondents individually and separately. For the school module, school principals and/or head teachers were provided copies of the survey instrument ahead of the scheduled face-to-face interview as some questions referred to administrative records. For the student module, the survey team coordinated with schools in identifying an appropriate time to interview students. Whenever possible, interviews were scheduled during breaks or noncritical periods (e.g., during extracurricular activities). The survey team also requested school management and homeroom teachers to provide a suitable venue where the interviews could be conducted, respective of child protection policies. For the household module, the survey team reached out to target respondents through short messaging service or phone calls to identify an appropriate time for the interview. Although most respondents were interviewed in their respective houses, some parents and/or guardians were interviewed in the school premises or public spaces (e.g., restaurants) as mutually agreed by the respondents and the survey team.
English and Tagalog translations were made available, but enumerators (who were hired from the surveyed areas) were instructed to interview in their local language as they saw fit.
To elicit candid and honest responses, the enumerators assured all respondents that other than research, any information they provide would not be used for performance assessment and evaluation or any other purpose. Parents and guardians were requested to sign consent forms allowing the use of data they and their children have provided to meet the study’s research objectives.
Data collection tool. The survey data collection platform was designed by Real-Time Analytics using tablet technology and cloud-based software that enhances capacity to ensure data quality by allowing real-time tracking and monitoring of enumerators. Intended to catch outliers, the software provided ways to give enumerators feedback when data points did not seem to be consistent with expected responses so that they could ask follow-up questions. This survey technology also enabled easy production of key graphs and statistics that were continuously updated and lessened the time needed to collect or clean the data.
Selection of survey areas. One of the crucial steps in conducting YEILMOS was the selection of provinces to be covered in the study. Although the survey was not designed to be nationally representative, it was deemed ideal to have representation from various geographic and sectoral areas. In consultation with DepEd, the following geographic areas were chosen: National Capital Region (NCR) and Ilocos Sur from Luzon, Eastern Samar from Visayas, and Davao del Sur from Mindanao. These geographic areas also have heterogeneous socioeconomic characteristics. For instance, NCR and Davao del Sur are highly urbanized areas, while Ilocos Sur and Eastern Samar have relatively higher population concentration in rural areas.

youth education Investment and Labor Market outcomes in the philippines12
Survey period. The field operations were conducted from February to April 2017, but with different survey periods across the four survey areas. The variations in the survey period were mainly due to the calendar of activities of the schools and availability of the households.
Training. Several rounds of training were conducted for the survey team leaders, coordinators, and enumerators on various aspects of data collection. In particular, the survey team members were taught the rationale and key objectives of the survey, how each question should be asked, how to navigate the tablet-based data collection platform, and the DepEd protocols for data collection. The training comprised of lectures, recapitulation, mock interviews, and field practice interviews. Significant time was allotted for role-playing activities to simulate what could happen during the field operations and how enumerators should respond to such scenarios. Training lasted for 2 days for team leaders and coordinators, and 3 days for enumerators. Continuous training support was given by the team leaders.
Quality assurance of survey data. The survey team was divided into four groups, one for each of the four survey areas. Each group comprised of a team leader, school coordinators, and enumerators. School coordinators did the initial liaising with sample schools to schedule the survey team’s visit. Team leaders were tasked with organizing their respective teams, recruiting and training enumerators, and supervising enumerators’ work. Enumerators, on the other hand, did the actual respondent interviews under the supervision of the team leader. Upon completion of the interview, enumerators were instructed to carefully review the questionnaire to ensure that all questions were answered appropriately before leaving the schools or households. All interviews completed within the day were then submitted to team leaders who were responsible for further reviewing the accomplished questionnaires for completeness, consistency, and accuracy. Any inconsistencies spotted were then highlighted and returned to the enumerators for validation.
Box 2: National Career Assessment Examination
To help identify the types of career-related information available to students, one of the questions asked through the Youth Education Investment and Labor Market Outcomes Survey was whether or not students receive information about career that are aligned with their interests and skills.
Starting in 2007, the National Career Assessment Examination (NCAE) has been one of the analytical tools used by schools to assist students in identifying their interests and skills. Questions asked in the NCAE are designed to test students’ general scholastic knowledge, vocational aptitude, occupational preferences, and entrepreneurial skills. Since the implementation of the K to 12 Basic Education Program, the NCAE has been administered to Grade 9 students in all public and private schools in the Philippines.
The results of the NCAE are recommendatory in nature. The examination profiles a student’s aptitude in the four senior high school tracks and their corresponding strands. In particular, the NCAE is designed to gauge a student’s interests and career inclination, whether it is technical-vocational, entrepreneurial, or toward further education in college. It is intended to provide information to students and parents that will guide them in determining which career track is best for a student to take after completing senior high school.
Source: https://www.deped.gov.ph/?s=NCAE.

youth education Investment and Labor Market outcomes Survey 13
Debriefing sessions on the inconsistencies or errors in the filled-out questionnaires, including the proper recording of responses and following skip patterns in questions and instructions, were also conducted to ensure high quality data.
The Appendix lists some of the data cleaning done after the survey was conducted.
Limitations. The YEILMOS was intended to provide baseline information on factors that shape decisions about educational investment and career planning for high school students and their families in the National Capital Region, Ilocos Sur, Eastern Samar, and Davao del Sur. Although these areas were strategically identified to provide diverse insights on the subject matter, data collected from the survey do not necessarily provide nationally representative estimates. However, to facilitate higher participation rates, only educational service contracting schools were targeted among private schools in the study areas. Among the 250 schools originally targeted, the participation rate stood at 98.5% among public schools and 91% among private schools. Originally targeted private schools that were not able to participate tended to be larger in terms of student population. No systematic characteristics were observed among originally targeted public schools that were unable to participate.
Sampled students who were initially listed in the census but turned out to have dropped out or moved to other schools that were not part of the study were replaced with other enrolled students of the same grade and gender. In addition, there were instances when parents or guardians of student respondents were not interviewed due to various personal reasons. At the time of writing this report, no imputations were done for households that chose not to provide information on income, assets, and other economic indicators.
Several questions asked in YEILMOS were designed to capture the perceptions of students regarding career-related information and financial assistance, and the responses may not necessarily reflect reality. For example, when students (or their parents) were asked if they received certain types of career-related information from a specific source, it is possible that some respondents answered that they did not receive such information, even if they did, and vice versa. One reason for this may be that the respondents were not able to absorb the information they received. Furthermore, when students were asked whether they received financial assistance, it is possible that some answered “yes”, even if they did not receive any financial assistance, or “no” even if they did receive it. Hence, the responses provided by these students (or their parents) can be interpreted only as the perception of whether or not they received information on financial assistance.
Similarly, when asked to rank major sources of information, low ranks do not necessarily imply that a certain source is not important. Rather, a low rank might simply suggest that respondents used other sources of information. On the other hand, when students (or their parents) were asked to assess their (their children’s) likelihood of continuing in the education system, it is possible that some respondents indicated they were likely to proceed to further education, but eventually dropped out, and the opposite may also be true. In other words, what the survey tried to capture was the level of optimism of each student because perception and level of optimism are considered influential factors when making decisions.
14
IIIKey Findings
The findings presented in this section are divided into six parts, with the first part showing the characteristics of the sampled schools, students, and households. The next four parts—from career guidance to occupational preferences and expectations—discuss the factors that students and households consider when making educational investment and career planning decisions as well as their primary sources of information while going through this process. Finally, the last part dwells on some issues and realities in the wider context that may affect the education and career choices of students and households.
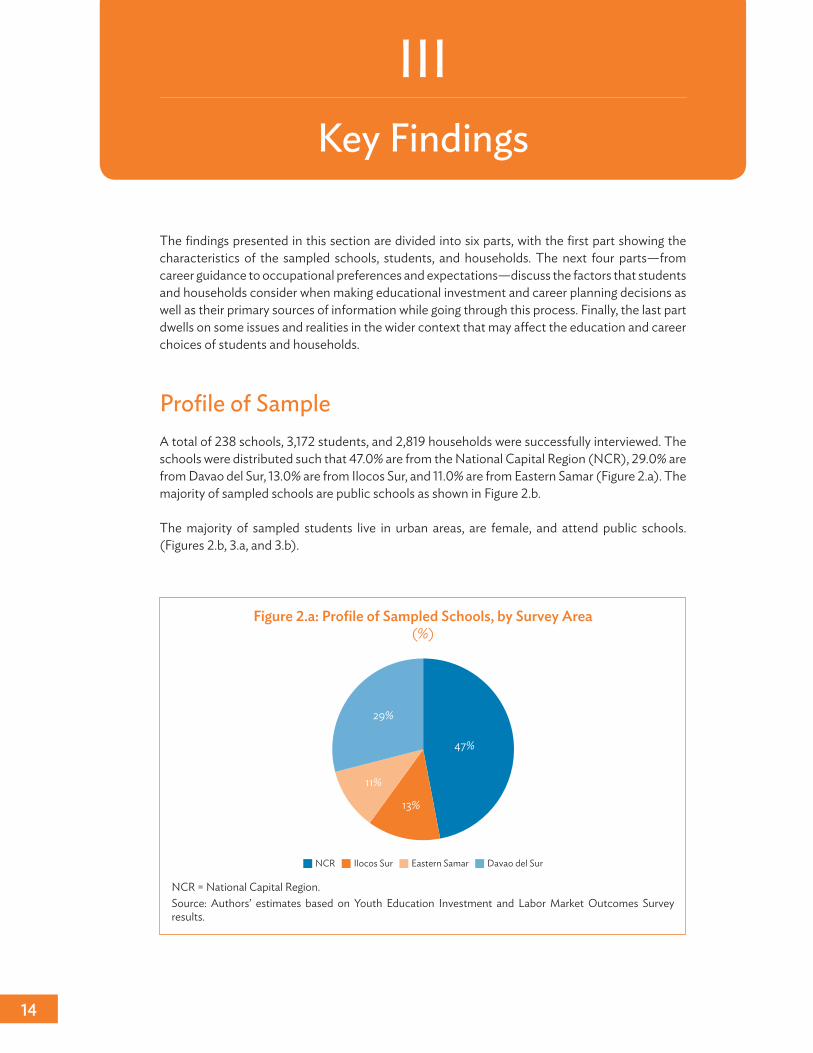
profile of SampleA total of 238 schools, 3,172 students, and 2,819 households were successfully interviewed. The schools were distributed such that 47.0% are from the National Capital Region (NCR), 29.0% are from Davao del Sur, 13.0% are from Ilocos Sur, and 11.0% are from Eastern Samar (Figure 2.a). The majority of sampled schools are public schools as shown in Figure 2.b.
The majority of sampled students live in urban areas, are female, and attend public schools. (Figures 2.b, 3.a, and 3.b).
Figure 2.a: Profile of Sampled Schools, by Survey Area (%)
NCR = National Capital Region.Source: Authors’ estimates based on Youth Education Investment and Labor Market Outcomes Survey results.
13%
11%
29%
47%
NCR Ilocos Sur Eastern Samar Davao del Sur

Key Findings 15
Figure 2.b: Number of Sampled Schools, by Survey Area and School Type
NCR = National Capital Region.Source: Authors’ estimates based on Youth Education Investment and Labor Market Outcomes Survey results.
59
52
13
1711
28
42
160
20
40
60
80
100
120
NCR Ilocos Sur Eastern Samar Davao del Sur
Public Private
Figure 3.a: Profile of Sampled Students, by Location (%)
Source: Authors’ estimates based on Youth Education Investment and Labor Market Outcomes Survey results.
Urban74.6%
Rural25.4%
Figure 3.b: Profile of Sampled Students, by Gender (%)
Source: Authors’ estimates based on Youth Education Investment and Labor Market Outcomes Survey results.
Male46.8%
Female53.2%

youth education Investment and Labor Market outcomes in the philippines16
In terms of the socioeconomic profile of sampled households (Figure 4.a), 18% have an annual (self-reported) income range of ₱80,000 and below, 16% earn between ₱80,000 and ₱160,000, 15% earn ₱540,001 or higher, 15% earn between ₱250,001 and ₱540,000 , and 13% earn between ₱160,000 to ₱250,000. About 23% of the sampled households did not report their income.
Most of the adults who responded to the household module are either college (27%) or high school (32%) graduates (Figure 4.b), while about 89% of adult respondents are engaged in work (Figure 5).
Figure 4.a: Profile of Sampled Households, by Income Bracket (%)
Note: Value labels refer to the income ranges for each income bracket.Source: Authors’ estimates based on Youth Education Investment and Labor Market Outcomes Survey results.
22.5
18.416.1 15.314.7
13.0
0
5
10
15
20
25
�80,000and below
�80,001 to�160,000
�160,000 to�250,000
�250,001 to�540,000
�540,001and higher
Income notindicated
Figure 4.b: Profile of Sampled Households, by Educational Attainment (%)
Source: Authors’ estimates based on Youth Education Investment and Labor Market Outcomes Survey results.
Postgrad1% Pre-baccalaureate
11%
No Schoolto Primary
18% Bachelors
27%
High School32%
Uncategorized11%

Key Findings 17
Figure 5: Profile of Sampled Households, by Work Status (%)
Source: Authors’ estimates based on Youth Education Investment and Labor Market Outcomes Survey results.
Engagedin Work
89%
Not11%
Career GuidanceCareer Guidance received by Current Students
Activities offered by schools. Group counseling sessions, SHS career guidance program (CGP), and one-on-one career counseling sessions are the most common activities offered by schools for their CGP. When asked about the types of guidance services offered in school (Table 1), public schools reported that they generally focus on SHS CGP (69%), group counseling (68%), and vocationally oriented seminars with experts talking to classes (62%). On the other hand, private schools cited group counseling sessions (89%), one-on-one career counseling sessions (85%), and SHS CGP (81%) the most.
In more urbanized areas like NCR and Davao del Sur, more schools reported offering a variety of career guidance activities compared with schools in other provinces. This is particularly true for activities that require private sector participation like career or job fairs, student immersion, and jobsite tours or visits.
Jobsite tours or visits, training in other job-seeking skills, and tours of postsecondary institutions. Only a fourth of sampled schools reported conducting activities such as jobsite tours or visits, training in other job-seeking skills, and tours of postsecondary institutions as part of their career guidance activities. When asked about the types of services they offer, about 40% of private schools reported offering the aforementioned activities, while significantly less public schools reported doing so.
Priorities of guidance programs. Across the geographic areas included in this study, guidance programs in public and private schools generally give priority to helping students identify their SHS tracks and less priority to assisting them with financial aid issues. When asked about goals in the provision of guidance program services (Table 2), at least 38% of schools reportedly emphasized helping students identify their SHS track. Majority of sampled schools reported giving less priority to financial aid issues in their guidance programs.
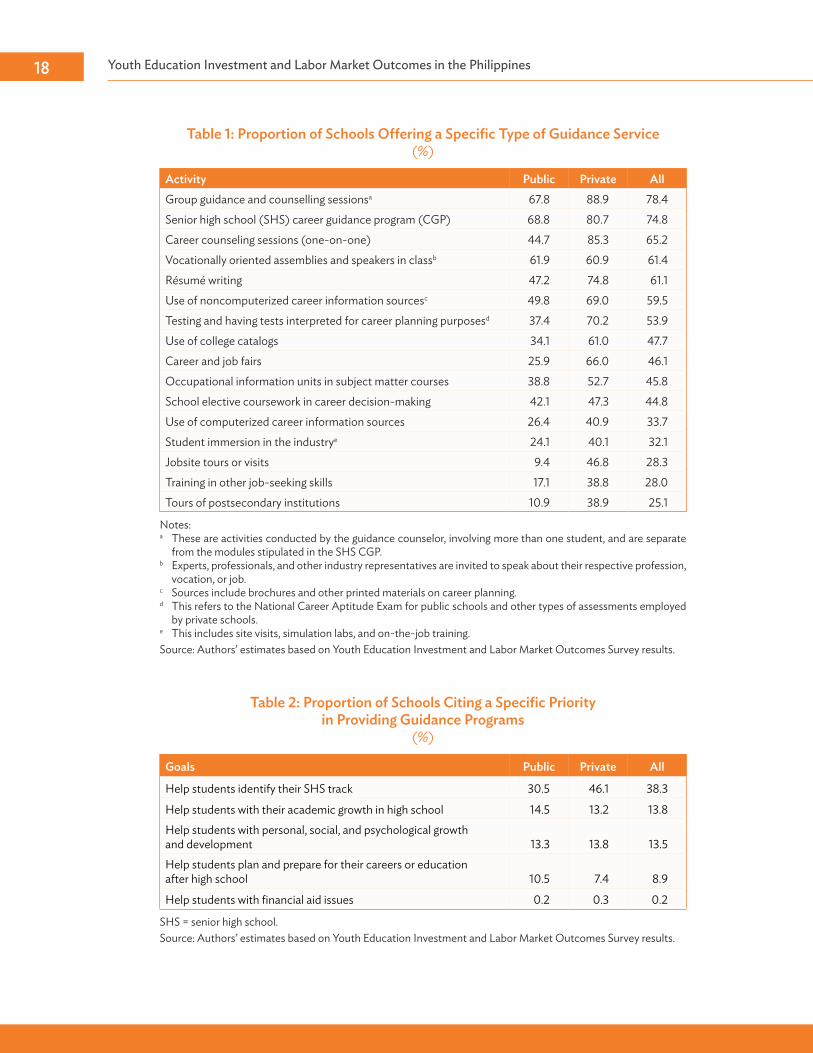
youth education Investment and Labor Market outcomes in the philippines18
Table 1: Proportion of Schools Offering a Specific Type of Guidance Service (%)
Activity Public Private AllGroup guidance and counselling sessionsa 67.8 88.9 78.4Senior high school (SHS) career guidance program (CGP) 68.8 80.7 74.8Career counseling sessions (one-on-one) 44.7 85.3 65.2Vocationally oriented assemblies and speakers in classb 61.9 60.9 61.4Résumé writing 47.2 74.8 61.1Use of noncomputerized career information sourcesc 49.8 69.0 59.5Testing and having tests interpreted for career planning purposesd 37.4 70.2 53.9Use of college catalogs 34.1 61.0 47.7Career and job fairs 25.9 66.0 46.1Occupational information units in subject matter courses 38.8 52.7 45.8School elective coursework in career decision-making 42.1 47.3 44.8Use of computerized career information sources 26.4 40.9 33.7Student immersion in the industrye 24.1 40.1 32.1Jobsite tours or visits 9.4 46.8 28.3Training in other job-seeking skills 17.1 38.8 28.0Tours of postsecondary institutions 10.9 38.9 25.1
Notes:a These are activities conducted by the guidance counselor, involving more than one student, and are separate
from the modules stipulated in the SHS CGP.b Experts, professionals, and other industry representatives are invited to speak about their respective profession,
vocation, or job.c Sources include brochures and other printed materials on career planning.d This refers to the National Career Aptitude Exam for public schools and other types of assessments employed
by private schools.e This includes site visits, simulation labs, and on-the-job training.Source: Authors’ estimates based on Youth Education Investment and Labor Market Outcomes Survey results.
Table 2: Proportion of Schools Citing a Specific Priority in Providing Guidance Programs
(%)
Goals Public Private All
Help students identify their SHS track 30.5 46.1 38.3
Help students with their academic growth in high school 14.5 13.2 13.8Help students with personal, social, and psychological growth and development 13.3 13.8 13.5Help students plan and prepare for their careers or education after high school 10.5 7.4 8.9
Help students with financial aid issues 0.2 0.3 0.2
SHS = senior high school.Source: Authors’ estimates based on Youth Education Investment and Labor Market Outcomes Survey results.
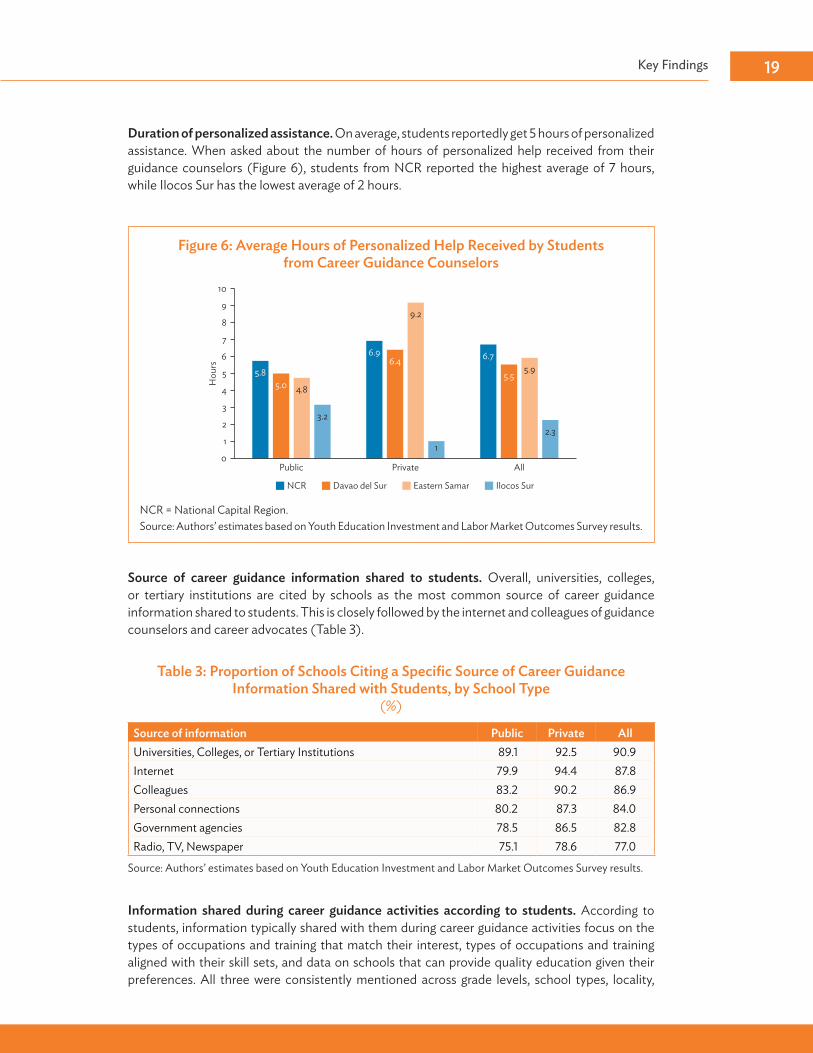
Key Findings 19
Duration of personalized assistance. On average, students reportedly get 5 hours of personalized assistance. When asked about the number of hours of personalized help received from their guidance counselors (Figure 6), students from NCR reported the highest average of 7 hours, while Ilocos Sur has the lowest average of 2 hours.
Figure 6: Average Hours of Personalized Help Received by Students from Career Guidance Counselors
NCR = National Capital Region.Source: Authors’ estimates based on Youth Education Investment and Labor Market Outcomes Survey results.
5.8
6.9 6.7
5.0
6.45.5
4.8
9.2
5.9
3.2
1
2.3
Public
Hou
rs
Private All
NCR Davao del Sur Eastern Samar Ilocos Sur
5.8
0
1
2
3
4
5
6
7
8
9
10
Table 3: Proportion of Schools Citing a Specific Source of Career Guidance Information Shared with Students, by School Type
(%)
Source of information Public Private AllUniversities, Colleges, or Tertiary Institutions 89.1 92.5 90.9Internet 79.9 94.4 87.8Colleagues 83.2 90.2 86.9Personal connections 80.2 87.3 84.0Government agencies 78.5 86.5 82.8Radio, TV, Newspaper 75.1 78.6 77.0
Source: Authors’ estimates based on Youth Education Investment and Labor Market Outcomes Survey results.
Source of career guidance information shared to students. Overall, universities, colleges, or tertiary institutions are cited by schools as the most common source of career guidance information shared to students. This is closely followed by the internet and colleagues of guidance counselors and career advocates (Table 3).
Information shared during career guidance activities according to students. According to students, information typically shared with them during career guidance activities focus on the types of occupations and training that match their interest, types of occupations and training aligned with their skill sets, and data on schools that can provide quality education given their preferences. All three were consistently mentioned across grade levels, school types, locality,

youth education Investment and Labor Market outcomes in the philippines20
and gender. When asked about the types of information they received in CGP (Figure 7), 55% of students from private schools and 56% from public schools reported the types of occupation and training that fit their interests. Roughly 49% of private school students and 43% of public school students said that they received information on types of occupations that fit their skills, and 39% of private school students and 34% of public school students received information on schools that can provide quality education.
Career Guidance received by Adults When they Were Studying
Types of information received by household respondents when they were choosing careers. The majority of household respondents received some information when they were choosing careers. In addition to asking students about the types of career-related information that they receive, it is also instructive to get retrospective information from adults because presumably, these are people who have more insights about the labor market and are in a position to assess the importance of career-related information with subsequent labor market outcomes. When asked whether they received information that was useful in choosing careers, 86% reported that they received some information, while 14% said they did not. NCR (16%) had the highest number of households that did not receive any information, followed by Ilocos Sur (14%). Only 1% of the household respondents from Eastern Samar and Davao del Sur reported being uninformed while considering careers.
Table 4 and Figures 8.a, 8.b, 8.c, 8.d, and 8.e summarize the proportion of household respondents with access to specific types of information while choosing careers, disaggregated by area.
Figure 7: Types of Information Received in Career Guidance, by School Type (%)
Source: Authors’ estimates based on Youth Education Investment and Labor Market Outcomes Survey results.
Types of occupations and training that fitpersonal interests
Information on funding options
Types of occupations and training that fitskills
Occupation outcomes from nationallabor market
Schools that can provide a qualityeducation given experiences
Occupation in demand outside thecountry
Types of occupations and training that fitpersonal wage preferences
Wage outcomes of those from schoolsin region
Labor market information Occupation outcomes of those fromschools in region
5.6 5.9
99.2
15.7 16.4
19.1 38.6
48.8
54.7
0 10 20 30 40 50 60
Private
0 10 20 30 40 50 60
Public
5.1 4
12.4 7.4
12.7 23.3
18.5
33.5 43.1
55.5

Key Findings 21
Table 4: Proportion of Household Members Citing Availability of Specific Information while Choosing Career Path
(%)
AreaLabor Market Information
Information on Types of
Occupations and Training
that Fit Personal Interests
Information on Types of
Occupations and Training
that Fit Wage Preferences
Information on Types of
Occupations that Fit Skills
Information on Schools
that Can Provide Quality
Education Given
Preferences
Information on Funding
OptionsNo
Information
NCR 32.5 35.7 14.7 21.2 17.8 4.2 16.2
Ilocos Sur 20.2 59.1 6.7 9.4 4.6 1.4 13.6
Eastern Samar
29.9 54.8 20.1 39.1 32.4 7.3 1.3
Davao del Sur
35.9 50.8 39.0 39.0 18.6 9.4 1.4
All 32.5 38.6 17.5 23.5 17.9 4.9 14.0
NCR = National Capital Region.Source: Authors’ estimates based on Youth Education Investment and Labor Market Outcomes Survey results.
Roughly a third of the surveyed households cited that labor market information was available during the time they were choosing a career path, higher than what was reported by students. There are small differences among the regions, but all figures fall in the 30%–35% range except for Ilocos Sur, which is at 20%.
Figure 8.a: Proportion of Household Members Citing Availability of “Labor Market Information” while Choosing Career Path,
by Survey Area and Locality (%)
NCR = National Capital Region.Source: Authors’ estimates based on Youth Education Investment and Labor Market Outcomes Survey results.
32.5 34.1
10.4
31.528.0
32.8
42.0
0
10
20
30
40
50
60
70
Urban Rural
NCR Ilocos Sur Eastern Samar Davao del Sur

youth education Investment and Labor Market outcomes in the philippines22
When it comes to the differences between types of localities, more than half of adult household members in rural areas shared that they were informed of the types of occupations and training that fit personal interests compared with people from urban areas. About 59% of households in Ilocos Sur reported being given this particular information, while only 36% of households in NCR reported the same. Figure 8.b further disaggregates the provincial estimates by urban and rural areas.
Figure 8.b: Proportion of Household Members Citing Availability of Information on “Types of Occupations and Training That Fit Personal Interests”
while Choosing Career Path, by Survey Area and Locality (%)
NCR = National Capital Region.Source: Authors’ estimates based on Youth Education Investment and Labor Market Outcomes Survey results.
35.7
52.2
64.0
54.3 55.3
48.2
56.0
0
10
20
30
40
50
60
70
Urban Rural
NCR Ilocos Sur Eastern Samar Davao del Sur
More people from rural areas (31%) reported being informed of the types of occupations and training that fit their wage preferences compared with their urban counterparts (17%). The provincial estimates by urban and rural areas were further disaggregated for the proportion of people citing the availability of types of occupations and training that fit wage preferences (Figure 8.c) and skills (Figure 8.d).
When asked if they were informed of schools that can provide quality education given their preferences, only 18% of people from urban areas and 15% of people in rural areas answered in the affirmative. About a third (32%) of respondents from Eastern Samar mentioned receiving such information at the time they were selecting their career, while other figures noted were 19% for Davao del Sur and 18% for NCR. Only 5% of sampled households in Ilocos Sur reported having knowledge of good schools that met their preferences when choosing a career. Figure 8.e further disaggregates the provincial estimates by urban and rural areas.
Across survey areas, only a few households were given information on funding options when considering their careers. About 9% of households in Davao del Sur reported having access to such information, followed by Eastern Samar with 7%, NCR with 4%, and Ilocos Sur with 1%.

Key Findings 23
Figure 8.c: Proportion of Household Members Citing Availability of Information on “Types of Occupations and Training That Fit Wage Preferences”
while Choosing Career Path, by Survey Area and Locality (%)
NCR = National Capital Region.Source: Authors’ estimates based on Youth Education Investment and Labor Market Outcomes Survey results.
14.7 12.52.6
14.6
26.6
36.3
44.4
0
10
20
30
40
50
60
70
Urban Rural
NCR Ilocos Sur Eastern Samar Davao del Sur
Figure 8.d: Proportion of Household Members Citing Availability of Information on “Types of Occupations and Training That Fit Skills” while Choosing
Career Path, by Survey Area and Locality (%)
NCR = National Capital Region.Source: Authors’ estimates based on Youth Education Investment and Labor Market Outcomes Survey results.
Urban Rural
NCR Ilocos Sur Eastern Samar Davao del Sur
0
10
20
30
50
40
70
60
21.2
10.6 8.6
31.8
42.447.7
32.2

youth education Investment and Labor Market outcomes in the philippines24
Table 5: Proportion of Household Members Indicating Preference to Have Had Specific Information Available while Choosing Career Path, by Survey Area
(%)
AreaLabor Market Information
Information on Types of
Occupations and Training
that Fit Personal Interests
Information on Types of
Occupations and Training
that Fit Wage Preferences
Information on Types of
Occupations that Fit Skills
Information on Schools
that Can Provide Quality Education Given
PreferencesInformation on
Funding Options
NCR 29.0 27.7 18.5 19.6 20.2 18.6
Ilocos Sur 24.9 34.3 10.6 19.4 7.8 10.6
Eastern Samar
24.8 54.7 20.2 32.8 26.8 12.4
Davao del Sur
32.0 31.6 34.3 29.7 17.0 16.9
All 29.1 29.0 20.1 21.1 19.7 18.0
NCR = National Capital Region.Source: Authors’ estimates based on Youth Education Investment and Labor Market Outcomes Survey results.
It is also worth noting that respondents with higher educational attainment reported having received more types of information that were useful for choosing careers.
Table 5 summarizes the types of information surveyed households preferred to have had while they were choosing their career path.
Figure 8.e: Proportion of Household Members Citing Availability of “Information on Schools That Can Provide Quality Education Given Preferences” while Choosing Career Path, by Survey Area and Locality
(%)
NCR = National Capital Region.Source: Authors’ estimates based on Youth Education Investment and Labor Market Outcomes Survey results.
17.8
5.73.9
34.430.0
19.915.8
0
10
20
30
40
50
60
70
Urban Rural
NCR Ilocos Sur Eastern Samar Davao del Sur

Key Findings 25
Types of information that should have been made available while choosing a career path according to households. Almost a third of the surveyed household members preferred to have had labor market information available to them while they were choosing a career path. When asked what type of information they preferred to have had when they were still contemplating which career to take (Table 5), 29% of household respondents mentioned labor market information. More respondents from Davao del Sur (32%) and NCR (29%) indicated this piece of information to be crucial, while only 25% of respondents in Eastern Samar and Ilocos Sur believed this to be the case.
Number of household respondents who indicated that information on occupations and training that fit interest should have been made available when choosing careers. In most of the surveyed provinces, 29% of household respondents indicated that they would have appreciated receiving data on occupations and training that fit their interest when choosing careers. It is only in Eastern Samar where more than half of the households (55%) said they would have appreciated access to such information. Looking at locality, more household members from rural areas (39%) than urban areas (28%) preferred receiving information on an occupation that matches their interests.
Number of household respondents who indicated that information on funding options should have been made available when choosing careers. About 18% of household respondents would have wanted information on funding options while choosing career paths. NCR registered the highest percentage at 19%, followed by Davao del Sur at 17%, Eastern Samar at 12%, and Ilocos Sur at 11%. The percentage for urban areas (18%) was slightly higher than that for rural areas (15%).
Choice of Senior High School trackStudents’ track choices. Academic track is the most popular track choice among students across provinces and grade levels, although percentages in Eastern Samar (59%) and Davao del Sur (63%) are relatively lower than those in NCR and Ilocos Sur (Figure 9.a). Coming in second is technical-vocational and livelihood (TVL) with only about a third of students in Eastern Samar and Davao del Sur and a quarter in NCR and Ilocos Sur preferring this track. Across grade levels, 71% prefer the academic track and 23% prefer the TVL track.
Students’ preference for academic track. Preference for academic track is higher among students in private schools than those in public schools by about 20 percentage points (Figure 9.b). About 83% of private school students prefer the academic track, while only 62% of those in public schools do.
Students’ preference for TVL track. Preference for TVL track is slightly stronger among students in rural areas than in urban areas, and among students in public schools than in private schools. Among students in rural schools, 34% chose or intend to choose the TVL track, versus 22% in urban schools (Figure 9.c).
Although both males and females show a higher preference for the academic over the TVL track, females show a higher preference for the academic track on average across all four geographic areas (77% of females as against 63% of males) (Figure 9.d). Eastern Samar and Davao del Sur have a higher share of TVL preference (more than 40%), particularly among male students.

youth education Investment and Labor Market outcomes in the philippines26
Reasons for choosing a specific track. Across areas, interest in field or subject matter is the reason most often cited by students for their choice of SHS track. A large majority (80% in urban areas and 79% in rural areas) claim it to be one of their three major considerations when choosing a track. This applies to more than 80% of students in NCR and Davao del Sur, and more than 70% of students in Ilocos Sur and Eastern Samar (Figure 10). Compatibility with one’s skills comes in second with almost half of the students citing it as a major consideration. Results also show that a quarter of the students still value their parents’ recommendation.
Figure 9.b: Distribution of Students by Intended or Chosen Track and School Type (%)
TVL = technical-vocational and livelihood.Source: Authors’ estimates based on Youth Education Investment and Labor Market Outcomes Survey results.
62.2 82.5
30.8
12.5
0
20
40
60
80
100%
Undecided Arts and design Sports TVL Academic
Public Private
Figure 9.a: Distribution of Students by Intended or Chosen Track and Survey Area (%)
NCR = National Capital Region, TVL = technical-vocational and livelihood.Source: Authors’ estimates based on Youth Education Investment and Labor Market Outcomes Survey results.
72.5 71.0 58.7 62.6
20.8 24.6 34.4 33.4
0
20
40
60
80
100%
NCR Ilocos Sur Eastern Samar Davao del Sur
Undecided Arts and design Sports TVL Academic
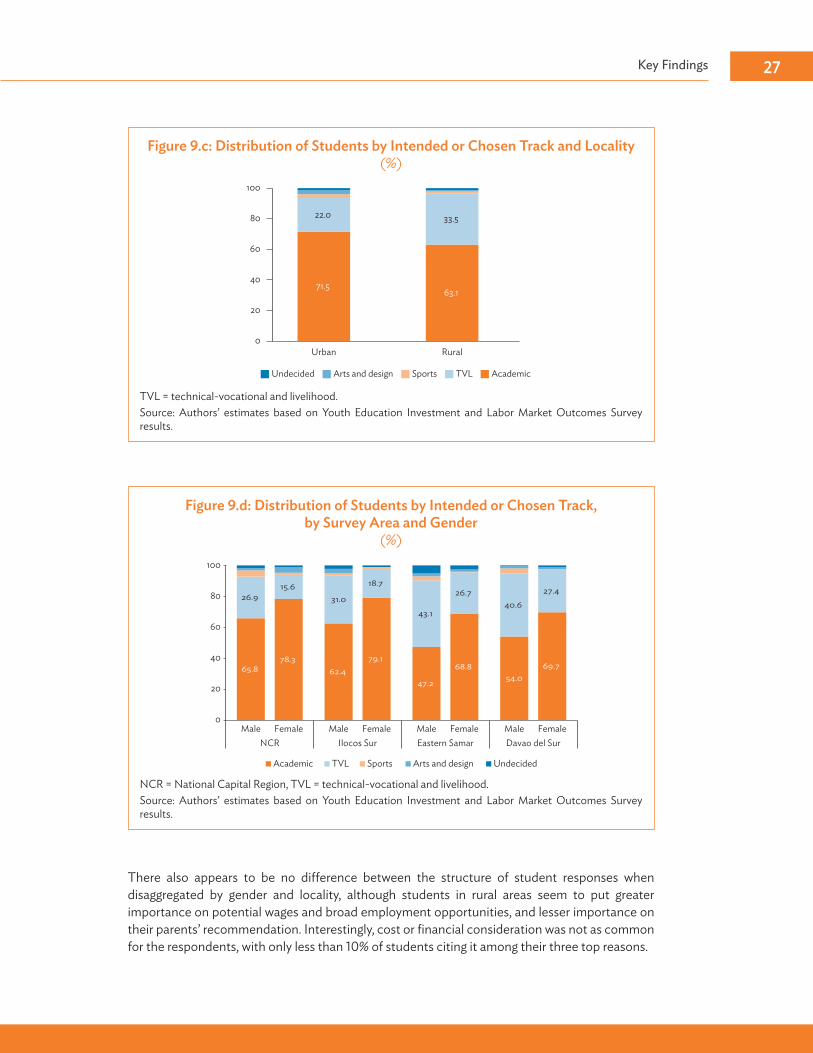
Key Findings 27
Figure 9.c: Distribution of Students by Intended or Chosen Track and Locality (%)
TVL = technical-vocational and livelihood.Source: Authors’ estimates based on Youth Education Investment and Labor Market Outcomes Survey results.
71.5 63.1
22.0 33.5
0
20
40
60
80
100%
Undecided Arts and design Sports TVL Academic
Urban Rural
Figure 9.d: Distribution of Students by Intended or Chosen Track, by Survey Area and Gender
(%)
NCR = National Capital Region, TVL = technical-vocational and livelihood.Source: Authors’ estimates based on Youth Education Investment and Labor Market Outcomes Survey results.
65.8 78.3
26.9 15.6
62.4 79.1
31.0
18.7
47.2
68.8
43.1
26.7
54.069.7
40.6
27.4
Male
100
80
60
40
20
0Female Male Female Male Female Male Female
NCR Ilocos Sur Eastern Samar Davao del Sur
Academic TVL Sports Arts and design Undecided
There also appears to be no difference between the structure of student responses when disaggregated by gender and locality, although students in rural areas seem to put greater importance on potential wages and broad employment opportunities, and lesser importance on their parents’ recommendation. Interestingly, cost or financial consideration was not as common for the respondents, with only less than 10% of students citing it among their three top reasons.

youth education Investment and Labor Market outcomes in the philippines28
Source of information used by students when choosing tracks. Across locality and gender, family (parents and siblings) is the source of information most used by students when making a track choice. Peers are also an often-cited source at 52%–61%, and so are relatives at 35%–44% and teachers at 30%–34% (Figure 11.a). There is a higher tendency among students in rural areas to cite peers as an information source, while students in urban areas tend to use internet sources more than those in rural areas. It is worth noting that guidance counselors rank low when students were asked to identify the sources of information they use when choosing a track (5%–6%).
Ranking of sources of students used or plan to use in choosing their track, across areas. The ranking of sources students used or plan to use in choosing their track is largely consistent across the four areas, with parents, peers, and relatives on top of the list. The internet is not as popular a source in Ilocos Sur as much as it is in the other areas, particularly NCR where internet use is heaviest (18.7%) (Figure 11.b). Students in NCR and Ilocos Sur also rely on their peers’ advice although not as heavily as their counterparts in Eastern Samar and Davao del Sur.
Preferred track vs. track most likely to take. Most students preferring the academic track also reported it to be the track they are most likely to take, with only 5% reporting that they will most likely take a different track. Students’ preferred tracks are not necessarily what students end up taking for various reasons. The likelihood of taking a different track from what one prefers is higher among students preferring TVL, with 15% believing that they are likely to take another track given current circumstances. It is even higher among those preferring the sports (39%), and arts and design (27%) tracks. In cases where the preferred track is different from the one likely to be taken, the academic track is most often cited as the track they are most likely to take.
Figure 10: Proportion of Students Identifying a Major Consideration for Choosing a Track, by Survey Area
(%)
NCR = National Capital Region.Source: Authors’ estimates based on Youth Education Investment and Labor Market Outcomes Survey results.
Broad employmentopportunities
Interest
Potential wages
Best fits my skills
College preparation
Recommendationof parentsAbility to workabroad
80.4
70.4
70.2
48.4
39.9
45.6
30.5
20.9
33.8
21.9
26.4
32.1
20.6
28.6
19.7
16.1
27.7
12.0
11.9
0
10
20
30
40
50
60
70
80
90
NCR Ilocos Sur Eastern Samar
82.5
60.0
17.8
28
.5 35
.7
10.7
12.6
9.4
17.0
Davao del Sur

Key Findings 29
Figure 11.a: Proportion of Students Citing a Specific Major Source of Information They Used or Planned to Use in Choosing a Track,
by Locality and Gender (%)
Source: Authors’ estimates based on Youth Education Investment and Labor Market Outcomes Survey results.
70.1 73
.7
52.4
61.2
34.7
43.8
30.5 34
.3
19.8
15.5 17.5
5.3
6.4 7.1
5.6
4.6
Urban Rural67
.7 72
.9
55.3
51.7
36.6
35.0
29.5 32
.1
20.3
18.6
15.6
16.7
6.3
6.6
5.5
5.5
Male Female
Parents and siblings
Other
Peers
Internet
Relative
Own perception
Teachers
Guidance counselor
0
10
20
30
40
50
60
70
80
Figure 11.b: Proportion of Students Citing a Specific Major Source of Information They Used or Planned to Use in Choosing a Track, by Survey Area
(%)
NCR = National Capital Region.Source: Authors’ estimates based on Youth Education Investment and Labor Market Outcomes Survey results.
69.5
69.2
75.2
51.9
44.9
62.5
33.3
42.5
30.5
28.7
20.3
10.7
18.7
1.3 6.
0
6.0
5.6
6.8
75.1
62.5
61.6
34.2
46.7
30.9
34.1
18.8
17.2
7.8 9.
1
6.3 8.
8
4.5 5.2
Parents and siblings
Other
Peers
Internet
Relative
Own perception
Teachers
Guidance counselor
0
10
20
30
40
50
60
70
80
NCR Ilocos Sur Eastern Samar Davao del Sur

youth education Investment and Labor Market outcomes in the philippines30
Overall, the likelihood of taking one’s preferred track is high across areas, particularly in Ilocos Sur where 100% of students preferring the sports track also reported the likelihood that they will take this track, while only 2% of those who prefer the academic track and 8% of those who prefer the TVL track think that they are more likely to take a different track (Tables 6.a–6.d).
Differences between students’ and parents’ track preferences. There are some differences between students’ and parents’ track preference especially among students who prefer tracks other than the academic track. Among students who prefer TVL, only 31% have parents who share their preference, while 67% have parents whose preference is to have their children take the academic track instead (Figure 12). Among students who prefer the sports track, only 4% have parents preferring the same, while 68% have parents who prefer the academic track instead. The same goes for the arts and design track, with only 6% having parents preferring the same track, while 83% have parents preferring the academic track instead.
Table 6.a: Preferred Track versus Track Likely to Be Taken Given Current Circumstances in National Capital Region
(Proportion of Grade 9 and 10 students, %)
Preferred
Likely to be Taken
TOTALAcademic TVL SportsArts and Design
Don’t Know
Academic 95.4 2.6 0.3 0.5 1.2 100.0 TVL 12.7 83.0 2.1 0.8 1.4 100.0 Sports 24.2 11.6 57.1 – 7.1 100.0 Arts and Design 6.0 13.0 0.6 74.0 6.5 100.0 Undecided 20.3 10.3 7.8 – 61.5 100.0 All 70.3 21.0 2.8 2.9 3.0 100.0
– = magnitude equals zero, TVL = technical-vocational and livelihood.Source: Authors’ estimates based on Youth Education Investment and Labor Market Outcomes Survey results.
Table 6.b: Preferred Track versus Track Likely to Be Taken Given Current Circumstances in Ilocos Sur (Proportion of Grade 9 and 10 students, %)
Preferred
Likely to be Taken
TOTALAcademic TVL SportsArts and Design
Don’t Know
Academic 98.0 0.7 – – 1.3 100.0 TVL 8.4 91.6 – – – 100.0 Sports – – 100.0 – – 100.0 Arts and Design 38.7 – – 61.3 – 100.0 Undecided 24.5 26.2 – – 49.3 100.0 All 74.1 20.7 1.9 1.2 2.1 100.0
– = magnitude equals zero, TVL = technical-vocational and livelihood.Source: Authors’ estimates based on Youth Education Investment and Labor Market Outcomes Survey results.

Key Findings 31
Table 6.c: Preferred Track versus Track Likely to Be Taken Given Current Circumstances in Eastern Samar
(Proportion of Grade 9 and 10 students, %)
Preferred
Likely to be Taken
TOTALAcademic TVL SportsArts and Design
Don’t Know
Academic 92.8 2.5 0.7 1.2 2.8 100.0 TVL 7.9 77.5 2.2 – 12.3 100.0 Sports – – 47.5 27.3 25.2 100.0 Arts and Design – 22.9 – 5.1 72.0 100.0 Undecided 9.5 30.7 – – 59.9 100.0 All 57.6 27.2 2.4 1.5 11.2 100.0
– = magnitude equals zero, TVL = technical-vocational and livelihood.Source: Authors’ estimates based on Youth Education Investment and Labor Market Outcomes Survey results.
Table 6.d: Preferred Track versus Track Likely to Be Taken Given Current Circumstances in Davao del Sur
(Proportion of Grade 9 and 10 students, %)
Preferred
Likely to be Taken
TOTALAcademic TVL SportsArts and Design
Don’t Know
Academic 92.5 5.0 0.3 1.2 1.0 100.0 TVL 8.9 90.3 – – 0.8 100.0 Sports 11.0 7.5 81.5 – – 100.0 Arts and Design 12.3 – – 85.5 2.2 100.0 Undecided 26.3 – – – 73.7 100.0 All 61.7 31.9 2.3 2.4 1.8 100.0
– = magnitude equals zero, TVL = technical-vocational and livelihood.Source: Authors’ estimates based on Youth Education Investment and Labor Market Outcomes Survey results.
Parental considerations in the choice of children’s track. Parental considerations in the choice of their child’s track are similar to factors the students themselves would consider when choosing a track, with the addition of potential wage and broad employment opportunities. Interest, potential wage, and broad employment opportunities are the top considerations of parents in both urban and rural areas (Figure 13). However, ranking in terms of how often a reason is cited varies across provinces (Table 7). For instance, an overwhelmingly large proportion of parents (74%) in Davao del Sur, 55% in NCR, and 64% in Ilocos Sur cited potential wage among their considerations, and only 39% of parents in Eastern Samar believed this to be a factor. More parents in rural areas choose tracks based on potential wage and broad employment opportunities. While a child’s interest is only the third consideration in rural areas, it ranks first in urban areas together with potential wage.

youth education Investment and Labor Market outcomes in the philippines32
Figure 13: Proportion of Parents Identifying a Specific Major Consideration in the Choice of Child’s Track, by Locality
(%)
Source: Authors’ estimates based on Youth Education Investment and Labor Market Outcomes Survey results.
58.0 56.356.4
64.5
48.5
63.3
33.528.5
21.318.216.1 14.4
8.7
0
10
20
30
40
50
60
70
80
Urban Rural
6.1
18.014.4
Interest
Ability to workabroad
Potential wages
Employmentopportunities in Manila
Broad employmentopportunitiesRecommendationof family members
Best fits child’sskillsCost and financialconsideration
Figure 12: Students’ Preferred Track versus Parents’ or Guardians’ Preferred Track
(%)
TVL = technical-vocational and livelihood.Source: Authors’ estimates based on Youth Education Investment and Labor Market Outcomes Survey results.
Arts and DesignSportsTVLAcademic
88.7 9.1 0.61.5
67.2 30.8 1.30.7
67.7 24.8 3.93.5
83.4 10.6 0.06.0
0 20 40 60 80 100
Academic
TVL
Sports
Arts and Design
Proportion of students (%)

Key Findings 33
Table 7: Proportion of Parents Identifying a Specific Major Consideration in the Choice of Child’s Track, by Survey Area
(%)
Consideration for Choosing a Track NCRIlocos
SurEastern Samar
Davao del Sur All
Interest 58.0 54.0 64.1 56.1 57.8Potential wages 54.6 63.8 39.0 73.6 57.3Broad employment opportunities 46.7 64.4 51.9 63.9 50.3Best fits my skills 33.4 26.3 36.1 31.6 32.9Ability to work abroad 21.4 20.0 15.9 20.4 21.0Employment opportunities in Manila 17.4 6.9 7.4 6.7 14.9Recommendation of other family members 13.7 23.1 28.5 14.9 14.8Cost or financial consideration 9.0 7.5 17.7 9.6 9.3Social acceptability expectations 4.8 0.1 6.3 4.3 4.6Location and proximity of school offering the major or vocation 4.6 0.1 6.6 4.5 4.4
Recommendation of friends or peers 1.6 1.3 1.2 2.1 1.7Others 7.2 0.3 10.2 5.9 6.8
NCR = National Capital Region. Source: Authors’ estimates based on Youth Education Investment and Labor Market Outcomes Survey results.
Number of students not proceeding to senior high school. Meanwhile, only less than 1% of surveyed students indicated that they would not be proceeding to SHS. All of them mentioned financial problems as one of three reasons they would not continue to SHS. This is followed by being unprepared and being not interested.
Figure 14: Proportion of Students Identifying Specific Reasons for Not Proceeding to Senior High School
(%)
Source: Authors’ estimates based on Youth Education Investment and Labor Market Outcomes Survey results.
30.8
31.3
31.4
36.7
0 10 20 30 40
Undecided on what to study
Has job o�er
Household responsibilities
Not interested
Felt unprepared
Financial problem
69.8
100.0
50 60 70 80 90 100

youth education Investment and Labor Market outcomes in the philippines34
Choice of College MajorNumber of students who expect to go to college. About 85% of student respondents expect to go to college. When asked about their preferred college course, 22% of the students said that they prefer personal services, 18% prefer engineering and engineering trades, and 15% prefer courses related to teacher training and education services (Figure 15.a).
More private school students prefer the profession-based college majors such as engineering, health, business administration, and architecture, compared with public school students who favor teacher training and security services. In terms of locality, more students from urban areas prefer health, business administration, architecture, and personal services, while more students in rural areas prefer teacher training.
Differences in preferred college majors between boys and girls. College major preferences reflect gender variations. More girls prefer teacher training, business administration, health, and personal services, while more boys prefer engineering, architecture, computing, transport services, and security services (Figure 15.b).
Students’ primary considerations in choosing a college major. Generally, most students cite interest, best fit their skills, potential wages, recommendation of parents, and broad employment opportunities as primary considerations in choosing a college major. The majority of students (64%) choose courses based on their interest, while a good proportion of them consider their skills (36%) and potential wages from related careers (29%) when making a choice. As was the case with choosing an SHS track, cost or financial consideration does not
Figure 15.a: Proportion of Students Preferring Specific Courses, by School Type (%)
Source: Authors’ estimates based on Youth Education Investment and Labor Market Outcomes Survey results.
0 5 10 15 20 25Don't knowHumanities
Life sciencesOthers
LawJournalism and information
ArtsSocial and behavioral science
Transport servicesSecurity services
Teacher training and education scienceComputing
Architecture and buildingBusiness and administration
HealthEngineering and engineering trades
Personal services
Private PublicAll
22.423.222.017.6 21.1
20.216.014.0
11.09.97.2 7.8
5.5
15.6
12.611.110.9
10.2
8.7
11.615.3
15.313.2
7.67.52.9 6.41.3 3.8
3.12.31.3 2.2
1.61.91.9
1.11.30.9
0.90.90.51.1
1.01.0
1.8
3.4
5.34.4
7.7
17.8

Key Findings 35
Figure 15.b: Proportion of Students Preferring Specific Courses, by Gender (%)
Source: Authors’ estimates based on Youth Education Investment and Labor Market Outcomes Survey results.
1.2
0.7
0.9
3.03.9
2.4
1.7
4.4
13.1
20.6
21.1
5.7 2.6
8.4
29.3 8.0
6.5
0.8
1.2
1.2
1.4
1.9 1.9
2.1
3.1 6.2
6.4
8.8 10.1
13.2 14.2
14.5 19.1
30.3
0 5 10 15 20 25 30 35
HumanitiesDon't know
Life sciencesJournalism and information
Social and behavioral scienceLaw
OthersArts
Business and administrationHealth
Teacher training and education scienceArchitecture and building
Transport servicesComputing
Personal servicesSecurity services
Engineering and engineering trades
Male Female
Figure 16: Proportion of Students Identifying a Specific Major Consideration for Choosing a College Major, by School Type
(%)
Source: Authors’ estimates based on Youth Education Investment and Labor Market Outcomes Survey results.
0.7
0.3
1.5
2.8
5.4
5.6
6.7
11.6
13.7
21.7
22.1
27.8
32.5
59.1 75.0
1.2
0.1
1.6
3.8
5.7
7.3
4.9
13.5
15.6
25.2
30.3
32.6
42.3
0 10 20 30 40 50 60 70 80
Others
Recommendation of teachersLocation/proximity of school o�ering the major/vocation
Employment opportunities in Manila
Recommendation of friends/peers
Social acceptability expectations
Cost/financial consideration
Recommendation of other family members
Ability to work abroad
Broad employment opportunities
Recommendation of parents
Potential wages
Best fits my skills
Interest
Private Public

youth education Investment and Labor Market outcomes in the philippines36
show up as a major factor, with only 6.1% of students mentioning it. The recommendation of teachers (0.2%) and location (2%) do not seem to factor in the students’ top considerations in choosing a college major.
The top considerations are the same across private school and public school students (Figure 16), and across students in rural and urban schools.
Students’ source of information when choosing a college course. According to students, social circles seem to be the predominant information source when choosing a college course. Students cited parents (68.8%), peers (48.3%), and relatives (40.5%) as the most used sources of information, while guidance counselors were the least cited source of information (2.5%) for choosing a college course.
Parents’ source of information when choosing a college course for their children. Consistent with student-reported information sources, social circles seem to be the primary information source as well for household respondents when choosing a college course for their children. This holds true across locality, province, and educational attainment. Household respondents identified parents (38%), peers (34%), and relatives (32%) as the most used sources of information, while the least cited sources of information include television and radio (3.8%) and guidance counselors (3.0%) (Figure 17). It is worth noting that the top three and least used sources of information are the same for both choosing an SHS track and choosing a college course.
Figure 17: Proportion of Households Citing a Specific Source of Information as One of the Three Major Sources of Information Used
in Choosing Postsecondary Education (%)
Source: Authors’ estimates based on Youth Education Investment and Labor Market Outcomes Survey results.
10 20 30 600
Guidance counselor
Television and radio
Others
Books, newspapers, and magazines
Internet
Teacher
Self
Sibling/s
Relative
Peers
Parents
5040Rural UrbanAll
37.7
37.3
48.136.9
33.633.3
31.835.7
27.2
19.418.2
18.713.1
12.12.1
5.25.5
4.61.8
1.3
1.0
4.8
3.8
4.04.2
4.03.03.03.3
18.921.2
32.441.5
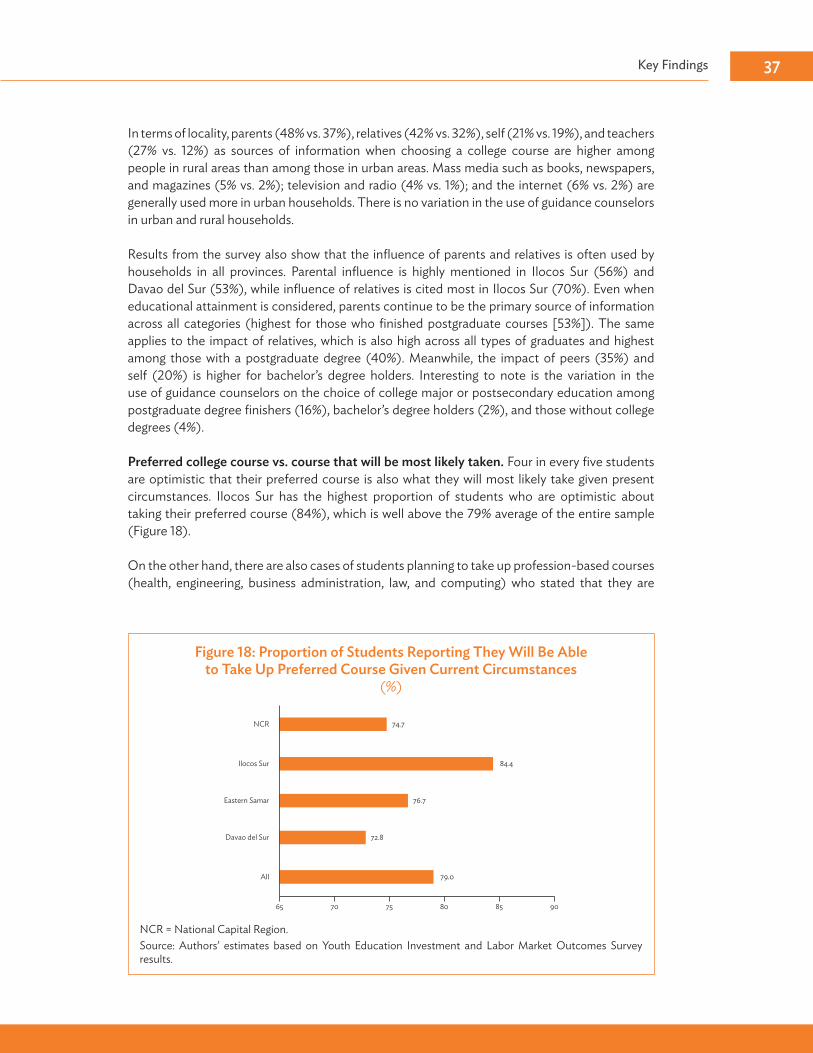
Key Findings 37
In terms of locality, parents (48% vs. 37%), relatives (42% vs. 32%), self (21% vs. 19%), and teachers (27% vs. 12%) as sources of information when choosing a college course are higher among people in rural areas than among those in urban areas. Mass media such as books, newspapers, and magazines (5% vs. 2%); television and radio (4% vs. 1%); and the internet (6% vs. 2%) are generally used more in urban households. There is no variation in the use of guidance counselors in urban and rural households.
Results from the survey also show that the influence of parents and relatives is often used by households in all provinces. Parental influence is highly mentioned in Ilocos Sur (56%) and Davao del Sur (53%), while influence of relatives is cited most in Ilocos Sur (70%). Even when educational attainment is considered, parents continue to be the primary source of information across all categories (highest for those who finished postgraduate courses [53%]). The same applies to the impact of relatives, which is also high across all types of graduates and highest among those with a postgraduate degree (40%). Meanwhile, the impact of peers (35%) and self (20%) is higher for bachelor’s degree holders. Interesting to note is the variation in the use of guidance counselors on the choice of college major or postsecondary education among postgraduate degree finishers (16%), bachelor’s degree holders (2%), and those without college degrees (4%).
Preferred college course vs. course that will be most likely taken. Four in every five students are optimistic that their preferred course is also what they will most likely take given present circumstances. Ilocos Sur has the highest proportion of students who are optimistic about taking their preferred course (84%), which is well above the 79% average of the entire sample (Figure 18).
On the other hand, there are also cases of students planning to take up profession-based courses (health, engineering, business administration, law, and computing) who stated that they are
Figure 18: Proportion of Students Reporting They Will Be Able to Take Up Preferred Course Given Current Circumstances
(%)
NCR = National Capital Region.Source: Authors’ estimates based on Youth Education Investment and Labor Market Outcomes Survey results.
65 70 75 80 9085
72.8Davao del Sur
74.7NCR
76.7Eastern Samar
84.4Ilocos Sur
79.0All

youth education Investment and Labor Market outcomes in the philippines38
more likely to take lower-value courses (personal services and security services) given their circumstances. For instance, out of the students who prefer to take up health, 4% stated that they are likely to take up courses related to personal services instead. This trend is most apparent in NCR at 6%. For those who prefer engineering, 7% said that they are likely to take up courses related to security services due to their circumstances. This trend is strongest in Davao del Sur, where 11% of students said that they are likely to take up courses different from their preferred engineering course.
In addition, 4% of students who want to take up business-related courses said that they are likely to end up taking courses related to personal services. This phenomenon seems to be most apparent in Eastern Samar where it applies to 13% of students. Similarly, 3% of law school aspirants and 4% of students who hope to take up computing-related courses said that they are likely to end up in personal services courses as well. The trend of law school hopefuls seeing themselves in personal services is strongest in NCR (6%). Meanwhile, in Eastern Samar, 16% of students wanting to do computing see themselves taking up personal services courses instead due to current circumstances.
Parents expecting their children to continue on to postsecondary education. Almost all parents (95%) expect their children to proceed to postsecondary education. The expectation is highest in NCR with 96% of households seeing that their children will continue onto postsecondary education. Meanwhile, Davao del Sur (88%) and Ilocos Sur (91%) exhibit lower percentages of households expecting their children to proceed to postsecondary schooling. In terms of locality, overall, more urban households (96%) believe that their children will go for postsecondary education compared with rural households (89%) (Figure 19). The pattern is also observed in other areas but is strongest in Eastern Samar, with 98% of urban households expecting their children to proceed to postsecondary education as opposed to 91% for rural households.
0 20 40 60 10080
Eastern Samar91.3
97.8
NCR 96.3
Ilocos Sur 93.189.9
Davao del Sur 88.989.7
All 95.688.8
Rural Urban
Figure 19: Proportion of Parents Expecting Their Children to Continue on to Postsecondary Education, by Survey Area and Locality
(%)
NCR = National Capital Region.Source: Authors’ estimates based on Youth Education Investment and Labor Market Outcomes Survey results.

Key Findings 39
Figure 20: Proportion of Parents Citing a Specific Factor for Their Children Not Continuing with Postsecondary Education, by Locality
(%)
Source: Authors’ estimates based on Youth Education Investment and Labor Market Outcomes Survey results.
0 20 40 60 80 100
Other, specify
Marriage
Grades not su�cient
Not necessary for employmentchoice
Not interested
Want to pursue other interests
Unprepared
Undecided
Has job o�er
Household responsibilities
Financial problems96.693.097.8
26.2 36.522.6
11.5
11.113.8
10.110.4
8.25.0
6.54.5
3.14.3
2.72.6
1.71.21.6
1.4
1.41.8
6.6
17.0
15.110.3
Rural UrbanAll
Reasons for Not Continuing with Postsecondary Education according to Household Respondents. Financial problems seem to be the most frequently cited factor among households for not proceeding to postsecondary education. Specifically, 97% of households cited financial problems, followed by household responsibilities (26%), job offer (12%), indecision (11%), and unpreparedness (10%) as reasons for not proceeding to postsecondary education. Financial problems are the most common factor among urban households while household responsibilities is the top factor for rural households (Figure 20). More rural households cite unpreparedness and undecidedness than urban households. Notably, marriage was a factor mentioned only by rural households.
Financial constraint is the predominant factor and is most apparent in Ilocos Sur (100%) and NCR (97%). While “household responsibilities” is mostly cited among Davao del Sur households (34%), “being unprepared” is also frequently cited in both Davao del Sur (20%) and Ilocos Sur (14%). “Being undecided” is the strongest factor for not proceeding to postsecondary education among Eastern Samar households (16%), and “job offers” is the strongest in Davao del Sur households (18%). Similarly, while “insufficient grades” generally registers at 1% overall, it comes up to 7% of households in Eastern Samar.
occupational preferences and expectationsStudents’ preferred occupation. When asked about their preferred occupation by age 30, the majority of students across grade levels reported an inclination to become professionals (51%). The top three occupation choices for grade 9 students include professionals (50%), service and sales workers (14%), and managers (11%). For grades 10 and 11, the top 3 choices are professionals
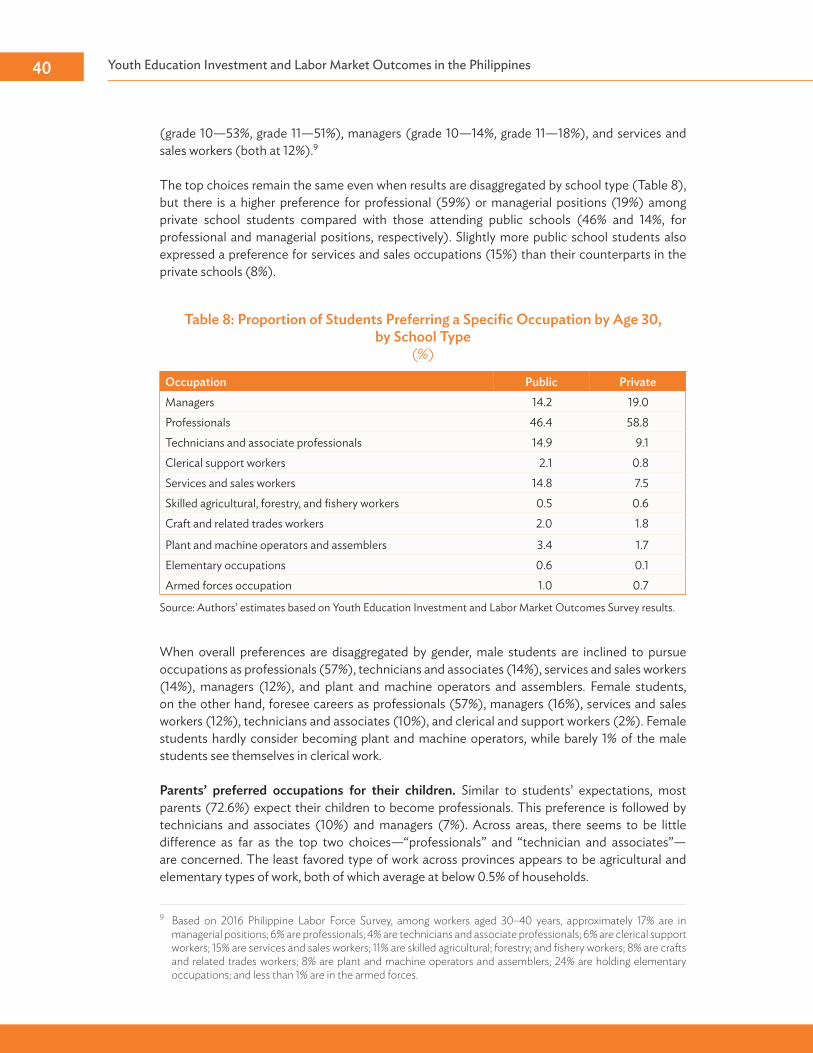
youth education Investment and Labor Market outcomes in the philippines40
(grade 10—53%, grade 11—51%), managers (grade 10—14%, grade 11—18%), and services and sales workers (both at 12%).9
The top choices remain the same even when results are disaggregated by school type (Table 8), but there is a higher preference for professional (59%) or managerial positions (19%) among private school students compared with those attending public schools (46% and 14%, for professional and managerial positions, respectively). Slightly more public school students also expressed a preference for services and sales occupations (15%) than their counterparts in the private schools (8%).
When overall preferences are disaggregated by gender, male students are inclined to pursue occupations as professionals (57%), technicians and associates (14%), services and sales workers (14%), managers (12%), and plant and machine operators and assemblers. Female students, on the other hand, foresee careers as professionals (57%), managers (16%), services and sales workers (12%), technicians and associates (10%), and clerical and support workers (2%). Female students hardly consider becoming plant and machine operators, while barely 1% of the male students see themselves in clerical work.
Parents’ preferred occupations for their children. Similar to students’ expectations, most parents (72.6%) expect their children to become professionals. This preference is followed by technicians and associates (10%) and managers (7%). Across areas, there seems to be little difference as far as the top two choices—“professionals” and “technician and associates”—are concerned. The least favored type of work across provinces appears to be agricultural and elementary types of work, both of which average at below 0.5% of households.
9 Based on 2016 Philippine Labor Force Survey, among workers aged 30–40 years, approximately 17% are in managerial positions; 6% are professionals; 4% are technicians and associate professionals; 6% are clerical support workers; 15% are services and sales workers; 11% are skilled agricultural; forestry; and fishery workers; 8% are crafts and related trades workers; 8% are plant and machine operators and assemblers; 24% are holding elementary occupations; and less than 1% are in the armed forces.
Table 8: Proportion of Students Preferring a Specific Occupation by Age 30, by School Type
(%)
Occupation Public PrivateManagers 14.2 19.0Professionals 46.4 58.8Technicians and associate professionals 14.9 9.1Clerical support workers 2.1 0.8Services and sales workers 14.8 7.5Skilled agricultural, forestry, and fishery workers 0.5 0.6Craft and related trades workers 2.0 1.8
Plant and machine operators and assemblers 3.4 1.7Elementary occupations 0.6 0.1Armed forces occupation 1.0 0.7
Source: Authors’ estimates based on Youth Education Investment and Labor Market Outcomes Survey results.
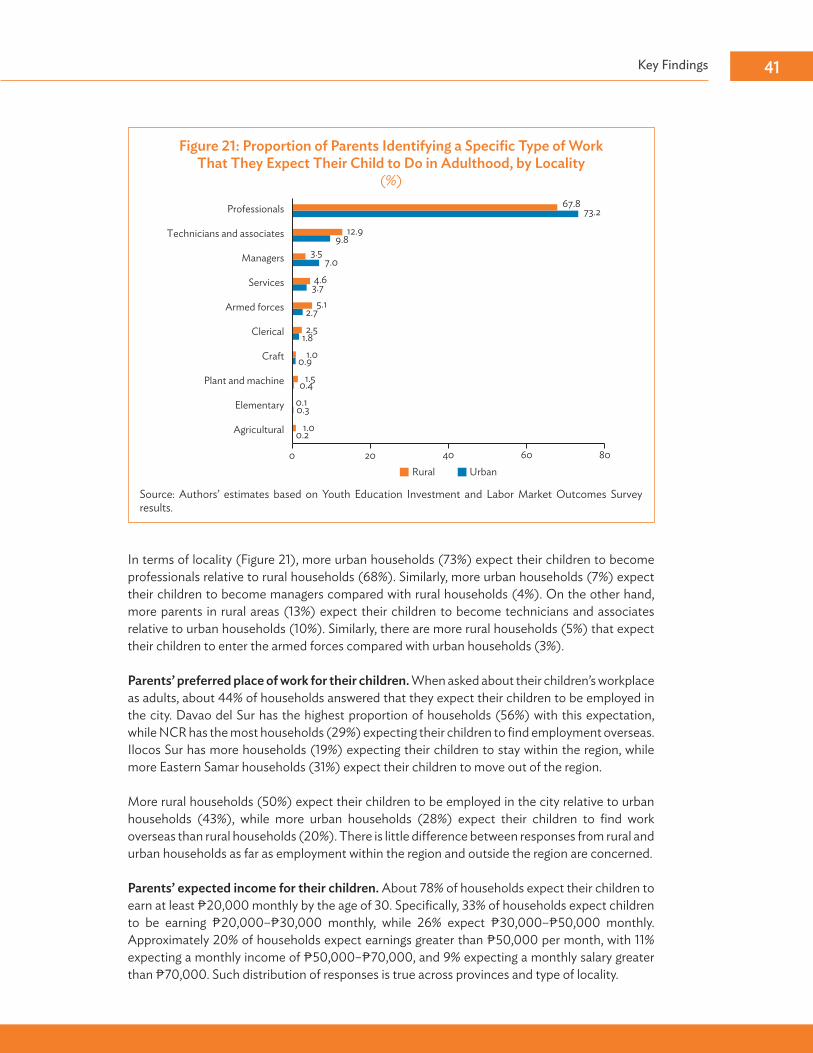
Key Findings 41
Figure 21: Proportion of Parents Identifying a Specific Type of Work That They Expect Their Child to Do in Adulthood, by Locality
(%)
Source: Authors’ estimates based on Youth Education Investment and Labor Market Outcomes Survey results.
Rural Urban
0.2
0.3
0.4
0.9
1.8
2.7
3.7
7.0
9.8
1.0
0.1
1.5
1.0
2.5
5.1
4.6
3.5
12.9
0 20
Agricultural
Elementary
Plant and machine
Craft
Clerical
Armed forces
Services
Managers
Technicians and associates
Professionals 73.267.8
40 60 80
In terms of locality (Figure 21), more urban households (73%) expect their children to become professionals relative to rural households (68%). Similarly, more urban households (7%) expect their children to become managers compared with rural households (4%). On the other hand, more parents in rural areas (13%) expect their children to become technicians and associates relative to urban households (10%). Similarly, there are more rural households (5%) that expect their children to enter the armed forces compared with urban households (3%).
Parents’ preferred place of work for their children. When asked about their children’s workplace as adults, about 44% of households answered that they expect their children to be employed in the city. Davao del Sur has the highest proportion of households (56%) with this expectation, while NCR has the most households (29%) expecting their children to find employment overseas. Ilocos Sur has more households (19%) expecting their children to stay within the region, while more Eastern Samar households (31%) expect their children to move out of the region.
More rural households (50%) expect their children to be employed in the city relative to urban households (43%), while more urban households (28%) expect their children to find work overseas than rural households (20%). There is little difference between responses from rural and urban households as far as employment within the region and outside the region are concerned.
Parents’ expected income for their children. About 78% of households expect their children to earn at least ₱20,000 monthly by the age of 30. Specifically, 33% of households expect children to be earning ₱20,000–₱30,000 monthly, while 26% expect ₱30,000–₱50,000 monthly. Approximately 20% of households expect earnings greater than ₱50,000 per month, with 11% expecting a monthly income of ₱50,000–₱70,000, and 9% expecting a monthly salary greater than ₱70,000. Such distribution of responses is true across provinces and type of locality.

youth education Investment and Labor Market outcomes in the philippines42
other FindingsThis part expounds on realities in the larger context that may impact the educational investment and career planning choices of students and households. Survey findings related to financial aid programs, factors that affect SHS tracks offered in schools, school transfers, unexpected events experienced by households that impact educational decisions, and insights on formal education from those currently working are discussed to capture pertinent facets of the macro-environment in which crucial education and career decisions are being made.
Financial Aid
Knowledge on potential funding options for children’s attendance in senior high school. When asked about information on potential funding options to support their children in SHS, only 14% of household respondents noted knowing about financial aid programs. Parents from urban areas fared better at 15%, while parents from rural areas registered only 8% (Table 9).
Table 9: Proportion of Households with Information on Potential Financial Aid for Children in Senior High School, by Survey Area and Locality
(%)
Province Urban Rural All
NCR 15.3 15.3
Ilocos Sur 2.5 4.6 3.6
Eastern Samar 12.8 8.4 10.3
Davao del Sur 10.9 9.3 10.1
All 14.5 8.3 13.8
NCR = National Capital Region.Source: Authors’ estimates based on Youth Education Investment and Labor Market Outcomes Survey results.
Main source of information on financial aid programs. Social circles remain to be the main source of information for those aware of financial aid programs. Parents from urban areas typically get their information from friends and relatives (39%) followed by their children’s teachers (35%) and websites (24%). Parents from rural areas, on the other hand, cited their friends and relatives (49%), teachers (44%), and admission officers (22%) as their sources of information for financial aid for their children.
When disaggregated by area, survey data show that households from NCR often rely on their friends and relatives (38%), teachers (33%), and admission officers to provide information on potential funding for SHS. In Ilocos Sur, parents count on their children’s teachers (42%) as well as friends and relatives (36%) to identify sources of financial aid. The majority of the parents in Eastern Samar rely on teachers (60%) followed by their friends and relatives (52%), while the percentages for Davao del Sur are at 49% for friends and relatives and 44% for teachers.
Interestingly, despite the small percentage of households that reported having access to information on SHS financial aid programs for their children, the majority (74%) of current grade 11 students from the sampled private schools are voucher recipients. NCR schools noted
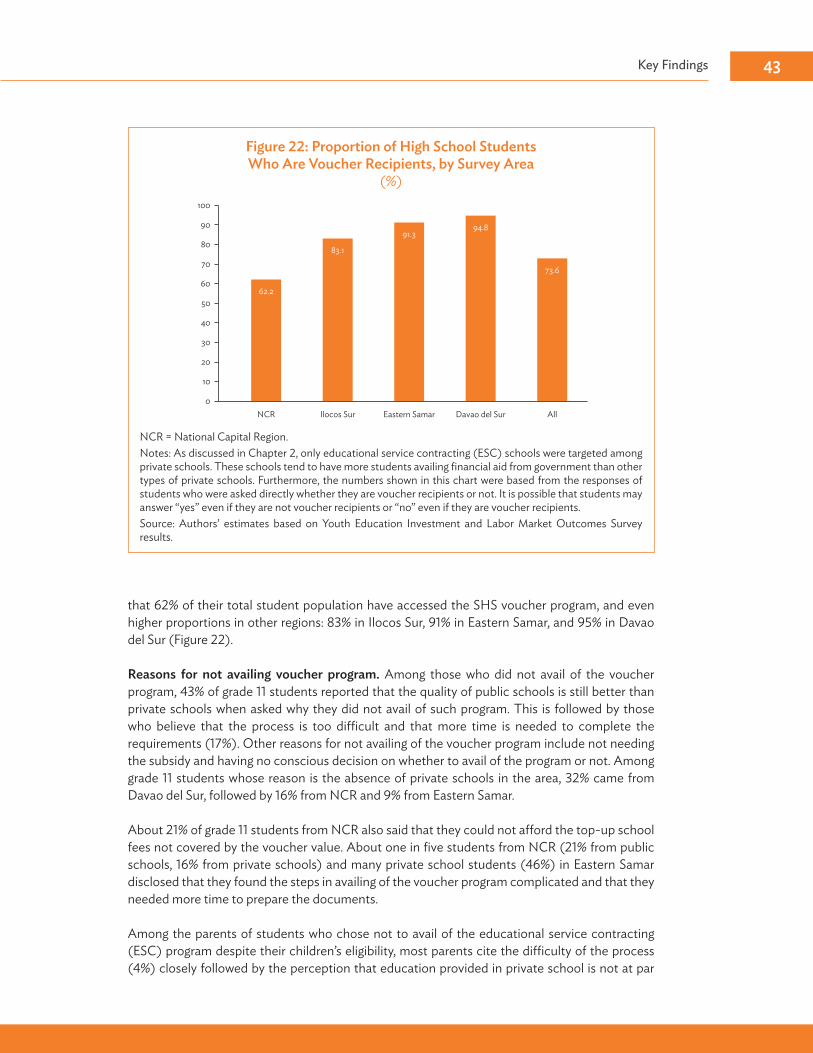
Key Findings 43
that 62% of their total student population have accessed the SHS voucher program, and even higher proportions in other regions: 83% in Ilocos Sur, 91% in Eastern Samar, and 95% in Davao del Sur (Figure 22).
Reasons for not availing voucher program. Among those who did not avail of the voucher program, 43% of grade 11 students reported that the quality of public schools is still better than private schools when asked why they did not avail of such program. This is followed by those who believe that the process is too difficult and that more time is needed to complete the requirements (17%). Other reasons for not availing of the voucher program include not needing the subsidy and having no conscious decision on whether to avail of the program or not. Among grade 11 students whose reason is the absence of private schools in the area, 32% came from Davao del Sur, followed by 16% from NCR and 9% from Eastern Samar.
About 21% of grade 11 students from NCR also said that they could not afford the top-up school fees not covered by the voucher value. About one in five students from NCR (21% from public schools, 16% from private schools) and many private school students (46%) in Eastern Samar disclosed that they found the steps in availing of the voucher program complicated and that they needed more time to prepare the documents.
Among the parents of students who chose not to avail of the educational service contracting (ESC) program despite their children’s eligibility, most parents cite the difficulty of the process (4%) closely followed by the perception that education provided in private school is not at par
Figure 22: Proportion of High School Students Who Are Voucher Recipients, by Survey Area
(%)
NCR = National Capital Region.Notes: As discussed in Chapter 2, only educational service contracting (ESC) schools were targeted among private schools. These schools tend to have more students availing financial aid from government than other types of private schools. Furthermore, the numbers shown in this chart were based from the responses of students who were asked directly whether they are voucher recipients or not. It is possible that students may answer “yes” even if they are not voucher recipients or “no” even if they are voucher recipients.Source: Authors’ estimates based on Youth Education Investment and Labor Market Outcomes Survey results.
0
10
20
30
40
50
60
70
80
90
100
62.2
83.1
91.3
73.6
94.8
NCR Ilocos Sur Eastern Samar AllDavao del Sur
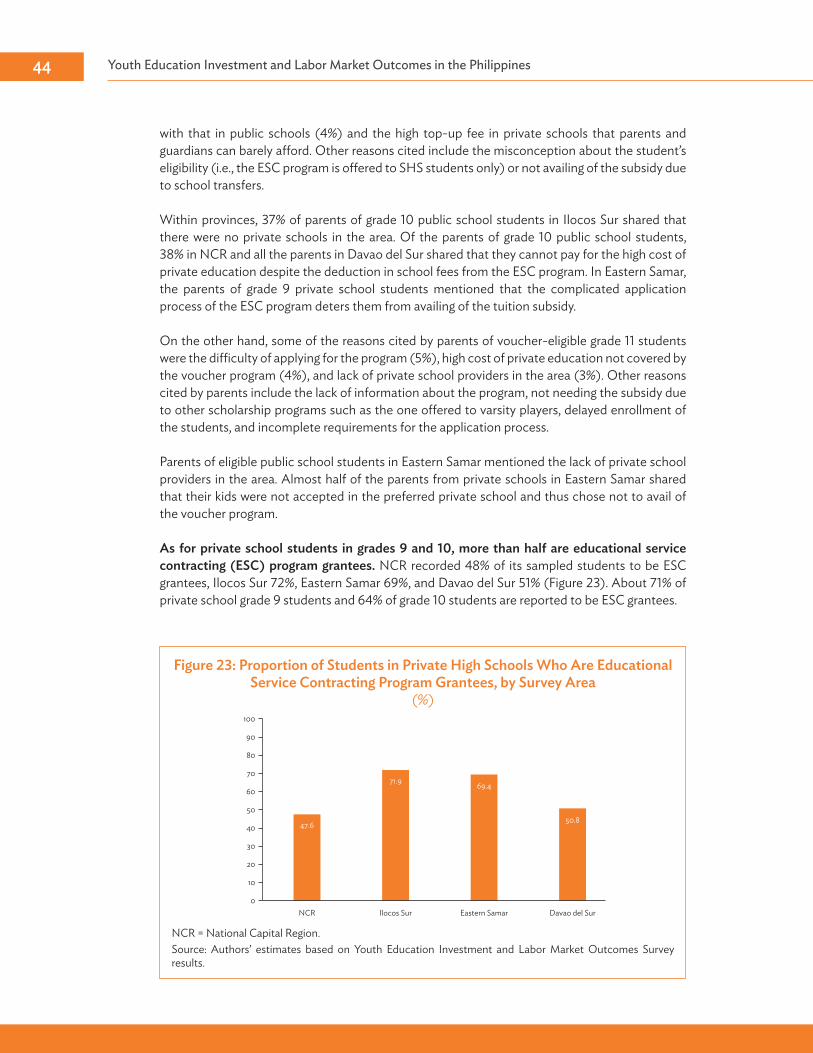
youth education Investment and Labor Market outcomes in the philippines44
with that in public schools (4%) and the high top-up fee in private schools that parents and guardians can barely afford. Other reasons cited include the misconception about the student’s eligibility (i.e., the ESC program is offered to SHS students only) or not availing of the subsidy due to school transfers.
Within provinces, 37% of parents of grade 10 public school students in Ilocos Sur shared that there were no private schools in the area. Of the parents of grade 10 public school students, 38% in NCR and all the parents in Davao del Sur shared that they cannot pay for the high cost of private education despite the deduction in school fees from the ESC program. In Eastern Samar, the parents of grade 9 private school students mentioned that the complicated application process of the ESC program deters them from availing of the tuition subsidy.
On the other hand, some of the reasons cited by parents of voucher-eligible grade 11 students were the difficulty of applying for the program (5%), high cost of private education not covered by the voucher program (4%), and lack of private school providers in the area (3%). Other reasons cited by parents include the lack of information about the program, not needing the subsidy due to other scholarship programs such as the one offered to varsity players, delayed enrollment of the students, and incomplete requirements for the application process.
Parents of eligible public school students in Eastern Samar mentioned the lack of private school providers in the area. Almost half of the parents from private schools in Eastern Samar shared that their kids were not accepted in the preferred private school and thus chose not to avail of the voucher program.
As for private school students in grades 9 and 10, more than half are educational service contracting (ESC) program grantees. NCR recorded 48% of its sampled students to be ESC grantees, Ilocos Sur 72%, Eastern Samar 69%, and Davao del Sur 51% (Figure 23). About 71% of private school grade 9 students and 64% of grade 10 students are reported to be ESC grantees.
Figure 23: Proportion of Students in Private High Schools Who Are Educational Service Contracting Program Grantees, by Survey Area
(%)
NCR = National Capital Region.Source: Authors’ estimates based on Youth Education Investment and Labor Market Outcomes Survey results.
0
10
20
30
40
50
60
70
80
90
100
NCR Ilocos Sur Eastern Samar Davao del Sur
47.6
71.9 69.4
50.8

Key Findings 45
Reasons for not availing the Education Service Contracting program. Some of the reasons why qualified grade 9 students opted not to avail of the ESC program include the perceived high fees they would still have to pay despite the subsidy (19%), the perceived difficulty of accessing the program (16%), and finding that the private school does not offer the track they prefer (16%) (Table 10.a). Other reasons are having no need for it, lacking letters for the program application, and having parents who are not aware of the program.
Table 10.a: Proportion of Grade 9 Students Who Qualified for Educational Service Contracting Program but Did Not Take It Up for a Specific Reason
(%)
Reason %No affordable private schools or value for subsidy from ESC is not enough for private school expenses
19.2
Process for accessing ESC is difficult or requires more time 16.1 Private school did not offer track that was of interest 16.1 Was not accepted into preferred private school 6.8 Othera 43.0
ESC = educational service contracting.a Other reasons include having no need for the program, lacking letters for the program application, and having
parents who are not aware of the program.Source: Authors’ estimates based on Youth Education Investment and Labor Market Outcomes Survey results.
All public school grade 9 students in Eastern Samar and 21% in NCR reasoned out that the value of the ESC is not enough to cover the school fees.
A number of grade 9 students from NCR (33% public school students, 7% private school students) mentioned that the processing of ESC grants is too difficult or that it requires more time. Further, 17% of public school students in NCR were not accepted in their preferred private schools, while 20% shared that they chose not to avail of the program altogether since their target private schools do not offer their preferred track.
Perceived complexity of application process for the Education Service Contracting program. About 24% of grade 10 students who opted not to avail of the ESC program reasoned that the process is too difficult to complete. A few thought the quality of private school education is not as good as the one offered in public schools (6%), while some said they have no private schools in the area (Table 10.b). Among grade 10 public school students from Davao del Sur, 21% mentioned that they have no private schools to choose from, 23% believe that the quality of public schools is better than private schools, and 53% said that the process is too difficult or that they needed more time to process their ESC applications.
All grade 10 private school students from Eastern Samar thought that the process is too difficult or that they needed more time to process their ESC applications.
Other reasons cited by grade 10 students for deciding not to avail of the program include not needing the subsidy and having no decision yet regarding which school or track to enroll in.
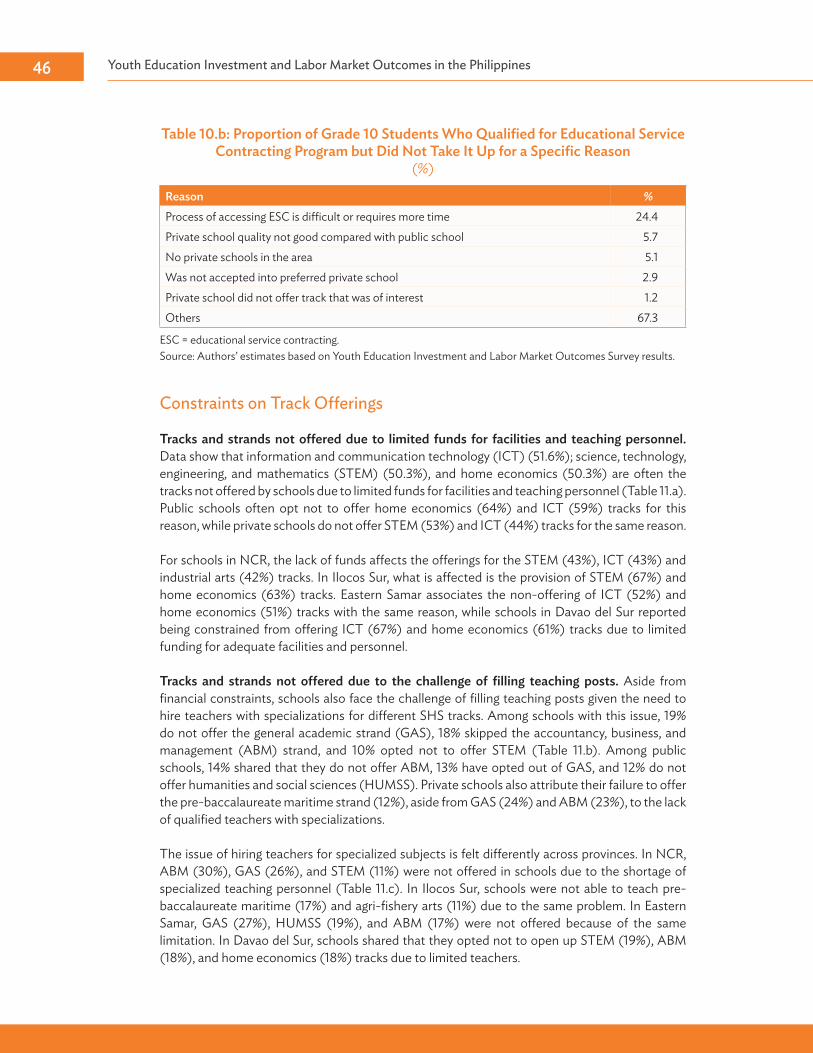
youth education Investment and Labor Market outcomes in the philippines46
Constraints on track offerings
Tracks and strands not offered due to limited funds for facilities and teaching personnel. Data show that information and communication technology (ICT) (51.6%); science, technology, engineering, and mathematics (STEM) (50.3%), and home economics (50.3%) are often the tracks not offered by schools due to limited funds for facilities and teaching personnel (Table 11.a). Public schools often opt not to offer home economics (64%) and ICT (59%) tracks for this reason, while private schools do not offer STEM (53%) and ICT (44%) tracks for the same reason.
For schools in NCR, the lack of funds affects the offerings for the STEM (43%), ICT (43%) and industrial arts (42%) tracks. In Ilocos Sur, what is affected is the provision of STEM (67%) and home economics (63%) tracks. Eastern Samar associates the non-offering of ICT (52%) and home economics (51%) tracks with the same reason, while schools in Davao del Sur reported being constrained from offering ICT (67%) and home economics (61%) tracks due to limited funding for adequate facilities and personnel.
Tracks and strands not offered due to the challenge of filling teaching posts. Aside from financial constraints, schools also face the challenge of filling teaching posts given the need to hire teachers with specializations for different SHS tracks. Among schools with this issue, 19% do not offer the general academic strand (GAS), 18% skipped the accountancy, business, and management (ABM) strand, and 10% opted not to offer STEM (Table 11.b). Among public schools, 14% shared that they do not offer ABM, 13% have opted out of GAS, and 12% do not offer humanities and social sciences (HUMSS). Private schools also attribute their failure to offer the pre-baccalaureate maritime strand (12%), aside from GAS (24%) and ABM (23%), to the lack of qualified teachers with specializations.
The issue of hiring teachers for specialized subjects is felt differently across provinces. In NCR, ABM (30%), GAS (26%), and STEM (11%) were not offered in schools due to the shortage of specialized teaching personnel (Table 11.c). In Ilocos Sur, schools were not able to teach pre-baccalaureate maritime (17%) and agri-fishery arts (11%) due to the same problem. In Eastern Samar, GAS (27%), HUMSS (19%), and ABM (17%) were not offered because of the same limitation. In Davao del Sur, schools shared that they opted not to open up STEM (19%), ABM (18%), and home economics (18%) tracks due to limited teachers.
Table 10.b: Proportion of Grade 10 Students Who Qualified for Educational Service Contracting Program but Did Not Take It Up for a Specific Reason
(%)
Reason %Process of accessing ESC is difficult or requires more time 24.4Private school quality not good compared with public school 5.7No private schools in the area 5.1Was not accepted into preferred private school 2.9Private school did not offer track that was of interest 1.2Others 67.3
ESC = educational service contracting.Source: Authors’ estimates based on Youth Education Investment and Labor Market Outcomes Survey results.
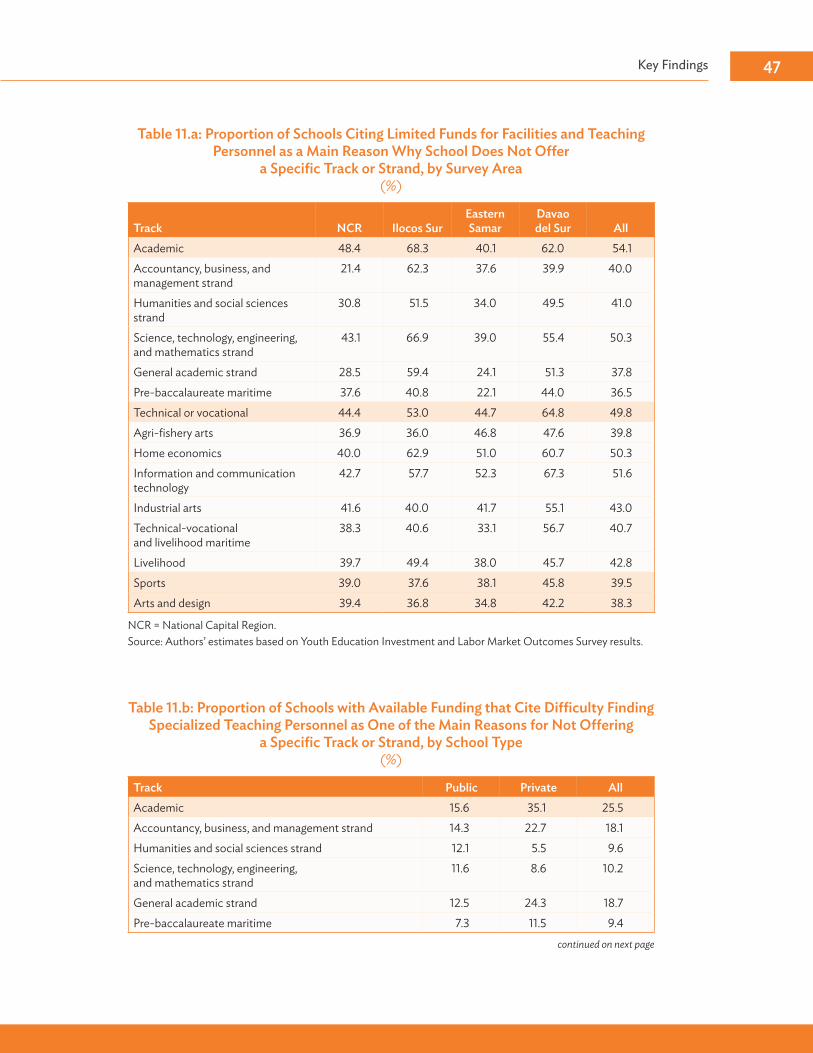
Key Findings 47
Table 11.a: Proportion of Schools Citing Limited Funds for Facilities and Teaching Personnel as a Main Reason Why School Does Not Offer
a Specific Track or Strand, by Survey Area (%)
Track NCR Ilocos SurEastern Samar
Davao del Sur All
Academic 48.4 68.3 40.1 62.0 54.1Accountancy, business, and management strand
21.4 62.3 37.6 39.9 40.0
Humanities and social sciences strand
30.8 51.5 34.0 49.5 41.0
Science, technology, engineering, and mathematics strand
43.1 66.9 39.0 55.4 50.3
General academic strand 28.5 59.4 24.1 51.3 37.8Pre-baccalaureate maritime 37.6 40.8 22.1 44.0 36.5Technical or vocational 44.4 53.0 44.7 64.8 49.8Agri-fishery arts 36.9 36.0 46.8 47.6 39.8Home economics 40.0 62.9 51.0 60.7 50.3Information and communication technology
42.7 57.7 52.3 67.3 51.6
Industrial arts 41.6 40.0 41.7 55.1 43.0Technical-vocational and livelihood maritime
38.3 40.6 33.1 56.7 40.7
Livelihood 39.7 49.4 38.0 45.7 42.8Sports 39.0 37.6 38.1 45.8 39.5Arts and design 39.4 36.8 34.8 42.2 38.3
NCR = National Capital Region.Source: Authors’ estimates based on Youth Education Investment and Labor Market Outcomes Survey results.
continued on next page
Table 11.b: Proportion of Schools with Available Funding that Cite Difficulty Finding Specialized Teaching Personnel as One of the Main Reasons for Not Offering
a Specific Track or Strand, by School Type (%)
Track Public Private AllAcademic 15.6 35.1 25.5Accountancy, business, and management strand 14.3 22.7 18.1Humanities and social sciences strand 12.1 5.5 9.6Science, technology, engineering, and mathematics strand
11.6 8.6 10.2
General academic strand 12.5 24.3 18.7Pre-baccalaureate maritime 7.3 11.5 9.4

youth education Investment and Labor Market outcomes in the philippines48
Track Public Private AllTechnical or vocational 12.0 7.6 9.8Agri-fishery arts 7.7 1.7 4.5Home economics 8.8 1.3 4.6Information and communication technology 9.2 3.4 6.3Industrial arts 7.3 1.6 4.2Technical-vocational and livelihood maritime 6.9 1.8 4.3Livelihood 8.4 4.7 6.5Sports 7.7 8.0 7.9Arts and design 7.7 8.3 8.0
Source: Authors’ estimates based on Youth Education Investment and Labor Market Outcomes Survey results.
Table 11.b continued
Table 11.c: Proportion of Schools with Available Funding that Cite Difficulty Finding Specialized Teaching Personnel as One of the Main Reasons
for Not Offering a Specific Track or Strand, by Survey Area (%)
Track NCR Ilocos SurEastern Samar
Davao del Sur All
Academic 35.1 18.1 21.3 17.8 25.5Accountancy, business, and management strand
30.4 5.8 16.5 17.6 18.1
Humanities and social sciences strand
7.0 1.5 19.1 17.4 9.6
Science, technology, engineering, and mathematics strand
10.6 0.0 15.8 19.2 10.2
General academic strand 25.5 6.8 26.8 3.4 18.7Pre-baccalaureate maritime 8.0 16.8 2.5 8.9 9.4Technical or vocational 6.3 11.7 7.6 18.2 9.8Agri-fishery arts 1.8 11.1 0.9 4.0 4.5Home economics 1.3 6.2 2.8 17.9 4.6Information and communication technology
3.1 10.8 2.3 12.3 6.3
Industrial arts 2.1 6.6 2.9 8.1 4.2Technical-vocational and livelihood maritime
1.7 6.3 0.9 12.0 4.3
Livelihood 2.5 10.0 6.2 11.6 6.5Sports 7.9 5.2 6.1 14.5 7.9Arts and design 7.9 5.3 6.1 15.3 8.0
NCR = National Capital Region.Source: Authors’ estimates based on Youth Education Investment and Labor Market Outcomes Survey results.
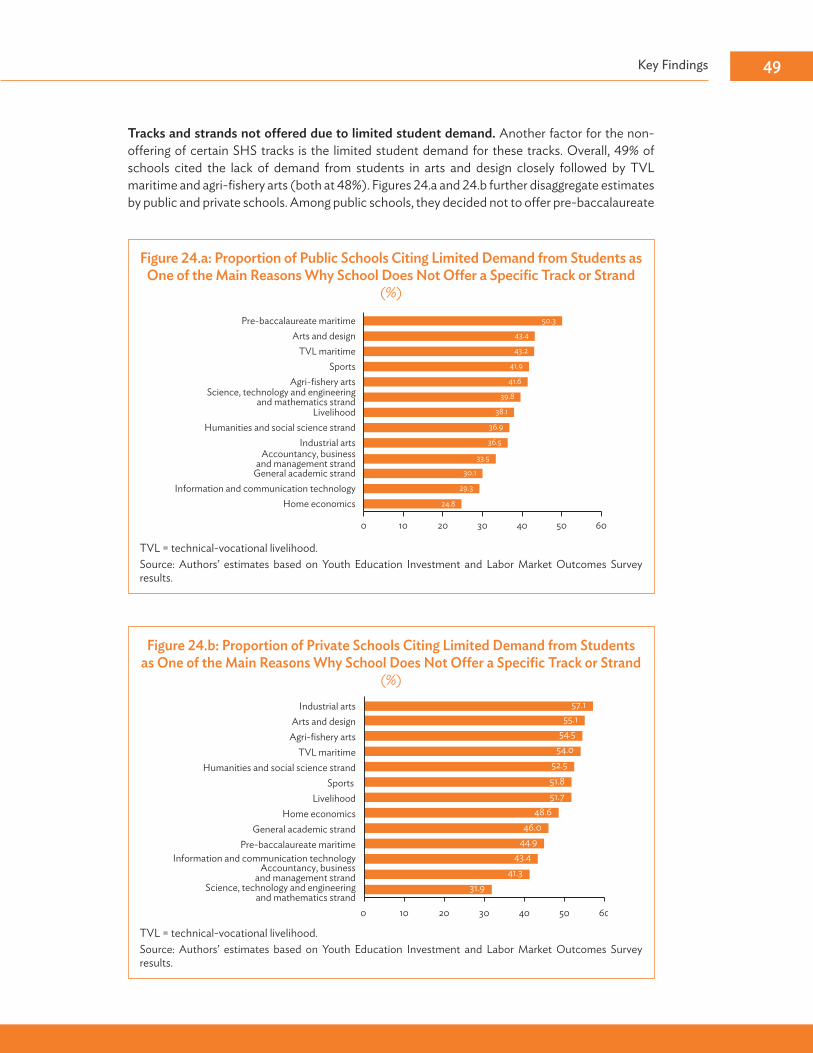
Key Findings 49
Tracks and strands not offered due to limited student demand. Another factor for the non-offering of certain SHS tracks is the limited student demand for these tracks. Overall, 49% of schools cited the lack of demand from students in arts and design closely followed by TVL maritime and agri-fishery arts (both at 48%). Figures 24.a and 24.b further disaggregate estimates by public and private schools. Among public schools, they decided not to offer pre-baccalaureate
Figure 24.a: Proportion of Public Schools Citing Limited Demand from Students as One of the Main Reasons Why School Does Not Offer a Specific Track or Strand
(%)
TVL = technical-vocational livelihood.Source: Authors’ estimates based on Youth Education Investment and Labor Market Outcomes Survey results.
24.8
29.3
30.1
33.5
36.5
36.9
38.1
39.8
41.6
41.9
43.2
43.4
50.3
0 10 20 30 40 50 60
Home economicsInformation and communication technology
General academic strand
Accountancy, businessand management strand
Industrial artsHumanities and social science strand
Livelihood
Science, technology and engineeringand mathematics strand
Agri-fishery artsSports
TVL maritimeArts and design
Pre-baccalaureate maritime
Figure 24.b: Proportion of Private Schools Citing Limited Demand from Students as One of the Main Reasons Why School Does Not Offer a Specific Track or Strand
(%)
TVL = technical-vocational livelihood.Source: Authors’ estimates based on Youth Education Investment and Labor Market Outcomes Survey results.
31.941.3
43.444.946.0
48.651.751.852.5
54.054.5
55.1
0 10 20 30 40 50 60
Science, technology and engineeringand mathematics strand
Accountancy, businessand management strand
Information and communication technologyPre-baccalaureate maritime
General academic strandHome economics
LivelihoodSports
Humanities and social science strandTVL maritime
Agri-fishery artsArts and design
57.1Industrial arts

youth education Investment and Labor Market outcomes in the philippines50
maritime (50%), arts and design (43%), and TVL maritime (43%) since they were not able to get enough students enrolling in these tracks. Private schools, on the other hand, opted not to open academic and industrial arts tracks (both at 57%) and arts and design track (55%) since there were very few students who expressed interest in the said tracks.
Impact of student interest on tracks offered. Student interest influences the schools’ track offering. In NCR, schools noted the lack of demand for academic (58%), HUMSS (57%), and home economics (53%) tracks as the reason for not offering these tracks.
In Ilocos Sur, schools decided not to offer arts and design (57%), sports (56%), and industrial arts (53.%) tracks due to limited student demand.
About 60% of schools in Eastern Samar did not offer pre-baccalaureate maritime, 50% opted out of TVL maritime, and 44% skipped the arts and design track.
Davao del Sur also observed the limited demand for agri-fishery arts (48%), pre-baccalaureate maritime (47%), and GAS (45%) and decided not to offer these tracks.
Differences in constraints confronted by public and private schools. Public and private schools face varying major constraints. The number of classrooms and adequacy of facilities is the major constraint among public schools (43%), followed by the lack of teachers (29%), and the application requirements to be able to offer different SHS tracks (18%) (Table 12.a). Among private schools, limited student enrollment is considered as the top constraint (33%), followed by the application requirements to be able to offer different SHS tracks (13%), and number of classrooms and adequacy of facilities (13%).
The number of classrooms and adequacy of facilities remains to be in the top three major constraints cited by the schools, followed by limited student enrollment and the lack of teachers (Table 12.b). NCR reported limited student enrollment (35%), lack of classrooms and inadequacy of school facilities (22%), and the lack of application requirements to offer SHS tracks (16%) to be the major constraints for schools. In Eastern Samar, schools noted the lack of application requirements to be
Table 12.a: Proportion of Schools Citing a Specific Issue as a Major Constraint for the School, by School Type
(%)
Issue or Type of Constraint Public Private AllNumber of classrooms and adequacy of facilities 43.1 12.7 27.8 Limited student enrollment 8.5 32.9 20.8 Lack of teachers 28.6 7.5 18.0 Application requirements to be able to offer different SHS tracks
17.5 13.2 15.3
High student enrollment 6.6 11.4 9.0 Schedule of disbursement of subsidies for voucher or ESC recipients
3.0 4.1 3.6
ESC application requirements 2.5 2.8 2.7 Others 5.4 3.5 4.4
ESC = educational service contracting, SHS = senior high school.Source: Authors’ estimates based on Youth Education Investment and Labor Market Outcomes Survey results.

Key Findings 51
Table 12.b: Proportion of Schools Citing a Specific Issue as a Major Constraint for the School, by Survey Area
(%)
Issue or Type of Constraint NCR Ilocos SurEastern Samar
Davao del Sur All
Limited student enrollment 35.3 19.9 – 10.0 20.8Number of classrooms and adequacy of facilities 21.7 42.6 23.5 23.5 27.8Application requirements to be able to offer different SHS tracks 16.1 9.5 29.2 6.1 15.3High student enrollment 15.4 3.7 3.7 8.0 9.0Lack of teachers 5.1 42.2 11.4 18.2 18.0ESC application requirements 4.9 0.4 3.3 – 2.7Schedule of disbursement of subsidies for voucher or ESC recipients 4.5 1.2 6.0 2.1 3.6Others 0.8 1.9 2.2 21.2 4.4
– = magnitude equals zero, ESC = educational service contracting, NCR = National Capital Region, SHS = senior high school.Source: Authors’ estimates based on Youth Education Investment and Labor Market Outcomes Survey results.
able to offer different SHS tracks as their key issue (29%), followed by the need for more classrooms and better facilities (24%) and more teachers (11%). Ilocos Sur recorded the limited number of classrooms (43%) as its top constraint while Davao del Sur cited inadequacy of facilities (24%). Ilocos Sur also listed the lack of teachers (42%) and limited student enrollment (20%) as other key concerns, while schools from Davao del Sur shared that the lack of classrooms and facilities (24%) as well as the limited number of teachers (18%) are a major problem.
School transfers
Number of school transferees. Grade 11 has the highest proportion of transferees at 41%, and an even larger percentage of transferees is expected the following school year (2017–2018) as 61% of current grade 10 students have expressed plans of transferring schools the following school year (Figure 25).
More students from urban schools reported to have transferred or have plans to transfer schools compared with those in rural schools. On the other hand, the proportion of students reported to have transferred is higher among those in private schools, while the proportion is higher in public schools for those who are planning to transfer (Table 13).
Preferred track not offered in previous school is the most cited reason for transferring among grade 11 students, while for grades 9 and 10, it is mainly the parents’ decision for reasons unknown to the student. When asked to cite the reason why they transferred schools, 54% of grade 11 students explained that their preferred track was not being offered in their previous school. On the other hand, 49% of grade 9 and 54% of grade 10 students, said that they did not know the parents’ reason for transferring schools. Results also show the importance of students’ or parents’ preference for better school facilities and non-curricular

youth education Investment and Labor Market outcomes in the philippines52
activities as this was the second most popular reason among transferees for all three grade levels. Financial consideration is also an issue as at least a third of transferees in grades 9 and 10 cited this among the reasons.
Furthermore, “parents’ decision for reasons unknown to the student” and “preference for better facilities and non-curricular activities” are high on the list of reasons for transferring cited by students both in private and public schools, and urban and rural areas. However, “too high school-related expense” seems to be a more common issue for those in public schools and those in rural areas, compared to those private and urban schools. “Better facilities and non-curricular activities” is a more common reason for those in private schools. Among grade 11 transferees, “preferred track not being offered in previous school” is equally a concern both for those in public and private schools as well as for those in urban and rural areas.
Figure 25: Distribution of Transferees and Would-Be Transferees for Each Grade Level
(%)
Source: Authors’ estimates based on Youth Education Investment and Labor Market Outcomes Survey results.
10.7 10.9 9.5
61.4
40.9
12.4
0
10
20
30
40
50
60
70
Transferred from another school Plans to transfer
Prop
ortio
n of
stud
ents
(%
)
Grade 9 Grade 10 Grade 11
Table 13: Distribution of Transferees and Would-Be Transferees, by Locality and School Type
(%)
Transferred from another school Plans to transfer
Location Type Urban 21.0 29.1 Rural 12.3 18.2 School TypePublic 13.3 30.9 Private 29.8 23.6
Source: Authors’ estimates based on Youth Education Investment and Labor Market Outcomes Survey results.

Key Findings 53
Reasons for transferring schools according to students. Among those with plans to transfer, “preferred track not offered,” “parents’ decision for reasons unknown to the student,” and “preference for better facilities and non-curricular activities” are the top reasons for planning to transfer. When asked to cite the three major reasons why they plan to transfer schools, grade 10 students identified “preferred track not offered” (59%), “wants better facilities and non-curriculum activities” (47%), and “parents’ decision for reasons unknown to the student” (38%)
Table 14.a: Proportion of Students Citing a Specific Reason for Transferring from Another School, by Grade Level
(%)
Reason Grade 9 Grade 10 Grade 11Top-up expenses (of previous school) are unexpectedly too high, or the voucher amount, ESC subsidies, and/or other scholarship subsidies are unexpectedly not enough to cover all fees in previous school
15.6 21.3 9.8
Expected that school-related expenses (of previous school) are high but can no longer afford
32.6 34.8 14.0
Cannot cope with academic requirements of previous school 15.3 17.9 12.4 Feeling of unbelongingness in previous school 9.2 6.6 2.8 Teachers in previous school did not have technical expertise 4.4 15.0 7.0 Previous school did not offer student’s preferred track 14.3 12.6 54.4 Want to move to a school that offers better facilities and non-curriculum activities
39.8 26.5 47.6
Parents’ or guardians’ reason for wanting to move is unknown 48.5 54.1 44.7 Present school is near home 22.9 21.4 18.9 Other 13.6 11.5 6.6
ESC = education service contracting.Source: Authors’ estimates based on Youth Education Investment and Labor Market Outcomes Survey results.
Table 14.b: Proportion of Students Citing a Specific Reason for Transferring from Another School, by Grade Level and School Type
(%)
ReasonGrade 9 Grade 10 Grade 11
Public Private Public Private Public PrivateTop-up expenses (of previous school) are unexpectedly too high, or the voucher amount, ESC subsidies, and/or other scholarship subsidies are unexpectedly not enough to cover all fees in previous school
14.9 17.6 22.8 16.6 10.1 9.7
Expected that school-related expenses (of previous school) are high but can no longer afford
37.8 18.6 41.7 14.0 26.9 10.4
Cannot cope with academic requirements of previous school
16.6 12.1 16.1 23.4 8.0 13.6
continued on next page
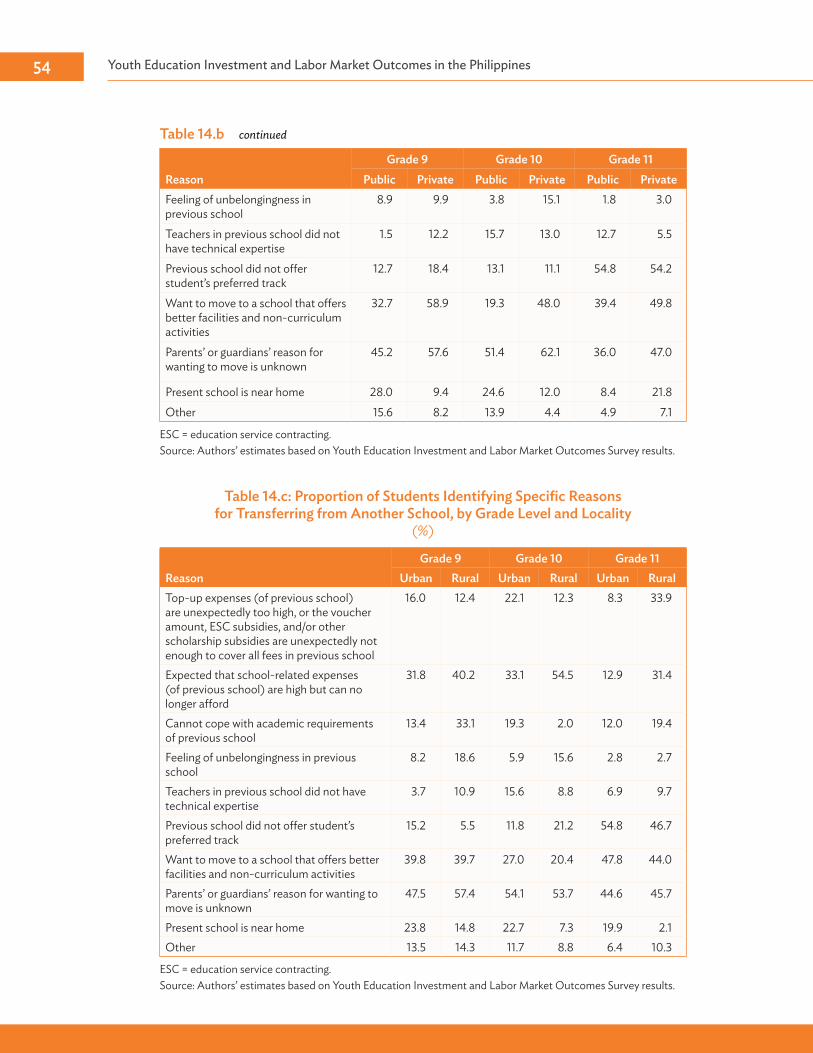
youth education Investment and Labor Market outcomes in the philippines54
Table 14.c: Proportion of Students Identifying Specific Reasons for Transferring from Another School, by Grade Level and Locality
(%)
ReasonGrade 9 Grade 10 Grade 11
Urban Rural Urban Rural Urban RuralTop-up expenses (of previous school) are unexpectedly too high, or the voucher amount, ESC subsidies, and/or other scholarship subsidies are unexpectedly not enough to cover all fees in previous school
16.0 12.4 22.1 12.3 8.3 33.9
Expected that school-related expenses (of previous school) are high but can no longer afford
31.8 40.2 33.1 54.5 12.9 31.4
Cannot cope with academic requirements of previous school
13.4 33.1 19.3 2.0 12.0 19.4
Feeling of unbelongingness in previous school
8.2 18.6 5.9 15.6 2.8 2.7
Teachers in previous school did not have technical expertise
3.7 10.9 15.6 8.8 6.9 9.7
Previous school did not offer student’s preferred track
15.2 5.5 11.8 21.2 54.8 46.7
Want to move to a school that offers better facilities and non-curriculum activities
39.8 39.7 27.0 20.4 47.8 44.0
Parents’ or guardians’ reason for wanting to move is unknown
47.5 57.4 54.1 53.7 44.6 45.7
Present school is near home 23.8 14.8 22.7 7.3 19.9 2.1 Other 13.5 14.3 11.7 8.8 6.4 10.3
ESC = education service contracting.Source: Authors’ estimates based on Youth Education Investment and Labor Market Outcomes Survey results.
ReasonGrade 9 Grade 10 Grade 11
Public Private Public Private Public PrivateFeeling of unbelongingness in previous school
8.9 9.9 3.8 15.1 1.8 3.0
Teachers in previous school did not have technical expertise
1.5 12.2 15.7 13.0 12.7 5.5
Previous school did not offer student’s preferred track
12.7 18.4 13.1 11.1 54.8 54.2
Want to move to a school that offers better facilities and non-curriculum activities
32.7 58.9 19.3 48.0 39.4 49.8
Parents’ or guardians’ reason for wanting to move is unknown
45.2 57.6 51.4 62.1 36.0 47.0
Present school is near home 28.0 9.4 24.6 12.0 8.4 21.8 Other 15.6 8.2 13.9 4.4 4.9 7.1
ESC = education service contracting.Source: Authors’ estimates based on Youth Education Investment and Labor Market Outcomes Survey results.
Table 14.b continued
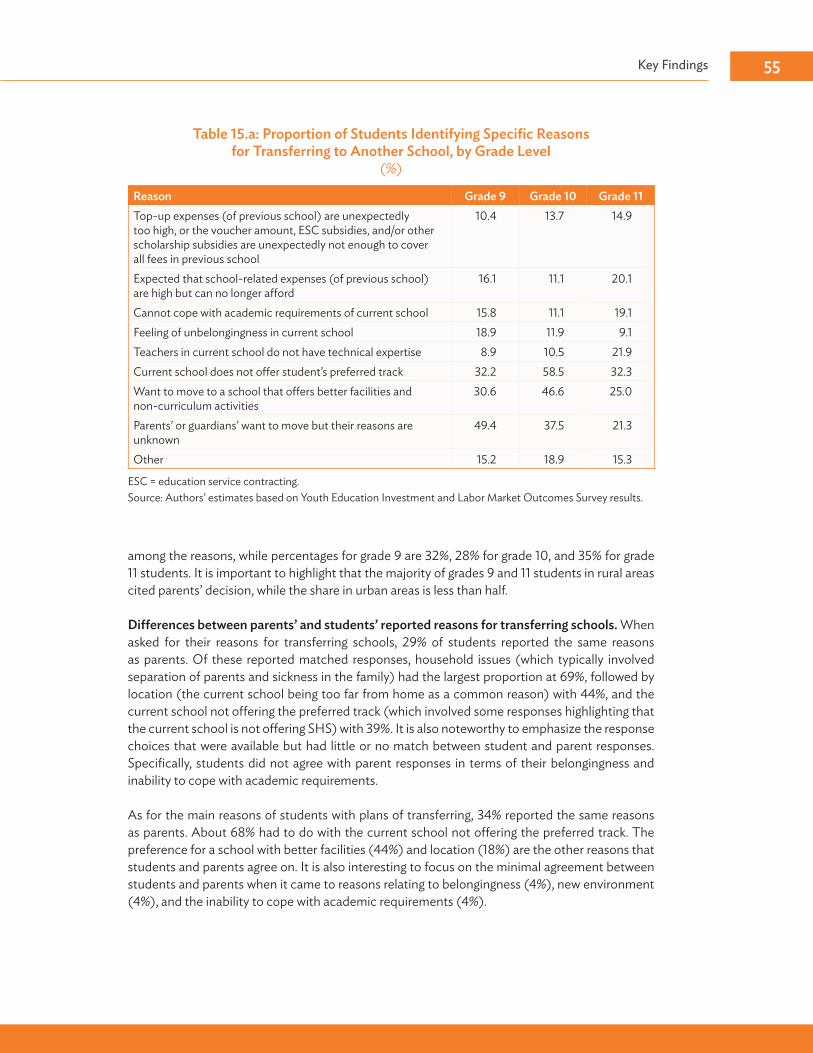
Key Findings 55
Table 15.a: Proportion of Students Identifying Specific Reasons for Transferring to Another School, by Grade Level
(%)
Reason Grade 9 Grade 10 Grade 11Top-up expenses (of previous school) are unexpectedly too high, or the voucher amount, ESC subsidies, and/or other scholarship subsidies are unexpectedly not enough to cover all fees in previous school
10.4 13.7 14.9
Expected that school-related expenses (of previous school) are high but can no longer afford
16.1 11.1 20.1
Cannot cope with academic requirements of current school 15.8 11.1 19.1 Feeling of unbelongingness in current school 18.9 11.9 9.1 Teachers in current school do not have technical expertise 8.9 10.5 21.9 Current school does not offer student’s preferred track 32.2 58.5 32.3 Want to move to a school that offers better facilities and non-curriculum activities
30.6 46.6 25.0
Parents’ or guardians’ want to move but their reasons are unknown
49.4 37.5 21.3
Other 15.2 18.9 15.3
ESC = education service contracting.Source: Authors’ estimates based on Youth Education Investment and Labor Market Outcomes Survey results.
among the reasons, while percentages for grade 9 are 32%, 28% for grade 10, and 35% for grade 11 students. It is important to highlight that the majority of grades 9 and 11 students in rural areas cited parents’ decision, while the share in urban areas is less than half.
Differences between parents’ and students’ reported reasons for transferring schools. When asked for their reasons for transferring schools, 29% of students reported the same reasons as parents. Of these reported matched responses, household issues (which typically involved separation of parents and sickness in the family) had the largest proportion at 69%, followed by location (the current school being too far from home as a common reason) with 44%, and the current school not offering the preferred track (which involved some responses highlighting that the current school is not offering SHS) with 39%. It is also noteworthy to emphasize the response choices that were available but had little or no match between student and parent responses. Specifically, students did not agree with parent responses in terms of their belongingness and inability to cope with academic requirements.
As for the main reasons of students with plans of transferring, 34% reported the same reasons as parents. About 68% had to do with the current school not offering the preferred track. The preference for a school with better facilities (44%) and location (18%) are the other reasons that students and parents agree on. It is also interesting to focus on the minimal agreement between students and parents when it came to reasons relating to belongingness (4%), new environment (4%), and the inability to cope with academic requirements (4%).

youth education Investment and Labor Market outcomes in the philippines56
unexpected events experienced by Households
Impact of unexpected events on households’ education-related decisions. About 45% of sampled households reported that unexpected events affected their education-related decisions. The effect of an unexpected event seems to be most apparent in Eastern Samar (86%), which could be attributed to a relatively recent calamity, followed by Davao del Sur (49%), NCR (42%), and Ilocos Sur (29%) (Figure 26). In terms of locality, generally, more rural households (56%) than urban households (43%) report that unexpected events affected education-related decisions. This trend applies to Davao del Sur (51% rural vs. 47% urban) and Ilocos Sur (38% rural vs. 14% urban) as well. In Eastern Samar, while both rural and urban households posted proportions greater than 80%, the proportion of urban households (89%) is slightly higher than that of rural households (83%).10
10 In the survey instrument used in this study, unexpected events or shocks include the following: (i) drought, flood, or typhoon; (ii) crop disease or pest; (iii) livestock loss; (iv) failure of household-operated business; (v) steep crop price changes; (vi) steep food price changes; (vii) sudden increase of school-related costs; (viii) severe water shortage or electricity problems; (ix) restricted access to markets; (x) chronic or severe illness or accident of household member; (xi) death of a household member; (xii) break-up of the household; (xiii) bushfire or fire; (xiv) dwelling damaged or destroyed; (xv) unplanned pregnancy; (xvi) lawsuits, etc.
Table 15.b: Proportion of Students Identifying Specific Reasons for Transferring to Another School, by Grade Level and Locality
(%)
ReasonGrade 9 Grade 10 Grade 11
Urban Rural Urban Rural Urban RuralTop-up expenses (of previous school) are unexpectedly too high, or the voucher amount, ESC subsidies, and/or other scholarship subsidies are unexpectedly not enough to cover all fees in previous school
10.7 7.9 14.2 7.6 15.1 10.2
Expected that school-related expenses (of previous school) are high but can no longer afford
15.8 18.9 11.1 10.0 20.3 16.0
Cannot cope with academic requirements of current school
15.9 14.9 10.6 18.1 19.4 11.9
Feeling of unbelongingness in current school 18.3 23.7 11.3 19.7 9.1 10.2 Teachers in current school do not have technical expertise
8.5 12.2 10.3 12.8 22.3 13.1
Current school does not offer student’s preferred track
31.7 36.5 58.0 64.9 32.7 24.0
Want to move to a school that offers better facilities and non-curriculum activities
30.3 33.2 45.7 59.3 22.6 72.8
Parents’ or guardians’ want to move but their reasons are unknown
45.7 79.2 37.0 44.2 19.5 56.8
Other 17.1 – 19.9 6.3 15.7 7.9
– = magnitude equals zero, ESC = education service contracting.Source: Authors’ estimates based on Youth Education Investment and Labor Market Outcomes Survey results.

Key Findings 57
Figure 26: Proportion of Households Reporting That an Unexpected Event Affected Education-Related Decisions, by Survey Area
(%)
NCR = National Capital Region.Source: Authors’ estimates based on Youth Education Investment and Labor Market Outcomes Survey results.
85.5
48.842.0
28.8
44.6
0
10
20
30
40
50
60
70
80
90
EasternSamar
Davaodel Sur
NCR Ilocos Sur All
Similarly, 46% of households state that unexpected events will continue to affect education-related decisions in the following year. The response is still highest for Eastern Samar with 54% of households reporting the persistence of unexpected events in education-related decisions for the next year, followed by NCR (47%), Davao del Sur (39%), and Ilocos Sur (17%) (Figure 27). Overall, there does not seem to be much difference between rural and urban households regarding whether or not unexpected events will still affect education-related decisions for Eastern Samar
Figure 27: Proportion of Households Reporting That an Unexpected Event Will Still Affect Education-Related Decisions in the Following Year, by Survey Area
(%)
NCR = National Capital Region.Source: Authors’ estimates based on Youth Education Investment and Labor Market Outcomes Survey results.
0
10
20
30
40
50
60
EasternSamar
Davaodel Sur
NCR Ilocos Sur All
54.3
46.8
39.1
16.7
45.6

youth education Investment and Labor Market outcomes in the philippines58
households. For Davao del Sur and Ilocos Sur, more rural households believe that unexpected events will still affect decisions in the following year.
Insights from the Currently employed
Perceived usefulness of formal education to current work. Overall, the majority of adult household respondents find their formal education to be either useful or very useful in their current primary work. In particular, about 26% find it very useful and 39% find it useful, while only a small portion (14%) think it is not useful at all (Figure 28). The same trend applies across locality and areas except in Eastern Samar, where more workers find their formal education to be very useful in their current primary work (40%).
Many household respondents think they are overqualified for their current job functions, with percentages ranging from 46% to 58% across provinces (Figure 29).
On the other hand, about a quarter of workers feel they are educationally underqualified for their current job (Figure 30). This is lowest in Ilocos Sur (21%), while the rest of the areas have shares of more than 25%.
On average, roughly 30% of workers are in their desired career (Figure 31). This is highest in Davao del Sur (34%) and lowest in Eastern Samar (22%).
The majority of those with higher educational attainment reported finding themselves in a career they desire. On average, only 33% of technical and vocational education and training graduates and 42% of college graduates find themselves in their desired career, while 77% of postgraduate graduates claim that their current work is the career they desire (Figure 32). The same pattern
Figure 28: Households’ Assessment of Usefulness of Formal Education in Current Primary Work
(%)
Source: Authors’ estimates based on Youth Education Investment and Labor Market Outcomes Survey results.
13.5
21.1
38.5
26.2
0.6 0
5
10
15
20
25
30
35
40
45
Not useful at all Somewhat useful Useful Very useful Respondent had no education

Key Findings 59
Figure 29: Proportion of Workers Who Think Their Educational Attainment Exceeds the Minimum Required for Their Current Job, by Survey Area and Locality
(%)
NCR = National Capital Region.Source: Authors’ estimates based on Youth Education Investment and Labor Market Outcomes Survey results.
47.6 47.6
54.2
46.349.2
57.5 56.3 56.8
45.848.6 47.1
0
20
40
60
Urban Rural AllNCR Ilocos Sur Eastern Samar Davao del Sur
Figure 30: Proportion of Workers Who Think Their Educational Attainment is Below the Minimum Level for Their Current Job, by Survey Area
(%)
NCR = National Capital Region.Source: Authors’ estimates based on Youth Education Investment and Labor Market Outcomes Survey results.
0 10 20 30
25.3NCR
20.7Ilocos Sur
26.4EasternSamar
27.6Davaodel Sur
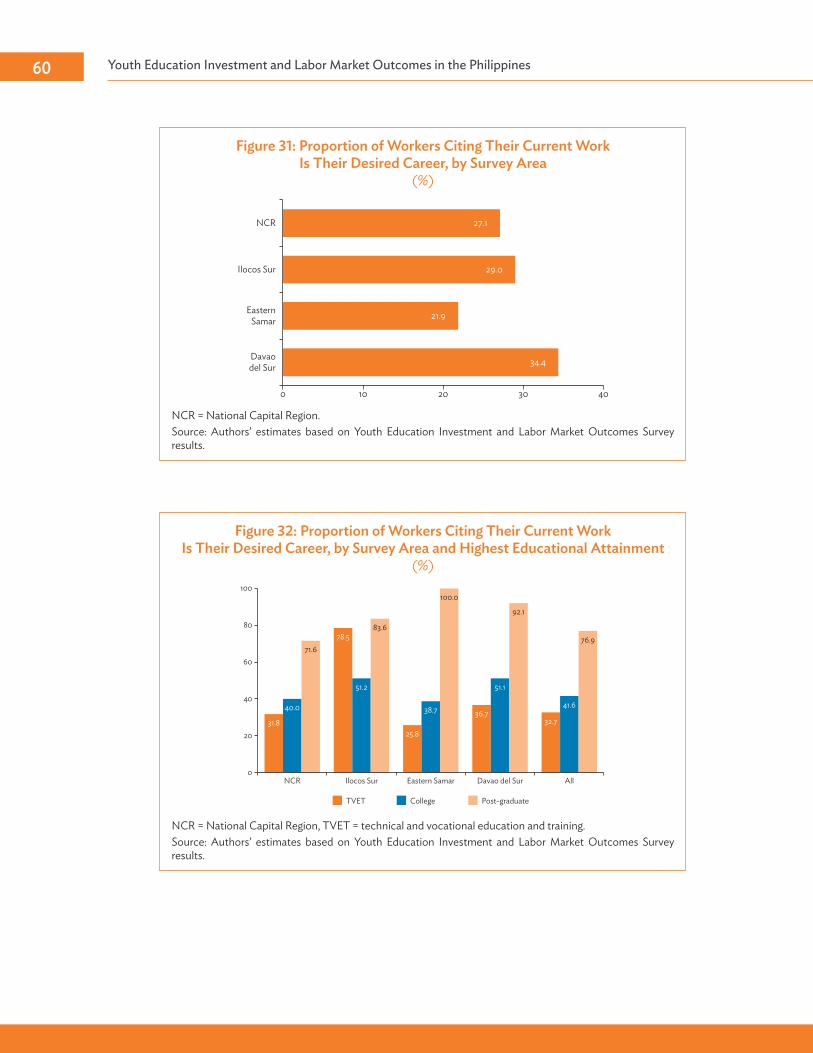
youth education Investment and Labor Market outcomes in the philippines60
Figure 31: Proportion of Workers Citing Their Current Work Is Their Desired Career, by Survey Area
(%)
NCR = National Capital Region.Source: Authors’ estimates based on Youth Education Investment and Labor Market Outcomes Survey results.
0 10 20 4030
27.1NCR
29.0Ilocos Sur
21.9EasternSamar
34.4Davaodel Sur
Figure 32: Proportion of Workers Citing Their Current Work Is Their Desired Career, by Survey Area and Highest Educational Attainment
(%)
NCR = National Capital Region, TVET = technical and vocational education and training.Source: Authors’ estimates based on Youth Education Investment and Labor Market Outcomes Survey results.
31.8
78.5
25.8
36.740.0
51.2
38.7
51.1
71.6
83.6
100.0
92.1
0
20
40
60
80
100
NCR Ilocos Sur Eastern Samar Davao del Sur
TVET College Post-graduate
32.7
41.6
76.9
All

Key Findings 61
can be observed in all areas except Ilocos Sur, where a large share of technical and vocational education and training graduates (79%) reported being in their desired career. Also noteworthy is that all postgraduates in Eastern Samar believe that they are in their desired career.
Many workers in high-level jobs claim that they are in their desired career. Professionals have a significantly higher share of such workers (almost two-thirds) compared with managers, technicians and associate professionals, and members of the armed forces. The same trend is true across areas except for Eastern Samar, where a tiny share of clerical support workers and those in the armed forces claimed being in their desired career. The unusually large share (71%) of armed forces members in Davao del Sur who say that they are in their desired career is also worth noting.
About two in five workers (41%) in the top income quintile also reported being in careers they desire (Figure 33). Workers in the upper 40% of annual income distribution have higher shares of workers in their desired career than those in the lower 60%.
Figure 33: Proportion of Workers Citing Their Current Work Is Their Desired Career, by Income Quintile
(%)
Source: Authors’ estimates based on Youth Education Investment and Labor Market Outcomes Survey results.
23.7
16.9
19.9
31.4
40.8
0 10 20 30 40 50
Quintile 1
Quintile 2
Quintile 3
Quintile 4
Quintile 5
62
IvSummary
The introduction of the Senior High School program in the Philippines is the latest in a series of reform initiatives comprising the multiphase implementation of the K to 12 Basic Education Program, which is meant to better prepare graduates for both postsecondary education and employment. SHS requires students and their families to new and make additional decisions about educational investment and potential career planning. These decisions include which SHS tracks to take and they must be considered 2 years before the completion of basic education. Although the CGPs for SHS have been instituted to help guide students and their families through this process, there is a need to look more closely and systematically at how such critical educational decisions, which can impact long-term labor market outcomes in the Philippines, are made.
These considerations were explored through the Youth Education Investment and Labor Market Outcomes Survey (YEILMOS), conducted by ADB and DepEd. It surveyed a total of 238 schools, 3,172 students, and 2,819 households to gather baseline data on factors that influence youth education investment decisions and career expectations, and to explore how such choices affect subsequent labor market outcomes.
The aim of the YEILMOS was to inform the policy and program initiatives that will help students and their families make informed educational decisions and set out effective career plans, through CGPs for SHS. This section therefore highlights selected survey findings and puts forward related policy implications grouped into the following clusters: (i) insights from those currently employed, (ii) factors that students and their families take into account when making educational investment and career planning decisions, (iii) primary sources of information when making educational investment and career planning decisions, and (iv) other contextual considerations and resource complementarity.
The first cluster summarizes survey findings about the working population’s employment outcomes and how they are aligned with the educational investments made by those currently employed. The extend to which their education investments are reciprocated with commensurate socioeconomic returns could be incorporated into the design of programs that aim to better align educational investment with employment outcomes for the younger generation. The second and third clusters directly answer the study’s main research questions on factors that shape educational investment and career planning decisions and sources of career information. These topics provide information on whether educational and career planning decisions are well-informed, while also suggesting ways to ensure that there is a seamless flow of adequate information that can better inform such decisions. The fourth cluster addresses constraints that schools, students, and their families confront when making educational and career decisions. Identifying bottlenecks and how they could be addressed will place Filipino youths and their families in a good position to make optimal decisions with the support of schools.

Summary 63
Insights from Currently employed Adults• Among those currently employed, many adults interviewed as part of the YEILMOS
indicated that their education was at least useful in their current employment, but that they were also overqualified for their current jobs. This points to a misalignment of credentials and jobs. It is clear that higher education is important to future employment. However, the quality of jobs offered in the Philippines also needs to be examined. Matching the quality, level, and nature of education to the jobs available, both in the present day and in the future, requires a more nuanced policy that ideally involves all sectors of society. Employers, in particular, should be involved in crafting qualification standards and career guidance information to deliver better labor market outcomes.11
• Those with higher education and earning higher incomes, perhaps not surprisingly report higher job satisfaction and better alignment of credentials to job description. These people should be further surveyed so that lessons can be derived from their experiences, particularly in the ways they leverage their education, their incomes, and presumably their social networks to access better employment opportunities.
Considerations in Making educational Investment and Career planning Decisions
• Many SHS students in the Philippines opt to take the academic track, with the expectation of proceeding to college after high school. Parents share the same expectations for choosing tracks and planning for college. Policy initiatives should endeavor to meet student and parental expectations by ensuring access to relevant information on track choices and postsecondary options. Such policy initiatives should aim to shift mindsets and be able to demonstrate to students and their parents the viability of tracks other than the academic one. They should support alternative tracks and postsecondary options by providing information on economic trends and labor market outcomes.
• In terms of employment, traditional professions are still most desired by both parents and students. Many parents also expect their children to stay in the city and be earning above the minimum wage by the age of 30. These expectations need to be aligned with recent labor market trends of automation, artificial intelligence, rapid innovation, job mobility, and government development targets. The government must design and implement policy initiatives that explore how these expectations, particularly those of the parents, can be better informed.
• Personal attributes and skills, availability of educational options, household issues, and financial considerations are usually cited as the reasons for choosing an SHS track, a college major, or a school. While schools and CGPs can influence decisions related to personal attributes and skills, they may have difficulty addressing the other three reasons, which are all driven by external factors. However, this should not preclude the implementation of policy initiatives that meet these macroeconomic considerations. Career guidance activities should give more emphasis on financial aid opportunities and educational options beyond SHS. Parental involvement in career guidance should be increased to minimize household issues that prevent students from successfully transitioning to further education or desired careers.
11 There are policies that act on labor demand, i.e., policies that influence what types of jobs are created. These lie outside the scope of the education sector and are outside the scope of this study.
youth education Investment and Labor Market outcomes in the philippines64
• Economic shocks and natural disasters are reported to continually affect education decisions. Resilience initiatives therefore need to be explored. As in the case of Eastern Samar, these initiatives cannot be successfully implemented by one entity alone and require a whole-of-society approach.
primary Sources of Information When Making educational Investment and Career planning Decisions
• Immediate family members and social circles are frequently cited by students and parents as the main influencers when discussing education choices and career planning. For schools, the primary sources of information on further education are the universities and/or tertiary education institutions. Family members, especially parents, and social circles therefore need to be factored into career guidance activities. Schools, meanwhile, need to build strong partnerships with tertiary institutions and share information on accessibility and standards to help students transition to their desired postsecondary option.
• When asked about what information they received (or hoped to receive) when helping to choose careers for their children, parents cited information on courses or occupations that matched the skills and interests of their children. This points to a need for policy initiatives that would help broaden the minds of parents by offering information that takes into account labor market trends and possible future shifts in employment demand.
• While the National Career Assessment Examination is seen as an important and objective tool to help students identify their true skills and interests, it is not used optimally. The benefits of the examination should be given more prominence and schools should endeavor to adequately explain its results to students, thereby providing a broader perspective on positive personal attributes and career prospects.
• In CGPs, details on postsecondary outcomes (e.g., tertiary education options or employment trends) and financial aid are often sidelined in favor of information based on personal aspirations or preferences. Clearly, sound knowledge of tertiary education and/or future jobs could help guide students in their choice of SHS tracks. As such, policy initiatives should balance and respond to both presently held aspirations and future labor market demand. Information on financial aid, which is cited as an important consideration in plans to pursue postsecondary education, should be widely disseminated and made easily available.
• Career guidance activities that require significant resources and access to employers or industry groups are more readily available in private and urban schools. Policy initiatives should endeavor to address these resource shortfalls and access gaps to ensure that public and rural schools are not left behind.
other Contextual Considerations and resource Complementarity
• Throughout the Philippines, financial aid opportunities for education, such as the educational-service-contracting schools and vouchers, are not accessed by students because of a lack of information or perceived high barriers. It is evident that these informational gaps need to be bridged. Policy measures, such as informing parents

Summary 65
of actual costs of college and helping them with the application process for financial aid, have improved enrollment levels and longevity of schooling in other countries and should be explored in the Philippines.
• Many students cite the availability of certain SHS tracks as the primary reason for transferring schools. However, since changing schools could be detrimental to a student’s welfare by disrupting his or her momentum and/or diminishing his or her sense of belonging, school transfers should be carefully examined. Ideally, schools should endeavor to provide as much variety as possible in the SHS tracks offered to accommodate their students. To maximize resources, however, the government should pilot initiatives that explore resource complementarity between and among public and private and rural and urban schools. One such initiative is the clustering of schools to ensure wide reach and high quality. Additionally, support for transferring students should also be strengthened to boost educational continuity and ensure a sense of belonging.
• A school’s ability to offer different SHS tracks is affected by various factors such as lack of funds, difficulty in finding specialized teaching personnel, limited student demand, etc. Survey data demonstrate a reduced ability to offer all tracks for public schools compared to private schools, and for rural schools compared to urban schools. There is a need to develop policies for complementarity and resource-sharing between school types and localities to ensure that choice is maximized for all students. The first step is to provide better data on student demand and mobility as well as teaching personnel requirements, so that adequate funds can be allocated across the education system.
potential Areas for Future researchThe YEILMOS was designed to collect baseline information on factors that shape youth education investment decisions and career expectations. It is intended to provide well-founded input for education policy, particularly efforts to improve existing CGPs. Through follow-up data collection activities, this objective may be expanded to examine how the implementation of the K to 12 Basic Education Program can be further enhanced. For instance, tracking baseline survey respondents after they complete SHS, will allow researchers to gauge how SHS track preferences affect student performance in postsecondary education. Do college students who took the academic track in SHS tend to perform better than those who took nonacademic tracks? Are those who took nonacademic tracks any better equipped with practical skills that increase their likelihood of getting jobs right after SHS? With recent statistics suggesting that a non-trivial number of Filipino students drop out of secondary school before completing it, tracking of students over time and monitoring drop-out behavior may be especially important in helping future SHS students to choose tracks or schools that better match their preferences, which may ultimately reduce drop-out rates. In addition, future data-collection activities may test different models for providing career guidance information. Results from such an analytical exercise may be used to develop ways to standardize and consistently deliver information that is relevant depending on each student’s interests, skills, and employment aspirations as well as desired labor market outcomes for the Philippines. Furthermore, data-collection activities may be designed to test how programs that provide financial assistance to students and their families evolve over time as well as exploring how such changes to such programs affect education outcomes and fulfill labor market demand.

66
SECT
ION
A1:
IDEN
TIFI
CATI
ON
PA
RTIC
ULA
RS1.
PRO
VIN
CE
NA
ME
AN
D C
OD
E:2.
MU
NIC
IPA
LITY
NA
ME
AN
D C
OD
E:3.
BARA
NG
AY
NA
ME
AN
D C
OD
E:4.
URB
AN
/RU
RAL
5. SC
HO
OL
NA
ME
AN
D S
CH
OO
L ID
:6.
SC
HO
OL
AD
DRE
SS (L
OC
ATI
ON
NO
TE):
7. N
AM
E O
F PR
INC
IPA
L:8.
PRI
NC
IPA
L PH
ON
E N
UM
BER:
9. A
LTER
NA
TIVE
PH
ON
E N
UM
BER:
10. G
PS C
OO
RDIN
ATE
S FO
R SC
HO
OL
N=1
S=2
MLA
T.
LON
G.
SECT
ION
A2:
IDEN
TIFI
CATI
ON
PA
RTIC
ULA
RS1.
NA
ME
OF
ENU
MER
ATO
R: 9
. N
AM
E O
F SU
PERV
ISO
R:2.
EN
UM
ERA
TOR
CO
DE:
10. S
UPE
RVIS
OR
CO
DE:
3. E
NU
MER
ATO
R SI
GN
ATU
RE:
11. S
UPE
RVIS
OR
SIG
NA
TURE
:4.
D
ATE
OF
INTE
RVIE
W:
12. D
ATE
OF
VERI
FIC
ATI
ON
:5.
TIM
E O
F IN
TERV
IEW
(STA
RT):
13. C
ALL
BAC
K N
EED
ED:
6.
TIM
E O
F IN
TERV
IEW
(EN
D):
7. S
TATU
S O
F Q
UES
TIO
NN
AIR
E:14
. STA
TUS
OF
QU
ESTI
ON
NA
IRE:
YOU
TH E
DU
CATI
ON
INVE
STM
ENT
AN
D L
ABO
R M
ARK
ET O
UTC
OM
ES S
URV
EY
SCH
OO
L Q
UES
TIO
NN
AIR
E
D
REM
ARK
S BY
SU
PERV
ISO
R:8.
R
EMA
RKS
BY E
NU
MER
ATO
R:
1 = Y
ES
2 =
NO
1= Q
UES
TIO
NN
AIR
E CO
MPL
ETED
2
= Q
UES
TIO
NN
AIR
E PA
RTLY
FIL
LED
3
= O
THER
(SPE
CIFY
)
1 = Q
UES
TIO
NN
AIR
E CO
MPL
ETED
2
= Q
UES
TIO
NN
AIR
E PA
RTLY
FIL
LED
3
= O
THER
(SPE
CIFY
)
APP
END
IX 1:
Sch
ool Q
uest
ionn
aire
Appendix 1 67
SECT
ION
A: C
HA
RACT
ERIS
TICS
OF
SCH
OO
L
Gra
de 9
Gra
de 10
Gra
de 11
Gra
de 9
Gra
de 10
Gra
de 11
Gra
de 9
Gra
de 10
Gra
de 11
Gra
de 9
Gra
de 10
G
rade
11G
rade
9G
rade
10
Gra
de 11
Lim
ited
fund
s to
pro
vide
en
ough
fa
cilit
ies a
nd
teac
hing
pe
rson
nel
Fund
s are
av
aila
ble
but
cann
ot fi
nd
enou
gh
spec
ializ
ed
teac
hing
pe
rson
nel f
or
this
track
/ st
rand
Lim
ited
dem
and
from
st
uden
ts
ACA
DEM
IC [
] [
] [
] [
]A
CCO
UN
TAN
CY, B
USI
NES
S an
d M
AN
AG
EMEN
T(A
BM) S
TRA
ND
[ ]
[ ]
[ ]
[ ]
HU
MA
NIT
IES
and
SOCI
AL
SCIE
NCE
(HU
MSS
) STR
AN
D [
] [
] [
] [
]SC
IEN
CE,T
ECH
NO
LOG
Y an
d EN
GIN
EERI
NG
and
MA
THEM
ATI
CS(S
TEM
) STR
AN
D [
] [
] [
] [
]G
ENER
AL
ACA
DEM
IC S
TRA
ND
[ ]
[ ]
[ ]
[ ]
PRE-
BACC
ALA
URE
ATE
MA
RITI
ME
[ ]
[ ]
[ ]
[ ]
TECH
NIC
AL
/ VO
CATI
ON
AL
[ ]
[ ]
[ ]
[ ]
AG
RI-F
ISH
ERY
ART
S [
] [
] [
] [
]H
OM
E EC
ON
OM
ICS
[ ]
[ ]
[ ]
[ ]
INFO
RMA
TIO
N A
ND
CO
MM
UN
ICA
TIO
N T
ECH
NO
LOG
Y(IC
T) [
] [
] [
] [
]IN
DU
STRI
AL
ART
S [
] [
] [
] [
]TV
L M
ARI
TIM
E [
] [
] [
] [
]LI
VELI
HO
OD
[ ]
[ ]
[ ]
[ ]
SPO
RTS
[ ]
[ ]
[ ]
[ ]
ART
S A
ND
DES
IGN
[ ]
[ ]
[ ]
[ ]
OTH
ER, S
PECI
FY__
____
___
9e. I
f you
thin
k tha
t lim
ited
fund
ing
is on
e of
th
e m
ain
reas
ons w
hy
your
scho
ol d
oes n
ot
curre
ntly
offe
r thi
s tra
ck
/ stra
nd, a
ppro
ximat
ely
how
muc
h ad
ditio
nal
fund
ing
(per
scho
ol
year
) you
thin
k is
need
ed fo
r you
r sch
ool
to b
e ab
le to
offe
r thi
s tra
ck?
9f. I
f you
thin
k tha
t lac
k of
spec
ializ
ed te
ache
rs is
on
e of
the
mai
n re
ason
s w
hy yo
ur sc
hool
doe
s not
cu
rrent
ly of
fer t
his t
rack
/ st
rand
, app
roxim
atel
y ho
w m
any a
dditi
onal
sp
ecia
lized
teac
hing
pe
rson
nel y
ou th
ink a
re
need
ed fo
r you
r sch
ool
to b
e ab
le to
offe
r thi
s tra
ck?
9g. I
f you
thin
k tha
t lim
ited
dem
and
from
st
uden
ts is
one
of t
he
mai
n re
ason
s why
your
sc
hool
doe
s not
cur
rent
ly of
fer t
his t
rack
/ st
rand
, ap
prox
imat
ely h
ow m
any
stud
ents
you
thin
k are
ne
eded
for y
our s
choo
l to
be
able
to o
ffer t
his
track
?
8a. H
ow m
any s
tude
nts e
nrol
led
at th
e be
ginn
ing
of th
e sc
hool
year
?8b
. How
man
y stu
dent
s who
enr
olle
d at
the
begi
nnin
g of
the
scho
ol ye
ar le
ft be
fore
the
end
of th
e sc
hool
year
?
8c. H
ow m
any s
tude
nts t
rans
ferre
d to
yo
ur sc
hool
in th
e m
iddl
e of
the
scho
ol
year
?
9a. W
hich
trac
ks a
nd st
rand
s doe
s you
r sch
ool o
ffer?
(Ple
ase
tick t
he p
rogr
ams t
hat y
our s
choo
l offe
rs)
9b. F
or e
ach
track
and
stra
nd th
at yo
ur
scho
ol o
ffers
, kin
dly p
rovi
de th
e nu
mbe
r of t
each
ers a
vaila
ble
for e
ach
grad
e
9c. H
ow m
any t
each
ers h
ave
Indu
stry
Ex
perie
nce
(>=
3 yea
rs p
rofe
ssio
nal
expe
rienc
e –
TVET
Onl
y)?
9d. P
leas
e tic
k the
mai
n re
ason
s why
your
scho
ol
does
not
offe
r thi
s tra
ck?
Vouc
her r
ecip
ient
sES
C gr
ante
es
GRA
DE
10G
RAD
E 9
7. H
ow m
any h
ave
pass
ed th
e lic
ensu
re
exam
?
6 .H
ow m
any t
each
ers
have
a m
aste
rs in
ed
ucat
ion/
peda
gogy
as
thei
r mai
n fie
ld o
f stu
dy?
5. H
ow m
any t
each
ers h
ave
a m
aste
r(s)
deg
ree
or
high
er?
4. H
ow m
any t
each
ers h
ave
at le
ast a
bac
helo
r’s d
egre
e?3.
How
man
y tea
cher
s hav
e an
ass
ocia
te d
egre
e (b
ut n
ot
a ba
chel
or’s
degr
ee)?
PERM
AN
ENT/
Dep
Ed-f
unde
d
1. H
ow m
any t
each
ers t
each
for e
ach
of th
e fo
llow
ing
grad
es?
GRA
DE
11
TEM
PORA
RY/L
GU
-fun
ded
2. H
ow m
any t
each
ers h
ave
at
leas
t 5 ye
ars o
f ind
ustry
ex
perie
nce?
All SE
CTIO
N A
: CH
ARA
CTER
ISTI
CS O
F SC
HO
OL

Appendix 168
14. H
ow a
re st
uden
ts a
lloca
ted
into
diff
eren
t sec
tion?
1 = S
tude
nts a
re ra
ndom
ly al
loca
ted
2 =
Acc
ordi
ng to
dat
e of
enr
ollm
ent (
first
com
e, fi
rst s
erve
bas
is)3 =
Acc
ordi
ng to
aca
dem
ic a
ptitu
de4
= S
tude
nts w
ho a
re E
SC g
rant
ees /
vou
cher
reci
pien
ts a
re g
roup
ed in
a se
para
te se
ctio
n
Shift
1Sh
ift 1
Shift
2Sh
ift 2
Shift
3Sh
ift 3
Shift
4Sh
ift 4
Shift
1Sh
ift 1
Shift
2Sh
ift 2
Shift
3Sh
ift 3
Shift
4Sh
ift 4
Shift
1Sh
ift 1
Shift
2Sh
ift 2
Shift
3Sh
ift 3
Shift
4Sh
ift 4
Shift
1Sh
ift 1
Shift
2Sh
ift 2
Shift
3Sh
ift 3
Shift
4Sh
ift 4
18. H
ow fa
r is t
his s
choo
l fro
m:
19. D
oes y
our s
choo
l fac
e an
y con
stra
ints
with
the
follo
win
g?
[Rec
ord
dist
ance
in K
ilom
eter
s]
Clos
est m
arke
tCl
oses
t ci
nem
a ha
llCl
oses
t co
llege
or
univ
ersit
y
Lack
of
Teac
hers
Lim
ited
Stud
ent
Enro
llmen
t
Hig
h St
uden
t En
rollm
ent
ESC
App
licat
ion
Requ
irem
ents
App
licat
ion
Requ
irem
ents
to
be
able
to
offe
r diff
eren
t SH
S tra
cks
Oth
er S
peci
fy)
23. H
ow m
any p
rivat
e se
cond
ary
scho
ols w
ithin
45
min
utes
of d
rivin
g di
stan
ce o
ffer t
he sa
me
cour
ses,
if at
al
l?
17. W
hat t
ime
does
scho
ol e
nd fo
r eac
h of
the
shift
s15
. Num
ber o
f shi
fts t
his s
choo
l ope
rate
s und
er?
16. W
hat t
ime
does
scho
ol st
art f
or e
ach
of th
e sh
ifts
20. A
ppro
ximat
ely,
how
man
y pub
lic
seco
ndar
y sch
ools
are
with
in 4
5 m
inut
es o
f dr
ivin
g di
stan
ce fr
om th
is sc
hool
(via
mos
t co
mm
on v
ehic
le u
sed
to c
omm
ute
in th
is ar
ea)?
21. H
ow m
any p
ublic
seco
ndar
y sch
ools
with
in 4
5 m
inut
es o
f driv
ing
dist
ance
offe
r th
e sa
me
cour
ses a
s you
r sch
ool, i
f at a
ll?
22. A
ppro
ximat
ely,
how
man
y priv
ate
seco
ndar
y sch
ools
are
with
in 4
5 m
inut
es
of d
rivin
g di
stan
ce fr
om th
is sc
hool
?
13. W
hat r
esou
rces
are
use
d fo
r upd
atin
g th
e TV
ET
curri
culu
m (c
heck
all t
hat a
pply)
11. W
hat r
esou
rces
are
use
d fo
r upd
atin
g th
e cu
rricu
lum
(che
ck a
ll tha
t app
ly)12
. How
ofte
n is
the
TVET
cur
ricul
um
upda
ted
by th
e sc
hool
?
Clos
est p
ublic
tran
spor
tatio
n te
rmin
alCl
oses
t bus
ines
s dist
rict
Sche
dule
of d
isbur
sem
ent o
f su
bsid
ies f
or v
ouch
er/E
SC
reci
pien
ts
Num
ber o
f cla
ssro
oms
and
adeq
uacy
of f
acilit
ies
10. H
ow o
ften
is th
e ge
nera
l cur
ricul
um
upda
ted
by th
e sc
hool
?
Gra
de
Gra
de 9
Gra
de 10
Gra
de 11
Gra
de 12
1 = N
ever
2
= W
hen
Dep
Ed st
anda
rds a
re u
pdat
ed
3 =
Year
ly
1 = F
orm
al c
onsu
ltatio
ns w
ith te
ache
rs
2 =
Dep
Ed g
over
nmen
t edu
catio
nal
prac
tice
mat
eria
l 3
= In
tern
atio
nal e
duca
tiona
l pra
ctic
e m
ater
ial
4 =
Out
side
advi
sors
5
= Co
nsul
tatio
n w
ith p
rivat
e se
ctor
1 = N
ever
2
= W
hen
Dep
Ed st
anda
rds a
re
upda
ted
3 =
Year
ly
1 = F
orm
al c
onsu
ltatio
ns w
ith te
ache
rs
2 =
Nat
iona
l edu
catio
nal p
ract
ice
mat
eria
l 3
= In
tern
atio
nal e
duca
tiona
l pra
ctic
e m
ater
ial
4 =
Out
side
advi
sors
5
= Co
nsul
tatio
n w
ith p
rivat
e se
ctor
indu
stry
1 = N
o co
nstr
aint
2
= M
inor
Con
stra
int
3 =
Mod
erat
e Co
nstr
aint
4
= M
ajor
Con
stra
int

Appendix 1 69SE
CTIO
N B
: SCH
OO
L M
AN
AG
EMEN
T
Q5.
Wha
t are
the
crite
ria fo
r hiri
ng te
ache
rs? (
Rank
all t
hat a
pply)
Oth
ers:
Q6.
Wha
t are
the
five
issue
s mos
t com
mon
ly ra
ised
durin
g the
par
ent m
eetin
gs? I
dent
ify a
t mos
t fiv
e iss
ues.
Q1.
Is th
ere
a Pa
rent
-Tea
cher
A
ssoc
iatio
n (P
TA) f
or th
is sc
hool
?
Q2.
How
ofte
n do
es th
e PT
A m
eet?
Q3.
How
ofte
n ar
e st
aff m
eetin
gs h
eld
betw
een
you
and
teac
hers
of t
he sc
hool
?Q
4. H
ow o
ften
is th
e sc
hool
usu
ally
visit
ed
by a
n of
ficia
l fro
m D
epEd
?
1 = Y
es
2 =
No ►
Q3
1 = M
ore
than
onc
e a
mon
th
2 =
Onc
e a
mon
th
3 =
Onc
e pe
r ter
m
4 =
Onc
e ev
ery s
ix m
onth
s 5
= O
nce
a ye
ar
6 =
Nev
er
1 = P
asse
d th
e lic
ensu
re e
xam
2
= Co
mpl
eted
Bac
helo
r’s in
Edu
catio
n 3 =
Indu
stry
exp
erie
nce
4 =
Reco
mm
enda
tion
5 =
Non
e Ra
nk 1:
___
____
____
___
Rank
2: _
____
____
____
_ Ra
nk 3
: ___
____
____
___
Rank
4: _
____
____
____
_
1 = T
each
er P
erfo
rman
ce
2 =
Stud
ent A
tten
danc
e 3
= St
uden
t Per
form
ance
4
= O
ther
aspe
cts o
f tea
cher
beh
avio
r 5
= D
istrib
utio
n of
Sch
olar
ship
s/G
rant
s 6
= D
istrib
utio
n of
boo
ks
7 =
Scho
ol in
frast
ruct
ure
8 =
Scho
ol m
ater
ials
9 =
Stud
ent T
each
er R
atio
10
= S
choo
l fin
ance
s 11
= S
choo
l per
form
ance
12
= C
aree
r gui
danc
e co
unse
lling
13
= C
ours
e of
ferin
gs fo
r SH
S
1 = M
ore
than
onc
e a
mon
th
2 =
Onc
e a
mon
th
3 =
Onc
e pe
r ter
m
4 =
Onc
e ev
ery s
ix m
onth
s 5
= O
nce
a ye
ar
6 =
Nev
er
1 = M
ore
than
onc
e a
mon
th
2 =
Onc
e a
mon
th
3 =
Onc
e pe
r ter
m
4 =
Onc
e ev
ery s
ix m
onth
s 5
= O
nce
a ye
ar
6 =
Nev
er
SECT
ION
B: S
CHO
OL
MA
NA
GEM
ENT

Appendix 170
SECT
ION
C: S
CHO
OL
FIN
AN
CES
3a (1
- Yes
, 2 –
N
o Sk
ip to
Q3c
)3b
(PhP
)3c
(1- Y
es, 2
–
No
Skip
to Q
3e)
3d (P
hP)
3e (
1- Ye
s, 2 –
N
o Sk
ip to
Q4)
3f (P
hP)
4a (1
- Yes
, 2 –
N
o Sk
ip to
Q6)
4b (P
hP6a
6b6c
6d6e
Gra
de 9
Gra
de 10
Gra
de 11
Q5.
Did
the
scho
ol re
ceive
the
follo
win
g mat
eria
ls fro
m n
on-
gove
rnm
ent a
nd n
on-h
ouse
hold
sour
ces i
n th
e pr
evio
us
acad
emic
year
?
Q6.
Doe
s the
scho
ol
keep
a fo
rmal
ac
coun
ting
and
audi
t re
cord
of i
ts
expe
nditu
re?
Q1. D
oes t
his s
choo
l col
lect
an
y sch
ool f
ees f
rom
the
pare
nts?
Q2a
. How
muc
h ar
e th
e sc
hool
fees
(tui
tion)
for a
stud
ent (
PHP)
for a
full-
acad
emic
year
?
In p
arts
(a)
& (c
) & (e
) e
nter
the
code
and
in p
arts
(b)
& (d
) & (f
) rec
ord
the
amou
nt (P
hP)
Q4.
Did
this
scho
ol re
ceive
an
y mon
ey fr
om th
e no
n-go
vern
men
t and
non
-ho
useh
old
sour
ces i
n th
e la
st
acad
emic
year
?
Capi
tatio
n gr
ant (
Dep
Ed n
on-
ESC)
, e.g.
, MO
OE,
etc
.Fo
r PRI
VATE
scho
ols o
nly:
Capi
tatio
n gr
ant (
Dep
Ed
ESC)
Oth
er gr
ants
(spe
cify
; e.g.
LG
U-p
rovid
ed gr
ant)
Q3.
Did
this
scho
ol re
ceive
any c
ash
gran
ts fr
om th
e go
vern
men
t in
the
last
acad
emic
ye
ar?
Q2a
. On
top
of th
e sc
hool
fees
, on
the
aver
age,
how
muc
h ar
e th
e ot
her
expe
nses
that
stud
ents
nee
d to
incu
r thr
ough
out t
he fu
ll-ac
adem
ic ye
ar
(boo
ks, s
choo
l sup
plie
s, un
iform
, stu
dy tr
ips,
etc)
?
GRA
DE
11G
RAD
E 10
Q7.
For P
RIVA
TE sc
hool
s onl
y: W
hat i
s the
av
erag
e te
ache
r wag
e pe
r mon
th o
f ful
l-tim
e te
ache
rs at
the
follo
win
g lev
els?
(if p
ublic
sc
hool
skip
to n
ext m
odul
e)
Text
book
sTe
ache
r tra
inin
gBu
ildin
g su
pplie
sFo
od fo
r st
uden
tsO
ther
sc
hool
su
pplie
s
Supe
rviso
r/Hea
d te
ache
rM
id-le
vel
Entry
leve
l
GRA
DE
9G
RAD
E 11
GRA
DE
9G
RAD
E 10
1 = Y
es
2 =
No ►
Q3
1 = Y
es
2 =
No
1 =
Yes
2
= N
o
SECT
ION
C: S
CHO
OL
FIN
AN
CES

Appendix 1 71
SECT
ION
D. A
UTO
NO
MY
IN S
CHO
OL
MA
NA
GEM
ENT
(for
PRI
VATE
SCH
OO
LS o
nly)
Stud
ent s
atisf
actio
nPe
rform
ance
on
scho
ol st
anda
rdize
d te
st
Dro
pout
rate
s of s
tude
nts
Teac
her/s
taff
satis
fact
ion
Atte
ndan
ce ra
te
Stud
ent A
ttend
ance
Ra
tes
Teac
her/s
taff
satis
fact
ion
Dro
pout
rate
s of
stud
ents
Perfo
rman
ce o
n st
anda
rdize
d te
sts
Stud
ent s
atisf
actio
n
Q1.
Doe
s the
scho
ol se
t cr
iteria
for s
tude
nt
adm
issio
ns?
6 =
Cap
acity
to p
ay
scho
ol fe
es
5 = R
ecom
men
datio
n fro
m re
puta
ble
grou
p
4 =
Sibl
ing a
ttend
ance
3 = Q
uota
on
max
imum
no
. of s
tude
nts/
scho
ol
capa
city
2 =
Ext
racu
rricu
lar
activ
ities
/lead
ersh
ip
Q5.
Who
dec
ides
to
prom
ote
or re
war
d a
teac
her f
or go
od
perfo
rman
ce?
Q6.
Wha
t typ
e of
indi
cato
rs d
oes t
he sc
hool
syst
emat
ical
ly c
olle
ct? (
mul
tiple
resp
onse
s allo
wed
)
Q2.
On
a sc
ale
of 1
to 5
(1 b
eing
the
mos
t im
porta
nt),
how
impo
rtant
are
th
e fo
llow
ing c
riter
ia fo
r adm
issio
n?
Oth
er (s
peci
fy)
Q7.
On
a sc
ale
of 1
to 5
(1 b
eing
the
mos
t im
porta
nt),
rank
the
targ
ets t
hat t
he sc
hool
set i
n te
rms o
f eva
luat
ing i
ts o
vera
ll per
form
ance
.
1 = A
cade
mic
Pe
rform
ance
in e
ntra
nce
test
Q3.
To o
ffer a
com
plet
ely n
ew c
lass
(e
.g. A
rt, p
hoto
grap
hy) w
hat
agre
emen
t wou
ld th
e pr
inci
pal o
r hea
d of
aca
dem
ics n
eed?
(Enc
ircle
all t
hat
appl
y)
Q4.
To
expa
nd sc
hool
size
in te
rms o
f nu
mbe
r of s
tude
nts (
e.g.
>5%
) wha
t ag
reem
ent w
ould
the
prin
cipa
l/adm
inist
rato
r nee
d?1 =
Yes
2
= N
o (S
kip
to Q
3)
1 = B
oard
of T
rust
ees
2 =
Scho
ol a
dmin
istra
tion
3 =
Pare
nts’
asso
ciat
ion
4 =
Dep
Ed/ O
utsid
e A
utho
rity
5 =
Oth
er, p
leas
e sp
ecify
__
____
____
___
1 = B
oard
of t
rust
ees
2 =
Scho
ol a
dmin
istra
tion
3
= Sc
hool
or S
GC
and
outs
ide
auth
ority
4
= O
utsid
e A
utho
rity
5 =
Oth
er, p
leas
e sp
ecify
__
____
____
___
1 = B
oard
of t
rust
ees
2 =
Scho
ol
adm
inist
ratio
n
3 =
Scho
ol o
r SG
C an
d ou
tsid
e au
thor
ity
4 =
Out
side
Aut
horit
y
1 = D
o no
t col
lect
2
= Co
llect
thro
ugh
ad h
oc
inte
rvie
ws
3 =
Colle
ct sy
stem
atic
ally
th
roug
h fo
cuse
d qu
estio
nnai
re (o
nce
year
) 4
= Co
llect
at le
ast t
wic
e a
year
1 = D
o no
t col
lect
2
= Co
llect
at e
nd o
f yea
r on
ly
3 =
Colle
ct b
i-an
nual
ly
4 =
Colle
ct q
uart
erly
5
= Co
llect
mon
thly
1 = D
o no
t col
lect
2
= Co
llect
at e
nd o
f ye
ar o
nly
3 =
Colle
ct b
i-an
nual
ly
4 =
Colle
ct q
uart
erly
5
= Co
llect
mon
thly
1 = D
o no
t col
lect
2
= Co
llect
thro
ugh
ad h
oc
inte
rvie
ws
3 =
Colle
ct sy
stem
atic
ally
th
roug
h fo
cuse
d qu
estio
nnai
re (o
nce
year
) 4
= Co
llect
at le
ast t
wic
e a
year
1 = D
o no
t col
lect
2
= Co
llect
thro
ugh
ad h
oc
inte
rvie
ws
3 =
Colle
ct sy
stem
atic
ally
th
roug
h fo
cuse
d qu
estio
nnai
re (o
nce
year
) 4
= Co
llect
at le
ast t
wic
e a
year
SECT
ION
D: A
UTO
NO
MY
IN S
CHO
OL
MA
NA
GEM
ENT
(for
PRI
VATE
SCH
OO
LS o
nly)

Appendix 172
Q11.
Are
resu
lts fr
om te
ache
r per
form
ance
as
sess
men
ts c
omm
unic
ated
bac
k to
teac
hers
th
roug
h fo
rmal
mee
tings
?
Q12
. If a
teac
her i
s und
erpe
rform
ing w
hat s
teps
are
un
derta
ken
to im
prov
e pe
rform
ance
? (s
elec
t all
that
app
ly)
Q13
. How
are
stud
ents
ass
esse
d in
term
s of a
ssig
nmen
t to
clas
ses o
r tea
cher
s?
Stud
ent s
atisf
actio
nTe
nure
or e
xper
ienc
e
Q10
. On
a sc
ale
of 1-
5, ho
w w
ould
you
asse
ss th
e m
oral
e or
mot
ivat
ion
of
teac
hers
at y
our s
choo
l? W
ith 1
bein
g –
high
mor
ale
Teac
her A
ttend
ance
Gra
de-le
vel c
oord
inat
or/
Prin
cipa
l rev
iew
Dro
pout
rate
s of
stud
ents
Q9.
On
a sc
ale
of 1-
5, ho
w m
uch
do th
e fo
llow
ing m
atte
r in
asse
ssin
g tea
cher
per
form
ance
(bon
uses
, pro
mot
ions
, aw
ards
etc
.)?1 –
mos
t mpo
rtant
& 5
– le
ast i
mpo
rtant
Oth
erPe
rform
ance
on
scho
ol
stan
dard
ized
test
Stud
ent s
atisf
actio
nPe
rform
ance
on
stan
dard
ized
test
sD
ropo
ut ra
tes o
f stu
dent
sQ
8. H
ow a
re th
e in
dica
tors
in Q
7 di
ssem
inat
ed? (
mul
tiple
resp
onse
s allo
wed
)Te
ache
r/sta
ff sa
tisfa
ctio
nSt
uden
t Atte
ndan
ce R
ates
1 = N
ot re
leas
ed
2 =
Upo
n re
ques
t 3
= Po
sted
out
side
clas
sroo
m
4 =
Post
ed o
utsid
e sc
hool
5
= A
vaila
ble
onlin
e 6
= D
irect
ly d
eliv
ered
to p
aren
ts
7 =
Repo
rted
to D
epEd
8
= O
ther
(spe
cify
)
1 = N
ot a
t all
2 =
Onc
e a
year
3
= Tw
o-th
ree
times
a ye
ar
4 =
4 tim
es a
year
or m
ore
1 = In
form
al m
ento
ring
2 =
Form
al m
ento
ring
3 =
Trai
ning
4
= Re
assig
nmen
t to
diffe
rent
clas
s or t
asks
5
= Te
rmin
atio
n
1 = A
ll st
uden
ts ta
ke sa
me
clas
ses r
egar
dles
s of t
est p
erfo
rman
ce.
2 =
Stud
ents
are
assig
ned
to c
lass
bas
ed o
n la
st y
ear’s
acad
emic
rank
ing
at b
egin
ning
of y
ear,
base
d on
teac
her/
staf
f ass
essm
ent.
3 =
Stud
ents
are
assig
ned
to c
lass
bas
ed o
n sk
ill a
t beg
inni
ng o
f yea
r, ba
sed
on st
anda
rdiz
ed te
st.
4 =
Stud
ents
are
free
to se
lect
clas
s diff
icul
ty a
nd le
vel a
ccor
ding
to
perc
eive
d ab
ility
5
= St
uden
ts ar
e as
signe
d to
diff
eren
t cla
sses
bas
ed o
n th
eir
abili
ty o
ver d
iffer
ent s
ubje
ct ar
eas.
6 =
Stud
ents
ass
igne
d to
cla
ss b
ased
on
last
nam
e or
dat
e of
birt
h
1 = N
ot re
leas
ed
2 =
Upo
n re
ques
t 3
= Po
sted
out
side
clas
sroo
m
4 =
Post
ed o
utsid
e sc
hool
5
= A
vaila
ble
onlin
e 6
= D
irect
ly d
eliv
ered
to p
aren
ts
7 =
Repo
rted
to D
epEd
8
= O
ther
(spe
cify
)
1 = N
ot re
leas
ed
2 =
Upo
n re
ques
t 3
= Po
sted
out
side
clas
sroo
m
4 =
Post
ed o
utsid
e sc
hool
5
= A
vaila
ble
onlin
e 6
= D
irect
ly d
eliv
ered
to p
aren
ts
7 =
Repo
rted
to D
epEd
8
= O
ther
(spe
cify
)
1 = N
ot re
leas
ed
2 =
Upo
n re
ques
t 3
= Po
sted
out
side
clas
sroo
m
4 =
Post
ed o
utsid
e sc
hool
5
= A
vaila
ble
onlin
e 6
= D
irect
ly d
eliv
ered
to p
aren
ts
7 =
Repo
rted
to D
epEd
8
= O
ther
(spe
cify
)
1 = N
ot re
leas
ed
2 =
Upo
n re
ques
t 3
= Po
sted
out
side
clas
sroo
m
4 =
Post
ed o
utsid
e sc
hool
5
= A
vaila
ble
onlin
e 6
= D
irect
ly d
eliv
ered
to p
aren
ts
7 =
Repo
rted
to D
epEd
8
= O
ther
(spe
cify
)

Appendix 1 73
SECT
ION
E: C
HA
RACT
ERIS
TICS
OF
PRIN
CIPA
L
YEA
RSM
ON
THS
YEA
RSM
ON
THS
YEA
RSM
ON
THS
1 – Y
es2
– N
o (s
kip
to
Q12
)
Teac
hing
Supe
rvisi
ng /
Supp
ortin
g Te
ache
rs
Supe
rvisi
ng /
Supp
ortin
g St
uden
ts
Adm
inist
rativ
e Ta
sks (
e.g.,
m
eetin
gs)
Atte
ndin
g Tr
aini
ngs
Oth
er
(spe
cify
)
1. G
ende
r4.
How
long
hav
e yo
u be
en in
th
is po
sitio
n in
this
scho
ol?
20. O
n av
erag
e, h
ow m
any h
ours
per
wee
k do
you
spen
d on
the
follo
win
g sch
ool-
rela
ted
activ
ities
?
3. D
o yo
u be
long
to a
te
ache
r's u
nion
?2.
Age
(in
year
s)
6. H
ow lo
ng d
id yo
u w
ork a
s a
teac
her i
n to
tal b
efor
e ta
king
this
posit
ion?
5. H
ow lo
ng d
id yo
u w
ork a
s a
teac
her i
n th
is sc
hool
bef
ore
taki
ng th
is po
sitio
n?
11. N
ame
the
top
3 mos
t fre
quen
t tra
inin
g pr
ovid
ers.
12. H
ave
you
ever
rece
ived
any
ki
nd o
f tra
inin
g on
scho
ol
man
agem
ent o
r ad
min
istra
tion
for t
he p
ast 5
ye
ars?
9. H
ave
you
rece
ived
any
tra
inin
g on
care
er
guid
ance
co
unse
lling
?
7. W
hat w
as yo
ur m
ain
reas
on fo
r jo
inin
g thi
s sch
ool w
hen
you
first
m
oved
her
e?
8. W
hat i
s the
hig
hest
leve
l of
scho
olin
g tha
t you
hav
e co
mpl
eted
?
10. H
ow fr
eque
ntly
hav
e yo
u re
ceiv
ed su
ch tr
aini
ng?
1 – Y
es2
– N
o (s
kip
to Q
15)
13. H
ow fr
eque
ntly
hav
e yo
u re
ceiv
ed su
ch tr
aini
ng?
14. N
ame
the
top
3 mos
t fre
quen
t tra
inin
g pro
vide
rs.
15. D
o yo
u ha
ve
grad
e-le
vel
coor
dina
tors
at
your
scho
ol?
16. I
f yes
, how
ofte
n do
you
mee
t w
ith gr
ade-
leve
l coo
rdin
ator
s or
teac
hers
in gr
ades
9-1
1 ind
ivid
ually
to
talk
abo
ut th
eir p
erfo
rman
ce?
17. H
ow o
ften
do yo
u m
eet w
ith
stud
ents
in gr
ades
9-1
1 in
divi
dual
ly o
r in
a gr
oup
to ta
lk
abou
t the
ir pe
rform
ance
?
18. H
ow o
ften
do yo
u m
eet
with
par
ents
as a
grou
p?19
. Wha
t act
ion
did
you
take
th
e la
st ti
me
a te
ache
r was
ab
sent
for a
n ex
tend
ed p
erio
d w
ithou
t offi
cial
cle
aran
ce?
1 = M
ale
2 =
Fem
ale
1 = Y
es
2 =
No
PUT
'99'
IF D
ON
T KN
OW
1 = R
outin
e ap
plic
atio
n of
pos
ting a
nd
tran
sfer
rule
s (in
clud
ing r
ebal
anci
ng o
f lo
ad)
2 =
Polit
ical
inte
rfere
nce/
pre
ssur
e 3
= Pe
rson
al re
ques
t 4
= Pu
nish
men
t 5
= St
rain
ed p
erso
nal r
elat
ions
at
prev
ious
scho
ol
6 =
Tran
sfer
red
from
Ano
ther
Sch
ool
7 =
Oth
er (s
peci
fy)
1 = P
rimar
y Sch
ool
2 =
Seco
ndar
y Sch
ool
3 =
Hig
h Sc
hool
Dip
lom
a 4
= Ba
chel
ors d
egre
e or
equ
ival
ent
5 =
Mas
ter's
deg
ree
6
= Ph
.D. a
nd a
bove
7
= O
ther
, spe
cify
1 = Q
uart
erly
2
= Tw
ice
a ye
ar
3 =
Year
ly
4 =
Bi-a
nnua
l 5
= O
nce
or tw
ice
durin
g the
pa
st 5
year
s
1 = Q
uart
erly
2
= Tw
ice
a ye
ar
3 =
Year
ly
4 =
Bi-a
nnua
l 5
= O
nce
or tw
ice
durin
g the
pa
st 5
year
s
1 = Y
es
2 =
No ►
17
1 = M
ore
than
onc
e a
mon
th
2 =
Onc
e a
mon
th
3 =
Onc
e ev
ery 3
mon
ths
4 =
Onc
e ev
ery s
ix m
onth
s 5
= O
nce
a ye
ar
6 =
Nev
er
ENCI
RCLE
ALL
TH
AT
APP
LY
1 = N
o ac
tion
2 =
Info
rmal
que
ry
3 =
Ora
l war
ning
4
= W
ritte
n w
arni
ng (m
emo)
5
= Re
port
to D
ivisi
on
Supe
rinte
nden
t 6
= Te
rmin
atio
n
1 = M
ore
than
onc
e a
mon
th
2 =
Onc
e a
mon
th
3 =
Onc
e ev
ery 3
mon
ths
4 =
Onc
e ev
ery s
ix m
onth
s 5
= O
nce
a ye
ar
6 =
Nev
er
1 = M
ore
than
onc
e a
mon
th
2 =
Onc
e a
mon
th
3 =
Onc
e ev
ery 3
mon
ths
4 =
Onc
e ev
ery s
ix m
onth
s 5
= O
nce
a ye
ar
6 =
Nev
er
SECT
ION
E: C
HA
RACT
ERIS
TICS
OF
PRIN
CIPA
L

Appendix 174SE
CTIO
N F
: TEA
CHER
INCE
NTI
VES
AN
D C
ARE
ER G
UID
AN
CESE
CTIO
N F
: TEA
CHER
INCE
NTI
VES
& C
ARE
ER G
UID
AN
CE
Q1.
Wha
t met
hods
are
bein
g use
d to
mon
itor t
he p
erfo
rman
ce o
f tea
cher
s for
Gra
des 9
-12 a
t you
r sch
ool?
(ans
wer
Yes
=1
or N
o= 2
for e
ach
give
n m
etho
d)ST
UD
ENTS
’ ACA
DEM
IC P
ERFO
RMA
NCE
YES
1N
O2
TEA
CHER
PEE
R RE
VIEW
OF
LESS
ON
PLA
NS,
ASS
ESSM
ENT
INST
RUM
ENTS
YES
1N
O2
PRIN
CIPA
L O
R SE
NIO
R ST
AFF
OBS
ERVA
TIO
N O
F LE
SSO
NS
YES
1N
O2
OBS
ERVA
TIO
N O
F LE
SSO
NS
YES
1N
O2
PERF
ORM
AN
CE A
PPRA
ISA
L O
F TE
ACH
ERS
(PA
ST)
YES
1N
O2
PERF
ORM
AN
CE B
ASE
D B
ON
US
PRO
GRA
M (P
BB)
YES
1N
O2
OTH
ER S
PECI
FY:
YES
1N
O2
PRO
MO
TIO
N
SALA
RY IN
CREA
SE
FIN
AN
CIA
L BO
NU
S O
R O
THER
MO
NET
ARY
REW
ARD
OPP
ORT
UN
ITIE
S FO
R PR
OFE
SSIO
NA
L D
EVEL
OPM
ENT
ACT
IVIT
IES
PUBL
IC R
ECO
GN
ITIO
N (A
T A
N A
SSEM
BLY
OR
OTH
ER F
ORU
M)
OTH
ER S
PECI
FY:
Que
stio
n 3
appl
ies o
nly
to P
RIVA
TE sc
hool
s (sk
ip to
Q4
if no
t a p
rivat
e sc
hool
)Q
3. F
or th
e fo
llow
ing t
asks
, tic
k th
e on
e w
ith th
e m
ost c
onsid
erab
le re
spon
sibili
ty.
Shou
ld an
opt
ion
not a
pply
to yo
ur sc
hool
, ent
er “-
1”.
Hiri
ng te
ache
rs
Layi
ng o
ff te
ache
rs
Esta
blish
ing s
alar
ies o
f tea
cher
s
Det
erm
inin
g sal
ary i
ncre
ases
of t
each
ers
Form
ulat
ing s
choo
l bud
get
Esta
blish
ing s
tude
nt d
iscip
linar
y pol
icie
s
App
rovi
ng st
uden
ts fo
r adm
issio
n
Choi
ce o
f tex
tboo
ks
Det
erm
inin
g cou
rse
cont
ent
Dec
idin
g wha
t cou
rses
are
offe
red
Dec
idin
g whe
ther
Gra
de 11
and
12 sh
ould
be
offe
red
at th
is sc
hool
Pare
nts’
asso
ciat
ion
Teac
hers
Prin
cipa
lSc
hool
ad
min
istra
tion
Q2.
On
a sca
le o
f the
1 to
5 (1
bei
ng th
e m
ost i
mpo
rtant
and
frequ
ently
use
d), r
ank t
he fo
llow
ing m
etho
ds ad
opte
d by
your
scho
ol to
ince
ntiv
ize te
ache
rs w
ho p
erfo
rm w
ell a
t the
ir jo
b.
(Sho
uld
an o
ptio
n no
t app
ly to
your
scho
ol, e
nter
99)

Appendix 1 75
a. G
uida
nce
coun
selo
rs*
b. G
uida
nce
“car
eer”
advo
cate
s**
* - S
choo
l per
sonn
el w
ith gu
idan
ce co
unse
lor p
lant
illa
** -
Scho
ol p
erso
nnel
and
uppe
rcla
ssm
an e
ngag
ed in
care
er ad
voca
cy
a. Se
nior
seco
ndar
y car
eer g
uida
nce
prog
ram
YES
1N
O2
b. S
choo
l ele
ctiv
e co
urse
wor
k in
care
er d
ecisi
on m
akin
gYE
S1
NO
2c.
Occ
upat
iona
l info
rmat
ion
units
in su
bjec
t-m
atte
r cou
rses
YE
S1
NO
2d.
Stu
dent
imm
ersio
n in
the
indu
stry
(for
exa
mpl
e, co
-op,
wor
k stu
dy, in
tern
ship
, fo
rmal
pro
gram
s whe
re st
uden
ts ar
e pl
aced
with
men
tor)
YES
1N
O2
e. C
aree
r/job
fairs
YE
S1
NO
2f.
Voca
tiona
lly o
rient
ed as
sem
blie
s and
spea
kers
in cl
ass
YES
1N
O2
g. Jo
bsite
tour
s or v
isits
(fie
ld tr
ips)
YES
1N
O2
h. T
ours
of p
ost-
seco
ndar
y ins
titut
ions
YES
1N
O2
i. Tes
ting a
nd h
avin
g tes
ts in
terp
rete
d fo
r car
eer p
lann
ing p
urpo
ses o
ther
than
N
CAE
(for
exa
mpl
e, in
tere
st in
vent
orie
s, vo
catio
nal a
ptitu
de te
sts)
YE
S1
NO
2
j. Car
eer c
ouns
elin
g ses
sions
(one
-on-
one)
YES
1N
O2
k. G
roup
guid
ance
/cou
nsel
ing s
essio
nsYE
S1
NO
2l. R
esum
e w
ritin
gYE
S1
NO
2m
. Tra
inin
g in
othe
r job
seek
ing s
kills
YES
1N
O2
n. U
se o
f non
-com
pute
rized
care
er in
form
atio
n so
urce
s (pa
mph
lets
, bro
chur
es,
etc.)
YES
1N
O2
o. U
se o
f com
pute
rized
care
er in
form
atio
n so
urce
s (on
line
job
sear
ch, e
tc.)
YES
1N
O2
p. U
se o
f col
lege
cata
logs
YE
S1
NO
2
Q5.
For
eac
h of
the
follo
win
g act
iviti
es in
dica
te w
heth
er th
e ac
tivity
is cu
rrent
ly av
aila
ble
at yo
ur sc
hool
.
ACT
IVIT
Y
B. O
f tho
se as
signe
d, n
umbe
r pro
fess
iona
lly ce
rtifie
d as
guid
ance
coun
selo
rs
A. N
umbe
r A
ssig
ned
Q4.
Ind
icat
e in
colu
mn
A th
e nu
mbe
r of f
ull-t
ime
guid
ance
coun
selo
rs/a
dvoc
ates
assig
ned
to h
igh
scho
ol st
uden
ts at
your
scho
ol. O
f tho
se as
signe
d, in
dica
te in
colu
mn
B th
e nu
mbe
r of
coun
selo
rs th
at ar
e ce
rtifie
d hi
gh sc
hool
guid
ance
coun
selo
rs. (
Com
plet
e ea
ch ro
w. I
f non
e, w
rite
“0”.)
If ye
s, w
hat i
s the
gra
de o
f firs
t exp
osur
e or
intr
oduc
tion?
(T
ick
one
box o
nly)
GRA
DE
11G
RAD
E 10
GRA
DE
9
AVA
ILA
BLE
AT
SCH
OO
L?(1
– Y
ES, 2
– N
O)
Q6.
On
a sc
ale
of 1
to 5
(1 fo
r the
goa
l with
the
mos
t im
port
ant e
mph
asis,
and
so o
n th
roug
h 5
for t
he g
oal w
ith th
e le
ast e
mph
asis)
, ran
k the
ext
ent t
o w
hich
the
follo
win
g goa
ls ar
e cu
rrent
ly e
mph
asize
d by
the
guid
ance
pro
gram
at yo
ur sc
hool
. (D
o no
t dup
licat
e ra
nkin
gs.)
(Ans
wer
Q6
only
if Q
5a is
yes,
if no
skip
to Q
12)
GO
AL
RAN
K (w
rite
1 for
the
goal
with
mos
t em
phas
is an
d 5 f
or le
ast e
mph
asis.
Lea
ve b
lank
if n
o em
phas
is)
Hel
p st
uden
ts w
ith id
entif
ying
fina
ncia
l aid
issu
es
Hel
p st
uden
ts w
ith th
eir a
cade
mic
grow
th in
hig
h sc
hool
Hel
p st
uden
ts w
ith p
erso
nal, s
ocia
l, psy
chol
ogic
al gr
owth
and
deve
lopm
ent
Hel
p st
uden
ts p
lan
and
prep
are
for t
heir
care
ers o
r edu
catio
n af
ter h
igh
scho
ol
Hel
p st
uden
ts id
entif
y the
ir Se
nior
Hig
h Sc
hool
trac
k

Appendix 176Q
7. O
n av
erag
e, h
ow m
any h
ours
of p
erso
naliz
ed h
elp
from
care
er co
unse
llor d
oes e
ach
stud
ent g
et p
er sc
hool
year
? (W
rite
“0” i
f non
e).
Q8.
Wha
t are
the
type
s of i
nfor
mat
ion
prov
ided
to st
uden
ts d
urin
g sen
ior s
econ
dary
care
er gu
idan
ce p
rogr
am
Type
s of I
nfor
mat
ion
a.
Ass
istan
ce in
inte
rpre
ting N
CAE
scor
esYE
S1
NO
2b.
I
dent
ify fi
elds
that
bes
t fit
stud
ents
’ aca
dem
ic ap
titud
e an
d sk
ills
YES
1N
O2
c.
Ide
ntify
fiel
ds th
at b
est f
it st
uden
ts’ in
tere
sts
YES
1N
O2
d.
Wag
e pr
ospe
cts f
or d
iffer
ent f
ield
sYE
S1
NO
2e.
I
dent
ify fi
elds
that
offe
r hig
h em
ploy
men
t opp
ortu
nitie
s in
the
Phi
lippi
nes
YES
1N
O2
f.
Ide
ntify
fiel
ds th
at o
ffer h
igh
empl
oym
ent o
ppor
tuni
ties a
broa
dYE
S1
NO
2g.
A
ssist
ance
in fi
ndin
g sou
rces
of f
inan
cial
supp
ort o
r sch
olar
ship
o
ppor
tuni
ties
YES
1N
O2
h.
Ass
istan
ce in
pos
t-se
cond
ary a
pplic
atio
n pr
oces
sYE
S1
NO
2
Q9.
Whe
re d
o yo
u us
ually
get c
aree
r gui
danc
e in
form
atio
n sh
ared
to st
uden
ts? (
If an
swer
to an
y of Q
8b-h
yes,
if no
skip
to Q
10)
Type
s of I
nfor
mat
ion
Uni
vers
ities
/Col
lege
s/Te
rtiar
y Ins
titut
ions
YES
1N
O2
Gov
ernm
ent A
genc
ies (
CHED
, TES
DA
)YE
S1
NO
2Co
lleag
ues
YES
1N
O2
Pers
onal
Con
nect
ions
(frie
nds a
nd re
lativ
es)
YES
1N
O2
Radi
o, T
V, N
ewsp
aper
YES
1N
O2
Inte
rnet
YES
1N
O2
Rank
Q11
. Wha
t are
oth
er ty
pes o
f inf
orm
atio
n th
at ar
e no
t cur
rent
ly p
rovi
ded,
but
you
thin
k wou
ld b
e us
eful
stud
ents
?
Q12
a. D
o yo
u m
onito
r stu
dent
s’ ac
tiviti
es a
fter
gra
duat
ion?
1 –
Yes
2 –
No
(ski
p to
nex
t sec
tion)
If “y
es”,
for t
he g
radu
atin
g cl
ass o
f SY
2014
-15:
Q12
b. A
ppro
ximat
e th
e pe
rcen
tage
of s
tude
nts w
ho p
ursu
ed th
e lis
ted
activ
ities
dire
ctly
afte
r hig
h sc
hool
a. En
rolle
d in
at le
ast f
our-
year
colle
ge o
r uni
vers
ityb.
Enr
olle
d in
an as
soci
ate
degr
ee gr
antin
g col
lege
or o
ther
less
-tha
n-4-
year
po
stse
cond
ary e
duca
tion
c. En
tere
d th
e la
bor m
arke
t (in
clud
ing b
usin
ess/
entre
pren
euria
l)d.
Pur
sued
oth
er ac
tiviti
es (e
.g.,, m
ilita
ry, o
r ful
l-tim
e, h
omem
akin
g, et
c.)
Yes/
No
Yes/
No
Ass
istan
ce in
pos
t-se
cond
ary a
pplic
atio
n pr
oces
sA
ssist
ance
in fi
ndin
g sou
rces
of f
inan
cial
supp
ort o
r sch
olar
ship
opp
ortu
nitie
sId
entif
y fie
lds t
hat o
ffer h
igh
empl
oym
ent o
ppor
tuni
ties a
broa
dId
entif
y fie
lds t
hat o
ffer h
igh
empl
oym
ent o
ppor
tuni
ties i
n th
e Ph
ilipp
ines
Wag
e pr
ospe
cts f
or d
iffer
ent f
ield
sId
entif
y fie
lds t
hat b
est f
it st
uden
ts’ in
tere
sts
Iden
tify f
ield
s tha
t bes
t fit
stud
ents
’ aca
dem
ic ap
titud
e an
d sk
ills
Ass
istan
ce in
inte
rpre
ting N
CAE
scor
esTy
pes o
f Inf
orm
atio
nQ
10. A
mon
g the
type
s of i
nfor
mat
ion
prov
ided
to st
uden
ts in
Q7,
rank
(1 b
eing
the
high
est)
the
info
rmat
ion
emph
asize
d by
care
er gu
idan
ce co
unse
lors
(ran
k will
dep
end
on th
e nu
mbe
r of ‘
yes’
answ
ers i
n Q
7)
PERC
ENT
Q13
. Wha
t are
the
thre
e m
ost p
opul
ar d
egre
es/c
ours
es c
hose
n by
stud
ents
gra
duat
ing
from
this
scho
ol?
[link
ed to
Q12
]
1 = A
gric
ultu
re a
nd re
late
d fie
lds
2 =
Engi
neer
ing
3 =
Scie
nce
and
mat
h 4
= In
form
atio
n te
chno
logy
5
= Te
ache
r edu
catio
n 6
= H
ealth
scie
nces
7
= A
rts a
nd h
uman
ities
8
= So
cial
and
beh
avio
ral s
cien
ces
9 =
Busin
ess a
dmin
istra
tion
and
rela
ted
cour
ses
10 =
Arc
hite
ctur
e 11
= M
ariti
me
12 =
Com
mun
icat
ion

77
YOU
TH E
DU
CATI
ON
INV
ESTM
ENT
AN
D L
ABO
R M
ARK
ET O
UTC
OM
ES S
URV
EY
THIS
INFO
RMAT
ION
IS ST
RICT
LY C
ON
FID
ENTI
AL A
ND
IS T
O B
E U
SED
FOR
STAT
ISTI
CAL P
URP
OSE
S O
NLY
.
HO
USE
HO
LD Q
UES
TIO
NN
AIR
E
SECT
ION
A-1
: HO
USE
HO
LD ID
ENTI
FICA
TIO
N
COD
E
1. P
ROVI
NCE
:
2. M
UN
ICIP
ALI
TY/C
ITY:
3. B
ARA
NG
AY:
4. L
OCA
LITY
(URB
AN
=1, R
URA
L=2)
:
5. S
CHO
OL
ID a
nd S
CHO
OL
NA
ME:
6. S
CHO
OL
TYPE
(PU
BLIC
=1, P
RIVA
TE 2
, ALS
=3)
7. N
AM
E A
ND
CO
DE
OF
STU
DEN
T:
8. N
AM
E A
ND
CO
DE
OF
STU
DEN
T:
9. N
AM
E A
ND
CO
DE
OF
STU
DEN
T:
10. F
ULL
HO
USE
HO
LD ID
ENTI
FICA
TIO
N N
UM
BER:
Ang
sarb
ey n
a ito
ay a
lam
at m
ay ka
pahi
ntul
utan
ng K
agaw
aran
ng E
duka
syon
ng P
ilipin
as. L
ahat
ng i
mpo
rmas
yon
na m
akok
olek
ta a
y pag
-iing
atan
at i
tutu
ring k
ompi
dens
yal (
This
surv
ey is
aut
horiz
ed b
y the
the
Dep
artm
ent o
f Edu
catio
n of
the
Philip
pine
s. A
ll inf
orm
atio
n co
llect
ed h
erei
n w
ill be
trea
ted
with
utm
ost c
are
and
are
stric
tly c
onfid
entia
l).
MA
RK B
OX
WIT
H A
N 'X
' IF M
ORE
TH
AN
ON
E ST
UD
ENT
FRO
M T
HE
SAM
E H
OU
SEH
OLD
WA
S SE
LECT
ED
DU
RIN
G T
HE
RAN
DO
M S
ELEC
TIO
N
CON
DU
CTED
AT
SCH
OO
L.
AD
DRE
SS A
ND
DES
CRIP
TIO
N O
F LO
CATI
ON
OF
HO
USE
HO
LD -
INCL
UD
E A
NY
IDEN
TIFY
ING
CH
ARA
CTER
ISTI
CS O
F D
WEL
LIN
G, N
AM
E O
F N
EIG
HBO
URI
NG
HO
USE
HO
LDS
& K
EY P
ERM
AN
ENT
CON
TACT
S, P
HO
NE
NU
MBE
R (I
F A
NY)
.
NONE . . . . . . 1
APP
END
IX 2
: Hou
seho
ld Q
uest
ionn
aire

Appendix 278
PAH
INTU
LOT
Ako
si _
____
____
____
____
____
____
____
____
___
(PA
NG
ALA
N N
G M
AG
ULA
NG
/GU
ARD
IAN
at P
IRM
A S
A T
AA
S N
G P
AN
GA
LAN
), __
____
____
____
____
____
____
___
(rel
asyo
n sa
ba
tang
kapa
pana
yam
in)
ay p
umap
ayag
na
mak
apan
ayam
ang
aki
ng a
nak n
a si
____
____
____
____
____
____
____
____
____
____
___
(PA
NG
ALA
N N
G B
ATA
) ni
____
____
____
____
____
____
____
(PA
NG
ALA
N N
G E
NU
MER
ATO
R) n
gayo
ng _
____
____
____
____
____
____
_, 2
016
(PET
SA).
PAN
IMU
LA
Mag
anda
ng a
raw
po!
Ako
si (P
AN
GA
LAN
NG
EN
UM
ERA
TOR)
, enu
mer
ator
par
a sa
pag
-aar
al p
ara
sa P
roye
kton
g You
th E
duca
tion
Inve
stm
ents
and
Lab
or M
arke
t Out
com
es S
urve
y in
the
Philip
pine
s (ip
akita
ang
ID
). A
ng a
min
g pag
-aar
al a
y ala
m a
t may
kapa
hint
ulut
an d
in p
o ng
Kag
awar
an n
g Edu
kasy
on (i
paki
ta a
ng M
emor
andu
m m
ula
sa D
epEd
). A
ng p
ag-a
aral
na
ito a
y nag
lala
yon
na ip
agpa
-ibay
uhin
ang
repo
rman
g hat
id n
g K-
12 sa
atin
g edu
kasy
on. N
ais p
o na
min
na
mag
ing k
atuw
ang n
amin
kay
o sa
gaw
aing
ito
sa p
amam
agita
n n
g p
agbi
biga
y in
yong
salo
obin
at k
aran
asan
sa p
agga
bay s
a in
yong
mga
ana
k sa
pagp
ili ng
kani
lang
ed
ucat
iona
l tra
cks s
a Se
nior
Hig
h Sc
hool
.
Kung
mam
arap
atin
nin
yo, n
ais k
o rin
pon
g hilin
gin
na a
ng in
yong
ana
k ay m
agin
g isa
sa m
ga re
spon
dent
ng p
ag-a
aral
na
ito. K
abila
ng sa
pag
-aar
al n
a ito
ang
pag
hing
i sa
Kaga
war
an n
g Edu
kasy
on n
g mga
dat
os sa
pa
aral
an n
g iny
ong a
nak g
aya
ng ka
nila
ng L
earn
er's
Prof
ile.
Maa
ri po
ban
g pirm
ahan
nin
yo a
ng b
ahag
ing i
to (C
onse
nt A
rea)
upa
ng p
atun
ay n
g iny
ong p
agpa
yag s
a pa
g-uu
sap
na it
o?

Appendix 2 79
SECT
ION
A-2
: SU
RVEY
STA
FF D
ETA
ILS
11. N
AM
E O
F EN
UM
ERA
TOR:
12. E
NU
MER
ATO
R CO
DE:
13. T
IME
INTE
RVIE
W S
TART
:A
MPM
14. D
ATE
OF
INTE
RVIE
W (D
D/M
M/Y
Y):
15. N
AM
E O
F FI
ELD
SU
PERV
ISO
R:
16. F
IELD
SU
PERV
ISO
R CO
DE:
MEA
NIN
GS
FOR
COM
MO
N S
KIP
PATT
ERN
S/A
BBRE
VIA
TIO
NS
►SK
IP T
O A
SPE
CIFI
C Q
UES
TIO
N IF
CH
OSE
N
► N
EXT
PERS
ON
SKIP
TO
TH
E N
EXT
PERS
ON
IF C
HO
SEN
► N
EXT
SECT
ION
SKIP
TO
TH
E N
EXT
MO
DU
LE/S
ECTI
ON
IF C
HO
SEN
PHP
PHIL
IPPI
NE
PESO
S
OBS
ERVA
TIO
NS
DU
RIN
G T
HE
INTE
RVIE
WRE
CORD
GEN
ERA
L N
OTE
S A
BOU
T TH
E IN
TERV
IEW
AN
D R
ECO
RD A
NY
SPEC
IAL
INFO
RMA
TIO
N T
HA
T W
ILL
BE
HEL
PFU
L FO
R SU
PERV
ISO
RS A
ND
TH
E A
NA
LYSI
S O
F TH
IS Q
UES
TIO
NN
AIR
E.
17. D
ATE
OF
QU
ESTI
ON
NA
IRE
INSP
ECTI
ON
(D
D/M
M/Y
Y):
(EN
UM
ERA
TOR ►
NEX
T PA
GE)
18. T
IME
HO
USE
HO
LD Q
UES
TIO
NN
AIR
E IN
TERV
IEW
EN
DED
19. D
ATE
HO
USE
HO
LD IN
TERV
IEW
EN
DED
(D
D/M
M/Y
Y):
Appendix 280
SECT
ION
B: H
OU
SEH
OLD
MEM
BER
ROST
ER
1.2.
3.4.
5.6.
7.8a
.8b
.
I N D I V I D U A L I D
NA
ME
Sex
Wha
t is [
NA
ME]
's re
latio
nshi
p to
the
head
of h
ouse
hold
?IS
TH
IS P
ERSO
N
AN
SWER
ING
FO
R H
IMSE
LF/
HER
SELF
?
WH
AT
IS T
HE
ID C
OD
E O
F TH
E PE
RSO
N
AN
SWER
ING
FO
R [N
AM
E]?
Is [N
AM
E] a
n O
FW?
Has
[NA
ME]
be
en a
CCT
be
nefic
iary
?
How
long
has
[N
AM
E]
been
a C
CT
bene
ficia
ry?
(mon
ths)
YEA
RSID
CO
DE
1 2 3
4 5 6 7 8 9 10 11 12
How
old
is [N
AM
E]?
PU
T "9
99" I
F D
ON
'T
KNO
WLI
ST H
OU
SEH
OLD
HEA
D
ON
LIN
E 1.
HO
USE
HO
LD
HEA
D IS
SO
MEO
NE
WH
O
MA
KES
THE
FIN
AN
CIA
L D
ECIS
ION
S IN
TH
E H
OU
SEH
OLD
. M
AKE
A C
OM
PLET
E LI
ST
OF
ALL
IND
IVID
UA
LS W
HO
N
ORM
ALL
Y LI
VE A
ND
EA
T TH
EIR
MEA
LS T
OG
ETH
ER
IN T
HIS
HO
USE
HO
LD,
STA
RTIN
G W
ITH
TH
E H
EAD
OF
HO
USE
HO
LD.
OVE
RSEA
S FO
REIG
N
WO
RKER
S (O
FWs)
ARE
A
LSO
INCL
UD
ED A
S PA
RT
OF
THE
HO
USE
HO
LD.
(CO
NFI
RM T
HA
T H
OU
SEH
OLD
HEA
D H
ERE
IS S
AM
E A
S H
OU
SEH
OLD
H
EAD
LIS
TED
ON
CO
VER.
)
IN O
RDER
TO
MA
KE A
CO
MPR
EHEN
SIVE
LIS
T O
F H
OU
SEH
OLD
MEM
BERS
, USE
TH
E FO
LLO
WIN
G P
ROBI
NG
Q
UES
TIO
NS
TO T
HE
HEA
D O
F TH
E H
OU
SEH
OLD
:
1. Fi
rst,
ask
nam
es o
f all
the
imm
edia
te fa
mily
of t
he h
ouse
hold
he
ad w
ho n
orm
ally
live
and
eat
thei
r mea
ls to
geth
er h
ere.
2.
Writ
e do
wn
nam
es, s
ex, a
ge a
nd
rela
tions
hip
to h
ouse
hold
hea
d.
FILL
IN Q
UES
TIO
NS
1 TO
5.
3. T
hen
ask
nam
es o
f any
oth
er
pers
ons r
elat
ed to
the
head
of t
he
hous
ehol
d or
any
othe
r hou
seho
ld
mem
ber t
hat n
orm
ally
lives
and
eats
thei
r mea
ls to
geth
er h
ere.
FI
LL IN
QU
ESTI
ON
S 1 T
O 5
4. A
lso as
k ab
out o
ther
per
sons
no
t her
e w
ho n
orm
ally
live
and
eat
thei
r mea
ls he
re. F
or e
xam
ple,
ho
useh
old
mem
bers
stud
ying
el
sew
here
or t
rave
ling.
FI
LL IN
QU
ESTI
ON
S 1 T
O 5
. 5.
The
n as
k na
mes
of a
ny o
ther
pe
rson
s not
rela
ted
to th
e he
ad o
f th
e ho
useh
old
or o
ther
hou
seho
ld
mem
bers
, but
who
nor
mal
ly liv
e an
d ea
t the
ir m
eals
toge
ther
her
e su
ch as
live
-in
serv
ants
. FI
LL IN
QU
ESTI
ON
S 1 T
O 5
ALL
IN
DIV
IDU
ALS
OF
OR
ABO
VE T
HE
AG
E O
F 12
MU
ST
AN
SWER
BY
THEM
SELV
ES. I
F <1
2 O
R N
OT
AVA
ILA
BLE,
TH
E M
OST
IN
FORM
ED
HO
USE
HO
LD
MEM
BER
SHO
ULD
RE
SPO
ND
.
MA
LE ....
......1
FEM
ALE
....2
HEA
D ...
........
........
........
........
........
........
........
1SP
OU
SE ...
........
........
........
........
........
........
...2
SON
/DAU
GH
TER
........
........
........
........
.3ST
EPSO
N/S
TEPD
AUG
HTE
R ....
.......
4SI
STER
/BRO
THER
.......
........
........
........
.5G
RAN
DCH
ILD
.......
........
........
........
........
.6FA
THER
/MO
THER
.......
........
........
........
7SO
N/D
AUG
HTE
R IN
LAW
.......
........
8BR
OTH
ER/S
ISTE
R IN
LAW
........
.......
9FA
THER
/MO
THER
IN L
AW ...
.......
10O
THER
REL
ATIV
E (S
PECI
FY) .
......1
1O
THER
NO
N R
ELAT
IVES
(S
PECI
FY) .
........
........
........
........
........
......1
4
YES
........
.1 ►
7N
O ....
.....2
YES
........
1
N
O ....
.....2
►9
SECT
ION
B: H
OU
SEH
OLD
MEM
BER
ROST
ER
YES
........
.....1
NO
........
......2

Appendix 2 81
9.11.
12.
13.
14.
Wha
t is t
he h
ighe
st gr
ade
com
plet
ed b
y [N
AM
E]?
Has
[NA
ME]
ev
er a
tten
ded
a te
chni
cal-
voca
tiona
l ce
rtific
ate
to
impr
ove
empl
oym
ent
pros
pect
s for
the
past
5 ye
ars?
Wha
t kin
d of
tech
nica
l-voc
atio
nal c
ertif
icat
e co
urse
did
(NA
ME)
take
? [In
dica
te a
ll tha
t ap
plie
s]
Dur
atio
n of
te
chni
cal-
voca
tiona
l ce
rtific
ate
cour
se?
(mon
ths)
Did
(NA
ME)
rece
ive
a di
plom
a fo
r te
chni
cal-v
ocat
iona
l ce
rtific
ate
cour
se?
Dur
atio
n Fi
eld/
Spec
ializ
atio
n
If "D
iplo
ma"
and
abo
ve in
item
9,
10.
No
scho
olin
g .....
........
........
........
........
........
.1Pr
e-sc
hool
........
........
........
........
........
........
...2
PRIM
ARY
G1
........
........
........
........
........
........
........
........
..3G
2 ....
........
........
........
........
........
........
........
......4
G3
........
........
........
........
........
........
........
........
..5
G4
........
........
........
........
........
........
........
........
..6G
5 ....
........
........
........
........
........
........
........
..... 7
G6
........
........
........
........
........
........
........
........
..8G
7 ....
........
........
........
........
........
........
........
......9
JUN
IOR
HIG
HJH
1 .....
........
........
........
........
........
........
........
10JH
2 .....
........
........
........
........
........
........
........
11JH
3 .....
........
........
........
........
........
........
........
12
JH4 .
........
........
........
........
........
........
........
....13
VOCA
TIO
NA
L U
PPER
SE
CON
DA
RYV1
........
........
........
........
........
........
........
........
14V2
........
........
........
........
........
........
........
........
15SE
NIO
R H
IGH
SH
1.....
........
........
........
........
........
........
........
16SH
2.....
........
........
........
........
........
........
........
17
A&
E A
ccre
dita
tion
Elem
enta
ry ...
....18
A&
E A
ccre
dita
tion
Elem
enta
ry ...
....19
POST
SEC
ON
DA
RY N
ON
-TE
RTIA
RYPS
1 .....
........
........
........
........
........
........
........
.20
PS2 .
........
........
........
........
........
........
........
.....2
1PS
3 .....
........
........
........
........
........
........
........
.22
PRE-
BACC
ALA
URE
ATE/
CE
RTIF
ICAT
E/D
IPLO
MA
PCD
.......
........
........
........
........
........
........
.....2
3
BACH
ELO
R’s
B1 ....
........
........
........
........
........
........
........
....24
B2 ....
........
........
........
........
........
........
........
....25
B3
........
........
........
........
........
........
........
........
26
B4 ....
........
........
........
........
........
........
........
....27
B5 ....
........
........
........
........
........
........
........
....28
MA
STER
S &
ABO
VEM
1.....
........
........
........
........
........
........
........
..29
PHD
........
........
........
........
........
........
........
....30
EDU
CATI
ON
.......
........
........
........
........
........
........
........
........
........
........
........
........
........
1BU
SIN
ESS
AD
MIN
ISTR
ATIO
N,
ACCO
UN
TAN
CY, C
OM
MER
CE, R
ETA
IL S
HO
P
MA
NAG
EMEN
T, E
CON
OM
ICS,
etc
. ......
........
........
........
........
........
........
......2
PUBL
IC A
DM
INIS
TRAT
ION
and
PLA
NN
ING
.......
........
........
........
........
.....3
LAW
and
LEG
AL
SERV
ICES
.......
........
........
........
........
........
........
........
........
........
...4
MED
ICA
L, H
EALT
H S
ERVI
CES,
NU
RSIN
G,e
tc. ..
........
........
........
........
........
5SC
IEN
CE,M
ATH
EMAT
ICS,
COM
PUTI
NG
, etc
. .....
........
........
........
........
....6
OTH
ER T
ECH
NIC
AL
& E
NG
INEE
RIN
G,
INCL
UD
ING
ARC
HIT
ECTU
RE, I
ND
UST
RY,
CRA
FT, B
UIL
DIN
G T
RAD
ES,e
tc...
........
........
........
........
........
........
........
........
..7AG
RICU
LTU
RE,L
IVES
TOCK
,FO
REST
RY ....
........
........
........
........
........
........
...8
SOCI
AL
AN
D B
EHAV
IORA
L ST
UD
IES,
M
EDIA
, CU
LTU
RE,S
PORT
AN
D L
EISU
RE S
TUD
IES,
TO
URI
SM, e
tc. ..
........
........
........
........
........
........
........
........
........
........
........
........
.......
9A
RT O
R H
UM
AN
ITIE
S-LA
NG
UAG
ES,
CLA
SSIC
S, H
ISTO
RY,T
HEO
LOG
Y,et
c. ...
........
........
........
........
........
........
..10
PERS
ON
AL
CARE
SER
VICE
S-CA
TERI
NG
, D
OM
ESTI
C SC
IEN
CE,H
AIR
DRE
SSIN
G, e
tc. ..
........
........
........
........
........
..11
PUBL
IC O
RDER
AN
D S
AFE
TY—
POLI
CE,
ARM
Y, F
IRE
SERV
ICES
, etc
........
........
........
........
........
........
........
........
........
......1
2G
ENER
AL
or n
o SP
ECIF
IC F
IELD
.......
........
........
........
........
........
........
........
......1
3O
THER
(SPE
CIFY
) .....
........
........
........
........
........
........
........
........
........
........
........
.....1
4
YES
........
.1
NO
........
...2 ►
15
AGRI
CULT
URE
AN
D F
ISH
ERY
........
........
........
........
........
..1AU
TOM
OTI
VE ...
........
........
........
........
........
........
........
........
.......
2CO
NST
RUCT
ION
........
........
........
........
........
........
........
........
....3
ELEC
TRO
NIC
S .....
........
........
........
........
........
........
........
........
.....4
FOO
TWEA
R A
ND
LEA
THER
GO
OD
S .....
........
........
......5
FURN
ITU
RES
AN
D F
IXTU
RES .
........
........
........
........
........
.6G
ARM
ENTS
.......
........
........
........
........
........
........
........
........
........
.7H
EALT
H, S
OCI
AL
AN
D O
THER
CO
MM
UN
ITY
DEV
ELO
PMEN
T SE
RVIC
ES ...
........
........
........
........
........
...8
HEA
TIN
G, V
ENTI
LATI
ON
, AIR
CON
DIT
ION
ING
A
ND
REF
RIG
ERAT
ION
........
........
........
........
........
........
.......
9IN
FORM
ATIO
N A
ND
CO
MM
UN
ICAT
ION
S TE
CHN
OLO
GY
........
........
........
........
........
........
........
........
...10
LAN
D T
RAN
SPO
RTAT
ION
........
........
........
........
........
......1
1M
ARI
TIM
E .....
........
........
........
........
........
........
........
........
........
...12
MET
ALS
AN
D E
NG
INEE
RIN
G ....
........
........
........
........
....13
PRO
CESS
ES F
OO
D A
ND
BEV
ERAG
ES ...
........
........
....14
TOU
RISM
(HO
TEL
AN
D R
ESTA
URA
NT
........
........
...15
OTH
ER, S
PECI
FY ....
........
........
........
........
........
........
........
.......
16
YES
........
.....1
NO
........
......2

Appendix 282
15.
16.
18.
19.
20.
21.
22.
23.
24.
25.
26.
Wha
t is [
NA
ME]
's cu
rrent
mar
ital s
tatu
s?D
oes/
Do
the
spou
se(s
)/
partn
er(s
) liv
e in
this
hous
ehol
d no
w?
Did
(NA
ME)
do
any
wor
k at
all e
ven
for
only
one
hou
r du
ring t
he
past
wee
k?
Alth
ough
(N
AM
E) d
id
not w
ork,
did
(NA
ME)
ha
ve a
job
or
busin
ess
durin
g the
pa
st w
eek?
In th
e la
st 12
m
onth
s , di
d [N
AM
E] ru
n a
non-
farm
bu
sines
s of
any s
ize fo
r th
emse
lves
or
the
hous
ehol
d,
even
if fo
r on
e ho
ur?
In th
e la
st 12
m
onth
s, di
d [N
AM
E]
help
in a
ny
kind
of n
on-
farm
bu
sines
s run
by
this
hous
ehol
d,
even
if fo
r on
e ho
ur?
In th
e la
st 12
m
onth
s, di
d [N
AM
E] w
ork
on h
ouse
hold
ag
ricul
tura
l ac
tiviti
es
(incl
udin
g fa
rmin
g, ra
ising
liv
esto
ck o
r fis
hing
, whe
ther
fo
r sal
e or
for
hous
ehol
d fo
od) e
ven
if ju
st fo
r one
ho
ur?
CHEC
K: Q
18-
24: I
S TH
E A
NSW
ER T
O
AT
LEA
ST
ON
E Q
UES
TIO
N A
'Y
ES'?
PRIM
ARY
SECO
ND
ARY
LIST
UP
TO T
WO
17.
WRI
TE ID
CO
DE
OF
(NA
ME)
's Sp
ouse
Base
d on
the
resp
onse
s jus
t giv
en fo
r wor
k/jo
b in
the
last
12 m
onth
s, ho
w w
ould
(NA
ME)
de
fine
his/
her p
rimar
y and
seco
ndar
y act
ivity
?
In th
e la
st 12
m
onth
s, di
d [N
AM
E] h
ad to
le
ave
from
w
ork o
n ho
useh
old
agric
ultu
ral
activ
ities
(in
clud
ing
farm
ing,
raisi
ng
lives
tock
or
fishi
ng, w
heth
er
for s
ale
or fo
r ho
useh
old
food
) due
to
tem
pora
ry
illnes
s/in
jury
, va
catio
n or
ot
her r
easo
ns?
With
in th
e ne
xt
two
wee
ks, is
[N
AM
E]
expe
cted
to go
ba
ck to
wor
k on
hous
ehol
d ag
ricul
tura
l ac
tiviti
es
(incl
udin
g fa
rmin
g, ra
ising
liv
esto
ck o
r fis
hing
, whe
ther
fo
r sal
e or
for
hous
ehol
d fo
od)?
YES
.......1
►20
NO
........
2
YES
.......1
►20
NO
........
2
YES
........
1
NO
........
.2 ►
18
YES
........
.....1
NO
........
......2
YES
........
.....1
NO
........
......2
YES
........
.....1
NO
........
......2
YES
........
.....1
NO
........
......2
YES
........
.....1
NO
........
......2
YES
........
..1
NO
........
....2
►50
WAG
E W
ORK
ERS .
........
........
........
........
........
........
........
........
...1SE
LF E
MPL
OYE
D (N
ON
-AG
RIC
):
WIT
H P
AID
EM
PLO
YEES
........
........
........
........
........
........
.2
WIT
HO
UT
PAID
EM
PLO
YEES
.......
........
........
........
.......3
SELF
EM
PLO
YED
(AG
RIC
):
WIT
H P
AID
EM
PLO
YEES
........
........
........
........
........
........
.4
WIT
HO
UT
PAID
EM
PLO
YEES
.......
........
........
........
.......5
UN
PAID
FA
MIL
Y H
ELPE
R (N
ON
-AG
RIC
) .....
........
.....6
UN
PAID
FA
MIL
Y H
ELPE
R (A
GRI
C) .
........
........
........
.......7
UN
PAID
APP
REN
TICE
SHIP
........
........
........
........
........
........
8O
THER
, SPE
CIFY
........
........
........
........
........
........
........
........
......9
MA
RRIE
D ...
........
........
........
...1
LIVI
NG
TO
GET
HER
.......
........
........
2SE
PARA
TED
.......
........
........
..3
(►
18)
AN
NU
LED
.......
........
........
.....4
(►
18)
NEV
ER M
ARR
IED
........
......5
(►18
)W
IDO
W(E
R) ...
........
........
....6
(►18
)D
IVO
RCED
.......
........
........
....7
(►18
)

Appendix 2 83
27.
28.
29.
30.
31.
32.
33.
34.
35.
For w
age
wor
kers
O
NLY
, are
you
entit
led
to p
aid
leav
e in
your
pr
esen
t job
?
For w
age
wor
kers
O
NLY
, do
you
have
a
lega
l writ
ten
cont
ract
w
ith yo
ur e
mpl
oyer
?
For w
age
wor
kers
ON
LY, is
(N
AM
E)'s
empl
oyer
for t
his
wor
k…
For w
age
wor
kers
ON
LY,
how
man
y yea
rs h
as
[NA
ME]
wor
ked
for t
his
empl
oyer
?
How
man
y yea
rs h
as
(NA
ME)
wor
ked
for t
his
spec
ific
occu
patio
n?
App
roxim
atel
y ho
w m
any w
age
wor
kers
are
us
ually
em
ploy
ed in
th
e es
tabl
ishm
ent
whe
re (N
AM
E)
wor
ks? (
incl
ude
NA
ME)
How
use
ful w
ere
(NA
ME)
's fo
rmal
edu
catio
n fo
r thi
s wor
k?
DES
CRIP
TIO
NCO
DE
DES
CRIP
TIO
NCO
DE
NU
MBE
R
Wha
t kin
d of
trad
e or
bus
ines
s is
it co
nnec
ted
with
?
[CO
DE:
PSI
C SE
CTO
R][C
OD
E: P
SOC
COD
E]
Wha
t kin
d of
wor
k doe
s (N
AM
E) u
sual
ly d
o in
this
job?
DES
CRIB
E TH
E O
CCU
PATI
ON
A
ND
MA
IN T
ASK
S O
R D
UTI
ES
IN A
T LE
AST
2 W
ORD
S.
PRIM
ARY
JOB
YES
........
.....1
NO
........
......2
YES
........
.....1
NO
........
......2
NO
T U
SEFU
L AT
ALL
........
........
......1
SOM
EWH
AT U
SEFU
L .....
........
........
2U
SEFU
L .....
........
........
........
........
........
.....3
VERY
USE
FUL .
........
........
........
........
....4
RESP
ON
DEN
T H
AD
NO
ED
UCA
TIO
N ...
........
........
........
........
....5
GO
VERN
MEN
T ....
........
........
........
1PO
LITI
CAL
PART
Y ....
........
........
..2CO
OPE
RATI
VE....
........
........
........
..3N
GO
......
........
........
........
........
........
....4
INT’
L O
RG ...
........
........
........
........
....5
RELI
GIO
US
ORG
.......
........
........
...6PR
IVAT
E SE
CTO
R ....
........
........
....7
OTH
ER, S
PECI
FY ....
........
........
......8
Appendix 284
36.
37.
39.
40.
41.
42.
Wha
t min
imum
leve
l of f
orm
al e
duca
tion
do yo
u th
ink
wou
ld b
e re
quire
d be
fore
som
eone
wou
ld b
e ab
le to
ca
rry o
ut th
is w
ork?
How
man
y yea
rs
of w
ork
expe
rienc
e in
ot
her r
elat
ed w
ork
do yo
u th
ink
wou
ld b
e re
quire
d be
fore
som
eone
w
ith [L
EVEL
OF
EDU
CATI
ON
IN
THE
PREV
IOU
S Q
UES
TIO
N]
wou
ld b
e ab
le to
ca
rry o
ut th
is w
ork?
For w
age
wor
kers
O
NLY
, are
you
entit
led
to p
aid
leav
e in
your
pr
esen
t job
?
For w
age
wor
kers
O
NLY
, do
you
have
a
lega
l writ
ten
cont
ract
w
ith yo
ur e
mpl
oyer
?
For e
mpl
oyee
s ON
LYIs
[NA
ME]
's em
ploy
er fo
r th
is w
ork…
For w
age
wor
kers
ON
LY,
how
man
y yea
rs h
as
[NA
ME]
wor
ked
for t
his
empl
oyer
?
YEA
RS
38.
In th
is PR
IMA
RY jo
b, h
ow m
uch
was
(NA
ME)
's to
tal in
com
e in
the
last
12 m
onth
s?
Sala
ry p
er fr
eque
ncy
spec
ified
in p
revi
ous
ques
tion
mon
th/w
eek/
day
(PH
P)
No.
of m
onth
s em
ploy
ed fo
r the
la
st 12
mon
ths
Freq
uenc
y of s
alar
y1-
mon
thly
2-w
eekl
y3-
daily
SEC
ON
DA
RY JO
B
NO
FO
RMA
L ED
UCA
TIO
N/B
ELO
W P
RIM
ARY
........
........
..1CO
MPL
ETED
PRI
MA
RY E
DU
CATI
ON
.......
........
........
........
......2
COM
PLET
ED JU
NIO
R H
IGH
SCH
OO
L .....
........
........
........
......3
CO
MPL
ETED
VO
CATI
ON
AL
UPP
ER S
ECO
ND
ARY
.......
..4CO
MPL
ETED
SEN
IOR
HS .
........
........
........
........
........
........
........
......5
COM
PLET
ED P
OST
-SEC
ON
DA
RY N
ON
-TER
TIA
RY
EDU
CATI
ON
.......
........
........
........
........
........
........
........
........
........
.......
6CO
MPL
ETED
PRE
-BAC
CALA
URE
ATE/
CER
TIFI
CATE
/D
IPLO
MA
........
........
........
........
........
........
........
........
........
........
........
.....7
BACH
ELO
R’S
DEG
REE
........
........
........
........
........
........
........
........
.....8
MA
STER
’S D
EGRE
E .....
........
........
........
........
........
........
........
........
.......
9Ph
.D a
nd a
bove
.......
........
........
........
........
........
........
........
........
........
....10
OTH
ER, S
PECI
FY ....
........
........
........
........
........
........
........
........
........
...11
YES
........
.....1
NO
........
......2
YES
........
.....1
NO
........
......2
GO
VERN
MEN
T ....
........
........
....1
POLI
TICA
L PA
RTY
........
........
..2CO
OPE
RATI
VE....
........
........
......3
NG
O ..
........
........
........
........
........
....4
INT’
L O
RG ...
........
........
........
........
5RE
LIG
IOU
S O
RG ...
........
........
...6
PRIV
ATE
SECT
OR
........
........
....7
OTH
ER, S
PECI
FY ....
........
........
..8

Appendix 2 85
43.
44.
45.
46.
47.
48.
49.
How
man
y yea
rs
has [
NA
ME]
w
orke
d fo
r thi
s sp
ecifi
c oc
cupa
tion?
App
roxim
atel
y ho
w m
any p
aid
wor
kers
are
us
ually
em
ploy
ed
in th
e es
tabl
ishm
ent
whe
re yo
u w
ork?
(in
clud
e yo
urse
lf)
How
use
ful w
ere
your
stud
ies
durin
g you
r for
mal
edu
catio
n fo
r thi
s wor
k?
Wha
t min
imum
leve
l of f
orm
al e
duca
tion
do
you
thin
k wou
ld b
e re
quire
d be
fore
so
meo
ne w
ould
be
able
to c
arry
out
this
wor
k?
How
man
y ye
ars o
f wor
k ex
perie
nce
in
othe
r rel
ated
w
ork d
o yo
u th
ink w
ould
be
requ
ired
befo
re
som
eone
with
[L
EVEL
OF
EDU
CATI
ON
IN
TH
E PR
EVIO
US
QU
ESTI
ON
] w
ould
be
able
to
carry
out
this
wor
k?
DES
CRIP
TIO
NCO
DE
DES
CRIP
TIO
NCO
DE
NU
MBE
R
YEA
RS
50.
In th
is se
cond
ary j
ob, h
ow m
uch
was
[NA
ME]
's to
tal
inco
me
in th
e la
st 12
mon
ths?
No.
of m
onth
s em
ploy
ed fo
r th
e la
st 12
m
onth
s
Freq
uenc
y of s
alar
y1-
mon
thly
2-w
eekl
y3-
daily
Sala
ry p
er
freq
uenc
y sp
ecifi
ed in
pr
evio
us
ques
tion
mon
th/w
eek/
day
(PH
P)
Wha
t kin
d of
wor
k doe
s [N
AM
E] u
sual
ly d
o in
this
job?
DES
CRIB
E TH
E O
CCU
PATI
ON
AN
D M
AIN
TA
SKS
OR
DU
TIES
IN A
T LE
AST
2 W
ORD
S.
Wha
t kin
d of
trad
e or
bus
ines
s is
it co
nnec
ted
with
?
[CO
DE:
PSO
C CO
DE]
[CO
DE:
PSI
C SE
CTO
R]
NO
T U
SEFU
L AT
ALL
........
........
......1
SOM
EWH
AT U
SEFU
L .....
........
........
2U
SEFU
L .....
........
........
........
........
........
.....3
VERY
USE
FUL .
........
........
........
........
....4
RESP
ON
DEN
T H
AD
N
O E
DU
CATI
ON
.......
........
........
....5
NO
FO
RMA
L ED
UCA
TIO
N/B
ELO
W
PRIM
ARY
.......
........
........
........
........
........
........
........
........
.1CO
MPL
ETED
PRI
MA
RY E
DU
CATI
ON
.......
........
2CO
MPL
ETED
JUN
IOR
HIG
H S
CHO
OL .
........
....3
COM
PLET
ED V
OCA
TIO
NA
L U
PPER
SE
CON
DA
RY ....
........
........
........
........
........
........
........
....4
COM
PLET
ED S
ENIO
R H
S .....
........
........
........
........
....5
COM
PLET
ED P
OST
-SEC
ON
DA
RY N
ON
-TE
RTIA
RY E
DU
CATI
ON
........
........
........
........
........
.6CO
MPL
ETED
PRE
-BAC
CALA
URE
ATE/
CE
RTIF
ICAT
E/D
IPLO
MA
........
........
........
........
.......
7BA
CHEL
OR’
S D
EGRE
E ....
........
........
........
........
........
...8
MA
STER
’S D
EGRE
E .....
........
........
........
........
........
........
.9Ph
.D a
nd a
bove
.......
........
........
........
........
........
........
......1
0O
THER
, SPE
CIFY
........
........
........
........
........
........
........
.11
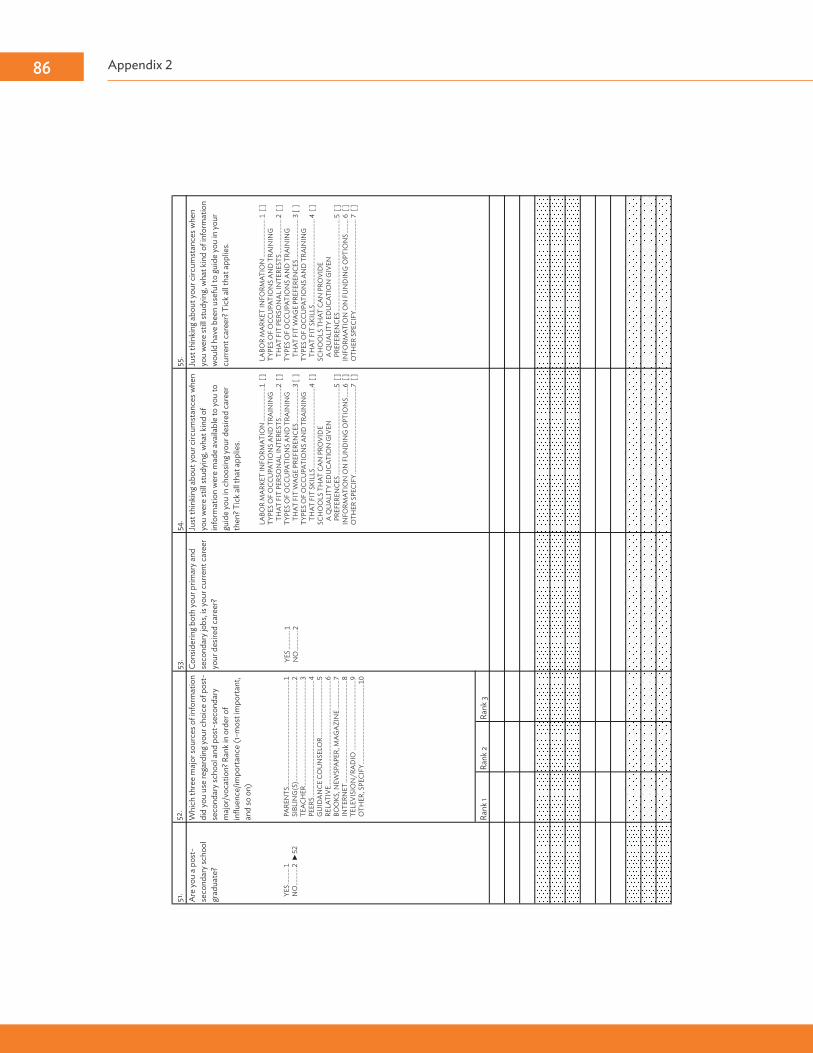
Appendix 286
51.
53.
54.
55.
Are
you
a po
st-
seco
ndar
y sch
ool
grad
uate
?
Cons
ider
ing b
oth
your
prim
ary a
nd
seco
ndar
y job
s, is
your
cur
rent
car
eer
your
des
ired
care
er?
Just
thin
king
abo
ut yo
ur c
ircum
stan
ces w
hen
you
wer
e st
ill st
udyi
ng, w
hat k
ind
of
info
rmat
ion
wer
e m
ade
avai
labl
e to
you
to
guid
e yo
u in
cho
osin
g you
r des
ired
care
er
then
? Tic
k all t
hat a
pplie
s.
Just
thin
king
abo
ut yo
ur c
ircum
stan
ces w
hen
you
wer
e st
ill st
udyi
ng, w
hat k
ind
of in
form
atio
n w
ould
hav
e be
en u
sefu
l to
guid
e yo
u in
your
cu
rrent
car
eer?
Tic
k all t
hat a
pplie
s.
Rank
1Ra
nk 2
Rank
3
Whi
ch th
ree
maj
or so
urce
s of i
nfor
mat
ion
did
you
use
rega
rdin
g you
r cho
ice
of p
ost-
seco
ndar
y sch
ool a
nd p
ost-
seco
ndar
y m
ajor
/voc
atio
n? R
ank i
n or
der o
f in
fluen
ce/im
porta
nce
(1-m
ost i
mpo
rtant
, an
d so
on)
52.
YES
........
...1
N
O ....
........
2 ►
52
PARE
NTS
........
........
........
........
........
........
........
........
........
...1
SIBL
ING
(S) ..
........
........
........
........
........
........
........
........
.....2
TE
ACH
ER ....
........
........
........
........
........
........
........
........
......3
PE
ERS .
........
........
........
........
........
........
........
........
........
........
.4
GU
IDA
NCE
CO
UN
SELO
R .....
........
........
........
........
...5
RELA
TIVE
........
........
........
........
........
........
........
........
........
..6
BOO
KS, N
EWSP
APE
R, M
AGA
ZIN
E ....
........
........
7 IN
TERN
ET ...
........
........
........
........
........
........
........
........
.....8
TE
LEVI
SIO
N/R
AD
IO ..
........
........
........
........
........
.......9
O
THER
, SPE
CIFY
........
........
........
........
........
........
........
10
YES
........
.....1
NO
........
......2
LABO
R M
ARK
ET IN
FORM
ATIO
N ...
........
........
.....1
[ ]
TYPE
S O
F O
CCU
PATI
ON
S A
ND
TRA
ININ
G
THAT
FIT
PER
SON
AL
INTE
REST
S .....
........
........
2 [
] TY
PES
OF
OCC
UPA
TIO
NS
AN
D T
RAIN
ING
TH
AT F
IT W
AGE
PREF
EREN
CES .
........
........
........
3 [
]TY
PES
OF
OCC
UPA
TIO
NS
AN
D T
RAIN
ING
TH
AT F
IT S
KILL
S .....
........
........
........
........
........
........
....4
[ ]
SCH
OO
LS T
HAT
CA
N P
ROVI
DE
A
QU
ALI
TY E
DU
CATI
ON
GIV
EN
PREF
EREN
CES .
........
........
........
........
........
........
........
.....5
[ ]
INFO
RMAT
ION
ON
FU
ND
ING
OPT
ION
S .....
..6 [
]O
THER
SPE
CIFY
.......
........
........
........
........
........
........
......7
[ ]
LABO
R M
ARK
ET IN
FORM
ATIO
N ...
........
........
........
1 [
]TY
PES
OF
OCC
UPA
TIO
NS
AN
D T
RAIN
ING
TH
AT F
IT P
ERSO
NA
L IN
TERE
STS .
........
........
.......
2 [
] TY
PES
OF
OCC
UPA
TIO
NS
AN
D T
RAIN
ING
TH
AT F
IT W
AGE
PREF
EREN
CES .
........
........
........
...3
[ ]
TYPE
S O
F O
CCU
PATI
ON
S A
ND
TRA
ININ
G
THAT
FIT
SKI
LLS .
........
........
........
........
........
........
........
...4
[ ]
SCH
OO
LS T
HAT
CA
N P
ROVI
DE
A
QU
ALI
TY E
DU
CATI
ON
GIV
EN
PREF
EREN
CES .
........
........
........
........
........
........
........
........
5 [
]IN
FORM
ATIO
N O
N F
UN
DIN
G O
PTIO
NS .
........
.6 [
]O
THER
SPE
CIFY
.......
........
........
........
........
........
........
........
.7 [
]

Appendix 2 87
SECT
ION
C: H
OU
SIN
G, W
ATE
R an
d SA
NIT
ATI
ON
[ASK
HO
USE
HO
LD H
EAD
]
5.6.
3.
Wha
t is t
he h
ouse
hold
's m
ajor
fu
el u
sed
for l
ight
ing?
7.4.
The
toile
t and
ba
thro
om a
re in
side
the
dwel
ling.
Wha
t is t
he m
ain
sour
ce o
f w
ater
for h
ouse
hold
act
iviti
es
(coo
king
, cle
anin
g, ba
thin
g, et
c)?
PHP
How
did
you
get t
his d
wel
ling?
How
muc
h do
es th
is ho
useh
old
pay p
er m
onth
to re
nt th
is dw
ellin
g?
PHP
The
roof
of t
he m
ain
dwel
ling a
re
pred
omin
antly
mad
e of
wha
t m
ater
ials?
1.2.
Estim
ate
the
rent
per
mon
th
you
coul
d re
ceiv
e if
you
rent
ed th
is dw
ellin
g?
COM
BIN
E BO
TH C
ASH
AN
D IN
-KIN
D
PAYM
ENTS
FO
R RE
NT
SECT
ION
C: H
OU
SIN
G, W
ATER
, AN
D S
AN
ITAT
ION
OW
NER
/CO
-OW
NER
........
........
........
........
........
........
.......
1 ►
3M
ORT
GAG
ED/B
EIN
G P
URC
HA
SED
........
........
........
..2 ►
3EM
PLO
YER-
PRO
VID
ED/S
UBS
IDIZ
ED ....
........
........
...3 ►
3EM
PLO
YER-
PRO
VID
ED (F
REE)
........
........
........
........
.....4
►3
REN
TED
IN ..
........
........
........
........
........
........
........
........
........
...5
REN
TED
FRE
E w
/ CO
NSE
NT
........
........
........
........
........
.6 ►
3RE
NTE
D F
REE
w/o
CO
NSE
NT
.......
........
........
........
.......
7 ►
3O
THER
, SPE
CIFY
........
........
........
........
........
........
........
........
...8 ►
3
STRO
NG
MAT
ERIA
LS (G
ALV
AN
IZED
IR
ON
, ALU
MIN
UM
, TIL
E, C
ON
CRET
E,
BRIC
K, S
TON
E, A
SBES
TOS .
........
........
........
......1
LI
GH
T M
ATER
IALS
(CO
GO
N,
NIP
A A
NA
HAW
.......
........
........
........
........
........
......2
SALV
AGED
/MA
KESH
IFTM
ATER
IAL .
........
.....3
M
IXED
, BU
T PR
EDO
MIN
AN
TLY
ST
RON
G M
ATER
IALS
........
........
........
........
........
..4M
IXED
, BU
T PR
EDO
MIN
AN
TLY
LI
GH
T M
ATER
IALS
.......
........
........
........
........
........
5M
IXED
BU
T PR
EDO
MIN
AN
TLY
SA
LVAG
ED M
ATER
IALS
.......
........
........
........
......6
NO
T A
PPLI
CABL
E .....
........
........
........
........
........
.......7
YES
.....1
NO
......2
IN
DO
OR
TAP .
........
........
........
........
........
1N
EIG
HBO
RHO
OD
MA
NU
AL
WAT
ER P
UM
P .....
........
........
........
........
2N
EIG
HBO
RHO
OD
DEE
P W
ELL .
...3
RIVE
R/CR
EEK .
........
........
........
........
.......
4O
THER
, SPE
CIFY
........
........
........
........
..5
NO
NE
........
........
........
........
........
........
........
.....1
ELEC
TRIC
ITY
........
........
........
........
........
......2
KERO
SEN
E (g
aas)
.......
........
........
........
......3
LPG
(Liq
uefie
d pe
trole
um ga
s) ...
........
.4O
IL (v
eget
able
, ani
mal
, and
oth
ers)
..5
CAN
DLE
.......
........
........
........
........
........
........
.6O
THER
, SPE
CIFY
........
........
........
........
.......
8

Appendix 288
SECTION D1: HOUSEHOLD ASSETS
2 3How many [ITEMS] does your household own? [IF NONE WRITE '0'] AND MOVE TO NEXT ITEM
Number of [ITEM]s owned at present? [IF NONE WRITE '0' AND SKIP TO NEXT ITEM]
Number of [ITEM]s purchased in the past twelve months? [IF NONE WRITE '0']
What is the total value of all [CURRENT MARKET VALUE OF ITEM]s?
NUMBER NUMBER PHP
1 Refrigerator2 Laptop3 Personal Computer4 Internet Connection5 Cell Phone 6 Land Lines7 Jewelry8 Books/Magazines/Novels/Religious Texts, etc.9 Educational Software10 Bank Accounts11 Agricultural Land12 Residential Land13 Residential House
1
CODE
SECTION D1: HOUSEHOLD ASSETS
SECTION D2: HOUSEHOLD ASSETS (continued)SECTION D2: HOUSEHOLS ASSETS (cont'd) …
YES 1NO 2
15. For what purpose/s were the remittances used?1 - Education 3 - Household consumption other than education/health/medical2 - Health/Medical 4 - Investment/Business
5 - Other (Specify) ___________________________
YES 1NO 2
YES 1NO 2
17.d SOCIAL ASSISTANCE/ welfare benefits/ cash transfers ("poverty"/ income-support benefits)
17.h OTHER BENEFITS/ ALLOWANCES
17.e SCHOLARSHIPS
17.g HOUSING/ utility allowances (including heating benefits, financial support to pay electricity, water bills, etc.); IN-KIND BENEFITS (school feeding, social canteens) vouchers and coupons for food, fuel, transport etc.; fee waivers;
14. During the past 12 months, has this household received any transfers of money from individuals not currently living in the household?
16. During the past 12 months, has this household provided any transfers of money to individuals not currently living in the household?
17. During the past 12 months, has anyone in this household received any of these benefits from government or local authorities?
17.a PENSIONS (state); social pensions, disability pensions, merit pensions (ie, veterans)
17.b UNEMPLOYMENT benefit (insurance), non-contributory unemployment allowances or (re)insertion support
17.c CHILD AND FAMILY BENEFITS
17.f ADB-supported programs (Voucher Program or ESC)

Appendix 2 89
SECT
ION
E: R
ECEN
T SH
OCK
S TO
HO
USE
HO
LD W
ELFA
RESE
CTIO
N E
: REC
ENT
SHO
CKS
TO H
OU
SEH
OLD
WEL
FARE
[ASK
HO
USE
HO
LD H
EAD
OR
MO
ST K
NO
WLE
DG
EABL
E RE
SPO
ND
ENT]
1.
2.3.
5.6.
Ove
r the
pas
t fiv
e ye
ars w
as yo
ur h
ouse
hold
seve
rely
affe
cted
ne
gativ
ely b
y any
of t
he fo
llow
ing
even
ts?
Rank
the
thre
e m
ost
signi
fican
t sho
cks y
ou
expe
rienc
ed
Did
[SH
OCK
] cau
se
a re
duct
ion
in
hous
ehol
d in
com
e an
d/or
ass
ets?
Did
this
shoc
k affe
ct
educ
atio
n-re
late
d de
cisio
ns?
Do
you
thin
k th
ese
shoc
ks w
ill
still
affe
ct
educ
ated
-rel
ated
de
cisio
n in
the
next
year
?
MO
NTH
YEA
R
301
Dro
ught
/Flo
ods/
Typh
oons
302
Crop
dise
ase
or c
rop
pest
s suc
h as
gro
und-
hog
atta
cks
303
Live
stoc
k die
d or
wer
e st
olen
304
Hou
seho
ld b
usin
ess f
ailu
re, n
on-a
gric
ultu
ral
305
Loss
of s
alar
ied
empl
oym
ent o
r non
-pay
men
t of s
alar
y
306
Larg
e fa
ll in
sale
pric
es fo
r cro
ps
307
Larg
e ris
e in
pric
e of
food
308
Incr
ease
in sc
hool
cos
ts
309
Seve
re w
ater
shor
tage
/ele
ctric
ity p
robl
ems
310
Rest
ricte
d ac
cess
to m
arke
ts
311
Chro
nic/
seve
re ill
ness
or a
ccid
ent o
f hou
seho
ld m
embe
r
312
Dea
th o
f a m
embe
r of h
ouse
hold
313
Dea
th o
f oth
er fa
mily
mem
ber
314
Brea
k-up
of t
he h
ouse
hold
315
Bush
fire/
Fire
316
Hija
ckin
g/Ro
bber
y/bu
rgla
ry/a
ssau
lt/Th
eft/K
idna
ppin
g
317
Dw
ellin
g da
mag
ed, d
estro
yed
318
Unp
lann
ed P
regn
ancy
319
Law
suits
320
Oth
er _
____
____
____
___
4.
S H O C K I D
Whe
n di
d th
is [S
HO
CK]
occu
r?
THE
QU
ESTI
ON
S TO
TH
E RI
GH
T SH
OU
LD O
NLY
BE
ASK
ED
CON
CERN
ING
TH
E TH
REE
MO
ST S
EVER
E SH
OCK
S, A
S IN
DIC
ATE
D IN
Q
UES
TIO
N 2
.
LEA
VE A
LL
OTH
ER R
OW
S BL
AN
K.
PUT
COD
E O
F BI
GG
EST
SHO
CKS
GO
TH
ROU
GH
EN
TIRE
LIS
T BE
FORE
PRO
CEED
ING
TO
Q2.
YES
........
....1
NO
........
.....2
(►N
EXT
ITEM
)
YES
........
....1
NO
........
.....2
(►N
EXT
ITEM
)
YES
........
....1
NO
........
.....2
(►N
EXT
ITEM
)
MO
ST S
EVER
E .....
.......1
SE
CON
D M
OST
SE
VERE
.......
........
........
.2TH
IRD
MO
ST
SEVE
RE ...
........
........
.....3
INCO
ME
LOSS
...1
ASS
ET L
OSS
........
.2LO
SS O
F BO
TH ..3
NEI
THER
.......
........
4
JAN
UA
RY....
........
........
........
........
.......
01FE
BRU
ARY
........
........
........
........
........
.02
MA
RCH
........
........
........
........
........
.......
03A
PRIL
.......
........
........
........
........
........
....04
MAY
.......
........
........
........
........
........
.......
05JU
NE.
........
........
........
........
........
........
....06
JULY
........
........
........
........
........
........
......0
7AU
GU
ST ....
........
........
........
........
........
.08
SEPT
EMBE
R ....
........
........
........
........
..09
OCT
OBE
R .....
........
........
........
........
.....1
0N
OVE
MBE
R ....
........
........
........
........
..11
DEC
EMBE
R ....
........
........
........
........
...12
Appendix 290
SECT
ION
F: P
ARE
NTA
L/LE
GA
L G
UA
RDIA
N IN
VOLV
EMEN
T[A
SK P
ARE
NT
OF
THE
STU
DEN
T U
ND
ER C
ON
SID
ERA
TIO
N O
R LE
GA
L G
UA
RDIA
N O
R M
OST
KN
OW
LED
GEA
BLE
RESP
ON
DEN
T][IN
TH
IS S
ECTI
ON
, "N
AM
E" R
EFER
S TO
TH
E ST
UD
ENT
UN
DER
CO
NSI
DER
ATI
ON
]1.
COPY
ID F
OR
RESP
ON
DEN
T TO
TH
IS S
ECTI
ON
FRO
M H
OU
SEH
OLD
RO
STER
TUIT
ION
TRA
NSP
ORT
TUTO
RIN
G
ID (of sampled student)
1.Pl
ease
pro
vide
the
brea
kdow
n of
cos
ts fo
r [SC
HO
OL]
for a
cade
mic
year
201
6-20
17 fo
r [N
AM
E]
SCH
OO
L U
NIF
ORM
BOO
KS, S
CH
OO
L M
ATE
RIA
LS, S
CH
OO
L PR
OJE
CT
ALL
OW
AN
CE
(exc
ludi
ng
trans
port,
etc
.)O
THER
TOTA
LA
CC
OM
MO
DA
TIO
N
SECT
ION
F: P
ARE
NTA
L/LE
GA
L G
UA
RDIA
N IN
VOLV
EMEN
T
Appendix 2 91
2b.
MER
IT-B
ASE
D
SCH
OLA
RSH
IPS
LOA
NS
VOU
CH
ERS
ESC
OTH
ER
(Spe
cify
)
3.4.
Are
you
awar
e of
the
follo
win
g pr
ogra
ms?
Is (N
AM
E O
F ST
UD
ENT)
's sc
hool
att
enda
nce
parti
ally
fu
nded
by t
he fo
llow
ing
prog
ram
s?
In a
dditi
on to
the
subs
idie
s rec
eive
d fro
m
gove
rnm
ent a
nd o
ther
sc
hola
rshi
p gr
ants
, ap
prox
imat
ely h
ow m
uch
top-
up e
xpen
ses h
ave
you
incu
rred
for (
NA
ME
OF
STU
DEN
T)'s
scho
olin
g for
this
scho
ol
year
?
Vouc
her
Educ
atio
n Se
rvic
e C
ontra
ctin
g
2a.
How
muc
h of
the
educ
atio
nal c
osts
wer
e fin
ance
d us
ing t
he fo
llow
ing m
eans
for [
NA
ME]
for t
he a
cade
mic
year
201
6-20
17?
HO
USE
HO
LDO
THER
EX
TEN
DED
FA
MIL
Y /
FRIE
ND
S
STU
DEN
T'S
INC
OM
EN
EED
-BA
SED
SC
HO
LARS
HIP
SVo
uche
rEd
ucat
ion
Serv
ice
Con
tract
ing
YES
........
......1
N
O ....
........
...2
►8
YES
........
......1
►8
NO
........
.......
2

Appendix 292
6.7.
8.9.
If (N
AM
E O
F ST
UD
ENT)
was
qua
lifie
d fo
r a vo
uche
r but
did
not
av
ail t
he p
rogr
am, w
hy d
id (N
AM
E O
F ST
UD
ENT)
not
acc
ess i
t?If
(NA
ME
OF
STU
DEN
T) w
as q
ualif
ied
for E
SC b
ut d
id n
ot a
vail
the
prog
ram
, why
did
(NA
ME
OF
STU
DEN
T) n
ot a
cces
s it?
Are
you
fam
iliar w
ith th
e K-
12 S
tude
nt P
rimer
?O
n a
scal
e of
1 to
10, 1
bei
ng ve
ry u
sefu
l to
10
bein
g not
use
ful, h
ow u
sefu
l is th
e K-
12 S
tude
nt
Prim
er?
5.Co
uld
(NA
ME
OF
STU
DEN
T)
have
acc
ess t
o th
e fo
llow
ing
prog
ram
s?
Vouc
her
Educ
atio
n Se
rvic
e C
ontra
ctin
g
NO
PRI
VATE
SCH
OO
LS IN
ARE
A ...
........
........
........
........
........
........
1N
O P
RIVA
TE S
CHO
OLS
TH
AT C
OU
LD A
FFO
RD/
VA
LUE
OF
VOU
CHER
IS N
OT
ENO
UG
H
FOR
PRIV
ATE
SCH
OO
L EX
PEN
SES .
........
........
........
........
........
.....2
PRIV
ATE
SCH
OO
L Q
UA
LITY
NO
T G
OO
D
COM
PARE
D T
O P
UBL
IC ...
........
........
........
........
........
........
........
........
.3PR
OCE
SS O
F AC
CESI
NG
VO
UCH
ER IS
DIF
FICU
LT ...
........
....4
WA
S N
OT
ACCE
PTED
INTO
PRE
FERR
ED
PRIV
ATE
SCH
OO
L ....
........
........
........
........
........
........
........
........
........
......5
PRIV
ATE
SCH
OO
L D
ID N
OT
OFF
ER T
RACK
TH
AT W
AS
OF
INTE
REST
.......
........
........
........
........
........
........
........
....6
OTH
ER (S
PECI
FY) .
........
........
........
........
........
........
........
........
........
........
..7
NO
PRI
VATE
SCH
OO
LS IN
ARE
A ...
........
........
........
........
........
........
1N
O P
RIVA
TE S
CHO
OLS
TH
AT C
OU
LD A
FFO
RD/
VA
LUE
OF
VOU
CHER
IS N
OT
ENO
UG
H
FOR
PRIV
ATE
SCH
OO
L EX
PEN
SES .
........
........
........
........
........
.....2
PRIV
ATE
SCH
OO
L Q
UA
LITY
NO
T G
OO
D
COM
PARE
D T
O P
UBL
IC ...
........
........
........
........
........
........
........
........
.3PR
OCE
SS O
F AC
CESI
NG
VO
UCH
ER IS
DIF
FICU
LT ...
........
....4
WA
S N
OT
ACCE
PTED
INTO
PRE
FERR
ED
PRIV
ATE
SCH
OO
L ....
........
........
........
........
........
........
........
........
........
......5
PRIV
ATE
SCH
OO
L D
ID N
OT
OFF
ER T
RACK
TH
AT W
AS
OF
INTE
REST
.......
........
........
........
........
........
........
........
....6
OTH
ER (S
PECI
FY) .
........
........
........
........
........
........
........
........
........
........
..7
YES
........
......1
N
O ....
........
...2
►8
YES
........
......1
N
O ....
........
...2
►10
Appendix 2 93
10.
11.12
.13
.H
as (N
AM
E O
F ST
UD
ENT)
rece
ntly
tran
sfer
red
from
ano
ther
scho
ol?
Wha
t are
the
3 maj
or re
ason
s why
(NA
ME
OF
STU
DEN
T) h
as tr
ansf
erre
d
from
ano
ther
scho
ol?Fo
r the
nex
t sch
ool y
ear,
do yo
u ha
ve p
lans
of
tran
sfer
ring (
NA
ME
OF
STU
DEN
T) to
an
othe
r sch
ool?
Wha
t are
the
3 maj
or re
ason
s why
you
are
plan
ning
to tr
ansf
er (N
AM
E O
F ST
UD
ENT)
to a
noth
er sc
hool
?
Rank
1:Ra
nk 2:
Rank
3:
Rank
1:Ra
nk 2
:Ra
nk 3:
YES
........
......1
N
O ....
........
...2
►12
YES
........
......1
N
O ....
........
...2
►14
TOP-
UP
EXPE
NSE
S(O
F PR
EVIO
US
SCH
OO
L) A
RE
UN
PEXC
TED
LY T
OO
HIG
H /
TH
E VO
UCH
ER A
MO
UN
T, E
SC
SUSB
SID
IES,
AN
D/O
R O
THER
SCH
OLA
RSH
IP S
UBS
IDIE
S A
RE U
NEX
PECT
EDLY
NO
T EN
OU
GH
TO
CO
VER
ALL
FEE
S IN
PR
EVIO
US
SCH
OO
L .....
........
........
........
........
........
........
........
........
........
........
......1
EXPE
CTED
TH
AT S
CHO
OL-
RELA
TED
EX
PEN
SES
(O
F PR
EVIO
US
SCH
OO
L) A
RE H
IGH
BU
T CA
N N
O L
ON
GER
A
FFO
RD ...
........
........
........
........
........
........
........
........
........
........
........
........
........
........
.2ST
UD
ENT
CAN
NO
T CO
PE W
ITH
ACA
DEM
IC
REQ
UIR
EMEN
TS O
F PR
EVIO
US
SCH
OO
L.....
........
........
........
........
........
.3ST
UD
ENT
FELT
TH
AT H
E/SH
E D
ID N
OT
BELO
NG
TO
PRE
VIO
US
SCH
OO
L ...
........
........
........
........
........
........
........
........
........
.......4
TEAC
HER
S IN
TH
E PR
EVIO
US
SCH
OO
L D
ID N
OT
HAV
E TE
CHN
ICA
L EX
PERT
ISE .
........
........
........
........
........
........
........
........
........
........
..5PR
EVIO
US
SCH
OO
L D
ID N
OT
OFF
ER S
TUD
ENT’
S
PREF
ERRE
D T
RACK
........
........
........
........
........
........
........
........
........
........
........
.....6
WA
NT
TO M
OVE
TO
A S
CHO
OL
THAT
OFF
ERS
BETT
ER
FACI
LITI
ES A
ND
NO
N-C
URR
ICU
LUM
ACT
IVIT
IES .
........
........
........
.7O
THER
(SPE
CIFY
) .....
........
........
........
........
........
........
........
........
........
........
........
.....8

Appendix 294
15.
16.
17.
18.
Wha
t tra
ck d
o yo
u w
ant/i
s you
r chi
ld to
pur
sue/
purs
uing
in
Sen
ior H
igh
Scho
ol?
Wha
t are
the
3 maj
or c
onsid
erat
ion
for y
ou in
cho
osin
g thi
s tra
ck fo
r you
r chi
ld?
Do
you
have
any
info
rmat
ion
on fi
nanc
ial a
id (s
chol
arsh
ip
or st
uden
t loa
ns) w
hich
your
ch
ild c
an a
vail f
or se
nior
hig
h sc
hool
?
Wha
t wer
e yo
ur th
ree
maj
or so
urce
s of i
nfor
mat
ion
on
finan
cial
aid
for s
enio
r hig
h sc
hool
? Ran
k in
orde
r of
impo
rtanc
e (1
-mos
t im
porta
nt a
nd so
on)
Rank
1:Ra
nk 2
:Ra
nk 3:
Rank
1:Ra
nk 2
:Ra
nk 3:
14. W
hat k
ind
of w
ork w
ould
you
pref
er fo
r [N
AM
E]?
COD
ED
ESCR
IBE
THE
OCC
UPA
TIO
N
AN
D M
AIN
TA
SKS
OR
DU
TIES
IN
AT
LEA
ST 2
WO
RDS.
Aca
dem
ic ...
........
........
........
........
........
........
........
........
.......
1Te
chni
cal/
Voca
tiona
l/Li
velih
ood .
........
........
........
..2Sp
orts
........
........
........
........
........
........
........
........
........
........
..3A
rts a
nd D
esig
n ....
........
........
........
........
........
........
........
..4O
ther
s, sp
ecify
........
........
........
........
........
........
........
........
5
POTE
NTI
AL
WAG
ES ...
........
........
........
........
........
........
........
......1
BRO
AD
EM
PLO
YMEN
T O
PPO
RTU
NIT
IES .
........
........
...2
EMPL
OYM
ENT
OPP
ORT
UN
ITIE
S IN
MA
NIL
A ...
........
3A
BILI
TY T
O W
ORK
ABR
OA
D ....
........
........
........
........
........
...4
INTE
REST
.......
........
........
........
........
........
........
........
........
........
........
5BE
ST F
ITS
CHIL
D’S
SKI
LLS .
........
........
........
........
........
........
....6
COST
/FIN
AN
CIA
L CO
NSI
DER
ATIO
NS
........
........
........
7RE
COM
MEN
DAT
ION
OF
OTH
ER F
AM
ILY
MEM
BERS
......
........
........
........
........
........
........
........
........
........
......
9RE
COM
MEN
DAT
ION
OF
FRIE
ND
S/PE
ERS .
........
.......1
0SO
CIA
L AC
CEPT
ABI
LITY
/EX
PECT
ATIO
NS .
........
......1
1
YES
........
......1
N
O ....
........
...2
►19
Web
site
of sc
hool
s .....
........
........
........
........
........
........
.......
1Te
ache
rs ...
........
........
........
........
........
........
........
........
........
.....2
Gui
danc
e Co
unse
lors
........
........
........
........
........
........
.......
3St
uden
t .....
........
........
........
........
........
........
........
........
........
.....4
Frie
nds o
r Rel
ativ
es ...
........
........
........
........
........
........
........
5Bo
oks,
New
spap
er, M
agaz
ine .
........
........
........
........
.....6
Bank
.......
........
........
........
........
........
........
........
........
........
........
.7Fl
yers
or P
rint A
ds ....
........
........
........
........
........
........
........
..8O
ther
s, sp
ecify
........
........
........
........
........
........
........
........
....9

Appendix 2 95
19.
20.
21.
22.
23.
On
a sc
ale
of 1-
10, w
ith 1
havi
ng th
e hi
ghes
t qua
lity a
nd 10
hav
ing t
he lo
wes
t qu
ality
, how
muc
h do
you
thin
k the
qu
ality
of s
choo
l mat
ter i
n de
term
inin
g yo
ur c
hild
’s jo
b ou
tcom
es?
On
a sc
ale
of 1-
10, w
ith 1
bein
g ver
y im
porta
nt a
nd 10
not
impo
rtant
, how
m
uch
do yo
u th
ink s
choo
l tra
ck m
atte
rs in
de
term
inin
g you
r chi
ld’s
job
outc
omes
?
Do
you
expe
ct yo
ur c
hild
to c
ontin
ue o
nto
post
-sec
onda
ry e
duca
tion?
Wha
t are
the
3 mos
t im
porta
nt fa
ctor
s for
not
con
tinui
ng
with
pos
t sec
onda
ry e
duca
tion
or d
o no
t kno
w a
bout
your
de
cisio
n. R
ank i
n or
der o
f pre
fere
nce
(1-m
ost i
mpo
rtant
and
so
on)
.
Rank
1:Ra
nk 2
:Ra
nk 3:
Wha
t lev
el o
f edu
catio
n do
you
expe
ct yo
ur c
hild
to
com
plet
e?
YES
........
...1
►23
NO
........
....2
FI
NA
NCI
AL
PRO
BLEM
........
........
........
........
........
........
.....1
HO
USE
HO
LD R
ESPO
NSI
BILI
TIES
.......
........
........
......2
GRA
DES
NO
T SU
FFIC
IEN
T ....
........
........
........
........
.......3
NO
T N
ECES
SARY
FO
R CH
OIC
E O
F EM
PLO
YMEN
T ....
........
........
........
........
........
........
........
......4
ALR
EAD
Y H
AVE
A JO
B O
FFER
.......
........
........
........
.....5
NO
T IN
TERE
STED
.......
........
........
........
........
........
........
......6
UN
DEC
IDED
ON
WH
AT T
O S
TUD
Y ....
........
........
....7
WA
NT
TO P
URS
UE
OTH
ER IN
TERE
STS.
........
........
8FE
LT U
NPR
EPA
RED
FO
R PO
ST-S
ECO
ND
ARY
SC
HO
OL .
........
........
........
........
........
........
........
........
........
......9
MA
RRIA
GE
........
........
........
........
........
........
........
........
........
.10
OTH
ER, S
PECI
FY ....
........
........
........
........
........
........
........
..11
1 2 3 4 5 6 7 8 9
1 2 3 4 5 6 7 8 9
Juni
or H
igh
Scho
ol ...
........
........
........
........
........
........
........
.......
1(S
KIP
TO N
EXT
SAM
PLED
STU
DEN
T. IF
NO
M
ORE
SA
MPL
ED S
TUD
ENT,
SKI
P TO
NEX
T SE
CTIO
N)
Seni
or H
igh
Scho
ol ...
........
........
........
........
........
........
........
.......
2(S
KIP
TO N
EXT
SAM
PLED
STU
DEN
T. IF
NO
M
ORE
SA
MPL
ED S
TUD
ENT,
SKI
P TO
NEX
T SE
CTIO
N)
Post
-sec
onda
ry n
on-t
ertia
ry ...
........
........
........
........
........
....3
Certi
ficat
e/D
iplo
ma
Cour
se ...
........
........
........
........
........
....4
Bach
elor
’s D
egre
e .....
........
........
........
........
........
........
........
.......
5M
aste
rs D
egre
e.....
........
........
........
........
........
........
........
........
....6
PhD
and
Abo
ve ....
........
........
........
........
........
........
........
........
.....7

Appendix 296
24.
25.
26.
How
muc
h ed
ucat
iona
l cos
t do
you
expe
ct w
ill be
nee
ded
to fi
nanc
e yo
ur c
hild
’s tu
ition
in p
ost-
seco
ndar
y edu
catio
n, a
nnua
lly?
Wha
t typ
e of
wor
k do
you
expe
ct yo
ur c
hild
will
perfo
rm a
s an
adul
t?
Whe
re d
o yo
u ex
pect
your
chi
ld to
be
empl
oyed
?
Less
than
Php
20,
000
........
........
........
........
........
........
........
........
........
........
........
........
........
........
.......
1M
ore
than
Php
20,
000
but l
ess t
han
Php
50,0
00 ...
........
........
........
........
........
........
........
......2
Mor
e th
an P
hp 5
0,00
0 bu
t les
s tha
n Ph
p 10
0,00
0 .....
........
........
........
........
........
........
........
..3M
ore
than
Php
100
,000
but
less
than
Php
300
,000
.......
........
........
........
........
........
........
.....4
Mor
e th
an P
hp 3
00,0
00....
........
........
........
........
........
........
........
........
........
........
........
........
........
.......
5
Prof
essio
nal (
e.g.
, doc
tor,
law
yer,
man
ager
, tea
cher
, etc
.) ....
........
........
........
........
......1
Wor
king
cla
ss/m
anua
l labo
rer/
trade
s/bl
ue c
olla
r (e.
g., f
acto
ry, m
aint
enan
ce,
carp
ente
r, el
ectri
cian
, etc
.) ....
........
........
........
........
........
........
........
........
........
........
........
........
.2Se
rvic
e in
dust
ry (e
.g.,
food
serv
ice,
cus
tom
er se
rvic
e, h
ospi
talit
y, e
tc.).
........
........
3Cl
eric
al (e
.g.,
offic
e as
sista
nt, r
ecor
d ke
epin
g) ...
........
........
........
........
........
........
........
.......4
Tech
nica
l (e.
g., c
ompu
ter p
rogr
amm
ing,
ele
ctro
nics
repa
ir) ...
........
........
........
........
....5
Empl
oym
ent i
s not
likel
y for
my c
hild
.......
........
........
........
........
........
........
........
........
........
.....6
Oth
er ty
pe o
f wor
k (pl
ease
spec
ify__
____
) ......
........
........
........
........
........
........
........
........
.7
With
in th
e ci
ty/m
unic
ipal
ity ....
........
........
........
........
......1
With
in th
e re
gion
.......
........
........
........
........
........
........
........
.2O
utsid
e th
e re
gion
, but
with
in th
e Ph
ilippi
nes .
.......
3O
vers
eas ..
........
........
........
........
........
........
........
........
........
.......
4

Appendix 2 97
27.
2829
30O
vera
ll, on
a sc
ale
of 1
to 10
(1 b
eing
very
in
volv
ed to
10 b
eing
dise
ngag
ed),
how
in
volv
ed a
re yo
u in
your
chi
ld's
scho
olin
g?
Dur
ing l
ast a
cade
mic
year
, how
ofte
n ha
ve yo
u pa
rtici
pate
d in
any
of t
he
follo
win
g sch
ool-r
elat
ed a
ctiv
ities
?
A) D
iscus
sed
my c
hild
's be
havi
or w
ith a
teac
her o
n m
y ow
n in
itiat
ive.
___
B) D
iscus
sed
my c
hild
's be
havi
or o
n th
e in
itiat
ive
of o
ne o
f his/
her o
wn
teac
hers
.___
C) D
iscus
sed
my c
hild
's pr
ogre
ss w
ith a
teac
her o
n m
y ow
n in
itiat
ive.
___
D) D
iscus
sed
my c
hild
's pr
ogre
ss o
n th
e in
itiat
ive
of o
ne o
f his/
her o
wn
teac
hers
.___
E) V
olun
teer
ed in
phy
sical
act
iviti
es, e
.g. b
uild
ing m
aint
enan
ce, c
arpe
ntry
, ga
rden
ing o
r yar
d w
ork.
___
F) V
olun
teer
ed in
ext
ra-c
urric
ular
act
iviti
es, e
.g. b
ook c
lub,
scho
ol p
lay,
spor
ts, f
ield
trip
.___
G) V
olun
teer
ed in
the
scho
ol lib
rary
or m
edia
cen
tre. _
__H
) Ass
isted
a te
ache
r in
the
scho
ol._
__I)
App
eare
d as
a gu
est s
peak
er. _
__J)
Par
ticip
ated
in lo
cal s
choo
l , e.
g. pa
rent
cou
ncil o
r PTA
. ___
K) C
heck
ed a
nd d
iscus
sed
my c
hild
's re
port
card
with
him
/her
.___
On
aver
age,
how
muc
h m
onth
ly in
com
e do
you
expe
ct
your
chi
ld to
mak
e at
age
30, in
toda
y's te
rms?
On
a sc
ale
of 1-
10, w
ith 1
bein
g ver
y sat
isfie
d an
d 10
not
satis
fied,
how
sa
tisfie
d ar
e yo
u in
the
follo
win
g asp
ects
of (
NA
ME
OF
STU
DEN
T)'s
curre
nt sc
hool
?
A) O
vera
ll Sch
ool S
atisf
actio
n __
__B)
Con
geni
ality
of A
tmos
pher
e/(N
AM
E of
STU
DEN
T)'s
Feel
ing o
f Be
long
ingn
ess _
__C)
Loc
atio
nD
) (N
AM
E O
F ST
UD
ENT)
's Ch
osen
Tra
ck/S
trand
___
E) C
urric
ulum
Req
uire
men
ts__
_F)
Com
pete
ncy o
f Tea
cher
s ___
G) Q
ualit
y of C
aree
r Gui
danc
e pr
ovid
ed to
(NA
ME
OF
STU
DEN
T)
___
H) Q
ualit
y of S
choo
l Fac
ilitie
sI)
Tra
nspa
renc
y of S
choo
l on
the
Act
ual A
fford
abilit
y of S
choo
l Fee
s __
_J)
Am
ount
of G
over
nmen
t Sub
sidie
s___
K) P
roce
ss o
f App
lyin
g for
Gov
ernm
ent S
ubsid
ies_
__
LESS
TH
AN
PH
P 5,
000 .
........
........
........
........
........
.......
1PH
P 5,
000-
PHP
10,0
00 ....
........
........
........
........
........
...2
PHP
10,0
00-P
HP
20,0
00 ...
........
........
........
........
........
.3PH
P 20
,000
-PH
P 30
,000
.......
........
........
........
........
.....4
PHP
30,0
00-P
HP
50,0
00 ...
........
........
........
........
........
.5PH
P 50
,000
-PH
P 70
,000
.......
........
........
........
........
.....6
OVE
R PH
P 70
,000
........
........
........
........
........
........
........
..7
Onc
e a
wee
k .....
........
........
........
........
........
........
.......
1O
nce
a m
onth
.......
........
........
........
........
........
........
..2O
nce
ever
y qua
rter .
........
........
........
........
........
......3
Onc
e a
scho
ol ye
ar ...
........
........
........
........
........
.....4
Nev
er ...
........
........
........
........
........
........
........
........
.......
5

Appendix 298
3132
If yo
u an
swer
ed 6
to 10
in Q
uest
ion#
30, w
hat a
re th
e th
ree
maj
or fa
ctor
s w
hy yo
u ha
ve n
ot b
een
heav
ily in
volv
ed in
stud
ent's
scho
olin
g? R
ank i
n or
der o
f im
porta
nce
(1 b
eing
very
impo
rtant
, and
so o
n).
Whi
ch th
ree
fact
ors w
ere
mos
t im
porta
nt in
mak
ing t
he fi
nal d
ecisi
on o
f at
tend
ing t
his s
choo
l? A
lso, r
ank i
n or
der o
f pre
fere
nce
(1 -
mos
t im
porta
nt, a
nd so
on)
.
Rank
1:Ra
nk 2
:Ra
nk 3:
Rank
1:Ra
nk 2
:Ra
nk 3:
I AM
VER
Y BU
SY W
ITH
WO
RK ...
........
........
........
........
........
........
.......
1I C
AN
’T G
O H
OM
E EA
RLY
DU
E TO
HEA
VY T
RAFF
IC ...
........
.2SP
OU
SE A
ND
/OR
OTH
ER R
ELAT
IVE
ARE
MO
RE
HA
ND
S O
N ..
........
........
........
........
........
........
........
........
........
........
........
.....3
I DO
N’T
HAV
E TH
E TE
CHN
ICA
L KN
OW
/HO
W
ON
TH
E LE
SSO
NS
BEIN
G T
AUG
HT
TO (N
AM
E O
F ST
UD
ENT)
.......
........
........
........
........
........
........
........
........
........
........
........
...4
I WA
NT
(NA
ME
OF
STU
DEN
T) T
O B
E IN
DEP
END
ENT
OTH
ERS,
PLE
ASE
SPE
CIFY
.......
........
........
........
........
........
........
........
..5
COST
S .....
........
........
........
........
........
........
........
........
........
........
........
........
.......
1CU
RRIC
ULU
M ....
........
........
........
........
........
........
........
........
........
........
........
2N
EAR
PARE
NTS
’ HO
ME
........
........
........
........
........
........
........
........
.......
3N
EAR
RELA
TIVE
S’ H
OM
E .....
........
........
........
........
........
........
........
........
4SC
HO
OL
QU
ALI
TY ...
........
........
........
........
........
........
........
........
........
......5
SCH
OO
L A
FFIL
IATI
ON
.......
........
........
........
........
........
........
........
........
..6SC
HO
OL’S
ACC
RED
ITAT
ION
.......
........
........
........
........
........
........
.....7
EDU
CATI
ON
/EM
PLO
YMEN
T O
UTC
OM
ES ...
........
........
........
....8
COU
RSE
OFF
ERIN
GS
COIN
CID
E W
ITH
PRE
FERE
NCE
S .....
.9LA
CK O
F G
OO
D P
UBL
IC S
CHO
OLS
NEA
R P
ARE
NTS
’ H
OM
E .....
........
........
........
........
........
........
........
........
........
........
........
........
....10
OTH
ERS,
SPE
CIFY
.......
........
........
........
........
........
........
........
........
........
...11
99
YOU
TH E
DU
CATI
ON
INVE
STM
ENT
AN
D L
ABO
R M
ARK
ET O
UTC
OM
ES S
URV
EY
TH
IS IN
FORM
ATIO
N IS
STRI
CTLY
CO
NFI
DEN
TIAL
AN
D IS
TO
BE
USE
D FO
R ST
ATIS
TICA
L PU
RPO
SES O
NLY
.
STU
DEN
T Q
UES
TIO
NN
AIR
E
CO
VER
SECT
ION
: HO
USE
HO
LD ID
ENTI
FICA
TIO
N
1. P
ROVI
NC
E:
2. M
UN
ICIP
ALI
TY/C
ITY:
3. B
ARA
NG
AY:
4. S
CH
OO
L ID
and
SC
HO
OL
NA
ME:
5. S
CH
OO
L TY
PE:
6. N
AM
E A
ND
CO
DE
OF
STU
DEN
T:
7. F
ULL
HO
USE
HO
LD ID
ENTI
FIC
ATI
ON
NU
MBE
R:
8. Ang
sarb
ey n
a ito
ay a
lam
at m
ay ka
pahi
ntul
utan
ng K
agaw
aran
ng E
duka
syon
ng P
ilipin
as. L
ahat
ng i
mpo
rmas
yon
na m
akok
olek
ta a
y pag
-iing
atan
at i
tutu
ring k
umpi
dens
yal (
This
surv
ey is
aut
horiz
ed b
y the
the
Dep
artm
ent o
f Edu
catio
n of
the
Philip
pine
s. A
ll inf
orm
atio
n co
llect
ed h
erei
n w
ill be
trea
ted
with
utm
ost c
are
and
are
stric
tly co
nfid
entia
l).
PAH
INTU
LOT
Ako
si _
____
____
____
____
____
____
____
____
___
(PA
NG
ALA
N N
G M
AG
ULA
NG
/GU
ARD
IAN
at P
IRM
A S
A T
AA
S N
G P
AN
GA
LAN
), __
____
____
____
____
____
____
___
(rel
asyo
n sa
bat
ang k
apap
anay
amin
) ay
pum
apay
ag n
a m
akap
anay
am a
ng
akin
g ana
k na
si __
____
____
____
____
____
____
____
____
____
____
_ (P
AN
GA
LAN
NG
BA
TA) n
i ___
____
____
____
____
____
____
_ (P
AN
GA
LAN
NG
EN
UM
ERA
TOR)
nga
yong
___
____
____
____
____
____
___,
2016
(PET
SA).
PAN
IMU
LA
Mag
anda
ng a
raw
po!
Ako
si (P
AN
GA
LAN
NG
EN
UM
ERA
TOR)
, enu
mer
ator
par
a sa
pag
-aar
al p
ara
sa P
roye
kton
g You
th E
duca
tion
Inve
stm
ents
and
Lab
or M
arke
t Out
com
es S
urve
y in
the
Philip
pine
s (ip
akita
ang
ID).
Ang
am
ing p
ag-a
aral
ay a
lam
at m
ay ka
pahi
ntul
utan
din
po
ng K
agaw
aran
ng E
duka
syon
(ipa
kita
ang
Mem
oran
dum
mul
a sa
Dep
Ed).
Ang
pag
-aar
al n
a ito
ay n
agla
layo
n na
ipag
pa-ib
ayuh
in a
ng re
porm
ang h
atid
ng K
-12 s
a at
ing e
duka
syon
. Nai
s po
nam
in n
a m
agin
g kat
uwan
g nam
in k
ayo
sa g
awai
ng it
o sa
pam
amag
itan
ng
pag
bibi
gay
inyo
ng sa
loob
in a
t kar
anas
an sa
pag
gaba
y sa
inyo
ng m
ga a
nak s
a pa
gpili
ng ka
nila
ng e
duca
tiona
l tra
cks s
a Se
nior
Hig
h Sc
hool
.
Kung
mam
arap
atin
nin
yo, n
ais k
o rin
pon
g hilin
gin
na a
ng in
yong
ana
k ay m
agin
g isa
sa m
ga re
spon
dent
ng p
ag-a
aral
na
ito. K
abila
ng sa
pag
-aar
al n
a ito
ang
pag
hing
i sa
Kaga
war
an n
g Edu
kasy
on n
g mga
dat
os sa
paa
rala
n ng
inyo
ng a
nak g
aya
ng ka
nila
ng L
earn
er's
Prof
ile.
Maa
ri po
ban
g pirm
ahan
nin
yo a
ng b
ahag
ing i
to (C
onse
nt A
rea)
upa
ng p
atun
ay n
g iny
ong p
agpa
yag s
a pa
g-uu
sap
na it
o.
AD
DRE
SS A
ND
DES
CRI
PTIO
N O
F LO
CA
TIO
N O
F H
OU
SEH
OLD
- IN
CLU
DE
AN
Y ID
ENTI
FYIN
G C
HA
RAC
TERI
STIC
S O
F D
WEL
LIN
G, N
AM
E O
F N
EIG
HBO
RIN
G H
OU
SEH
OLD
S &
KEY
PER
MA
NEN
T C
ON
TAC
TS, P
HO
NE
NU
MBE
R (I
F A
NY)
.
MA
RK B
OX
WIT
H A
N 'X
' IF M
ORE
TH
AN
ON
E ST
UD
ENT
FRO
M T
HE
SAM
E H
OU
SEH
OLD
W
AS
SELE
CTED
DU
RIN
G T
HE
RAN
DO
M
SELE
CTIO
N C
ON
DU
CTED
AT
SCH
OO
L.
COD
E
APP
END
IX 3
: Stu
dent
Que
stio
nnai
re

Appendix 3100
SECT
ION
A: S
URV
EY S
TAFF
DET
AIL
S
9. N
AM
E O
F EN
UM
ERA
TOR:
10. E
NU
MER
ATO
R CO
DE:
11. T
IME
INTE
RVIE
W S
TART
:A
MPM
12. D
ATE
OF
INTE
RVIE
W (D
D/M
M/Y
Y):
13. N
AM
E O
F FI
ELD
SU
PERV
ISO
R:
14. F
IELD
SU
PERV
ISO
R CO
DE:
16. 1
ST D
ATA
EN
TRY
CLER
K CO
DE:
MEA
NIN
GS
FOR
COM
MO
N S
KIP
PATT
ERN
S/A
BBRE
VIA
TIO
NS
17. 1
ST D
ATA
EN
TRY
DA
TE (D
D/M
M/Y
Y):
►SK
IP T
O A
SPE
CIFI
C Q
UES
TIO
N IF
CH
OSE
N
► N
EXT
PERS
ON
SKIP
TO
TH
E N
EXT
PERS
ON
IF C
HO
SEN
► N
EXT
SECT
ION
SKIP
TO
TH
E N
EXT
MO
DU
LE/S
ECTI
ON
IF C
HO
SEN
PHP
PHIL
IPPI
NE
PESO
S
TABL
E O
F CO
NTE
NTS
CO
VER
SEC
TIO
N: H
OU
SEH
OLD
IDEN
TIFI
CA
TIO
N
SEC
TIO
N A
: SU
RVEY
STA
FF D
ETA
ILS
SEC
TIO
N B
: STU
DEN
T D
ETA
ILS
SEC
TIO
N C
: FO
RMA
L SC
HO
OLI
NG
SEC
TIO
N D
: JO
BS/A
PPRE
NTI
CES
HIP
/IN F
ORM
AL
TRA
ININ
G/IN
DU
STRY
IMM
ERSI
ON
DU
RIN
G S
CH
OO
LSE
CTI
ON
E: S
ENIO
R H
IGH
SC
HO
OL
CH
OIC
E (f
or G
rade
s 9 a
nd 10
)SE
CTI
ON
F: C
OLL
EGE
CH
OIC
ESE
CTI
ON
G: O
CC
UPA
TIO
N C
HO
ICE
SEC
TIO
N H
: SEN
IOR
HIG
H S
CH
OO
L C
ARE
ER G
UID
AN
CE
PRO
GRA
M
SEC
TIO
N I:
PER
SPEC
TIVE
ON
PA
REN
T'S
INVO
LVEM
ENT
AN
D E
XPE
CTA
TIO
NS
SEC
TIO
N J:
STU
DEN
T'S
OVE
RALL
SA
TISF
AC
TIO
N
OBS
ERVA
TIO
NS
DU
RIN
G T
HE
INTE
RVIE
WRE
CORD
GEN
ERA
L N
OTE
S A
BOU
T TH
E IN
TERV
IEW
AN
D R
ECO
RD A
NY
SPEC
IAL
INFO
RMA
TIO
N T
HA
T W
ILL
BE
HEL
PFU
L FO
R SU
PERV
ISO
RS A
ND
TH
E A
NA
LYSI
S O
F TH
IS Q
UES
TIO
NN
AIR
E.
15. D
ATE
OF
QU
ESTI
ON
NA
IRE
INSP
ECTI
ON
(D
D/M
M/Y
Y):
( EN
UM
ERA
TOR ►
NEX
T PA
GE)
SECT
ION
A: S
URV
EY S
TAFF
DET
AIL
S

Appendix 3 101
YOU
TH E
DU
CATI
ON
INVE
STM
ENT
AN
D L
ABO
R M
ARK
ET O
UTC
OM
ES S
URV
EY
TH
IS IN
FORM
ATIO
N IS
STRI
CTLY
CO
NFI
DEN
TIAL
AN
D IS
TO
BE
USE
D FO
R ST
ATIS
TICA
L PU
RPO
SES O
NLY
.
STU
DEN
T Q
UES
TIO
NN
AIR
E
SECT
ION
B: S
TUD
ENT
IDEN
TIFI
CATI
ON
COD
E
1. P
ROVI
NC
E:
2. M
UN
ICIP
ALI
TY/C
ITY:
3. B
ARA
NG
AY:
5. S
CH
OO
L ID
and
SC
HO
OL
NA
ME:
6. S
CH
OO
L TY
PE
7. F
ULL
HO
USE
HO
LD ID
ENTI
FIC
ATI
ON
:
8. S
TUD
ENT
ID a
nd S
TUD
ENT
NA
ME:
11. A
GE:
12. G
END
ER (M
ALE
=1, F
EMA
LE2)
Ang
sarb
ey n
a ito
ay a
lam
at m
ay ka
pahi
ntul
utan
ng K
agaw
aran
ng E
duka
syon
ng P
ilipin
as. L
ahat
ng i
mpo
rmas
yon
na m
akok
olek
ta a
y pag
-iing
atan
at i
tutu
ring k
ompi
dens
yal (
This
surv
ey is
aut
horiz
ed b
y the
the
Dep
artm
ent o
f Edu
catio
n of
the
Philip
pine
s. A
ll inf
orm
atio
n co
llect
ed h
erei
n w
ill be
trea
ted
with
utm
ost c
are
and
stric
t con
fiden
tialit
y).
PAH
INTU
LOT
Ako
si _
____
____
____
____
____
____
____
____
___
(PA
NG
ALA
N N
G M
AG
ULA
NG
/GU
ARD
IAN
at P
IRM
A S
A T
AA
S N
G P
AN
GA
LAN
), __
____
____
____
____
____
____
___
(rel
asyo
n sa
ba
tang
kapa
pana
yam
in)
ay p
umap
ayag
na
mak
apan
ayam
ang
aki
ng a
nak n
a si
____
____
____
____
____
____
____
____
____
____
___
(PA
NG
ALA
N N
G B
ATA
) ni
____
____
____
____
____
____
____
(PA
NG
ALA
N N
G E
NU
MER
ATO
R) n
gayo
ng _
____
____
____
____
____
____
_, 2
016
(PET
SA).
10. C
URR
ENT
SEC
TIO
N:
MA
RK B
OX
WIT
H A
N 'X
' IF M
ORE
TH
AN
ON
E ST
UD
ENT
FRO
M T
HE
SAM
E H
OU
SEH
OLD
WA
S SE
LEC
TED
D
URI
NG
TH
E RA
ND
OM
SEL
ECTI
ON
C
ON
DU
CTE
D A
T SC
HO
OL.
4. L
OC
ALI
TY (U
RBA
N=1
, RU
RAL=
2):
9. C
URR
ENT
GRA
DE

Appendix 3102
PAN
IMU
LA
Mag
anda
ng a
raw
po!
Ako
si (P
AN
GA
LAN
NG
EN
UM
ERA
TOR)
, enu
mer
ator
par
a sa
pag
-aar
al p
ara
sa P
roye
kton
g You
th E
duca
tion
Inve
stm
ents
and
Lab
or M
arke
t Out
com
es S
urve
y in
the
Philip
pine
s (ip
akita
ang
ID
). A
ng a
min
g pag
-aar
al a
y ala
m a
t may
kapa
hint
ulut
an d
in p
o ng
Kag
awar
an n
g Edu
kasy
on (i
paki
ta a
ng M
emor
andu
m m
ula
sa D
epEd
). A
ng p
ag-a
aral
na
ito a
y nag
lala
yon
na ip
agpa
-ibay
uhin
ang
repo
rman
g hat
id
ng K
-12
sa se
ktor
ng e
duka
syon
. Nai
s po
nam
in n
a m
agin
g kat
uwan
g nam
in k
ayo
sa g
awai
ng it
o sa
pam
amag
itan
ng
pag
bibi
gay
inyo
ng sa
loob
in a
t kar
anas
an sa
pag
gaba
y sa
inyo
ng m
ga a
nak s
a pa
gpili
ng
kani
lang
edu
catio
nal t
rack
s sa
Seni
or H
igh
Scho
ol.
Kung
mam
arap
atin
nin
yo, n
ais k
o rin
pon
g hilin
gin
na a
ng in
yong
ana
k ay m
agin
g isa
sa m
ga re
spon
dent
ng p
ag-a
aral
na
ito. K
abila
ng sa
pag
-aar
al n
a ito
ang
pag
hing
i sa
Kaga
war
an n
g Edu
kasy
on n
g mga
dat
os sa
pa
aral
an n
g iny
ong a
nak g
aya
ng ka
nila
ng L
earn
er's
Prof
ile.
Maa
ri po
ban
g pirm
ahan
nin
yo a
ng b
ahag
ing i
to (C
onse
nt A
rea)
upa
ng p
atun
ay n
g iny
ong p
agpa
yag s
a pa
g-uu
sap
na it
o.
YOU
TH E
DU
CATI
ON
INVE
STM
ENT
AN
D L
ABO
R M
ARK
ET O
UTC
OM
ES S
URV
EY
TH
IS IN
FORM
ATIO
N IS
STRI
CTLY
CO
NFI
DEN
TIAL
AN
D IS
TO
BE
USE
D FO
R ST
ATIS
TICA
L PU
RPO
SES O
NLY
.
STU
DEN
T Q
UES
TIO
NN
AIR
E
SECT
ION
B: S
TUD
ENT
IDEN
TIFI
CATI
ON
COD
E
1. P
ROVI
NC
E:
2. M
UN
ICIP
ALI
TY/C
ITY:
3. B
ARA
NG
AY:
5. S
CH
OO
L ID
and
SC
HO
OL
NA
ME:
6. S
CH
OO
L TY
PE
7. F
ULL
HO
USE
HO
LD ID
ENTI
FIC
ATI
ON
:
8. S
TUD
ENT
ID a
nd S
TUD
ENT
NA
ME:
11. A
GE:
12. G
END
ER (M
ALE
=1, F
EMA
LE2)
Ang
sarb
ey n
a ito
ay a
lam
at m
ay ka
pahi
ntul
utan
ng K
agaw
aran
ng E
duka
syon
ng P
ilipin
as. L
ahat
ng i
mpo
rmas
yon
na m
akok
olek
ta a
y pag
-iing
atan
at i
tutu
ring k
ompi
dens
yal (
This
surv
ey is
aut
horiz
ed b
y the
the
Dep
artm
ent o
f Edu
catio
n of
the
Philip
pine
s. A
ll inf
orm
atio
n co
llect
ed h
erei
n w
ill be
trea
ted
with
utm
ost c
are
and
stric
t con
fiden
tialit
y).
PAH
INTU
LOT
Ako
si _
____
____
____
____
____
____
____
____
___
(PA
NG
ALA
N N
G M
AG
ULA
NG
/GU
ARD
IAN
at P
IRM
A S
A T
AA
S N
G P
AN
GA
LAN
), __
____
____
____
____
____
____
___
(rel
asyo
n sa
ba
tang
kapa
pana
yam
in)
ay p
umap
ayag
na
mak
apan
ayam
ang
aki
ng a
nak n
a si
____
____
____
____
____
____
____
____
____
____
___
(PA
NG
ALA
N N
G B
ATA
) ni
____
____
____
____
____
____
____
(PA
NG
ALA
N N
G E
NU
MER
ATO
R) n
gayo
ng _
____
____
____
____
____
____
_, 2
016
(PET
SA).
10. C
URR
ENT
SEC
TIO
N:
MA
RK B
OX
WIT
H A
N 'X
' IF M
ORE
TH
AN
ON
E ST
UD
ENT
FRO
M T
HE
SAM
E H
OU
SEH
OLD
WA
S SE
LEC
TED
D
URI
NG
TH
E RA
ND
OM
SEL
ECTI
ON
C
ON
DU
CTE
D A
T SC
HO
OL.
4. L
OC
ALI
TY (U
RBA
N=1
, RU
RAL=
2):
9. C
URR
ENT
GRA
DE

Appendix 3 103
SECT
ION
C: F
ORM
AL
SCH
OO
LIN
G
5.6.
S C H O O L I D
If yo
u w
ere
qual
ified
for a
vouc
her b
ut d
id n
ot
avai
l the
pro
gram
, why
did
you
not a
cces
s it?
If yo
u w
ere
qual
ified
for E
SC b
ut d
id n
ot av
ail
the
prog
ram
, why
did
you
not a
cces
s it?
2.a
Vouc
her
2.b
Educ
atio
n Se
rvic
e Co
ntra
ct
2.a
Vouc
her
2.b
Educ
atio
n Se
rvic
e Co
ntra
ct
4.a
Vouc
her
2.b
Educ
atio
n Se
rvic
e Co
ntra
ct
1. Wha
t typ
e of
scho
ol is
st
uden
t atte
ndin
g? (L
OA
D
AN
SWER
FRO
M G
1, Q
uest
ion
#6)
Are
you
awar
e of
the
follo
win
g pro
gram
s?Is
your
atte
ndan
ce at
pr
ivat
e sc
hool
par
tially
fu
nded
by t
he fo
llow
ing
prog
ram
s?
Are
you
qual
ified
to ac
cess
the
follo
win
g pro
gram
s?
3.2.
4.
SECT
ION
C: F
ORM
AL
SCH
OO
LIN
G
PUBL
IC ...
........
........
........
........
....1
PRIV
ATE
SECU
LAR
........
......2
PRIV
ATE
NO
N-
SECU
LAR
.......
........
........
.......
3PU
BLIC
LY F
INA
NCE
D
BUT
PRIV
ATE.
........
........
.......
4CO
MM
UN
ITY
BASE
D....
.....5
OTH
ER S
PECI
FY ...
........
........
.6
YES
.......
........
........
........
........
....1
NO
........
........
........
........
........
.....2
DO
N’T
KN
OW
.......
.......
998
YES
........
...1N
O ....
........
2
YES
........
..1N
O ....
.......
2
YES
........
........
..1
NO
........
........
...2
►7
DO
N’T
KN
OW
.....9
98
►7
YES
........
........
........
........
.....1
►
6
NO
........
........
........
........
......2
►
7D
ON
’T K
NO
W ...
....99
8 ►
7
NO
PRI
VATE
SCH
OO
LS IN
ARE
A ...
........
........
........
...1N
O P
RIVA
TE S
CHO
OLS
TH
AT C
OU
LD
AFF
ORD
/ V
ALU
E O
F VO
UCH
ER
IS N
OT
ENO
UG
H F
OR
PRIV
ATE
SCH
OO
L EX
PEN
SES .
........
........
........
........
........
........
........
........
........
...2PR
IVAT
E SC
HO
OL
QU
ALI
TY N
OT
G
OO
D C
OM
PARE
D T
O P
UBL
IC ....
........
........
........
...3PR
OCE
SS O
F AC
CESI
NG
VO
UCH
ER
IS D
IFFI
CULT
.......
........
........
........
........
........
........
........
.......4
WA
S N
OT
ACCE
PTED
INTO
PRE
FERR
ED
PRIV
ATE
SCH
OO
L .....
........
........
........
........
........
........
......5
PRIV
ATE
SCH
OO
L D
ID N
OT
OFF
ER
TRAC
K TH
AT W
AS
OF
INTE
REST
.......
........
........
....6
OTH
ER (S
PECI
FY) .
........
........
........
........
........
........
........
.....7

Appendix 3104
7.8.
9.10
.11.
12.
Are
you
fam
iliar
of t
he
Seni
or H
igh
Scho
ol S
tude
nt
Prim
er?
On
a sca
le o
f 1 to
10, 1
bei
ng
very
use
ful t
o 10
bei
ng n
ot
usef
ul, h
ow u
sefu
l is th
e Se
nior
Hig
h Sc
hool
Stu
dent
Pr
imer
?
Hav
e yo
u re
cent
ly
trans
ferre
d fro
m an
othe
r sc
hool
?
Wha
t are
the
thre
e m
ajor
reas
ons w
hy yo
u ha
ve
trans
ferre
d fro
m an
othe
r sch
ool?
For t
he n
ext s
choo
l yea
r, do
yo
u ha
ve p
lans
of
trans
ferri
ng to
anot
her
scho
ol?
Wha
t are
the
thre
e m
ajor
reas
ons w
hy yo
u ar
e pl
anni
ng to
tran
sfer
to an
othe
r sch
ool?
Rank
1:Ra
nk 1:
Rank
2:
Rank
2:
Rank
3:Ra
nk 3:
YES
........
....1
NO
........
.....2
►9
YES
........
....1
N
O ....
........
.2 ►
11YE
S ....
......1
N
O ....
.......
2 ►
13
TOP-
UP
EXPE
NSE
S(O
F PR
EVIO
US
SCH
OO
L) A
RE
UN
PEXC
TED
LY T
OO
HIG
H /
TH
E VO
UCH
ER
AM
OU
NT,
ESC
SU
SBSI
DIE
S, A
ND
/OR
OTH
ER
SCH
OLA
RSH
IP S
UBS
IDIE
S A
RE U
NEX
PECT
EDLY
N
OT
ENO
UG
H T
O C
OVE
R A
LL F
EES
IN
PREV
IOU
S SC
HO
OL .
........
........
........
........
........
........
........
........
...1
EXPE
CTED
TH
AT S
CHO
OL-
RELA
TED
EX
PEN
SES
(O
F PR
EVIO
US
SCH
OO
L) A
RE H
IGH
BU
T CA
N
NO
LO
NG
ER A
FFO
RD ....
........
........
........
........
........
........
........
....2
CAN
NO
T CO
PE W
ITH
ACA
DEM
IC R
EQU
IREM
ENTS
O
F PR
EVIO
US
SCH
OO
L .....
........
........
........
........
........
........
.......
3FE
LT T
HAT
[STU
DEN
T] D
ID N
OT
BELO
NG
TO
PR
EVIO
US
SCH
OO
L ....
........
........
........
........
........
........
........
.......
4TE
ACH
ERS
IN T
HE
PREV
IOU
S SC
HO
OL
D
ID N
OT
HAV
E TE
CHN
ICA
L EX
PERT
ISE .
........
........
........
5PR
EVIO
US
SCH
OO
L D
ID N
OT
OFF
ER S
TUD
ENT’
S PR
EFER
RED
TRA
CK ...
........
........
........
........
........
........
........
........
..6W
AN
T TO
MO
VE T
O A
SCH
OO
L TH
AT O
FFER
S BE
TTER
FAC
ILIT
IES
AN
D N
ON
-CU
RRIC
ULU
M
ACTI
VITI
ES ....
........
........
........
........
........
........
........
........
........
........
...7
PARE
NTS
/ G
UA
RDIA
NS
WA
NT
ME
TO M
OVE
BU
T TH
EIR
REA
SON
S A
RE U
NKN
OW
N T
O [S
TUD
ENT]
..8O
THER
(SPE
CIFY
) .....
........
........
........
........
........
........
........
........
......9

Appendix 3 105
13.
14.
15.
16.
17.
18.
19.
20.
21.
Doe
s you
r cur
rent
sc
hool
hav
e a c
ompu
ter
lab/
scho
ol co
mpu
ter
for s
tude
nts'
use?
How
ofte
n do
you
get
to ac
cess
the
com
pute
r la
b/sc
hool
com
pute
r?
Did
you
ever
use
the
scho
ol co
mpu
ter i
n m
akin
g edu
catio
n-re
late
d ch
oice
s, e.
g.,
empl
oyab
ility
or
pote
ntia
l wag
e re
turn
fro
m a
parti
cula
r job
th
at in
fluen
ced
your
ch
oice
of s
ubtra
ck,
educ
atio
n pr
ogra
ms/
sc
hola
rshi
ps yo
u ca
n av
ail o
f, et
c.?
Why
did
you
neve
r get
to
acce
ss th
e co
mpu
ter
lab
in yo
ur sc
hool
?
Doe
s you
r sch
ool h
ave
an in
tern
et co
nnec
tion?
How
ofte
n di
d yo
u ge
t to
acce
ss th
e in
tern
et
whi
le yo
u w
ere
enro
lled
at [S
CHO
OL]
?
Why
did
you
neve
r get
to
acce
ss th
e in
tern
et
whi
le yo
u w
ere
enro
lled
at [S
CHO
OL}
?
Doe
s you
r [SC
HO
OL]
ha
ve a
care
er/ c
olle
ge/
stud
ent c
ouns
elor
?
Doe
s you
r [SC
HO
OL]
pr
ovid
e ad
vanc
ed
clas
ses (
hono
rs
cour
ses/
spec
ial
clas
s/st
ar se
ctio
n)?
YES
........
........
........
........
......1
N
O ....
........
........
........
........
...2
►17
DO
N’T
KN
OW
.......
..998
►
17
YES
........
........
........
........
...1
NO
........
........
........
........
....2
DO
N’T
KN
OW
......9
98
EVER
YDAY
........
........
........
...1FE
W T
IMES
A W
EEK
.......2
FEW
TIM
ES A
M
ON
TH ...
........
........
........
..3FE
W T
IMES
A Y
EAR
........
4N
EVER
.......
........
........
........
....5
►16
OTH
ER, S
PECI
FY ....
........
..6
YES
........
........
....1 ►
17N
O ....
........
........
.2 ►
17
NO
T EN
OU
GH
CO
MPU
TERS
.......
........
....1
COM
PUTE
RS N
OT
WO
RKIN
G ...
........
........
.....2
USA
GE
REST
RICT
ED
BY S
CHO
OL .
........
........
....3
NO
T IN
TERE
STED
.......
...4H
AVE
COM
PUTE
R AC
CESS
AT
HO
ME .
.......5
OTH
ER, S
PECI
FY ....
........
..6
YES
........
........
........
.....1
N
O ....
........
........
........
..2 ►
20D
ON
’T
KNO
W ....
........
....99
8 ►
20EV
ERYD
AY ....
........
........
......1
►
20FE
W T
IMES
A W
EEK
......2
►
20FE
W T
IMES
A
MO
NTH
.......
........
........
.....3
►
20FE
W T
IMES
A Y
EAR
.......
4 ►
20N
EVER
.......
........
........
........
...5
►19
OTH
ER, S
PECI
FY ....
........
.6
►20
NO
T EN
OU
GH
CO
MPU
TERS
.......
........
1CO
MPU
TERS
NO
T W
ORK
ING
.......
........
.....2
USA
GE
REST
RICT
ED
BY S
CHO
OL .
........
........
3N
OT
INTE
REST
ED ...
...4
HAV
E CO
MPU
TER
ACCE
SS A
T H
OM
E ....
5O
THER
, SPE
CIFY
........
..6
YES
.......
........
........
........
.......
1N
O ....
........
........
........
........
....2
►23
DO
N’T
KN
OW
.......
...998
►
23N
/A ....
........
........
........
.....9
99
►23

Appendix 3106
22.
23.
24.
25.
26.
27.
28.
29a
29b
Dur
ing t
his s
choo
l ye
ar, h
ave
you
take
n an
y ad
vanc
ed
clas
ses/
cour
ses a
t [S
CHO
OL]
?
Wha
t was
your
ac
adem
ic ra
nkin
g in
your
clas
s in
your
pr
evio
us gr
ade
leve
l?
Wha
t is y
our
acad
emic
rank
ing
in yo
ur cl
ass i
n yo
ur
curre
nt gr
ade
leve
l?
Hav
e yo
u ta
ken
NCA
E?H
ave
you
alre
ady
rece
ived
the
resu
lts
of yo
ur N
CAE?
On
a sca
le o
f 1-1
0, 1
bein
g ver
y use
ful t
o 10
bei
ng n
ot u
sefu
l, ho
w u
sefu
l do
you
cons
ider
the
info
rmat
ion
from
th
e N
CAE
whi
le
mak
ing
educ
atio
n/ca
reer
de
cisio
ns?
Besid
es N
CAE,
ha
ve yo
u ta
ken
any
othe
r car
eer
asse
ssm
ent t
ools?
Plea
se sp
ecify
nam
e of
care
er
asse
ssm
ent t
ool t
aken
.O
n a s
cale
of 1
-10,
1 be
ing v
ery u
sefu
l to
10 b
eing
not
use
ful,
how
use
ful d
o yo
u co
nsid
er th
e ca
reer
as
sess
men
t too
l in
Q29
a w
as/w
ill b
e in
mak
ing
educ
atio
n/ca
reer
de
cisio
ns?
30.
Wha
t deg
ree
track
are
you
curre
ntly
enr
olle
d in
(onl
y fo
r 11th
grad
ers)
?
YES
........
...1N
O ....
........
2
TOP
5 ....
........
........
........
1TO
P 5–
10 ...
........
........
.2TO
P 10
–25%
........
.......3
TOP
25–5
0% ....
........
...4BO
TTO
M 2
6–50
......5
BOTT
OM
25%
.......
....6
DO
N’T
KN
OW
...99
8
TOP
5 ....
........
........
........
1TO
P 5–
10 ...
........
........
.2TO
P 10
–25%
........
.......3
TOP
25–5
0% ....
........
...4BO
TTO
M 2
6–50
......5
BOTT
OM
25%
.......
....6
DO
N’T
KN
OW
...99
8
YES
........
...1
N
O ....
........
.2 ►
28YE
S ....
.......
1
NO
........
.....2
►28
YES
........
...1
N
O ....
........
.2 ►
30
Philip
pine
Apt
itude
Cl
assif
icat
ion
Test
.......
........
........
.1Ph
ilippi
ne O
ccup
atio
nal
Inte
rest
Sur
vey .
........
........
........
......2
Adm
issio
n Te
st fo
r Col
lege
s an
d U
nive
rsiti
es ....
........
........
........
.3Sc
ienc
e an
d Te
chno
logy
Sc
hola
rshi
p Ex
amin
atio
n .....
......4
Oth
er, S
peci
fy ...
........
........
........
.......5
ACA
DEM
IC ...
........
........
........
.1
►32
TECH
NIC
AL/
VOCA
TIO
NA
L /
LIVE
LIH
OO
D ....
........
........
..2SP
ORT
S .....
........
........
........
.......3
►
33A
RTS
AN
D D
ESIG
N ...
........
4 ►
33

Appendix 3 107
31.
32.
33.
34.
Wha
t are
the
3 maj
or co
nsid
erat
ions
for
choo
sing t
his s
trand
? Ran
k in
orde
r of
impo
rtanc
e (1
- m
ost i
mpo
rtant
, and
so o
n)
of e
ach
sour
ce in
your
dec
ision
mak
ing.
Whi
ch 3
maj
or so
urce
s of i
nfor
mat
ion
did
you
use
in yo
ur ch
oice
of t
rack
? Ran
k in
orde
r of i
mpo
rtanc
e (1
- m
ost i
mpo
rtant
, an
d so
on)
.
Rank
1:Ra
nk 1:
Rank
2:
Rank
2:
Rank
3:Ra
nk 3:
If te
chni
cal/v
ocat
iona
l/liv
elih
ood
track
, w
hich
spec
ializ
atio
n di
d yo
u ta
ke?
If ac
adem
ic tr
ack,
whi
ch st
rand
did
you
take
?
AGRI
-FIS
HER
Y A
RTS
........
........
........
........
1 ►
33H
OM
E EC
ON
OM
ICS
........
........
........
........
2 ►
33IN
FORM
ATIO
N A
ND
CO
MM
UN
ICAT
ION
TE
CHN
OLO
GY
(ICT
) .....
........
........
........
..3 ►
33IN
DU
STRI
AL
ART
S .....
........
........
........
.......4
►33
TVL
MA
RITI
ME
.......
........
........
........
........
....5 ►
33
ACCO
UN
TAN
CY, B
USI
NES
S an
d M
AN
AGEM
ENT(
ABM
) STR
AN
D ....
........
.....1
HU
MA
NIT
IES
and
SOCI
AL
SCIE
NCE
(HU
MSS
) STR
AN
D....
........
........
........
........
........
..2SC
IEN
CE,T
ECH
NO
LOG
Y an
d EN
GIN
EERI
NG
and
MAT
HEM
ATIC
S(ST
EM) S
TRA
ND
.......
3G
ENER
AL
ACA
DEM
IC S
TRA
ND
.......
........
....4
PRE-
BACC
ALA
URE
ATE
MA
RITI
ME .
........
...5
POTE
NTI
AL
WAG
ES ...
........
........
........
........
........
.1BR
OA
D E
MPL
OYM
ENT
OPP
ORT
UN
ITIE
S ...
........
........
........
........
........
........
........
........
........
........
...2
EMPL
OYM
ENT
OPP
ORT
UN
ITIE
S IN
M
AN
ILA
.......
........
........
........
........
........
........
........
....3
ABI
LITY
TO
WO
RK A
BRO
AD
........
........
........
..4IN
TERE
ST ...
........
........
........
........
........
........
........
.......
5BE
ST F
ITS
MY
SKIL
LS ....
........
........
........
........
.......
6CO
ST/F
INA
NCI
AL
CON
SID
ERAT
ION
.....
7RE
COM
MEN
DAT
ION
OF
PARE
NTS
......
.....8
RECO
MM
END
ATIO
N O
F O
THER
FA
MIL
Y M
EMBE
RS ..
........
........
........
........
........
........
........
..... 9
RECO
MM
END
ATIO
N O
F FR
IEN
DS/
PEER
S ...
........
........
........
........
........
........
........
........
........
........
10LO
CATI
ON
/PRO
XIM
ITY
OF
SCH
OO
L O
FFER
ING
TH
E M
AJO
R/VO
CATI
ON
....1
1SO
CIA
L AC
CEPT
ABI
LITY
/EX
PECT
ATIO
NS
.......
........
........
........
........
........
........
........
........
........
....12
OTH
ER, S
PECI
FY ....
........
........
........
........
........
.....1
3
PARE
NTS
........
........
........
........
........
........
........
........
.....1
SIBL
ING
S.....
........
........
........
........
........
........
........
........
2TE
ACH
ER ....
........
........
........
........
........
........
........
........
3PE
ERS .
........
........
........
........
........
........
........
........
........
...4
GU
IDA
NCE
CO
UN
SELO
R .....
........
........
........
.....5
RELA
TIVE
........
........
........
........
........
........
........
........
....6
BOO
KS, N
EWSP
APE
R, M
AGA
ZIN
E ....
........
..7IN
TERN
ET ...
........
........
........
........
........
........
........
.......
8TE
LEVI
SIO
N/R
AD
IO ..
........
........
........
........
........
.9O
WN
PER
CEPT
ION
........
........
........
........
........
....10
OTH
ER, S
PECI
FY ....
........
........
........
........
........
......1
1

Appendix 3108
SECT
ION
D: J
OBS
/APP
REN
TICE
SHIP
/IN F
ORM
AL
TRA
ININ
G/IN
DU
STRY
IMM
ERSI
ON
DU
RIN
G S
CHO
OL
2.3.
4.5.
6.7.
8.9.
10.
11.12
.O
ccup
atio
n C
ode
How
muc
h tim
e pe
r wee
k do
you
spen
d on
jo
b/ap
pren
tices
hip/
OJT
or
info
rmal
trai
ning
?
Wha
t cos
ts w
ere
invo
lved
whi
le o
btai
ning
th
is jo
b/ap
pren
tices
hip/
OJT
/or
info
rmal
trai
ning
?
Doe
s you
r cur
rent
scho
ol
offe
r sho
rt-te
rm (l
ess t
han
one
mon
th) i
ndus
try
imm
ersio
n ac
tiviti
es?
Sinc
e th
e be
ginn
ing
of th
e cu
rrent
scho
ol ye
ar, h
ave
you
ever
par
ticip
ated
in
any o
f the
se (s
hort-
term
) in
dust
ry im
mer
sion
activ
ities
that
your
scho
ol
offe
red
to it
s stu
dent
s?
Sinc
e th
e be
ginn
ing
of th
e sc
hool
year
, app
roxi
mat
ely
how
man
y hou
rs h
ave
you
spen
t on
thes
e (s
hort-
term
) stu
dent
imm
ersio
n ac
tiviti
es th
at yo
ur sc
hool
of
fere
d?
NU
MBE
RPH
P
How
did
you
find
this
job/
appr
entic
eshi
p/O
JT/o
r inf
orm
al
train
ing?
Wha
t typ
e of
jo
b/ap
pren
tices
hip/
OJ
T/or
info
rmal
trai
ning
w
as th
is?
J O B / A P P R E N T I C E S H I P I D
1. D
id y
ou p
ursu
e an
y jo
b, a
ppre
ntic
eshi
p, O
JT o
r inf
orm
al tr
aini
ng (f
or m
ore
than
one
mon
th) w
hile
you
wer
e in
scho
ol d
urin
g th
is sc
hool
yea
r?
Job
Des
crip
tion
Indu
stry
C
ode
Was
this
job/
appr
entic
eshi
p/O
JT/o
r in
form
al tr
aini
ng p
art o
f [S
CH
OO
L]'s
requ
irem
ents
?
INCL
UD
E A
LL S
EARC
H
COST
S SU
CH A
S TR
AN
SPO
RT, F
OO
D,
BRIB
ES, E
NRO
LLM
ENT
WIT
H R
ECRU
ITER
FEE
, ET
C.
INCL
UD
E TR
AVE
L TI
ME
A
ND
PRE
PARA
TIO
N T
IME
SPEN
T FO
R JO
B/A
PPRE
NTI
CESH
IP/ O
R IN
FORM
AL
TRA
ININ
G
SECT
ION
D: J
OBS
/APP
REN
TICE
SHIP
/IN F
ORM
AL
TRA
ININ
G/IN
DU
STRY
IMM
ERSI
ON
DU
RIN
G S
CHO
OL
Refe
r to
App
endi
x on
Occ
upat
ion
Code
s
Refe
r to
App
endi
x on
Indu
stry
Co
des
YES,
TO
REC
EIVE
FI
NA
NCI
AL
AID
.......
.....1
YES,
FO
R CO
URS
E CR
EDIT
........
........
........
.......
2N
O ....
........
........
........
........
.......
3
SCH
OO
L CO
NTA
CTS .
........
....1
FAM
ILY/
RE
LATI
VE ...
........
......2
AD
VERT
ISEM
ENT
..3RE
CRU
ITM
ENT
FIRM
.......
........
........
....4
FRIE
ND
S .....
........
........
.5O
THER
S,
SPEC
IFY.
........
........
....6
PAID
........
........
........
..1RE
CEIV
ED
SUBS
IDY
........
......2
UN
PAID
.......
........
...3
YES
........
........
........
........
....1
NO
........
........
........
........
.....2
►ne
xt S
ectio
nD
ON
’T K
NO
W ...
....99
8 ►
next
Sec
tion
YES
........
........
........
........
....1
NO
........
........
........
........
.....2
►ne
xt S
ectio
n
YES
........
........
........
....1
NO
........
........
........
.....2
►
NEX
T SE
CTIO
N

Appendix 3 109
SECTION E: SENIOR HIGH SCHOOL CHOICE (FOR GRADES 9 AND 10)SECTION E: SENIOR HIGH SCHOOL CHOICE (for Grades 9 and 10)
SN Question Code Answer1 Do you expect to continue onto senior high school education?
2 What are the 3 most important factors for not continuing with senior high school education or do not know about your decision. Rank in order of preference (1 - most important, etc). (SKIP TO NEXT SECTION AFTER RESPONDING TO THIS QUESTION)
3 What degree track do you plan to enroll in?
4 Ideally, what strand/specialization would you like/prefer to pursue for your senior high school education?
5 What are the 3 major considerations for choosing your first two options in Question 4? Rank in order of preference with 1 as the most important.
6 Considering your current circumstances, what track are you more likely to end up pursuing?
7 How many people who have pursued this track have influenced your decision? NUMBER
8 How many people who have pursued this strand (i.e., your identified Option 1 strand in Q4) have influenced your decision? NUMBER
Option 1Option 2Option 3
10. a Senior high school
Rank 1___Rank 2___Rank 3___
9 What are your three top school choices for senior high school?
Which source of information did you use/plan to use regarding your choice of senior high school and track/strand? Identify and rank the three most important sources (1-most important and so on).
10
Option 1:
Option 2:
YES .......................................1 ►3NO ....................................... 2 DON’T KNOW .........998
Rank 1
Rank 1
Rank 2
Rank 2
Rank 3
Rank 3
Accountancy, Business and Management (ABM) ......................... 1Science, Technology, Engineering and Mathematics (STEM) .. 2Humanities and Social Sciences (HUMSS) ....................................... 3General Academic Strand (GAS) .......................................................... 4Pre-baccalaureate Maritime .................................................................... 5Home Economics (HE) ............................................................................. 6Information and Communications Technology (ICT) .................. 7Agri-Fishery Arts .......................................................................................... 8Industrial Arts ................................................................................................ 9TVL Maritime ..............................................................................................10DON’T KNOW .......................................................................................998
FINANCIAL PROBLEM............................................................................1HOUSEHOLD RESPONSIBILITIES ....................................................2GRADES NOT SUFFICIENT ..................................................................3NOT NECESSARY FOR CHOICE OF EMPLOYMENT .................................................................4ALREADY HAVE A JOB OFFER ...........................................................5NOT INTERESTED ....................................................................................6UNDECIDED ON WHAT TO STUDY ...............................................7 WANT TO PURSUE OTHER INTERESTS........................................8FELT UNPREPARED FOR POST-SECONDARY SCHOOL ......9MARRIAGE ................................................................................................ 10OTHER, SPECIFY ..................................................................................... 11
ACADEMIC ...........................................................................................1TECHNICAL/VOCATIONAL/LIVELIHOOD .......................2SPORTS ...................................................................................................3 ►5ARTS AND DESIGN ..........................................................................4 ►5DON’T KNOW .............................................................................. 998 ►5
POTENTIAL WAGES ...................................................................................... 1BROAD EMPLOYMENT OPPORTUNITIES ......................................... 2EMPLOYMENT OPPORTUNITIES IN MANILA ................................ 3ABILITY TO WORK ABROAD .................................................................... 4INTEREST ............................................................................................................ 5BEST FITS MY SKILLS ..................................................................................... 6COLLEGE PREPAREDNESS ......................................................................... 7COST/FINANCIAL CONSIDERATION ............................................... 8RECOMMENDATION OF PARENTS ..................................................... 9RECOMMENDATION OF OTHER FAMILY MEMBERS ........................................................................................................10RECOMMENDATION OF FRIENDS/PEERS .....................................11LOCATION/PROXIMITY OF SCHOOL OFFERING THE MAJOR/VOCATION ...............................................12SOCIAL ACCEPTABILITY/EXPECTATIONS ....................................13
ACADEMIC ...................................................................................................1TECHNICAL/VOCATIONAL/LIVELIHOOD ...............................2SPORTS ...........................................................................................................3ARTS AND DESIGN ..................................................................................4DON’T KNOW ............................................................................................5
Encircle here PARENTS/SIBLINGS ............................................................................................ 1 TEACHER ................................................................................................................... 2 PEERS ........................................................................................................................... 3 GUIDANCE COUNSELOR ................................................................................. 4ADMISSION OFFICERS FROM OTHER SCHOOLS, COLLEGES OR
UNIVERSITIES ...................................................................................................... 5RELATIVE ................................................................................................................... 6 BOOKS, NEWSPAPER, MAGAZINE.............................................................. 7INTERNET ................................................................................................................. 8 TELEVISION/RADIO .......................................................................................... 9 OTHER SUCCESSFUL INDIVIDUAL(S) ENCOUNTERED .............. 10 GENERAL PUBLIC PERCEPTION .................................................................11 OTHER, SPECIFY ..................................................................................................12

Appendix 3110
SECTION E: SENIOR HIGH SCHOOL CHOICE (for Grades 9 and 10)
SN Question Code Answer10 10. b Track/Subtrack
Rank 1___Rank 2___Rank 3___
11a. Location [Scale 1-10]11b. Parental recommendation [Scale 1-10]11c. Relative recommendation [Scale 1-10]11d. Counselor recommendation [Scale 1-10]11e. Peer recommendation [Scale 1-10]11f. School Reputation [Scale 1-10]11g. Degree offerings [Scale 1-10]11h. Interest in track/subtrack/vocation [Scale 1-10]11i. Costs [Scale 1-10]11j. Future employment/salary prospects [Scale 1-10]11k. Other, Specify [Scale 1-10]
12 Do you have any information on financial aid (scholarships, student loans) for senior high schools?
13 What were your sources of information on financial aid for senior high school? Check all that apply.
14 Do you plan to apply for any scholarships or student loans?
15 Why don't you want to apply for scholarship/student loan?
16 Do you expect to take some time off from school for a year before you start your senior high school education? If yes, why?
17 On a scale of 1–10, with 1 being the most important and 10 the least important, how much do you think the chosen track matters in college preparedness?
18 On a scale of 1–10, with 1 having the highest probability and 10 the lowest probability, what do you think is the probability that training in this track will lead to employment in any occupation (if applicable)?
20 On a scale of 1-10, with 1 being very important and 10 not important, how much do you think the quality of school matters in determining job outcomes?
21 On a scale of 1-10, with 1 being very important and 10 not important, how much do you think the chosen track matters in determining job outcomes?
How much do the following factors play a role in choosing this school? (1 - most important, etc).11
19 On a scale of 1-10, with 1 being most certain and 10 least certain, how certain are you that this your desired track over long term?
Encircle here PARENTS/SIBLINGS ............................................................................................ 1 TEACHER ................................................................................................................... 2 PEERS ........................................................................................................................... 3 GUIDANCE COUNSELOR ................................................................................. 4ADMISSION OFFICERS FROM OTHER SCHOOLS, COLLEGES OR
UNIVERSITIES ...................................................................................................... 5RELATIVE ................................................................................................................... 6 BOOKS, NEWSPAPER, MAGAZINE.............................................................. 7INTERNET ................................................................................................................. 8 TELEVISION/RADIO .......................................................................................... 9 OTHER SUCCESSFUL INDIVIDUAL(S) ENCOUNTERED .............. 10 GENERAL PUBLIC PERCEPTION .................................................................11 OTHER, SPECIFY ..................................................................................................12
WEBSITE OF POST SECONDARY INSTITUTIONS ..................................................................................1 [ ]
TEACHER .................................................................................................2 [ ]GUIDANCE COUNSELOR ...............................................................3 [ ]ADMISSION OFFICERS FROM OTHER SCHOOLS,
COLLEGES OR UNIVERSITIES....................................................4 [ ]RELATIVE .................................................................................................5 [ ]PARENT/GUARDIAN ......................................................................6 [ ]BOOKS, NEWSPAPER, MAGAZINE ...........................................7 [ ]BANK .........................................................................................................8 [ ]OTHER INTERNET SOURCES,SPECIFY ...................................9 [ ]WEBSITE OF OTHER SCHOLARSHIP PROVIDERS ........ 10 [ ]FLYERS/PRINT ADS ....................................................................... 11 [ ]OTHER, SPECIFY ............................................................................... 12 [ ]
YES ................................. 1 NO .................................. 2 ►14
YES ................................. 1 ►16NO .................................. 2
TEDIOUS PROCESS ..................................................................................1 DON’T KNOW ANY .................................................................................2NOT CONFIDENT THAT APPLICATION
WILL BE APPROVED ..............................................................................3OTHER (SPECIFY) .....................................................................................4
YES, FINANCIAL .......................................................................................1YES, TRAVEL ................................................................................................2YES, WORK EXPERIENCE ......................................................................3YES, NEED A BREAK .................................................................................4NO .....................................................................................................................5OTHER, SPECIFY ........................................................................................6
1 ..............12 ..............23 ..............34 ..............45 ..............5
1 ..............12 ..............23 ..............34 ..............45 ..............5
1 ..............12 ..............23 ..............34 ..............45 ..............5
1 ..............12 ..............23 ..............34 ..............45 ..............51 ..............12 ..............23 ..............34 ..............45 ..............5
6 ..............67 ..............78 ..............89 ..............910 ........10
6 ..............67 ..............78 ..............89 ..............910 ........10
6 ..............67 ..............78 ..............89 ..............910 ........10
6 ..............67 ..............78 ..............89 ..............910 ........106 ..............67 ..............78 ..............89 ..............910 ........10

Appendix 3 111
SECTION F: COLLEGE CHOICESECTION F: COLLEGE CHOICE
SN Code Answer1
2
Rank 1___Rank 2___Rank 3___
3NUMBER
4
1st Choice
2nd Choice
1st Choice
Rank 1___Rank 2___Rank 3___
2nd ChoiceRank 1___Rank 2___Rank 3___
7
8
9
Option 1
Option 2
Option 3
What are you more likely to end up studying?
What is the monthly income you expect to receive upon accepting a job after graduating with this degree? Report in PHP
Do you expect to continue onto post-secondary education?
5
Question
What major would you like/aspire to pursue for your post-secondary education?
6
What are the 3 most important factors for not continuing with post secondary education or do not know about your decision. Rank in order of preference (1 - most important, etc). (SKIP TO NEXT SECTION AFTER RESPONDING TO THIS QUESTION)
What is the highest degree you want to obtain?
How many people who have pursued post-secondary education infludence your decision?
What are your 3 major considerations for choosing this major/vocation? Choose top 3 considerations (1 - most important, etc)
What type of degree program do you need to enroll in in order to pursue this career?
10 What are your three top choices for post secondary schools?
YES .......................................1 ►3NO ....................................... 2 DON’T KNOW .........998
FINANCIAL PROBLEM.................................................................................................... 1HOUSEHOLD RESPONSIBILITIES ............................................................................ 2GRADES NOT SUFFICIENT .......................................................................................... 3NOT NECESSARY FOR CHOICE OF EMPLOYMENT ......................................................................................... 4ALREADY HAVE A JOB OFFER ................................................................................... 5NOT INTERESTED ............................................................................................................ 6UNDECIDED ON WHAT TO STUDY ....................................................................... 7 WANT TO PURSUE OTHER INTERESTS................................................................ 8FELT UNPREPARED FOR POST-SECONDARY SCHOOL .............................. 9MARRIAGE .........................................................................................................................10OTHER, SPECIFY ..............................................................................................................11
CERTIFICATE/DIPLOMAVOCATIONAL DEGREE .................................................................................................. 1ASSOCIATE........................................................................................................................... 2BACHELORS......................................................................................................................... 3MASTERS ............................................................................................................................... 4PHD AND ABOVE .............................................................................................................. 5OTHER, SPECIFY ................................................................................................................ 6
POTENTIAL WAGES ........................................................................................................ 1BROAD EMPLOYMENT OPPORTUNITIES ........................................................... 2EMPLOYMENT OPPORTUNITIES IN MANILA .................................................. 3ABILITY TO WORK ABROAD ...................................................................................... 4INTEREST .............................................................................................................................. 5BEST FITS MY SKILLS ....................................................................................................... 6COST/FINANCIAL CONSIDERATION ................................................................. 7RECOMMENDATION OF PARENTS ....................................................................... 8RECOMMENDATION OF OTHER FAMILY MEMBERS ................................. 9RECOMMENDATIO OF FRIENDS/PEERS ..........................................................10LOCATION/PROXIMITY OF SCHOOL OFFERING THE MAJOR/
VOCATION .....................................................................................................................11SOCIAL ACCEPTABILITY/EXPECTATIONS .................................................... 12OTHER, SPECIFY ..............................................................................................................13
INCLUDE OPTIONS IN APPENDIX(Include Don’t Know (998) as one of the possible answers)
INCLUDE OPTIONS IN APPENDIX(Include Don’t Know (998) as one of the possible answers)
LESS THAN PHP 5,000 ...................................................................................................1PHP 5,000 TO PHP 10,000 ...........................................................................................2PHP 10,000 TO PHP 20,000 ........................................................................................3PHP 20,000 TO PHP 30,000 ........................................................................................4PHP 30,000 TO PHP 50,000 ........................................................................................5PHP 50,000 TO PHP 70,000 ........................................................................................6OVER PHP 70,000.............................................................................................................7DON’T KNOW ..............................................................................................................998
VOCATIONAL DEGREE .................................................................................................. 1ASSOCIATE........................................................................................................................... 2BACHELORS......................................................................................................................... 3MASTERS ............................................................................................................................... 4PHD AND ABOVE .............................................................................................................. 5OTHER, SPECIFY ................................................................................................................ 6DON’T KNOW ...............................................................................................................998

Appendix 3112
SECTION F: COLLEGE CHOICE
SN Code AnswerQuestionOption 1 Rank 1___
Rank 2___Rank 3___
Option 2 Rank 1___Rank 2___Rank 3___
Option 3 Rank 1___Rank 2___Rank 3___
Rank 1___Rank 2___Rank 3___
Rank 1___Rank 2___Rank 3___
13
14
Rank 1___Rank 2___Rank 3___
15
16
17
18
19
20
21
22
12 Which source of information did you use/plan to use regarding your choice of post-secondary school and post-secondary major/vocation? Identify and rank the three most important sources.
What are your 3 major considerations for choosing this school? Choose top 3 considerations
11
12. b Post-secondary major/vocation
12. a Post-secondary school
Do you plan to apply for any scholarships or student loans?
What were your sources of information on financial aid for post-secondary schools? Identify and rank the three most important sources.
Do you have any information on financial aid (scholarships, student loans) for post-secondary schools?
On a scale of 1-10, with 1 being very important and 10 not important, how much do you think the major matters in determining job outcomes?
On a scale of 1-10, with 1 being very important and 10 not important, how much do you think the quality of school matters in determining job outcomes?
On a scale of 1-10, with 1 being most likely and 10 least likely, how likely do you see yourself in this field of work in the next ten years?
On a scale of 1-10, with 1 having very high probability and 10 very low probability, what do you think is the probability that completing the program will lead to employment in any occupation (if applicable)?
On as scale of 1-10, with 1 having very high level of confidence and 10 very low, how confident are you in completing your post-secondary education?
Why don't you want to apply for scholarship/student loan?
Do you expect to take some time off from school before you start your post secondary education? If yes, why?
LOCATION .........................................................................................................................1PARENTAL RECOMMENDATION ..........................................................................2RELATIVE RECOMMENDATION .............................................................................3COUNSELOR RECOMMENDATION .....................................................................4PEER RECOMMENDATION........................................................................................5SCHOOL REPUTATION ...............................................................................................6DEGREE OFFERINGS .....................................................................................................7INTEREST IN MAJOR/VOCATION ........................................................................8COSTS ...................................................................................................................................9FUTURE EMPLOYMENT/SALARY PROSPECTS ........................................... 10OTHER SPECIFY ............................................................................................................ 11
Encircle here PARENTS/SIBLINGS ................................................................................................................... 1 TEACHER .......................................................................................................................................... 2 PEERS .................................................................................................................................................. 3 GUIDANCE COUNSELOR ........................................................................................................ 4ADMISSION OFFICERS FROM OTHER SCHOOLS, COLLEGES OR
UNIVERSITIES ............................................................................................................................. 5RELATIVE .......................................................................................................................................... 6 BOOKS, NEWSPAPER, MAGAZINE..................................................................................... 7INTERNET ........................................................................................................................................ 8 TELEVISION/RADIO ................................................................................................................. 9 OTHER SUCCESSFUL INDIVIDUAL(S) ENCOUNTERED .................................... 10 GENERAL PUBLIC PERCEPTION ....................................................................................... 11 OTHER, SPECIFY ........................................................................................................................ 12
YES ................................. 1 NO .................................. 2 ►15
WEBSITE OF POST SECONDARY INSTITUTIONS ..................................1 [ ]TEACHER ......................................................................................................................2 [ ]GUIDANCE COUNSELOR ....................................................................................3 [ ]ADMISSION OFFICERS FROM OTHER SCHOOLS,
COLLEGES OR UNIVERSITIES.........................................................................4 [ ]RELATIVE ......................................................................................................................5 [ ]PARENT/GUARDIAN ...........................................................................................6 [ ]BOOKS, NEWSPAPER, MAGAZINE ................................................................7 [ ]BANK ..............................................................................................................................8 [ ]OTHER INTERNET SOURCES,SPECIFY ........................................................9 [ ]WEBSITE OF OTHER SCHOLARSHIP PROVIDERS .............................10 [ ]FLYERS/PRINT ADS ............................................................................................11 [ ]OTHER, SPECIFY ....................................................................................................12 [ ]
YES ................................. 1 ►17NO .................................. 2
YES ................................. 1 ►17NO .................................. 2
TEDIOUS PROCESS ...................................................................................................... 1 DON’T KNOW ANY ..................................................................................................... 2NOT CONFIDENT THAT APPLICATION WILL BE APPROVED ............. 3OTHER (SPECIFY) ......................................................................................................... 4
YES, FINANCIAL .............................................................................................................1YES, TRAVEL ......................................................................................................................2YES, WORK EXPERIENCE ............................................................................................3YES, NEED A BREAK .......................................................................................................4NO ...........................................................................................................................................5OTHER, SPECIFY ..............................................................................................................61 ..............12 ..............23 ..............34 ..............45 ..............51 ..............12 ..............23 ..............34 ..............45 ..............51 ..............12 ..............23 ..............34 ..............45 ..............51 ..............12 ..............23 ..............34 ..............45 ..............51 ..............12 ..............23 ..............34 ..............45 ..............5
6 ..............67 ..............78 ..............89 ..............910 ........106 ..............67 ..............78 ..............89 ..............910 ........106 ..............67 ..............78 ..............89 ..............910 ........106 ..............67 ..............78 ..............89 ..............910 ........106 ..............67 ..............78 ..............89 ..............910 ........10

Appendix 3 113
SECTION G: OCCUPATION CHOICESECTION G: OCCUPATION CHOICE
SN Question Code1 What is your main occupational choice at age
30? [asked of everyone]2 On average, how much monthly income do
you expect to make in this occupation at age 30, in today's terms?
3 How much education is needed for this kind of work?
4 Which 3 major sources of information did you use in your choice of occupation/skill? Rank in order of influence/importance each source encircled (1 - most important, and so on).
Rank 1 Rank 2 Rank 3
5 How many relatives who have a similar occupation have influenced your decision?
6 How many community members/friends who have a similar occupation of your choice have influenced your decision?On a scale of 1-10, with 1 being the highest and 10 the least, how influential are/were the following factors in your choice of occupation?7.a Employment Opportunities In Manila7.b Ability to Work Abroad7.c Interest7.d Best Fits My Skills7.e Cost/Financial Consideration7.f Recommendation of Parents7.g Recommendation of Other Family 7.h Recommendation of Friends/Peers7.i Location/Proximity of School Offering the Major/Vocation7.j Social Acceptability/Expectations7.k Other, Specify
8 On a scale of 1-10, with 1 being very certain and 10 uncertain, how certain are you that this your desired skill/occupation over long term?
Answer
7
NUMBER
NUMBER
LESS THAN PHP 5,000 .......................................................... 1PHP 5,000 TO PHP 10,000 .................................................. 2PHP 10,000 TO PHP 20,000 ............................................... 3PHP 20,000 TO PHP 30,000 ............................................... 4PHP 30,000 TO PHP 50,000 ............................................... 5PHP 50,000 TO PHP 70,000 ............................................... 6OVER PHP 70,000.................................................................... 7
HIGH SCHOOL DIPLOMA ...............................................1VOCATIONAL DEGREE ........................................................ 2ASSOCIATE................................................................................. 3BACHELORS............................................................................... 4MASTERS ..................................................................................... 5PHD................................................................................................. 6OTHER, SPECIFY ...................................................................... 7DON’T KNOW .....................................................................998
Encircle here PARENTS/SIBLINGS ....................................................................... 1 TEACHER .............................................................................................. 2 PEERS ...................................................................................................... 3 GUIDANCE COUNSELOR ............................................................ 4ADMISSION OFFICERS FROM OTHER SCHOOLS,
COLLEGES OR UNIVERSITIES ................................................. 5RELATIVE .............................................................................................. 6 BOOKS, NEWSPAPER, MAGAZINE ........................................ 7 INTERNET ........................................................................................... 8 TELEVISION/RADIO ..................................................................... 9 OTHER SUCCESSFUL INDIVIDUAL(S) ENCOUNTERED
10 GENERAL PUBLIC PERCEPTION ............................................11 OTHER, SPECIFY .............................................................................12
INSERT CODE998 FOR DON’T KNOW

Appendix 3114
SECTION H: SENIOR HIGH SCHOOL CAREER GUIDANCE PROGRAMSECTION H: SENIOR HIGH SCHOOL CAREER GUIDANCE PROGRAM
SN Question Code Answer1 During the last academic year, how often have your
parents / guardians participated in any of the following school-related activities?
2 Is it part of of the DepEd's Senior High School Career Guidance Program?
3 During this school year, how many hours did you get personalized help from career counsellor? (Write "0" if none).
4 What types of information did you receive? (select all that apply)
6 What types of other information would you find useful in making decisions about future career paths but have not been provided to you by the school's career guidance program?
5 On a scale of 1-10, with 1 being highly useful and 10 least useful, please rate the usefulness in making education-related decision of each type of information received as indicated in Question 4.
YES ............................................. 1NO ..............................................2 ►Skip for Next Section
YES ............................................. 1NO .............................................. 2DON’T KNOW ................998
LABOR MARKET INFORMATION ..........................................................1TYPES OF OCCUPATIONS AND TRAINING
THAT FIT PERSONAL INTERESTS ........................................................2TYPES OF OCCUPATIONS AND TRAINING
THAT FIT PERSONAL WAGE PREFERENCES ..................................3TYPES OF OCCUPATIONS AND TRAINING
THAT FIT SKILLS ...........................................................................................4SCHOOLS THAT CAN PROVIDE A QUALITY EDUCATION
GIVEN PREFERENCES .................................................................................5INFORMATION ON FUNDING OPTIONS .........................................6OCCUPATION OUTCOMES OF THOSE
FROM SCHOOLS IN REGION .................................................................7WAGE OUTCOMES OF THOSE FROM SCHOOLS
IN REGION .......................................................................................................8OCCUPATION OUTCOMES FROM NATIONL
LABOR MARKET ............................................................................................9OCCUPATION IN DEMAND OUTSIDE THE COUNTRY .........10OTHER, SPECIFY ..........................................................................................11
Rank1.....__2.....__3.....__4.....__5.....__6.....__7.....__8.....__9.....__10....__

Appendix 3 115
SECTION I: PERSPECTIVE ON PARENT’S INVOLVEMENT AND EXPECTATIONSSECTION I: PERSPECTIVE ON PARENT'S INVOLVEMENT AND EXPECTATIONS
SN Question CodeDuring the last academic year, how often have your parents/guardians participated in any of the following school-related activities?a) Discussed my behaviour with a teacher on their own initiative.b) Discussed my behaviour on the initiative of one of my teachersc) Discussed my progress with a teacher on my their own initiative.d) Discussed my progress on the initiative of one of my teachers.e) Volunteered in physical activities, e.g. building maintenance, carpentry, gardening or yard workf) Participated in extra-curricular activities, e.g. book club, school play, sports, field trip.g) Volunteered in the school library or media centre.h) Assisted a teacher in the school.i) Appeared as a guest speaker.j) Participated in local school , e.g. parent council or PTA.k) Discussed my progress with me, e.g. talked about my report card
2 What do you think is the track that your parents/guardians would prefer you to enroll in Senior High School?
3 What are your parent's /guardian's three major considerations in preferring this track for you? Rank all that applies in order of magnitude of each source in your decision making.
4 Do you think your parents/guardians expect you to continue onto post-secondary education?
5 What are the 3 most important factors why you think your parents/guardians do not expect you to continue with post secondary education or do not know about your decision? Rank in order of preference (1 - most important, etc). (SKIP TO NEXT SECTION AFTER RESPONDING TO THIS QUESTION)
6 Where do your parents/guardians expect you to study after junior high school?
7 Where do your parents/guardians expect you to study after senior high school?
8 Would your parents/guardians expect you to work part time to support part of your educational costs in post secondary education?
9 What type of work are you expected to engage in as an adult?
10 On average, how much monthly income are you expected to earn at age 30 by your parents?
11 Where do your parents expect you to work?
Answer1
Rank 1
Rank 2
Rank 3
Rank 1
Rank 2
Rank 3
POTENTIAL WAGES ....................................................................1BROAD EMPLOYMENT OPPORTUNITIES .......................2EMPLOYMENT OPPORTUNITIES IN MANILA ..............3ABILITY TO WORK ABROAD ..................................................4INTEREST ..........................................................................................5BEST FITS MY SKILLS ...................................................................6COLLEGE PREPAREDNESS .......................................................7COST/FINANCIAL CONSIDERATION .............................8RECOMMENDATION OF PARENTS ...................................9RECOMMENDATION OF OTHER
FAMILY MEMBERS ................................................................. 10RECOMMENDATION OF FRIENDS/PEERS .................. 11LOCATION/PROXIMITY OF SCHOOL
OFFERING THE MAJOR/VOCATION .......................... 12SOCIAL ACCEPTABILITY/EXPECTATIONS ................. 13DON’T KNOW ...........................................................................998
FINANCIAL PROBLEM................................................................1HOUSEHOLD RESPONSIBILITIES ........................................2GRADES NOT SUFFICIENT ......................................................3NOT NECESSARY FOR CHOICE OF EMPLOYMENT ...4ALREADY HAVE A JOB OFFER ...............................................5NOT INTERESTED ........................................................................6UNDECIDED ON WHAT TO STUDY ...................................7 WANT TO PURSUE OTHER INTERESTS............................8FELT UNPREPARED FOR POST-SECONDARY
SCHOOL .........................................................................................9MARRIAGE .................................................................................... 10OTHER, SPECIFY ......................................................................... 11DON’T KNOW ...........................................................................998
Professional (e.g., doctor, lawyer, manager, teacher, etc.) .........................................1
Working class/manual laborer/trades/ blue collar (e.g., factory, maintenance, carpenter, electrician, etc.) ..................................2
Service industry (e.g., food service, customer service, hospitality, etc.) ...................3
Clerical (e.g., office assistant, record keeping) .........................................................4
Technical (e.g., computer programming, electronics repair) ....................................................5
Employment is not likely for me ............................6Other type of work (please specify) ....................7Don’t Know.............................................................. 998
Within the city/municipality ........................................... 1Outside the city/municipality
but within the region ........................................................ 2Outside the region but within the Philippines .......... 3Overseas .................................................................................. 4Don’t Know........................................................................998
LESS THAN PHP 5,000 .........................................................1PHP 5,000 TO PHP 10,000 .................................................2PHP 10,000 TO PHP 20,000 ..............................................3PHP 20,000 TO PHP 30,000 ..............................................4PHP 30,000 TO PHP 50,000 ..............................................5PHP 50,000 TO PHP 70,000 ..............................................6OVER PHP 70,000...................................................................7DON’T KNOW ................................................................... 998
Once a week .................................................................1Once a month ..............................................................2Once every quarter ....................................................3Once a school year .....................................................4Never ...............................................................................5
YES ..................................................1 ►6NO ................................................... 2DON’T KNOW .....................998
YES ...............................................1NO ................................................2 ►10DON’T KNOW ................. 998
Academic ................................................................................ 1Technical/Vocational/Livelihood ................................. 2Sports........................................................................................ 3Arts and Design .................................................................... 4Others, specify ...................................................................... 5Don’t Know........................................................................998

Appendix 3116
SECTION J: STUDENT’S OVERALL SATISFACTIONSECTION J: STUDENT'S OVERALL SATISFACTION
1. On a scale of 1 to 10, 1 being very satisfied to 10 not satisfied, how satisfied are you in the following aspects of your current school?
2. Which three factors were most important in making the final decision in attending this school? Also, rank in order of preference (1 - most important, and so on).
Overall School Satisfaction
Congeniality of School Atmosphere/Feeling of belongingness
Location
Chosen Track/Strand
Curriculum Requirements
Competency of Teachers
Quality of Career Guidance
Quality of School FacilitiesTransparency of School on the Actual Amount of Tuition and Other Miscellaneous Fees Prior to Enrollment
Affordability of School Fees Rank 1: __________
Government Subsidies Rank 2: __________
Rank 3: __________
COSTS................1COSTS ................................................................................1CURRICULUM ................................................................2NEAR PARENTS’ HOME ............................................3NEAR RELATIVES’ HOME .........................................4SCHOOL QUALITY .....................................................5SCHOOL AFFILIATION .............................................6SCHOOL’S ACCREDITION ......................................7EDUCATION/EMPLOYMENT OUTCOMES ..................................................................8
COURSE OFFERINGS COINCIDE WITH PREFERENCES ................................................9
LACK OF GOOD PUBLIC SCHOOLS NEAR PARENTS’ HOME .......................................10
OTHER, SPECIFY ........................................................11

117
1. Corrected the miscoded and unmatched student ID number in the student and household databases, e.g., the original student ID number was used instead of that of the interviewed replacement student. This was done by (i) checking unmatched learner reference numbers (LRNs) between the student and household databases bearing the same home address and/or contact numbers, and (ii) confirming the correctness of the LRN encoded in the household database by comparing it to the name of the student in the Department of Education (DepEd) database.
2. Corrected the miscoded student ID number in the student and household databases, e.g., duplicate records of a unique LRN observed in the two databases. This was done by (i) confirming the correct LRN as indicated in step 1; (ii) identifying the miscoded LRN in the student database and/or household database; and (iii) encoding the correct LRN by comparing the name of the student, home address, gender, and grade level to those pieces of information in the DepEd database.
3. Corrected miscoded student ID, e.g., lacked “0” in front, had one of the 12 digits miscoded, had less than or more than 12 digits.
4. Dropped students (and their corresponding household data) with no matching household.
5. Dropped households (and their corresponding student data) with more than one sampled student.
6. Dropped miscoded student IDs, i.e., student IDs are supposed to be numeric with 12 digits, but the name of the student was encoded instead of the student ID in a few cases.
7. Sampled students’ ages go as high as 40–60 years old. It turned out that this was due to erroneous merging by the database specialist; data for some sampled students were recorded against the household head, or in the row corresponding to the household head, instead of the sampled student’s row. Erroneous age data were corrected.
8. Corrected miscoded school ID of some students, i.e., some sampled students were not assigned their proper or correct school IDs.
9. Corrected miscoded school IDs, i.e., school IDs are supposed to be numeric with six digits, but the name of the schools was encoded instead of the school ID in a few cases.
10. Corrected miscoded household head tag and gender of students and household members.
11. Recoded categories to reflect respondent’s correct answer, e.g., a mismatch between the input of Philippine Standard Occupational Classification category of survey enumerators and the interviewee’s preferred or anticipated occupation.12 This was done by checking for trends in miscoding occupational classification categories, e.g., police officers are usually tagged under “Armed Forces Occupations” (category 10); and tagging all variations of police officer responses, e.g., SPO1, spo1, po1, police, etc. under “Service and Sales Workers” (category 5).
12 Philippine Statistics Authority. Philippine Standard Occupational Classification. https://psa.gov.ph/sites/default/files/4publication.pdf.
APPENDIX 4: Data Cleaning Steps Undertaken

118 Appendix 4
12. Recoded “Others” if the respondent’s answer could fit under an existing category. This was done by manually checking respondents’ specific reason and recoding the response if the comment falls under existing options.
13. Manually recoded the number of individual guidance counseling hours reported by school principals. This was done by (i) checking for outliers among reported number of personalized guidance counseling hours of schools, e.g., 8,000 per school year; (ii) confirming the number by calling the school; and (iii) recoding the noted response as confirmed by the school head and/or guidance counselor.

119
Albert, J. R. 2016. What Do Statistics Say about Education in the Philippines? Philippine Institute for Development Studies (PIDS) Policy Note 2016-19. Quezon City: PIDS. http://pids.gov.ph/publications/5721.
Albert, J. R., Dumagan, J., and Martinez, A., Jr. 2015. Inequalities in Income, Labor, and Education: The Challenge of Inclusive Growth. Discussion Paper Series. No. 2015-01. Makati City: Philippine Institute for Development Studies.
Amoah, S., Kwofie, I., and Kwofie, F. 2015. The School Counsellor and Students’ Career Choice in High School: The Assessor’s Perspective in a Ghanaian Case. Journal of Education and Practice. 6 (23). pp. 57–65.
Asad, M., Iqbal, N., and Tasneem, S. 2015. The Influence of Parents Educational Level on Secondary School Students Academic Achievements in District Rajanpur. Journal of Education and Practice. 6 (16). https://files.eric.ed.gov/fulltext/EJ1079955.pdf.
Asian Development Bank. 2018. Social Protection Brief: Reducing Youth Not in Employment, Education, or Training through JobStart Philippines. ADB Brief No. 87.
Asian Development Bank. 2015. Key Indicators for Asia and the Pacific 2015. Manila.
Attanasio, O. and Kaufmann, K. 2009. Educational Choices, Subjective Expectations, and Credit Constraints. NBER Working Paper. No. 15087. Cambridge, Massachusetts: National Bureau of Economic Research.
Banerjee, A., Glewwe, P., Powers, S., and Wasserman, M. 2013. Expanding Access and Increasing Student Learning in Post-Primary Education in Developing Countries: A Review of the Evidence. J-PAL Post-Primary Education Initiative Review Paper. Cambridge, Massachusetts: Abdul Latif Jameel Poverty Action Lab.
Bonilla, L., Bottan, N., and Ham, A. 2016. Information Policies and Higher Education Choices: Experimental Evidence from Colombia. http://www.cedlas-er.org/sites/default/files/aux_files/ham.pdf.
Briones, L. 2016. Quality, Accessible, Relevant, and Liberating Basic Education for All. Presentation at the Education Summit 2016. Pasay City. 3–4 November.
Chen, X. 2013. STEM Attrition: College Students’ Paths Into and Out of STEM Fields: Statistical Analysis Report. Washington, DC: National Center for Education Statistics. https://nces.ed.gov/pubs2014/2014001rev.pdf.
Fischer, G. and Karlan, D. 2015. The Catch-22 of external validity in the context of constraints to firm growth. American Economic Review. 105 (5). pp. 295–299.
references

references120
Government of the Philippines, Commission on Higher Education. 2017. CHED Position on the Proposed Free Tuition for All Undergraduate Students in SUCs: Towards a Pro-Poor and Pro-Quality Higher Education. http://ched.gov.ph/wp-content/uploads/2017/10/CHED-Position-on-Free-Tuitionv2_Final_colored.pdf.
Government of the Philippines, Department of Education. K to 12 General Information. http://www.deped.gov.ph/k-to-12/faq.
______. Senior High School. http://www.deped.gov.ph/k-to-12/faq/senior-high-school.
______. 2017. Policy Guidelines on System Assessment in the K to 12 Basic Education Program. DepEd Order No. 29, s. 2017. Manila. http://www.deped.gov.ph/2017/06/05/do-29-s-2017-policy-guidelines-on-system-assessment-in-the-k-to-12-basic-education-program/.
______. 2018. SHS Implementation Exceeds Expectations, Seeks Sustained Support. 10 May. http://www.pna.gov.ph/articles/1034925.
Government of the Philippines, National Economic and Development Authority. 2017. Philippine Development Plan 2017–2022. http://pdp.neda.gov.ph/wp-content/uploads/ 2017/01/10-04-07-2017.pdf.
Government of the Philippines, Philippine Statistics Authority. 2016. Annual Labor and Employment Estimates.
______. Various years, 1991–2008. Philippines Household Labor Force Survey.
Hanushek, E. and Peterson, P. 2014. Higher Grades, Higher GDP. Hoover Digest: Research and Opinion on Public Policy. No. 1 (Winter). pp. 75–78.
Hastings, J., et al. 2016. (Un)Informed College and Major Choice: Evidence from Linked Survey and Administrative Data. Economics of Education Review. 51. pp. 136–151.
Hoxby, C. and Turner, S. 2013. What High-Achieving Low-Income Students Know about College. American Economic Review. 105 (5). pp. 514–517.
IT and Business Process Association of the Philippines. 2016. Road Map 2022: IBPAP and its Journey towards Growth and Transformation.
Jensen, R. 2010. The (Perceived) Returns to Education and the Demand for Schooling. The Quarterly Journal of Economics. May. pp. 515–548.
Jensen, U. 2011. Factors Influencing Student Retention in Higher Education. Research and Evaluation. Honolulu, Hawaii. http://www.ksbe.edu/_assets/spi/pdfs/Retention_Brief.pdf.
Kim, S., Ahn, T., and Fouad, N. 2015. Family Influence on Korean Students’ Career Decisions: A Social Cognitive Perspective. Journal of Career Assessment.
Kremer, M., Brannen, C., Glennerster, R. 2013. The Challenge of Education and Learning in the Developing World. Science. Vol. 340.

references 121
Perna, L. and Thomas, S. 2006. A Framework for Reducing the College Success Gap and Promoting Success for All. National Symposium on Postsecondary Student Success: Spearheading a Dialogue on Student Success. http://repository.upenn.edu/cgi/viewcontent.cgi?article=1347&context=gse_pubs.
Roy, R. 2016. What Influences Student Decisions in School and Career. Northern Illinois Region P-20 Network Research Report. http://niu.edu/p20network/_pdfs/work-groups/workforce/Career-Influencers-Report.pdf.
Watts, A. G. and Fretwell, D. 2004. Public Policies for Career Development: Case Studies and Emerging Issues for Designing Career Information and Guidance Systems in Developing and Transition Economies.
World Bank. 2016. Republic of the Philippines Labor Market Review: Employment and Poverty. Washington, DC.

Youth Education Investment and Labor Market Outcomes in the PhilippinesSurvey Report
This report presents fi ndings from a survey in the Philippines on what shapes young people’s decisions about their education. The survey focused on students’ choice of track in senior high school—academic, technical-vocational and livelihood, sports, or arts and design—their choice of college course, and their occupational preferences and expectations. It was conducted by the Asian Development Bank in collaboration with the Philippine Department of Education. Its results highlight the most infl uential considerations and information sources for students and households. This report aims to help enhance career guidance programs and long-term labor market outcomes.
About the Asian Development Bank
ADB is committed to achieving a prosperous, inclusive, resilient, and sustainable Asia and the Pacifi c, while sustaining its e� orts to eradicate extreme poverty. Established in 1966, it is owned by 68 members—49 from the region. Its main instruments for helping its developing member countries are policy dialogue, loans, equity investments, guarantees, grants, and technical assistance.
About the Philippines Department of Education
DepEd’s mission is to protect and promote the right of every Filipino to quality, equitable, culture-based, and complete basic education. The department formulates, implements, and coordinates policies, plans, programs and projects in the areas of formal and non-formal basic education. It supervises all elementary and secondary education institutions, including alternative learning systems, both public and private; and provides for the establishment and maintenance of a complete, adequate, and integrated system of basic education relevant to the goals of national development.
ASIAN DEVELOPMENT BANK6 ADB Avenue, Mandaluyong City1550 Metro Manila, Philippineswww.adb.org
DEPARTMENT OF EDUCATIONDepEd Complex, Meralco Avenue, Pasig City1600 Metro Manila, Philippineswww.deped.gov.ph
YOUTH EDUCATION INVESTMENT AND LABOR MARKET OUTCOMES IN THE PHILIPPINESSURVEY REPORT
JULY 2019


