0 Youth unemployment and Joblessness challenge in Ghana: Revisiting the Issues A Background Paper for a National Youth Employment Dialogue Prepared by Prof. William Baah-Boateng Department of Economics University of Ghana Abridged Version February 2018
Transcript
0
Youth unemployment and Joblessness challenge in
Ghana: Revisiting the Issues
A Background Paper for a National Youth Employment Dialogue
Prepared by
Prof. William Baah-Boateng Department of Economics
2. Stylized Fact about Youth Unemployment ............................................................. 1
3. What Brought About the Current Situation? ........................................................ 3 “Jobless” Growth Argument .................................................................................................................................. 3 Quantity and Quality of Labour Market Inflows .............................................................................................. 4
4. What have been done so far? ................................................................................. 6
5. Issues for Discussion .............................................................................................. 6
1
1. Introduction
▪ Youth unemployment and joblessness remains a major socio-economic and
political problem in Ghana and many other African countries. Ghana’s growth
performance has been quite impressive but this has not translated into the creation
of sufficient jobs for the rapid expansion of the labour force. Indeed, employment
growth over the years has not been matched by an equally fast pace of employment
growth particularly in the formal sector. Employment creation has also not been
sufficient to meet the rising number of labour market entrants. In 2014, about
207,492 jobs were created by non-household enterprises (see GSS, 2015), which
fall short of an estimated 519,539 potential net labor market entrants in the same
year.
▪ While the employment challenge affects the whole labor force, its impact is
particularly severe on the youth whose rates of unemployment or engagement in
vulnerable and informal employment tend to be higher. 1 Essentially, youth
unemployment challenge has often been one of the key issues that dominate the
political discourse during the campaign towards the Presidential and Parliamentary
elections since 1992, but a solution to the problem remains elusive.
▪ The African Centre for Economic Transformation (ACET) in collaboration with
the INCLUDE platform organised two national dialogues on youth employment in
Ghana in 2016. The purpose was to engage the parties in a discussion before the
presidential and parliamentary elections, so that a consensus had been reached on
the labour market challenges. Indeed, “Job creation” became the main issue during
the electioneering campaign to the extent that the main opposition party (which
went on to win the election) titled their Manifesto “Change: An agenda for jobs”.
Employment generation strategy in the document was anchored on industrialisation
linked with modernised agriculture with two key campaign issues – “one district,
one factory”, and “one village, one dam” alongside “planting for food and jobs” to
show the party’s commitment to promoting employment generation of their
government.
2. Stylized Fact about Youth Unemployment ▪ In Ghana, the population aged 15-35 are referred to as youth, which is in line with
the African Union statistical definition of youth. The youth (15-35 years) in Ghana
accounts for about a third (33.5%) of the country’s population with about two-fifth
being children aged below 15 years (Figure 1) and waiting to form the youth
population in the next decade. This group of young people particularly those aged
1 Vulnerable employment is defined as the proportion of own account and contributing family work in total
employment. It is a defined measure of people employed under relatively precarious circumstances indicated
by their status in employment. We use the term “employment challenge” to refer to both unemployment in
particular and joblessness in general as well as engagement in vulnerable employment.
2
15-24 years is mostly new entrants into the market from different levels of
education, with limited or no work experience.
Figure 1: Age Distribution of the population 2000-2015, (%)
Source: Computed from 2010 Population Censuses, GLSS 6, & Labour Force Survey.
▪ Unemployment rates are generally higher among the youth than adults because they
are more vulnerable in times of economic challenges than their older counterparts on
account of labour market constraints such as lower level of education and limited labour
market experience. Youth unemployment rate is higher among youth aged 15-24 than
younger adults aged 25-35 years confirming the general observation that
unemployment rate declines with age.
Figure 2: Youth unemployment rates (%)
Source: Computed from 2010 Population Census, GLSS 6 & Labour Force Survey. GSS
▪ Youth unemployment rate is higher among the educated than the less educated and this
underscores the need to focus on addressing the phenomenon of unemployment among
the educated youth.
0
20
40
60
80
100
2010 2013 2015
38.3 39.4 39.9
20.0 19.1 16.1
17.0 15.3 17.4
24.7 26.2 26.6
Adults (36+)
Young Adults (25-35)
Youth (15-24)
Children (0-14)
0
2
4
6
8
10
12
14
16
2010 2013 2015
11.710.9
15.3
6.24.9
7.8 Youth (15-24)
Youth (25-35)
3
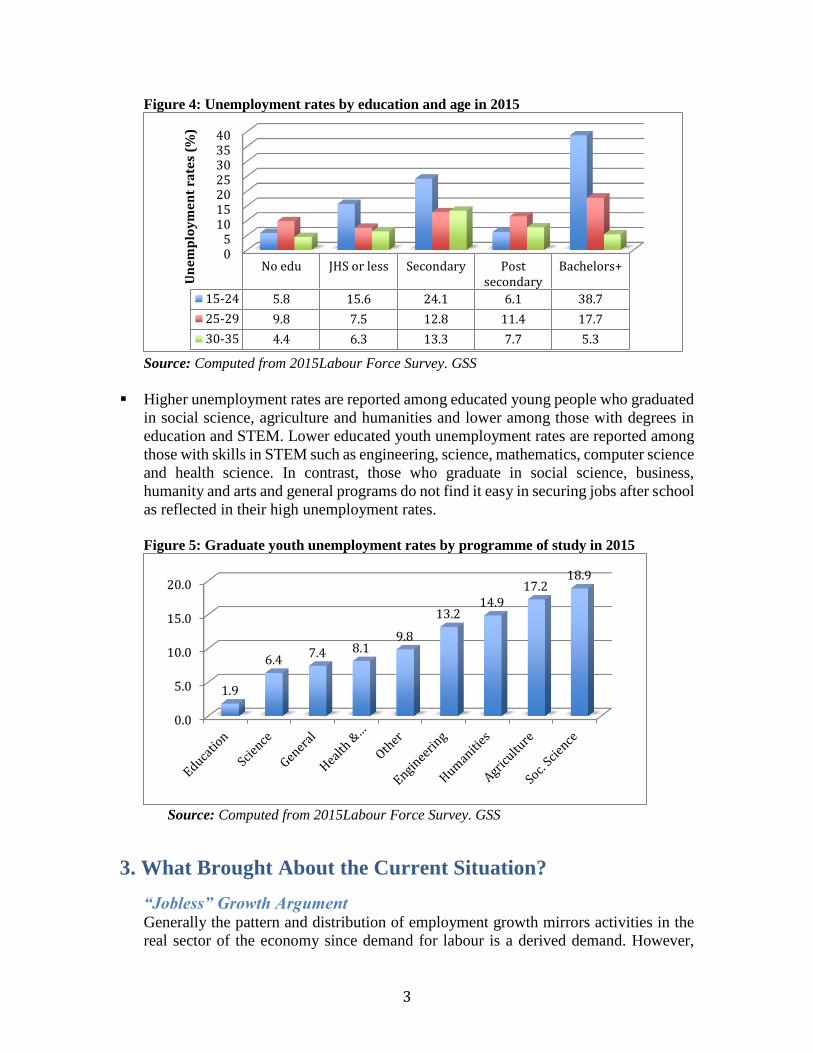
Figure 4: Unemployment rates by education and age in 2015
Source: Computed from 2015Labour Force Survey. GSS
▪ Higher unemployment rates are reported among educated young people who graduated
in social science, agriculture and humanities and lower among those with degrees in
education and STEM. Lower educated youth unemployment rates are reported among
those with skills in STEM such as engineering, science, mathematics, computer science
and health science. In contrast, those who graduate in social science, business,
humanity and arts and general programs do not find it easy in securing jobs after school
as reflected in their high unemployment rates.
Figure 5: Graduate youth unemployment rates by programme of study in 2015
Source: Computed from 2015Labour Force Survey. GSS
3. What Brought About the Current Situation?
“Jobless” Growth Argument Generally the pattern and distribution of employment growth mirrors activities in the
real sector of the economy since demand for labour is a derived demand. However,
05
10152025303540
No edu JHS or less Secondary Postsecondary
Bachelors+
15-24 5.8 15.6 24.1 6.1 38.7
25-29 9.8 7.5 12.8 11.4 17.7
30-35 4.4 6.3 13.3 7.7 5.3
Un
em
plo
ym
en
t ra
tes
(%)
0.0
5.0
10.0
15.0
20.0
1.9
6.47.4 8.1
9.8
13.214.9
17.218.9
4
employment growth has not kept pace with the speed of economic growth over the last
few decades. The widening gap between national output and employment, as depicted
in Figure 6, is an indication of the slow growth of jobs relative to economic growth.
The slow response of jobs to strong economic growth has been linked to the sources of
economic growth over the years. Ghana’s growth has generally emanated from sectors
that do not generate sufficient jobs. Manufacturing and agriculture known to have high
labor absorption are the sectors that have been the poor performing sectors in terms of
growth. In contrast, the extractive sector (mining and oil) and financial intermediation
considered to have low labor absorption have been the key drivers of growth
culminating in low employment response to economic growth in the country.
Figure 6: Employment and GDP growth trends 2000-2013
Source: Computed by the authors from National Accounts, 2000 and 2010, Population
Censuses, and GLSS 3, 4, 5, and 6.
Quantity and Quality of Labour Market Inflows ▪ The skillset of net inflows into the labor market has implication for the potential status
of the new entrants in the market as unemployed or employed in formal or informal
settings. Educational output, which constitutes potential gross labor market entrants
from secondary and tertiary educational institutions has seen rapid rise from 112,900 in
2011 to 324,100 in 2017 after a continuous drop from 147,200 in 20092 (Figure 7). On
average, gross inflows into the labor market from secondary school level including
TVET account for 70 per cent with inflows from tertiary level accounting for the
remaining 30 per cent.
Figure 7: Total Potential inflows from Education & Training into the Labor Market
2 The drop in secondary school output in 2010 and 2011 was as a result of 4 years, which means that many
of those expected to have graduated from SHS3 in 2010 proceeded to SHS4 and graduated in 2011. Many
wrote exams in 2010 and didn’t go to SHS4 and that accounted for the reduction in 2011. The subsequent
reversal to 3 years double the output in 2012 and accounted for the shock into the system
0.0
2.0
4.0
6.0
8.0
10.0
12.0
0.0
2.0
4.0
6.0
8.0
10.0
12.0
14.0
16.0
To
tal
em
plo
ym
en
t (i
n m
illi
on
s)
Gro
wth
Ra
te (
%)
Growth of GDP and Employment
Total employment GDP Employment
5
Source: Computed from Graduate Output, NCTE and EMIS Data
▪ Very few graduates enter the labor market with skills and knowledge in science,
technology, engineering and mathematics (STEM) that are relatively in high
demand in the labor market. Available data suggests that the country continues to
churn out more graduates in humanities as against STEM, which is important for
the country’s economic transformation.
Figure 8: Graduate output from Public universities by major program
Source: Computed from Graduate Output, NCTE
▪ There is a widely held view that government’s commitment to promoting TVET in
the country is very low, and it is evident in the low funding of TVET. In 2012, the