27
Youth Unemployment in Advanced Economies in Europe: Searching for Solutions Angana Banerji International Monetary Fund February 2015
| Date post: | 28-Dec-2015 |
| Category: |
Documents |
| Upload: | lindsay-miller |
| View: | 214 times |
| Download: | 0 times |

Youth Unemployment in Advanced Economies in Europe: Searching for
SolutionsAngana Banerji
International Monetary FundFebruary 2015

Based On

Scope of Research
• 22 countries: 18 euro area, Denmark, Norway, Sweden and the UK
• 1983 – 2012
• Youth: Workforce aged 15–24 years and
Adult: Workforce aged 25 and above

Road Map
Problem
Impact
Main drivers
Research Conclusions

ProblemDiverse Cross-Country Picture
Youth Unemployment Rate, 2014(Percent, 12-month average through October, 2014)
More than 25 percent
15 to 25 percent
Less than 15 percent
Source: Eurostat.

Youth Unemployment Rate, 2014(Percent, 12-month average through October, 2014)
More than 25 percent
15 to 25 percent
Less than 15 percent
Source: Eurostat.
ProblemDiverse Cross-Country Picture

Youth Unemployment Rate, 2014(Percent, 12-month average through October, 2014)
More than 25 percent
15 to 25 percent
Less than 15 percent
Source: Eurostat.
ProblemDiverse Cross-Country Picture

Youth Unemployment Rate, 2014(Percent, 12-month average through October, 2014)
More than 25 percent
15 to 25 percent
Less than 15 percent
Source: Eurostat.
ProblemDiverse Cross-Country Picture

The ProblemUnprecedented Highs. Long-Term.
Source: Eurostat and IMF staff calculations. Note: Long-term unemployment defined as unemployment lasting 12 months or more.1/ Euro area youth unemployment rates maximum and minimums across all Euro Area countries.
0
10
20
30
40
50
60
EA Youth range 1/ ESP youthESP adult
Euro Area: Unemployment Rate(Percent)
0
10
20
30
40
50
60
70
EA Youth range 1/ ESP youthESP adult
Euro Area: Long-term Unemployment Rate
(Percent)

ImpactLow Growth. Social Costs. Pressure on Social Safety Nets
2000 2001 2002 2003 2004 2005 2006 2007 2008 2009 2010 2011 2012 201315
20
25
30
35
40
45
50
55
60
35
40
45
50Spain: Labor Market Indicators
Dependency ratioYouth unemployment rateYouth labor participation rate (rhs)
Sources: Eurostat; and IMF staff calculations.
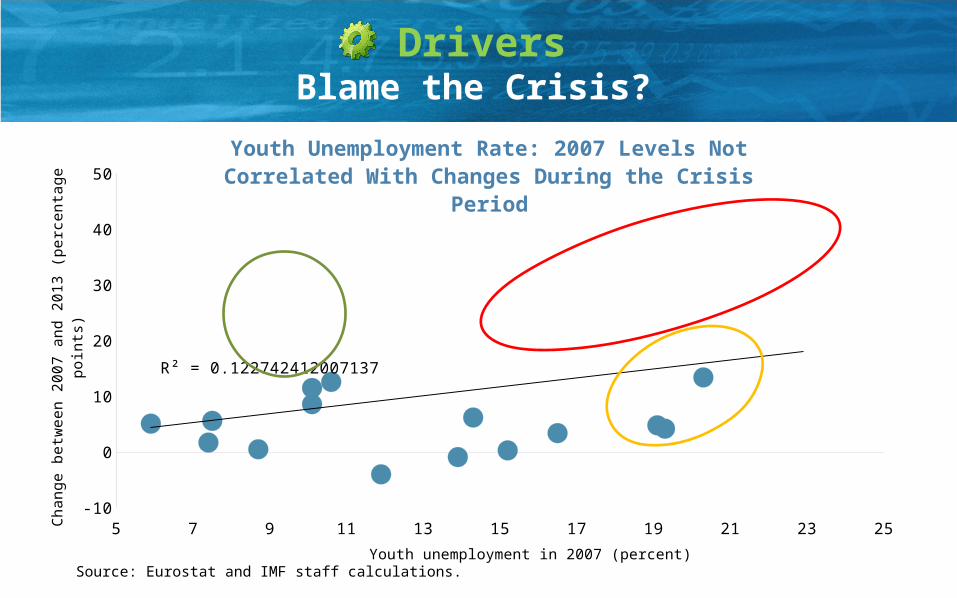
DriversBlame the Crisis?
Source: Eurostat and IMF staff calculations.
5 7 9 11 13 15 17 19 21 23 25-10
0
10
20
30
40
50
R² = 0.122742412007137
Youth unemployment in 2007 (percent)
Ch
an
ge b
etw
een
20
07
an
d 2
01
3 (
perc
en
tag
e
poin
ts)
Youth Unemployment Rate: 2007 Levels Not Correlated With Changes During the Crisis Pe-
riod

Drivers Important Role of Growth: Youth Are 3 Times More Sensitive
0%
10%
20%
30%
40%
50%
60%
70%
80%
90%
100% Euro Area: How Well Does Growth Ex-plain Increase in Youth Unemployment?
Source: IMF staff calculations.
Average
EA average EA crisis-hit 1/
EA other high unemploy-
ment 2/
EA low un-employment
3/
ESP0
0.2
0.4
0.6
0.8
1
1.2
1.4
1.6
1.8
2
Euro Area : Increase in Unemployment Rate For A Decline in Growth, (Per-
centage Points)
Youth Adult
Source: IMF staff estimates,.Note: 1/ EA Crisis-hit countries include: CYP, GRC, ESP, PRT, IRE. 2/ EA other high unemployment countries include: ITA, FRA. 3/ EA low unemployment countries include: AUS, GER, NED.

Drivers Fragile Employment Conditions
Sources: Eurostat; and IMF staff calculations.Note: Crisis-hit countries include Greece, Italy, Portugal, Spain, and Cyprus.
Share of youth workers on temporary contracts
Share of adult on temporary contracts
0
10
20
30
40
50
60
70
46%
15%
Share of Workers on Temporary Con-tracts in Crisis-hit Countries (2013,
Percent)
Em-ploy-
ment in SMEs75%
Employ-ment in
non-SMEs25%
Employment in SMEs as a Share of Total Employment in Spain, 2008–13
(Percent)

Drivers Fragile Employment Conditions
Sources: Eurostat; and IMF staff calculations.Note: Crisis-hit countries include Greece, Italy, Portugal, Spain, and Cyprus.
2000
2001
2002
2003
2004
2005
2006
2007
2008
2009
2010
2011
2012
6
8
10
12
14
16
18
0
10
20
30
40
50
60
Impact of Housing Market on Unem-ployment in Spain
Construction (%GDP)
Unemployment rate (15–24, rhs)
0
10
20
30
40
50
60
70
80
90
100
Youth Employment By Sector in Crisis-hit Countries, 2000–07
(Percent)
ManufacturingConstruction, Real EstateWholesale, Retail Trade
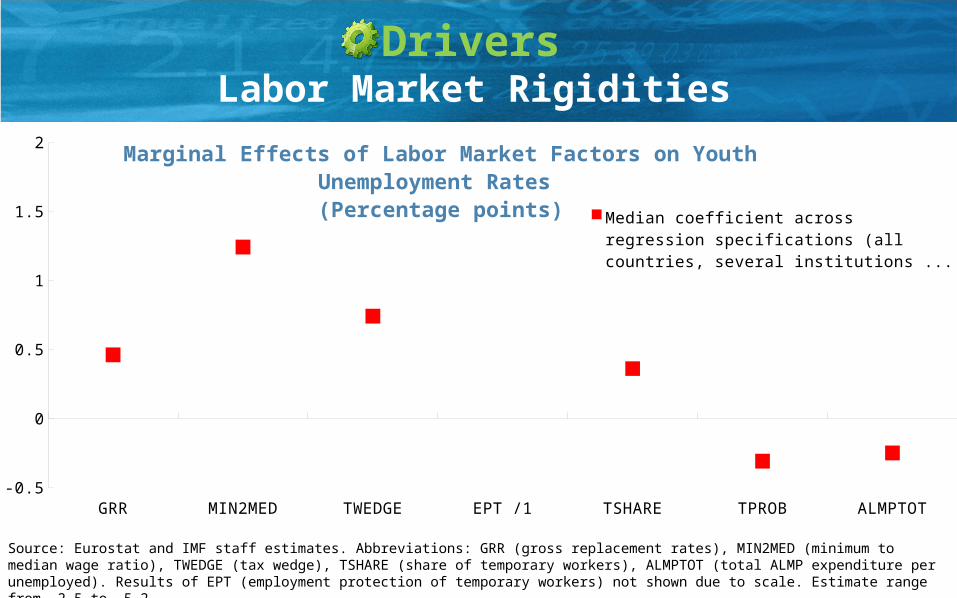
Drivers Labor Market Rigidities
Source: Eurostat and IMF staff estimates. Abbreviations: GRR (gross replacement rates), MIN2MED (minimum to median wage ratio), TWEDGE (tax wedge), TSHARE (share of temporary workers), ALMPTOT (total ALMP expenditure per unemployed). Results of EPT (employment protection of temporary workers) not shown due to scale. Estimate range from -2.5 to -5.2.
GRR MIN2MED TWEDGE EPT /1 TSHARE TPROB ALMPTOT0
0.2
0.4
0.6
0.8
1
1.2
1.4
1.6
1.8
2 Marginal Effects of Labor Market Factors on Youth Unem-ployment Rates
(Percentage points)Median coefficient across regression specifications (all countries, several institutions together)

USA JPN
OECD EA
EA cris
is-hi
t cou
ntrie
sES
P0.0
0.1
0.2
0.3
0.4
0.5
0.62001 2013
Ratio of Minimum to Median Wage
Source: OECD.Note: Crisis-hit countries include Greece, Italy, Portugal, Spain, and Cyprus.
1 2 3 4 5 60
10
20
30
40
50
60
70
Labor Tax Wedge (Percent)
2001 2013
Source: OECD.Note: Tax wedge is defined as the difference between labor costs to the employer and net take-home pay of the employee as a percentage of labor costs. Single person taxed on 100% of average earnings with no child. Crisis-hit countries include Greece, Italy, Portugal, Spain, and Cyprus.
Drivers Cost of Hiring

USA JPN
OECD EA
EA cris
is-hi
t cou
nt...
ESP
0
10
20
30
40
50
60
70
2001 2013
Share of Temporary Workers Ages 15–24
(Percent of total employment)
Source: OECD.Note: Crisis-hit countries include Greece, Italy, Portugal, Spain, and Cyprus.
USA JPN
OECD EA
EA cris
is-hi
t cou
nt...
ESP
0.0
0.5
1.0
1.5
2.0
2.5
3.0
3.5
4.0
2001 2013
Protection of Temporary Workers(Employment Protection Legislation Rat-
ing)
Source: OECD.Note: Crisis-hit countries include Greece, Italy, Portugal, Spain, and Cyprus.
Drivers Labor Market Duality

1 2 3 4 5 60
1
2
3
2006
2011
Active Labor Market Policies Spending on Training
(Thousand euro per unemployed)
Source: OECD; Eurostat; and IMF staff calculations.Note: ALMP measures include training as one of the main components, while total spending combines measures, supports and services. Crisis-hit countries include Greece, Italy, Portugal, Spain, and Cyprus.
Best in euro area Crisis-hit countries0
10
20
30
40
50
60
70
80
90
100
Share of Temporary Workers Ages 15–24 in Vocational Training, 2012
(Percent)
Drivers Training and Skills

Research Conclusions
Boost Growth
Support Demand
● Monetary Easing● Use Fiscal Space
Supply Side Reforms
● Strengthen Banks● Product Market Reforms
Labor Market Reforms
● Lower Labor Tax Wedge● Align Minimum Wages
● Reduce Duality
● Vocational Training● Active Labor Market Policies

Research ConclusionsGrowth: Will History Repeat Itself?
1987
1989
1991
1993
1995
1997
1999
2001
2003
2005
2007
2009
2011
201320
30
40
50
60
70
80
90
100
110
Youth Unemployment Rates (Peak = 100)
PRT ESP FRA
Spain France Italy Portugal Euro Area
0
1
2
3
4
5
6
7
Historical
WEO projection
Average Growth for Unemployment Reduc-tion
(Percent)
Source: Eurostat; World Economic Outlook; and IMF staff calculations.

Thank you

Background SlidesFramework: Key Assumptions
• Output gap: different effect across countries
• Labor market features: same effect across countries
• Explaining level not change.
• 22 countries, 18 euro area, Denmark, Norway, Sweden and the UK. 1983 – 2012.
• Substantial data gaps.

Background SlidesMore Details In…

Background SlidesFramework: Role of Economic Activity
yu 10
Panel and country-specific estimation
Growth/Output gap

Background Slides Labor Market Characteristics
• Hiring costs• Opportunity cost of work• Labor market protection, flexibility• Collective bargaining• Vocational training and education• Active labor market policies
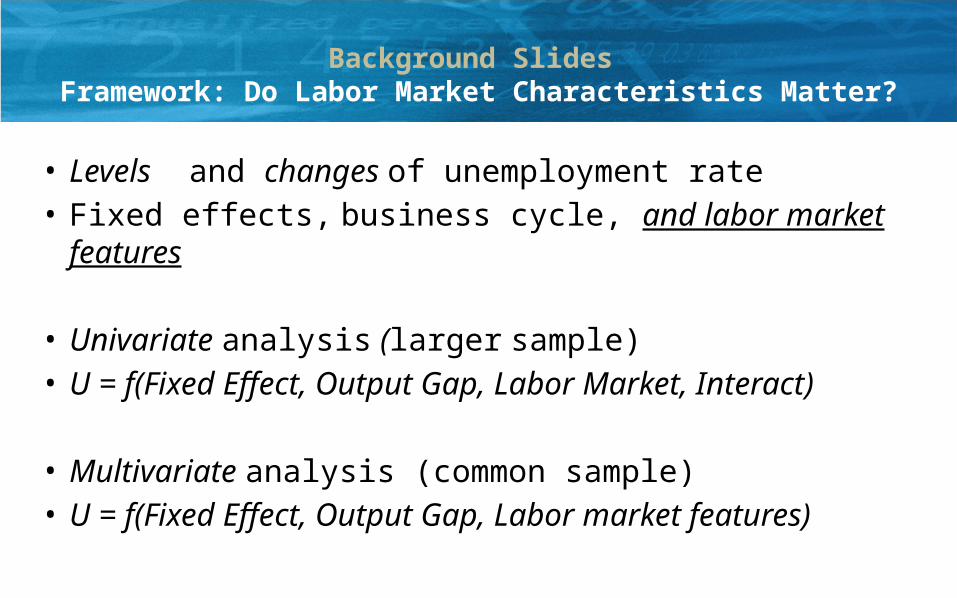
Background Slides Framework: Do Labor Market Characteristics Matter?
• Levels and changes of unemployment rate• Fixed effects, business cycle, and labor market features
• Univariate analysis (larger sample)• U = f(Fixed Effect, Output Gap, Labor Market, Interact)
• Multivariate analysis (common sample)• U = f(Fixed Effect, Output Gap, Labor market features)
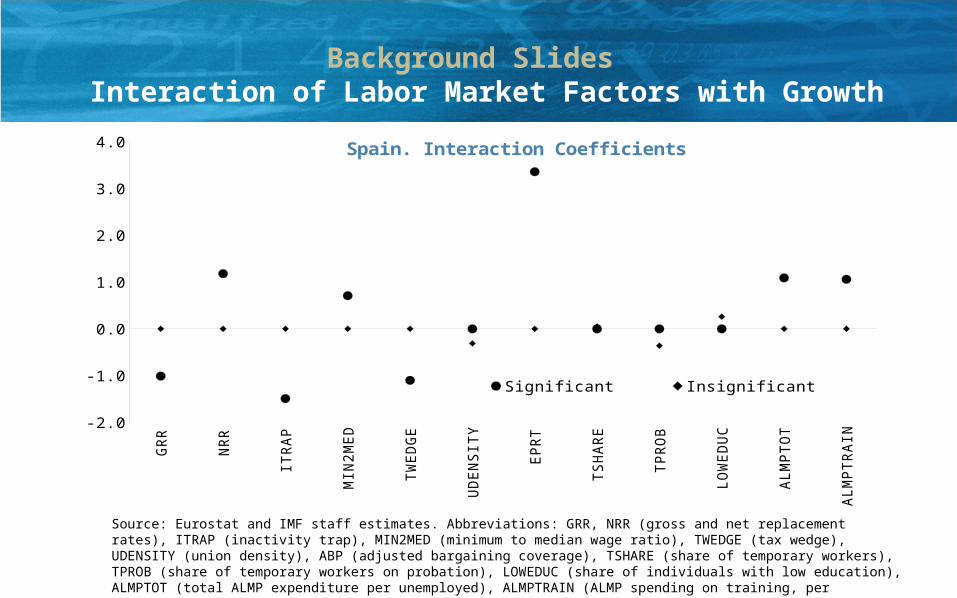
Background Slides Interaction of Labor Market Factors with Growth
GR
R
NR
R
ITR
AP
MIN
2M
ED
TW
ED
GE
UD
EN
SIT
Y
EPR
T
TS
HA
RE
TPR
OB
LO
WED
UC
ALM
PTO
T
ALM
PTR
AIN
-2.0
-1.0
0.0
1.0
2.0
3.0
4.0 Spain. Interaction Coefficients
Significant Insignificant
Source: Eurostat and IMF staff estimates. Abbreviations: GRR, NRR (gross and net replacement rates), ITRAP (inactivity trap), MIN2MED (minimum to median wage ratio), TWEDGE (tax wedge), UDENSITY (union density), ABP (adjusted bargaining coverage), TSHARE (share of temporary workers), TPROB (share of temporary workers on probation), LOWEDUC (share of individuals with low education), ALMPTOT (total ALMP expenditure per unemployed), ALMPTRAIN (ALMP spending on training, per unemployed). Results of EPT (employment protection of temporary workers) excluded for presentational clarity.


![Banerji and Comcare (Compensation) [2018] AATA 892 (16 ...€¦ · 2. On 18 October 2013 Ms Banerji lodged a claim for workers compensation for post-traumatic stress disorder under](https://static.documents.pub/doc/80x56/602bc7199c047a63db333cd0/banerji-and-comcare-compensation-2018-aata-892-16-2-on-18-october-2013.jpg)


