46
Chapter 10

Chapter 10

360 CHAPTER 10
Chapter 10The Jar of Marbles: PROBABILITY, STATISTICS, AND INTERPRETING DATA
Probability and statistics are useful areas of mathematics. When used to study real data, however, theresults can be manipulated in a variety of ways. As a consumer of information through television, theInternet, and printed materials, you should be aware of techniques used to manipulate information andopinions.
In this chapter you will have the opportunity to:
• explore probability through experimentation.
• learn the difference between theoretical and experimental probability.
• classify and calculate independent and dependent probabilities.
• represent possible outcomes in tables, grids, and tree diagrams.
• analyze questions for bias.
• learn to select representative samples.
• classify questions as open or closed option.
• determine whether a correlation exists in a scatter plot.
• determine if causality is reasonable for a given correlation.
Read the problem below, but do not try to solve it now. What you learn over the next few days willenable you to solve it.
JM-0. How would you ask a survey question andthen organize all of the answers you receiveinto a graph? Would you know whom to askin order to have a representative sample of thestudents at your school? Could you ask yourquestion without influencing the person youare interviewing?
Number Sense
Algebra and Functions
Mathematical Reasoning
Measurement and Geometry
Statistics, Data Analysis, & Probability

The Jar of Marbles: Probability, Statistics, and Interpreting Data 361
Chapter 10The Jar of Marbles: PROBABILITY, STATISTICS, AND INTERPRETING DATA
JM-1. Probability is a topic in mathematics we use almost daily, yet we often do not realize howfrequently we use it. Copy and complete these sentences.
a) When the weather forecaster says that there is a 20% chance of rain, what is thechance it will not rain?
b) If we are certain something will occur, what is the likelihood it will occur?
c) If an event is impossible, what is the likelihood of it happening?
d) What is the chance of getting heads when you flip a fair coin?
JM-2. Today you will be recording the results of a coin flipping experiment. Use a coin and theresource page your teacher gives you with a table like the one shown below. Follow thesedirections for each flip. See the example below.
a) You and your partner will flip a coin 25 times. Record the result of each flip.
b) In the third column, write the total number of heads up to and including that flip inthe numerator of the fraction. The denominator will be the number of the flip.
c) After you record each result, convert the fraction to a decimal and a percent.
Note: An example is shown below. Your actual data will be different.
FlipNumber
Outcome
(EXAMPLES!)
ExperimentalProbability
of Heads as aFraction
ExperimentalProbability
of Heads as aDecimal
ExperimentalProbability
of Heads as aPercent
1 T01
0 0%
2 H12
0.5 50%
3 H23 0. 66 66. 6%
4 T24
0.5 50%

362 CHAPTER 10
JM-3. Use your data from coin flipping to answer the questions below, then complete the graphportion of your resource page.
a) What is the theoretical probability of getting heads?
b) On the graph paper portion of yourresource page, draw a colored horizontalline from 0 to 25 representing the theoreticalprobability. Include the key on your graph.
c) In a different color, draw a scatter plotrepresenting the experimental probability ofgetting heads for your 25 flips. Include thiskey on your graph as well.
Exp
erim
enta
l P
roba
bili
ty
Coin Flipping
50%
Coin Flips
0%
100%
1 25
JM-4. Copy and complete this table using your data from the 25 coin flips. You may need to useproportions to complete it.
Total Number of Coin Flips 25 50 100 500 1000Number of Heads(based on experimental probability)Expected Number of Heads(based on theoretical probability) 12.5
JM-5. Sometimes people say that a fair coin has a 50-50 chance of turning up heads or tails. Inother words, in theory the two possible outcomes are equally likely.
a) Will an experiment of tossing a fair coin always give results that are the same ratioas the theory?
b) If you get heads on one flip, will you always get tails on the second flip?
c) If you flip a coin 100 times, in theory, how many times do you expect to get heads?Why?
d) If you flip a coin twice and it comes up heads both times, does this mean the coin isrigged or unfair? Why?
e) If you flip a coin 100 times and you get 47 heads and 53 tails, does this mean thecoin is rigged or unfair? Why?
f) If you flip a coin 1000 times and get 625 heads and 375 tails, does this mean thecoin is rigged or unfair? Why?

The Jar of Marbles: Probability, Statistics, and Interpreting Data 363
JM-6. In the previous problem you were thinking about two concepts of probability: theoreticaland experimental probabilities.
a) While the theoretical probability of getting heads is 50%, what was the experimentalprobability of getting heads in part (e) of the previous problem?
b) On what are theoretical probabilities based?
c) On what are experimental probabilities based?
JM-7.VOCABULARY TERMS FOR PROBABILITY
SAMPLE SPACE: All possible outcomes of a situation. For example, there are sixpossible outcomes when a six-sided die is rolled and two possible outcomes whenflipping a coin.
OUTCOME: Any possible or actual result or consequence of the action(s)considered, such as rolling a five on a die or getting tails when flipping a coin.
EVENT: An outcome or group of outcomes from an experiment, such as rolling aneven number on a die.
PROBABILITY: A number between zero and one that states the likelihood of anevent. It is the ratio of desired outcomes to all possible outcomes (the sample space).
IMPOSSIBILITY: When an event has a probability of zero; that is, an event thatcannot occur, such as rolling a seven on a six-sided die.
CERTAINTY: When an event has a probability of one; such as rolling a numberbetween one and six on a standard die.
Make these notes in your Tool Kit to the right of the double-lined box.
a) Describe the sample space when you are dealing from a deck of cards.
b) Describe a sample outcome of drawing a card from a full deck.
JM-8. Find the radius and circumference of the circles with the given area. Use π = 3.14.
a) 706.5 ft2 b) 254.34 m2

364 CHAPTER 10
JM-9. Answer these questions about probability.
a) What is the highest percent probability you can ever get?
b) What is the lowest percent probability you can ever get?
c) If the probability of heads is 43.6%, what is the probability of tails?
JM-10. Find each of the following.
a) |82| – |-20| b) |4| – |-40|
c) |-18| + |63| d) |-13.72| + |2.6|
JM-11. Write “theoretical” or “experimental” to describe the following statements.
a) The chance of getting heads three times in a row when flipping a coin is 18
.
b) I flipped this coin eight times and got heads six times.
c) My mom packed my lunch three of the past five days.
d) The chance of finding the winning Zappo Cola can is 1 in 98,000,000.
e) Based on mathematical models, the chance of rain today is 60%.
f) Based on last year’s amount of rain in April, the chance of rain on a day in April thisyear.
JM-12. Find the area and perimeter of the following figures. Write the numbers as decimals,rounding to the nearest hundredth.
a)
21.8 cm
14.7 cm
4.2 cm
12.5 cm 9.3 cm
b)
5
125
78
4 13
9 56 cm
cm
cm cm

The Jar of Marbles: Probability, Statistics, and Interpreting Data 365
JM-13.EXPERIMENTAL AND THEORETICAL PROBABILITIES
EXPERIMENTAL PROBABILITY is the probability based on data collected inexperiments.
Experimental Probability = number of successful outcomes in the experiment
total number of outcomes in the experiment
THEORETICAL PROBABILITY is a calculated probability based on thepossible outcomes when they all have the same chance of occurring.
Theoretical Probability = number of successful outcomes
total number of possible outcomes
By “successful” we usually mean desired or specified outcome, such as rolling
a 3 on a die ( 16 ), pulling a king from a deck of cards ( 4
52 = 1
13 ), or flipping a coin
and getting tails ( 12 ).
Probabilities are written like this:
The probability of rolling a 3 on a die is P(3).The probability of pulling a king out of a deck of cards is P(king).The probability of getting tails is P(tails).
Answer these questions in your Tool Kit to the right of the double-lined box.
a) For a deck of cards, what is P(diamond)?
b) For a die, what is P(odd number)?
JM-14. Now that we have started a new chapter, it istime for you to organize your binder.
a) Put the work from the last chapter inorder and keep it in a separate folder.
b) When this is completed, write “I haveorganized my binder.”
JM-15. Follow your teacher’s directions for practicing mental math.

366 CHAPTER 10
JM-16. Kandi has a bag of marbles. She has 5 black, 3 white, 2green, and 4 orange marbles. Kandi reaches into the bagwithout looking and pulls out a marble.
a) What is the probability that she will pull out agreen marble?
b) If she does get a green marble and does not put itback in the bag, what is the probability she willnow pull the other green marble from the bag?
c) Assume that Kandi does get the second greenmarble and does not return it to the bag. What isthe probability she will now pull another green marble from the bag?
JM-17. In the previous problem, each event affected the following events because Kandi did notreturn the marbles to the bag. By taking the green marbles out of the bag, she changedboth the numerator and denominator of the later probabilities. However, she did notchange the numerator for events like drawing a black marble.
INDEPENDENT AND DEPENDENT EVENTS
Two events are DEPENDENT if the outcome of the first event affects the outcomeof the second event. For example, if you draw a card from a deck and do not replaceit for the next draw, the events are dependent.
Two events are INDEPENDENT if the outcome of the first event does not affectthe outcome of the second event. For example, if you draw a card from a deck butreplace it before you draw again, the two events are independent.
Answer these questions in your Tool Kit to the right of the double-lined box.
a) Is rolling a 3 on a die after you already rolled a 3 an independent or dependentevent? Explain.
b) If you know that Juanito just pulled a green marble from a bag and did not put itback, is pulling another green marble out of the bag an independent or dependentevent? Explain.

The Jar of Marbles: Probability, Statistics, and Interpreting Data 367
JM-18. For the following experiments, write “dependent” if the second event depends on theoutcome of the first and “independent” if the first event does not affect the outcome ofthe second event.
a) Flipping a coin and getting tails after you have already flipped it once and gotten tails.
b) Drawing a king from a deck of cards after a card was taken out and not returned tothe deck.
c) Drawing an ace from a deck of cards after a card was drawn, replaced, and the deckshuffled again.
d) Getting a peppermint candy from a jar of mixed candies after you just took out andate a lemon candy.
e) Choose one of the situations described in parts (a) through (d) and explain why youchose either independent or dependent.
JM-19. Think of a standard deck of 52 playing cards*. If you pull one card from the deck atrandom, what is the probability that it is the seven of clubs? (That is, what isP(seven of clubs)?)
P(seven of clubs) = 1 seven of clubs in the deck52 possible cards to draw
= 1
52 ≈ 0.019
a) Find P(jack of any suit).
b) Find P(face card).
c) Find P(heart).
d) Are these probabilities theoreticalor experimental?
*Note: A standard deck of playing cardshas four suits in two colors: diamondsand hearts are red; clubs and spades are black. Each suit has 13 cards: an ace, twothrough ten, a jack, a queen, and a king. Jacks, queens, and kings are known as “facecards.”
JM-20. Steve and Cathy are playing a card game with a standard deck of 52 playing cards. Cathyis dealt an ace and a four. Steve is dealt a jack.
a) How many cards are left in the deck?
b) How many of the remaining cards are aces?
c) If Steve gets an ace, he will win. What is the probability that he will get an ace?
d) Steve gets a two and Cathy gets a five. Now Steve wants a nine. What is theprobability that he will get a nine?

368 CHAPTER 10
JM-21. Write “theoretical” or “experimental” todescribe the following statements.
a) The chance of spinning a four on a spinner
numbered one through four is 14
.
b) I drew ten cards out of a deck and gotspades three times.
c) I made eight out of the last ten free throws.
d) The chance of winning a new car in theraffle is 1 in 32,000.
e) Based on mathematical models, the chance of a thunderstorm today is 40%.
f) Based on last year’s data, the chance of a hurricane today is 2%.
JM-22. Find the following probabilities using a standard deck of 52 shuffled playing cards.
a) Find P(king).
b) Find P(red eight).
c) Find P(two or a three).
d) Are these probabilities theoretical or experimental? Why?
JM-23. Answer these questions after studying the graph below.
a) How many people do you seerepresented on the graph?
b) Of all the people graphed, whichperson earns the median salary?
c) Which person has the mediannumber of years of collegeeducation?
d) What is the mode of the salariesshown?
e) What is the mode of years ofcollege education shown in thescatter plot?
f) What is the range of the salariesshown?
10 5020 30 40 60 70
123456789
101112
A
B
C
D
E
F
G
80
Col
lege
Edu
catio
n (y
ears
)
Salary (thousands of dollars)

The Jar of Marbles: Probability, Statistics, and Interpreting Data 369
JM-24. Which of the following could not be a probability?
(A) - 110
(B) 1 (C) 1% (D) 0.1 (E) none of these
JM-25. If the experimental probability of getting heads is 75.3%, what is the probability ofgetting tails?
(A) 75.3% + 100% (B) 75.3% – 100% (C) 100% – 75.3% (D) 175.3%
JM-26. Convert each fraction into both a decimal and a percent.
a) 25
b) 26
c) 58
d) 812
JM-27. Convert each decimal into both a fraction and a percent.
a) 0.1 b) 0.5 c) 0 3. d) 0.875
JM-28. Complete the following Diamond Problems.
Sum
Product a)
9 11
b)
8 b
c)
77π
d)
a+ba
e)
45
1
JM-29. Simplify.
a) 1112
+ 49
c) 910
· 2
13
b) 4
35 – 1
1315
d) 12 ÷ 78
JM-30. Answer these questions about probability.
a) What is the highest decimal probability you can ever get?
b) What is the lowest decimal probability you can ever get?
c) If the decimal probability of getting heads is 0.45, what is P(tails)?

370 CHAPTER 10
JM-31. Marble Probability Experiment
Your teacher will give you a bag of 20 marbles. Everyteam in the class has an identical bag. Do not open orlook inside the bag until you are instructed to do so.You are going to try to determine how many of eachcolor marbles there are without looking in the bag.
a) Each student must create a tally sheet to record thenumber of times each color is pulled out. This canbe done on scratch paper.
b) To start the experiment, one student will reach intothe bag (without looking into it) and take out amarble. Each team member records the color of the marble on his/her tally sheet.
c) The student returns the marble to the bag, gives the bag a gentle shake, then passesthe bag to the next student. Take turns and repeat the process until you haverecorded the colors of 40 marbles.
d) Get a resource page from your teacher. Fill in the team experimental probabilitycolumn on the resource page.
EventYour Team’sExperimentalProbability
ClassExperimentalProbability
Prediction ofTheoreticalProbability
ActualProbability
purple 40 = %
40 = % 20 = %
20 = %
red 40 = %
40 = % 20 = %
20 = %
yellow 40 = %
40 = % 20 = %
20 = %
orange 40 = %
40 = % 20 = %
20 = %
green 40 = %
40 = % 20 = %
20 = %
black 40 = %
40 = % 20 = %
20 = %
orange or red 40 = %
40 = % 20 = %
20 = %
yellow, green, ororange
40 = %
40 = % 20 = %
20 = %
not purple 40 = %
40 = % 20 = %
20 = %
not red and notpurple
40 = %
40 = % 20 = %
20 = %
not black 40 = %
40 = % 20 = %
20 = %
e) The data your team collected needs to be shared with the rest of the class. Haveyour team representative record your data on the overhead or poster your teacher hasprovided.
f) Record the class data in the class experimental probability column on your resourcepage.
>>Problem continues on the next page.>>

The Jar of Marbles: Probability, Statistics, and Interpreting Data 371
g) Based on the information you have learned today in your experiment, make aneducated guess about the theoretical probabilities, that is, the actual number ofmarbles of each color in the bag. Record your predictions in the prediction columnon your resource page.
h) After everyone on your team has completed part (g), open the bag and record theactual probabilities in the last column on the resource page.
JM-32. Now we will calculate probabilities of more complex situations.
a) Find the sum of the theoretical probabilities for taking out a purple, orange, green,yellow, or red marble.
b) Explain why the answer to the previous question makes sense.
c) Why is the probability of (yellow, green, or orange) the same as the probability of(not red and not purple)?
d) Use your previous answer to help you find another pair of situations with the sameprobabilities.
JM-33. Compare your team’s experimental probabilities and the class’ experimental probabilitieswith the theoretical probabilities. What conclusion can you make about increasing thenumber of pieces of data gathered in an experiment?
JM-34. Busy Lizzie’s mom packs her lunch. Lizzieknows that there were five yogurts in therefrigerator: one raspberry, two strawberry, oneblueberry, and one vanilla.
a) Which flavor is she most likely to have inher lunch bag today? Why?
b) What are her chances of finding a vanillayogurt in her lunch bag?

372 CHAPTER 10
JM-35. Becoming a professional football player is the dream ofmany students. Here are some numbers to consider.There are 265,000 high school seniors who play footballevery year. 16,450 of them make it to a college team.215 of those original students make it to a professionalteam. (Source: NCAA)
a) Colt is a high school senior on a football team in alarge city. There are 1000 seniors playing in hisleague. Use a proportion to find the number ofthose 1000 students who will make it to a collegeteam.
b) Use a proportion to find the number of those 1000 students who will make it to aprofessional team.
c) What is the probability that a high school senior football player will make it to aprofessional team? Express your answer as a percent.
JM-36. Convert each of the following fractions into a decimal and then into a percent.
a)
25
d)
1715
b)
85
e)
329
c)
214
f)
297
JM-37. If the probability of rain tomorrow is 15%, what is the probability of no raintomorrow?
(A) 0.15 + 1 (B) 0.15 – 1 (C) 1 – 0.15 (D) 10.15
JM-38. Convert each of the following percents into a decimal and then into a fraction.
a) 25%
c) 60%
b) 75%
d) 37.5%

The Jar of Marbles: Probability, Statistics, and Interpreting Data 373
JM-39. A bag of marbles contains only the colors red, green, and blue.
a) The probability of getting a red marble is 13 . What is the probability of getting a
blue or green marble?
b) The probability of getting a green marble is 14
. What is the probability of getting a
blue marble?
c) There are 24 marbles in the bag. How many are blue?
JM-40. Answer these questions using the flow diagram shown below.
Start End÷ 54 1.25
a) If you start with 5, with what number do you end?
b) If you start with -9, with what number do you end?
c) If you start with 10, with what number do you end?
d) If you end with 35, with what number did you start?
e) Use the word reciprocal in a complete sentence to describe what is happening inthis flow diagram.
JM-41. Stephen and Paul saw Doggee Brand Dog Food on sale in a 22-pound bag for $15. Theychecked the store brand bulk dog food bin and found that the unit price was $0.70 perpound.
a) What is the unit cost of Doggee Brand Dog Food?
b) Which kind of dog food is the better buy?
JM-42. Simplify.
a) 58 + 6
7b) 3
1415
– 38
c) 1214
· 2
610
d) 2
23 ÷ 5
7
JM-43. Obtain a poll from your teacher. You will have about five minutes to read and answer thequestions. When you are done filling it out, return it to your teacher. When you havefinished, write “I took the poll” by this problem number.
374 CHAPTER 10
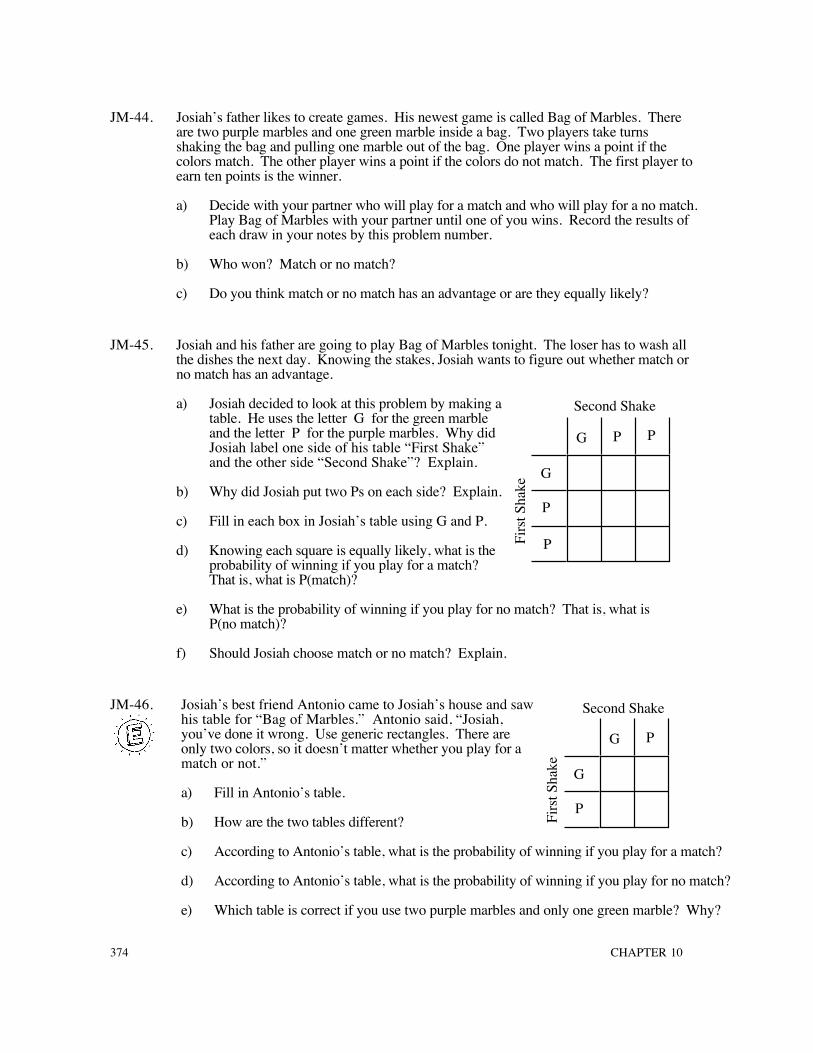
JM-44. Josiah’s father likes to create games. His newest game is called Bag of Marbles. Thereare two purple marbles and one green marble inside a bag. Two players take turnsshaking the bag and pulling one marble out of the bag. One player wins a point if thecolors match. The other player wins a point if the colors do not match. The first player toearn ten points is the winner.
a) Decide with your partner who will play for a match and who will play for a no match.Play Bag of Marbles with your partner until one of you wins. Record the results ofeach draw in your notes by this problem number.
b) Who won? Match or no match?
c) Do you think match or no match has an advantage or are they equally likely?
JM-45. Josiah and his father are going to play Bag of Marbles tonight. The loser has to wash allthe dishes the next day. Knowing the stakes, Josiah wants to figure out whether match orno match has an advantage.
a) Josiah decided to look at this problem by making atable. He uses the letter G for the green marbleand the letter P for the purple marbles. Why didJosiah label one side of his table “First Shake”and the other side “Second Shake”? Explain.
b) Why did Josiah put two Ps on each side? Explain.
c) Fill in each box in Josiah’s table using G and P.
d) Knowing each square is equally likely, what is theprobability of winning if you play for a match?That is, what is P(match)?
e) What is the probability of winning if you play for no match? That is, what isP(no match)?
G
P
P
G
P P
Firs
t Sha
ke
Second Shake
f) Should Josiah choose match or no match? Explain.
JM-46. Josiah’s best friend Antonio came to Josiah’s house and sawhis table for “Bag of Marbles.” Antonio said, “Josiah,you’ve done it wrong. Use generic rectangles. There areonly two colors, so it doesn’t matter whether you play for amatch or not.”
a) Fill in Antonio’s table.
b) How are the two tables different?
G
P
G
P
Firs
t Sha
ke
Second Shake
c) According to Antonio’s table, what is the probability of winning if you play for a match?
d) According to Antonio’s table, what is the probability of winning if you play for no match?
e) Which table is correct if you use two purple marbles and only one green marble? Why?

The Jar of Marbles: Probability, Statistics, and Interpreting Data 375
JM-47. Josiah’s father walked in and looked at Antonio’s table.He said, “We can use your table accurately if we fill in thetable with fractions, similar to a generic rectangle.”Josiah’s dad changed the table as shown at right.
a) Why did Josiah’s dad write 13
next to the G?
b) Why did Josiah's dad write 23 next to the two Ps?
c) Write a complete sentence to explain each of thefractions inside the boxes in this new table.
G
P
G
P
Firs
t Sha
ke
Second Shake
1
9GG
4
9
2
9
2
9GP
PG PP
1
3
1
3
23
23
d) According to this table, should Josiah play for match or no match? Why?
e) Does Josiah’s table in problem JM-45 agree with his dad’s table in this problem?Explain.
JM-48. Write “theoretical” or “experimental” to describe the following statements.
a) The chance of rolling a sum of three with two dice is 118
.
b) I drew five cards out of a deck and got clubs three times.
c) I bought six raffle tickets and did not win anything.
d) Based on mathematical models, the chance of a thunderstorm today is 40%.
JM-49. Why is the statement “It always rains on my birthday” a statement of experimentalprobability rather than of theoretical probability?
JM-50. For the following experiments, write “dependent” if the second event depends on theoutcome of the first event and “independent” if the second event does not depend on theoutcome of the first event.
a) P(spinning spin a two on a spinner after having just spun a two)
b) P(drawing a red six from a deck of cards after a card was just drawn and notreturned to the deck)
c) P(drawing a face card from a deck of cards after a jack was just drawn and replacedand the deck shuffled again)
d) P(getting a lemon-lime soda if the person before you reaches into a cooler full oflemon-lime sodas, removes one, and drinks it)

376 CHAPTER 10
JM-51. If the probability of getting a red marble from a bag is 38 , what is the probability of
not getting a red marble?
(A) 1 – 38
(B) 38 – 1 (C) 1 + 3
8(D) 1
38
JM-52. Find the area of the shapes with the following dimensions:
a) a triangle with a height of 4.7 inchesand a base of 6.8 inches
b) a rectangle with a length of 12.4meters and a width of 8.7 meters
c) a triangle with a height of 7.4 feetand a base of 5.9 feet
d) a square with a side length of 7.3centimeters
JM-53. Solve the following problem by writing and solving an equation or by using a Guess andCheck table. Remember to write your answer in a complete sentence.
A triangle with a perimeter of 16.3 centimeters has one side that is two times the length ofanother side. The third side is 1.7 centimeters longer than the shortest side. Find thelengths of the sides of the triangle.
JM-54. Algebra Puzzles Solve the following problems.
a) -4(5x + 11) = 128 b) x + 16 + 2x – 21 = 40
c) 41 + 3x – 17 + 5x = 24 d) 4(3x – 7) + 25 = -39
JM-55. Simplify.
a) 2
12 – 3
5b) 6 ÷ 3
23
c) 2
14 · 8
12

The Jar of Marbles: Probability, Statistics, and Interpreting Data 377
JM-56. Here is a graphical look at proportions and percents. Copy and complete the table.
Picture Problem in Words / Proportion Answer
100%
0%
20
15
0
n%
What percent of 20 is 15?
=15 part
20 whole
n part
100% whole
100%
0%
30
24
0
n% =
JM-57. Find the fraction greater than 14 and less than 3
10 that has the smallest possible
denominator.
JM-58. Copy and complete this table using the fractions your teacher will provide.
Question Event To Examine Poll AFraction
Poll APercent
Poll BFraction
Poll BPercent
1. Name anythingteenagers worry about. grades/graduation
2. Do you support thePresident’s EducationPlan?
yes
3. How could education inAmerica be improved?
more computerspending
4. Do you think violence inmovies affects children? yes
5. Should teachers makemore money? yes
6. Do you like exercise? yes
JM-59. Were the results from Poll A and Poll B similar? List any reasons you think mightaccount for the differences.

378 CHAPTER 10
JM-60. Let’s examine each of the questions to find possible reasons for the different results weobtained. Here are the six questions as they were presented to each team.
Poll A Poll B
1. To what level do teenagers worryabout poor grades?(low / medium / high)
What do teenagers worry aboutthese days?
1. Name one thing teenagers worry aboutthese days.
2. Do you support the President’seducation plan?
2. Do you support the President’s educationplan since it will ensure that students will bemore successful in school?
3. How could education in Americabe improved? ___
a) develop higher standards forstudents
b) raise teacher salariesc) make more computers accessible
to studentsd) other (specify)
3. How could education in America beimproved?
4. Do you think violence in today’smovies affects children?
4. Do you think the frequent occurrence ofbrutal violence in today’s movies affectsyoung, impressionable children?
5. Should teachers make moremoney?
5. Don’t you agree that teachers should makemore money?
6. Moderate exercise is necessary tostay healthy. Do you exercise?
6. Do you exercise?
a) Question Order: Question 1 uses this technique to bias or influence the results. Thismeans that two questions were asked in order so that the first one suggests the answer tothe second. Which poll in Question 1, A or B, used the “question order” technique andwhy is it going to influence responses?
b) Preface: Instead of asking a question, these questions usually start with statementsthat can bias the result of the following question. Which question number (2through 6) and poll letter (A or B) used this technique?
c) Two Questions in One: This technique involves asking two questions at once.The people being asked may agree with one part and disagree with another part, butthey are not allowed to give a separate answer for each part. Which questionnumber (2 through 6) and poll letter (A or B) used this technique?
>>Problem continues on the next page.>>

The Jar of Marbles: Probability, Statistics, and Interpreting Data 379
d) Closed Option: If a person only has a few choices, this increases the chance acertain choice will be picked. Which question number (2 through 6) and poll letter(A or B) used this technique?
e) Favorable Or Unfavorable Wording: By using adjectives, pleasing orunpleasant words, the surveyor can influence the results. Which question number(2 through 6) and poll letter (A or B) used this technique?
f) Desire To Please: Most people want to be agreeable and please the surveyor. Anyquestions starting with, “Don’t you agree” or “Don’t you think” are naturallybiased. Which question number (2 through 6) and poll letter (A or B) used thistechnique?
JM-61. Armando and Vlad were flipping three coins: a nickel, a dime, and a quarter.
a) Make an organized list of the possible outcomes. If the nickel comes up heads, thedime comes up heads, and the quarter comes up tails, we write this outcome as HHT.
b) They decided that Armando would win when exactly two heads come up and Vladwould win if exactly one head comes up. Who has a better chance of winning?Explain.
JM-62. Sharee, who was working on the previous problem, suggested, “It’s hard to keep track ofthe possibilities in a list. Let’s make a grid.”
a) Explain why it would be difficult touse a grid with this problem.
b) Dexter did not think that a gridwould work. He started drawing adifferent kind of diagram, called atree diagram. He explained that thefirst split showed the two choices forthe nickel; it could be heads (H) ortails (T). If the nickel was heads,then the second split would show thetwo choices for the dime. The sameis true if the nickel was tails. Thethird split is for quarters. Whatoutcome does HHT represent?
c) Copy his diagram and complete thelist of outcomes at the side.
H
T
H
T
H
T
H
T
H
T
H
T
H
T
HHH
HHT
d) Where does Dexter’s diagram show the outcome that the nickel was tails while thedime and quarter were both heads?
e) On your diagram, circle the outcome(s) with exactly two heads. What is theprobability of flipping exactly two heads?

380 CHAPTER 10
JM-63. Steve is playing another card game with Cathy. They shuffle 52 cards. Cathy is dealt athree and a five, while Steve is dealt a five and a ten. None of the cards are returned to thedeck.
a) What is the probability that Steve will get a six on his next card?
b) Continuing their game, Steve gets a three and Cathy gets a five. Now Stevewants another three. What is the probability that he will get a three?
JM-64. Kimberly has a pair of dice. To win the game she is playing she needs to roll a sum offive on her next turn. She made the following chart of the possible sums of two dice.
First Die Roll
1
2
3
4
5
6
+
2 3 4 5 6 7
4 5 6 7 8 9
5 6 7 8 9 10
6 7 8 9 10 11
7 8 9 10 11 12
3 4 5 6 7 8 The two dice are rolled, and the sum is shown here.
Seco
nd D
ie R
oll
1 2 3 4 5 6
a) How many squares representing sums are shown in the table?
b) How many of the squares show a sum of five?
c) What is the probability that she will roll a sum of five?
d) What is the probability that she will roll a sum greater than five?
e) If she rolls a sum of five on her first roll, what is the probability that she will roll asum of five on her second roll?
JM-65. A bag of marbles contains only the colors yellow, green, and blue.
a) The probability of getting a yellow marble is 23 . What is the probability of getting a
blue or green marble?
b) The probability of getting a green marble is 14
. What is the probability of getting a
blue marble?
c) There are 24 marbles in the bag. How many are blue?

The Jar of Marbles: Probability, Statistics, and Interpreting Data 381
JM-66. In your own words answer the following questions.
a) Is there an x such that | x | = -1? Explain your reasoning.
b) If | x | = 3 what are the possible values for x?
c) What is your best definition of absolute value?
JM-67. Which of the values below cannot be a probability?
(A) 0 (B) 38
(C) 45% (D) 1.2 (E) none of these
JM-68. While computing the statistics of his baseball team, Jake found that Geraldo was getting ahit 5 out of 7 times at bat. Approximately how many hits would Geraldo get if he were atbat 100 times?
JM-69. If baseball were played on Mars, the balls would fly much farther than they do on Earth.Thus, the number of home runs would be much greater on Mars. If Mike hit 76 homerson Earth, he could expect to hit 50% more on Mars. How many home runs would he hiton Mars?
JM-70. Solve for x.
a) 12 = x
10b) x
55 = 5
10c) 45
63 = 10
x
d) 36x
= 5.42.4
e) 4214.7
= x7
f) x15
= 2.73
JM-71. Answer these questions using the flow diagram shown below.
Start · End÷ 24
+ 0.2531
a) If you start with 8, with what number do you end?
b) If you start with -12, with what number do you end?
c) If you start with 12, with what number do you end?
d) If you end with 1.25, with what fraction did you start?
e) If you end with 1324
, with what fraction did you start?

382 CHAPTER 10
JM-72. Here is a graphical look at proportions and percents. Copy and complete the table.
Picture Problem in Words / Proportion Answer
100%
0%
40
n
0
55%
What is 55% of 40?
=
100%
0%
80
50
0
n%
JM-73. Solve for the variable.
a) 3b – 2b + 17 + 14 b = 18 b) 5(6 – x) + 2.5(x + 2) = 25
c) 0.7(m – 10) = -6 d) 1.8(2n – 5) = -12.6
JM-74. Find the area and circumference of a circle with a radius of 6.3 centimeters.
JM-75. Here are some questions. Identify which of the six techniques is being used to try toinfluence the people being surveyed. If no bias technique is being used, write, “Fairquestion.”
a) Zappo Cola has twice the vitamin E of other brands. In your opinion, what is thehealthiest cola drink?
b) Do you think that cruel people who hurt defenseless animals should be imprisoned?
c) Don’t you agree that Hal Poppington is the best man to be Mayor?
d) Which soda is your favorite?
e) Which shirt color would you prefer? 1) blue 2) beige 3) brown 4) tan

The Jar of Marbles: Probability, Statistics, and Interpreting Data 383
JM-76. You and your partner work for the U.S. Department of Education. You have been askedto survey people about the President’s new proposal to have students attend school for200 days instead of 180 days. A fair question would be, “Do you think students shouldattend school for 180 days, as they do now, or for 200 days?” Rewrite the fair questionto bias (or influence) the results toward the 200 day answer. Each team will work on oneof the following.
a) Order Of Question b) Two Questions In One
c) Closed Option d) Unfavorable Or Favorable Wording
e) Desire To Please f) Preface
JM-77. Today we will begin our survey project. Yourteacher will give you a choice of questions andfurther instructions. You will attempt to learnwhat all the students in your school think aboutthe question by surveying a representativesample. You will calculate the percent ofstudents who give you different answers andkeep track of characteristics of your samplepopulation.
After your teacher offers you a choice of surveyquestions, copy down the question you choseby this problem number.
JM-78. Copy the timeline for the project in your notes or assignment calendar. Write the datesyour teacher gives you for each of the following.
a) Survey questions chosen.
b) Modifications approved, tally form created, student survey started.
c) Student survey finished, all percents calculated, graph drawn.
JM-79. Survey questions can be either open or closed. Open questions allow free response. Theresponses from open questions are frequently difficult to organize. Closed questionsallow only a limited number of responses, which the researcher knows before doing thesurvey. Classify the following questions as either “open” or “closed.”
a) What date is your birthday?
b) Who is your favorite actor?
c) What adjective would you use to describe your best friend?
d) What is your favorite day of the week?

384 CHAPTER 10
JM-80. Read your survey question again.
a) Is your survey question open or closed?
b) Will you have difficulty organizing the responses from your question?
c) Would it be easier to create a closed list of possible answers to make the responseseasier to organize?
d) Will it be possible to categorize the responses from your question?
e) If you need to rewrite or change your question, do so by tomorrow and make sureyour teacher approves the changes you make.
JM-81. Complete a tree diagram to show the outcomes for the first Bagof Marbles game Josiah and his dad played in problem JM-45.The tree is started at right.
a) Does this tree give us the same set of outcomes as the grid?
b) The tree can also be made using just one P for purplemarbles, provided you use the probabilities. Draw the treeat right including the probabilities.
c) What do you need to do to calculate the probability ofdrawing two purple marbles?
d) What do you need to do to calculate the probability ofdrawing two green marbles.
e) Show how to calculate the probability of a match. That is,P(match).
f) Show how to calculate P(no match).
P
PG
G
G
P
P
G
P
31
G 31
G 31
32
P 32
P 32
JM-82. Convert each of the following fractions into a decimal and then into a percent.
a) 12575
b) 89
c) 511
d) 4243
e) 3738
f) 2117

The Jar of Marbles: Probability, Statistics, and Interpreting Data 385
JM-83. Josiah played the marble game and chose to play for a match. His father ended up washingthe dishes the next day. Josiah’s father decided to build a new bag of marbles. He put inone green and three purple marbles.
a) Copy and complete a table like the one below to analyze the advantages of playingeach strategy with this new bag.
G P P P
G GGmatch
P GPno match
P
P
b) Use your table from part (a) to determine the probability of getting match andgetting no match.
c) Which strategy from part (b) has a greater probability of winning?
d) Draw a generic rectangle fraction table to analyze the advantages of playing matchwith the new bag.
e) Should Josiah play match or no match? What are the probabilities?
JM-84. During the 162-game baseball season, the outfielder Felipe saved an average of $32 pergame. He kept the money in a sock in his locker.
a) At the end of the season he took his money to the bank. How much had he saved bythe end of the season?
b) He plans to leave all the money in his savings account until the end of next season.At a simple interest rate of 4.68% per year, how much will he have at the end of nextseason?
JM-85. Amanda and her family went to a restaurant for dinner. The meal cost $27.96. They wantto leave a tip between 15% and 20%. How much should they leave? Explain how youfound your answer.
386 CHAPTER 10
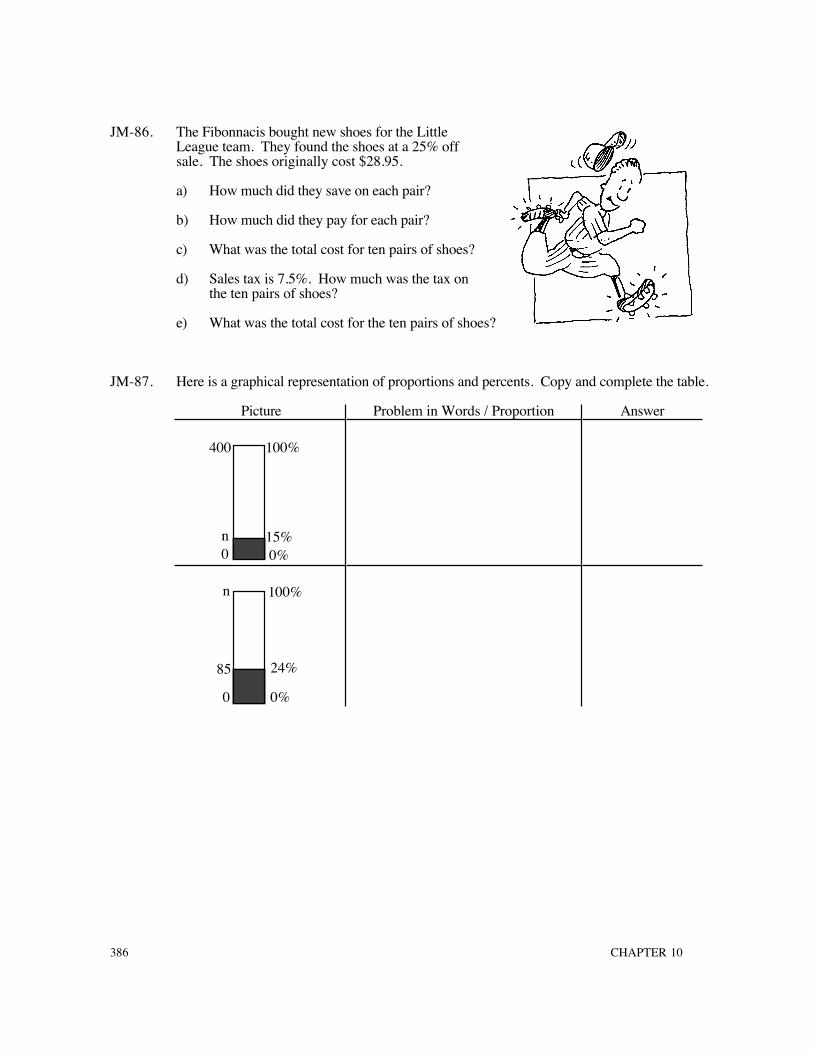
JM-86. The Fibonnacis bought new shoes for the LittleLeague team. They found the shoes at a 25% offsale. The shoes originally cost $28.95.
a) How much did they save on each pair?
b) How much did they pay for each pair?
c) What was the total cost for ten pairs of shoes?
d) Sales tax is 7.5%. How much was the tax onthe ten pairs of shoes?
e) What was the total cost for the ten pairs of shoes?
JM-87. Here is a graphical representation of proportions and percents. Copy and complete the table.
Picture Problem in Words / Proportion Answer
100%
0%
400
n0
15%
100%
0%
n
24%
0
85

The Jar of Marbles: Probability, Statistics, and Interpreting Data 387
JM-88. You should have revised your survey question and obtained your teacher’s approval foryour changes. To help you survey students in an organized manner, you need to set up atable to keep track of the participants.
a) Take out a sheet of binder paper. Write your question and heading at the top of thepage.
b) Make a list of four characteristics of your school’s population you will monitor inyour sample to ensure that your sample is representative (i.e., gender, age, grade,location, whether or not you know the person, etc.).
c) Set up a table that you will use to record each student’s characteristics and responses.You will turn this paper in on the due date. Look at the sample form below.
My Question: What is your favorite color?
# Name Gender Know Them? Rides Bike Area Asked Response1 Kim F yes no classroom blue
2 Scott M no yes bus red
d) Your teacher will tell you the number of students you need to survey. Number yourtable accordingly.
JM-89. Your survey is supposed to represent the entire population of students in your school.Will you be able to ask your question of every student in your school? Why or why not?
JM-90. If you want to know what a dish of food tastes like,you can get a good idea by trying a little taste or asample of the food. You do not need to eat thewhole dish of food. When statisticians cannotsurvey everyone in a population, they use asample of the population. However, getting arepresentative sample is not always easy.
a) If you wanted to generalize the opinions of allstudents at your school, would it make sense togo to a bank and survey the people there?Why or why not?
b) If you wanted to generalize the opinions of all students at your school, would itmake sense to ask all your friends at school? Why or why not?
c) If you wanted to generalize the opinions of all students at your school, would itmake sense to ask every third person in the bus line?

388 CHAPTER 10
JM-91.POPULATION AND SAMPLES
A POPULATION is a collection of objects or a group of people about whominformation is gathered.
A SAMPLE is a subgroup of the population. For example, if you want to conduct asurvey at your school about what foods to serve in the cafeteria, the population wouldbe the entire student body.
If you choose to sample 10% of the students, you need to include the correct fractionof students from each grade and an equal number of male and female students. AREPRESENTATIVE SAMPLE is a subgroup of the population that matches thegeneral characteristics of the entire population.
Highlight the key words of each of the three definitions in your Tool Kit.
JM-92. There are a variety of ways to sample the population you are studying. Each method hasadvantages and drawbacks.
a) If you ask the opinion of the people around you, then you have conducted aconvenience sample. What is a feature of a convenience sample?
b) What is a drawback to a convenience sample?
c) If you mail a questionnaire and accept all the returned responses, then you havetaken a written survey. What is a feature of a written survey?
d) What is a drawback to a written survey?
e) If you systematically choose random people from your population, then you have arandom sample. What is a feature of a random sample?
f) What is a drawback to a random sample?
JM-93. From what population are each of these samples taken? Write down the actual populationfor each of these sampling techniques.
Method of Sampling Description ofActual Population
Call every hundredth name in the phone book. People with phones whohave their number listed.
Call people at home at 10 a.m.
Ask every tenth person who leaves the mall.
Ask people leaving the bank.
Mail questionnaires to people.
Ask everyone on the school bus.

The Jar of Marbles: Probability, Statistics, and Interpreting Data 389
JM-94. In 1988 the Steering Committee of thePhysicians Health Study Research Groupreleased the results of a five-year experimenton over 22,000 male physicians aged 40 to 84.The research on this sample suggested that theparticipants who took an aspirin every otherday had a lower rate of heart attacks.
a) Can you legitimately conclude from thissample that aspirin reduces heart attacksfor all men and women? If you cannotconclude this, why not?
b) Can you legitimately conclude from this sample that aspirin reduces heart attacks forall men? If you cannot conclude this, why not?
c) Can you legitimately conclude from this sample that aspirin reduces heart attacks forall men aged 40 to 84? If you cannot conclude this, why not?
d) Can you legitimately conclude from this sample that aspirin reduces heart attacks formale physicians aged 40 to 84? If you cannot conclude this, why not?
e) Can you legitimately conclude from this sample that aspirin is good for malephysicians aged 40 to 84? If you cannot conclude this, why not?
JM-95. At right is a graph of seven coordinate points.
a) Look at the points in the graph and organize theordered pairs in a table.
Example:
x -3 -2 -1 0 1 2 3
y 2.5
b) What algebraic rule would give these points?
c) Name at least two other points whichwould fit this rule.
x
y

390 CHAPTER 10
JM-96. For your survey, you will need to sample students carefully to get a representative sampleof the population.
a) Why would your survey not be representative if you only call your friends?
b) Why would your survey not be representative if you survey only students in yourmath class?
c) Why would your survey not be representative if you survey only students in thebicycle area?
d) Why would your survey not be representative if you survey only boys?
e) Make a list of three things you will do when asking people your survey question toensure you are asking a representative sample of the student population.
JM-97. Find the value of each expression.
a) 13 – (- 3
4 ) b) 2
3 (- 3
5 ) c) 2
3 – 4
5
d) - 47 · 5
8e) 1
23 · 4 f) -1
14 (-2
47 )
JM-98. Find the radius and circumference of the circles with the given area. Use a calculatorand round to the nearest hundredth.
a) 100.81 yd2 b) 550 km2
JM-99. Angela and Kenya were trying to figure out how many cupboard handles to buy in orderto remodel the kitchen. The new cupboards would only need 50% as many handles as theold ones. Show the proportions and answer the questions below.
a) If 38 handles were needed for all of the new cupboards, how many handles were onthe original cupboards?
b) The cost of each new handle was the same as the cost of each original handle. If theoriginal handles cost a total of $338, what will be the cost of the new handles?
c) When they got to the hardware store, they found the handles were 25% off. Howmuch will it cost them to purchase the new cupboard handles?

The Jar of Marbles: Probability, Statistics, and Interpreting Data 391
JM-100.Round to the nearest hundredth.
Picture Problem in Words / Proportion Answer
100%
0%
n
0
92%132132 is 92% of what number?
=
100%
0%
n
24
0
85%
JM-101. Follow your teacher’s directions for practicing mental math.
JM-102. A good surveyor tries to keep the people beingsurveyed from being biased by prior experience. Forthis problem, assume you are conducting a taste test tocompare Zappo Cola and Fizzy Cola.
a) How would you make sure that people’spreconceived notions of their favorite sodawould not be an influencing factor?
b) If four people all taste the two sodassimultaneously, how can you make sure they donot influence each other’s opinions by talkingabout their impressions?
c) Could the temperature of the colas make a difference? How would you reduce anyinfluence that temperature could have?
JM-103. You have studied a number of ways to organize data visually.
a) Make a list of all the different types of graphs you know how to make.
b) Which of the graphs you listed in part (a) will you use to present your data from thesurvey question you were assigned?
c) In how many days is your survey due?
Here is a graphical representation of proportions and percents. Copy and complete the table.
392 CHAPTER 10
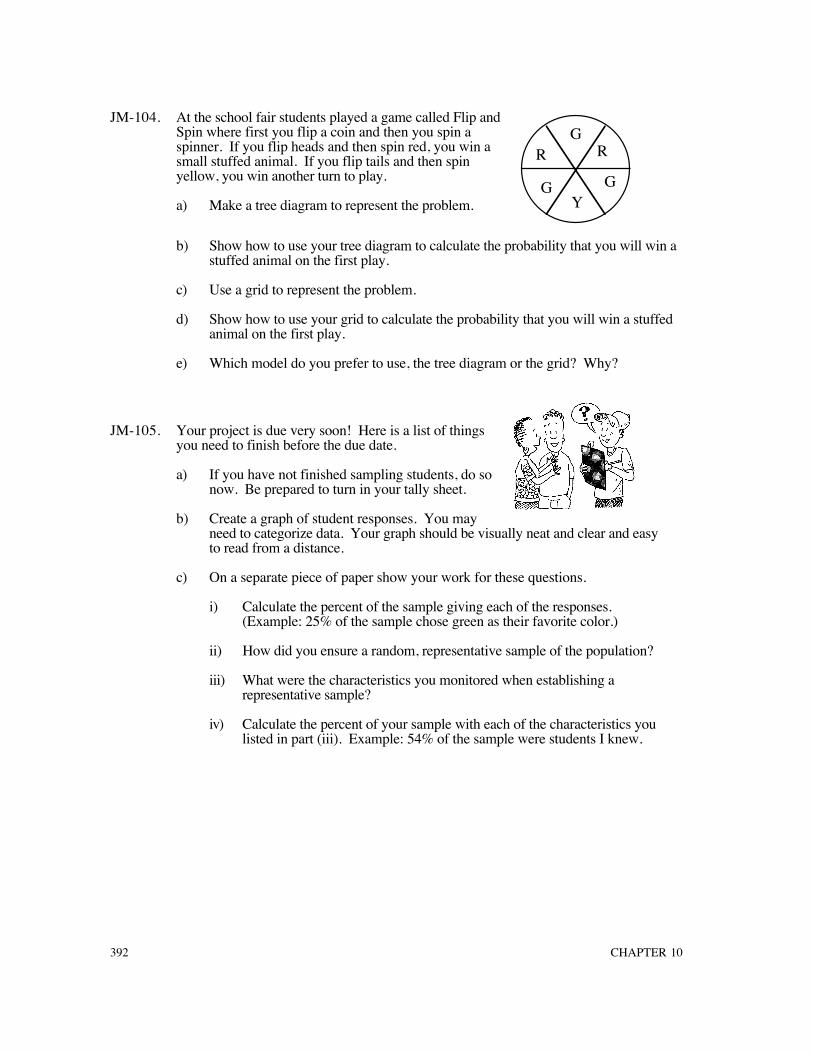
JM-104. At the school fair students played a game called Flip andSpin where first you flip a coin and then you spin aspinner. If you flip heads and then spin red, you win asmall stuffed animal. If you flip tails and then spinyellow, you win another turn to play.
a) Make a tree diagram to represent the problem.
R R
YG G
G
b) Show how to use your tree diagram to calculate the probability that you will win astuffed animal on the first play.
c) Use a grid to represent the problem.
d) Show how to use your grid to calculate the probability that you will win a stuffedanimal on the first play.
e) Which model do you prefer to use, the tree diagram or the grid? Why?
JM-105. Your project is due very soon! Here is a list of thingsyou need to finish before the due date.
a) If you have not finished sampling students, do sonow. Be prepared to turn in your tally sheet.
b) Create a graph of student responses. You mayneed to categorize data. Your graph should be visually neat and clear and easyto read from a distance.
c) On a separate piece of paper show your work for these questions.
i) Calculate the percent of the sample giving each of the responses.(Example: 25% of the sample chose green as their favorite color.)
ii) How did you ensure a random, representative sample of the population?
iii) What were the characteristics you monitored when establishing a representative sample?
iv) Calculate the percent of your sample with each of the characteristics you listed in part (iii). Example: 54% of the sample were students I knew.
The Jar of Marbles: Probability, Statistics, and Interpreting Data 393
JM-106. In the previous chapter, you studied the area of a circle, A = πr2. For this problem we usethe variables x and y instead of A and r.
a) Create a table to organize a set of points which follow the rule y = πx2.
Use π = 227
. Graph the ordered pairs on a coordinate grid.
b) What do the x-values represent?
c) What do the y-values represent?
JM-107. Find the value of each expression.
a) 18 + (-33) b) 14 · (-5) c) (-16) ÷ 8
d) -28 + 45 e) (-23) · (-6) f) -26 + (-37)
JM-108. Melissa is going to re-sod her yard. Her backyard has a rectangular lawn area that is
24 12 feet by 18 feet. Her front yard has two rectangular areas. One is 18
12 feet by 14
12 feet,
and the other is 12 12 feet by 14
12 feet. How many square feet of sod does Melissa need?
JM-109. The town Little League needed more baseball bats. Batsnormally cost $25 each. Because it is late in the season, thesporting goods company is having a half-price sale. It is sucha good deal that the league decides to stock up for the nextseason and buy fifty bats. What is their total bill? (Do notforget to add the sales tax of 7.5%.)
JM-110. Complete the following Diamond Problems.
Sum
Product a)
23
14
b)
2.31
c)
49
212
d)
1.8 0.7
e)
35
2940

394 CHAPTER 10
JM-111. Here is a graphical representation of proportions and percents. Copy and complete the table.
Picture Problem in Words / Proportion Answer
100%
0%
400
n%
0
215=
100%
0%
n
75%
0
120=
JM-112. Mentally calculate 60% of $37. Write your result and explain how you got it.
JM-113. Calculate the following sums and differences.
a) 57 + 4
5b) 11
15 + 4
11c) 11
15 – 4
11
JM-114. Are the following relationships possible or not possible? Explain your answer in acomplete sentence.
a) An increase in the number of pages in a book causes an increase in the cost of thebook.
b) An increase in shoe size causes an increase in spelling ability.
c) An increase in the number of years of education causes an increase in salary.
d) An increase in facial tissue sales causes an increase in hot chocolate sales.
e) An increase in walking time causes an increase in weight loss.
f) An increase in a husband’s age causes an increase in the wife’s age.

The Jar of Marbles: Probability, Statistics, and Interpreting Data 395
JM-115. Examine the scatter plot below which shows the number of pages in a bookcompared to the price of the book.
a) How many books are representedin this scatter plot?
b) Is this correlation positive?(As one variable increases invalue, does the other variableincrease as well?)
c) What does this graph tell youabout the relationship betweenthe number of pages in the bookand its price?
d) Does an increase in the numberof pages cause an increase in theprice?
100 200 300 400 5000
10
20
30
40
Number of Pages�
Pri
ce (
in d
olla
rs)
JM-116. Graph the following data as a scatter plot on the resourcepage.
a) Is the correlation positive? (As one value increases,does the other value also increase?)
b) In your opinion, does more time studying cause a risein test scores?
Hours Spent Studying
10
7
8
15
12
4
2
10
1
6
590
7097
858055
100
20
857085
Test Scores (Percent)
12
23

396 CHAPTER 10
JM-117. Look at the scatter plot below showing the husband’s age compared to the wife’s age.
a) Is this a positive or negativecorrelation? A negativecorrelation means that as onevariable increases in value, theother variable decreases invalue.
b) What does the graph tell youabout the age of the husbandcompared to the age of thewife?
c) Does an increase in thehusband’s age cause anincrease in the wife’s age?
20 40 60 80 100
20
40
60
80
Age of Husband (Years)
100
Age
of W
ife
(Yea
rs)
JM-118. In the preceding problem, the events are not caused by each other; each one is caused byanother factor. Look at the double-line graph below to answer the following questions.
a) Do the sales of tissues and hotchocolate appear to be correlated orsomehow connected?
b) Does the sale of tissue cause theincrease in the sale of hot chocolate?Explain.
c) Why does the data seem to be relatedas it appears in the line graph?
0
30
40
50
60
Months
Sale
s (i
n th
ousa
nds)
Tissue Sales
Hot Chocolate Sales
A S O N D J F M A M JJ

The Jar of Marbles: Probability, Statistics, and Interpreting Data 397
JM-119. Graph the following data as a scatter plot on the resource page.
a) Is the correlation positive or negative?
b) Does there appear to be a connection betweenheight and spelling ability?
c) Does more height cause better spelling ability?
d) What other factors could create the correlation yousee?
Height Spelling Test (Percent)
24567249183670666134595764
3869850 01290817525807788
JM-120. Find the diameter of the circles with the given circumference. Use π = 227 .
a) 1331 m b) 770 in.
c) 99.88 cm d) 5280 km
JM-121. Sometimes we notice that two things are connected, and we assume that the connectionmeans that one thing causes the other. For example, if you study enough people, you maynotice that the more gray hairs a person has the fewer hours the person spends at work.Does this mean gray hair causes people to work less? Explain the real connectiondescribed here.
JM-122. Look back at problem JM-116 to answer the following questions.
a) How many people are represented in the graph?
b) Find the mean number of hours spent studying.
c) Find the median of the test scores.
d) Why is the mean not the best measure for the test scores?

398 CHAPTER 10
JM-123. Here is a graphical representation of proportions and percents. Copy and complete the table.
Picture Problem in Words / Proportion Answer
100%
0%
400n%
0
384
100%
0%
n
25%
0
90
JM-124. Find the area and circumference of a circle with a diameter of 23.8 inches.
JM-125. Simplify the following expressions.
a) (6 – 8)(9 – 10) – (4 + 2)(6 + 3) b) -8432 – 12(-5)
c) -4 · 7 + 2(-3
18
) d) 56 – (-4) + (-6)(4
23
)
JM-126. Simplify.
a) 2
78 + 3
5b) 9
12 – 5
8
c) 4
45 · 6
7d) 3
8 ÷ 6
34
The Jar of Marbles: Probability, Statistics, and Interpreting Data 399
JM-127. In a jar you have ten cubes numbered 0, 1, 2, ... , 9. Takeout a cube, write the number down, put it back in the jar,shake the jar, and take out a cube again. What is theprobability that the sum of the two cubes is 10 orgreater?
JM-128. Today you will present your survey projects in class. Be sure you have the followingitems ready to turn in as directed by your teacher:
a) tally sheet
b) graph of responses
c) calculations and explanations from problem JM-105 part (c).
JM-129. Chapter Summary Answering the followingquestions will help you to summarize this chapter.Write a paragraph about:
a) how theoretical and experimental probabilitiesare calculated.
b) when experimental probabilities are likely to beclose to the theoretical probability.
Use three ways to organize and solve the followingprobability problem: a list, a grid or genericrectangle, and a tree diagram.
c) Josiah’s dad thinks he has finally figured out a way to win the marble match game.He decided to use two bags, one with three purple marbles and one green marble.The other bag has one purple marble and two green marbles. Each player draws twomarbles, one from each bag. Analyze this game. Who has a better chance, Josiahplaying for match or his dad playing for no match?
d) Explain which method you prefer to use when analyzing problems like (c).

400 CHAPTER 10
JM-130. Here is a graphical representation of proportions and percents. Copy and complete the table.
Picture Problem in Words / Proportion Answer
100%
0%
400
n%
0
133
=
100%
0%
n
80%
0
240
JM-131. Compute the following percentages.
a) 25% of 80 b) 12
12 % of 120 c) 33
13 % of 75
d) 60% of 70 e) 15% of 60 f) 9% of 1015
JM-132. Evaluate the following expressions.
a) 25 · 3
7b) 3
4 + 5
6 + 2
3c) 3
8 ÷ 1
16
d) 611
– 37
e) 2
13 · 3
25
f) 710
÷ 35
The Jar of Marbles: Probability, Statistics, and Interpreting Data 401
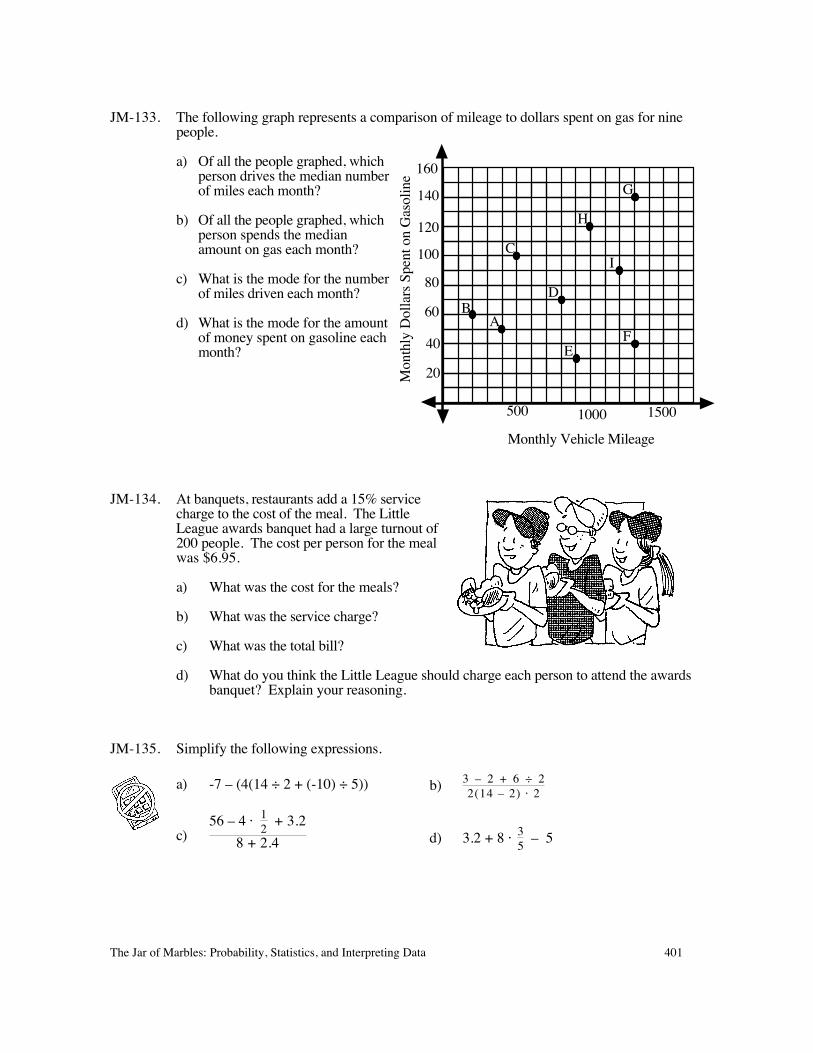
JM-133. The following graph represents a comparison of mileage to dollars spent on gas for ninepeople.
a) Of all the people graphed, whichperson drives the median numberof miles each month?
b) Of all the people graphed, whichperson spends the medianamount on gas each month?
c) What is the mode for the numberof miles driven each month?
d) What is the mode for the amountof money spent on gasoline eachmonth?
AB
C
D
EF
G140
160
120
100
20
40
60
80
Monthly Vehicle Mileage
500 1000 1500
H
I
Mon
thly
Dol
lars
Spe
nt o
n G
asol
ine
JM-134. At banquets, restaurants add a 15% servicecharge to the cost of the meal. The LittleLeague awards banquet had a large turnout of200 people. The cost per person for the mealwas $6.95.
a) What was the cost for the meals?
b) What was the service charge?
c) What was the total bill?
d) What do you think the Little League should charge each person to attend the awardsbanquet? Explain your reasoning.
JM-135. Simplify the following expressions.
a) -7 – (4(14 ÷ 2 + (-10) ÷ 5))
c)56 – 4 · 1
2 + 3.2
8 + 2.4
b) 3 – 2 + 6 ÷ 22(14 – 2) · 2
d) 3.2 + 8 · 35 – 5

402 CHAPTER 10
JM-136. Simplify.
a) 3
45 + 1
910
b) 1
49 – 4
13
c) 7
78 · 2
710
d) 6
49 ÷ 1
38
JM-137. Write the given numbers and continue each pattern on your paper.
a) 18 , 1
4 , 3
8 , ____, _____, _____, _____, _____
b) 16 , 1
3 , _____, _____, 5
6 , _____
c) _____, 25 , 0
5 , _____, -4
5 , _____, _____
d) 0.25, _____, 0.75, _____, 1.25, _____, _____
e) 0.2, 0.05, ____, _____, _____, _____, -0.7
f) 7%, 15%, 31%, _____, _____, _____, _____
JM-138. If the probability of an event happening is N, what is the probability of the event nothappening?
(A) N – 1 (B) 1 – N (C) 1 + N (D) 1 · N

The Jar of Marbles: Probability, Statistics, and Interpreting Data 403
JM-139. Becoming a professional basketball player is thedream of many students. Here are somenumbers to consider. There are 150,000 highschool seniors who play basketball every year.3800 of them make it to a college team. Ofthose, 64 students make it to a professional team.(Source: NCAA.)
a) Slim is a high school senior on thebasketball team in a large city. There are1000 seniors in his league. Use aproportion to find how many of the 1000students will make it onto a college team.
b) Use a proportion to find the number of those 1000 students who will make it onto aprofessional team.
c) What is the probability that a high school senior basketball player will make it to aprofessional team? Express your answer as a percent.
d) Refer to problem JM-35. Determine if the following statement is true or false:“It is about half as likely for a high school senior to become a professionalbasketball player as it is for him to become a professional football player.”
JM-140. What We Have Done in This Chapter
Below is a list of the Tool Kit entries from this chapter.
• JM-7 Vocabulary Terms for Probability
• JM-13 Experimental and Theoretical Probabilities
• JM-17 Dependent and Independent Events
• JM-91 Population and Samples
When you have finished, write “My Tool Kit is up to date.”
JM-141. Course Summary Your teacher will assign each team a chapter to summarize.
a) For your chapter, list the objectives from the front of the chapter. Restate them inyour own words.
b) List the Tool Kit entries from the end of the chapter.
c) With your team select five problems from the chapter that you think best representthe objectives and Tool Kit.
d) Write out the solutions for the problems.
e) Prepare a poster to present to the rest of the class showing the chapter objectives(in your own words), the Tool Kit list, and the five problems with their solutions.Be ready to explain why you chose those particular problems.

404 CHAPTER 10
JM-142. Your job is to create some new problems for the final exam. Your teacher will assign yourteam another chapter. Use the five problems selected for that chapter as a basis for writingthe new problems. Sometimes you can do this by just changing some numbers.Sometimes you will need to change the whole problem. Two examples are given below.
Find the area.
Original:
8 ft
8 ft 5 ft
New:
5 m
6 m
1 m
2 m
1 m
Solve the equation.
Original: 5(x – 3) = -7x + 18 New: -3(x – 5) = -2x + 10
a) With your team, write one problem that is similar to but different from each of thefive poster problems.
b) Solve each of the problems your team wrote.
JM-143. A Letter of Advice Write a letter of advice to a student entering Foundations forAlgebra for the first time. Include in this letter how they can be successful in this course.If you could start over, what would you do differently? What types of things helped yousucceed in this class? What tools were important? What general advice would you givethis student?


