42
YTF – statistical analysis of 1700 prospects and leads Gunnar V. Søiland Norwegian Petroleum Directorate

YTF – statistical analysis of 1700 prospects and leads
Gunnar V. Søiland
Norwegian Petroleum Directorate
Norway’s Petroleum Resources
• The Norwegian Petroleum Directorate (NPD) is responsible for maintaining a complete inventory of petroleum resources in Norway.
• This is done in accordance with established resource classification routines, regular reporting from the oil companies and NPD’s geological mapping.
• NPD compile and publish annually figures on field reserves, contingent resources and YTF resources.

3
More than half of the resources still remain
3
48%
Undiscovered resources
Resources in discoveries
Resources in fields
Reserves
20%
5%
6%
21%sold and
delivered

Estimating Undiscovered, Yet To Find (YTF) Volumes
YTF = Number of prospects x Size x Probability
Probability of oil/gas (HC phase)

1: Number of Accumulations

6
Number of features / feature density
sold and
delivered
Assessment of feature density is based on one or more calibration areas
where all relevant elements can be counted.
These elements are the number of
• discoveries
• dry wells
• mapped prospects
• leads
+ number of postulated prospects (which could be mapped in the future).

NPD’s Database
• Maintain Extensive Prospect database updated by
• NPD in-house mapping
• License Applications
• Prospect mapping in the Licenses (Exploration committees / L2S)
-Many Prospects are recorded with several historic estimates
• Pre-drill estimates compared to Well results – reported by the Operators
• All Discoveries and Fields – annual reporting from the Operators
• Complete well data base with all interpretations and reports
7

Norway – some numbers June 2017
8
903 Production Licenses signed
1764 Exploration Wells
4553 Production / Injection Well
81 Fields in Production (116 fields totally)
1100 Prospects
600 Leads
74 Plays identified and analysed by NPD

2: Size of future discoveries
We think they are bigger than they are

10
Size of prospects and discoveries
sold and
delivered
1. Sizes of mapped prospects in the play.
2. Information from discoveries is important for confirmed plays. Knowledge
of discovered volumes are essential for assessment in mature plays, while
information from analogues is also important for less explored cases.
3. Calculating the size of future discoveries builds on estimates of volume
and fluid (liquid and gas) parameters.
Pro
bab
ility
Volume

0
5
10
15
20
25
30
35
40
Mill
ion
Sm
³ o
e
Liquids
Gas
*North Sea Norwegian Sea Barents Sea
Discoveries last 10 years pr. region sorted by size
11
*Johan Sverdrup is not included.
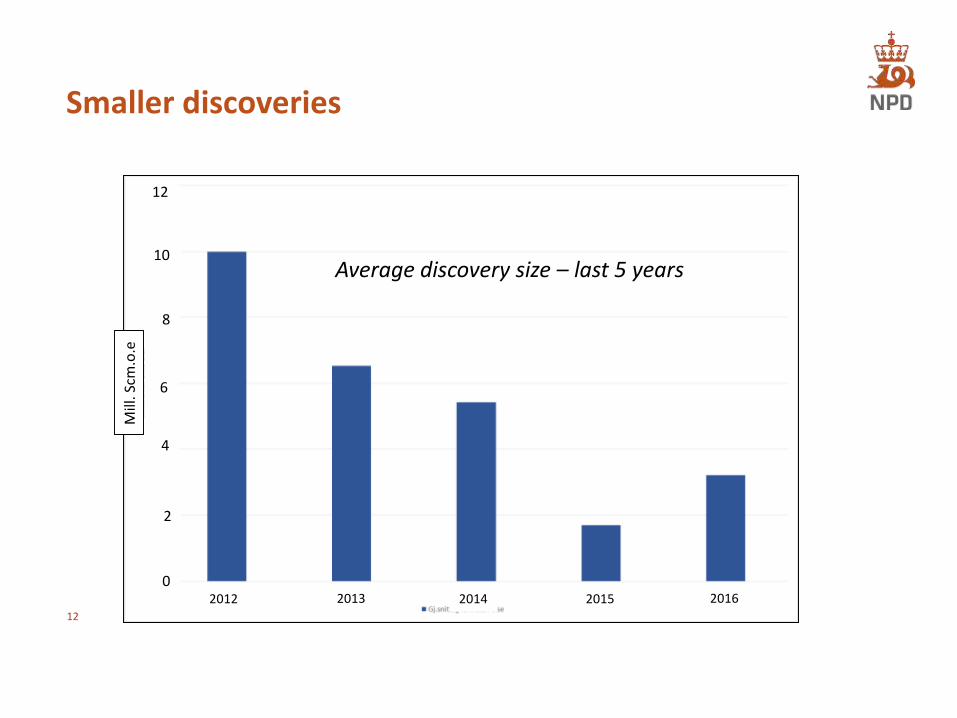
Smaller discoveries
12
Mill
. Scm
.o.e
2012 2013 2014 2015 2016
12
10
8
6
4
2
0
Average discovery size – last 5 years

Discovery size vs estimates in applications
13

NCS Pre vs Post-drill volume estimates1998
14
K.Ofstad et. al (1998) Evaluation of Norwegian Wildcat Wells

15
2008

Exploration targets 2007-2016 - oil
Mill
.Sm
3o
.e. in
pla
ce

Exploration targets 2007-2016 - gas
Mill
.Sm
3o
.e. in
pla
ce
?
?
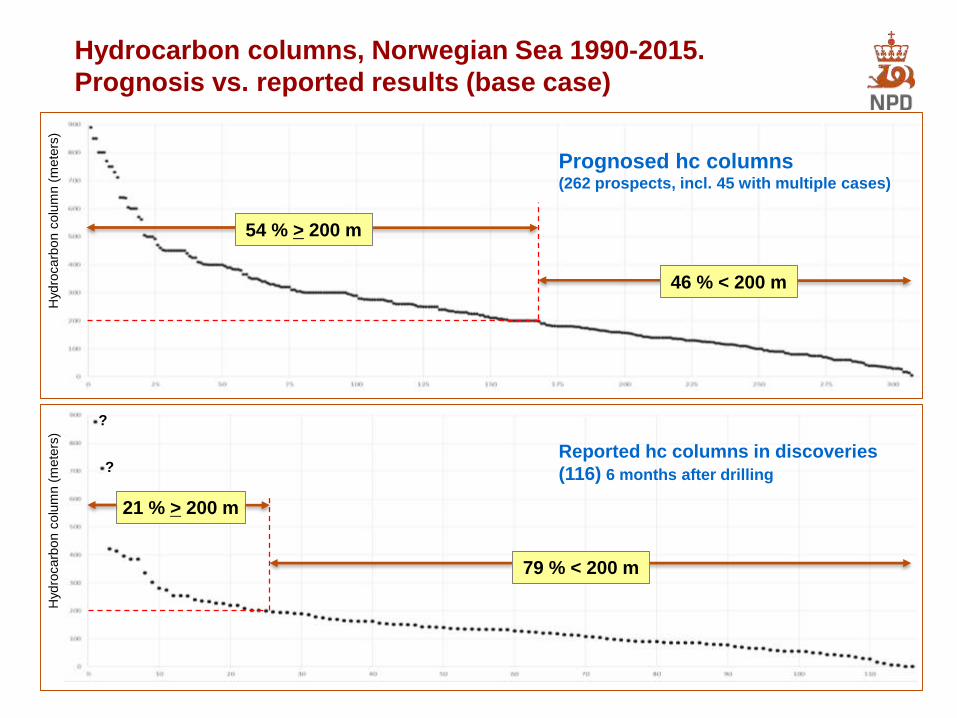
Reported hc columns in discoveries
(116) 6 months after drilling
Prognosed hc columns(262 prospects, incl. 45 with multiple cases)
Hydro
carb
on
colu
mn
(mete
rs)
Hydro
carb
on
colu
mn
(mete
rs)
Hydrocarbon columns, Norwegian Sea 1990-2015.
Prognosis vs. reported results (base case)
21 % > 200 m
46 % < 200 m
54 % > 200 m
79 % < 200 m

3: Probability of Success

20
Prospect Probability and Discovery Success
sold and
delivered
The probability of making future discoveries comprises the probabilities of a
play being confirmed (play probability) and of a prospect becoming a
discovery if the play is confirmed.
The historical finding rate for this and comparable plays is an important
parameter.

Running average success rate of last 50 wells – total and for discoveries > 1 mill. Sm3 o.e.
The last 50 wells - average success rate of 50%.
Troll I
Johan
Sverdrup
North Sea – all plays. Success rate and resource growth 1966-2016

Norwegian Sea – all plays. Success rate and resource growth 1980-2016
Running average success rate of last 20 wells – total and for discoveries > 1 mill. Sm3 o.e.
Maria, Dvalin
& 6507/5-6 S
Ormen
Lange

Barents Sea – all plays. Success rate and resource growth 1980-2016
Running average success rate of last 20 wells – total and for discoveries > 1 mill. Sm3 o.e.
Alta
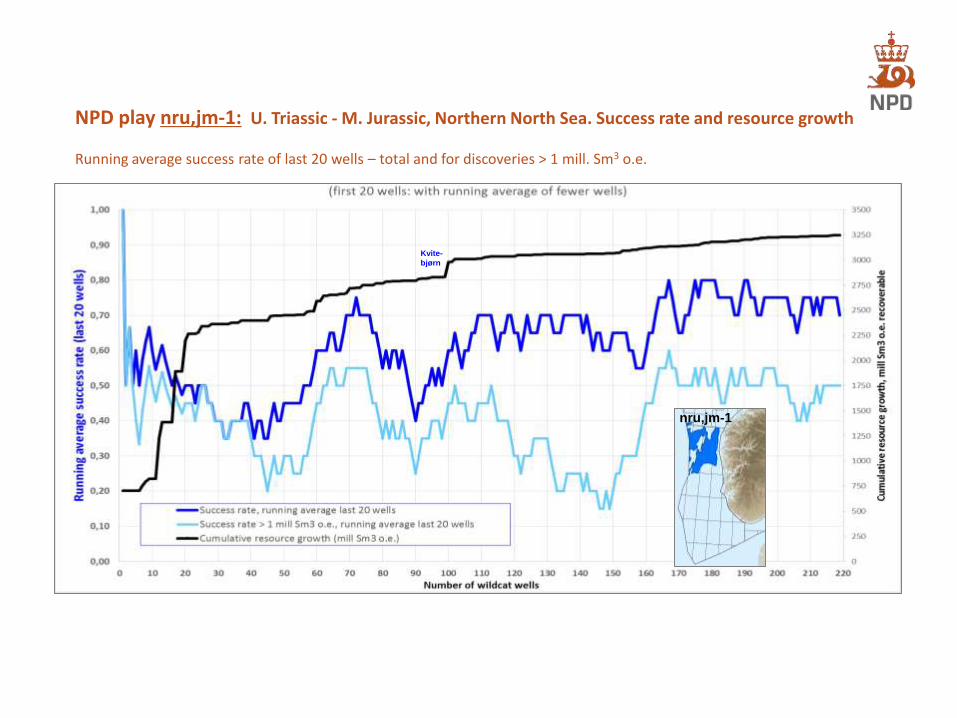
NPD play nru,jm-1: U. Triassic - M. Jurassic, Northern North Sea. Success rate and resource growth
Running average success rate of last 20 wells – total and for discoveries > 1 mill. Sm3 o.e.
Kvite-
bjørn
nru,jm-1

NPD play njl,jm-1: Late Triassic – Middle Jurassic, North Sea. Success rate and resource growth.
Running average success rate of last 20 wells – total and for discoveries > 1 mill. Sm3 o.e.
Ivar
Aasen
njl,jm-1

NPD play nhjl,jm-2: Late Triassic – Middle Jurassic, Norwegian Sea. Success rate and resource growth
Running average success rate of last 20 wells – total and for discoveries > 1 mill. Sm3 o.e.
Maria
nhjl,jm-2

27
4: Probability of phase petroleum
sold and
delivered
Evaluations of source rock and migration are used initialy to assess the
probability of proving
• oil
• gas
• combination of both (multiphase discovery).
Information from the history of discoveries is very important for assessment
in mature areas.

Plays on the Norwegian Continental Shelf
Total Confirmed Unconfirmed
North Sea 24 20 4
Norwegian Sea 21 12 9
Barents Sea 29 12 17
Total 74 41 33
Examples of some plays in the Norwegian Sea:
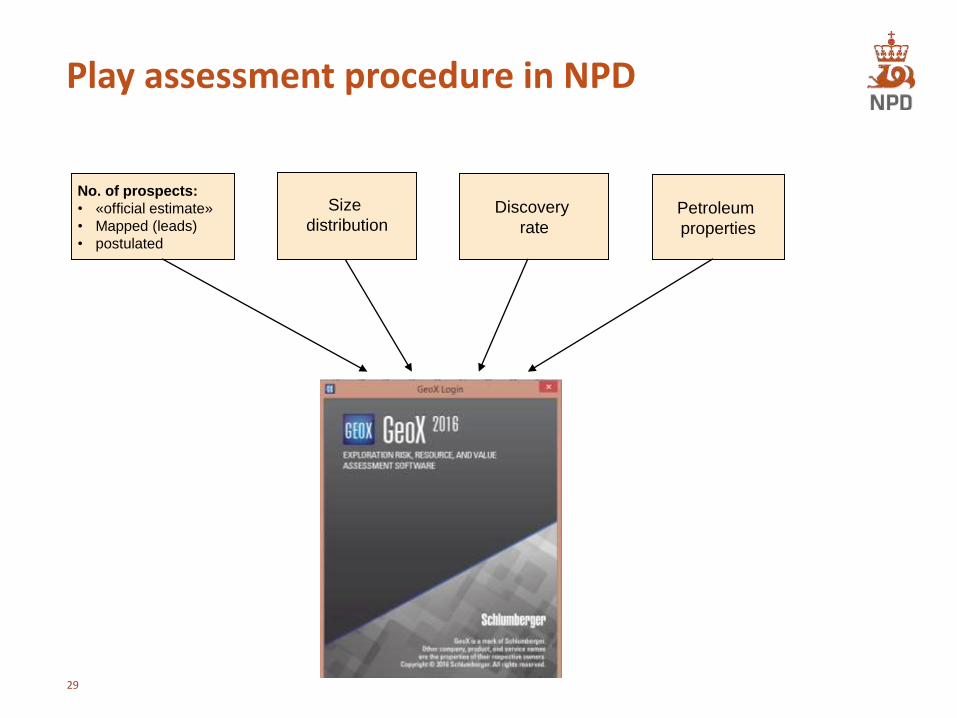
Play assessment procedure in NPD
No. of prospects:
• «official estimate»
• Mapped (leads)
• postulated
Size
distributionDiscovery
ratePetroleum
properties
29

The play analysis is assessment of both the chance that the play exist - and the YTF potential of the play
Results:• Number and size of future potential
accumulation
• HC type in potential accumulations
• Total potential petroleum volume of the play with uncertainty range
• The potential economic value of the play
• Aggregated numbers for specific regions and the entire Norwegian shelf
30

Undiscovered resources split by regions
31
41 %59 %
Barents Sea
47 %53 %
Norwegian Sea
66 %
34 %
North Sea
Gas
Liquids
2920 million Sm3 oe

Total recoverable undiscovered resources over time for each part of the NCS
32
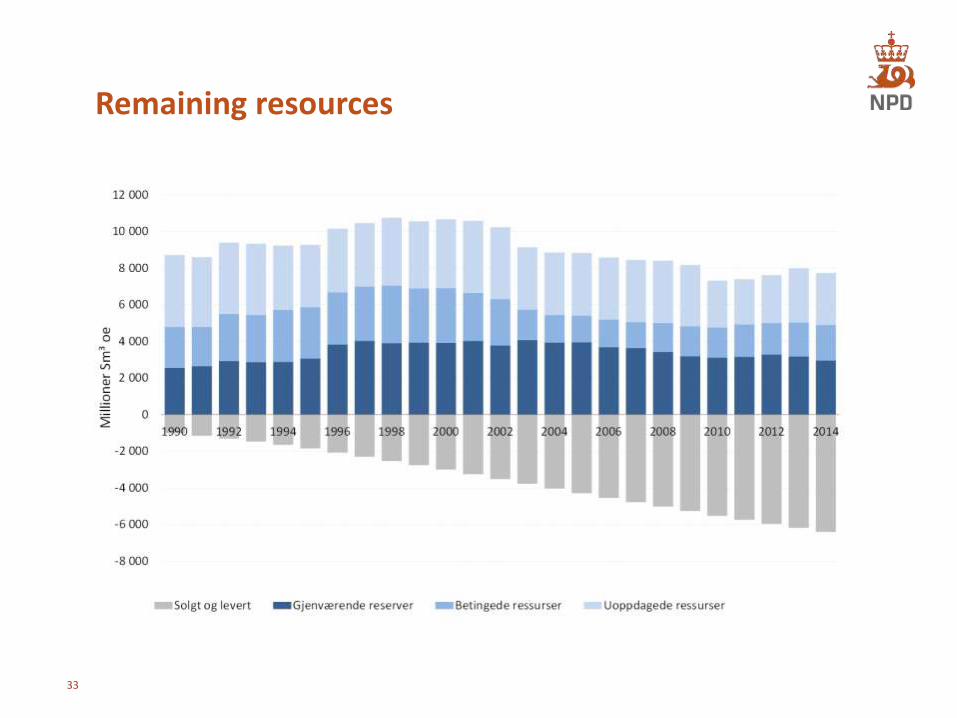
Remaining resources
33

Creaming curve for the NCS 2013-15
34

Creaming curve including undiscovered resources, Barents Sea
~100 wildcat wells
Acc
um
ula
ted
res
ou
rce
s m
illio
ns
Sm3
o.e
.
Creaming curve updated February 2015, undiscovered recources updated December 2013

Exploration failures on the Norwegian continental shelf
• Wildcats (2007 - 2016)
• Focus: dry targets and reason for failure
• North Sea: ~ 200 targets
• Norwegian Sea: ~ 100 targets
• Barents Sea: ~ 70 targets
36

All targets – trap types
Norwegian Sea North SeaBarents Sea
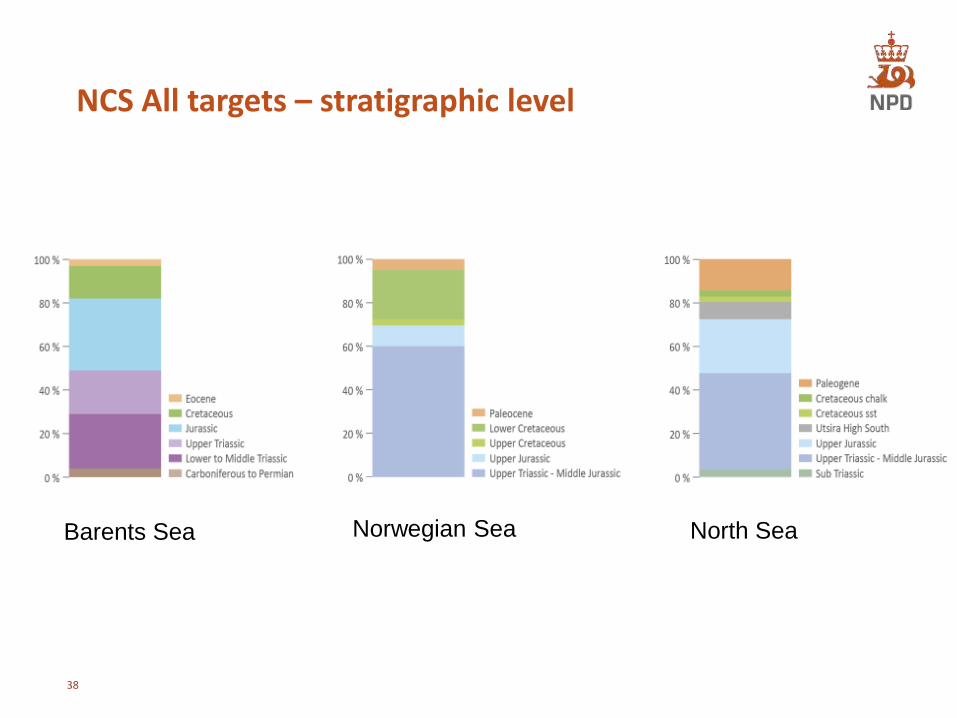
NCS All targets – stratigraphic level
38
Barents Sea Norwegian Sea North Sea

Discovered volumes in most tested targets
Barents Sea Norwegian Sea North Sea
~ 220 mill.Sm3 oe
~180 mill.Sm3 oe
~140mill.Sm3 oe

Main reasons for failure
40
North Sea Barents SeaNorwegian Sea
Presence of source
Maturity of source
Migration of HC
Presence of closure
Presence of top seal
Presence of lateral seal
Presence of reservoir
Quality of reservoir
Charge
Trap
Reservoir
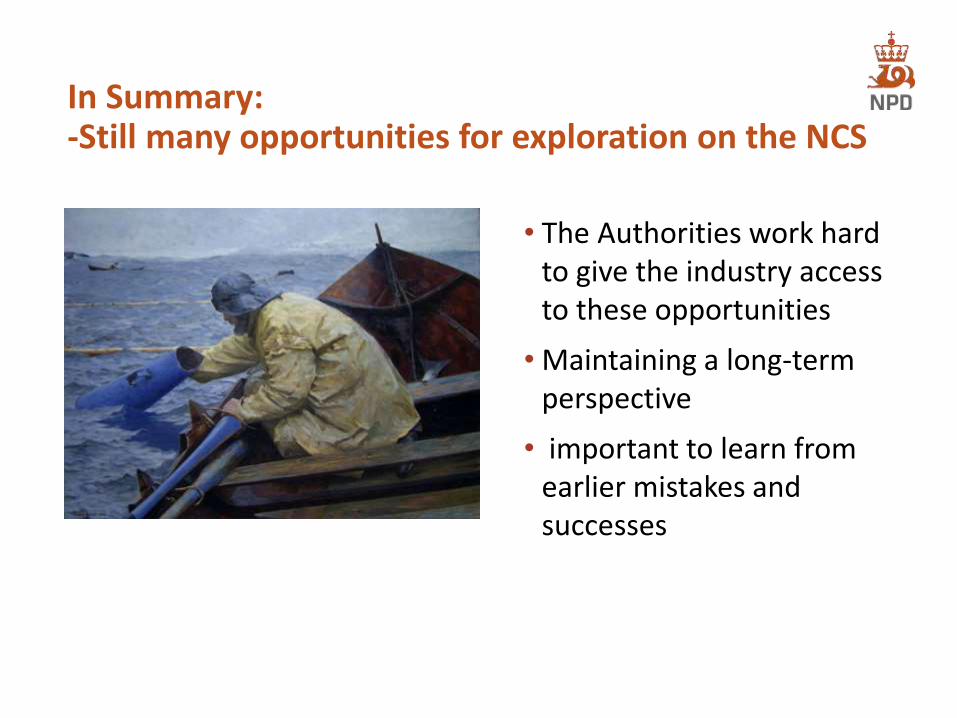
In Summary:-Still many opportunities for exploration on the NCS
• The Authorities work hard to give the industry access to these opportunities
• Maintaining a long-term perspective
• important to learn from earlier mistakes and successes

Thank you for your attention!


