a. Institut de Chimie et Procédés pour l’Energie, l’Environnement et la Santé (ICPEES), UMR 7515, CNRS-Université de Strasbourg (UdS), 25, rue Becquerel, 67087 Strasbourg Cedex 08, France
b. Institut de Physique et Chimie des Matériaux de Strasbourg (IPCMS), UMR 7504, CNRS-Université de Strasbourg (UdS), 23, rue du Loess, 67034 Strasbourg Cedex 02, France
β-SiC was synthesized via a gas-solid reaction between SiO vapor and dispersed solid
carbon. The detailed synthesis of the SiC-based materials was summarized in recent reviews. 1,
2 The supports were prepared by pore volume impregnation of the high porosity β-SiC with an
ethanol solution of Ti(iOC3H7)4. After impregnation, the samples were allowed to dry at room
temperature for 4 h and then oven-dried at 110 oC in air for 8 h. The transformation of the
titanium precursor into TiO2 crystalline phase is performed by calcination of the sample in air
at 600 °C for 5 h with a heating rate of 2 °C/min. The supports are noted xTiO2-SiC with x
representing the loading of TiO2 on the SiC carrier (5 wt. %, 10 wt. % and 15 wt. %) and
marked as TS-C5, TS-C10 and TS-C15 where C means coated catalyst. The titania decorated
β-SiC was synthesized by mixing microsized silicon powder and TiO2 nanoparticles with a
carbon-containing resin.3 The mixture was further carbonized at 1300 oC under an argon
atmosphere, the obtained TiO2-doped SiC material was named as TS-D where D means doped
catalyst.
Co3O4/xTiO2-SiC catalyst preparation
The cobalt was deposited onto the TiO2 coated SiC support (TS-C10, 10 wt. % TiO2) by
pore volume impregnation with cobalt nitrate (Arcros) solution. The cobalt loading was kept
at 10 wt. % with respect to the support weight which is the lower range of cobalt loading
according to the literature and patent survey.4, 5 After impregnation the solid was allowed to
dry at room temperature for 4 h and then oven-dried at 110 oC for 8 h and calcined at 350 oC
(heating rate of 1 oC·min-1) for 2 h in order to obtain the Co3O4/TS-C10 catalyst precursor.
The oxide form of the cobalt was further reduced in flowing hydrogen (30 mL·min-1·gcat-1) at
300°C for 6 h, to obtain the metallic ones. The obtained catalyst was noted as 10CTS-C10.
The TiO2 doped SiC supported cobalt catalyst and SiC-supported cobalt catalyst without TiO2
were prepared following by the same process, and noted as 10CTS-D and 10CS, respectively.
High loading cobalt catalyst (30 wt %) was also prepared by the same process mentioned
above, and noted as 30CTS-C10.
Characterization techniques
X-ray diffraction (XRD) measurements were carried out in a Bruker D-8 Advance
diffractometer equipped with a Vantec detector. The powdered sample was packed onto a
glass slide. ASTM powder diffraction files were used to identify the phase present in the
sample. Crystallite sizes were calculated from line broadening using the Scherrer equation.
The specific surface area of the support and the catalyst, after reduction, were determined
in a Micromeritics sorptometer. Before analysis the sample was outgassed at 250 °C under
vacuum for 8 h in order to desorb moisture and adsorbed species on its surface. The
measurements were carried out using N2 as adsorbent at liquid N2 temperature at relative
pressures between 0.06 and 0.99.
Scanning electron microscopy (SEM) analyses were carried out on a JEOL 6700F
microscope working at 10 kV accelerated voltage. The solid was fixed on the sample holder
by a graphite paste for examination. Before analysis the sample was covered by a thin layer of
gold in order to avoid charging effect.
TEM tomography was done on a JEOL 2100 F (FEG) electron microscope operating at a
beam voltage of 200 kV, using a 2048 × 2048 pixels Ultrascan cooled CCD array detector,
and a high tilt sample holder. The sample preparation for classical and tomography TEM was
done according to the following process: the solid was crushed in a mortar into a very fine
powder. The powder was then dispersed in ethanol by sonication during 5 min. After
sonication a drop of the solution was deposited on a holey carbon copper grid and the solvent
was evaporated at room temperature before introducing of the sample holder into the
microscope chamber.
59Co NMR experiments were performed in a home-made zero magnetic field at a
temperature of 2, 4.2 and 77K. The integrated spin-echo intensity was recorded every 0.61
MHz using a coherent pulsed NMR spectrometer with phase-sensitive detection and
automated frequency scanning. The NMR spectra were taken at five different values of the
excitation RF field, covering a range over more than one order of magnitude. Such a
procedure allowed us to determine the optimum excitation field at each frequency and to
correct for the variation of the local electronic susceptibility and thus of the NMR
enhancement factor as a function of frequency. After this a further correction for the usual2
frequency dependence of the NMR signal was applied. The NMR amplitudes obtained in such
a way represent the true distribution of nuclei with a given HF. Detailed description of the
technique can be found in the literature.6, 7 The analysis was performed on both fresh and
spent catalysts; this later was covered with a homogeneous solid waxes layer, in order to
prevent any surface oxidation of the cobalt phase during air exposure.
Fischer-Tropsch synthesis reaction
The Fischer-Tropsch synthesis reaction was carried out in a tubular fixed-bed stainless
steel reactor (I.D. = 6 mm) with circulating silicon oil as heating source. The reduced catalyst
(5 g, in a grain form with an average size between 150 to 400 µm) was hosted between quartz
wool plugs in the middle of the reactor. The reactor pressure was slowly increased from 0.1 to
4 MPa (ramping rate of 1 MPa·h-1) under argon. The total pressure was controlled by a back
pressure regulator (MFI Ltd.). At 4 MPa the reactor temperature was raised from room
temperature to the desired reaction temperature (heating rate of 2°C·min-1). Then, the argon
flow was replaced by a 50:50 v:v mixture of synthesis gas and argon (CO:H2 = 1:2). The
catalyst was activated under a synthesis gas-argon mixture with different synthesis gas
concentrations during three days before evaluation under pure synthesis gas conditions. The
catalyst bed temperature was monitored with a thermocouple (Ø 0.3 mm) inserted inside a
stainless steel finger (Ø 1 mm) passing through the catalyst bed. The products were condensed
in two high pressure traps maintained at 85°C and 15°C respectively. The exit gas was
analyzed on-line, both by Thermal Conductivity Detector (TCD) and Flame Ionization
Detector (FID), with a gas chromatography (GC Varian 3800 equipped with a DP-1 and
Carbobond capillary columns).
The liquid hydrocarbon phase and water were condensed in the traps and were analyzed
off-line at the end of the test. The water was removed from the organic phase by decantation
of the system. A known amount (100 mg) of the organic phase, liquid hydrocarbons and waxy
products, was dissolved in 3 mL of dichloromethane under sonication during 30 minutes.
Then, 20 mL of CS2 were further added to the solution in order to ensure the complete
dissolution of the organic phase. For analysis, 1 µL of the solution was injected in a GC
apparatus equipped with a Simdist column operated at 400 °C which allowed the detection of
hydrocarbons from C9 to C70.
20 30 40 50 60 70 80 (2
11)
(105
)
(200
) (101
)
(113
)
(202
)
(002
) (1
11)
d c
b
a
Inte
nsity
(a.u
.)
Two theta (degree)
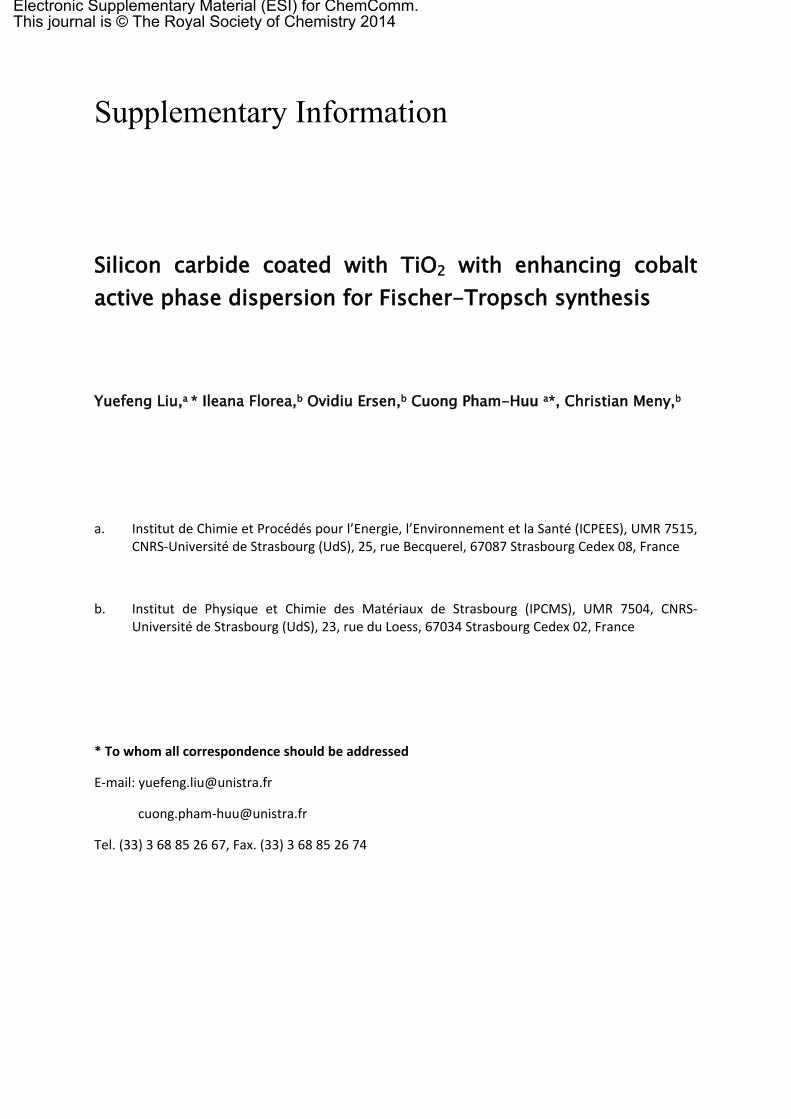
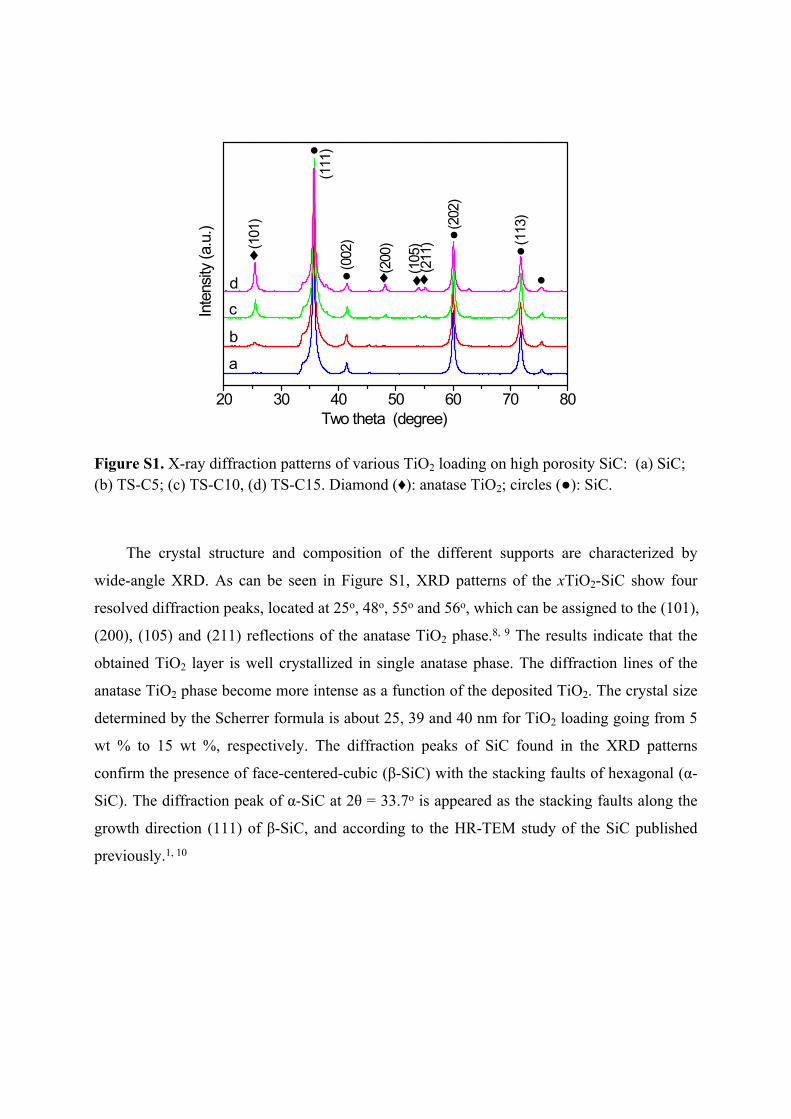
Figure S1. X-ray diffraction patterns of various TiO2 loading on high porosity SiC: (a) SiC; (b) TS-C5; (c) TS-C10, (d) TS-C15. Diamond (♦): anatase TiO2; circles (●): SiC.
The crystal structure and composition of the different supports are characterized by
wide-angle XRD. As can be seen in Figure S1, XRD patterns of the xTiO2-SiC show four
resolved diffraction peaks, located at 25o, 48o, 55o and 56o, which can be assigned to the (101),
(200), (105) and (211) reflections of the anatase TiO2 phase.8, 9 The results indicate that the
obtained TiO2 layer is well crystallized in single anatase phase. The diffraction lines of the
anatase TiO2 phase become more intense as a function of the deposited TiO2. The crystal size
determined by the Scherrer formula is about 25, 39 and 40 nm for TiO2 loading going from 5
wt % to 15 wt %, respectively. The diffraction peaks of SiC found in the XRD patterns
confirm the presence of face-centered-cubic (β-SiC) with the stacking faults of hexagonal (α-
SiC). The diffraction peak of α-SiC at 2θ = 33.7o is appeared as the stacking faults along the
growth direction (111) of β-SiC, and according to the HR-TEM study of the SiC published
previously.1, 10
1000 800 600 400 200 0
TS-C10 SiC
Ti 3
pTi
3s
Ti 2
s
Si 1
sSi
2p
Ti 2p
C 1s
O1s
Inte
nsity
(a.u
.)
Binding Energy (eV)
470 465 460 455
Ti 2p
Inte
nsity
(a.u
.)
Binding Energy (eV)
465.6
459.9
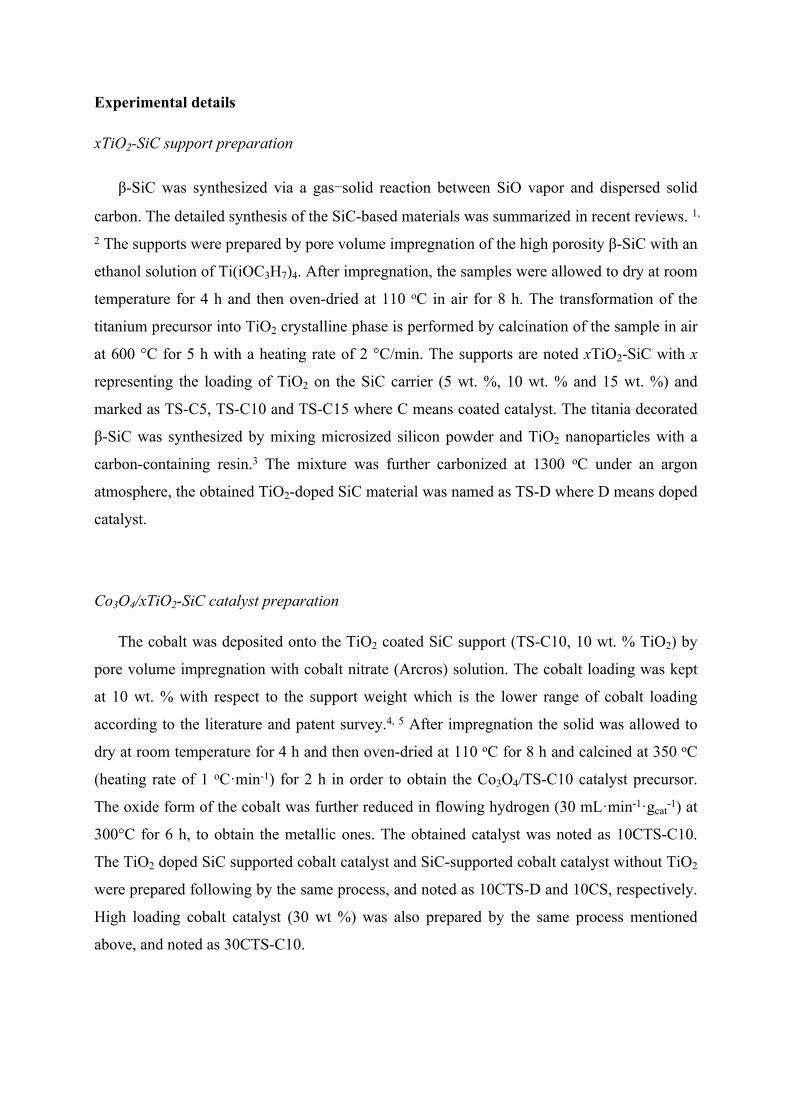
Sample Ti/Si ratio O/C ratio
SiC - 32/68TS-C10 27/73 62/38
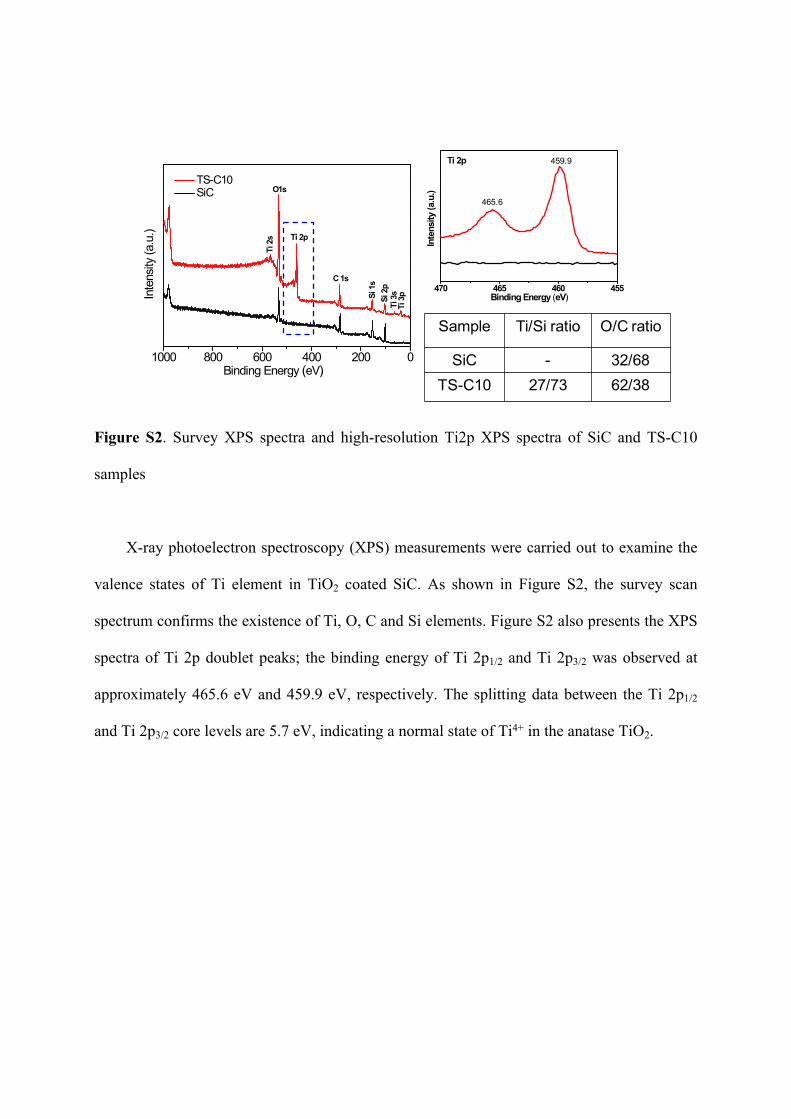
Figure S2. Survey XPS spectra and high-resolution Ti2p XPS spectra of SiC and TS-C10
samples
X-ray photoelectron spectroscopy (XPS) measurements were carried out to examine the
valence states of Ti element in TiO2 coated SiC. As shown in Figure S2, the survey scan
spectrum confirms the existence of Ti, O, C and Si elements. Figure S2 also presents the XPS
spectra of Ti 2p doublet peaks; the binding energy of Ti 2p1/2 and Ti 2p3/2 was observed at
approximately 465.6 eV and 459.9 eV, respectively. The splitting data between the Ti 2p1/2
and Ti 2p3/2 core levels are 5.7 eV, indicating a normal state of Ti4+ in the anatase TiO2.
A
100 μm Si Ti
B CC
ount
s
D
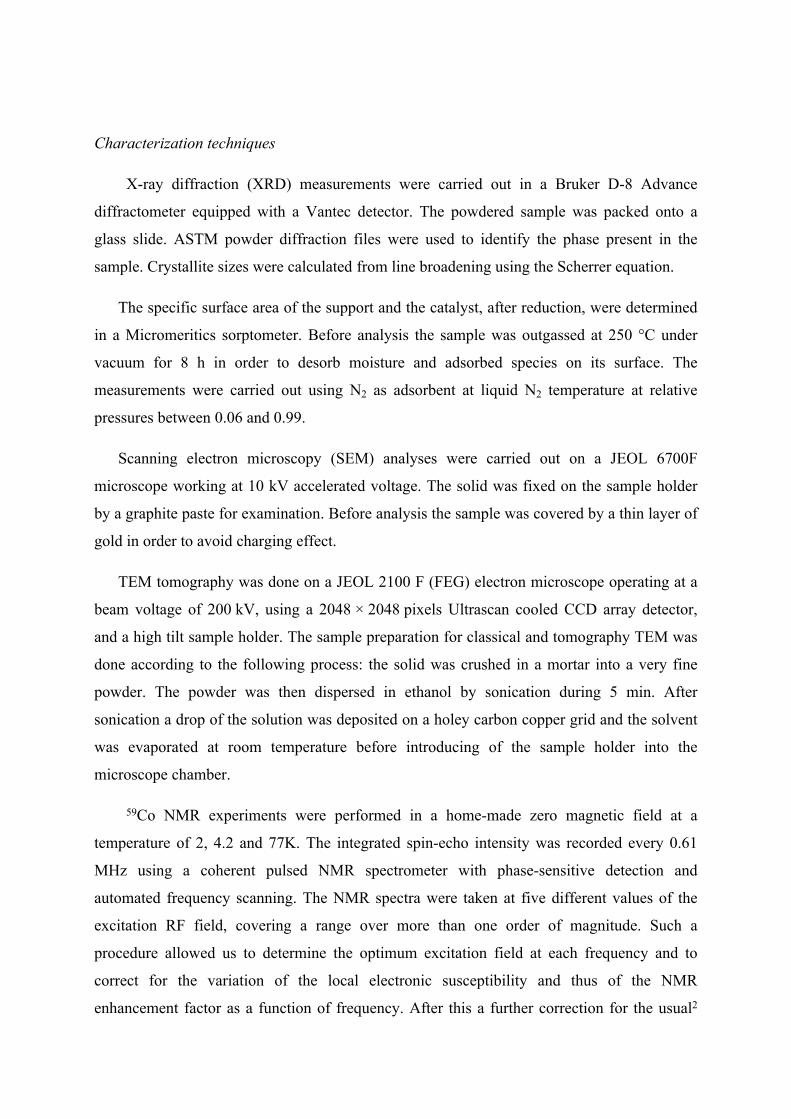
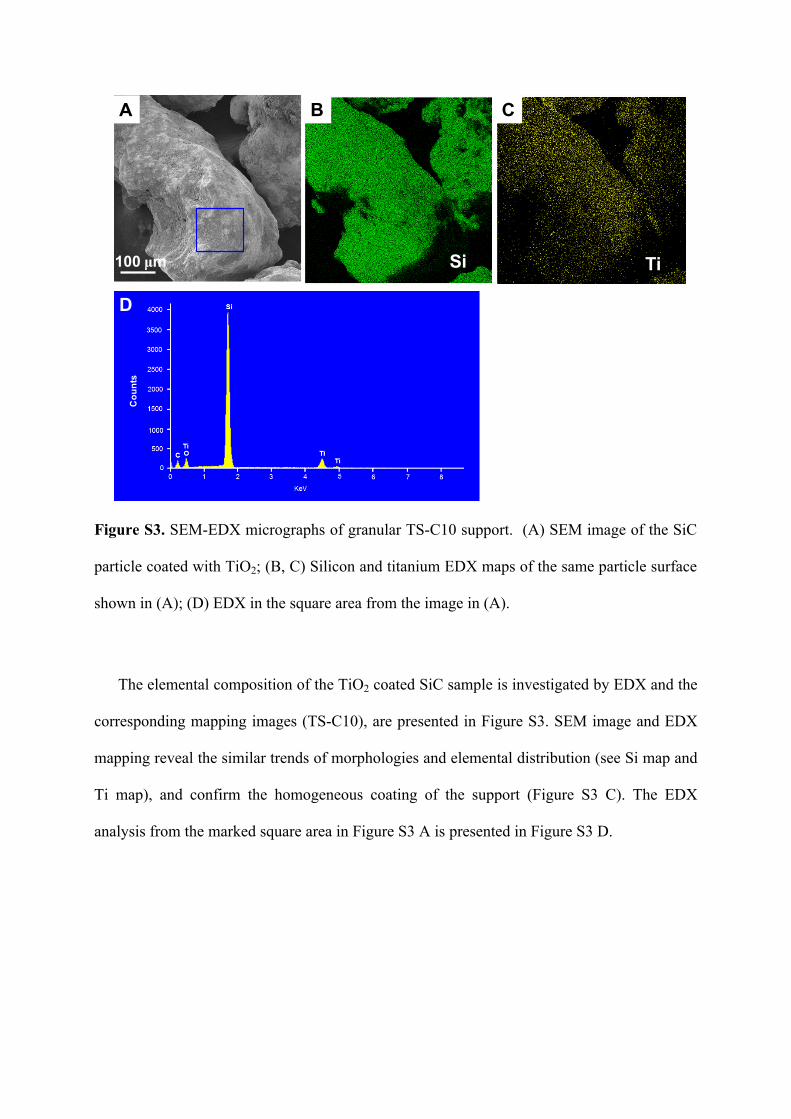
Figure S3. SEM-EDX micrographs of granular TS-C10 support. (A) SEM image of the SiC
particle coated with TiO2; (B, C) Silicon and titanium EDX maps of the same particle surface
shown in (A); (D) EDX in the square area from the image in (A).
The elemental composition of the TiO2 coated SiC sample is investigated by EDX and the
corresponding mapping images (TS-C10), are presented in Figure S3. SEM image and EDX
mapping reveal the similar trends of morphologies and elemental distribution (see Si map and
Ti map), and confirm the homogeneous coating of the support (Figure S3 C). The EDX
analysis from the marked square area in Figure S3 A is presented in Figure S3 D.
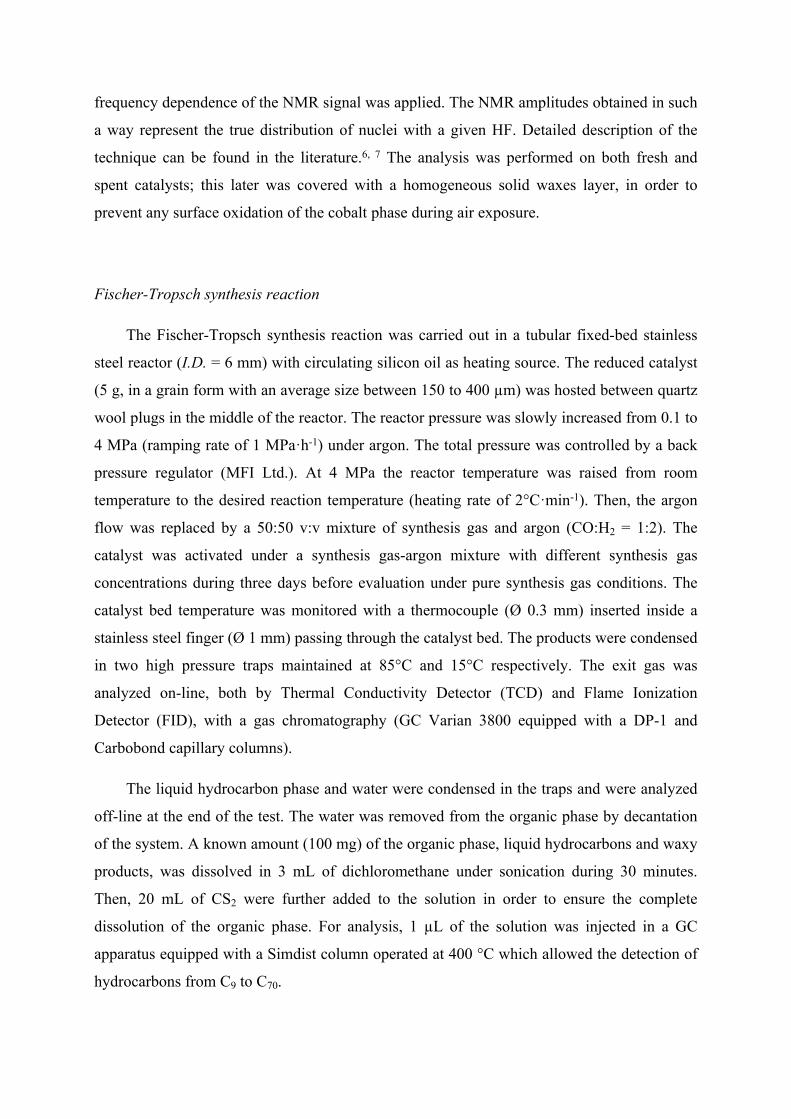
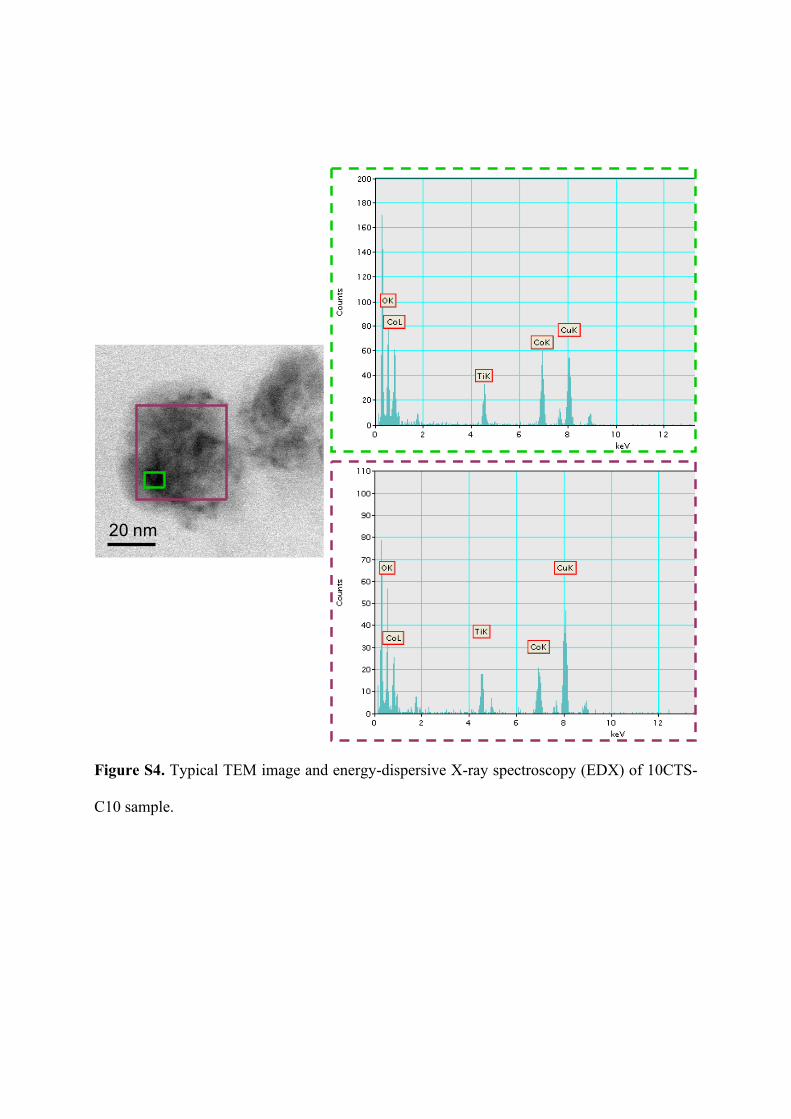
20 nm
Figure S4. Typical TEM image and energy-dispersive X-ray spectroscopy (EDX) of 10CTS-
C10 sample.
40 42 44 46 48 50
c
a
d
b
SiC CoOCo fcc Co hcp TiO2anatase
In
tens
ity (a
.u.)
Two theta (degree)Figure S5. Ex situ X-ray diffraction patterns of prepared catalysts: (a) 10CS ; (b) 10CTS-C5; (c) 10CTS-C10 and (d) 10CTS-C15
The XRD patterns of the cobalt supported on the SiC-based catalysts are presented in
Figure S5. Before XRD experiments, the catalysts were reduced under hydrogen at 300 °C for
6 h. The 10Co/SiC catalyst only displays diffraction lines corresponding to the SiC support
and metallic cobalt phase. The absence of diffraction lines corresponding to the cobalt oxide
phases confirms the complete reduction of the cobalt phase. A similar reduction pattern is also
observed on the TiO2 coated catalysts. However, a diffraction line appears at around 42.5° on
the catalyst with 15 wt. % of TiO2, which could be assigned to a CoO phase. Such results
seem to indicate that at high TiO2 loading some hardly reducible phase of cobalt was formed
after reduction of the catalyst.
0
2
4
6
8
10
15 wt.%10 wt.%5 wt.%
TiO2 content
CoTY
(10
-5 m
olco
g Co-1
s-1
0 wt.%0
20
40
60
80
100
C 5+ se
lect
ivity
(%)
Figure S6. FTS activity and C5+ selectivity as functions of time on stream on various TiO2 loading on catalysts. Reaction conditions: H2/CO molar ratio = 2, reaction temperature = 215 °C, total pressure = 40 bar, GHSV (STP) = 60 ml·gcat
-1·min-1.
The CO conversion, cobalt time yield (CoTY, ×10-5 molcogCo-1s-1) and C5+ selectivity
obtained on cobalt supported on TiO2 coated SiC with different titania content, i.e. 5%
(10CTS-C5), 10% (10CTS-C10) and 15% (10CTS-C15), are shown in Figure S6. The same
cobalt catalyst supported on SiC without TiO2, noted Co/SiC, is also plotted in the same
figure to compare the catalytic performance obtained under the same reaction conditions. The
introduction of TiO2 in the support leads to a considerable improvement of the catalyst
activity for the reaction of FTS. The cobalt time yield increases from 4.0 to 4.9 molcogCo-1s-1
over the 10CTS-C5 catalyst promoted with 5 wt% TiO2 comparing to TiO2-free catalyst. The
CoTY of 8.2 molcogCo-1s-1 is obtained on the 10CTS-C10 at 215 oC. When the TiO2 loading
increases up to 15%, the cobalt time yield decreases to 5.2 molcogCo-1s-1. This decay of the
FTS activity as increasing the TiO2 loading could be attributed to an increase of the metal-
support interaction between the TiO2 and the cobalt precursor which contributes to lower
cobalt dispersion. The increase of the FTS catalytic activity is accompanied by a slight
decrease of selectivity for liquid hydrocarbons. The C5+ selectivity decreases from 95% for an
unpromoted catalyst to about 92% for the promoted catalyst loaded with 10% of TiO2.
10 20 30 40 50
1.6
2.4
3.2
4.0
Carbon number (n)
Log
(Wn/n
) α = 0.88
Figure S7. Anderson-Schulz-Flory plots for 30CTS-C10 catalyst on realistic FTS reaction
conditions. Reaction conditions: H2/CO molar ratio = 2, reaction temperature = 240 °C, total
pressure = 40 bar, GHSV (STP) = 320 mL·gcat-1·min-1, total pressure = 40 bar, 1.25 g catalyst
diluted with 3.75g SiC.
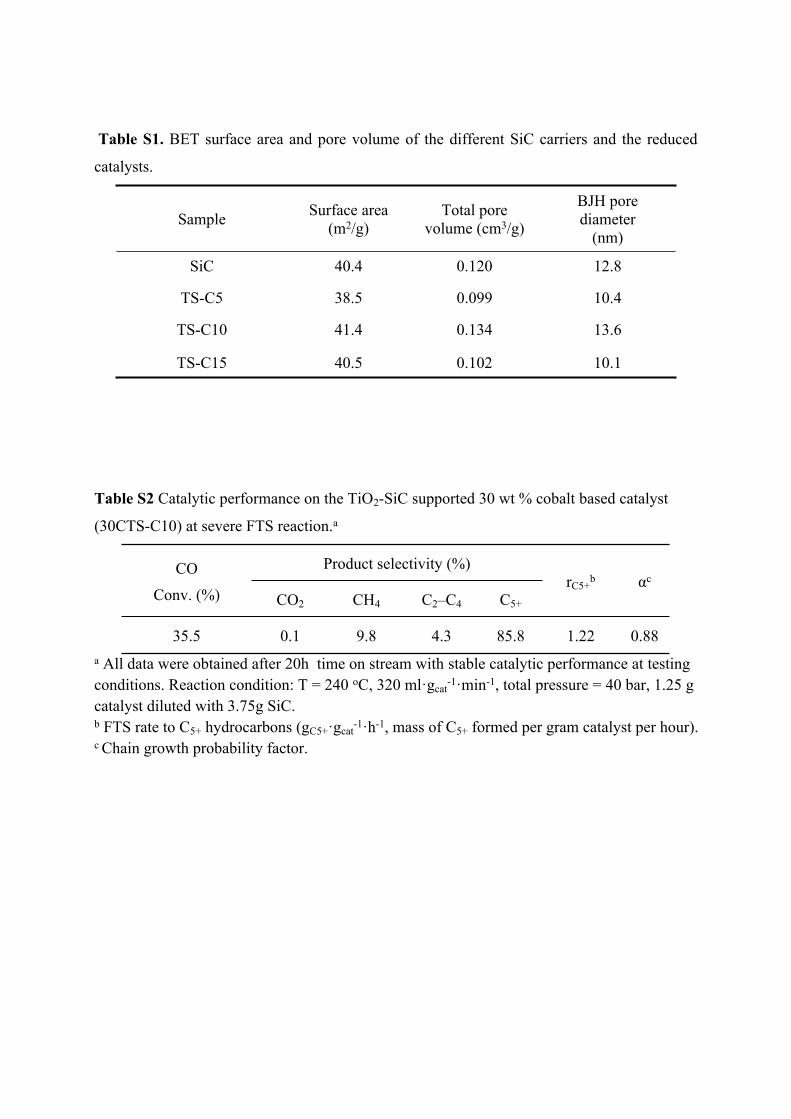
Table S1. BET surface area and pore volume of the different SiC carriers and the reduced
catalysts.
Sample Surface area (m2/g)
Total pore volume (cm3/g)
BJH pore diameter
(nm)
SiC 40.4 0.120 12.8
TS-C5 38.5 0.099 10.4
TS-C10 41.4 0.134 13.6
TS-C15 40.5 0.102 10.1
Table S2 Catalytic performance on the TiO2-SiC supported 30 wt % cobalt based catalyst
(30CTS-C10) at severe FTS reaction.a
Product selectivity (%)CO
Conv. (%) CO2 CH4 C2–C4 C5+
rC5+b αc
35.5 0.1 9.8 4.3 85.8 1.22 0.88a All data were obtained after 20h time on stream with stable catalytic performance at testing conditions. Reaction condition: T = 240 oC, 320 ml·gcat
-1·min-1, total pressure = 40 bar, 1.25 g catalyst diluted with 3.75g SiC. b FTS rate to C5+ hydrocarbons (gC5+·gcat
-1·h-1, mass of C5+ formed per gram catalyst per hour).c Chain growth probability factor.
Reference
1. P. Nguyen and C. Pham, Appl Catal a-Gen, 2011, 391, 443-454.2. Y. F. Liu, O. Ersen, C. Meny, F. Luck and P. H. Cuong, Chemsuschem, 2014, 7, 1218-1239.3. Y. Liu, B. de Tymowski, F. Vigneron, I. Florea, O. Ersen, C. Meny, P. Nguyen, C. Pham, F. Luck
and C. Pham-Huu, ACS Catalysis, 2013, 3, 393-404.4. R. Oukaci, A. H. Singleton and J. G. Goodwin, Appl Catal a-Gen, 1999, 186, 129-144.5. F. Diehl and A. Y. Khodakov, Oil Gas Sci Technol, 2009, 64, 11-24.6. C. Meny and P. Panissod, ed. G. A. Webb, Springer, Heidelberg, Germany 2006.7. P. Panissod and C. Meny, Appl Magn Reson, 2000, 19, 447-460.8. B. Jongsomjit, T. Wongsalee and P. Praserthdam, Mater Chem Phys, 2006, 97, 343-350.9. J. Y. Shen, H. Wang, Y. Zhou, N. Q. Ye, G. B. Li and L. J. Wang, Rsc Adv, 2012, 2, 9173-9178.10. N. Keller, C. Pham-Huu, M. J. Ledoux, C. Estournes and G. Ehret, Appl Catal a-Gen, 1999, 187,