The global primary energy demand will increase by 1.4 times in 2050. The net increase in energy demand can be entirely attributable to non-OECD. In OECD, decoupling between growth of the GDP and energy consumption proceeds. 63% of the increment come from China, India and the ASEAN countries. Share of Asia in the global primary energy demand will increase from 41% to 48%.
❖ Primary energy demand vs. real GDP ❖ Change in energy demand(2016-2050)
60% of the increment in the primary energy demand will be consumed for power generation. The global electricity demand will double in 2050, and 60% of the increment will occur in Asia. In Asia, electrification rate will increase to 30% in 2050, and 40% of electricity demand will be
covered by coal, which can be obtained plentifully and inexpensively. Except for Asia, natural gas-fired power generation will be applied more than the coal-fired.
❖ Change in electricity generation(2016-2050)
❖ Electricity demand and electrification rate
Asia Non-Asia
Electrification rateElectrification rate
* Electrification rate: Share of electricity in the final energy consumption
Sixty percent of the growth in electricity demand will be met by thermal power generation, especially natural gas. Asia leads the large global increase in fossil fuels required for power generation as well as for transportation. The high dependence on fossil fuels remains unchanged and energy related CO2 emissions increase by 34% by 2050.
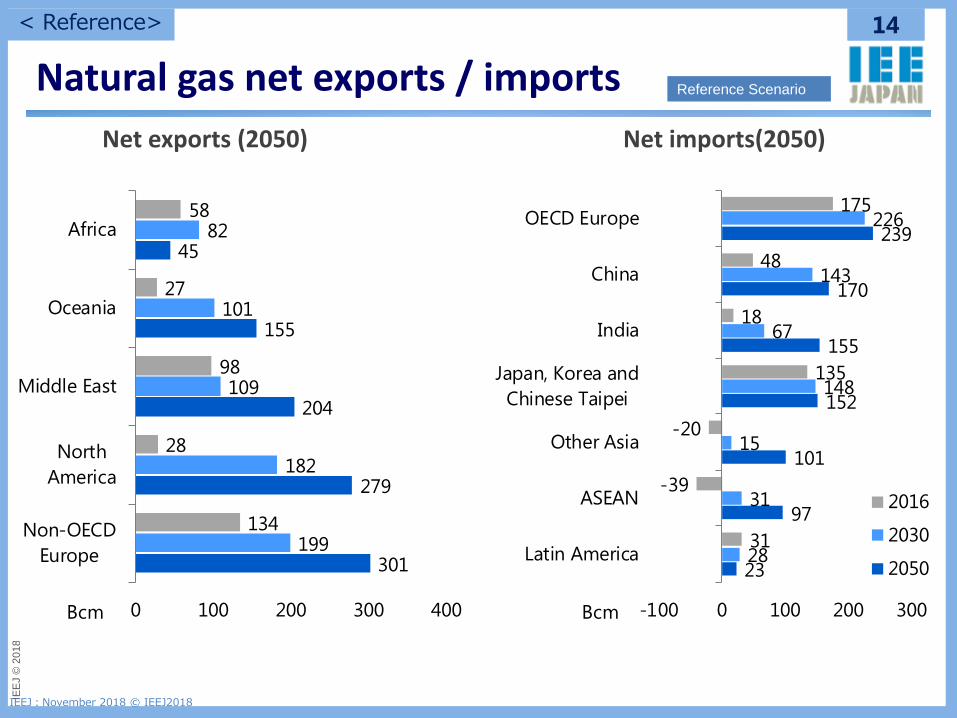
Energy imports of Asia will increase dramatically. 80% of energy traded globally will be consumed in Asia. United States will be a net exporter in the middle of the 2020s. Self-sufficiency rate in Asia will decrease from 72% to 63%. This tendency is remarkable for
ASEAN, which will be a net importer in the first half of the 2020s.
Self-sufficiency rate of oil will decrease from 28% to 14%, due to increase of consumption for transportation. Self-sufficiency rate of natural gas will also decrease remarkably.
Self-sufficiency rate of coal will be maintained at a level of 80%. The amount of oil import will increase remarkably, and the total amount of energy import will grow
from 1.6% to 3.0% against the GDP (from 0.9% to 5.2% in the ASEAN).
Increase of oil import spending in Asia❖ China ❖ ASEAN❖ India
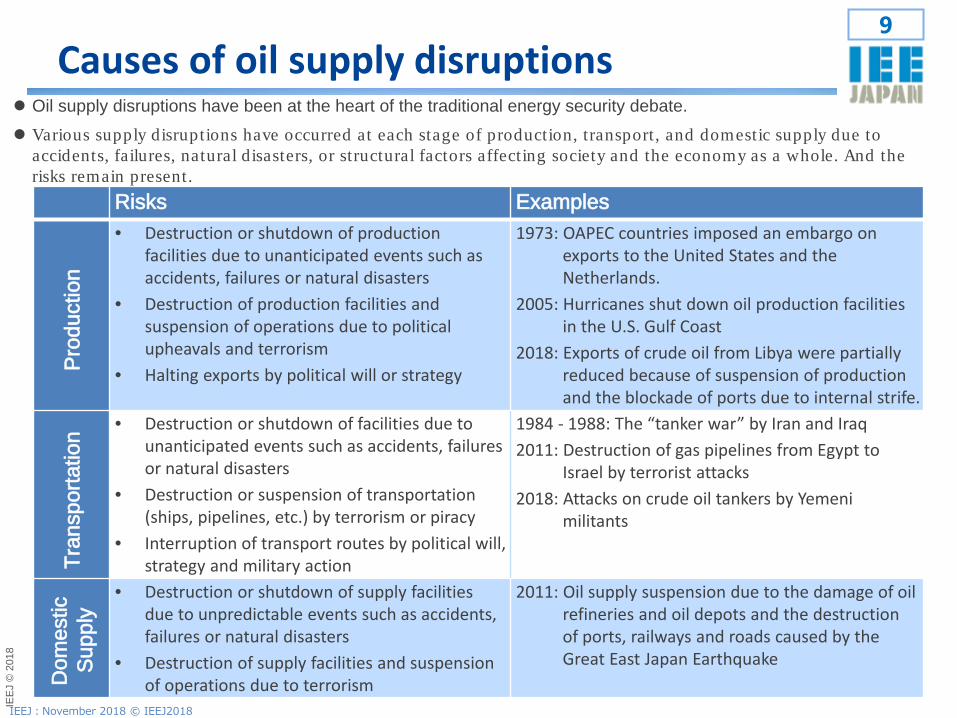
Causes of oil supply disruptions Oil supply disruptions have been at the heart of the traditional energy security debate. Various supply disruptions have occurred at each stage of production, transport, and domestic supply due to
accidents, failures, natural disasters, or structural factors affecting society and the economy as a whole. And the risks remain present.
Risks Examples
Pro
duct
ion
• Destruction or shutdown of production facilities due to unanticipated events such as accidents, failures or natural disasters
• Destruction of production facilities and suspension of operations due to political upheavals and terrorism
• Halting exports by political will or strategy
1973: OAPEC countries imposed an embargo on exports to the United States and the Netherlands.
2005: Hurricanes shut down oil production facilities in the U.S. Gulf Coast
2018: Exports of crude oil from Libya were partially reduced because of suspension of production and the blockade of ports due to internal strife.
Tran
spor
tatio
n • Destruction or shutdown of facilities due to unanticipated events such as accidents, failures or natural disasters
• Destruction or suspension of transportation (ships, pipelines, etc.) by terrorism or piracy
• Interruption of transport routes by political will, strategy and military action
1984 - 1988: The “tanker war” by Iran and Iraq2011: Destruction of gas pipelines from Egypt to
Israel by terrorist attacks2018: Attacks on crude oil tankers by Yemeni
militants
Dom
estic
S
uppl
y
• Destruction or shutdown of supply facilities due to unpredictable events such as accidents, failures or natural disasters
• Destruction of supply facilities and suspension of operations due to terrorism
2011: Oil supply suspension due to the damage of oil refineries and oil depots and the destruction of ports, railways and roads caused by the Great East Japan Earthquake
Tight supply -demand balance and shortage of OPEC spare capacity
Relatively calm market condition thanks to production increase from Saudi Arabia, etc.
Oversupply due to economic slowdown
Oil
pric
e 80-100$/bbl or more depending on circumstances
70-80$/bbl 50$/bbl
Oth
er e
nerg
y
LNG demand decline with the rise of prices.Coal becomes more competitive.
-
Lower LNG price materialise potential demand. FIDs of new liquefaction plans are postponed.
Scenario AScenario B-1
Muddle through
Scenario B-2 Trade/economic confrontation
Iranian oil exports become zero by US sanctions?
Conflicts between US and EU or China become
stronger?
Yes No
YesNo
Key result of scenario analysis on the impacts, up around 2020, of US re-imposit ion of economic sanctions against Iran.
In the scenario where Iranian crude oil exports (about 2.5 Mb/d) are totally eliminated, oil prices rise due to shortage of OPEC spare capacity.
In the scenario where trade friction start ing from US escalates, world ’s economic slowdown relaxes oil supply-demand, and eventually pushes down oil prices.
❖ Points of the scenario analysis
Source: IEEJ, Scenario analysis on the impacts of sanctions against Iran on international oil market, August 2018
New threat for power supplyThe increasing dependence on a specific energy sourceWhile regions which depend on gas -fired power generation have increased in the United
States and natural gas is supplied by pipeline, the supply risk caused by natural gas supply disruption becomes more evident.
The “duck curve ” of net load due to the expansion of solar PV In California and Japan where introduction of solar PV power generation is expanding,
the duck curve of net load which the peak load comes twice a day is progressing. Requirement for electricity supply capacity is increasing that can follow, particularly, steep rise of electricity demand from daytime to early evening.
The shutdown of power plants due to economic feasibility There is a risk of unexpected large-scale closure of power generation capacity in the short
term due to its economic feasibility. In the United States, during 2012 to 2017, large capacities (coal-fired: 55 GW, gas-fired: 36 GW, nuclear: 5 GW) were closed due to unfavourable market condition. Unbundled power business structure is challenging the transmission system operator or the reliability assessment organisation to capture such plans.
Cyber attacks In Ukraine, power outage occurred due to cyber attacks in December 2015 and December
2016. Power system control was hacked and ended up power outage. When capacity of virtual power plants (VPPs), connecting distributed power generators via open network, increases in the future, cyber attacks can possibly risk VPP system.
(Source) Agency for Natural Resources and Energy, METI(Ministry of Economy, Trade and Industry), Document 3 “Global Warming” p. 3 at 6th Round Table for Studying Energy Situations (Feb. 19, 2017)
Further CO2 reductions fromAdvanced Technologies Scenario❖ Energy -related CO 2 emissions
1) CO2-free hydrogen (refer to Asia/World Energy Outlook 2016)• Hydrogen -fired power generation: 1 GW x 3,000 units• Fuel cell vehicles: 1 billion units(H2 demand of 800 Mt/yr corresponds 3 times of today ’s LNG)
2) Negative -emission technology• BECCS(Biomass-fired power generation ): 0.5 GW x 2,800 units(Fuel supply of 2,000 Mtoe/yr needs land of 2.85 million km 2)
3) Zero -emission power generation and factories with CCS-10 GtCO2 (Maximum reduction volume by substituting for
thermal power generation without CCS)• SPS: 1.3GW x 2,300 units
or • HTGR: 0.275 GW x 8,700 unitsor • Nuclear fusion reactor: 0.5 GW x 4,500 unitsor • Thermal power generation with CCS: 2,800 GW
(Estimated CO2 storage potential is over 7,000 Gt)
+-1 GtCO2• CCS: Installed in 20% of factories and plants(iron & steel, cement, chemicals, pulp & paper, refinery and GTL/CTL)
❖ Examples of technologies for further reductions
* Emissions path reflected “RCP 2.6” in the 5th Assessment Report (AR5) by the Intergovernmental Panel on Climate Change (IPCC).
Molecules to electrons Energy transition includes shifting away from fossil fuels to electricity. High hopes are placed on hydrogen as a carrier of zero-carbon energy. Hydrogen can be produced from renewable energy, fossil fuels, and nuclear.
Important Role of Hydrogen Number one priority is addressing Climate Change Potential benefits : to stabilize fossil fuel rich economies in Post-Oil-Age to connect energy importing Asian countries with energy exporters in the zero-emission world to store surplus renewable electricity
Potential of Hydrogen
Source: IEEJ
Carbon reduction
Effective use of fossil fuel resources
Hydrogen production + CCS
Lesser dependence on oil
StabilizingMiddle EastEconomic growth Science and technology
Large Scale H2 Is Essential• In terms of economics, large-scale supply chain is sine qua non• Transport has three options, liquefied hydrogen (LH2), methylcyclohexane (MCH)
and ammonia (NH3).
Exporters Importers, domestic producers
LH2
Fossil fuel
CO2
Steam reforming,gasification
CCS, EOR
H2
MCH
NH3
Domestic transport H2-fired
Power generation
NH3-firedPower generation
HRS FCV
Marinetransport
Liquefaction
hydrogenation
Synthesis
Gasification
Dehydrogenation
Decomposition
Loading Unloading
Domestic delivery
Domestic delivery
H2
Electrolysis
Renewables Renewables
Electrolysis
Note: LH2 is liquefied hydrogen, MCH is methylcyclohexane, NH3 is ammonia
3.Need to keep addressing oil supply disruption. Addressing power supply disruption is a new challenge.
4.A variety of innovative technologies development and large-scale cost reductions are prerequisite in meeting the 2c’ target (de-carbonization by the end of the century). *Hydrogen is a promising technology for countries and sectors and across different energy sources.