Cheryl Watson – CMG 2005 – 501 1 Cheryl Watson Session 501; CMG2005 in Orlando December 8, 2005 Watson & Walker, Inc. home of Cheryl Watson's TUNING Letter, CPU Chart, BoxScore & GoalTender z990 and z9-109 Performance and Capacity Planning Issues
Transcript
Cheryl Watson – CMG 2005 – 501 1
Cheryl WatsonSession 501; CMG2005 in OrlandoDecember 8, 2005
Watson & Walker, Inc. home of Cheryl Watson's TUNING Letter, CPU Chart, BoxScore &
GoalTender
z990 and z9-109 Performance and Capacity Planning Issues
Cheryl Watson – CMG 2005 – 501 2
Session AbstractSeveral installations found that their new z990 processors were not performing as expected. Were their beginning
expectations unrealistic? Do the new configurations require a different level of tuning? Are the machines not performing according to LSPR expectations? You may find that one or more of these is true in your case. Whether you have z990 processors currently installed, or are planning on ordering a
z990 or a newer z9-109, this is an extremely important session. The session is given by Cheryl Watson, who has an
intense interest in these new machines and extensive experience in comparative performance studies. Her
recommendations will definitely provide valuable insights and knowledge.
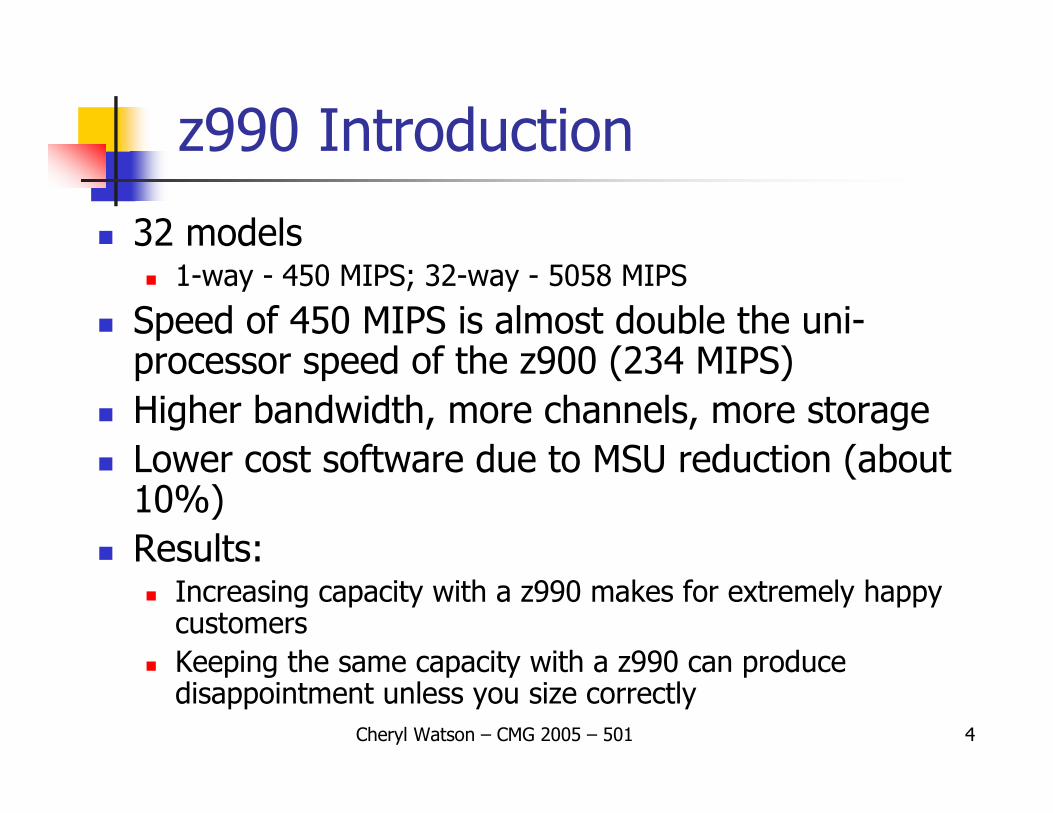
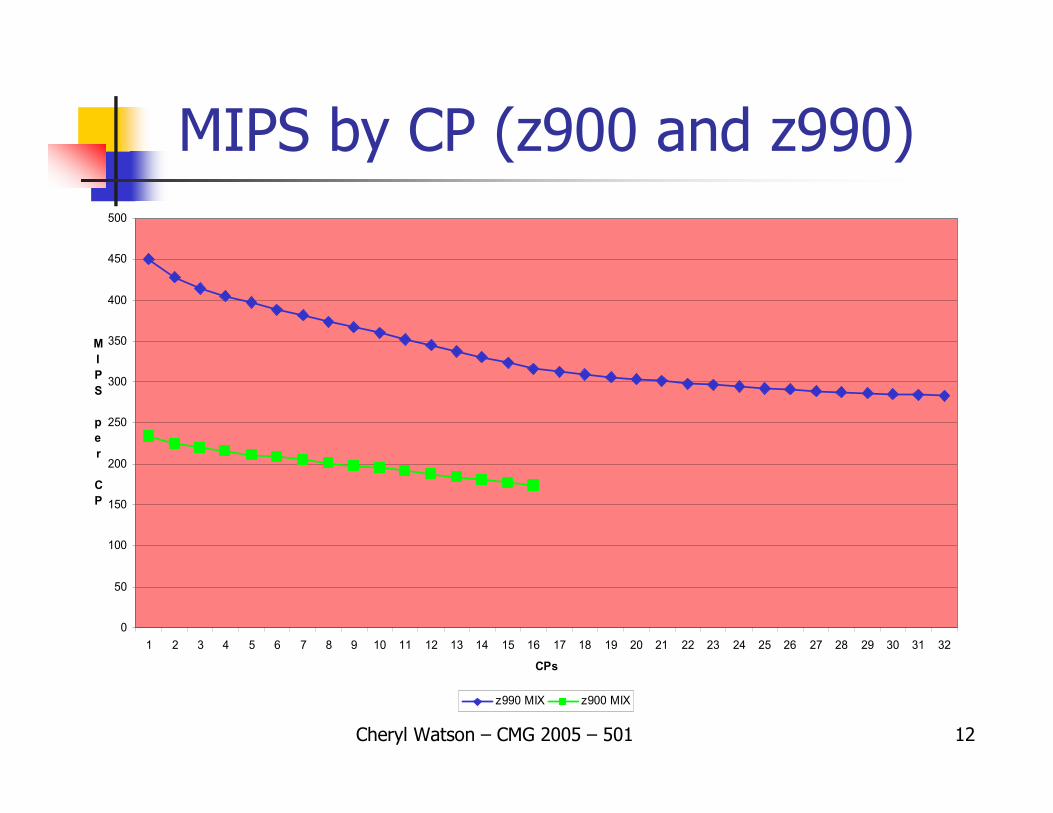
Speed of 450 MIPS is almost double the uni-processor speed of the z900 (234 MIPS)Higher bandwidth, more channels, more storageLower cost software due to MSU reduction (about 10%)Results:
Increasing capacity with a z990 makes for extremely happy customersKeeping the same capacity with a z990 can produce disappointment unless you size correctly
Speed of 608 MIPS is about 35% faster than the uni-processor speed of the z990 (450 MIPS)Higher bandwidth, more channels, more storageLower cost software due to MSU reduction (another 10% below z990)Results:
Still to be determined, but price/performance looks greatUpgrade by each CP will be costly due to software
Cheryl Watson – CMG 2005 – 501 6
Capacity of Processors
No independent analysis of processorsIBM creates and runs their own benchmark jobs. Results published in their Large Systems Performance Reference (LSPR) - www.ibm.com/servers/eserver/zseries/lsprResults are shown as ITR (Internal Throughput Rate) ratioscomparing the CPU usage between two benchmarked machinesBasis for the determination of MIPS, MSUs and SUsWe greatly respect and appreciate the amount of time, effort and cost that goes into these benchmarks – the IBM LSPR team does an excellent job!
Cheryl Watson – CMG 2005 – 501 7
Challenges in Creating LSPRs
Hardware architecture changesChange in placement of the CVB/CVD instructions on the 9672 machines resulted in poor performance for COBOL subscripting programsChange in how high-speed cache is handled made a huge difference in z900 performance for jobs that modify data within 256 byes of the instructions doing the modifyingThe size of high-speed cache, architecture of cache and size of storage can significantly alter results
Cheryl Watson – CMG 2005 – 501 8
Challenges in Creating LSPRs
The workloads changeNewer applications are using more floating point, Java, C/C++ code and UNIX servicesSubsystems may require new facilities that are only available on new systems (e.g. DB2 *loves* 64-bit)
Software changesLatest software can only run on the latest hardware due to instruction requirements or new facilities (e.g. you must run in 64-bit mode for z/OS on a zSeries machine, but can only run in 31-bit mode on a 9672)
Cheryl Watson – CMG 2005 – 501 9
OS/390 R10 LSPRs
IBM runs a set of benchmark jobs on new machines and compares the performance of the jobs to older machinesIBM then publishes the results as ITRRs (internal throughput rate ratios) in their LSPR
ITRRs are ratios between two machines, and the base machine often changesMIPS, MSUs and service units are roughly based on these ITRRs
Cheryl Watson – CMG 2005 – 501 10
OS/390 R10 LSPRs
The original z900 LSPRs were run on OS/390 R10Base machine was the z900 2064-1C1 (Dec2001)z900 workloads consisted of:
CB84 – Short commercial batch (31-bit)TSO – Interactive TSO (64-bit)CICS/DB2 – CICS work using DB2 (64-bit)IMS – IMS work (31-bit)CBW2 – Long commercial batch with heavy DB2 (31-bit)FPC1 – Floating point/scientific work (31-bit)
The MIX workload is the harmonic mean of CB84, TSO, CICS/DB2 and IMS
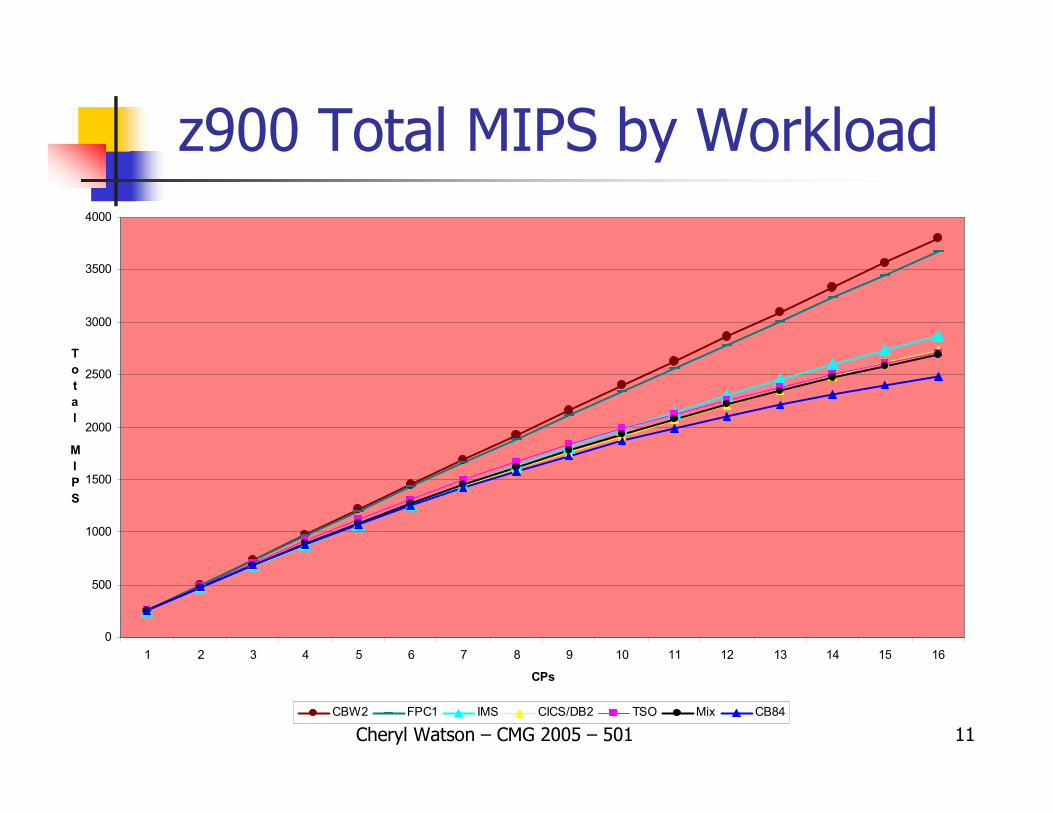
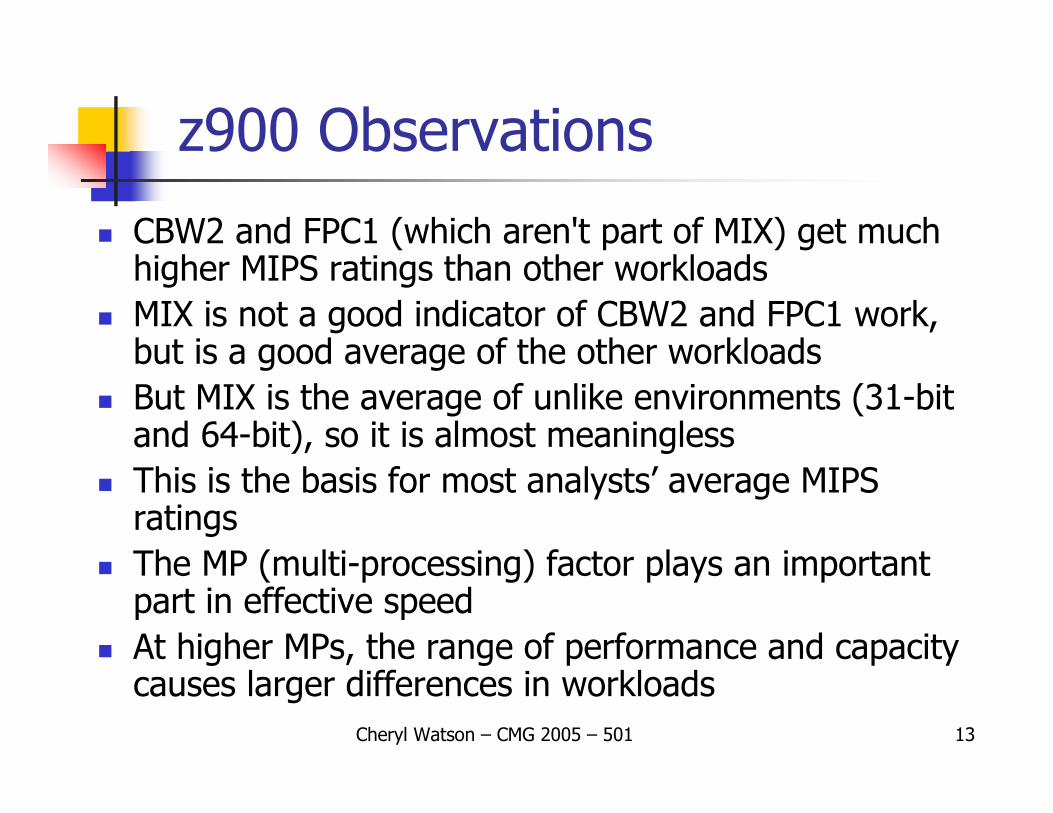
CBW2 and FPC1 (which aren't part of MIX) get much higher MIPS ratings than other workloadsMIX is not a good indicator of CBW2 and FPC1 work, but is a good average of the other workloadsBut MIX is the average of unlike environments (31-bit and 64-bit), so it is almost meaninglessThis is the basis for most analysts’ average MIPS ratingsThe MP (multi-processing) factor plays an important part in effective speedAt higher MPs, the range of performance and capacity causes larger differences in workloads
Cheryl Watson – CMG 2005 – 501 14
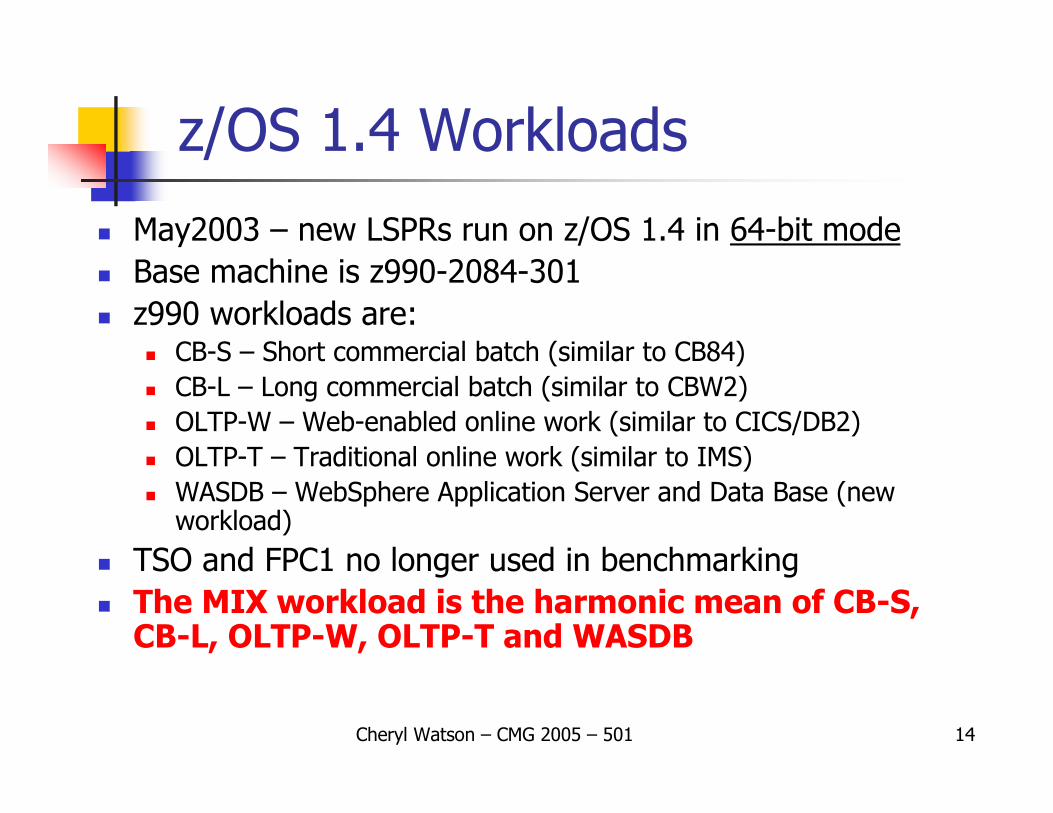
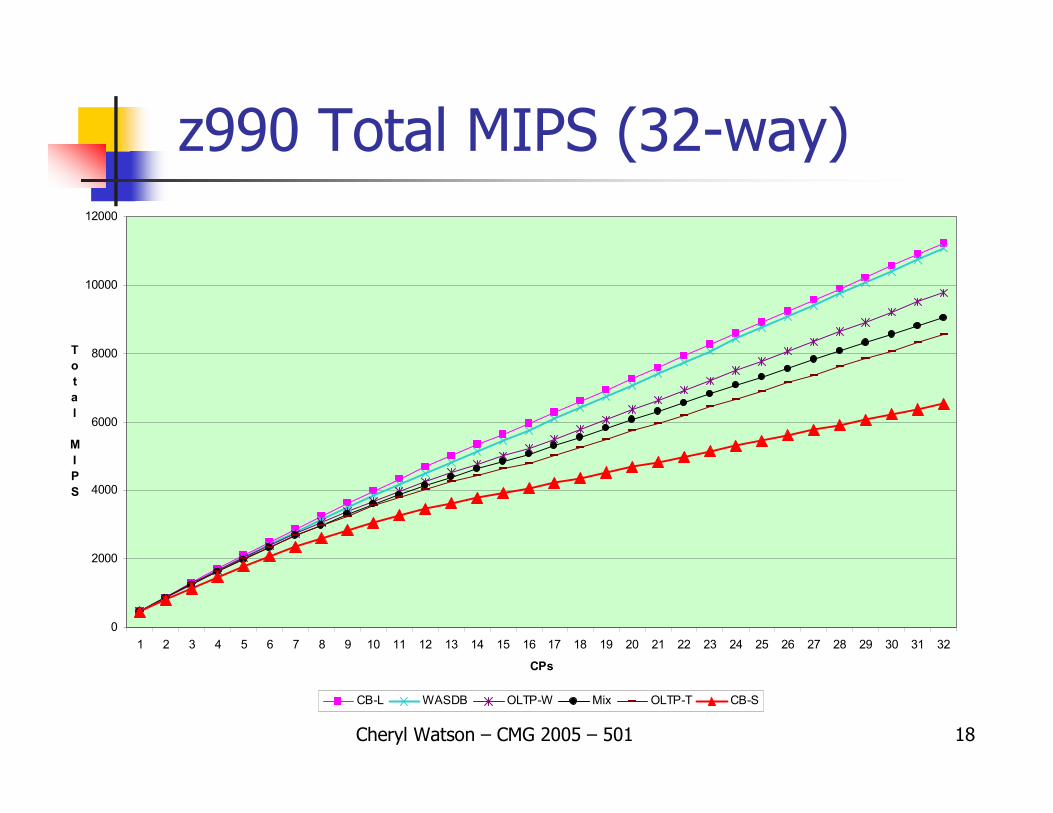
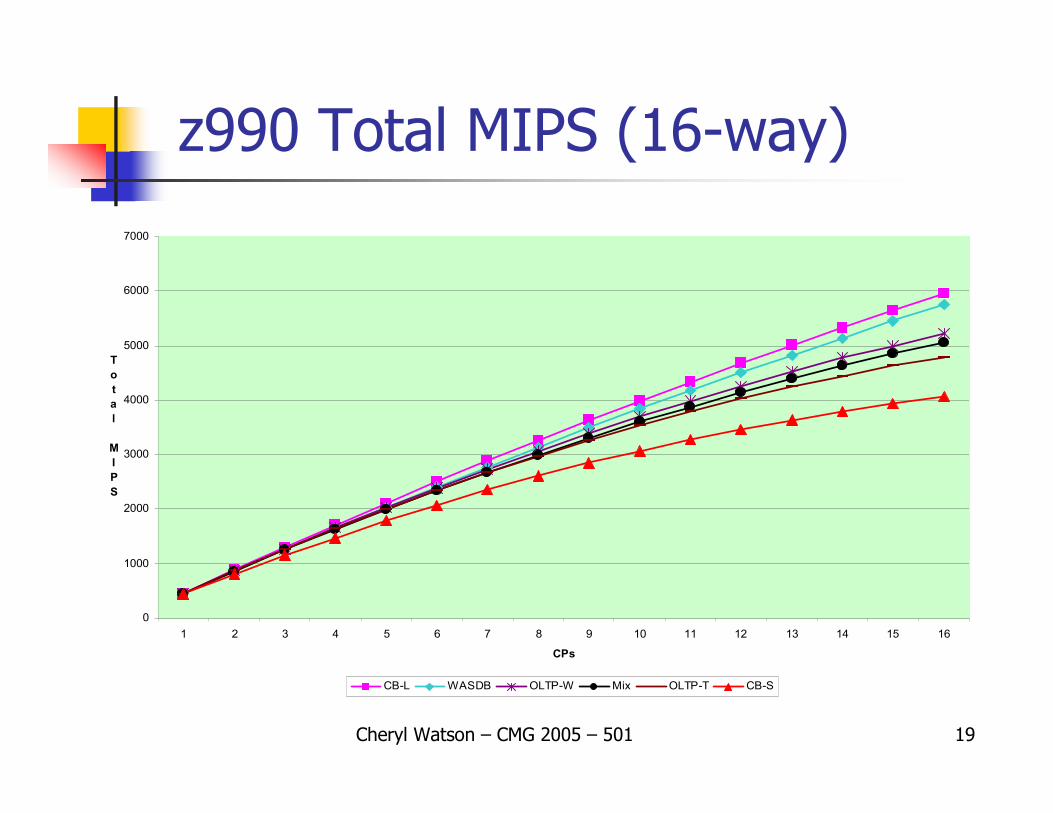
z/OS 1.4 WorkloadsMay2003 – new LSPRs run on z/OS 1.4 in 64-bit modeBase machine is z990-2084-301z990 workloads are:
CB-S – Short commercial batch (similar to CB84)CB-L – Long commercial batch (similar to CBW2)OLTP-W – Web-enabled online work (similar to CICS/DB2)OLTP-T – Traditional online work (similar to IMS)WASDB – WebSphere Application Server and Data Base (new workload)
TSO and FPC1 no longer used in benchmarkingThe MIX workload is the harmonic mean of CB-S, CB-L, OLTP-W, OLTP-T and WASDB
Cheryl Watson – CMG 2005 – 501 15
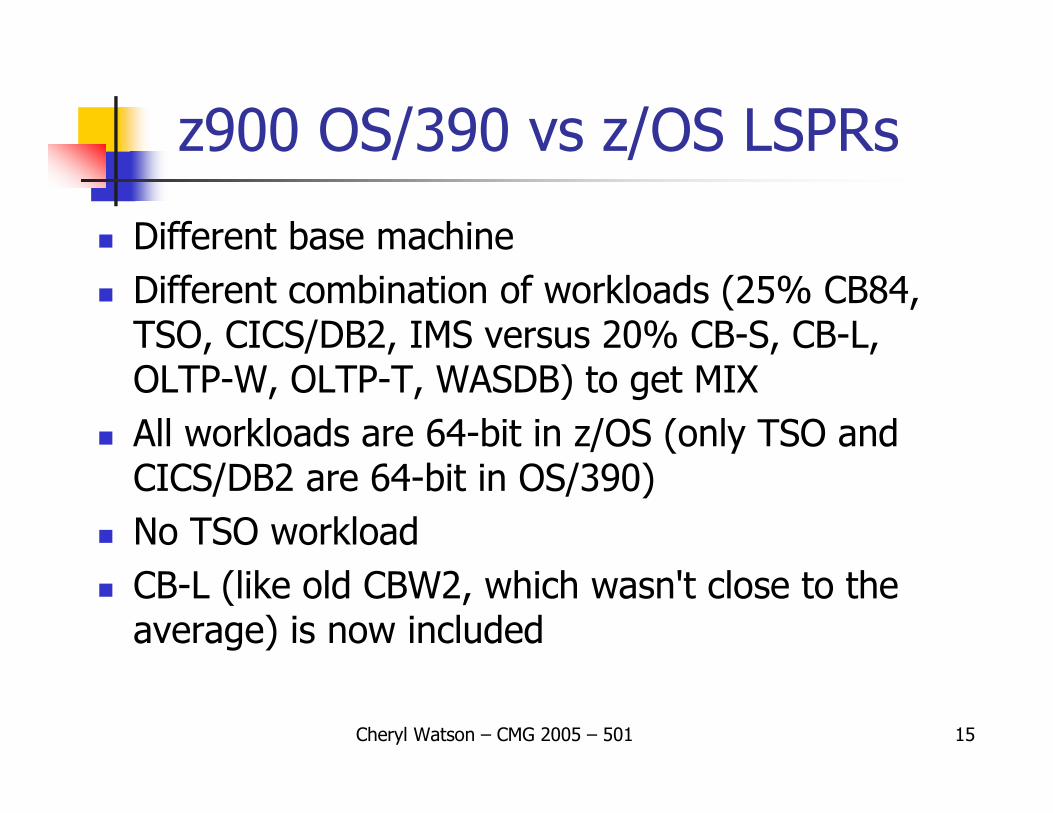
z900 OS/390 vs z/OS LSPRs
Different base machineDifferent combination of workloads (25% CB84, TSO, CICS/DB2, IMS versus 20% CB-S, CB-L, OLTP-W, OLTP-T, WASDB) to get MIXAll workloads are 64-bit in z/OS (only TSO and CICS/DB2 are 64-bit in OS/390)No TSO workloadCB-L (like old CBW2, which wasn't close to the average) is now included
Cheryl Watson – CMG 2005 – 501 16
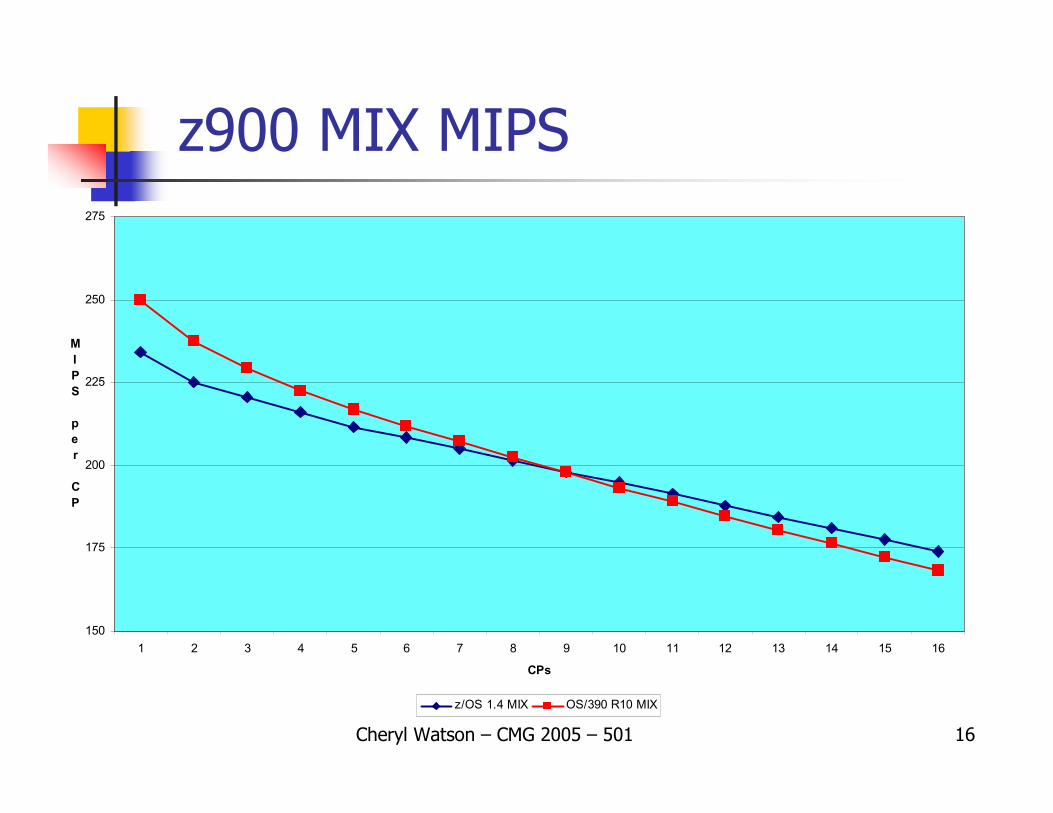
z900 MIX MIPS
150
175
200
225
250
275
1 2 3 4 5 6 7 8 9 10 11 12 13 14 15 16
CPs
MIPS per CP
z/OS 1.4 MIX OS/390 R10 MIX
Cheryl Watson – CMG 2005 – 501 17
LSPR Observations
MIX (average) MIPS are lower using z/OS LSPRs on smaller MPs, but higher using z/OS LSPRs on larger MPsCB-L and WASDB account for most of the increase on larger MPsOS/390 R10 LSPRs are the last available for 9672s
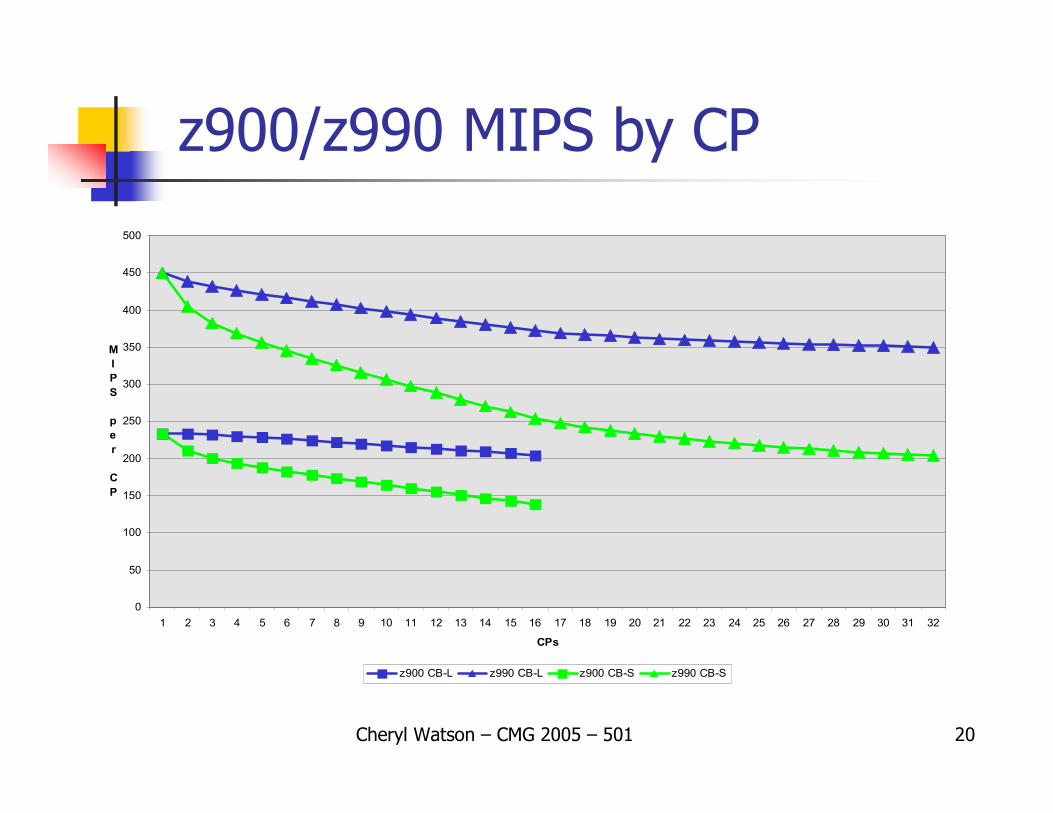
MIX MIPS are higher when you have more CPs due to the inclusion of higher rated CB-L and WASDB17-way to 32-way configurations show less degradation – it’s two single image LPARsMuch greater difference between CB-L and CB-S MIPS per CP on z990CB-L shows less degradation than CB-S at higher MPs
Cheryl Watson – CMG 2005 – 501 22
z900 versus z990
We started hearing about z990 disappointments in early November 2003Workloads weren't meeting expectations on moves from z900 to z990 Many sites were seeing underperformance of between 8% to 12%, using standard workload analysesThis underperformance was seen in users' analyses and via our BoxScore product
Cheryl Watson – CMG 2005 – 501 23
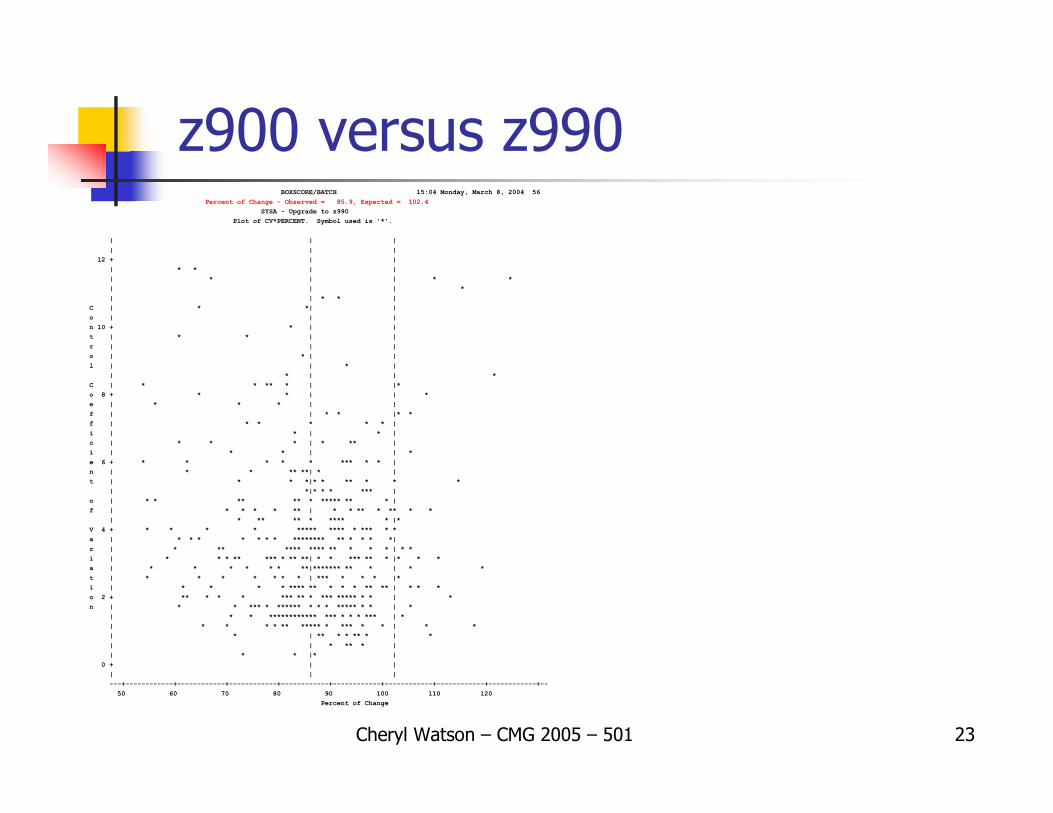
z900 versus z990BOXSCORE/BATCH 15:04 Monday, March 8, 2004 56
Percent of Change - Observed = 85.9, Expected = 102.4SYSA - Upgrade to z990
z900 versus z990BOXSCORE/BATCH 15:04 Monday, March 8, 2004 49
V1R6 (c) Watson & Walker, Inc. Summary - CPU per I/O
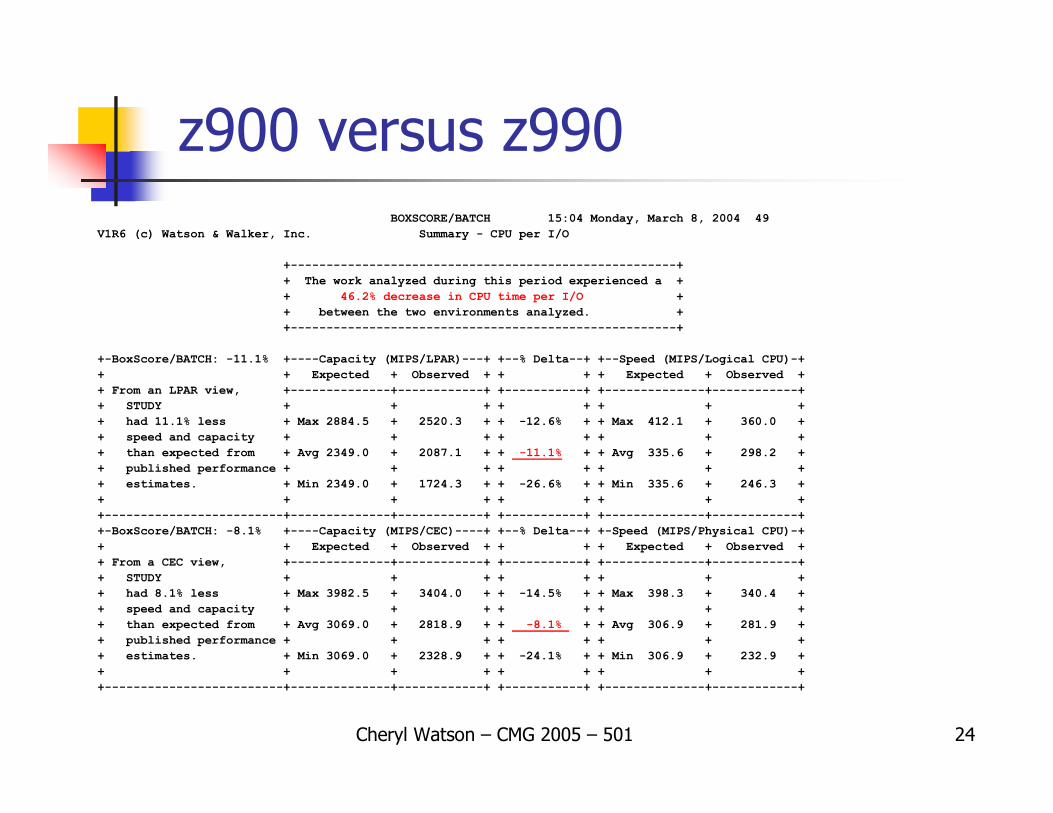
+------------------------------------------------------+ + The work analyzed during this period experienced a + + 46.2% decrease in CPU time per I/O + + between the two environments analyzed. + +------------------------------------------------------+
+-BoxScore/BATCH: -11.1% +----Capacity (MIPS/LPAR)---+ +--% Delta--+ +--Speed (MIPS/Logical CPU)-+ + + Expected + Observed + + + + Expected + Observed + + From an LPAR view, +--------------+------------+ +-----------+ +--------------+------------+ + STUDY + + + + + + + + + had 11.1% less + Max 2884.5 + 2520.3 + + -12.6% + + Max 412.1 + 360.0 + + speed and capacity + + + + + + + + + than expected from + Avg 2349.0 + 2087.1 + + -11.1% + + Avg 335.6 + 298.2 + + published performance + + + + + + + + + estimates. + Min 2349.0 + 1724.3 + + -26.6% + + Min 335.6 + 246.3 + + + + + + + + + + +-------------------------+--------------+------------+ +-----------+ +--------------+------------+ +-BoxScore/BATCH: -8.1% +----Capacity (MIPS/CEC)----+ +--% Delta--+ +-Speed (MIPS/Physical CPU)-+ + + Expected + Observed + + + + Expected + Observed + + From a CEC view, +--------------+------------+ +-----------+ +--------------+------------+ + STUDY + + + + + + + + + had 8.1% less + Max 3982.5 + 3404.0 + + -14.5% + + Max 398.3 + 340.4 + + speed and capacity + + + + + + + + + than expected from + Avg 3069.0 + 2818.9 + + -8.1% + + Avg 306.9 + 281.9 + + published performance + + + + + + + + + estimates. + Min 3069.0 + 2328.9 + + -24.1% + + Min 306.9 + 232.9 + + + + + + + + + + +-------------------------+--------------+------------+ +-----------+ +--------------+------------+
Cheryl Watson – CMG 2005 – 501 25
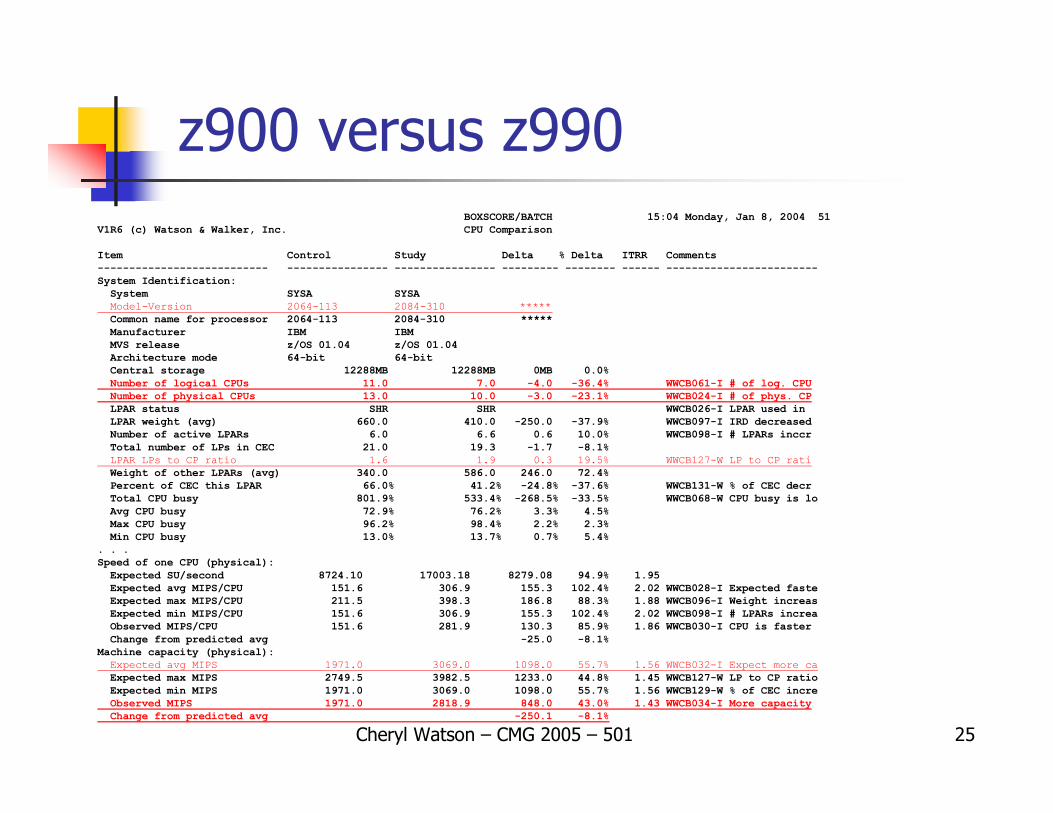
z900 versus z990BOXSCORE/BATCH 15:04 Monday, Jan 8, 2004 51
V1R6 (c) Watson & Walker, Inc. CPU ComparisonItem Control Study Delta % Delta ITRR Comments--------------------------- ---------------- ---------------- --------- -------- ------ ------------------------System Identification:System SYSA SYSAModel-Version 2064-113 2084-310 *****Common name for processor 2064-113 2084-310 *****Manufacturer IBM IBMMVS release z/OS 01.04 z/OS 01.04Architecture mode 64-bit 64-bitCentral storage 12288MB 12288MB 0MB 0.0%Number of logical CPUs 11.0 7.0 -4.0 -36.4% WWCB061-I # of log. CPUNumber of physical CPUs 13.0 10.0 -3.0 -23.1% WWCB024-I # of phys. CPLPAR status SHR SHR WWCB026-I LPAR used in LPAR weight (avg) 660.0 410.0 -250.0 -37.9% WWCB097-I IRD decreased Number of active LPARs 6.0 6.6 0.6 10.0% WWCB098-I # LPARs inccrTotal number of LPs in CEC 21.0 19.3 -1.7 -8.1%LPAR LPs to CP ratio 1.6 1.9 0.3 19.5% WWCB127-W LP to CP ratiWeight of other LPARs (avg) 340.0 586.0 246.0 72.4%Percent of CEC this LPAR 66.0% 41.2% -24.8% -37.6% WWCB131-W % of CEC decrTotal CPU busy 801.9% 533.4% -268.5% -33.5% WWCB068-W CPU busy is loAvg CPU busy 72.9% 76.2% 3.3% 4.5%Max CPU busy 96.2% 98.4% 2.2% 2.3%Min CPU busy 13.0% 13.7% 0.7% 5.4%
. . .Speed of one CPU (physical):Expected SU/second 8724.10 17003.18 8279.08 94.9% 1.95Expected avg MIPS/CPU 151.6 306.9 155.3 102.4% 2.02 WWCB028-I Expected fasteExpected max MIPS/CPU 211.5 398.3 186.8 88.3% 1.88 WWCB096-I Weight increasExpected min MIPS/CPU 151.6 306.9 155.3 102.4% 2.02 WWCB098-I # LPARs increaObserved MIPS/CPU 151.6 281.9 130.3 85.9% 1.86 WWCB030-I CPU is fasterChange from predicted avg -25.0 -8.1%
Machine capacity (physical):Expected avg MIPS 1971.0 3069.0 1098.0 55.7% 1.56 WWCB032-I Expect more caExpected max MIPS 2749.5 3982.5 1233.0 44.8% 1.45 WWCB127-W LP to CP ratio Expected min MIPS 1971.0 3069.0 1098.0 55.7% 1.56 WWCB129-W % of CEC increObserved MIPS 1971.0 2818.9 848.0 43.0% 1.43 WWCB034-I More capacity Change from predicted avg -250.1 -8.1%
Cheryl Watson – CMG 2005 – 501 26
z900 versus z990
ObservationsThis example used the CB-S workload because the site had previously been using the CB84 workload successfully for yearsChange in CPU time is consistent, but not meeting CB-S expectationsFrom the plot, this doesn't seem to appear to be a problem with just one type of job – it's all jobsThe 46.2% decrease is actual, but the -11.1% and -8.1% are interpretations based on expectations
Cheryl Watson – CMG 2005 – 501 27
z900 versus z990
Observations (cont.)On the CPU Comparison report, some interesting things to note: number of LPs, CPs and LP to CP ratioStorage changes can make a significant impact on certain types of jobs, such as sortsWatch the MIPS! In this case, -8.1% change in capacity amounts to 250 MIPS (IBM allows a +5% to -5% difference in capacity to meet their capacity projections)
Cheryl Watson – CMG 2005 – 501 28
z900 versus z990 (z9-109)
So why is this happening?
1. Moving to Fewer CPs2. LPAR Configurations Change3. Low I/O Density4. 5% Variation Can Matter5. Storage sizes usually increase and can change the
behavior of some work, especially sorts
Cheryl Watson – CMG 2005 – 501 29
1. Moving to Fewer CPs
Higher importance workloads tend to dominate the lower importance workloadsHigher importance workloads have latent demand that takes more CPUUni-processors have unique problems (many sites are now going to uni-processors for the first time)
Cheryl Watson – CMG 2005 – 501 30
2. LPAR Configurations
Moving to fewer CPs causes higher LP to CP ratio2:1 or 3:1 ratios are acceptable, but 10:1 isn'tThis overhead shows up as higher TCB and SRB timesPoor LPAR configurations can cause up to 30% overhead!Installations *MUST* plan on re-evaluating their LPAR assignments after configuration changes
Cheryl Watson – CMG 2005 – 501 31
3. Low I/O Density
IBM says that low I/O density environments more closely match the CB-L workload than other workloadsLow I/O density is defined as having less than 30 DASD I/Os per second per unit of CPU usage as measured in MSUsIBM says that 80% of sites have this condition (we found it to be closer to 100%)Free SAS program to calculate I/O density at www.watsonwalker.com/lowio.txt
Cheryl Watson – CMG 2005 – 501 32
3. Low I/O Density
First identified by IBM in 1999 when sites upgraded from G4 to G5/G6 processors (which were significantly faster)Also occurs from z900 to z990 or z9-109 and from z990 to z9-109IBM has added a new customized workload to their internal tools called LOIO, which is a combination of 60% CB-L, 20% WASDB and 20% OLTP-WNew LSPRs were updated on October 29, 2004 and include new workloads: LoIO and TI-Mix (Transaction-Intensive Mix)IBM's sizing tool, zPCR, includes these customized workloads
Cheryl Watson – CMG 2005 – 501 33
3. Low I/O Density
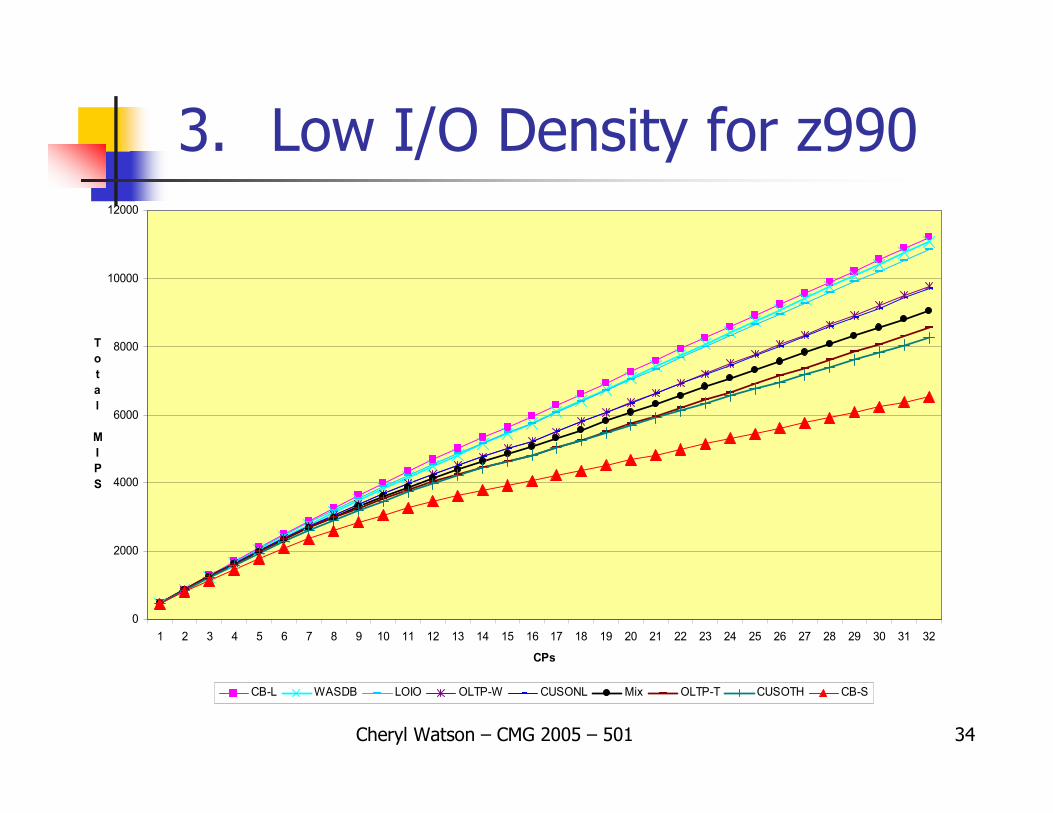
If you have low I/O density, then you *must* do sizing using a customized workload rather than others (OLTP-T, CB-S, etc.)100% of our customers have had to use the LOWIO workload for estimatesIf you use MIX MIPS or a standard workload, then you will probably not meet your expectations
5% of the smallest z990 is about 22 MIPS (no big deal)5% of the 16-way z990 is about 253 MIPS (BIG deal!)You need to have a performance guarantee from IBM (they say that one isn't really needed because they will keep customers happy – but we still think guarantees are important)Be careful of the +/- 5% variation in expected performance if it's a tight move
Cheryl Watson – CMG 2005 – 501 36
Question
If LoIO applies to most installationsand if LoIO represents the highest MIPS ratings,then why are any sites complaining?
You have to look at the comparison between the z900 and z990
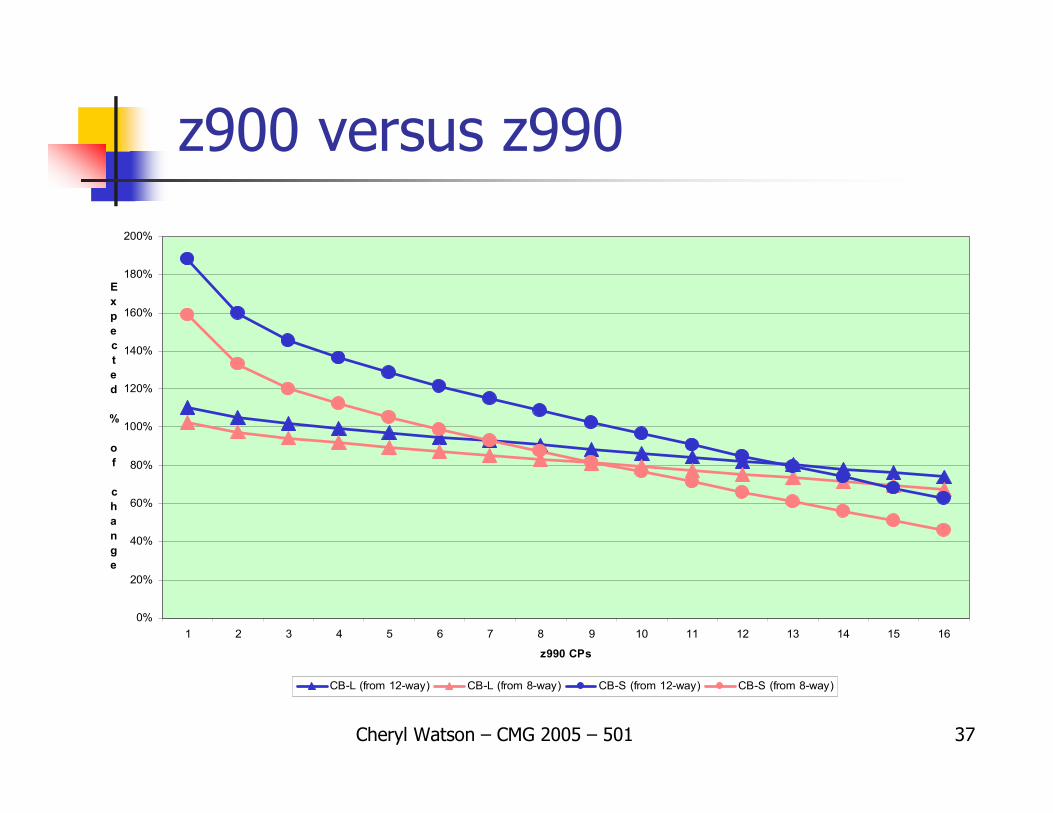
Dark lines represent moving from a 12-way z900 to each of the first 16 z990s for CB-L (highest) and CB-SLight lines represent moving from an 8-way z900 to each of the first 16 z990s for CB-L (highest) and CB-SCB-L is worse than CB-S until there is one more CP on the z990 than on the z900; then they reverseCB-S is fairly close to old MIX MIPS, but CB-L is fairly close to LOWIO MIPS
Cheryl Watson – CMG 2005 – 501 39
z900 versus z990Example 1 (moving across)
Move from a 12-way z900 (2255 MIX MIPS) to an 8-way z990 (2293 MIX MIPS)CB-S gets 19% better performance than CB-LIf you planned on CB-S performance and you got CB-L performance, you'd be disappointed
Example 2 (moving down)Move half of the workload from an 8-way z900 (1611 MIX MIPS) to a 2-way z990 (855 MIX MIPS)CB-S gets 36% higher capacity than CB-L
Example 3 (moving up)Move from an 8-way z900 (1611 MIX MIPS) to a 16-way z990 (5058 MIX MIPS)CB-S gets 21% lower capacity than CB-L
Cheryl Watson – CMG 2005 – 501 40
Latest z/OS 1.6 LSPRs
zSeries LSPR Values for z/OS 1.6Newly Published on July 26, 2005Primitive LSPR workloads for zSeries:
Mixed workloadsMixed –uses CB-J instead of CB-S, so MIPS appear higherTI-Mix – Transaction-Intensive MixLoIO-Mix – Low I/O Mix (MIPS are more consistent)
Cheryl Watson – CMG 2005 – 501 41
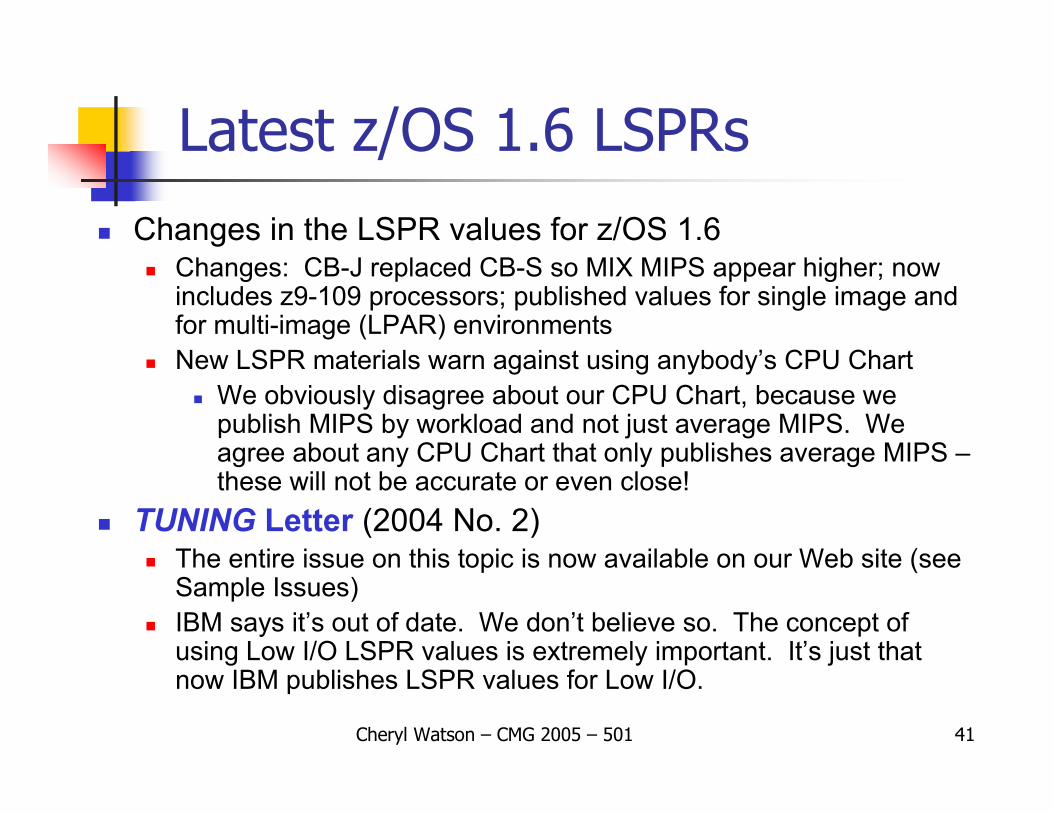
Latest z/OS 1.6 LSPRsChanges in the LSPR values for z/OS 1.6
Changes: CB-J replaced CB-S so MIX MIPS appear higher; now includes z9-109 processors; published values for single image and for multi-image (LPAR) environmentsNew LSPR materials warn against using anybody’s CPU Chart
We obviously disagree about our CPU Chart, because we publish MIPS by workload and not just average MIPS. We agree about any CPU Chart that only publishes average MIPS –these will not be accurate or even close!
TUNING Letter (2004 No. 2)The entire issue on this topic is now available on our Web site (see Sample Issues)IBM says it’s out of date. We don’t believe so. The concept ofusing Low I/O LSPR values is extremely important. It’s just that now IBM publishes LSPR values for Low I/O.
Cheryl Watson – CMG 2005 – 501 42
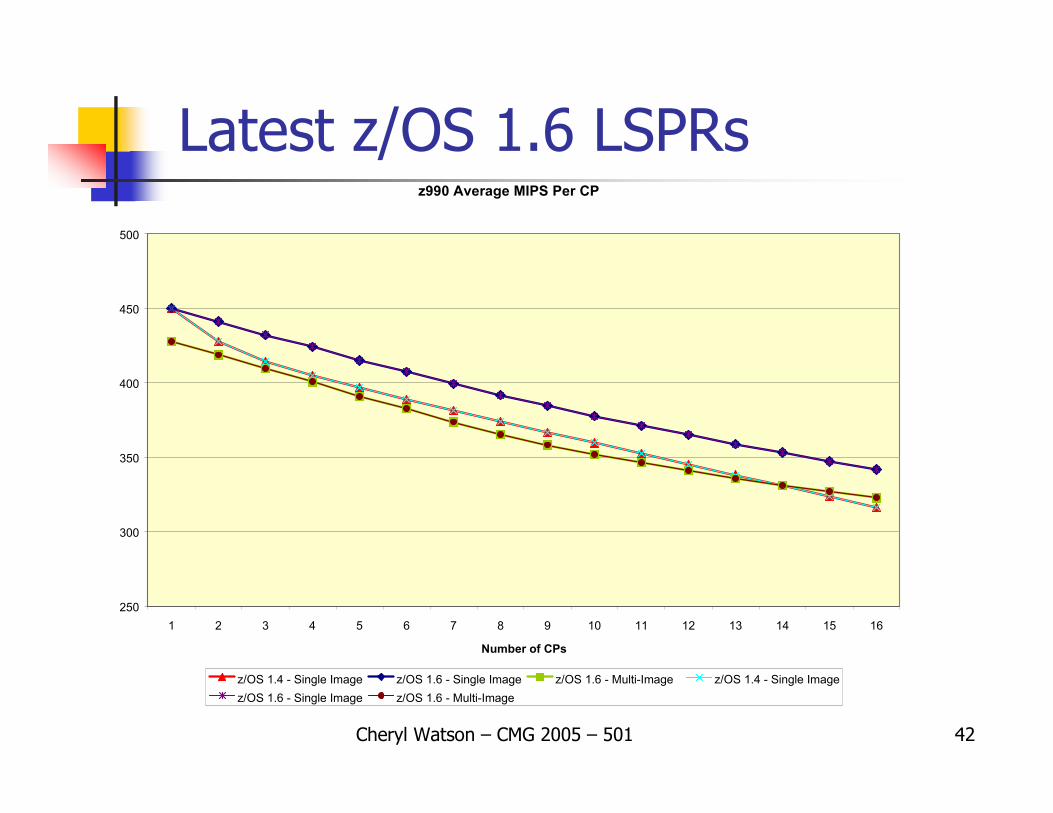
Latest z/OS 1.6 LSPRsz990 Average MIPS Per CP
250
300
350
400
450
500
1 2 3 4 5 6 7 8 9 10 11 12 13 14 15 16
Number of CPs
z/OS 1.4 - Single Image z/OS 1.6 - Single Image z/OS 1.6 - Multi-Image z/OS 1.4 - Single Imagez/OS 1.6 - Single Image z/OS 1.6 - Multi-Image
Cheryl Watson – CMG 2005 – 501 43
Latest z/OS 1.6 LSPRs
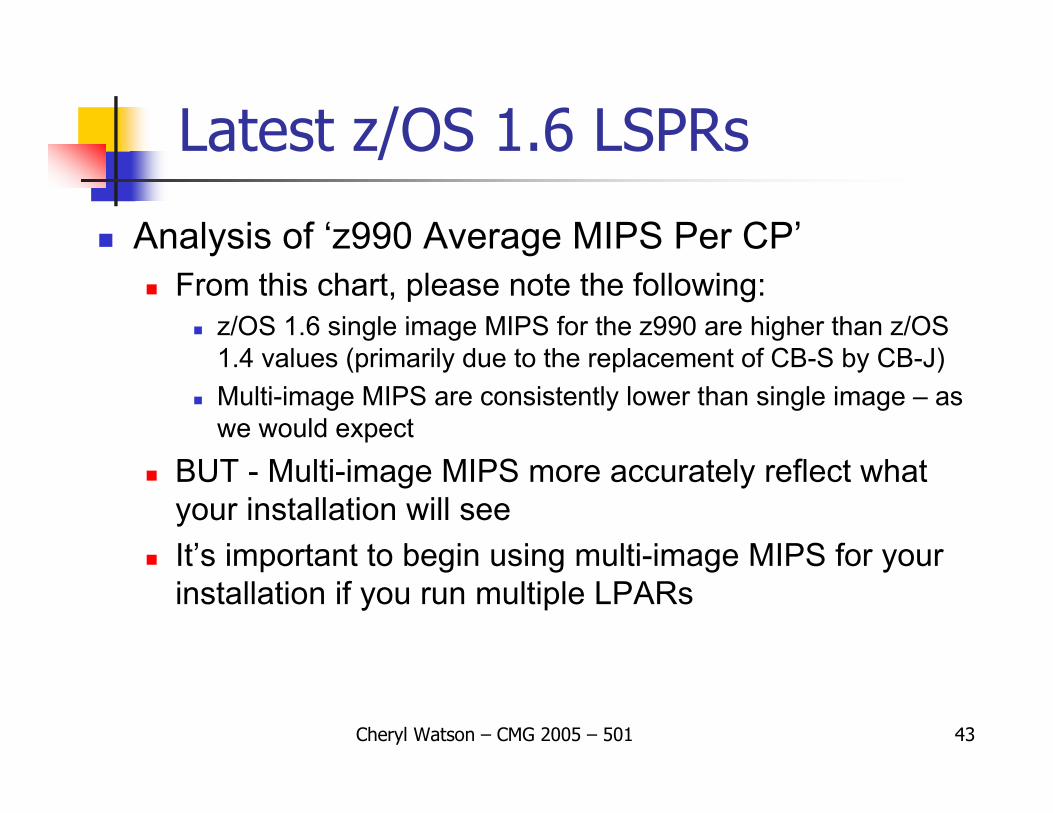
Analysis of ‘z990 Average MIPS Per CP’From this chart, please note the following:
z/OS 1.6 single image MIPS for the z990 are higher than z/OS 1.4 values (primarily due to the replacement of CB-S by CB-J)Multi-image MIPS are consistently lower than single image – as we would expect
BUT - Multi-image MIPS more accurately reflect what your installation will seeIt’s important to begin using multi-image MIPS for your installation if you run multiple LPARs
Cheryl Watson – CMG 2005 – 501 44
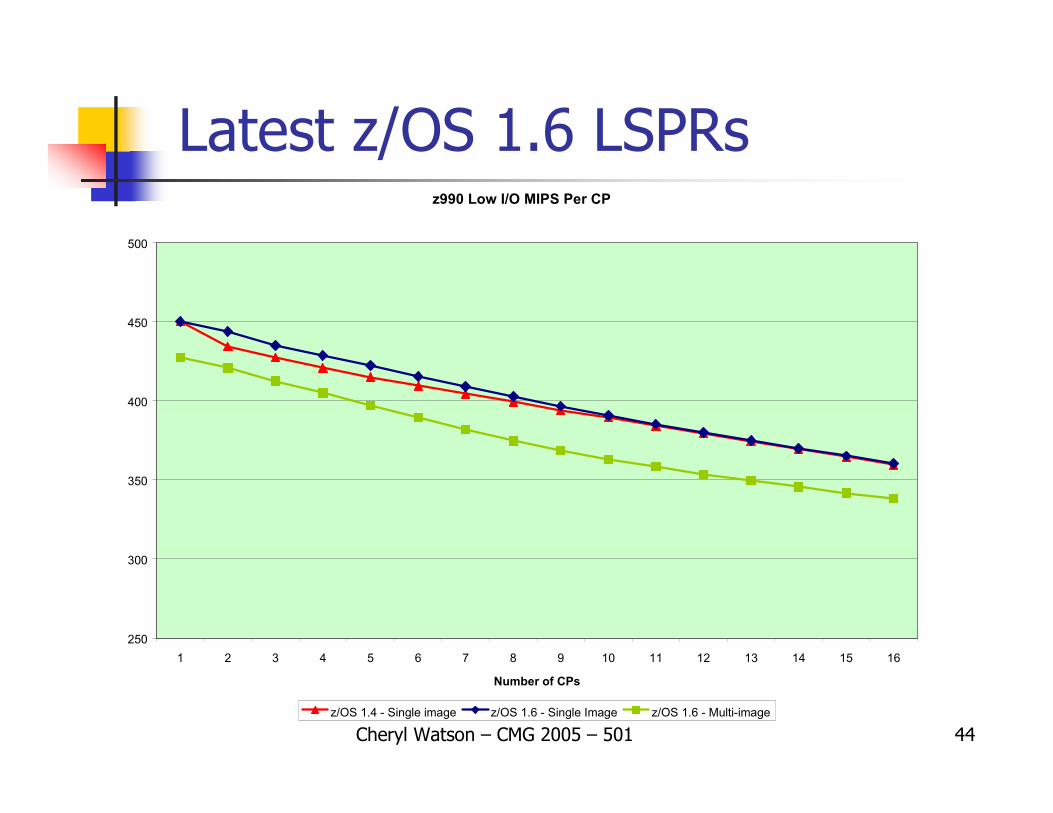
Latest z/OS 1.6 LSPRsz990 Low I/O MIPS Per CP
250
300
350
400
450
500
1 2 3 4 5 6 7 8 9 10 11 12 13 14 15 16
Number of CPs
z/OS 1.4 - Single image z/OS 1.6 - Single Image z/OS 1.6 - Multi-image
Cheryl Watson – CMG 2005 – 501 45
Latest z/OS 1.6 LSPRs
Analysis of ‘z990 Low I/O MIPS Per CP’In our analysis, most installations match the profile of the ‘Low I/O’ workloadThis chart is mainly to show that Low I/O MIPS are fairly consistentNotice that multi-image MIPS are between 20 and 25 MIPS lower than single imageThat means that you can’t compare your old z/OS 1.4 single image MIPS to the new z/OS 1.6 multi-image MIPSBUT multi-image is closer to what you’ll really see
Cheryl Watson – CMG 2005 – 501 46
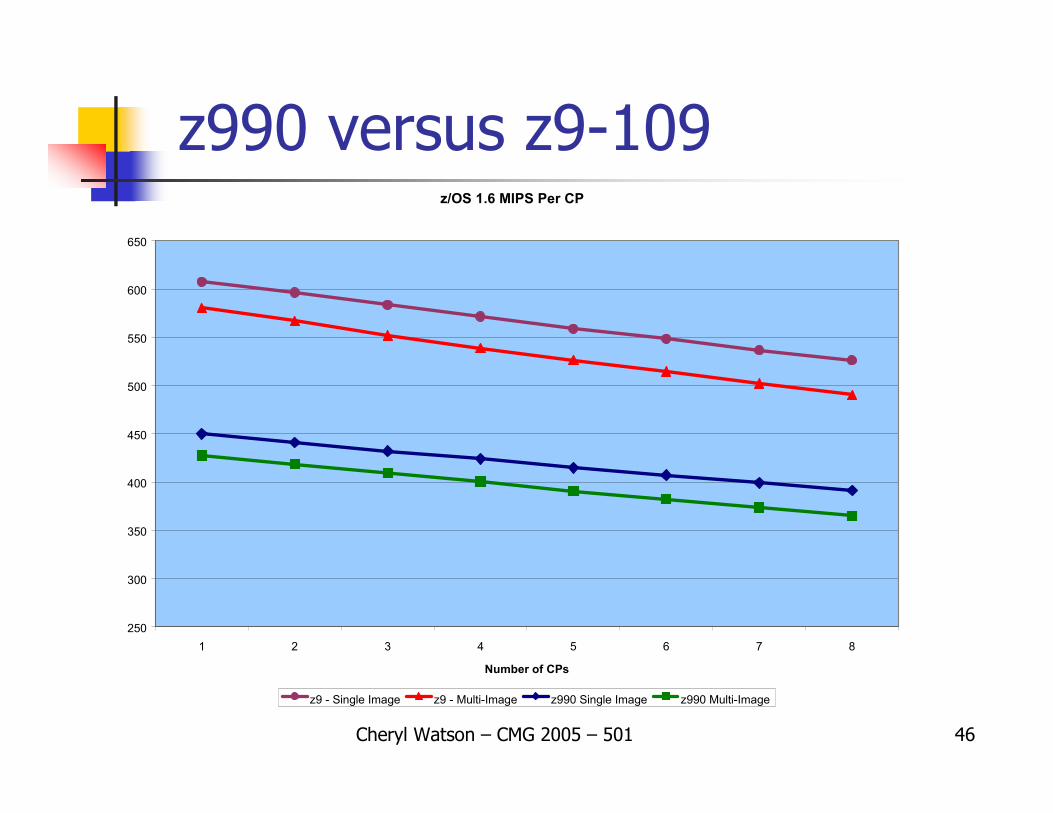
z990 versus z9-109z/OS 1.6 MIPS Per CP
250
300
350
400
450
500
550
600
650
1 2 3 4 5 6 7 8
Number of CPs
z9 - Single Image z9 - Multi-Image z990 Single Image z990 Multi-Image
Cheryl Watson – CMG 2005 – 501 47
z990 versus z9-109Analysis of ‘Average z/OS 1.6 MIPS Per CP’
This chart shows the difference in average MIPS per CP between the z9-109 and the z990The z9-109 is about 35% faster than the z990 – that’s great!Be aware of the difference between MIPS per CP and total MIPS
Example – a 2094-708 varies by 35 MIPS per CP between the single image and multi-image – but that’s a total of 280 MIPSIf you don’t first adjust to multi-image, then you may not get an accurate estimate of capacityAs noted before, you’ll really experience the multi-image effect
Do you see now how important it is to switch to multi-image MIPS or LSPRs at this point in time?
Cheryl Watson – CMG 2005 – 501 48
Important: zPCR!IBM has free tools for sizing
Marketing representatives can now use free internal tools for processor sizing studies (zPCR and CP2000)Two new custom workloads:
Low I/O: harmonic mean of 60% CB-L, 20% OLTP-W, and 20% WASDB
Low I/O is defined as images that have fewer than 30 DASD SSCHs/Second per used MSU
TI-Mix: harmonic mean of 5% CB-L, 30% CB-J, 42% OLTP-W, and 25% OLTP-T
Most installations are in a low I/O environmentzPCR to be no cost to customers as of 4Q05 (WSC Flash10399)
Cheryl Watson – CMG 2005 – 501 49
Important: zPCR!
zPCR is a Requirement for Capacity Planning If you don't use zPCR or CP2000, you may be disappointedIBM representative is required to run CP2000 prior to completing a contract for a z990Our experience – the people at the site who confirm the capacity of a new machine have never heard of these toolsIt's imperative that you get the tools and understand the results before confirming your hardware orderMIPS and LSPR tables don’t take into account LPAR configuration
Cheryl Watson – CMG 2005 – 501 50
Latest LSPRsThanks to IBM
www-1.ibm.com/servers/eserver/zseries/lspr/New multi-image LSPR values will provide a much better view of capacityNew CB-J workload is much better than CB-S for today’s workFree zPCR Tool should become mandatory before any upgrade
Warning – It may take customers some time to get used to (and fully understand) the new multi-image LSPR values – stay tuned for future analysis
Cheryl Watson – CMG 2005 – 501 51
RecommendationsBe especially cautious when moving to fewer CPs (this will apply to most z990 & z9-109 moves)Check out LPAR configurations before moving It's important to tune after the upgrade Don't use MIX MIPS as a basis for your expectationsCheck your I/O density before using any workloads, and if low, use the customized LOWIO workload for estimations – Use zPCR from IBM!It's important to understand workloads for sizingRemember IBM's 5% margin