Zagreb – 30 July 2014 T-Hrvatski Telekom Results for the first six months ended 30 June 2014 First six months of 2014 characterised by Company transformation - Market leading position in all segments of telecommunications services - Slowdown of revenue decline in continuing adverse operating conditions - Company transformation as basis for future growth - new organizational structure implemented, substantial decrease in number of managerial positions, new Collective Agreement signed, Letter of Intent to outsource services of construction and maintenance of HT’s infrastructure T-Hrvatski Telekom (Reuters: THTC.L, HT.ZA; Bloomberg: THTC LI, HTRA CZ), Croatia’s leading telecommunications provider, announces its unaudited results for the six months ended 30 June 2014. T-HT is Croatia’s largest telecommunications provider and the market leader across all areas of operation. At the end of the first half of 2014, Hrvatski Telekom had 1.1 million fixed line customers, 2.3 million mobile subscribers and 620,508 broadband retail access lines, providing TV services to 393,525 customers. In the first six months of the year, the overall telecommunications industry in Croatia was strongly impacted by the continuing economic crisis, regulatory changes and further market deterioration. Operating within a challenging environment, HT slowed the trend of revenue decline, and reported H1 2014 of HRK 3.3 billion. This represents a fall of 5.2% compared to the almost 6.0% fall seen in the same period of the previous year. Revenue declined primarily in the voice segment, and this was partially offset by higher non-voice revenue, substantial growth in ICT revenue and increased terminal equipment revenue. Despite increased company transformation related costs, the Group maintained operating expenses at the same level and EBITDA amounted to HRK 1.2 billion. EBITDA before exceptional items was HRK 1.3 billion, a 10.0% decrease primarily due to the revenue decrease and change of revenue structure. Net income totalled HRK 401 million, down 29.5%. Company transformation leading to a more agile, more efficient organization To build the foundations for the future growth and expansion of the Group’s operations, against the backdrop of the protracted economic crisis and continued deterioration of the Croatian telecommunications market, the first six months of the year were characterized by the transformation of the Company. A number of activities were undertaken in order to increase levels of efficiency and customer focus, including the implementation of a new organizational structure and the introduction a new Chief Customer Experience Officer position within the Management Board of HT. To create a more agile, more efficient organization, the number of managerial positions was cut substantially, so that currently HT has 31% fewer managerial positions as compared to the same period of the previous year.
Transcript
Zagreb – 30 July 2014
T-Hrvatski Telekom
Results for the first six months ended 30 June 2014
First six months of 2014 characterised by Company transformation
- Market leading position in all segments of telecommunications services - Slowdown of revenue decline in continuing adverse operating conditions - Company transformation as basis for future growth - new organizational structure
implemented, substantial decrease in number of managerial positions, new Collective Agreement signed, Letter of Intent to outsource services of construction and maintenance of HT’s infrastructure
T-Hrvatski Telekom (Reuters: THTC.L, HT.ZA; Bloomberg: THTC LI, HTRA CZ), Croatia’s leading telecommunications provider, announces its unaudited results for the six months ended 30 June 2014. T-HT is Croatia’s largest telecommunications provider and the market leader across all areas of operation. At the end of the first half of 2014, Hrvatski Telekom had 1.1 million fixed line customers, 2.3 million mobile subscribers and 620,508 broadband retail access lines, providing TV services to 393,525 customers. In the first six months of the year, the overall telecommunications industry in Croatia was strongly impacted by the continuing economic crisis, regulatory changes and further market deterioration. Operating within a challenging environment, HT slowed the trend of revenue decline, and reported H1 2014 of HRK 3.3 billion. This represents a fall of 5.2% compared to the almost 6.0% fall seen in the same period of the previous year. Revenue declined primarily in the voice segment, and this was partially offset by higher non-voice revenue, substantial growth in ICT revenue and increased terminal equipment revenue. Despite increased company transformation related costs, the Group maintained operating expenses at the same level and EBITDA amounted to HRK 1.2 billion. EBITDA before exceptional items was HRK 1.3 billion, a 10.0% decrease primarily due to the revenue decrease and change of revenue structure. Net income totalled HRK 401 million, down 29.5%. Company transformation leading to a more agile, more efficient organization To build the foundations for the future growth and expansion of the Group’s operations, against the backdrop of the protracted economic crisis and continued deterioration of the Croatian telecommunications market, the first six months of the year were characterized by the transformation of the Company. A number of activities were undertaken in order to increase levels of efficiency and customer focus, including the implementation of a new organizational structure and the introduction a new Chief Customer Experience Officer position within the Management Board of HT. To create a more agile, more efficient organization, the number of managerial positions was cut substantially, so that currently HT has 31% fewer managerial positions as compared to the same period of the previous year.
2
A new Collective Agreement was signed with the unions, providing a high level of rights to HT employees, but also reflecting the present economic situation and conditions under which the Group operates. In order to increase infrastructure quality and efficiency, along with cost optimization with regard to construction and maintenance, a non-binding Letter of Intent was signed with Ericsson to outsource the services of construction and maintenance of HT’s infrastructure. In June, HT took over the management of Optima Telekom (OT), as part of the pre-bankruptcy settlement process, to improve OT's market positioning and stabilize its financial performance. This move is aimed at protecting the interests of OT’s customers, as well as bringing stability to the telecom market overall. In the first half of the year, the Croatian telecommunication market was marked by a considerable increase in the annual radiofrequency fee, which impacts HT's operations significantly. The increase in the annual radiofrequency cost is so significant that all present plans for investments and new networks, services and technology development will have to amended to in a way that will result in substantial reductions. In order to decrease the negative impact of such a significant increase in costs and to preserve business sustainability, employment and investments, Croatian Telecom increased its mobile service prices by introducing a network access fee in July. HT continues to invest As one of the leading drivers of economic growth in Croatia, HT continues to invest. In the first half of the year, capital expenditures amounted to HRK 492 million. Investments were primarily directed towards network development, broadband access enhancement and IP transformation aimed at strengthening the technological base of HT. In the first half of the year, Croatian Telecom opened a new data center, representing an investment of HRK 62.5 million. This demanding project was achieved through cooperation between Croatian Telecom and Group Končar. The data center is one of the most advanced in this part of the European Union and is a showcase for Croatian expertise. Davor Tomašković, President of the Management Board of HT: Company transformation is the basis for future growth and expansion of operations Commenting on the results for the first six months of 2014, Davor Tomašković, President of the Management Board and CEO of Hrvatski Telekom, said: „Across the second quarter of 2014, the focus of our activities has been on the transformation of the Company in order to make the organization more flexible, more advanced and fully focused on its customers. “We have undertaken a number of initiatives to achieve a more agile and more efficient organization and thereby build the foundations for the future growth of operations in the domestic market, and for the expansion of our operations across the regional market. “Most of these activities have now been successfully completed and, despite the continued deterioration of our operating environment and the imposition of a new tax, we are maintaining the outlook for 2014 that we announced at the beginning of the year. “
A conference call for analysts and investors will be held at 09:30 UK time / 10:30 CET on the same day.
The conference call dial in details are as follows: International Dial In +44 (0) 1452 555 566 UK Free Call Dial In (from landlines only) 0800 694 0257 Conference ID 69379925
A replay of the call will be available until Wednesday, 6 August 2014 using the following details: International Dial In 44 (0)1452 550 000 UK Free Call Dial In (from landlines only) 0800 953 1533 Replay Access Code 69379925
A presentation covering results for the first six months of 2014 can be downloaded from the T-HT web site (www.t.ht.hr/eng/investors/).
4
1. Review
1.1 Introduction
T-Hrvatski Telekom is Croatia’s largest telecommunications provider and the market leader in all segments in which it operates. At 30 June 2014, the Group served 1.1 million fixed-line customers, 2.3 million mobile subscribers, 620,508 broadband retail access lines and provided TV services to 393,525 customers.
1.2 Market overview
Fixed-line market Fixed telephony remains highly competitive in Croatia, with 13 operators active in the market1. Fixed to mobile substitution is a key market trend in a declining fixed-line market. The number of fixed-line minutes of use (MOU) decreased yoy by 14.4% in Q1 20142. T-HT successfully maintained its leading position in the fixed line market, reflecting the Group’s continuing dedication to high-quality services and improved offers. T-HT submitted to the Croatian Competition Agency (AZTN) a notification of concentration of undertakings by T-HT and Optima Telekom (regarding the acquisition of control over Optima Telekom by HT) in September 2013. Subsequently, on 19 March 2014 the AZTN passed the decision by which the acquisition was conditionally approved. T-HT announced on 18 June 2014 that it had taken over management of Optima Telekom for a period of four years, following the completion of the pre-bankruptcy settlement procedure and the adoption and registration of the decisions by the General Assembly of Optima Telekom. The goal of taking over the management of OT, under terms strictly defined by the AZTN, is to improve the market position of OT and to stabilize the company’s financial performance in order to protect the interests of customers, employees, shareholders and other stakeholders of OT as well as the telecommunications market in general. Consolidation of Optima’s results has been postponed until the next reporting period. Mobile telecommunications The mobile SIM market continues to contract, reaching an estimated penetration rate of 117.2% at the end of June 2014 vs. 118.0% reported for June 2013. The Company’s share of total mobile customers is estimated at 46.3%. Mobile usage continues to grow with total Croatian mobile market minutes of use (MOU) increasing yoy by 8.6% in Q1 2014, while the number of SMSs sent decreased yoy by 2.5%1. Mobile data usage rose as a result of more favourable commercial offers by all three operators alongside increasing smartphone and tablet offers. On 23 May 2014 a threefold increase in the radiofrequency spectrum was introduced by the decision of the Croatian government. The Group maintained a leading market position in a saturated mobile market through its enhanced commercial tariff offers, further extension of the LTE based network coverage and by the new brand-
5
reseller agreement. On 10 May 2014, “24sata” magazine and Hrvatski Telekom launched “24 mobi” offering exclusive media content free of charge for its customers. Internet The Croatian fixed broadband market grew by 3.6% in Q1 2014 reaching 932,6191 fixed broadband connections. DSL is still the dominant broadband technology. At the end of Q2 2014, T-HT Group had 680,377 broadband access lines. The Croatian pay TV market grew by 11% in Q1 2014 reaching 713,211 customers2. The positive trend is expected to continue during 2014. Data HT is maintaining its leading position in a data market that is migrating from traditional data services to more cost-effective, IP-based services. Although the data market is relatively small, it represents an important service for business customers. Wholesale Following the liberalization of the fixed line market, demand for infrastructure services requested by alternative operators remained high in Q2 2014 with a major focus on broadband services. The number of broadband wholesale customers (BSA and Naked BSA) increased to 59,869 at the end of Q2 2014. Due to high churn, the number of Unbundled Local Loops (ULL) and Wholesale Rental Lines (WLR) is stagnating with 171,144 ULLs and 119,790 WLRs at the end of the period. In January 2014, wholesale prices were reduced for the following regulated services: call origination, fixed and mobile call termination. ICT Trends in the Croatian IT market trend in 2014 are dependent on economic pressures, the financing of the state budget and new investments in business. In 2014, some sectors are expected to increase IT services spending as fierce competition forces them to invest into ICT services to remain competitive.
1.3 Economic background
The recession in Croatia continues for the sixth consecutive year. The Croatian GDP growth rate contracted again by 0.4% yoy in Q1 2014 driven by the contraction in personal consumption by 0.5%2. Croatia had the third highest unemployment rate in EU in May 2014 (just behind Greece and Spain).3 According to Croatian Central Bureau of Statistics, the registered unemployment rate at 18.3% in June 2014 was just slightly below the level registered in May 2013 (18.6%). Disposable income reported for May 2014 was almost at the same level as in May 2013 (at an average HRK 5,497, or 0.9% higher in real terms)2. Gradual economic recovery could be driven by a higher rate of exports, reforms in public sector and significant foreign direct investments, but the level to which this can be achieved in 2014 remains to be seen. ___________________ 1 Source: Croatian Post and Electronic Communications Agency 2 Source: Central Bureau of Statistics 3 Source: Eurostat
6
1.4 Regulatory environment
Amendments to the Ordinance on payment of fees for the licence for use of addresses, numbers and radio frequency spectrum On 23 May 2014 the Amendments to the Ordinance on payment of fees for the licence for use of addresses, numbers and radio frequency spectrum was introduced. This ordinance introduced a threefold increase in the annual radio frequency fee as an additional measure of fiscal consolidation on the revenue side of the State Budget. In response to this increase, HT increased the prices of mobile services by introducing a mobile network access fee (as of 1 July for postpaid customers in the amount of 8 kn + VAT; as of 10 July for prepaid customers - 10% of the prepaid voucher denomination).
1.5 Termination of GDR program
At the beginning of July HT has sent Notice to JPMorgan Chase Bank, acting as HT's GDR Depositary, of the termination of HT's GDR Depositary Agreement effective as of 1 October, 2014. GDRs will continue to be traded until that time. HT intends to seek to delist its GDRs from the London Stock Exchange (“LSE”) on the same date. The Company has decided to terminate the GDR program and delist its GDRs from the LSE due to the low number of GDRs in facility and their low trading volume on the LSE, making the economic rationale for continuing to list on the LSE unconvincing. The shares will continue to be listed and tradable on the Zagreb Stock Exchange.
1.6 Change in reporting of operational data
In Q4 2013, the treatment of revenue from default interests and dunning letters was amended and presented as a part of Revenue instead of Other operating income for the whole of 2013. In order to reconcile the presentation of comparable period data with data presented in H1 2014, the following positions in the financial statements for H1 2013 were also reclassified as follows: Other operating income (HRK -34 million), Revenue (HRK +34 million).
1.7 Summary of key financial indicators
in HRK million Q2
2013 Q2
2014 change Jan-Jun
2013 Jan-Jun
2014 change
Revenue 1,756 1,680 -4.3% 3,469 3,288 -5.2%
EBITDA before exceptional items 753 651 -13.6% 1,422 1,280 -10.0%
Exceptional items 0 36 / 60 90 50.1%
EBITDA after exceptional items 753 615 -18.4% 1,362 1,190 -12.6%
Data subscribers (in 000) 2) 1,248 1,368 9.6% 1,248 1,368 9.6% 1) Source: VIPnet's published H1 2013 and Tele2's report for H1 2013. Number of customers for VIPnet and Tele2 for H1
2014 is internally estimated. 2) Mobile data customers refers to SIM cards with recurring and non-recurring data usage, allowing access to internet and
data services through the mobile network infrastructure. Recurring data usage referes to the PSD access data share of voice & data bundle price plans or optins for smarthphones or comparable devices with recurring payment (>1month) and a predefined data volume (incl. flat). Non-recurring data usage refers to revenues from pay-for-use customers using smarthphones or comparable devices.
ULL (Unbundled Local Loop) 169 171 1.1% 169 171 1.1% 1) Includes PSTN, FGSM and old PSTN Voice customers migrated to IP platform; Payphones excluded 2) Payphones excluded 3) Includes ADSL, FTTH and Naked DSL 4) Includes Naked Bitstream + Bitstream 5) Total traffic is generated by fixed retail mainlines as defined in note 1.
Highlights: Undisputed market leadership in all categories Successful value strategy: customers choosing more and more high value for money offers Extended portfolio of services to maximize value for customers
10
Leading through innovation 24 mobi - first media virtual network HOP: attractive handset financing for most innovative devices all times Leading convergence: Max Obitelj (4 play), workplace offers for business customers Leading in content: enriched exclusive TV content (Formula One, HBO premium) Extension of attractive ICT/cloud services portfolio on ICT marketplace Most advanced data center services in new Selska facility
Increased government fee for mobile radio frequency transferred to the customers via price
increase
Mobile telecommunications The mobile customer base decreased by 1.8%, from 2,350,000 customers in H1 2013 to 2,308,000 customers in H1 2014 mainly as a result of aggressive competitive offers and a decrease in customers with double SIM cards, due to the continuing trend of favourable flat and cross net offers. The number of postpaid customers is 6.5% higher than in H1 2013. This has resulted from the promotion of successful and attractive tariffs (Plan, Plan za posao, Plan za tim) and handsets as well as mobile internet offers. Offers such as changes in the Split Contract instalment model, HOP and amendments to the Plan tariffs in March contributed to increased postpaid customer base. HT has further expanded the coverage of its 4G network based on LTE (Long Term Evolution) technology providing its customers from smaller towns and villages access to the fastest mobile internet available. Also, additional promotion of mobile internet tariffs based on the 4G network continued, accompanied by new a higher-value mobile internet portfolio launch (e.g. MAXtv To Go) and attractive offers of the latest tablets. Further strengthening its reputation for innovation, HT was the first to introduce the service HOP - Hoću opet promijeniti (I Want to Change it Again) service, enabling customers to change and upgrade their smartphones at favourable prices within the contract duration. The number of prepaid customers fell 8.2% lower from H1 2013 due to strong competition and the overall decline of prepaid market. The ongoing MNP and retention efforts in the prepaid segment as well as focusing on additional value for HT prepaid customers are being undertaken to mitigate this ongoing decline. The Simpa offer has been further enriched with new internet and 4G options and the “Prejaka Mala” option – with unlimited text messages, 1GB mobile internet and a thousand minutes for cross net calls at a very affordable price (HRK 15 per week). The Simpa option was additionally promoted, offering additional MBs for every top up during the promotional period and attractive Sony smartphones. A new bonbon campaign was introduced, continuing to bring its customers additional value through new attractive 4G mobile internet options. Moreover, bonbon customers can receive 50% discount on the first monthly package for every top up of HRK 80 or 50 % discount on two monthly packages for every top up of HRK 160. In May, in conjunction with 24sata daily, T-HT launched 24mobi, the first media virtual network in this part of Europe. Minutes of usage per average customer in H1 increased by 8.9% compared to the same period last year due to the introduction of flat offers and bundles with a high amount of minutes in postpaid and prepaid tariffs what is in line with overall market trends. Blended ARPU decreased by 6.5% against H1 2013 in a very competitive market driven by attractive offers for customers. Additionally, the economic situation and EU regulations on roaming prices, which started on 1 of July 2013, also impacted ARPU development as well. Fixed line By the end of June 2014, total fixed access mainlines stood at 1,086,000, 7.5% lower than in June 2013 This decline, seen in both segments, was result of the market trend of fixed to mobile and IP substitution, regulation and intensed competition but T-HT further continues with proactive and reactive offers and
11
activities designed to prevent churn. Fixed telephony users generated 819 million of minutes in H1 2014, 22.2% lower than in the same period last year as a result of shrinking customer base and fixed to mobile substitution. Fixed voice ARPA decreased by 9.6% from the same period last year as a result of the above mentioned general market trends. Internet The broadband retail customer base was 1.7% lower than in the same period in the previous year, falling to 621,000, due to stronger competition and aggressive offers in the market. At the same time, broadband retail ARPA was 1.4% lower than in H1 2013. Residential ARPA was 1.9% lower due to migrations to flat packages and bundle offers. In response T-HT has continued to promote MAX2/MAX3 packages and Ultra MAX packages on FTTH accompanied by attractive tablet offers. Business ARPA was 1.2% higher than H1 2013, as a result of upselling of customer to bundles and higher speeds and the launch of new redesigned business MAX2 and MAX3 packages. The TV customer base is growing steadily. As a result of continuous service and program offer improvements, 394,000 customers were achieved at the end of June 2014, a 5.1% increase from June 2013. TV ARPU was up 10.3% on H1 2013, driven by premium content (additional program packages, video on demand etc.) and enriched exclusive TV content with MAX Auto Moto GP (Formula One) and HBO premium (incl. HBO GO streaming service) TV packages. Satellite TV, which is an extension of traditional IPTV service, continues to grow with continuous improvements in the offer providing more value for customers. Satellite TV is expected to contribute significantly to the overall success of pay TV, resulting in 56.3% more customers than in H1 2013. In H1 2014 T-HT promoted its Convergent and Joint Mobile/Fixed service “MAXobitelj”, together with Mobile net+ tariffs and MAX 3 packages followed by a TV campaign communicating the fact that it offers the best sport content and fastest Internet everywhere. Data The number of data lines fell 6.9% compared to H1 2013. Traditional data lines have been decreasing as T-HT focuses on promoting migration to IP based products. Wholesale At the end of June 2014 there were 171,000 active ULL lines and 60,000 broadband wholesale access (DSL and naked DSL lines). The ULL market is still growing, but in comparison to last year growth is slowing down. The number of WLR lines reached 120,000 compared to 108,000 at the end of June 2013. As a consequence of the WLR offer, the number of “pure” CPS customers was reduced to the 17,000 at the end of June 2014 (decrease of 10,000 compared to same period last year). At the end of June 2014, there were 739,000 ported numbers recorded from HT’s fixed network to other fixed networks. Growth in the number of ported numbers compared to last year is mainly connected with growth of ULL and NBSA services. Despite the growth in the total number of WLR and CPS customers, the volume of originated minutes in H1 2014 declined by 9.7% compared to the same period last year. Sales of IP and data services in the national wholesale market increased by 4.0% in volume compared to the same period last year.
12
Visitor roaming services are a major source of international wholesale revenue in the first half of 2014. EU regulated prices applied in retail and wholesale impacted the growth of roaming services usage by foreign visitors in the HT mobile network and by HT retail users abroad. Visitors generated 52.3% more voice minutes and 413.0% more data traffic than last year. At the same time on the wholesale cost side, HT's mobile customers generated 87.8% more roaming voice traffic in foreign countries, 35.4% more SMS and 422.0% more data traffic compared to the same period last year. Total capacity of data and IP services in Croatia and in the region sold to foreign operators increased by 5.0% in capacity contributing to wholesale revenues earned in the international market. The third significant contributor to wholesale international revenue is the termination and transit of international voice traffic. Total international voice traffic volume terminated into the HT mobile network increased in H1 2014 by 12.4% compared to H1 2013, while international traffic toward Croatian fixed networks decreased by 12.6% compared to same period last year. ICT More than 2,371 companies and about 29,340 end users are using T-HT Cloud services. Following continuous engagement and the expansion of the Cloud portfolio in Q2 2014, new services were launched, e.g. Cloud Storage and Waste Management. More than 8,000 units of Fiscal cash registers have been sold; more than 5,400 users are using T-HT Fleet management and there are more than 9,900 Cloud Exchange users. In Q2, the ICT Marketplace portal was upgraded with new improved security features (password complexity and SMS authentication). Combis and HT successfully delivered high valued customized ICT solutions. Combis as a standalone entity contributed to total ICT results mainly as a result of closing some big projects in IT infrastructure, Professional services and Direct banking solutions. In cooperation with the Končar Group, Croatian Telekom introduced one of the highest categorised Data Centers in this part of Europe. The Data Center enables storage and remote monitoring of ICT infrastructure, resulting in significant savings in operations and secure and optimal equipment usage.
3. Group financial performance
3.1 Revenue
in HRK million Q2
2013 Q2
2014 change Jan-Jun
2013 Jan-Jun
2014 change
Voice revenue 854 693 -18.9% 1,674 1,360 -18.8%
Non voice revenue 702 711 1.3% 1,378 1,413 2.6%
Other service revenue 115 152 32.1% 223 281 25.8%
Terminal equipment 47 77 62.7% 98 145 47.9%
Miscellaneous 1) 36 46 27.4% 95 89 -6.9%
Revenue 2) 1,756 1,680 -4.3% 3,469 3,288 -5.2%
13
1) Starting from Q4 2013 revenue from dunning letters and default interests presented in Revenue. Consequently, restatement from Other operating income to Miscellaneous (HRK +34 million) made for H1 2013.
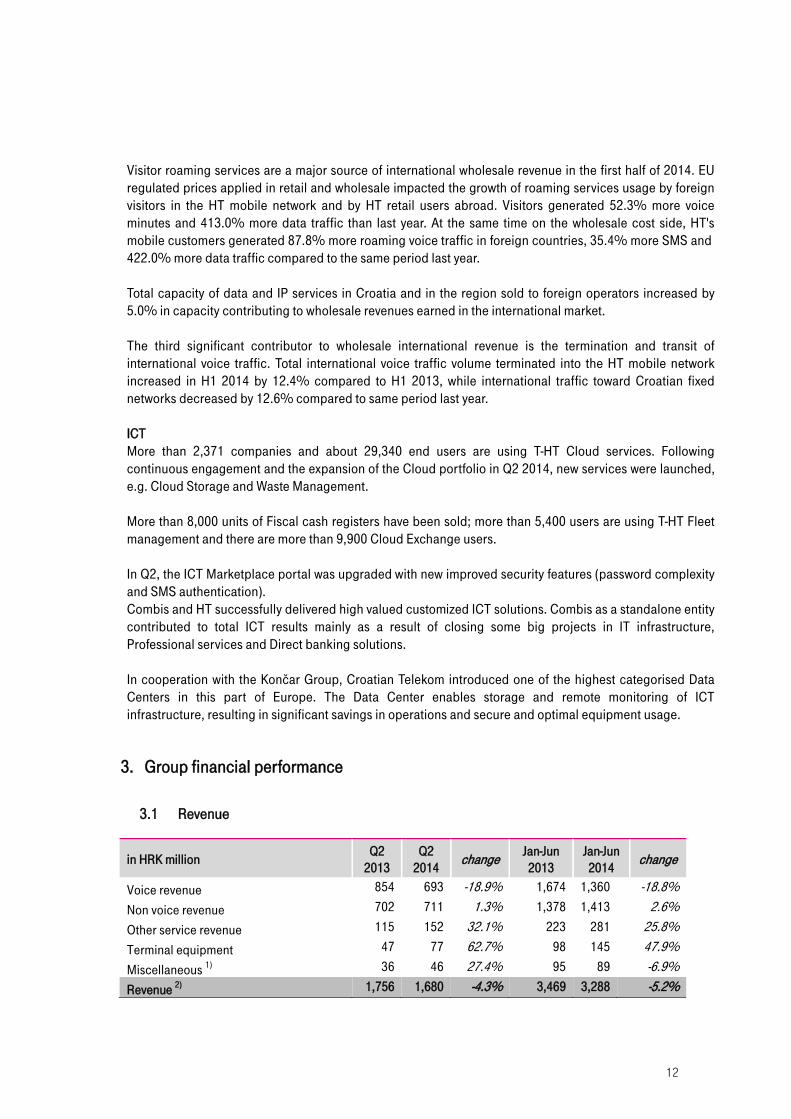
2) Due to new classification of revenue 2013 slightly changed in structure. Total consolidated revenue decreased by 5.2% to HRK 3,288 million in H1 2014 from HRK 3,469 million in H1 2013. The decrease was driven by voice revenue (HRK 315 million) and miscellaneous revenue (HRK 7 million) and partially offset by an increase in other service revenue (HRK 58 million), terminal equipment (HRK 47 million) and non voice revenue (HRK 35 million). This revenue trend is an extension of the negative trend seen in previous years due to the deteriorating economic situation and growing competition as a result of high numbers of flat tariff offers and the strict regulation of the fixed line business. In addition, roaming revenues decreased by HRK 27 million and visitor revenues by HRK 29 million mostly impacted by new EU regulation from 1 July 2013. The contribution of subsidiaries to Group revenue increased and were as follows: Iskon HRK 183 million in H1 2014 (H1 2013: HRK 162 million); Combis HRK 188 million (H1 2013: HRK 153 million). Total consolidated revenue decreased by 4.3% to HRK 1,680 million in Q2 2014 from HRK 1,756 million in Q2 2013. The decrease was driven by voice revenue (HRK 161 million) due to the reasons outlined above. Voice revenue Voice revenue declined by HRK 315 million, or 18.8%, in comparison to H1 2013 and it was driven by lower fixed (HRK 173 million or 19.1% lower) and mobile voice revenue (HRK 142 million, or 18.4%, lower). The negative trend was visible in both business (HRK 170 million, or 27.3%, lower) and residential segment (HRK 145 million, or 13.7%, lower). In H1 2014 fixed retail voice declined by HRK 121 million, or 15.6%. Of the total decrease, HRK 77 million refers to residential (down 13.9) and HRK 44 million to business (down 19.7%). The decline resulted from a fall in retail mainlines by 7.5% compared to the same period last year, the ongoing trend of fixed to mobile substitution due to attractive mobile offers and a tight regulatory environment. Consequently, the number of minutes fell by 22.2% and ARPA declined by 9.6%. The fixed wholesale voice decrease (HRK 52 million, or 40.4%, lower) was mainly driven by lower revenue from international voice services, as international hubbing traffic declined, as well as international mobile termination rate (MTR) from July 2013 (H1 2014: HRK 0.45 vs. H1 2013: HRK 1.28). The mobile voice decline (HRK 142 million, or 18.4%, lower) was visible in both segments: business was HRK 74 million, or 27.5%, lower and residential HRK 68 million, or 13.6%, lower. This negative trend was the result of a decline in mobile termination call (MTC) revenue, a drop in postpaid and prepaid retail revenue, and a decrease in visitor voice. MTC revenue declined by HRK 45 million as a result of price decreases from January 2014 in national mobile to mobile traffic (H1 2014: HRK 0.1282 vs. H1 2013: HRK 0.195), and from July 2013 in international traffic (H1 2014: HRK 0.45 vs. H1 2013: HRK 1.28). The postpaid retail revenue decrease of HRK 49 million came largely from the business segment, while residential was broadly flat to the same period last year. The fall in business (HRK 47 million, or 24.0%) was the result of lower average price of usage in spite of stabile minutes of use per average customer. Although the customer base was 1.9% higher, prices fell due to fierce price competition in a saturated mobile market, amidst a continuously unfavourable macro-economic environment. Additionally, EU regulation as of 1 July 2013, led to lower prices in roaming. As a result of these factors ARPU declined.
14
Prepaid retail revenue saw a decrease of HRK 34 million, or 16.2%, caused by an 8.2% lower customer base and lower average revenue per customer. The customer base fell on aggressive mobile number portability (MNP) offers in the market in the first quarter and increased efforts to migrate prepaid to postpaid (prepaid to postpaid migration rose by 17.5% from H1 2013). In addition, a lower number of recharges led to an ARPU drop. Visitors revenue declined by HRK 14 million, or 37.2%, compared to Q2 2013, due to lower prices (the implementation of EU regulation from 1 of July), although voice traffic increased. In Q2 2014, voice revenue recorded a decline of HRK 161 million, or 18.9%, driven by lower fixed voice revenue (HRK 85 million, or 19.0%, lower) and mobile (HRK 76 million, or 18.8%, lower). This negative trend was visible in both business (HRK 90 million, or 28.1%, lower) and residential segment (HRK 71 million, or 13.3%, lower). Fixed retail voice declined by HRK 57 million, or 15.0%. Out of this decline, HRK 35 million refers to residential and HRK 22 million to business. This was the outcome of the factors that also impacted H1 2014 fixed retail voice revenue. Consequently, the number of minutes dropped by 22.1% and ARPA declined by 8.3%. A fall in in fixed wholesale voice (HRK 28 million, or 41.8%) was mainly driven by lower revenue from international voice services, as international hubbing traffic declined, and international MTR from July 2013 as well (Q2 2014: HRK 0.45 vs. Q2 2013: HRK 1.28). A decline in mobile voice (HRK 76 million, or 18.8%) resulted from both segments: business was HRK 40 million, or 27.9%, lower; and residential was HRK 36 million, or 13.8%, lower. The negative trend resulted from a fall in postpaid and prepaid retail revenue, lower MTC revenue and visitor revenue. Non voice revenue Non voice revenue increased by HRK 35 million, or 2.6%, in the first half of year in comparison to the same period last year. This positive trend is the result of an increase of mobile data revenue (HRK 68 million), TV (HRK 26 million) and infrastructure revenue (HRK 15 million). Mobile data growth was the result of the continuing trend of substitution of traditional voice and SMS services with data, a higher number of data traffic included in tariff bundles and increasing share of customers having smartphones. Higher number of customers in Plan tariffs with included multimedia and large data packages is contributing to data revenue growth. An increase in TV revenue was driven by a 5.1% rise in TV customers as well as higher TV average revenue per user, which rose 10.3%. This resulted from the additional promotion of packages and Satellite TV customer acquisition activities (especially in rural areas). At the same time, the attractive “MAXobitelj” offer continued throughout the first half of the year, supporting the promotion of TV services. The increase in infrastructure services revenue resulted from growth in the customer base (ULL, WLR, NBSA, BSA) despite NBSA and BSA price decreases.
15
This positive development was partially offset by lower SMS revenue (HRK 29 million), visitor revenue (HRK 16 million), traditional data (HRK 9 million), ADSL (HRK 9 million) and other fixed revenue (HRK 11 million). The drop recorded in visitor revenue resulted from lower prices (due to the implementation of EU regulation from 1 of July), although usage increased. The decrease in traditional data revenue was driven by a migration to IP data and price competition on the Ethernet market. Lower ADSL revenue resulted from lower broadband customer base, down 1.7%, and ARPA, which fell 1.4%, related to customer migration to flat packages and bundle offers. Other fixed revenue decreases were mostly related to lower prices in international wholesale data and lower VPN fixed revenue. Of the total increase in non voice revenue, HRK 51 million refers to residential, while business fell HRK 16 million, mostly due to lower visitors revenue. Non voice revenue increased by HRK 9 million, or 1.3%, in Q2 2014 in comparison to Q2 2013. This was driven by an increase in fixed of HRK 5 million and in mobile of HRK 4 million. Of the total increase, HRK 23 million refers to the residential segment, while business was HRK 14 million lower, mostly due to a lower visitors revenue. Growth in fixed came largely from higher wholesale revenue (HRK 4 million) mostly driven by higher infrastructure, while the mobile increase was driven by data revenue (HRK 30 million), with decreasing visitors (HRK 14 million) and SMS revenue (HRK 12 million). Other service revenue Other service revenue rose HRK 58 million, or 25.8%, in comparison to H1 2013, driven by higher ICT revenue (HRK 55 million). ICT revenue growth was mainly in Combis IT infrastructure and professional services (HRK 35 million), and HT specific ICT solutions for key accounts (HRK 20 million). In Q2 2014, an increase in other service revenue by HRK 37 million, or 32.1%, in comparison to Q2 2013, was driven by higher ICT revenue (HRK 36 million). Combis contributed HRK 24 million, mainly due to an increase in revenue generated from IT infrastructure and professional services, while HT generated HRK 11 million, mainly due to Cloud and hardware reselling solutions. Terminal equipment Terminal equipment revenue increased by HRK 47 million, or 47.9%, in comparison to H1 2013, of which HRK 40 million (up 60.1%) refers to residential, while HRK 7 million (up 21.8%) was seen in the business segment. The increase was primarily seen in mobile as a result of the introduction of split contracts (entire handset revenue recognized at the moment of handset sale to the customer). In Q2 2014, terminal equipment revenue increased by HRK 30 million, or 62.7%, in comparison to Q2 2013. Of the total increase, HRK 25 million refers to residential (up 75.1%), while HRK 5 million (up 34.1%) was from business. This increase was mainly driven by mobile as a result of the introduction of split contracts. Miscellaneous A decline in miscellaneous (HRK 7 million, or 6.9%) in comparison to H1 2013, was mainly driven by lower national roaming revenue due to lower prices (HRK 10 million) but was partially offset by higher revenue from the energy business (HRK 2 million), which started in Q4 2013.
16
In Q2 2014, miscellaneous increased HRK 10 million, or 27.4%, in comparison to Q2 2013. This resulted primarily from higher national roaming (HRK 5 million) and energy business revenue. National roaming revenue was higher due to discounts posted in April 2013, the result of new lower prices retroactively applied from January 2013 due to new contracts.
3.2 Operating expenses
Total consolidated operating expenses decreased by 0.3% (HRK 5 million) to HRK 2,166 million in H1 2014. This decrease mainly resulted from lower material expenses, higher capitalized work performed by the Group and a fall in other expenses. The decline in these costs was largely offset by higher employee benefits expenses and asset write downs. Total consolidated operating expenses increased by 4.1%, or HRK 43 million, to HRK 1,093 million in Q2 2014 from HRK 1,050 million in Q2 2013. This increase was primarily driven by higher employee benefits expenses (HRK 30 million), material expenses (HRK 17 million) and other expenses (HRK 7 million). The fall was partially offset by a lower write down of assets (HRK 7 million) and an increase in capitalized work performed by the Group (HRK 5 million).
3.2.1 Material expenses
Material expenses decreased to HRK 933 million in H1 2014 from HRK 950 million in H1 2013 as a result of lower service expenses (HRK 88 million) and were partially offset by higher merchandise, material and energy expenses (HRK 71 million). A decrease in services expenses of 19.2% mainly resulted from lower telecommunication costs and copyright fees. International telecommunication costs declined (HRK 55 million) mainly due to lower international hubbing traffic and lower average roaming unit cost as a result of EU roaming regulation introduced as of 1 July 1 2013. The negative impact of lower average roaming unit costs was partially offset by higher usage. Domestic telecommunication costs declined (HRK 21 million), mainly due to lower FTR and MTR, combined with a decrease in traffic. Lower copyright fees (HRK 10 million), driven by the residential segment, resulted from a higher share of capitalized content rights contracts. However, there was also a higher number of TV customers and of additional TV packages, especially sport and HBO packages. Merchandise costs increased (HRK 82 million), mainly driven by higher ICT and mobile merchandise costs, while fixed merchandise was down compared to the same period last year. ICT merchandise increased in line with revenue development. Mobile merchandise costs increased, mostly in the residential segment due to a higher number of acquired customers in postpaid and retained customers taking handsets. The increase was also due to a higher share of high value handsets sold, partially due to the introduction of the split contract model. A decrease in the fixed segment was mainly the result of lower residential customer acquisition and retention related merchandise costs, due to a changed approach in marketing campaigns from the previous year. In Q1 2013 there was strong ADSL retention campaign.
17
Material expenses increased from HRK 458 million in Q2 2013 to HRK 476 million in Q2 2014 as a result of higher merchandise, material and energy expenses (HRK 60 million), offset by lower service expenses (HRK 42 million). The merchandise costs increase (HRK 69 million) was mainly driven by higher mobile merchandise costs and higher ICT merchandise, while fixed merchandise costs were lower, compared to Q2 2013, due to the reasons outlined above. Services expenses decreased by 18.5%, or HRK 42 million, mainly from lower telecommunication costs (HRK 36 million) and copyright fees (HRK 4 million). International telecommunication cost decreased (HRK 23 million), mainly due to lower international hubbing traffic and average roaming unit cost decline which was partially offset by higher usage. Domestic telecommunication cost decreased (HRK 13 million), mainly due to lower FTR and MTR combined with traffic decrease. Copyright fees are lower by HRK 4 million mainly as a result of higher content capitalization.
3.2.2 Employee benefits expenses
Total employee benefits expenses increased by 3.3% to HRK 623 million in H1 2014 from HRK 603 million in H1 2013, mainly due to costs for headcount redundancies which in H1 2014 increased to HRK 90 million, while in the same period last year had totalled HRK 60 million. Excluding redundancy costs, employee benefits expenses decreased by HRK 10 million in spite of an increase in the contribution to salaries due to the amended Salaries Contribution Law as of 1 April 2014. The number of FTE decreased to 5,413 in H1 2014 from 5,609 in H1 2013, mainly as a result of the Headcount Restructuring program as well as the effect of reorganization, of which the impact is partially offset by new employments arising from company transformation initiatives. Total employee benefits expenses increased by 10.9% to HRK 307 million in Q2 2014 from HRK 277 million in Q2 2013. The rise was primarily driven by costs for headcount redundancy, which in Q2 2014 amounted to HRK 36 million, while in Q2 2013 there were none. Excluding redundancy costs, employee benefits expenses decreased by HRK 5 million.
3.2.3 Other expenses
Other expenses slightly decreased by 0.3%, or HRK 2 million, to HRK 603 million in H1 2014 mainly due to an decrease in advertising, rental and leasing and sales commissions costs partially offset by costs related to company restructuring. In Q2 2014, other expenses increased by 2.4%, or HRK 7 million, to HRK 315 million due to costs related to company restructuring.
3.3 Write down of assets
Assets write downs increased by 8.9%, or HRK 4 million, to HRK 45 million in H1 2014 mainly due to adjusted receivables related to wholesale operators.
18
In Q2 2014, assets write downs decreased by 25.0%, or HRK 7 million, to HRK 20 million. This decrease was mainly the result of the lower value of adjusted receivables driven by the wholesale segment (HRK 6 million).
3.4 Depreciation and amortization
Depreciation and amortization rose over the same period in 2013 by 3.6% (H1 2014: HRK 660 million; H1 2013: HRK 637 million) mainly due to higher content capitalization. In Q2 2014, depreciation and amortization were 4.7% higher than the same quarter last year (Q2 2014: HRK 335 million; Q2 2013: HRK 320 million).
3.5 T-HT Group profitability
in HRK million Q2
2013 Q2
2014 change Jan-Jun
2013 Jan-Jun
2014 change
Revenue 1,756 1,680 -4.3% 3,469 3,288 -5.2%
EBITDA before exceptional items 753 651 -13.6% 1,422 1,280 -10.0%
Exceptional items 1) 0 36 / 60 90 50.1%
EBITDA after exceptional items 753 615 -18.4% 1,362 1,190 -12.6%
Net profit margin 18.9% 12.1% -6.8 p.p. 16.4% 12.2% -4.2 p.p1) Exceptional items refer to redundancy costs totalling HRK 90 million in H1 2014 and HRK 60 million in H1
2013. Other operating income increased by HRK 4 million compared to H1 2013, mainly as a result of higher income from penalties and fees related to a court decision on the collection process and higher copper cable sales, partially offset by lower real estate sales. As a result of decreased revenue and higher redundancy costs, EBITDA fell 12.6% to HRK 1,190 million, with the margin at 36.2%. EBITDA before exceptional items decreased by 10.0%, or HRK 142 million, to HRK 1,280 million in H1 2014 mainly as a result of lower revenue and lower operating expenses. Consolidated net profit decreased by 29.5% to HRK 401 million in H1 2014 from HRK 570 million in H1 2013. This decrease was primarily a result of lower EBITDA, along with higher depreciation and amortization and net financial income lower due to lower income from interest on cash at the bank and lower exchange rate gains. In Q2 2014, EBITDA decreased by 18.4% to HRK 615 million, mainly due to the revenue decrease combined with lower other operating income, and higher operating expenses including redundancy costs that in 2013 were not booked in Q2.
19
In Q2 2014, EBITDA before exceptional items decreased by 13.6%, or HRK 103 million, to HRK 651 million mainly due to lower revenue and other operating income. Other operating income decreased by HRK 20 million, mainly as a result of lower real estate sales. In Q2 2014, consolidated net profit decreased by 38.9% to HRK 203 million from HRK 332 million in Q2 2013. This decrease was primarily a result of lower EBITDA and further impacted by higher depreciation and amortization and lower net financial income.
3.6 Balance sheet
The total value of assets decreased by 4.9% in comparison to the last year end, primarily driven by current assets. The fall in current assets of 10.4% was mostly due to the dividend payment in May 2014. Total non-current assets decreased by 1.2%, mainly due to lower investments in property plant and equipment. Total issued capital and reserves decreased to HRK 10,366 million at 30 June 2014 from HRK 10,700 million at 31 December 2013, mainly due to the dividend payment in May 2014 in the amount of HRK 736 million and realized net profit for 2014 in amount of HRK 401 million. An increase of HRK 694 million in ordinary share capital was due to partial reinvestment of profit for 2013. Total non-current liabilities increased by 13.5% as a result of higher liabilities for retransmission rights. Total current liabilities decreased to HRK 1,513 million at 30 June 2014 from HRK 1,844 million at 31 December 2013, mainly due to the settlement of higher payables for capital expenditures and international traffic at year end.
3.7 Cash flow
Cash flow from operating activities is T-HT Group’s principal source of funds enabling the Company to finance capital investments and dividend distributions. In H1 2014, net cash flow from operating activities decreased by 25.2% compared to H1 2013, mainly due to decreased volume of trade payables in 2014 coming from higher capital expenditures in 2013 settled in 2014, and lower capital expenditures in 2014. This was partially offset by lower volume of trade receivables in 2014 resulting mainly from lower roaming prices and receivables from visitors. In addition, receivables from pre-bankruptcy settlements have been converted to financial investments. Net cash flow from investing activities increased by 419.6%, mainly as a result of significantly higher maturity of financial assets (time deposits) in H1 2014 and due to lower capital expenditures in H1 2014.
20
Net cash flow from financing activities decreased by HRK 733 million, mainly due to the dividend payment in May 2014 in the amount of HRK 736 million (the previous year’s dividend payment was in July).
Capital expenditure of HRK 492 million in H1 2014 was down 19.6%, or HRK 120 million, from the same period in 2013 due to absence of one-off real estate investments and shift of investments in IT and Network platforms areas to H2 2014.
In 2014, T-HT continues to focus on the further development of the network infrastructure, increasing broadband access capacity and availability, enabling IP transformation of network and technology basis of the Company to secure business continuity and long-term sustainability of T-HT’s leading market position. T-HT is continuing its strategic mobile broadband deployment project, enabling outperformance in comparison to its competition in mobile broadband with respect to coverage, capacity, scalability, performance of network as well as continuation of the single RAN project. Modernization of the radio access network project has been completed, with 99.7% of total mobile access locations modernized. At the end of Q2 2014, T-HT’s 4G network reached 36% of population and its 3G network had 77% population coverage. The implementation of the all-IP service platform is a strategic priority for the business transformation initiative in the period from 2012 to 2015. T-HT is continuing its strategic PSTN migration project, enabling fixed voice service continuity with the efficient transformation from obsolete TDM technology to IP. At the end of Q2 2014, 58.1% customers had been migrated. The ongoing MPLS modernization project is enabling new IP Broadband Services provisioning and higher network quality / performance. In the HT Metro Ethernet Network, 18 new 10Gbps IP routers were installed and in total 16 out of 28 sites planned for 2014 have been migrated. IT activities and accomplishments are focused on the technological establishment of a ‘digital company’ business model and transformation to 'on-line' business model, convergence of the business portfolio and consolidation of information systems and business support (projects include: Energy services, DWH fix enabler, split contract, etc.). In Q2 2014, capital expenditure was HRK 304 million, or 22.4%, lower than in Q2 2013.
21
4. Overview of segment profitability
4.1 Residential Segment
in HRK million Q2
2013 Q2
2014 change Jan-Jun
2013 Jan-Jun
2014 change
Voice revenue 533 462 -13.3% 1.053 908 -13.7%
Non voice revenue 423 446 5.5% 837 888 6.1%
Other service revenue 0 1 135.8% 1 3 114.8%
Terminal equipment 33 58 75.1% 67 107 60.1%
Miscellaneous 1) 12 14 22.5% 24 27 8.9%
Total Revenue 2) 1.001 982 -2.0% 1.983 1.933 -2.5%
Operating expenses 3) 306 318 4.1% 638 612 -4.1%
Contribution to EBITDA before EI 696 664 -4.6% 1.345 1.320 -1.8% 1) Starting from Q4 2013 revenue from dunning letters and default interests presented in Revenue.
Consequently, restatement from Other operating income to Miscellaneous (HRK +17 million) made for H1 2013.
2) Due to new classification of revenue 2013 slightly changed in structure. 3) Operating expenses per segment for 2013 changed in comparison to originally reported in 2013 due to
organisatinal changes in 2014.
4.2 Business Segment
in HRK million Q2
2013 Q2
2014 change Jan-Jun
2013 Jan-Jun
2014 change
Voice revenue 321 231 -28.1% 621 451 -27.3%
Non voice revenue 279 265 -5.1% 541 525 -2.9%
Other service revenue 115 151 31.6% 222 278 25.3%
Terminal equipment 14 19 34.1% 31 38 21.8%
Miscellaneous 1) 25 32 29.7% 71 62 -12.2%
Total Revenue 2) 754 698 -7.4% 1.486 1.355 -8.8%
Operating expenses 3) 325 334 2.7% 650 671 3.2%
Contribution to EBITDA before EI 429 364 -15.1% 836 684 -18.2% 1) Starting from Q4 2013 revenue from dunning letters and default interests presented in Revenue.
Consequently, restatement from Other operating income to Miscellaneous (HRK +17 million) made for H1 2013.
2) Due to new classification of revenue 2013 slightly changed in structure. 3) Operating expenses per segment for 2013 changed in comparison to originally reported in 2013 due to
organisational changes in 2014.
22
4.3 Network and support functions
in HRK million Q2
2013 Q2
2014 change Jan-Jun
2013 Jan-Jun
2014 change
Other operating income 1) 17 41 139.9% 65 69 6.1%
Operating expenses 404 388 -4.0% 823 793 -3.7%
Contribution to EBITDA before EI -387 -347 10.4% -758 -724 4.5% 1) Starting from Q4 2013 revenue from dunning letters and default interests presented in Revenue.
Consequently, restatement from Other operating income to Miscellaneous (HRK -34 million) made for H1 2013
2) Operating expenses per segment for 2013 changed in comparison to originally reported in 2013 due to organisational changes in 2014.
5. Risk management
Besides the business and regulatory developments detailed in this statement, and in audited financial statements for 2013 made public, there were no material changes to the Group’s risk profile in the period under review.
23
6. Group 2014 outlook
Revenue The Croatian economy remains sluggish, with no sign of recovery still since entering recession in 2009. Unemployment has remained at high levels, with many companies undertaking restructuring measures while both public debt and the budget deficit have increased. Current expectations are for slightly negative GDP growth in 2014 as well. Telecommunication spending in both the residential and corporate sectors has also tightened while competitive pressure and a stringent domestic and EU regulatory regime continue to exert pressure on the Group’s business. Despite this economic environment, with a stronger contribution from the Group’s near core and new businesses and in the absence of major one off negative impact from roaming revenues as seen in previous year, the pace of decline in Group revenue is expected to slow. EBITDA before exceptional items The economic environment and revenue trends outlined above, along with changes in the revenue structure, will impact EBITDA accordingly. As a result, the Group expects a 2014 EBITDA margin of between 39% and 41%. Investments T-HT Group has identified the need for a significant strategic shift with respect to investment, aimed at halting the downward trend in the performance of the business. To implement this strategy, the T-HT Group will intensify and focus its investment on infrastructure, customer processes and services whilst monitoring business expansion opportunities in both domestic and regional markets. Consequently capex investment amounting to more than HRK 1 billion is again expected in 2014.
24
7. T-HT Group Financial statements
7.1 Consolidated Income Statement
in HRK million (IFRS HT accounting policies)
Q2 2013
Q2 2014
change Jan-Jun 2013
Jan-Jun 2014
change
Voice revenue 854 693 -18.9% 1,674 1,360 -18.8%
Non voice revenue 702 711 1.3% 1,378 1,413 2.6%
Other service revenue 115 152 32.1% 223 281 25.8%
Terminal equipment 47 77 62.7% 98 145 47.9%
Miscellaneous 1) 36 46 27.4% 95 89 -6.9%
Revenue 2) 1,756 1,680 -4.3% 3,469 3,288 -5.2%
Other operating income 1) 48 28 -41.5% 65 69 6.1%
Total operating revenue 1,803 1,708 -5.3% 3,534 3,356 -5.0%
Depreciation and amortization 320 335 4.7% 637 660 3.6%
EBIT 433 280 -35.4% 725 530 -26.9%
Financial income 10 2 -84.6% 29 15 -47.8% Income/loss from investment in joint ventures
7 4 -46.9% 10 4 -61.5%
Financial expenses 34 31 -11.2% 48 49 0.2%
Profit before taxes 416 255 -38.8% 716 501 -30.1%
Taxation 84 52 -38.3% 146 99 -32.0%
Net profit 332 203 -38.9% 570 401 -29.5%
Exceptional items 0 36 - 60 90 50.1%
EBITDA before exceptional items 753 651 -13.6% 1,422 1,280 -10.0% 1) Starting from Q4 2013 revenue from dunning letters and default interests presented in Revenue.
Consequently, restatement from Other operating income to Miscellaneous (HRK +34 million) made for H1 2013.
2) Due to new classification of revenue 2013 slightly changed in structure.
25
7.2 Consolidated Balance Sheet
in HRK million (IFRS HT accounting policies)
At 31 Dec 2013
At 30 Jun 2014
Change
Intangible assets 1,358 1,358 0.0%
Property, plant and equipment 5,570 5,402 -3.0%
Non-current financial assets 594 650 9.3%
Receivables 126 143 13.7%
Deferred tax asset 60 60 0.2%
Total non-current assets 7,708 7,612 -1.2%
Inventories 115 136 18.5%
Receivables 1,457 1,335 -8.4%
Current financial assets 1,352 431 -68.1%
Cash and cash equivalents 2,039 2,551 25.1%
Prepayments and accrued income 149 128 -14.4%
Total current assets 5,112 4,581 -10.4%
TOTAL ASSETS 12,820 12,193 -4.9%
Subscribed share capital 8,189 8,883 8.5%
Reserves 409 409 0.1%
Revaluation reserves -1 0 109.7%
Retained earnings 662 672 1.6%
Net profit for the period 1,442 401 -72.2%
Total issued capital and reserves 10,700 10,366 -3.1% Provisions 132 132 -0.6%
Non-current liabilities 142 180 26.9%
Deferred tax liability 2 2 0.0%
Total non-current liabilities 276 314 13.5%
Current liabilities 1,724 1,371 -20.5%
Deferred income 120 117 -2.8%
Provisions for redundancy 0 26 -
Total current liabilities 1,844 1,513 -17.9%
Total liabilities 2,120 1,827 -13.8%
TOTAL EQUITY AND LIABILITIES 12.820 12.193 -4.9%
26
7.3 Consolidated Cash Flow Statement
in HRK million (IFRS HT accounting policies) Jan-Jun 2013 Jan-Jun 2014 change
Profit before tax 716 501 -30.1%
Depreciation and amortization 637 660 3.6%
Increase / (decrease) of current liabilities 179 -216 -220.3%
(Increase) / decrease of current receivables -120 83 168.9%
(Increase) / decrease of inventories -45 -21 52.4%
Other cash flow increases/ decreases -294 -204 30.7%
Net cash inflow/outflow from operating activities 1,073 803 -25.2%
Proceeds from sale of non-current assets 44 0 -99.4%
Proceeds from sale of non-current financial assets
1 1 -16.7%
Interest received 16 11 -34.6%
Other cash inflows from investing activities 493 1.098 122.9% Total increase of cash flow from investing activities
554 1,110 100.4%
Purchase of non-current assets -612 -492 19.6%
Purchase of non-current financial assets -75 -76 -0.9% Other cash outflows from investing activities -7 -93 -1211.9%
Total decrease of cash flow from investing activities
-694 -661 4.7%
Net cash inflow/outflow from investing activities -140 448 419.6%
Total increase of cash flow from financing activities
0 0 -
Repayment of loans and bonds -2 0 99.7%
Dividends paid 0 -736 -
Repayment of finance lease -3 -2 39.4%
Other cash outflows from financing activities 0 0 -100.0%
Total decrease in cash flow from financing activities
-5 -738 -15779.7%
Net cash inflow/outflow from financing activities -5 -738 Exchange gains/losses on cash and cash equivalents
-10 -2 83.2%
Cash and cash equivalents at the beginning of period
3.146 2.039 -35.2%
Net cash (outflow) / inflow 918 511 -44.3%
Cash and cash equivalents at the end of period 4,064 2,551 -37.2%
Network and Support Functions -371 -377 -1.6% -758 -724 4.5%
Total Contribution to EBITDA before SI of the Segments
753 651 -13.6% 1,422 1,280 -10.0%
Special influences 0 36 - 60 90 50.1%
Total EBITDA 753 615 -18.4% 1,362 1,190 -12.6%
7.5 Group’s revenue breakdown under former reporting structure
in HRK million Q2
2013 Q2
2014 change Jan-Jun
2013 Jan-Jun
2014 change
Mobile 1) 722 688 -4.8% 1,403 1,325 -5.5%
Fixed Telephony 366 309 -15.4% 744 625 -16.1%
Wholesale 142 118 -17.0% 277 233 -15.7%
IP Revenue 389 397 2.1% 776 791 1.9%
Data 26 20 -20.7% 53 43 -17.9%
ICT 101 137 35.5% 195 250 28.4%
Miscellaneous1) 10 8 -15.8% 22 16 -24.1%
Energy 0 2 - 0 2 -
Other non telco services 0 1 - 0 2 - Revenue 1,756 1,680 -4.3% 3,469 3,288 -5.2%
1) Starting from Q4 2013 revenue from dunning letters and default interests presented in Revenue. Consequently, restatement from Other operating income to Mobile revenue (HRK +17 million) and Miscellaneous (HRK +17 million) was made for H1 2013.
7.6 Statement of changes in Equity
Position AOP Previous year Current year
1 2 3 4
1. Subscribed share capital 001 8.188.853.500 8.882.853.500
2. Capital reserves 002 0 0
3. Reserves from profit 003 409.056.013 409.346.546
4. Retained earnings or loss carried forward 004 661.832.263 672.381.787
5. Net profit or loss for the period 005 1.441.510.961 401.441.532
6. Revaluation of tangible assets 006 0 0
7. Revaluation of intangible assets 007 0 0
8. Revaluation of available for sale assets 008 -1.151.584 111.197
9. Other revaluation 009 0 0
10. Total equity and reserves (AOP 001 to 009) 010 10.700.101.153
10.366.134.562
11. Foreign exchange differences from foreign investments 011 0 0
28
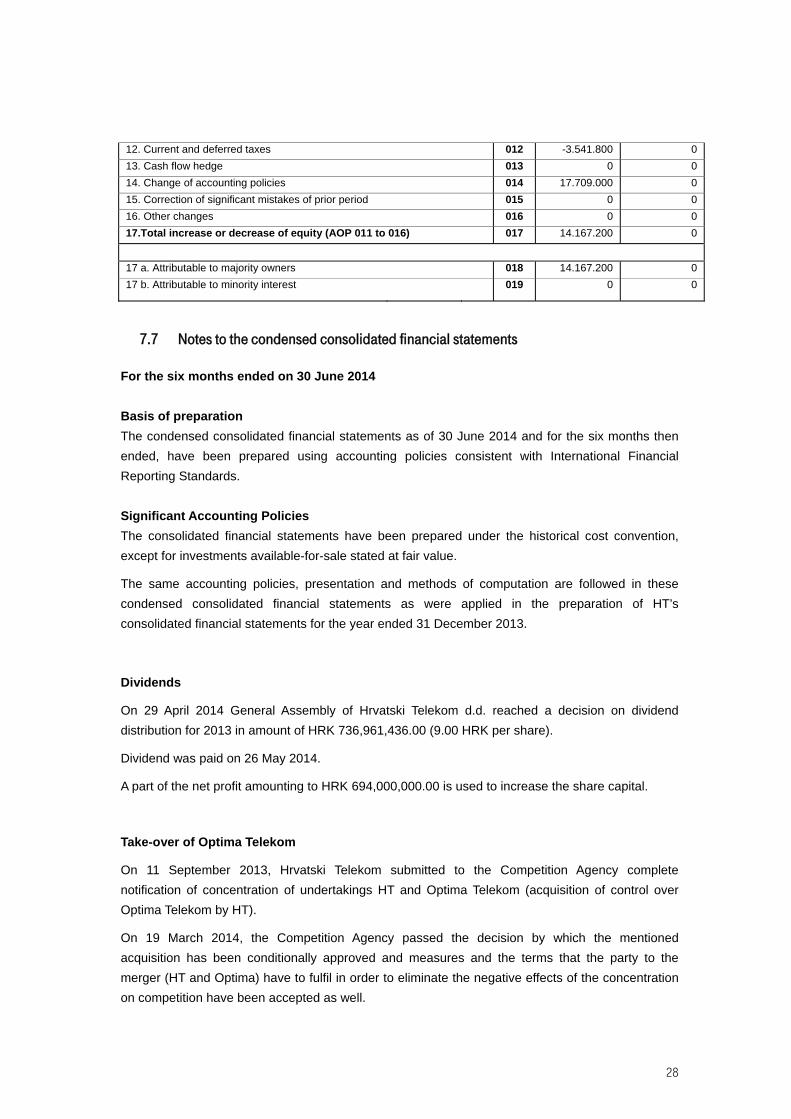
12. Current and deferred taxes 012 -3.541.800 0
13. Cash flow hedge 013 0 0
14. Change of accounting policies 014 17.709.000 0
15. Correction of significant mistakes of prior period 015 0 0
16. Other changes 016 0 0
17.Total increase or decrease of equity (AOP 011 to 016) 017 14.167.200 0
17 a. Attributable to majority owners 018 14.167.200 0
17 b. Attributable to minority interest 019 0 0
7.7 Notes to the condensed consolidated financial statements
For the six months ended on 30 June 2014
Basis of preparation
The condensed consolidated financial statements as of 30 June 2014 and for the six months then
ended, have been prepared using accounting policies consistent with International Financial
Reporting Standards.
Significant Accounting Policies
The consolidated financial statements have been prepared under the historical cost convention,
except for investments available-for-sale stated at fair value.
The same accounting policies, presentation and methods of computation are followed in these
condensed consolidated financial statements as were applied in the preparation of HT’s
consolidated financial statements for the year ended 31 December 2013.
Dividends
On 29 April 2014 General Assembly of Hrvatski Telekom d.d. reached a decision on dividend
distribution for 2013 in amount of HRK 736,961,436.00 (9.00 HRK per share).
Dividend was paid on 26 May 2014.
A part of the net profit amounting to HRK 694,000,000.00 is used to increase the share capital.
Take-over of Optima Telekom
On 11 September 2013, Hrvatski Telekom submitted to the Competition Agency complete
notification of concentration of undertakings HT and Optima Telekom (acquisition of control over
Optima Telekom by HT).
On 19 March 2014, the Competition Agency passed the decision by which the mentioned
acquisition has been conditionally approved and measures and the terms that the party to the
merger (HT and Optima) have to fulfil in order to eliminate the negative effects of the concentration
on competition have been accepted as well.
29
HT announced on 18 June 2014, that it took over management of Optima Telekom for the period of
4 years, following the completion of the pre-bankruptcy settlement procedure and the adoption and
registration of the decisions by the General Assembly of Optima Telekom. Consolidation of Optima’s
results is prolonged for next period.
Segment information
Business reporting format is determined to be Residential, Business and Network and Support
Function segments as the Group’s risks and rates of return are affected predominantly by
differences in the market and customers. The segments are organised and managed separately
according to the nature of the customers and markets that the services rendered, with each
segment representing a strategic business unit that offers different products and services.
The Residential Segment includes marketing, sales and customer services, focused on providing
mobile, fixed line telecommunications and TV distribution services to residential customers.
The Business Segment includes marketing, sales and customer services, focused on providing
mobile and fixed line telecommunications and systems integration services to corporate customers,
small- and medium-sized businesses and the public sector. The Business Segment is also
responsible for the wholesale business in both fixed and mobile services.
The Network and Support Functions performs cross-segment management and support functions,
and includes the Technology, Procurement, Accounting, Treasury, Legal and other central functions.
The Network and Support Functions is included in segment information as a voluntary disclosure
since it does meet the criteria for an operating segment.
The Management Board, as the chief operating decision maker, monitors the operating results of
business units separately for the purpose of making decisions about resource allocation and
performance assessment. Segment performance is evaluated based on contribution margin II or
segment results (as calculated in the table below).
The Group’s geographical disclosures are based on the geographical location of its customers.
Management of the Group does not monitor assets and liabilities by segments and therefore this
information has not been disclosed.
Fully owned subsidiaries Iskon Internet, Combis, KDS and E-tours are consolidated within the
respective operating segments.
30
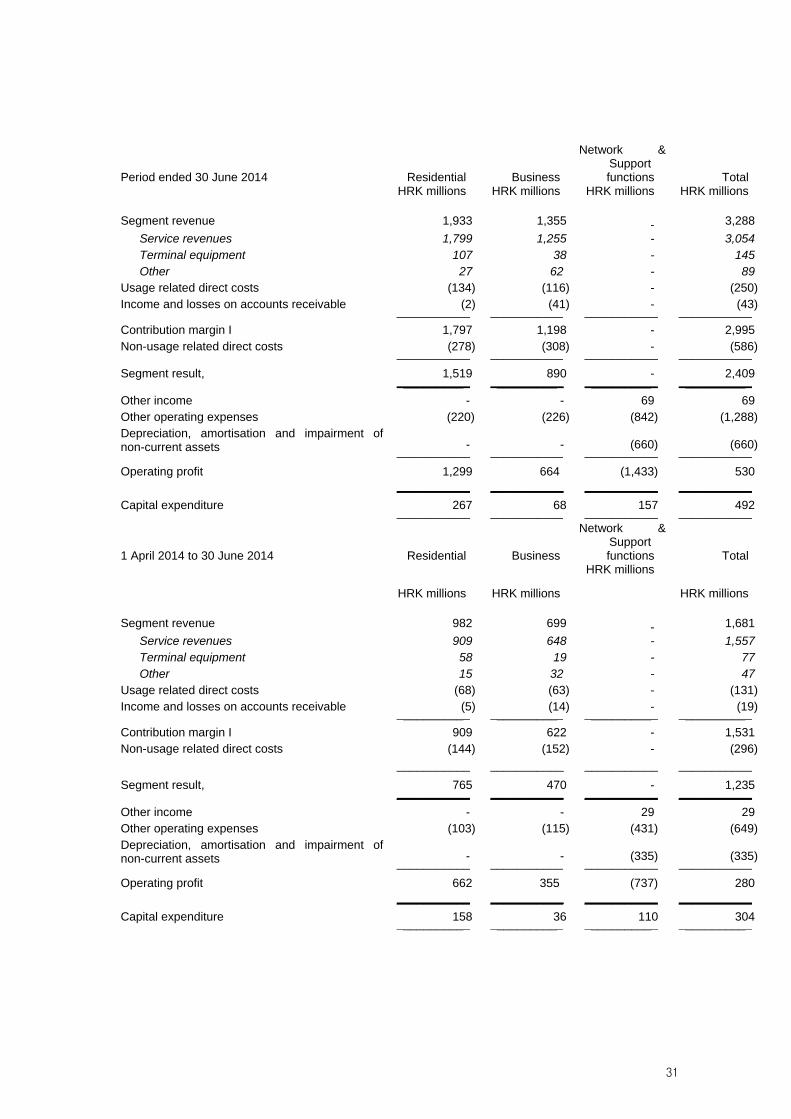
The following tables present revenue and direct cost information regarding the Group’s segments:
Period ended 30 June 2013 Residential Business
Network & Support functions Total
HRK millions HRK millions HRK millions HRK millions
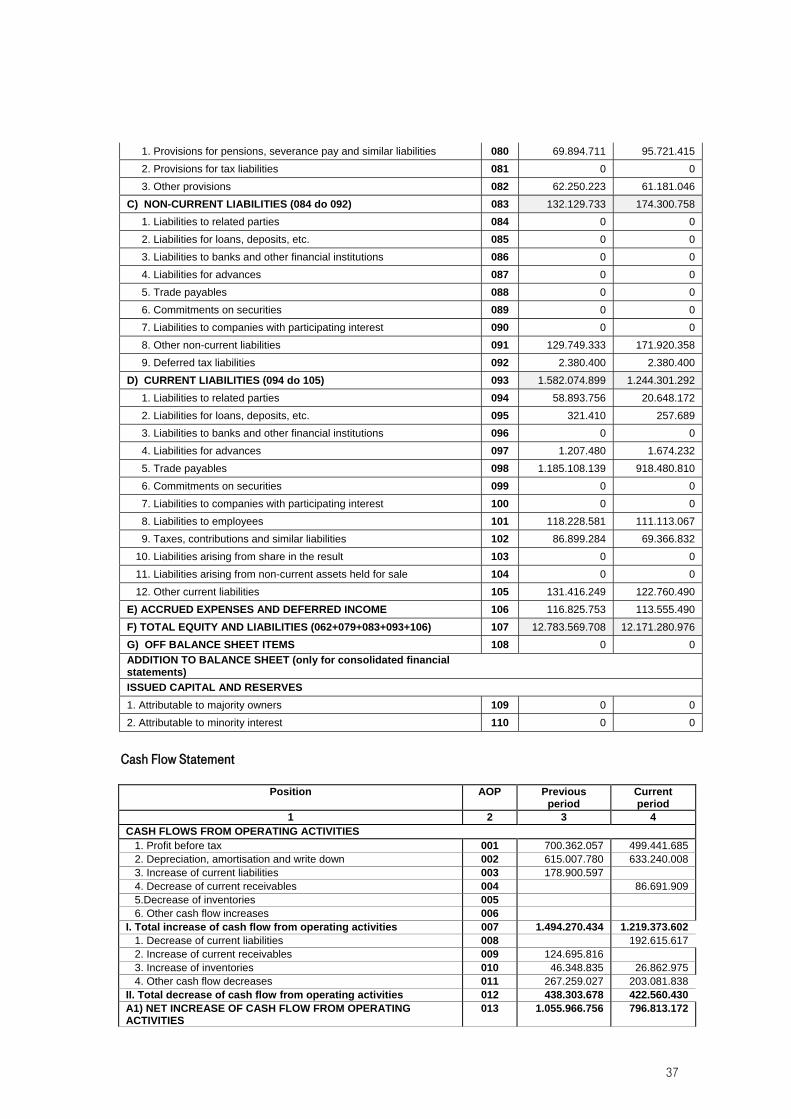
D) CURRENT LIABILITIES (094 do 105) 093 1.582.074.899 1.244.301.292
1. Liabilities to related parties 094 58.893.756 20.648.172
2. Liabilities for loans, deposits, etc. 095 321.410 257.689
3. Liabilities to banks and other financial institutions 096 0 0
4. Liabilities for advances 097 1.207.480 1.674.232
5. Trade payables 098 1.185.108.139 918.480.810
6. Commitments on securities 099 0 0
7. Liabilities to companies with participating interest 100 0 0
8. Liabilities to employees 101 118.228.581 111.113.067
9. Taxes, contributions and similar liabilities 102 86.899.284 69.366.832
10. Liabilities arising from share in the result 103 0 0
11. Liabilities arising from non-current assets held for sale 104 0 0
12. Other current liabilities 105 131.416.249 122.760.490
E) ACCRUED EXPENSES AND DEFERRED INCOME 106 116.825.753 113.555.490
F) TOTAL EQUITY AND LIABILITIES (062+079+083+093+106) 107 12.783.569.708 12.171.280.976
G) OFF BALANCE SHEET ITEMS 108 0 0
ADDITION TO BALANCE SHEET (only for consolidated financial statements)
ISSUED CAPITAL AND RESERVES
1. Attributable to majority owners 109 0 0
2. Attributable to minority interest 110 0 0
Cash Flow Statement
Position AOP Previous period
Current period
1 2 3 4 CASH FLOWS FROM OPERATING ACTIVITIES 1. Profit before tax 001 700.362.057 499.441.685 2. Depreciation, amortisation and write down 002 615.007.780 633.240.008 3. Increase of current liabilities 003 178.900.597 4. Decrease of current receivables 004 86.691.909 5.Decrease of inventories 005 6. Other cash flow increases 006 I. Total increase of cash flow from operating activities 007 1.494.270.434 1.219.373.602 1. Decrease of current liabilities 008 192.615.617 2. Increase of current receivables 009 124.695.816 3. Increase of inventories 010 46.348.835 26.862.975 4. Other cash flow decreases 011 267.259.027 203.081.838 II. Total decrease of cash flow from operating activities 012 438.303.678 422.560.430 A1) NET INCREASE OF CASH FLOW FROM OPERATING ACTIVITIES
013 1.055.966.756 796.813.172
38
A2) NET DECREASE OF CASH FLOW FROM OPERATING ACTIVITIES
014 0 0
CASH FLOW FROM INVESTING ACTIVITIES 1. Proceeds from sale of non-current assets 015 43.931.151 258.357 2. Proceeds from sale of non-current financial assets 016 1.120.071 943.398 3. Interest received 017 15.692.451 10.165.090 4. Dividend received 018 5. Other proceeds from investing activities 019 475.733.336 1.090.961.496 III. Total cash inflows from investing activities 020 536.477.009 1.102.328.341 1. Purchase of non-current assets 021 595.799.212 469.408.611 2. Purchase of non-current financial assets 022 75.005.322 75.692.710 3. Other cash outflows from investing activities 023 23.481.971 86.870.161 IV. Total cash outflows from investing activities 024 694.286.505 631.971.482 B1) NET INCREASE OF CASH FLOW FROM INVESTING ACTIVITIES
025 0 470.356.859
B2) NET DECREASE OF CASH FLOW FROM INVESTING ACTIVITIES
026 157.809.496 0
CASH FLOW FROM FINANCING ACTIVITIES 1. Proceeds from issue of equity securities and debt securities 027 0 0 2. Proceeds from loans and borrowings 028 0 0 3. Other proceeds from financing activities 029 831.739 0 V. Total cash inflows from financing activities 030 831.739 0 1. Repayment of loans and bonds 031 0 0 2. Dividends paid 032 736.021.901 3. Repayment of finance lease 033 0 0 4. Purchase of treasury shares 034 418.558 5. Other cash outflows from financing activities 035 0 0 VI. Total cash outflows from financing activities 036 418.558 736.021.901 C1) NET INCREASE OF CASH FLOW FROM FINANCING ACTIVITIES
037 413.181 0
C2) NET DECREASE OF CASH FLOW FROM FINANCING ACTIVITIES
038 0 736.021.901
Total increases of cash flows 039 898.570.441 531.148.130 Total decreases of cash flows 040 0 0 Cash and cash equivalents at the beginning of period 041 3.103.603.253 1.962.975.311 Increase of cash and cash equivalents 042 898.570.441 531.148.130 Decrease of cash and cash equivalents 043 0 0 Cash and cash equivalents at the end of period 044 4.002.173.694 2.494.123.441
Statement of changes in equity
Position AOP Previous year Current year
1 2 3 4
1. Subscribed share capital 001 8.188.853.500 8.882.853.500
2. Capital reserves 002 0 0
3. Reserves from profit 003 409.056.013 409.346.546
4. Retained earnings or loss carried forward 004 792.390.636 792.675.024
5. Net profit or loss for the period 005 1.431.245.824 397.234.708
6. Revaluation of tangible assets 006 0 0
7. Revaluation of intangible assets 007 0 0
8. Revaluation of available for sale assets 008 -1.151.584 111.197
9. Other revaluation 009 0 0
10. Total equity and reserves (AOP 001 to 009) 010 10.820.394.389 10.482.220.975
11. Foreign exchange differences from foreign investments 011 0 0
12. Current and deferred taxes 012 -3.541.800 0
13. Cash flow hedge 013 0 0
14. Change of accounting policies 014 17.709.000 0
39
15. Correction of significant mistakes of prior period 015 0 0
16. Other changes 016 0 0
17.Total increase or decrease of equity (AOP 011 to 016) 017 14.167.200 0
17 a. Attributable to majority owners 018
17 b. Attributable to minority interest 019
Notes to the condensed financial statements For period ended 30 June 2014
Basis of preparation
The condensed financial statements of 30 June 2014 and for the six months then ended, have been
prepared using accounting policies consistent with International Financial Reporting Standards.
Significant Accounting Policies
The financial statements have been prepared under the historical cost convention, except for
investments available-for-sale stated at fair value.
The same accounting policies, presentation and methods of computation are followed in these
condensed financial statements as were applied in the preparation of the Company’s financial
statements for the year ended 31 December 2013.
Dividends
On 29 April 2014 General Assembly of Hrvatski Telekom d.d. reached a decision on dividend
distribution for 2013 in amount of HRK 736,961,436.00 (9.00 HRK per share).
Dividend was paid on 26 May 2014.
A part of the net profit amounting to HRK 694,000,000.00 is used to increase the share capital.
Take-over of Optima Telekom
On 11 September 2013, Hrvatski Telekom submitted to the Competition Agency complete
notification of concentration of undertakings HT and Optima Telekom (acquisition of control over
Optima Telekom by HT).
On 19 March 2014, the Competition Agency passed the decision by which the mentioned
acquisition has been conditionally approved and measures and the terms that the party to the
merger (HT and Optima) have to fulfil in order to eliminate the negative effects of the concentration
on competition have been accepted as well.
HT announced on 18 June 2014, that it took over management of Optima Telekom for the period of
4 years, following the completion of the pre-bankruptcy settlement procedure and the adoption and
registration of the decisions by the General Assembly of Optima Telekom. Consolidation of Optima’s
results is postponed for next period.
40
Segment information
Business reporting format is determined to be Residential, Business and Network and Support
Function segments as the Company’s risks and rates of return are affected predominantly by
differences in the market and customers. The segments are organised and managed separately
according to the nature of the customers and markets that the services rendered, with each
segment representing a strategic business unit that offers different products and services.
The Residential Segment includes marketing, sales and customer services, focused on providing
mobile, fixed line telecommunications and TV distribution services to residential customers.
The Business Segment includes marketing, sales and customer services, focused on providing
mobile and fixed line telecommunications and systems integration services to corporate customers,
small- and medium-sized businesses and the public sector. The Business Segment is also
responsible for the wholesale business in both fixed and mobile services.
The Network and Support Functions performs cross-segment management and support functions,
and includes the Technology, Procurement, Accounting, Treasury, Legal and other central functions.
The Network and Support Functions is included in segment information as a voluntary disclosure
since it does meet the criteria for an operating segment.
The Management Board, as the chief operating decision maker, monitors the operating results of
business units separately for the purpose of making decisions about resource allocation and
performance assessment. Segment performance is evaluated based on contribution margin II or
segment results (as calculated in the table below).
The Company’s geographical disclosures are based on the geographical location of its customers.
Management of the Company does not monitor assets and liabilities by segments and therefore this
information has not been disclosed.
The following tables present revenue and direct cost information regarding the Company’s
segments:
Period ended 30 June 2013 Residential Business
Network & Support functions Total
HRK millions HRK millions HRK millions HRK millions
Capital expenditure 148 33 110 291 ___________ ___________ ___________ ___________
Relations with the governing company and its affiliated companies
In the first six months of 2014 there were no transactions among related parties with a significant
impact on the financial position and operations of the Company in the given period.
In the first six months of 2014 there were no changes in transactions among related parties which
were specified in the annual financial report for 2013 and which had a significant impact on the
financial position and operations of the Company in the first six months of 2014.
Business relations transacted between HT d.d. in the first six months of 2014 and the governing
company and affiliated companies thereof can be classified as follows:
Transactions with related companies
Transactions with related companies primarily relate to the transactions with the companies owned
by Deutsche Telekom AG (hereinafter referred to as: DTAG). The Company enters into transactions
in the normal course of business on an arm’s length basis. These transactions included the sending
and receiving of international traffic to/from these companies.
In the first six months of 2014 the Company generated total revenue from related companies from
international traffic to the amount of HRK 36 million (the six months of 2013: HRK 47 million), while
total costs of international traffic amounted to HRK 35 million (the first six months of 2013: HRK 31
million).
43
DTAG companies provided technical assistance to the Company in the amount of HRK 12 million in
the first six months of 2014 (the first six months of 2013: HRK 5.5 million).
Compensation of the Supervisory Board
The chairman of the Supervisory Board receives remuneration in the amount of 1.5 of the average
net salary of the employees of the Company paid in the preceding month. To the deputy chairman,
the amount of 1.25 of the average net salary of the employees of the Company paid in the
preceding month is paid, while any other member receives the amount of one average net salary of
the employees of the Company paid in the preceding month. To a member of the Supervisory
Board, who is in the same time the Chairman of the Audit Committee of the Supervisory Board, in
the amount of 1.5 of the average monthly net salary of the employees of the Company paid in the
preceding month. To a member of the Supervisory Board, who is in the same time a Member of the
Audit Committee of the Supervisory Board, in the amount of 1.25 of the average monthly net salary
of the employees of the Company paid in the preceding month. To a member of the Supervisory
Board, who is in the same time a Member of the Compensation and Nomination Committee of the
Supervisory Board, in the amount of 1.25 of the average monthly net salary of the employees of the
Company paid in the preceding month. DT AG representatives do not receive any remuneration for
the membership in the Supervisory Board due to a respective policy of DT AG.
In July 2013, the Supervisory Board established the Sustainability Committee. The Committee
consists of three members, two external experts and one member of the Supervisory Board.
Members of the Sustainability Committee who are not at the same time members of the
Supervisory Board are entitled to monthly remuneration in the amount of 0.25 of the average net
salary of employees of the Company paid in the preceding month. At this time, only one member
receives remuneration, which is not being paid directly to him but in line with his instruction,
remuneration is paid out to the benefit of the Fund for award of scholarships to Croatian Homeland
War veterans and their children.
In the first six months of 2014, the Company paid a total amount of HRK 0.3 million (the first six
months of 2013: HRK 0.4 million) to the Members of its Supervisory Board. No loans were granted
to the Members of the Supervisory Board.
Compensation to key management personnel
In the first six months of 2014 the total compensation paid to key management personnel of the
Company amounted to HRK 18 million (first six months of 2013: HRK 20 million Key management
personnel include members of the Management Board and the directors of sectors of the Company.
44
8. Statement of the Management Board of Hrvatski Telekom d.d
To the best of our knowledge, unaudited financial statements of the company Hrvatski Telekom d.d. (hereinafter: “Company”) and unaudited consolidated financial statements of the Company and affiliated companies thereof (hereinafter: "Group"), which are prepared in accordance with International Financial Reporting Standards (IFRS), give a true and fair view of assets and obligations, profit and loss, financial position, and operations of both the Company and the Group. The management report for the first six months of 2014 contains a true presentation of development and results of operations and position of the Group, with description of significant risks and uncertainties for the Group as a whole. Mr. Davor Tomašković, President of the Management Board (CEO)* Ms. Irena Jolić Šimović, Member of the Management Board and Chief Human Resources Officer Mr. Thorsten Albers, Member of the Management Board and Chief Technical and Chief Information Officer Ms. Nataša Rapaić, Member of the Management Board and Chief Operating Officer Residential Mr. Jens Hartmann, Member of the Management Board and Chief Operating Officer Business Zagreb, 30 July 2014 *Until the appointment of the Chief Financial Officer and Chief Customer Experience Officer, he performs the managing tasks falling within the scope of competence of the Member of the Management Board and Chief Financial Officer, and Member of the Management Board and Chief Customer Experience Officer.
45
9. Presentation of information
Unless the context otherwise requires, references in this publication to ‘‘T-HT Group’’ or ‘‘the Group’’ or "T-HT" are to the Company Hrvatski Telekom d.d., together with its subsidiaries. References to ‘‘HT’’ or the ‘‘Company’’ are to the Company Hrvatski Telekom d.d. Following the merger of T-Mobile d.o.o. with Hrvatski Telekom (HT d.d.), effective 1 January 2010, the Group is now organized into two business units: Business and Residential. Therefore, references to “Business” are to business operations performed within the Company’s Business Segment. References to ‘‘Residential’ are to business operations performed within the Company’s Residential Segment. References to ‘‘Iskon’’ are to the Company’s wholly-owned subsidiary, Iskon Internet d.d. References to ‘‘Combis’’ are to the Company’s wholly-owned subsidiary, Combis d.o.o. References to ‘‘KDS” are to the Company’s wholly-owned subsidiary, KDS d.o.o. References to ‘‘E-tours” are to the Company’s wholly-owned subsidiary, E-tours d.o.o. References in this publication to ‘‘Agency’’ are to the Croatian National Regulatory Authority, the Agency for Post and Electronic Communications.
10. Disclaimer
This release contains certain forward-looking statements with respect to the financial condition, results of operations and business of the Group. These forward-looking statements represent the Company's expectations or beliefs concerning future events and involve known and unknown risks and uncertainties that could cause actual results, performance or events to differ materially from those expressed or implied in such statements. Additional information concerning important factors that could cause actual results to differ materially is available in the Group's reports which may be found at www.t.ht.hr