Zagreb – 28 October 2011 T-Hrvatski Telekom Results for the nine months to 30 September 2011 Recession, regulatory initiatives and special tax continue to impact business; revenue fall of 3.6%, limited by Combis contribution and strong IP revenue growth; solid margins on effective cost management T-Hrvatski Telekom (Reuters: THTC.L, HT.ZA; Bloomberg: THTC LI, HTRA CZ), Croatia’s leading telecommunications provider, announces unaudited results for the nine months to 30 September 2011. Group Highlights • Revenues down 3.6% to HRK 6,092 million or EUR 822 million (Jan-Sep 2010: HRK 6,321 million, EUR 871 million) o Combis contributes HRK 281 million or EUR 38 million (Jan-Sep 2010: HRK 110 million, EUR 15 million. Consolidated from May 2010) o Underlying revenues down 7.6%, excluding both Combis contribution and revenue recognition after change in useful life of customer relationship as outlined on page 7 • IP and ICT revenues show continued growth • Cost control initiatives continue • EBITDA down 2.1% at HRK 2,799 million (EUR 378 million) and 46.0% margin (Jan-Sep 2010: HRK 2,858 million or EUR 394 million, 45.2%) • Net profit almost flat at HRK 1,483 million (EUR 200 million) • Operating cash flow down 14.8% to HRK 1,894 million (EUR 256 million) • T-HT has reviewed its continued participation in the privatisation process; unconfirmed media reports suggest Government of Kosovo has cancelled process Residential Segment • T-HT maintained its leading position in all three markets (mobile, fixed line and IP) • Introduced new mobile tariffs targeting a range of customer segments • Mobile subscribers up 3.5% (up 2.9% on Q2 2011), following change in definition of prepaid subscribers as outlined on page 7 • 538,443 ADSL mainlines, up 8.3% from Q3 2010 (flat to Q2 2011), and 317,847 TV customers, up 21.7% (up 4.6% on Q2 2011) • Revenues down 5.0%, due largely to lower voice revenues in the mobile and fixed network and lower non voice revenue in mobile Business Segment • Stable customer base across all segments and products/tariffs • Mobile subscribers up 5.6% (up 1.1% on Q2 2011) • 109,342 ADSL mainlines up 6.0% (up 0.9% on Q2 2011) and 18,919 TV customers, up 17.0% (up 2.6% on Q2 2011) • Revenues down 1.9% o IP and ICT revenues showing further growth with new ICT services launched IvicaMudrinić, President of the Management Board and CEO, said: “T-HT has released another robust set of results against the backdrop of a difficult economic environment and our revenue was 3.6% lower in the period. However, we have maintained our strict cost control initiatives and we are reporting a solid EBITDA margin, whilst ICT services provider Combis has made a positive contribution to our business. Despite further downward pressure from regulation
Transcript
Zagreb – 28 October 2011
T-Hrvatski Telekom Results for the nine months to 30 September 2011
Recession, regulatory initiatives and special tax continue to impact business; revenue fall of
3.6%, limited by Combis contribution and strong IP revenue growth; solid margins on effective cost management
T-Hrvatski Telekom (Reuters: THTC.L, HT.ZA; Bloomberg: THTC LI, HTRA CZ), Croatia’s leading telecommunications provider, announces unaudited results for the nine months to 30 September 2011.
Group Highlights
• Revenues down 3.6% to HRK 6,092 million or EUR 822 million (Jan-Sep 2010: HRK 6,321 million, EUR 871 million) o Combis contributes HRK 281 million or EUR 38 million (Jan-Sep 2010: HRK 110 million,
EUR 15 million. Consolidated from May 2010) o Underlying revenues down 7.6%, excluding both Combis contribution and revenue
recognition after change in useful life of customer relationship as outlined on page 7 • IP and ICT revenues show continued growth • Cost control initiatives continue • EBITDA down 2.1% at HRK 2,799 million (EUR 378 million) and 46.0% margin (Jan-Sep 2010:
HRK 2,858 million or EUR 394 million, 45.2%) • Net profit almost flat at HRK 1,483 million (EUR 200 million) • Operating cash flow down 14.8% to HRK 1,894 million (EUR 256 million) • T-HT has reviewed its continued participation in the privatisation process; unconfirmed media
reports suggest Government of Kosovo has cancelled process
Residential Segment • T-HT maintained its leading position in all three markets (mobile, fixed line and IP) • Introduced new mobile tariffs targeting a range of customer segments • Mobile subscribers up 3.5% (up 2.9% on Q2 2011), following change in definition of prepaid
subscribers as outlined on page 7 • 538,443 ADSL mainlines, up 8.3% from Q3 2010 (flat to Q2 2011), and 317,847 TV customers,
up 21.7% (up 4.6% on Q2 2011) • Revenues down 5.0%, due largely to lower voice revenues in the mobile and fixed network
and lower non voice revenue in mobile Business Segment • Stable customer base across all segments and products/tariffs • Mobile subscribers up 5.6% (up 1.1% on Q2 2011) • 109,342 ADSL mainlines up 6.0% (up 0.9% on Q2 2011) and 18,919 TV customers, up 17.0%
(up 2.6% on Q2 2011) • Revenues down 1.9%
o IP and ICT revenues showing further growth with new ICT services launched IvicaMudrinić, President of the Management Board and CEO, said: “T-HT has released another robust set of results against the backdrop of a difficult economic environment and our revenue was 3.6% lower in the period. However, we have maintained our strict cost control initiatives and we are reporting a solid EBITDA margin, whilst ICT services provider Combis has made a positive contribution to our business. Despite further downward pressure from regulation
2
and intense competition across all our operations, we have maintained our number one position across all areas of business. “Furthermore, the Government of Croatia is proposing to abolish the 6% fee on mobile network services introduced in 2009 and this should have a positive impact on the Croatian telecoms sector. Nevertheless, the existing regulatory regime continues to deter investment in a next generation communications/fiber infrastructure that would help to stimulate economic growth in Croatia.” Contact details T-Hrvatski Telekom Investor Relations
Erika Kašpar, Corporate Communications and Investor Relations
+ 385 1 4912 000
Elvis Knežević, Investor Relations + 385 1 4911 114 Anita MarićŠimek, Investor Relations + 385 1 4911 884 Email [email protected] College Hill
Kay Larsen / Adrian Duffield +44 207 457 2020 A conference call for analyst and investors will start at 14:00 UK time / 15:00 CET today. The dial-in details are as follows: International Dial In +44 (0) 1452 555 566 UK Free Call Dial In 0800 694 0257 Conference ID 20913459 A replay of the call will be available until Thursday, 3 November 2011 using the following details: International Dial In +44 (0) 1452 550 000 UK Free Call Dial In (from landlines only) 0800 953 1533 Replay Access Code 20913459# A presentation covering results for the first nine months of 2011 can be downloaded from the T-HT website (www.t.ht.hr/eng/investors) About T-Hrvatski Telekom T-Hrvatski Telekom (T-HT) is the leading provider of telecommunication services in Croatia, serving more than 1.3 million fixed lines, nearly 2.5 million mobile subscribers and 648,000 broadband connections through its Residential and Business divisions. Since its initial public offering in October 2007, T-HT shares have traded on the Zagreb Stock Exchange, with global depositary receipts trading on the London Stock Exchange. Deutsche Telekom AG owns 51% of T-HT’s shares, with the War Veterans’ Fund owning 7%. The remaining free float is in the hands of private and institutional investors.
3
Results for the nine months to 30 September 2011 Business and financial review Introduction T-Hrvatski Telekom is Croatia’s largest telecommunications provider and the market leader in all segments in which it operates. At 30 September 2011, the Group served 1.3 million fixed-line customers, nearly 2.5 million mobile subscribers, 648,000 broadband connections and provided TV services to more than 337,000 customers. In March 2010, T-HT acquired the ICT company Combis, significantly expanding its ability to provide integrated solutions to Croatia’s business market. Market overview The key event in the Croatian telecommunications sector in recent months has been the acquisition by VIPnet, the second largest mobile player, of leading cable operator B.net in June 2011. This is expected to increase competition in integrated telecommunications products. Major growth areas in the sector are broadband and TV, while usage of fixed telephony continued to decline in line with expectations and world-wide trends. With new regulation in force from July 2011 regarding Wholesale Line Rental (WLR) and naked bit-stream, all operators are now achieving full country-wide reach. The Croatian mobile market also declined throughout 2011 owing to market saturation and the impact of the recession (reduced consumer purchasing power and the 6% tax on mobile services imposed in August 2009). Increased availability of smartphones and mobile broadband devices boosted mobile broadband usage, however. T-HT remained the leader in a saturated market served by three operators since 2005. All three operators offer new tariff bundles with combinations of voice, messaging and data both to consumer and business customers, along with new offers such as e-books. According to the Croatian Central Bureau of Statistics, total Croatian mobile MOU increased by 4.0% in first half 2011. Mobile Internet promotion has intensified as all three mobile operators promote new mobile broadband products with attractive smartphone and tablet deals. Fixed telephony remains competitive in Croatia with 10 active operators, while VIPnet’s recent acquisition of B.net is likely to increase competition in integrated telecommunication products. T-HT has successfully maintained its leading market position in all segments. This reflects the Group’s continuing dedication to high-quality services and improved marketing with offers tailored to suit the needs of specific customer segments. According to the Croatian Central Bureau of Statistics, the number of fixed-line minutes of use (MOU) decreased by 9.4% in first half 2011. Fixed-line penetration remained stable at 42% of the population, according to the National Regulatory Agency. T-HT Group remained the largest provider of broadband services in Croatia, continuing to expand the roll out of its high-speed MAXadsl offering and augmenting it with premium services such as MAXtv – the Group’s TV service. During first nine months of 2011 a new player entered in the Croatian pay TV market but T-HT continued to enrich its TV offer with the addition of new TV channels and social media functionality. Croatia’s broadband market remains a growth area for T-HT, with approximately 45% of
4
Croatian households connected via fixed broadband compared to an average of around 62% in Western Europe. Economic background After nine consecutive quarters of decline, Croatia’s GDP recorded very moderate growth of 0.8% in the second quarter of 2011 boosted by exports and consumption. At the same time, however, the decline in investment continued. Revised forecasts have lowered Croatia’s estimated GDP growth to just between 0.5% and 0.8% for FY 2011. Registered unemployment remains high at 16.8% in September 2011 (September 2010: 16.9%) according to the Croatian Central Bureau of Statistics, with no sign yet of real recovery, while the corporate sector has not been initiating projects that would generate new employment.
Average monthly net earnings for the first seven months of 2011 was HRK 5,393, marking a fall of 0.3% year on year.
Privatisation of Post and Telecommunications of Kosovo J.S.C. (PTK) As announced in early June 2011, T-HT has fulfilled the pre qualification requirements in relation to the privatisation of Post and Telecommunications of Kosovo J.S.C. (PTK) and has been confirmed as one of the Pre-Qualified Applicants. In light of charges recently filed against certain PTK managers suspected of corruption, however, T-HT has reviewed its continued participation in the privatisation process. According to media reports, the Government of Kosovo recently cancelled the tender process and will announce another in due course. However, T-HT has not received any official notification that this is the case. Update on 6% fee on mobile network services The Group released an update on 14 October 2011 on the status of the 6% fee on mobile network services imposed under the Fee for the Provision of Mobile Electronic Communications Networks Services Act and introduced on 1 August, 2009. The update followed a proposal on 13 October 2011 by the Croatian Government to abolish this fee, with effect from 1 January 2012. The Government proposes abolition of the fee under the Act on the Termination of the Fee for the Provision of Services in Mobile Electronic Communications Networks Act, which will go before the Croatian Parliament. At this moment there is no precise clarity on when the Parliament will approve the proposal. The impact of the 6% tax in the nine months to 30 September 2011 was HRK 113 million (Jan-Sep 2010: HRK 124 million).
5
Regulatory environment The Law on Electronic Communications, which replaced the previous Law on Telecommunications, has been in force since 1 July, 2008 and transposed the 2002 EU Regulatory Framework onto Croatia’s electronic communications market. In order to align the Croatian regulatory framework with EU framework amendments from 2009, the Croatian Parliament adopted amendments to the Law on Electronic Communications in July 2011 and this came into force in August 2011. These amendments will increase the discretionary powers of the Croatian Post and Electronic Communications Agency (Agency, or HAKOM) with regard to regulating the electronic communications market and is expected to result in a tighter regulatory regime. Croatian operators were given 90 days’ notice to comply with the new provisions of the Law. In April 2011, the Agency adopted decisions by which it determined that “three criteria tests” were fulfilled for two markets in terms of “Access to the fixed network and public voice markets:”
1. Publicly available local and/or national telephone services provided at a fixed location for residential customers
2. Publicly available local and/or national telephone services provided at a fixed location for non-residential customers.
Subsequently, in July 2011 the Agency adopted decisions by which it determined that “three criteria tests” were fulfilled for:
3. The retail broadband Internet access market. This implies that the Agency considers that these markets under 1, 2 and 3 above are susceptible to ex ante regulatory control and thus should be analysed for the existence of significant market power (SMP). Public consultation on market analysis for markets 1 and 2 above ended on 16 June and for market 3 above ended on 12 September, 2011. The final decisions by the Agency on these market analyses and regulatory remedies are still pending. Under a decision adopted in March 2010, the Agency determined that the “x” percentage that should be used for the purpose of calculating the Group’s prices for wholesale bitstream access services on copper network - IP level (retail minus methodology) - should be 40%. A further price reduction in wholesale bitstream access service was adopted by the Agency in September 2010 (price reduction for virtual private channels for voice and IPTV services). However, in September 2011 the Agency initiated a revision of the x% level for the purpose of calculating bitstream prices on copper network, with a proposal to increase it to 60%. The outcome of this process is still pending. Also, in line with the obligation imposed upon the Group by the Agency’s decision on SMP designation and imposition of remedies in the wholesale broadband access market, the Company published a “reference offer for the wholesale bitstream access over the Group’s fibre optics access network”. However, in August 2011 the Agency initiated amendments to this part of the Group’s reference offer. The outcome of this process is still pending. On 6 April, 2011, the Agency finalized its analysis of the retail market regarding Access to the Public Communications Network at a Fixed Location for residential and non-residential customers and designated the Company and its subsidiary Iskon Internet as operators with SMP. The following remedies were imposed upon the Company:
6
- Network access and use of special network facilities (obligation to introduce naked DSL and wholesale line rental - WLR - and standalone retail access service)
- Non-discrimination - Transparency - Price control of retail access services (notification of retail prices 30 days in advance;
prohibition from unreasonably bundling services) - Accounting separation and cost accounting (cost accounting project, initiated at the end of
2008, is ongoing)
Price control of retail access services were imposed on Iskon Internet. In line with these requirements, in June and July 2011 the Company published wholesale reference offers for naked BSA and wholesale line rental. In August 2011, the Agency finalized its analysis of retail markets - Publicly available local and/or national telephone services provided at a fixed location for residential customers and non residential customers - and determined the Group and Iskon to be the SMP operators in these markets. Consequently, the following obligations were imposed upon the Group:
- retail price control (cost-orientation, price notification to the Agency 45 days prior to launch, non-discrimination)
- regulation of promotional offers (notification of promotional offers to the Agency 15 days prior to the launch, duration of promotional offers restricted to two months, promotional benefits must not apply longer than three months, promotional offers for the same service must not be repeated more than once a year)
In September 2011, the Agency finalized the procedure of the “three criteria test” for the retail broadband Internet market, and determined that this market is susceptible to ex ante regulation. Consequently, on 24 October 2011, the Agency publicly announced its proposal to designate the Company and Iskon as operators with significant market power (SMP) in (i) retail broadband Internet access market and (ii) retail market for transmission of television programmes with remuneration (hereinafter: IPTV market) although the IPTV market was not defined in accordance to applicable laws, neither was it previously determined as a market susceptible to sector-specific regulation (regardless of the fact that this is a precondition according to EU rules). Public consultation on proposed regulatory remedies for retail broadband Internet access and IPTV services continues until 23 November 2011. In October 2010, the Group was (re)designated as the universal service provider for the next five years for all universal services (except for the subscribers’ directory, which the Group can continue to provide on a commercial basis). Tariffs for universal services must be set at an “affordable level.” Other tariffs, besides those mentioned above, are subject to ex-post review and are essentially unregulated. Accounting separation (applies only to the Company’s fixed business); cost accounting project, initiated at the end of 2008, is ongoing. In Q3 2011 the Agency started developing its own cost modelling for all regulated services. The registration of pre-paid customers in mobile networks is now underway.
7
Segmental reporting On 1 January 2010, the old operating segments T-Com and T-Mobile, serving fixed and mobile markets respectively, were replaced by a new structure based upon Residential and Business units. As of the first quarter of 2011, new segment reporting based on this customer segmentation was introduced with three separate operating segments: Residential Segment, Business Segment and Network and Support Functions. The Residential Segment (RS) includes marketing, sales and customer services, focused on providing mobile, fixed line telecommunications and TV distribution services to residential customers. The Business Segment (BS) includes marketing, sales and customer services, focused on providing mobile and fixed line telecommunications and systems integration services to corporate customers, small- and medium-sized businesses and the public sector. The Business Segment is also responsible for the wholesale business in both fixed and mobile services. The Network and Support Functions (NSF) performs cross-segment management and support functions, and includes the Technology department, Procurement, Accounting, Treasury, Legal and other central functions. Fully owned subsidiaries Iskon Internet, Combis and KDS are consolidated within the respective operating segments. The Group reports EBITDA and primary revenues and expenses (i.e. revenues and expenses involving third parties) for its operating segments. Depreciation is not allocated to the segments as the majority is related to the fixed and mobile network, which is part of the NSF. Change in useful life of customer relationship Under Group Accounting policies, revenue from connection fees should be recognized over the estimated useful life of a customer relationship. To date, the lifetime of a customer relationship in the fixed telephony segment was estimated at 10 years. Due to changed market conditions, the period that constitutes useful life has been re-evaluated and is now calculated at three years, with effect from 1 January 2011. This change has been recognized in Q3 2011 and has had a positive impact on revenue of HRK 73 million. Change in definition of Prepaid Subscribers From Q1 2011, the regulator (HAKOM) amended the definition of the total prepaid subscriber base so that only SIMs showing traffic or voucher recharges in the previous 90 days should be considered as subscribers. To date, T-HT had been using a definition of its subscriber base that included all connected SIMs in the subscriber base. For Q3 2011, T-HT has aligned the number of prepaid subscribers with the new HAKOM definition and all related KPIs. Data for comparable periods in this report are restated in line with the new definition.
8
Summary of key financial indicators
in HRK million Jan-Sep 2011
Jan-Sep 2010
% of change 11/10
Revenue 6,092 6,321 -3.6% EBITDA before exceptional items 2,799 2,858 -2.1% EBITDA after exceptional items 2,799 2,858 -2.1% EBIT (Operating profit) 1,794 1,870 -4.0% Net profit after minority interest 1,483 1,484 -0.1% EBITDA margin before exceptional items 46.0% 45.2% 0.7 p.p. EBITDA margin after exceptional items 46.0% 45.2% 0.7 p.p. EBIT margin 29.5% 29.6% -0.1 p.p. Net profit margin 24.3% 23.5% 0.9 p.p.
in HRK million At 30 Sep 2011
At 31 Dec 2010
% of change 11/10
Cash and cash equivalents 2,478 3,282 -24.5% Total assets 12,532 13,585 -7.7% Total issued capital and reserves 10,677 11,054 -3.4%
in HRK million Jan-Sep 2011
Jan-Sep 2010
% of change 11/10
Net cash flow from operating activities 1,894 2,223 -14.8% RESIDENTIAL SEGMENT
in HRK million Jan-Sep 2011
Jan-Sep 2010
% of change 11/10
Revenue 3,327 3,502 -5.0% Contribution to EBITDA before exceptionals 2,248 2,294 -2.0% BUSINESS SEGMENT
in HRK million Jan-Sep 2011
Jan-Sep 2010
% of change 11/10
Revenue 2,765 2,819 -1.9% Contribution to EBITDA before exceptionals 1,731 1,919 -9.8% NETWORK & SUPPORT FUNCTIONS
in HRK million Jan-Sep 2011
Jan-Sep 2010
% of change 11/10
Contribution to EBITDA before exceptionals -1,180 -1,355 -12.9%
9
Exchange rate information Kuna per Euro Kuna per U.S. dollar
Average Period end Average Period end Nine months to 30 September 2010 7.26 7.29 5.53 5.36 Nine months to 30 September 2011 7.41 7.49 5.27 5.49
Selected Operational Data
Key operational data Jan-Sep 2011
Jan-Sep 2010
% of change 11/10
Mobile subscibers in 000 Number of subscribers 3) 2,485 2,393 3.8% - Residential 2,031 1,964 3.5% - Business 454 430 5.6% Number of postpaid subscribers 1,037 984 5.4% Number of prepaid subscribers 3) 1,448 1,409 2.7%
Minutes of use (MOU) per average subscriber3) 134 133 0.7%
- Residential 100 97 3.4% - Business 288 301 -4.2% Blended ARPU (monthly average for the year in HRK)2) 3) 94 106 -11.9%
- Residential 73 85 -13.5% - Business 184 204 -9.6% Blended non-voice ARPU (monthly average for the year in HRK)2) 3) 23 25 -5.7%
Market share of subscribers (%)1) 3) 45.0 45.4 -0.5 p.p. 1) Source: VIPnet and Tele2 reports for Q3 2010 and Tele2 Q3 2011. Subscriber numbers for VIPnet in Q3 2011 are internally estimated. 2) Due to T-Mobile and T-Com merger and within the new segmental reporting explained above, as of Q1 2011 calculation of ARPU was changed to show consolidated mobile revenues rather than unconsolidated mobile revenues 3) In September 2011 definition of prepaid subscribers was changed in order to be aligned with HAKOM definition. According to new definition, only SIMs showing traffic or voucher recharges in the last 90 days should be considered as subscribers. Number of subscribers in 2010 and all related KPIs were restated accordingly.
10
Key operational data Jan-Sep 2011
Jan-Sep 2010
% of change 11/10
Fixed mainlines in 000 Total mainlines 1) 1,321 1,444 -8.5% - Residential 1,123 1,225 -8.3% - Business 199 219 -9.2% Total Traffic (mill. of minutes) 2,097 2,387 -12.2% - Residential 1,558 1,733 -10.1% - Business 538 654 -17.7% ARPA voice per access (monthly average for the year in HRK) 120 132 -8.8%
- Residential 99 107 -7.4% - Business 238 268 -11.0% IP mainlines/customers in 000 ADSL mainlines 648 600 7.9% - Residential 538 497 8.3% - Business 109 103 6.0% TV customers 2) 337 277 21.5% - Residential 318 261 21.7% - Business 19 16 17.0% Fixed-line customers 1 1 5.7% VPN connection points 4 4 8.5% ADSL mainlines ARPA (monthly average for the year in HRK) 121 128 -5.6%
- Residential 118 125 -5.9% - Business 133 138 -3.9% Data lines in 000 Total data lines 6 6 -7.2% Wholesale customers in 000 CPS (Carrier Pre-Selection) 137 224 -39.0% NP (Number portability) users/number 535 399 34.1% ULL (Unbundled Local Loop) 144 130 11.1% WLR (Wholesale Line Rental)3) 78 0 - 1) Includes POTS+FGSM+ ISDN+Payphones 2) Includes IPTV, DTH and Cable TV customers 3) On 1 July T-HT published new WLR (Wholesale Line Rental) offer in line with HAKOM regulation
11
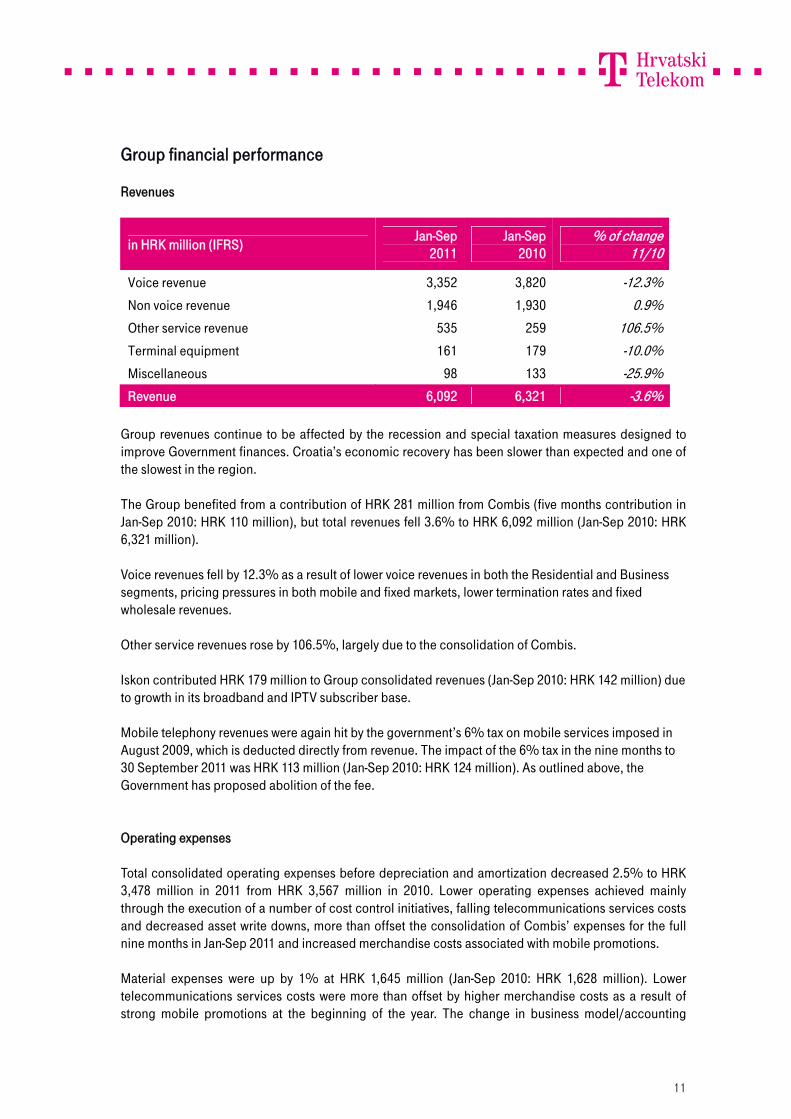
Group financial performance Revenues
in HRK million (IFRS) Jan-Sep 2011
Jan-Sep 2010
% of change 11/10
Voice revenue 3,352 3,820 -12.3% Non voice revenue 1,946 1,930 0.9% Other service revenue 535 259 106.5% Terminal equipment 161 179 -10.0% Miscellaneous 98 133 -25.9% Revenue 6,092 6,321 -3.6%
Group revenues continue to be affected by the recession and special taxation measures designed to improve Government finances. Croatia’s economic recovery has been slower than expected and one of the slowest in the region. The Group benefited from a contribution of HRK 281 million from Combis (five months contribution in Jan-Sep 2010: HRK 110 million), but total revenues fell 3.6% to HRK 6,092 million (Jan-Sep 2010: HRK 6,321 million). Voice revenues fell by 12.3% as a result of lower voice revenues in both the Residential and Business segments, pricing pressures in both mobile and fixed markets, lower termination rates and fixed wholesale revenues. Other service revenues rose by 106.5%, largely due to the consolidation of Combis. Iskon contributed HRK 179 million to Group consolidated revenues (Jan-Sep 2010: HRK 142 million) due to growth in its broadband and IPTV subscriber base. Mobile telephony revenues were again hit by the government’s 6% tax on mobile services imposed in August 2009, which is deducted directly from revenue. The impact of the 6% tax in the nine months to 30 September 2011 was HRK 113 million (Jan-Sep 2010: HRK 124 million). As outlined above, the Government has proposed abolition of the fee. Operating expenses Total consolidated operating expenses before depreciation and amortization decreased 2.5% to HRK 3,478 million in 2011 from HRK 3,567 million in 2010. Lower operating expenses achieved mainly through the execution of a number of cost control initiatives, falling telecommunications services costs and decreased asset write downs, more than offset the consolidation of Combis’ expenses for the full nine months in Jan-Sep 2011 and increased merchandise costs associated with mobile promotions. Material expenses were up by 1% at HRK 1,645 million (Jan-Sep 2010: HRK 1,628 million). Lower telecommunications services costs were more than offset by higher merchandise costs as a result of strong mobile promotions at the beginning of the year. The change in business model/accounting
12
treatment of Consumer Premises Equipment (CPE) from 1 September 2010 resulted in a fall in merchandise costs in Jan-Sep 2011 of HRK 112 million (Jan-Sep 2010: HRK 14 million) which was more than offset by the consolidation of Combis expenses. Total employee benefit expenses decreased by 1.8% to HRK 860 million in Jan-Sep 2011 from HRK 876 million in Jan-Sep 2010, despite consolidation of Combis’ expenses for the full nine months of the period. The Group’s (FTE) employee numbers fell to 6,066 in September 2011 from 6,251 in September 2010 mainly as a result of a continuing program to rationalize business processes and drive efficiency improvements. Other expenses decreased by 5.2% to HRK 975 million (Jan-Sep 2010: HRK 1,028 million) primarily due to lower maintenance and advertising expenses. Asset write-downs decreased by 46.3% to HRK 48 million (Jan-Sep 2010: HRK 89 million) after improvements made in the collection of written off receivables and in dunning procedures. Depreciation and amortization rose by 1.7% to HRK 1,005 million (Jan-Sep 2010: HRK 988 million). T-HT Group profitability
in HRK million Jan-Sep 2011
Jan-Sep 2010
% of change 11/10
Revenue 6,092 6,321 -3.6% EBITDA before exceptional items 2,799 2,858 -2.1% EBITDA after exceptional items 2,799 2,858 -2.1% EBIT (Operating profit) 1,794 1,870 -4.0% Net profit after minority interest 1,483 1,484 -0.1% EBITDA margin before exceptional items 46.0% 45.2% 0.7 p.p. EBITDA margin after exceptional items 46.0% 45.2% 0.7 p.p. EBIT margin 29.5% 29.6% -0.1 p.p. Net profit margin 24.3% 23.5% 0.9 p.p.
EBITDA decreased by 2.1% to HRK 2,799 million (Jan-Sep 2010: HRK 2,858 million). The EBITDA margin increased to 46.0% (Jan-Sep 2010: 45.2%) as EBITDA declined more slowly than revenues, as outlined above. Operating profit (EBIT) fell 4.0% to HRK 1,794 million (Jan-Sep 2010: HRK 1,870 million). Net profit was almost flat at HRK 1,483 million (Jan-Sep 2010: 1,484 million) as lower EBIT was offset by the absence of last year’s one-off charge related to involvement in HT Mostar (Jan-Sep 2010: HRK 32 million), higher financial income and lower taxation year on year.
13
Balance sheet T-HT’s balance sheet remains strong, with total assets of HRK 12,532 million. At 30 September 2011, cash and cash equivalents stood at HRK 2,478 million, compared with HRK 3,282 million at 31 December. A dividend totalling HRK 1,863 million was paid in May 2011. Cash flow As a result of lower profitability and higher redundancy payments, net cash flow from operating activities in Jan-Sep 2011 fell 14.8% to HRK 1,894 million (Jan-Sep 2010: 2,223 million). Capital expenditure
in HRK million Jan-Sep 2011
Jan-Sep 2010
% of change 11/10
Business 61 36 70.3% Residential 252 115 119.9% Network and Support Functions 320 467 -31.4% T-HT Group 633 617 2.6% Capex / Revenue ratio 10.4% 9.8% 0.6 p.p.
Capital expenditure was 2.6% higher compared with the first nine months of 2010. The merger of T-HT with T-Mobile Croatia along with efforts to maximize internal synergy potential between the fixed and mobile business areas meant that several major projects were rescheduled or postponed in 2010. The shift of Consumer Premises Equipment (CPE) from OPEX to CAPEX as of 1 September 2010 also resulted in an HRK 112 million increase (Jan-Sep 2010: HRK 14 million). The Residential Segment experienced substantially higher capital expenditure, mostly due to the change in business model/accounting treatment of network CPE and increased capital expenditure related to IT. Business Segment capital expenditure was 70.3% higher, mainly due to increased investment in business-related IT solutions, change in business model/accounting treatment of CPE equipment as well as increased capex in Combis and Iskon. In the absence of clarity on the issue of fiber access, the Group has continued with its modernisation of the current fixed core and aggregation network, while in the mobile network it continues to invest in radio access and core network transformation in order to improve mobile broadband access.
14
Analysis of segment results Residential Segment highlights
• T-HT maintained its leading position in all three markets (mobile, fixed line and IP) • Introduced new mobile tariffs targeting a range of customer segments • Mobile subscribers up 3.5% (up 2.9% on Q2 2011), following change in definition of prepaid
subscribers as outlined on page 7 • 538,443 ADSL mainlines, up 8.3% from Q3 2010 (flat to Q2 2011), and 317,847 TV customers,
up 21.7% (up 4.6% on Q2 2011) • Revenues down 5.0%, due largely to lower voice revenues in the mobile and fixed network
and lower non voice revenue in mobile • Contribution to EBITDA of HRK 2.248million, down 2.0%
Key operational data Jan-Sep 2011
Jan-Sep 2010
% of change 11/10
Mobile subscribers in 000
Number of subscribers 3) 2,031 1,964 3.5%
Minutes of use (MOU) per average subscriber3) 100 97 3.4%
Blended ARPU (monthly average for the year in HRK) 3) 73 85 -13.5%
Fixed mainlines in 000
Total mainlines1) 1,123 1,225 -8.3%
Total Traffic (mill. of minutes) 1,558 1,733 -10.1%
ARPA voice per access (monthly average for the year in HRK) 99 107 -7.4%
IP mainlines/customers in 000
ADSL mainlines 538 497 8.3%
TV customers2) 318 261 21.7%
ADSL mainlines ARPA (monthly average for the year in HRK) 118 125 -5.9%
1) Includes POTS+FGSM+ ISDN+Payphones 2) Includes IPTV, DTH and Cable TV customers 3) In September 2011 definition of prepaid subscribers was changed in order to be aligned with HAKOM definition. According to new definition, only SIMs showing traffic or voucher recharges in the last 90 days should be considered as subscribers. Number of subscribers in 2010 and all related KPIs were restated accordingly.
15
In the first six weeks of 2011, T-HT launched sustained mobile acquisition and retention campaigns for new and existing customers signing 24 months contracts. The Group also introduced postpaid tariffs focusing on data and targeting young people, along with new family and broadband mobile tariffs. After its first successful year, bonbon has more than 100,000 subscribers, with 85% of the customer base under 35 years old, establishing it as an attractive brand for young professionals. Minutes of usage per average mobile subscriber in nine months to 30 September 2011 increased by 3.4%, compared to the same period last year. Blended ARPU decreased by 13.5% in the period compared to the nine months to 30 September 2010, as a result of the economic environment and intense competitive pressures. The Group also introduced bundled fixed and mobile products to boost ADSL customer acquisition. T-HT’s IPTV and DTH satellite TV services were further boosted by offers including new and exclusive sports content, pay per view and “try and buy.“ Subscription to the satellite TV service was boosted by the repositioning of the service in Q1 2011. Satellite TV is becoming an increasingly important element of the Group’s TV product offering. In Q2 it was decided to unbundle ADSL service for provisioned DTH customers, not using the ADSL service connected to DTH, resulting in a decline of ADSL connections in Q3. Total fixed access mainlines at the end of September 2011 were 1,123million, down 8.3% year on year. This decline is in line with the wider trend in the telecommunications market for fixed to mobile and IP substitution. At the same time, the Group continues to ensure the competitiveness of its products through attractive promotional offers and excellent service delivery. Fixed telephony traffic fell to 1,558 million minutes in the nine months to 30 September 2011, down 10.1% on the previous year. This market trend is indicative of the ongoing substitution of fixed traffic by mobile and IP traffic. Fixed voice average revenue per access (ARPA) decreased 7.4% from the same period last year as a result of the overall market trends described above. At the end of September 2011, ADSL mainlines were up 8.3% at 538,443 compared with the same period in 2010. ADSL mainline ARPA fell 5.9%. The Group’s TV subscriber base has shown further growth, with 317,847 customers at the end of September 2011, up 21.7% on the year. Subscriptions to Satellite TV, an extension of the Group’s IPTV service, continue to grow.
16
Residential Segment financial performance
in HRK million Jan-Sep 2011
Jan-Sep 2010
% of change 11/10
Voice revenue 1,969 2,256 -12.7% Non voice revenue 1,117 1,053 6.1% Other service revenue 113 45 152.9% Terminal equipment 115 135 -15.1% Miscellaneous 13 13 0.0% Total revenues 3,327 3,502 -5.0% Operating expenses 1,079 1,208 -10.7% Contribution to EBITDA before exceptionals 2,248 2,294 -2.0%
In the nine months to 30 September 2011, total residential revenues fell to HRK 3,327 million, down 5% year on year. The decline was due to lower voice revenues in the mobile and fixed network along with lower non voice revenues in mobile. This decline is largely due to the delayed economic recovery, regulatory measures and an intensely competitive market. Voice revenues A fall in retail mobile voice revenues in the nine months to 30 September 2011 from the same period in 2010 was driven by a highly competitive market, with prices showing a consistently decreasing trend in the face of a tough economic environment. In addition, voice mobile termination revenues were lower following reductions in termination rates. Mobile minutes of use (MOU) per average subscriber rose by 3.4%, however, demonstrating that the revenue decline resulted from lower average revenue per usage, owing to the factors mentioned above. Fixed telephony revenues in the nine months to 30 September 2011 were lower year on year owing to the continuation of fixed to mobile substitution as well as regulatory measures (including the regulation of WLR and naked ADSL).This resulted in an 8.3% fall in the number of mainlines and a 10.1% decrease in minutes of use. As a result of lower minutes spent and downward pricing pressure, voice ARPA declined by 7.4%. Non voice revenues In the first nine months to 30 September 2011, non voice revenues rose 6.1% over the previous year as a result of higher revenues from fixed services, whilst mobile revenues slipped slightly.
17
The mobile business has seen a notable redistribution of non voice revenues, with higher data revenues, supported by competitively priced packages and the increased availability of smart phones. This underscores the shift toward usage of data transmission services by the average mobile customer and away from voice and SMS. Higher fixed non voice (IP) revenues achieved at the end of September 2011 in comparison with the same period last year were a result of an 8.3% increase in ADSL mainlines and 21.7% rise in TV subscribers. Marketing initiatives and promotional offers caused ADSL ARPA to slip 5.9% in the period, however. Other service revenues Other service revenues were HRK 68 million higher as a result of different tariff structures for mobile. Terminal equipment Revenues from terminal equipment fell 15.1% in the nine months to 30 September 2011 to HRK 115 million compared with the previous year. This was due to decreased sales of handsets and different treatment of CPE equipment compared to last year. Contribution to EBITDA In the nine months to 30 September 2011, the contribution to EBITDA was HRK 2,248 million, down 2.0% compared with the same period last year. Business Segment highlights
• Stable customer base across all segments and products/tariffs • Mobile subscribers up 5.6% (up 1.1% on Q2 2011) • 109,342 ADSL mainlines up 6.0% (up 0.9% on Q2 2011) and 18,919 TV customers, up 17.0%
(up 2.6% on Q2 2011) • Revenues down 1.9%
o IP and ICT revenues showing further growth with new ICT services launched • Maintained position as major wholesale provider • Contribution to EBITDA of HRK 1,731 million, down 9.8%
Key operational data Jan-Sep 2011
Jan-Sep 2010
% of change 11/10
Mobile customers in 000
Number of subscribers 454 430 5.6%
18
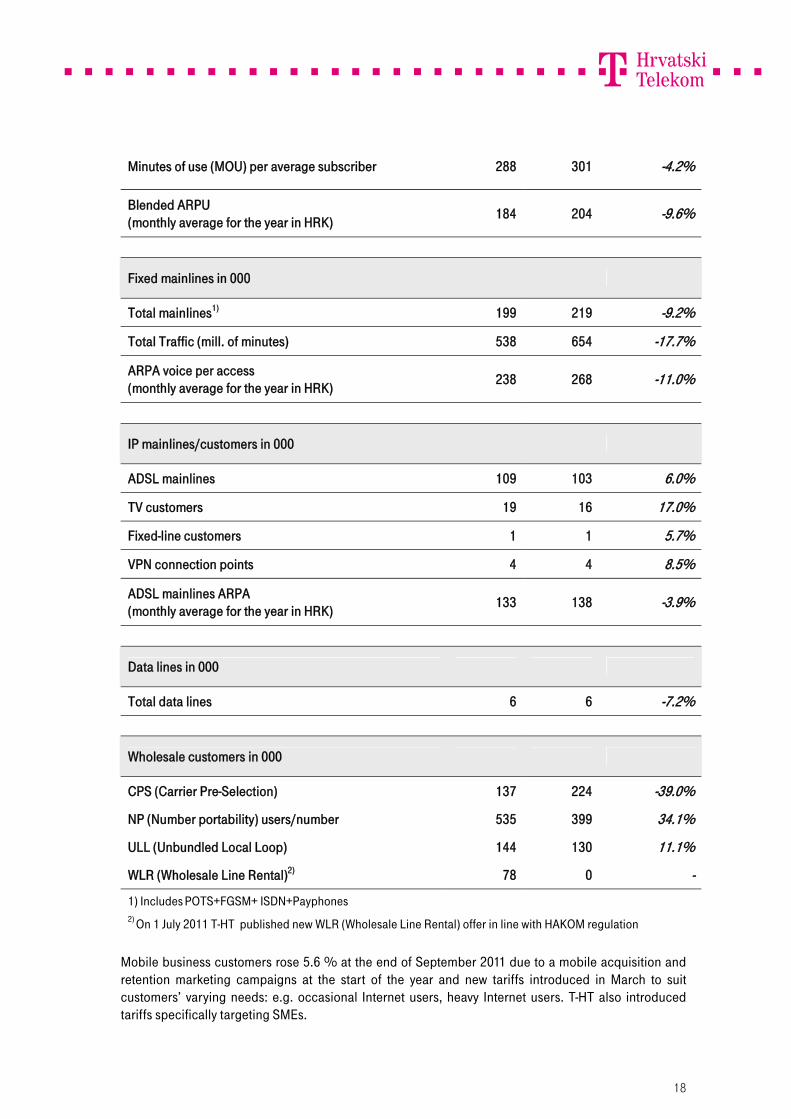
Minutes of use (MOU) per average subscriber 288 301 -4.2%
Blended ARPU (monthly average for the year in HRK) 184 204 -9.6%
Fixed mainlines in 000
Total mainlines1) 199 219 -9.2%
Total Traffic (mill. of minutes) 538 654 -17.7%
ARPA voice per access (monthly average for the year in HRK) 238 268 -11.0%
IP mainlines/customers in 000
ADSL mainlines 109 103 6.0%
TV customers 19 16 17.0%
Fixed-line customers 1 1 5.7%
VPN connection points 4 4 8.5%
ADSL mainlines ARPA (monthly average for the year in HRK) 133 138 -3.9%
1) Includes POTS+FGSM+ ISDN+Payphones 2) On 1 July 2011 T-HT published new WLR (Wholesale Line Rental) offer in line with HAKOM regulation
Mobile business customers rose 5.6 % at the end of September 2011 due to a mobile acquisition and retention marketing campaigns at the start of the year and new tariffs introduced in March to suit customers’ varying needs: e.g. occasional Internet users, heavy Internet users. T-HT also introduced tariffs specifically targeting SMEs.
19
Minutes of use per subscriber slipped 4.2%, however, and ARPA fell 9.6%, due to the impact of the economic downturn. Fixed line customer mainlines fell 9.2% year on year in the nine months to 30 September to 198,622. This fall is in line with the wider trend of fixed to mobile and IP substitution in the telecommunications market. Fixed telephony business minutes totalled 538 million minutes in nine months to 30 September 2011, down 17.7% on the same period last year. Fixed voice ARPA decreased 11.0% on the year to HRK 238, as result of lower usage. The ADSL subscriber base is showing continued growth as a result of attractive retention and acquisition promotions. ADSL mainlines in the nine month period rose 6.0% over the previous year to 109,342 whilst ADSL ARPA fell 3.9% to HRK 133. Subscribers to TV services grew 17.0% to 18,919 over the previous year as result of continuous service enhancements and offers on program packages to both new and existing subscribers. The Group launched a hotel TV service in March. The VPN customer base rose 8.5%. T-HT constantly promotes the migration of existing traditional data customers to IP based products. The number of data lines fell 7.2% in the nine months to 30 September 2011 compared with the previous year. Whilst traditional data lines are falling, however, uptake of new Metro Ethernet services continues to increase. In Q3 2011, tportal.hr became the Number Two web portal in Croatia by reach, with more than 800,000 unique visitors per month according to Gemius, an independent Internet traffic research agency. The consolidation of Croatia’s telecommunications market continues. The most significant recent development was the acquisition by VIPNet of cable operator B.Net. This move will intensify competition in the national wholesale and retail data market. With Croatia in the final stages of accession to the European Union, there is pressure from EU-based operators to increase discounts on roaming to levels close to EU benchmarks. Business Segment financial performance
in HRK million Jan-Sep 2011
Jan-Sep 2010
% of change 11/10
Voice revenue 1,383 1,565 -11.6% Non voice revenue 829 876 -5.4% Other service revenue 422 214 96.8% Terminal equipment 46 44 6.1% Miscellaneous 85 120 -28.8% Total revenues 2,765 2,819 -1.9%
20
Operating expenses 1,034 899 15.0% Contribution to EBITDA before exceptionals 1,731 1,919 -9.8%
Revenues Voice revenues
Voice revenues fell 11.6% to HRK 1,383 million (Jan-Sept 2010: HRK 1,565 million) mainly driven by continued economic downturn, competitive pressure on pricing and a 9.2% decline in total fixed mainlines with 17.7% fall in total fixed minutes .
Wholesale fixed voice revenues fell 13.8% due to regulatory intervention in the form of lower IC prices as of 1 January 2011. In addition, voice services revenues from international operators fell 5.8% compared with the previous year, primarily as result of lower traffic.
Downward pressure on mobile voice revenues continued, with a fall in retail mobile voice revenues driven by lower voice ARPU. This was partially offset by an increase in subscribers. In addition, voice mobile termination revenues were lower following reductions in termination rates. Non voice revenues Non voice revenues fell 5.4% to HRK 829 million in the nine months to 30 September 2011, due primarily to declines in retail and wholesale fixed non voice revenues. The decline in fixed retail was driven by lower revenues from traditional data, partially offset by higher IP revenues. Non voice fixed wholesale revenues were lower on a decline in revenues from national leased lines, migration to new commercial models and a decrease in capacity. Revenues from national IP services slipped on a fall in dial-up traffic. Interconnection leased line revenues also showed a decrease. Other service revenues Other service revenues increased 96.8% to HRK 422 million (Jan-Sept 2010: HRK 214million) on growth in ICT-related revenues following the acquisition of Combis (consolidated as of May 2010). Terminal equipment Revenues from terminal equipment rose 6.1% to HRK 46 million. Fixed terminal equipment revenues decreased slightly but this was offset by higher revenue from mobile terminal equipment following promotional activities at the beginning of 2011.
21
Miscellaneous revenues Miscellaneous revenues fell 28.8% to HRK 85 million. The fall was primarily driven by lower mobile revenue, as disconnection fee revenue became part of service revenue as of the start of 2011. Mobile wholesale miscellaneous revenues also decreased due to lower national roaming (NR) prices and lower usage. Contribution to EBITDA The Business Segment’s contribution to EBITDA in the nine months to 30 September 2011 fell 9.8% compared with the previous year to HRK 1,731 million. Network and support functions financial performance
in HRK million Jan-Sep 2011
Jan-Sep 2010
% of change 11/10
Other Operating income 185 104 78.1% Operating expenses 1,365 1,459 -6.5% Contribution to EBITDA before exceptionals -1,180 -1,355 -12.9%
In the Network and support functions, a 78.1% increase in Other operating income resulted from the one-off impact of a reversal of provisions and increased revenue from dunning letters. Operating expenses were 6.5% lower compared with the previous year due to lower maintenance expenses and service costs. Overall this resulted in a lower negative contribution to EBITDA for the nine months to 30 September 2011 of -HRK 1.180 million (Jan-Sept 2010: -HRK 1,355 million). Network and Service Platforms Network and Service Platforms are T-HT’s core infrastructure and as such are continuously upgraded and improved in line with Group strategy. With the consolidation of T-HT’s business operations, the Group started to converge the functionalities of its resources in both fixed and mobile networks on joint service platforms, thus achieving improved service availability and greater cost efficiencies. In the nine months to 30 September 2011, T-HT has been working on the further development of its network infrastructure, increasing broadband access capacity and establishing a common, fixed and mobile, transport and core network. In fixed networks, T-HT has adopted a strategy of providing all services via one common broadband port, triggering the transformation of its access network by the construction of a new optical access network, including an optical access platform (GPON) and modernization of the copper access network. Furthermore, the Group continues functional upgrades of the existing PSTN network to enable VoIP telephony provision on broadband.
22
In mobile networks, continuous radio access and core network transformation will support the development and rapid implementation of new, economically optimized technologies (e.g. HSPA, LTE), while taking into account maximum utilization of existing infrastructure and frequency resources. Mobile BroadBand (MBB) access was strongly in the focus of development, through existing and newly deployed technologies such as UMTS900, in order to improve data services coverage. Expansion of network by building of new infrastructural points is continued, along with capacity expansion to support strong data traffic increase. T-HT Group Third Quarter 2011 Report Summary of key financial indicators
in HRK million (IFRS) Jul-Sep 2011
Jul-Sep 2010
% of change 11/10
Voice revenue 1,222 1,377 -11.3% Non voice revenue 695 686 1.3% Other service revenue 214 110 94.4% Terminal equipment 48 58 -16.4% Miscellaneous 30 46 -35.6% Revenues 2,209 2,278 -3.0% EBITDA before exceptional items 1,132 1,137 -0.5% EBITDA after exceptional items 1,132 1,137 -0.5% EBIT 791 814 -2.9% Net profit 655 662 -1.2%
In the third quarter of 2011, revenues declined 3.0%, due primarily to a 11.3% fall in Voice revenues. This was the result of a tough economic environment, a consistent decline in prices (including interconnection prices) and intense competitive pressure. Non voice revenues rose by 1.3%, due largely to an increase in residential fixed non voice revenues (connected with ADSL and IPTV services) and higher mobile non voice usage. Both, Voice and Non voice were supported by the change in revenue recognition outlined above, due to the amended definition of useful life of a customer relationship. Other service revenues rose 94.4% due to an improved contribution from Combis and the implementation of different tariff structures in mobile. Following a decrease in operating expenses, EBITDA fell 0.5% while larger depreciation expenses caused EBIT to decrease 2.9%. Net profit fell 1.2%.
23
Risk management As well as the business and regulatory developments outlined in this statement, the Group also reports the following changes to its risk profile in the period under review. The Group understands that the Agency has filed two indictments to the Misdemeanour Court against the Company over infringements of the Electronic Communications Act, proposing that the Company should be fined 3% of its annual gross revenues in each of these two proceedings due to the Company’s alleged breach of regulatory obligations proscribed by the decision of the Agency Council dated 6 April 2011 upon which the Company is obligated to offer alternative operators wholesale line rental service as of 1 July 2011. These indictments have not yet been officially delivered to the Company. When and if such misdemeanour charges are received, the Company will present its defence before the Misdemeanour Court. Croatian Competition Agency (CCA) has initiated proceedings against all three mobile operators (including the Company) for the alleged agreement on concerted practice prohibited by the Competition Act since all three mobile operators changed billing units in their tariff plans on 1 October 1 2009 from 15 seconds to 60 seconds. The CCA considers the change of billing units to be an agreement on a price increase. The Company received the CCA’s decision on official initiation of the procedure on 21 September 2011. In these proceedings, the CCA will examine the existence of such agreement among the above-mentioned operators and whether as such it constitutes concerted practice as prohibited under Article 8 of the Competition Act (OJ 79/09).
24
Group 2011 outlook Revenue As stated in the Q1 results on 28 April 2011, the Group’s performance for the current financial year is influenced by the strength of the tourist season in Croatia and recovery in the national economy. The economic turnaround that had been predicted earlier this year has not materialized, while unemployment remains high and the amount of overdue payments has reached record levels. At the same time, the government’s 6% tax on mobile services, originally imposed in 2009, has not been removed, whilst the recent introduction of regulations governing wholesale line rental and naked DSL will further impact the Group’s business. The Group continues to maintain its focus on exploiting new growth opportunities and maximising existing ones. However, given the tough economic conditions and accelerated regulatory pressures the Group expects 2011 revenue to be moderately lower than the 2010 level. EBITDA before exceptional items In light of continued challenging economic conditions in Croatia, regulatory impact and consequently lower expectations for revenue, the Group expects 2011 EBITDA close to the 2010 level. However, the Group is committed to maintaining the year-on-year EBITDA margin through efficiencies gained so far and continuing strong cost controls. CAPEX While the current regulatory regime remains a disincentive to T-HT’s potential investment in fiber infrastructure, the Group expects 2011 capital expenditure to be lower than 2010. However, T-HT will continue to invest in modernizing the network and IT systems, as well as in mobile capacity. Regional Expansion The Group continues to monitor and evaluate expansion opportunities to increase shareholder value.
25
T-HT Group Financial statements
Consolidated Income Statement
in HRK million (IFRS) Jan-Sep 2011
Jan-Sep 2010
% of change
11/10
Jul-Sep 2011
Jul-Sep 2010
% of change
11/10
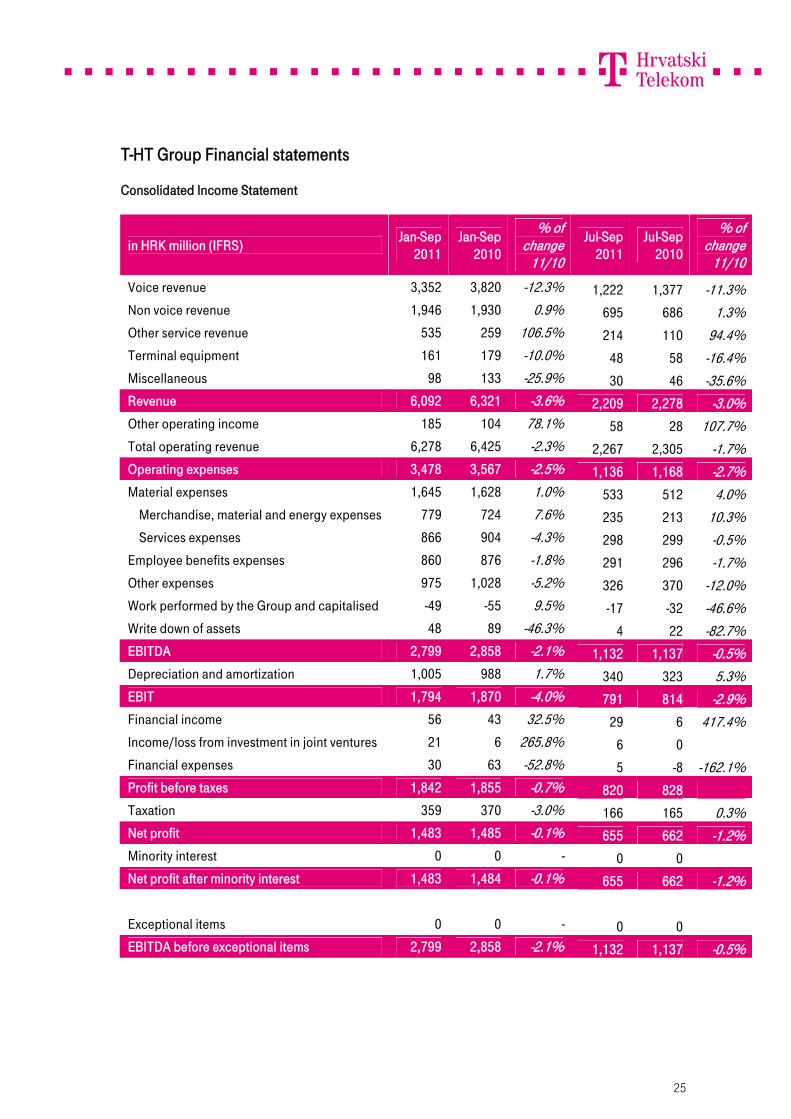
Voice revenue 3,352 3,820 -12.3% 1,222 1,377 -11.3% Non voice revenue 1,946 1,930 0.9% 695 686 1.3% Other service revenue 535 259 106.5% 214 110 94.4% Terminal equipment 161 179 -10.0% 48 58 -16.4% Miscellaneous 98 133 -25.9% 30 46 -35.6% Revenue 6,092 6,321 -3.6% 2,209 2,278 -3.0% Other operating income 185 104 78.1% 58 28 107.7% Total operating revenue 6,278 6,425 -2.3% 2,267 2,305 -1.7% Operating expenses 3,478 3,567 -2.5% 1,136 1,168 -2.7% Material expenses 1,645 1,628 1.0% 533 512 4.0% Merchandise, material and energy expenses 779 724 7.6% 235 213 10.3% Services expenses 866 904 -4.3% 298 299 -0.5% Employee benefits expenses 860 876 -1.8% 291 296 -1.7% Other expenses 975 1,028 -5.2% 326 370 -12.0% Work performed by the Group and capitalised -49 -55 9.5% -17 -32 -46.6% Write down of assets 48 89 -46.3% 4 22 -82.7% EBITDA 2,799 2,858 -2.1% 1,132 1,137 -0.5% Depreciation and amortization 1,005 988 1.7% 340 323 5.3% EBIT 1,794 1,870 -4.0% 791 814 -2.9% Financial income 56 43 32.5% 29 6 417.4% Income/loss from investment in joint ventures 21 6 265.8% 6 0 Financial expenses 30 63 -52.8% 5 -8 -162.1% Profit before taxes 1,842 1,855 -0.7% 820 828 Taxation 359 370 -3.0% 166 165 0.3% Net profit 1,483 1,485 -0.1% 655 662 -1.2% Minority interest 0 0 - 0 0 Net profit after minority interest 1,483 1,484 -0.1% 655 662 -1.2% #DIV/0! Exceptional items 0 0 - 0 0 EBITDA before exceptional items 2,799 2,858 -2.1% 1,132 1,137 -0.5%
26
Consolidated Balance Sheet
in HRK million At 30 Sep 2011
At 31 Dec 2010
% of change 11/10
Intangible assets 1,030 1,162 -11.4% Property, plant and equipment 6,090 6,336 -3.9% Non-current financial assets 443 422 5.0% Receivables 24 31 -23.0% Deferred tax asset 50 57 -11.6% Total non-current assets 7,637 8,008 -4.6% Inventories 189 216 -12.6% Receivables 1,351 1,504 -10.1% Current financial assets 711 465 52.9% Cash and cash equivalents 2,478 3,282 -24.5% Prepayments and accrued income 167 110 51.5% Total current assets 4,895 5,577 -12.2% TOTAL ASSETS 12,532 13,585 -7.7% Subscribed share capital 8,189 8,189 0.0% Reserves 409 409 0.1% Revaluation reserves -3 -1 -170.3% Retained earnings 598 626 -4.5% Net profit for the period 1,483 1,831 -19.0% Minority interest 1 0 - Total issued capital and reserves 10,677 11,054 -3.4% Provisions 311 293 6.1% Non-current liabilities 35 117 -70.0% Total non-current liabilities 346 410 -15.6% Current liabilities 1,305 1,871 -30.3% Accrued expenses and deferred income 205 250 -18.1% Total current liabilities 1,509 2,121 -28.8% Total liabilities 1,855 2,531 -26.7% TOTAL EQUITY AND LIABILITIES 12,532 13,585 -7.7%
27
Consolidated Cash Flow Statement
in HRK million (IFRS HT accounting policies) Jan-Sep 2011
Jan-Sep 2010
% of change
11/10
Profit before tax 1,842 1,855 -0.7% Depreciation and amortization 1,005 988 1.7% Decrease of current receivables 50 0 - Decrease of inventories 28 0 - Other cash flow increases 0 0 - Total increase of cash flow from operating activities 2,924 2,843 2.8% Decrease of current liabilities -503 -147 -242.6% Increase of current receivables 0 -148 100.0% Increase of inventories 0 -6 100.0% Other cash flow decreases -527 -320 -64.8% Total decrease of cash flow from operating activities -1,030 -620 -66.2% Net cash inflow/outflow from operating activities 1,894 2,223 -14.8% Proceeds from sale of non-current assets 11 5 94.7% Proceeds from sale of non-current financial assets 74 437 -83.1% Proceeds from sale of current financial assets 0 0 - Interest received 44 38 15.9% Other cash inflows from investing activities 518 150 246.2% Total increase of cash flow from investing activities 647 630 2.7% Purchase of non-current assets -634 -617 -2.6% Purchase of non-current financial assets 0 -290 100.0% Other cash outflows from investing activities -840 -399 -110.2% Total decrease of cash flow from investing activities -1,473 -1,307 -12.7% Net cash inflow/outflow from investing activities -826 -678 -22.0% Total increase of cash flow from financing activities 0 0 - Repayment of loans and bonds -9 -2 -394.8% Dividends paid -1,863 -2,788 33.2% Repayment of finance lease 0 -1 100.0% Total decrease in cash flow from financing activities -1,872 -2,791 32.9% Net cash inflow/outflow from financing activities -1,872 -2,791 32.9% Total increase of cash flow 1,894 2,223 -14.8% Total decrease of cash flow -2,698 -3,468 22.2% Cash and cash equivalents at the beginning of period 3,282 4,195 -21.8% Net cash (outflow) / inflow -804 -1,246 35.4% Cash and cash equivalents at the end of period 2,478 2,949 -16.0%
28
Consolidated EBITDA reconciliation
in HRK million Jan-Sep 2011
Jan-Sep 2010
% of change 11/10
Segment Result (Contribution to EBITDA) Residential Segment 2,248 2,294 -2.0% Business Segment 1,731 1,919 -9.8% Network and Support Functions -1,180 -1,355 -12.9%
Total Contribution to EBITDA before exceptionals of the Segments 2,799 2,858 -2.1%
Exceptional items 0 0 - Total EBITDA 2,799 2,858 -2.1%
Group’s revenue breakdown under former reporting structure
1. Subscribed share capital 8,189 8,189 2. Net income reserves 409 409 3. Retained earnings or loss carried forward 627 598 4.Net profit (loss) for the period 1,831 1,483 5. Revaluation of available for sale financial assets -2 -2 6. Other changes in equity 0 0 7. Total equity and reserves 11,054 10,677
29
Notes to the condensed consolidated financial statements For the nine months ended on 30 September 2011 Basis of preparation The condensed consolidated financial statements as of 30 September 2011 and for the nine months then ended, have been prepared using accounting policies consistent with International Financial Reporting Standards. Significant Accounting Policies The consolidated financial statements have been prepared under the historical cost convention, except for investments available-for-sale stated at fair value.
The same accounting policies, presentation and methods of computation are followed in these condensed consolidated financial statements as were applied in the preparation of HT’s consolidated financial statements for the year ended 31 December 2010.
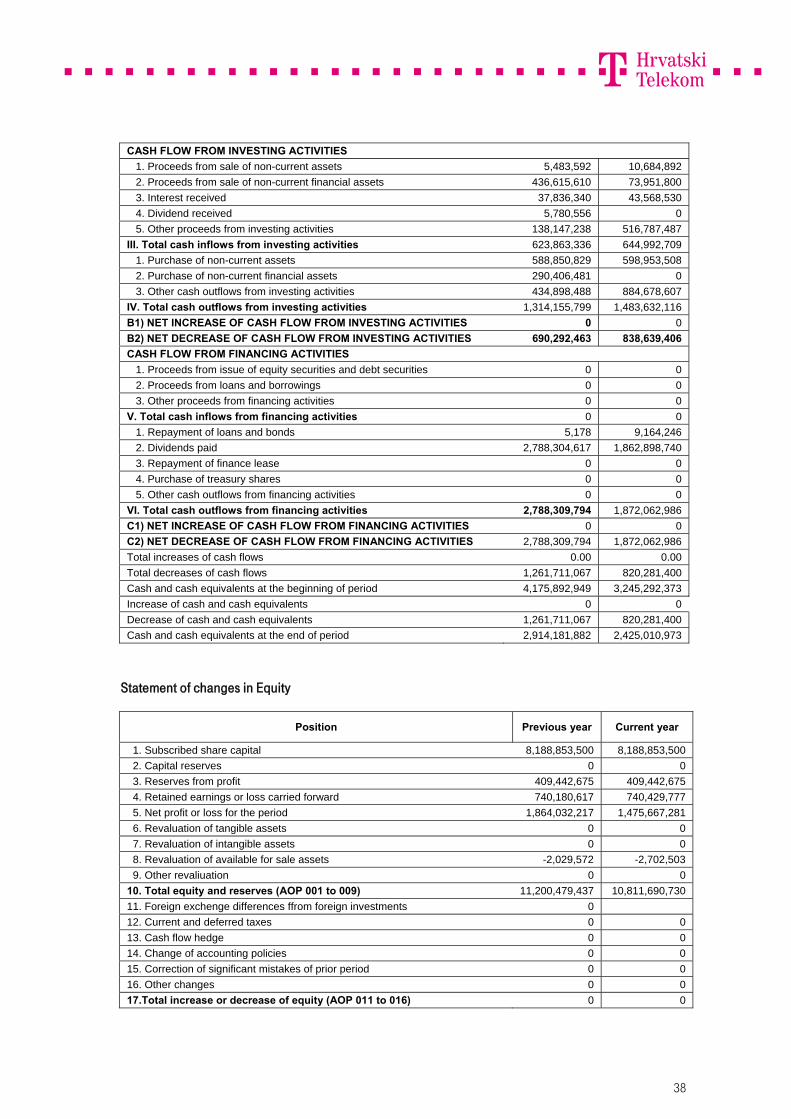
Dividends Dividend in the amount of HRK 1,864 million (HRK 22,76 per share) was paid to the shareholders on 23 May 2011. Segment information On 1 January 2010, the old divisions of T-Com and T-Mobile, serving fixed and mobile markets respectively, were replaced by a new structure based upon Residential and Business segments. Starting from first quarter of 2011, new segment reporting following this structure is introduced.
The group’s operating segments are Residential Segment, Business Segment and Network and Support function segment.
The Residential Segment (RS) includes marketing, sales and customer care activities, focused on providing mobile, fixed line telecommunications and TV distribution services to residential customers.
The Business Segment (BS) includes marketing, sales and customer care activities, focused on providing mobile and fixed line telecommunications, system integration services to corporate customers, small and medium business, and public sector. Also BS is responsible for wholesale business for both, fixed and mobile services.
The Network and Support Functions (NSF) performs cross-segment management and support functions, including Technology department, Procurement, Accounting, Treasury, Legal and other central functions.
30
Business segments
The following tables present revenue and profit of HT’s business segments:
Period ended 30 September 2011
in HRK million Residential
SegmentBusiness Segment
Network and support
functionsVoice revenue 1,969 1,383 0Non voice revenue 1,117 829 0Other service revenue 113 116 0ICT services 0 306 Terminal equipment 115 46 0Miscellaneous 13 85 0Total revenues 3,327 2,765 0 Other operating income 0 0 185 Operating expenses 1,079 1,034 1,365 Contribution to EBITDA before SI 2,248 1,731 -1,180
Current interim period 1 July 2011 to 30 September 2011
in HRK million Residential
SegmentBusiness Segment
Network and support
functionsVoice revenue 685 537 0Non voice revenue 387 308 0Other service revenue 49 38 0ICT services 0 127 Terminal equipment 33 15 0Miscellaneous 3 27 0Total revenues 1,157 1,052 0 Other operating income 0 0 58 Operating expenses 339 347 451 Contribution to EBITDA before SI 818 705 -393
31
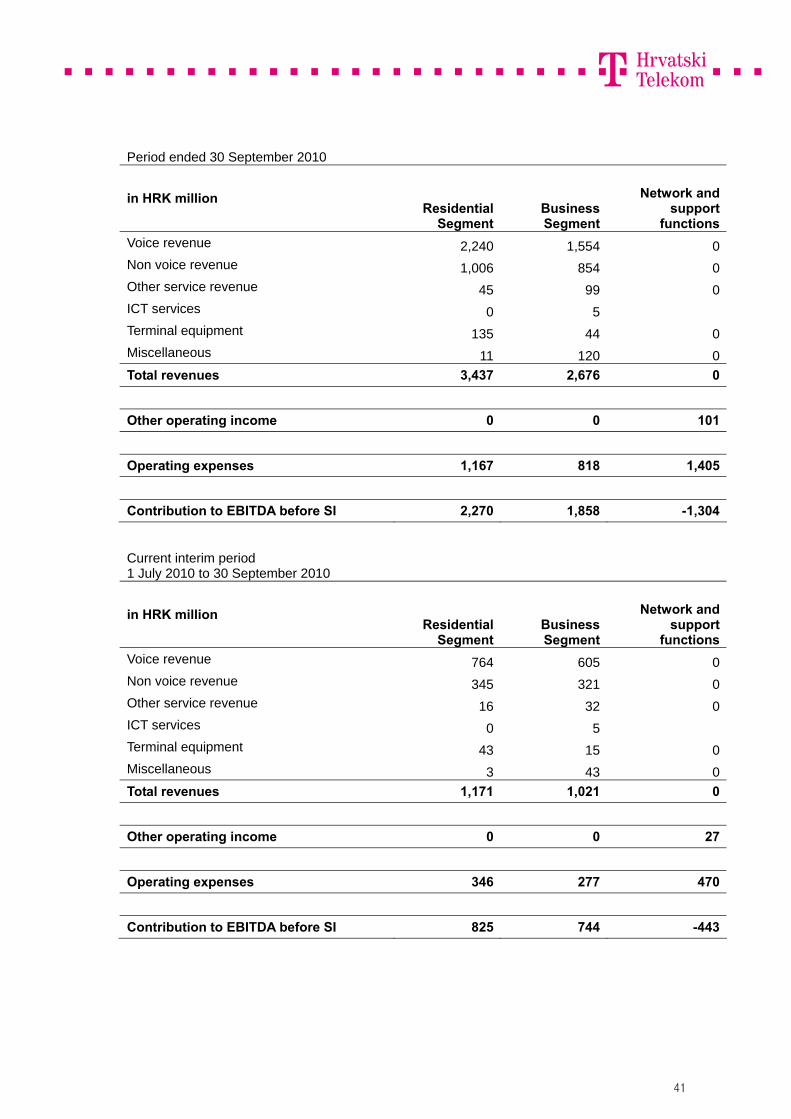
Period ended 30 September 2010
in HRK million Residential
SegmentBusiness Segment
Network and support
functionsVoice revenue 2,256 1,565 0Non voice revenue 1,053 876 0Other service revenue 45 99 0ICT services 0 115 Terminal equipment 135 44 0Miscellaneous 13 120 0Total revenues 3,502 2,819 0 Other operating income 0 0 104 Operating expenses 1,208 899 1,459 Contribution to EBITDA before SI 2,294 1,920 -1,355
Current interim period 1 July 2010 to 30 September 2010
in HRK million Residential
SegmentBusiness Segment
Network and support
functionsVoice revenue 769 608 0Non voice revenue 362 324 0Other service revenue 16 35 0ICT services 0 59 Terminal equipment 43 15 0Miscellaneous 4 43 0Total revenues 1,194 1,084 0 Other operating income 0 0 28 Operating expenses 361 320 486 Contribution to EBITDA before SI 833 764 -458
32
Relations with the governing company and its affiliated companies
In the first nine months of 2011 there were no transactions among related parties with a significant impact on the financial position and operations of the Group in the given period.
In the first nine months of 2011 there were no changes in transactions among related parties which were specified in the annual financial report for 2010 and which had a significant impact on the financial position and operations of the Group in the first nine months of 2011.
Business relations transacted between HT d.d. and affiliated companies thereof (hereinafter referred to as: Group) in the first nine months of 2011 and the governing company and affiliated companies thereof can be classified as follows:
Transactions with related companies
Transactions with related companies primarily relate to the transactions with the companies owned by Deutsche Telekom AG (hereinafter referred to as: DTAG). The Group enters into transactions in the normal course of business on an arm’s length basis. These transactions included the sending and receiving of international traffic to/from these companies.
In the first nine months of 2011 the Group generated total revenue from related companies from international traffic to the amount of HRK 115 million (the first nine months of 2010: HRK 131 million), while total costs of international traffic amounted to HRK 72 million (the first nine months of 2010: HRK 95 million).
DTAG companies provided intellectual services to the Group in the amount of HRK 7 million in the first nine months of 2011 (the first nine months of 2010: HRK 8 million).
Compensation of the Supervisory Board
The chairman of the Supervisory Board receives remuneration in the amount of 1.5 of the average net salary of the employees of the Company paid in the preceding month. To the deputy chairman, the amount of 1.25 of the average net salary of the employees of the Company paid in the preceding month is paid, while any other member receives the amount of one average net salary of the employees of the Company paid in the preceding month. To a member of the Supervisory Board who is in the same time the Chairman of the Audit Committee of the Supervisory Board in the amount of 1.5 of the average monthly net salary of the employees of the company paid in the preceding month. To a member of the Supervisory Board who is in the same time a Member of the Audit Committee of the Supervisory Board in the amount of 1.25 of the average monthly net salary of the employees of the company paid in the preceding month. To a member of the Supervisory Board who is in the same time a Member of the Compensation and Nomination Committee of the Supervisory Board in the amount of 1.25 of the average monthly net salary of the employees of the company paid in the preceding month. DTAG representatives do not receive any remuneration for the membership in the Supervisory Board due to a respective policy of DTAG.
33
In the first nine months of 2011, the Company paid a total amount of HRK 0.5 million (the first nine months of 2010: HRK 0.5 million) to the Members of its Supervisory Board. No loans were granted to the Members of the Supervisory Board.
Compensation to key management personnel
In the first nine months of 2011 the total compensation paid to key management personnel of the Group amounted to HRK 35 million (first nine months of 2010: HRK 28 million Compensation paid to key management personnel relates to short-term employee benefits. Key management personnel include members of the Management Boards of the Company and its subsidiaries and the operating directors of the Company, who are employed by the Group.
34
Appendix: HT d.d. Financial statements (TFI POD Form) (Note: The Group’s TFI POD Form is posted on the Company website www.t.ht.hr/eng/investors)
Income Statement
Position Previous period
Previous period
Current period
Current period
Cummulative Quarter Cummulative Quarter I. OPERATING INCOME (112 do 113) 6,212,409,906 2,224,692,002 5,861,346,809 2,102,295,315 1. Rendering of services 6,110,469,807 2,193,277,911 5,711,224,394 2,054,900,954 2. Other operating income 101,940,099 31,414,091 150,122,415 47,394,361 II. OPERATING COSTS (115+116+120+124+125+126+129+130) 4,337,391,690 1,410,901,284 4,063,830,124 1,316,402,432
1. Change in inventories of work in progress 2. Material expenses (117 do 119) 1,534,852,481 489,043,943 1,382,544,479 424,313,410 a) Costs of raw materials 106,147,250 42,542,487 114,483,818 35,979,110 b) Cost of goods sold 542,589,348 132,946,368 450,000,654 103,299,617 c) Other material expenses 886,115,883 313,555,088 818,060,007 285,034,683 3. Employee benefits expenses (121 do 123) 778,112,420 258,071,001 739,661,876 250,199,411 a) Net salaries 408,777,713 137,422,639 408,750,020 137,587,615 b) Tax and contributions from salary expenses 255,333,300 82,684,985 222,135,408 75,777,771 c) Contributions on salary 114,001,407 37,963,377 108,776,448 36,834,025 4. Depreciation and amortisation 963,124,782 313,750,370 961,347,180 325,255,571 5. Other expenses 936,131,025 312,732,558 910,430,499 308,075,573 6. Write down of assets (127+128) 87,109,745 21,198,207 45,970,033 3,719,864 a) non-current assets (except financial assets) 0 0 0 0 b) current assets (except financial assets) 87,109,745 21,198,207 45,970,033 3,719,864 7. Provisions 38,061,237 16,105,205 23,876,057 4,838,603 8. Other operating costs 0 0 0 0 III. FINANCIAL INCOME (132 do 136) 54,854,518 12,510,405 44,606,393 21,471,466 1. Interest, foreign exchange differences, dividens and similar income from related parties 8,197,906 2,851,427 7,021,985 1,753,047
2. Interest, foreign exchange differences, dividens and similar income from third parties 40,157,387 9,006,476 36,861,533 19,712,842
3. Income from investments in associates and joint ventures 5,780,556 0 0 0
4. Unrealised gains (income) from financial assets 5. Other financial income 718,669 652,502 722,875 5,577 IV. FINANCIAL EXPENSES (138 do 141) 30,561,831 986,763 11,659,783 -4,883,724 1. Interest, foreign exchange differences, dividens and similar income from related parties 0 0 0 0
2. Interest, foreign exchange differences, dividens and similar income from third parties 24,774,800 -491,131 5,555,661 -6,166,910
3. Unrealised losses (expenses) from financial assets 4. Other financial expenses 5,787,031 1,477,894 6,104,122 1,283,186 V. SHARE OF PROFIT FROM ASSOCIATED COMPANIES 0 0 0 0
VI. SHARE OF LOSS FROM ASSOCIATED COMPANIES 0 0 0 0 VII. EXTRAORDINARY - OTHER INCOME 0 0 0 0 VIII. EXTRAORDINARY - OTHER EXPENSES 0 0 0 0 IX. TOTAL INCOME (111+131+144) 6,267,264,424 2,237,202,407 5,905,953,202 2,123,766,781 X. TOTAL EXPENSES (114+137+143+145) 4,367,953,521 1,411,888,047 4,075,489,907 1,311,518,708 XI. PROFIT OR LOSS BEFORE TAXES (146-147) 1,899,310,903 825,314,360 1,830,463,295 812,248,073 1. Profit before taxes (146-147) 1,899,310,903 825,314,360 1,830,463,295 812,248,073 2. Loss before taxes (147-146) 0 0 0 0
35
XII. TAXATION 369,964,699 166,399,257 354,796,013 164,116,399 XII. PROFIT OR LOSS FOR THE PERIOD (148-151) 1,529,346,204 658,915,103 1,475,667,282 648,131,674 1. Profit for the period (149-151) 1,529,346,204 658,915,103 1,475,667,282 648,131,674 2. Loss for the period (151-148) 0 0 0 0 ADDITION TO PROFIT AND LOSS ACCOUNT (only for consolidated financial statements)
XIV. PROFIT OR LOSS FOR THE PERIOD 1. Attributable to majority owners 0 0 0 0 2. Attributable to minority interest 0 0 0 0 STATEMENT OF OTHER COMPREHENSIVE INCOME (only for IFRS adopters)
I. PROFIT OR LOSS FOR THE PERIOD (=152) 0 0 0 0 II. OTHER COMPREHENSIVE INCOME/LOSS BEFORE TAXES (159 TO 165) 1,856,778 -811,425 -672,931 -1,145,402
1. Exchange differences from international settlement 0 0 0 0 2. Changes in revaluation reserves of long-term tangible and intangible assets 0 0 0 0
3. Profit or loss from re-evaluation of financial assets held for sale 1,856,778 -811,425 -672,931 -1,145,402
4. Profit or loss from cash flow hedging 0 0 0 0 5. Profit or loss from hedging of foreign investments 0 0 0 0 6. Share of other comprehensive income/loss from associatied companies 0 0 0 0
7. Actuarial gains/losses from defined benefit plans 0 0 0 0 III. TAXATION OF OTHER COMPREHENSIVE INCOME FOR THE PERIOD 0 0 0 0
IV. NET OTHER COMPREHENSIVE INCOME FOR THE PERIOD (158 TO 166) 1,856,778 -811,425 -672,931 -1,145,402
V. COMPREHENSIVE INCOME OR LOSS FOR THE PERIOD (157+167) 1,856,778 -811,425 -672,931 -1,145,402
Balance Sheet
Position Previous period Current period
ASSETS A) RECEIVABELS FOR SUBSCRIBED NOT PAID CAPITAL 0 0 B) NON-CURRENT ASSETS (003+010+020+029+033) 8,195,308,051 7,855,546,743 I. INTANGIBLE ASSETS (004 do 009) 923,900,981 803,342,814 1. Expenditure for development 0 0 2. Concessions, patents, licenses, trademarks, service marks, software and other rights 855,692,772 760,694,512
3. Goodwill 0 4. Advances for purchase of intangible assets 0 5. Intangible assets in progress 68,208,209 42,648,302 6. Other intangible assets 0 0 II. PROPERTY, PLANT AND EQUIPMENT (011 do 019) 6,236,109,440 5,986,576,964 1. Land 37,668,031 37,625,556 2. Buildings 3,717,506,842 3,646,095,462 3. Plant and equipement 1,903,615,166 1,836,669,713 4. Tools, working inventory and transportation assets 187,018,678 167,784,929 5. Biological assets 0 6. Advances for purchase of tangible assets 4,171,262 2,270,250 7. Tangible assets in progress 379,933,479 291,016,838
36
8. Other tangible assets 6,195,982 5,114,216 9. Investment in real-estate 0 0 III. NON-CURRENT FINANCIAL ASSETS (021 do 028) 946,901,017 991,912,653 1. Share in related parties 628,335,287 858,360,887 2. Loans to related parties 276,989,280 91,992,816 3. Participating interests (shares) 1,161,000 1,161,000 4. Loans to companies with participating interest 0 0 5. Investments in securities 34,079,175 34,061,675 6. Loans, deposits, etc. 6,336,275 6,336,275 7. Other non-current financial assets 0 0 8. Equity-accounted investments 0 0 IV. RECEIVABLES (030 do 032) 31,464,799 23,350,725 1. Receivables from related parties 0 0 2. Receivables arising from sales on credit 19,868,966 18,624,492 3. Other receivables 11,595,833 4,726,233 V. DEFERRED TAX ASSET 56,931,814 50,363,587 C) CURRENT ASSETS (035+043+050+058) 5,244,657,111 4,519,298,641 I. INVENTORIES (036 do 042) 203,034,434 164,843,424 1. Raw materials and supplies 101,783,434 99,110,995 2. Production in progress 0 0 3. Finished products 0 0 4. Merchandise 101,132,488 65,626,206 5. Advances for inventories 118,512 106,223 6. Long term assets held for sale 0 0 7. Biological assets 0 0 II. RECEIVABLES (044 do 049) 1,351,184,560 1,234,444,141 1. Receivables from related parties 21,681,008 25,640,717 2. Receivables from end-customers 1,212,572,764 1,143,464,699 3. Receivables from participating parties 0 0 4. Receivables from employees and members of the company 93,298 55,401 5. Receivables from government and other institutions 28,861,872 1,792,785 6. Other receivables 87,975,618 63,490,539 III. CURRENT FINANCIAL ASSETS (051 do 057) 445,145,744 695,000,103 1. Share in related parties 0 0 2. Loans to related parties 0 0 3. Participating interests (shares) 0 0 4. Loans to companies with participating interest 0 0 5. Investments in securities 445,145,744 695,000,103 6. Loans, deposits, etc. 0 7. Other financial assets 0 IV. CASH AND CASH EQUIVALENTS 3,245,292,373 2,425,010,973 D) PREPAYMENTS AND ACCRUED INCOME 97,006,334 149,652,184 E) TOTAL ASSETS (001+002+034+059) 13,536,971,496 12,524,497,568 F) OFF BALANCE SHEET ITEMS EQUITY AND LIABILITIES A) ISSUED CAPITAL AND RESERVES (063+064+065+071+072+075+078) 11,200,479,437 10,811,690,730 I. SUBSCRIBED SHARE CAPITAL 8,188,853,500 8,188,853,500 II. CAPITAL RESERVES 0 0 III.RESERVES FROM PROFIT (066+067-068+069+070) 409,442,675 409,442,675 1. Legal reserves 409,442,675 409,442,675 2. Reserve for own shares 0 0 3. Treasury shares and shares (deductible items) 0 0 4. Statutory reserves 0 0 5. Other reserves 0 0 IV. REVALUATION RESERVES -2,029,572 -2,702,503 V. RETAINED EARNINGS OR LOSS CARRIED FORWARD (073-074) 740,180,617 740,429,777 1. Retained earnings 740,180,617 740,429,777
37
2. Loss carried forward 0 0 VI. NET PROFIT OR LOSS FOR THE PERIOD (076-077) 1,864,032,217 1,475,667,281 1. Net profit for the period 1,864,032,217 1,475,667,281 2. Net loss for the period 0 0 VII. MINORITY INTEREST 0 0 B) PROVISIONS (080 do 082) 426,453,758 309,007,461 1. Provisions for pensions, severance pay and similar libabilities 325,366,358 209,450,143 2. Provisions for tax liabilities 3. Other provisions 101,087,400 99,557,318 C) NON-CURRENT LIABILITIES (084 do 092) 29,833,741 26,645,993 1. Liabilites to related parties 0 0 2. Liabilities for loans, deposits, etc. 0 0 3. Liabilities to banks and other financial institutions 0 0 4. Liabilities for advances 0 0 5. Trade payables 0 0 6. Commitments on securities 0 0 7. Liabilities to companies with participating interest 0 0 8. Other non-current liabilities 29,833,741 26,645,993 9. Deferred tax liabilities 0 0 D) CURRENT LIABILITIES (094 do 105) 1,560,996,564 1,174,590,486 1. Liabilites to related parties 19,719,378 1,093,675 2. Liabilities for loans, deposits, etc. 181,503 221,048 3. Liabilities to banks and other financial institutions 0 0 4. Liabilities for advances 1,343,302 1,936,366 5. Trade payables 1,200,573,696 800,365,514 6. Commitments on securities 0 7. Liabilities to companies with participating interest 0 8. Liabilities to emloyees 201,496,193 173,968,605 9. Taxes, contributions and similar liabilities 36,296,148 112,557,323 10. Liabilities arising from share in the result 0 11. Liabilities arising from non-current assets held for sale 0 12. Other current liabilities 101,386,344 84,447,955 E) ACCRUED EXPENSES AND DEFERRED INCOME 319,207,996 202,562,899 F) TOTAL EQUITY AND LIABILITIES (062+079+083+093+106) 13,536,971,496 12,524,497,569 G) OFF BALANCE SHEET ITEMS
Cash Flow Statement
Position Prethodno razdoblje
Tekuće razdoblje
CASH FLOWS FROM OPERATING ACTIVITIES 1. Profit before tax 1,899,310,903 1,830,463,294 2. Depreciation and amortisation 962,755,291 961,347,180 3. Increase of current liabilities 0 0 4. Decrease of current receivables 0 72,208,643 5.Decrease of inventories 0 38,191,010 6. Other cash flow increases 0 0 I. Total increase of cash flow from operating activities 2,862,066,194 2,902,210,127 1. Decrease of current liabilities 147,050,270 506,238,923 2. Increase of current receivables 121,922,138 0 3. Increase of inventories 52,126,145 0 4. Other cash flow decreases 324,076,451 505,550,212 II. Total decrease of cash flow from operating activities 645,175,003 1,011,789,135 A1) NET INCREASE OF CASH FLOW FROM OPERATING ACTIVITIES 2,216,891,191 1,890,420,992 A2) NET DECREASE OF CASH FLOW FROM OPERATING ACTIVITIES 0 0
38
CASH FLOW FROM INVESTING ACTIVITIES 1. Proceeds from sale of non-current assets 5,483,592 10,684,892 2. Proceeds from sale of non-current financial assets 436,615,610 73,951,800 3. Interest received 37,836,340 43,568,530 4. Dividend received 5,780,556 0 5. Other proceeds from investing activities 138,147,238 516,787,487 III. Total cash inflows from investing activities 623,863,336 644,992,709 1. Purchase of non-current assets 588,850,829 598,953,508 2. Purchase of non-current financial assets 290,406,481 0 3. Other cash outflows from investing activities 434,898,488 884,678,607 IV. Total cash outflows from investing activities 1,314,155,799 1,483,632,116 B1) NET INCREASE OF CASH FLOW FROM INVESTING ACTIVITIES 0 0 B2) NET DECREASE OF CASH FLOW FROM INVESTING ACTIVITIES 690,292,463 838,639,406 CASH FLOW FROM FINANCING ACTIVITIES 1. Proceeds from issue of equity securities and debt securities 0 0 2. Proceeds from loans and borrowings 0 0 3. Other proceeds from financing activities 0 0 V. Total cash inflows from financing activities 0 0 1. Repayment of loans and bonds 5,178 9,164,246 2. Dividends paid 2,788,304,617 1,862,898,740 3. Repayment of finance lease 0 0 4. Purchase of treasury shares 0 0 5. Other cash outflows from financing activities 0 0 VI. Total cash outflows from financing activities 2,788,309,794 1,872,062,986 C1) NET INCREASE OF CASH FLOW FROM FINANCING ACTIVITIES 0 0 C2) NET DECREASE OF CASH FLOW FROM FINANCING ACTIVITIES 2,788,309,794 1,872,062,986 Total increases of cash flows 0.00 0.00 Total decreases of cash flows 1,261,711,067 820,281,400 Cash and cash equivalents at the beginning of period 4,175,892,949 3,245,292,373 Increase of cash and cash equivalents 0 0 Decrease of cash and cash equivalents 1,261,711,067 820,281,400 Cash and cash equivalents at the end of period 2,914,181,882 2,425,010,973
Statement of changes in Equity
Position Previous year Current year
1. Subscribed share capital 8,188,853,500 8,188,853,500 2. Capital reserves 0 0 3. Reserves from profit 409,442,675 409,442,675 4. Retained earnings or loss carried forward 740,180,617 740,429,777 5. Net profit or loss for the period 1,864,032,217 1,475,667,281 6. Revaluation of tangible assets 0 0 7. Revaluation of intangible assets 0 0 8. Revaluation of available for sale assets -2,029,572 -2,702,503 9. Other revaliuation 0 0 10. Total equity and reserves (AOP 001 to 009) 11,200,479,437 10,811,690,730 11. Foreign exchenge differences ffrom foreign investments 0 12. Current and deferred taxes 0 0 13. Cash flow hedge 0 0 14. Change of accounting policies 0 0 15. Correction of significant mistakes of prior period 0 0 16. Other changes 0 0 17.Total increase or decrease of equity (AOP 011 to 016) 0 0
39
Notes to the condensed financial statements For period ended 30 September 2011 Basis of preparation The condensed financial statements of 30 September 2011 and for the nine months then ended, have been prepared using accounting policies consistent with International Financial Reporting Standards. Significant Accounting Policies The financial statements have been prepared under the historical cost convention, except for investments available-for-sale stated at fair value.
The same accounting policies, presentation and methods of computation are followed in these condensed financial statements as were applied in the preparation of the Company’s financial statements for the year ended 31 December 2010.
Dividends Dividend in the amount of HRK 1,864 million (HRK 22,76 per share) was paid to the shareholders on 23 May 2011. Segment information On 1 January 2010, the old divisions of T-Com and T-Mobile, serving fixed and mobile markets respectively, were replaced by a new structure based upon Residential and Business segments. Starting from first quarter of 2011, new segment reporting following this structure is introduced.
The Company’s operating segments are Residential Segment, Business Segment and Network and Support functions.
The Residential Segment includes marketing, sales and customer care activities, focused on providing mobile, fixed line telecommunications and TV distribution services to residential customers.
The Business Segment includes marketing, sales and customer care activities, focused on providing mobile and fixed line telecommunications to corporate customers, small and medium business, and public sector. Also Business Segment is responsible for wholesale business for both, fixed and mobile services.
The Network and Support functions perform cross-segment management and support functions, including Technology department, Procurement, Accounting, Treasury, Legal and other central functions.
40
Business segments
The following tables present revenue and profit of HT’s business segments:
Period ended 30 September 2011
in HRK million Residential
SegmentBusiness Segment
Network and support
functionsVoice revenue 1,948 1,374 0Non voice revenue 1,049 807 0Other service revenue 113 116 0ICT services 0 26 Terminal equipment 115 46 0Miscellaneous 9 85 0Total revenues 3,234 2,454 0 Other operating income 0 0 173 Operating expenses 1,009 785 1,309 Contribution to EBITDA before SI 2,225 1,669 -1,136
Current interim period 1 July 2011 to 30 September 2011
in HRK million Residential
SegmentBusiness Segment
Network and support
functionsVoice revenue 678 531 0Non voice revenue 363 306 0Other service revenue 49 20 0ICT services 0 26 Terminal equipment 33 15 0Miscellaneous 2 27 0Total revenues 1,125 925 0 Other operating income 0 0 53 Operating expenses 315 244 432 Contribution to EBITDA before SI 810 681 -379
41
Period ended 30 September 2010
in HRK million Residential
SegmentBusiness Segment
Network and support
functionsVoice revenue 2,240 1,554 0Non voice revenue 1,006 854 0Other service revenue 45 99 0ICT services 0 5 Terminal equipment 135 44 0Miscellaneous 11 120 0Total revenues 3,437 2,676 0 Other operating income 0 0 101 Operating expenses 1,167 818 1,405 Contribution to EBITDA before SI 2,270 1,858 -1,304
Current interim period 1 July 2010 to 30 September 2010
in HRK million Residential
SegmentBusiness Segment
Network and support
functionsVoice revenue 764 605 0Non voice revenue 345 321 0Other service revenue 16 32 0ICT services 0 5 Terminal equipment 43 15 0Miscellaneous 3 43 0Total revenues 1,171 1,021 0 Other operating income 0 0 27 Operating expenses 346 277 470 Contribution to EBITDA before SI 825 744 -443
42
Relations with the governing company and its affiliated companies In the first nine months of 2011 there were no transactions among related parties with a significant impact on the financial position and operations of the Company in the given period.
In the first nine months of 2011 there were no changes in transactions among related parties which were specified in the annual financial report for 2010 and which had a significant impact on the financial position and operations of the Company in the first nine months of 2011.
Business relations transacted between HT d.d. in the first nine months of 2011 and the governing company and affiliated companies thereof can be classified as follows:
Transactions with related companies
Transactions with related companies primarily relate to the transactions with the companies owned by Deutsche Telekom AG (hereinafter referred to as: DTAG). The Company enters into transactions in the normal course of business on an arm’s length basis. These transactions included the sending and receiving of international traffic to/from these companies.
In the first nine months of 2011 the Company generated total revenue from related companies from international traffic to the amount of HRK 115 million (the nine months of 2010: HRK 131 million), while total costs of international traffic amounted to HRK 72 million (the first nine months of 2010: HRK 95 million).
DTAG companies provided intellectual services to the Company in the amount of HRK 7 million in the first nine months of 2011 (the first nine months of 2010: HRK 8 million).
Compensation of the Supervisory Board
The chairman of the Supervisory Board receives remuneration in the amount of 1.5 of the average net salary of the employees of the Company paid in the preceding month. To the deputy chairman, the amount of 1.25 of the average net salary of the employees of the Company paid in the preceding month is paid, while any other member receives the amount of one average net salary of the employees of the Company paid in the preceding month. To a member of the Supervisory Board who is in the same time the Chairman of the Audit Committee of the Supervisory Board in the amount of 1.5 of the average monthly net salary of the employees of the company paid in the preceding month. To a member of the Supervisory Board who is in the same time a Member of the Audit Committee of the Supervisory Board in the amount of 1.25 of the average monthly net salary of the employees of the company paid in the preceding month. To a member of the Supervisory Board who is in the same time a Member of the Compensation and Nomination Committee of the Supervisory Board in the amount of 1.25 of the average monthly net salary of the employees of the company paid in the preceding month. DTAG representatives do not receive any remuneration for the membership in the Supervisory Board due to a respective policy of DTAG.
In the first nine months of 2011, the Company paid a total amount of HRK 0.5 million (the first nine months of 2010: HRK 0.5 million) to the Members of its Supervisory Board. No loans were granted to the Members of the Supervisory Board.
43
Compensation to key management personnel
In the first nine months of 2011 the total compensation paid to key management personnel of the Company amounted to HRK 26 million (first nine months of 2010: HRK 28 million Compensation paid to key management personnel relates to short-term employee benefits. Key management personnel include members of the Management Boards of the Company and the operating directors of the Company, who are employed by the Company.
Statement of the Management Board of Hrvatski Telekom d.d. To the best of our knowledge, unaudited financial statements of the company Hrvatski Telekom d.d. (hereinafter: “Company”) and unaudited consolidated financial statements of the Company and affiliated companies thereof (hereinafter: "Group"), which are prepared in accordance with International Financial Reporting Standards (IFRS), give a true and fair view of assets and obligations, profit and loss, financial position, and operations of both the Company and the Group. The management report for the first nine months to 30 September 2011 contains a true presentation of development and results of operations and position of the Group, with description of significant risks and uncertainties for the Group as a whole. Mr. Ivica Mudrinić, President of the Management Board Mr. Dino Dogan, Member of the Management Board and Chief Financial Officer Mr. Johan Busé, Member of the Management Board and Chief Operating Officer Residential Ms. Irena Jolić Šimović, Member of the Management Board and Chief Operating Officer Business Mr. Božidar Poldrugač, Member of the Management Board and Chief Technical Officer and Chief Information Officer Ms. Branka Skaramuča, Member of the Management Board and Chief Human Resources Officer Zagreb, 28 October 2011
44
Presentation of information Unless the context otherwise requires, references in this publication to ‘‘T-HT Group’’ or ‘‘the Group’’ or "T-HT" are to the Company Hrvatski Telekom d.d., together with its subsidiaries. References to ‘‘HT’’ or the ‘‘Company’’ are to the Company Hrvatski Telekom d.d. Following the merger of T-Mobile d.o.o. with Hrvatski Telekom (HT d.d.), effective 1 January 2010, the Group is now organized into two business units: Business and Residential. Therefore, references to “Business” are to business operations performed within the Company’s Business Segment. References to ‘‘Residential’ are to business operations performed within the Company’s Residential Segment. References to ‘‘Iskon’’ are to the Company’s wholly-owned subsidiary, Iskon Internet d.d. References to ‘‘Combis’’ are to the Company’s wholly-owned subsidiary, Combis d.o.o. References to ‘‘KDS” are to the Company’s wholly-owned subsidiary, KDS d.o.o. References in this publication to ‘‘Agency’’ are to the Croatian National Regulatory Authority, the Agency for Post and Electronic Communications. Disclaimer This release contains certain forward-looking statements with respect to the financial condition, results of operations and business of the Group. These forward-looking statements represent the Company's expectations or beliefs concerning future events and involve known and unknown risks and uncertainties that could cause actual results, performance or events to differ materially from those expressed or implied in such statements. Additional information concerning important factors that could cause actual results to differ materially is available in the Group's reports which may be found at www.t.ht.hr