27
SEPTEMBER 2015 Program of Accompanying Research for Agricultural Innovation researĐh4agriŶŶoǀaioŶ.org ZAMBIA Potentials and Possibilities for German Collaboration in Agriculture

SEPTEMBER 2015Program of Accompanying
Research for Agricultural Innovation resear h4agri o aio .org
ZAMBIA
Potentials and Possibilities for German
Collaboration in Agriculture

ACKNOWLEDGEMENTS
The paper was developed within the project “Program of Accompanying Research for
Agri ultural I o aio ” PARI , hi h is fu ded y the Ger a Federal Mi istry of E o o i Cooperaio a d De elop e t BM) .
CONTRIBUTORS TO THE COUNTRY DOSSIER ZAMBIA
)ARI: Moses M ale, Chrisia Cho a
FARA: Ye i Aki a ijo, Fatu i Olu ole A iodu
)EF: Heike Bau üller, Joa hi o Brau , A apia De arry, Kathari a Galla t, Tiga u Degu Getahu , Chrisi e Hus a , Ha ah Jae i ke, Oli er K. Kirui, Ehsa Eyshi Rezaei, Yas i S ith, Jusi e Akpe e Ta o, Detlef Vir ho , Kathari a )i
This report is ork i progress a d o i uously ei g updated. A y feed a k a d suggesio s for further i pro e e t are el o e a d a e se t to pari@u i- o .de.

Country Dossier Zambia
ZMB 1
Table of Contents
1 General background information of the agricultural and food sectors ............................. 3
1.1 Pan-African policies and strategies .............................................................................. 5
1.2 National (and regional) policies and strategies ........................................................... 6
1.3 Data on food and nutrition security ............................................................................. 7
1.4 Data on most relevant crops and value chains .......................................................... 11
1.4.1 Production ........................................................................................................... 11
1.4.2 Consumption and nutrition status ...................................................................... 11
1.4.3 Trade .................................................................................................................... 12
1.5 National (and regional) innovation system ................................................................ 13
1.5.1 Research system and organizations .................................................................... 13
1.5.2 Innovation platforms ........................................................................................... 14
1.5.3 Extension system and organizations ................................................................... 14
1.5.4 Private R&D activities .......................................................................................... 14
1.6 Key challenges, emerging needs and potentials in the agricultural sector ............... 14
2 Most relevant value chains in Zambia .............................................................................. 17
2.1 AIC value chains .......................................................................................................... 18
2.1.1 Maize value chain ................................................................................................ 18
2.1.2 Soybean ............................................................................................................... 18
2.1.3 Groundnuts and common beans ......................................................................... 19
2.2 Other relevant value chains ....................................................................................... 19
2.2.1 Cassava ................................................................................................................ 19
2.2.2 Wheat and rice value chains ............................................................................... 20
2.2.3 Aquaculture ......................................................................................................... 21
2.2.4 Fresh Fruits and Vegetables (FFV) Value Chains ................................................. 21
3 Innovations in value chains in the past 20 years .............................................................. 22
3.1 The most crucial limiting factors in Zambia / AIC-region / in AIC value chains ......... 22
3.2 The most important / beneficial innovations in the relevant value chains ............... 22
3.2.1 AIC value chains .......................................................................................................... 22
3.2.2 Other value chains and cross-cutting innovations ..................................................... 22
3.3 Most promising approaches for farmer and small business related value chain
innovations ................................................................................................................. 22
4 Considerations for Effective Zambia-German Collaboration in Agricultural Research and
Development ............................................................................................................................ 22
4.1 Promising Agricultural Products and Value Chains. ................................................... 22
4.2 A systematic assessment of promising partnerships for each promising innovation
area ............................................................................................................................. 24
4.3 Some potential partners for the German collaboration: in science and research,
private sector and NGOs and governmental organizations ....................................... 24
4.4 Needed implementation research ............................................................................. 24
5 References ......................................................................................................................... 25

Program of Accompanying Research for Agricultural Innovation (PARI)
ZMB 2
List of Tables
Table 1: Selected national economic and health-related data .................................................. 8
Table 2: Top 10 crops produced by area, volume and value ................................................... 11
Table 3: Food supply by tons, kg per capita and kcal per capita ............................................. 12
Table 4: AIC value chains: Soy (together with maize/cotton), Groundnut (together with
bean) ......................................................................................................................................... 12
Table 5: Export and Import of AIC value chains: ...................................................................... 13
Table 6: Country level Performance Indicators ........................................................................ 15
Table 7: Selection of promising agricultural products /value chains ....................................... 23
List of Figures
Figure 1: Annual GDP Growth (%) 1965 to 2011 ........................................................................ 8
Figure 2: Percentage Trends in Incidences of Poverty Levels (1991 - 2010) ............................. 9
Figure 3: Agricultural Sector Growth Rate (% change in constant 1994 Zambian Kwacha
terms) ......................................................................................................................................... 9
Figure 4: Percentage of National Budget Spent on Agriculture 2007-2012:
Allocated and Actual Spending................................................................................................. 10
Figure 5: 2013 Budget Allocations to Agriculture .................................................................... 10
Figure 6: Distribution of Poverty Reduction Programme Spending 2013 ................................ 11
Figure 7: Distance to market .................................................................................................... 17
Country Dossier Zambia
ZMB 3
1 General background information of the agricultural and food sectors
The agricultural sector plays an important role in the Zambian economy. It generates
between 16 and 20% of the Gross Domestic Product (GDP) and more than 70% of the
cou tr s populatio depe ds o agri ulture for li elihood, espe iall i rural areas. The sector also accounts for about 67% of the labor force and remains the main source of income
and employment for rural women and men (GRZ-FAO, 2009). The current Zambian
Government (and even past Governments) has identified agriculture as the number one key
driver sector of the economy, complementing the mining sector which has been the largest
contributor of foreign exchange earnings and national revenue.
The aspirations of the Zambian people – as captured in the Vision 2030 formulated in
December 2006 – is among other things, a diversified and balanced and strong industrial
se tor, a oder agri ultural se tor a d a effi ie t a d produ ti e ser i es se tor . A d according to the current plan, the Sixth National Development Plan: 2011-2015 (SNDP: 2011-
2015) the country plans to diversify and grow the economy, focusing on agriculture, tourism,
manufacturing, mining and energy, as the growth sectors/areas (SNDP: 2011-2015).
This is in cognizance of the cou tr s ast resource endowment in terms of land, water, labor
and climate. This vast natural resource endowment reflects the enormous potential to
expand and/or excel in agricultural development. Out of the 75 million ha total land area 42
million ha (58%) is classified as medium to high potential for agricultural production and
suitable for the production of a broad range of crops, livestock and fish, with an annual
rainfall ranging between 800 mm to 1500 mm. The potential of irrigable land is over 423,000
ha, of which about 100,000 ha is currently irrigated among the large-scale, emergent and
smallholder farmers. With the cou tr s a u da t surfa e a d u dergrou d ater resources, there is potential to drastically increase the area under irrigation (it is said that
Zambia has about 40% of the water resources in the SADC Region).
Agriculturally and based on annual rainfall pattern and/or soil variability, the country is
divided into three major agro-ecological regions (Regions I, II and III).
Region I: covers parts of Southern, Eastern and Western Provinces and constitutes 12% of
the cou tr s total la d area. The ‘egio receives annual rainfall of less than 800 mm and its
soil type is loamy to clayey on the valley floor and course to fine loamy shallow soils on the
escarpment. It is suitable for the production of crops such as cotton, sesame, sorghum,
groundnuts, beans, sweet potatoes, cassava, rice and millet and has potential for the
production of various irrigated crops including fruits and vegetables. This Region is also
suitable for extensive cattle production. However, the valley part of the Region lies on a low
altitude, is consequently hot and humid, and because of tsetse flies this part is not suitable
for cattle rearing.
Region II: is sub-divided into Region IIa and IIb. It constitutes 42% of the country and receives
annual rainfall of between 800 mm to 1,000 mm. Region IIa covers the Central, Lusaka, parts
of Southern and Eastern provinces. Generally it has inherently fertile soils and thus
permanent settled systems of agriculture are practiced in this sub-Region. A variety of crops
are grown including maize, cotton, tobacco, sunflower, soybeans, irrigated wheat,
groundnuts and other arable crops. The area is also suitable for flowers, paprika and
vegetable production. The sub-Region is also suitable for beef, dairy and poultry production.
On the other hand, sub-Region IIb covers part of Western Province and consists of sandy

Program of Accompanying Research for Agricultural Innovation (PARI)
ZMB 4
soils. It is suitable for the production of cashew nut, rice, cassava, millet and vegetables; and
also suitable for beef, dairy and poultry production.
Region III: covers the Copperbelt, Luapula, Northern, Muchinga and North-western
Provinces. It o stitutes % of the Cou tr s total la d area a d receives annual rainfall of
between 1,000 mm and 1,500 mm. With the exception of the Copperbelt Province, the
Region is characterized by highly leached, acidic soils a d thus the ‘egio s agri ultural potential can be enhanced by application of agricultural lime and organic matter. However, it
has the inherent potential for the production of millet, cassava, sorghum, beans,
groundnuts, coffee, sugarcane, rice and pineapples. Its perennial streams can be utilized for
small-scale irrigation. Increased exploitation of the fisheries resources and introduction of
fish farming, offers good opportunities for development.
In nearly all the cou tr s National Development Plans, agriculture has featured prominently.
During the implementation of the National Agricultural Policy (NAP) 2004-2015, the
agriculture sector registered some positive gains in a number of areas. The cited notable
ones include:
i) An increase in crop production. For instance for selected crops, harvests from 2004 to
2013 increased as follows:
Maize: from 1,213,202 metric tons (MT) to 2,532,800 MT (by an average of 12.8 %);
Rice: from 11,699 MT to 44,747 MT (by an average of 18.3 %);
Wheat: from 82,585 MT to 273,584 MT (by an average of 18.8 %);
Cassava: from 911,673 MT to 1,114,583 MT (by an average of 6.4 %);
Groundnuts: from 69,696 MT to 106,792 MT (by an average of 13.9 %);
Mixed Beans: from 18,161 MT to 56,411 MT (by an average of 16.8 %);
Soybeans: from 54,687 MT to 261,063 MT (by an average of 26.3 %); and
Sunflower: from 13,857 MT to 33,733 MT (by an average of 29.6 %).
ii) An increase in capture fisheries and aquaculture fish production. Total annual capture
fish production increased from 67,725 MT in 2004 to 76,214 MT in 2012 (by 12.5 %).
Total inland aquaculture fish production on the other hand also increased from 5,125 MT
in 2004 to 12,988 MT in 2012 (by 153 %).
A general increase in the pig population from 286,726 in 2004 to 704,832 in 2008.
However, goats decreased from 1,002,376 in 2004 to 746,143 in 2008 and the cattle
population decreased from 2,341,970 in 2004 to 2,315,327 in 2008;
iii) Additionally, among small scale farmers the average maize yields increased from 1.93
MT/ha in 2004 to 2.24 MT/ha in 2012, thereby marginally contributing to increases in
maize production besides increases attributed to increased area under maize. However,
it should be noted that these average yields fluctuated downwards from 1.93 MT/ha in
2004 to 1.31 MT/ha in 2008 before reaching a maximum of 2.25 MT/ha in 2010 and
again decreasing to 1.93 MT/ha in 2013, thereby indicating that no meaningful progress
has been recorded in achieving increased productivity in maize production despite huge
investments made in providing input subsidies. Low productivity has been attributed to
unfavorable rainfall performance, weak extension services and poor research and
technology transfer.
According to the Central Statistical Offi e s C“O Li i g Co ditio s Mo itori g “ur e s of 2006 and 2010, agriculture has marginally led to an increase in rural incomes and
Country Dossier Zambia
ZMB 5
contributed marginally to poverty reduction and increased food and nutrition security
(Mason et al., 2013).
Also the increases in agriculture production and/or gains recorded during the
implementation of the NAP: 2004-2015 have not been significant enough to meet the
growing domestic and foreign demand for Zambian agricultural commodities. This is also
despite the skewed increased Government budgetary allocations (more than 60%) of the
expenditure channeled towards maize production and marketing.
1.1 Pan-African policies and strategies
Zambia is part or aligned to a number of strategies and frameworks existing at continental,
regional and/or sub-regional levels for agricultural and rural development. These include
those developed by the African Union (AU), the Southern African Development Community
(SADC) and the Common Market for Eastern and Southern Africa (COMESA). A few examples
include:
The Comprehensive Africa Agriculture Development Programme (CAADP) of 2003
which has been prepared through the facilitation of the Food and Agriculture
Organization of the United Nations (FAO) in close collaboration with the NEPAD
Secretariat and being implemented by NEPAD. It is for African integration through
agriculture. The CAADP has been prepared to promote interventions that best
respond to the widely recognized crisis situation of African agriculture. In its
commitment to CAADP, Zambia has also developed and signed the CAADP Compact
on 18th January 2011 to support the implementation of the Vision 2030 and NAP.
Under CAADP, African cou tries governments agreed to commit at least 10% of their
national budget to agriculture with the projection that it will lead to 6% annual
growth rate for the sector. Going further under CAADP, Zambia has developed the
National Agriculture Investment Plan (NAIP) 2014-2018, designed to make a
difference in the manner in which the agricultural development agenda will be
pursued in the country. The emphasis of NAIP is pro-poor agricultural-led economic
development;
The African Peer Review Mechanism (APRM) in 2004, implemented one year after
endorsement of the CAADP;
The Abuja Declaration on Fertilizer for an African Green Revolution, under which the
AU Member States resolved to increase fertilizer use from 8.0 Kg to 50.0 Kg of
nutrients per hectare by 2015;
The Malabo Declaration of June 2014, intended to accelerate agricultural growth and
transformation for shared prosperity and improved livelihoods by Harnessing
Opportunities for Inclusive Growth and Sustainable Development ;
The Science Agenda for Agriculture in Africa (S3A) 2014, which was developed by a
coalition of actors under the leadership of the Forum for Agricultural Research in
Africa (FARA). The S3A is an African-owned and -led process that articulates the
science, technology, extension, innovations, policy and social learning that Africa
needs to apply in order to meet its agricultural and overall development goals. The
Science Agenda, in the medium- to long-term, aims at building systemic science
capacity at national and regional levels, capable of resolving evolving needs for
farmers, producers, entrepreneurs and consumers, e.g. effects of climate change;
Program of Accompanying Research for Agricultural Innovation (PARI)
ZMB 6
Southern Africa Development Community-Regional Agricultural Policy (SADC-RAP):
)a ia has ee a ti e i the “ADC s idea of o i g up with a Regional Agricultural
Policy (RAP) aimed at harmonizing the growth and development of agriculture and
promotion marketing and trade among SADC member States.
1.2 National (and regional) policies and strategies
There are currently a number of national policy and strategy documents guiding the
development of the Agricultural Sector in Zambia. Notable ones include:
National Agricultural Policy (NAP): 2004-2015: currently been revised or updated. It is
built on the following six guiding principles:
1. The right to adequate and nutritious food;
2. Equitable, inclusive and sustainable development;
3. Profitability and competitiveness;
4. Cognizance of current traditional and state land tenure systems;
5. Stakeholder involvement; and
6. Cognizance of international Treaties, Protocols and Agreements.
Vision 2030: Long-term development document that includes all other national socio-
economic sectors besides agriculture.
Sixth National Development Plan (SNDP): 2011-2015: a national medium-term
development plan which also includes all other national socio-economic sectors
besides agriculture.
National Agriculture Investment Plan (NAIP) 2014-2018: formulated or developed
under CAADP, outlining key interlinked and complementary areas of support for
investment. The o erall o je ti e of NAIP is to fa ilitate a d support the development of a sustainable, dynamic, diversified and a competitive agricultural
sector that assures food security at household and national levels and maximizes the
se tor's o tri utio to GDP . In order to realize the objective, the following four
inter-related programmes are planned and two categories of key support services
(KSS) to be implemented under the NAIP:
Programmes: (a) Sustainable Natural Resources Management; (b) Agricultural
Production and Productivity Improvement; (c) Market Access and Services
Development; and; (d) Food and Nutrition Security and Disaster Risk Management.
KSS: (a) Knowledge Support Systems; and (b) Institutional Strengthening.
Other sub-sector policies and strategies include: (i) National Aquaculture Strategy for
Zambia, (ii) National Aquaculture Development Plan, (iii) National Rice Development Strategy
(NRDS), (iv) Cassava National Development Strategy, (v) National Irrigation Policy and (vi)
Cooperatives Development Policy (draft).
It is important to underline that contemporary agrarian forms, processes and dynamics are
shaped by the past political, economic, cultural and institutional arrangements. The historical
context of the national and sub-regional policies and strategies for the development of
agriculture in Zambia can be summarized in four broad but overlapping phases: (i) the
Colonial period; (ii) Early Independence; (iii) 1980 to 2000; and (iv) 2000 and beyond or to-
date. A detailed overview of the development of the agricultural sector on Zambia is
provided in Appendix II.
Country Dossier Zambia
ZMB 7
Other On-going Agricultural Programmes and Projects
The following are some of the currently running and/or about to commence agricultural
projects in Zambia:
Agricultural Productivity Programme in Southern Africa (APPSA) - World Bank-funded;
Enhanced Smallholder Livestock Investment Project (E-SLIP) - IFAD funded;
Irrigation Development Support Project (IDSP) - World Bank funded;
Smallholder Agribusiness Promotion Programme (SAPP) - IFAD funded;
Livestock Development and Animal Health Project (LDAHP) - World Bank funded;
Livestock Infrastructure Support Project (LISP) - AfDB funded;
Support to Productivity and Production Project (S3P) - IFAD funded;
Pilot Project on Climate Resilience (PPCR) - World Bank funded;
Farmer Input Support Programme (FISP) - Government of the Republic of Zambia
(GRZ) funded;
Support to the Agricultural Sector Performance Enhancement Programme (PEP) - EU
funded;
CASU (EU through FAO);
Agricultural Productivity and Market Enhancement Project (APMEP) - AfDB funded;
Strengthening Rice Seed Production and Enhancing Extension Services to increase
Rice Production in Zambia (FAO);
Developing Value Chain Innovations and Value Chains to Improve Food Security in
East & Southern Africa - Australian-agency funded;
Food Security Pack (FSP) - GRZ funded;
Programme for Accompanying Research innovations (PARI).
1.3 Data on food and nutrition security
The following section includes information about important socio-economic indicators,
production and trade data and data on consumption and nutrition status.

Program of Accompanying Research for Agricultural Innovation (PARI)
ZMB 8
Table 1: Selected national economic and health-related data
Indicator Data Year
Population, total 1,5021,002 2014
Population growth (annual %) 2.5 2014
Rural population (% of total population) 60 2014
GDP per capita, PPP (constant 2011 international $) 3898 2014
GNI per capita, PPP (constant 2011 international $) 52,914,077,683 2013
Poverty headcount ratio at $2 a day (PPP) (% of population) 87 2010
Poverty headcount ratio at $1.25 a day (PPP) (% of population) 74 2010
Poverty headcount ratio at national poverty lines (% of population) 61 2010
Rural poverty headcount ratio at national poverty lines (% of rural population) 78 2010
Agricultural land (% of land area) 32 2012
Agricultural irrigated land (% of total agricultural land) no data
Agriculture value added per worker (constant 2005 US$) 353 2014
Agriculture, value added (% of GDP) 10 2013
Access to electricity, rural (% of rural population) 5.8 2012
Employees, agriculture, female (% of female employment) 79 2005
Employees, agriculture, male (% of male employment) 66 2005
Employment in agriculture (% of total employment) 72 2005
Literacy rate, adult total (% of people ages 15 and above) 61 2007
Ratio of female to male secondary enrollment (%) 59 1988
Mortality rate, under-5 (per 1,000 live births) 87 2013
Malnutrition prevalence, weight for age (% of children under 5) 15 2007
Malnutrition prevalence, height for age (% of children under 5) 46 2007
Maternal mortality ratio (modeled estimate, per 100,000 live births) 280 2013
Source: World Bank, http://data.worldbank.org/country
Figure 1: Annual GDP Growth (%) 1965 to 2011
Source: Central Statistics Office (CSO)
Country Dossier Zambia
ZMB 9
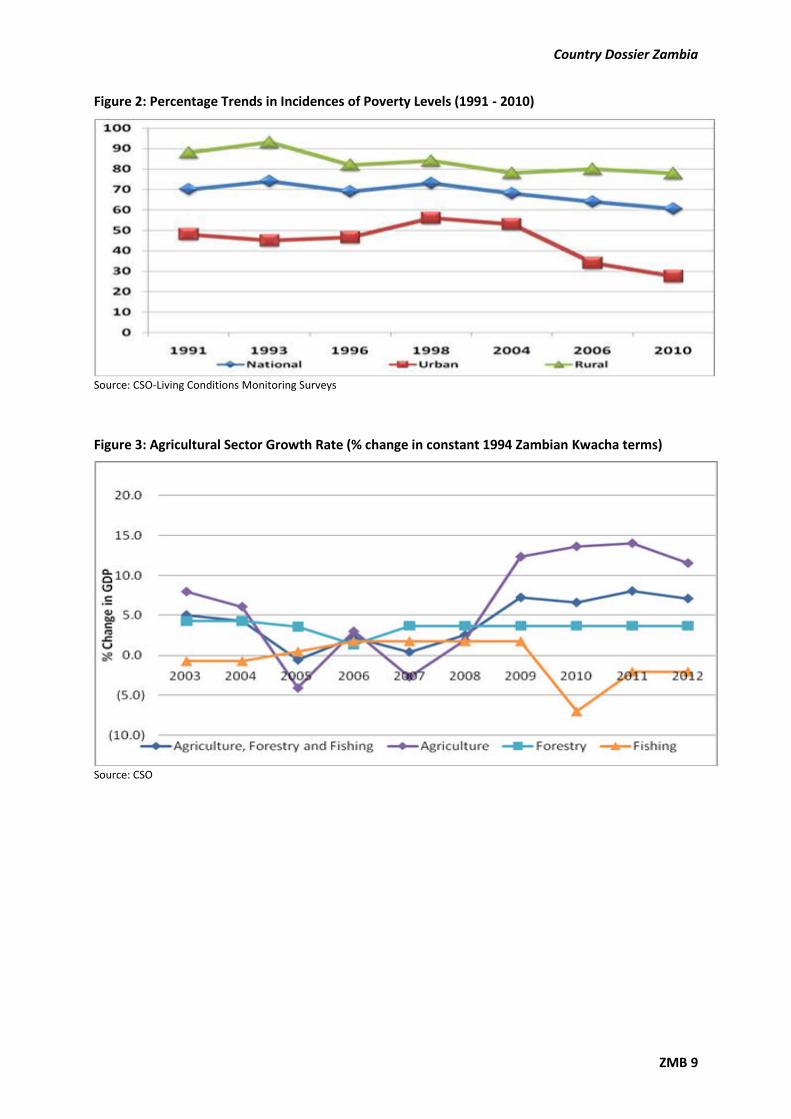
Figure 2: Percentage Trends in Incidences of Poverty Levels (1991 - 2010)
Source: CSO-Living Conditions Monitoring Surveys
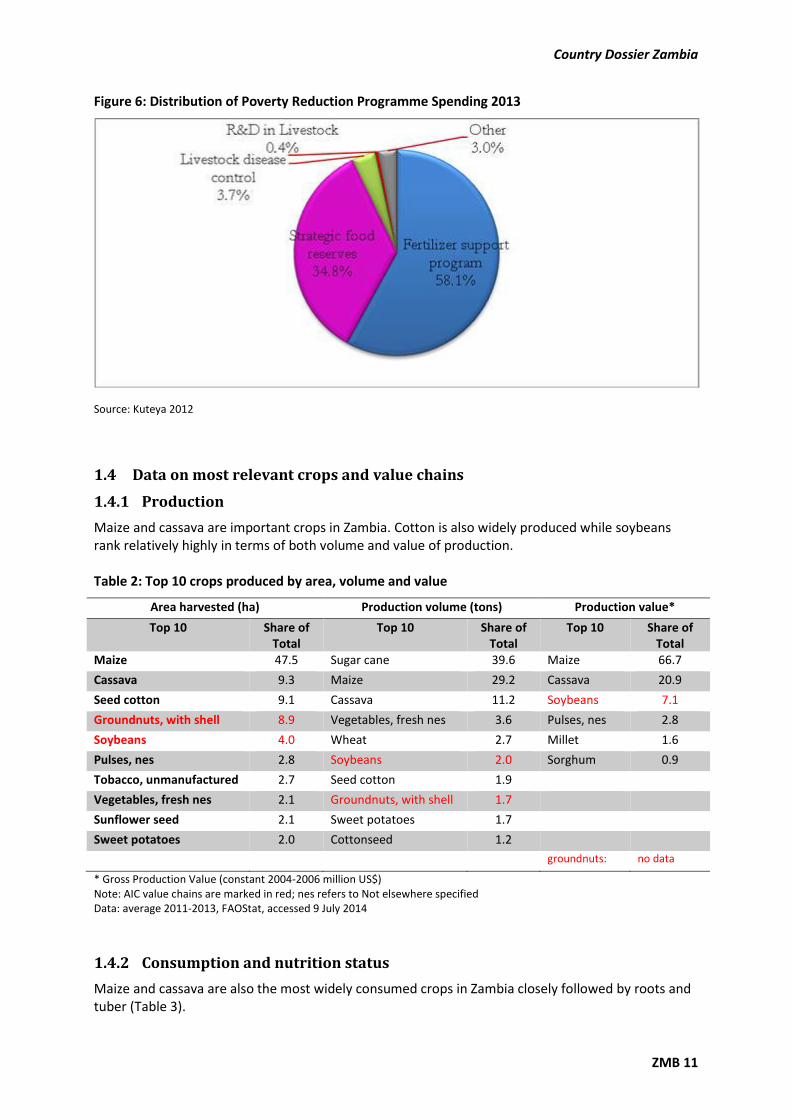
Figure 3: Agricultural Sector Growth Rate (% change in constant 1994 Zambian Kwacha terms)
Source: CSO

Program of Accompanying Research for Agricultural Innovation (PARI)
ZMB 10
Figure 4: Percentage of National Budget Spent on Agriculture 2007-2012: Allocated and Actual
Spending
Source: Kuteya 2012
Figure 5: 2013 Budget Allocations to Agriculture
Source: Kuteya, 2012
Country Dossier Zambia
ZMB 11
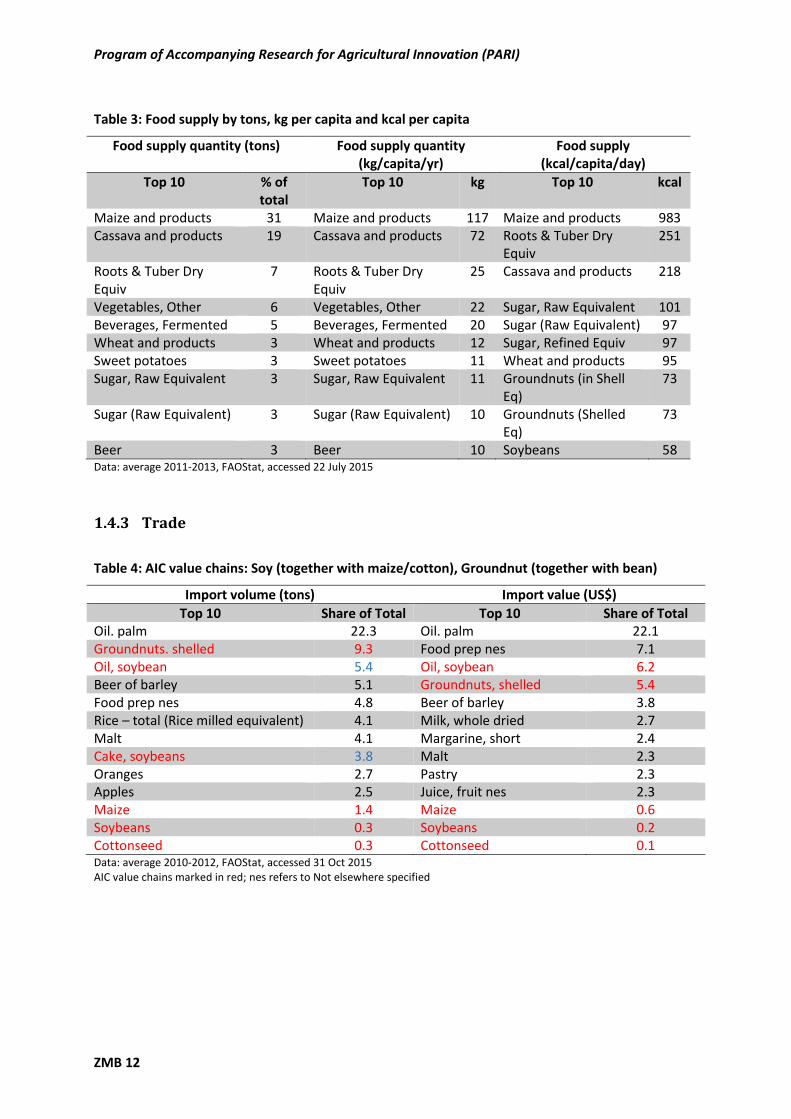
Figure 6: Distribution of Poverty Reduction Programme Spending 2013
Source: Kuteya 2012
1.4 Data on most relevant crops and value chains
1.4.1 Production
Maize and cassava are important crops in Zambia. Cotton is also widely produced while soybeans
rank relatively highly in terms of both volume and value of production.
Table 2: Top 10 crops produced by area, volume and value
Area harvested (ha) Production volume (tons) Production value*
Top 10 Share of
Total
Top 10 Share of
Total
Top 10 Share of
Total
Maize 47.5 Sugar cane 39.6 Maize 66.7
Cassava 9.3 Maize 29.2 Cassava 20.9
Seed cotton 9.1 Cassava 11.2 Soybeans 7.1
Groundnuts, with shell 8.9 Vegetables, fresh nes 3.6 Pulses, nes 2.8
Soybeans 4.0 Wheat 2.7 Millet 1.6
Pulses, nes 2.8 Soybeans 2.0 Sorghum 0.9
Tobacco, unmanufactured 2.7 Seed cotton 1.9
Vegetables, fresh nes 2.1 Groundnuts, with shell 1.7
Sunflower seed 2.1 Sweet potatoes 1.7
Sweet potatoes 2.0 Cottonseed 1.2
groundnuts: no data
* Gross Production Value (constant 2004-2006 million US$)
Note: AIC value chains are marked in red; nes refers to Not elsewhere specified
Data: average 2011-2013, FAOStat, accessed 9 July 2014
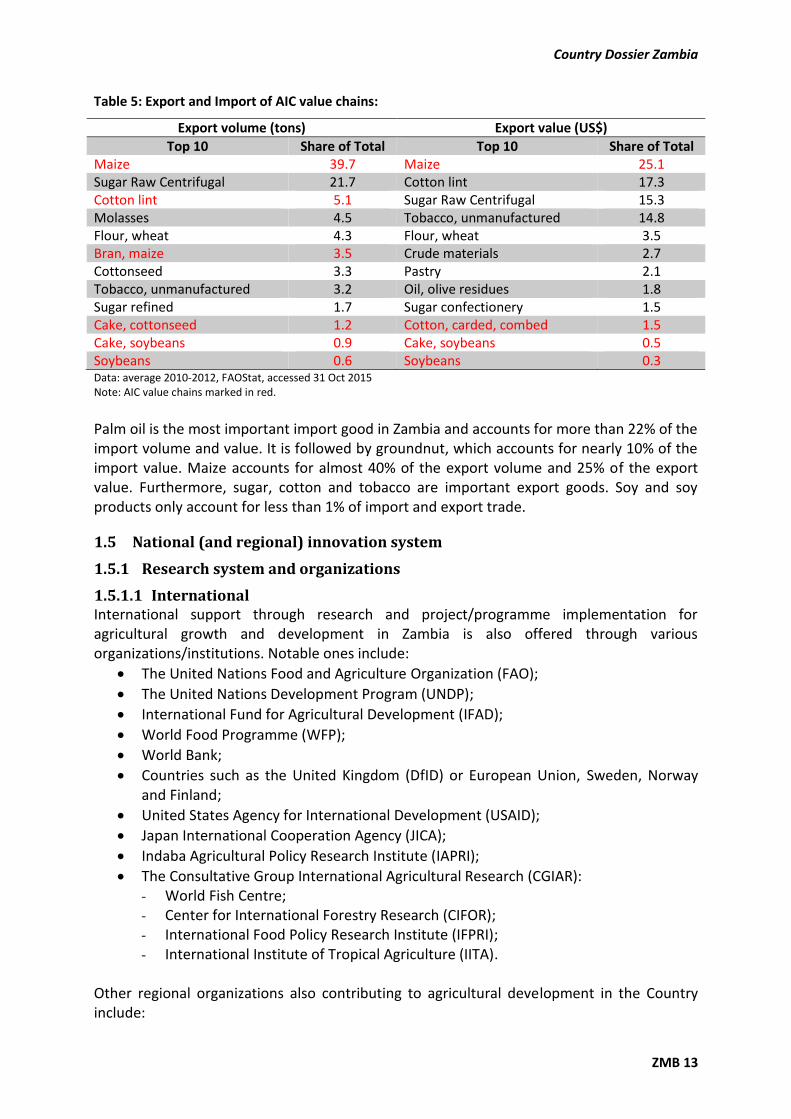
1.4.2 Consumption and nutrition status
Maize and cassava are also the most widely consumed crops in Zambia closely followed by roots and
tuber (Table 3).
Program of Accompanying Research for Agricultural Innovation (PARI)
ZMB 12
Table 3: Food supply by tons, kg per capita and kcal per capita
Food supply quantity (tons) Food supply quantity
(kg/capita/yr)
Food supply
(kcal/capita/day)
Top 10 % of
total
Top 10 kg Top 10 kcal
Maize and products 31 Maize and products 117 Maize and products 983
Cassava and products 19 Cassava and products 72 Roots & Tuber Dry
Equiv
251
Roots & Tuber Dry
Equiv
7 Roots & Tuber Dry
Equiv
25 Cassava and products 218
Vegetables, Other 6 Vegetables, Other 22 Sugar, Raw Equivalent 101
Beverages, Fermented 5 Beverages, Fermented 20 Sugar (Raw Equivalent) 97
Wheat and products 3 Wheat and products 12 Sugar, Refined Equiv 97
Sweet potatoes 3 Sweet potatoes 11 Wheat and products 95
Sugar, Raw Equivalent 3 Sugar, Raw Equivalent 11 Groundnuts (in Shell
Eq)
73
Sugar (Raw Equivalent) 3 Sugar (Raw Equivalent) 10 Groundnuts (Shelled
Eq)
73
Beer 3 Beer 10 Soybeans 58 Data: average 2011-2013, FAOStat, accessed 22 July 2015
1.4.3 Trade
Table 4: AIC value chains: Soy (together with maize/cotton), Groundnut (together with bean)
Import volume (tons) Import value (US$)
Top 10 Share of Total Top 10 Share of Total
Oil. palm 22.3 Oil. palm 22.1
Groundnuts. shelled 9.3 Food prep nes 7.1
Oil, soybean 5.4 Oil, soybean 6.2
Beer of barley 5.1 Groundnuts, shelled 5.4
Food prep nes 4.8 Beer of barley 3.8
Rice – total (Rice milled equivalent) 4.1 Milk, whole dried 2.7
Malt 4.1 Margarine, short 2.4
Cake, soybeans 3.8 Malt 2.3
Oranges 2.7 Pastry 2.3
Apples 2.5 Juice, fruit nes 2.3
Maize 1.4 Maize 0.6
Soybeans 0.3 Soybeans 0.2
Cottonseed 0.3 Cottonseed 0.1 Data: average 2010-2012, FAOStat, accessed 31 Oct 2015
AIC value chains marked in red; nes refers to Not elsewhere specified
Country Dossier Zambia
ZMB 13
Table 5: Export and Import of AIC value chains:
Export volume (tons) Export value (US$)
Top 10 Share of Total Top 10 Share of Total
Maize 39.7 Maize 25.1
Sugar Raw Centrifugal 21.7 Cotton lint 17.3
Cotton lint 5.1 Sugar Raw Centrifugal 15.3
Molasses 4.5 Tobacco, unmanufactured 14.8
Flour, wheat 4.3 Flour, wheat 3.5
Bran, maize 3.5 Crude materials 2.7
Cottonseed 3.3 Pastry 2.1
Tobacco, unmanufactured 3.2 Oil, olive residues 1.8
Sugar refined 1.7 Sugar confectionery 1.5
Cake, cottonseed 1.2 Cotton, carded, combed 1.5
Cake, soybeans 0.9 Cake, soybeans 0.5
Soybeans 0.6 Soybeans 0.3 Data: average 2010-2012, FAOStat, accessed 31 Oct 2015
Note: AIC value chains marked in red.
Palm oil is the most important import good in Zambia and accounts for more than 22% of the
import volume and value. It is followed by groundnut, which accounts for nearly 10% of the
import value. Maize accounts for almost 40% of the export volume and 25% of the export
value. Furthermore, sugar, cotton and tobacco are important export goods. Soy and soy
products only account for less than 1% of import and export trade.
1.5 National (and regional) innovation system
1.5.1 Research system and organizations
1.5.1.1 International
International support through research and project/programme implementation for
agricultural growth and development in Zambia is also offered through various
organizations/institutions. Notable ones include:
The United Nations Food and Agriculture Organization (FAO);
The United Nations Development Program (UNDP);
International Fund for Agricultural Development (IFAD);
World Food Programme (WFP);
World Bank;
Countries such as the United Kingdom (DfID) or European Union, Sweden, Norway
and Finland;
United States Agency for International Development (USAID);
Japan International Cooperation Agency (JICA);
Indaba Agricultural Policy Research Institute (IAPRI);
The Consultative Group International Agricultural Research (CGIAR):
- World Fish Centre;
- Center for International Forestry Research (CIFOR);
- International Food Policy Research Institute (IFPRI);
- International Institute of Tropical Agriculture (IITA).
Other regional organizations also contributing to agricultural development in the Country
include:
Program of Accompanying Research for Agricultural Innovation (PARI)
ZMB 14
African Development Bank (AfDB);
Forum for Agricultural Research in Africa (FARA);
Centre for Coordination of Agricultural Research and Development for Southern
Africa (CCARDESA);
Coalition for African Rice Development (CARD);
SADC - Genetic and Plant Resources Research Institute.
1.5.1.2 National
Agricultural research in Zambia is largely undertaken by the Ministry of Agriculture and
Livestock through the Zambia Agriculture Research Institute (ZARI), the Golden Valley
Agricultural Research Trust (GART), and CVRI. The University of Zambia (UNZA), National
Institute for Scientific and Industrial Research (NISIR) and of late Mulungushi University also
undertake research. Thus innovations are locally undertaken through the above institutions.
In July this year, the Forum for Agricultural Research in Africa (FARA), in partnership with the
German Government represented by the Center for Development Research (ZEF) of the
U i ersit of Bo u der its O e World No Hu ger i itiati e, entered into an agreement
with ZARI in implementing the Programme of Accompanying Research for Agricultural
Innovations (PARI). ZARI is currently playing the role of Lead Implementing Institution (LII) for
the PARI in Zambia.
1.5.2 Innovation platforms
- pending further information -
1.5.3 Extension system and organizations
- pending further information -
1.5.4 Private R&D activities
- pending further information -
1.6 Key challenges, emerging needs and potentials in the agricultural sector
The agriculture sector continues to face several challenges such as:
Low agricultural production and productivity;
Erosion of indigenous livestock and plant genetic resources;
Low private sector participation in agricultural development, especially in agricultural
marketing;
High levels of food and nutrition insecurity particularly at household level;
High dependence on rain-fed agriculture, exacerbated by low levels of irrigation
especially by small scale farmers;
Diminished investment in agricultural research and development (R&D);
Inefficient agricultural extension service delivery;
Low levels of agricultural mechanization among smallholder farmers;
Inefficient agricultural markets for inputs and outputs;
Limited access and availability to agricultural finance and credit facilities;
Reduced net value of agricultural exports particularly for horticulture, floriculture and
fish products although the overall value of non-traditional exports has been rising
due to included exports of timber, honey and handcrafts;
Country Dossier Zambia
ZMB 15
Unsustainable use of natural resources and low resilience to effects of climate
change; and
Inadequate mainstreaming of gender and governance issues, and HIV/AIDS.
In the continued effort of enhancing the performance of the Agricultural Sector, the Vision of
the re ised NAP is: To attain sustainable agricultural production which will enhance
competitiveness, profitability, food and nutrition security and contribute to employment and
income generation, national economic development and contribute to poverty reduction by
2020 .
To support and/or complement the implementation of the National Agricultural Policy (NAP)
and the Vision 2030, Zambia has signed the CAADP Compact and formulated the Zambia
National Agriculture Investment Plan (NAIP) 2014-2018, under CAADP. The NAIP seeks to
identify priority investment and policy changes that would result in robust agricultural
growth that lessens the incidences of rural poverty.
Based on the general approach (see Africa-wide study Chapter 4) and in pursuit of efficiency
and effectiveness, investment by Germany into the agricultural and food sector are
suggested in those African countries, which:
Show actual progress in sustainable agricultural productivity driven by related
innovations, as indicated by comprehensive productivity measurement and
innovation actions on the ground;
Have a track record of political commitment to foster sustainable agricultural growth,
as indicated by performance under CAADP, and
Prioritize actions for hunger and malnutrition reduction and show progress, but
where agricultural and rural development and nutrition interventions are likely to
make a significant difference, as indicated by public policy and civil society actions.
Based on this approach, investment into the agricultural and food sector of Zambia can be
expected to have only a modest effect on food and nutrition security improvements in the
country.
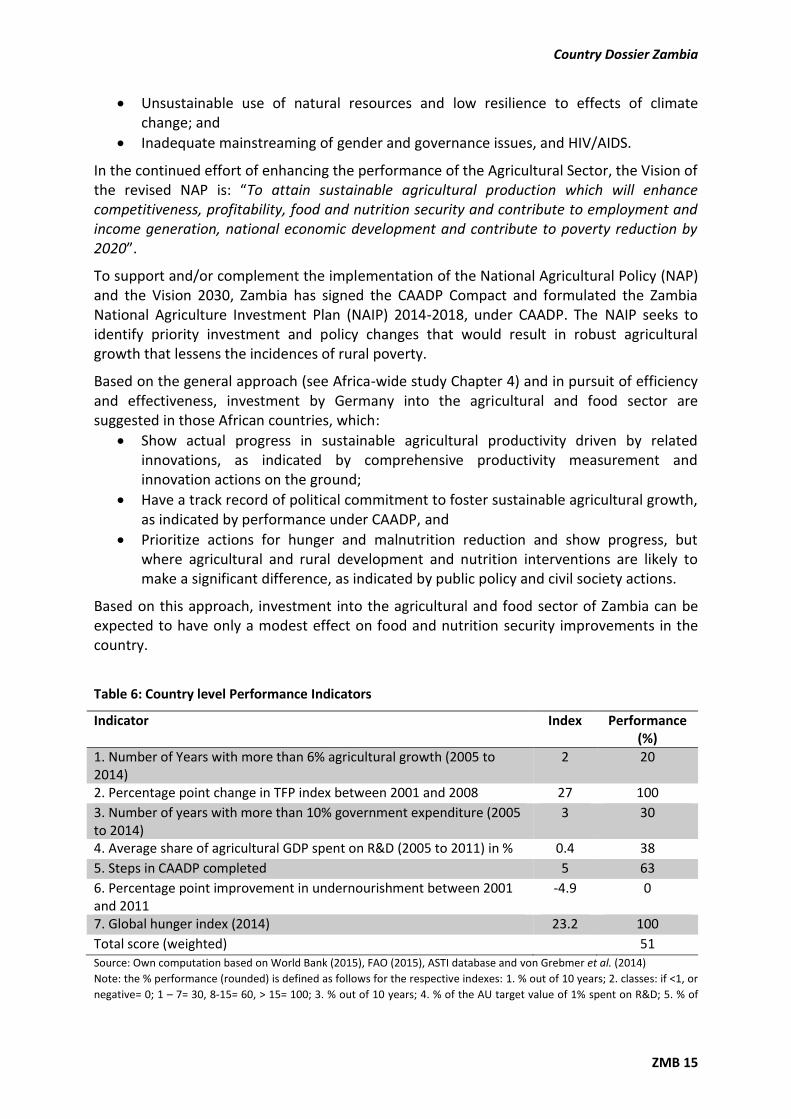
Table 6: Country level Performance Indicators
Indicator Index Performance
(%)
1. Number of Years with more than 6% agricultural growth (2005 to
2014)
2 20
2. Percentage point change in TFP index between 2001 and 2008 27 100
3. Number of years with more than 10% government expenditure (2005
to 2014)
3 30
4. Average share of agricultural GDP spent on R&D (2005 to 2011) in % 0.4 38
5. Steps in CAADP completed 5 63
6. Percentage point improvement in undernourishment between 2001
and 2011
-4.9 0
7. Global hunger index (2014) 23.2 100
Total score (weighted) 51
Source: Own computation based on World Bank (2015), FAO (2015), ASTI database and von Grebmer et al. (2014)
Note: the % performance (rounded) is defined as follows for the respective indexes: 1. % out of 10 years; 2. classes: if <1, or
negative= 0; 1 – 7= 30, 8-15= 60, > 15= 100; 3. % out of 10 years; 4. % of the AU target value of 1% spent on R&D; 5. % of

Program of Accompanying Research for Agricultural Innovation (PARI)
ZMB 16
the desired 8 steps; 6. classes: if < 2 = 0; if 3-5= 30; if 6-10=60, if>10=100; 7. classes: if < 12= 0; 12-16: = 60; 17-20: = 60; >
20= 100.
Total score (weighted) performance and need to invest: (sum of (1.+2.)/2 (expected growth performance); + sum of
(3.+4.+5.)/3 (expected government commitment); + sum of (6.+7.)/2 (performance in food and nutrition security and need))
divided by 3.
Results of assessment (Table 6)
Expected agricultural growth performance:
Zambia has increased its agricultural growth by more than 6% of the CADDP target
only for two years between 2005 and 2014 (www.resakss.org);
However, Total factor productivity in Zambia had improved by 27% between 2001
and 2008 (Fuglie and Rada, 2011), indicating substantial improvement in the
innovation performance of the country.
Government commitment:
Zambia has a track record of political commitment to foster sustainable agricultural
growth by being modestly active in the CAADP process and having completed five out
of the eight steps in the CAADP process (www.resakss.org);
However, the Zambia government has invested more than 10% of total government
expenditures (CAADP target) in the agriculture only for three years between 2005
and 2014 (www.resakss.org);
In addition, Zambia spends only 0.4% of its agricultural GDP on agricultural research
and development, which is much lower than the Sub-Saharan Africa average
(www.asti.cgiar.org) and the AU target value of 1% spent on R&D. This indicates that
Zambia´s investment on agricultural innovation is not yet sufficient.
Food and nutrition security progress and need:
Zambia is not prioritizing actions for hunger and malnutrition reduction and even the
prevalence of undernourishment increased by about 5%, between 2001 and 2011;
In addition, Zambia has a very high GHI score value of 24.4, reflecting an alarming
level of hunger (von Grebmer et al., 2014)1. This makes the investment into the
agricultural and food sector in Zambia very urgent to fight the high numbers of food
in secured people.
Overall, the economic, political, and social/nutrition framework in Zambia suggests modest
investment into the agricultural and food sector of the country.
1 GHI s ore Values less tha . refle t lo hu ger, alues fro . to 9.9 refle t oderate hu ger, alues
fro . to 9.9 i di ate a serious le el of hu ger, alues fro . to 9.9 are alar i g, a d alues of 30.0 or greater are e tre el alar ing (von Grebmer et al., 2014).
Country Dossier Zambia
ZMB 17
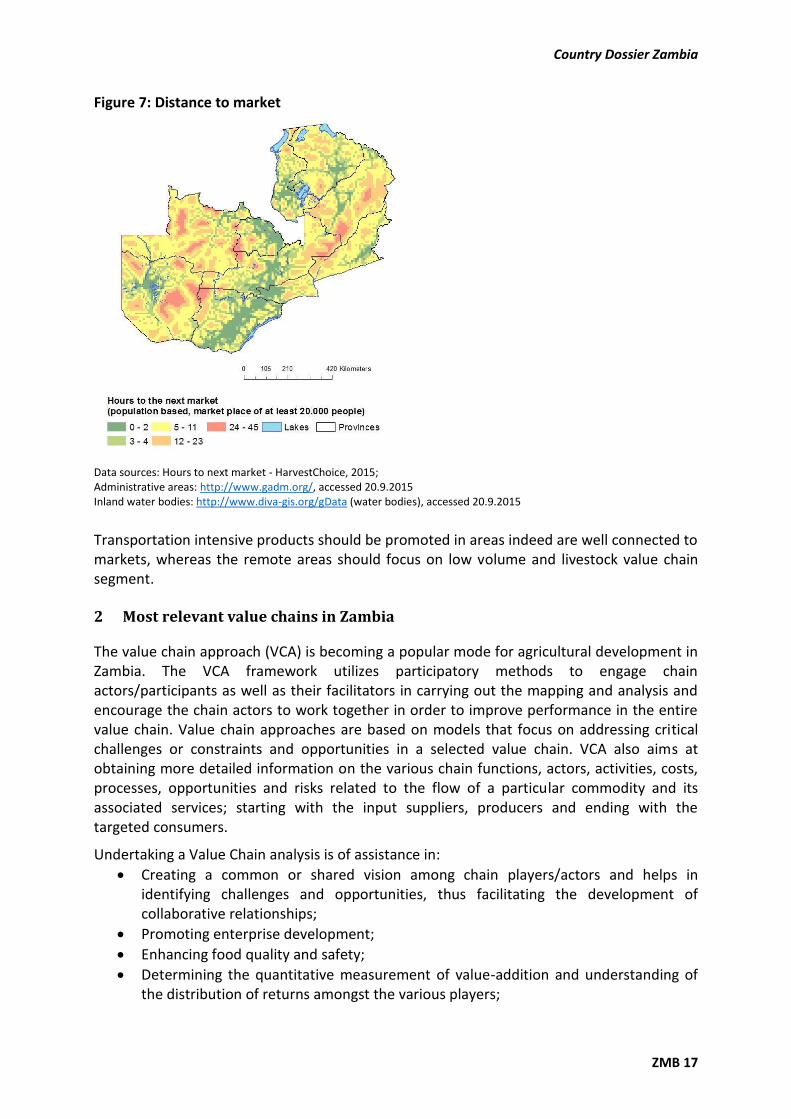
Figure 7: Distance to market
Data sources: Hours to next market - HarvestChoice, 2015;
Administrative areas: http://www.gadm.org/, accessed 20.9.2015
Inland water bodies: http://www.diva-gis.org/gData (water bodies), accessed 20.9.2015
Transportation intensive products should be promoted in areas indeed are well connected to
markets, whereas the remote areas should focus on low volume and livestock value chain
segment.
2 Most relevant value chains in Zambia
The value chain approach (VCA) is becoming a popular mode for agricultural development in
Zambia. The VCA framework utilizes participatory methods to engage chain
actors/participants as well as their facilitators in carrying out the mapping and analysis and
encourage the chain actors to work together in order to improve performance in the entire
value chain. Value chain approaches are based on models that focus on addressing critical
challenges or constraints and opportunities in a selected value chain. VCA also aims at
obtaining more detailed information on the various chain functions, actors, activities, costs,
processes, opportunities and risks related to the flow of a particular commodity and its
associated services; starting with the input suppliers, producers and ending with the
targeted consumers.
Undertaking a Value Chain analysis is of assistance in:
Creating a common or shared vision among chain players/actors and helps in
identifying challenges and opportunities, thus facilitating the development of
collaborative relationships;
Promoting enterprise development;
Enhancing food quality and safety;
Determining the quantitative measurement of value-addition and understanding of
the distribution of returns amongst the various players;

Program of Accompanying Research for Agricultural Innovation (PARI)
ZMB 18
Promotion of coordinated linkages among the value chain actors e.g. producers,
processors and marketers;
Improving of a i di idual fir s o petiti e positio and/or share in the commodity
market.
Below are some of the important and emerging value chains in Zambia:
2.1 AIC value chains
The value chains chosen for the Agricultural Innovation Centers (AIC) include soybean
(together with maize/cotton) and groundnut (together with bean).
2.1.1 Maize value chain
Maize is )a ia s main staple food, particularly prepared in the for of a thi k porridge called nshima. Maize also receives the most support in terms of the go er e t s udgetar allocation and provision of other agricultural services, compared to other agricultural
commodities reflected in the National Food Balance Sheet (FBS). However, urban
consumption observations are indicating some changes in preference, especially among the
youths. Among a good number of urban youth consumers, rice and wheat products e.g.
bread, are becoming preferable substitutes for maize.
Maize is also the most prominent crop among the small- and medium-scale famers and
contribute about 80% to the total national maize production. The maize value chain also
apparently has the highest number of actors in its value chain functions, i.e. input suppliers,
producers, processors traders and consumers. The crop is grown in nearly all provinces of
Zambia, even where it is not agronomically recommended. Some few commercial farmers
also grow maize for livestock feed and sometimes as a winter crop, under irrigation, for
human consumption when a short-fall in production is anticipated.
Maize is the major crop bought for and stored/preserved as the national food strategic
reserves by the Food Reserve Agency (FRA). Currently maize also forms one of the main raw
materials in the Zambian livestock feed mill industry, with the bulk of it being poultry feed.
2.1.2 Soybean
The soybean value chain is providing a promising opportunity for entrepreneurship and food
and nutrition security in Zambia. This is largely through its potential for growth as demanded
by predominantly the livestock feed industry, particularly the poultry sub-sector, and the
increasing acceptability for human consumption as it provides high quality nutrition
(proteins) at much lower cost than the most common proteins sources.
Zambia is self-sufficient (net exporter) in soy production – production for the year 2009/10
estimated at about 112,000 metric tons while consumption is estimated at 90,000 metric
tons (Technoserve, 2010). This production and export of soy in Zambia is dominated by
commercial farmers (85% of production). Growth in production has largely been achieved by
increase in area planted rather than yield increase, despite volatility as the market has grown
(ibid). The growth for soybean in Zambia is also promising because of the excess processing
capacity accompanied with good vertical integration (such as with livestock feed
manufactures).

Country Dossier Zambia
ZMB 19
Despite this strong export market opportunities in Zimbabwe, South Africa and Democratic
Republic of Congo, several constraints continue to hinder soy value chain in Zambia,
including (Technoserve, 2010):
Relatively high cost base;
Poor transport infrastructure and an uncertainty in the export policy;
Inaccessible inputs, and technical knowledge (especially with quality issues) for
smallholder farmers;
High transport costs pose challenges for the import/export market opportunities.
2.1.3 Groundnuts and common beans
Groundnuts and common beans are primarily small-scale farmer crops grown by over half a
million Zambian households. Approximately 80% of these food crops are consumed at
household level or within the local area. Most of the surplus crops enter the informal market
chain. There is, however, major potential market demand for both crops in terms of regional
and international markets provided that these crops are produced, harvested and processed
according to market specifications.
)a ia s li ate and soil conditions are ideal for growing groundnuts. In the 1960s and
1970s Zambia was a major exporter of premium-grade groundnuts to the European
confectionery market. However, in the 1980s, the private sector was unable to fill the void
left by the dismantling of the State-owned parastatal companies such as the National
Agricultural Marketing Board (NAMBOARD), which led to a decline in seed germination,
lower yields, loss of sorting and grading capacity, increased aflatoxin levels, and loss in
farmer, trade and customer confidence.
2.2 Other relevant value chains
2.2.1 Cassava
Cassava is the other dominant national staple food crop, after maize, and one of the main
food security crops in the country. It is mainly produced in Northern, Muchinga and Luapula
Provinces, as well as in some areas of Western and North-Western Provinces. The crop is
almost exclusively produced by smallholder farmers. It is mostly used for home consumption
(with over 94% of the production consumed). Currently only around 8% of the produced
crop is actually marketed locally as fresh root or sold as dried chips mainly into informal
markets in Lusaka and Copperbelt Provinces. Some regional exports of dried chips take place
to the Democratic Republic of Congo (DRC) mainly through informal cross border markets,
such as at Kasumbalesa.
Cassava has a number of advantages compared, for instance to maize, and is thus very much
suited for small-scale farmer production in that:
It is a low input crop (no/limited fertilizer requirement, no annual seed purchase,
etc.);
A large number of small-scale farmers in the high cassava production areas have good
production knowledge of cassava;
It is not affected by drought as it able to tolerate long periods without rain (once it is
established);

Program of Accompanying Research for Agricultural Innovation (PARI)
ZMB 20
It is also mainly grown in high/reliable rainfall areas.
In trying to promote commercialization of cassava, the government has developed a
National Cassava Development Strategy. This is being cognizant of the fact that besides it
being one of the main food security crops in the country, a number of market development
opportunities exist, which have the potential to create substantial additional market pull for
cassava; such as being used in starch production, in feed mill, for beer brewing, milling
industry, etc.
Cassava commercialization (through product/market development) is expected to lead to
increased incomes through increasing the proportion of the crop that is marketed, which will
lead to increased production (market pull). Commercialization of cassava is also expected to
lead to increase in the geographical coverage of cassava production areas, providing
additional small-scale farmers with both increased incomes as well as food security. Cassava
is also a major world food crop with global production in excess of 230 million tons per year,
with the four major producing countries (Nigeria, Brazil, Indonesia and Thailand) producing
almost half the world crop.
However, the commercial exploitation of cassava in Zambia is hampered by factors such as:
Government maize price subsidies that create barriers-to-trade. The current Food
Reserve Agency (FRA) discounted price distorts the market and makes it very difficult
for cassava chip farmer/processors to compete (major feed-mill companies are
willing to substitute thousands of tons of maize with cassava they can purchase it for
70% maize price);
High transport costs, as most cassava is grown far (Luapula, Northern, Muchinga and
Western Provinces) fro )a ia s a ufa turi g e ters;
Lack of product consistency: failure to secure a regular market, poor procedures,
ineffective quality controls and/or lack of farmer awareness has led to non-
commercial inconsistent product quality / specification;
Lack of traceability: to protect their reputation, share-value, profits and to avoid
litigation, large food companies demand suppliers to provide clear detailed evidence
showing all food i gredie ts origi .
2.2.2 Wheat and rice value chains
Wheat is predominantly produced by large-scale/commercial farmers, and as an irrigated
crop. Zambia has normally had surplus wheat production. On the other hand, rice is
predominantly grown by small-scale farmers.
Being a more convenient food to cook and consume, rice is increasingly becoming a
mainstream alternative to the traditional staples such as maize and cassava, which are
however still eaten by large populations in Zambia and all across Africa. There is also growing
awareness in the country that the rising demand for rice is not transient, but rather a part of
a general trend being seen across the African continent in food consumption patterns,
arising from the increasing urban and predominantly young populations. In responding to
this trend, Zambia has developed the National Rice Development Strategy (NRDS): 2015-
2019, whose overall strategic objective is to increase local rice production by at least 50%
and also to enhance its competitiveness on the market. Additionally, in recognition of the
growing importance of rice as a national cereal staple, the government has designated it as

Country Dossier Zambia
ZMB 21
one of the two food commodities which the FRA purchases for the national strategic food
reserves.
Rice has reportedly been cultivated in Zambia at a subsistence level for quite a long time but
is currently being grown as a cash crop by smallholder farm families and thus offers great
potential to contribute to income and employment in the country, especially in the rural
areas. The observed strong supply response to diversify into rice production by the
smallholder farmers, is not only due to the incentive created by rising consumer demand in
the country, but also by the little expenditure on rice inputs compared to, for example maize
or cotton, under the traditional farming system they practice.
The leading provinces, in terms of percentage contribution to aggregate national production
are Western, Northern, Muchinga, Luapula and Eastern Provinces. According to the Ministry
of Agri ulture a d the Ce tral “tatisti al Offi e s Crop Forecasting Survey results, over the
last six years, the area under rice cultivation has averaged about 36,144 ha, of which
Western Province accounted for 43%, Northern Province 31%, Muchinga Province 17%,
Eastern and Luapula Provinces 4% each, and the rest of the provinces 2%.
2.2.3 Aquaculture
Zambia, with funding provided by the Food and Agricultural Organisation (FAO), developed a
National Aquaculture Strategy in 2004. The National Aquaculture Strategy proposes means
and methods of addressing critical issues relating to aquaculture development through input
supply (i.e. production and delivery of feeds and seeds as well as the availability of farm
credit) and access to extension support and markets. The National Aquaculture Strategy was
later followed with the formulation of National Aquaculture Development Plan: 2009-2011.
Aquaculture (fish-farming) is currently gaining prominence especially with the depletion of
fisheries resources from the cou tr s atural ater odies. Aquaculture is practiced and
thus being promoted, among both commercial and small-scale fish farmers, in
impoundments, reservoirs and dams; earthen ponds (small and large); and in cages.
Most commercial fish farms are located in Southern, Lusaka and Copperbelt Provinces. On
the other hand, small-scale fish farmers are concentrated in Northern, Northwestern and
Eastern Provinces (constitutes 80% of the total). The number of small-scale farmers taking up
fish farming has been increasing rapidly over the years due to the activities of aquaculture
projects being undertaken in the Country.
The production systems and practices of fish farming in Zambia are diverse, ranging from
extensive to intensive practices and from multi-species to mono species, with no clear
distinctions and levels of practice generally overlap.
2.2.4 Fresh Fruits and Vegetables (FFV) Value Chains
Promoting commercial production of fresh fruits and vegetables (FFV) and increasing access
to markets for smallholder farmers have been identified as key drivers for stimulating
inclusive economic growth and reducing poverty that is prevalent in rural and peri-urban
areas within Zambia. The attractiveness of a strategy of commercializing FFV production
among the small-scale farmers is principally on account of high potential to increase
incomes, create both direct and indirect employment opportunities. Equally important is the
possibility involving the resource-poor member of farming households such as the women,
Program of Accompanying Research for Agricultural Innovation (PARI)
ZMB 22
the youth, people living with HIV/AIDS and thus provide them with opportunities to enhance
their food security.
3 Innovations in value chains in the past 20 years
- pending further information -
3.1 The most crucial limiting factors in Zambia / AIC-region / in AIC value chains
- pending further information -
3.2 The most important / beneficial innovations in the relevant value chains
- pending further information -
3.2.1 AIC value chains
- pending further information -
3.2.2 Other value chains and cross-cutting innovations
- pending further information -
3.3 Most promising approaches for farmer and small business related value
chain innovations
- pending further information -
4 Considerations for Effective Zambia-German Collaboration in Agricultural
Research and Development
4.1 Promising Agricultural Products and Value Chains.
Besides assessing the returns of investments into institutional innovations in Zambia,
analysis to choose the most promising value chains in the country is also undertaken. In
compliance with the availability of data and the purpose of the study four criteria that focus
on poverty and market potential are used to select the five most promising agricultural
products from the long list of agricultural products the country produces and sells. The first
indicator, the trade potential (revealed comparative advantage (RCA) index), is computed to
identify value chains over which the country has revealed (but not potential) comparative
advantage. In the present case, the RCA index compares the share of a given agricultural
produ t i )a ia s e port asket ith that of the sa e produ t i total orld e ports. The second indicator, yield gap, is used to assess the expected return of the envisaged Germany
investment on the given AIC country value chains. A third indicator, average yield growth, is
used to examine the Potential of the product for poverty reduction. The production share of
total supply is also used to assess the present integration of the poor in the market
(relevance).
The summary of the five most promising value chains based on Revealed Comparative
Advantage (RCA) index, average yield growth and relative yield gap is reported in Table 7

Country Dossier Zambia
ZMB 23
below. The production share, RCA index, actual yield growth and relative yield gap for the
GIZ-selected value chain(s) is also reported at the bottom of the table, when they are not
included in the list of the first five most promising value chains.
Table 7: Selection of promising agricultural products /value chains
Rank by RCA Rank by Yield
progress***
Rank by yield gap Rank by relevance of crop
Rank Name of
agricultural
product
RCA
index
(2012)
Name of
the crop
Average
annual
yield
growth
(2005 to
2012 )
Name
of
staple
crop
(rain
fed)
Relativ
e yield
gap
(%)**
Name of
agricultural
product
Production
share of
supply
(2012)*
1 Oil, olive
residues
77 Ground-
nuts,
with
shell
11 maize 86 Cottonseed
Oil
200
2 Cotton linter 70 Soybean
s
6 millet 89 Soybean 180
3 Bran, maize 56 Maize 6 Sugar 113
4 Tobacco,
unmanufactu
red
10 Wheat 5 Cassava ,
products
100
5 Beans, green 9 Sweet
potatoes
5 Sweet
potatoes
100
GIZ
selected
Groundnuts,
shelled
0.04 Groundnut
Oil
100
Soybeans 0.02
Source: * Own computation based on FAO 2015 data, ** from Van Bussel et al. (2015).
Note: *** a minimum of 0.5% production (volume) share threshold is used as a screening (crop relevance) criteria.
Results of assessment (Table 7):
The trade potential (revealed comparative advantage (RCA) index) is high for olive oil
residues, cotton linter, maize, unmanufactured tobacco and green beans. This
indicates that Zambia has comparative advantage (in the export) of these
commodities. The RCA value for the GIZ selected crops is much lower than 1
indicating that Zambia has comparative disadvantage (in the export) of all the GIZ
crops namely soybeans and ground nut.
The yield performance indicating progress suggests that over the CAADP period (2005
to 2012) the GIZ selected value chains( groundnuts and soybeans ), maize, wheat and
sweet potatoes are the five most promising crops.
Yield gaps indicate potentials from another angle, and is observed to be high for rain
maize and millet indicating the high potential return of investing on these value
chains.
In terms of relevance (production share of supply) cottonseed oil, soybeans, sugar
(raw equivalent), cassava and sweet potatoes are the leading. The total production of
the first two products exceeds the total supply. The full supply of the latter three and
ground nuts (the other GIZ selected value chain), is also fully produced in the country.
Program of Accompanying Research for Agricultural Innovation (PARI)
ZMB 24
4.2 A systematic assessment of promising partnerships for each promising
innovation area
With )a ia s high pote tial for agri ultural de elop e t a d di ersifi atio fro the mining sector, for economic growth and poverty reduction, there is a huge scope for a long
standing collaboration between Zambia and Germany. Therefore the cooperation and/or
collaboration between Zambia and Germany through PARI should be harnessed.
The scaling-up of the innovation platforms in the different countries is a major partnership
area which the countries will like to explore with stakeholders from Germany. This will
however be best placed along the strategic commodities and themes in the different
countries.
The Zambian agricultural development policies, strategies and plans have identified a
number of prime commodities and value chains to be given attention and priority. Zambia
appears to be behind in terms of innovation platforms, thus following the signing of the
Agreement between FARA and ZARI, needs close follow-up with Germany, in order to
identify and come up with appropriate innovation platforms and/or technology generation
along these commodities will be a vital route for collaboration for impact.
4.3 Some potential partners for the German collaboration: in science and
research, private sector and NGOs and governmental organizations
A good partnership framework is essential to bring the German–Zambian collaboration to
fruition. Besides ZARI, other prospective partners with Germany in Zambia will include the
Mi istr of Agri ulture a d Li esto k, the U i ersities, a d the far ers orga isatio s/
associations, the non-governmental organization and the relevant private sector.
4.4 Needed implementation research
The potential for German collaboration in fostering Zambian agricultural growth and
development is enormous. This could range from research partnerships for technology
generation and innovations through capacity building in order to develop pathways and
systems for translating research outputs to development outcomes for positive socio-
economic impact. The need to build external collaboration on existing progressive initiatives
and the Government pathways for the development of the sector is very essential for
complementarity and synergy.

Country Dossier Zambia
ZMB 25
5 References
FAO. 2014. The State of Food Insecurity in the World 2014. Rome: FAO, WFP, IFAD.
GRZ-FAO. 2009. GRZ–FAO National Medium Term Priority Framework 2009-2013 – ZAMBIA.
APRIL 2009. Retrieved on September 28, 2015 from:
ftp://ftp.fao.org/TC/CPF/Country%20NMTPF/Zambia/Status/NMTPF.pdf
HarvestChoice. 2015. "Travel time to nearest town over 20K (mean, hours, 2000)."
International Food Policy Research Institute, Washington, DC., and University of Minnesota,
St. Paul, MN. Available online at http://harvestchoice.org/data/tt_20k.
Kuteya A. 2012. A al zi g )a ia s Agri ultural “e tor Budget . Presentation at the
ACF/IAPRI
Budget Meeting. Lusaka. Available online at: http://www.aec.msu.edu/fs2/-
zambia/2013_Zambian-AgriculturalSector_Budget_Analysis-Auckland.pdf
Mason N.M., Jayne T.S. and Mofya‐Mukuka R. 2013. Zambia's input subsidy
programs. Agricultural Economics, 44(6), 613-628.
National Agricultural Policy (NAP)-Revised
National Agricultural Investment Plan (NAIP). May 2013
National Aquaculture Strategy, May 2004
Sixth National Development Plan. January 2011
Soybean value chain and market analysis Report. IAPRI, June 2014
Technoserve. 2010. Southern Africa Soy Roadmap – Zambia value chain analysis. November
2010 –February 2011
Vision 2030. December 2006.
von Grebmer K., Saltzman A., Birol E., Wiesmann D., Prasai N., Yohannes Y., Menon P.,
Thompson J. and Sonntag A. 2014. Global Hunger Index 2014: The Challenge of Hidden
Hunger. Bonn/Washington D.C./Dublin: Welthungerhilfe, International Food Policy Research
Institute (IFPRI), Concern Worldwide.


