ZAMBIA’S SECOND N Government of the Republic of Zambia Ministry of Lands, Natural Resources and Environmental Protection NATIONAL BIODIVERSITY STRATE PLAN (NBSAP -2) 2015-2025 EGY AND ACTION
Transcript
ZAMBIA’S SECOND NATIONAL BIODIVERSITY STRATEGY AND ACTION
Government of the Republic of Zambia
Ministry of Lands, Natural Resources
and Environmental Protection
ZAMBIA’S SECOND NATIONAL BIODIVERSITY STRATEGY AND ACTION
PLAN (NBSAP -2)
2015-2025
ZAMBIA’S SECOND NATIONAL BIODIVERSITY STRATEGY AND ACTION
FOREWORD
The conservation of our environment and its natural resources is of critical importance to Zambia in order to protect our natural heritage. This is not only for purposes of ensuring continued socio-economic development but it is also meant to sustain the important ecological services that our environment and its natural resources provide to us. This approach is also based on our firm belief in inter-generational equity to ensure that we do not deprive future generations of the goods and services that we currently enjoy from our environment and its natural resources.
As a result, over the years, the Zambian Government has put in place policies, strategies and programmes that promote conservation of our fauna and flora in the country. For
example, we formulated the National Conservation Strategy (NCS) in 1985 which provided a solid base for a coordinated approach to our environmental management culminating into the promulgation of the Environmental Protection and Pollution Control Act No. 12 of 1990. This piece of legislation established the Environmental Council of Zambia (ECZ), now the Zambia Environmental Management Agency (ZEMA) as a statutory body charged with the mandate to regulate environmental management and pollution control, among other things. In 1999, we formulated our first National Biodiversity Strategy and Action Plan (NBSAP) which we have revised in this Strategy in order to bring it in line with our current development paradigm, respond to new challenges and align it to global frameworks including the Strategic Plan on Biodiversity from 2011 to 2020 and its Aichi Targets. Over the years, our commitment to conservation and prudent management of our environment and natural resources has grown with over 40% of our total land area reserved for protection of flora and fauna through a network of various types of protected areas.
This NBSAP2 represents our commitment to achieving both the long-term and medium-term national development objectives enshrined in the Vision 2030 and Revised Sixth National Development Plan, respectively. The NBSAP2 will also help us domesticate broader international frameworks including the Sustainable Development Goals (SDGs) and other national obligations under the international instruments which we are Party to including the Convention on Biological Diversity (UNCCBD), the Climate Change Convention (UNFCCC), the Ramsar Convention on Wetlands including regional SADC protocols on wildlife, water, fisheries, forestry, biosafety, energy, mining, gender and development, trade, etc. We remain committed to prioritizing sustainable management and conservation of our environment and its natural resources to ensure that we continue benefitting from the goods and ecological services they provide.
Christabel Ngimbu, MP MINISTER OF LANDS, NATURAL RESOURCES AND ENVIRONMENTAL PROTECTION
PREFACE
In Zambia, our forests, wildlife, fisheries, wetlands and indeed protected areas constitute a basis for livelihoods for the majority of our people as a resource base, and indeed the backbone of the country’s economy. Therefore, sustainable management and utilization of these natural resources is cardinal if the country is to achieve its aspirations of broad-based and equitable sustainable development.
Zambia developed its first National Biodiversity Strategy and Action Plan (NBSAP1) in 1999 and this has guided our implementation of the objectives of the Convention on Biological Diversity (CBD) over the years. However, changes in the country’s development paradigm have meant that this
Strategy is no longer in harmony with our current national development trajectory. In addition, at the global level, emerging issues, including climate change, and the shift from Millennium Development Goals (MDGs) to Sustainable Development Goals (SDGs) mean that our strategy in addressing issues related to biodiversity conservation need to reflect these new challenges. Finally, the adoption of the Global Strategic Plan on Biodiversity (2011-2020) and the Aichi Biodiversity Targets under the CBD in 2010 necessitated the formulation of a new generation of NBSAPs to operationalize these new developments.
It is from this background that Zambia has revised its first NBSAP and re-aligned it to respond to our contemporary development challenges as well as fit within the emerging global discourse on addressing biodiversity loss. This Strategy also provides a framework to guide work on biodiversity conservation in the country for the next ten years as well as acting as a resource mobilization tool both internally and externally to enable us implement it successfully. It represents our national aspiration to address the challenges we are facing in conserving our biodiversity and is also a symbol of our collective resolve to do this in a coordinated and effective manner.
In this regard, sectoral strategies that are guided by this NBSAP2 to conserve biodiversity, will be critical to ensure coordination and synergies at both planning and implementation levels as well as maximise efficiency in allocation and utilization of financial resources.
Barnaby Bwalya Mulenga Permanent Secretary
MINISTRY OF LANDS, NATURAL RESOURCES AND ENVIRONMENTA L PROTECTION
ACKNOWLEDGEMENTS The Revision of the National Biodiversity Strategy and Action Plan (NBSAP) of 1999 which has culminated into the formulation of this NBSAP2 could not have been a success without the contribution of several individuals and institutions too numerous to outline here. On behalf of the Ministry of Lands, Natural Resources and Environmental Protection (MLNREP), I wish to thank all individuals and organizations who, in one way or the other, played a role in helping us complete this mammoth task. In particular, I wish to thank all Government line ministries, civil society organizations, the private sector and most importantly local communities who provided valuable information which has provided the basis for this Strategy. I am also grateful to academic and research institutions that played a critical role in reviewing and providing critical comments on earlier drafts of the report. AUTHORS I would like to thank all authors who contributed to this Strategy, in particular, NIRAS-Zambia which was responsible for producing this document, the team leader Mr. Misael Kokwe, Prof. Patrick Matakala and Prof. Emmanuel Chidumayo. They were ably supported by contributors on thematic areas consisting of Dr. Godfrey Mwila (Agro-biodiversity), Ms. Chaona Phiri (Birds), Mr. Charles Phiri (Mammals), Mr. Hangoma Mudenda (Fish), and Mr. Freddie Siangulube (Invertebrates). Professor Chidumayo also provided internal review for quality control of all outputs of this process. TECHNICAL REVIEWERS The various outputs leading to the formulation of this strategy, primarily the thematic stocktaking and assessment reports, synthesized into a single combined Stocktaking Report and the Fifth National Report, were reviewed by a dedicated team of reviewers from various sectors who remained committed to the exercise throughout the process. This Technical Review Team ensured that comments were provided to the Consultants in a timely manner and their commitment and long hours of work, often over the weekends, deserve commendation. FUNDING BODIES The revision of the NBSAP1 and the preparation of the Fifth National Report, which were done concurrently using the same process would not have been possible without generous support from the Global Environment Facility (GEF), through the United Nations Environment Programme (UNEP). The Nature Conservancy (TNC), through its Zambia Country Office also provided support through its growing national portfolio and influence, which proved instrumental in facilitating the stakeholder consultations. I also wish to thank the Zambian Government Treasury, which ensured timely release of additional resources that were required for the process. The policy guidance and leadership provided by the Hon. Minister and the Permanent Secretary, respectively, played a vital role in keeping this process on track. CBD NATIONAL FOCAL POINT AND TEAM Finally, I wish to thank the CBD National Focal Point for Zambia, Mr. Ephraim Mwepya Shitima and his team of officers in the Department who coordinated the implementation of this Project and ensured that the exercise proceeded smoothly. I also thank individuals and organizations who supported this process in one way or another but not specifically mentioned here for brevity. This Strategy belongs to all people of Zambia including practitioners of biodiversity conservation, local communities, women and the youth who must take this Strategy as a blue print for the next ten years.
Godwin Fishani Gondwe Director- Environment and Natural Resources Management Department
MINISTRY OF LANDS, NATURAL RESOURCES AND ENVIRONMENTAL PROTECTION
v
EXECUTIVE SUMMARY
Zambia is endowed with abundant natural resources and a fairly rich biological diversity manifested in its wetlands and rivers, flora and fauna and agro-biodiversity. The mainstay of Zambia’s economy is natural resource-based principally mining, tourism, forestry, fisheries, agriculture and hydro-power generation with about 80 percent of Zambia’s population is directly dependent on natural resources for fuel, food, income, raw materials and medicines. However, the value of ecosystems and their biodiversity are not fully appreciated. Drawing from lessons in implementing the first NBSAP (2000-2009), this Strategy aims at ensuring that Zambia’s biodiversity is valued, conserved, restored and used sustainably.
The Government of the Republic of Zambia recognizes the importance of biodiversity in its contribution to the provision of ecosystem goods and services for national economic development and livelihoods, and in particular, the important role of National Biodiversity Strategies and Action Plans (NBSAPs) in guiding conservation and sustainable use of biodiversity. For this reason, NBSAP-2 has been developed as a transformative strategy emphasizing evidence-based interventions, fully participatory processes, important role of protected areas, incorporation of climate change resilience principles, restoration activities, need for diverse financing mechanisms and supportive policy, legal and regulatory (PLR) framework.
In the last five years, Zambia has undertaken other important initiatives supportive of biodiversity conservation. Key among these include completion of its Strategy on Reducing Emissions from Deforestation and forest Degradation (REDD+) in 2015 and , Forestry Policy (2014), Forestry Act (2015), Water Resources Management Act (2011), and the on-going development of a Wetlands Policy and revision of the Wildlife Policy and Act.
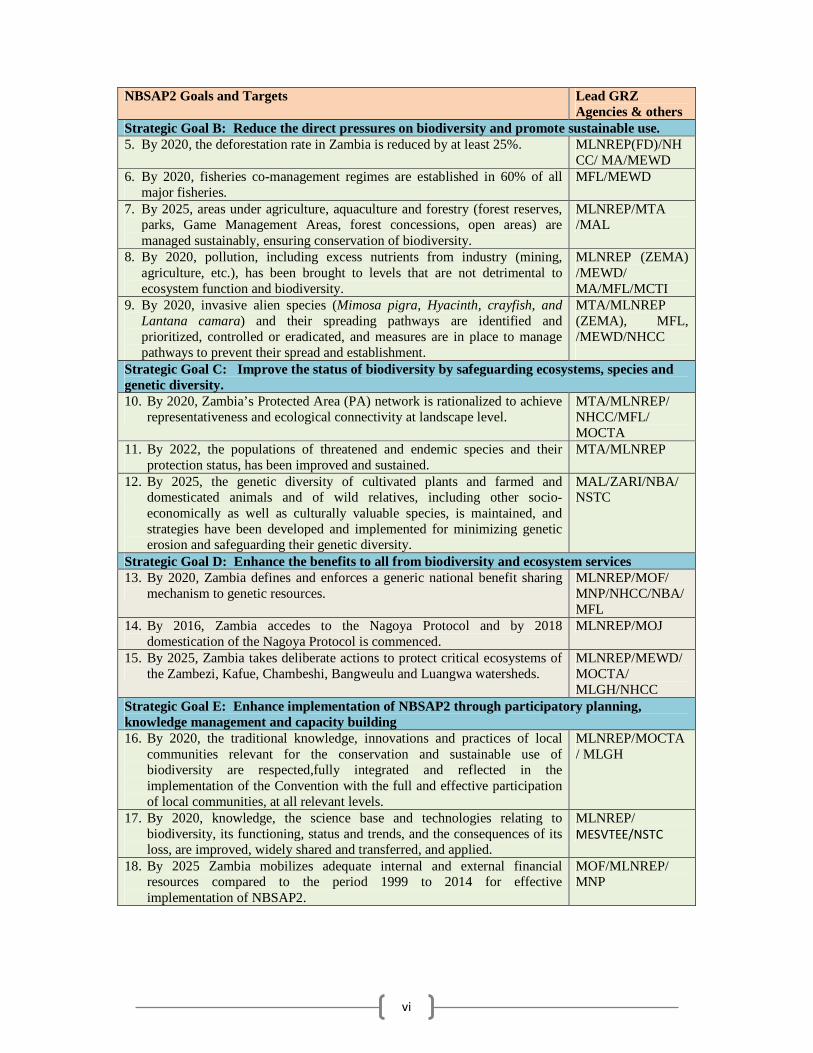
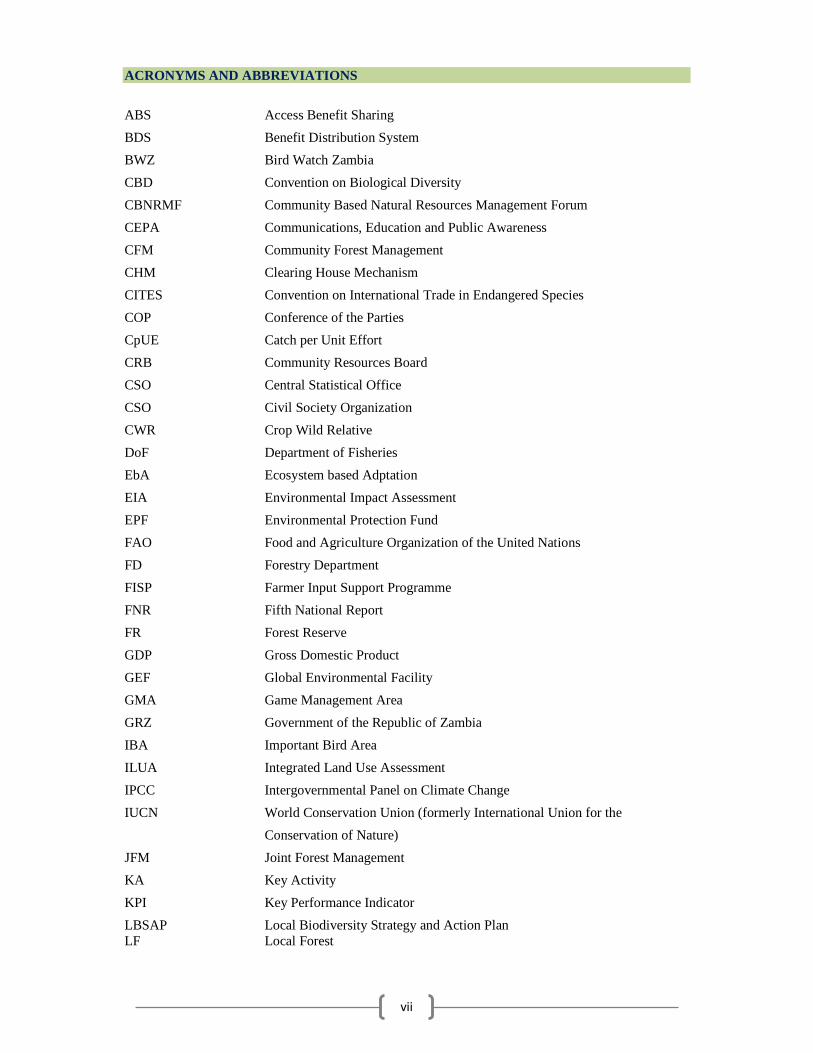
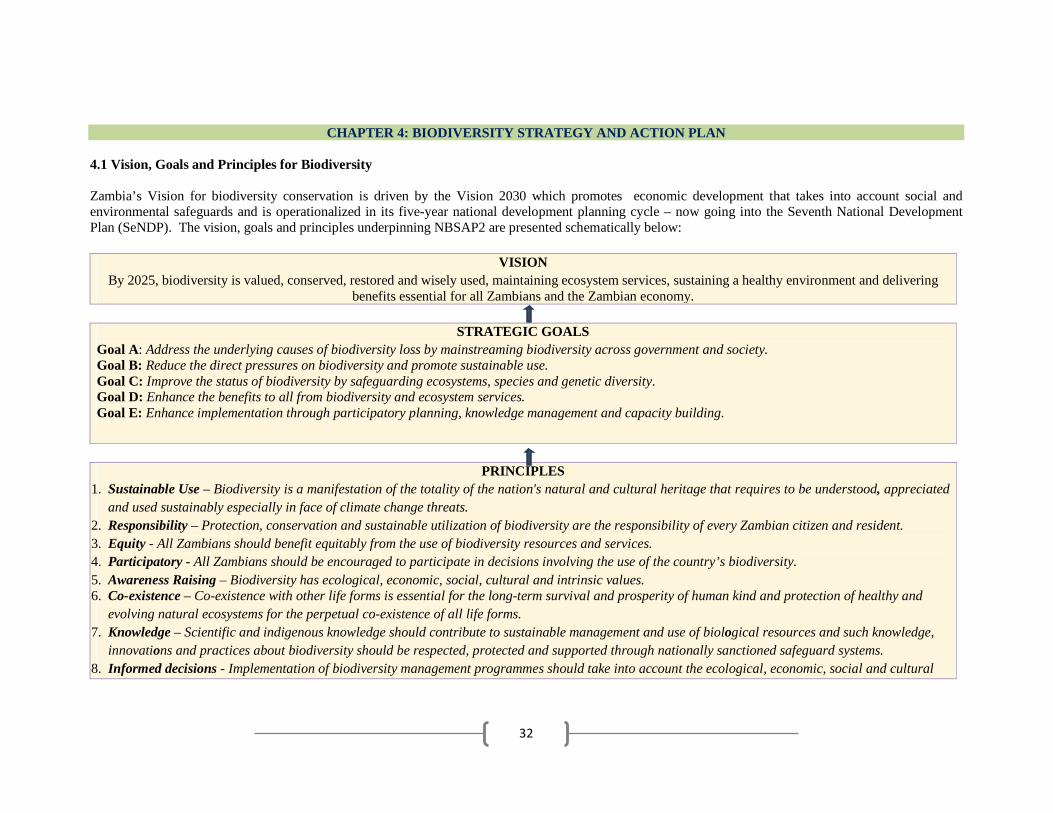
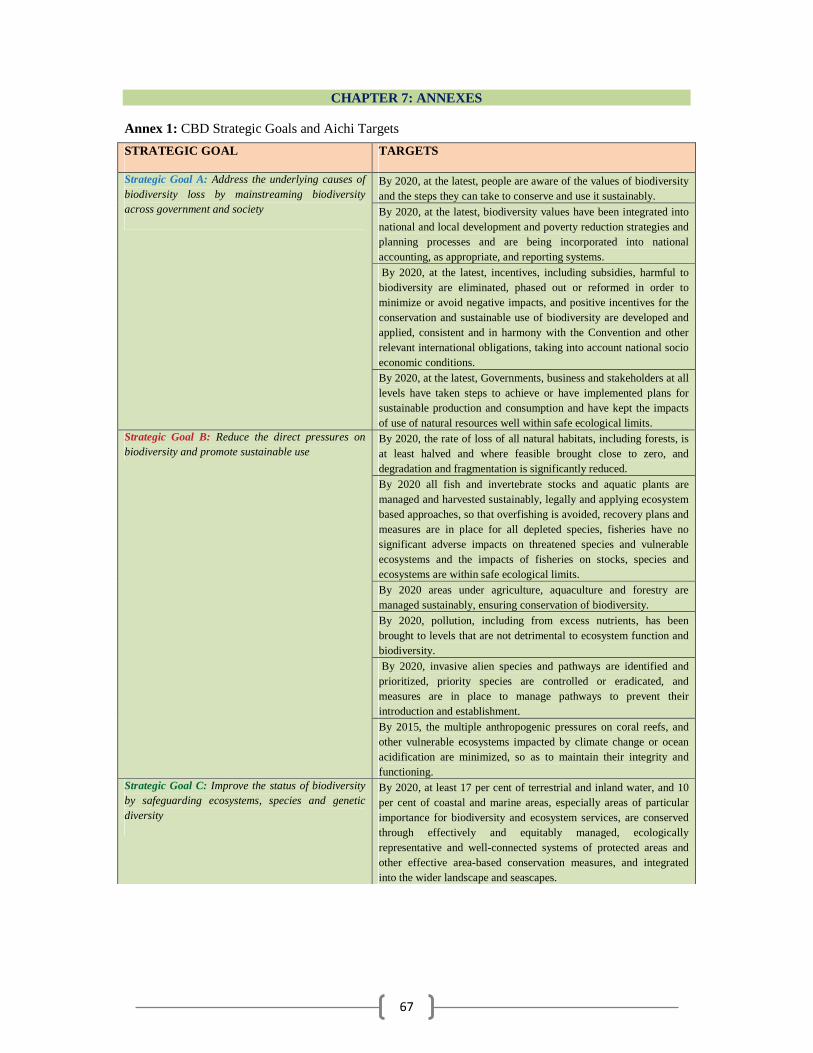
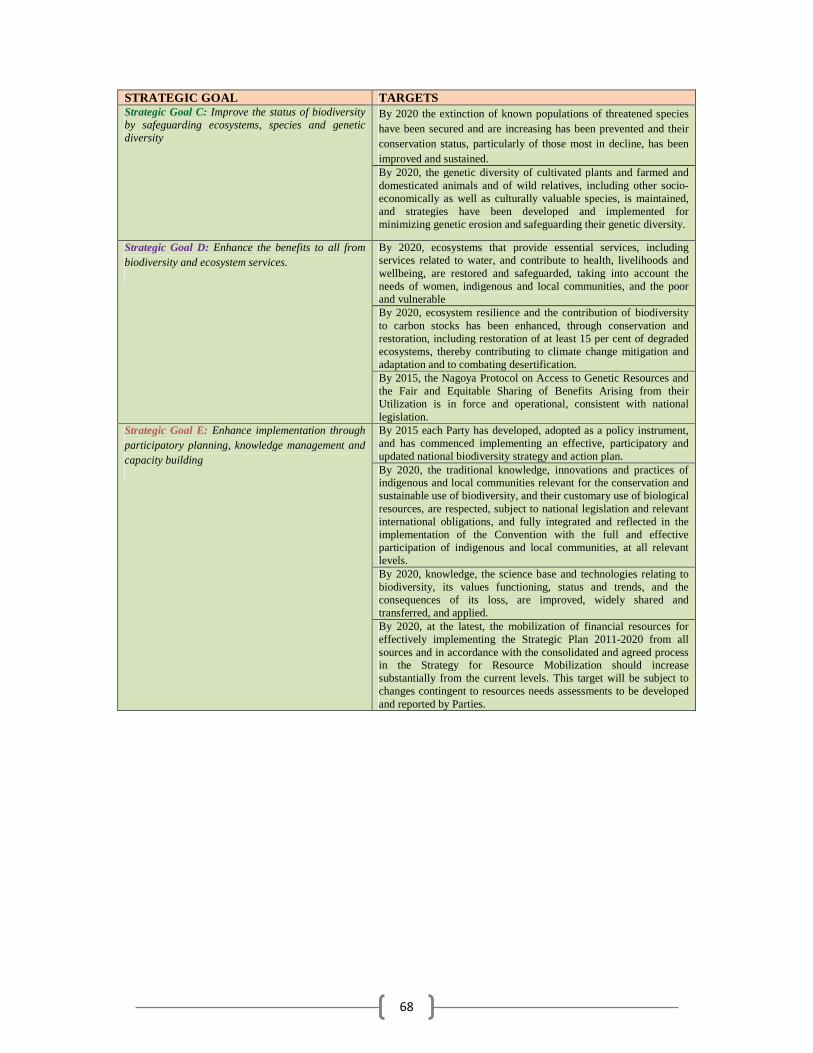
In revising the first NBSAP, Zambia undertook a wide consultative process involving more than 500 stakeholders at national and provincial levels. The inputs from these consultations provided valuable information on national priorities for inclusion in the revised Strategy. Zambia’s NBSAP-2 will cover the period 2015-2025, and its vision is “By 2025, biodiversity is valued, conserved, restored and wisely used, maintaining ecosystem services, sustaining a healthy environment and delivering benefits essential for all Zambians and the Zambian economy.” Based on national and provincial prioritization exercises, the five strategic goals of the CBD Strategic Plan were considered highly relevant to Zambia, and these provide the overarching framework for NBSAP-2. The 20 Aichi Biodiversity Targets were reduced to 18 national targets, which underscores the relevance of the CBD Strategic Plan and Aichi Targets (2011-2020) to Zambia’s priorities. The Strategic Goals and Targets of Zambia’s NBSAP2 are presented in the table below: NBSAP2 Goals and Targets Lead GRZ Agencies &
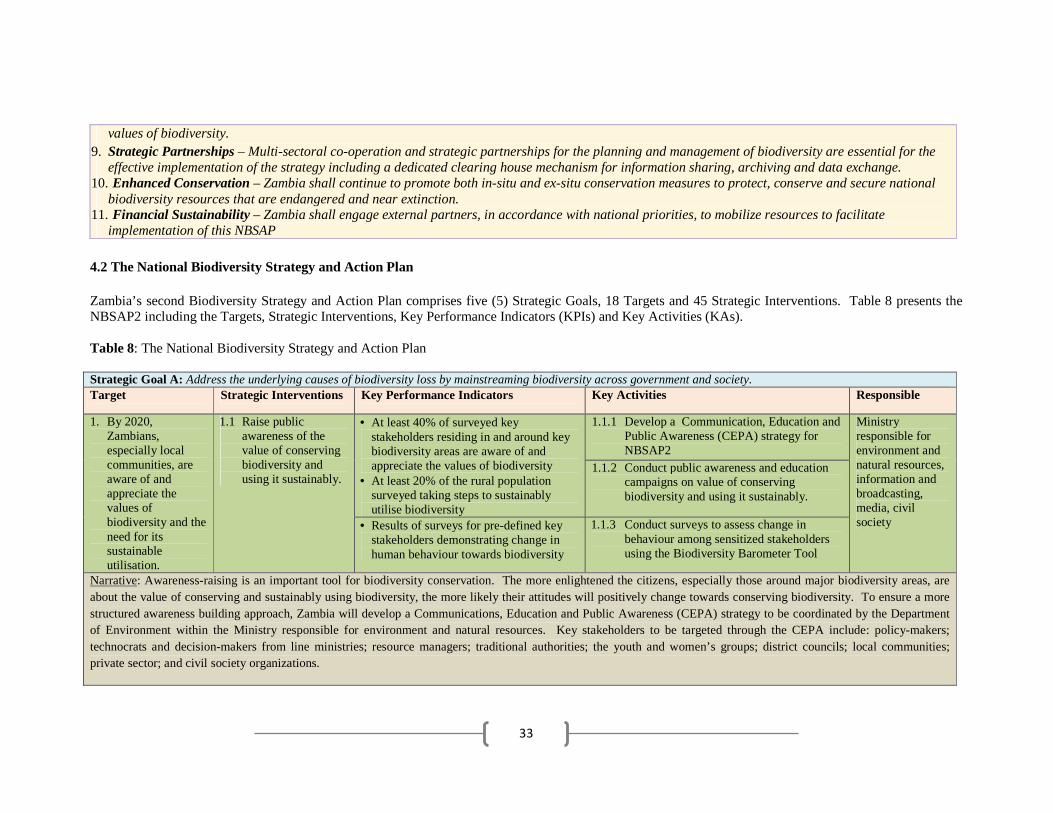
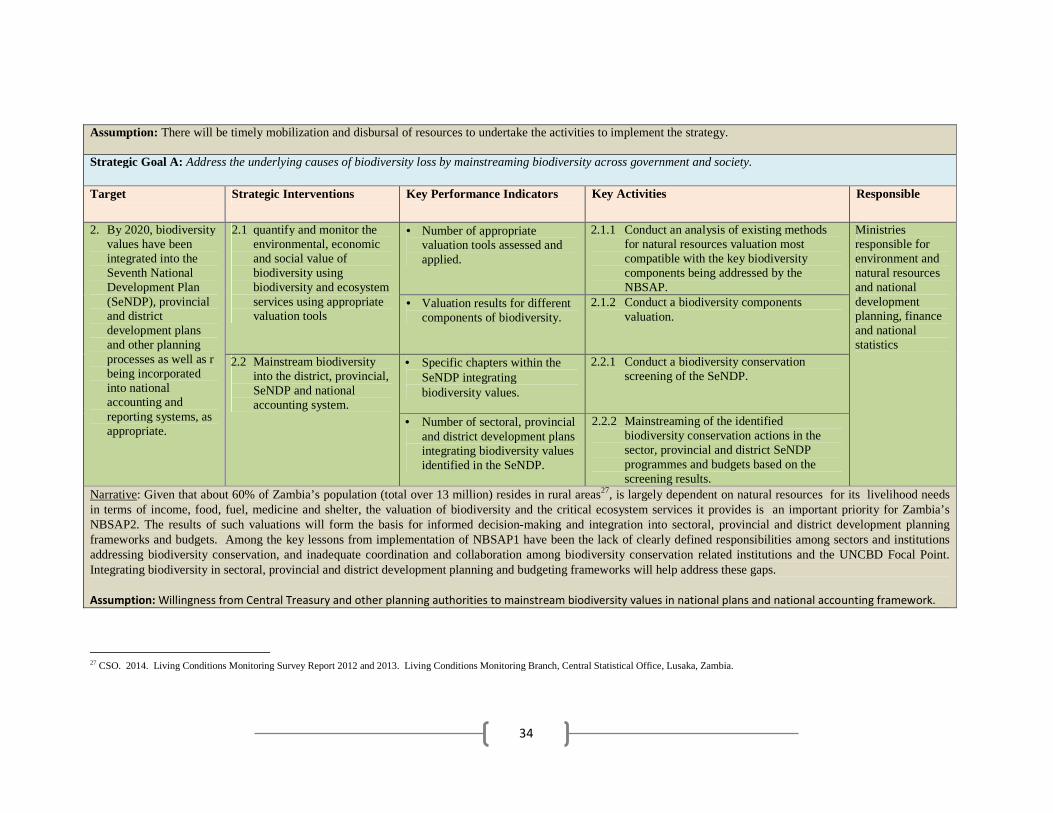
others Strategic Goal A: Address the underlying causes of biodiversity loss by mainstreaming biodiversity across government and society. 1. By 2020, Zambians, especially local communities, are aware of the
values of biodiversity and the steps they can take to conserve and use it sustainably.
MLNREP, MIBS, MEDIA & CIVIL SOCIETY
2. By 2020, biodiversity values have been integrated into the Seventh National Development Plan (SeNDP), provincial and district development plans and planning processes as well as reporting systems are being incorporated into national accounting, as appropriate.
MLNREP, MNP, MOF, CSO
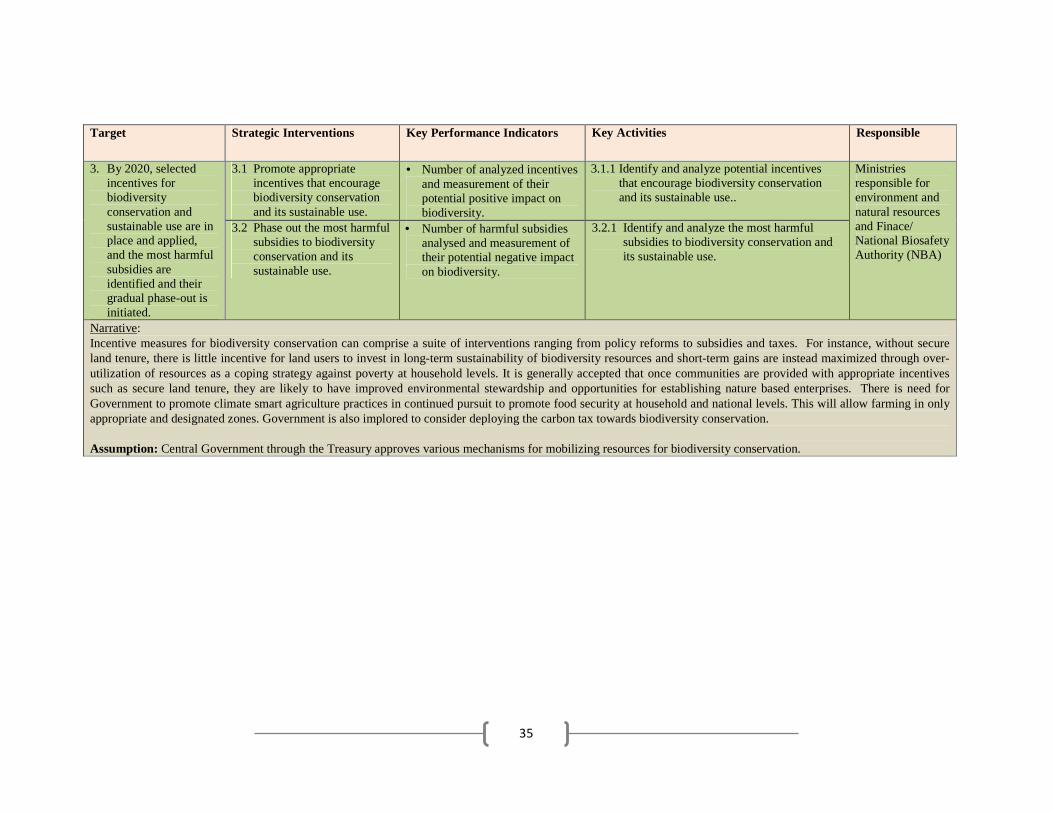
3. By 2019, selected incentives for biodiversity conservation and sustainable use are in place and applied, and the most harmful subsidies are identified and their gradual phase-out is initiated.
MLNREP/MNP, MOF
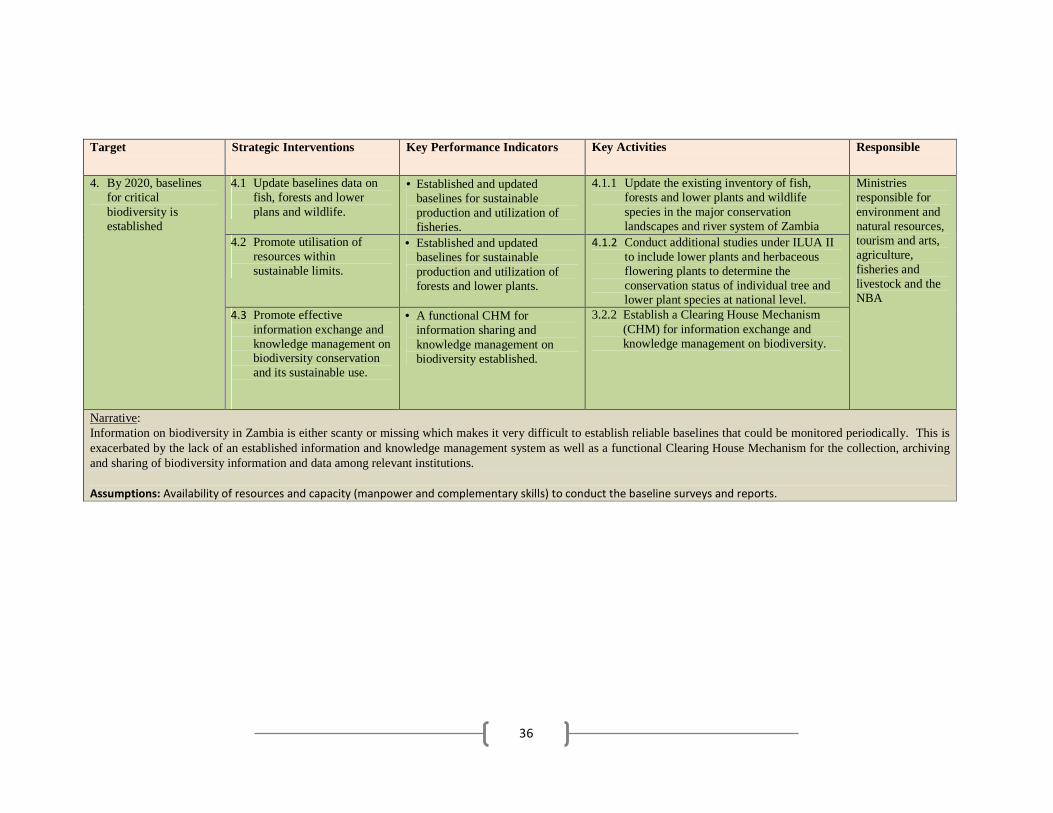
4. By 2020, baselines for sustainable production and utilization of fisheries, forests and wildlife are established and updated.
MLNREP/MTA/MA/MEWD (DWA&WARMA) /MFL
vi
NBSAP2 Goals and Targets Lead GRZ
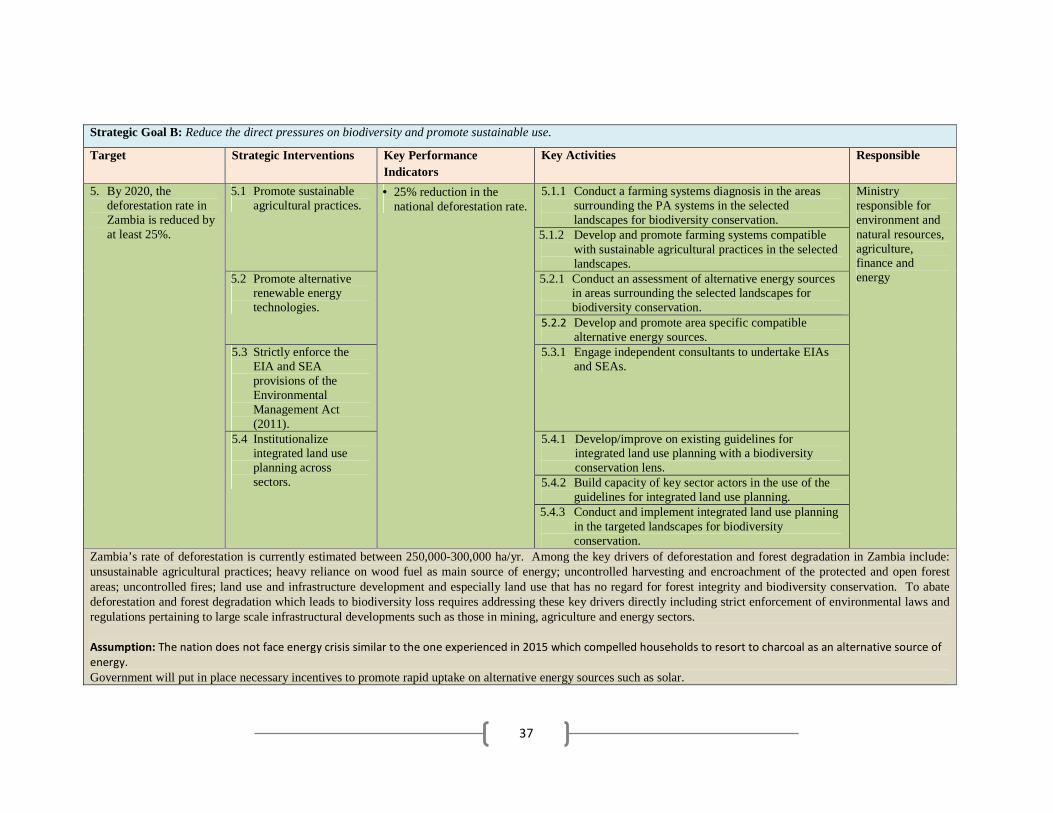
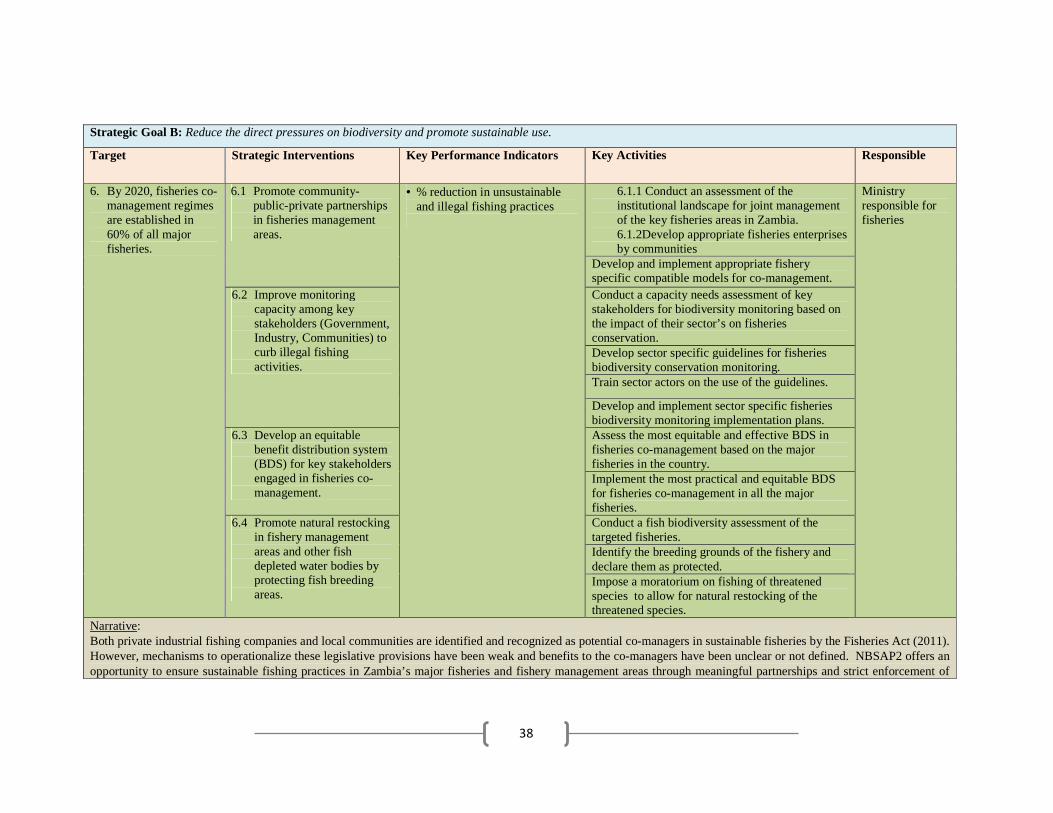
Agencies & others Strategic Goal B: Reduce the direct pressures on biodiversity and promote sustainable use. 5. By 2020, the deforestation rate in Zambia is reduced by at least 25%. MLNREP(FD)/NH
CC/ MA/MEWD 6. By 2020, fisheries co-management regimes are established in 60% of all
major fisheries. MFL/MEWD
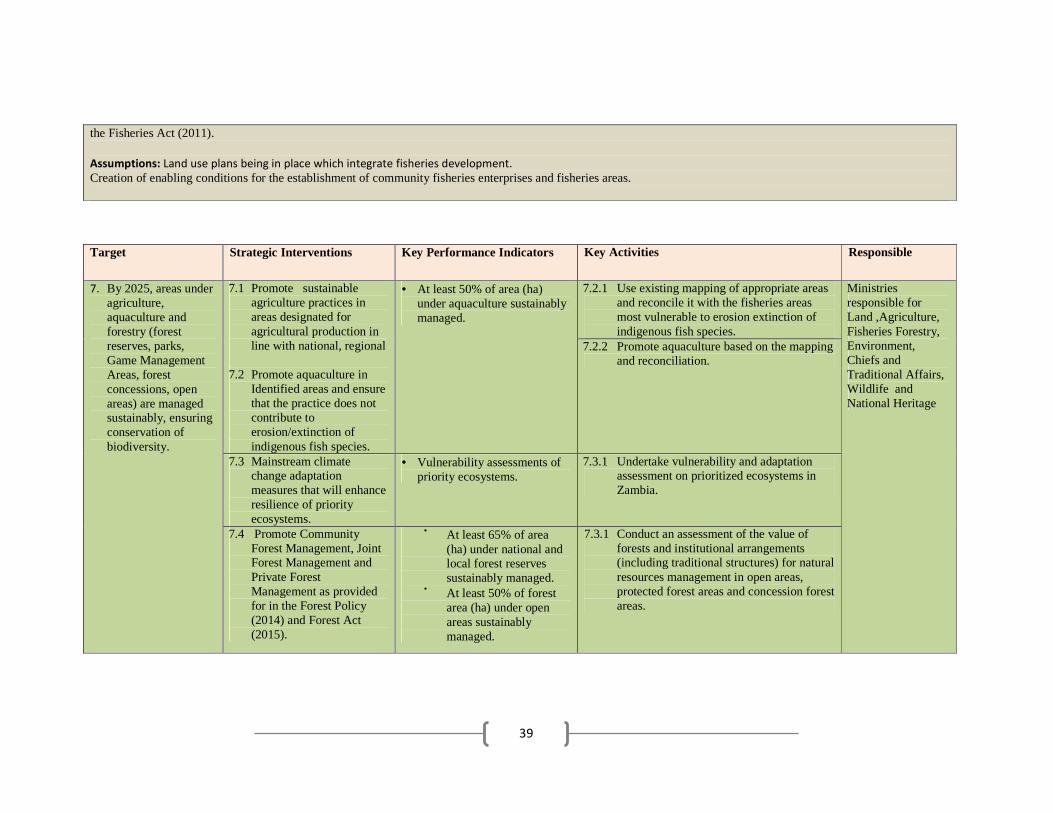
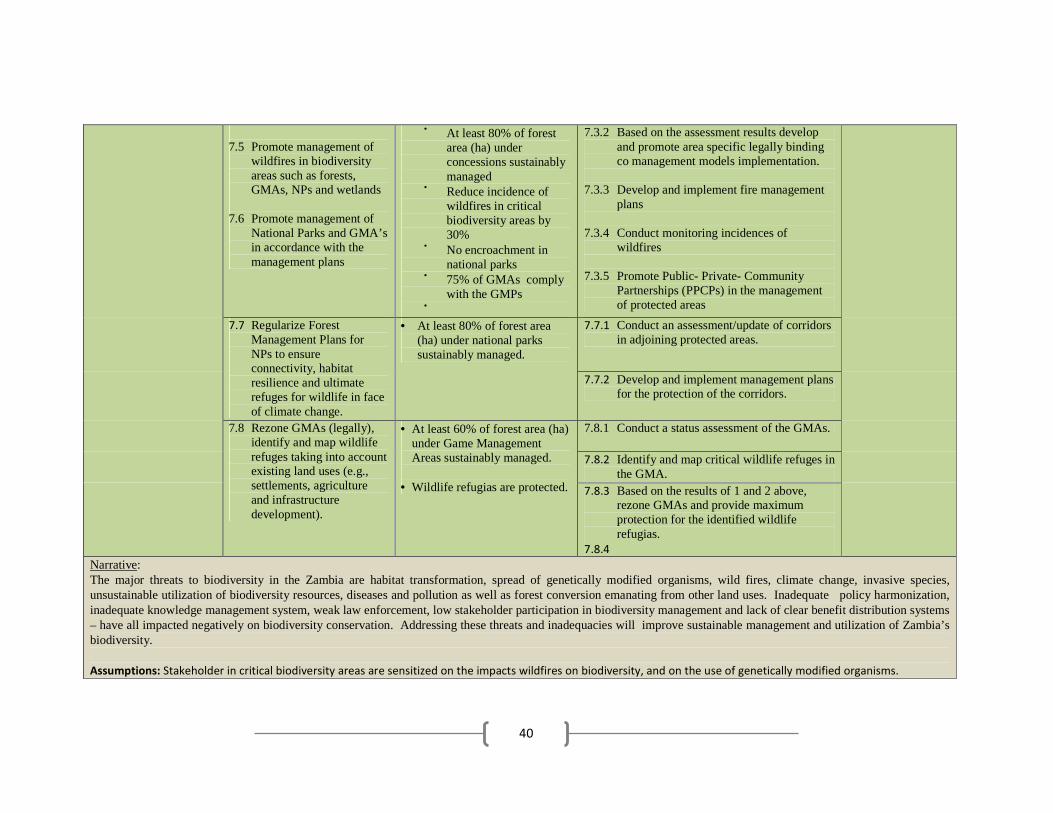
7. By 2025, areas under agriculture, aquaculture and forestry (forest reserves, parks, Game Management Areas, forest concessions, open areas) are managed sustainably, ensuring conservation of biodiversity.
MLNREP/MTA /MAL
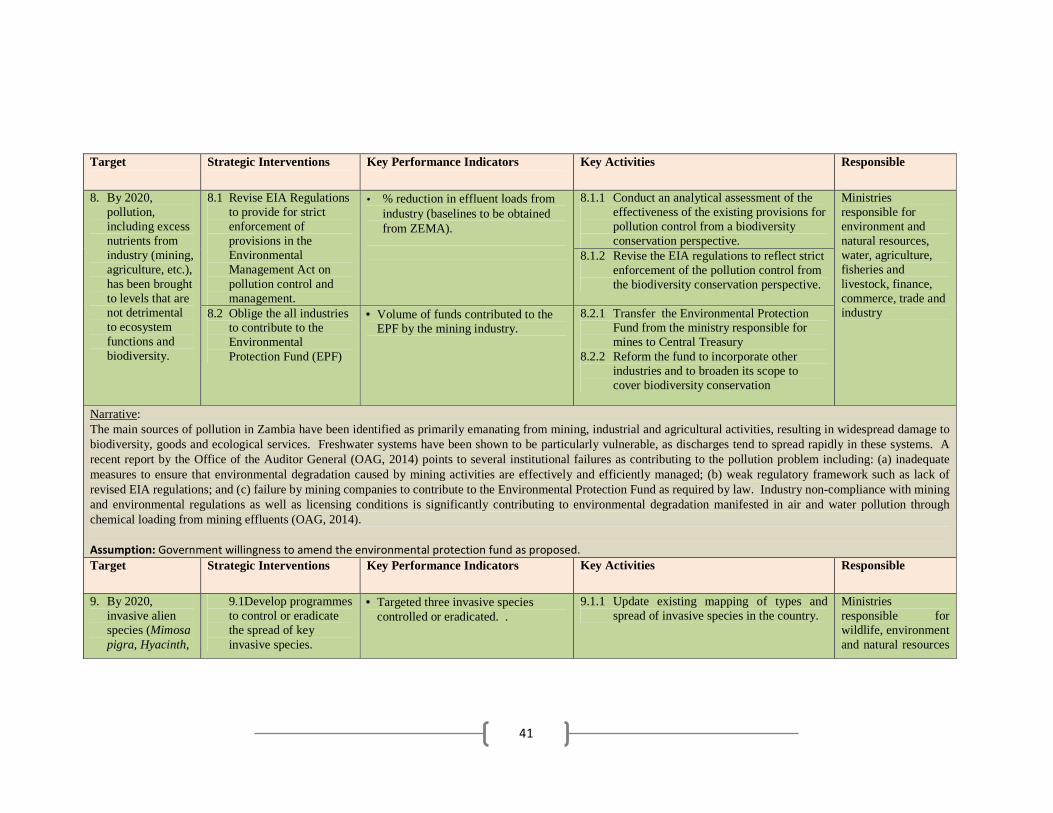
8. By 2020, pollution, including excess nutrients from industry (mining, agriculture, etc.), has been brought to levels that are not detrimental to ecosystem function and biodiversity.
MLNREP (ZEMA) /MEWD/ MA/MFL/MCTI
9. By 2020, invasive alien species (Mimosa pigra, Hyacinth, crayfish, and Lantana camara) and their spreading pathways are identified and prioritized, controlled or eradicated, and measures are in place to manage pathways to prevent their spread and establishment.
MTA/MLNREP (ZEMA), MFL, /MEWD/NHCC
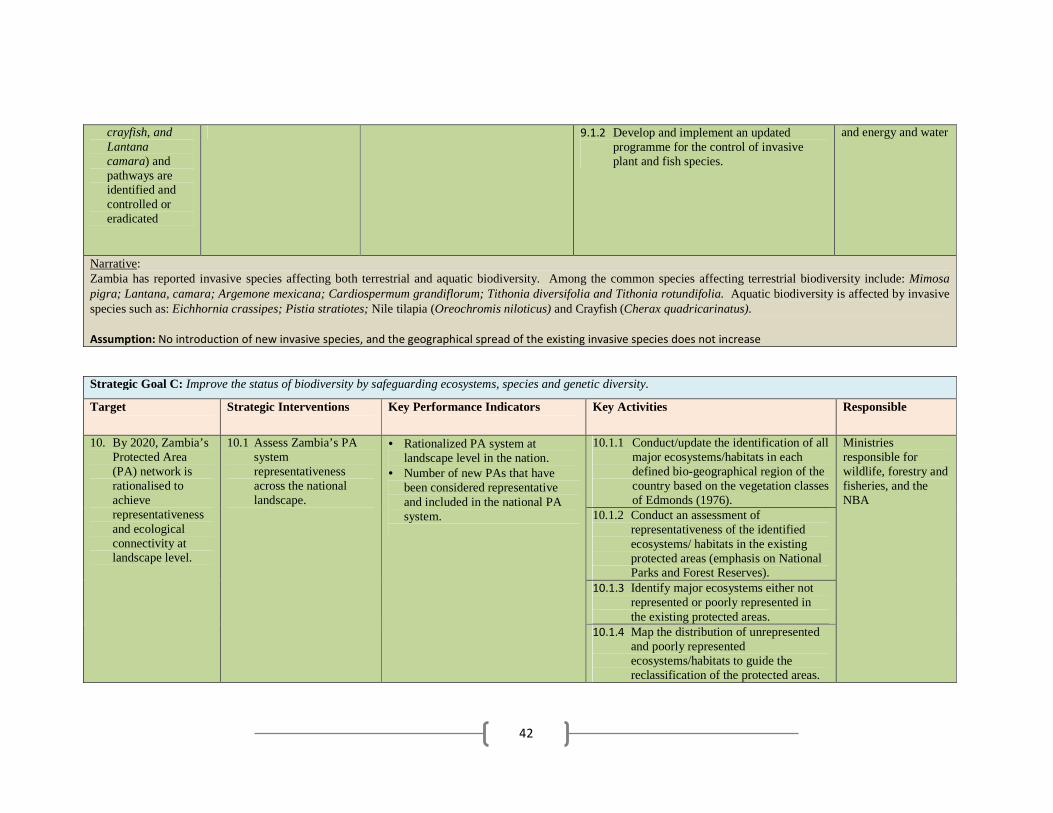
Strategic Goal C: Improve the status of biodiversity by safeguarding ecosystems, species and genetic diversity. 10. By 2020, Zambia’s Protected Area (PA) network is rationalized to achieve
representativeness and ecological connectivity at landscape level. MTA/MLNREP/ NHCC/MFL/ MOCTA
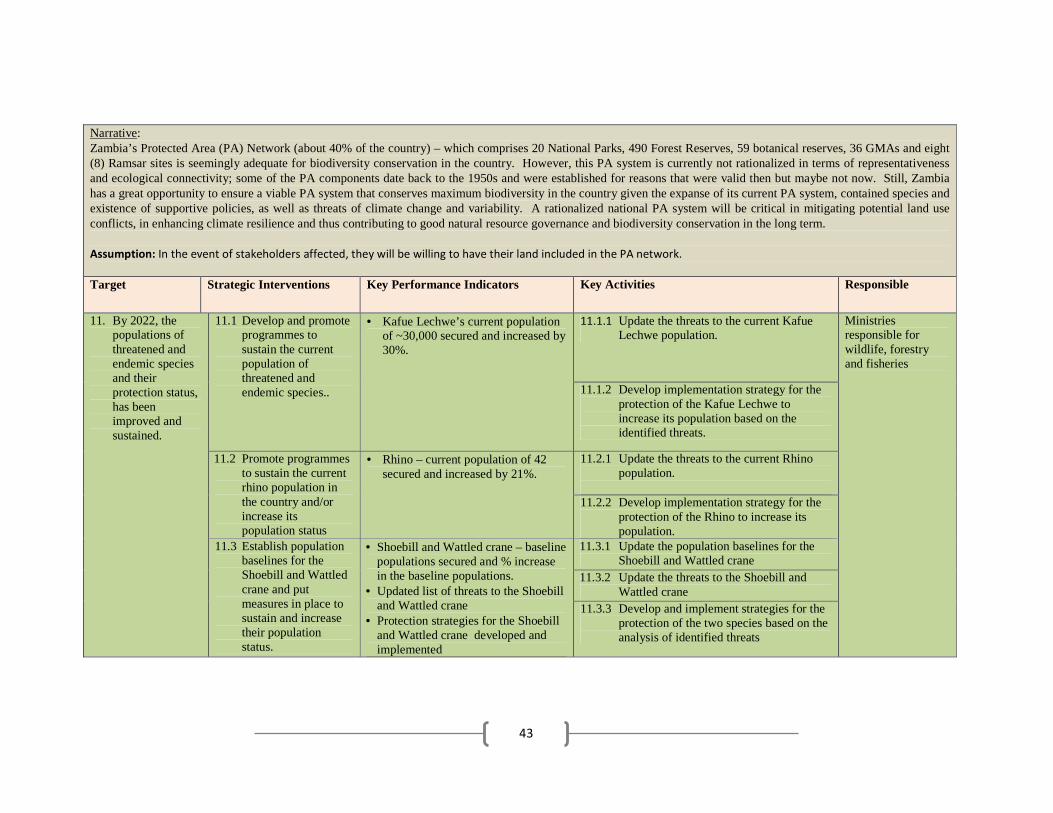
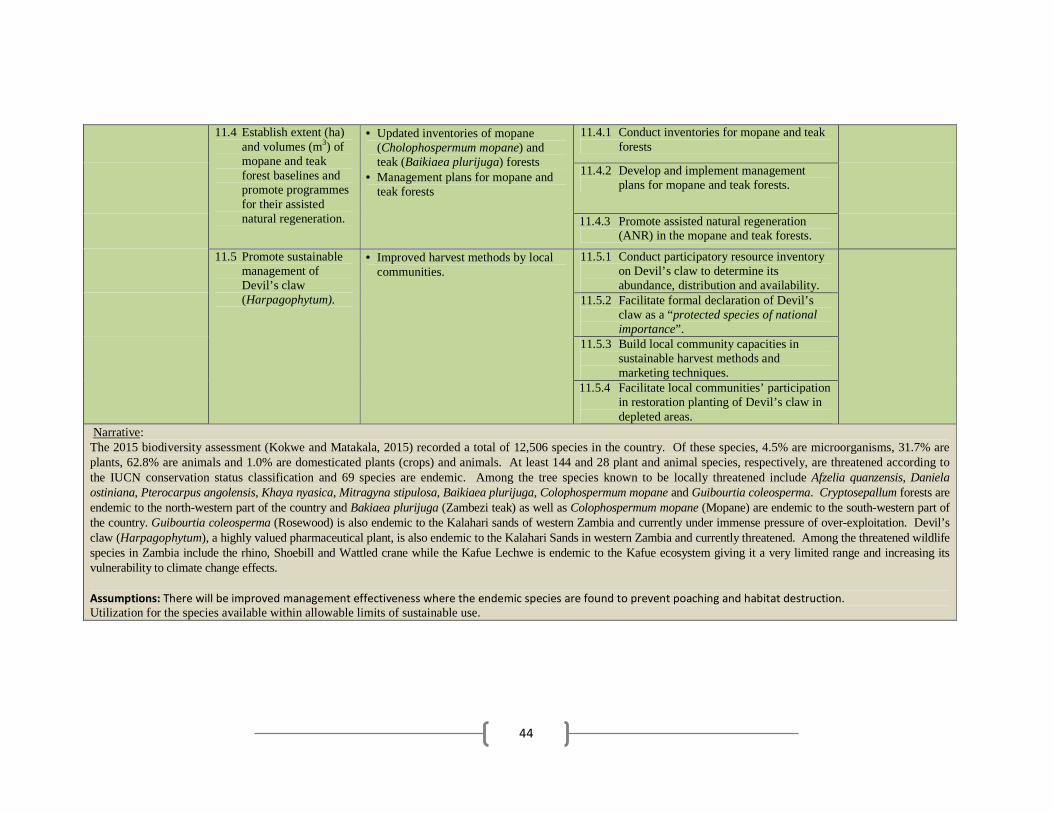
11. By 2022, the populations of threatened and endemic species and their protection status, has been improved and sustained.
MTA/MLNREP
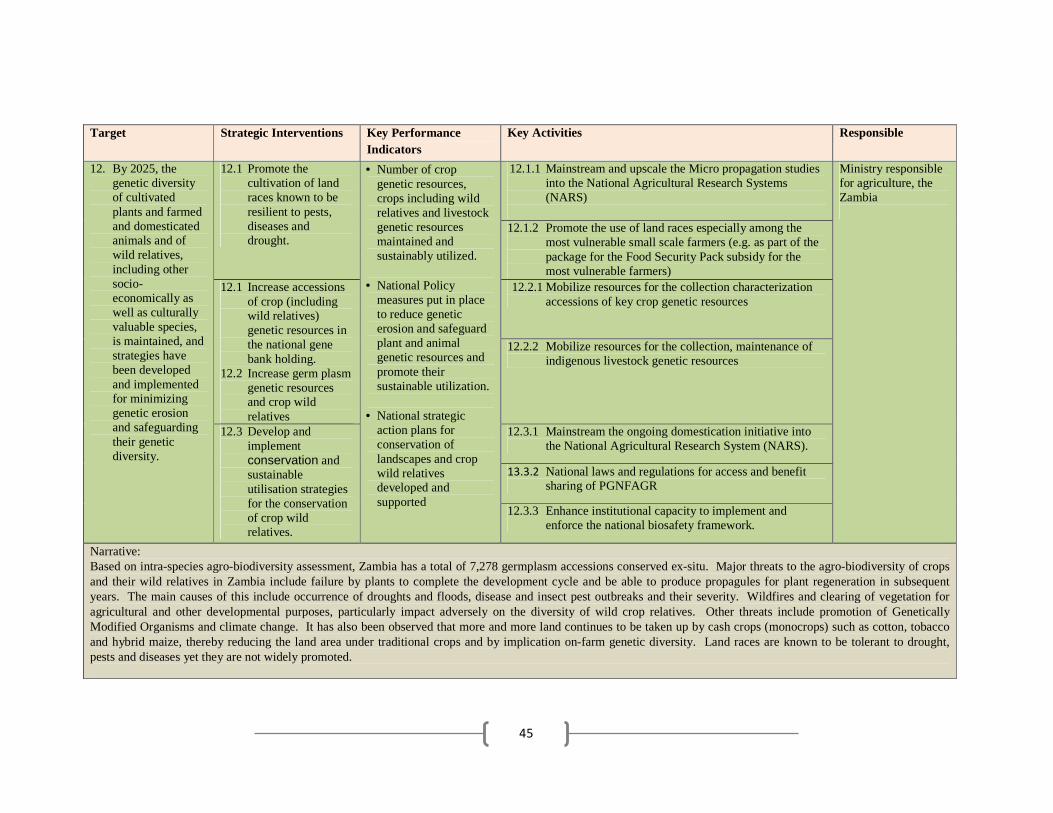
12. By 2025, the genetic diversity of cultivated plants and farmed and domesticated animals and of wild relatives, including other socio-economically as well as culturally valuable species, is maintained, and strategies have been developed and implemented for minimizing genetic erosion and safeguarding their genetic diversity.
MAL/ZARI/NBA/NSTC
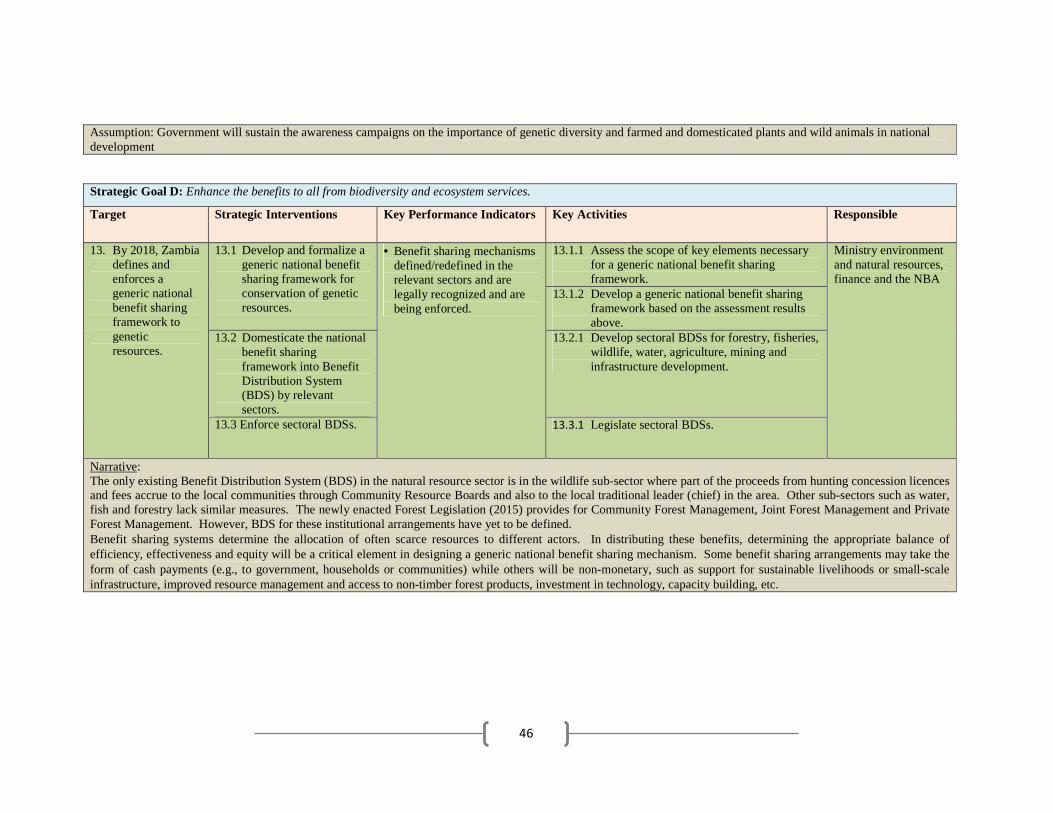
Strategic Goal D: Enhance the benefits to all from biodiversity and ecosystem services 13. By 2020, Zambia defines and enforces a generic national benefit sharing
mechanism to genetic resources. MLNREP/MOF/ MNP/NHCC/NBA/MFL
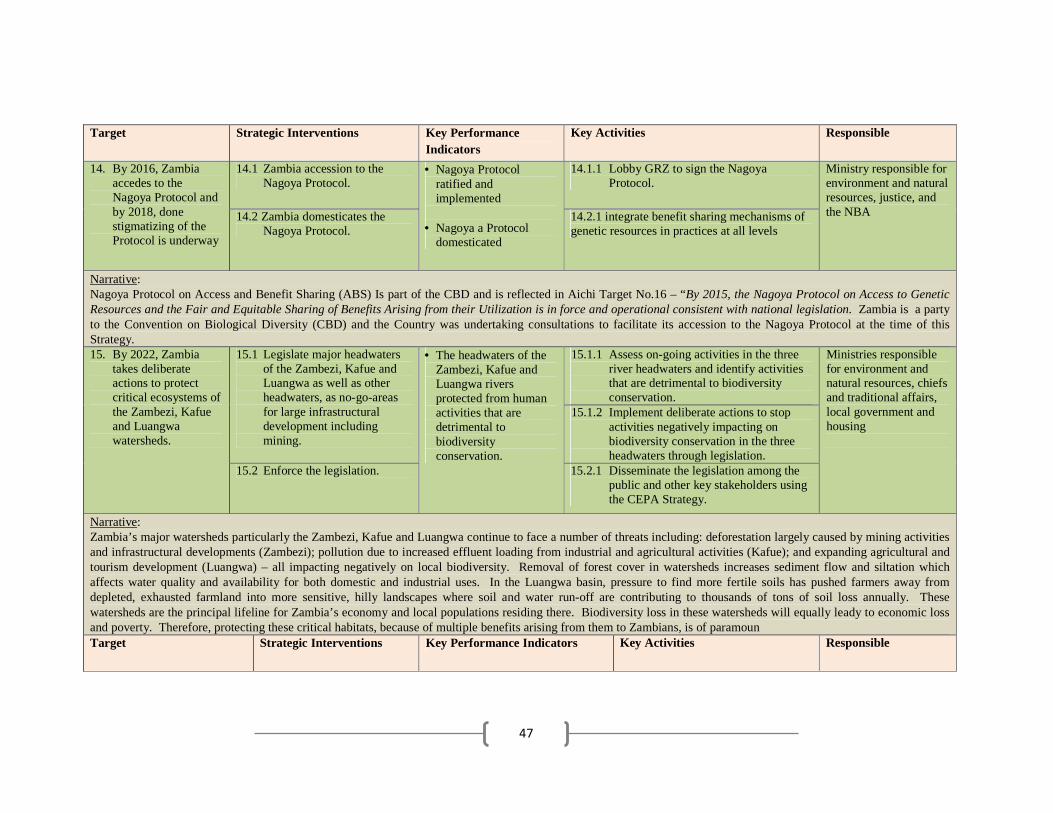
14. By 2016, Zambia accedes to the Nagoya Protocol and by 2018 domestication of the Nagoya Protocol is commenced.
MLNREP/MOJ
15. By 2025, Zambia takes deliberate actions to protect critical ecosystems of the Zambezi, Kafue, Chambeshi, Bangweulu and Luangwa watersheds.
MLNREP/MEWD/MOCTA/ MLGH/NHCC
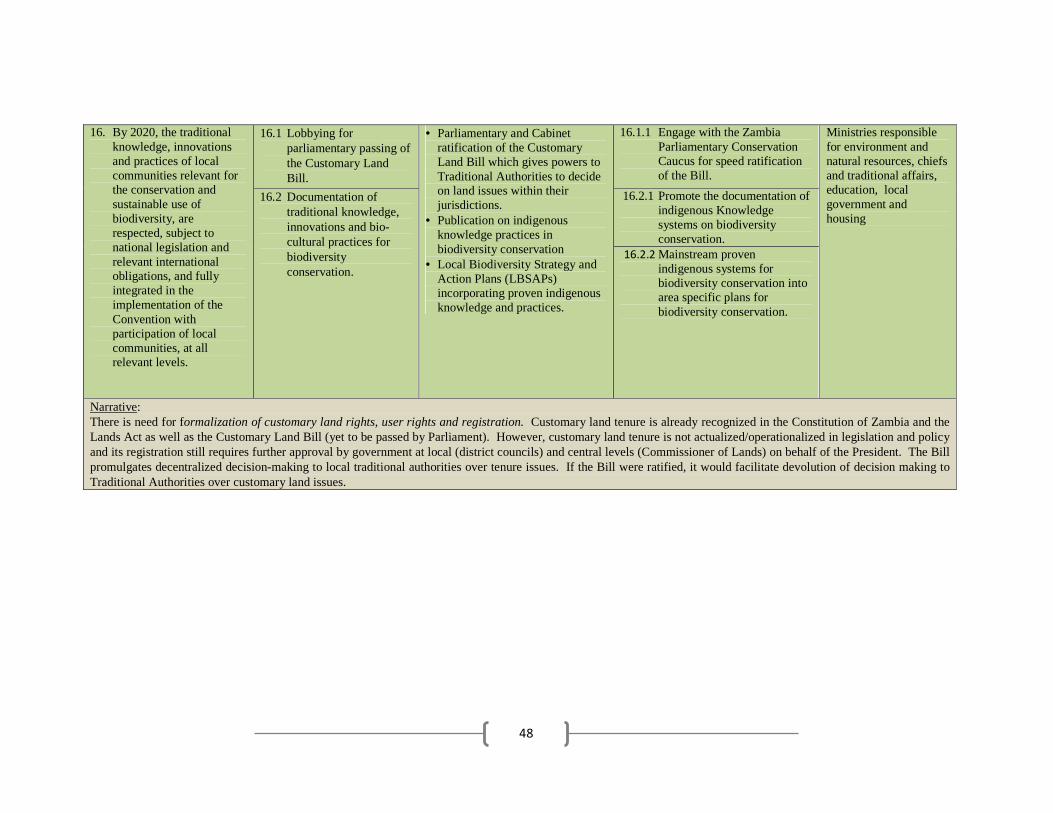
Strategic Goal E: Enhance implementation of NBSAP2 through participatory planning, knowledge management and capacity building 16. By 2020, the traditional knowledge, innovations and practices of local
communities relevant for the conservation and sustainable use of biodiversity are respected,fully integrated and reflected in the implementation of the Convention with the full and effective participation of local communities, at all relevant levels.
MLNREP/MOCTA/ MLGH
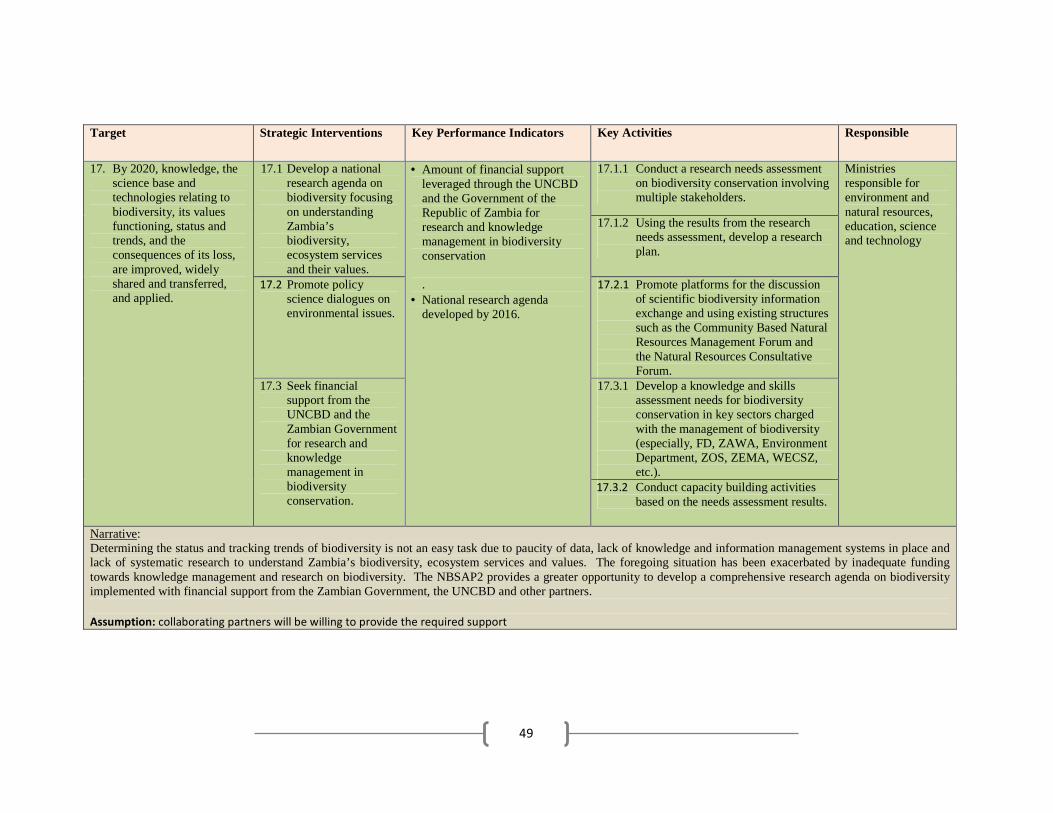
17. By 2020, knowledge, the science base and technologies relating to biodiversity, its functioning, status and trends, and the consequences of its loss, are improved, widely shared and transferred, and applied.
MLNREP/ MESVTEE/NSTC
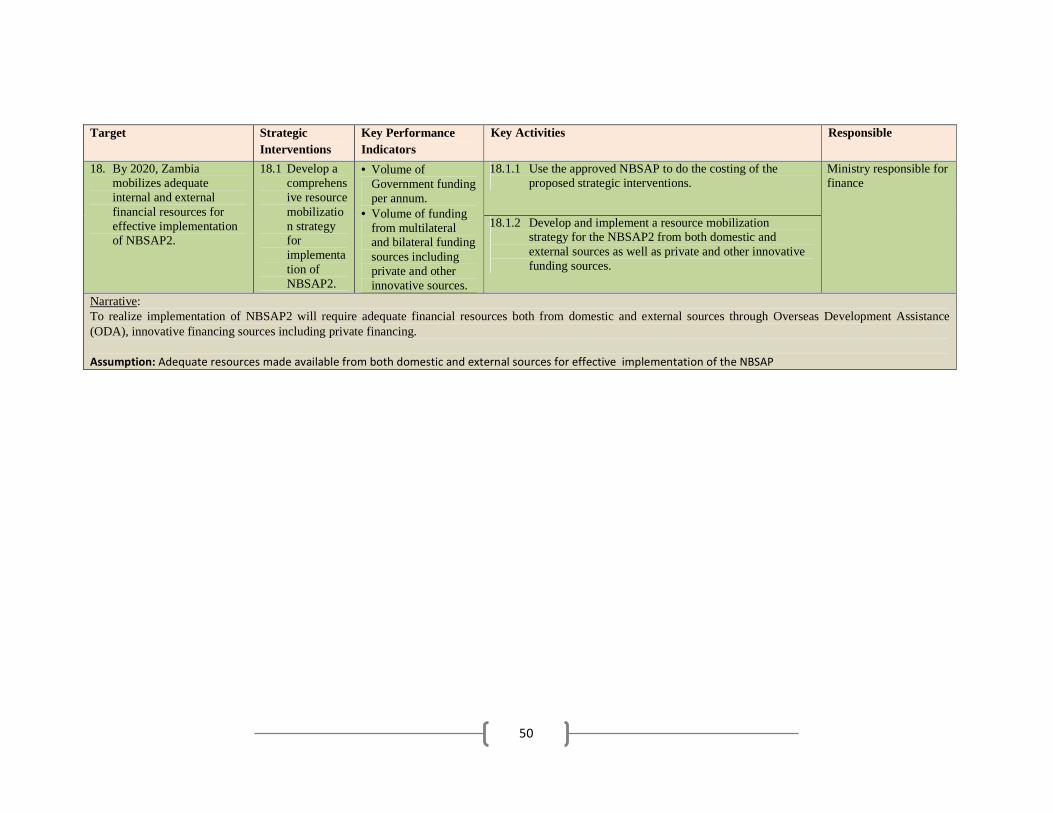
18. By 2025 Zambia mobilizes adequate internal and external financial resources compared to the period 1999 to 2014 for effective implementation of NBSAP2.
MOF/MLNREP/ MNP
vii
ACRONYMS AND ABBREVIATIONS
ABS Access Benefit Sharing
BDS
BWZ
Benefit Distribution System
Bird Watch Zambia
CBD Convention on Biological Diversity
CBNRMF Community Based Natural Resources Management Forum
CEPA Communications, Education and Public Awareness
CFM Community Forest Management
CHM Clearing House Mechanism
CITES Convention on International Trade in Endangered Species
COP Conference of the Parties
CpUE Catch per Unit Effort
CRB Community Resources Board
CSO Central Statistical Office
CSO Civil Society Organization
CWR Crop Wild Relative
DoF
EbA
Department of Fisheries
Ecosystem based Adptation
EIA Environmental Impact Assessment
EPF Environmental Protection Fund
FAO Food and Agriculture Organization of the United Nations
FD Forestry Department
FISP Farmer Input Support Programme
FNR Fifth National Report
FR Forest Reserve
GDP Gross Domestic Product
GEF Global Environmental Facility
GMA Game Management Area
GRZ Government of the Republic of Zambia
IBA Important Bird Area
ILUA Integrated Land Use Assessment
IPCC Intergovernmental Panel on Climate Change
IUCN World Conservation Union (formerly International Union for the
Conservation of Nature)
JFM Joint Forest Management
KA Key Activity
KPI Key Performance Indicator
LBSAP Local Biodiversity Strategy and Action Plan LF Local Forest
viii
LFA Logical Framework Analysis M&E Monitoring and Evaluation MA MIBS
Ministry of Agriculture Ministry of Information and Broadcasting Services
MCTI Ministry of Commerce, Trade and Industry METTPAZ
MGE
MHE
Management Effectiveness Tracking Tool for Protected Areas in Zambia Ministry of General Education
Ministry of Higher Education MLGH Ministry of Local Government and Housing MLNREP MNP
Ministry of Lands, Natural Resources and Environmental Protection Ministry of Development Planning
MEWD MFL
Ministry of Energy and Water Development Ministry of Fisheries and Livestock
MOCTA MOF MOJ
Ministry of Chiefs and Traditional Affairs Ministry of Finance Ministry of Justice
MTA Ministry of Tourism and Arts NARS National Agricultural Research System NBSAP NBA NHCC
National Biodiversity Strategy and Action Plan National Biosafety Authority National Heritage Conservation Commission
NP National Park NPIF Nagoya Protocol Implementation Fund NRCF NSTC
Natural Resources Consultative Forum National Science and Technology Council
OAG Office of the Auditor General PA Protected Area PET Potential Evapo-transpiration PFM Private Forest Management REDD+ Reducing Emissions from Deforestation and Forest Degradation,
Conservation, Enhancement of Carbon Stocks and Sustainable Management of Forests
SABONET Southern African Botanical Biodiversity Network SEA Strategic Environmental Assessment SeNDP Seventh National Development Plan SFM UNCBD
Sustainable Forest Management United Nations Convention on Biological Diversity
UNDP United Nations Development Programme UNEP United Nations Environment Programme UNFCCC United Nations Framework Convention on Climate Change WECSZ WWF
Wildlife and Environmental Conservation Society of Zambia Worldwide Fund for Nature
FOREWORD .......................................................................................................................................... ii
PREFACE .............................................................................................................................................. iii ACKNOWLEDGEMENTS ................................................................................................................... iv
EXECUTIVE SUMMARY .................................................................................................................... v
ACRONYMS AND ABBREVIATIONS ............................................................................................. vii
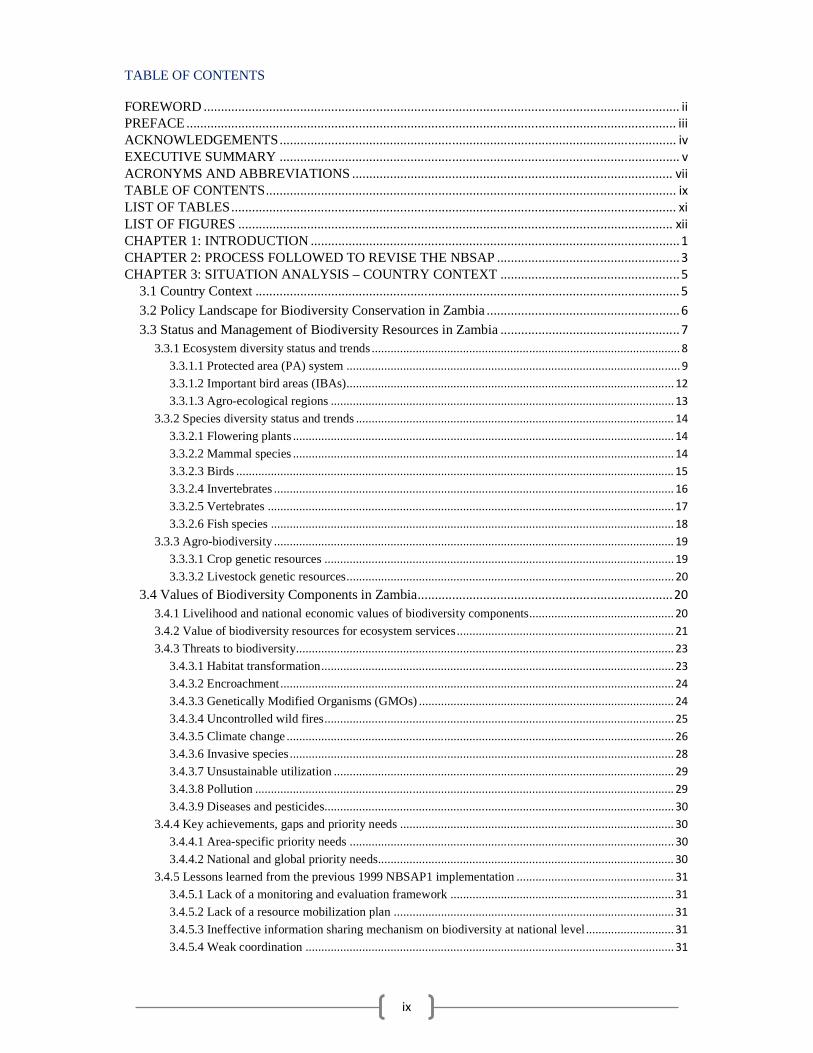
TABLE OF CONTENTS ....................................................................................................................... ix
LIST OF TABLES ................................................................................................................................. xi
LIST OF FIGURES .............................................................................................................................. xii
3.3.2.6 Fish species ................................................................................................................................ 18
Annex 1: CBD Strategic Goals and Aichi Targets ........................................................................... 67
xi
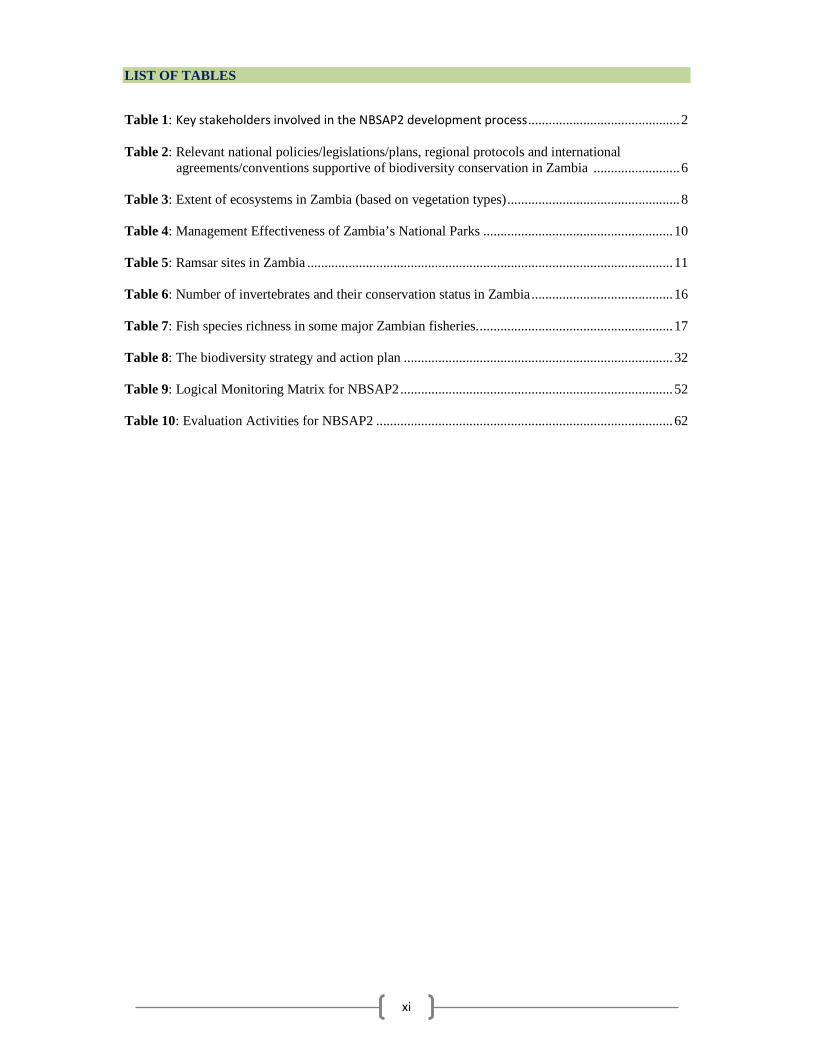
LIST OF TABLES
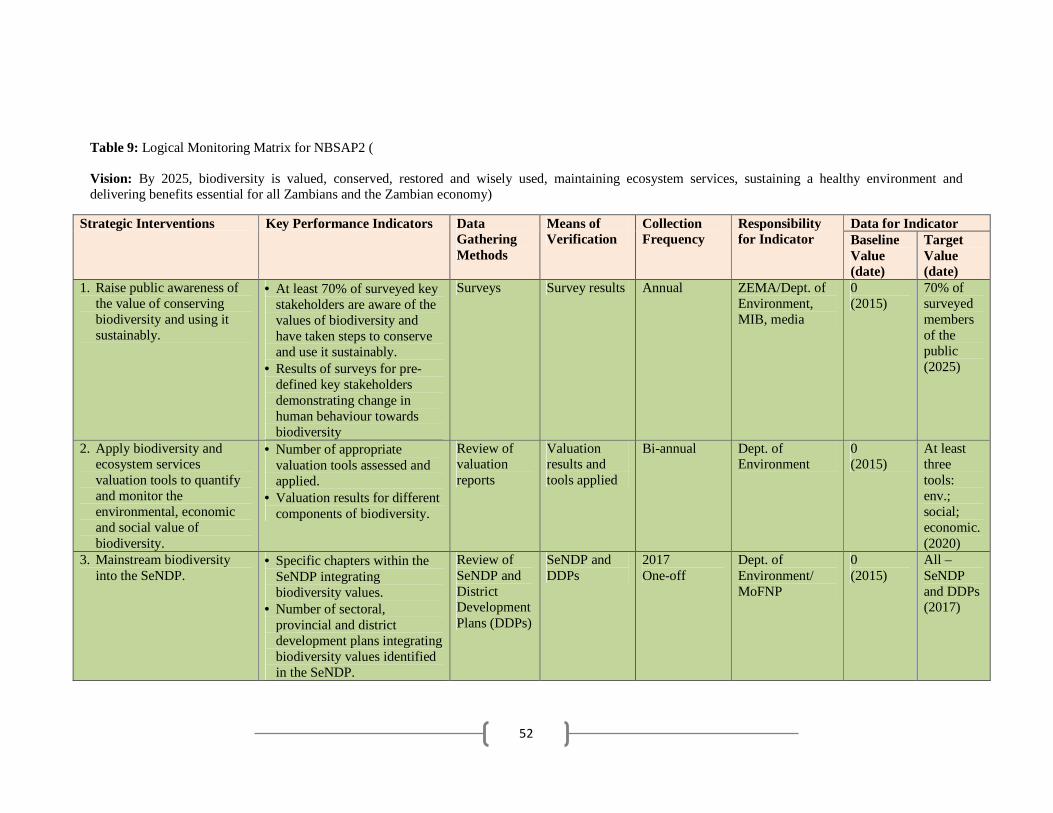
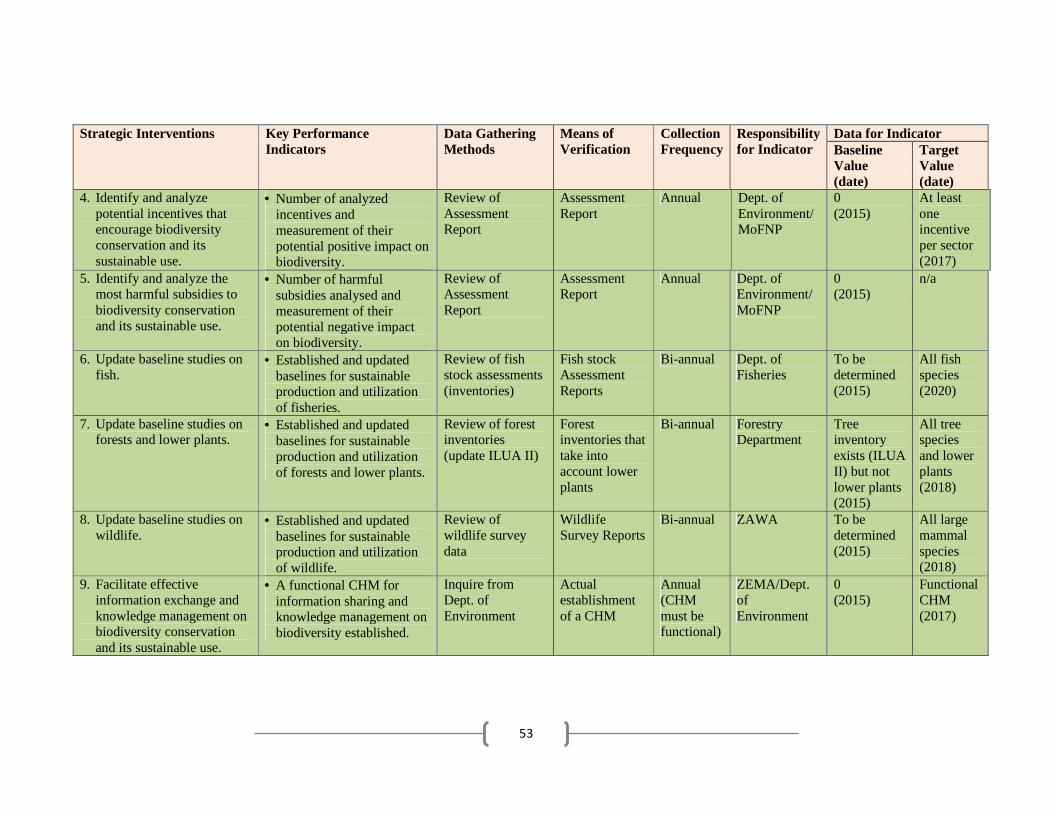
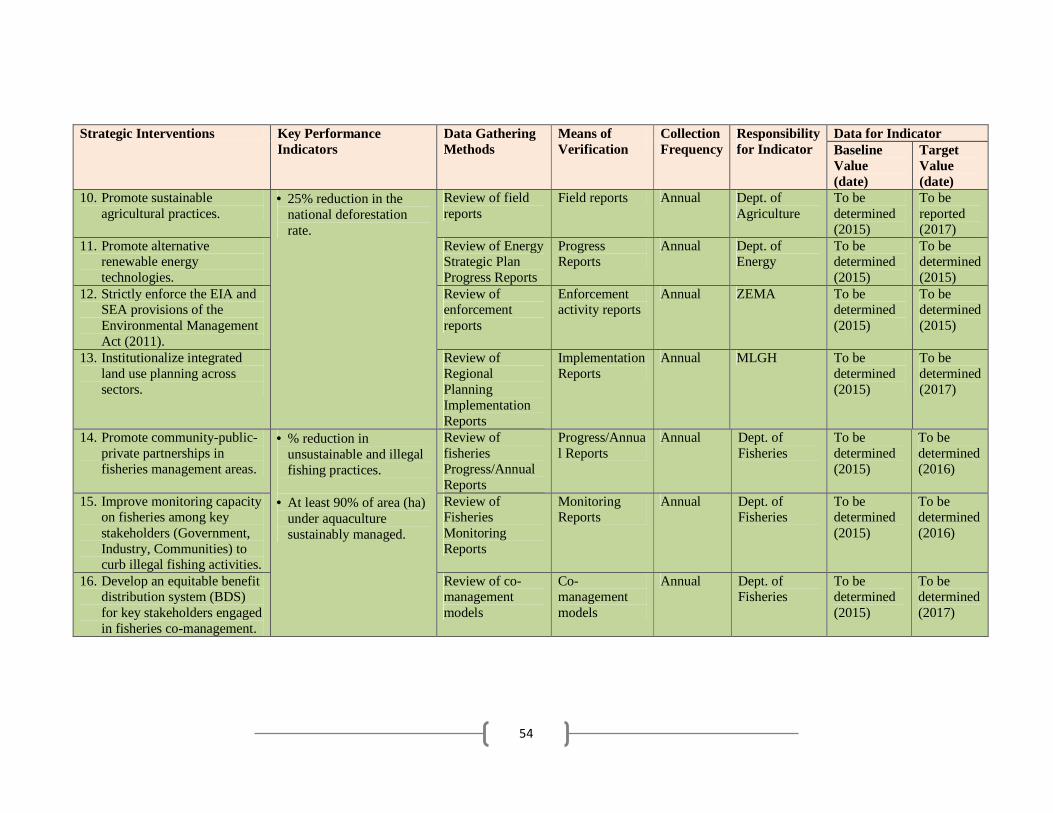
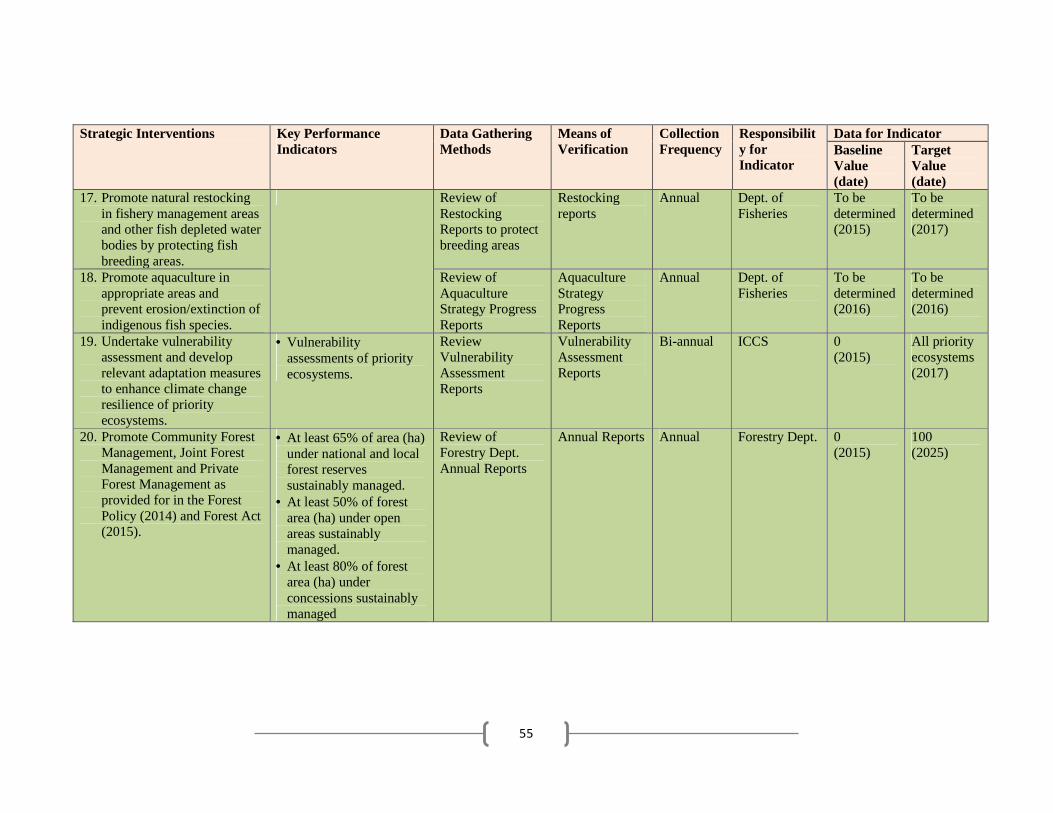
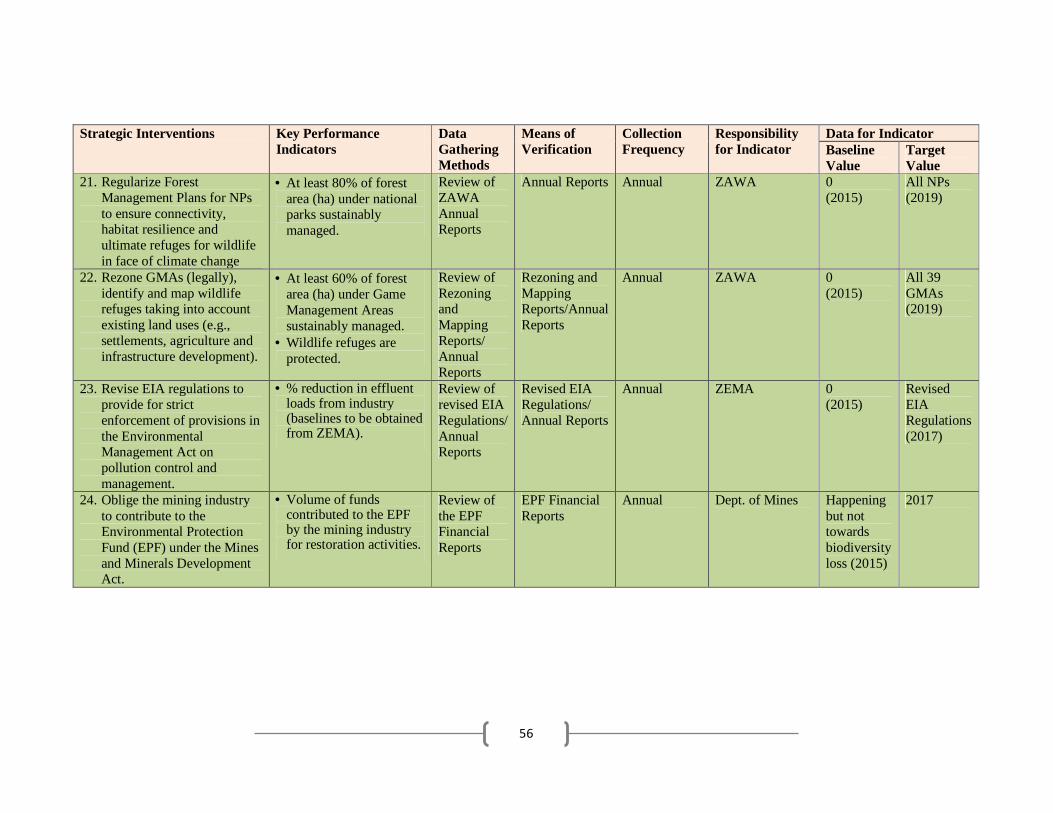
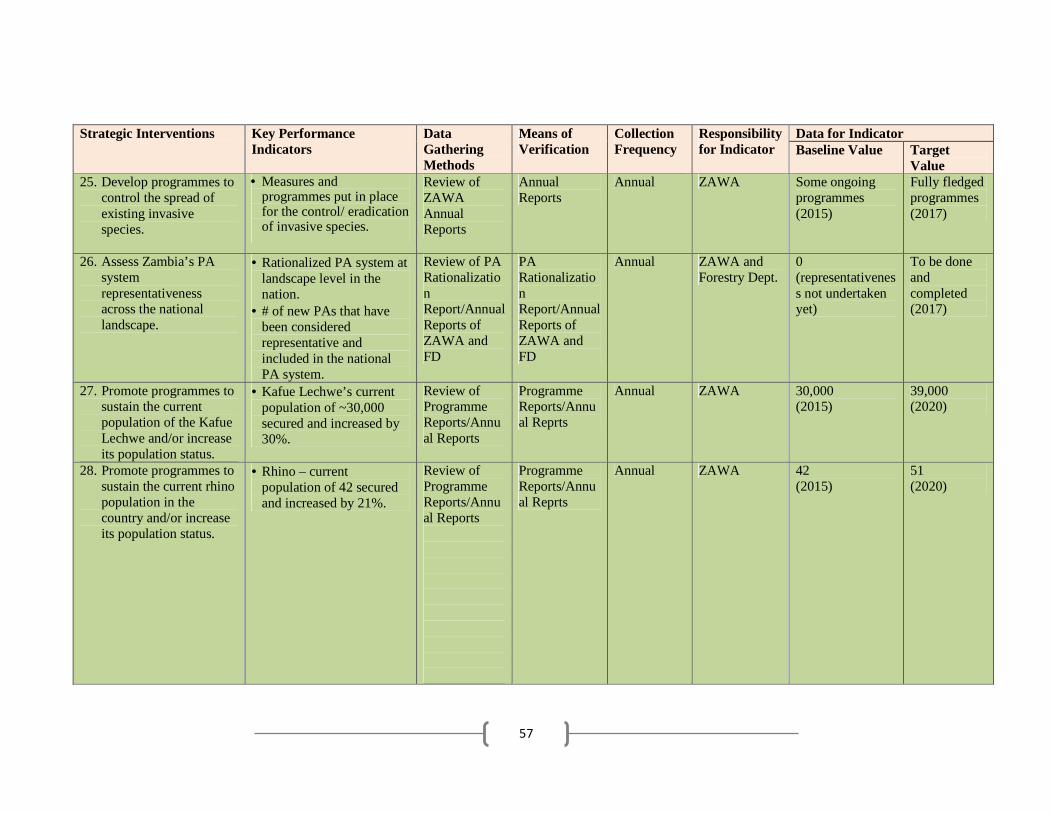
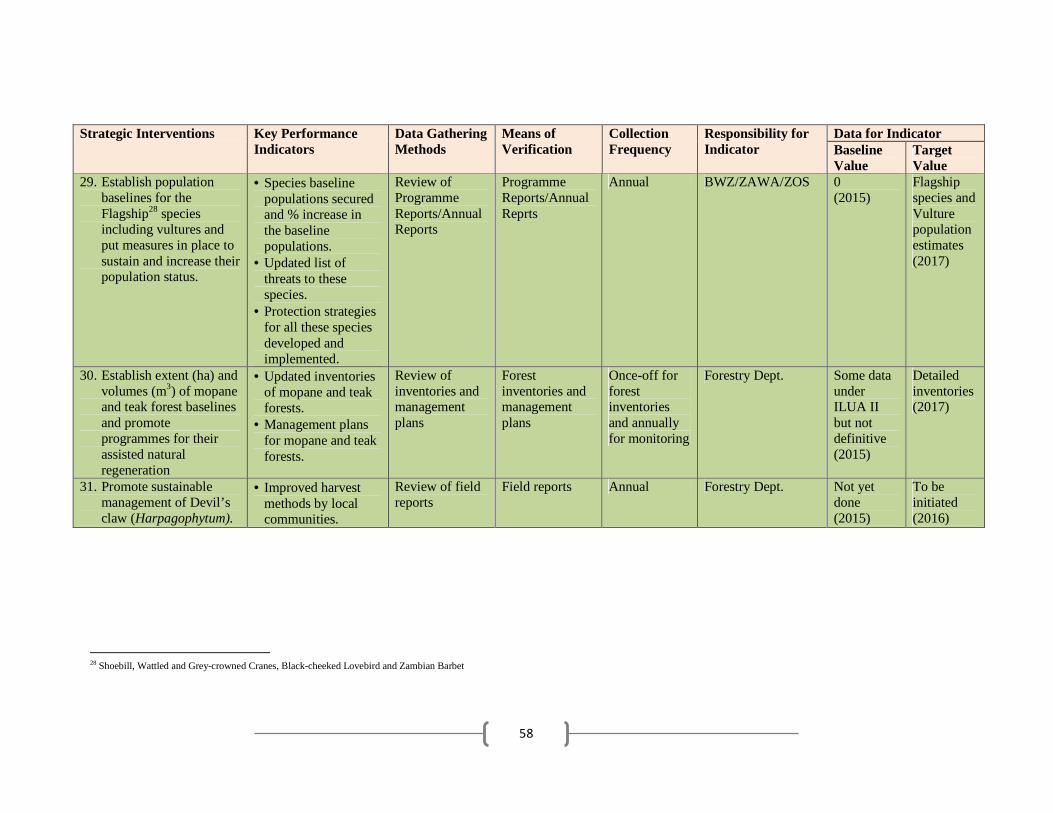
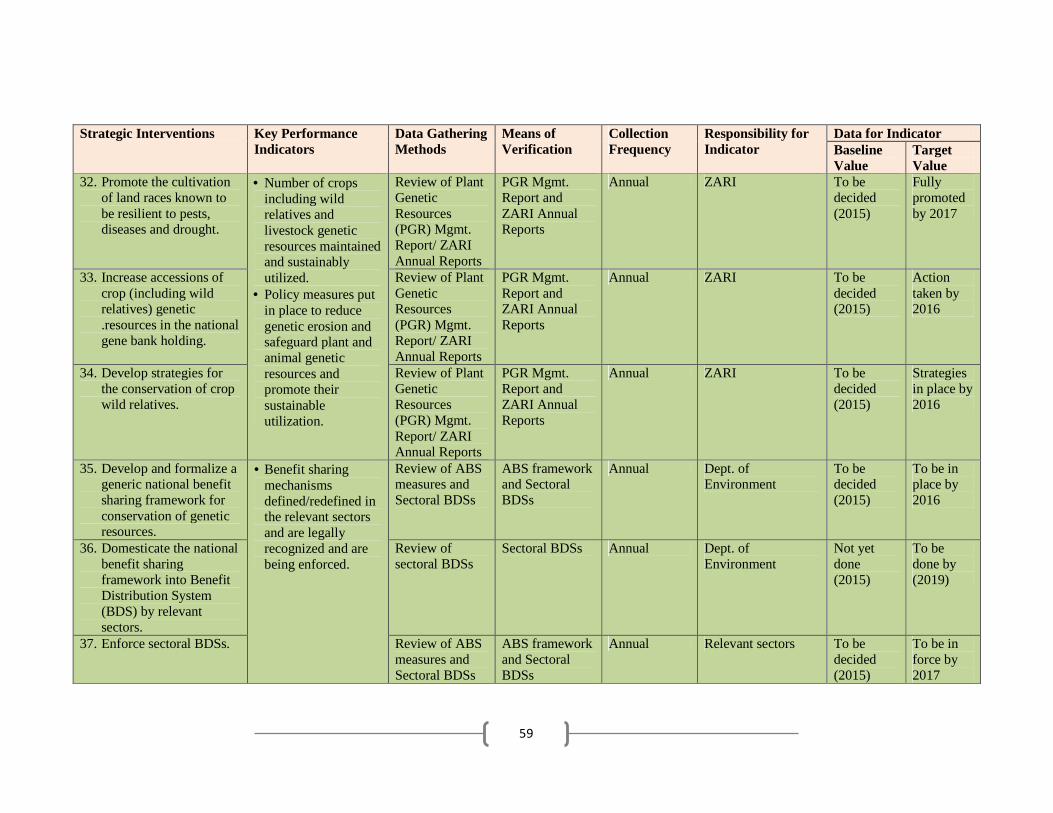
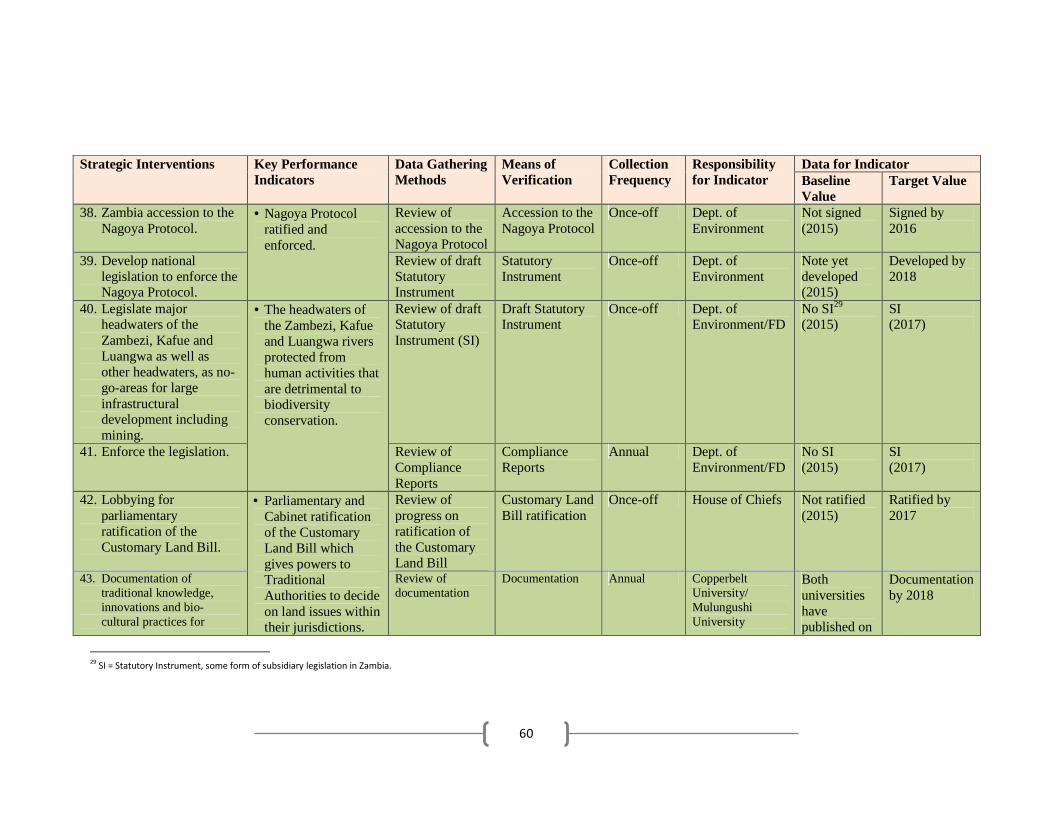
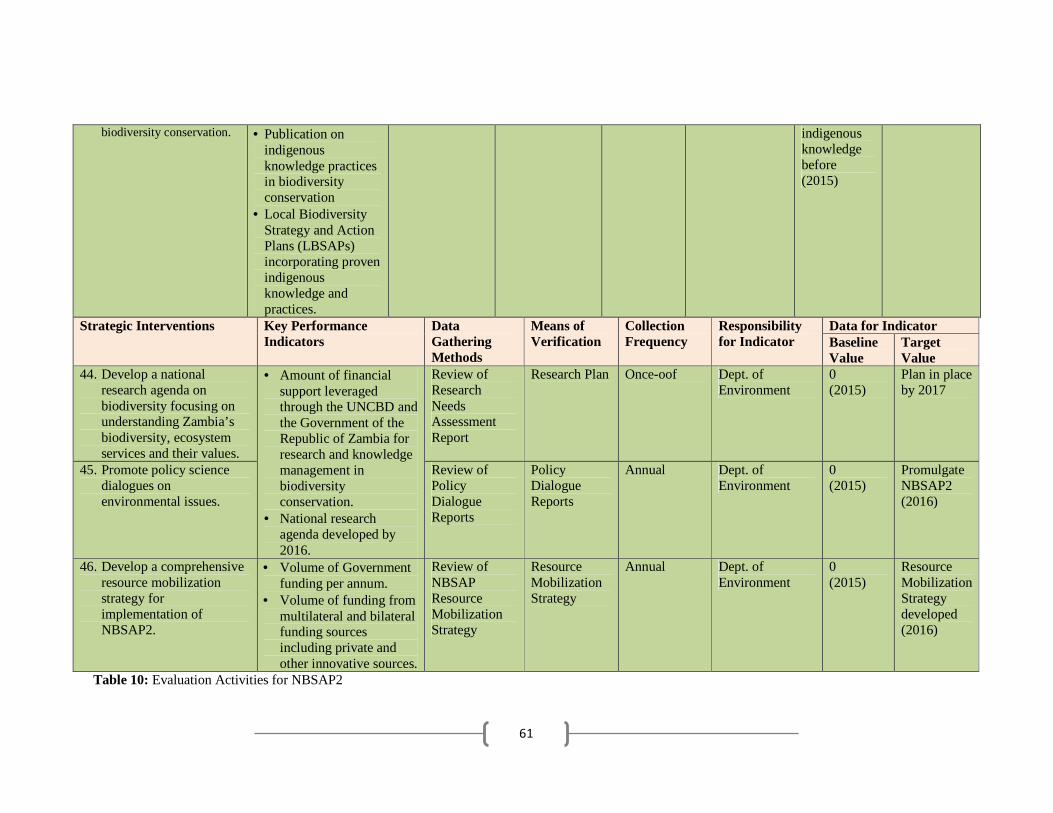
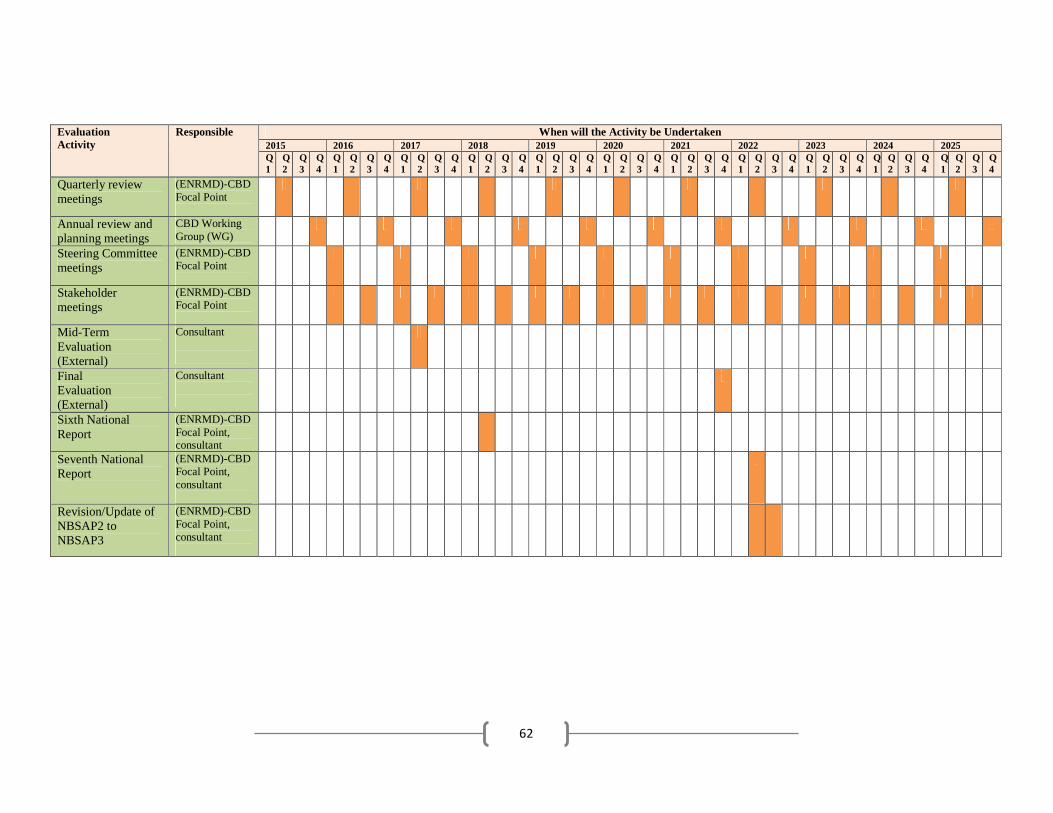
Table 1: Key stakeholders involved in the NBSAP2 development process ............................................ 2 Table 2: Relevant national policies/legislations/plans, regional protocols and international agreements/conventions supportive of biodiversity conservation in Zambia ......................... 6 Table 3: Extent of ecosystems in Zambia (based on vegetation types) .................................................. 8 Table 4: Management Effectiveness of Zambia’s National Parks ....................................................... 10 Table 5: Ramsar sites in Zambia .......................................................................................................... 11 Table 6: Number of invertebrates and their conservation status in Zambia ......................................... 16 Table 7: Fish species richness in some major Zambian fisheries. ........................................................ 17 Table 8: The biodiversity strategy and action plan .............................................................................. 32 Table 9: Logical Monitoring Matrix for NBSAP2 ............................................................................... 52 Table 10: Evaluation Activities for NBSAP2 ...................................................................................... 62
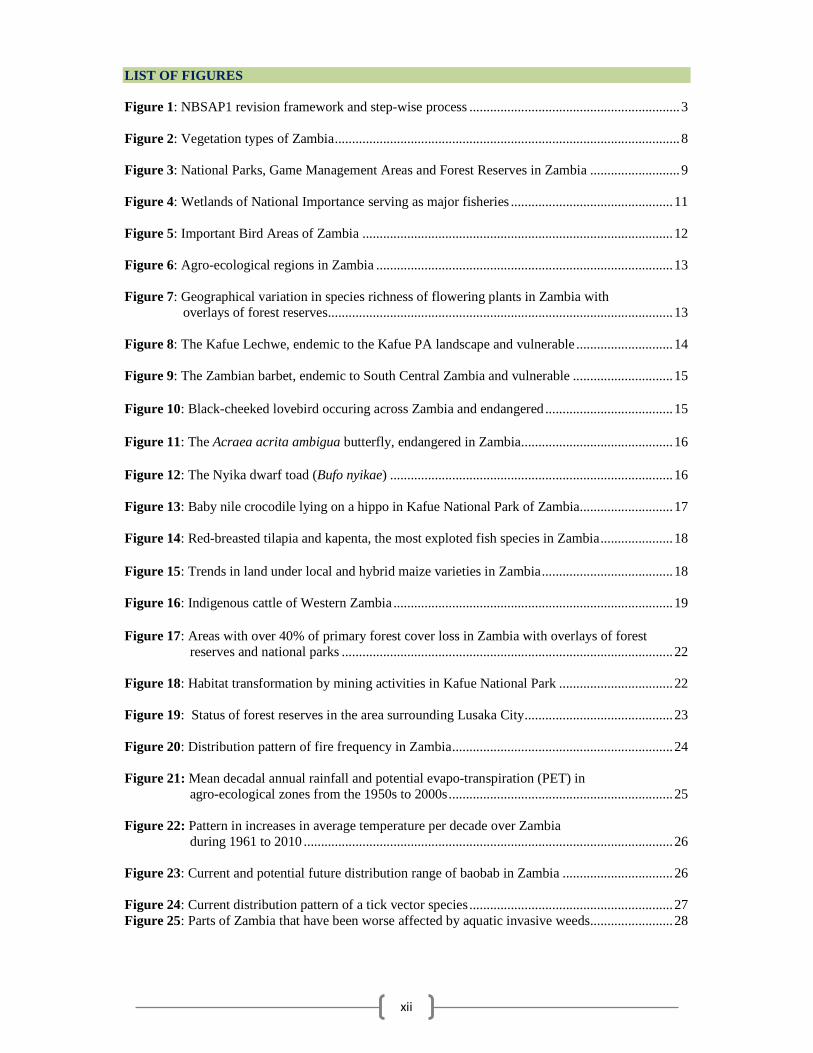
xii
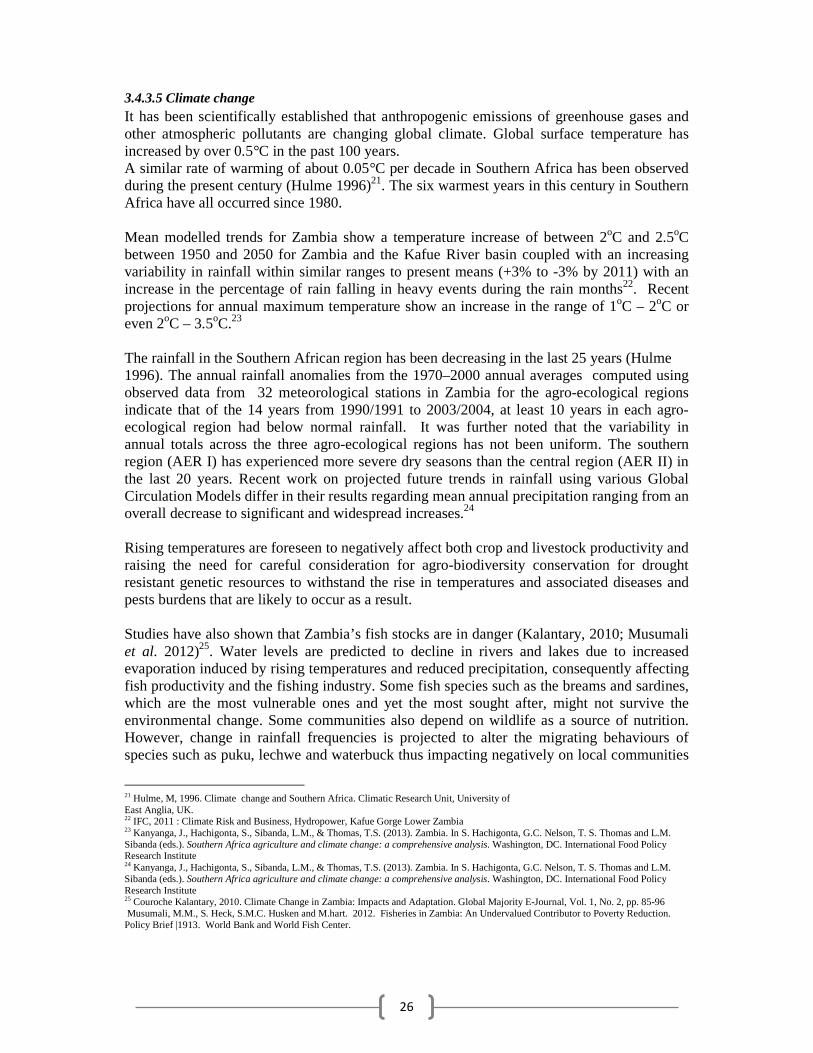
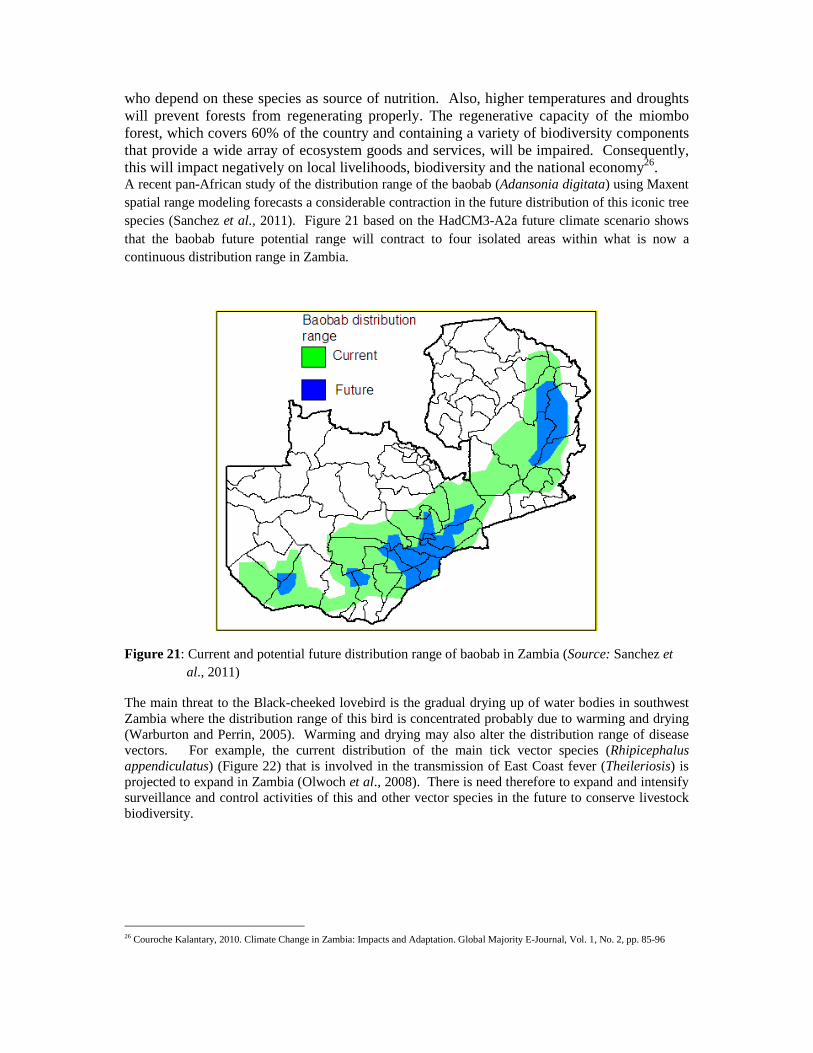
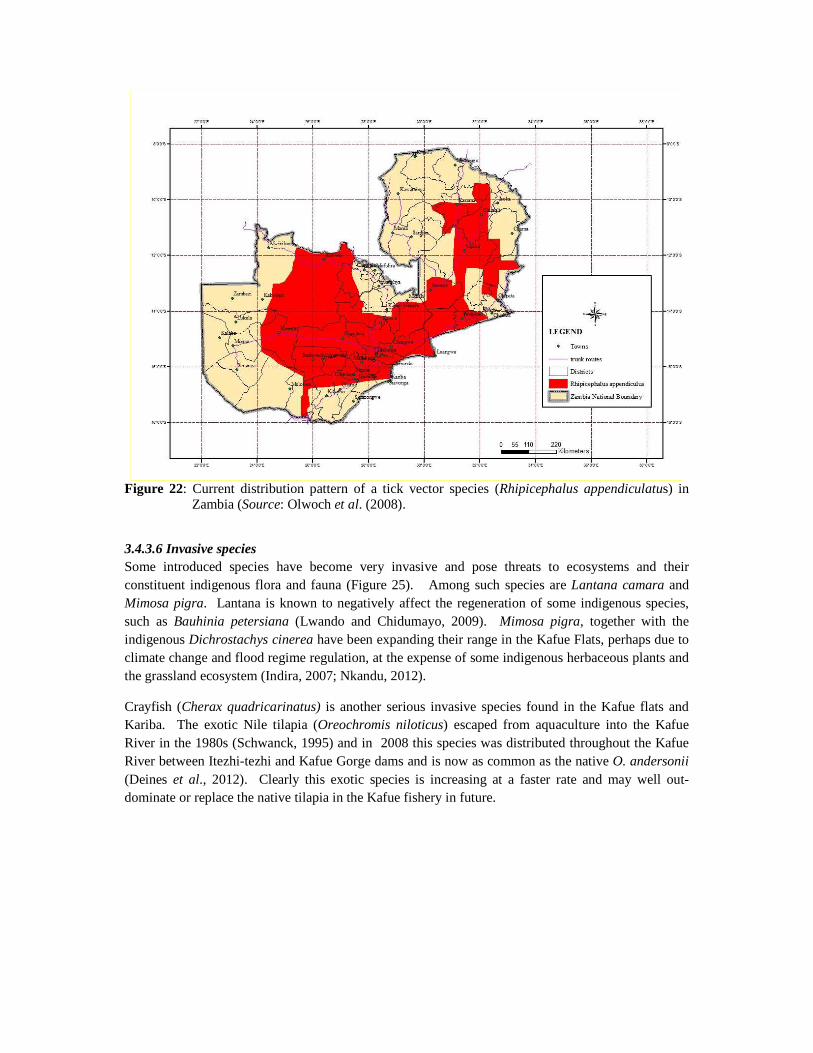
LIST OF FIGURES Figure 1: NBSAP1 revision framework and step-wise process ............................................................. 3 Figure 2: Vegetation types of Zambia .................................................................................................... 8 Figure 3: National Parks, Game Management Areas and Forest Reserves in Zambia .......................... 9 Figure 4: Wetlands of National Importance serving as major fisheries ............................................... 11 Figure 5: Important Bird Areas of Zambia .......................................................................................... 12 Figure 6: Agro-ecological regions in Zambia ...................................................................................... 13 Figure 7: Geographical variation in species richness of flowering plants in Zambia with overlays of forest reserves.................................................................................................... 13 Figure 8: The Kafue Lechwe, endemic to the Kafue PA landscape and vulnerable ............................ 14 Figure 9: The Zambian barbet, endemic to South Central Zambia and vulnerable ............................. 15 Figure 10: Black-cheeked lovebird occuring across Zambia and endangered ..................................... 15 Figure 11: The Acraea acrita ambigua butterfly, endangered in Zambia ............................................ 16 Figure 12: The Nyika dwarf toad (Bufo nyikae) .................................................................................. 16 Figure 13: Baby nile crocodile lying on a hippo in Kafue National Park of Zambia........................... 17 Figure 14: Red-breasted tilapia and kapenta, the most exploted fish species in Zambia ..................... 18 Figure 15: Trends in land under local and hybrid maize varieties in Zambia ...................................... 18 Figure 16: Indigenous cattle of Western Zambia ................................................................................. 19 Figure 17: Areas with over 40% of primary forest cover loss in Zambia with overlays of forest reserves and national parks ................................................................................................ 22 Figure 18: Habitat transformation by mining activities in Kafue National Park ................................. 22 Figure 19: Status of forest reserves in the area surrounding Lusaka City ........................................... 23 Figure 20: Distribution pattern of fire frequency in Zambia ................................................................ 24 Figure 21: Mean decadal annual rainfall and potential evapo-transpiration (PET) in agro-ecological zones from the 1950s to 2000s ................................................................. 25 Figure 22: Pattern in increases in average temperature per decade over Zambia during 1961 to 2010 ........................................................................................................... 26 Figure 23: Current and potential future distribution range of baobab in Zambia ................................ 26 Figure 24: Current distribution pattern of a tick vector species ........................................................... 27 Figure 25: Parts of Zambia that have been worse affected by aquatic invasive weeds........................ 28
1
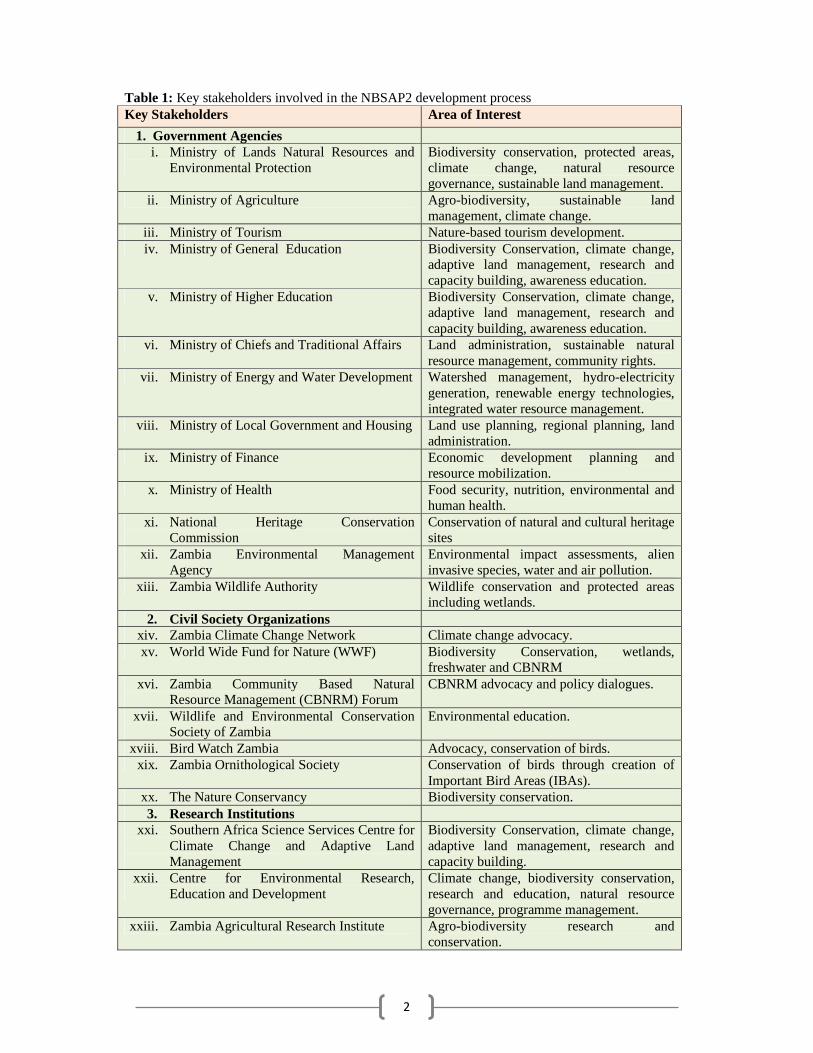
CHAPTER 1: INTRODUCTION National Biodiversity Strategies and Action Plans (NBSAPs) are the principal instruments for implementing the Convention on Biodiversity (CBD) at the national level as stipulated in Article 6 of the CBD. The Convention requires Parties to prepare a national biodiversity strategy (or equivalent instrument) and to ensure that biodiversity and the strategy are mainstreamed into the planning and activities of all those sectors whose activities can have an impact (positive and negative) on biodiversity. As a signatory to the CBD, Zambia developed its first Strategy in 1999 in conformity with Article 6 of the CBD. During the Tenth Session of the Conference of Parties (COP 10) to the CBD, Parties agreed to translate the Strategic Plan on Biodiversity 2011-2020 and it’s Aichi Targets into national actions through revision and/or updating of national biodiversity strategies and action plans. Additionally, it was agreed that the fifth national country reports should focus on the implementation of the Strategic Plan and report on progress towards achieving the Aichi targets. The Government of the Republic of Zambia, with support from the Global Environment Facility (GEF) through the United Nations Environment Programme (UNEP), embarked on reviewing the 1999 National Biodiversity Strategy and Action Plan (NBSAP1) in 2014. The revision of the NBSAP1 was not only to bring it within the current national development paradigm, including Vision 20301 and the medium term development plans including the Revised National Development Plan (R-SNDP) and its successor the Seventh National Development Plan (SeNDP), but it was also intended to reflect the international biodiversity framework under the Convention especially the Strategic Plan on Biodiversity 2011-2020 and its Aichi Targets as well as the post 2015 development agenda and sustainable development goals. Therefore, Zambia’s NBSAP2 is totally aligned with the Strategic Plan on Biodiversity 2011-2020 and its Aichi Targets as well as the Post-2015 Sustainable Development Goals (SDGs). The Government, through the Ministry of Lands, Natural Resources and Environmental Protection (MLNREP) spearhead the revision of the NBSAP1 and preparation of the Fifth National Report. The Fifth National Report was submitted to the CBD Secretariat in June 2015. The revision of the NBSAP1 involved a broad consultative process at national and provincial levels to ascertain Zambia’s priorities for biodiversity conservation. This strategy, NBSAP2, is a product of inputs from various stakeholders and analytical work on the various components of Zambia’s biodiversity. Stakeholders included relevant line ministries, statutory bodies, civil society and research organizations. Table 1 shows the list of key stakeholders involved in the NBSAP1 revision process and their main interests.
1 Vision 2030 (2006-2030) aims at ensuring Zambia becomes a prosperous middle income nation by 2030
2
Table 1: Key stakeholders involved in the NBSAP2 development process Key Stakeholders Area of Interest
1. Government Agencies i. Ministry of Lands Natural Resources and
ii. Ministry of Agriculture Agro-biodiversity, sustainable land management, climate change.
iii. Ministry of Tourism Nature-based tourism development. iv. Ministry of General Education Biodiversity Conservation, climate change,
adaptive land management, research and capacity building, awareness education.
v. Ministry of Higher Education Biodiversity Conservation, climate change, adaptive land management, research and capacity building, awareness education.
vi. Ministry of Chiefs and Traditional Affairs Land administration, sustainable natural resource management, community rights.
vii. Ministry of Energy and Water Development Watershed management, hydro-electricity generation, renewable energy technologies, integrated water resource management.
viii. Ministry of Local Government and Housing Land use planning, regional planning, land administration.
ix. Ministry of Finance Economic development planning and resource mobilization.
x. Ministry of Health Food security, nutrition, environmental and human health.
xi. National Heritage Conservation Commission
Conservation of natural and cultural heritage sites
xii. Zambia Environmental Management Agency
Environmental impact assessments, alien invasive species, water and air pollution.
xiii. Zambia Wildlife Authority Wildlife conservation and protected areas including wetlands.
2. Civil Society Organizations xiv. Zambia Climate Change Network Climate change advocacy. xv. World Wide Fund for Nature (WWF) Biodiversity Conservation, wetlands,
freshwater and CBNRM xvi. Zambia Community Based Natural
Resource Management (CBNRM) Forum CBNRM advocacy and policy dialogues.
xvii. Wildlife and Environmental Conservation Society of Zambia
Environmental education.
xviii. Bird Watch Zambia Advocacy, conservation of birds. xix. Zambia Ornithological Society Conservation of birds through creation of
Important Bird Areas (IBAs). xx. The Nature Conservancy Biodiversity conservation. 3. Research Institutions
xxi. Southern Africa Science Services Centre for Climate Change and Adaptive Land Management
Biodiversity Conservation, climate change, adaptive land management, research and capacity building.
xxii. Centre for Environmental Research, Education and Development
Climate change, biodiversity conservation, research and education, natural resource governance, programme management.
xxiii. Zambia Agricultural Research Institute Agro-biodiversity research and conservation.
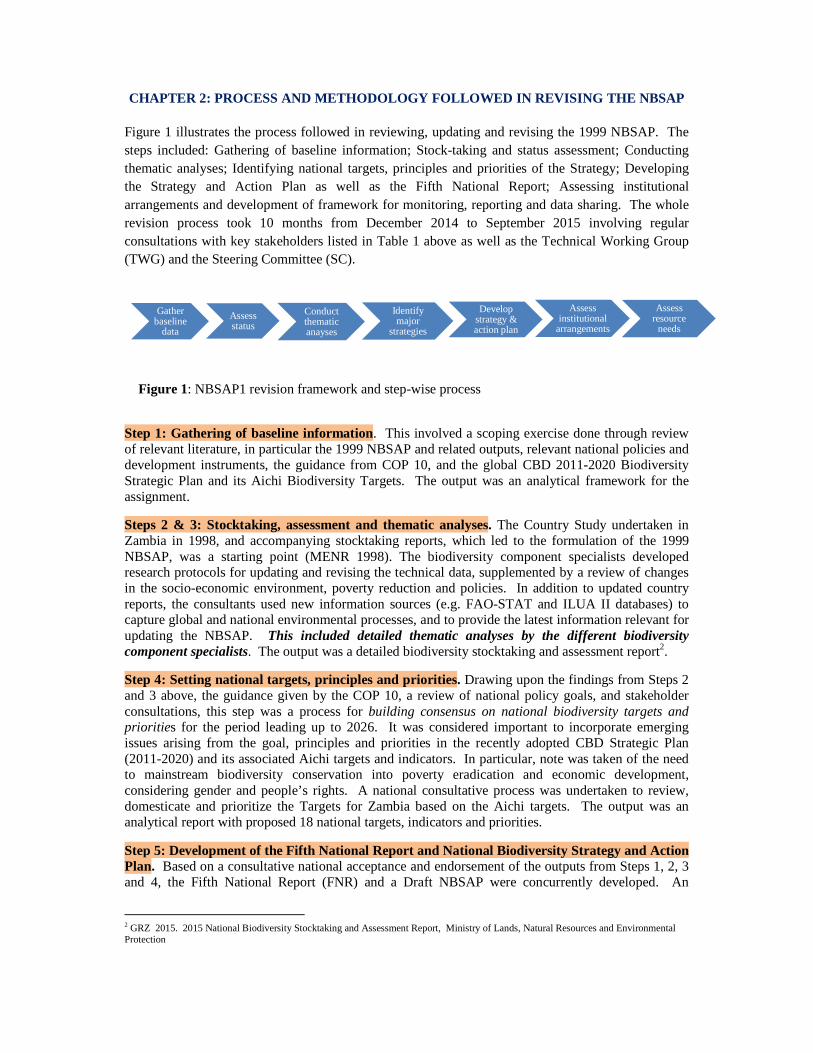
CHAPTER 2: PROCESS AND METHODOLOGY FOLLOWED IN REVI SING THE NBSAP Figure 1 illustrates the process followed in reviewing, updating and revising the 1999 NBSAP. The steps included: Gathering of baseline information; Stock-taking and status assessment; Conducting thematic analyses; Identifying national targets, principles and priorities of the Strategy; Developing the Strategy and Action Plan as well as the Fifth National Report; Assessing institutional arrangements and development of framework for monitoring, reporting and data sharing. The whole revision process took 10 months from December 2014 to September 2015 involving regular consultations with key stakeholders listed in Table 1 above as well as the Technical Working Group (TWG) and the Steering Committee (SC).
Figure 1: NBSAP1 revision framework and step-wise process
Step 1: Gathering of baseline information. This involved a scoping exercise done through review of relevant literature, in particular the 1999 NBSAP and related outputs, relevant national policies and development instruments, the guidance from COP 10, and the global CBD 2011-2020 Biodiversity Strategic Plan and its Aichi Biodiversity Targets. The output was an analytical framework for the assignment.
Steps 2 & 3: Stocktaking, assessment and thematic analyses. The Country Study undertaken in Zambia in 1998, and accompanying stocktaking reports, which led to the formulation of the 1999 NBSAP, was a starting point (MENR 1998). The biodiversity component specialists developed research protocols for updating and revising the technical data, supplemented by a review of changes in the socio-economic environment, poverty reduction and policies. In addition to updated country reports, the consultants used new information sources (e.g. FAO-STAT and ILUA II databases) to capture global and national environmental processes, and to provide the latest information relevant for updating the NBSAP. This included detailed thematic analyses by the different biodiversity component specialists. The output was a detailed biodiversity stocktaking and assessment report2.
Step 4: Setting national targets, principles and priorities. Drawing upon the findings from Steps 2 and 3 above, the guidance given by the COP 10, a review of national policy goals, and stakeholder consultations, this step was a process for building consensus on national biodiversity targets and priorities for the period leading up to 2026. It was considered important to incorporate emerging issues arising from the goal, principles and priorities in the recently adopted CBD Strategic Plan (2011-2020) and its associated Aichi targets and indicators. In particular, note was taken of the need to mainstream biodiversity conservation into poverty eradication and economic development, considering gender and people’s rights. A national consultative process was undertaken to review, domesticate and prioritize the Targets for Zambia based on the Aichi targets. The output was an analytical report with proposed 18 national targets, indicators and priorities.
Step 5: Development of the Fifth National Report and National Biodiversity Strategy and Action Plan. Based on a consultative national acceptance and endorsement of the outputs from Steps 1, 2, 3 and 4, the Fifth National Report (FNR) and a Draft NBSAP were concurrently developed. An
2 GRZ 2015. 2015 National Biodiversity Stocktaking and Assessment Report, Ministry of Lands, Natural Resources and Environmental Protection
Gather baseline
data
Assess status
Conduct thematic anayses
Identify major
strategies
Develop strategy & action plan
Assess institutional
arrangements
Assess resource
needs
4
iterative process was followed whereby the drafts of the FNR and NBSAP were subjected to local, sub-national, expert and national level consultations. Based on stakeholder feedback, scientific and expert peer review, and close client consultation, a final NBSAP was prepared and submitted for validation at a National Stakeholders Workshop. The outputs from Step 4 were the Fifth National Report and the revised NBSAP (NBSAP2) including a monitoring and evaluation framework for the NBSAP2. Both the draft Fifth National Report and NBSAP2 were submitted to the UNCBD Secretariat for further review after which final reports were prepared.
Step 6: Assessment of Institutional Arrangements. Assessment of institutional arrangements focused on analysis of effective implementation arrangements for NBSAP2 drawing on lessons from NBSAP1 implementation and focusing on existing rather than new structures. The proposed implementation arrangements were subjected to a wider stakeholder review of the draft NBSAP2 recommendations on implementation arrangements. The final output is contained in Section 5.2 of this Strategy.
Step 7: Assessment of Resource Needs. The MLNREP will proceed to prepare an Investment Plan for NBSAP2 through the Biodiversity Finance Initiative (BIOFIN) Project. The Investment plan will indicate funding which will be required from both domestic and external sources for the effective implementation of the Strategy.
5
CHAPTER 3: SITUATION ANALYSIS – THE COUNTRY CONTEXT
3.1 Country Context
Zambia is a landlocked country in Southern Africa. It is located between latitudes 8° and 18° south and longitudes 22° and 34° east and covers a total area of 752,612 square kilometres. The country is bordered by, The Democratic Republic of Congo to the north, Tanzania to the north-east, Malawi to the east, Mozambique, Zimbabwe, Botswana and Namibia to the South, and Angola to the west. Zambia is administratively divided into ten provinces namely: Central, Copperbelt, Eastern, Luapula, Lusaka, Muchinga, Northern, North-Western, Southern and Western provinces.
The Country is situated on the plateau of central Africa, between 1000–1600 m above mean sea level with an average altitude of 1200 m and has a relatively moderate climate. There are three seasons: rainfall occurs mainly between November and April, which is also the main farming season; the period from May to August tends to be cool and dry; and September and October are typically hot and dry.
Zambia’s population increased from 7,383,097 in 1990 to 9,885,591 in 2000 and to 13, 092,666 in 2010. This represented a percentage increase of 33.9% in the 1990-2000 inter-censal periods. This growth declined to 32.4% in the 2000-2010 inter-censal periods (CSO, 20123).
In recent years, Zambia’s economy has seen significant recovery. Gross Domestic Product (GDP) growth has averaged about 6.4% in 2014/2015 after a decline in GDP growth from 6.7% in 2013 to 5.7% due mainly to waning copper production and low prices in the world market (Rasmussen, 20154). Inflation declined from 35.2% at the end of 1996 to 7.9% at the end of 2010 (CSO, 2012d5) and closed at 8% by end of 2014 (Rasmussen, 20156). Inflation was contained within 8% in 2014 due to effective tightening of monetary policy by the Central Bank. However, given the current exchange rate of the US dollar to the Zambian Kwacha of 1:13; it can be estimated that the current inflation rate has doubled from that of 2014 to about 15-16% as already being witnessed in rising food and other commodity prices.
Zambia’s development agenda has been set out in the Vision 2030 and the Sixth National Development Plan (SNDP) (2011-2015), with the aim to become a middle income country by 2030, mainly through private sector-led broad-based economic growth. The Vision clearly states the need for an economy which is competitive, self-sustaining, dynamic and resilient to any external shocks, supports stability and protection of biological and physical systems and is free from donor dependence. The SNDP on the other hand recognises that Zambia’s natural resources could provide an impetus to the development of agriculture, tourism, manufacturing, mining and energy sectors.
As a low-income country that is focused on achieving growth and development to reduce poverty and raise standards of living, Zambia is largely dependent on its natural assets. The country’s natural capital comprises its forests, which dominate the landscape, its wetlands and rivers, land and all the flora and fauna they contain. The value of these ecosystems and their biodiversity are partially appreciated. For example, while forest production is measured to some extent in terms of the size of the forestry sector, its contributions to other sectors and to human wellbeing is not accounted for (Turpie et al., 2014).
As a developing country that is rich in natural resources, there is a danger of achieving short-term growth through the over-exploitation of its natural resources. This trend is evident in the rapid depletion of Zambia’s natural forests with the deforestation rate currently estimated between 250,000
3 CSO (2010), Living Conditions Monitoring Survey, 2006 and 2010. Central Statics Office, Government of the Republic of Zambia. 4 Rasmussen, P.E. 2015. Zambia Economic Outlook. Country Note. African Development Bank (AfDB), Zambia Field Office, Lusaka. 5 Central Statistical Office, 2012d. Living conditions monitoring survey report 2006 and 2010. 6 Rasmussen, P.E. 2015. Zambia Economic Outlook. Country Note. African Development Bank (AfDB), Zambia Field Office, Lusaka.
6
– 300,000 hectares per year, and hence the need to actively promote biodiversity conservation and sustainable utilisation of these resources to realise socio- economic development.
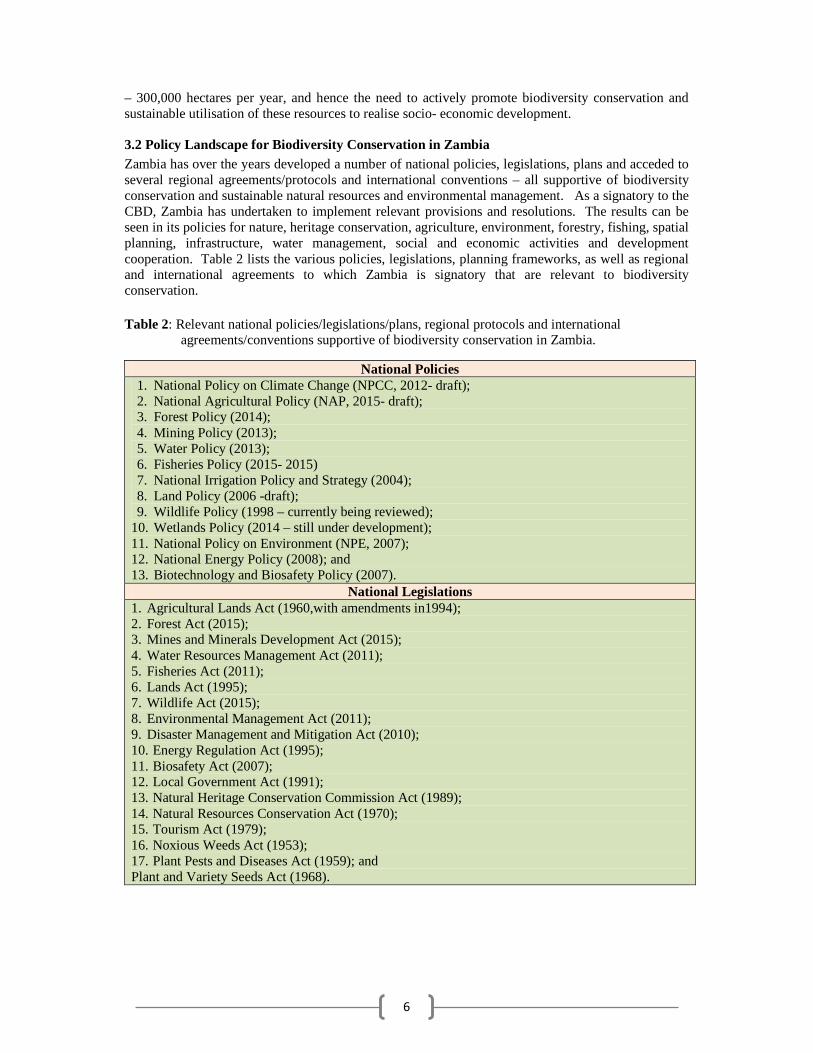
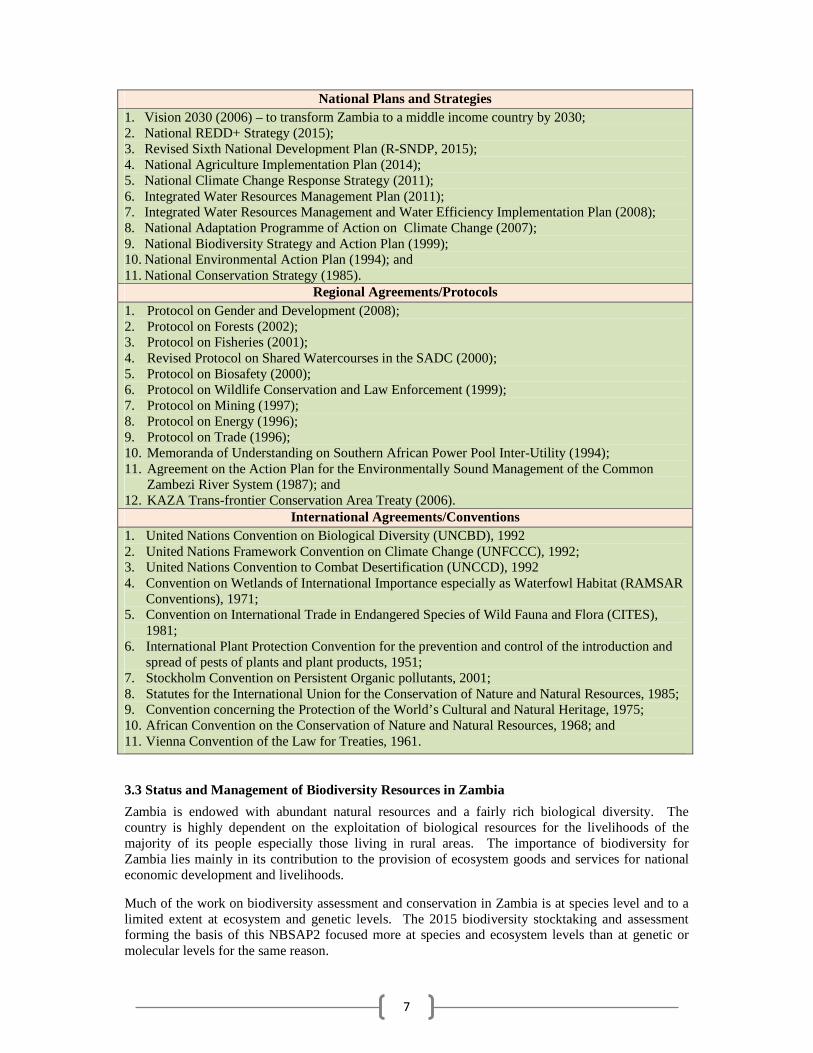
3.2 Policy Landscape for Biodiversity Conservation in Zambia Zambia has over the years developed a number of national policies, legislations, plans and acceded to several regional agreements/protocols and international conventions – all supportive of biodiversity conservation and sustainable natural resources and environmental management. As a signatory to the CBD, Zambia has undertaken to implement relevant provisions and resolutions. The results can be seen in its policies for nature, heritage conservation, agriculture, environment, forestry, fishing, spatial planning, infrastructure, water management, social and economic activities and development cooperation. Table 2 lists the various policies, legislations, planning frameworks, as well as regional and international agreements to which Zambia is signatory that are relevant to biodiversity conservation. Table 2: Relevant national policies/legislations/plans, regional protocols and international
agreements/conventions supportive of biodiversity conservation in Zambia.
National Policies 1. National Policy on Climate Change (NPCC, 2012- draft); 2. National Agricultural Policy (NAP, 2015- draft); 3. Forest Policy (2014); 4. Mining Policy (2013); 5. Water Policy (2013); 6. Fisheries Policy (2015- 2015) 7. National Irrigation Policy and Strategy (2004); 8. Land Policy (2006 -draft); 9. Wildlife Policy (1998 – currently being reviewed);
10. Wetlands Policy (2014 – still under development); 11. National Policy on Environment (NPE, 2007); 12. National Energy Policy (2008); and 13. Biotechnology and Biosafety Policy (2007).
National Legislations 1. Agricultural Lands Act (1960,with amendments in1994);
National Plans and Strategies 1. Vision 2030 (2006) – to transform Zambia to a middle income country by 2030;
2. National REDD+ Strategy (2015);
3. Revised Sixth National Development Plan (R-SNDP, 2015);
4. National Agriculture Implementation Plan (2014);
5. National Climate Change Response Strategy (2011);
6. Integrated Water Resources Management Plan (2011);
7. Integrated Water Resources Management and Water Efficiency Implementation Plan (2008);
8. National Adaptation Programme of Action on Climate Change (2007);
9. National Biodiversity Strategy and Action Plan (1999);
10. National Environmental Action Plan (1994); and
11. National Conservation Strategy (1985).
Regional Agreements/Protocols 1. Protocol on Gender and Development (2008); 2. Protocol on Forests (2002); 3. Protocol on Fisheries (2001); 4. Revised Protocol on Shared Watercourses in the SADC (2000); 5. Protocol on Biosafety (2000); 6. Protocol on Wildlife Conservation and Law Enforcement (1999); 7. Protocol on Mining (1997); 8. Protocol on Energy (1996); 9. Protocol on Trade (1996); 10. Memoranda of Understanding on Southern African Power Pool Inter-Utility (1994); 11. Agreement on the Action Plan for the Environmentally Sound Management of the Common
Zambezi River System (1987); and 12. KAZA Trans-frontier Conservation Area Treaty (2006).
International Agreements/Conventions 1. United Nations Convention on Biological Diversity (UNCBD), 1992
2. United Nations Framework Convention on Climate Change (UNFCCC), 1992;
3. United Nations Convention to Combat Desertification (UNCCD), 1992
4. Convention on Wetlands of International Importance especially as Waterfowl Habitat (RAMSAR Conventions), 1971;
5. Convention on International Trade in Endangered Species of Wild Fauna and Flora (CITES), 1981;
6. International Plant Protection Convention for the prevention and control of the introduction and spread of pests of plants and plant products, 1951;
7. Stockholm Convention on Persistent Organic pollutants, 2001;
8. Statutes for the International Union for the Conservation of Nature and Natural Resources, 1985;
9. Convention concerning the Protection of the World’s Cultural and Natural Heritage, 1975;
10. African Convention on the Conservation of Nature and Natural Resources, 1968; and
11. Vienna Convention of the Law for Treaties, 1961.
3.3 Status and Management of Biodiversity Resources in Zambia
Zambia is endowed with abundant natural resources and a fairly rich biological diversity. The country is highly dependent on the exploitation of biological resources for the livelihoods of the majority of its people especially those living in rural areas. The importance of biodiversity for Zambia lies mainly in its contribution to the provision of ecosystem goods and services for national economic development and livelihoods.
Much of the work on biodiversity assessment and conservation in Zambia is at species level and to a limited extent at ecosystem and genetic levels. The 2015 biodiversity stocktaking and assessment forming the basis of this NBSAP2 focused more at species and ecosystem levels than at genetic or molecular levels for the same reason.
8
The conservation and management of various components of biodiversity falls under several government line ministries and statutory bodies with the MLNREP having the overall coordination function.
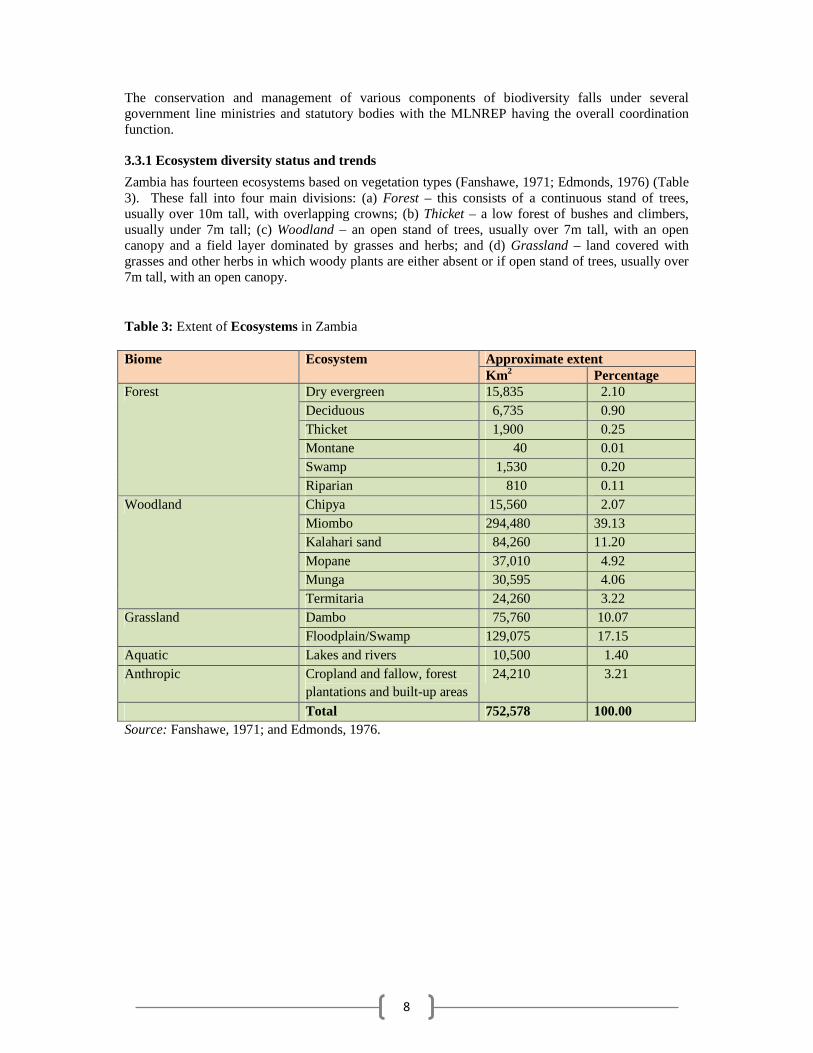
3.3.1 Ecosystem diversity status and trends Zambia has fourteen ecosystems based on vegetation types (Fanshawe, 1971; Edmonds, 1976) (Table 3). These fall into four main divisions: (a) Forest – this consists of a continuous stand of trees, usually over 10m tall, with overlapping crowns; (b) Thicket – a low forest of bushes and climbers, usually under 7m tall; (c) Woodland – an open stand of trees, usually over 7m tall, with an open canopy and a field layer dominated by grasses and herbs; and (d) Grassland – land covered with grasses and other herbs in which woody plants are either absent or if open stand of trees, usually over 7m tall, with an open canopy.
Table 3: Extent of Ecosystems in Zambia Biome Ecosystem Approximate extent
Aquatic Lakes and rivers 10,500 1.40 Anthropic Cropland and fallow, forest
plantations and built-up areas 24,210 3.21
Total 752,578 100.00 Source: Fanshawe, 1971; and Edmonds, 1976.
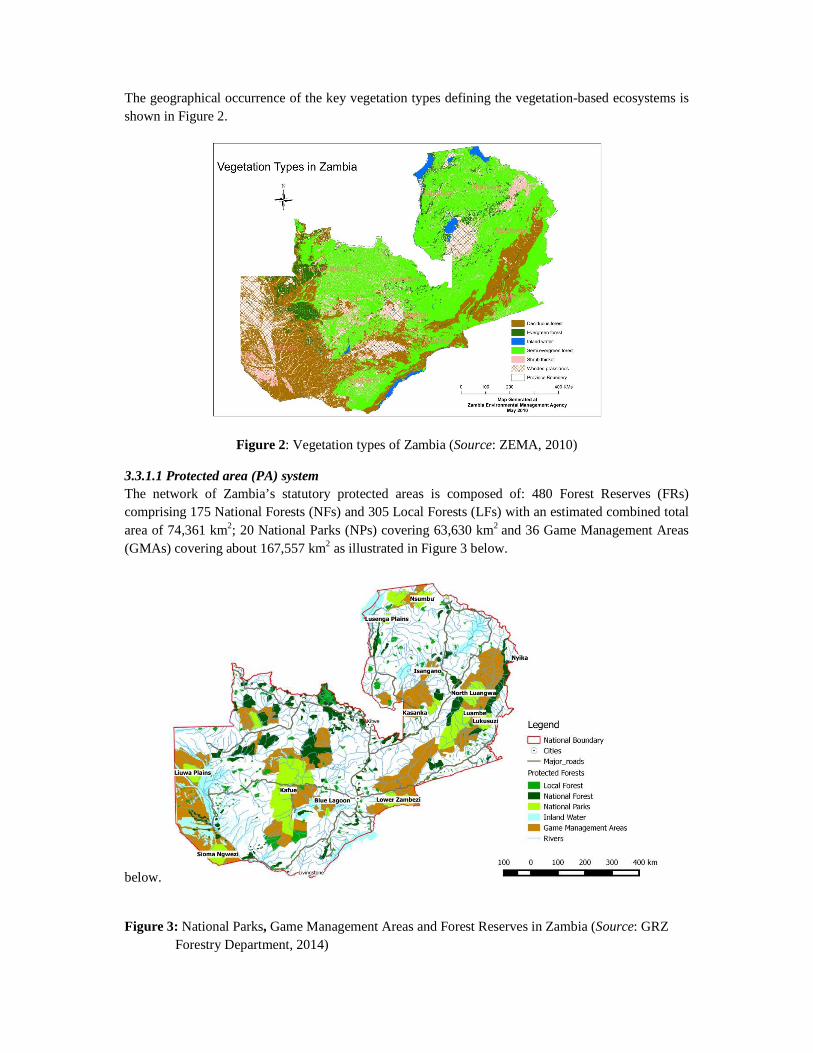
The geographical occurrence of the key vegetation types defining the vegetation-based ecosystems is shown in Figure 2.
Figure 2: Vegetation types of Zambia (Source: ZEMA, 2010)
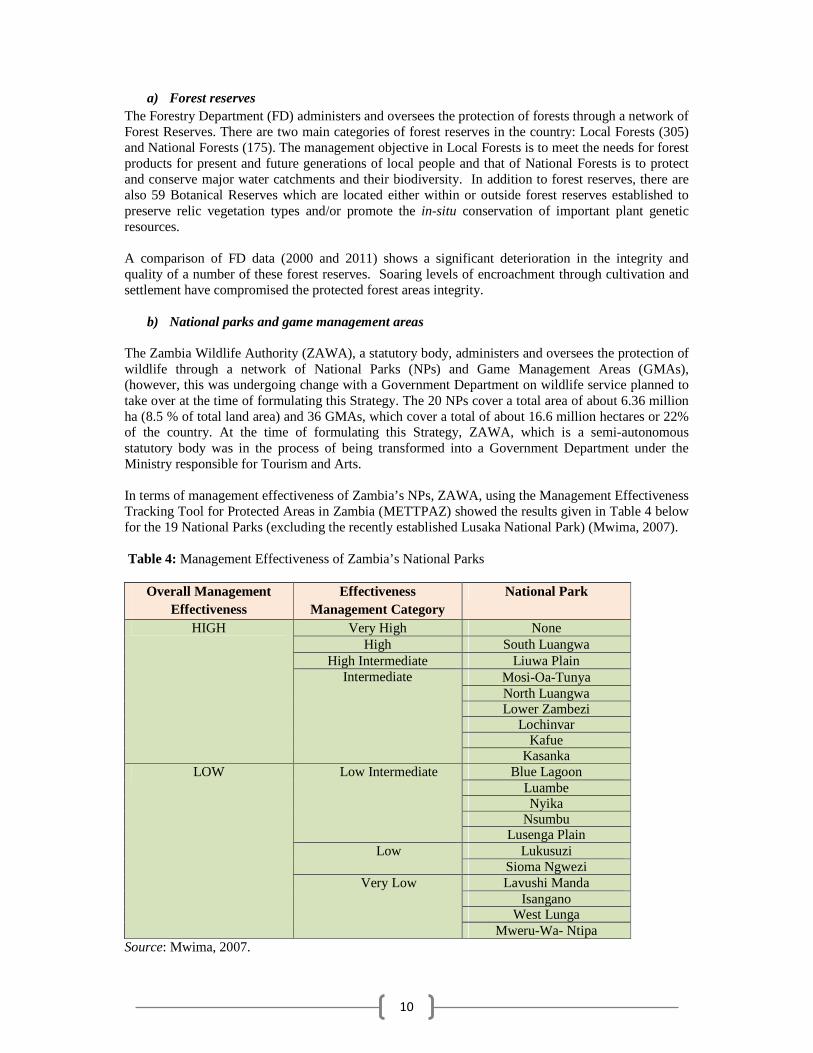
3.3.1.1 Protected area (PA) system The network of Zambia’s statutory protected areas is composed of: 480 Forest Reserves (FRs) comprising 175 National Forests (NFs) and 305 Local Forests (LFs) with an estimated combined total area of 74,361 km2; 20 National Parks (NPs) covering 63,630 km2 and 36 Game Management Areas (GMAs) covering about 167,557 km2 as illustrated in Figure 3 below.
below.
Figure 3: National Parks, Game Management Areas and Forest Reserves in Zambia (Source: GRZ
Forestry Department, 2014)
10
a) Forest reserves The Forestry Department (FD) administers and oversees the protection of forests through a network of Forest Reserves. There are two main categories of forest reserves in the country: Local Forests (305) and National Forests (175). The management objective in Local Forests is to meet the needs for forest products for present and future generations of local people and that of National Forests is to protect and conserve major water catchments and their biodiversity. In addition to forest reserves, there are also 59 Botanical Reserves which are located either within or outside forest reserves established to preserve relic vegetation types and/or promote the in-situ conservation of important plant genetic resources. A comparison of FD data (2000 and 2011) shows a significant deterioration in the integrity and quality of a number of these forest reserves. Soaring levels of encroachment through cultivation and settlement have compromised the protected forest areas integrity.
b) National parks and game management areas The Zambia Wildlife Authority (ZAWA), a statutory body, administers and oversees the protection of wildlife through a network of National Parks (NPs) and Game Management Areas (GMAs), (however, this was undergoing change with a Government Department on wildlife service planned to take over at the time of formulating this Strategy. The 20 NPs cover a total area of about 6.36 million ha (8.5 % of total land area) and 36 GMAs, which cover a total of about 16.6 million hectares or 22% of the country. At the time of formulating this Strategy, ZAWA, which is a semi-autonomous statutory body was in the process of being transformed into a Government Department under the Ministry responsible for Tourism and Arts. In terms of management effectiveness of Zambia’s NPs, ZAWA, using the Management Effectiveness Tracking Tool for Protected Areas in Zambia (METTPAZ) showed the results given in Table 4 below for the 19 National Parks (excluding the recently established Lusaka National Park) (Mwima, 2007). Table 4: Management Effectiveness of Zambia’s National Parks
Overall Management Effectiveness
Effectiveness Management Category
National Park
HIGH Very High None High South Luangwa
High Intermediate Liuwa Plain Intermediate Mosi-Oa-Tunya
North Luangwa Lower Zambezi
Lochinvar Kafue
Kasanka LOW Low Intermediate Blue Lagoon
Luambe Nyika
Nsumbu Lusenga Plain
Low Lukusuzi Sioma Ngwezi
Very Low Lavushi Manda Isangano
West Lunga Mweru-Wa- Ntipa
Source: Mwima, 2007.
11
Game Management Areas (GMAs) are protected areas in communally owned lands (i.e., customary or traditional lands) that are used primarily for the sustainable utilization of wildlife resources, through regulated hunting and/or non-consumptive tourism concessions, for the benefit of the nation, local communities and the wildlife resource. GMAs fall in IUCN Conservation Area Category VI (Resource Reserve). Based on sampled GMAs in the Luangwa and Kafue ecosystems (Lindsey et al. 2013), all GMAs have been encroached as a result of human settlements and agricultural activities in areas where such activities are not permissible within a GMA; e.g., areas zoned as wildlife corridors or wildlife refuges.
c) Wetlands of international importance
Zambia has eight (8) Ramsar sites with a combined total area of 40,305 km2 (Table 5). These wetlands are habitats of several important fauna and flora species including some endemic and endangered species. Recent assessment of the state and trends in these wetlands (ZAWA, 2015) indicates improved status of the Lukanga swamps, Bangweulu swamps and Liuwa Plains and attributes the improvement to the attention some of these wetlands have received from private sector engagement in their conservation regimes.
Apart from their global significance, these wetlands are also very important at national level including others (e.g., Kariba, Itezhi-tezhi and Lower Zambezi) as they comprise the major fisheries of the country (Figure 4). Table 5: Ramsar sites in Zambia
Name of Ramsar Site Area (km2) Bangweulu Swamps 11,000 Busanga Swamp 2,000 Kafue Flats (includes Lochinvar & Blue Lagoon NPs) 6,005 Lake Tanganyika (portion in Zambia) 2,300 Luangwa Floodplains 2,500 Lukanga Swamp 2,600 Mweru-Wa-Ntipa Swamps 4,900 Barotse Floodplain 9,000 Total 40,305
Source: https://rsis.ramsar.org/
Figure 4: Wetlands of International Importance serving as major fisheries
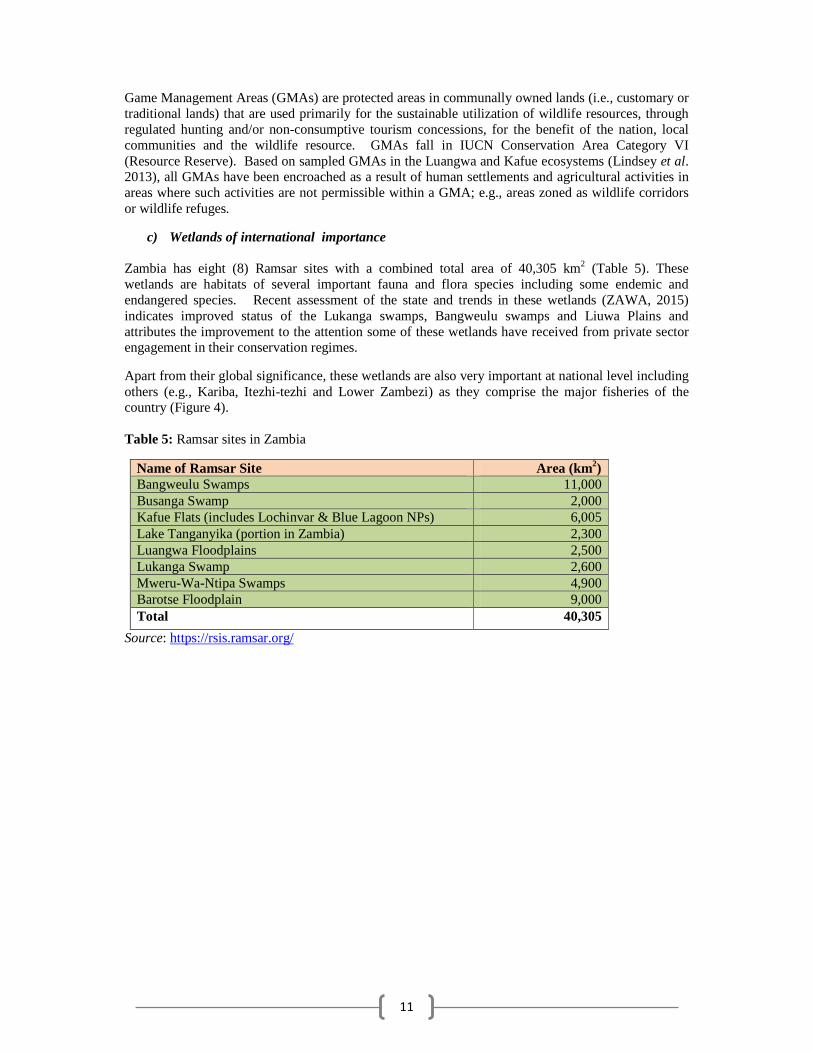
3.3.1.2 Important bird areas (IBAs) Zambia has a network of 42 Important Bird Areas (IBAs) covering a combined area of 105,382.5 km2; approximately 14% of Zambia’s total land surface area (Figure 5). At present, about 82% of the area covered by IBAs receives some form of protection (National Park: 60%; Game Management Area: 19%; National Forest: 2%; and privately owned forest: 1% (Leonard, 2005). The remaining 18% are in open areas with no legal status; a few of these have developed some local by-laws7 with the help of chiefs and traditional leaders.
7 Nyoni, M. (2010), Conservation Bye-laws for Magumwi-Machile Site in Machile Important Bird Area, Zambian Ornithological Society.
Lower Zambezi
Figure 5: Important Bird Areas of Zambia (Source: Leonard, 2005).
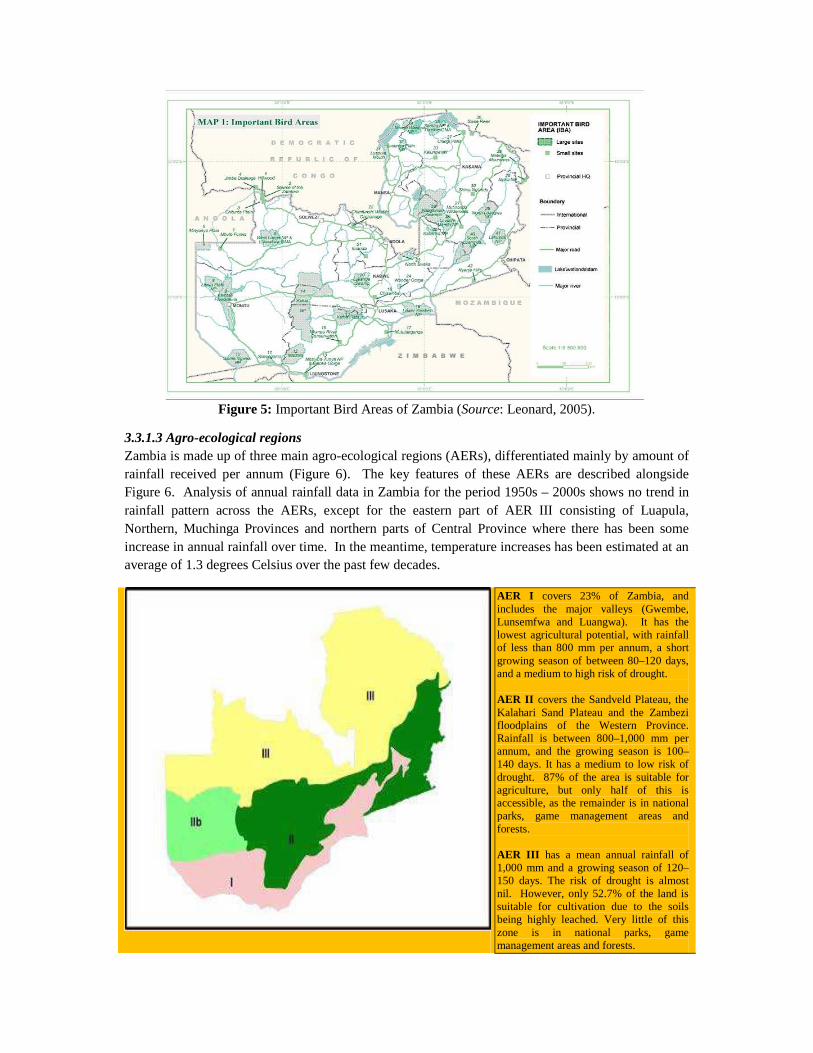
3.3.1.3 Agro-ecological regions Zambia is made up of three main agro-ecological regions (AERs), differentiated mainly by amount of rainfall received per annum (Figure 6). The key features of these AERs are described alongside Figure 6. Analysis of annual rainfall data in Zambia for the period 1950s – 2000s shows no trend in rainfall pattern across the AERs, except for the eastern part of AER III consisting of Luapula, Northern, Muchinga Provinces and northern parts of Central Province where there has been some increase in annual rainfall over time. In the meantime, temperature increases has been estimated at an average of 1.3 degrees Celsius over the past few decades.
AER I covers 23% of Zambia, and includes the major valleys (Gwembe, Lunsemfwa and Luangwa). It has the lowest agricultural potential, with rainfall of less than 800 mm per annum, a short growing season of between 80–120 days, and a medium to high risk of drought. AER II covers the Sandveld Plateau, the Kalahari Sand Plateau and the Zambezi floodplains of the Western Province. Rainfall is between 800–1,000 mm per annum, and the growing season is 100–140 days. It has a medium to low risk of drought. 87% of the area is suitable for agriculture, but only half of this is accessible, as the remainder is in national parks, game management areas and forests. AER III has a mean annual rainfall of 1,000 mm and a growing season of 120–150 days. The risk of drought is almost nil. However, only 52.7% of the land is suitable for cultivation due to the soils being highly leached. Very little of this zone is in national parks, game management areas and forests.
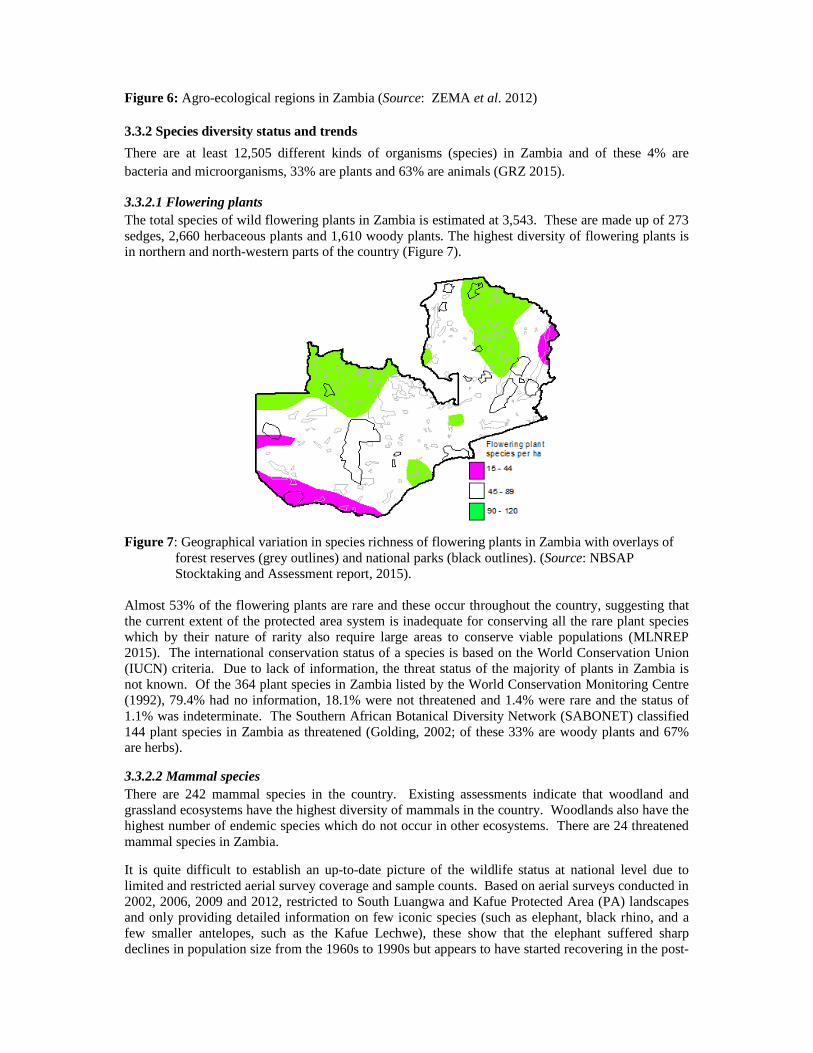
Figure 6: Agro-ecological regions in Zambia (Source: ZEMA et al. 2012)
3.3.2 Species diversity status and trends
There are at least 12,505 different kinds of organisms (species) in Zambia and of these 4% are bacteria and microorganisms, 33% are plants and 63% are animals (GRZ 2015).
3.3.2.1 Flowering plants The total species of wild flowering plants in Zambia is estimated at 3,543. These are made up of 273 sedges, 2,660 herbaceous plants and 1,610 woody plants. The highest diversity of flowering plants is in northern and north-western parts of the country (Figure 7).
Figure 7: Geographical variation in species richness of flowering plants in Zambia with overlays of forest reserves (grey outlines) and national parks (black outlines). (Source: NBSAP Stocktaking and Assessment report, 2015).
Almost 53% of the flowering plants are rare and these occur throughout the country, suggesting that the current extent of the protected area system is inadequate for conserving all the rare plant species which by their nature of rarity also require large areas to conserve viable populations (MLNREP 2015). The international conservation status of a species is based on the World Conservation Union (IUCN) criteria. Due to lack of information, the threat status of the majority of plants in Zambia is not known. Of the 364 plant species in Zambia listed by the World Conservation Monitoring Centre (1992), 79.4% had no information, 18.1% were not threatened and 1.4% were rare and the status of 1.1% was indeterminate. The Southern African Botanical Diversity Network (SABONET) classified 144 plant species in Zambia as threatened (Golding, 2002; of these 33% are woody plants and 67% are herbs).
3.3.2.2 Mammal species There are 242 mammal species in the country. Existing assessments indicate that woodland and grassland ecosystems have the highest diversity of mammals in the country. Woodlands also have the highest number of endemic species which do not occur in other ecosystems. There are 24 threatened mammal species in Zambia.
It is quite difficult to establish an up-to-date picture of the wildlife status at national level due to limited and restricted aerial survey coverage and sample counts. Based on aerial surveys conducted in 2002, 2006, 2009 and 2012, restricted to South Luangwa and Kafue Protected Area (PA) landscapes and only providing detailed information on few iconic species (such as elephant, black rhino, and a few smaller antelopes, such as the Kafue Lechwe), these show that the elephant suffered sharp declines in population size from the 1960s to 1990s but appears to have started recovering in the post-
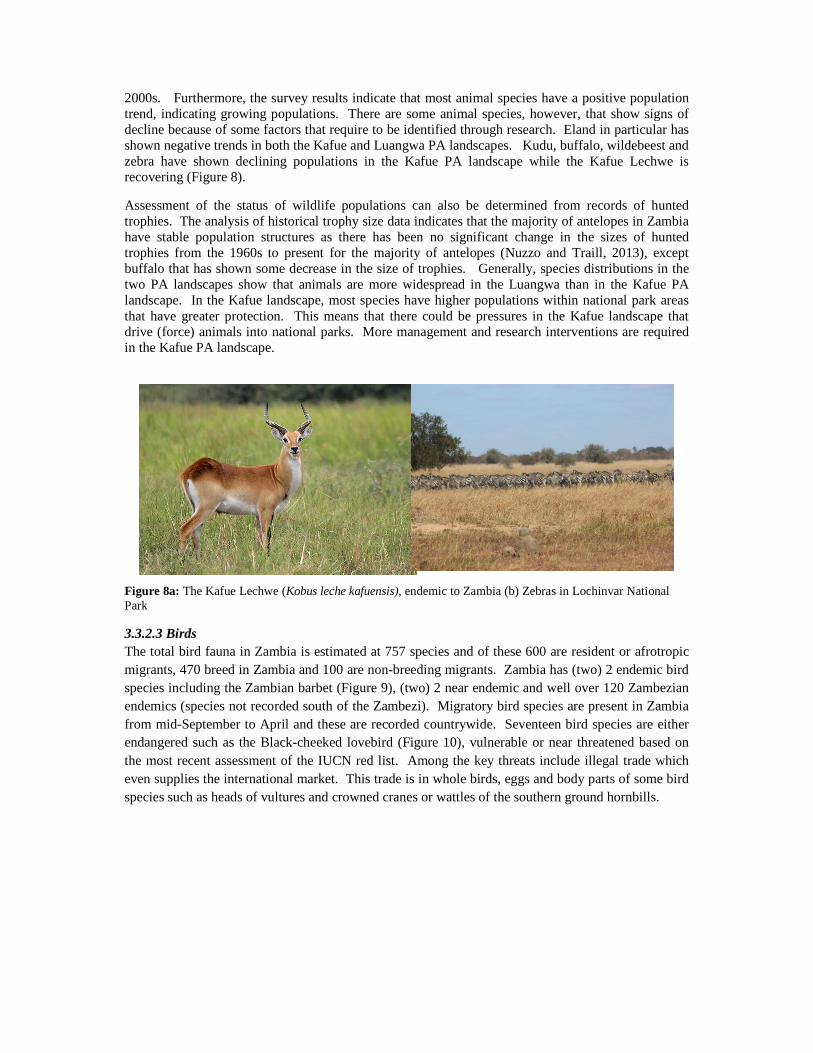
2000s. Furthermore, the survey results indicate that most animal species have a positive population trend, indicating growing populations. There are some animal species, however, that show signs of decline because of some factors that require to be identified through research. Eland in particular has shown negative trends in both the Kafue and Luangwa PA landscapes. Kudu, buffalo, wildebeest and zebra have shown declining populations in the Kafue PA landscape while the Kafue Lechwe is recovering (Figure 8).
Assessment of the status of wildlife populations can also be determined from records of hunted trophies. The analysis of historical trophy size data indicates that the majority of antelopes in Zambia have stable population structures as there has been no significant change in the sizes of hunted trophies from the 1960s to present for the majority of antelopes (Nuzzo and Traill, 2013), except buffalo that has shown some decrease in the size of trophies. Generally, species distributions in the two PA landscapes show that animals are more widespread in the Luangwa than in the Kafue PA landscape. In the Kafue landscape, most species have higher populations within national park areas that have greater protection. This means that there could be pressures in the Kafue landscape that drive (force) animals into national parks. More management and research interventions are required in the Kafue PA landscape.
Figure 8a: The Kafue Lechwe (Kobus leche kafuensis), endemic to Zambia (b) Zebras in Lochinvar National Park
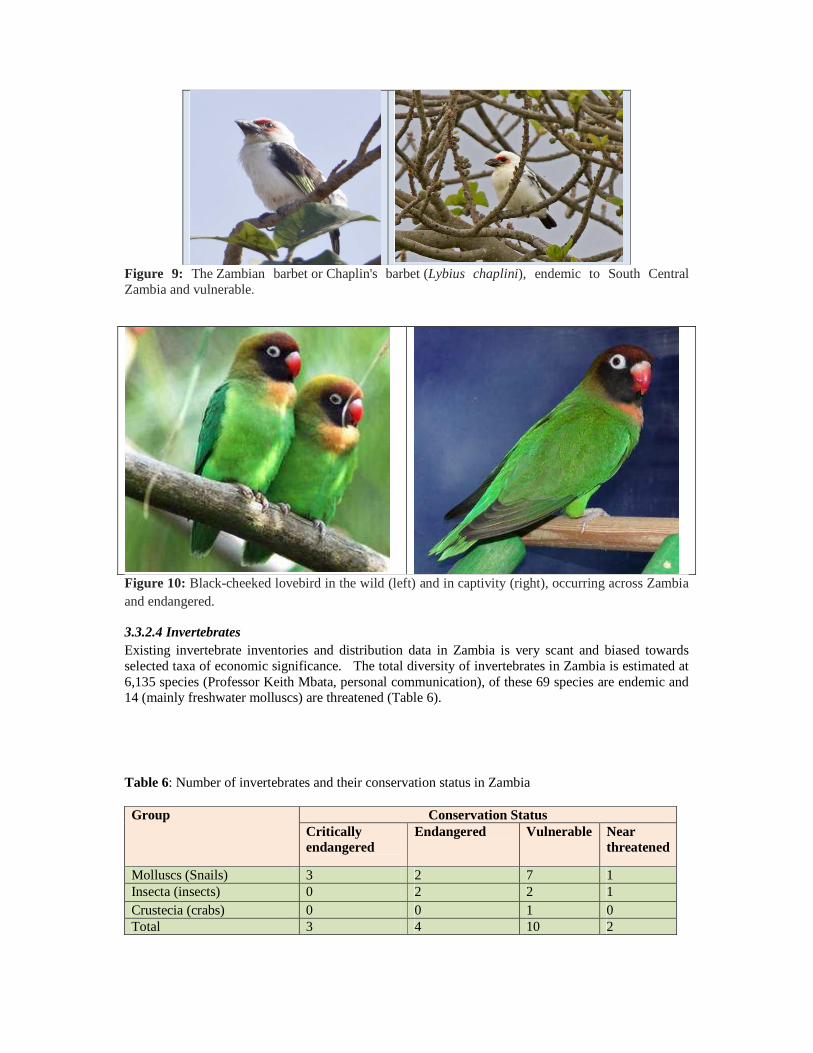
3.3.2.3 Birds The total bird fauna in Zambia is estimated at 757 species and of these 600 are resident or afrotropic migrants, 470 breed in Zambia and 100 are non-breeding migrants. Zambia has (two) 2 endemic bird species including the Zambian barbet (Figure 9), (two) 2 near endemic and well over 120 Zambezian endemics (species not recorded south of the Zambezi). Migratory bird species are present in Zambia from mid-September to April and these are recorded countrywide. Seventeen bird species are either endangered such as the Black-cheeked lovebird (Figure 10), vulnerable or near threatened based on the most recent assessment of the IUCN red list. Among the key threats include illegal trade which even supplies the international market. This trade is in whole birds, eggs and body parts of some bird species such as heads of vultures and crowned cranes or wattles of the southern ground hornbills.
Figure 9: The Zambian barbet or Chaplin's barbet (Lybius chaplini), endemic to South Central Zambia and vulnerable.
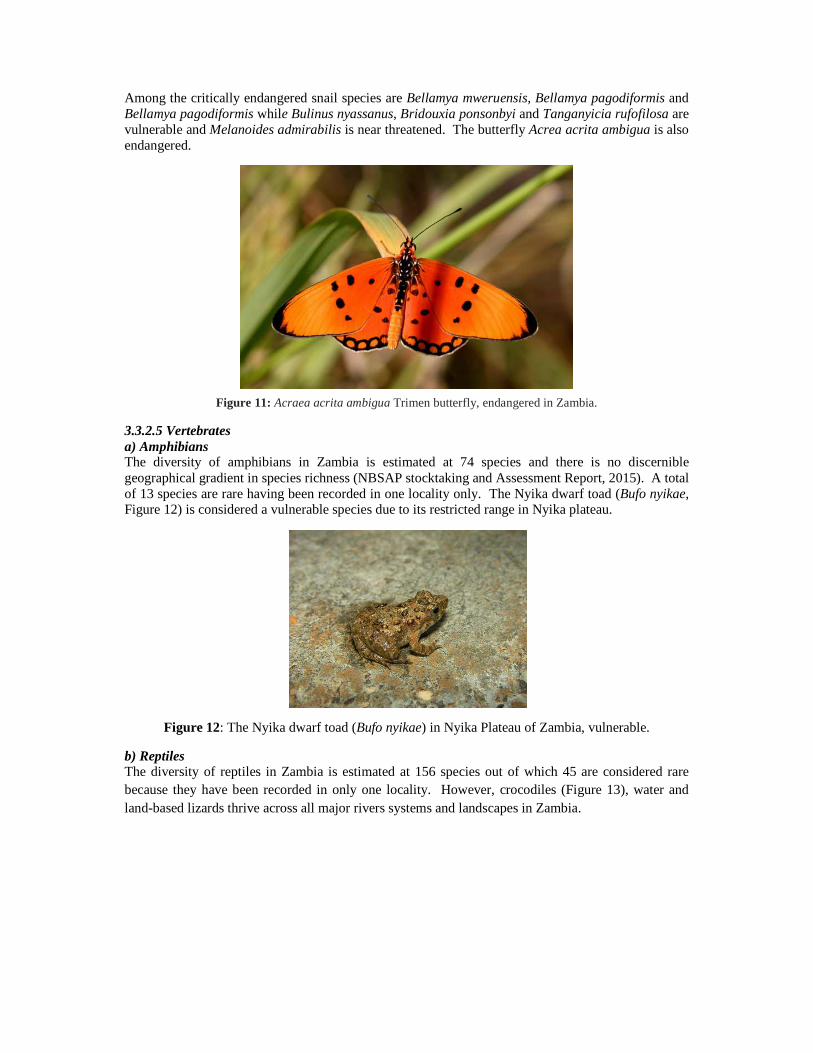
Figure 10: Black-cheeked lovebird in the wild (left) and in captivity (right), occurring across Zambia and endangered.
3.3.2.4 Invertebrates Existing invertebrate inventories and distribution data in Zambia is very scant and biased towards selected taxa of economic significance. The total diversity of invertebrates in Zambia is estimated at 6,135 species (Professor Keith Mbata, personal communication), of these 69 species are endemic and 14 (mainly freshwater molluscs) are threatened (Table 6).
Table 6: Number of invertebrates and their conservation status in Zambia Group Conservation Status
Among the critically endangered snail species are Bellamya mweruensis, Bellamya pagodiformis and Bellamya pagodiformis while Bulinus nyassanus, Bridouxia ponsonbyi and Tanganyicia rufofilosa are vulnerable and Melanoides admirabilis is near threatened. The butterfly Acrea acrita ambigua is also endangered.
Figure 11: Acraea acrita ambigua Trimen butterfly, endangered in Zambia.
3.3.2.5 Vertebrates a) Amphibians The diversity of amphibians in Zambia is estimated at 74 species and there is no discernible geographical gradient in species richness (NBSAP stocktaking and Assessment Report, 2015). A total of 13 species are rare having been recorded in one locality only. The Nyika dwarf toad (Bufo nyikae, Figure 12) is considered a vulnerable species due to its restricted range in Nyika plateau.
Figure 12: The Nyika dwarf toad (Bufo nyikae) in Nyika Plateau of Zambia, vulnerable.
b) Reptiles The diversity of reptiles in Zambia is estimated at 156 species out of which 45 are considered rare because they have been recorded in only one locality. However, crocodiles (Figure 13), water and land-based lizards thrive across all major rivers systems and landscapes in Zambia.
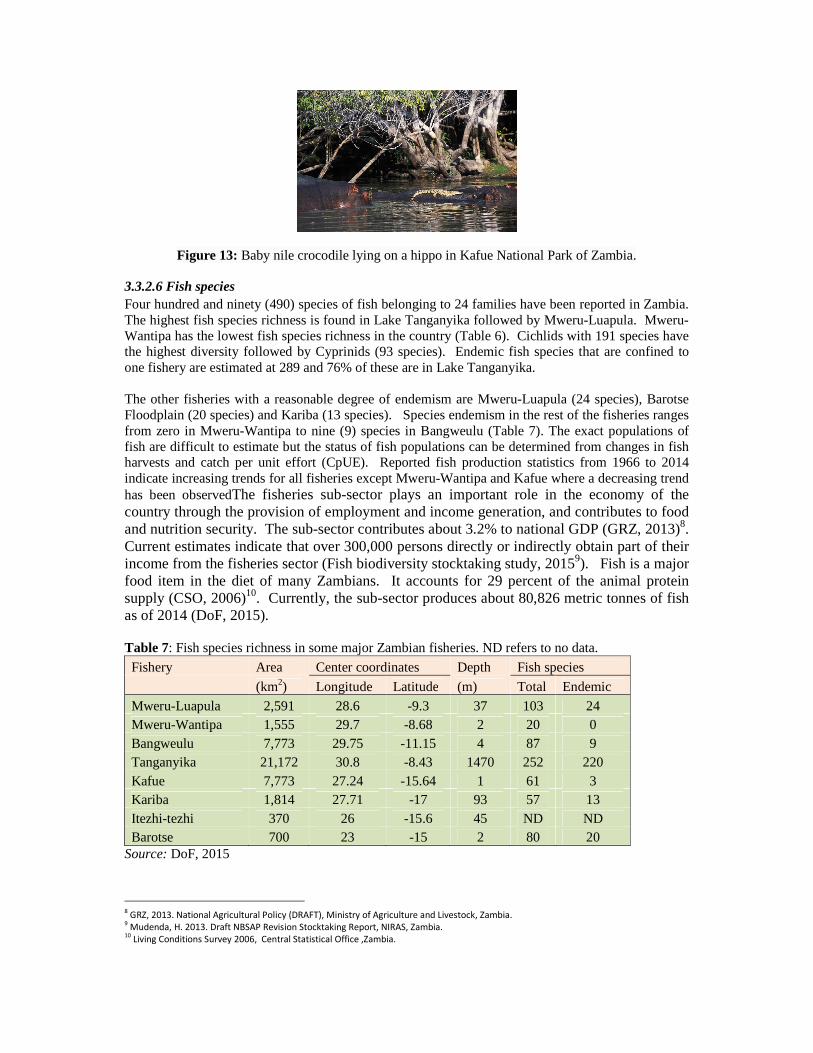
Figure 13: Baby nile crocodile lying on a hippo in Kafue National Park of Zambia.
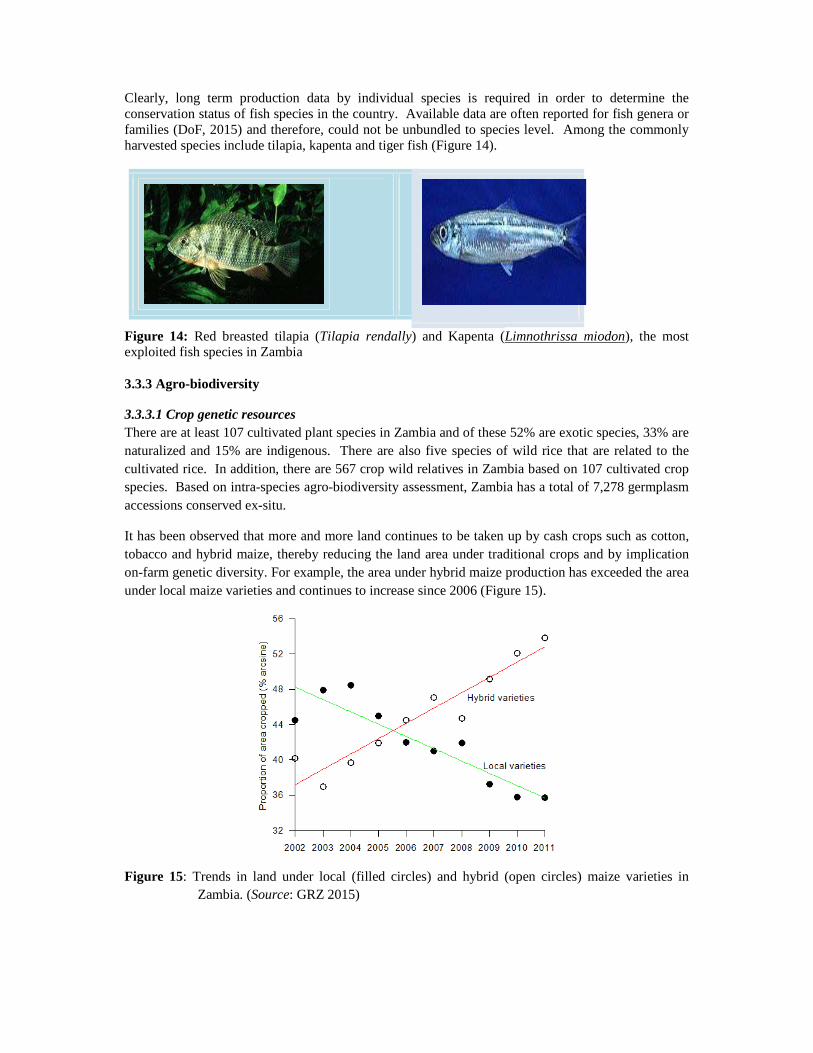
3.3.2.6 Fish species Four hundred and ninety (490) species of fish belonging to 24 families have been reported in Zambia. The highest fish species richness is found in Lake Tanganyika followed by Mweru-Luapula. Mweru-Wantipa has the lowest fish species richness in the country (Table 6). Cichlids with 191 species have the highest diversity followed by Cyprinids (93 species). Endemic fish species that are confined to one fishery are estimated at 289 and 76% of these are in Lake Tanganyika. The other fisheries with a reasonable degree of endemism are Mweru-Luapula (24 species), Barotse Floodplain (20 species) and Kariba (13 species). Species endemism in the rest of the fisheries ranges from zero in Mweru-Wantipa to nine (9) species in Bangweulu (Table 7). The exact populations of fish are difficult to estimate but the status of fish populations can be determined from changes in fish harvests and catch per unit effort (CpUE). Reported fish production statistics from 1966 to 2014 indicate increasing trends for all fisheries except Mweru-Wantipa and Kafue where a decreasing trend has been observedThe fisheries sub-sector plays an important role in the economy of the country through the provision of employment and income generation, and contributes to food and nutrition security. The sub-sector contributes about 3.2% to national GDP (GRZ, 2013)8. Current estimates indicate that over 300,000 persons directly or indirectly obtain part of their income from the fisheries sector (Fish biodiversity stocktaking study, 20159). Fish is a major food item in the diet of many Zambians. It accounts for 29 percent of the animal protein supply (CSO, 2006)10. Currently, the sub-sector produces about 80,826 metric tonnes of fish as of 2014 (DoF, 2015). Table 7: Fish species richness in some major Zambian fisheries. ND refers to no data.
Fishery Area Center coordinates Depth Fish species (km2) Longitude Latitude (m) Total Endemic
10 Living Conditions Survey 2006, Central Statistical Office ,Zambia.
Clearly, long term production data by individual species is required in order to determine the conservation status of fish species in the country. Available data are often reported for fish genera or families (DoF, 2015) and therefore, could not be unbundled to species level. Among the commonly harvested species include tilapia, kapenta and tiger fish (Figure 14).
Figure 14: Red breasted tilapia (Tilapia rendally) and Kapenta (Limnothrissa miodon), the most exploited fish species in Zambia 3.3.3 Agro-biodiversity
3.3.3.1 Crop genetic resources There are at least 107 cultivated plant species in Zambia and of these 52% are exotic species, 33% are naturalized and 15% are indigenous. There are also five species of wild rice that are related to the cultivated rice. In addition, there are 567 crop wild relatives in Zambia based on 107 cultivated crop species. Based on intra-species agro-biodiversity assessment, Zambia has a total of 7,278 germplasm accessions conserved ex-situ.
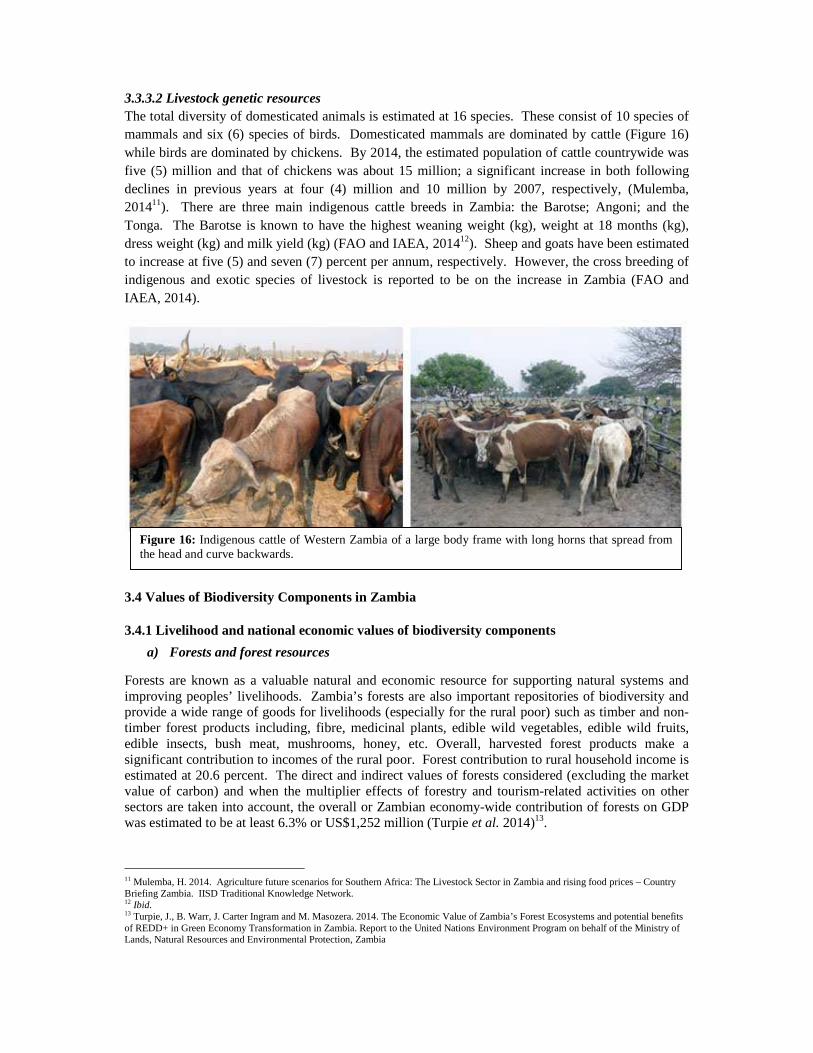
It has been observed that more and more land continues to be taken up by cash crops such as cotton, tobacco and hybrid maize, thereby reducing the land area under traditional crops and by implication on-farm genetic diversity. For example, the area under hybrid maize production has exceeded the area under local maize varieties and continues to increase since 2006 (Figure 15).
Figure 15: Trends in land under local (filled circles) and hybrid (open circles) maize varieties in Zambia. (Source: GRZ 2015)
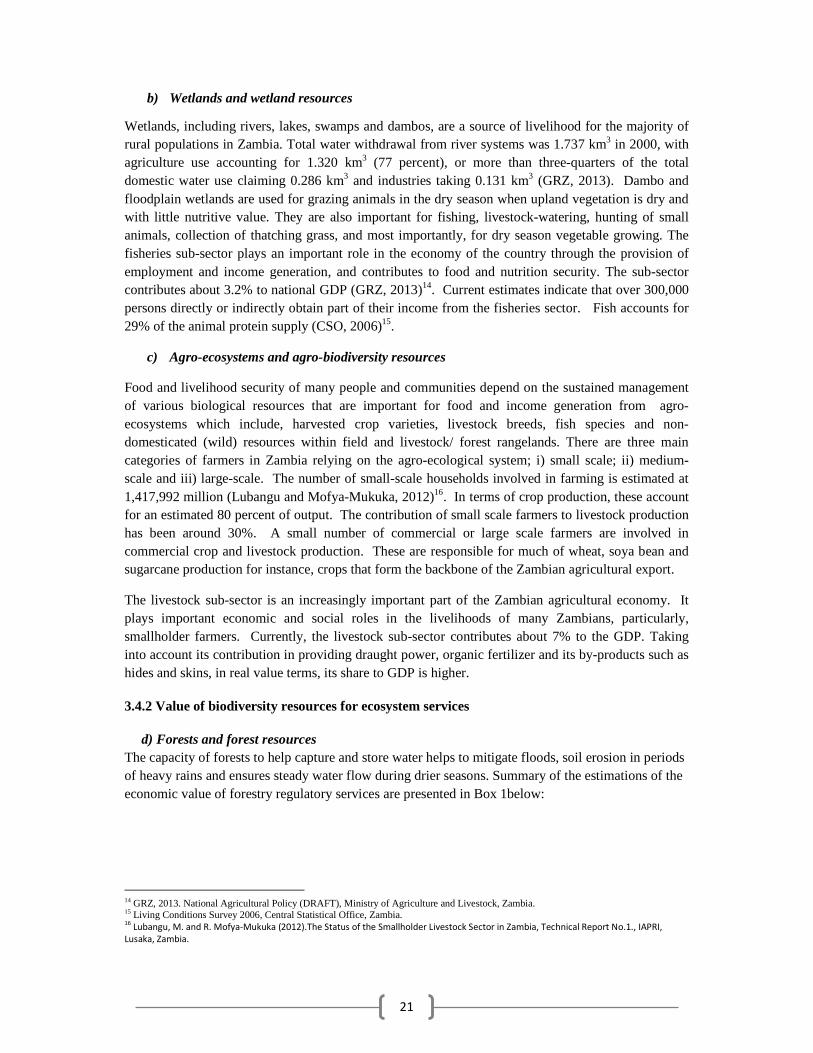
3.3.3.2 Livestock genetic resources The total diversity of domesticated animals is estimated at 16 species. These consist of 10 species of mammals and six (6) species of birds. Domesticated mammals are dominated by cattle (Figure 16) while birds are dominated by chickens. By 2014, the estimated population of cattle countrywide was five (5) million and that of chickens was about 15 million; a significant increase in both following declines in previous years at four (4) million and 10 million by 2007, respectively, (Mulemba, 201411). There are three main indigenous cattle breeds in Zambia: the Barotse; Angoni; and the Tonga. The Barotse is known to have the highest weaning weight (kg), weight at 18 months (kg), dress weight (kg) and milk yield (kg) (FAO and IAEA, 201412). Sheep and goats have been estimated to increase at five (5) and seven (7) percent per annum, respectively. However, the cross breeding of indigenous and exotic species of livestock is reported to be on the increase in Zambia (FAO and IAEA, 2014).
3.4 Values of Biodiversity Components in Zambia
3.4.1 Livelihood and national economic values of biodiversity components
a) Forests and forest resources
Forests are known as a valuable natural and economic resource for supporting natural systems and improving peoples’ livelihoods. Zambia’s forests are also important repositories of biodiversity and provide a wide range of goods for livelihoods (especially for the rural poor) such as timber and non-timber forest products including, fibre, medicinal plants, edible wild vegetables, edible wild fruits, edible insects, bush meat, mushrooms, honey, etc. Overall, harvested forest products make a significant contribution to incomes of the rural poor. Forest contribution to rural household income is estimated at 20.6 percent. The direct and indirect values of forests considered (excluding the market value of carbon) and when the multiplier effects of forestry and tourism-related activities on other sectors are taken into account, the overall or Zambian economy-wide contribution of forests on GDP was estimated to be at least 6.3% or US$1,252 million (Turpie et al. 2014)13.
11 Mulemba, H. 2014. Agriculture future scenarios for Southern Africa: The Livestock Sector in Zambia and rising food prices – Country Briefing Zambia. IISD Traditional Knowledge Network. 12 Ibid. 13 Turpie, J., B. Warr, J. Carter Ingram and M. Masozera. 2014. The Economic Value of Zambia’s Forest Ecosystems and potential benefits of REDD+ in Green Economy Transformation in Zambia. Report to the United Nations Environment Program on behalf of the Ministry of Lands, Natural Resources and Environmental Protection, Zambia
Figure 16: Indigenous cattle of Western Zambia of a large body frame with long horns that spread from the head and curve backwards.
21
b) Wetlands and wetland resources
Wetlands, including rivers, lakes, swamps and dambos, are a source of livelihood for the majority of rural populations in Zambia. Total water withdrawal from river systems was 1.737 km3 in 2000, with agriculture use accounting for 1.320 km3 (77 percent), or more than three-quarters of the total domestic water use claiming 0.286 km3 and industries taking 0.131 km3 (GRZ, 2013). Dambo and floodplain wetlands are used for grazing animals in the dry season when upland vegetation is dry and with little nutritive value. They are also important for fishing, livestock-watering, hunting of small animals, collection of thatching grass, and most importantly, for dry season vegetable growing. The fisheries sub-sector plays an important role in the economy of the country through the provision of employment and income generation, and contributes to food and nutrition security. The sub-sector contributes about 3.2% to national GDP (GRZ, 2013)14. Current estimates indicate that over 300,000 persons directly or indirectly obtain part of their income from the fisheries sector. Fish accounts for 29% of the animal protein supply (CSO, 2006)15.
c) Agro-ecosystems and agro-biodiversity resources
Food and livelihood security of many people and communities depend on the sustained management of various biological resources that are important for food and income generation from agro-ecosystems which include, harvested crop varieties, livestock breeds, fish species and non-domesticated (wild) resources within field and livestock/ forest rangelands. There are three main categories of farmers in Zambia relying on the agro-ecological system; i) small scale; ii) medium-scale and iii) large-scale. The number of small-scale households involved in farming is estimated at 1,417,992 million (Lubangu and Mofya-Mukuka, 2012)16. In terms of crop production, these account for an estimated 80 percent of output. The contribution of small scale farmers to livestock production has been around 30%. A small number of commercial or large scale farmers are involved in commercial crop and livestock production. These are responsible for much of wheat, soya bean and sugarcane production for instance, crops that form the backbone of the Zambian agricultural export.
The livestock sub-sector is an increasingly important part of the Zambian agricultural economy. It plays important economic and social roles in the livelihoods of many Zambians, particularly, smallholder farmers. Currently, the livestock sub-sector contributes about 7% to the GDP. Taking into account its contribution in providing draught power, organic fertilizer and its by-products such as hides and skins, in real value terms, its share to GDP is higher.
3.4.2 Value of biodiversity resources for ecosystem services
d) Forests and forest resources The capacity of forests to help capture and store water helps to mitigate floods, soil erosion in periods of heavy rains and ensures steady water flow during drier seasons. Summary of the estimations of the economic value of forestry regulatory services are presented in Box 1below:
14 GRZ, 2013. National Agricultural Policy (DRAFT), Ministry of Agriculture and Livestock, Zambia. 15 Living Conditions Survey 2006, Central Statistical Office, Zambia. 16
Lubangu, M. and R. Mofya-Mukuka (2012).The Status of the Smallholder Livestock Sector in Zambia, Technical Report No.1., IAPRI,
Lusaka, Zambia.
22
Box 1.Estimated economic value of forest regulatory functions
Carbon: The value of carbon can be estimated in terms of its damage costs, but this social cost of carbon (estimated to be $29 per tonne), which if aggregated would amount to about $15 million per annum. In evaluating potential for REDD projects, carbon can also be valued in terms of its market value, which we estimate to be in the region of $6 per tonne. Depending on location, carbon stocks in Zambian forests are potentially worth about $150 per ha on average (once off), but ranging up to $745 per ha for intact forests. Annual values of sequestration in degraded areas are about $16-30 per ha per year. Sediment retention: Based on a model of soil erosion and transport (using InVEST) developed through this analysis, it was estimated that current rates of sediment output are in the order of 250 million tonnes (average 2.23 tonnes per ha), and that sediment retention by forests are on the order of 274 million tones, generating a cost savings of $237 million per annum. Water and climate regulation: Forests have positive benefits on water flows through infiltration or contribute significantly to flood attenuation, so loss of forest cover over large areas could result in reduced precipitation in the region, impacting on flows, water yields and hydropower generation, and driving up the costs of electricity. Pollination: Based on the costs of alternative means of pollination, the value of forest pollination services was estimated to be in the order of $74 million per annum. Source: Turpie et al., 201417
e) Wetlands and wetland resources Wetland ecosystems provide water for different uses by storing water (sponge effect), thus helping to recharge both surface and groundwater sources. Additionally, wetlands improve the quality of water by filtering pollutants and sediments while retaining the nutrients required by wetland species. Wetlands are a major habitat for a number of living organisms key to the national economy and livelihoods. The breeding cycles of mammal species such as the Kafue Lechwe is dependent on the health of the Kafue Flats wetland ecosystems. Bird species such as the Wattled crane, wild ducks, geese and a wide range of fish and other aquatic species depend on wetland habitats.
f) Wildlife
Animals play important ecological roles in the ecosystem. Among these is their role in pollinating flowers of both wild and cultivated plants. Insects are particularly important in this respect, but so are some birds and mammals. The production of legume crops, such as beans, peas and soybean, is wholly dependent on the work of insect pollinators. The survival and genetic diversification of such crops and wild plants is therefore dependent on pollinator animals.
Animals play an important role in the dispersal of seed and germination of some flowering plants. For example, 54% and 82% of understory and shrub species, respectively, in miombo woodland are dispersed by animals. For some species, seed germination is improved after the seed has passed through the digestive system of birds and ruminants. Animal dung, especially of birds, bats and ruminants, are important sources of plant fertilizers which improve plant production in both wild lands and croplands.
17
Turpie, J., B. Warr, J. Carter Ingram and M. Masozera. 2014. The Economic Value of Zambia’s Forest Ecosystems and potential benefits of
REDD+ in Green Economy Transformation in Zambia. Report to the United Nations Environment Program on behalf of the Ministry of
Lands, Natural Resources and Environmental Protection, Zambia. Chapter 6, Draft. 131 pp.
3.4.3 Threats to biodiversity
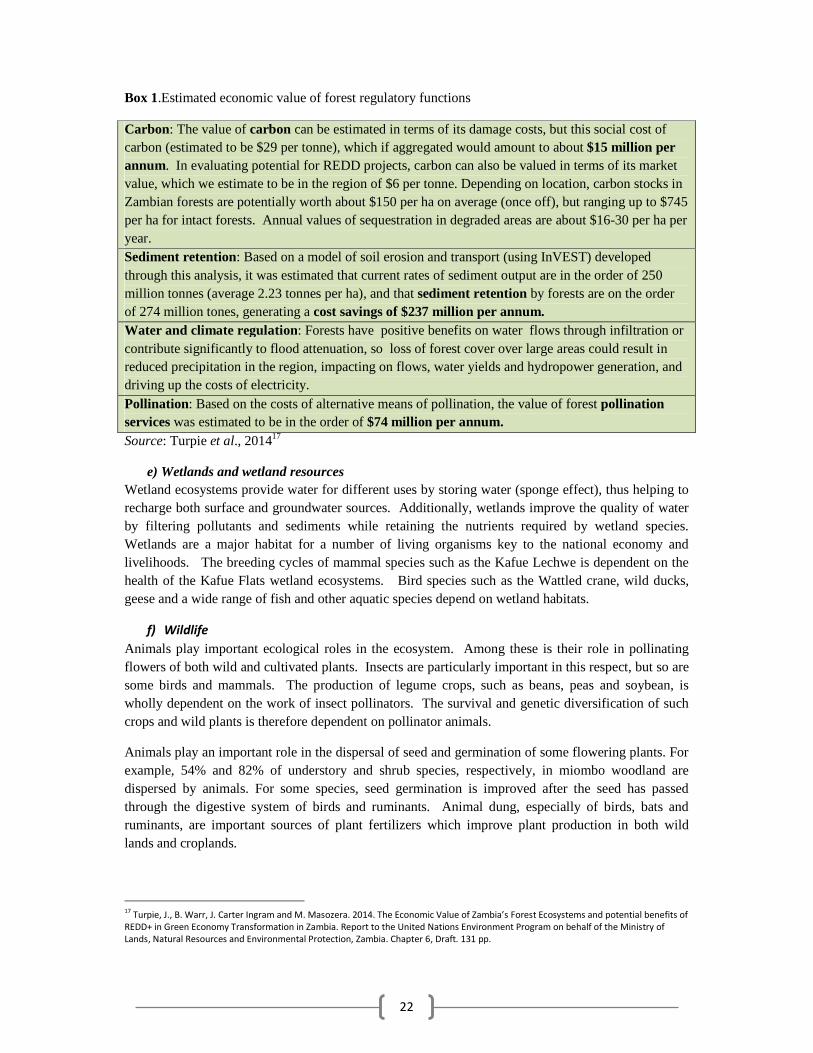
3.4.3.1 Habitat transformation Among the most serious threats to plants and their habitats are deforestation and forest degradation. Northern Zambia has lost much of its primary forest cover (Figure 17), largely due to shifting cultivation (Chidumayo, 1987; Sprague and Oyama, 1999). This is also the area with the highest diversity of flowering plants.
Thus deforestation and forest degradation are major threats to plant biodiversity in northern Zambia. In the east, central and southern Zambia, conversion of forest land to permanent crop agriculture is the main driver of forest cover loss and degradation.
Figure 17: Areas (red) with over 40% of primary forest cover loss in Zambia with overlays of forest reserves (grey outlines) and national parks (black outlines). Based on Chidumayo (2012).
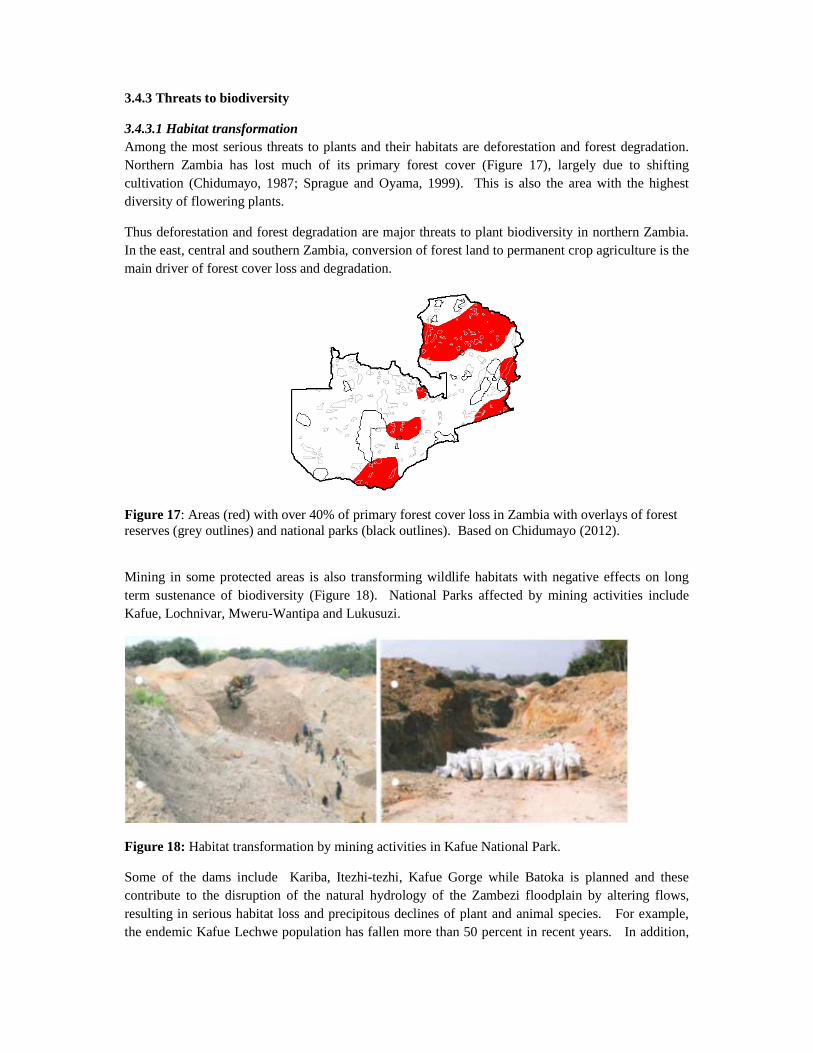
Mining in some protected areas is also transforming wildlife habitats with negative effects on long term sustenance of biodiversity (Figure 18). National Parks affected by mining activities include Kafue, Lochnivar, Mweru-Wantipa and Lukusuzi.
Figure 18: Habitat transformation by mining activities in Kafue National Park.
Some of the dams include Kariba, Itezhi-tezhi, Kafue Gorge while Batoka is planned and these contribute to the disruption of the natural hydrology of the Zambezi floodplain by altering flows, resulting in serious habitat loss and precipitous declines of plant and animal species. For example, the endemic Kafue Lechwe population has fallen more than 50 percent in recent years. In addition,
local communities blame the decline in fish yields and forage in riparian grazing areas on flow alterations produced by the dams.
3.4.3.2 Encroachment A comparison of FD data (2000 and 2of forest reserves. Soaring levels of encroachment through cultivation and settlement have compromised the protected forest areas. By 2011, it was estimated that less than half of the NationaForest estate could be considered free from encroachment or settlement (GRZ 2004
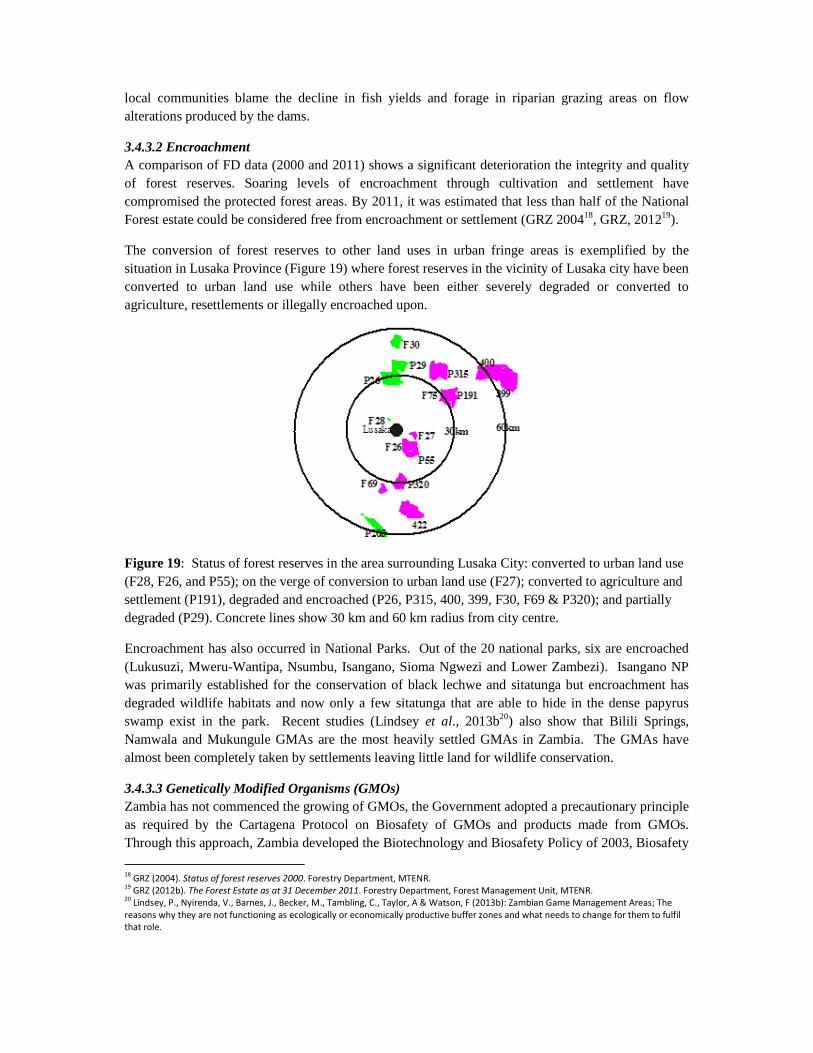
The conversion of forest reserves to other land uses in urban fringe areas is exemplified by the situation in Lusaka Province (Figure 19converted to urban land use while others agriculture, resettlements or illegally encroached upon.
Figure 19: Status of forest reserves in(F28, F26, and P55); on the verge of conversion to urban land use (F27); converted to agriculture and settlement (P191), degraded and encroached (P26, P315, 400, 399, F30, F69 & P320); and partdegraded (P29). Concrete lines show 30 km and 60 km radius from city centre.
Encroachment has also occurred in National Parks. Out of the 20 national parks, six are encroached (Lukusuzi, Mweru-Wantipa, Nsumbu, Isangano, Siwas primarily established for the conservation of black lechwe degraded wildlife habitats and now only a few sitatunga that are able to hide in the dense pswamp exist in the park. Recent studiesNamwala and Mukungule GMAs are the most almost been completely taken by settlements leaving little land for wildlife conservation.
3.4.3.3 Genetically Modified OrganismsZambia has not commenced the growing of GMOs, the Government adopted a precautionary principle as required by the Cartagena Protocol on BiosafetyThrough this approach, Zambia developed the Biotechnology and Biosafety Policy of 2003, Biosafety
18
GRZ (2004). Status of forest reserves 2000. Forestry Department, MTENR. 19
GRZ (2012b). The Forest Estate as at 31 December 201120
Lindsey, P., Nyirenda, V., Barnes, J., Becker, M., Tambling, C., Taylor, A & Watson, F (2013b): Zambian Game Management Areas
reasons why they are not functioning as ecologically
that role.
local communities blame the decline in fish yields and forage in riparian grazing areas on flow
A comparison of FD data (2000 and 2011) shows a significant deterioration the integrity and quality Soaring levels of encroachment through cultivation and settlement have
compromised the protected forest areas. By 2011, it was estimated that less than half of the NationaForest estate could be considered free from encroachment or settlement (GRZ 200418, GRZ, 2012
The conversion of forest reserves to other land uses in urban fringe areas is exemplified by the Figure 19) where forest reserves in the vicinity of Lusaka city have been
to urban land use while others have been either severely degraded or converted to agriculture, resettlements or illegally encroached upon.
: Status of forest reserves in the area surrounding Lusaka City: converted to urban land use (F28, F26, and P55); on the verge of conversion to urban land use (F27); converted to agriculture and settlement (P191), degraded and encroached (P26, P315, 400, 399, F30, F69 & P320); and partdegraded (P29). Concrete lines show 30 km and 60 km radius from city centre.
Encroachment has also occurred in National Parks. Out of the 20 national parks, six are encroached Wantipa, Nsumbu, Isangano, Sioma Ngwezi and Lower Zambezi).
was primarily established for the conservation of black lechwe and sitatunga but encroachment degraded wildlife habitats and now only a few sitatunga that are able to hide in the dense p
Recent studies (Lindsey et al., 2013b20) also show that Namwala and Mukungule GMAs are the most heavily settled GMAs in Zambia. The GMAs have almost been completely taken by settlements leaving little land for wildlife conservation.
rganisms (GMOs) Zambia has not commenced the growing of GMOs, the Government adopted a precautionary principle as required by the Cartagena Protocol on Biosafety of GMOs and products made from GMOs. Through this approach, Zambia developed the Biotechnology and Biosafety Policy of 2003, Biosafety
. Forestry Department, MTENR.
31 December 2011. Forestry Department, Forest Management Unit, MTENR.
Lindsey, P., Nyirenda, V., Barnes, J., Becker, M., Tambling, C., Taylor, A & Watson, F (2013b): Zambian Game Management Areas
reasons why they are not functioning as ecologically or economically productive buffer zones and what needs to change for them to fulfil
local communities blame the decline in fish yields and forage in riparian grazing areas on flow
tegrity and quality Soaring levels of encroachment through cultivation and settlement have
compromised the protected forest areas. By 2011, it was estimated that less than half of the National , GRZ, 201219).
The conversion of forest reserves to other land uses in urban fringe areas is exemplified by the ) where forest reserves in the vicinity of Lusaka city have been
have been either severely degraded or converted to
the area surrounding Lusaka City: converted to urban land use (F28, F26, and P55); on the verge of conversion to urban land use (F27); converted to agriculture and settlement (P191), degraded and encroached (P26, P315, 400, 399, F30, F69 & P320); and partially
Encroachment has also occurred in National Parks. Out of the 20 national parks, six are encroached ezi). Isangano NP
and sitatunga but encroachment has degraded wildlife habitats and now only a few sitatunga that are able to hide in the dense papyrus
Bilili Springs, The GMAs have
almost been completely taken by settlements leaving little land for wildlife conservation.
Zambia has not commenced the growing of GMOs, the Government adopted a precautionary principle of GMOs and products made from GMOs.
Through this approach, Zambia developed the Biotechnology and Biosafety Policy of 2003, Biosafety
Lindsey, P., Nyirenda, V., Barnes, J., Becker, M., Tambling, C., Taylor, A & Watson, F (2013b): Zambian Game Management Areas; The
nge for them to fulfil
Act No. 10 of 2007, a few necessary regulations and guidelines. Two local laboratories were also set up for detecting GMOs. To that effect, the National Biosafety Authority Board was inaugurated in 2015 and charged with the responsibility of regulating research, development, application, import, export, transit, contained use, release or placing on the market of any genetically modified organism whether intended for use as a pharmaceutical, food, feed or processing, or product of genetically modified organism prevents any harm to humans and animal health or any damage to the environment, non-genetically modified crop and biological diversity.
3.4.3.4 Uncontrolled wild fires Uncontrolled bush fires contribute to forest degradation in Zambia (Trapnell, 1959; Lawton, 1978; Chidumayo, 2013). Most wild fires that damage forests and woodlands in Zambia are caused by human activities. Annual burning is very common in agro-ecological region IIA which includes the main national parks in the country (Figure 20). In fact, incidences of wild fires in Kafue National Park have increased by nearly 2% per year over the 2004 – 2008 period. Other studies have shown that approximately 25% or an average of 188,000 km2 of Zambia’s total land area burnt annually between 2007 and 2012 (Sikaundi, 2013; Hollingsworth et al., 2015). Most of agro-ecological zone III tends to be burnt once in 3 – 4 years. The actual damage to biodiversity of these wild fires has not been adequately assessed. However, frequent late fires prevent regeneration of fire-intorelant species and induce changes in species diversity. The result is often “fire-trapped” open vegetation that has low species diversity (Trapnell, 1959; Lawton, 1978). Early dry season burning is recommended in forestry because it promotes forest production but in practice this conflicts with the cultural and traditional uses of bush fire in Zambia where bush burning is done during the late dry season (Eriksen, 2007). Complete fire protection increases the risks of more severe and damaging accidental bush fires in the late dry season (Chidumayo, 1997) and reduces the diversity of understorey species (Chidumayo, 1988). Fire management therefore needs to take into account local ecology and local uses of fire.
Figure 20: Distribution pattern of fire frequency in Zambia. Based on Barbosa et al. (1999). Red for areas burnt annually, white for areas that burn once in 2 – 3 years and green for areas that burn once in 3 – 4 years.
26
3.4.3.5 Climate change It has been scientifically established that anthropogenic emissions of greenhouse gases and other atmospheric pollutants are changing global climate. Global surface temperature has increased by over 0.5°C in the past 100 years. A similar rate of warming of about 0.05°C per decade in Southern Africa has been observed during the present century (Hulme 1996)21. The six warmest years in this century in Southern Africa have all occurred since 1980. Mean modelled trends for Zambia show a temperature increase of between 2oC and 2.5oC between 1950 and 2050 for Zambia and the Kafue River basin coupled with an increasing variability in rainfall within similar ranges to present means (+3% to -3% by 2011) with an increase in the percentage of rain falling in heavy events during the rain months22. Recent projections for annual maximum temperature show an increase in the range of 1oC – 2oC or even 2oC – 3.5oC.23 The rainfall in the Southern African region has been decreasing in the last 25 years (Hulme 1996). The annual rainfall anomalies from the 1970–2000 annual averages computed using observed data from 32 meteorological stations in Zambia for the agro-ecological regions indicate that of the 14 years from 1990/1991 to 2003/2004, at least 10 years in each agro-ecological region had below normal rainfall. It was further noted that the variability in annual totals across the three agro-ecological regions has not been uniform. The southern region (AER I) has experienced more severe dry seasons than the central region (AER II) in the last 20 years. Recent work on projected future trends in rainfall using various Global Circulation Models differ in their results regarding mean annual precipitation ranging from an overall decrease to significant and widespread increases.24 Rising temperatures are foreseen to negatively affect both crop and livestock productivity and raising the need for careful consideration for agro-biodiversity conservation for drought resistant genetic resources to withstand the rise in temperatures and associated diseases and pests burdens that are likely to occur as a result. Studies have also shown that Zambia’s fish stocks are in danger (Kalantary, 2010; Musumali et al. 2012)25. Water levels are predicted to decline in rivers and lakes due to increased evaporation induced by rising temperatures and reduced precipitation, consequently affecting fish productivity and the fishing industry. Some fish species such as the breams and sardines, which are the most vulnerable ones and yet the most sought after, might not survive the environmental change. Some communities also depend on wildlife as a source of nutrition. However, change in rainfall frequencies is projected to alter the migrating behaviours of species such as puku, lechwe and waterbuck thus impacting negatively on local communities
21 Hulme, M, 1996. Climate change and Southern Africa. Climatic Research Unit, University of East Anglia, UK. 22 IFC, 2011 : Climate Risk and Business, Hydropower, Kafue Gorge Lower Zambia 23 Kanyanga, J., Hachigonta, S., Sibanda, L.M., & Thomas, T.S. (2013). Zambia. In S. Hachigonta, G.C. Nelson, T. S. Thomas and L.M. Sibanda (eds.). Southern Africa agriculture and climate change: a comprehensive analysis. Washington, DC. International Food Policy Research Institute 24 Kanyanga, J., Hachigonta, S., Sibanda, L.M., & Thomas, T.S. (2013). Zambia. In S. Hachigonta, G.C. Nelson, T. S. Thomas and L.M. Sibanda (eds.). Southern Africa agriculture and climate change: a comprehensive analysis. Washington, DC. International Food Policy Research Institute 25 Couroche Kalantary, 2010. Climate Change in Zambia: Impacts and Adaptation. Global Majority E-Journal, Vol. 1, No. 2, pp. 85-96 Musumali, M.M., S. Heck, S.M.C. Husken and M.hart. 2012. Fisheries in Zambia: An Undervalued Contributor to Poverty Reduction. Policy Brief |1913. World Bank and World Fish Center.
who depend on these species as source of nutrition. Also, higher temperatures and droughts will prevent forests from regenerating properly. The regenerative capacity of the miombo forest, which covers 60% of the country and containing a variety of biodiversity components that provide a wide array of ecosystem goods and services, will be impaired. Consequently, this will impact negatively on local livelihoods, biodiversity and the national economy26. A recent pan-African study of the distribution range of the baobab (Adansonia digitata) using Maxent spatial range modeling forecasts a considerable contraction in the future distribution of this iconic tree species (Sanchez et al., 2011). Figure 21 based on the HadCM3-A2a future climate scenario shows that the baobab future potential range will contract to four isolated areas within what is now a continuous distribution range in Zambia.
Figure 21: Current and potential future distribution range of baobab in Zambia (Source: Sanchez et al., 2011)
The main threat to the Black-cheeked lovebird is the gradual drying up of water bodies in southwest Zambia where the distribution range of this bird is concentrated probably due to warming and drying (Warburton and Perrin, 2005). Warming and drying may also alter the distribution range of disease vectors. For example, the current distribution of the main tick vector species (Rhipicephalus appendiculatus) (Figure 22) that is involved in the transmission of East Coast fever (Theileriosis) is projected to expand in Zambia (Olwoch et al., 2008). There is need therefore to expand and intensify surveillance and control activities of this and other vector species in the future to conserve livestock biodiversity.
26 Couroche Kalantary, 2010. Climate Change in Zambia: Impacts and Adaptation. Global Majority E-Journal, Vol. 1, No. 2, pp. 85-96
Figure 22: Current distribution pattern of a tick vector species (Rhipicephalus appendiculatus) in
Zambia (Source: Olwoch et al. (2008).
3.4.3.6 Invasive species Some introduced species have become very invasive and pose threats to ecosystems and their constituent indigenous flora and fauna (Figure 25). Among such species are Lantana camara and Mimosa pigra. Lantana is known to negatively affect the regeneration of some indigenous species, such as Bauhinia petersiana (Lwando and Chidumayo, 2009). Mimosa pigra, together with the indigenous Dichrostachys cinerea have been expanding their range in the Kafue Flats, perhaps due to climate change and flood regime regulation, at the expense of some indigenous herbaceous plants and the grassland ecosystem (Indira, 2007; Nkandu, 2012).
Crayfish (Cherax quadricarinatus) is another serious invasive species found in the Kafue flats and Kariba. The exotic Nile tilapia (Oreochromis niloticus) escaped from aquaculture into the Kafue River in the 1980s (Schwanck, 1995) and in 2008 this species was distributed throughout the Kafue River between Itezhi-tezhi and Kafue Gorge dams and is now as common as the native O. andersonii (Deines et al., 2012). Clearly this exotic species is increasing at a faster rate and may well out-dominate or replace the native tilapia in the Kafue fishery in future.
Figure 23: Parts of Zambia that have been worse affected by aquatic invasive weeds
3.4.3.7 Unsustainable utilization A number of timber species are known to be locally threatened due to overexploitation that has caused mature trees to become rare. Among these include Afzelia quanzensis, Daniela ostiniana, Pterocarpus angolensis, Khaya nyasica and Mitragyna stipulosa (Chidumayo and Njovu, 1998). This is in spite of declaring some of these species as protected or reserved. Currently, seventeen species of trees are reserved under the Forest Law and can therefore only be cut under license although in practice this is difficult to enforce. Over-harvesting of edible tubers of some orchids, especially for sale, is also threatening some local orchid populations.
Bush meat hunting remains a major threat to biodiversity conservation. It has been observed that in almost all areas the populations of some of the animal species has decreased due to poaching which occurs in almost all GMAs. Available evidence indicates that poaching for bush meat trade combined with continued reduction in wildlife habitats are the major factors affecting the growth of wildlife populations in the country. It has been demonstrated that loss of highly valuable fish species in water bodies often results from the use of unsustainable fishing methods such as use of mosquito nets and catching small fishes.
Quantities of caterpillar worm in Mpika, Chinsali and central Zambia significantly reduced between 2008 and 2013. There could be several factors attributed to this reduction. With little control of the collection and trade in the worm, coupled with increasing incidence of poverty in landscapes where the worms are found, there is a general increasing trend of overexploitation and a decline in selective harvesting.
3.4.3.8 Pollution The immediate effect of pollution in ecosystems is the reduction in the quality of biodiversity goods or products. For example, a study in the Upper Kafue River in Chililabombwe district revealed that the concentration of heavy metals in fish was quite high (Chidumayo et al., 1997). Pollution often has lagged effects on species diversity. However, effluent from the mines discharged into the Kafue river system has been reported to negatively affect the diversity of butterflies, dragonflies and other benthonic invertebrates as a result of elevated levels of redox, electrical conductivity and turbidity (Chama and Siachoono, 2015).
30
3.4.3.9 Diseases and pesticides Invertebrates have been documented to be impacted negatively by the use of non-targeted spraying of persistent organo-insecticides in the control of Trypanosomiasis (Julius et al., 2014). Diseases can cause population declines, dramatic die-off or reductions in the reproductive processes and survival of species. In the Kafue NP, every year, there are reported deaths of Waterbucks. This is also recorded in the Lochnivar NP among Buffalos that die due to Foot and Mouth disease (personal comments from Head of Planning, ZAWA).
3.4.4 Key achievements, gaps and priority needs
Zambia’s 1999 National Biodiversity Strategy and Action Plan (NBSAP1) set out a total of 14 targets. NBSAP1 implementation towards the set targets encountered a number of challenges, notably an inadequate monitoring framework to assess changes in the baselines and an absence of a clear financing framework. A monitoring plan was developed but it's effective implementation encountered logistical challenges. A review of achievements towards the set targets under the 1999 NBSAP shows modest results. Most of the actions taken could broadly be classified as means rather than ends in meeting the set targets. In other cases, there were no direct actions taken and hence there was no data available. These challenges will be taken into account and addressed to ensure implementation of NBSAP-2 is more effective.
3.4.4.1 Area-specific priority needs The major source of concern in Agro-ecological Zone I is drought drought resulting in inadequate water which is impacting negatively on agro-biodiversity and agricultural production and wildlife, especially in Mosi-oa-Tunya National Park, Sioma Ngwezi National Park and the southern part of Kafue National Park and its buffer zones. The need for climate change adaptation is urgent in these regions and possible actions will include effective water management technologies, development and promotion of drought tolerant crops and livestock, effective water management, including provision of drinking water to humans, wildlife and livestock.
In Mweru-Wantipa system, the fluctuation in water levels in the Lake and its swamps is the major source of concern. The precise causes of water level fluctuations are not well known, hence there is need to carry out hydrological studies of the Mweru-Wantipa system. These fluctuations may be contributing to the decline in fish production in the Mweru-Wantipa fishery and the attendant socio-economic impacts on the communities in this system. Mweru-Wantipa also has a number of threatened invertebrate species including Ballamyamweruensis and B. pagodiformis.
Under the Kafue river system, threats which require attention include the spread of invasive species (e.g., Mimosa pigra and crayfish, etc.), pollution and unsustainable utilization of biodiversity resources, threatening major catchments for the Kafue and Zambezi Rivers. Therefore, catchment protection, proper management of invasive species and habitat restoration are critical requirements. Pollution from mining, industrial and agricultural activities require strict control measures so that they do not cause widespread damage to biodiversity, goods and ecological services. Unsustainable utilization of forest and fish resources is also emerging as an important environmental problem in the region and needs serious attention.
3.4.4.2 National and global priority needs The key national need relates to inadequate information and data about trends on biodiversity in the country. Without a good knowledge base, it is almost impossible to prioritize investment in the biodiversity sector. It is therefore necessary to carry out periodic censuses/inventories and assessments of representative and critical ecosystems/habitats and species.
31
These assessments should be the basis for reviewing the country’s performance in implementing national and international obligations on biodiversity. Implicit in this concern is the need to develop capacity in biodiversity monitoring and analysis through training of personnel and the establishment of biodiversity observatories in representative ecosystems/habitats in the country. The country may require external support in addressing this data challenge.
The key global need of concern is climate change. Because Zambia is already experiencing droughts and floods, it is imperative that the country implements interventions, including Ecosystem Based Adaptation (EbA) and appropriate mitigation actions to address this challenge. For Zambia, this means, among other things, better management of forests to maintain and increase carbon stocks as greenhouse gas sinks and to reduce emissions of greenhouse gases that contribute to global warming from industrial, agricultural and infrastructural development. It will also require undertaking adaptation measures to enhance internal resilience in the economy and among local communities to avert unsustainable use of biodiversity components.
3.4.5 Lessons learned from the previous 1999 NBSAP1 implementation
3.4.5.1 Inadequate monitoring and evaluation framework NBSAP1 lacked an effective monitoring and evaluation framework and hence it has been difficult to assess progress of NBSAP1 implementation without clear baselines and institutional arrangements for data collection, reporting and archiving. NBSAP2 is addressing this issue by putting in place a comprehensive M&E framework. However, there will still be need to establish baselines for the various biodiversity components where gaps have been identified in the Monitoring and Evaluation Plan (Section 4.3).
3.4.5.2 Lack of a resource mobilization plan NBSAP1 lacked a clear resource mobilization plan. As a result, activities undertaken were mostly ad-hoc, project-based with low coordination. NBSAP2 proposes development of a resource mobilization plan with both the Ministry of Finance (MoF) and the Ministry of Lands, Natural Resources and Environmental Planning (MLNREP) taking the lead – focusing on both domestic and external sources, as well as innovative financing sources (see Section 5.3).
3.4.5.3 Ineffective information sharing mechanism on biodiversity at national level NBSAP1 had put in place a Clearing House Mechanism (CHM), however, this was not utilized effectively during the implementation of NBSAP 1 and the CBD Focal Point, which constituted Secretariat for coordination lacked adequate support. NBSAP2 recommends the establishment of both a CHM and provision of support to the to CBD National Focal Point to facilitate timely information sharing on biodiversity conservation in Zambia.
3.4.5.4 Weak coordination NBSAP1 implementation faced challenges of ineffective coordination.. Section 5.1 recommends an institutional framework for a functional and robust coordination framework but building on or using existing structures to ensure non-duplication and synergy. It is important that the Department responsible for environment, as the Focal appoint for the UNCBD, plays the coordination role effectively and diligently.
32
CHAPTER 4: BIODIVERSITY STRATEGY AND ACTION PLAN 4.1 Vision, Goals and Principles for Biodiversity Zambia’s Vision for biodiversity conservation is driven by the Vision 2030 which promotes economic development that takes into account social and environmental safeguards and is operationalized in its five-year national development planning cycle – now going into the Seventh National Development Plan (SeNDP). The vision, goals and principles underpinning NBSAP2 are presented schematically below:
VISION By 2025, biodiversity is valued, conserved, restored and wisely used, maintaining ecosystem services, sustaining a healthy environment and delivering
benefits essential for all Zambians and the Zambian economy.
STRATEGIC GOALS Goal A: Address the underlying causes of biodiversity loss by mainstreaming biodiversity across government and society. Goal B: Reduce the direct pressures on biodiversity and promote sustainable use. Goal C: Improve the status of biodiversity by safeguarding ecosystems, species and genetic diversity. Goal D: Enhance the benefits to all from biodiversity and ecosystem services. Goal E: Enhance implementation through participatory planning, knowledge management and capacity building.
PRINCIPLES
1. Sustainable Use – Biodiversity is a manifestation of the totality of the nation's natural and cultural heritage that requires to be understood, appreciated and used sustainably especially in face of climate change threats.
2. Responsibility – Protection, conservation and sustainable utilization of biodiversity are the responsibility of every Zambian citizen and resident. 3. Equity - All Zambians should benefit equitably from the use of biodiversity resources and services. 4. Participatory - All Zambians should be encouraged to participate in decisions involving the use of the country’s biodiversity. 5. Awareness Raising – Biodiversity has ecological, economic, social, cultural and intrinsic values. 6. Co-existence – Co-existence with other life forms is essential for the long-term survival and prosperity of human kind and protection of healthy and
evolving natural ecosystems for the perpetual co-existence of all life forms. 7. Knowledge – Scientific and indigenous knowledge should contribute to sustainable management and use of biological resources and such knowledge,
innovations and practices about biodiversity should be respected, protected and supported through nationally sanctioned safeguard systems. 8. Informed decisions - Implementation of biodiversity management programmes should take into account the ecological, economic, social and cultural
33
values of biodiversity. 9. Strategic Partnerships – Multi-sectoral co-operation and strategic partnerships for the planning and management of biodiversity are essential for the
effective implementation of the strategy including a dedicated clearing house mechanism for information sharing, archiving and data exchange. 10. Enhanced Conservation – Zambia shall continue to promote both in-situ and ex-situ conservation measures to protect, conserve and secure national
biodiversity resources that are endangered and near extinction. 11. Financial Sustainability – Zambia shall engage external partners, in accordance with national priorities, to mobilize resources to facilitate
implementation of this NBSAP 4.2 The National Biodiversity Strategy and Action Plan Zambia’s second Biodiversity Strategy and Action Plan comprises five (5) Strategic Goals, 18 Targets and 45 Strategic Interventions. Table 8 presents the NBSAP2 including the Targets, Strategic Interventions, Key Performance Indicators (KPIs) and Key Activities (KAs). Table 8: The National Biodiversity Strategy and Action Plan Strategic Goal A: Address the underlying causes of biodiversity loss by mainstreaming biodiversity across government and society. Target Strategic Interventions Key Performance Indicators Key Activities Responsible
1. By 2020, Zambians, especially local communities, are aware of and appreciate the values of biodiversity and the need for its sustainable utilisation.
1.1 Raise public awareness of the value of conserving biodiversity and using it sustainably.
• At least 40% of surveyed key stakeholders residing in and around key biodiversity areas are aware of and appreciate the values of biodiversity
• At least 20% of the rural population surveyed taking steps to sustainably utilise biodiversity
1.1.1 Develop a Communication, Education and Public Awareness (CEPA) strategy for NBSAP2
Ministry responsible for environment and natural resources, information and broadcasting, media, civil society
1.1.2 Conduct public awareness and education campaigns on value of conserving biodiversity and using it sustainably.
• Results of surveys for pre-defined key stakeholders demonstrating change in human behaviour towards biodiversity
1.1.3 Conduct surveys to assess change in behaviour among sensitized stakeholders using the Biodiversity Barometer Tool
Narrative: Awareness-raising is an important tool for biodiversity conservation. The more enlightened the citizens, especially those around major biodiversity areas, are about the value of conserving and sustainably using biodiversity, the more likely their attitudes will positively change towards conserving biodiversity. To ensure a more structured awareness building approach, Zambia will develop a Communications, Education and Public Awareness (CEPA) strategy to be coordinated by the Department of Environment within the Ministry responsible for environment and natural resources. Key stakeholders to be targeted through the CEPA include: policy-makers; technocrats and decision-makers from line ministries; resource managers; traditional authorities; the youth and women’s groups; district councils; local communities; private sector; and civil society organizations.
34
Assumption: There will be timely mobilization and disbursal of resources to undertake the activities to implement the strategy.
Strategic Goal A: Address the underlying causes of biodiversity loss by mainstreaming biodiversity across government and society.
2. By 2020, biodiversity values have been integrated into the Seventh National Development Plan (SeNDP), provincial and district development plans and other planning processes as well as r being incorporated into national accounting and reporting systems, as appropriate.
2.1 quantify and monitor the environmental, economic and social value of biodiversity using biodiversity and ecosystem services using appropriate valuation tools
• Number of appropriate valuation tools assessed and applied.
2.1.1 Conduct an analysis of existing methods for natural resources valuation most compatible with the key biodiversity components being addressed by the NBSAP.
Ministries responsible for environment and natural resources and national development planning, finance and national statistics
• Valuation results for different components of biodiversity.
2.1.2 Conduct a biodiversity components valuation.
2.2 Mainstream biodiversity into the district, provincial, SeNDP and national accounting system.
• Specific chapters within the SeNDP integrating biodiversity values.
2.2.1 Conduct a biodiversity conservation screening of the SeNDP.
• Number of sectoral, provincial and district development plans integrating biodiversity values identified in the SeNDP.
2.2.2 Mainstreaming of the identified biodiversity conservation actions in the sector, provincial and district SeNDP programmes and budgets based on the screening results.
Narrative: Given that about 60% of Zambia’s population (total over 13 million) resides in rural areas27, is largely dependent on natural resources for its livelihood needs in terms of income, food, fuel, medicine and shelter, the valuation of biodiversity and the critical ecosystem services it provides is an important priority for Zambia’s NBSAP2. The results of such valuations will form the basis for informed decision-making and integration into sectoral, provincial and district development planning frameworks and budgets. Among the key lessons from implementation of NBSAP1 have been the lack of clearly defined responsibilities among sectors and institutions addressing biodiversity conservation, and inadequate coordination and collaboration among biodiversity conservation related institutions and the UNCBD Focal Point. Integrating biodiversity in sectoral, provincial and district development planning and budgeting frameworks will help address these gaps.
Assumption: Willingness from Central Treasury and other planning authorities to mainstream biodiversity values in national plans and national accounting framework.
27 CSO. 2014. Living Conditions Monitoring Survey Report 2012 and 2013. Living Conditions Monitoring Branch, Central Statistical Office, Lusaka, Zambia.
3. By 2020, selected incentives for biodiversity conservation and sustainable use are in place and applied, and the most harmful subsidies are identified and their gradual phase-out is initiated.
3.1 Promote appropriate incentives that encourage biodiversity conservation and its sustainable use.
• Number of analyzed incentives and measurement of their potential positive impact on biodiversity.
3.1.1 Identify and analyze potential incentives that encourage biodiversity conservation and its sustainable use..
Ministries responsible for environment and natural resources and Finace/ National Biosafety Authority (NBA)
3.2 Phase out the most harmful subsidies to biodiversity conservation and its sustainable use.
• Number of harmful subsidies analysed and measurement of their potential negative impact on biodiversity.
3.2.1 Identify and analyze the most harmful subsidies to biodiversity conservation and its sustainable use.
Narrative: Incentive measures for biodiversity conservation can comprise a suite of interventions ranging from policy reforms to subsidies and taxes. For instance, without secure land tenure, there is little incentive for land users to invest in long-term sustainability of biodiversity resources and short-term gains are instead maximized through over-utilization of resources as a coping strategy against poverty at household levels. It is generally accepted that once communities are provided with appropriate incentives such as secure land tenure, they are likely to have improved environmental stewardship and opportunities for establishing nature based enterprises. There is need for Government to promote climate smart agriculture practices in continued pursuit to promote food security at household and national levels. This will allow farming in only appropriate and designated zones. Government is also implored to consider deploying the carbon tax towards biodiversity conservation. Assumption: Central Government through the Treasury approves various mechanisms for mobilizing resources for biodiversity conservation.
4. By 2020, baselines for critical biodiversity is established
4.1 Update baselines data on fish, forests and lower plans and wildlife.
• Established and updated baselines for sustainable production and utilization of fisheries.
4.1.1 Update the existing inventory of fish, forests and lower plants and wildlife species in the major conservation landscapes and river system of Zambia
Ministries responsible for environment and natural resources, tourism and arts, agriculture, fisheries and livestock and the NBA
4.2 Promote utilisation of resources within sustainable limits.
• Established and updated baselines for sustainable production and utilization of forests and lower plants.
4.1.2 Conduct additional studies under ILUA II to include lower plants and herbaceous flowering plants to determine the conservation status of individual tree and lower plant species at national level.
4.3 Promote effective information exchange and knowledge management on biodiversity conservation and its sustainable use.
• A functional CHM for information sharing and knowledge management on biodiversity established.
3.2.2 Establish a Clearing House Mechanism (CHM) for information exchange and knowledge management on biodiversity.
Narrative: Information on biodiversity in Zambia is either scanty or missing which makes it very difficult to establish reliable baselines that could be monitored periodically. This is exacerbated by the lack of an established information and knowledge management system as well as a functional Clearing House Mechanism for the collection, archiving and sharing of biodiversity information and data among relevant institutions.
Assumptions: Availability of resources and capacity (manpower and complementary skills) to conduct the baseline surveys and reports.
37
Strategic Goal B: Reduce the direct pressures on biodiversity and promote sustainable use.
5. By 2020, the deforestation rate in Zambia is reduced by at least 25%.
5.1 Promote sustainable agricultural practices.
• 25% reduction in the national deforestation rate.
5.1.1 Conduct a farming systems diagnosis in the areas surrounding the PA systems in the selected landscapes for biodiversity conservation.
Ministry responsible for environment and natural resources, agriculture, finance and energy
5.1.2 Develop and promote farming systems compatible with sustainable agricultural practices in the selected landscapes.
5.2 Promote alternative renewable energy technologies.
5.2.1 Conduct an assessment of alternative energy sources in areas surrounding the selected landscapes for biodiversity conservation.
5.2.2 Develop and promote area specific compatible alternative energy sources.
5.3 Strictly enforce the EIA and SEA provisions of the Environmental Management Act (2011).
5.3.1 Engage independent consultants to undertake EIAs and SEAs.
5.4 Institutionalize integrated land use planning across sectors.
5.4.1 Develop/improve on existing guidelines for integrated land use planning with a biodiversity conservation lens.
5.4.2 Build capacity of key sector actors in the use of the guidelines for integrated land use planning.
5.4.3 Conduct and implement integrated land use planning in the targeted landscapes for biodiversity conservation.
Zambia’s rate of deforestation is currently estimated between 250,000-300,000 ha/yr. Among the key drivers of deforestation and forest degradation in Zambia include: unsustainable agricultural practices; heavy reliance on wood fuel as main source of energy; uncontrolled harvesting and encroachment of the protected and open forest areas; uncontrolled fires; land use and infrastructure development and especially land use that has no regard for forest integrity and biodiversity conservation. To abate deforestation and forest degradation which leads to biodiversity loss requires addressing these key drivers directly including strict enforcement of environmental laws and regulations pertaining to large scale infrastructural developments such as those in mining, agriculture and energy sectors. Assumption: The nation does not face energy crisis similar to the one experienced in 2015 which compelled households to resort to charcoal as an alternative source of
energy.
Government will put in place necessary incentives to promote rapid uptake on alternative energy sources such as solar.
38
Strategic Goal B: Reduce the direct pressures on biodiversity and promote sustainable use.
6. By 2020, fisheries co-management regimes are established in 60% of all major fisheries.
6.1 Promote community-public-private partnerships in fisheries management areas.
• % reduction in unsustainable and illegal fishing practices
6.1.1 Conduct an assessment of the institutional landscape for joint management of the key fisheries areas in Zambia. 6.1.2Develop appropriate fisheries enterprises by communities
Ministry responsible for fisheries
Develop and implement appropriate fishery specific compatible models for co-management.
6.2 Improve monitoring capacity among key stakeholders (Government, Industry, Communities) to curb illegal fishing activities.
Conduct a capacity needs assessment of key stakeholders for biodiversity monitoring based on the impact of their sector’s on fisheries conservation. Develop sector specific guidelines for fisheries biodiversity conservation monitoring. Train sector actors on the use of the guidelines.
Develop and implement sector specific fisheries biodiversity monitoring implementation plans.
6.3 Develop an equitable benefit distribution system (BDS) for key stakeholders engaged in fisheries co-management.
Assess the most equitable and effective BDS in fisheries co-management based on the major fisheries in the country. Implement the most practical and equitable BDS for fisheries co-management in all the major fisheries.
6.4 Promote natural restocking in fishery management areas and other fish depleted water bodies by protecting fish breeding areas.
Conduct a fish biodiversity assessment of the targeted fisheries. Identify the breeding grounds of the fishery and declare them as protected. Impose a moratorium on fishing of threatened species to allow for natural restocking of the threatened species.
Narrative: Both private industrial fishing companies and local communities are identified and recognized as potential co-managers in sustainable fisheries by the Fisheries Act (2011). However, mechanisms to operationalize these legislative provisions have been weak and benefits to the co-managers have been unclear or not defined. NBSAP2 offers an opportunity to ensure sustainable fishing practices in Zambia’s major fisheries and fishery management areas through meaningful partnerships and strict enforcement of
39
the Fisheries Act (2011).
Assumptions: Land use plans being in place which integrate fisheries development.
Creation of enabling conditions for the establishment of community fisheries enterprises and fisheries areas.
7. By 2025, areas under agriculture, aquaculture and forestry (forest reserves, parks, Game Management Areas, forest concessions, open areas) are managed sustainably, ensuring conservation of biodiversity.
7.1 Promote sustainable agriculture practices in areas designated for agricultural production in line with national, regional
7.2 Promote aquaculture in Identified areas and ensure that the practice does not contribute to erosion/extinction of indigenous fish species.
• At least 50% of area (ha) under aquaculture sustainably managed.
7.2.1 Use existing mapping of appropriate areas and reconcile it with the fisheries areas most vulnerable to erosion extinction of indigenous fish species.
Ministries responsible for Land ,Agriculture, Fisheries Forestry, Environment, Chiefs and Traditional Affairs, Wildlife and National Heritage
7.2.2 Promote aquaculture based on the mapping and reconciliation.
7.3 Mainstream climate change adaptation measures that will enhance resilience of priority ecosystems.
• Vulnerability assessments of priority ecosystems.
7.3.1 Undertake vulnerability and adaptation assessment on prioritized ecosystems in Zambia.
7.4 Promote Community Forest Management, Joint Forest Management and Private Forest Management as provided for in the Forest Policy (2014) and Forest Act (2015).
• At least 65% of area (ha) under national and local forest reserves sustainably managed.
• At least 50% of forest area (ha) under open areas sustainably managed.
7.3.1 Conduct an assessment of the value of forests and institutional arrangements (including traditional structures) for natural resources management in open areas, protected forest areas and concession forest areas.
40
7.5 Promote management of
wildfires in biodiversity areas such as forests, GMAs, NPs and wetlands
7.6 Promote management of
National Parks and GMA’s in accordance with the management plans
• At least 80% of forest area (ha) under concessions sustainably managed
• Reduce incidence of wildfires in critical biodiversity areas by 30%
• No encroachment in national parks
• 75% of GMAs comply with the GMPs
•
7.3.2 Based on the assessment results develop and promote area specific legally binding co management models implementation.
7.3.3 Develop and implement fire management plans
7.3.4 Conduct monitoring incidences of
wildfires
7.3.5 Promote Public- Private- Community Partnerships (PPCPs) in the management of protected areas
7.7 Regularize Forest Management Plans for NPs to ensure connectivity, habitat resilience and ultimate refuges for wildlife in face of climate change.
• At least 80% of forest area (ha) under national parks sustainably managed.
7.7.1 Conduct an assessment/update of corridors in adjoining protected areas.
7.7.2 Develop and implement management plans for the protection of the corridors.
7.8 Rezone GMAs (legally), identify and map wildlife refuges taking into account existing land uses (e.g., settlements, agriculture and infrastructure development).
• At least 60% of forest area (ha) under Game Management Areas sustainably managed.
• Wildlife refugias are protected.
7.8.1 Conduct a status assessment of the GMAs.
7.8.2 Identify and map critical wildlife refuges in the GMA.
7.8.3 Based on the results of 1 and 2 above, rezone GMAs and provide maximum protection for the identified wildlife refugias.
7.8.4
Narrative: The major threats to biodiversity in the Zambia are habitat transformation, spread of genetically modified organisms, wild fires, climate change, invasive species, unsustainable utilization of biodiversity resources, diseases and pollution as well as forest conversion emanating from other land uses. Inadequate policy harmonization, inadequate knowledge management system, weak law enforcement, low stakeholder participation in biodiversity management and lack of clear benefit distribution systems – have all impacted negatively on biodiversity conservation. Addressing these threats and inadequacies will improve sustainable management and utilization of Zambia’s biodiversity.
Assumptions: Stakeholder in critical biodiversity areas are sensitized on the impacts wildfires on biodiversity, and on the use of genetically modified organisms.
8. By 2020, pollution, including excess nutrients from industry (mining, agriculture, etc.), has been brought to levels that are not detrimental to ecosystem functions and biodiversity.
8.1 Revise EIA Regulations to provide for strict enforcement of provisions in the Environmental Management Act on pollution control and management.
• % reduction in effluent loads from industry (baselines to be obtained from ZEMA).
8.1.1 Conduct an analytical assessment of the effectiveness of the existing provisions for pollution control from a biodiversity conservation perspective.
Ministries responsible for environment and natural resources, water, agriculture, fisheries and livestock, finance, commerce, trade and industry
8.1.2 Revise the EIA regulations to reflect strict enforcement of the pollution control from the biodiversity conservation perspective.
8.2 Oblige the all industries to contribute to the Environmental Protection Fund (EPF)
• Volume of funds contributed to the EPF by the mining industry.
8.2.1 Transfer the Environmental Protection Fund from the ministry responsible for mines to Central Treasury
8.2.2 Reform the fund to incorporate other industries and to broaden its scope to cover biodiversity conservation
Narrative: The main sources of pollution in Zambia have been identified as primarily emanating from mining, industrial and agricultural activities, resulting in widespread damage to biodiversity, goods and ecological services. Freshwater systems have been shown to be particularly vulnerable, as discharges tend to spread rapidly in these systems. A recent report by the Office of the Auditor General (OAG, 2014) points to several institutional failures as contributing to the pollution problem including: (a) inadequate measures to ensure that environmental degradation caused by mining activities are effectively and efficiently managed; (b) weak regulatory framework such as lack of revised EIA regulations; and (c) failure by mining companies to contribute to the Environmental Protection Fund as required by law. Industry non-compliance with mining and environmental regulations as well as licensing conditions is significantly contributing to environmental degradation manifested in air and water pollution through chemical loading from mining effluents (OAG, 2014).
Assumption: Government willingness to amend the environmental protection fund as proposed.
9. By 2020, invasive alien species (Mimosa pigra, Hyacinth,
9.1Develop programmes to control or eradicate the spread of key invasive species.
• Targeted three invasive species controlled or eradicated. .
9.1.1 Update existing mapping of types and spread of invasive species in the country.
Ministries responsible for wildlife, environment and natural resources
42
crayfish, and Lantana camara) and pathways are identified and controlled or eradicated
9.1.2 Develop and implement an updated programme for the control of invasive plant and fish species.
and energy and water
Narrative: Zambia has reported invasive species affecting both terrestrial and aquatic biodiversity. Among the common species affecting terrestrial biodiversity include: Mimosa pigra; Lantana, camara; Argemone mexicana; Cardiospermum grandiflorum; Tithonia diversifolia and Tithonia rotundifolia. Aquatic biodiversity is affected by invasive species such as: Eichhornia crassipes; Pistia stratiotes; Nile tilapia (Oreochromis niloticus) and Crayfish (Cherax quadricarinatus).
Assumption: No introduction of new invasive species, and the geographical spread of the existing invasive species does not increase
Strategic Goal C: Improve the status of biodiversity by safeguarding ecosystems, species and genetic diversity.
10. By 2020, Zambia’s Protected Area (PA) network is rationalised to achieve representativeness and ecological connectivity at landscape level.
10.1 Assess Zambia’s PA system representativeness across the national landscape.
• Rationalized PA system at landscape level in the nation.
• Number of new PAs that have been considered representative and included in the national PA system.
10.1.1 Conduct/update the identification of all major ecosystems/habitats in each defined bio-geographical region of the country based on the vegetation classes of Edmonds (1976).
Ministries responsible for wildlife, forestry and fisheries, and the NBA
10.1.2 Conduct an assessment of representativeness of the identified ecosystems/ habitats in the existing protected areas (emphasis on National Parks and Forest Reserves).
10.1.3 Identify major ecosystems either not represented or poorly represented in the existing protected areas.
10.1.4 Map the distribution of unrepresented and poorly represented ecosystems/habitats to guide the reclassification of the protected areas.
43
Narrative: Zambia’s Protected Area (PA) Network (about 40% of the country) – which comprises 20 National Parks, 490 Forest Reserves, 59 botanical reserves, 36 GMAs and eight (8) Ramsar sites is seemingly adequate for biodiversity conservation in the country. However, this PA system is currently not rationalized in terms of representativeness and ecological connectivity; some of the PA components date back to the 1950s and were established for reasons that were valid then but maybe not now. Still, Zambia has a great opportunity to ensure a viable PA system that conserves maximum biodiversity in the country given the expanse of its current PA system, contained species and existence of supportive policies, as well as threats of climate change and variability. A rationalized national PA system will be critical in mitigating potential land use conflicts, in enhancing climate resilience and thus contributing to good natural resource governance and biodiversity conservation in the long term.
Assumption: In the event of stakeholders affected, they will be willing to have their land included in the PA network.
11. By 2022, the populations of threatened and endemic species and their protection status, has been improved and sustained.
11.1 Develop and promote programmes to sustain the current population of threatened and endemic species..
• Kafue Lechwe’s current population of ~30,000 secured and increased by 30%.
11.1.1 Update the threats to the current Kafue Lechwe population.
Ministries responsible for wildlife, forestry and fisheries
11.1.2 Develop implementation strategy for the protection of the Kafue Lechwe to increase its population based on the identified threats.
11.2 Promote programmes to sustain the current rhino population in the country and/or increase its population status
• Rhino – current population of 42 secured and increased by 21%.
11.2.1 Update the threats to the current Rhino population.
11.2.2 Develop implementation strategy for the
protection of the Rhino to increase its population.
11.3 Establish population baselines for the Shoebill and Wattled crane and put measures in place to sustain and increase their population status.
• Shoebill and Wattled crane – baseline populations secured and % increase in the baseline populations.
• Updated list of threats to the Shoebill and Wattled crane
• Protection strategies for the Shoebill and Wattled crane developed and implemented
11.3.1 Update the population baselines for the Shoebill and Wattled crane
11.3.2 Update the threats to the Shoebill and Wattled crane
11.3.3 Develop and implement strategies for the protection of the two species based on the analysis of identified threats
44
11.4 Establish extent (ha) and volumes (m3) of mopane and teak forest baselines and promote programmes for their assisted natural regeneration.
• Updated inventories of mopane (Cholophospermum mopane) and teak (Baikiaea plurijuga) forests
• Management plans for mopane and teak forests
11.4.1 Conduct inventories for mopane and teak forests
11.4.2 Develop and implement management plans for mopane and teak forests.
11.4.3 Promote assisted natural regeneration (ANR) in the mopane and teak forests.
11.5 Promote sustainable management of Devil’s claw (Harpagophytum).
• Improved harvest methods by local communities.
11.5.1 Conduct participatory resource inventory on Devil’s claw to determine its abundance, distribution and availability.
11.5.2 Facilitate formal declaration of Devil’s claw as a “protected species of national importance”.
11.5.3 Build local community capacities in sustainable harvest methods and marketing techniques.
11.5.4 Facilitate local communities’ participation in restoration planting of Devil’s claw in depleted areas.
Narrative: The 2015 biodiversity assessment (Kokwe and Matakala, 2015) recorded a total of 12,506 species in the country. Of these species, 4.5% are microorganisms, 31.7% are plants, 62.8% are animals and 1.0% are domesticated plants (crops) and animals. At least 144 and 28 plant and animal species, respectively, are threatened according to the IUCN conservation status classification and 69 species are endemic. Among the tree species known to be locally threatened include Afzelia quanzensis, Daniela ostiniana, Pterocarpus angolensis, Khaya nyasica, Mitragyna stipulosa, Baikiaea plurijuga, Colophospermum mopane and Guibourtia coleosperma. Cryptosepallum forests are endemic to the north-western part of the country and Bakiaea plurijuga (Zambezi teak) as well as Colophospermum mopane (Mopane) are endemic to the south-western part of the country. Guibourtia coleosperma (Rosewood) is also endemic to the Kalahari sands of western Zambia and currently under immense pressure of over-exploitation. Devil’s claw (Harpagophytum), a highly valued pharmaceutical plant, is also endemic to the Kalahari Sands in western Zambia and currently threatened. Among the threatened wildlife species in Zambia include the rhino, Shoebill and Wattled crane while the Kafue Lechwe is endemic to the Kafue ecosystem giving it a very limited range and increasing its vulnerability to climate change effects.
Assumptions: There will be improved management effectiveness where the endemic species are found to prevent poaching and habitat destruction.
Utilization for the species available within allowable limits of sustainable use.
12. By 2025, the genetic diversity of cultivated plants and farmed and domesticated animals and of wild relatives, including other socio-economically as well as culturally valuable species, is maintained, and strategies have been developed and implemented for minimizing genetic erosion and safeguarding their genetic diversity.
12.1 Promote the cultivation of land races known to be resilient to pests, diseases and drought.
• Number of crop genetic resources, crops including wild relatives and livestock genetic resources maintained and sustainably utilized.
• National Policy measures put in place to reduce genetic erosion and safeguard plant and animal genetic resources and promote their sustainable utilization.
• National strategic action plans for conservation of landscapes and crop wild relatives developed and supported
12.1.1 Mainstream and upscale the Micro propagation studies into the National Agricultural Research Systems (NARS)
Ministry responsible for agriculture, the Zambia
12.1.2 Promote the use of land races especially among the most vulnerable small scale farmers (e.g. as part of the package for the Food Security Pack subsidy for the most vulnerable farmers)
12.1 Increase accessions of crop (including wild relatives) genetic resources in the national gene bank holding.
12.2 Increase germ plasm genetic resources and crop wild relatives
12.2.1 Mobilize resources for the collection characterization accessions of key crop genetic resources
12.2.2 Mobilize resources for the collection, maintenance of indigenous livestock genetic resources
12.3 Develop and implement conservation and sustainable utilisation strategies for the conservation of crop wild relatives.
12.3.1 Mainstream the ongoing domestication initiative into the National Agricultural Research System (NARS).
13.3.2 National laws and regulations for access and benefit sharing of PGNFAGR
12.3.3 Enhance institutional capacity to implement and enforce the national biosafety framework.
Narrative: Based on intra-species agro-biodiversity assessment, Zambia has a total of 7,278 germplasm accessions conserved ex-situ. Major threats to the agro-biodiversity of crops and their wild relatives in Zambia include failure by plants to complete the development cycle and be able to produce propagules for plant regeneration in subsequent years. The main causes of this include occurrence of droughts and floods, disease and insect pest outbreaks and their severity. Wildfires and clearing of vegetation for agricultural and other developmental purposes, particularly impact adversely on the diversity of wild crop relatives. Other threats include promotion of Genetically Modified Organisms and climate change. It has also been observed that more and more land continues to be taken up by cash crops (monocrops) such as cotton, tobacco and hybrid maize, thereby reducing the land area under traditional crops and by implication on-farm genetic diversity. Land races are known to be tolerant to drought, pests and diseases yet they are not widely promoted.
46
Assumption: Government will sustain the awareness campaigns on the importance of genetic diversity and farmed and domesticated plants and wild animals in national development
Strategic Goal D: Enhance the benefits to all from biodiversity and ecosystem services.
Narrative: The only existing Benefit Distribution System (BDS) in the natural resource sector is in the wildlife sub-sector where part of the proceeds from hunting concession licences and fees accrue to the local communities through Community Resource Boards and also to the local traditional leader (chief) in the area. Other sub-sectors such as water, fish and forestry lack similar measures. The newly enacted Forest Legislation (2015) provides for Community Forest Management, Joint Forest Management and Private Forest Management. However, BDS for these institutional arrangements have yet to be defined. Benefit sharing systems determine the allocation of often scarce resources to different actors. In distributing these benefits, determining the appropriate balance of efficiency, effectiveness and equity will be a critical element in designing a generic national benefit sharing mechanism. Some benefit sharing arrangements may take the form of cash payments (e.g., to government, households or communities) while others will be non-monetary, such as support for sustainable livelihoods or small-scale infrastructure, improved resource management and access to non-timber forest products, investment in technology, capacity building, etc.
14. By 2016, Zambia accedes to the Nagoya Protocol and by 2018, done stigmatizing of the Protocol is underway
14.1 Zambia accession to the Nagoya Protocol.
• Nagoya Protocol ratified and implemented
• Nagoya a Protocol
domesticated
14.1.1 Lobby GRZ to sign the Nagoya Protocol.
Ministry responsible for environment and natural resources, justice, and the NBA 14.2 Zambia domesticates the
Nagoya Protocol. 14.2.1 integrate benefit sharing mechanisms of genetic resources in practices at all levels
Narrative: Nagoya Protocol on Access and Benefit Sharing (ABS) Is part of the CBD and is reflected in Aichi Target No.16 – “By 2015, the Nagoya Protocol on Access to Genetic Resources and the Fair and Equitable Sharing of Benefits Arising from their Utilization is in force and operational consistent with national legislation. Zambia is a party to the Convention on Biological Diversity (CBD) and the Country was undertaking consultations to facilitate its accession to the Nagoya Protocol at the time of this Strategy. 15. By 2022, Zambia
takes deliberate actions to protect critical ecosystems of the Zambezi, Kafue and Luangwa watersheds.
15.1 Legislate major headwaters of the Zambezi, Kafue and Luangwa as well as other headwaters, as no-go-areas for large infrastructural development including mining.
• The headwaters of the Zambezi, Kafue and Luangwa rivers protected from human activities that are detrimental to biodiversity conservation.
15.1.1 Assess on-going activities in the three river headwaters and identify activities that are detrimental to biodiversity conservation.
Ministries responsible for environment and natural resources, chiefs and traditional affairs, local government and housing
15.1.2 Implement deliberate actions to stop activities negatively impacting on biodiversity conservation in the three headwaters through legislation.
15.2 Enforce the legislation. 15.2.1 Disseminate the legislation among the public and other key stakeholders using the CEPA Strategy.
Narrative: Zambia’s major watersheds particularly the Zambezi, Kafue and Luangwa continue to face a number of threats including: deforestation largely caused by mining activities and infrastructural developments (Zambezi); pollution due to increased effluent loading from industrial and agricultural activities (Kafue); and expanding agricultural and tourism development (Luangwa) – all impacting negatively on local biodiversity. Removal of forest cover in watersheds increases sediment flow and siltation which affects water quality and availability for both domestic and industrial uses. In the Luangwa basin, pressure to find more fertile soils has pushed farmers away from depleted, exhausted farmland into more sensitive, hilly landscapes where soil and water run-off are contributing to thousands of tons of soil loss annually. These watersheds are the principal lifeline for Zambia’s economy and local populations residing there. Biodiversity loss in these watersheds will equally leady to economic loss and poverty. Therefore, protecting these critical habitats, because of multiple benefits arising from them to Zambians, is of paramoun Target Strategic Interventions Key Performance Indicators Key Activities Responsible
48
16. By 2020, the traditional knowledge, innovations and practices of local communities relevant for the conservation and sustainable use of biodiversity, are respected, subject to national legislation and relevant international obligations, and fully integrated in the implementation of the Convention with participation of local communities, at all relevant levels.
16.1 Lobbying for parliamentary passing of the Customary Land Bill.
• Parliamentary and Cabinet ratification of the Customary Land Bill which gives powers to Traditional Authorities to decide on land issues within their jurisdictions.
• Publication on indigenous knowledge practices in biodiversity conservation
• Local Biodiversity Strategy and Action Plans (LBSAPs) incorporating proven indigenous knowledge and practices.
16.1.1 Engage with the Zambia Parliamentary Conservation Caucus for speed ratification of the Bill.
Ministries responsible for environment and natural resources, chiefs and traditional affairs, education, local government and housing
16.2 Documentation of traditional knowledge, innovations and bio-cultural practices for biodiversity conservation.
16.2.1 Promote the documentation of indigenous Knowledge systems on biodiversity conservation.
16.2.2 Mainstream proven indigenous systems for biodiversity conservation into area specific plans for biodiversity conservation.
Narrative: There is need for formalization of customary land rights, user rights and registration. Customary land tenure is already recognized in the Constitution of Zambia and the Lands Act as well as the Customary Land Bill (yet to be passed by Parliament). However, customary land tenure is not actualized/operationalized in legislation and policy and its registration still requires further approval by government at local (district councils) and central levels (Commissioner of Lands) on behalf of the President. The Bill promulgates decentralized decision-making to local traditional authorities over tenure issues. If the Bill were ratified, it would facilitate devolution of decision making to Traditional Authorities over customary land issues.
17. By 2020, knowledge, the science base and technologies relating to biodiversity, its values functioning, status and trends, and the consequences of its loss, are improved, widely shared and transferred, and applied.
17.1 Develop a national research agenda on biodiversity focusing on understanding Zambia’s biodiversity, ecosystem services and their values.
• Amount of financial support leveraged through the UNCBD and the Government of the Republic of Zambia for research and knowledge management in biodiversity conservation
.
• National research agenda developed by 2016.
17.1.1 Conduct a research needs assessment on biodiversity conservation involving multiple stakeholders.
Ministries responsible for environment and natural resources, education, science and technology
17.1.2 Using the results from the research needs assessment, develop a research plan.
17.2 Promote policy science dialogues on environmental issues.
17.2.1 Promote platforms for the discussion of scientific biodiversity information exchange and using existing structures such as the Community Based Natural Resources Management Forum and the Natural Resources Consultative Forum.
17.3 Seek financial support from the UNCBD and the Zambian Government for research and knowledge management in biodiversity conservation.
17.3.1 Develop a knowledge and skills assessment needs for biodiversity conservation in key sectors charged with the management of biodiversity (especially, FD, ZAWA, Environment Department, ZOS, ZEMA, WECSZ, etc.).
17.3.2 Conduct capacity building activities based on the needs assessment results.
Narrative: Determining the status and tracking trends of biodiversity is not an easy task due to paucity of data, lack of knowledge and information management systems in place and lack of systematic research to understand Zambia’s biodiversity, ecosystem services and values. The foregoing situation has been exacerbated by inadequate funding towards knowledge management and research on biodiversity. The NBSAP2 provides a greater opportunity to develop a comprehensive research agenda on biodiversity implemented with financial support from the Zambian Government, the UNCBD and other partners.
Assumption: collaborating partners will be willing to provide the required support
50
Target Strategic Interventions
Key Performance Indicators
Key Activities Responsible
18. By 2020, Zambia mobilizes adequate internal and external financial resources for effective implementation of NBSAP2.
18.1 Develop a comprehensive resource mobilization strategy for implementation of NBSAP2.
• Volume of Government funding per annum.
• Volume of funding from multilateral and bilateral funding sources including private and other innovative sources.
18.1.1 Use the approved NBSAP to do the costing of the proposed strategic interventions.
Ministry responsible for finance
18.1.2 Develop and implement a resource mobilization strategy for the NBSAP2 from both domestic and external sources as well as private and other innovative funding sources.
Narrative: To realize implementation of NBSAP2 will require adequate financial resources both from domestic and external sources through Overseas Development Assistance (ODA), innovative financing sources including private financing.
Assumption: Adequate resources made available from both domestic and external sources for effective implementation of the NBSAP
51
4.3 Monitoring and Evaluation Plan
In order To effectively monitor and evaluate Zambia’s NBSAP2 towards the Aichi Targets, this M&E framework emphasizes balance between regular progress monitoring focusing on output level indicators and the achievement of established targets and periodic in-depth evaluation activities to examine whether outputs are leading to expected outcomes and impacts as well as exploring reasons why. Hence, the NBSAP2 M&E Framework comprises a logical monitoring matrix and evaluation activities. The logical monitoring matrix (or Logical Framework Analysis) is cast at the target and output levels with key performance indicators at that output level rather than at the activity level (process indicators).
The Logical Monitoring Matrix and Evaluation Activities for NBSAP2 are presented in Tables 8 and 9, respectively. The Logical Monitoring Matrix (or LFA) comprises the Strategic Interventions (SIs), Key Performance Indicators (KPIs), Data Gathering Methods (DGM), Collection Frequency for the data, Responsibility for the task and Baseline (Table 9).
The monitoring and evaluation of NBSAP2 will be coordinated by Ministry of Lands, Natural Resources and Environmental Protection through the CBD Focal Point with support from the National Steering Committee and the CBD Working Group comprising representatives from various relevant sectors. The key evaluation components will include (Table 10):
• Annual review and planning meetings; • Steering Committee meetings; • Stakeholder meetings; • Independent mid-term evaluation by mid-2017; • Submission of the 6th National Report in 2018; • Final independent evaluation to be undertaken in 2021; and • Submission of the 7th National Report in 2022.
Results of the final independent evaluation will provide information on Zambia’s contribution towards the achievement of the Aichi Targets as well as lessons and direction for the development of a third NBSAP.
52
Table 9: Logical Monitoring Matrix for NBSAP2 (
Vision: By 2025, biodiversity is valued, conserved, restored and wisely used, maintaining ecosystem services, sustaining a healthy environment and delivering benefits essential for all Zambians and the Zambian economy)
Strategic Interventions Key Performance Indicators Data Gathering Methods
Means of Verification
Collection Frequency
Responsibility for Indicator
Data for Indicator Baseline Value (date)
Target Value (date)
1. Raise public awareness of the value of conserving biodiversity and using it sustainably.
• At least 70% of surveyed key stakeholders are aware of the values of biodiversity and have taken steps to conserve and use it sustainably.
• Results of surveys for pre-defined key stakeholders demonstrating change in human behaviour towards biodiversity
Surveys Survey results Annual ZEMA/Dept. of Environment, MIB, media
0 (2015)
70% of surveyed members of the public (2025)
2. Apply biodiversity and ecosystem services valuation tools to quantify and monitor the environmental, economic and social value of biodiversity.
• Number of appropriate valuation tools assessed and applied.
• Valuation results for different components of biodiversity.
Review of valuation reports
Valuation results and tools applied
Bi-annual Dept. of Environment
0 (2015)
At least three tools: env.; social; economic. (2020)
3. Mainstream biodiversity into the SeNDP.
• Specific chapters within the SeNDP integrating biodiversity values.
• Number of sectoral, provincial and district development plans integrating biodiversity values identified in the SeNDP.
Review of SeNDP and District Development Plans (DDPs)
17. Promote natural restocking in fishery management areas and other fish depleted water bodies by protecting fish breeding areas.
Review of Restocking Reports to protect breeding areas
Restocking reports
Annual Dept. of Fisheries
To be determined (2015)
To be determined (2017)
18. Promote aquaculture in appropriate areas and prevent erosion/extinction of indigenous fish species.
Review of Aquaculture Strategy Progress Reports
Aquaculture Strategy Progress Reports
Annual Dept. of Fisheries
To be determined (2016)
To be determined (2016)
19. Undertake vulnerability assessment and develop relevant adaptation measures to enhance climate change resilience of priority ecosystems.
• Vulnerability assessments of priority ecosystems.
Review Vulnerability Assessment Reports
Vulnerability Assessment Reports
Bi-annual ICCS 0 (2015)
All priority ecosystems (2017)
20. Promote Community Forest Management, Joint Forest Management and Private Forest Management as provided for in the Forest Policy (2014) and Forest Act (2015).
• At least 65% of area (ha) under national and local forest reserves sustainably managed.
• At least 50% of forest area (ha) under open areas sustainably managed.
• At least 80% of forest area (ha) under concessions sustainably managed
29. Establish population baselines for the Flagship28 species including vultures and put measures in place to sustain and increase their population status.
• Species baseline populations secured and % increase in the baseline populations.
• Updated list of threats to these species.
• Protection strategies for all these species developed and implemented.
Review of Programme Reports/Annual Reports
Programme Reports/Annual Reprts
Annual BWZ/ZAWA/ZOS 0 (2015)
Flagship species and Vulture population estimates (2017)
30. Establish extent (ha) and volumes (m3) of mopane and teak forest baselines and promote programmes for their assisted natural regeneration
• Updated inventories of mopane and teak forests.
• Management plans for mopane and teak forests.
Review of inventories and management plans
Forest inventories and management plans
Once-off for forest inventories and annually for monitoring
Forestry Dept. Some data under ILUA II but not definitive (2015)
Detailed inventories (2017)
31. Promote sustainable management of Devil’s claw (Harpagophytum).
• Improved harvest methods by local communities.
Review of field reports
Field reports Annual Forestry Dept. Not yet done (2015)
To be initiated (2016)
28 Shoebill, Wattled and Grey-crowned Cranes, Black-cheeked Lovebird and Zambian Barbet
39. Develop national legislation to enforce the Nagoya Protocol.
Review of draft Statutory Instrument
Statutory Instrument
Once-off Dept. of Environment
Note yet developed (2015)
Developed by 2018
40. Legislate major headwaters of the Zambezi, Kafue and Luangwa as well as other headwaters, as no-go-areas for large infrastructural development including mining.
• The headwaters of the Zambezi, Kafue and Luangwa rivers protected from human activities that are detrimental to biodiversity conservation.
Review of draft Statutory Instrument (SI)
Draft Statutory Instrument
Once-off Dept. of Environment/FD
No SI29 (2015)
SI (2017)
41. Enforce the legislation. Review of Compliance Reports
Compliance Reports
Annual Dept. of Environment/FD
No SI (2015)
SI (2017)
42. Lobbying for parliamentary ratification of the Customary Land Bill.
• Parliamentary and Cabinet ratification of the Customary Land Bill which gives powers to Traditional Authorities to decide on land issues within their jurisdictions.
Review of progress on ratification of the Customary Land Bill
Customary Land Bill ratification
Once-off House of Chiefs Not ratified (2015)
Ratified by 2017
43. Documentation of traditional knowledge, innovations and bio-cultural practices for
Review of documentation
Documentation Annual Copperbelt University/ Mulungushi University
Both universities have published on
Documentation by 2018
29
SI = Statutory Instrument, some form of subsidiary legislation in Zambia.
61
biodiversity conservation. • Publication on indigenous knowledge practices in biodiversity conservation
• Local Biodiversity Strategy and Action Plans (LBSAPs) incorporating proven indigenous knowledge and practices.
44. Develop a national research agenda on biodiversity focusing on understanding Zambia’s biodiversity, ecosystem services and their values.
• Amount of financial support leveraged through the UNCBD and the Government of the Republic of Zambia for research and knowledge management in biodiversity conservation.
• National research agenda developed by 2016.
Review of Research Needs Assessment Report
Research Plan Once-oof Dept. of Environment
0 (2015)
Plan in place by 2017
45. Promote policy science dialogues on environmental issues.
Review of Policy Dialogue Reports
Policy Dialogue Reports
Annual Dept. of Environment
0 (2015)
Promulgate NBSAP2 (2016)
46. Develop a comprehensive resource mobilization strategy for implementation of NBSAP2.
• Volume of Government funding per annum.
• Volume of funding from multilateral and bilateral funding sources including private and other innovative sources.
Review of NBSAP Resource Mobilization Strategy
Resource Mobilization Strategy
Annual Dept. of Environment
0 (2015)
Resource Mobilization Strategy developed (2016)
Table 10: Evaluation Activities for NBSAP2
62
Evaluation Activity
Responsible When will the Activity be Undertaken 2015 2016 2017 2018 2019 2020 2021 2022 2023 2024 2025 Q 1
The ministry responsible for environment and natural resources, as focal point on the CBD and also responsible for environmental policy, will be responsible for the overall coordination of NBSAP implementation in close collaboration with the National Steering Committee which was formed at the beginning of NBSAP1, the Zambia Environmental Management Agency (ZEMA), the ministry responsible Wildlife and National Parks, the ministries responsible for fisheries and other key stakeholder organizations active in the environment sector in general and biodiversity conservation in particular, will all play various roles.’ The National Steering Committee will provide overall guidance and management oversight for NBSAP2 implementation while the NBSAP Working Group (WG) will provide technical guidance in the implementation of NBSAP2 and review technical documents. The ministry responsible for environmental will receive and process project proposals from stakeholders and shall prepare an appropriate programme for regular monitoring of project performance in accordance with the monitoring plan presented in Section 4.4. The ministry responsible for environment will also regularly consult with other line ministries in implementing specific components of the programme. For example, the ministry of mines, the ministry responsible for energy and water development over water and mining related issues; the ministries responsible for Justice on legal and institutional matters; wildlife management and tourism; fisheries; agro-biodiversity; science and technology over bio-safety issues; local government on local authorities’ (districts) involvement in conservation and management of biodiversity through development of Local Biodiversity Strategies and Action Plans (LBSAPs); and the ministry responsible for chiefs and traditional affairs over local communities’ involvement in the conservation and management of biodiversity especially in customary land areas.
5.2 Implementation
NBSAP2 shall be implemented by sectors within relevant Ministries based on their mandates and specializations, Civil Society Organizations (CSOs), Community-Based Organizations (CBOs) and the private sector. In line with the Decentralization Policy (2002) and the Decentralization Policy Implementation Plan (2009), NBSAP2 puts greater emphasis on devolved management responsibilities and benefits to the local level. The implementing partners shall be responsible for monitoring the impact of their activities and for reporting on their target indicators. 5.3 Resource Mobilization
A key lesson from NBSAP1 implementation was the funding constraint to effectively finance the strategy. NBSAP2 is premised on a diversified approach to resource mobilization by leveraging finance from various sources including: Government budgetary allocations; financing under CBD Financial Mechanism, such as the Global Environment Facility (GEF), Overseas Development Assistance (bilateral and multilateral); Private financing sources and other innovative financing sources such as Foundations and Payment for Ecosystem Services. All these will be elaborated within the Biodiversity Finance Initiative (BIOFIN) Project which will cost the NBSAP and recommend sources of funds. The responsibility for resource mobilization for NBSAP2 lies with the Ministry of Finance, the MLNREP through the GEF Focal Point through the GEF Implementing Agencies, as appropriate. Both local NGOs and International Non-Governmental Organizations (INGOs) are also expected to leverage funding towards implementation of NBSAP2.
64
CHAPTER 6: BIBLIOGRAPHY Barbosa, P. M., D. Stroppiana, and J.M. Grégoire. 1999. An assessment of vegetation fire in Africa (1981 – 1991): Burned areas, burned biomass, and atmospheric emissions. Global Biogeochemical Cycles 13: 933 – 956.
Central Statistical Office (CSO). 2006. Living Conditions Survey 2006, CSO, Zambia.
Central Statistical Office (CSO). 2012a. Zambia 2010 Census of population and housing: Vol. 11. Central Statistical Office (CSO). 2012b. Zambia 2010 Census of population and housing: population summary report.
Central Statistical Office (CSO). 2012c. Zambia 2010 Census of population and housing: national analytical report.
Central Statistical Office (CSO). 2012d. Living conditions monitoring survey report 2006 and 2010.
Central Statistical Office (CSO). 2013. Energy Statistics 2000- 2011. Republic of Zambia.
Central Statistical Office (CsO). 2014. Gross Domestic Product 2010 Benchmark Estimates. Government of Zambia, Lusaka.
Central Statistics Office (CSO). 2010. Living Conditions Monitoring Survey, 2006 and 2010. Central Statics Office, Government of the Republic of Zambia. Chama, L. and S. Siachoono. 2015. Effectiveness of birds, butterflies, dragonflies, damselflies and invertebrates as indicators of freshwater ecological integrity. Geophysical Research Vol. 17, EGU2015-13383, 2015. Chidumayo, E N. 1997. Miombo ecology and management: An introduction. Intermediate Technology Publishers, London. Chidumayo, E.N. 1988. A re-assessment of effects of fire on miombo regeneration in the Zambian Copperbelt. Journal of Tropical Ecology 4:361-372.
Chidumayo, E.N. 2012. Development of reference emission levels for Zambia. Report prepared for FAO-Zambia Integrated Land Use Assessment (ILUA) Phase II project, Lusaka, Zambia.
Chidumayo, E.N. 1987. A shifting cultivation land use system under population pressure in Zambia. Agroforestry Systems 5:15-25.
Chidumayo, E.N. 2013. Forest degradation and recovery in a miombo woodland landscape in Zambia: 22 years of observations on permanent sample plots. Forest Ecology and Management 291:154-161.
Chidumayo, E.N. and F. Njovu. 1998. Ecological screening of forest areas in the PFAP area, Zambia. Provincial Forestry Action Progrmme, Ndola. Chidumayo, E.N., K. Mbata, H. Chabwela, J. Munyandorero and J. Cernak. 1997. A specialist environmental assessment of the ecology at the Konkola Mining Licence Area in Zambia. A report prepared for Anglo American Corporation of South Africa.
65
Deines, A., C.A. Bee, R. Jensen and D. Lodge. 2012. Modeling artisanal fisheries and hydroelectricity in relation to the Itezhe-tezhi dam on the Kafue River, Zambia. Working Paper Series, Department of Economics, University of Notre Dame.
Department of Fisheries (DOF). 2015. 2014 fisheries statistics: Annual report. Chilanga.
Edmonds, A.C.R. 1976. Vegetation Map (1:500,000) of Zambia. Surveyor General, Lusaka. Eriksen, C. 2007. Why do they burn the ‘bush’? Fire, rural livelihoods, and conservation in Zambia. The Geographical Journal 173:242-256.
Fanshawe, D.B. 1971. The vegetation of Zambia. Government Printers, Lusaka. 67 pp. Golding, J.S. (ed.). 2002. Southern African Red Data Lists. SABONET Report No. 14, SABONET, Pretoria. GRZ. 2004. Status of forest reserves 2000. Forestry Department, MTENR. GRZ. 2012b. The Forest Estate as at 31 December 2011. Forestry Department, Forest Management Unit, MTENR. GRZ. 2013. National Agricultural Policy (Draft), Ministry of Agriculture and Livestock, Zambia. GRZ 2015. The Stocktaking and Biodiversity Assessment under the National Biodiversity Strategy and Action Plan (NBSAP) Project, Ministry of Lands, Natural Resources and Environmental Protection Hollingsworth, L.T., D. Johnson, G. Sikaundi and S. Siame. 2015. Fire management assessment of Eastern Province, Zambia. Washington, D.C.: USDA Forest Service International Programs. ILUA. 2008. Integrated Land Use Assessment Zambia 2005 – 2008. Ministry of Tourism, Environment and Natural Resources, Lusaka-Zambia. Indira, T.J. 2007. Mapping and modeling of Mimosa pigra expansion in Lochinvar National Park, Zambia. MSc thesis, International Institute for Geo-Information Science and Earth Observation, Enschede, The Netherlands. Julius D. Elias, Jasper N. Ijumba and Florence A. Mamboya. 2014. Effectiveness and Compatibility of Non-tropical Bio-Monitoring Indices for Assessing Pollution in Tropical Rivers - A Review. International Journal of Ecosystem 4: 1 28 -134.
GRZ 2015. The 2015 National Biodiversity Stocktaking and Assessment Report, Ministry of Lands, Natural Resources and Environmental Protection (MLNREP)
Lawton, R.M. 1978. A study of the dynamic ecology of Zambian vegetation. Journal of Ecology, 66: 175-198. Leonard, P. 2005. Important Bird Areas of Zambia; Priority Conservation Sites, Zambian Ornithological Society.
Lindsey, P., V. Nyirenda, J. Barnes, M. Becker, C. Tambling, A. Taylor & F. Watson. 2013b: Zambian Game Management Areas; The reasons why they are not functioning as ecologically or economically productive buffer zones and what needs to change for them to fulfil that role. Lubangu, M. and R. Mofya-Mukuka. 2012. The Status of the Smallholder Livestock Sector in Zambia, Technical Report No.1., IAPRI, Lusaka, Zambia.
66
Lwando, C. and E.N. Chidumayo. 2009. Lantana reduces abundance and regeneration of Bauhinia at Lusaka. Black Lechwe 16:26-27. Matakala, P.W., M. Kokwe and J. Statz. 2015. Zambia National Strategy to Reduce Emissions from Deforestation and Forest Degradation. Consultancy report under the Zambia UN-REDD Programme submitted to the Ministry of Lands, Natural Resources and Environmental Protection. March 2015. MENR . 1998a. Zambia Biodiversity Strategy and Action Plan – The Country Study, MENR, Lusaka. Mudenda, H. 2013. Draft NBSAP Revision Stocktaking Report, NIRAS, Zambia. Mwima, H.K. 2007. Synthesis of completed management effectiveness tracking tool for protected areas managed by the Zambia Wildlife Authority for the year 2007. Report prepared for the Ministry of Tourism, Environment and Natural Resources (MTENR). October, 2007.
Nkandu, B. 2012. Regeneration of Mimosa pigra L following bush clearing and burning in Lochinvar National Park of the Kafue Flats of Zambia. M.Sc. dissertation, University of Zambia. Nuzzo, M. C. and Traill, L. W. (2013). What 50 years of trophy records illustrate for hunted African elephant and bovid populations. African Journal of Ecology 52: 250 – 253. Nyoni, M. 2010. Conservation Bye-laws for Magumwi-Machile Site in Machile Important Bird Area, Zambian Ornithological Society (ZOS), Lusaka, Zambia. Office of the Auditor General (OAG). 2014. Report of the Auditor General on the management of environmental degradation caused by mining activities in Zambia. GRZ.
Olwoch, J.M., B. Reyers, F.A Engelbrecht and B.F.N. Erasmus. 2008. Climate change and the tick-borne disease, Theileriosis (East Coast fever) in sub-Saharan Africa. Journal of Arid Environments 72:108-120.
Sanchez, A.C., P.E. Osborne and N. Haq. 2011. Climate change and the African baobab (Adansonia digitata L.): the need for better conservation strategies. African Journal of Ecology 49:234-245. Schwanck, E.J. 1995. The introduced Oreochromis niloticus is spreading on the Kafue floodplain. Hydrobiologia 315: 143 – 147.
Sikaundi, G. 2013. Use of remotely sensed data to monitor and manage wild fires in Zambia. Presentation at Inception Meeting on Miombo Forest Regeneration Project (Unpublished Report). Sprague, D.S. and Oyama, S. 1999. Density and distribution of citemene fields in a miombo woodland environment in Zambia. Environmental Management 24:273-280. Trapnell, C.G. 1959. Ecological results of woodland burning experiments in Northern Rhodesia. Journal of Ecology, 47: 129-168. Turpie J., Benjamin Warr, Jane Carter Ingram and Michel Masozera. 2014. The Economic Value of Zambia’s Forest Ecosystems and potential benefits of REDD+ in Green Economy Transformation in Zambia. Report to UNEP on behalf of the MLNREP, Zambia.
Warburton, L. S. and M.R. Perrin. 2005. Conservation implications of the drinking habits of black-cheeked lovebirds Agapornis nigrigenis in Zambia. Bird Conservation International 15:383 – 396.
ZEMA, GRID-Arendal, GRID-Sioux Falls, UNEP. 2012. Zambia Atlas of Our Changing Environment.
67
CHAPTER 7: ANNEXES
Annex 1: CBD Strategic Goals and Aichi Targets
STRATEGIC GOAL TARGETS
Strategic Goal A: Address the underlying causes of biodiversity loss by mainstreaming biodiversity across government and society
By 2020, at the latest, people are aware of the values of biodiversity and the steps they can take to conserve and use it sustainably.
By 2020, at the latest, biodiversity values have been integrated into national and local development and poverty reduction strategies and planning processes and are being incorporated into national accounting, as appropriate, and reporting systems. By 2020, at the latest, incentives, including subsidies, harmful to biodiversity are eliminated, phased out or reformed in order to minimize or avoid negative impacts, and positive incentives for the conservation and sustainable use of biodiversity are developed and applied, consistent and in harmony with the Convention and other relevant international obligations, taking into account national socio economic conditions. By 2020, at the latest, Governments, business and stakeholders at all levels have taken steps to achieve or have implemented plans for sustainable production and consumption and have kept the impacts of use of natural resources well within safe ecological limits.
Strategic Goal B: Reduce the direct pressures on biodiversity and promote sustainable use
By 2020, the rate of loss of all natural habitats, including forests, is at least halved and where feasible brought close to zero, and degradation and fragmentation is significantly reduced. By 2020 all fish and invertebrate stocks and aquatic plants are managed and harvested sustainably, legally and applying ecosystem based approaches, so that overfishing is avoided, recovery plans and measures are in place for all depleted species, fisheries have no significant adverse impacts on threatened species and vulnerable ecosystems and the impacts of fisheries on stocks, species and ecosystems are within safe ecological limits. By 2020 areas under agriculture, aquaculture and forestry are managed sustainably, ensuring conservation of biodiversity. By 2020, pollution, including from excess nutrients, has been brought to levels that are not detrimental to ecosystem function and biodiversity. By 2020, invasive alien species and pathways are identified and prioritized, priority species are controlled or eradicated, and measures are in place to manage pathways to prevent their introduction and establishment. By 2015, the multiple anthropogenic pressures on coral reefs, and other vulnerable ecosystems impacted by climate change or ocean acidification are minimized, so as to maintain their integrity and functioning.
Strategic Goal C: Improve the status of biodiversity by safeguarding ecosystems, species and genetic diversity
By 2020, at least 17 per cent of terrestrial and inland water, and 10 per cent of coastal and marine areas, especially areas of particular importance for biodiversity and ecosystem services, are conserved through effectively and equitably managed, ecologically representative and well-connected systems of protected areas and other effective area-based conservation measures, and integrated into the wider landscape and seascapes.
68
STRATEGIC GOAL TARGETS Strategic Goal C: Improve the status of biodiversity by safeguarding ecosystems, species and genetic diversity
By 2020 the extinction of known populations of threatened species have been secured and are increasing has been prevented and their conservation status, particularly of those most in decline, has been improved and sustained. By 2020, the genetic diversity of cultivated plants and farmed and domesticated animals and of wild relatives, including other socio-economically as well as culturally valuable species, is maintained, and strategies have been developed and implemented for minimizing genetic erosion and safeguarding their genetic diversity.
Strategic Goal D: Enhance the benefits to all from biodiversity and ecosystem services.
By 2020, ecosystems that provide essential services, including services related to water, and contribute to health, livelihoods and wellbeing, are restored and safeguarded, taking into account the needs of women, indigenous and local communities, and the poor and vulnerable By 2020, ecosystem resilience and the contribution of biodiversity to carbon stocks has been enhanced, through conservation and restoration, including restoration of at least 15 per cent of degraded ecosystems, thereby contributing to climate change mitigation and adaptation and to combating desertification. By 2015, the Nagoya Protocol on Access to Genetic Resources and the Fair and Equitable Sharing of Benefits Arising from their Utilization is in force and operational, consistent with national legislation.
Strategic Goal E: Enhance implementation through participatory planning, knowledge management and capacity building
By 2015 each Party has developed, adopted as a policy instrument, and has commenced implementing an effective, participatory and updated national biodiversity strategy and action plan. By 2020, the traditional knowledge, innovations and practices of indigenous and local communities relevant for the conservation and sustainable use of biodiversity, and their customary use of biological resources, are respected, subject to national legislation and relevant international obligations, and fully integrated and reflected in the implementation of the Convention with the full and effective participation of indigenous and local communities, at all relevant levels. By 2020, knowledge, the science base and technologies relating to biodiversity, its values functioning, status and trends, and the consequences of its loss, are improved, widely shared and transferred, and applied. By 2020, at the latest, the mobilization of financial resources for effectively implementing the Strategic Plan 2011-2020 from all sources and in accordance with the consolidated and agreed process in the Strategy for Resource Mobilization should increase substantially from the current levels. This target will be subject to changes contingent to resources needs assessments to be developed and reported by Parties.