Summary of Existing Budget The vast bulk of the budget’s expenditures are comprised of three expenses, Healthcare, Retirement, and Military, which account for $2.578 Trillion of the total $3.667 Trillion budget, or 70.31%. We cannot seriously confront budgetary spending without addressing these three areas of the U.S. Budget. When combined with Welfare and Interest On Debt, these five expenses account for 88.04% of 2013 budgetary spending. 1 Retirement 651 Social security 830,319 22.64% 602 Federal employee retirement and disability 139,738 3.81% 601 General retirement and disability insurance (excluding social security) 8,940 0.24% Total, Retirement 978,997 26.70% Healthcare 571 Medicare 530,346 14.46% 551 Health care services 329,766 8.99% 703 Hospital and medical care for veterans 54,528 1.49% 552 Health research and training 32,494 0.89% 554 Consumer and occupational health and safety 4,586 0.13% Total, Healthcare 951,720 25.95% Military 051 Department of Defense-Military: 620,260 16.91% 053 Atomic energy defense activities 19,419 0.53% 054 Defense-related activities 7,742 0.21% Total, Military 647,421 17.65% Welfare 609 Other income security 168,320 4.59% 605 Food and nutrition assistance 116,331 3.17% 603 Unemployment compensation 75,200 2.05% 604 Housing assistance 42,708 1.16% Total, Welfare 402,559 10.98% Interest On Debt 901 Interest on Treasury debt securities (gross) 472,040 12.87% 909 Other investment income -646 -0.02% 908 Other interest -50,370 -1.01% 902 Interest received by on-budget trust funds -64,472 -1.76% 903 Interest received by off-budget trust funds -108,837 -2.97% Total, Interest on Debt 247,715 6.76% Combined Total 3,228,412 88.04% Total U.S. Budget, 2013 3,667,076 100.00% 1 Historical Tables, Budget of the United States Government, Fiscal Year 2013. Table 5.1. Government Printing Office. http://www.gpo.gov/fdsys/search/pagedetails.action?granuleId=BUDGET-2013-TAB-5- 1&packageId=BUDGET-2013-TAB&fromBrowse=true
Transcript
Summary of Existing Budget
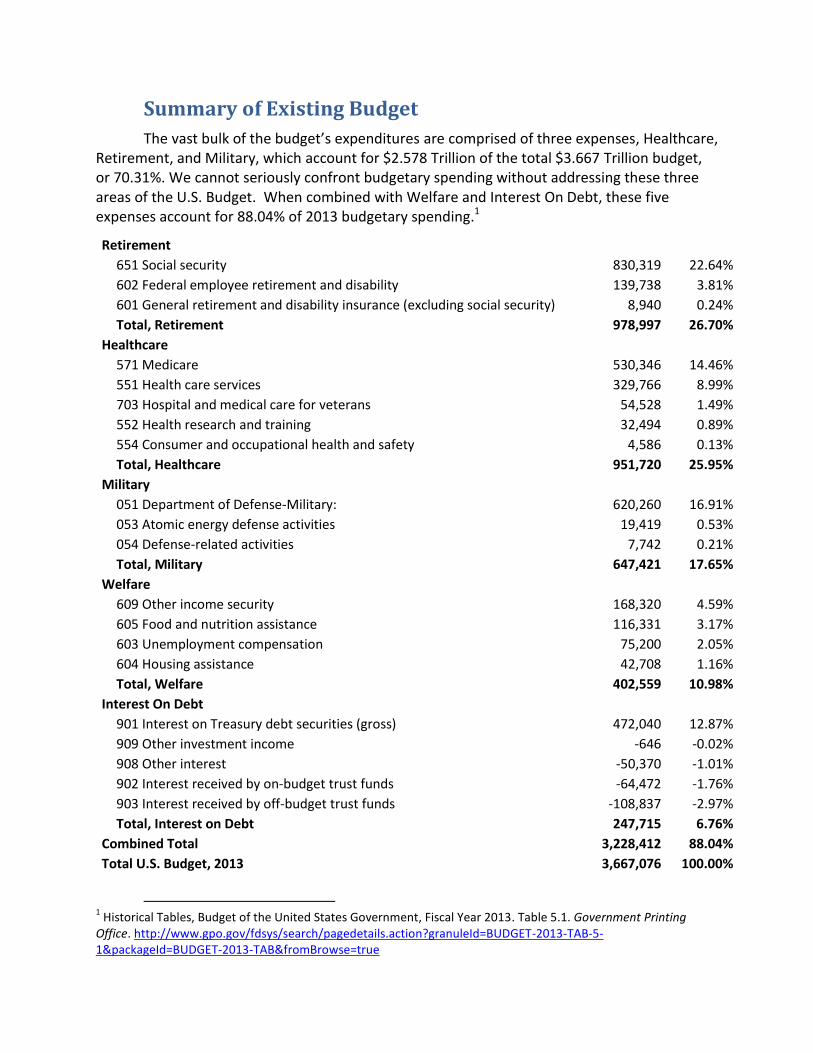
The vast bulk of the budget’s expenditures are comprised of three expenses, Healthcare, Retirement, and Military, which account for $2.578 Trillion of the total $3.667 Trillion budget, or 70.31%. We cannot seriously confront budgetary spending without addressing these three areas of the U.S. Budget. When combined with Welfare and Interest On Debt, these five expenses account for 88.04% of 2013 budgetary spending.1
Retirement 651 Social security 830,319 22.64%
602 Federal employee retirement and disability 139,738 3.81%
601 General retirement and disability insurance (excluding social security) 8,940 0.24%
Total, Retirement 978,997 26.70%
Healthcare 571 Medicare 530,346 14.46%
551 Health care services 329,766 8.99%
703 Hospital and medical care for veterans 54,528 1.49%
552 Health research and training 32,494 0.89%
554 Consumer and occupational health and safety 4,586 0.13%
Total, Healthcare 951,720 25.95%
Military 051 Department of Defense-Military: 620,260 16.91%
053 Atomic energy defense activities 19,419 0.53%
054 Defense-related activities 7,742 0.21%
Total, Military 647,421 17.65%
Welfare 609 Other income security 168,320 4.59%
605 Food and nutrition assistance 116,331 3.17%
603 Unemployment compensation 75,200 2.05%
604 Housing assistance 42,708 1.16%
Total, Welfare 402,559 10.98%
Interest On Debt 901 Interest on Treasury debt securities (gross) 472,040 12.87%
909 Other investment income -646 -0.02%
908 Other interest -50,370 -1.01%
902 Interest received by on-budget trust funds -64,472 -1.76%
903 Interest received by off-budget trust funds -108,837 -2.97%
Total, Interest on Debt 247,715 6.76%
Combined Total 3,228,412 88.04%
Total U.S. Budget, 2013 3,667,076 100.00%
1 Historical Tables, Budget of the United States Government, Fiscal Year 2013. Table 5.1. Government Printing
Most Americans can surely agree that, given the widespread unemployment, it would naturally be inhumane to reduce spending on welfare. If we can return Americans back to work, welfare expense will drop naturally, which should be our goal. Concerning the debt, we cannot truly confront this without first confronting our budget, or we will not have the cash reserves on hand to pay it off. We must first turn our deficit into a surplus and gain the requisite cash reserves to begin paying off our debt.
This leaves three primary expenses to logically be confronted, which account for 70.31% of the budget, Healthcare, Retirement, and Military spending. These are the logical parts of the budget for us to focus on reducing. This budget proposal takes commonsense initiatives towards drastically reducing these parts of the budget while returning 15 million Americans back to work, and seeks to keep veterans and current military employed – particularly since returning military personnel (Gulf War Era II Veterans) have been experiencing 30% unemployment rates.
The major aspects of this budget are as follows:
Reduce spending on Social Security and Medicare by increasing the full benefits ages for Social Security to 70 while eliminating limited benefits ages, and changing the Medicare benefits age to 70. Because people are living 17.0 years longer since we instituted Social Security in 1935, and 8.5 years longer since we instituted Medicare in 1965, the programs will not be sustainable without changing the benefits ages to reflect how life expectancy is increasing, and are the primary drivers of the U.S. budget deficit. We are paying for far more years of life per person under both programs than they were originally designed for. Proposed Savings: $386 billion annually.
Return all military personnel from Afghanistan, and communicate with both the United Nations and Afghanistan’s government to ensure optimal democratic governance and stability. Rather than returning troops blindly, institute a voluntary re-employment program for all current U.S. troops and prior veterans who wish to remain employed, so that they can guard the borders. Because ‘Military Personnel’ accounts for just $156 billion of the $647 billion National Defense budget, we can pay troops the same salaries to do something labor-intensive like guarding the borders while still cutting major expense from the $382 billion in ‘Operation and Maintenance’ ($274 billion) and ‘Procurement’ ($109 billion). This would return tens of thousands of employed consumers to the U.S., where they would now be free to spend their military salaries here in the United States rather than overseas, giving the economy a substantial boost. Proposed Savings: $211 billion annually.
Remove healthcare’s recent individual mandate forcing employers, including small businesses, to fund health insurance for their employees. This is destroying U.S. jobs by unnecessarily burdening small businesses, and greatly increasing the cost of companies doing business here in the U.S. It boosts the cost per worker and forces U.S. jobs overseas. By removing the mandate we will greatly increase the ability of U.S.-based companies to compete, and restore jobs to average Americans.
Healthcare does not matter if employees do not have jobs, and the healthcare benefits are costing Americans their jobs.
Use money saved from Retirement, Healthcare, and the Military to institute a 3-year public works program reminiscent of Franklin D. Roosevelt’s “New Deal”. Rather than spending blindly on special interest projects as occurred during the recent Stimulus bills, such a public works program will create jobs effectively per dollar spent by focusing on labor-intensive jobs that avoid extraneous and unnecessary expenditures on equipment, land, utilities, and technology. Examples of such public works programs include conservation, cleaning up public buildings/areas, census operations, sewing, painting murals, and free-access public seminars. Logically, for $400 billion of federal spending, 15 million Americans can be put to work via jobs paying them $20,000 each ($300 billion), with an additional $100 billion left over to cover supervisory/equipment expenses and any other expenses which should arise. Cost: $400 billion annually, temporary.
Provide tax breaks to companies who hire more U.S. workers in relation to company earnings. Rather than using our currently complex corporate tax code, we should restructure corporate taxation entirely so that the sole tax break is based on how many U.S. workers a company hires. The more workers it hires in relation to its earnings, the less money it pays in federal taxes. Our currently complex code allows huge corporations like General Electric to receive a $3.3 billion refund from the IRS each year. It is time to remove the complexity and reward business based simply on how many U.S. jobs they create in relation to company earnings.
Completely end trade with countries whose minimum wages are below $4.00/hour and whose imports the previous year exceeded $8 billion, most notably China, Mexico, and Russia until such time as they raise their minimum wages above the $4.00/hour mark. This will greatly increase the ability of American workers and companies to compete on a level playing field with their foreign counterparts, and improve working conditions of all people worldwide. Rather than attempting protectionism, this will seek only to ensure other countries pay their workers fairly like we do in order for us to trade with them, rather than letting their workers be paid slave wages like China’s where workers make on average 50 cents an hour.
Mandate shareholder voting on CEO compensation at publicly traded companies. Because a CEO often plays a vital role in renominating members to his or her company’s Board of Directors, board members have incentive to pay the CEO whatever the CEO wants if they wish to retain their positions. However, publicly traded companies are not owned by the CEO, it is not the CEO’s money or company; rather, it is owned by the shareholders. Thus, the shareholders should decide the CEO’s compensation rather than the CEO or Board of Directors. Unfortunately, America’s top 500 companies, the S&P 500, have been recording record profits year after year, even as they reduce their U.S. workforces. The CEOs who fired the most U.S. workers made 42% more pay than their S&P 500 peers. They have been freeing up money to give themselves by firing U.S. workers. Only by removing their ability to pay themselves these vast sums, and placing the pay decision where it belongs, in the hands of shareholders, can we stop the intentional firing of U.S. workers.
Reform individual taxation by instituting an IRS study to determine what questions, for purposes of taxation, best determine overall wealth (net worth). Logically we should be able to narrow down what the 5-10 best questions are for determining overall wealth for purposes of taxation, and abandon all less efficient questioning. However, we first need to know what questions are most efficient for purposes of taxation.
Reducing Entitlement Spending
The single greatest factor responsible for the growth in government spending is the increased average lifespan since instituting Social Security in 1935 and Medicare in 1965. Since 1935, average lifespan has increased from 61.7 to 78.7, yet the retirement age for receiving Social Security benefits has remained set at 62 for early benefits. The age to receive full benefits was recently increased by Congress from 65 to 67, yet this increase is to occur gradually over a 22-year period, and currently is around 66. As such, taxpayers are now paying for 16.0 more years of full retirement benefits and 17.0 years of limited benefits on average per retiree than the original Social Security program was designed to sustain.
The retirement age for receiving Medicare benefits remains likewise set at 65, even though average U.S. life expectancy has increased from 70.2 in 1965 to 78.7 today. Taxpayers are now paying for 8.5 more years of Medicare benefits than the original Medicare program was designed to sustain. Unlike Social Security, no change has been made to the benefits age for Medicare recipients.
Program Year
Instituted
Life Expectancy
Then Now Increase
Social Security 1935 61.7 78.7 17.0
Medicare 1965 70.2 78.7 8.5
Source: NCHS, United States Life Tables, 2002, National Vital Statistics Report, vol. 53, no. 6, pp. 33-34, Nov. 10, 2004.2
The following shows the comparative percentages and costs for each age group that receives Social Security benefits.
Social Security, Potential Cost Savings by Benefits Age, 2011
Source: Annual Statistical Supplement, 2011. Table 5.A1.1—Number and average monthly benefit for retired workers, by age and sex, December 2010. SSA.3
Through instituting an increase for the Social Security benefits age from 67 to 70 and eliminating the limited benefits age of 62, a total of $215.92 billion will be saved each year. This still reflects only 5 years out of the 17 year increase in life expectancy since Social Security was instituted in 1935; a necessary change needed to keep the program, and the U.S. government, solvent. The following are the approximate cost percentages for age brackets receiving Medicare benefits.
By instituting an increase in the Medicare beneficiary age requirement from 65 to 70, a total of $170.49 billion would be cut from the U.S. budget each year. This would still reflect only 5 of the 8.5 years that the average lifespan has increased since Medicare originated in 1965. As such, by increasing the Social Security benefits age to 70, and Medicare to 70, a minimum of $386.47 billion can be saved each year.
Reducing Military Spending
Though less than either Health or Retirement spending, which combined are 50.58% of the U.S. Budget, Military spending is the other particularly noticeable cost, comprising 20.44% of the Budget (which does not include Veterans, only Defense spending). Both parties have increased Military spending drastically since 2001. Military spending from 1984-1999 was largely stable, always remaining between $263 and $305 billion, but under a Republican Congress and presidency that changed when Military spending shot up to $456 billion in 2003 and to $556 billion in 2006 as a result of the War on Terror. However, it was under a Democratic Congress from 2007-2010 that Military spending hit an all-time high, shooting up to $625 billion in 2007, $696 billion in 2008, and climaxing in 2010 at $721 billion.
While George W. Bush signed a Status of Forces Agreement in 2008 setting two deadlines for Iraq troop withdrawal in 2009 and 2011, he did not sign a similar agreement for troops in Afghanistan. As such, a decade later troops remain engulfed in the ongoing War on Terror, and while troop levels are being decreased there, they still remain in higher numbers than during the Bush presidency. Ultimately, we should not continue propping up a foreign economy with hundreds of billions of dollars in military enforcement even as our own economy is faltering.
Ultimately, most money in the defense budget goes not to paying our troops, research and development, or the CIA, but to operations, maintenance, and procurement. Much of our military spending as such is expendable and unnecessary, for we are able to offer troops the same pay levels, continue military research and development at the same pace, and continue funding the CIA and Department of Energy at the same levels while still cutting hundreds of billions of dollars in spending.
050 National Defense, Top Expenses 2013 Cost (Billions)
Section % 2014 Cost (Billions)
Operation and maintenance $273.643 42.27% $120.643
Military personnel $156.122 24.11% $156.122
Procurement $108.511 16.76% $50.511
Research, development, test & evaluation $69.654 10.76% $69.654
Department of Energy $19.419 3.00% $19.419
Military construction $9.572 1.48% $9.572
SUBTOTAL $636.921 98.38% $425.921
Other Expenses $27.161 1.62% $10.797
TOTAL $647.421 100% $436.718
As such, by cutting back on expensive military technology, and employing troops in a labor-intensive program like guarding the borders, the United States will be able to cut from the $298.236 billion of Operation and Maintenance, and $136.044 billion of Procurement. This budget projects to save $361 billion annually by returning U.S. troops from the Middle East and providing a re-employment program for military personnel and ex-military personnel to guard the borders should they voluntarily choose to do so.
Expensive U.S. Military Technology
Technology Cost/Unit Produced Total Cost
Lockheed Martin F-35 Lightning II $122 Million 2000 $323 Billion
Bell-Boeing V22 Osprey $155.2 Million 174 $27 Billion
Grumman E-2D Advanced Hawkeye $233.1 Million 75 $17.5 Billion
Such a program will not only produce severe cuts to military spending, but secure the gaping holes in American borders through which drug trafficking, weapons smuggling, and terrorist infiltration occurs. It will also result in tens of thousands of formerly U.S. troops now employed as government employees within U.S. borders who will use their salaries to purchase U.S. goods, instead of buying products overseas as has been occurring. The U.S. should continue to emphasize research and development, which is a relatively small portion of the defense budget; and spending there does not need to be cut whatsoever. Existing technology can be put into storage in readiness for future military necessities.
However, blindly returning troops results in their becoming unemployed, veterans ages 18-24 have a 30.4% unemployment rate, nearly double the rate for non-veterans of the same age, 15.3%. As such it is important to offer them a voluntary re-employment program so they can remain employed should they so desire. By doing so we will provide a boost to the employment rate, maintain more employed consumers within U.S. borders, and still cut $211 billion from the U.S. budget annually.
Removing the Individual Mandate
In a globally free trading environment, a country which increases its own minimum wage and benefits will disadvantage itself with respect to jobs, for a country whose minimum wage and benefits are far lower (like China’s) will naturally be preferred by business as a manufacturing hub. Furthermore, fewer employees can be hired by a business, whether small or large, as they must use the same amount of money to hire more expensive workers; which detrimentally impacts small business who can ill afford fewer workers.
It is of importance then that both a minimum wage and benefits be suitable to provide a minimum standard of living, but also that they be relatively comparable to the country’s major trading partners lest jobs get outsourced and nationwide small business decay. One must assume that in general a company whose business it is to make profit will outsource jobs where labor and benefits are cheapest; with the primary determinants of where to create jobs being the following expenses: minimum wage, benefits, transportation, and regulation.
When benefits such as healthcare become too excessive, it is furthermore the tendency of business to keep employee hours below the point mandated by law to procure benefits, which under the Patient Protection and Affordable Care Act will be only 30 hours. The logical result of this will be that businesses nationwide, and even government agencies, will convert more workers to part-time, reducing hours below 30 to avoid paying the increased healthcare benefits. Furthermore, any company which does not do so will be at a disadvantage, as they risk a competitor reducing their hours. In such a way, the market encourages all businesses to
constantly keep reducing their wages and benefits through outsourcing, automation, and hour reduction below federal benefit requirements.
The increased complexity added by the mandate will only further serve to hamper small business, which is responsible for the majority of job creation. The simplest way for a struggling small business to avoid the impacts of a bureaucratic, complicated law like the Patient Protection and Affordable Care Act will be to reduce the hours of all employees below 30. You will then see average Americans increasingly working multiple part-time jobs to try and make ends meet.
For all of these reasons, this budget removes the individual mandate of the Patient Protection and Affordable Care Act to ensure the U.S. remains competitive with respect to job creation, fosters small business, and most importantly protects employees who will otherwise see their hours cut as a direct result of the Patient Protection and Affordable Care Act.
Public Works Program
To ensure maximal U.S. employment, this budget institutes a 3-year public works program similar to that created by Franklin D. Roosevelt. Logically 15 million Americans can be put to work for jobs paying $20,000 each at a cost of $300 billion per year, with another $100 billion to cover additional expenses such as supervising, equipment, transportation, and utilities. By using the money saved from entitlements and military spending for a short-term mass employment program, Americans will move from welfare dependence to the pride of employment, and gain the money necessary to create small businesses nationwide.
As observed by Pollin & Peltier, for government to create jobs effectively, job creation must be labor-intensive and spend primarily on employees and less on extraneous expenses.
“In addition, education is a relatively labor-intensive industry. This means that, compared with the other industries we are examining, for every $1 billion in new spending in education, proportionally more money is spent on hiring new people into the industry and relatively less is spent on supplies, equipment, buildings.”5
The following elements of a wide-scale public works program will allow maximal employment for minimal expense.
Conservation, cleaning up parks and forests, and reforestation.
Repairing/cleaning up public buildings such as schools, hospitals, etc.
Censuses of local areas via the U.S. Census Bureau.
Painting murals and creating works of art/music.
Sewing projects.
Public education courses held in public areas (libraries, parks, and other freely-accessed areas).
Farming – physical, labor-intensive only, not technological.
Low-cost, labor-intensive construction/landscaping projects like digging ditches.
5 Pollin & Garrett-Peltier (2007). The U.S. Employment Effects of Military and Domestic Spending Priorities. pg. 10.
Automation is with outsourcing the primary cause of U.S. job loss. A company wishing to increase profits can most easily do so by reducing worker pay, since payroll typically accounts for the majority of a company’s expense. Outsourcing, replacing workers with machinery, and moving to part-time/temp workers are all ways to reduce company overhead.
Ultimately, the number of workers hired will always decrease given advances in technology, per automation, unless government incentivizes business to hire maximally. It is for this reason that such an incentive should be provided business; chiefly in the form of tax breaks for companies who hire more U.S. workers in relation to company earnings. Since it is a U.S. tax break, the taxes involved are to the U.S. government, it makes sense that the jobs which merit such a tax break should be U.S. jobs specifically.
Given the increasing complexity of corporate taxation which allows numerous loopholes to exist, it is imperative that we simplify the existing corporate tax code. This budget enacts an entirely new form of corporate taxation, taxing business simply based on earnings and U.S. workers employed. According to the Institute for Policy Studies, the following companies paid their CEOs more money than they paid the U.S. government in taxes:
Company Income Taxes (millions) CEO Compensation (millions) 2010 Taxes:
CEO Comp 2010 2009 2010 Change from 2009
General Electric -$3,253 -$833 $15.2 172% -214.01
Prudential Financial -$722 -$49 $16.2 10% -44.57
Verizon -$705 -$611 $18.1 4% -38.95
Bank of New York Mellon -$670 $289 $19.4 73% -34.54
Dow Chemical -$576 $65 $17.7 13% -32.54
Honeywell -$471 -$27 $15.2 15% -30.99
International Paper -$249 $228 $12.3 75% -20.24
Ameriprise -$224 $199 $16.3 -11% -13.74
Capital One Financial -$152 $278 $14.9 144% -10.20
Nabors Industries -$138 -$15 $13.5 -42% -10.22
eBay -$131 $507 $12.4 22% -10.56
Marsh & McLennan -$90 -$308 $14.0 1% -6.43
Stanley Black & Decker -$75 -$1 $32.6 253% -2.30
Mylan Laboratories -$73 $43 $15.0 27% -4.87
Ford -$69 -$274 $26.5 48% -2.60
Allegheny Technologies -$47 -$91 $15.0 48% -3.13
Qwest Communications -$14 $10 $13.4 12% -1.04
Cablevision Systems -$3 $8 $13.3 -21% -0.23
Chesapeake Energy $0 $4 $21.0 13% 0.00
Wynn Resorts Ltd. $0 $0 $14.6 74% 0.00
Motorola Solutions $7 -$314 $13.7 62% 0.51
Coca-Cola Enterprises $8 $0 $19.1 71% 0.42
Motorola Mobility $12 $11 $13.0 245% 0.92
Boeing $13 -$132 $13.8 0% 0.94
Aon $16 $32 $20.8 100% 0.77
Source: Anderson, Collins, Klinger, & Pizzigati. Executive Excess 2011. Institute for Policy Studies.6
In determining how to restructure the corporate tax code, it is necessary to see some exact numbers; how much revenue is typically produced, and what percentage of federal revenue business income taxes account for.
Table 480. Internal Revenue Gross Collections by Type of Tax: 2005 to 2010
Type of tax Gross collections (bil. dol.) % of total
2005 2006 2007 2008 2009 2010 2009 2010
United States, total 2,269 2,519 2,692 2,745 2,345 2,345 100% 100%
Business income taxes 307 381 396 354 225 278 10% 12%
Estate and gift taxes 24 27 25 27 22 20 1% 1%
Excise taxes 57 58 53 52 47 47 2% 2%
Source: Table 480. Internal Revenue Gross Collections by Type of Tax: 2005 to 2010. IRS.7
Therefore it is reasonable to expect that business should account for $300-400 billion of revenue in a year and 13.5-15% of all tax revenue (the percentages prior to the economic downturn in 2008, not shown). This contrasts with a U.S. GDP of $15.685 trillion and corporate earnings of $3.674 trillion, of which $223.0 billion was paid in taxes or 6.07% in 2010.
Corporation Income Tax Balance Sheet, 2006-2010 (billions of dollars)
There were 125.972 million non-government workers employed in the United States as of June 2013; specifically 4.125 million agricultural workers, 113.167 million employed by private industries, and 8.643 million self-employed and unincorporated (non-agricultural).9 Current corporate income tax brackets are as follows:
1993-2013 Corporation Income Tax Brackets and Rates
Tax Bracket Tax Rate
First $50,000 15.0%
$50,000-$75,000 25.0%
$75,000-$100,000 34.0%
$100,000-$335,000 39.0%
$335,000-$10,000,000 34.0%
$10,000,000-$15,000,000 35.0%
$15,000,000-$18,333,333 38.0%
Over $18,333,333 35.0%
Source: SOI Tax Stats - Historical Table 24. IRS.10
Given this, to enact a tax break system devoid of loopholes that operates simplistically with less paperwork and which provides tax breaks to companies who hire more U.S. workers, the corporation income tax rate should tax approximately 6-9% of corporation earnings after the tax break has been accounted for (it is assumed 2008 with its 25.43% of earnings rate is an anomaly, the other rates are between 5.51% and 9.05%). The tax break should determine the number of employees hired out of total earnings, and provide a tax break which will allow companies who hire more U.S. workers to pay lower tax brackets to encourage maximal U.S. hiring and avoid the growing effects of automation.
As a simple example of how this could be structured, all tax rates could be halved, the first $50,000 taxed at 7.5%, the next as 12.5%, etc., and then use a tax break which deducts from a company’s tax based on how many U.S. workers they hire as a proportion of company earnings. Those which hire a greater proportion would see considerably lower rates, with the ultimate goal to reduce the average rate for all corporations after taxes to 6-10% to keep the rate consistent with today’s rate. As such, the entire corporate tax system could be greatly simplified while removing unfair loopholes, providing the same tax revenue, and incentivizing companies to hire maximally rather than using automation.
Fair Trade
The United States’ trade with China and other low minimum wage countries has proven extremely lopsided. With China in particular, the U.S. has been importing 3.84 to 6.24 times in as much as it has been selling, and that is just in raw dollar amounts. The trade with our 2nd-ranked trading partner from whom we import more than any other country is a one-sided
9 Table A-8. Bureau of Labor Statistics. http://www.bls.gov/news.release/empsit.t08.htm
affair; the United States buys many times more than it sells, a situation which from a business standpoint one would consider untenable.
If trade is too lopsided as it has become with China, the argument that trade advantages both sides breaks down. Furthermore, since the average Chinese manufacturing wage is $3.10 an hour including benefits (58 cents an hour without benefits) relative to the $31.09 manufacturing wage of the United States, the goods they sell are made at 1/10th the cost of their U.S. counterparts. As such, given that we’re importing 3.84 times as much from China as they are from us, and that their goods are made at 1/10th the expense U.S. goods are, we are buying approximately 30-40 times more product from China.
U.S. Trade with China, 2000-2012 (billions of dollars).
Source: Trade in Goods with China. U.S. Census Bureau.11
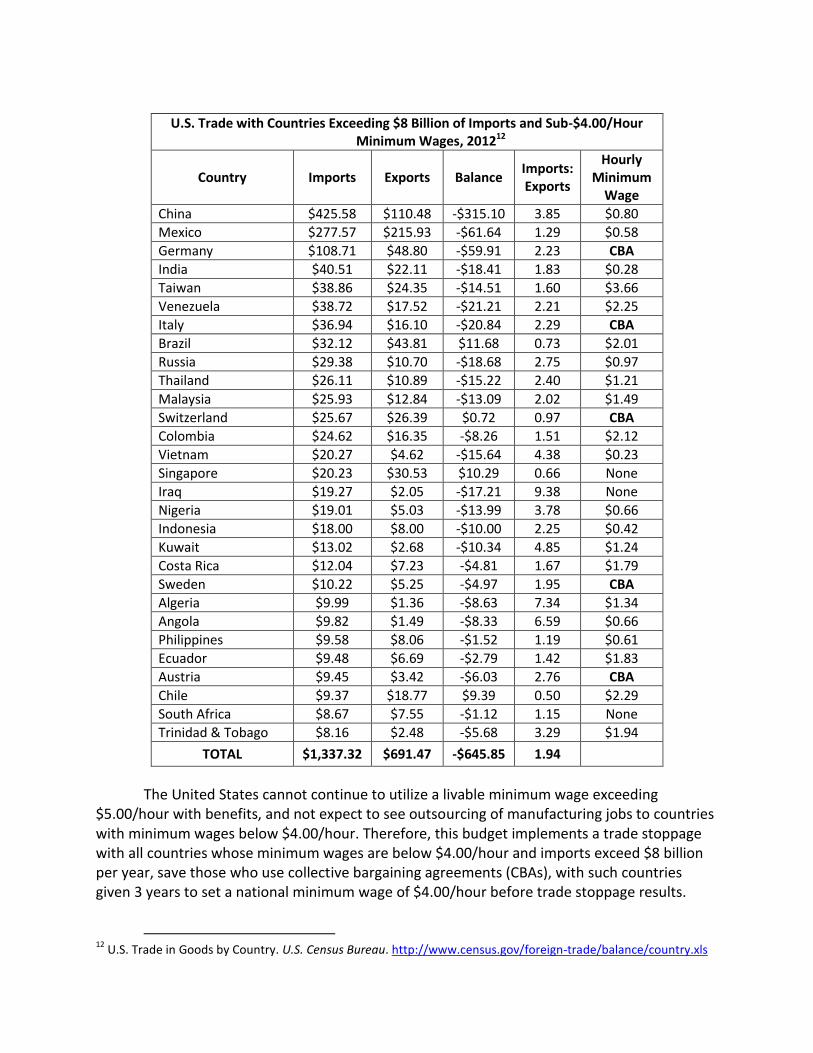
While less extreme, the United States runs trade deficits in the same manner with other low minimum wage countries as well. In 2012, the United States had a $646 billion trade deficit with the 24 countries whose minimum wages were below $4.00 an hour and which had imports exceeding $8 billion. The average Imports:Exports ratio for these 24 countries was 1.94, so the U.S. is importing almost double from these low-minimum wage countries what it is exporting. This Imports:Exports ratio is far higher than the ratio for high-minimum wage countries of 1.25 (Appendix Table 2).
U.S. Trade with Countries Exceeding $8 Billion of Imports and Sub-$4.00/Hour Minimum Wages, 201212
Country Imports Exports Balance Imports: Exports
Hourly Minimum
Wage
China $425.58 $110.48 -$315.10 3.85 $0.80
Mexico $277.57 $215.93 -$61.64 1.29 $0.58
Germany $108.71 $48.80 -$59.91 2.23 CBA
India $40.51 $22.11 -$18.41 1.83 $0.28
Taiwan $38.86 $24.35 -$14.51 1.60 $3.66
Venezuela $38.72 $17.52 -$21.21 2.21 $2.25
Italy $36.94 $16.10 -$20.84 2.29 CBA
Brazil $32.12 $43.81 $11.68 0.73 $2.01
Russia $29.38 $10.70 -$18.68 2.75 $0.97
Thailand $26.11 $10.89 -$15.22 2.40 $1.21
Malaysia $25.93 $12.84 -$13.09 2.02 $1.49
Switzerland $25.67 $26.39 $0.72 0.97 CBA
Colombia $24.62 $16.35 -$8.26 1.51 $2.12
Vietnam $20.27 $4.62 -$15.64 4.38 $0.23
Singapore $20.23 $30.53 $10.29 0.66 None
Iraq $19.27 $2.05 -$17.21 9.38 None
Nigeria $19.01 $5.03 -$13.99 3.78 $0.66
Indonesia $18.00 $8.00 -$10.00 2.25 $0.42
Kuwait $13.02 $2.68 -$10.34 4.85 $1.24
Costa Rica $12.04 $7.23 -$4.81 1.67 $1.79
Sweden $10.22 $5.25 -$4.97 1.95 CBA
Algeria $9.99 $1.36 -$8.63 7.34 $1.34
Angola $9.82 $1.49 -$8.33 6.59 $0.66
Philippines $9.58 $8.06 -$1.52 1.19 $0.61
Ecuador $9.48 $6.69 -$2.79 1.42 $1.83
Austria $9.45 $3.42 -$6.03 2.76 CBA
Chile $9.37 $18.77 $9.39 0.50 $2.29
South Africa $8.67 $7.55 -$1.12 1.15 None
Trinidad & Tobago $8.16 $2.48 -$5.68 3.29 $1.94
TOTAL $1,337.32 $691.47 -$645.85 1.94
The United States cannot continue to utilize a livable minimum wage exceeding $5.00/hour with benefits, and not expect to see outsourcing of manufacturing jobs to countries with minimum wages below $4.00/hour. Therefore, this budget implements a trade stoppage with all countries whose minimum wages are below $4.00/hour and imports exceed $8 billion per year, save those who use collective bargaining agreements (CBAs), with such countries given 3 years to set a national minimum wage of $4.00/hour before trade stoppage results.
12
U.S. Trade in Goods by Country. U.S. Census Bureau. http://www.census.gov/foreign-trade/balance/country.xls
The system will annually determine which countries exceeded $8 billion in imports in any previous year, and if their national minimum wages are below $4.00/hour, enact a complete trade embargo upon that country’s goods. As of 2014, only the above countries will be affected, with those which use collective bargaining agreements allowed an additional 3 years to enact national minimum wages since they had set sector minimum wages through collective bargaining.
Because the United States is importing almost double, on average, the value of goods from the aforementioned countries that it exports (1.93 Imports:Exports) and the goods are made by workers paid far less under minimum wages often below $2.00/hour, the trade has been disadvantageous to the United States. We are buying far more from the above countries than they are from us, manufactured goods that could be made here in the United States. Whatever the advantage might be from such mass-produced cheap goods, it is ultimately negated by the loss of U.S. jobs caused by cheaply paid, exploited foreign workers.
Such a regulation will have the double effect of not only creating a level playing field for U.S. workers to compete for vital manufacturing jobs with trading partners of the United States, but also of creating better working conditions for workers worldwide. Under the above system, countries will only be able to have considerable trade with the United States if paying their workers a decent minimum wage; thus empowering workers worldwide and reducing the global income disparity between poor and rich. As such, the above regulation is justifiable not only from a standpoint of U.S. economic necessity, but of global human rights.
Furthermore, the U.S. is then free to pursue global free trade with all other countries and remove all other trade barriers. Only those countries who have considerable commerce with the United States and do not pay their workers suitable wages should not be traded with. While trade will stop with countries who refuse to pay their workers $4.00 an hour minimum wages so that U.S. workers can compete, it will increase with all other countries.
Mandate Shareholder Voting of CEO Compensation
Given that shareholders own publicly traded companies, there is no good justification for allowing CEOs or a CEO-nominated Board of Directors to determine what a CEO’s salary should be. Shareholders should be able to determine a CEO’s pay in proportion to the shares they hold in the company as it is their money being spent.
A CEO has a vested interest in firing workers so long as they can determine their own pay, since doing so is the easiest way to free up company payroll for CEO bonuses. A company’s primary expense is typically payroll, and thus paying workers less is the easiest way to increase company profits. A CEO can easily profit a company and justify their own increased salary by reducing the company’s workforce through outsourcing, automation, and conversion to part-time/temporary workers so as to avoid the overtime and benefits of full-time workers.
America’s top 500 companies, the S&P 500, have been recording record profits year after year even as they reduce their U.S. workforces. Furthermore, CEO compensation has
increased from 59:1 in 1989 to 273:1 in 2012.13 The CEOs who fired the most workers in 2009 received on average 42% more pay than their S&P 500 peers.14 The 20 companies which received the most bailout money laid off 160,599 workers while giving their CEOs $275.6 million of compensation in 2008 alone, and some like Citigroup, Chase, Wells Fargo, Suntrust Banks, American Express, and State Street Corporation even increased their CEO pay dramatically after receiving bailout money.15
For all of these reasons, this budget mandates shareholder voting of CEO compensation at all publicly-traded companies to remove the incentive of CEOs to fire U.S. workers.
Individual Taxation Study
Given the complexity of the current income tax for individuals, it is high time the tax was simplified. Logically no more than 15 questions need to be asked, and perhaps less than 10, to reliably determine where wealth lies, and additional questions are unnecessarily intrusive and bureaucratic.
Therefore this budget institutes a study by the IRS to determine which questions best determine the overall net worth of the U.S. for purposes of accurate, comprehensive taxation. The numerous deductions and excessive questioning of our current income tax are unnecessary for purposes of accurately taxing the American people. We should keep the process of taxation minimal and initiate the first step towards a simpler, fairer, and more democratic tax system.