40
CHNG3807 Products and value chains Andrew Harris The University of Sydney Department of Chemical Engineering

CHNG3807Products and value chains
Andrew HarrisThe University of Sydney
Department of Chemical Engineering

The future of energy supply
Andrew Harris1,2
1Laboratory for Sustainable Technology, Department of Chemical EngineeringUniversity of Sydney, AUSTRALIA
2Darwin College, University of Cambridge, CB3 9EU, UNITED KINGDOMTel: +61 2 9351 2926, Fax: +61 2 9351 2854
Energy Information Administration (EIA) (www.eia.doe.gov)
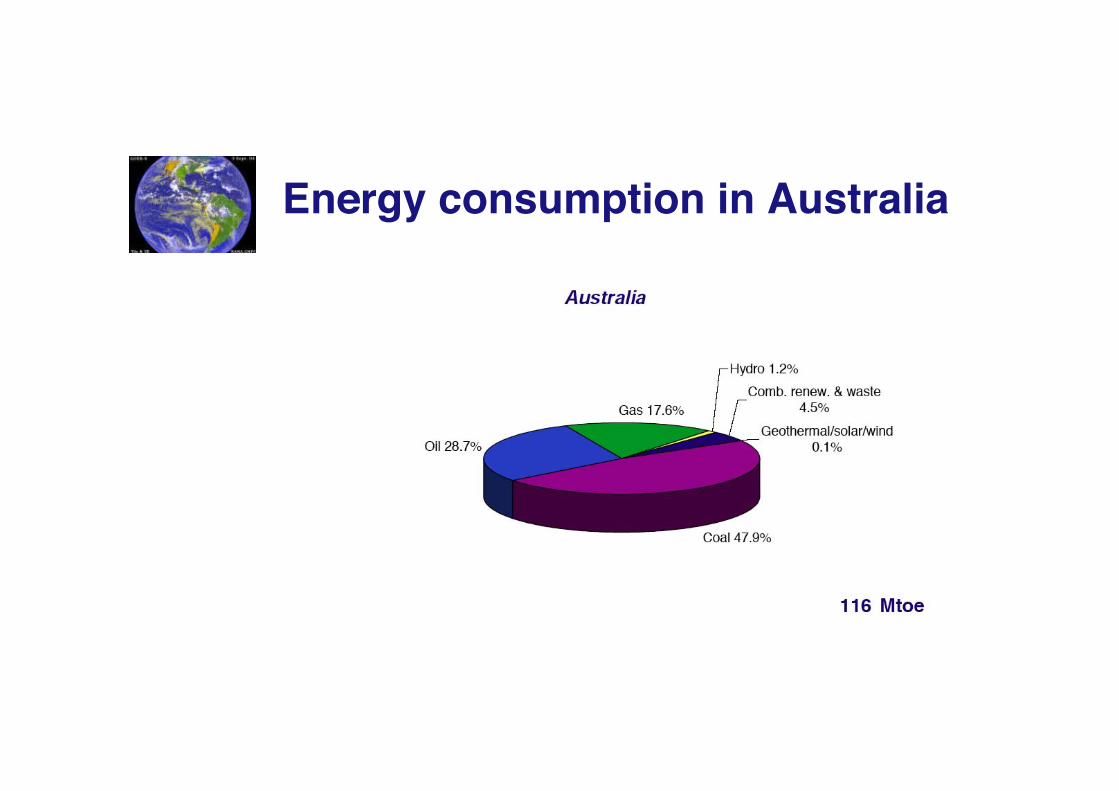
Energy consumption in Australia
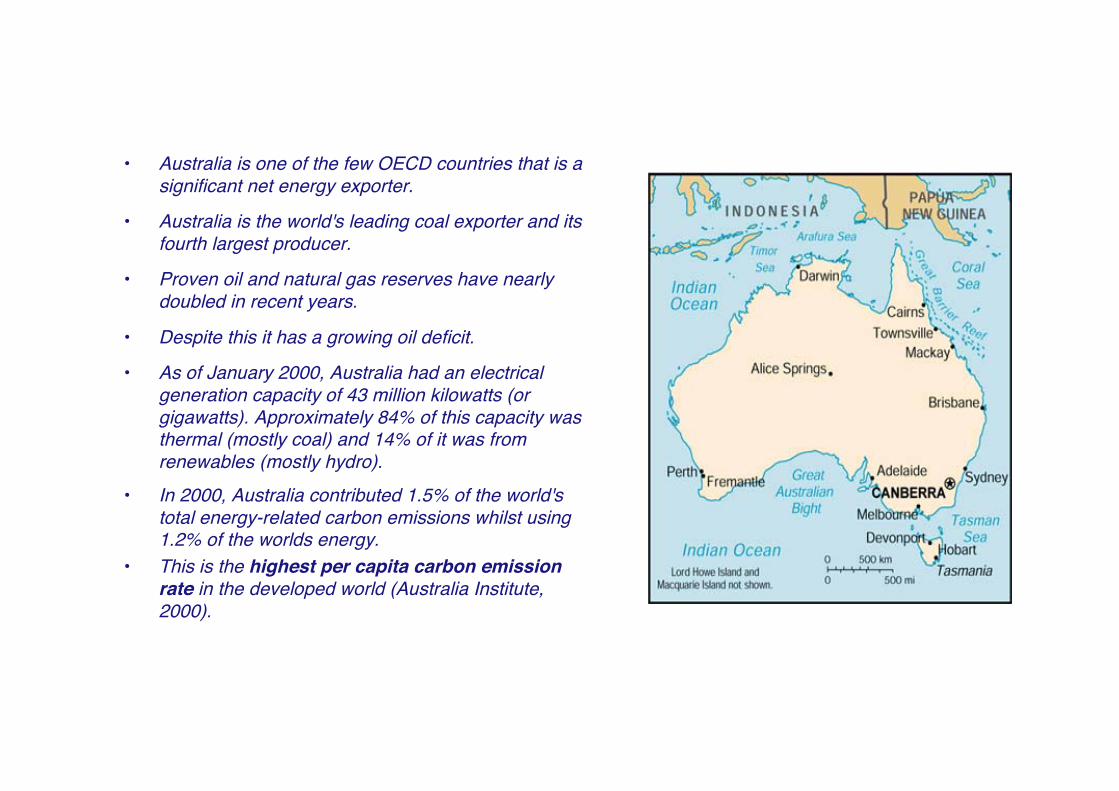
• Australia is one of the few OECD countries that is asignificant net energy exporter.
• Australia is the world's leading coal exporter and itsfourth largest producer.
• Proven oil and natural gas reserves have nearlydoubled in recent years.
• Despite this it has a growing oil deficit.
• As of January 2000, Australia had an electricalgeneration capacity of 43 million kilowatts (orgigawatts). Approximately 84% of this capacity wasthermal (mostly coal) and 14% of it was fromrenewables (mostly hydro).
• In 2000, Australia contributed 1.5% of the world'stotal energy-related carbon emissions whilst using1.2% of the worlds energy.
• This is the highest per capita carbon emissionrate in the developed world (Australia Institute,2000).


what are some alternatives?
• introduce “end of pipe” solutions• reduce global energy consumption• improve energy efficiency, introduce demand management• sustainable and renewable energy (cleaner, low carbon)• carbon sequestration• hydrogen economy
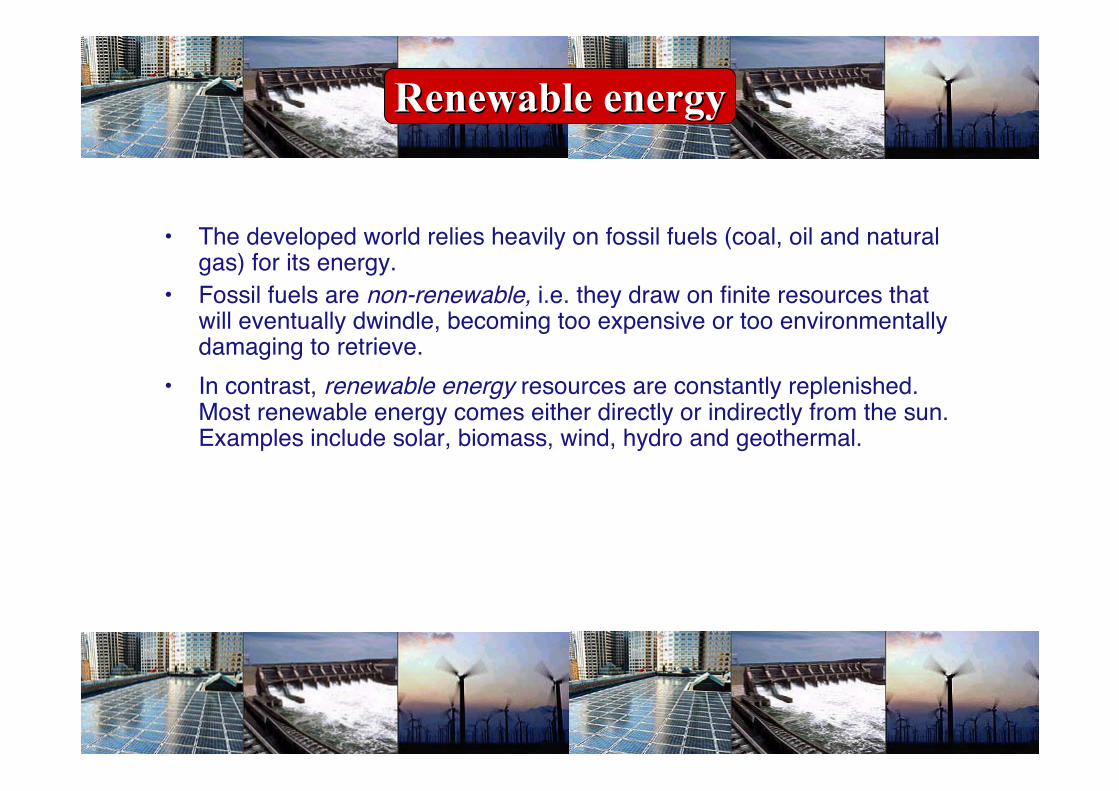
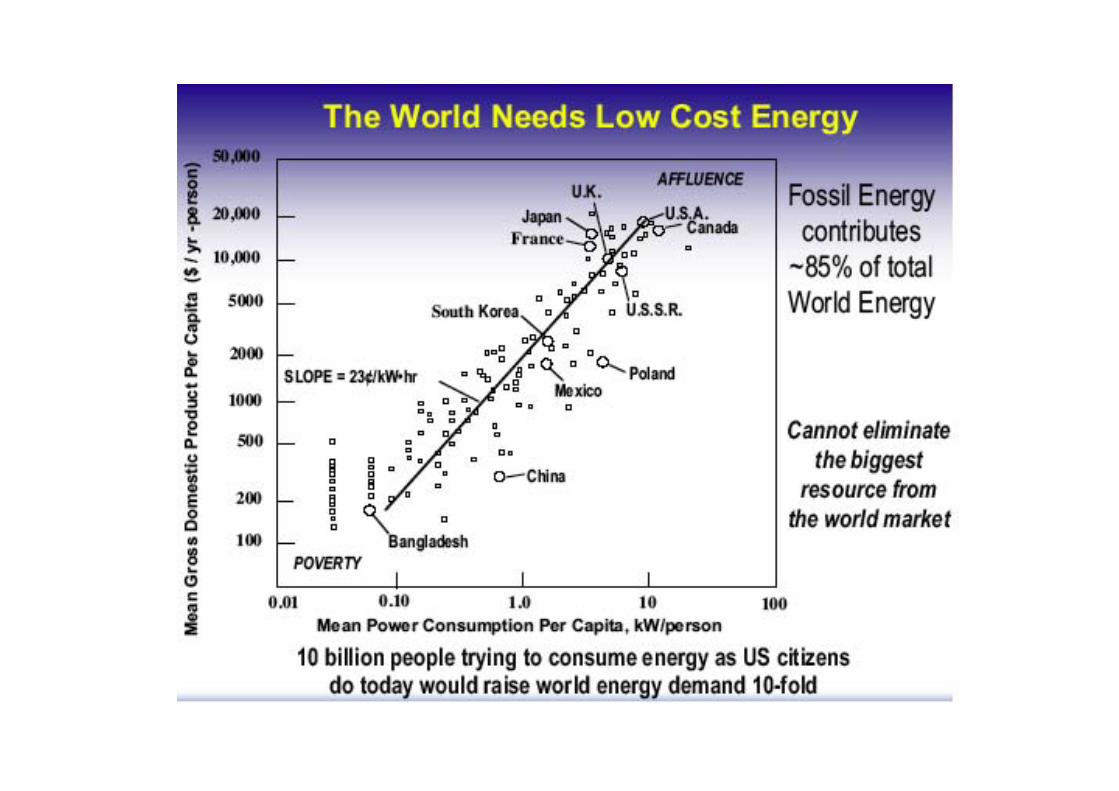
• The developed world relies heavily on fossil fuels (coal, oil and naturalgas) for its energy.
• Fossil fuels are non-renewable, i.e. they draw on finite resources thatwill eventually dwindle, becoming too expensive or too environmentallydamaging to retrieve.
• In contrast, renewable energy resources are constantly replenished.Most renewable energy comes either directly or indirectly from the sun.Examples include solar, biomass, wind, hydro and geothermal.
Renewable energyRenewable energy

Additional resources
• http://sequestration.mit.edu/index.html• http://www.newscientist.com/hottopics/climate/• http://www.iea.org/• http://www.smartoffice.com/principles.htm• http://www.thecarbontrust.co.uk/carbontrust/climate_change/iocc4_4_1.html• www.wwf.org.au/News_and_information/
Publications/PDF/Report/clean_energy_future_report.pdf• http://www.wwf.org.au/News_and_information/Features/feature10.php

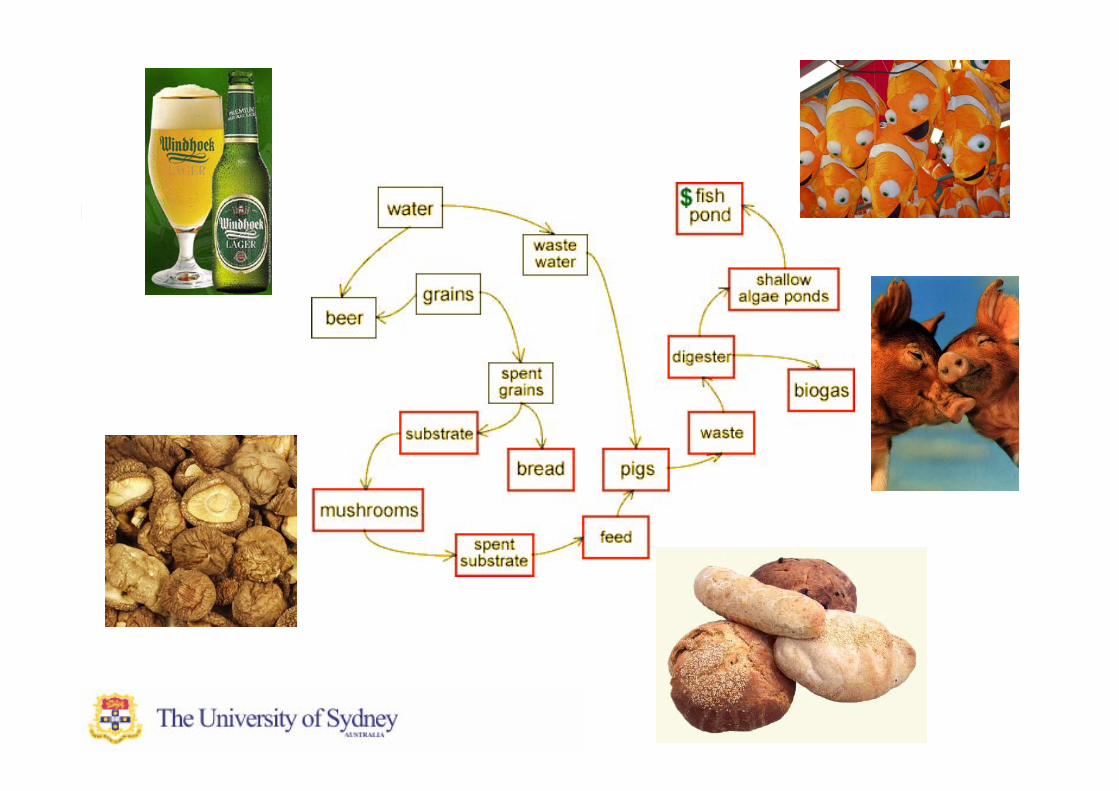
Zero emission process design
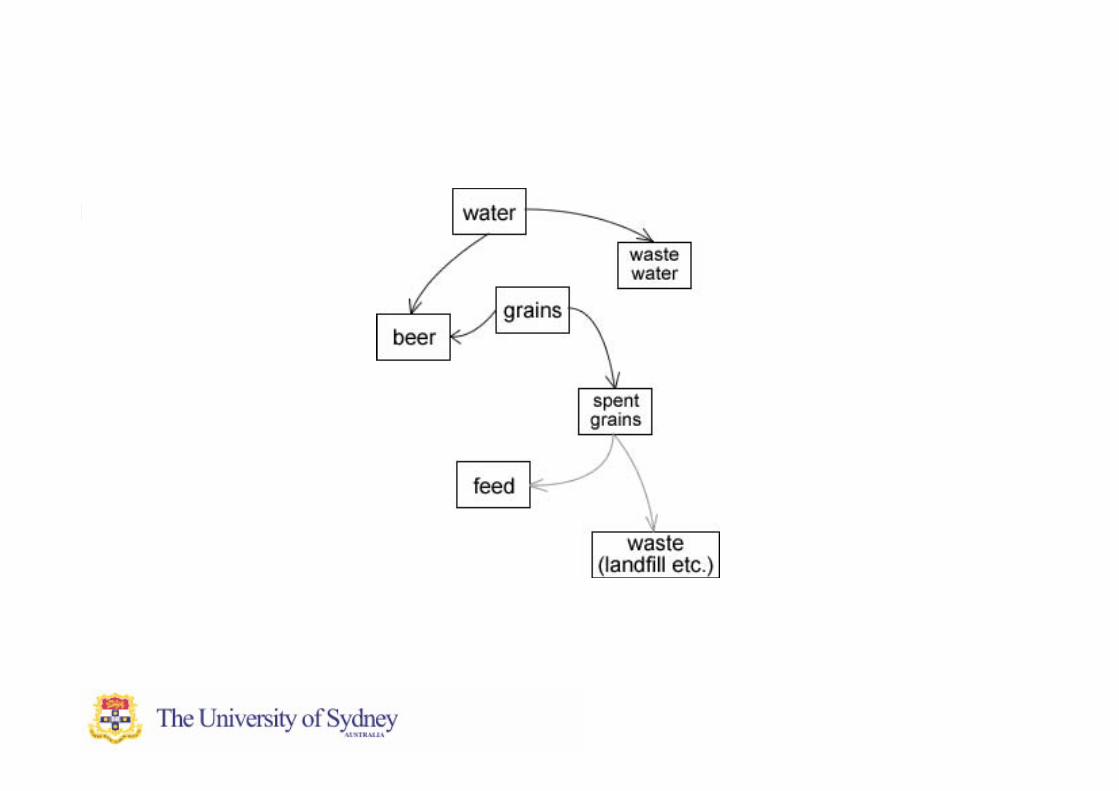
• Creating processes that have no waste streams.They make use of synergistic industries clusteredaround the plant to achieve this, e.g. ZERI brewery,mushroom farm, fish farm, piggery and steamgenerator.
• There are opportunities for zero emission processesin all industries across Australia and around theworld.
• e.g. zero emission coal technology in Australia.

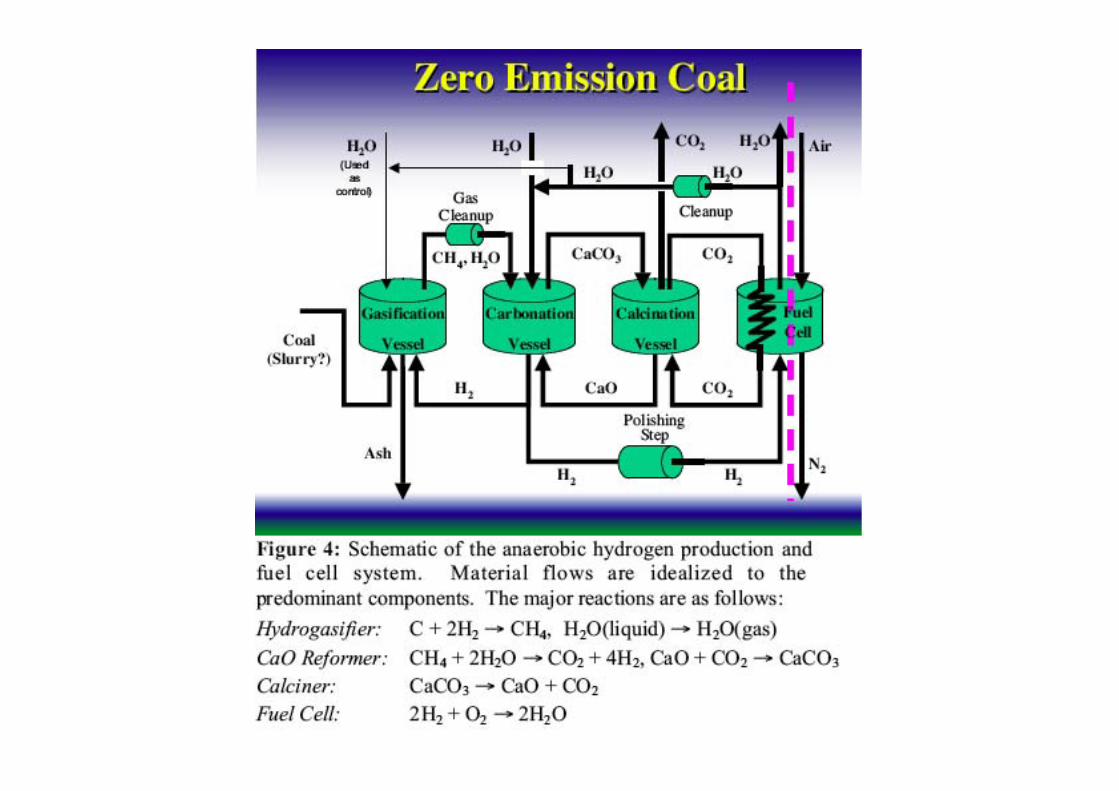
Zero emission coal
• Handout

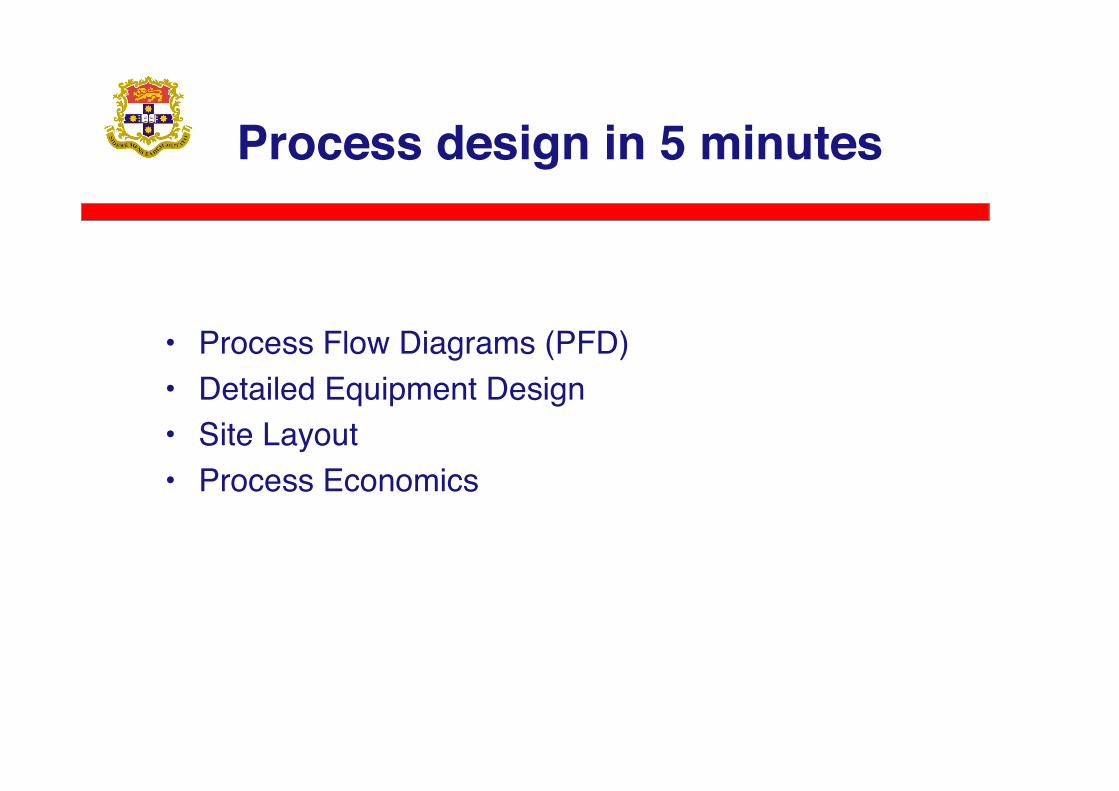
Process design in 5 minutes
• Process Flow Diagrams (PFD)• Detailed Equipment Design• Site Layout• Process Economics

Purpose of PFDs
• Communicate the principal operational steps in a process• Show all major feeds, products, by-products and wastes• Show all major processing units• Give basic mass and energy balance details• Show utility streams and usages

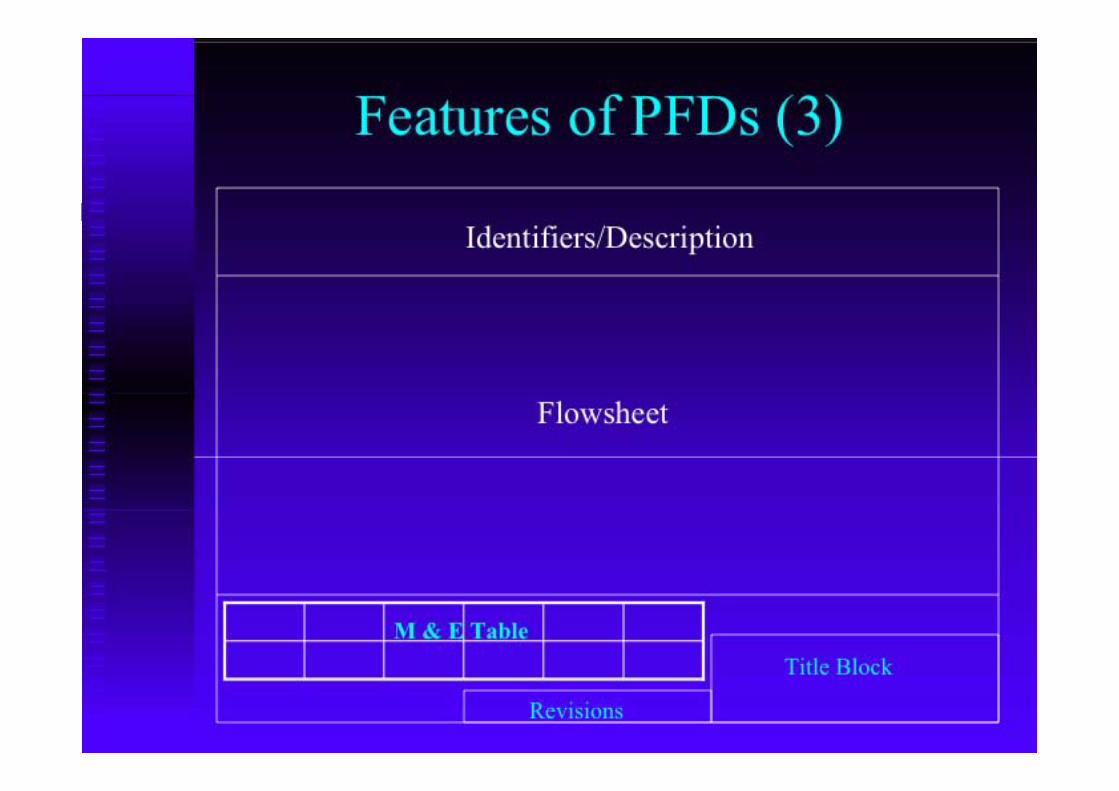
Features of PFDs
• All equipment has a code (e.g. T-101 = tank 101)– Often company standard– Coding letter relates to equipment– Number relates to item in class– First number often plant section First number
often plant section (cf. T-101, T201)• Coding can include:
– T = tank, R = reactor, C = column, P = pump, M =mixer, F = filter, D = dryer, HX = heat exchanger,Q = furnace, V = vaporizer, G = gas movers

Features of PFDs
• Spatial layout important– Flow from left to right– Equipment well spaced– Top section for identifiers and description– Bottom section for M&E Table– Adapt for P&ID– Equipment to follow vertical orientation as much as possible
much as possible


Preparation of PFDs
• Do rough sketch first• Select appropriate icons for units, number streams• Layout to reduce cross cross-over lines• Do draft drawing• Get someone else to check and sign off