46
ZEF-Discussion Papers on Development Policy No. 242 Adebayo M. Shittu, Dare Akerele and Mekbib Haile Food Price Spikes and Volatility in Local Food Markets in Nigeria Bonn, September 2017
ZEF-Discussion Papers on Development Policy No. 242
Adebayo M. Shittu, Dare Akerele and Mekbib Haile
Food Price Spikes and Volatility in Local Food Markets in Nigeria
Bonn, September 2017

The CENTER FOR DEVELOPMENT RESEARCH (ZEF) was established in 1995 as an international,
interdisciplinary research institute at the University of Bonn. Research and teaching at ZEF
address political, economic and ecological development problems. ZEF closely cooperates
with national and international partners in research and development organizations. For
information, see: www.zef.de.
ZEF – Discussion Papers on Development Policy are intended to stimulate discussion among
researchers, practitioners and policy makers on current and emerging development issues.
Each paper has been exposed to an internal discussion within the Center for Development
Research (ZEF) and an external review. The papers mostly reflect work in progress. The
Editorial Committee of the ZEF – DISCUSSION PAPERS ON DEVELOPMENT POLICY includes
Joachim von Braun (Chair), Christian Borgemeister, and Eva Youkhana. Chiara Kofol is the
Managing Editor of the series.
Adebayo M. Shittu, Dare Akerele and Mekbib Haile, Food Price Spikes and Volatility in Local
Food Markets in Nigeria, ZEF – Discussion Papers on Development Policy No. 242, Center for
Development Research, Bonn, September 2017, pp. 42.
ISSN: 1436-9931
Published by:
Zentrum für Entwicklungsforschung (ZEF)
Center for Development Research
Genscheralle 3
D – 53113 Bonn
Germany
Phone: +49-228-73-1861
Fax: +49-228-73-1869
E-Mail: [email protected]
www.zef.de
The author[s]:
Adebayo M. Shittu, Department of Agricultural Economics and Farm Management,
Federal University of Agriculture, Abeokuta, Nigeria. Contact: [email protected]
Dare Akerele, Department of Agricultural Economics and Farm Management,
Federal University of Agriculture, Abeokuta, Nigeria. Contact: [email protected]
Mekbib Haile, Centre for Development Research (ZEF), University of Bonn, Germany.
Contact: [email protected]

Acknowledgements
This research was funded by University of Bonn, Gemany. The research has also benefitted
from capacity building investments by the African Growth & Development Policy (AGRODEP)
modeling consortium, a group facilitated by International Food Policy Research Institute
(IFPRI), Washington, DC. Omotoso Ogunmola and Sarah Edewor at the Federal University of
Agriculture, Abeokuta, Nigeria provided support in carrying out this research. We are very
grateful to Katrin Gleisberg-Gerber who provided editorial support. We acknowledge the
invaluable suggestions for improvement of the paper by ZEF Working Papers’ Reviewers as
well as very useful comments by participants at Africa & COSBAE Track Session on Food Prices
and Price Volatility in Africa South of the Sahara during the 2017 Annual Meeting of
Agricultural and Applied Economics Association (AAEA). Many thanks also to the National
Bureau of Statistics, Nigeria, for the assistance in getting the domestic food prices for the
study. The authors are purely responsible for the views expressed, and any errors made.

Abstract
Beside the mixed evidences on transmission of international food price volatility to local
markets and the desirability or otherwise of reliance on stabilisation policy to cushion the
effects, very little is known about the key drivers of price spikes and volatility in sub-Saharan
Africa. This paper is an attempt to bridge this gap, by focusing on the patterns, drivers, and
policy responses to food price spikes and volatility across in Nigeria. The study was based on
16 years panel data on average monthly prices (2001:1 – 2016:12) of major food commodities
across local markets in the 36 States of Nigeria, supplemented with monthly series of relevant
domestic policy variables, and international prices, among other factors. Data analysis was
mainly within the framework of fixed effects models. Findings suggest that food price
upsurges in an average Nigeria market is more strongly related to spikes than volatility.
International factors such as crude oil price, international food prices, and global beginning
stock to use of coarse grains, and domestic policy variables such as real exchange rates,
monetary policy rates and narrow money are strong influencers of spikes in the price of one
or more food commodities in Nigeria’s local markets. Higher petrol price and food production
variability may substantially advance price instability in local food markets. Government
policy actions at addressing volatile food prices immediately after the 2007/2008 food crises
appeared to enhance food price stability. These findings call for greater attention on
management of monetary policy, including the exchange rates, ensuring stable petrol price,
limiting food production instability, mitigating spill-over of price upsurges from international
markets and building farmers and consumer’s resilience against food price changes, among
others, as important pathways to address short and medium-term food price upsurges.
Keywords: Price Spikes, Price Volatility, Monetary Policy, Local Food Markets, Nigeria
JEL codes: E31, E52
1
1. Introduction
The global food crisis of 2007-08 coupled with the resurgence of food price spikes in 2010-11
and rising food price volatility ever since have brought a great deal of research attention to
issues related to rising and volatile food prices. The common evidence has been that food
price spikes and volatility have been unprecedentedly high across many regions of the world
over the last decade (Ghosh et al., 2011; Tadese, 2012; Minot 2011, 2014). Volatility is often
regarded as variance and it is a measure of the dispersion of a random variable from its mean
value. Thus, price volatility relates to the fluctuations (or instability) in price around its mean
value over time or the risk of large, unexpected price changes (Omotosho and Doguwa, 2012;
Tadesse et al., 2014; Kalkuhl et al., 2013) while a price spike is a large, quick, and temporary
rise or fall in price (Tadesse et al., 2014) following a short-term shock.
According to World Bank (2012) projections, the pattern will remain for most major food
commodities over the next decade. The food price spikes and higher volatility of the past
decade have also been reported as having had huge economic costs and exerted negative
welfare impacts on many households, especially those of the poor, smallholders and female
headed households in Africa (von Braun and Tadese, 2012; Minot 2011, 2014; Shittu et al.
2015; Kalkuhl et al., 2016 ). Evidences however abound suggesting that the volatility levels,
drivers and impacts vary widely across regions and countries, among crops and between
processed and unprocessed foods as well as between traded and non-traded goods (Gilbert
and Morgan, 2010; Minot, 2014). Emergency, and spontaneous (panicky) policy responses
based on anecdotal assessments were helpful to reduce food price inflation in domestic
markets in some countries, it however, fuelled international price dynamics and had adverse
impacts on other importer countries (Martin and Anderson, 2012; Anderson, and Nelgen,
2012; Martin and Ivanic, 2016). It is therefore, imperative that in-depth analysis of food price
spikes and volatility are undertaken across local markets and commodities in Africa as to
provide information in support of intervention targeting and development programming in
the sub-region.
Nigeria occupies a central place in Africa’s and global food markets. The country is the largest
producer of cassava (of which garri – cassava flakes is a major product) in the world, one of
the Africa’s largest producer of rice and ironically the largest importer of rice in the world
(FAO, 2017). Hence, fluctuations in food prices in the country are more likely to be exported
to other countries in Africa and beyond, while changes in regional or world prices are also
more like to affect the country. This makes the country a suitable candidate for investigation
on food prices movements. In the context of high and volatile food prices, an understanding
of the drivers of food price spikes and volatility within the local commodity markets in Nigeria,
and the impacts of government policy responses in managing the price shocks across the
different states of the country becomes essential. This is more so given that there are very
2
few in-depth studies of the subject matter even though the country has been included – at
national aggregate level - in a number of price transmission and impact studies, notable Minot
(2014), Shittu et al. (2015), and Martin and Ivanic (2016), among others. The study is an
attempt to fill this knowledge gap.
The focus of this paper is on price spikes and volatility as opposed to price trend, which is,
reasonably expected long-term price changes that have little relevance to food crises. From a
welfare perspective, price spikes and volatility are more important than trends in overall price
levels. Price spikes can cause crises for consumers, investors, and farmers. This is because
price spikes and volatility are the primary indicators of food crises (Abbott et al., 2011). It is
believed that a food crisis is more closely related to extreme price spikes, while long-term
volatility is more strongly connected to general price risks (Tadesse et al., 2014). The
distinction between price spikes and volatility is to differentiate between factors that cause
risks to poor consumers and those that engender uncertainties to agricultural producers. Both
high and volatile prices create challenges for policy makers and the global community (FAO,
2011).
Literature identifies the major drivers of global food price spikes and volatilities. These include
agricultural production shocks such as drought and unfavourable weather conditions leading
to poor farm harvests in some major food producing countries; increases in input costs due
to higher fuel and fertilizer prices, higher transportation costs; diversion of food crops to
production of biofuels, and the introduction of policies to restrict food exports, import bans
and increase in tariffs. Mitchell (2008) argues that the most important driver is the large
increase in biofuels production in the United States and the European Union. Frankel (2006)
and Krichene (2008) noted expansionary monetary policy in key industrial countries, which
brought low interest rates, and a sudden fall in the value of the US dollar as a contributory
factor to the world food price volatility.
In an attempt to distinguish how different factors affect price changes, Tadesse at al. (2014)
summarized the potential drivers of food price changes into three categories: exogenous
shocks, also called “root” causes; “conditional” causes; and “internal” drivers. The root
causes, include, among others, extreme weather events, production shocks, oil price shocks
and demand shocks. The root causes were regarded as exogenous factors because the
possibility of a causal relationship between them and agricultural sector is minimal. The
internal drivers of price spikes and volatility are factors that are activated by the same price
dynamics and are referred to as endogenous shock amplifiers - examples of which are
discretionary trade policies and speculative activities propelled by price expectations and
reduction in global food stocks.
Many studies have examined the causes and drivers of food spikes and volatility at the global,
regional (Tadesse at al., 2016) and/or country levels (Kornher and Kalkuhl, 2013) and have
noted how changes in international and domestic factors affect food prices. While this has its
3
own merits, focusing on drivers of changes in worldwide aggregate or regional may mask
information about unique drivers of spikes and volatility at the country level or specific
regions within a country. This is because price spikes and volatility, and their distributional
implications on household welfare may vary substantially across regions in a country due,
among others, to the varying degree of price transmission and regions specific factors. For
instance, Minot (2014) found in African countries, contrary to the conventional thinking,
minuscule or statistically insignificant evidence of rising food price volatility. He noted that
while some prices became more volatile during 2007–2010, a larger number of prices have
become more stable in contrast to documentations by many workers on price volatility.
Hence, it is crucial to better understand price changes and their drivers at a country level and
in the regions within a country.
In the case of Nigeria, Masha (2000) indicated that the high inflation episodes in the country
since the 1970s were largely driven by the growth of money supply and some factors
reflecting the structural characteristics of the national economy. Mordi et al. (2007) noted
that price inflation is triggered by excess money supply, scarce foreign exchange, severe
shortages in commodity supply and continual labour and political unrest. High lending and
interest rates on bank deposits, devaluation of the national currency Naira, and a very high
and rising cost of production have contributed to rising general price levels in Nigeria (CBN,
2012). Shittu et al. (2015) identified monetary policy rates, Naira-to-Dollar exchange rate,
domestic narrow money supply, and rise in pump price of the premium motor spirit (petrol)
following the federal government “subsidy withdrawal policy” as important factors
contributing to exacerbated food prices in Nigeria.
Recently, Nigeria has experienced a historically unprecedented increase in food prices,
traceable in part to insurgency in the North-eastern region of the country and bombing of
refineries in the “oil rich” Niger Delta region. The supply of food from the North-eastern
region has been reduced drastically as unrest continues to prevail in the region. It is expected
that continued shortage in food supply and a concomitant increase in food prices until the
insurgency is reasonably contained. Reports from the Famine Early Warning System Network
(FEWS NET) (2016) suggests that Nigeria would face a credible risk of famine in 2017 (and
coming years) due to persistent conflict, severe drought and economic instability, which has
accentuated mass population displacement, restricted market activity and normal livelihoods.
A drop-off (shock) in oil revenue, which accounts for 70 per cent of Nigeria's state income,
has dried up hard currency supplies needed to fund food and other vital imports in the
country.
A number of emergency actions and policy responses have been implemented in Nigeria to
combat and/or cushion the effects of price spikes and volatility, most especially in the wake
of the global food price spikes of 2007/08 and the resurgence in 2011. These include release
of strategic grain reserves, ban on maize export, review of tariff regimes, review of minimum
4
wages, provision of assistance to farmers in form of input subsidies to meet rising input costs,
and reliance on trade and monetary policy instruments to stabilise prices, working within the
statutory roles of the Central Bank of Nigeria’s – Monetary Policy Committee (MPC).
In the wake of the liquidity crisis created by the global financial crisis in 2007, the MPC
resorted to monetary easing between 2008 and 2010 with a view to addressing the problem
of liquidity shortages that arose within the banking system (CBN, 2017). This entailed
progressive reduction of the Monetary Policy Rate (MPR), the Cash Reserve Ratio (CRR) and
the Liquidity Ratio (LR), among other measures, while the Open Market Operations (OMO)
was suspended. This expansionary monetary policy stance was however jettisoned in periods
after the 2007 – 2011 crises. Between 2012 and date, emphasis was placed on monetary
tightening – progressively raising MPR, CRR and LR as well as the midpoint and band around
the official exchange rate, while OMO are used to mop up or inject liquidity into the system
as the monetary policy focus shifted to achieving price and exchange rate stability (CBN,
2017).
The main objective is to undertake in-depth, crop specific and state/zonal level analysis of the
patterns and drivers of food price spikes and volatility in Nigeria. More specifically, the
influence of both external and domestic factors – monetary, trade and fiscal policy as well as
non-policy factors – on food price formation in Nigeria are assessed. Findings from this study
are critical for policy development, consumers, farmers and other interest groups at the local
and global level. The paper is organized as follows. Section 2 elaborates on the methodology.
The study data, the descriptive results and the econometric results are presented in sections
3 to 5. The final chapter concludes the main findings of the study.

5
2. Methods
2.1 Empirical Model
Evidences in literature, as reviewed in the preceding section, suggest that price spikes and
volatility in a domestic market may be linked with multiple and interconnected drivers
including market fundamentals, international prices and GDP, and domestic macroeconomic
environments, among others. Apart from these factors, price spikes or variability may also
be influenced by location and commodity specific factors, some of which may be
unobservable (Kornher and Kalkuhl, 2013). Hence, our empirical approach is to examine the
determinants of the hypothesized domestic food price spikes and volatility across the panel
of 36 States of Nigeria within the framework of fixed effect panel data model. This allows
consistent estimation of the influence of observable time varying food price spike/volatility
drivers, while controlling the influence of time invariant unobservable state specific sources
of heterogeneity.
In modelling drivers of food price spikes/volatilities, lagged values of dependent variables are
often introduced to account for the possibility that previous spike/volatility may influencing
current ones. We thus introduced lagged dependent variables in our models. This practice
however, tend to introduce dynamic bias (Nickell, 1981) into the model, warranting a resort
to use of the dynamic difference or system generalized method of moment (GMM) in such
model estimation. Nickell (1981), however, cautioned that these estimators are more
appropriate (and should be used) for cases involving small period (T) and large panels (N). He
noted that when time (T) is large (as is the case in the present study), the dynamic bias tends
to disappear and a more straightforward fixed effects estimator can be applied to the dynamic
model. Besides, the GMM approach comes with an estimation challenge: the number of
instruments in difference and system GMM tends to explode as time (T) becomes large
(Roodman, 2007). Given that we have a very long period (T=180), we presume that the
possible dynamic bias that may arise with the introduction of lagged value of dependent
variable (and its associated endogeneity) would be insignificant. Hence, a straightforward
fixed effects (panel) regression models were estimated, as described in the following sub-
sections.
2.1.1 Food Price Spikes Model
The general form of the fixed effects food price spike model for a commodity is given as:
itiititit cXYY 1lnln 1
Where: Yit is the average price of the referenced commodity at local markets in the ith state
in time t. 1lnlnln ititit YYY is the price spike [log price return] observed for the
referenced commodity between the referenced month and the previous month. Xit is a row

6
vector of time-varying regressors; ci is the unobservable time invariant state specific sources
of heterogeneity in price spikes, while 𝑖𝑡 is the stochastic residual term assumed to be a
Gaussian white noise with 0),|( cXE . i=1, 2, 3, …, I and t=1, 2, 3, …, T. I is the total
number of states (36) in the country and T is the total number of months (180), covering from
2002:1 to 2016:12 for which price spikes and volatilities were estimated. The total number of
observations equals 6480.
The fixed-effects (unlike random-effects) framework, is appropriate where 𝑐𝑖 may be
correlated with 𝑋𝑖𝑡, but 𝑋𝑖𝑡 remains uncorrelated with it . Using the framework thus, control
some forms of endogeneity problems that may arise where some unobserved state specific
factors like production or demand patterns, among others, contribute to observed food price
spikes. The cluster robust option was applied in the model estimation.
For robustness check, we also estimated the seemingly unrelated regression (SUR) models of
food price spikes and compare the results with those of estimated fixed effects model. We
presumed that it is possible that spikes in a given market or commodity may be related to
spikes (i.e. have spill over effects) in other markets or commodities. The fixed effects
estimation framework does not control for the cross market and/or commodity correlations,
which SUR does. However, while SUR models control for cross market/commodity
correlations as well as allow some naïve ways of examining the possible influence of some
observed time-invariant factors, it does not control for unobserved state/crop specific
sources of heterogeneity which raise some forms of endogeneity concerns.
The seemingly unrelated regression food price spike model estimated is specified as:
ijtjijtijtijt eXYY ij
'
1Dlnln 2
Variables in the model are as defined in the fixed effects model, but with j introduced to
represent specific food commodity. j=1, 2, 3, …, J. The total number of commodity considered
(J) is eleven (11). The residual terms (eijt) are assumed to have zero mean, homoscedastic (σ2)
and independent across individual observations. However, the complexity is that errors may
be correlated across equations (commodities) and markets in the states, such that E(eijt
eijtꞌ)=σijtꞌ, and σijtꞌ ≠0 when j=jꞌ. For the 11 equation systems, E(eeꞌ)=∑ IN with N=TI. Where
∑=(σijt) is 11 by 11 positive-definite matrix and is the Kronecker products of the 11 matrices.
Description of the variables in the price spike models are presented in Table 1.
2.1.2 Modelling Food Price Volatility
In this study, annual food price volatilities were computed for each commodity in each of
months of the year 2002:1 – 2016:12, using the last 12 month ending in the particular month
as the year (t) (details in section 2.2). It follows therefore that the volatility of each month of
year t contains (is estimated with) overlapping information (price spikes) from the eleven (11)
preceding months. Consequently, we conjectured that even in the absence of Nickel bias,
7
there may exist possibility of serial correlation given the way volatility was estimated. Thus,
we estimate (for robustness check) another strand of the fixed effects model that could
potentially handle serially correlated errors (equation 4) in addition to the (basic) fixed effects
model (equation 3).
The estimated (basic) fixed effects model for the price volatility of a specific food commodity
is specified as:
itiititit cZVV 1 3
Where: Vit is the volatility of price spikes, while Zit and ci are as earlier defined.
The fixed effects model with first order autoregressive scheme is specified as:
itiititit cZVV 1
𝑖𝑡
= 𝜌𝑖𝑡−1
+ 𝑢𝑖𝑡 4
Where: 𝑢𝑖𝑡 are error terms independently normally distributed with mean zero and constant
variance; 𝜌 is a measure of correlation between the empirical 𝑒𝑖𝑗𝑡 and its lag, 𝑒𝑖𝑗𝑡−1. We
examined the presence of serially correlated (AR1) disturbance using Bhargava et al. (1982)
Durbin–Watson statistic. Bhargava et al. (1982) noted that in datasets with large panels,
Durbin–Watson statistic estimates below 2 suggest rejection of the null hypothesis of serially
independent errors. He noted however, that very low values may suggest that errors follow
a random walk.
2.2 Variables Definition and Measurements
Food Price Spikes and Volatility
While (as mentioned earlier) price spikes relate to huge, quick but temporal upsurge and drop
in price, volatility captures long term variation in prices. Price volatility is a measure of price
dispersion from the mean which shows the risk that is related to price changes and signifies
substantial long-term price movement. Price spike is measured using the logarithm of period
(month) to period (month) prices of food items (P) over the entire years being considered
(Tadesse et al., 2014). It is formularized as
∆𝑙𝑛𝑃𝑚𝑡 = ln (𝑃𝑚
𝑃𝑚−1) = ln(𝑃𝑚) − ln (𝑃𝑚−1) 5
where ∆ represents difference operator, m represents month of the year and t represents the
year.
Food price volatility has been assessed using the standard deviation of log price return and
the coefficient of variation of the original price. Two broad views appear to be well projected
in the literature with respect to the “time dimension” of volatility being examined. The first
focuses on assessing volatility within months of specific (marketing) years over the entire
8
years for which volatility is studied (Balcombe, 2009; Minot, 2014). Volatility estimation
(either the standard deviation of log price returns method or the traditional coefficient of
variation approach) based on within months of specific marketing year only accounts for
intra-annual volatility, but fails to consider inter-annual variability (Tadesse et al., 2014;
Geman and Ott, 2014). Following Balcombe (2009), volatility within months of a year can be
specified as:
𝜎𝑝𝑡 = √[∑1
𝑁(𝑤𝑚𝑡 − �̅�)2] 6
where 𝜎𝑝𝑡 is the realized volatility for the year captured as the standard deviation of log
returns of price over the year. 𝑤𝑚𝑡 = ∆𝑙𝑛𝑃𝑚𝑡 is the log price returns and �̅� = ∑1
𝑁𝑤𝑚𝑡 is the
mean of the log price return. An advantage of the Balcombe (2009) methods is that it provides
a convenient way to circumvent the trend/unit root problem. The conventional (normal)
coefficient of variation is given as 𝜎
𝜇. Where 𝜎 is the standard deviation of (original) price over
the months of a given period (one year) and μ is the mean value of price.
As noted earlier, it is fundamental to measure volatility with some insights into inter-year
food price volatility. To achieve this, Tadesse et al. (2014) modified the conventional
coefficient of variation by dividing 𝜎 by the mean price of the whole sample (years), and as
such introduced a somewhat inter-year volatility, reflecting the measure of risks endured by
consumers and farmers over a period of time longer than the cropping or marketing year. The
modified formulation is given as:
𝐶𝑉𝑦 =∑ (𝑃𝑚−𝑃𝑦̅̅̅̅ )
212𝑚=1
∑ 𝑃𝑡𝑇𝑡=0
𝑇
12 7
where y represents a specific year, m represents month, and T is t month (12) by total number
of years under consideration.
Balcombe (2009) and Tadesse et al. (2014) estimate price volatility over marketing years with
no overlapping observations. However, in our assessment, we employed both Balcombe
(2009) and Tadesse et al. (2014) specifications with some modifications. As noted earlier,
rather than estimating volatility over marketing years with no overlapping observations, our
volatility estimate for each month of the year is with overlapping observations captured on
12 months (one marketing year) interval, starting progressively from December 2016
(through November of the same year) to the last month of year, 2001. By doing so, we are
able to capture intra-annual volatility, and some elements of annual variability. Likewise, we
employed the modified version of Tadesse et al. (2014) formulation, howbeit computed with
overlapping observations to assess some inter-year dimensions of volatility across the entire
sample period (years on interest).
9
Key control variables
The control variables are derived from literature review following Tadesse et al. (2014) and
Kornher and Kalkuhl (2013). The variables are expected to influence domestic food price
changes (spikes or volatility) in Nigeria. Description/measurement of variables such as
beginning stock to use ratio, international food price spikes and volatility, exchange rates,
crude oil price spikes and volatility, shocks in gross domestic products (GDP), international
transaction costs (captured by liner shipping connectivity index), global food (grains) supply
shocks, and GDP growth rates, among others, have been discussed comprehensively by these
authors. Readers could consult their works. The variables are adapted for Nigeria. Other key
control variables hypothesized to influence food price changes in Nigeria are discussed below.
Monetary Policy rates: This is the official interest rate fixed by the monetary policy
committee of the central bank (of Nigeria) to control the supply of money, usually by targeting
an inflation rate to ensure price stability and general trust in the currency. Monetary policy
(interest) rates are more directly related to bank loans. Higher monetary policy rates are
expected to reduce price inflation and stabilise price. The influence of interest rates on price
volatility is usually via its linkage with storage. In a low interest rate environment, the cost of
financing stockpiles is lower than when interest rates are high. A decrease in real interest
rates lowers the cost (opportunity cost) of stocking/carrying inventories. As a result the
demand for commodities raises and commodity prices increase, particularly if market
participants anticipate (speculates) that fluctuation (shocks) in interest rate will persist
(Frankel, 2006). It also expands expenditure and investment. Lower interest rates provide an
inducement to retain current exhaustible commodities, as it decreases the cost of stocking
(including the carrying cost of speculative positions). For a given anticipated price path, lower
interest rates makes it easier for investors to bet on assets such as commodities (including
foods); and under certain conditions, it can put upward pressure on futures price and, by
arbitrage, also on spot prices.
Narrow money supply (M1): Since the seminal work by Frankel (1984), empirical studies on
the influence of monetary conditions (and interest rates) on commodity prices have grown
(Apergis and Rezitis, 2011; Hamilton, 2009; Barsky and Kilian, 2004). Narrow money supply
(M1), includes physical money such as currency and coins, deposits at commercial banks, and
any monies held in easily accessible accounts. However, it does not include elements such as
loans by commercial banks, which is more directly related to monetary policy rate. Loans from
banks are contained in the broad money (M2). An expansionary narrow money supply is thus
expected to drive up commodity prices and vice versa. Although monetary policy shocks can
help in predicting commodity price movements, monetary policy shocks are not the main
sources of price fluctuations.
Per capita food production variability: This is an expression of the net food production
variability per capita expressed in international dollars. For the calculation this variable, the
10
standard deviation of food production trend per capita was used. The data were extracted
from food security indicator (FAO, 2016). Variability in food production may result from
variations in the area planted or because of yield variations due to weather shocks. Food
supply elasticity is usually low and the impacts of whether shocks are felt more quickly
because farmers cannot harvest what they did not plant. Continuing heavy rainfalls can even
destroy everything that is planted in reasonably large regions.
Even though production shocks often play substantial roles in food price variability, demand
(especially income) shocks (Gilbert and Morgan, 2010) and policy shocks (Christiaensen 2009),
may also be important factors. However, the degree to which food production
shocks/variability translates into food price volatility also depends on consumers’ demand
elasticities. Generally, consumers are less willing to revise their consumption patterns, and in
poor countries, may have few substitutes. In addition, the raw material from food commodity
may constitute only a small portion of many processed foods. Thus, a large rise in commodity
prices may even have a little impact on the price of final products.
Petrol price: Petrol price movements and the volatility of petrol prices can affect the volatility
of commodity prices. Increases in petrol price increase transportation cost which in turn lead
to hikes in prices. Among others, Shittu et al. (2015) found that hikes in petrol price due to
the withdrawal of subsidies on petroleum products are a key driver of rising food prices in the
country.
Real Effective Exchange rates: Higher real effective exchange rates capture changes in price
competitiveness as a result of macroeconomic changes. If the real exchange rate of a country
is rising, it implies that the country’s goods are becoming more expensive relative to its
competitors. Thus, increases in the real exchange rate will tend to increase net imports since
it now becomes cheaper to import. This can expand current account deficit and reduce
domestic aggregate demand, thereby reducing reduce inflation. Changes in exchange rates
reallocate purchasing power and price incentives across countries without changing the
overall food supply–demand balance (Gilbert and Morgan, 2010). Depreciation of Naira
relative to Dollar (or other currency) is expected to raise prices to producers and consumers
in Nigeria but lowers prices to consumers outside the country. Higher real effective exchange
rate may excavate domestic price spikes and/or volatility.
Government Policy Actions (Dummies): The dummy variables are introduced to capture
government policy stance in periods immediately after the 2007/2008 and its resurgence in
2010/21011 as well as the likely effects on food price spikes and volatility. The dummy
variable for year 2008 to 2011 reflects policy regime in which (as mentioned earlier)
government attempted to mitigate the effects of global food and financial crises of 2007/2008
through gradual liberalization of trade, release of reserved grains, review of minimum wages,
provision of assistance to farmers in form of input subsidies, suspension of open market
operation and monetary easing actions. The post 2011 dummy (year 2012 to 2016) describes

11
regime in which expansionary monetary (easing) policy stance was somewhat jettisoned with
emphasis placed on monetary tightening. As noted earlier, Open Market Operations (OMO)
was brought back to mop up or inject liquidity into the system with the in order to achieve
price and exchange rate stability.
Seasonal (quarterly) Dummies: The dummy variables were introduced to control for the
possible influence of seasons on price spikes or volatility. Although with possibility of mild
overlaps, quarter 4 (October to December) or quarter 1 (January to March) may roughly
represent early harvest or surplus/post-harvest seasons for most staples across regions of the
country while quarter 2 (April to June) and quarter 3 (July to September) may coincide with
onset of leans/post planting seasons. Generally price is expected to gradually fall in the early
harvest/surplus seasons and rise at the onset of lean season/post planting period when crops
are established on the field.
Borders: It is conjectures that the specificity of a state sharing border with another country
may have stronger influence on price situation in the state compared to other states that do
not share border. It is a dummy variable equalling one (1) if the state shares border with other
country and zero (0) otherwise.
Distance to major seaport (km): The variable is used as proxy for transaction cost within the
country. All else equal, distance is expected to be positively related to cost of transaction
costs (including transportation costs) within the country, and consequently, commodity
(food) price upsurges. Lagos ports are known as the economic doors to Nigeria. The
Guardian (2017) noted on the basis of available statistics from the Nigerian Port Authority
that Lagos ports complex alone claimed 97 per cent of the containers that are berthed in
Nigeria in 2016.
12
3. Study Data and Sources
This study was based, primarily, on a panel data on State level monthly retail market prices of
Nigeria’s major staples across 36 states of Nigeria between 2001 and 2016. The food
commodities are imported rice, local rice, maize, millet, sorghum, yam, garri (cassava flakes),
meat, fish, beans and palm oil. The price data were collected from the National Bureau of
Statistics (NBS) Office at Abuja, Nigeria, and were part of the data that are routinely collected
towards computation and publication of the composite Consumer Price Indices (CPI) for the
country.
Other data were extracted from the Annual Abstracts of Statistics, published by NBS;
Statistical Bulletins of the Central Bank of Nigeria while the corresponding world prices were
extracted from the World Consumer Prices section of the International Financial Statistics
(IFS) published by the International Monetary Fund (IMF). Usable data on global beginning
stock to use and supply are only available for rice and coarse grains (such as millet, maize,
sorghum). Data on relevant domestic policy variables – interest rates, exchange rates, money
supply, were extracted from the Central Bank of Nigeria (CBN) – Statistical Bulletins. Global
monthly grain production, supply beginning stock and use were collected from the United
Nations Department of Agriculture (USDA).

13
4. Descriptive Results
4.1 Food Price Spikes and Volatility Experienced in an Average Nigeria
Market
Table 1 provides descriptive statistics of the food price spikes and volatility as experienced
between 2002 and 2016 for each of the 11 major food commodities, while Figures 1a – 1c, 2a
– 2c and 3a – 3c in the appendix depict the patterns of price spikes, intra-annual volatility as
well as inter-year price volatility recorded in food prices over the years respectively.
As shown in Table 1, the mean price spike is approximately the same in all the grain markets.
It can be concluded that on average the patterns of price spikes are similar across the grain
markets. Although the mean price spikes of yam and garri are approximately equal, their
respective minimum and the maximum values are substantially different. The absolute
minimum and maximum values of price spikes for yam are more than twice that of garri
respectively. The mean, minimum and maximum values of price spikes for meat and fish are
also respectively different, suggesting different experience of short-term price upsurges
among these food commodities. In terms of volatility assessment, the mean, minimum and
maximum intra-annual price volatility estimates appear fairly similar for maize, millet and
sorghum but higher in magnitudes compared to local and imported rice. The intra-annual
price volatility appears to be slightly higher for local rice and other locally produced grains
than for imported rice.
Table 1: Descriptive Statistics of Food Price Spikes and Volatility, 2002:1 – 2016:12 (National Average)
Commodity Price Spike Intra-annual Price Volatility Inter annual Price Volatility
Min Max Mean Min Max Mean Min Max Mean
Rice (imported) -0.244 0.271 0.010 0.048 0.173 0.103 0.136 33.137 3.131
Rice (local) -0.285 0.318 0.181 0.041 0.193 0.121 0.121 26.895 2.962
Maize -0.320 0.306 0.009 0.074 0.250 0.157 0.323 24.900 4.001
Sorghum -0.295 0.263 0.010 0.088 0.220 0.147 0.367 15.602 2.270
Millet -0.281 0.223 0.010 0.080 0.223 0.145 0.366 21.021 3.152
Meat -1.522 0.355 0.001 0.077 0.522 0.193 1.655 493.773 54.765
Fish -0.623 0.603 0.009 0.090 0.397 0.184 2.307 187.208 43.297
Yam -0.569 0.456 0.009 0.096 0.375 0.246 0.437 49.180 9.974
Garri -0.214 0.183 0.008 0.080 0.205 0.152 0.433 20.426 4.231
Beans -0.231 0.215 0.010 0.087 0.203 0.134 0.301 22.837 4.175
Palm oil -0.151 0.303 0.013 0.044 0.146 0.095 0.494 127.448 3.200
Source: Authors’ Computation

14
The seemingly higher within-year price volatilities in locally produced grains may be partly
connected to weather/climate related, and production shocks including pests and diseases.
This includes drought, flood, and inadequate water supply and seasonal unfavourable
fluctuation in rainfall patterns, among others. Haile et al. (2013) noted that factors other than
weather related shocks can emanate from changes in input supply and variations in the area
planted.
The estimated inter-year price volatility values for imported rice and local rice are fairly equal.
Nevertheless, the observed volatility range (difference between the minimum and maximum
values) is wider for imported rice. Intra and inter-annual price variability are also considerable
higher for meat and fish. With respect to tubers, both within and between year price
variability are more pronounced in the yam than the garri market. This is expected because
substantial progress has been made in terms on rising productivity of cassava through the
development of high yielding, drought and diseases resistant cassava varieties compared to
yam. The Table also reveals comparatively low level of intra-annual and inter-year price
volatility in palm oil.
4.2 Patterns of Food Price Spikes and Volatilities in an Average Nigeria
Market
As shown in Appendix 1 (Figures 1a – c), there have been substantial short-term fluctuations
(spikes) in prices of food items in a typical market in Nigeria over the observed period. The
food spikes graphs show some extraordinary short-term spikes in prices of foods at some
specific time periods over the length of years. For example, the observed short-term spikes in
imported price appear not to differ substantially from the patterns observed over the years.
However, there are instances of comparatively high spikes prior to the 2007/08 food crises;
towards mid-2010 and in the third- quarter of 2014. Whether these observed variations can
be explained from econometrics standpoint is examined later in this study. Unlike for
sorghum with several episodes of price spikes, there have not been unusual fluctuations
(upsurges) in the price of maize over the last decade.
Whereas there are spreads of noticeable spikes in the price of garri and palm oil, spikes in
yam price feature moments of comparatively low spikes especially between late 2008 and
December 2010. The second episode of food crises in 2011 heralded another period of higher
spikes in yam prices. There are few cases of unexpected lager spikes in meat and fish prices.
With regard to food price volatility (Appendix 2), there are noticeable intra-annual volatilities
in prices of most crops over the years (Figures 2a-c). However, the patterns for commodities
such as rice, sorghum, maize, millet and garri appear not to have deviated markedly from the
patterns observed before the 2007/08 crises. The results also show intra-annual volatilities
for palm oil, yam and local rice. In general, food price volatility begun to rise progressively
from late 2012, and markedly from 2014 without a clear indication of return to earlier

15
patterns. Whether the observed intra-annual volatilities can be explained by some factors are
examined in this study.
It can be observed (Appendix 3) that inter-annual volatilities (Figures 3a-c) have remained
steady for most food commodities until late 2013. Since then progressive rise in inter-year
volatilities has been beyond what was observed across commodities except in animal product
markets. While the rising inter-annual pattern is worrisome, the observed inter-annual
volatility in 2016 is very alarming. Volatility peaks observed in 2016 are more than double the
all-time peaks of 2007/2008 and 2010/2011 for most food commodities.
16
5. Econometric Results
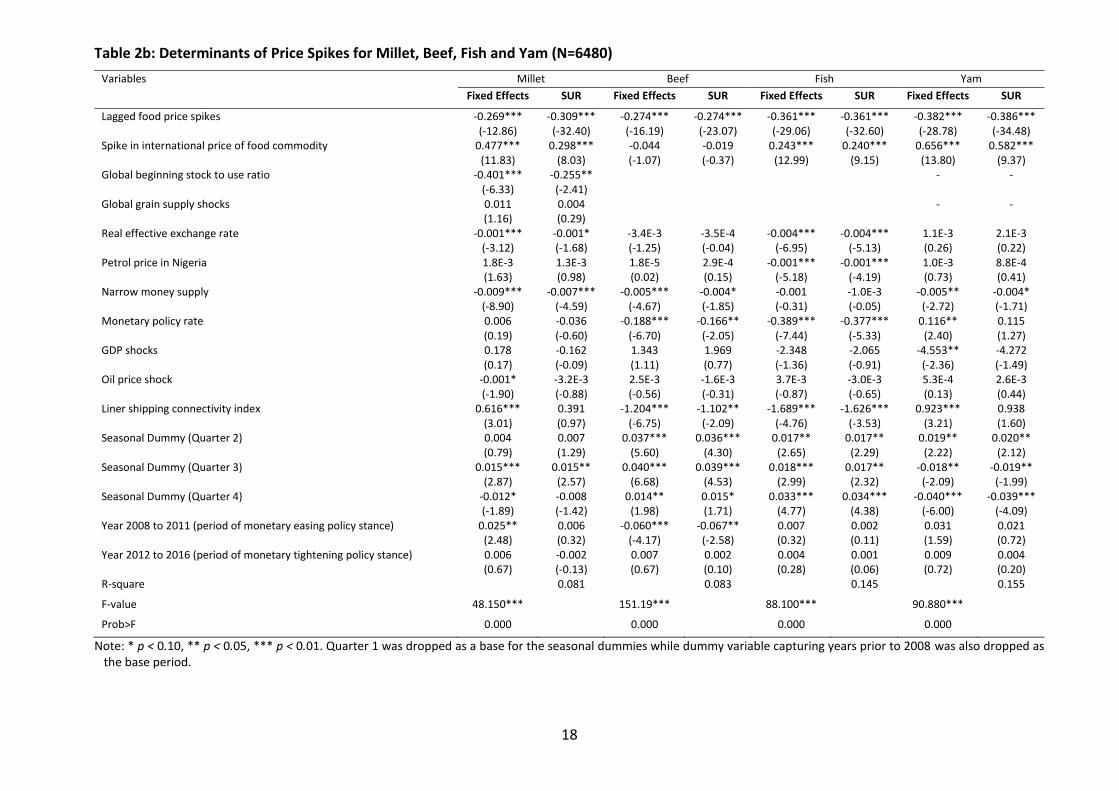
5.1 Determinants of food price spikes
As mentioned earlier, the SUR model allows examination of the influence of time constant
variables, which is impossible within the fixed effects framework. Our initial estimates of the
SUR models of price spikes, however, consistently revealed across all food commodities, that
none of the time-invariant factors such as location (zonal) dummies, distance from each state
to the major seaport (Lagos), and whether (or not) a state shares border/boundary with other
country is statistically significant. The results are not presented here, but are available on
request. Consequently, we concluded that not being able to account for influence of time
invariant factors, is not of concern in the use of fixed effects framework in this study. We thus,
excluded the time invariant variables in the parsimonious version of the SUR models
estimated.
Results of the factors influencing spikes in food prices are presented in Tables 2a-c. Here, only
the results for commodities in which the estimated models indicate statistical significance are
discussed. The results suggest that a spike in the price of a food commodity in a given period
(month) is less likely to be followed by a greater spike in the price of the food item in the
immediate succeeding month. Spikes in the domestic price of staples such as local rice, maize,
sorghum (Table 2a), millet, yam (Table 2b), beans and garri (Table 2c) are amplified by short-
term rises in their corresponding international prices. Given that food price spikes are
associated with the short-term spill-over effects from food international price (Balcombe,
2009), efforts should be geared towards diluting spill-over of price upsurges from
international food markets. Existing empirical studies conclude that unexpected price spikes
do not only make poor consumers and landless worse-off but also farmers that are net-food
buyers since they cannot quickly adjust farm production within the short-term in response to
price upsurges (Aksoy and Isik-Dikmelik, 2008; Anríquez et al., 2013). Nevertheless, price
spikes can be beneficial for food producing households especially in the medium and long-
term when households are able to adjust production to high-value crops.
Short-term spikes in the domestic food prices of the grains, fish, garri, beans and palm oil
(Table 2a-c) are negatively linked to depreciation of local currency. This would mean that a
weaker Naira is unlikely to substantially increase the rate of growth of food price inflation in
the country.

17
Table 2a: Determinants of Spikes for Rice, Maize and Sorghum Price (N=6480)
Variables Imported Rice Local Rice Maize Sorghum
Fixed Effects SUR Fixed Effects SUR Fixed Effects SUR Fixed Effects SUR
Lagged food price spikes -0.168*** -12.960
-0.221*** -29.030
-0.206*** -17.620
-0.262*** -31.980
-0.341*** -7.360
-0.340*** -37.550
-0.213*** -20.830
-0.275*** -31.400
Spike in international price of food commodity 1.1E-3 0.850
6.5E-4 0.800
2.9E-3 1.670
2.4E-3** 2.580
0.369*** 7.490
0.128*** 4.380
0.169*** 6.720
0.139*** 5.510
Global stock to use ratio -0.092*** -5.840
-0.036 -0.970
-0.139*** -4.800
-0.061 -1.470
-0.634*** -8.510
-0.448*** -4.000
-0.515*** -8.420
-0.367*** -3.520
Global grain supply shocks -0.005*** -3.430
-0.003 -0.990
-0.011 -1.560
-0.008** -2.100
0.046*** 5.220
0.020 1.270
0.016 1.650
0.011 0.770
Real effective exchange rate -0.001*** -6.180
-0.001** -2.230
-0.001*** -5.700
-0.001** -2.120
-0.001*** -4.580
-0.001 -1.010
-0.002*** -6.260
-0.002*** -3.010
Petrol price in Nigeria 1.6E-3** 2.330
7.3E-4 0.710
2.2E-3** 2.330
1.2E-3 0.970
1.1E-3 -1.010
4.5E-3 0.320
7.4E-5 -0.090
-2.9E-4 -0.220
Narrow money supply -0.008*** -11.770
-0.007*** 6.290
-0.007*** -8.930
-0.007*** -4.840
-0.011*** -14.900
-0.009*** -5.180
-0.010*** -10.510
-0.008*** -5.010
Monetary policy rate -0.095*** -4.630
-0.096** -2.390
-0.078*** -3.070
-0.067 -1.450
-0.050 -1.400
0.022 0.350
-0.070** -2.110
-0.077 -1.300
GDP shocks -0.706 -0.810
-1.998 -1.360
-1.413 -1.260
-2.756 -1.620
-2.209 -1.510
-3.525* -1.850
-0.523 -0.390
-0.365 -0.210
Oil price shock 0.001*** 6.330
0.001*** 5.540
0.001** 2.490
0.001*** 3.140
0.001** 2.790
4.2E-3 1.080
-0.002*** -3.620
-0.001*** -3.270
Liner shipping connectivity index -0.683*** -6.350
-0.606** -2.330
-0.420*** -2.960
-0.262 -0.870
0.598** 2.170
0.955** 2.210
0.491** 2.140
0.429 1.070
Seasonal Dummy (Quarter 2) 0.001 0.270
0.002 0.590
-0.003 -0.780
-0.001 -0.310
0.006 1.020
-0.001 -0.210
0.005 0.840
0.007 1.320
Seasonal Dummy (Quarter 3) -0.002 -0.580
-0.001 -0.240
4.7E-3 0.130
0.001 0.200
-0.001 -0.110
3.1E-3 0.050
0.017*** 3.580
0.019*** 3.210
Seasonal Dummy (Quarter 4) -0.001 -0.270
0.001 0.340
-0.024*** -4.410
-0.021*** -4.190
-0.045*** -6.040
-0.043*** -6.920
-0.014** -2.140
-0.008 -1.320
Year 2008 to 2011 (period of monetary easing policy stance) 0.063*** 10.470
0.046*** 3.440
0.059*** 8.470
0.034** 2.200
0.023** 2.340
-0.010 -0.510
0.028*** 2.950
0.008 0.430
Year 2012 to 2016 (period of monetary tightening policy stance) 0.038*** 7.900
0.031*** 3.300
0.034*** 5.540
0.022** 2.020
0.002 0.240
-0.011 -0.780
0.005 0.610
-0.004 -0.300
R-square 0.068 0.081 0.084 0.064
F-value 53.670*** 53.670*** 59.470*** 64.580***
Prob>F 0.000 0.000 0.000 0.000
Note: * p < 0.10, ** p < 0.05, *** p < 0.01. Quarter 1 was dropped as a base for the seasonal dummies while dummy variable capturing years prior to 2008 was also dropped as the base period.
18
Table 2b: Determinants of Price Spikes for Millet, Beef, Fish and Yam (N=6480)
Variables Millet Beef Fish Yam
Fixed Effects SUR Fixed Effects SUR Fixed Effects SUR Fixed Effects SUR
Lagged food price spikes -0.269*** (-12.86)
-0.309*** (-32.40)
-0.274*** (-16.19)
-0.274*** (-23.07)
-0.361*** (-29.06)
-0.361*** (-32.60)
-0.382*** (-28.78)
-0.386*** (-34.48)
Spike in international price of food commodity 0.477*** (11.83)
0.298*** (8.03)
-0.044 (-1.07)
-0.019 (-0.37)
0.243*** (12.99)
0.240*** (9.15)
0.656*** (13.80)
0.582*** (9.37)
Global beginning stock to use ratio -0.401*** (-6.33)
-0.255** (-2.41)
- -
Global grain supply shocks 0.011 (1.16)
0.004 (0.29)
- -
Real effective exchange rate -0.001*** (-3.12)
-0.001* (-1.68)
-3.4E-3 (-1.25)
-3.5E-4 (-0.04)
-0.004*** (-6.95)
-0.004*** (-5.13)
1.1E-3 (0.26)
2.1E-3 (0.22)
Petrol price in Nigeria 1.8E-3 (1.63)
1.3E-3 (0.98)
1.8E-5 (0.02)
2.9E-4 (0.15)
-0.001*** (-5.18)
-0.001*** (-4.19)
1.0E-3 (0.73)
8.8E-4 (0.41)
Narrow money supply -0.009*** (-8.90)
-0.007*** (-4.59)
-0.005*** (-4.67)
-0.004* (-1.85)
-0.001 (-0.31)
-1.0E-3 (-0.05)
-0.005** (-2.72)
-0.004* (-1.71)
Monetary policy rate 0.006 (0.19)
-0.036 (-0.60)
-0.188*** (-6.70)
-0.166** (-2.05)
-0.389*** (-7.44)
-0.377*** (-5.33)
0.116** (2.40)
0.115 (1.27)
GDP shocks 0.178 (0.17)
-0.162 (-0.09)
1.343 (1.11)
1.969 (0.77)
-2.348 (-1.36)
-2.065 (-0.91)
-4.553** (-2.36)
-4.272 (-1.49)
Oil price shock -0.001* (-1.90)
-3.2E-3 (-0.88)
2.5E-3 (-0.56)
-1.6E-3 (-0.31)
3.7E-3 (-0.87)
-3.0E-3 (-0.65)
5.3E-4 (0.13)
2.6E-3 (0.44)
Liner shipping connectivity index 0.616*** (3.01)
0.391 (0.97)
-1.204*** (-6.75)
-1.102** (-2.09)
-1.689*** (-4.76)
-1.626*** (-3.53)
0.923*** (3.21)
0.938 (1.60)
Seasonal Dummy (Quarter 2) 0.004 (0.79)
0.007 (1.29)
0.037*** (5.60)
0.036*** (4.30)
0.017** (2.65)
0.017** (2.29)
0.019** (2.22)
0.020** (2.12)
Seasonal Dummy (Quarter 3) 0.015*** (2.87)
0.015** (2.57)
0.040*** (6.68)
0.039*** (4.53)
0.018*** (2.99)
0.017** (2.32)
-0.018** (-2.09)
-0.019** (-1.99)
Seasonal Dummy (Quarter 4) -0.012* (-1.89)
-0.008 (-1.42)
0.014** (1.98)
0.015* (1.71)
0.033*** (4.77)
0.034*** (4.38)
-0.040*** (-6.00)
-0.039*** (-4.09)
Year 2008 to 2011 (period of monetary easing policy stance) 0.025** (2.48)
0.006 (0.32)
-0.060*** (-4.17)
-0.067** (-2.58)
0.007 (0.32)
0.002 (0.11)
0.031 (1.59)
0.021 (0.72)
Year 2012 to 2016 (period of monetary tightening policy stance) 0.006 (0.67)
-0.002 (-0.13)
0.007 (0.67)
0.002 (0.10)
0.004 (0.28)
0.001 (0.06)
0.009 (0.72)
0.004 (0.20)
R-square 0.081 0.083 0.145 0.155
F-value 48.150*** 151.19*** 88.100*** 90.880***
Prob>F 0.000 0.000 0.000 0.000
Note: * p < 0.10, ** p < 0.05, *** p < 0.01. Quarter 1 was dropped as a base for the seasonal dummies while dummy variable capturing years prior to 2008 was also dropped as the base period.

19
Table 2c: Determinants of Price Spikes for garri, Beans and Palm Oil (N=6480)
Variables Garri Beans Palm Oil
Fixed Effects SUR Fixed Effects SUR Fixed Effects SUR
Lagged food price spikes -0.333*** -21.820
-0.357*** -35.660
-0.331*** -15.000
-0.003*** -81.070
-0.105*** -9.480
-0.125*** -16.510
Spike in international price of food commodity 0.420*** 10.750
0.263*** 6.740
0.653*** 11.860
0.003*** 79.630
4.7E-4 1.540
4.1E-4 0.990
Real effective exchange rate -0.001*** -3.930
-0.001* -1.880
-0.003*** -8.660
-0.001*** -2.920
-0.001*** -8.550
-0.001*** -3.490
Petrol price in Nigeria -3.7E-3*** -3.180
0.000*** -3.080
-1.5E-3* -1.880
-8.8E-4 -1.030
-2.9E-3*** -5.300
0.000*** -3.370
Narrow money supply -0.009*** -7.960
-0.008*** -5.070
-0.007*** -9.160
-0.001 -0.640
-0.012*** -13.510
-0.012*** -11.040
Monetary policy rate -0.023 -0.760
-0.037 -0.650
-0.143*** -5.060
-0.079** -2.170
-0.261*** -13.240
-0.262*** -7.040
GDP shocks -6.083*** -5.210
-6.145*** -3.440
-5.014*** -4.410
0.202 0.170
1.089* 1.710
0.880 0.740
International Crude Oil price shocks 2.7E-3 0.720
0.001* 1.770
4.8E-3 1.410
0.001*** 3.500
-4.7E-3** -2.200
-4.4E-3* -1.820
Liner shipping connectivity index 0.534*** 2.820
0.520 1.420
-0.699*** -4.350
-0.476** -2.000
-1.060*** -10.530
-1.049*** -4.330
Seasonal Dummy (Quarter 2) 0.017*** 2.780
0.018*** 3.180
0.015** 2.700
0.001 0.310
-0.012*** -3.120
-0.011*** -2.920
Seasonal Dummy (Quarter 3) -0.005 -0.760
-0.006 -0.990
0.023*** 4.800
-0.003 -0.740
0.016*** 3.470
0.017*** 4.220
Seasonal Dummy (Quarter 4) -0.019*** -2.800
-0.018*** -3.060
-0.016** -2.060
-0.018*** -4.500
0.017*** 3.810
0.018*** 4.480
Year 2008 to 2011 (period of monetary easing policy stance) 0.035** 2.440
0.019 1.060
0.099*** 7.330
0.043*** 3.510
-0.005 -0.800
-0.009 -0.740
Year 2012 to 2016 (period of monetary tightening policy stance) 0.029*** 2.970
0.021 1.630
0.062*** 7.920
0.024 2.740
0.008 1.450
0.006 0.700
R-square 0.123 0.573 0.070
F-value 184.800*** 184.700*** 130.270***
Prob>F 0.000 0.000 0.000
Note: * p < 0.10, ** p < 0.05, *** p < 0.01. Quarter 1 was dropped as a base (quarter 1) for the seasonal dummies while dummy variable capturing years prior to 2008 was also dropped as the base period.

20
In small magnitudes, spikes in the domestic prices of rice (Table 2 a) are more directly related
to higher prices of petrol. However, higher petrol has negative effects on spikes in garri, beans
and palm oil. Geman and Ott (2014) noted petrol price as an important factor affecting food
prices. Higher prices of petrol heighten spikes in rice markets having enormous implications
for food security in terms of access to the food calorie needs, especially among poor
households leading to higher rates of malnutrition in the country. Shocks in GDP is less likely
to increase food price spikes in Nigeria. This is contrary to findings at a global scale in other
studies. For instance, Tadesse et al. (2014) found that global demand shocks have significant
and positive influence on spikes in maize, rice and soybean prices.
Narrow money supply has a negative and significant relationship with food price spikes. It
means that expansionary narrow money supply has calming effects on food price spikes in
Nigeria. This may be suggestive of how narrow money supply could be useful as a macro-
economic policy strategy for addressing potential short-terms price upsurge (spike) in food
markets and in manipulating agricultural sector in the country. Though, narrow money supply
may hurt farmers in the short-run since contractionary monetary policy tends to depress
inflation and may shift price, and therefore profit, away from farmers who could have taken
advantage of higher price to improve welfare. Some previous studies (Abeygunawardena and
Gunatilake, 1993; Tiwari, 2010; Lee and Park, 2013; Kornher et al., 2014) have linked money
supply with price inflation and volatility into the food sector.
Liner Shipping Connectivity Index (LSCI) is statistically significant and positively related to
spikes in the prices of food commodities such as millet, garri, yam and sorghum. This means
that an increase in the percentage points of (LSCI) leads to higher spikes in these commodities.
Lower costs of international trade can enhance greater demand for importing those
commodities from Nigeria. The external demand pressure from other countries, especially in
the face of inadequate or low supply (production) in the country can trigger significant price
upsurges. However, a lower international transaction cost (higher per cent points of LSCI) has
reducing effects on spikes in rice, fish, beans and palm oil prices.
Higher beginning stock to use ratio of coarse grains has negative effects on spikes in prices of
storable commodities such as rice, maize, millet and sorghum in Nigeria. Higher beginning
stock can absorb supply or demand shocks by acting as buffer to markets in the period of low
production and consequently suppress price swings (Geman and Ott, 2014).The results
suggest that on the average, spikes in the prices of locally grown cereals, roots and tubers and
beans appears to be generally low in the last quarter of the year, and relatively high in the
second and third quarters. The findings may give an indication of when government schemes
such safety nets can be targeted to vulnerable household groups. Increase monetary policy
rates is negatively related to food price spikes, meaning that lower interest rates may
heighten food price spikes in the country. As mentioned earlier, for a given anticipated price
path, lower interest rates makes it easier for investors to bet on assets such as commodities
21
(including foods); and may put upward pressure on futures price and, by arbitrage, also on
spot prices.
The results suggest that oil price spikes have increasing effects on prices of rice, maize and
palm oil. However, it has decreasing effects on the price of millet, sorghum, yam and garri.
The significance of the findings is that factors such as biofuels demand and production (such
as fertilizer, transportation) which have been linked with oil price changes (Tadesse et al.,
2014), among others, may be relevant in explaining food price changes in the country. The
coefficient of the dummy variable for the year 2008-2011 are statistically significant and
positive for rice, garri, beans, millet, maize, suggesting that average spike in each of these
food items is higher during the periods than the previous years. The combinations of
monetary policy instruments (coupled with suspension of the open market operations), and
other actions during this period appear to have an increasing effects of price of staples. This
development is unhealthy for net-food consumers because of the likely welfare loss. Although
the country appears to have embarked on monetary tightening in post 2011, average spike in
the price of rice, garri and beans still seem higher than that of 2007/2008 food crises- albeit
lesser in magnitudes than the observed spikes between year 2008 and 2011.
5.2 Determinants of Volatility in Food Prices
Tables 3a - c present our econometric results on drivers of food price volatility in Nigeria. The
Bhargava et al. (1982) Durbin–Watson statistic associated with each of the estimated fixed
effects model (with AR1 process) indicates presence of serially correlated errors in the
estimated model.

22
Table 3a: Determinants of Price Volatility of Rice, Maize and Sorghum (N=6480)
Variables Imported Rice Local Rice Maize Sorghum
Fixed Effects (FE)
FE with AR1 Fixed Effects (FE)
FE with AR1 Fixed Effects (FE)
FE with AR1 Fixed Effects (FE)
FE with AR1
Volatile international price of the food commodity
-5.37E-6 (-0.16)
1.49E-05 (0.51)
1.7E-3*** (4.15)
1.7E-3*** (5.17)
0.057 (1.32)
0.050 (0.78)
-0.095** (-2.68)
-0.104*** (-3.24)
Global beginning stock to use ratio -0.027*** (-6.63)
-0.014** (-2.3)
0.013 (0.8)
0.012** (1.71)
-0.017 (-0.44)
-0.025 (-0.52)
0.025 (1.13)
0.034 (1.56)
Real effective exchange rate 0.001*** (5.16)
0.001*** (5.54)
3.3E-3** (2.9)
3.9E-3** (2.8)
-2.3E-3 (-1.15)
-1.4E-3 (-0.47)
3.0E-3** (2.44)
2.72E-3** (2.09)
Petrol price in Nigeria 5.17E-6 (0.25)
1.78E-05 (0.98)
-.5E-4 (-0.52)
-6.9E-6 (-0.34)
1.87E-06 (0.05)
2.88E-05 (0.66)
-4.6E-4 (-1.45)
-2.8E-5 (-1.3)
Narrow money supply -0.001** (-2.88)
-0.001** (-2.56)
-0.001** (-2.69)
-0.001** (-2.84)
-2.1E-3 (-0.67)
-0.001 (-1.23)
-1.1E-3 (-0.45)
-2.6E-3 (-0.93)
Monetary policy rate 0.049*** (4.55)
0.042*** (3.11)
0.020* (1.7)
0.013 (0.91)
-0.019 (-0.98)
-0.010 (-0.31)
0.021 (1.48)
0.007 (0.5)
GDP growth rate -4.0E-3* (-1.75)
0.000189 (0.77)
3.3E-3 (0.89)
0.001*** (3.11)
0.001 (0.6)
0.001 (1.18)
2.5E-3 (0.89)
0.001* (1.78)
Food production variability -0.021 (-0.61)
-0.016 (-0.43)
-0.010 (-0.34)
-0.010 (-0.24)
-0.071 (-1.19)
-0.103 (-1.15)
0.124*** (3.18)
0.124** (2.98)
Liner shipping connectivity index 0.283*** (4.48)
0.204** (2.46)
0.206** (2.8)
0.134 (1.5)
-0.031 (-0.22)
0.050 (0.24)
0.135 (1.61)
0.002 (0.02)
Volatile international crude Oil price -0.088*** (-4.68)
-0.066*** (-4.24)
-0.086*** (-4.85)
-0.066*** (-3.85)
0.005 (0.27)
-0.011 (-0.29)
0.004 (0.24)
0.022 (1.1)
Seasonal Dummy (Quarter 2) -0.001** (-2.86)
-0.000319 (-0.44)
-0.001** (-2.1)
-0.001 (-0.69)
-0.001 (-1.37)
-0.001 (-0.59)
-0.002*** (-6.03)
-0.002** (-2.28)
Seasonal Dummy (Quarter 3) -0.0004 (-1.2)
-0.000481 (-0.61)
-0.001*** (-3.08)
-0.001 (-1.08)
-0.001 (-0.99)
-0.002 (-0.86)
-0.001** (-2.63)
-0.001 (-1.18)
Seasonal Dummy (Quarter 4) -0.001* (-1.96)
-0.001 (-0.82)
-0.001*** (-4.38)
-0.001 (-1.2)
-0.001* (-1.9)
-0.001 (-0.71)
-0.001** (-2.52)
-0.001 (-1.05)
Year 2008 to 2011 (period of monetary easing policy stance)
-0.005** (-2.15)
-0.010*** (-3.01)
-0.013*** (-3.06)
-0.014*** (-4.07)
0.001 (0.08)
-0.002 (-0.23)
-0.012*** (-4.08)
-0.011** (-2.79)
Year 2012 to 2016 (period of monetary tightening policy stance)
-0.003 (-1.61)
-0.005** (-2.09)
-0.009*** (-4.07)
-0.009*** (-3.32)
-0.003 (-0.64)
-0.004 (-0.69)
-0.008*** (-4.12)
-0.006** (-2.32)
F_value 27481.61*** 1484.75*** 15296.79*** 1881.56*** 80850.48*** 1403.9*** 16040.27*** 2199.41***
Durbin-Watson 1.347 1.442 1.281 1.592 Baltagi-Wu LTI 1.348 1.443 1.282 1.600
Note: * p < 0.10, ** p < 0.05, *** p < 0.01. Quarter 1 was dropped as a base for the seasonal dummies while dummy variable capturing years prior to 2008 was also dropped as the base period. Fixed effects= Fixed effects model without AR1 process

23
Table 3b: Determinants of Price Volatility of Millet, Beef, Fish and Yam (N=6480)
Variables Millet Beef Fish Yam
Fixed Effects (FE)
FE with AR1 Fixed Effects (FE)
FE with AR1 Fixed Effects (FE)
FE with AR1 Fixed Effects (FE)
FE with AR1
Lagged dependent variable 0.950*** (163.32)
0.916*** (179.91)
0.937*** (226.02)
0.901*** (162.74)
0.935*** (224.65)
0.877*** (152.44)
0.944*** (269.26)
0.904*** (176.97)
Volatile international price of food commodity -0.109 (-1.54)
-0.091 (-1.5)
-0.208*** (-4.72)
-0.192*** (-3.27)
-0.219*** (-4.8)
-0.181*** (-4.5)
-0.116 (-1.46)
-0.065 (-0.81)
Global beginning stock to use ratio 0.011 (0.43)
0.026 (0.99)
- - - - - -
Real effective exchange rate 2.7E-2* (1.94)
2.4E-3 (1.52)
0.001*** (3.09)
0.001*** (4.42)
0.001 (1.64)
7.9E-4 (0.35)
1.3E-3 (0.46)
-1.5E-3 (-0.72)
Petrol price in Nigeria -5.4E-4 (-1.43)
-4.1E-5* (-1.7)
1.2E-3* (2.03)
1.37E-3*** (3.25)
1.4E-4 (0.28)
8.24E-5** (2.26)
3.3E-4 (0.74)
6.96E-5** (2.09)
Narrow money supply -0.001** (-2.27)
-0.001*** (-3.21)
0.002*** (3.43)
0.002*** (3.46)
-0.002*** (-4.54)
-0.002*** (-4.32)
-0.001*** (-3.21)
-0.002*** (-3.57)
Monetary policy rate 0.032* (1.97)
0.019 (1.08)
0.144*** (4.16)
0.142*** (5.04)
0.052 (1.52)
0.013 (0.52)
-0.024 (-0.81)
-0.086*** (-3.62)
GDP growth rate 1.0E-3 (0.29)
4.3E-3 (1.3)
0.001** (2.22)
0.001 (1.46)
0.002*** (5.4)
0.001** (2.14)
0.002*** (4.79)
0.002*** (4.9)
Food production variability 0.119** (2.7)
0.130** (2.85)
0.199** (2.97)
0.185** (2.47)
0.440*** (5.34)
0.494*** (6.89)
0.192*** (3.58)
0.124* (1.92)
Liner shipping connectivity index 0.256** (2.5)
0.145 (1.26)
0.895*** (4.2)
0.843*** (4.85)
0.457** (2.24)
0.197 (1.24)
-0.140 (-0.73)
-0.577*** (-3.82)
Volatile international crude Oil price 0.008 (0.35)
0.017 (0.81)
0.051 (1.56)
0.017 (0.53)
0.027 (0.93)
0.053* (1.79)
-0.009 (-0.21)
0.011 (0.35)
Seasonal Dummy (Quarter 2) -0.001** (-2.54)
-0.001 (-1.19)
-0.003*** (-5.4)
-0.003* (-1.88)
-0.002*** (-4.4)
-0.001 (-0.96)
-0.001 (-0.81)
3.52E-5 (0.03)
Seasonal Dummy (Quarter 3) -0.001 (-1.57)
-0.001 (-0.63)
-0.003*** (-4.81)
-0.004** (-2.08)
-0.001* (-1.75)
7.35E-5 (0.05)
-0.001 (-1.42)
1.55E-6 (0.00)
Seasonal Dummy (Quarter 4) -0.001** (-2.54)
-0.001 (-0.82)
-0.004*** (-6.86)
-0.005*** (-2.92)
-0.002** (-2.16)
1.9E-3 (0.13)
-0.002** (-2.57)
- 1.1E-2 (0.81)
Year 2008 to 2011 (period of monetary easing policy stance) -0.009** (-2.21)
-0.009** (-2.1)
-0.011* (-1.79)
-0.012* (-1.76)
-0.036*** (-5.51)
-0.036*** (-5.95)
-0.019*** (-3.9)
-0.017*** (-2.99)
Year 2012 to 2016 (period of monetary tightening policy stance) -0.007** (-2.6)
-0.006** (-2.18)
-0.018** (-5.01)
-0.018*** (-3.75)
-0.021*** (-4.67)
-0.017*** (-4.09)
-0.014*** (-4.03)
-0.011** (-2.84)
F_value 9926*** 2250.40*** 10683.24*** 2465.29** 19319.07*** 2058.37*** 17756.81*** 2817.73***
Prob>F 0.000 0.000 0.000 0.000 0.000 0.000 0.000 0.000
Durbin-Watson 1.570 1.643 1.419 1.481
Baltagi-Wu LTI 1.571 1.647 1.421 1.490
Note: * p < 0.10, ** p < 0.05, *** p < 0.01. Quarter 1 was dropped as a base for the seasonal dummies while dummy variable capturing years prior to 2008 was also dropped as the base period. Fixed effects= Fixed effects model without AR1 process

24
Table 3c: Determinants of Price Volatility of garri, Beans and Palm Oil (N=6480)
Variables Garri Beans Palm Oil
Fixed Effects (FE)
FE with AR1 Fixed Effects (FE)
FE with AR1 Fixed Effects (FE)
FE with AR1
Lagged dependent variable 0.946*** (231.71)
0.896*** (161.33)
0.946*** (264.74)
0.890*** (153.92)
0.940*** (180.12)
0.903*** (165.55)
Volatile international price of food commodity -0.191*** (-4.53)
-0.144** (-2.55)
-0.255*** (-4.33)
-0.280*** (-5.09)
-4.8E-4*** (-5.35)
-4.4E-5*** (-3.37)
Real effective exchange rate 1.3E-3 (-0.72)
-9.81E-05 (-0.66)
4.4E-4 (0.29)
-2.75E-05 (-0.19)
3.6E-4 (0.57)
-1.5E-5 (-0.2)
Petrol price in Nigeria -4.3E-4* (-1.7)
-2.07E-05 (-0.9)
-3.41 (-1.13)
-4.72E-06 (-0.21)
4.2E-6 (0.3)
0.000 (0.49)
Narrow money supply -4.7E-3* (-1.78)
-0.001** (-2.6)
0.001 (1.48)
0.000216 (0.73)
-0.001*** (-5.22)
-0.001*** (-5.64)
Monetary policy rate -0.016 (-0.92)
-0.028* (-1.69)
0.008 (0.41)
-0.019 (-1.17)
0.007 (0.85)
-0.007 (-0.83)
GDP growth rate 3.5E-3 (1.2)
0.001** (2.54)
-3.2E-4 (-0.14)
5.43E-05 (0.19)
-1.9E-3 (-1.14)
-1.3E-3 (-0.85)
Food production variability 0.038 (0.97)
0.034 (0.75)
0.068 (1.68)
0.050 (1.13)
0.094** (2.75)
0.068** (2.47)
Liner shipping connectivity index -0.035 (-0.29)
-0.133 (-1.29)
0.139 (1.28)
-0.092 (-0.9)
0.060 (0.98)
-0.036 (-0.66)
Volatile international crude Oil price 0.009 (0.53)
-0.001 (-0.03)
0.055** (2.86)
0.075*** (3.64)
0.012 (1.23)
0.013 (1.15)
Seasonal Dummy (Quarter 2) -0.001** (-2.35)
-0.001 (-1.11)
-0.001* (-1.86)
-0.001 (-0.95)
-4.8E-3 (-1.64)
-4.2E-3 (-0.77)
Seasonal Dummy (Quarter 3) -3.6E-4 (-0.1)
-1.8E-3 (-0.18)
-0.001** (-2.21)
-0.001 (-0.92)
-3.1E-3 (-1.1)
-3.1E-3 (-0.53)
Seasonal Dummy (Quarter 4) -1.3E-3 (-0.22)
-2.0E-3 (-0.21)
-1.9E-3 (-0.49)
-9.4E-4 (-0.1)
1.8E-3 (0.55)
2.8E-3 (0.5)
Year 2008 to 2011 (period of monetary easing policy stance) -0.003 (-0.66)
-0.005 (-1.22)
-0.014*** (-3.6)
-0.012*** (-3.08)
-0.005* (-1.77)
-0.006** (-2.56)
Year 2012 to 2016 (period of monetary tightening policy stance) -0.002 (-0.6)
-0.003 (-1.09)
-0.010*** (-3.14)
-0.007** (-2.5)
-0.004* (-1.93)
-0.005** (-2.76)
F_value 13468.03*** 1947.08*** 25861.19*** 1821.23*** 14533.77*** 2618.53***
Prob>F 0.000 0.000 0.000 0.000 0.000 0.000
Durbin-Watson 1.448 1.387 1.599
Baltagi-Wu LTI 1.454 1.410 1.615
Note: * p < 0.10, ** p < 0.05, *** p < 0.01. Quarter 1 was dropped as a base for the seasonal dummies while dummy variable capturing years prior to 2008 was also dropped as the base period. Fixed effects= Fixed effects model without AR1 process
25
There are statistically significant relationship between international food prices and volatility
of the prices of some specific domestic foods. To keep space, we present results of influencers
of within year volatilities. The coefficients of the lagged values of domestic price volatility are
positive, suggesting that higher food price volatility in a month may have increasing effects on
volatility in another month of the year. This establishes some level of volatility persistence.
However, it is diffused at a lesser degree. Volatility of international price of rice appears to
have a significant and positive influence (albeit of small magnitude) on the volatility of local
rice. Volatile international price of rice is unlikely to increase volatility of prices of other locally
produced foods (Table 3 a). When volatility of international price of traded food commodity
remains high, it is more likely to be transmitted to the domestic price of same/similar products
as investors are unable to reasonably forecast future price. This is in line with results of studies
by Huh et al. (2012) and Kornher and Kalkuhl (2013). Given that high price volatility could
dampen farmers, industrials and other investors’ decisions, instability of the world rice market
may spell doom for investors in local rice production/businesses in Nigeria. This situation is
unfavourable for growth in agricultural (rice) production and food security in the country since
the country has enormous potentials for local rice production.
The beginning stock to use stocks of rice has negative and significant (albeit weak) effects on
imported rice price volatility (Table 3 a) as expected. A number of previous studies (Balcombe,
2009; Huh et al. 2012; Serra and Gil, 2012) has documented a significant negatively
relationship between beginning stock and food price volatilities. The positive relationship
between beginning stock-to-use of rice and volatility of local rice price seems counterintuitive.
Where previous studies established a positive relationship, the variable was insignificant
(Tadesse et al., 2014). Ordinarily, stocks absorb production deficits by raising available supply.
Higher food stocks at the start of marketing year is thus expected to ensure higher food supply
during the year, thereby helping to mitigate price instability. The somewhat contrary evidence
found in the case of local rice might be related to unstable macro-economic conditions,
including trade policies and political environment which may have upturned the possible
dampening effects of the beginning stock. Tadesse et al. (2014) noted that the effect of
exogenous shocks (such as stock-to-use) on price volatility may depend on the prevailing
economic and political environment.
Narrow money supply expansion calms volatility of rice, sorghum (Table 3 a), fish, millet, yam
(Table 3 b) and palm oil (Table 3 c), but raise the volatility of beef (Table 3 b) prices.
Theoretically, when money supply increases, aggregated demand tends to increase leading to
higher price level, including that of food commodities. However, volatility of price may not
necessarily increase. Changes in money supply can influence agricultural prices through the
mechanism of interest rates. Hence, by managing money supply through effective monetary
policies, the country can also influence food price rise or volatility to some extent.
Higher monetary policy rates (interest rates fixed by monetary policy committee) are
responsible for the higher volatilities of some food commodities such as imported rice, local

26
rice (Table 3 a), and beef (Tables 3 b) and lower volatility of prices of yam (Table 3 b) and garri
(Table 3 c). The most important avenue on which interest rate stimulates price volatility is
through the cost of stocking. Although interest rates may be a poor indictor of food price
volatility (Musaka, 2015), all else equal, decrease in real interest rates may decrease carrying
cost of inventories and increase commodity prices (Frankel, 2006). The foregoing projects how
monetary policy rates may be manipulated to influence food prices in the country.
The effects of petrol prices on volatility of food commodities are mixed. For example, higher
petrol price has more escalating effects on fish and beef price volatility (Table 3 b), and a
dampening (mild) influence on volatilities of garri and millet. Geman and Ott (2014) noted
that both petrol price movements (and volatility) can affect the volatility of commodity prices.
That higher prices of domestic price of oil (petrol) heighten volatility in animal protein markets
having enormous implications for the quality of proteins produced and consumed by the
average Nigerian. The quantity of meat consumed in Nigeria (2 kg per person and per year) is
still below the ECOWAS Zonal average of 8 kg per person per year (Okello et al., 2014; Bénard
et al., 2010). Hence, high food price volatility (as may be induced by higher oil (petro) price),
can further diminish consumption, especially among poor households leading to higher rates
of malnutrition in the country.
Higher real effective exchange rates (Naira to other currencies) increases grain volatility. This
suggests that appreciation of real exchange rate is what is required to substantially reduce
food price volatilities in Nigeria local markets. While this contradicts evidences in Gilbert
(2008) as well as Piesse and Thirtle (2009) that indicated that exchange rate depreciation
might not have been sufficiently large to cause substantial change in prices; it agrees with
evidences in most studies (Mitchell, 2008; Balcombe, 2009; Cornia et al., 2012).
Effort to stabilize Naira (to Dollar) exchange rates and/or ensure its appreciation can enhance
food security in the country. In their studies, Lee and Park (2013) and Geman and Ott (2014)
established that appreciation of exchange rate (for local currency) can substantially lower
volatility of domestic price. GDP growth can be regarded as demand side shock. We found
GDP growth rates to have significant and positive effect on the domestic price volatility of
local rice, garri, yam and beef suggesting that higher economic growth is more likely to
enhance volatility in the price of these products. This is in line with some previous studies (Lee
and Park, 2013; Tadesse et al., 2014) which reported that higher GDP growth rates can
significantly enhance food price volatility. However, higher GDP growth rates are inversely
related to the volatility of imported rice, millet and fish.
The results indicate that volatility crude oil price increases volatility of the domestic price of
rice, but depresses volatility of fish (Table 3 b) and beans (Table 3 c). The importance of oil
prices in explaining food price volatility shows that food and crude oil markets have become
more interwoven. Jungho and Koo (2009) and Musaka (2015) noted that crude oil price and
exchange rate are significant predictors of volatility of agricultural commodities. More
volatility crude oil price can result in higher demand for biofuel commodities such as maize,

27
millet, soybeans among others, leading to higher prices of the food commodities (and/or
related foods such imported and local rice). Ordinary, increased demand for biofuel food
commodities stimulates reallocation of production resources with the attendant impacts of
production and prices of biofuel and non-biofuel food commodities. Besides production and
biofuel effects, changes in crude oil price also affect food price volatility though a real income
effects because of their dominant impact on the overall economy (Tadesse et al., 2014). Food
production variability seems to enhance domestic price volatility of local rice, yam, millet,
sorghum and palm oil. It is largely believed that production variability is strongly linked to
more extreme weather conditions as a result of global warming and changes in input supply
and variations in area planted (Haile et al., 2013). Efforts to mitigate large fluctuation in food
outputs of these crops are crucial for investment decisions and food security in the country.
The Liner Shipping Connectivity Index (LSCI) is positively related with volatility of food such
imported rice, millet, maize and beef but inversely related to the volatility of yam price. At the
moment, the findings would suggest that the easier it is to ship these commodities to the rest
of the world (greater access to global trade), the higher their price volatilities at the domestic
market. However, greater connection to global shipping networks (lower cost of international
trade) could stabilize yam price. This is important for export yam export in Nigeria. Maritime
transport is the keystone of global trade and a key engine driving globalization.
The results suggest generally that across seasons of the year (as captured by quarterly
dummies), food price volatilities have remained relatively calm and/or undistinguished for
most foods. The implication is that heightened food price volatility is unlikely to be a serious
seasonal concern within the year in the country. The dummy variable (year 2008 to 2011)
captures volatility experience prior during the monetary easing government policy regime in
response to 2007/2008 global food crises. The coefficients of the dummy variable suggest that
price volatility generally reduce for food commodities during the periods than the periods
after. The implications are that government actions during the periods seem to be effective in
calming food price volatility in the country. Looking at price volatility after 2011, results show
that the coefficients associated with post 2011 dummy (year 2012 to 2016) are still generally
negative and statistically significant for food items but the magnitudes are slightly lower
except for beef. This suggests that with the exception of beef, average food price volatility
remains slightly higher after 2011 than in the year 2008-2011.

28
6. Conclusion
Food price spikes and volatility have become major concerns for policy makers and
development practitioners across the globe. Although a few studies have been conducted on
food price volatility in Africa, little is known about the key drivers of price spikes and volatility
in the region, and in Nigeria in particular. The available studies also document mixed and
inconclusive evidence on the patterns of food price volatility in Africa.
With specific focus on Nigeria, this study examines the patterns of food price spikes and
volatility and the impact of certain domestic and international factors on the volatility of
eleven food commodities in the country. We found that domestic food price volatility of
previous periods may have increase (albeit little) influence on the volatility of the current year.
Thus, establish mild volatility persistent in the economy. However, higher spike in a previous
period is less likely to progressively advance spikes in the current period. For some specific
commodities, seasonal dimension (quarterly dummies) reveal some distinguishing patterns
on price spikes. Spikes in the prices of locally grown cereals, roots and tubers and beans are
generally lower in the last quarter of the year and tends to be higher in second and third
quarter. However, food price volatility appears to remain calm across different quarters of the
year. Government policy response to food crises of 2007/2008 between year 2008 and 2011
appears to have some decreasing effects on volatility during the period, even though there
some level of price spikes. Finding suggests that on the average, food price volatility has not
increased beyond the patterns observed prior observed before 2007/2008 food crises
contrary to an assumption that food price volatility has become stronger in Africa (including
Nigeria) after the 2007/2008 food crises periods.
A mix of domestic, international and external factors affect food price spikes and volatility.
Higher spikes in international food prices are positively related to spikes in domestic food
prices. Likewise, higher volatilities in domestic prices of local rice are closely linked to volatility
of rice price at the international market. Thus, one of the policy challenges will be to reduce
spill-over of food price upsurges from external (international) commodity markets into the
country. In addition, volatility of international crude oil price play a substantial role in
explaining food price volatility with the possibility of escalating volatility of local rice price in
the country. As suggested, beginning stock to use ratio generally dampens both food price
spikes and price volatility. Macro-factors such as exchange rates, narrow money supply and
monetary policy rates seem to play a more important role in explaining food price spikes
and/or volatility. Increases in petrol price and food production variability, GDP growth rates
and transaction cost for international trade are further significant factors driving food prices
upsurges in some food commodities in Nigeria. The challenge of food price upsurges is more
of management of price spikes than volatilities.
Besides policy actions toward management of monetary policy, exchange rates and ensuring
stable petrol price and limiting food production variability and spill overs from international

29
markets, governments should endeavor to raise resilience of farmers and consumers to
handle price fluctuations. This can be achieved on the production side by supporting contract
farming and price insurance mechanisms, and on the consumer side through safety nets, cash
transfers and access to financial services.
30
References
Abbott, P. C., Hurt, C. and Tyner, W. E. (2011). What’s driving food prices in 2011? Farm
Foundation
Abeygunawardena, P. and Gunatilake, H. M. (1993). Impact of Money Supply on Aggregate
Price Levels: Evidence from Sri Lanka Sri Lankan Journal of Agricultural Economics 1(1):1-
15.
Aksoy, A., Isik-Dikmelik, A., 2008. Are Low Food Prices Pro-Poor? Net Food Buyers and Sellers
in Low Income Countries. Net Food Buyers and Sellers in Low-Income Countries (June 1,
2008). World Bank Policy Research Working Paper Series.
Anderson, K. and Nelgen, S. (2012). Trade barrier volatility and agricultural price stabilization.
World Develoment 40(1), 36–48.
Anríquez, G., Daidone, S., Mane, E., 2013. Rising food prices and undernourishment: A cross-
country inquiry. Food Policy 38, 190-202.
Apergis, N. and Rezitis, A. (2011). Food Price Volatility and Macroeconomic Factors: Evidence
from GARCH and GARCH-X Estimates. Journal of Agricultural and Applied Economics, 43,
1(February 2011):95–110
Balcombe, K. (2009): The evolving structure of world agricultural trade. Chapter: The nature
and determinants of volatility in agricultural prices: an empirical study from 1962-2008.
FAO, Rome: 109-136.
Barsky, R. B., and Kilian, L. (2004). Oil and the Macroeconomy since the 1970s. The Journal of
Economic Perspectives, 18(4), 115-134.
Bhargava, A., Franzini, L. and Narendranathan, W. (1982). Serial Correlation and the Fixed
Effects Model. The Review of Economic Studies 49(4): 533-549.
Central Bank of Nigeria (2017). Monetary Policy. http://www.cbn.gov.ng/monetarypolicy/
conduct.asp
Central Bank of Nigeria (2013). Quarterly Statistical Bulletin, 2 (1) March 2013– Tables. CBN,
Abuja, Nigeria. Available at: http://cenbank.org/documents/Statbulletin.asp.
CBN (Central Bank of Nigeria) (2012). 2012 Statistical Bulletin: Domestic Production,
Consumption and Prices, CBN, Abuja, Nigeria. Available at:
http://cenbank.org/documents/Statbulletin.asp.
Christiaensen, L. (2009). Revisiting the Global Food Architecture. Lessons from the 2008 Crisis.
Review of Business and Economics, 54, 345–361.

31
Cornia, G. A., Deotti, L. and Sassi, M. (2012). Food Price Volatility over the Last Decade in Niger
and Malawi: Extent, Sources and Impact on Child Malnutrition. WP 2012-002: February
2012
FAO (2011).The State of Food Insecurity in the World: How does international price volatility
affect domestic economies and food security? Food and Agriculture Organisation of the
United Nations, Rome
FAO (2017). Nigeria at a glance. http://www.fao.org/nigeria/fao-in-nigeria/nigeria-at-a-glance
en/
FAO (2016). Food security indicators. http://www.fao.org/economic/ess/ess-fs/ess-fadata/
en/#.WaUu3ch97IU
FAO. (2011). Food outlook: Global market analysis. November, 2011. Rome.
Frankel, J. (2006). “The Effects of Monetary Policy on Real Commodity Prices” NBER Working
Paper 12713.
Geman, H. and Ott, H. (2014). A re-examination of food price volatility, Working Paper 6,
ULYSSES project, EU 7th Framework Programme, Project 312182 KBBE.2012.1.4-05,
http://www.fp7-ulysses.eu/ , 68 pp.
Ghosh, J. Heintz, J. and Pollin, R. (2011). Speculation on Commodities Futures Markets and
Destabilization of Global Food Prices: Exploring the connections, Political Economy
Research Institute Working Paper 269, Amherst: University of Massachusetts.
Gilbert, C. L. (2008): Commodity Speculation and Commodity Investment. Geneva,
Switzerland: Department of Economics, University of Trento, Italia
Gilbert, C.L. and C.W. Morgan (2010): Food price volatility. In: Philosophical Transactions of
the Royal Society B: Biological Sciences 365 (1554): 3023-3034.
Haile, G.M., Kalkuhl, M. and von Braun (2013): Short-term global crop acreage response to
international food prices and implications of volatility. ZEF-Discussion Papers on
Development Policy 175. Center for Development Research, Bonn.
Hamilton, J. D. (2009). Causes and Consequences of the Oil Shock of 2007-08 (No. w15002).
National Bureau of Economic Research
Huh, H. S., Lee, H.H. and Park, C.Y. (2012): International transmission of food prices and
volatilities: A panel analysis. Technical report. Asian Development Bank, Manila.
Jungho, B. and Koo, W. W. (2009). A dynamic approach to the FDI-environment nexus: the
case of China and India. Journal of International Economic Studies, 13(2), 87-109.

32
Kalkuhl, M., von Braun, J and Torero, M. (2016). Food Price Volatility and Its Implications for
Food Security and Policy. https://www.zef.de/fileadmin/downloads/Buch_Zusamen
fassung_englisch_Homepage.pdf
Kalkuhl, M., Edenhofer, O., & Lessmann, K. (2013). Renewable energy subsidies: Second-best
policy or fatal aberration for mitigation?. Resource and Energy Economics, 35(3), 217-234.
Kornher, L. and Kalkuhl, M. (2013). Food Price Volatility in Developing Countries and its
Determinants. Quarterly Journal of International Agriculture 52(4):227-308.
Krichene, N. (2008). “Recent Inflationary Trends in World Commodities Markets.” IMF
Working Paper WP/08/130.
Lee, H. and Park, C. (2013). International Transmission of Food Prices and Volatilities: A Panel
Analysis. ADB Economics Working Paper Series. No. 373
Martin, W., Anderson, K. (2012). Export restrictions and price insulation during commodity
price booms. American Journal of Agricultural Econonomics 94(2), 422–427.
Martin, W., and Ivanic, M. (2016). Food Price Changes, Price Insulation, and Their Impacts on
Global and Domestic Poverty. In Food Price Volatility and Its Implications for Food Security
and Policy (pp. 101-113). Springer International Publishing.
Masha, I. (2000). “New Perspectives on Inflation in Nigeria”, CBN Economic and Financial
Review, 38(2).
Minot, N. W. (2011): Transmission of world food price changes to markets in Sub-Saharan
Africa. Discussion Papers 1059. International Food Policy Research Institute (IFPRI),
Washington, D.C.
Minot, N. (2014). Food price volatility in sub-Saharan Africa: Has it really increased? Food
Policy 45, 45–56.
Mitchell, D. (2008): A Note on Rising Food Prices. Washington, D.C., USA: World Bank
Development Economics Group
Mordi, C.N.O., Essien,E.A., Adenuga, A.O., Omanukwue, P. N., Ononugbo, M. C., Oguntade, A.
A., Aben, M.O and Ajao, O. M. (2007). The dynamics of inflation in Nigeria. CBN Occasional
Paper No.32
Nickell, S. J. (1981). Biases in dynamic models with fixed effects. Econometrica, 49(6):1417–
26.
Okello, A., Welburn, S., and Smith, J. (2014). Crossing institutional boundaries: mapping the
policy process for improved control of endemic and neglected zoonoses in sub-Saharan
Africa. Health policy and planning, 30(6), 804-812.

33
Omotosho, B. S. and Doguwa, S. I. (2012): Understanding the Dynamics of Inflation Volatility
in Nigeria: A GARCH Perspective. CBN Journal of Applied Statistics 3(2):51-74
Piesse J, and Thirtle C (2009): Three bubbles and a panic: an explanatory review of recent food
commodity price events. Food Policy. 34: 119-129. 10.1016/j.foodpol.2009.01.001.
Serra,T.,Gil,J.M.,2012.Price volatility in food markets: can stock building mitigate price
fluctuations? European Review of Agricultural Economics 40 (3), 1–22.
Shittu, A. M., Obayelu, O. A. and Salman, K. K. (2015). Welfare Effects of Policy-Induced Rising
Food Prices on Farm Households in Nigeria. AGRODEP Working Paper 0010 April 2015
Tadesse, G., Algieri, B., Kalkuhl, M. and von Braun, J. (2014). Drivers and triggers of
international food price spikes and volatility. Food Policy 47: 117–128
The Guardian (2017). Nigeria loses fortunes to over-dependence on Lagos ports.
https://guardian.ng/features/nigeria-loses-fortunes-to-over-dependence-on-lagos-
ports/
Tiwari, A. (2010). Impact of supply of money on food prices in India: A causality analysis. ICFAI
University, Tripura. https://mpra.ub.uni-muenchen.de/24679/
von Braun, J. and G. Tadesse (2012): Food security, commodity price volatility and the poor.
In: Aoki, M., T. Kuran and G. Roland (eds.): Institutions and Comparative Economic
Development. Volume 2012. IAE, Palgrave Macmillan, Basingstoke.
World Bank (2012) Food Price Watch, August 2012

34
Appendix 1: Patterns of Food Prices Spikes of Major Food Commodities in
Nigeria, 2001:2 – 2016:12 (National Average)
Figure 1 a: Domestic Price Spike of Imported Rice, Local Rice, Maize and Sorghum
-0.3
-0.2
-0.1
0
0.1
0.2
0.3
Feb
01
Sep
01
Ap
r 0
2
No
v 0
2
Jun
03
Jan
04
Au
g 0
4
Mrz
05
Okt
05
Mai
06
Dez
06
Jul 0
7
Feb
08
Sep
08
Ap
r 0
9
No
v 0
9
Jun
10
Jan
11
Au
g 1
1
Mrz
12
Okt
12
Mai
13
Dez
13
Jul 1
4
Feb
15
Sep
15
Ap
r 1
6
No
v 1
6
Imp. Rice National
-0.4
-0.2
0
0.2
0.4
Feb
01
Sep
01
Ap
r 0
2
No
v 0
2
Jun
03
Jan
04
Au
g 0
4
Mrz
05
Okt
05
Mai
06
Dez
06
Jul 0
7
Feb
08
Sep
08
Ap
r 0
9
No
v 0
9
Jun
10
Jan
11
Au
g 1
1
Mrz
12
Okt
12
Mai
13
Dez
13
Jul 1
4
Feb
15
Sep
15
Ap
r 1
6
No
v 1
6
Local Rice National
-0.3
-0.2
-0.1
0
0.1
0.2
0.3
Feb
01
Sep
01
Ap
r 0
2
No
v 0
2
Jun
03
Jan
04
Au
g 0
4
Mrz
05
Okt
05
Mai
06
Dez
06
Jul 0
7
Feb
08
Sep
08
Ap
r 0
9
No
v 0
9
Jun
10
Jan
11
Au
g 1
1
Mrz
12
Okt
12
Mai
13
Dez
13
Jul 1
4
Feb
15
Sep
15
Ap
r 1
6
No
v 1
6
Maize National
-0.4
-0.2
0
0.2
0.4
Feb
01
Sep
01
Ap
r 0
2
No
v 0
2
Jun
03
Jan
04
Au
g 0
4
Mrz
05
Okt
05
Mai
06
Dez
06
Jul 0
7
Feb
08
Sep
08
Ap
r 0
9
No
v 0
9
Jun
10
Jan
11
Au
g 1
1
Mrz
12
Okt
12
Mai
13
Dez
13
Jul 1
4
Feb
15
Sep
15
Ap
r 1
6
No
v 1
6
Sorghum National
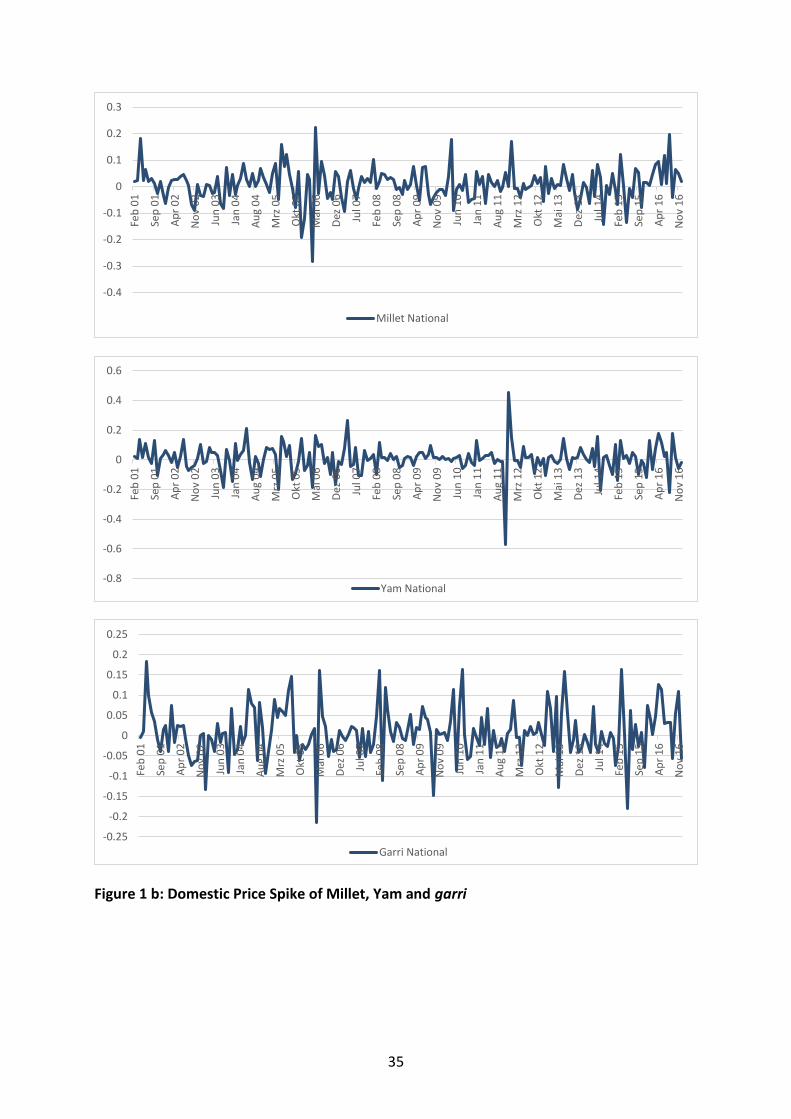
35
Figure 1 b: Domestic Price Spike of Millet, Yam and garri
-0.4
-0.3
-0.2
-0.1
0
0.1
0.2
0.3
Feb
01
Sep
01
Ap
r 0
2
No
v 0
2
Jun
03
Jan
04
Au
g 0
4
Mrz
05
Okt
05
Mai
06
Dez
06
Jul 0
7
Feb
08
Sep
08
Ap
r 0
9
No
v 0
9
Jun
10
Jan
11
Au
g 1
1
Mrz
12
Okt
12
Mai
13
Dez
13
Jul 1
4
Feb
15
Sep
15
Ap
r 1
6
No
v 1
6
Millet National
-0.8
-0.6
-0.4
-0.2
0
0.2
0.4
0.6
Feb
01
Sep
01
Ap
r 0
2
No
v 0
2
Jun
03
Jan
04
Au
g 0
4
Mrz
05
Okt
05
Mai
06
Dez
06
Jul 0
7
Feb
08
Sep
08
Ap
r 0
9
No
v 0
9
Jun
10
Jan
11
Au
g 1
1
Mrz
12
Okt
12
Mai
13
Dez
13
Jul 1
4
Feb
15
Sep
15
Ap
r 1
6
No
v 1
6
Yam National
-0.25
-0.2
-0.15
-0.1
-0.05
0
0.05
0.1
0.15
0.2
0.25
Feb
01
Sep
01
Ap
r 0
2
No
v 0
2
Jun
03
Jan
04
Au
g 0
4
Mrz
05
Okt
05
Mai
06
Dez
06
Jul 0
7
Feb
08
Sep
08
Ap
r 0
9
No
v 0
9
Jun
10
Jan
11
Au
g 1
1
Mrz
12
Okt
12
Mai
13
Dez
13
Jul 1
4
Feb
15
Sep
15
Ap
r 1
6
No
v 1
6
Garri National

36
Figure 1 c: Domestic Price Spike of Meat, Fish, Beans and Palm oil
-2
-1.5
-1
-0.5
0
0.5
Feb
01
Sep
01
Ap
r 0
2
No
v 0
2
Jun
03
Jan
04
Au
g 0
4
Mrz
05
Okt
05
Mai
06
Dez
06
Jul 0
7
Feb
08
Sep
08
Ap
r 0
9
No
v 0
9
Jun
10
Jan
11
Au
g 1
1
Mrz
12
Okt
12
Mai
13
Dez
13
Jul 1
4
Feb
15
Sep
15
Ap
r 1
6
No
v 1
6
Meat National
-0.8
-0.6
-0.4
-0.2
0
0.2
0.4
0.6
0.8
Feb
01
Sep
01
Ap
r 0
2
No
v 0
2
Jun
03
Jan
04
Au
g 0
4
Mrz
05
Okt
05
Mai
06
Dez
06
Jul 0
7
Feb
08
Sep
08
Ap
r 0
9
No
v 0
9
Jun
10
Jan
11
Au
g 1
1
Mrz
12
Okt
12
Mai
13
Dez
13
Jul 1
4
Feb
15
Sep
15
Ap
r 1
6
No
v 1
6
Fish National
-0.4
-0.2
0
0.2
0.4
Feb
01
Sep
01
Ap
r 0
2
No
v 0
2
Jun
03
Jan
04
Au
g 0
4
Mrz
05
Okt
05
Mai
06
Dez
06
Jul 0
7
Feb
08
Sep
08
Ap
r 0
9
No
v 0
9
Jun
10
Jan
11
Au
g 1
1
Mrz
12
Okt
12
Mai
13
Dez
13
Jul 1
4
Feb
15
Sep
15
Ap
r 1
6
No
v 1
6
Beans National
-0.2
-0.1
0
0.1
0.2
0.3
0.4
Feb
01
Sep
01
Ap
r 0
2
No
v 0
2
Jun
03
Jan
04
Au
g 0
4
Mrz
05
Okt
05
Mai
06
Dez
06
Jul 0
7
Feb
08
Sep
08
Ap
r 0
9
No
v 0
9
Jun
10
Jan
11
Au
g 1
1
Mrz
12
Okt
12
Mai
13
Dez
13
Jul 1
4
Feb
15
Sep
15
Ap
r 1
6
No
v 1
6
Palmoil National
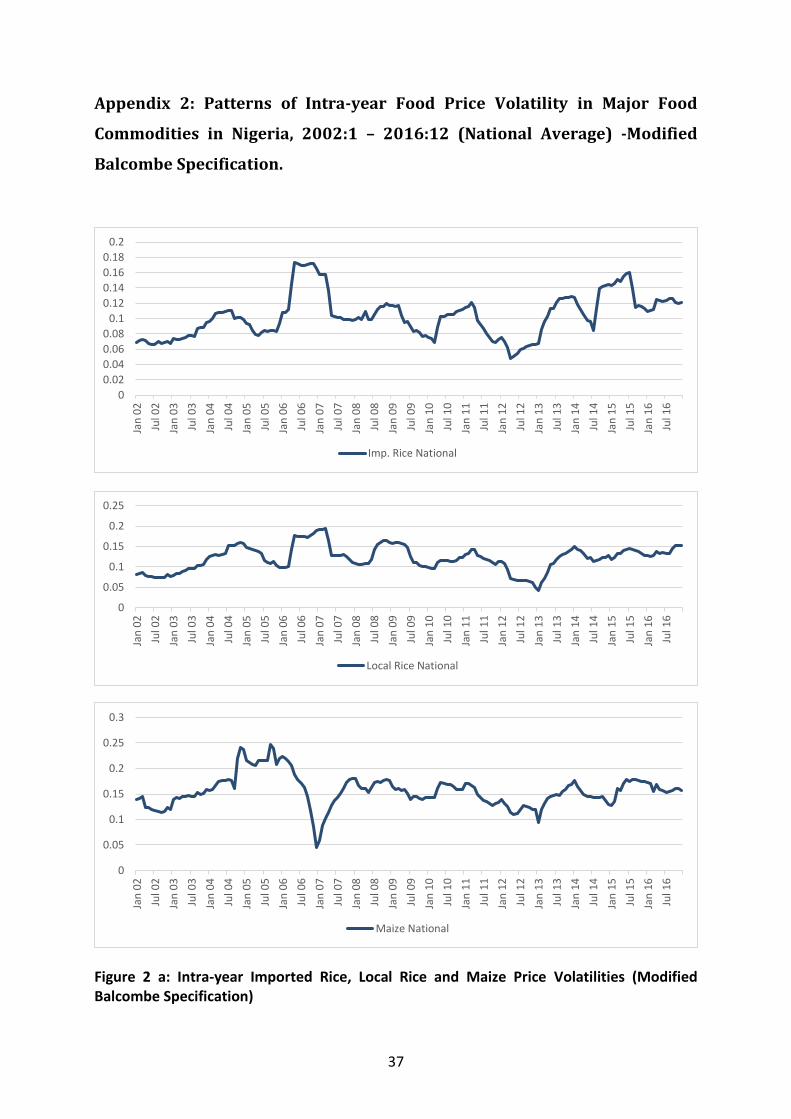
37
Appendix 2: Patterns of Intra-year Food Price Volatility in Major Food
Commodities in Nigeria, 2002:1 – 2016:12 (National Average) -Modified
Balcombe Specification.
Figure 2 a: Intra-year Imported Rice, Local Rice and Maize Price Volatilities (Modified Balcombe Specification)
0
0.02
0.04
0.06
0.08
0.1
0.12
0.14
0.16
0.18
0.2
Jan
02
Jul 0
2
Jan
03
Jul 0
3
Jan
04
Jul 0
4
Jan
05
Jul 0
5
Jan
06
Jul 0
6
Jan
07
Jul 0
7
Jan
08
Jul 0
8
Jan
09
Jul 0
9
Jan
10
Jul 1
0
Jan
11
Jul 1
1
Jan
12
Jul 1
2
Jan
13
Jul 1
3
Jan
14
Jul 1
4
Jan
15
Jul 1
5
Jan
16
Jul 1
6
Imp. Rice National
0
0.05
0.1
0.15
0.2
0.25
Jan
02
Jul 0
2
Jan
03
Jul 0
3
Jan
04
Jul 0
4
Jan
05
Jul 0
5
Jan
06
Jul 0
6
Jan
07
Jul 0
7
Jan
08
Jul 0
8
Jan
09
Jul 0
9
Jan
10
Jul 1
0
Jan
11
Jul 1
1
Jan
12
Jul 1
2
Jan
13
Jul 1
3
Jan
14
Jul 1
4
Jan
15
Jul 1
5
Jan
16
Jul 1
6Local Rice National
0
0.05
0.1
0.15
0.2
0.25
0.3
Jan
02
Jul 0
2
Jan
03
Jul 0
3
Jan
04
Jul 0
4
Jan
05
Jul 0
5
Jan
06
Jul 0
6
Jan
07
Jul 0
7
Jan
08
Jul 0
8
Jan
09
Jul 0
9
Jan
10
Jul 1
0
Jan
11
Jul 1
1
Jan
12
Jul 1
2
Jan
13
Jul 1
3
Jan
14
Jul 1
4
Jan
15
Jul 1
5
Jan
16
Jul 1
6
Maize National
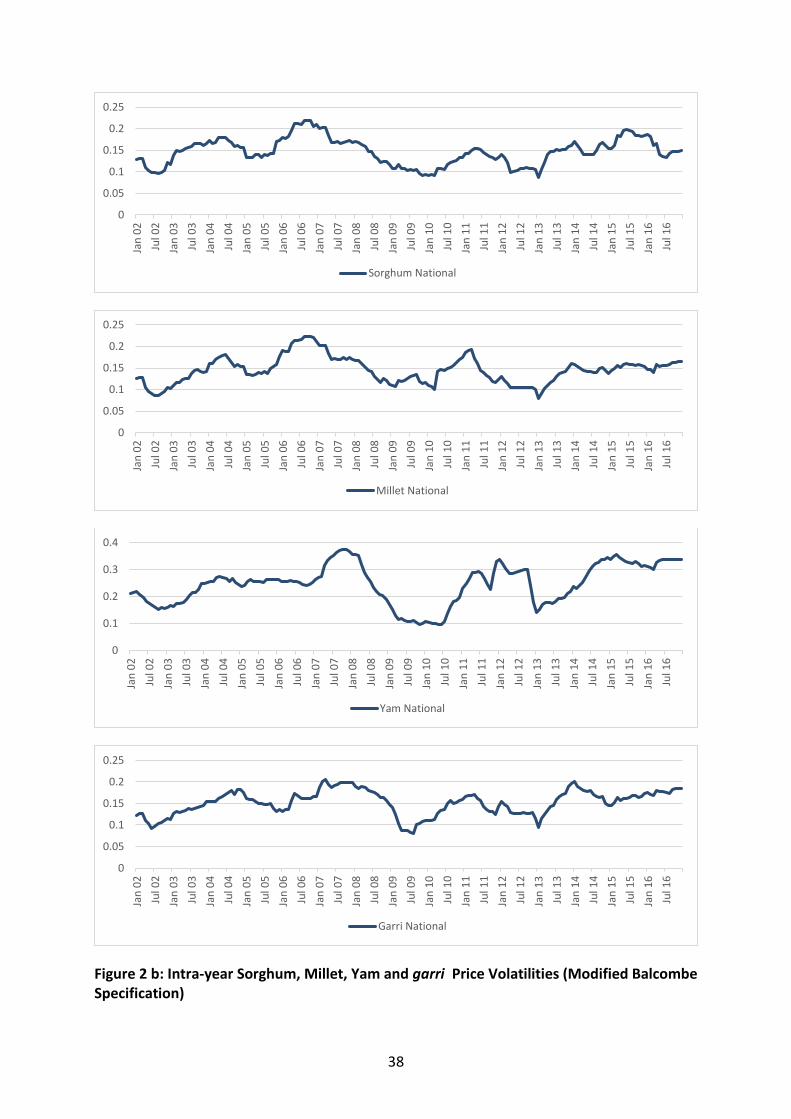
38
Figure 2 b: Intra-year Sorghum, Millet, Yam and garri Price Volatilities (Modified Balcombe Specification)
0
0.05
0.1
0.15
0.2
0.25
Jan
02
Jul 0
2
Jan
03
Jul 0
3
Jan
04
Jul 0
4
Jan
05
Jul 0
5
Jan
06
Jul 0
6
Jan
07
Jul 0
7
Jan
08
Jul 0
8
Jan
09
Jul 0
9
Jan
10
Jul 1
0
Jan
11
Jul 1
1
Jan
12
Jul 1
2
Jan
13
Jul 1
3
Jan
14
Jul 1
4
Jan
15
Jul 1
5
Jan
16
Jul 1
6
Sorghum National
0
0.05
0.1
0.15
0.2
0.25
Jan
02
Jul 0
2
Jan
03
Jul 0
3
Jan
04
Jul 0
4
Jan
05
Jul 0
5
Jan
06
Jul 0
6
Jan
07
Jul 0
7
Jan
08
Jul 0
8
Jan
09
Jul 0
9
Jan
10
Jul 1
0
Jan
11
Jul 1
1
Jan
12
Jul 1
2
Jan
13
Jul 1
3
Jan
14
Jul 1
4
Jan
15
Jul 1
5
Jan
16
Jul 1
6
Millet National
0
0.1
0.2
0.3
0.4
Jan
02
Jul 0
2
Jan
03
Jul 0
3
Jan
04
Jul 0
4
Jan
05
Jul 0
5
Jan
06
Jul 0
6
Jan
07
Jul 0
7
Jan
08
Jul 0
8
Jan
09
Jul 0
9
Jan
10
Jul 1
0
Jan
11
Jul 1
1
Jan
12
Jul 1
2
Jan
13
Jul 1
3
Jan
14
Jul 1
4
Jan
15
Jul 1
5
Jan
16
Jul 1
6
Yam National
0
0.05
0.1
0.15
0.2
0.25
Jan
02
Jul 0
2
Jan
03
Jul 0
3
Jan
04
Jul 0
4
Jan
05
Jul 0
5
Jan
06
Jul 0
6
Jan
07
Jul 0
7
Jan
08
Jul 0
8
Jan
09
Jul 0
9
Jan
10
Jul 1
0
Jan
11
Jul 1
1
Jan
12
Jul 1
2
Jan
13
Jul 1
3
Jan
14
Jul 1
4
Jan
15
Jul 1
5
Jan
16
Jul 1
6
Garri National

39
Figure 2 c: Intra-year Meat, Fish, Beans and Palm oil Price Volatilities (Modified Balcombe Specification)
0
0.2
0.4
0.6
Jan
02
Jul 0
2
Jan
03
Jul 0
3
Jan
04
Jul 0
4
Jan
05
Jul 0
5
Jan
06
Jul 0
6
Jan
07
Jul 0
7
Jan
08
Jul 0
8
Jan
09
Jul 0
9
Jan
10
Jul 1
0
Jan
11
Jul 1
1
Jan
12
Jul 1
2
Jan
13
Jul 1
3
Jan
14
Jul 1
4
Jan
15
Jul 1
5
Jan
16
Jul 1
6
Meat National
0
0.1
0.2
0.3
0.4
0.5
Jan
02
Jul 0
2
Jan
03
Jul 0
3
Jan
04
Jul 0
4
Jan
05
Jul 0
5
Jan
06
Jul 0
6
Jan
07
Jul 0
7
Jan
08
Jul 0
8
Jan
09
Jul 0
9
Jan
10
Jul 1
0
Jan
11
Jul 1
1
Jan
12
Jul 1
2
Jan
13
Jul 1
3
Jan
14
Jul 1
4
Jan
15
Jul 1
5
Jan
16
Jul 1
6
Fish National
0
0.05
0.1
0.15
0.2
0.25
Feb
02
Au
g 0
2
Feb
03
Au
g 0
3
Feb
04
Au
g 0
4
Feb
05
Au
g 0
5
Feb
06
Au
g 0
6
Feb
07
Au
g 0
7
Feb
08
Au
g 0
8
Feb
09
Au
g 0
9
Feb
10
Au
g 1
0
Feb
11
Au
g 1
1
Feb
12
Au
g 1
2
Feb
13
Au
g 1
3
Feb
14
Au
g 1
4
Feb
15
Au
g 1
5
Feb
16
Au
g 1
6
Beans National
0
0.05
0.1
0.15
0.2
Jan
02
Jul 0
2
Jan
03
Jul 0
3
Jan
04
Jul 0
4
Jan
05
Jul 0
5
Jan
06
Jul 0
6
Jan
07
Jul 0
7
Jan
08
Jul 0
8
Jan
09
Jul 0
9
Jan
10
Jul 1
0
Jan
11
Jul 1
1
Jan
12
Jul 1
2
Jan
13
Jul 1
3
Jan
14
Jul 1
4
Jan
15
Jul 1
5
Jan
16
Jul 1
6
Palmoil National
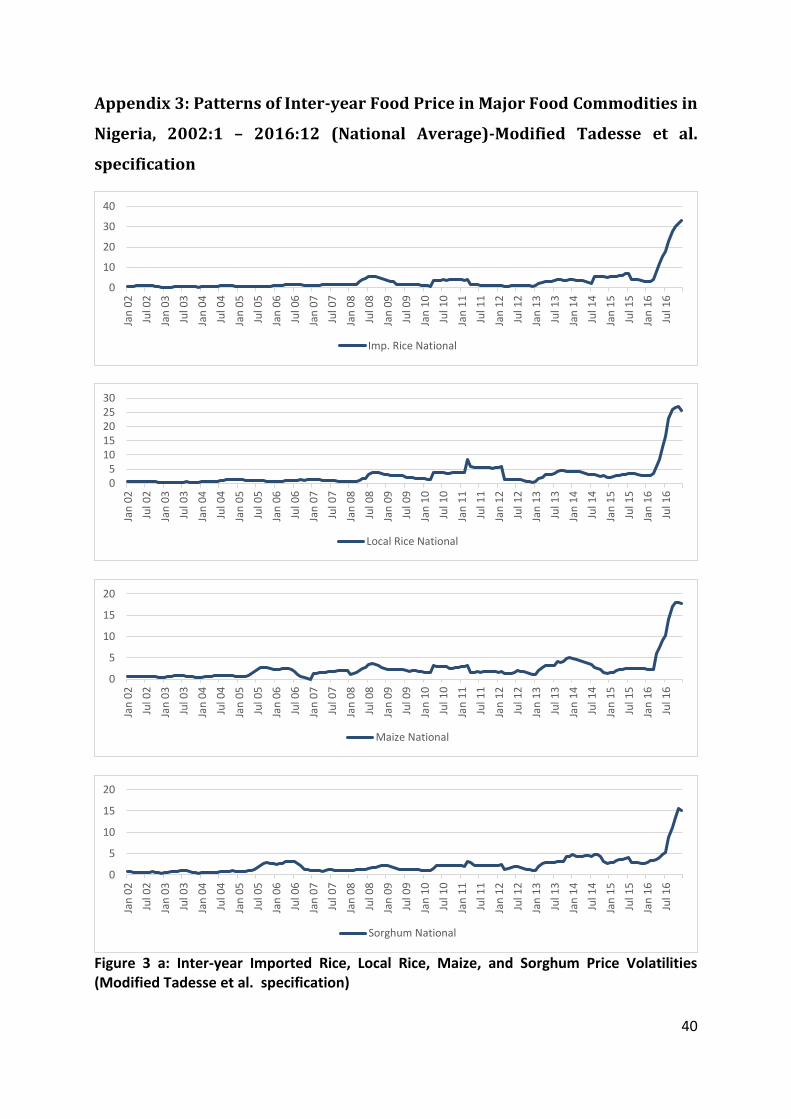
40
Appendix 3: Patterns of Inter-year Food Price in Major Food Commodities in
Nigeria, 2002:1 – 2016:12 (National Average)-Modified Tadesse et al.
specification
Figure 3 a: Inter-year Imported Rice, Local Rice, Maize, and Sorghum Price Volatilities (Modified Tadesse et al. specification)
0
10
20
30
40
Jan
02
Jul 0
2
Jan
03
Jul 0
3
Jan
04
Jul 0
4
Jan
05
Jul 0
5
Jan
06
Jul 0
6
Jan
07
Jul 0
7
Jan
08
Jul 0
8
Jan
09
Jul 0
9
Jan
10
Jul 1
0
Jan
11
Jul 1
1
Jan
12
Jul 1
2
Jan
13
Jul 1
3
Jan
14
Jul 1
4
Jan
15
Jul 1
5
Jan
16
Jul 1
6
Imp. Rice National
05
1015202530
Jan
02
Jul 0
2
Jan
03
Jul 0
3
Jan
04
Jul 0
4
Jan
05
Jul 0
5
Jan
06
Jul 0
6
Jan
07
Jul 0
7
Jan
08
Jul 0
8
Jan
09
Jul 0
9
Jan
10
Jul 1
0
Jan
11
Jul 1
1
Jan
12
Jul 1
2
Jan
13
Jul 1
3
Jan
14
Jul 1
4
Jan
15
Jul 1
5
Jan
16
Jul 1
6
Local Rice National
0
5
10
15
20
Jan
02
Jul 0
2
Jan
03
Jul 0
3
Jan
04
Jul 0
4
Jan
05
Jul 0
5
Jan
06
Jul 0
6
Jan
07
Jul 0
7
Jan
08
Jul 0
8
Jan
09
Jul 0
9
Jan
10
Jul 1
0
Jan
11
Jul 1
1
Jan
12
Jul 1
2
Jan
13
Jul 1
3
Jan
14
Jul 1
4
Jan
15
Jul 1
5
Jan
16
Jul 1
6
Maize National
0
5
10
15
20
Jan
02
Jul 0
2
Jan
03
Jul 0
3
Jan
04
Jul 0
4
Jan
05
Jul 0
5
Jan
06
Jul 0
6
Jan
07
Jul 0
7
Jan
08
Jul 0
8
Jan
09
Jul 0
9
Jan
10
Jul 1
0
Jan
11
Jul 1
1
Jan
12
Jul 1
2
Jan
13
Jul 1
3
Jan
14
Jul 1
4
Jan
15
Jul 1
5
Jan
16
Jul 1
6
Sorghum National

41
Figure 3 b: Inter-year Millet, Yam and garri Price Volatilities (Modified Tadesse et al specification)
0
5
10
15
20
25
Jan
02
Jul 0
2
Jan
03
Jul 0
3
Jan
04
Jul 0
4
Jan
05
Jul 0
5
Jan
06
Jul 0
6
Jan
07
Jul 0
7
Jan
08
Jul 0
8
Jan
09
Jul 0
9
Jan
10
Jul 1
0
Jan
11
Jul 1
1
Jan
12
Jul 1
2
Jan
13
Jul 1
3
Jan
14
Jul 1
4
Jan
15
Jul 1
5
Jan
16
Jul 1
6
Millet National
0
10
20
30
40
50
60
Jan
02
Jul 0
2
Jan
03
Jul 0
3
Jan
04
Jul 0
4
Jan
05
Jul 0
5
Jan
06
Jul 0
6
Jan
07
Jul 0
7
Jan
08
Jul 0
8
Jan
09
Jul 0
9
Jan
10
Jul 1
0
Jan
11
Jul 1
1
Jan
12
Jul 1
2
Jan
13
Jul 1
3
Jan
14
Jul 1
4
Jan
15
Jul 1
5
Jan
16
Jul 1
6
Yam National
0
5
10
15
20
25
Jan
02
Jul 0
2
Jan
03
Jul 0
3
Jan
04
Jul 0
4
Jan
05
Jul 0
5
Jan
06
Jul 0
6
Jan
07
Jul 0
7
Jan
08
Jul 0
8
Jan
09
Jul 0
9
Jan
10
Jul 1
0
Jan
11
Jul 1
1
Jan
12
Jul 1
2
Jan
13
Jul 1
3
Jan
14
Jul 1
4
Jan
15
Jul 1
5
Jan
16
Jul 1
6
Garri National

42
Figure 3 c: Inter-year Meat, Fish, Beans and Palm Oil Price Volatilities (Modified Tadesse and colleagues’ specification)
0
100
200
300
400
500
600
Jan
02
Jul 0
2
Jan
03
Jul 0
3
Jan
04
Jul 0
4
Jan
05
Jul 0
5
Jan
06
Jul 0
6
Jan
07
Jul 0
7
Jan
08
Jul 0
8
Jan
09
Jul 0
9
Jan
10
Jul 1
0
Jan
11
Jul 1
1
Jan
12
Jul 1
2
Jan
13
Jul 1
3
Jan
14
Jul 1
4
Jan
15
Jul 1
5
Jan
16
Jul 1
6
Meat National
0
50
100
150
200
Jan
02
Jul 0
2
Jan
03
Jul 0
3
Jan
04
Jul 0
4
Jan
05
Jul 0
5
Jan
06
Jul 0
6
Jan
07
Jul 0
7
Jan
08
Jul 0
8
Jan
09
Jul 0
9
Jan
10
Jul 1
0
Jan
11
Jul 1
1
Jan
12
Jul 1
2
Jan
13
Jul 1
3
Jan
14
Jul 1
4
Jan
15
Jul 1
5
Jan
16
Jul 1
6
Fish National
0
10
20
30
Jan
02
Jul 0
2
Jan
03
Jul 0
3
Jan
04
Jul 0
4
Jan
05
Jul 0
5
Jan
06
Jul 0
6
Jan
07
Jul 0
7
Jan
08
Jul 0
8
Jan
09
Jul 0
9
Jan
10
Jul 1
0
Jan
11
Jul 1
1
Jan
12
Jul 1
2
Jan
13
Jul 1
3
Jan
14
Jul 1
4
Jan
15
Jul 1
5
Jan
16
Jul 1
6Beans National
0
20
40
60
80
100
120
140
Jan
02
Jul 0
2
Jan
03
Jul 0
3
Jan
04
Jul 0
4
Jan
05
Jul 0
5
Jan
06
Jul 0
6
Jan
07
Jul 0
7
Jan
08
Jul 0
8
Jan
09
Jul 0
9
Jan
10
Jul 1
0
Jan
11
Jul 1
1
Jan
12
Jul 1
2
Jan
13
Jul 1
3
Jan
14
Jul 1
4
Jan
15
Jul 1
5
Jan
16
Jul 1
6
Palmoil National


