74
Zenith Energy Limited Annual Report 2017 ACN 615 682 203

Zenith Energy Limited Prospectus
1Details to the offer
Zenith Energy Limited Annual Report
2017ACN 615 682 203

Corporate DirectoryCorporate Directory Board of Directors
Executive Chairman Doug Walker Executive Director Gavin Great Managing Director Hamish Moffat Non-Executive Director Darren Smith Non-Executive Director Stephanie Unwin Joint Company Secretaries Rebecca Stringer-Krein
Peter Torre
Registered OfficeLevel 1, 160 Stirling Highway Nedlands WA 6009
Telephone: +61 08 9416 2000 Email: [email protected] Website: www.zenithenergyltd.com
Stock Exchange Listing Listed on the Australian Securities Exchange (ASX Code: ZEN)
Auditors BDO Audit (WA) Pty Ltd 38 Station Street, Subiaco WA 6008
Telephone: +61 08 6382 4600
Solicitors Steinpreis Paganin 16 Milligan St Perth WA 6000
Telephone: +61 08 9321 4000
Bankers Commonwealth Bank of Australia 225 St Georges Tce Perth 6000 Telephone: 13 22 21
Share Registry Link Market Services Ltd QV1 Building Level 12, 250 St George’s Tce Perth WA 6000
Telephone: +61 08 1300 554 474

Table of Contents Annual Report 2017
1Zenith Energy Limited
Table of ContentsChairman’s Letter ................................................................................................................................................................................................2
Directors’ Report ..................................................................................................................................................................................................5
Remuneration Report.....................................................................................................................................................................................16
Auditor’s Independence Declaration .......................................................................................................................................................26
Consolidated Statement of Profit or Loss and Other Comprehensive Income .................................................................28
Consolidated Statement of Financial Position ...................................................................................................................................29
Consolidated Statement of Changes in Equity ..................................................................................................................................30
Consolidated Statement of Cash Flows ................................................................................................................................................31
Notes to the Financial Statements..........................................................................................................................................................32
Directors’ Declaration .....................................................................................................................................................................................66
Independent Auditor’s Report ....................................................................................................................................................................67
Shareholder Information ...............................................................................................................................................................................70

2
Chairman’s Letter Annual Report 2017
Zenith Energy Limited
Dear Shareholder,
It is indeed an honour and a privilege that I, as your Executive Chairman, present the inaugural Annual Report of Zenith Energy Limited (‘Zenith Energy’) as an ASX listed company.
This has truly been a transformational year in many aspects, highlighted by the transition from a private entity into a publicly-listed company; a journey that has been both enlightening and humbling given the support that we have received from our shareholders, culminating with our successful ASX listing on 5 May this year.
I am very proud of and wish to acknowledge the dedication and commitment shown by our entire Zenith Energy team who have continued to deliver the Company’s existing energy contracts whilst at the same time have delivered an additional five projects over the past 18 months, safely, on time and within budget.
A truly remarkable performance given the additional demands an ASX listing process overlays on a Company.
Our ongoing operations are the core of the Company’s recurring revenue stream and the recent renewals of contracts reflect the value and respect of the relationships Zenith Energy fosters with its customers.
Zenith Energy is extremely well positioned to embrace the opportunities that lay ahead in an energy landscape in transition. Our Company’s dynamic, innovative and flexible approach to the individual needs of our customers set us apart in this competitive marketplace and has put Zenith Energy on a pathway of sustainable, profitable growth, as demonstrated by the recent announcement of the Letter of Intent from Dacian Gold for their Jupiter Project.
I have the privilege of leading your Board of Directors. Mr Darren Smith joined our Board as an Independent Non-Executive Director prior to listing and brings extensive strategy and management experience to the Team. Darren was the National Lead Partner for PwC’s Capital Project Services, where he created and led a team focussed on capital project value optimisation, cost and schedule risk analytics and project delivery across a range of infrastructure project types and industries in Australia and South-East Asia.
Chairman’s Letter
2
3
Chairman’s Letter (continued) Annual Report 2017
Zenith Energy Limited
I am very pleased to welcome the appointment of Ms Stephanie Unwin to our Board as an additional Independent Non-Executive Director, from 11 September 2017. Stephanie is an experienced company director with more than 15 years of Board engagements and is currently the Chief Executive Officer and Managing Director of ASX listed biotechnology company, Phylogica Limited. With many years’ experience in the development, construction, operation and management of renewable assets during her time at energy provider, Synergy, Stephanie brings unrivalled experience to the Company.
With Darren, Stephanie and the existing three Executive Directors, your Board of Directors shares a balance of industry and business experience, risk and corporate governance, and financial and technical depth.
In what will be our first full year as an ASX listed company, I wish to thank you, our Shareholders, for your investment in Zenith Energy. We are very excited about our future and we look forward to a long and rewarding journey with you all.
In closing, I would like to express a sincere thank you to our Team, from Perth and throughout Western Australia, to our Cairns office and throughout Queensland, to Ok Tedi in Papua New Guinea, to our Executive Management and our Advisors, you have delivered beyond expectations.
Yours sincerely,
Mr William (Doug) Walker Executive Chairman

4
Directors’ Report Annual Report 2017
Zenith Energy Limited4

5
Directors’ Report Annual Report 2017
Zenith Energy Limited
Directors’ ReportYour directors present their report on the consolidated entity (referred to herein as the Group) consisting of Zenith Energy Limited and its controlled entities for the financial year ended 30 June 2017.
5

6
Directors’ Report Annual Report 2017
Zenith Energy Limited
Directors’ ReportYour directors present their report on the consolidated entity (referred to herein as the Group) consisting of Zenith Energy Limited and its controlled entities for the financial year ended 30 June 2017.
General InformationDirectorsThe following persons were directors of Zenith Energy Limited during or since the end of the financial year up to the date of this report, unless otherwise stated:
William Douglas Walker – Executive Chairman (Appointed to Zenith Energy Limited on 2 November 2016)
Gavin Great – Executive Director (Appointed to Zenith Energy Limited on 2 November 2016)
Hamish Moffat – Managing Director (Appointed to Zenith Energy Limited on 2 November 2016)
Darren Smith – Non-Executive Director (Appointed to Zenith Energy Limited on 30 March 2017)
Stephanie Unwin – Non-Executive Director (Appointed to Zenith Energy Limited on 11 September 2017)
Particulars of each director’s experience and qualifications are set out later in this report.
Dividends Paid or RecommendedDividends/distributions of $0.22 million were paid prior to the common control transactions and Initial Public Offering (“IPO”) referred to in the ‘Significant Changes in State of Affairs’ in the operating and financial section below. Subsequent to these events, no dividends were declared or paid during the financial year ended 30 June 2017. The directors have not recommended the payment of a dividend in respect to the year ended 30 June 2017.
Indemnifying Officers or AuditorDuring or since the end of the financial year, the Company has given an indemnity or entered into an agreement to indemnify, or paid or agreed to pay insurance premiums as follows:
− The Company has paid premiums to insure each of the directors against liabilities for costs and expenses incurred by them in defending legal proceedings arising from their conduct while acting in the capacity of directors of the Company, other than conduct involving a wilful breach of duty in relation to the Company.
Proceedings on Behalf of CompanyNo person has applied for leave of court to bring proceedings on behalf of the Company or intervene in any proceedings to which the Company is a party for the purpose of taking responsibility on behalf of the Company for all or any part of those proceedings.
The Company was not a party to any such proceedings during the year.
Non-audit ServicesThe Board of Directors is satisfied that the provision of non-audit services during the year is compatible with the general standard of independence for auditors imposed by the Corporations Act 2001. The directors are satisfied that the services disclosed below did not compromise the external auditor’s independence for the following reasons:
− all non-audit services are reviewed and approved by the Board prior to commencement to ensure they do not adversely affect the integrity and objectivity of the auditor; and
− the nature of the services provided does not compromise the general principles relating to auditor independence in accordance with APES 110: Code of Ethics for Professional Accountants set by the Accounting Professional and Ethical Standards Board.
During the year, BDO Corporate Finance (WA) Pty Ltd, BDO (Nth QLD) Pty Ltd, BDO Reward (WA) Pty Ltd and BDO Corporate Tax (WA) Pty Ltd, related parties of the Group’s auditors, BDO Audit (WA) Pty Ltd provided services in relation to the Company’s Investigating Accountant’s Report, taxation services and remuneration benchmarking services in addition to audit services. The following fees for non-audit services were paid/payable during the year ended 30 June 2017:
$
Investigating Accountant’s Report (“IAR”) 59,870Taxation Services 21,889Remuneration Benchmarking Services 37,000Total remuneration for non-audit services 118,759

7
Directors’ Report (continued) Annual Report 2017
Zenith Energy Limited
Auditor’s Independence DeclarationThe lead auditor’s independence declaration for the year ended 30 June 2017 as required under section 307C of the Corporation Act 2001 has been received and can be found on page 26 of the financial report.
RoundingThe parent entity is a Company of the kind specified in the ASIC Corporation Legislative Instrument 2016/191. In accordance with this class order, amounts contained in the preliminary final report have been rounded to the nearest thousand dollars ($’000), unless specifically stated otherwise.
Environmental RegulationsThe Group is not subject to any significant environmental regulations under either Commonwealth or State legislations. The Board is not aware of any breach of environmental requirements as they apply to the Group.
OptionsAt the date of this report, there are no unissued ordinary shares of Zenith Energy Limited under option.
There have been no options granted over unissued shares or interests of any controlled entity within the Group during or since the end of the reporting period.
There were no options issued to directors and executives as remuneration, refer to the remuneration report for details of other transactions.
During the year ended 30 June 2017, there were no ordinary shares of Zenith Energy Limited issued on the exercise of options granted. No further shares have been issued since year-end. No amounts are unpaid on any of the shares.
No person entitled to exercise options had or has any right by virtue of the option to participate in any share issue of any other body corporate.
Information Relating to Directors and Company SecretariesWilliam (Doug) WalkerExecutive Chairman
Mr Walker is a 35-year veteran of the power generation industry. He has designed and built more than 60 remote power stations across Australasia, initially through his own company, StateWest Power, and later through Zenith Pacific Pty Ltd, which he co-founded in 2006. StateWest was subsequently acquired by Wesfarmers Energy.
Mr Walker is recognised in the industry for his innovative thinking, both in finding effective solutions to difficult power
generation problems and for creating the now widely-recognised Build, Own and Operate (“BOO”) approach to the establishment of remote area power plants.
During the three years prior to the end of the year, Mr Walker was not a director of any other listed entities.
Mr Walker was appointed a Director of Zenith Energy Limited on 2 November 2016, and Executive Chairman on 22 March 2017.
Gavin Great Executive Director
A co-founder of Zenith Pacific Pty Ltd, Mr Great plays a key role in the design, commissioning and operation of Zenith projects. He has extensive experience in the mining and offshore oil and gas industries, where he has specialized in power station PLC programming, and control system design and implementation. He also has overall operational responsibility for all Zenith Pacific Pty Ltd projects across Australia and Papua New Guinea.
Mr Great not does not currently hold any other directorships.
Mr Great was appointed a Director of Zenith Energy Limited on 2 November 2016, and Executive Director-Operations on 21 March 2017.
Hamish MoffatManaging Director
Mr Moffat has extensive experience in the downstream oil industry gained primarily in building markets in numerous sectors across Asia, Europe and the US. Mr Moffat was most recently the CEO of a private commercial services company which he sold into a major public services conglomerate in the second half of 2015. Previously he was the Chief Executive Officer of a privately held oil distribution company which holds exclusive distribution rights to a major international brand and has performed roles as Segment Director and Marketing Director for one of the world’s largest oil companies.
During the three years prior to the end of the year, Mr Moffat was not a director of any other listed entities.
Mr Moffat was appointed a Director of Zenith Energy Limited on 2 November 2016, and Managing Director on 22 March 2017.

8
Directors’ Report (continued) Annual Report 2017
Zenith Energy Limited
Darren SmithNon-Executive Director
Mr Smith is a strategy and management consultant with experience at PwC, GEM Consulting and Arthur D Little.
He was the National Lead Partner for PwC’s Capital Project Services, where he created and led a national team focused on capital project value optimisation, cost and schedule risk analytics and project delivery across a range of infrastructure project types and industries in Australia and South East Asia. Prior to his consulting career, he held senior industry roles, including as Corporate Engineering Manager for a major technology development company, where he was responsible for technology development and licensing activities around one of Australia’s largest R&D budgets.
Mr Smith has a Degree in Mechanical Engineering from Melbourne University, has completed an EDP at Harvard University and holds a number of patents in combustion technology and emissions controls.
During the three years prior to the end of the year, Mr Smith was not a director of any other listed entities.
Mr Smith was appointed Non-Executive Director on 30 March 2017.
Stephanie UnwinNon-Executive Director
Ms Unwin is an experienced company director with more than 15 years of Board engagements across both ASX and TSX listed companies.
She is currently the Chief Executive Officer and Managing Director of ASX listed biotechnology company, Phylogica Limited, and has previously served on the Boards of Integra Mining Limited and Alacer Gold Corp.
In her most recent role as Executive General Manager Retail of Synergy, Western Australia’s leading energy provider, Ms Unwin oversaw the retail business unit through the development of new energy solutions, providing her with invaluable experience as a strategist coupled with a deep knowledge of the energy landscape in Australia.
Ms Unwin is Managing Director of Phylogica Limited.
Ms Unwin was appointed Non-Executive Director on 11 September 2017.
Rebecca Stringer-KreinChief Financial Officer and Joint Company Secretary
Ms Stringer-Krein joined Zenith Pacific Pty Ltd as Chief Financial Officer and Company Secretary in August 2016. She was previously the CFO of a Marine Engineering Group, and has extensive experience as a Financial Controller in large Australian companies, mainly in the facilities management and mining sectors. Ms Stringer-Krein has a strong interest in corporate governance, and has often been engaged in positions related to organisational transformation, as well as preparing companies for mergers, acquisition, and ASX listing.
Ms Stringer-Krein was appointed Chief Financial Officer and Joint Company Secretary of Zenith Energy Limited on 2 November 2016.
Peter TorreJoint Company Secretary
Mr Torre has 20 years of corporate advisory experience. He holds a Bachelor of Business, is a Chartered Accountant, a Chartered Secretary and a Member of the Australian Institute of Company Directors.
Mr Torre is currently the company secretary for several ASX listed companies. He was a partner of an internationally affiliated firm of chartered accountants, working within its corporate services division for over nine years where he also held the position of Chairman of the National Corporate Services Committee.
Mr Torre was appointed Joint Company Secretary on 22 February 2017.
9
Directors’ Report (continued) Annual Report 2017
Zenith Energy Limited
Interest in the shares, options and performance rights of the company and related bodies corporate At the date of this report, the interests of the directors in the shares, options and performance rights of Zenith Energy Limited were:
DIRECTORORDINARY
SHARES
OPTIONS OVER
ORDINARY SHARES
PERFORM- ANCE
RIGHTS
William (Doug) Walker 23,440,000 - -Gavin Great 18,360,000 - -Hamish Moffat 3,400,000 - -
Darren Smith - - 42,000Stephanie Unwin - - -
Meetings of DirectorsDuring the financial year, three meetings of directors (including committees of directors) were held. Attendances by each director during the year were as follows:
DIRECTOR BOARD MEETINGS
Meetingseligible to
attendMeetingsattended
William (Doug) Walker 3 3Gavin Great 3 3Hamish Moffat 3 3Darren Smith 2 2Stephanie Unwin - -
In addition to the scheduled Board and Committee meetings, directors regularly communicate by telephone, email or other electronic means, and where necessary, circular resolutions are executed to effect decisions.

10
Directors’ Report (continued) Annual Report 2017
Zenith Energy Limited
Operating and Financial ReviewPrincipal ActivitiesThe principal activities of the Group during the financial year is to build, own, operate and maintain remote power plants for the resources industry.
Our Business Model and ObjectivesZenith Energy Limited operates two separate streams of material revenue. The first, the Build, Own, Operate (“BOO”) model, involves building power stations on our client sites (generally remote mine sites), and then selling electricity through a Power Purchase Agreement (“PPA”) on a 5-10 year (on average) term. BOO Contracts and PPA’s form the basis of Zenith’s Special Purpose Vehicle (“SPV”) companies, which are wholly owned by Zenith Pacific Pty Ltd. The second revenue stream is the Manage, Operate, Maintain (“MOM”) model, which is run through Zenith Pacific Pty Ltd as an operating entity. This model involves Zenith managing, operating and maintaining our client’s assets on their sites, without the purchase of the power station assets by Zenith.
Operating ResultsThe consolidated profit of the consolidated Group amounted to $3.123 million after providing for income tax. This represented a 95% increase on the results reported for the year ended 30 June 2016. The significant improvement was largely from a full-year return to normal operation at the Ok Tedi Mine Site in Papua New Guinea (an El Nino event affected 9 months of the Group’s results in FY16), as well as increases in revenue and continuing scrutiny around operating costs. Further discussion on the Group’s operations is provided below.
Review of OperationsA summary of the key projects for which the Group currently has BOO or MOM contracts is set out in the table below. The Nova Power Station was commissioned on 1 September 2016, and the Kundana Power Station became operational 28 June 2017.
PROJECT CONTRACT CONTRACT TYPE FUEL TYPE
Barrow Island Chevron Australia BOO /MOM Gas/diesel
Plutonic Billabong Gold BOO /MOM Gas/diesel
Daisy Milano Silver Lake Resources BOO Gas/diesel
Nova - Diesel Independence Group BOO Diesel
Nova – Solar* Independence Group BOO
Diesel / Solar
Halls Creek Pantoro BOO Diesel
Ok Tedi Ok Tedi Mining MOM Multi fuel
Phosphate Hill Incitec Pivot MOM Gas
Jundee Northern Star Resources BOO /MOM Gas
Kundana Northern Star Resources BOO Diesel
*Contract in suspension pending ARENA decision on funding of project.

11
Operating and Financial Review (continued) Annual Report 2017
Zenith Energy Limited
Financial PositionThe net assets of the Group increased by $28.89 million from 30 June 2016 to $36.05 million in 2017. This increase is largely due to the following factors:
− Improved operating performance of the Group; and
− Net proceeds from share issues from the IPO raising $23.41 million.
The Group’s strong financial position has enabled the Group to reduce its borrowings, excluding lease liabilities by $3.735 million, while maintaining a healthy working capital ratio. The Group’s working capital, being current assets less current liabilities, has improved from $1.03 million in 2016 to $4.51 million in 2017.
The directors believe the Group is in a strong and stable financial position to expand and grow its current operations.
The following table provides a summary of the historical consolidated statement of profit or loss and other comprehensive income for Zenith Pacific Pty Ltd for the 2015 and 2016 financial years (FY15 and FY16) and the statutory consolidated statement of profit or loss and other comprehensive income for the Group for the financial year ending 30 June 2017 (FY17). The Company lodged a Prospectus with the Australian Securities Exchange (“ASX”) on 5 May 2017 which contained details in respect to the outlook and expected results in the coming period for the Company.
ZENITH PACIFIC
FY15$’000
ZENITH PACIFIC
FY16$’000
GROUPFY17
$’000
Revenue 24,000 26,491 30,971Other income 58 32 426Cost of sales (12,340) (16,335) (13,489)Operating expenses (5,197) (5,666) (8,064)EBITDA 6,521 4,522 9,844Depreciation (1,091) (1,044) (2,041)EBIT 5,430 3,478 7,803Finance expenses (735) (758) (1,520)Loss on disposal of assets - (695) (19)Loss on cancellation of JV - - (1,638)Profit before income tax 4,695 2,025 4,626Income tax expense (1,509) (423) (1,503)Profit for the period 3,186 1,602 3,123

12
Directors’ Report (continued) Annual Report 2017
Zenith Energy Limited
Significant Changes in State of AffairsThe following significant changes in the state of affairs of the parent entity occurred during the financial year:
− On 2 November 2016, Zenith Energy Limited was incorporated. On the same date, Zenith Energy Limited acquired, through a common control transaction, the existing consolidated Group Zenith Pacific Pty Ltd and controlled entities, which had the same principle activities referred to above. The common control transaction was entered into in relation to the listing of Zenith Energy Limited onto the ASX on 5 May 2017. As such, these financial statements for the year ended 30 June 2017 represent the consolidated financial statements of Zenith Energy Limited. The comparative amounts shown at 30 June 2016 relate to the financial statements of Zenith Pacific Pty Ltd and controlled entities; and
− During the year, the Company issued an additional 50.00 million ordinary shares at $0.50 each to shareholders as part of the Initial Public Offering (“IPO”).
Changes in controlled entitiesIn 2015, Zenith Pacific Pty Ltd formed a joint venture (“JV”) entity with Solea AG, a German Photo-Voltaic (“PV”) provider. In November 2016, Zenith Pacific Pty Ltd dissolved the JV due to incompatibility of business models. The amount written off ($1.64 million) includes formation costs, legal fees and a settlement amount.
During the course of the financial year, three new entities were incorporated to the Group: Zenith Pacific Pty Ltd (NOVA-PV) Pty Ltd, Zenith Pacific Pty Ltd (KUNDANA) Pty Ltd, and Zenith Pacific Pty Ltd (HCM) Pty Ltd.
Except for the above, no other matters or circumstances have arisen since the end of the financial year which significantly affected or could significantly affect the operations of the Group in future financial years.
OutlookCurrent areas of strategic focus of the Group include the following:
− Continuing to work with resource companies to assist them with the provision of power, while they focus on resource extraction; and
− Continuing to focus on the contract possibilities related to Zenith’s extensive expertise in hybrid generation, in the hybrid/renewables market.
To further improve the Group’s profit and maximise shareholder wealth, the following developments are intended for implementation in the near future:
− Implementation of the Pronto Software ERP to further improve and streamline operational and administrative processes across all business units; and
− Construction of the contracted hybrid Diesel/Solar plant at the Nova Nickel Mine.
These developments, together with the current strategy of continuous improvement and adherence to quality control in existing markets, are expected to assist in the achievement of the consolidated Group’s long-term goals and development of new business opportunities.
Risk Factors There are a number of risks that, either individually or in combination, may materially and adversely affect the future operating and financial performance of Zenith Energy Limited and the value of its Shares. Some of these risks may be mitigated by Zenith Energy Limited’s internal controls, the directors and management.
The risks identified in this section, or other risk factors, may have a material impact on the financial performance of Zenith Energy Limited and the market price of the Shares. The following is not intended to be an exhaustive list of the risk factors to which the Group is exposed.
Specific Risks Operating Risks Zenith Energy Limited is, and will continue to be, exposed to a range of operational risks relating to current and future operations. These include equipment failures and other accidents, industrial action or disputes, lease renewals, damage by third parties, floods, fire, major cyclone, earthquake, lightning strike, terrorist attack or other disaster.
Contractual Relationships with Key Customers Zenith Energy Limited’s ability to conduct its business and generate income is derived from PPAs with its customers. Any termination of one or more PPAs may affect the Company’s financial performance.
Additional Capital and Financing Zenith Energy Limited, through its interest in each of its generation projects, has significant borrowings. The Company’s debt facilities include common financial and non-financial covenants which could limit the Group’s future financial flexibility.
Reliance on Key Personnel The responsibility of overseeing the day-to-day operations and the strategic management of Zenith Energy Limited depends substantially on its senior management and directors.

13
Directors’ Report (continued) Annual Report 2017
Zenith Energy Limited
Failing to Convert Pipeline Opportunities into Binding ContractsThe success of Zenith Energy Limited’s growth strategy, particularly in the commercial market for our hybrid and micro-grid offers, is highly dependent upon securing customers and converting trial or pipeline customers into ongoing, revenue producing customer relationships. For new green field and existing brown field projects, prospective clients often engage expert teams to research the latest technology for incorporation into their power delivery plans. The importance of educating customers as to the benefits of Zenith Energy Limited’s products therefore becomes paramount.
Competitive ThreatThe Group’s earnings and market share could come under threat from aggressive domestic and overseas market competitors. Competition may be based on factors including price, service, product differentiation and quality, production capability, innovation, growth, capital accessibility and turnaround times. The Group’s success is built on the key features of its offering, being innovation, strong long term client relationships, quality, reliability and durability.
Construction RiskNew power generation plants under construction are exposed to risks associated with the project not being completed on time, on budget, or in accordance with specifications. Increased costs and/or timing delays may delay or reduce the expected cash flows on a project and consequently impact the Group’s operating and financial performance.
Reliance on Business SystemsPower production consists of a diverse collection of operations and sequences, which is complex to control. Over the last thirty years Zenith Energy Limited’s key management has developed control and monitoring systems which are used to gather information to create the cost control file for every job.
There is a risk that any key business systems, particularly the Group’s unique control and monitoring systems, may be adversely affected by a number of factors, including an inability to operate, lack of support to maintain the system, damage, equipment faults, power failure, communication system failure, computer viruses, misuse by employees or contractors, external malicious interventions such as hacking, fire, natural disasters or weather interventions. Any failure of key business systems may materially affect the Group’s operations and profitability.

14
Directors’ Report (continued) Annual Report 2017
Zenith Energy Limited
Supply ChainAny disruption or external market condition limiting the supply or increasing the cost of components, consumables or raw materials to the Group could have a material adverse impact on Zenith Energy Limited’s profitability. The Group relies on the procurement of components, consumables and raw materials used in operation from its existing extensive network of local and international suppliers.
Intellectual PropertyZenith Energy Limited’s ability to fully leverage its expertise and innovation depends upon its ability to use and protect its intellectual property and any improvements to it. Such intellectual property may not be capable of being legally protected, it may be the subject of unauthorised disclosure or unlawfully infringed, or Zenith Energy Limited may incur substantial cost in asserting or defending its intellectual property rights.
Failing to Match Production to DemandZenith Energy Limited’s objectives are dependent on its ability to meet commercial demand for its products and services. This is particularly true in relation to Zenith Energy Limited’s hybrid & micro-grid offers, where the Company is seeking to establish footholds in a relatively immature market. There is a risk that Zenith Energy Limited will not be able to increase its power production capacity quickly enough, while maintaining appropriate quality standards, to meet incoming demand.
Insurance RiskZenith Energy Limited currently insures its operations in accordance with industry practice. However, in certain circumstances, Zenith Energy’s insurance may not be of a nature or level to provide adequate liability cover.
General RisksCommodity RiskZenith Energy Limited endeavours to maintain a balanced portfolio of customers by resource (i.e. gold, nickel, lithium, phosphate, oil, bauxite, iron ore) and commodity type across a select group of tier one and upper mid-tier resources and energy clients in a diverse range of geographies. Despite employing this diversification strategy, Zenith Energy Limited cannot provide any assurance that there will not be an adverse impact on their performance as a consequence of a downturn in one or more commodities or geographies.
Market RiskShare market conditions may affect the value of Zenith Energy Limited’s securities regardless of Zenith’s operating performance. Share market conditions are affected by many factors such as:
− general economic outlook;
− introduction of tax reform or other new legislation;
− interest rates and inflation rates;
− changes in investor sentiment toward particular market sectors;
− the demand for, and supply of, capital; and
− terrorism or other hostilities.
The resources market can be particularly sensitive to world economic conditions.
15
Corporate Governance Statement (continued) Annual Report 2017
Zenith Energy Limited
Exchange Rate RiskCurrently, all of the Group’s revenues and the majority of costs are in Australian dollars. However, the mix of currencies in which Zenith Energy Limited pays its costs and earns its revenues may change over time. If that mix changes, there may be a greater impact on profitability in Australian dollar terms. Zenith Energy Limited’s financial statements are prepared and presented in Australian dollars, and any appreciation in the Australian dollar against other currencies in which the Group transacts may adversely affect its financial performance and position. The Group has developed a global supply chain for components incorporated into both the Group’s operations and projects. This global supply chain will act as a natural exchange rate hedge which will provide some or limited security for the Group against fluctuations in the Australian dollar.
Dilution of ShareholdingsIn future, Zenith Energy Limited may issue Shares to new investors in order to finance the Group’s operations or growth strategy. While the Company will be subject to the constraints of the ASX Listing Rules regarding the percentage of its capital it is able to issue within a 12 month period, as a result of any new issue of Shares, an investor’s proportional beneficial ownership in the underlying assets of the Company may be diluted.
Events after the Reporting PeriodOther than the following, the directors are not aware of any significant events since the end of the reporting period.
− On 11 July 2017, Zenith Energy Limited advised the ASX that it had begun producing power under a BOO Power Purchase Agreement (“PPA”) for Northern Star Resources at their Jundee Gold Project Operation. This PPA was included in Zenith Energy Limited’s forecast at IPO.
− On 15 August 2017, Zenith Energy Limited advised the ASX
it had secured a three year MOM contract extension with Ok Tedi Mining Limited at its Tabubil Power Station. This PPA was included in Zenith Energy Limited’s forecast at IPO.
− On 22 August 2017, Zenith Energy Limited advised the ASX it had signed a one year extension (with a possible further one year extension) to its MOM contract at the Phosphate Hill Power Station near Mt Isa. This PPA was included in Zenith Energy Limited’s forecast at IPO.
− On 28 August 2017, Zenith Energy Limited and Dacian Gold Limited advised the ASX that they had entered into a Letter of Intent to build the Power Station for Dacian at the Mt Morgan Project. The PPA has a supply commencement date of 7 March 2018 and will positively impact FY18 earnings. This PPA was not included in Zenith Energy Limited’s forecast at IPO.
− At 30 June 2017, the CBA Trade Advance Facility for the financing of the IGO Nova Power Station was classed as a current liability. This facility has since converted to a five year facility with a straight line amortisation profile and quarterly repayments.
− The Group finalised its remuneration policy and the proposed calculations for LTI and STI opportunities as disclosed in the Remuneration Report. The expected cash payment is $0.462 million and a non-cash LTI of $0.247 million. These amounts have not been accrued at reporting date.
− On 11 September 2017, Ms Stephanie Unwin was appointed to the Board of Directors
Corporate Governance StatementZenith Energy Limited’s 2017 Corporate Governance Statement can be found at
http://www.zenithenergyltd.com/.
16
Directors’ Report (continued) Annual Report 2017
Zenith Energy Limited
Remuneration ReportThe directors present the Zenith Energy Limited’s 2017 remuneration report, outlining key aspects of our remuneration policy and framework, and remuneration awarded this year.
The report is structured as follows:
(a) Key management personnel (“KMP”) covered in this report
(b) Remuneration policy and link to performance
(c) Elements of remuneration
(d) Link between remuneration and performance
(e) Remuneration expenses for executive KMP
(f) Contractual arrangements for executive KMP
(g) Non-executive director arrangements
(h) Other statutory information
(a) Key management personnel (“KMP”) covered in this report
Doug Walker Executive Chairman (Appointed 2 November 2016)Gavin Great Executive Director (Appointed 2 November 2016)Hamish Moffat Managing Director (Appointed 2 November 2016)Darren Smith Non-Executive Director (Appointed 30 March 2017)Stephanie Unwin Non-Executive Director (Appointed 11 September 2017)Graham Cooper General Manager – Projects (Appointed 13 September 2016)Rebecca Stringer-Krein CFO and Joint Company Secretary (Appointed 2 November 2016)
(b) Remuneration policy and link to performance The remuneration policy of Zenith Energy Limited has been designed, with the assistance of external consultants, to align key management personnel (“KMP”) objectives with shareholder and business objectives by providing a fixed remuneration component and offering specific long-term incentives based on key performance areas affecting the Group’s financial results. The Board of Zenith Energy Limited believes the remuneration policy to be appropriate and effective in its ability to attract and retain KMP to run and manage the Group, as well as create goal congruence between directors, executives and shareholders.
The Board’s policy for determining the nature and amount of remuneration for KMP of the consolidated Group is based on the following:
− The measures within the remuneration policy are to be developed by the Remuneration and Nomination committee, which is soon to be established and approved by the Board.
− All KMP receive a base salary (which is based on factors such as length of service and experience), superannuation, fringe benefits, and performance incentives.
− Performance incentives are only paid once predetermined key performance indicators (“KPIs”) have been met.
− Incentives paid in the form of shares, options or Performance Rights are intended to align the interests of the directors and company with those of the shareholders.
− The Remuneration and Nomination committee will review KMP packages annually by reference to the Group’s performance, executive performance and comparable information from industry sectors.

17
Directors’ Report (continued) Annual Report 2017
Zenith Energy Limited
The performance of KMP is measured against criteria agreed annually with each executive and is based predominantly on the forecast growth of the Group’s profits and shareholders’ value. All incentives must be linked to predetermined performance criteria. The Board may, however, exercise its discretion in relation to approving incentives, bonuses and options, and can recommend changes to the Remuneration and Nomination committee’s recommendations. Any change must be justified by reference to measurable performance criteria.
The policy is designed to attract the highest calibre of executives and reward them for performance results leading to long-term growth in shareholder wealth.
KMP receive a superannuation guarantee contribution required by the government, which is currently 9.5% of the individual’s monthly ordinary time earnings. Some individuals, however, have chosen to sacrifice part of their salary to increase payments towards superannuation.
All remuneration paid to KMP is valued at the cost to the company and expensed.
The Board’s policy is to remunerate non-executive directors at market rates for time, commitment and responsibilities. The Remuneration and Nomination Committee will recommend payments to the non-executive directors and review their remuneration annually, based on market practice, duties and accountability. These recommendations will then be taken to the Board for approval. Independent external advice is sought when required. The maximum aggregate amount of fees that can be paid to non-executive directors is subject to approval by shareholders at the annual general meeting.
In addition, the Board’s remuneration policy prohibits directors and KMP from using Zenith Energy Limited shares as collateral in any external financial transaction, including margin loan arrangements.
Performance-based RemunerationKPIs are set annually, with a certain level of consultation with KMP. The measures are specifically tailored to the area each individual is involved in and has a level of control over. The KPIs target areas the Board believes hold greater potential for Group expansion and profit, covering financial and non-financial as well as short and long-term goals. The level set for each KPI is based on budgeted figures for the Group and respective industry standards. KPI’s are set in relation to both ongoing organisational objectives (e.g. no lost time injuries), as well as goal-setting for a particular financial year, for example, one-off projects. For more information on KPI targets, refer to (c) Elements of Remuneration.
Performance in relation to the KPIs is assessed annually, with incentives being awarded depending on the number and weighting of the KPIs achieved. Following the assessment, the KPIs are reviewed by the Remuneration and Nomination committee in light of the desired and actual outcomes, and their efficiency is assessed in relation to the Group’s goals and shareholder wealth, before the KPIs are set for the following year.
(c) Elements of remuneration Fixed Remuneration Executive KMP are paid a total fixed remuneration (“TFR”) amount consisting of salary plus 9.5% superannuation. The annual salaries for the year ended 30 June 2017 are tabled below. The actual salary amounts paid for the year ended 30 June 2017 are contained in section (e) Remuneration expenses for executive KMP in the Remuneration Report below. Executive KMP signed new common law contracts with Zenith Energy Limited on 22 March 2017.
KMP NAME POSITION TFR1TFR FROM
MARCH 22 20182
WD Walker Executive Chair $437,250 $546,000 H Moffat Managing Director $396,250 $464,000 G Great Executive Director - Operations $382,000 $382,000 G Cooper General Manager - Projects $382,000 $382,000 R Stringer-Krein Chief Financial Officer $260,860 $329,000
1. TFR is composed of salary plus 9.5% superannuation.
2. TFR from 22 March 2018 is to bring KMP remunerated below the median of the market into line with other KMP. Benchmark testing was conducted by BDO Rewards (WA) Pty Ltd in March 2017.

18
Directors’ Report (continued) Annual Report 2017
Zenith Energy Limited
Short-term incentives (“STIs”) and Long-term incentives (“LTIs”)Incentive Options and Performance Rights Plan
Part of the remuneration paid to non-executive directors is in the form of Performance Rights issued on an annual basis under the Company’s ‘Incentive Options and Performance Rights Plan’. The purpose of the plan is to assist in the reward, retention and motivation of Eligible Participants, link the reward of Eligible Participants to performance and the creation of Shareholder value, align the interests of Eligible Participants more closely with the interests of Shareholders by providing an opportunity for Eligible Participants to receive Shares, provide Eligible Participants with the opportunity to share in any future growth in value of the Company, and provide greater incentive for Eligible Participants to focus on the Company’s shorter and longer term goals.
On 30 March 2017, under this plan, the Company issued Mr Darren Smith with 42,000 Performance Rights subject to a vesting condition of 12 months service as a Non-Executive Director from grant date. The Performance Rights cannot be exercised until the vesting condition is satisfied or is waived in accordance with the plan (at the sole discretion of the Board). If there is a change of control of the Company during the 12 months, unvested Performance Rights automatically vest on a pro rata basis reflecting the proportion of the 12 months that has passed since grant date. Once vested, the rights have a seven (7) year expiry date. The Performance Rights have a nil exercise price and on vesting, will automatically convert into one ordinary share of the Company. As at the date of this report, 29 September 2017, Ms Stephanie Unwin had not yet been issued with Performance Rights relating to her appointment.
Share Plan
The Company has an incentive share plan in place. The purpose of the plan is to assist in the reward, retention and motivation of Eligible Participants, link the reward of Eligible Participants to performance and the creation of Shareholder value, align the interests of Eligible Participants more closely with the interests of Shareholders by providing an opportunity for Eligible Participants to receive Shares, provide Eligible Participants with the opportunity to share in any future growth in value of the Company, and provide greater incentive for Eligible Participants to focus on the Company’s shorter and longer term goals.
During the financial year ended 30 June 2017, no shares were granted under the Company’s share plan.
Cash bonuses
During the financial year ended 30 June 2017, bonuses were paid to KMP prior to Zenith Energy Limited’s listing and there was no formal policy in place. The bonuses were paid at the discretion of the Board of Directors, and were based on the achievement of certain events.
The Company will seek to formalise performance measures within the framework of its remuneration policy, inclusive of performance related remuneration incentives, in addition to the incentive option and performance right and share plan currently in place.
As part of the remuneration policy, the Group will seek to emphasise reward incentives for results and continued commitment to the Group through the provision of various cash bonus reward schemes, specifically the incorporation of incentive payments based on the achievement of EBITDA targets, key performance indicators (both financial and non-financial), and continued employment with the Group. All incentive payments will be triggered for consideration where the Group returns EBITDA that meets the targets set at the commencement of each financial year. These conditions will provide management with a performance target which focuses on driving profit growth utilising existing Group resources.
In accordance with the remuneration policy, the initial hurdle for the incentive scheme is performance against forecast earnings before interest, tax, depreciation and amortisation (“EBITDA”), followed by achievement against other set KPI’s. KMP are designated into two bands – Executive – Upper, and Executive – Lower. Upper Executive KMP have the opportunity to earn 200% of their TFR for performance against targets, while Lower Executive KMP are set at a maximum of 158%. KMP paid below the market median will be given the Fixed Pay Equalisation Incentive to bring their earnings up to median on the basis of results for the relevant financial year. STIs will be paid in cash, while LTIs are paid net of withholding tax and invested into shares at payment date. The exception to this would be if KMP LTI’s contravene take-over/creep rules. The Board retains the discretion to require these LTI’s to be paid in cash, subject to vesting conditions (time based only) remaining the same (three years from year-end date). The expected cash payment for the Group in relation to Executive KMP incentives and the fixed pay equalisation amounts is $0.462 million and a non-cash LTI of $0.247 million.
19
Directors’ Report (continued) Annual Report 2017
Zenith Energy Limited
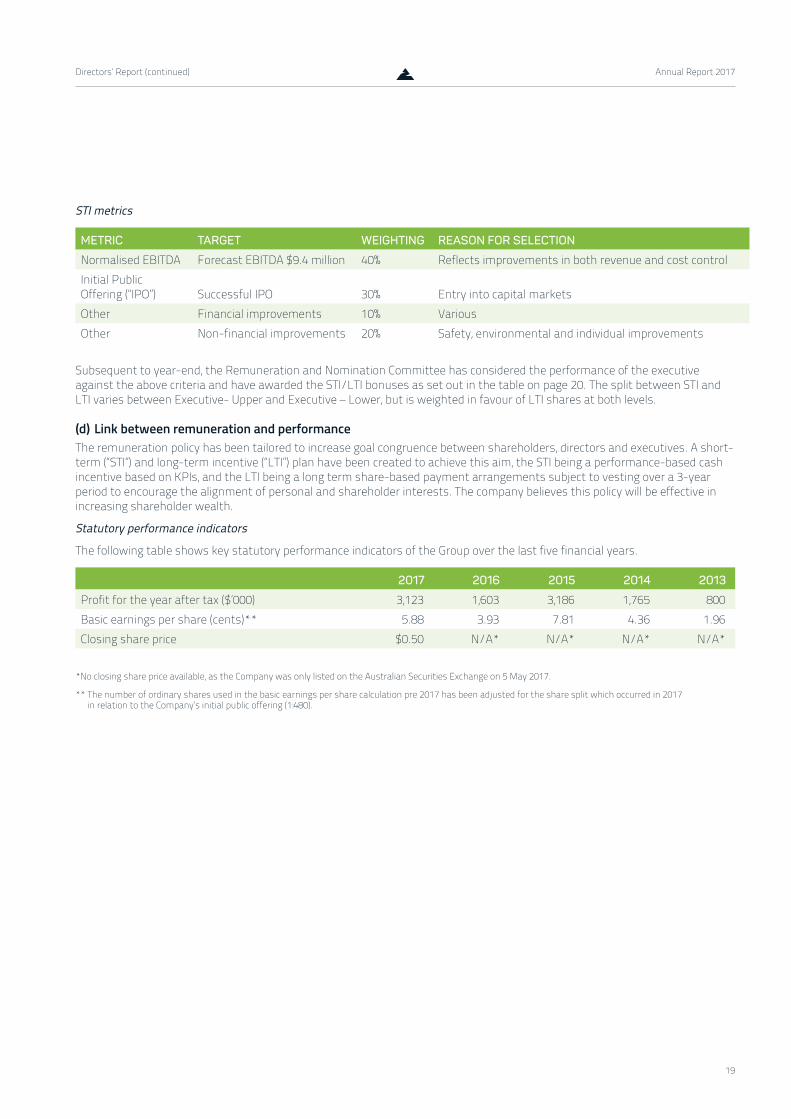
STI metrics
METRIC TARGET WEIGHTING REASON FOR SELECTION
Normalised EBITDA Forecast EBITDA $9.4 million 40% Reflects improvements in both revenue and cost controlInitial Public Offering (“IPO”) Successful IPO 30% Entry into capital markets Other Financial improvements 10% Various Other Non-financial improvements 20% Safety, environmental and individual improvements
Subsequent to year-end, the Remuneration and Nomination Committee has considered the performance of the executive against the above criteria and have awarded the STI/LTI bonuses as set out in the table on page 20. The split between STI and LTI varies between Executive- Upper and Executive – Lower, but is weighted in favour of LTI shares at both levels.
(d) Link between remuneration and performanceThe remuneration policy has been tailored to increase goal congruence between shareholders, directors and executives. A short-term (“STI”) and long-term incentive (“LTI”) plan have been created to achieve this aim, the STI being a performance-based cash incentive based on KPIs, and the LTI being a long term share-based payment arrangements subject to vesting over a 3-year period to encourage the alignment of personal and shareholder interests. The company believes this policy will be effective in increasing shareholder wealth.
Statutory performance indicators
The following table shows key statutory performance indicators of the Group over the last five financial years.
2017 2016 2015 2014 2013
Profit for the year after tax ($’000) 3,123 1,603 3,186 1,765 800Basic earnings per share (cents)** 5.88 3.93 7.81 4.36 1.96Closing share price $0.50 N/A* N/A* N/A* N/A*
*No closing share price available, as the Company was only listed on the Australian Securities Exchange on 5 May 2017.
** The number of ordinary shares used in the basic earnings per share calculation pre 2017 has been adjusted for the share split which occurred in 2017 in relation to the Company’s initial public offering (1:480).

20
Directors’ Report (continued) Annual Report 2017
Zenith Energy Limited
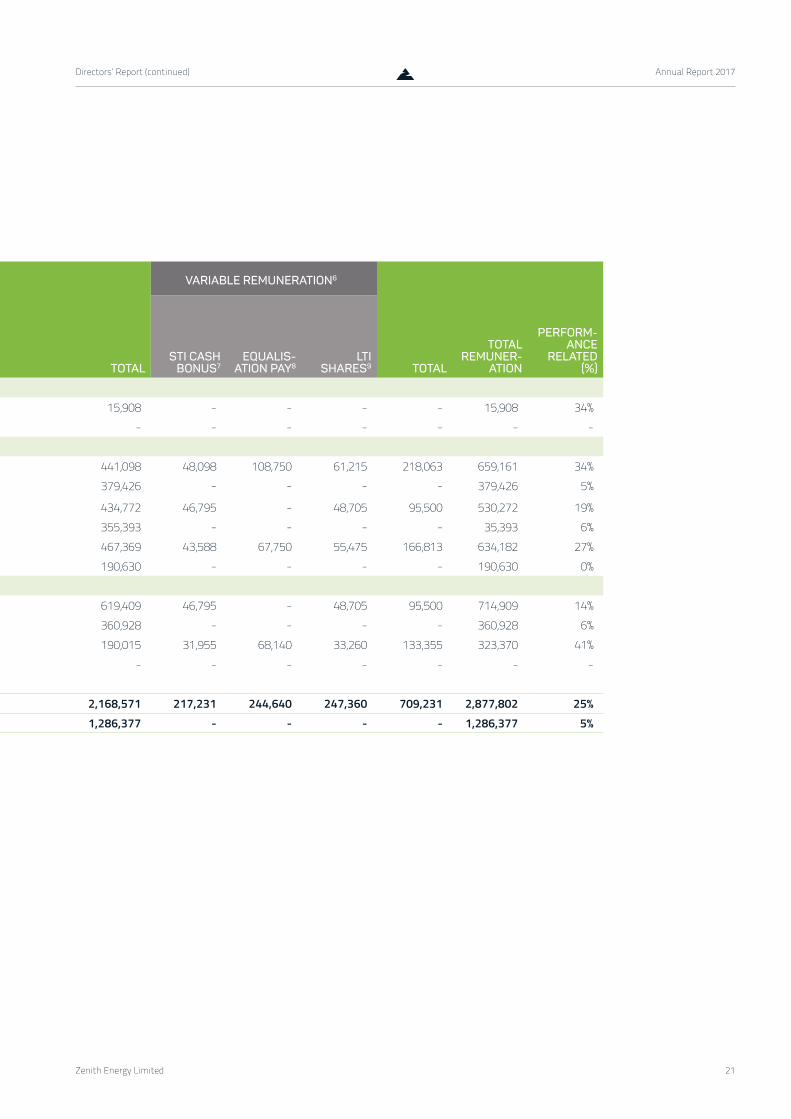
(e) Remuneration expenses for executive KMP Details of the nature and amount of each major element of remuneration of each director of the company and key management personnel for the year ended 30 June 2017 and 30 June 2016 are as follows:
KMP YEAR
FIXED REMUNERATION VARIABLE REMUNERATION
TOTAL
VARIABLE REMUNERATION6
TOTAL
TOTAL REMUNER-
ATION
PERFORM-ANCE
RELATED (%)
FIXED REMUNER-
ATION (CASH
SALARY)
NON- MONETARY BENEFITS4
LONG SERVICE
LEAVE
POST- EMPLOY-
MENT BENEFITS
(SUPERAN-NUATION)
CASH BONUS
RIGHTS TO DEFERRED
SHARES5STI CASH
BONUS7EQUALIS-
ATION PAY8LTI
SHARES9
Non-Executive DirectorsD Smith1 20173 10,500 - - - - 5,408 15,908 - - - - 15,908 34%
2016 - - - - - - - - - - - - -Executive DirectorsWD Walker 20173 330,558 - 75,852 31,688 3,000 - 441,098 48,098 108,750 61,215 218,063 659,161 34%
20162 328,648 - - 30,778 20,000 - 379,426 - - - - 379,426 5%
G Great 20173 315,033 - 83,105 30,354 6,280 - 434,772 46,795 - 48,705 95,500 530,272 19%
20162 304,560 - - 30,833 20,000 - 355,393 - - - - 35,393 6%H Moffat 20173 319,068 105,430 9,762 30,109 3,000 - 467,369 43,588 67,750 55,475 166,813 634,182 27%
20162 175,357 - - 15,273 - - 190,630 - - - - 190,630 0%OtherG Cooper (GM Projects) 20173 315,033 210,861 60,302 30,213 3,000 - 619,409 46,795 - 48,705 95,500 714,909 14%
20162 309,615 - - 31,313 20,000 - 360,928 - - - - 360,928 6%R Stringer Krein 20173 169,455 - 3,777 16,158 625 - 190,015 31,955 68,140 33,260 133,355 323,370 41%(CFO and Joint 20162 - - - - - - - - - - - - -Company Secretary)Total 2017 1,459,647 316,291 232,798 138,522 15,905 5,408 2,168,571 217,231 244,640 247,360 709,231 2,877,802 25%
2016 1,118,180 - - 108,197 60,000 - 1,286,377 - - - - 1,286,377 5%
1. D Smith was appointed a Director on 30 March 2017. This amount references three months directors’ fees payable.
2. 2016 remuneration was paid through Zenith Pacific Pty Ltd, the private company, prior to the capital restructure and subsequent listing of Zenith Energy Limited. Mr Smith and Ms Stringer-Krein were not engaged by the Group in 2016.
3. 2017 remuneration was paid through Zenith Pacific Pty Ltd from 1 July 2016 - 21 March 2017. Salaries from 22 March 2017 - 30 June 2017 were paid through Zenith Energy Limited.
4. Non-monetary benefits relate to interest, which would have been charged at an arm’s length basis over the life of the loans granted during the year. Refer to section ‘other transactions with KMP’ in the Remuneration report for further details.
5. Right to deferred shares (Performance Rights) are expensed over the vesting period. Refer to Note 25 for further details.
6. Subsequent to 30 June 2017, the Company finalised its STI and LTI remuneration policy and metrics. These amounts have not been accrued as there were no contractual obligation to issue the incentives at 30 June 2017 as it was subject to approval. The amounts have however been included in the above table as the STIs and LTIs relate to the 2017 financial year results.
7. Cash Bonus total includes short-term cash incentives relating to FY17 performance that will be paid in FY18.
8. FY17 Equalisation payment is an additional bonus to be paid to KMP to address the shortfall between their total fixed remuneration in FY17 and the salary benchmarking undertaken pre-IPO. It allows for KMP paid under the median to earn a payment up to the median on the basis that financial results are achieved.
9. Details on the LTI shares is disclosed under (c) elements of remuneration in the Remuneration Report. The value of the LTI shares is determined based on a dollar value are pre-withholding tax, and the net amount payable will be used to purchase shares on market on payment date, with a 3-year vest period. The amount shown above is for disclosure purposes only, however for accounting purposes, these amounts will be expensed over a three year vesting period.
21
Directors’ Report (continued) Annual Report 2017
Zenith Energy Limited
(e) Remuneration expenses for executive KMP Details of the nature and amount of each major element of remuneration of each director of the company and key management personnel for the year ended 30 June 2017 and 30 June 2016 are as follows:
KMP YEAR
FIXED REMUNERATION VARIABLE REMUNERATION
TOTAL
VARIABLE REMUNERATION6
TOTAL
TOTAL REMUNER-
ATION
PERFORM-ANCE
RELATED (%)
FIXED REMUNER-
ATION (CASH
SALARY)
NON- MONETARY BENEFITS4
LONG SERVICE
LEAVE
POST- EMPLOY-
MENT BENEFITS
(SUPERAN-NUATION)
CASH BONUS
RIGHTS TO DEFERRED
SHARES5STI CASH
BONUS7EQUALIS-
ATION PAY8LTI
SHARES9
Non-Executive DirectorsD Smith1 20173 10,500 - - - - 5,408 15,908 - - - - 15,908 34%
2016 - - - - - - - - - - - - -Executive DirectorsWD Walker 20173 330,558 - 75,852 31,688 3,000 - 441,098 48,098 108,750 61,215 218,063 659,161 34%
20162 328,648 - - 30,778 20,000 - 379,426 - - - - 379,426 5%
G Great 20173 315,033 - 83,105 30,354 6,280 - 434,772 46,795 - 48,705 95,500 530,272 19%
20162 304,560 - - 30,833 20,000 - 355,393 - - - - 35,393 6%H Moffat 20173 319,068 105,430 9,762 30,109 3,000 - 467,369 43,588 67,750 55,475 166,813 634,182 27%
20162 175,357 - - 15,273 - - 190,630 - - - - 190,630 0%OtherG Cooper (GM Projects) 20173 315,033 210,861 60,302 30,213 3,000 - 619,409 46,795 - 48,705 95,500 714,909 14%
20162 309,615 - - 31,313 20,000 - 360,928 - - - - 360,928 6%R Stringer Krein 20173 169,455 - 3,777 16,158 625 - 190,015 31,955 68,140 33,260 133,355 323,370 41%(CFO and Joint 20162 - - - - - - - - - - - - -Company Secretary)Total 2017 1,459,647 316,291 232,798 138,522 15,905 5,408 2,168,571 217,231 244,640 247,360 709,231 2,877,802 25%
2016 1,118,180 - - 108,197 60,000 - 1,286,377 - - - - 1,286,377 5%
1. D Smith was appointed a Director on 30 March 2017. This amount references three months directors’ fees payable.
2. 2016 remuneration was paid through Zenith Pacific Pty Ltd, the private company, prior to the capital restructure and subsequent listing of Zenith Energy Limited. Mr Smith and Ms Stringer-Krein were not engaged by the Group in 2016.
3. 2017 remuneration was paid through Zenith Pacific Pty Ltd from 1 July 2016 - 21 March 2017. Salaries from 22 March 2017 - 30 June 2017 were paid through Zenith Energy Limited.
4. Non-monetary benefits relate to interest, which would have been charged at an arm’s length basis over the life of the loans granted during the year. Refer to section ‘other transactions with KMP’ in the Remuneration report for further details.
5. Right to deferred shares (Performance Rights) are expensed over the vesting period. Refer to Note 25 for further details.
6. Subsequent to 30 June 2017, the Company finalised its STI and LTI remuneration policy and metrics. These amounts have not been accrued as there were no contractual obligation to issue the incentives at 30 June 2017 as it was subject to approval. The amounts have however been included in the above table as the STIs and LTIs relate to the 2017 financial year results.
7. Cash Bonus total includes short-term cash incentives relating to FY17 performance that will be paid in FY18.
8. FY17 Equalisation payment is an additional bonus to be paid to KMP to address the shortfall between their total fixed remuneration in FY17 and the salary benchmarking undertaken pre-IPO. It allows for KMP paid under the median to earn a payment up to the median on the basis that financial results are achieved.
9. Details on the LTI shares is disclosed under (c) elements of remuneration in the Remuneration Report. The value of the LTI shares is determined based on a dollar value are pre-withholding tax, and the net amount payable will be used to purchase shares on market on payment date, with a 3-year vest period. The amount shown above is for disclosure purposes only, however for accounting purposes, these amounts will be expensed over a three year vesting period.

22
Directors’ Report (continued) Annual Report 2017
Zenith Energy Limited
(f) Contractual arrangements for executive KMPThe following table provides employment details of persons who were, during the financial year, members of KMP of the Group.
NAME TITLETYPE OF EMPLOYMENT
CONTRACT DURATION
TERMINATION (REDUNDANCY)
PAYMENTS
TOTAL FIXED REMUNERATION
(INCLUSIVE OF 9.5% SUPER-ANNUATION)1
$
MD Walker Executive Chairman
Full-time salaried employee
No fixed date (3 month notice period)
26 week’s pay on base salary
437,250
G Great Executive Director – Operations
Full-time salaried employee
No fixed date (3 month notice period)
32 week’s pay on base salary
382,000
H Moffat Managing Director Full-time salaried employee
No fixed date (3 month notice period)
6 week’s pay on base salary
396,250
G Cooper General Manager - Projects
Full-time salaried employee
No fixed date (3 month notice period)
26 week’s pay on base salary
382,000
R Stringer-Krein Chief Financial Officer & Joint Company Secretary
Full-time salaried employee
No fixed date (3 month notice period)
4 week’s pay on base salary
260,860
The fixed remuneration detailed above reflects the most recent pay arrangements with the respective KMP (22 March 2017).
(g) Non-executive director arrangements The total annual remuneration paid to non-executive directors may not exceed the limit in the Company’s Constitution (currently $500,000) and may be varied by ordinary resolution of the Shareholders in a general meeting. The remuneration of the non-executive directors is fixed, rather than variable.
(h) Other statutory information1. Relative proportion of fixed versus variable remuneration expense
KMP NAME
FIXED REMUNERATION1 (INCLUDING SUPERANNUATION) AT RISK – STI2 AT RISK – LTI2
D Smith 2017: 66% 2016: N/A
2017: 34% 2016: N/A
2017: 0% 2016: N/A
WD Walker 2017: 67% 2016: 95%
2017: 24% 2016: 5%
2017: 9% 2016: 0%
G Great 2017: 81% 2016: 94%
2017: 10% 2016: 6%
2017: 9% 2016: 0%
H Moffat 2017: 73% 2016: 100%
2017: 18% 2016: 0%
2017: 9% 2016: 0%
G Cooper 2017: 86% 2016: 94%
2017: 7% 2016: 6%
2017: 7% 2016: 0%
R Stringer-Krein 2017: 59% 2016: N/A
2017: 31% 2016: N/A
2017: 10% 2016: N/A
1. Prior to the Company’s IPO on 5 May 2017, remuneration consisted of base salary plus possible discretionary cash bonuses only.
2. STI remuneration for 2017 related to cash bonuses and Performance Rights issued under the company’s Incentive Options and Performance Rights Plan.

23
Directors’ Report (continued) Annual Report 2017
Zenith Energy Limited
2. Details of share based compensation Performance Rights
During the current year, Mr Darren Smith was issued Performance Rights. These Performance Rights were issued under the Company’s Incentive Option and Performance Right Plan (“Plan”) and were issued as part of his appointment remuneration package.
The terms and conditions of these Performance Rights affecting remuneration in the current or a future reporting period are table below.
KMPNUMBER
ISSUEDGRANT
DATEEXERCISE
PRICEVESTING
DATE
SHARE PRICE ON
GRANT DATE
FAIR VALUE PER PERFORM-
ANCE RIGHT
TOTAL FAIR
VALUE ($) % VESTED
D Smith 42,00030 March
2017 Nil 29 March
2018 $0.50 $0.50 $21,000 -* The fair value on grate date is by reference to the Company’s initial public offering price (“IPO”), being $0.50/share.
Rights granted under the Plan carry no dividend or voting rights.
Details of Performance Rights provided as part of remuneration to KMP are shown below. The vesting conditions are set out in section (c) Elements of remuneration in the Remuneration Report. Further information on the Performance Rights is set out in note 25 to the financial statements.
Rights to deferred shares (Performance Rights)
KMPYEAR
GRANTED
BALANCE AT START OF YEARNUMBER
GRANTED DURING
YEARNUMBER
RIGHTS TO DEFERRED SHARES BALANCE AT END
OF YEAR (UNVESTED)
MAXIMUM VALUE YET
TO VEST*VESTED FORFEITED
NUMBER % NUMBER % NUMBER $
D Smith 2017 - 42,000 - - - - 42,000 15,592WD Walker - - - - - - - - -G Great - - - - - - - - -H Moffat - - - - - - - - -G Cooper - - - - - - - - -R Stringer-Krein - - - - - - - - -
* The maximum value of the deferred shares (Performance Rights) yet to vest has been determined as the amount of the grant date fair value of the rights that is yet to be expensed.
3. Engagement of Remuneration ConsultantsIndependent external advice is sought from remuneration consultants as required. Prior to the company listing on the ASX, the directors engaged BDO Reward (WA) Pty Ltd for recommendations around the development of a remuneration policy for the Group which included recommendations for the design of an incentive arrangement. BDO Reward (WA) Pty Ltd was paid $37,000 (excluding GST) for these services. No services were provided in 2016.
No other services were provided by BDO Reward (WA) Pty Ltd during the year.
The following arrangements were made to ensure that the remuneration recommendations were free from undue influence:
− BDO Reward (WA) Pty Ltd was engaged directly by the Board of directors. As the services were provided pre IPO of the company, a Remuneration and Nomination Committee was not established at that time; and
− The recommendations and report were addressed and communicated direct to the full Board of directors at that time.
As a result the directors are satisfied that the recommendations made were made free from undue influence from any members of key management personnel.
24
Directors’ Report (continued) Annual Report 2017
Zenith Energy Limited
4. Remuneration report approval at FY2017 AGM As Zenith Energy Limited was listed during the financial year 2017, the remuneration report will only be subject to approval by the members of the Company at its 2017 AGM.
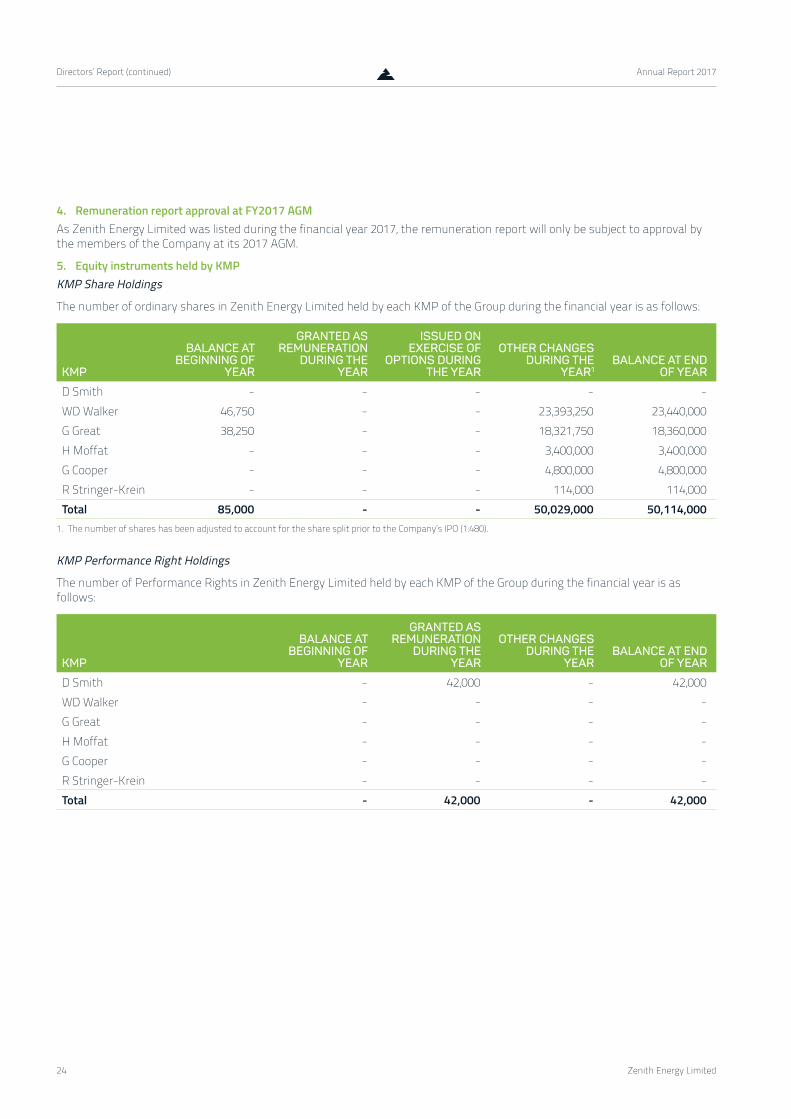
5. Equity instruments held by KMP KMP Share Holdings
The number of ordinary shares in Zenith Energy Limited held by each KMP of the Group during the financial year is as follows:
KMP
BALANCE AT BEGINNING OF
YEAR
GRANTED AS REMUNERATION
DURING THE YEAR
ISSUED ON EXERCISE OF
OPTIONS DURING THE YEAR
OTHER CHANGES DURING THE
YEAR1BALANCE AT END
OF YEAR
D Smith - - - - -WD Walker 46,750 - - 23,393,250 23,440,000 G Great 38,250 - - 18,321,750 18,360,000 H Moffat - - - 3,400,000 3,400,000 G Cooper - - - 4,800,000 4,800,000 R Stringer-Krein - - - 114,000 114,000 Total 85,000 - - 50,029,000 50,114,000
1. The number of shares has been adjusted to account for the share split prior to the Company’s IPO (1:480).
KMP Performance Right Holdings
The number of Performance Rights in Zenith Energy Limited held by each KMP of the Group during the financial year is as follows:
KMP
BALANCE AT BEGINNING OF
YEAR
GRANTED AS REMUNERATION
DURING THE YEAR
OTHER CHANGES DURING THE
YEARBALANCE AT END
OF YEAR
D Smith - 42,000 - 42,000WD Walker - - - -G Great - - - -H Moffat - - - -G Cooper - - - -R Stringer-Krein - - - -Total - 42,000 - 42,000

25
Directors’ Report (continued) Annual Report 2017
Zenith Energy Limited
6. Other transactions with key management personnelKMP Loans
Details of loans made to directors of Zenith Energy Limited and other key management personnel, are set out below.
KMP
BALANCE AT THE START OF THE
YEAR$
LOANS ISSUED DURING THE
YEAR AT FACE VALUE
$
INTEREST NOT CHARGED
$
BALANCE AT THE END OF THE YEAR
$
HIGHEST INDEBTEDNESS
DURING THE YEAR
$
H Moffat - 699,700 105,430 699,700 699,700G Cooper - 1,399,400 210,861 1,399,400 1,399,400
Following completion of the common control transaction referred to in the Directors’ Report, on (7 November 2016) loans were provided to Mr H Moffat and Mr G Cooper to fund the issue of 2,400,000 and 4,800,000 ordinary shares respectively in Zenith Energy Limited. The loans are interest free and repayment is expected within 18 months of reporting date.
The shares issued are in escrow until the loans are fully repaid.
The amounts shown for interest not charged in the table above represents the amount of interest that would have been charged on an arm’s length basis over the life of the loan.
Interest not charged has also been disclosed as another remuneration benefit received in the details of the remuneration table in (e) Remuneration expenses for executive KMP in the Remuneration Report.
No write-downs or allowances for doubtful debts loan receivables have been recognised in relation to any loans made to key management personnel.
KMP Transactions
− The Company leases its Cairns office premises from Pacific Synergy Pty Ltd ATF for Pacific Synergy Unit Trust (Pacific Synergy), an entity controlled by Mr W Walker and Mr G Great. The lease is on standard tenancy terms, with $138,000 (plus GST) per annum a in rent and no fixed term.
− The Company leases an apartment in West Perth for the benefit of its travelling employees. This lease is on standard tenancy terms through a third-party property manager, with $28,600 (plus GST) per annum in rent and a one year term (initial lease expires February 2018). The property is owned by an associate of Executive Chairman Mr W Walker.
There were no other transactions conducted between the Group and KMP or their related parties, apart from those disclosed above relating to equity, compensation and loans, that were conducted other than in accordance with normal employee, customer or supplier relationships on terms no more favourable than those reasonably expected under arm’s length dealings with unrelated persons.
End of audited remuneration report
This directors’ report, incorporating the remuneration report, is signed in accordance with a resolution of the Board of Directors:
Mr William (Doug) Walker Executive Chairman
Dated: 29 September 2017
26
Auditor’s Independence Declaration Annual Report 2017
Zenith Energy Limited
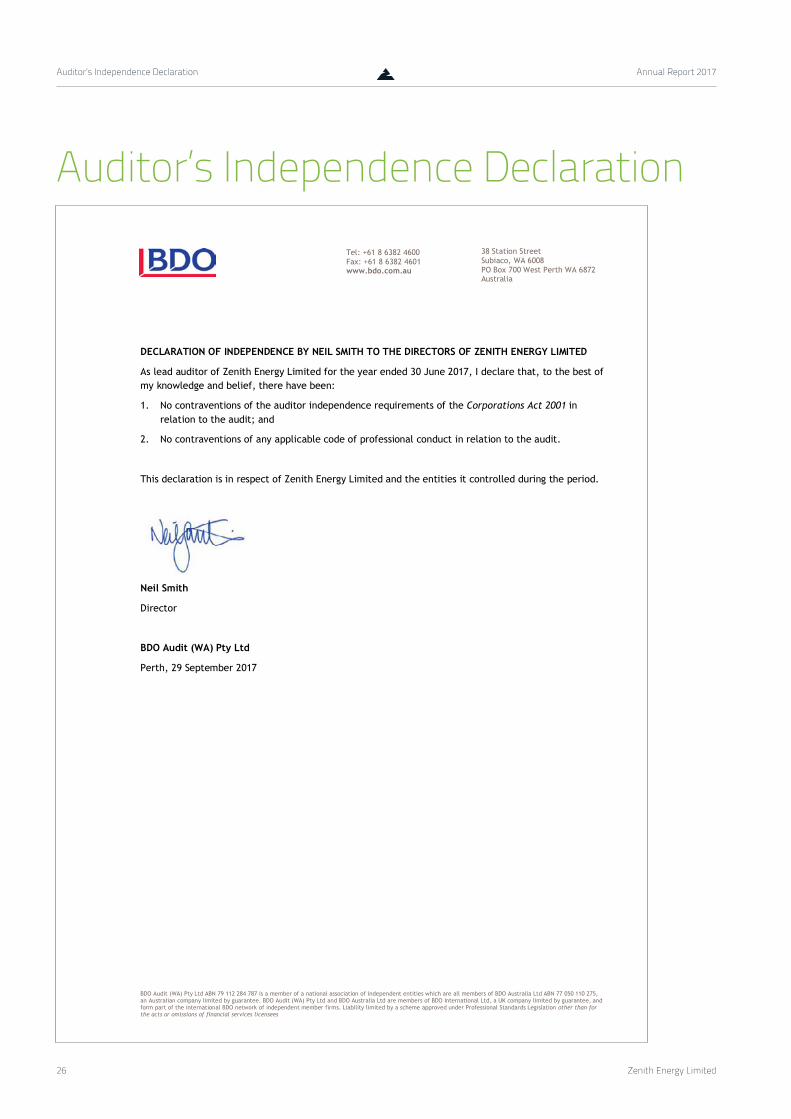
Auditor’s Independence Declaration
BDO Audit (WA) Pty Ltd ABN 79 112 284 787 is a member of a national association of independent entities which are all members of BDO Australia Ltd ABN 77 050 110 275,an Australian company limited by guarantee. BDO Audit (WA) Pty Ltd and BDO Australia Ltd are members of BDO International Ltd, a UK company limited by guarantee, andform part of the international BDO network of independent member firms. Liability limited by a scheme approved under Professional Standards Legislation other than forthe acts or omissions of financial services licensees
38 Station StreetSubiaco, WA 6008PO Box 700 West Perth WA 6872Australia
Tel: +61 8 6382 4600Fax: +61 8 6382 4601www.bdo.com.au
DECLARATION OF INDEPENDENCE BY NEIL SMITH TO THE DIRECTORS OF ZENITH ENERGY LIMITED
As lead auditor of Zenith Energy Limited for the year ended 30 June 2017, I declare that, to the best ofmy knowledge and belief, there have been:
1. No contraventions of the auditor independence requirements of the Corporations Act 2001 inrelation to the audit; and
2. No contraventions of any applicable code of professional conduct in relation to the audit.
This declaration is in respect of Zenith Energy Limited and the entities it controlled during the period.
Neil Smith
Director
BDO Audit (WA) Pty Ltd
Perth, 29 September 2017

27
Renumeration Report (continued) Annual Report 2017
Zenith Energy Limited
Financial Statements
27
28
Annual Report 2017
Zenith Energy Limited
NOTE 2017
$’0002016
$’000
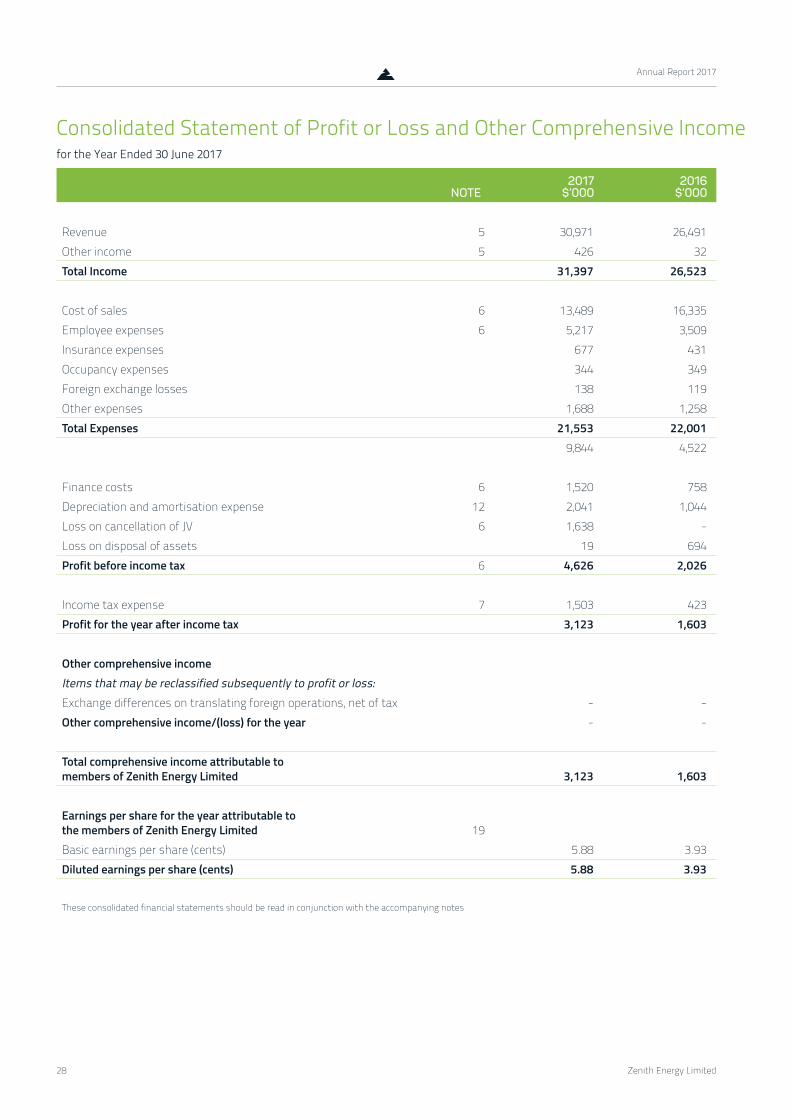
Revenue 5 30,971 26,491Other income 5 426 32Total Income 31,397 26,523
Cost of sales 6 13,489 16,335Employee expenses 6 5,217 3,509Insurance expenses 677 431Occupancy expenses 344 349Foreign exchange losses 138 119Other expenses 1,688 1,258Total Expenses 21,553 22,001
9,844 4,522
Finance costs 6 1,520 758Depreciation and amortisation expense 12 2,041 1,044Loss on cancellation of JV 6 1,638 -Loss on disposal of assets 19 694Profit before income tax 6 4,626 2,026
Income tax expense 7 1,503 423Profit for the year after income tax 3,123 1,603
Other comprehensive incomeItems that may be reclassified subsequently to profit or loss:Exchange differences on translating foreign operations, net of tax - - Other comprehensive income/(loss) for the year - -
Total comprehensive income attributable to members of Zenith Energy Limited 3,123 1,603
Earnings per share for the year attributable to the members of Zenith Energy Limited 19Basic earnings per share (cents) 5.88 3.93Diluted earnings per share (cents) 5.88 3.93
These consolidated financial statements should be read in conjunction with the accompanying notes
Consolidated Statement of Profit or Loss and Other Comprehensive Income for the Year Ended 30 June 2017
29
Annual Report 2017
Zenith Energy Limited
Consolidated Statement of Financial Position as at 30 June 2017
NOTE 2017
$’0002016
$’000
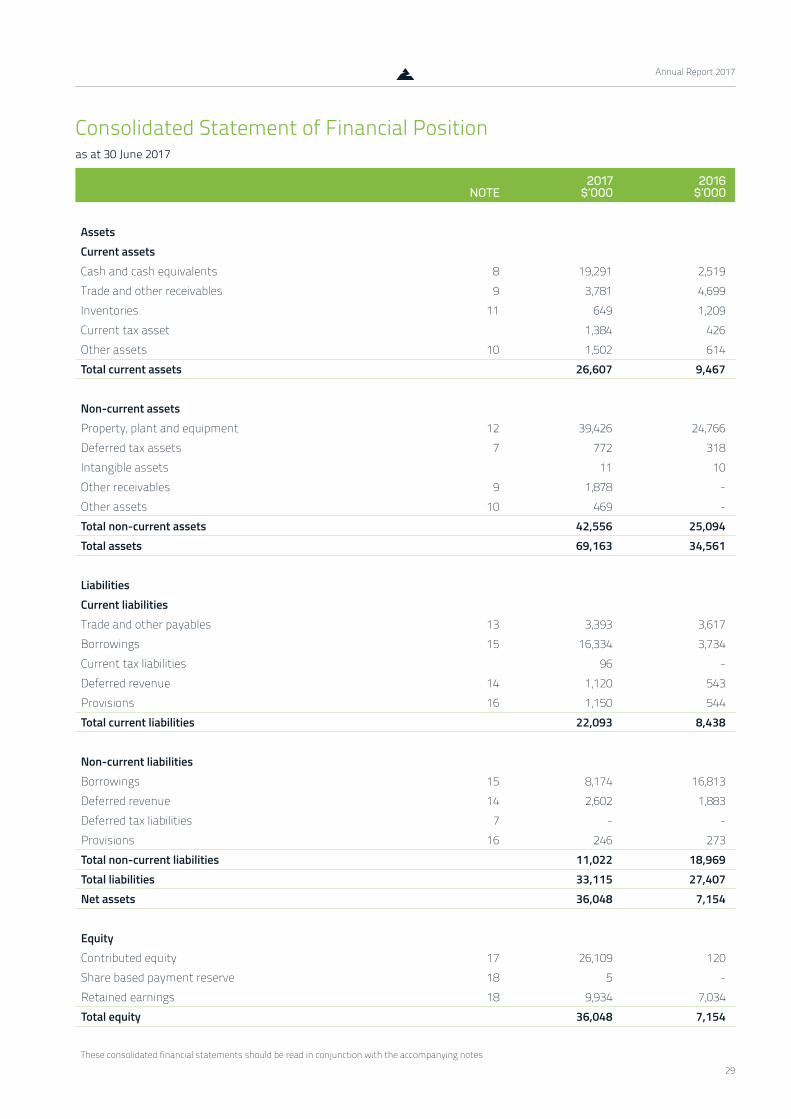
AssetsCurrent assetsCash and cash equivalents 8 19,291 2,519Trade and other receivables 9 3,781 4,699Inventories 11 649 1,209Current tax asset 1,384 426Other assets 10 1,502 614Total current assets 26,607 9,467
Non-current assetsProperty, plant and equipment 12 39,426 24,766Deferred tax assets 7 772 318Intangible assets 11 10Other receivables 9 1,878 - Other assets 10 469 - Total non-current assets 42,556 25,094Total assets 69,163 34,561
Liabilities Current liabilitiesTrade and other payables 13 3,393 3,617Borrowings 15 16,334 3,734Current tax liabilities 96 - Deferred revenue 14 1,120 543Provisions 16 1,150 544Total current liabilities 22,093 8,438
Non-current liabilities Borrowings 15 8,174 16,813Deferred revenue 14 2,602 1,883Deferred tax liabilities 7 - - Provisions 16 246 273Total non-current liabilities 11,022 18,969Total liabilities 33,115 27,407Net assets 36,048 7,154
Equity Contributed equity 17 26,109 120Share based payment reserve 18 5 - Retained earnings 18 9,934 7,034Total equity 36,048 7,154
These consolidated financial statements should be read in conjunction with the accompanying notes

30
Annual Report 2017
Zenith Energy Limited
CONTRIBUTED EQUITY
$’000
RETAINED EARNINGS
$’000
SHARE BASED
PAYMENT RESERVE
$’000
TOTAL EQUITY
$’000
Balance at 1 July 2015 120 5,431 - 5,551Total comprehensive income for the period Profit for the period - 1,603 - 1,603Total comprehensive income for the period - 1,603 - 1,603
Transactions with owners, recorded directly in equity Issue of ordinary shares, net of transaction costs and tax - - -Issue of share options - - - -Equity settled share based payment transactions - - - -Total transactions with owners - - - -Balance as at 30 June 2016 120 7,034 - 7,154
Balance at 1 July 2016 120 7,034 - 7,154Total comprehensive income for the period Profit for the period - 3,123 - 3,123Total comprehensive income for the period - 3,123 - 3,123
Transactions with owners, recorded directly in equity Issue of ordinary shares, net of transaction costs and tax 25,513 - - 25,513Tax effect on share issue costs 476 - - 476Share based payment expense - - 5 5Dividends paid - (223) - (223)Total transactions with owners 25,989 (223) 5 25,771Balance as at 30 June 2017 26,109 9,934 5 36,048
These consolidated financial statements should be read in conjunction with the accompanying notes
Consolidated Statement of Changes in Equity for the Year Ended 30 June 2017

31
Annual Report 2017
Zenith Energy Limited
NOTE 2017
$’0002016
$’000
Cash Flows from Operating Activities Receipts from customers 36,204 30,686Payments to suppliers and employees (28,481) (23,341)Interest received 7 12Borrowing costs (1,520) (758)Income tax (993) (1,835)Net cash provided by operating activities 24 5,217 4,764
Cash Flows from Investing Activities Payments of property, plant and equipment (9,518) (14,544)Proceeds on sale of property, plant and equipment - - Proceeds from related parties 8 - Loans from related parties - - Net cash used in investing activities (9,510) (14,544)
Cash Flows from Financing Activities Proceeds from issue of shares (net of transaction costs) 23,414 - Dividends (223) - Proceeds from borrowings 3,647 15,054Repayment of borrowings (5,773) (3,655)Net cash provided by financing activities 21,065 11,399Net increase in cash held 16,772 1,619Cash and cash equivalents at beginning of financial year 2,519 900Cash and cash equivalents at end of financial year 8 19,291 2,519
Non-cash financing and investing activities
During the year, the consolidated entity acquired plant and equipment and power generation assets with a fair value of $6.88 million by means of finance leases. These acquisitions are not reflected in the statement of cash flows.
In addition, shares were issued to related parties during the period ($2.099 million) which were non-cash. Refer to details in note 17 and 22.
These consolidated financial statements should be read in conjunction with the accompanying notes
Consolidated Statement of Cash Flows for the Year Ended 30 June 2017

32
Notes to the Financial Statements Annual Report 2017
Zenith Energy Limited
Notes to the Financial StatementsNote 1: Reporting Entity Zenith Energy Limited is a company limited by shares incorporated in Australia, whose shares are publicly traded on the Australian Securities Exchange. The company is a for-profit entity and the address of the company’s registered office is Level 1, 160 Stirling Highway, Nedlands WA 6009.
These consolidated financial statements and notes represent those of Zenith Energy Limited (the ‘Company’) and Controlled Entities (the “consolidated Group” or “Group”).
The separate financial statements of the parent entity, Zenith Energy Limited, have not been presented within this financial report as permitted by the Corporations Act 2001.
The financial statements were authorised for issue on 29 September 2017 by the directors of the Company.
Note 2: Basis of Preparation Statement of Compliance These financial statements are general purpose financial statements which have been prepared in accordance with the Corporations Act 2001, Accounting Standards and Interpretations, and comply with other requirements of the law. Accounting Standards include Australian Accounting Standards. Compliance with Australian Accounting Standards ensures that the financial statements and notes of the company and the Group comply with International Financial Reporting Standards (‘IFRS’).
Capital Restructure The Company was incorporated on 2 November 2016 to act as an Australian Securities Exchange (‘ASX’) listed holding company and acquired Zenith Pacific Pty Ltd. The acquisition of Zenith Pacific Pty Ltd by the company (the Capital Restructure) was not considered to be a business combination and does not result in any change of economic substance. Accordingly, following the Capital Restructure on 2 November 2016, the consolidated financial statements of the Company represent a continuation of the operations of Zenith Pacific Pty Ltd and controlled entities.
The Company and Zenith Pacific Pty Ltd and controlled entities, together form the Group. As such, the financial statements for the year ended 30 June 2017 represent the consolidated financial statement of the Group as this is the first reporting date after the Capital Restructure. The comparative amounts shown at 30 June 2016 relate to the consolidated financial statement of Zenith Pacific Pty Ltd and controlled entities.
New Standards and Interpretations for Current YearThe Group has adopted all of the new, revised or amended Accounting Standards and Interpretations issued by the Australian Accounting Standards Board (‘AASB’) that are mandatory for the current reporting period. Any new, revised or amended Accounting Standards and Interpretations that are not mandatory have not been early adopted.
Basis of MeasurementThe financial statements have been prepared under the historical cost convention, except for, where applicable, the revaluation of financial assets and liabilities at fair value through profit or loss and derivative financial instruments.
Functional and Presentation CurrencyThese consolidated financial statements are presented in Australian dollars, which is the company’s functional currency.
Rounding of AmountsThe Company is a company of the kind referred to in ASIC Instrument 2016/91, dated 1 April 2016 and in accordance with that Instrument, all financial information presented in Australian dollars has been rounded to the nearest thousand unless otherwise stated.
Use of Critical Accounting Judgements, Estimates and AssumptionsThe preparation of financial statements in conformity with AASBs requires management to make judgements, estimates and assumptions that affect the application of accounting policies and the reported amounts of assets, liabilities, income and expenses. Actual results may differ from these estimates. Estimates and underlying assumptions are reviewed on an ongoing basis. Revisions to accounting estimates are recognised in the period in which the estimate is revised and in any future periods affected. The judgements, estimates and assumptions that have a significant risk of causing a material adjustment to the carrying amounts of assets and liabilities (refer to the respective notes) within the next financial year are discussed below.

33
Notes to the Financial Statements (continued) Annual Report 2017
Zenith Energy Limited
(i) Impairment of non-current assets
Property, plant and Equipment are tested for impairment whenever events or changes in circumstances indicate that the carrying amount may not be recoverable. The Group assesses for the indicators of impairment in reference to but not limited to the following factors:
− Observable indication that the assets value has decline significantly more than would be expected as a result of passage of time or normal use;
− Significant changes with adverse effect on the entity has taken place in the technological, economic or legal environment in which the entity operates;
− Carrying of net assets of the entity is more than the market capitalisation;
− Evidence on obsolesces or physical damage of an asset; and
− Evidence from internal reporting that indicates that the economic performance of the asset is worse than expected
For the year ended 30 June 2017 no impairment indicators were identified by management which would require the recoverable amount to be determined.
(ii) Share-based payment transactions
The Group measures the cost of equity-settled transactions with employees by reference to the fair value of the equity instruments at the date at which they are granted. The fair value is determined by using the Black-Scholes option valuation model taking into account the terms and conditions upon which the instruments were granted. The accounting estimates and assumptions relating to equity-settled share-based payments would have no impact on the carrying amounts of assets and liabilities within the next annual reporting period but may impact profit or loss and equity. Refer to note 3 for the Group’s accounting policy in respect to share-based payments.
(iii) Provision for impairment of receivables
The provision for impairment of receivables assessment requires a degree of estimation and judgement. The level of provision is assessed by taking into account the specific knowledge of the individual debtors’ financial position. As at 30 June 2017, after review by the board, there was no impairment of receivables identified.
(iv) Lease classification
The Group enters into various lease agreements as part of the Group’s business strategy and operations.
The classification of whether a lease is to be accounted for as a finance or operating lease requires management’s judgement in relation to determining whether the terms of the lease transfer substantially all risks and rewards incidental to ownership of the equipment. Refer to note 3 for the Group’s accounting policy in respect to leases.
(v) Estimated useful life of property, plant and equipment
The Group estimates the useful life of property, plant and equipment based on the following factors:
− Expected usage of the asset (in reference to assets expected capacity or physical output);
− Its expected physical wear and tear;
− Technical and commercial obsolesces arising from changes and improvements in production; and
− Any legal or similar limits on the use of the asset such as expiry dates of related leases.
Refer to note 3 for the Group’s accounting policy in respect to property, plant and equipment.
(vi) Recognition of tax receivable in relation to Papua New Guinea (“PNG”) withholding tax
The Group has recognised a current tax receivable in relation to an expected credit to be received in the Group’s 2017 Australian income tax returns in relation to PNG withholding tax.
Included in the current tax asset in the statement of financial position is a receivable of $1.384 million which relates to an expected taxation credit to be received by the Group. This credit is in relation to the PNG withholding tax, of which a corresponding liability has been recognised for the amount to be paid.
The recognition of the receivable requires management’s judgement in relation to the expectation that the amount will be credited by the Australian Taxation Office.

34
Notes to the Financial Statements (continued) Annual Report 2017
Zenith Energy Limited
Note 3: Summary of Significant Accounting Policies The accounting policies set out below have been applied consistently to all periods presented in these consolidated financial statements, and have been applied consistently by Group entities.
Basis of ConsolidationSubsidiaries are entities controlled by the Group. Control exists when the Group is exposed to, or has rights to, variable returns from its involvement with the entity and has the ability to affect those returns through its power to direct the activities of the entity. The financial statements of subsidiaries are included in the consolidated financial statements from the date that control commences until the date that control ceases. The accounting policies have been changed where necessary to align them with the policies adopted by the Group.
Intra-Group balances and transactions, and any unrealised income and expenses arising from intra-Group transactions, are eliminated in preparing the consolidated financial statements. Unrealised gains arising from transactions with equity accounted investees are eliminated against the investment to the extent of the Group’s interest in the investee. Unrealised losses are eliminated in the same way as unrealised gains, but only to the extent that there is no evidence of impairment. Gains and losses are recognised when the contributed assets are consumed or sold by the equity accounted investees or, if not consumed or sold by the equity accounted investee, when the Group’s interest in such entities is disposed of.
Foreign CurrencyForeign currency transactions
Transactions in foreign currencies are translated to the functional currency ($AUD) of Group entities at exchange rates at the dates of the transactions. Monetary assets and liabilities denominated in foreign currencies at the reporting date are retranslated to Australian dollars at the foreign exchange rate at that date. The foreign currency gain or loss on monetary items is the difference between amortised cost in Australian dollars at the beginning of the period, adjusted for effective interest and payments during the period, and the amortised cost in foreign currency translated at the exchange rate at the end of the period. Non-monetary assets and liabilities denominated in foreign currencies that are measured at fair value are retranslated to Australian dollars at the exchange rate at the date that the fair value was determined.
Foreign currency differences arising on retranslation are recognised in profit or loss. Non-monetary items that are measured in terms of historical cost in a foreign currency are translated using the exchange rate at the date of the transaction.
Financial Instruments(i) Non-derivative financial assets
The Group has the following non-derivative financial assets: receivables and cash and cash equivalents.
Receivables
Trade receivables are recognised initially at fair value and subsequently measured at amortised cost using the effective interest rate method.
Collectability of trade receivables is assessed on an ongoing basis. Debts which are known to be uncollectable are written off.
An allowance is made for doubtful debts where there is objective evidence that the Group will not be able to collect all amounts due.
Cash and cash equivalents
Cash and cash equivalents comprise cash balances and call deposits with original maturities of three months or less. Restricted cash balances are reflected as non-current assets on the statement of financial position.
(ii) Non-derivative financial liabilities
The Group has the following non-derivative financial liabilities: borrowings and trade and other payables.
Borrowings
Borrowings are initially recognised at fair value, net of transaction costs incurred. Borrowings are subsequently measured at amortised cost. Any difference between the proceeds (net of transaction costs) and the redemption amount is recognised in profit or loss over the period of the borrowings using the effective interest method. Fees paid on the establishment of loan facilities are recognised as transaction costs of the loan to the extent that it is probable that some or all of the facility will be drawn down. In this case, the fee is deferred until the draw down occurs. To the extent there is no evidence that it is probable that some or all of the facility will be drawn down, the fee is capitalised as a prepayment for liquidity services and amortised over the period of the facility to which it relates.
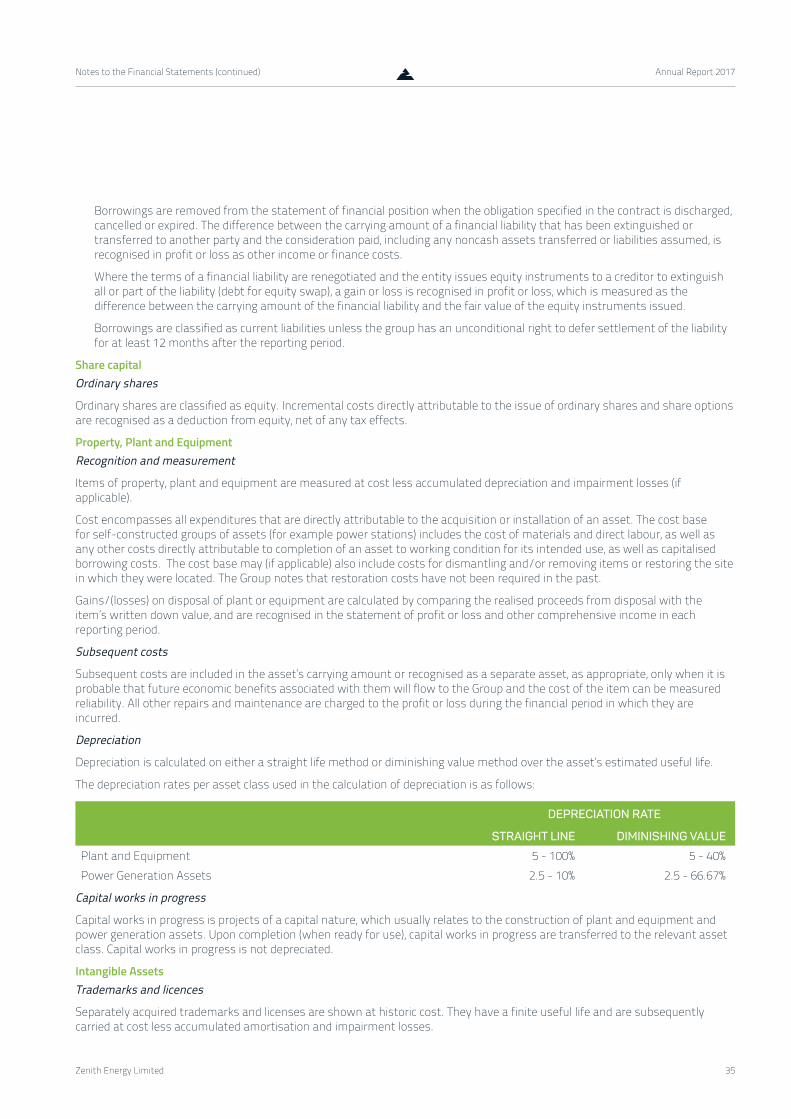
35
Notes to the Financial Statements (continued) Annual Report 2017
Zenith Energy Limited
Borrowings are removed from the statement of financial position when the obligation specified in the contract is discharged, cancelled or expired. The difference between the carrying amount of a financial liability that has been extinguished or transferred to another party and the consideration paid, including any noncash assets transferred or liabilities assumed, is recognised in profit or loss as other income or finance costs.
Where the terms of a financial liability are renegotiated and the entity issues equity instruments to a creditor to extinguish all or part of the liability (debt for equity swap), a gain or loss is recognised in profit or loss, which is measured as the difference between the carrying amount of the financial liability and the fair value of the equity instruments issued.
Borrowings are classified as current liabilities unless the group has an unconditional right to defer settlement of the liability for at least 12 months after the reporting period.
Share capitalOrdinary shares
Ordinary shares are classified as equity. Incremental costs directly attributable to the issue of ordinary shares and share options are recognised as a deduction from equity, net of any tax effects.
Property, Plant and EquipmentRecognition and measurement
Items of property, plant and equipment are measured at cost less accumulated depreciation and impairment losses (if applicable).
Cost encompasses all expenditures that are directly attributable to the acquisition or installation of an asset. The cost base for self-constructed groups of assets (for example power stations) includes the cost of materials and direct labour, as well as any other costs directly attributable to completion of an asset to working condition for its intended use, as well as capitalised borrowing costs. The cost base may (if applicable) also include costs for dismantling and/or removing items or restoring the site in which they were located. The Group notes that restoration costs have not been required in the past.
Gains/(losses) on disposal of plant or equipment are calculated by comparing the realised proceeds from disposal with the item’s written down value, and are recognised in the statement of profit or loss and other comprehensive income in each reporting period.
Subsequent costs
Subsequent costs are included in the asset’s carrying amount or recognised as a separate asset, as appropriate, only when it is probable that future economic benefits associated with them will flow to the Group and the cost of the item can be measured reliability. All other repairs and maintenance are charged to the profit or loss during the financial period in which they are incurred.
Depreciation
Depreciation is calculated on either a straight life method or diminishing value method over the asset’s estimated useful life.
The depreciation rates per asset class used in the calculation of depreciation is as follows:
DEPRECIATION RATE
STRAIGHT LINE DIMINISHING VALUE
Plant and Equipment 5 - 100% 5 - 40%Power Generation Assets 2.5 - 10% 2.5 - 66.67%
Capital works in progress
Capital works in progress is projects of a capital nature, which usually relates to the construction of plant and equipment and power generation assets. Upon completion (when ready for use), capital works in progress are transferred to the relevant asset class. Capital works in progress is not depreciated.
Intangible AssetsTrademarks and licences
Separately acquired trademarks and licenses are shown at historic cost. They have a finite useful life and are subsequently carried at cost less accumulated amortisation and impairment losses.
36
Notes to the Financial Statements (continued) Annual Report 2017
Zenith Energy Limited
Leased AssetsLeases of property, plant and equipment where the group, as lessee, has substantially all the risks and rewards of ownership are classified as finance leases (note 15).
Finance leases are capitalised at the lease’s inception at the fair value of the leased property or, if lower, the present value of the minimum lease payments. The corresponding rental obligations, net of finance charges, are included in other short-term and long-term payables. Each lease payment is allocated between the liability and finance cost. The finance cost is charged to the profit or loss over the lease period so as to produce a constant periodic rate of interest on the remaining balance of the liability for each period. The property, plant and equipment acquired under finance leases is depreciated over the asset’s useful life or over the shorter of the asset’s useful life and the lease term if there is no reasonable certainty that the Group will obtain ownership at the end of the lease term.
Leases in which a significant portion of the risks and rewards of ownership are not transferred to the group as lessee are classified as operating leases (note 27). Payments made under operating leases (net of any incentives received from the lessor) are charged to profit or loss on a straight-line basis over the period of the lease.
Lease income from operating leases where the Group is a lessor is recognised in income on a straight-line basis over the lease term. The respective leased assets are included in the statement of financial position based on their nature.
InventoriesInventories are stated at the lower of cost and net realisable value. Cost comprises all direct materials, direct labour and an appropriate portion of variable and fixed overheads. Fixed overheads are allocated on the basis of normal operating capacity. Costs are assigned to inventories using the first-in-first-out basis. Net realisable value is the estimated selling price in the ordinary course of business, less the estimated selling cost of completion and selling expenses.
Borrowing CostsGeneral and specific borrowing costs that are directly attributable to the acquisition, construction or production of a qualifying asset are capitalised during the period of time that is required to complete and prepare the asset for its intended use or sale. Qualifying assets are assets that necessarily take a substantial period of time to get ready for their intended use or sale.
Other borrowing costs are expensed in the financial period in which they are incurred.
Impairment(i) Financial assets including receivables
A financial asset not carried at fair value through profit or loss is assessed at each reporting date to determine whether there is any objective evidence that it is impaired. A financial asset is impaired if objective evidence indicates that a loss event has occurred after the initial recognition of the asset, and that the loss event had a negative effect on the estimated future cash flows of that asset and can be estimated reliably.
Objective evidence that financial assets (including equity securities) are impaired can include default or delinquency by a debtor, restructuring of an amount due to the Group on terms that the Group would not consider otherwise, indications that a debtor or issuer will enter bankruptcy, the disappearance of an active market for a security. In addition, for an investment in an equity security, a significant or prolonged decline in its fair value below its cost is objective evidence of impairment.
The Group considers evidence of impairment for receivables at both a specific asset and collective level. All individually significant receivables are assessed for specific impairment. Receivables that are not individually significant are collectively assessed for impairment by grouping together receivables with similar risk characteristics. In assessing collective impairment, the Group uses historical trends of the probability of default, timing of recoveries and the amount of loss incurred, adjusted for management’s judgement as to whether current economic and credit conditions are such that the actual losses are likely to be greater or less than suggested by historical trends.
An impairment loss in respect of a financial asset measured at amortised cost is calculated as the difference between its carrying amount and the present value of the estimated future cash flows discounted at the asset’s original effective interest rate. Losses are recognised in profit or loss and reflected in an allowance account against receivables. Interest on the impaired asset continues to be recognised through the unwinding of the discount. When a subsequent event causes the amount of impairment loss to decrease, the decrease in impairment loss is reversed through profit or loss.
37
Notes to the Financial Statements (continued) Annual Report 2017
Zenith Energy Limited
(ii) Non-financial assets
The carrying amounts of the Group’s non-financial assets, other than inventories and deferred tax assets, are reviewed at each reporting date to determine whether there is any indication of impairment. If any such impairment exists, then the asset’s recoverable amount is estimated.
The recoverable amount of an asset or cash-generating unit is the greater of its value in use and its fair value less costs to sell. In assessing value in use, the estimated future cash flows are discounted to their present value using a pre-tax discount rate that reflects current market assessments of the time value of money and risks specific to the asset. For the purpose of impairment testing, assets that cannot be tested individually are grouped together into the smallest Group of assets that generates cash inflows from continuing use that are largely independent of the cash inflows of other assets or Groups of assets (“the cash-generating unit” (“CGU”)).
The Group’s corporate assets do not generate separate cash inflows. If there is an indication that a corporate asset may be impaired, then the recoverable amount is determined for the CGU to which the corporate asset belongs. An impairment loss is recognised if the carrying amount of an asset or its CGU exceeds its estimated recoverable amount.
Impairment losses are recognised in profit or loss.
Impairment losses recognised in prior periods are assessed at each reporting date for any indications that the loss has decreased or no longer exists. An impairment loss is reversed if there has been a change in the estimates used to determine the recoverable amount. An impairment loss is reversed only to the extent that the asset’s carrying amount does not exceed the carrying amount that would have been determined, net of depreciation or amortisation, if no impairment loss had been recognised.
Employee Benefits(i) Short-term benefits
Short-term employee benefit obligations are those benefits expected to be settled within 12 months of the reporting date. They are recognised in current liabilities in respect of employees’ services up to the reporting date and are measured at the amounts expected to be paid when the liabilities are settled.
(ii) Other long-term employee benefits
The Group’s net obligation in respect of long-term employee benefits are those not expected to be settled within 12 months of the reporting date and are recognised in non-current liabilities, provided there is an unconditional right to defer settlement of the liability. The liability is measured at the present value of expected future payments to be made in respect of services provided by employees up to the reporting date.
In calculating the present value of future cash flows in respect of long service leave, the probability of long service leave being taken is based on historical data.
(iii) Share-based payment transactions
The Group operates an employee share plan and a director and employee incentive option and Performance Rights plan. The grant date fair value of equity instruments granted to employees is recognised as an employee expense, with a corresponding increase in equity, over the period that the employees and directors become unconditionally entitled to the equity instrument. The amount recognised as an expense is adjusted to reflect the number of equity instruments for which the related service and non-market vesting conditions are expected to be met, such that the amount ultimately recognised as an expense is based on the number of equity instruments that do not meet the related service and non-market performance conditions at the vesting date. For equity instruments with non-vesting conditions, the grant date fair value of the equity instruments is measured to reflect such conditions and there is no true-up for differences between expected and actual outcomes. When the company grants equity instruments to employees of subsidiaries, the fair value at grant date is recognised as a receivable from subsidiaries, with a corresponding increase in equity over the vesting period of the grant.
(iv) Provisions
A provision is recognised if, as a result of a past event, the Group has a present legal or constructive obligation that can be estimated reliably, and it is probable that an outflow of economic benefits will be required to settle the obligation.
Provisions are determined by discounting the expected future cash flows at a pre-tax rate that reflects current market assessments of the time value of money and the risks specific to the liability. The unwinding of the discount is recognised as a finance cost.

38
Notes to the Financial Statements (continued) Annual Report 2017
Zenith Energy Limited
RevenueSale of electricity supply
Revenue from the sale of electricity is recognised and measured at the fair value of the consideration received or receivable to the extent it is probable that the economic benefits will flow to the Group and the revenue can be reliably measured. Any revenue received from a customer, for which the goods and/or services are yet to be provided are recognised as deferred income and recognised over the period in which the goods and services are expected to be provided to the customer.
Revenue from electricity supply is recognised when the electricity has been delivered to the customer based on fixed charges and electricity consumed.
Sale of constructed goods
Revenue from the sale of constructed goods is recognised the outcome of a construction contract can be estimated reliably. Contract revenue and contract costs associated with the construction contract are be recognised as revenue and expenses respectively by reference to the stage of completion of the contract activity at the end of the reporting period.
In the case of a fixed price contract, the Group determines that a construction contract can be estimated reliably when both the contract costs to complete the contract and the stage of contract completion at the end of the reporting period can be measured reliably, and the contract costs attributable to the contract can be clearly identified and measured so that actual contract costs incurred can be compared with prior estimates. This estimation takes the form of comparing revenues agreed for achieved milestones by the client with purchase requisitions, purchase orders, and invoices already received to determine a fair value of percentage complete.
Other IncomeIncome from the provision of services, and from penalties received under customer/supplier contracts, is recognised and measured at the fair value of the consideration received or receivable to the extent it is probable that the economic benefits will flow to the consolidated entity and it can be reliably measured.
Lease PaymentsPayments made under operating leases are recognised in profit or loss on a straight-line basis over the term of the lease. Lease incentives received are recognised as an integral part of the total lease expense over the term of the lease.
Minimum lease payments made under finance leases are apportioned between the finance expense and the reduction of the outstanding liability. The finance expense is allocated to each period during the lease term so as to produce a constant periodic rate of interest on the remaining balance of the liability.
Goods and Services TaxRevenue, expenses and assets are recognised net of the amount of goods and services tax (GST), except where the amount of GST incurred is not recoverable from the taxation authority. In these circumstances, the GST is recognised as part of the cost of acquisition of the asset or as part of the expense. Receivables and payables are stated with the amount of GST included. The net amount of GST recoverable from, or payable to, the Australian Taxation Office (ATO) is included as a current asset or liability in the Statement of financial position.
Cash flows are included in the statement of cash flows on a gross basis. The GST components of cash flows arising from investing and financing activities which are recoverable from, or payable to, the ATO are classified as operating cash flows.
39
Notes to the Financial Statements (continued) Annual Report 2017
Zenith Energy Limited
Income tax The income tax expense or credit for the period is the tax payable on the current period’s taxable income based on the applicable income tax rate for each jurisdiction adjusted by changes in deferred tax assets and liabilities attributable to temporary differences and to unused tax losses.
The current income tax charge is calculated on the basis of the tax laws enacted or substantively enacted at the end of the reporting period in the countries where the Company’s subsidiaries and associates operate and generate taxable income. Management periodically evaluates positions taken in tax returns with respect to situations in which applicable tax regulation is subject to interpretation. It establishes provisions where appropriate on the basis of amounts expected to be paid to the tax authorities.
Deferred income tax is provided in full, using the liability method, on temporary differences arising between the tax bases of assets and liabilities and their carrying amounts in the consolidated financial statements. However, deferred tax liabilities are not recognised if they arise from the initial recognition of goodwill. Deferred income tax is also not accounted for if it arises from initial recognition of an asset or liability in a transaction other than a business combination that at the time of the transaction affects neither accounting nor taxable profit or loss. Deferred income tax is determined using tax rates (and laws) that have been enacted or substantially enacted by the end of the reporting period and are expected to apply when the related deferred income tax asset is realised or the deferred income tax liability is settled.
Deferred tax assets are recognised only if it is probable that future taxable amounts will be available to utilise those temporary differences and losses.
Deferred tax assets and liabilities are offset when there is a legally enforceable right to offset current tax assets and liabilities and when the deferred tax balances relate to the same taxation authority. Current tax assets and tax liabilities are offset where the entity has a legally enforceable right to offset and intends either to settle on a net basis, or to realise the asset and settle the liability simultaneously.
Current and deferred tax is recognised in profit or loss, except to the extent that it relates to items recognised in other comprehensive income or directly in equity. In this case, the tax is also recognised in other comprehensive income or directly in equity, respectively.
Tax consolidation
The Company and its wholly-owned Australian resident entities are part of a tax-consolidated group. As a consequence, all members of the tax-consolidated group are taxed as a single entity from that date. The head entity within the tax- consolidated group is Zenith Energy Limited.
Current tax expense/income, deferred tax liabilities and deferred tax assets arising from temporary differences of the members of the tax-consolidated group are recognised in the separate financial statements of the members of the tax- consolidated group using the “separate taxpayer within group” approach by reference to the carrying amounts of assets and liabilities in the separate financial statements of each entity and the tax values applying under tax consolidation.
Any current tax liabilities (or assets) and deferred tax assets arising from unused tax losses of the subsidiaries are assumed by the head entity in the tax-consolidated group and are recognised by the Company as amounts payable (receivable) to/(from) other entities in the tax-consolidated group in conjunction with any tax funding arrangement amounts (refer below). Any difference between these amounts is recognised by the Company as an equity contribution or distribution.
The Company recognises deferred tax assets arising from unused tax losses of the tax-consolidated group to the extent that it is probable that future taxable profits of the tax-consolidated group will be available against which the asset can be utilised.
Any subsequent period adjustments to deferred tax assets arising from unused tax losses as a result of revised assessments of the probability of recoverability is recognised by the head entity only.
Earnings per ShareThe Group presents basic and diluted earnings per share (EPS) data for its ordinary shares. Basic EPS is calculated by dividing the profit or loss attributable to ordinary shareholders of the company by the weighted average number of ordinary shares outstanding during the period. Diluted EPS is determined by adjusting the profit or loss attributable to ordinary shareholders and the weighted average number of ordinary shares outstanding for the effects of all dilutive potential ordinary shares.
40
Notes to the Financial Statements (continued) Annual Report 2017
Zenith Energy Limited
DividendsProvision is made for the amount of any dividend declared, being appropriately authorised and no longer at the discretion of the entity, on or before the end of the reporting period but not distributed at the end of the reporting period.
Operating SegmentsOperating segments are presented using the ‘management approach’, where the information presented is on the same basis as the internal reports provided to the Chief Operating Decision Maker (“CODM”). The CODM is responsible for the allocation of resources to operating segments and assessing their performance.
An operating segment is a component of the Group that engages in business activities from which it may earn revenues and incur expenses, including revenues and expenses that relate to transactions with any of the Group’s other components.
Segment results that are reported to the CODM include items directly attributable to a segment as well as those that can be allocated on a reasonable basis. Unallocated items comprise mainly investments (other than investment property) and related revenue, loans and borrowings and related expenses, corporate assets (primarily the company’s headquarters) and head office expenses, and income tax assets and liabilities.
Segment capital expenditure is the total cost incurred during the period to acquire non-current assets, other than deferred tax assets and financial assets.
New Standards and Interpretations Not Yet AdoptedThe AASB has issued new and amended Accounting Standards and Interpretations that have mandatory application date or future reporting periods and which the Group has decided not to early adopt. A discussion of those future requirements and their impact on the Group is as follows:
AASB 9: Financial Instruments
Applicable to annual reporting periods beginning on or after 1 January 2018.
The Standard will be applicable retrospectively (subject to the provisions on hedge accounting outlined below) and includes revised requirements for the classification and measurement of financial instruments, revised recognition and derecognition requirements for financial instruments and simplified requirements for hedge accounting.
The key changes that may affect the Group on initial application include certain simplifications to the classification of financial assets, simplifications to the accounting of embedded derivatives, upfront accounting for expected credit loss, and the irrevocable election to recognise gains and losses on investments in equity instruments that are not held for trading in other comprehensive income. AASB 9 also introduces a new model for hedge accounting that will allow greater flexibility in the ability to hedge risk, particularly with respect to hedges of non-financial items. Should the entity elect to change its hedge policies in line with the new hedge accounting requirements of the Standard, the application of such accounting would be largely prospective.
Zenith Energy Limited is in the process of conducting an impact assessment on the implications of the new Standard on its operations.
AASB 15: Revenue from Contracts with Customers
Applicable to annual reporting periods beginning on or after 1 January 2018.
When effective, this Standard will replace the current accounting requirements applicable to revenue with a single, principles-based model. Except for a limited number of exceptions, including leases, the new revenue model in AASB 15 will apply to all contracts with customers as well as non-monetary exchanges between entities in the same line of business to facilitate sales to customers and potential customers.
The core principle of the Standard is that an entity will recognise revenue to depict the transfer of promised goods or services to customers in an amount that reflects the consideration to which the entity expects to be entitled in exchange for the goods or services. To achieve this objective, AASB 15 provides the following five-step process:
i. identify the contract(s) with a customer;
ii. identify the performance obligations in the contract(s);
iii. determine the transaction price;
iv. allocate the transaction price to the performance obligations in the contract(s); and
v. recognise revenue when (or as) the performance obligations are satisfied.

41
Notes to the Financial Statements (continued) Annual Report 2017
Zenith Energy Limited
The transitional provisions of this Standard permit an entity to either: restate the contracts that existed in each prior period presented per AASB 108: Accounting Policies, Changes in Accounting Estimates and Errors (subject to certain practical expedients in AASB 15); or recognise the cumulative effect of retrospective application to incomplete contracts on the date of initial application. There are also enhanced disclosure requirements regarding revenue.
Zenith Energy Limited is in the process of conducting an impact assessment on the implications of the new Standard on its operations.
AASB 16: Leases
Applicable to annual reporting periods beginning on or after 1 January 2019.
When effective, this Standard will replace the current accounting requirements applicable to leases in AASB 117: Leases and related Interpretations. AASB 16 introduces a single lessee accounting model that eliminates the requirement for leases to be classified as operating or finance leases.
The main changes introduced by the new Standard include:
i. r ecognition of a right-to-use asset and liability for all leases (excluding short-term leases with less than 12 months of tenure and leases relating to low-value assets);
ii. depreciation of right-to-use assets in line with AASB 116: Property, Plant and Equipment in profit or loss and unwinding of the liability in principal and interest components;
iii. variable lease payments that depend on an index or a rate are included in the initial measurement of the lease liability using the index or rate at the commencement date;
iv. by applying a practical expedient, a lessee is permitted to elect not to separate non-lease components and instead account for all components as a lease; and
v. additional disclosure requirements.
The transitional provisions of AASB 16 allow a lessee to either retrospectively apply the Standard to comparatives in line with AASB 108 or recognise the cumulative effect of retrospective application as an adjustment to opening equity on the date of initial application.
Zenith Energy Limited is in the process of conducting an impact assessment on the implications of the new Standard on its operations.
Note 4: Operating Segments General Informationa) Identification of reportable segments
The Group has identified its operating segments based on the internal reports that are reviewed and used by the Board of Directors (chief operating decision makers) in assessing performance and determining the allocation of resources.
The Group is managed primarily on the basis of revenue stream, as the diversification of the Group’s operations inherently have notably different performance assessment criteria. Operating segments are therefore determined on the same basis.
Unless stated otherwise, all amounts reported to the Board of Directors, being the chief operating decision makers with respect to operating segments, are determined in accordance with accounting policies that are consistent with those adopted in the annual financial statements of the Group.
Reportable segments disclosed are based on aggregating operating segments where the segments are considered to have similar economic characteristics and are also similar with respect to the following:
− the products sold and/or services provided by the segment;
− the type or class of customer for the products or services;
− the distribution method; and
− any external regulatory requirements.

42
Notes to the Financial Statements (continued) Annual Report 2017
Zenith Energy Limited
b) Types of products and services by segment
BOO Revenue
Where revenue is produced by operating the Group’s assets under a PPA. Under BOO Revenue, supply, project and sales revenue is recognised.
BOO products and services are provided in Australia.
ZPPL/MOM Revenue
Where the revenue is produced by operating a client’s assets under a Manage, Operate, Maintain agreement. Under MOM Revenue, supply, project and sales revenue is recognised. The ZPPL also contains Engineer, Procure, Construct revenues, and head office administrative costs. MOM products and services are provided in Australia and Papua New Guinea.
30 JUNE 2017 STATUTORY FINANCIAL PERFORMANCE ANALYSIS
ZPPL$’000
BOO$’000
OTHER$’000
TOTAL$’000
External sales 8,909 22,062 - 30,971 Intersegment sales - - - - Interest revenue 4 - 98 102Total segment revenue 8,913 22,062 98 31,073
Reconciliation of segment revenue to Group revenue Other income 211 113 - 324 Intersegment elimination - - - - Total group revenue 9,124 22,175 98 31,397 Segment EBITDA before unusual items 3,535 7,238 (929) 9,844
- Depreciation and amortisation 190 1,851 - 2,041 - Loss on Disposal of Assets 19 - - 19- Finance costs 183 1,337 - 1,520 - Dissolution of JV 1,638 - - 1,638Profit/ (loss) before income tax 1,505 4,050 (929) 4,626Income tax expense (1,503)Profit after income tax 3,123
30 JUNE 2017 STATUTORY FINANCIAL POSITION ANALYSIS
ZPPL$’000
BOO$’000
OTHER$’000
TOTAL$’000
Segment assets 8,422 40,334 20,407 69,163
Total consolidated assets 69,163
Segment liabilities 3,915 28,549 651 33,115Total consolidated liabilities 33,115
Segment assets include: Deferred tax assets 250 21 501 772

43
Notes to the Financial Statements (continued) Annual Report 2017
Zenith Energy Limited
30 JUNE 2016 STATUTORY FINANCIAL PERFORMANCE ANALYSIS
ZPPL$’000
BOO$’000
OTHER$’000
TOTAL$’000
External sales 9,918 16,573 - 26,491Intersegment sales - - - -Interest revenue 12 20 - 32Total segment revenue 9,930 16,593 - 26,523
Reconciliation of segment revenue to Group revenue Other income - - - -Intersegment elimination - - - -Total group revenue 9,930 16,593 - 26,523
Segment EBITDA before unusal items 1,121 3,477 - 4,598- Depreciation and amortisation 134 910 - 1,044- Finance costs 129 704 - 833- Loss on disposal of assets - 694 - 694Profit/ (loss) before income tax 858 1,168 - 2,026Income tax expense (423)Profit after income tax 1,603
30 JUNE 2016STATUTORY FINANCIAL POSITION ANALYSIS
ZPPL$’000
BOO$’000
OTHER$’000
TOTAL$’000
Segment assets 9,531 25,030 - 34,561Total consolidated assets 34,561
Segment liabilities 6,052 21,354 - 27,407Total consolidated liabilities 27,407
Segment assets include: Deferred tax assets 269 - 49 318
REVENUE BY GEOGRAPHIC REGION2017
$’0002016
$’000
Revenue attributable to external customers is disclosed below, based on the location of the external customer:Australia 25,324 23,405Papua New Guinea 5,647 3,056Total Revenue 30,971 26,491

44
Notes to the Financial Statements (continued) Annual Report 2017
Zenith Energy Limited
ASSETS BY GEOGRAPHIC REGION2017
$’0002016
$’000
The location of segment asset by geographic location of the assets is disclosed below:Australia 68,800 33,846Papua New Guinea 393 715Total Assets 69,193 34,561
Major customers
Revenues from our 10 customers in the BOO segment represents approximately 71% of the Group’s total revenues.
Note 5: Revenue and Other Income
2017$’000
2016$’000
Revenue from continuing operationsRevenue:– Supply charges 12,842 14,329– Project revenue 3,153 7,959– Sales revenue 14,976 4,203
30,971 26,491Other income:– Rental revenue - - – Royalties - - – Other revenue 426 32
426 32Total revenue 31,397 26,523
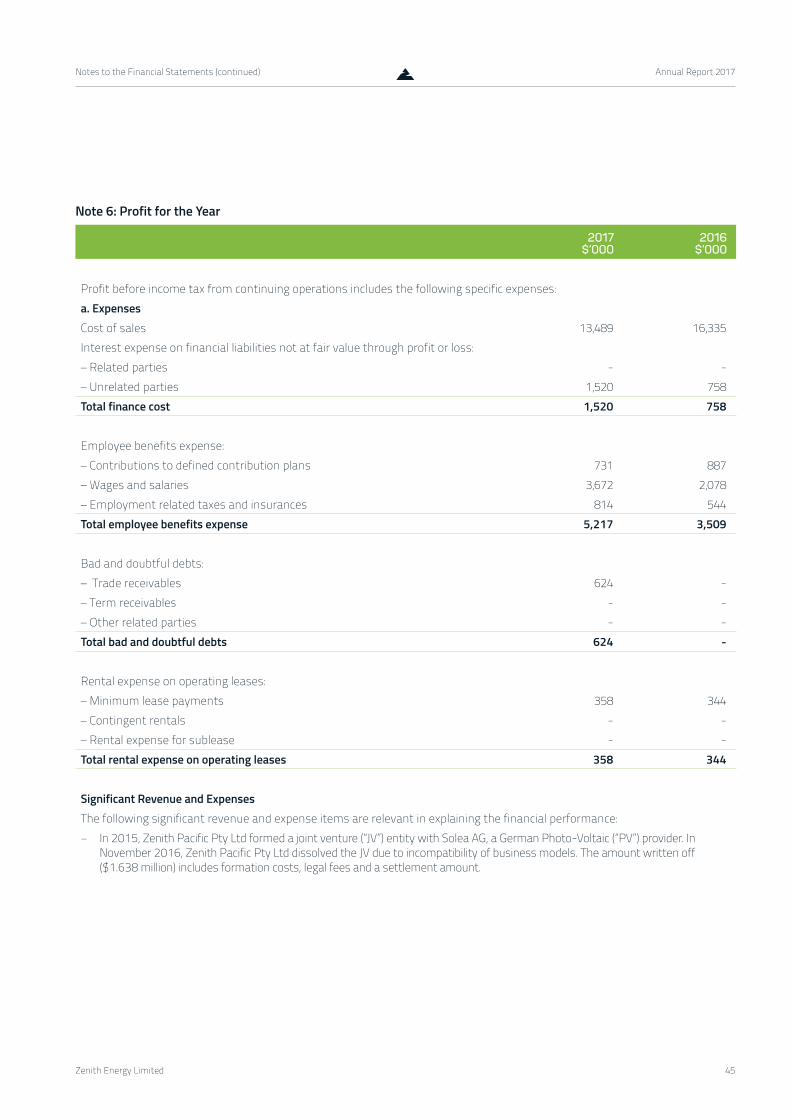
45
Notes to the Financial Statements (continued) Annual Report 2017
Zenith Energy Limited
Note 6: Profit for the Year
2017$’000
2016$’000
Profit before income tax from continuing operations includes the following specific expenses:a. ExpensesCost of sales 13,489 16,335 Interest expense on financial liabilities not at fair value through profit or loss:– Related parties - - – Unrelated parties 1,520 758 Total finance cost 1,520 758
Employee benefits expense:– Contributions to defined contribution plans 731 887 – Wages and salaries 3,672 2,078 – Employment related taxes and insurances 814 544 Total employee benefits expense 5,217 3,509
Bad and doubtful debts: – Trade receivables 624 - – Term receivables - - – Other related parties - - Total bad and doubtful debts 624 -
Rental expense on operating leases:– Minimum lease payments 358 344 – Contingent rentals - - – Rental expense for sublease - - Total rental expense on operating leases 358 344
Significant Revenue and ExpensesThe following significant revenue and expense items are relevant in explaining the financial performance:
− In 2015, Zenith Pacific Pty Ltd formed a joint venture (“JV”) entity with Solea AG, a German Photo-Voltaic (“PV”) provider. In November 2016, Zenith Pacific Pty Ltd dissolved the JV due to incompatibility of business models. The amount written off ($1.638 million) includes formation costs, legal fees and a settlement amount.

46
Notes to the Financial Statements (continued) Annual Report 2017
Zenith Energy Limited
Note 7: Income tax expense
2017$’000
2016$’000
The components of tax expense comprise:a) Current tax 1,472 742
Deferred tax movements 31 (130)Recoupment of prior year tax losses - -Under-provision in respect of prior years - (189)
1,503 423
b) Numerical reconciliation of tax expense:
The prima facie tax on profit from ordinary activities before income tax is reconciled to income tax as follows:
Prima facie tax payable on profit from ordinary activities before income tax at 30% (2016: 30%) 1,388 608
Add tax effect of: - Non-deductible expenditure 115 4- (Under)/Over provision for income tax in prior year - (189)
1,503 423
The applicable weighted average effective tax rates are as follows: 32% 21%
The Company and its wholly-owned Australian resident entities are part of a tax-consolidated group. As a consequence, all members of the tax-consolidated group are taxed as a single entity from that date. The head entity within the tax-consolidated group is Zenith Energy Limited.
Current tax expense/income, deferred tax liabilities and deferred tax assets arising from temporary differences of the members of the tax-consolidated group are recognised in the separate financial statements of the members of the tax- consolidated group using the “separate taxpayer within group” approach by reference to the carrying amounts of assets and liabilities in the separate financial statements of each entity and the tax values applying under tax consolidation.
Any current tax liabilities (or assets) and deferred tax assets arising from unused tax losses of the subsidiaries are assumed by the head entity in the tax-consolidated group and are recognised by the company as amounts payable (receivable) to/(from) other entities in the tax-consolidated group.
Any subsequent period adjustments to deferred tax assets arising from unused tax losses as a result of revised assessments of the probability of recoverability is recognised by the head entity only.

47
Notes to the Financial Statements (continued) Annual Report 2017
Zenith Energy Limited
2017$’000
2016$’000
c) Deferred tax assets and liabilitiesDeferred tax balances:Assets:Employee entitlements 419 280Borrowing costs 42 53Non-deductible equity raising costs - recognised in equity 381 -
842 333
Liabilities:Revenue received in advance (13) (4)Consumables - (11)Borrowing costs (57) -
(70) (15)Net deferred tax asset/(liability) 772 318
Note 8: Cash and Cash Equivalents
2017$’000
2016$’000
Cash at bank and on hand 19,291 2,519Short-term bank deposits - -
19,291 2,519
Balances as aboveCash at bank and on hand 19,291 2,519Balances as per statement of cash flows 19,291 2,519
The Group’s exposure to interest rate risk and foreign currency risk is discussed in Note 26.

48
Notes to the Financial Statements (continued) Annual Report 2017
Zenith Energy Limited
Note 9: Trade and Other Receivables
2017$’000
2016$’000
CURRENTTrade and other receivables 3,781 4,691Provision for impairment - -
3,781 4,691Related party receivables - 8
- 8Total current trade and other receivables 3,781 4,699
NON-CURRENTRelated party receivables 1,878 - Total non-current trade and other receivables 1,878 -
Total current and non-current trade and other receivables 5,659 4,699
Trade receivables are generally due for settlement in 30 days and therefore are all classified as current. The Group’s impairment and other accounting policies for trade and other receivables are outlined in note 2(iii) and note 3, respectively.
Further information relating to related party receivables is set out in note 22.
Due to the short term nature of the current receivables, the carrying amount is assumed to be the same as their fair value.
Information about the impairment of trade and other receivables, their credit quality and the Group’s exposure to credit risk, foreign currency risk and interest rate risk and trade and other receivables past due but not impaired can be found in note 3 and note 26.
Note 10: Other Assets
2017$’000
2016$’000
CURRENTPre-paid insurance 450 -Pre-paid expenses 895 243Deferred establishment costs 157 351Other current assets - 20Total other current assets 1,502 614
NON-CURRENTDeferred establishment costs 469 -Total other non-current assets 469 -

49
Notes to the Financial Statements (continued) Annual Report 2017
Zenith Energy Limited
Note 11: Inventories
2017$’000
2016$’000
CURRENTAt cost:Work in progress 381 1,058Finished goods 268 151Total inventories 649 1,209
Inventories recognised as an expense during the year ended 30 June 2017 amounted to $0.117 million (2016: $0.009 million). There were no write downs of inventories during the year. In addition, $0.777 million (2016: nil) of inventories were transferred to capital work in progress during the year.
Note 12: Property, Plant and Equipment
2017$’000
2016$’000
Plant and EquipmentAt cost: 2,119 2,143Accumulated depreciation (1,281) (1,236)
838 907
Power Generation Assets At cost: 42,021 26,048Accumulated depreciation (5,109) (3,162)
36,912 22,886
Capital Works in Progress At cost: 1,676 973
Total Property, Plant and Equipment 39,426 24,766
2017$’000
2016$’000
a) Leased AssetsPlant and equipment and power generation assets includes the following amounts where the Group is a lessee under a finance lease or hire purchase agreement.Total carrying amount 34,868 21,518
b) Assets pledged as security The Group’s bankers (CBA) have general security over the Group’s assets apart from SPV’s with leasing arrangements, as detailed above.
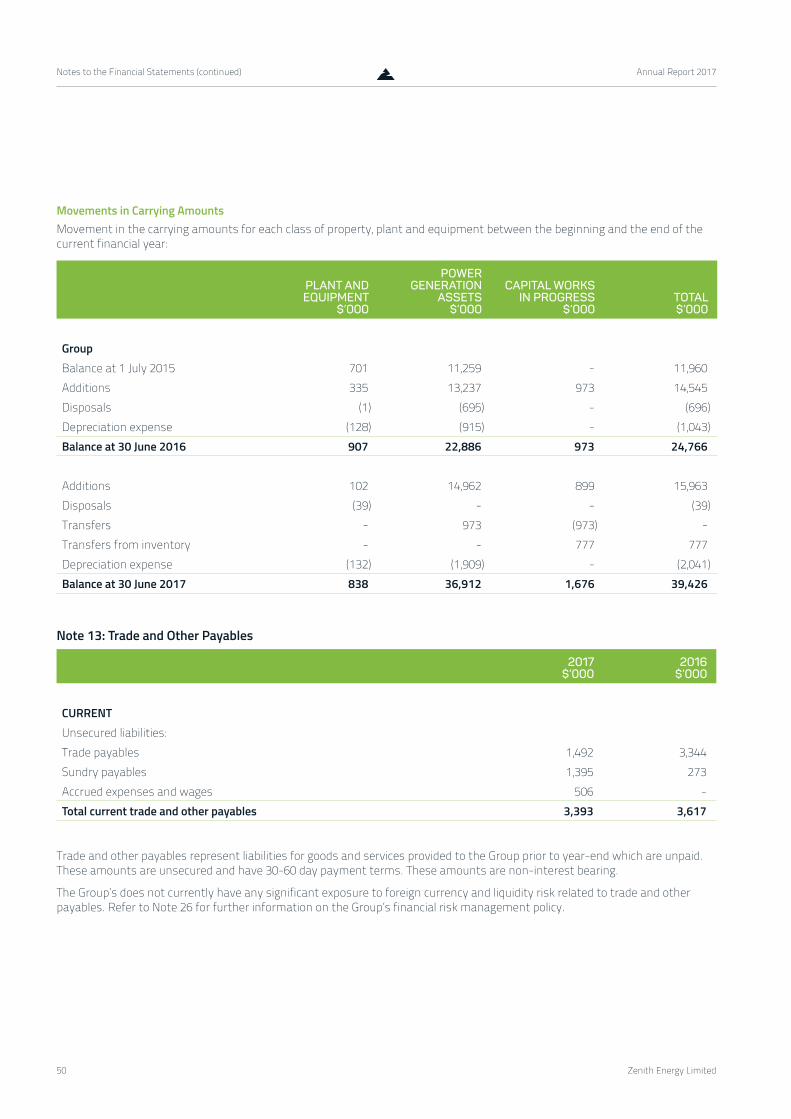
50
Notes to the Financial Statements (continued) Annual Report 2017
Zenith Energy Limited
Movements in Carrying AmountsMovement in the carrying amounts for each class of property, plant and equipment between the beginning and the end of the current financial year:
PLANT AND EQUIPMENT
$’000
POWER GENERATION
ASSETS$’000
CAPITAL WORKS IN PROGRESS
$’000TOTAL$’000
GroupBalance at 1 July 2015 701 11,259 - 11,960Additions 335 13,237 973 14,545Disposals (1) (695) - (696)Depreciation expense (128) (915) - (1,043)Balance at 30 June 2016 907 22,886 973 24,766
Additions 102 14,962 899 15,963Disposals (39) - - (39)Transfers - 973 (973) -Transfers from inventory - - 777 777Depreciation expense (132) (1,909) - (2,041)Balance at 30 June 2017 838 36,912 1,676 39,426
Note 13: Trade and Other Payables
2017$’000
2016$’000
CURRENTUnsecured liabilities:Trade payables 1,492 3,344Sundry payables 1,395 273Accrued expenses and wages 506 -Total current trade and other payables 3,393 3,617
Trade and other payables represent liabilities for goods and services provided to the Group prior to year-end which are unpaid. These amounts are unsecured and have 30-60 day payment terms. These amounts are non-interest bearing.
The Group’s does not currently have any significant exposure to foreign currency and liquidity risk related to trade and other payables. Refer to Note 26 for further information on the Group’s financial risk management policy.
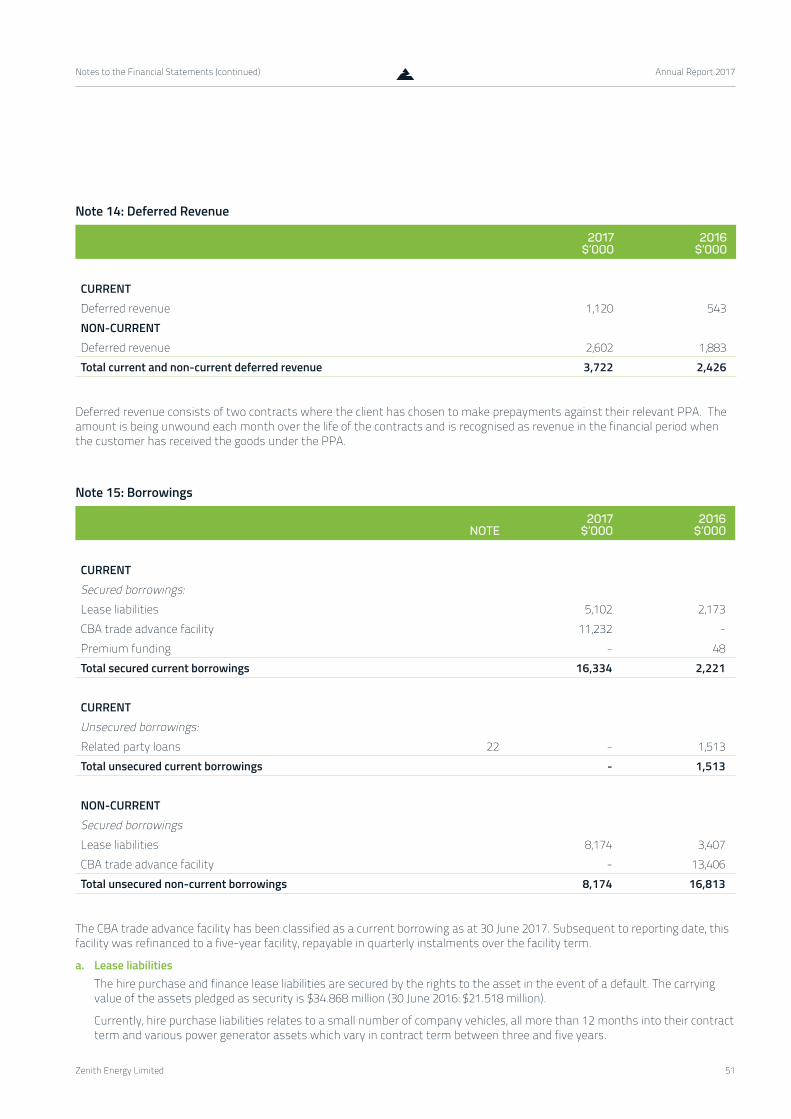
51
Notes to the Financial Statements (continued) Annual Report 2017
Zenith Energy Limited
Note 14: Deferred Revenue
2017$’000
2016$’000
CURRENTDeferred revenue 1,120 543 NON-CURRENTDeferred revenue 2,602 1,883Total current and non-current deferred revenue 3,722 2,426
Deferred revenue consists of two contracts where the client has chosen to make prepayments against their relevant PPA. The amount is being unwound each month over the life of the contracts and is recognised as revenue in the financial period when the customer has received the goods under the PPA.
Note 15: Borrowings
NOTE2017
$’0002016
$’000
CURRENTSecured borrowings: Lease liabilities 5,102 2,173CBA trade advance facility 11,232 -Premium funding - 48Total secured current borrowings 16,334 2,221
CURRENTUnsecured borrowings: Related party loans 22 - 1,513Total unsecured current borrowings - 1,513
NON-CURRENT Secured borrowings Lease liabilities 8,174 3,407CBA trade advance facility - 13,406Total unsecured non-current borrowings 8,174 16,813
The CBA trade advance facility has been classified as a current borrowing as at 30 June 2017. Subsequent to reporting date, this facility was refinanced to a five-year facility, repayable in quarterly instalments over the facility term.
a. Lease liabilities The hire purchase and finance lease liabilities are secured by the rights to the asset in the event of a default. The carrying value of the assets pledged as security is $34.868 million (30 June 2016: $21.518 million).
Currently, hire purchase liabilities relates to a small number of company vehicles, all more than 12 months into their contract term and various power generator assets which vary in contract term between three and five years.

52
Notes to the Financial Statements (continued) Annual Report 2017
Zenith Energy Limited
b. Risk exposures Details of the Group’s exposure to risks on borrowings are set out on Note 26.
c. Fair value For the majority of borrowings, the fair value are not materially different to their carrying values, since the interest payable on these borrowings is either close to current market rates, or the borrowings are relatively short term nature.
d. Compliance with borrowing covenants The Group has complied with the financial covenants of its borrowing facilities during the 2017 and 2016 reporting period.
e. Unutilised borrowing facilitiesGroup borrowing facilities and amounts have unutilised facility of $3.82 million as at 30 June 2017.
Note 16: Provisions
2017$’000
2016$’000
CURRENTEmployee provisions 1,150 544
NON-CURRENT Employee provisions 246 273Total provisions for employee benefits 1,396 817
Provision for employee benefits represents amounts accrued for annual leave and long service leave.
The current portion for this provision includes the total amount accrued for annual leave entitlements and the amounts accrued for long service leave entitlements that have vested due to employees having completed the required period of service. Based on past experience, the Group does not expect the full amount of annual leave or long service leave balances classified as current liabilities to be settled within the next 12 months. However, these amounts must be classified as current liabilities since the Group does not have an unconditional right to defer the settlement of these amounts in the event employees wish to use their leave entitlement. However, based on past experiences, the Group does not expect all employees to take the full amount of accrued leave or require payment with the next 12 months. The amount of leave that is not expected to be taken or paid within the next 12 months is $0.700 million (30 June 2016: $0.200 million).
The non-current portion for this provision includes amounts accrued for long service leave entitlements that have not yet vested in relation to those employees who have not yet completed the required period of service.
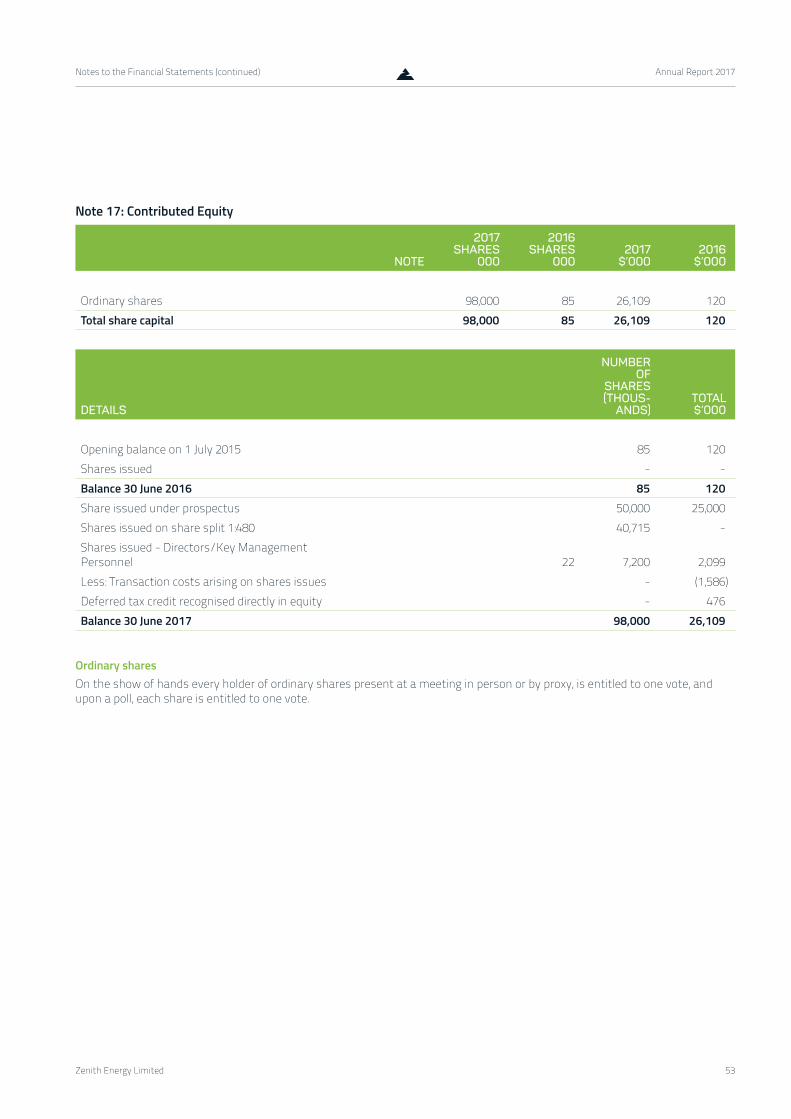
53
Notes to the Financial Statements (continued) Annual Report 2017
Zenith Energy Limited
Note 17: Contributed Equity
NOTE
2017SHARES
000
2016SHARES
0002017
$’0002016
$’000
Ordinary shares 98,000 85 26,109 120Total share capital 98,000 85 26,109 120
DETAILS
NUMBER OF
SHARES (THOUS-
ANDS)TOTAL $’000
Opening balance on 1 July 2015 85 120Shares issued - -Balance 30 June 2016 85 120Share issued under prospectus 50,000 25,000Shares issued on share split 1:480 40,715 -Shares issued - Directors/Key Management Personnel 22 7,200 2,099Less: Transaction costs arising on shares issues - (1,586)Deferred tax credit recognised directly in equity - 476Balance 30 June 2017 98,000 26,109
Ordinary shares On the show of hands every holder of ordinary shares present at a meeting in person or by proxy, is entitled to one vote, and upon a poll, each share is entitled to one vote.
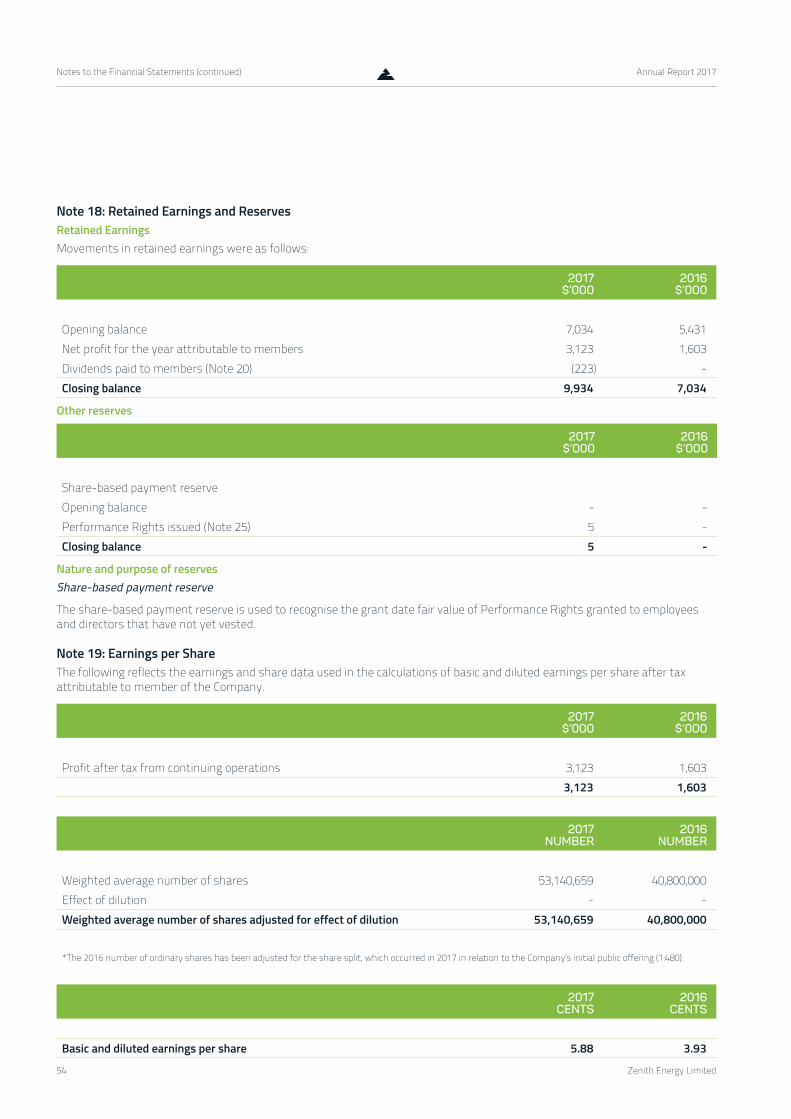
54
Notes to the Financial Statements (continued) Annual Report 2017
Zenith Energy Limited
Note 18: Retained Earnings and Reserves Retained Earnings Movements in retained earnings were as follows:
2017$’000
2016$’000
Opening balance 7,034 5,431Net profit for the year attributable to members 3,123 1,603Dividends paid to members (Note 20) (223) -Closing balance 9,934 7,034
Other reserves
2017$’000
2016$’000
Share-based payment reserve Opening balance - -Performance Rights issued (Note 25) 5 -Closing balance 5 -
Nature and purpose of reserves Share-based payment reserve
The share-based payment reserve is used to recognise the grant date fair value of Performance Rights granted to employees and directors that have not yet vested.
Note 19: Earnings per ShareThe following reflects the earnings and share data used in the calculations of basic and diluted earnings per share after tax attributable to member of the Company.
2017$’000
2016$’000
Profit after tax from continuing operations 3,123 1,6033,123 1,603
2017NUMBER
2016NUMBER
Weighted average number of shares 53,140,659 40,800,000Effect of dilution - -Weighted average number of shares adjusted for effect of dilution 53,140,659 40,800,000
*The 2016 number of ordinary shares has been adjusted for the share split, which occurred in 2017 in relation to the Company’s initial public offering (1:480).
2017CENTS
2016CENTS
Basic and diluted earnings per share 5.88 3.93
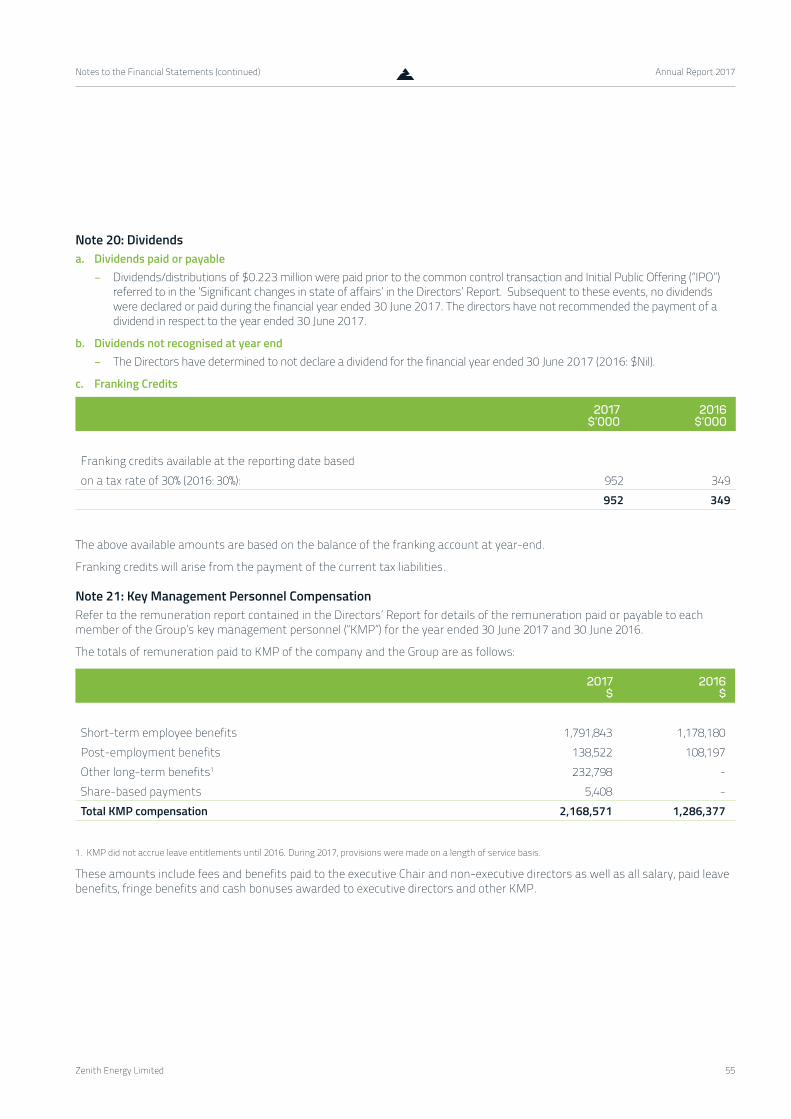
55
Notes to the Financial Statements (continued) Annual Report 2017
Zenith Energy Limited
Note 20: Dividends a. Dividends paid or payable
− Dividends/distributions of $0.223 million were paid prior to the common control transaction and Initial Public Offering (“IPO”) referred to in the ‘Significant changes in state of affairs’ in the Directors’ Report. Subsequent to these events, no dividends were declared or paid during the financial year ended 30 June 2017. The directors have not recommended the payment of a dividend in respect to the year ended 30 June 2017.
b. Dividends not recognised at year end − The Directors have determined to not declare a dividend for the financial year ended 30 June 2017 (2016: $Nil).
c. Franking Credits
2017$’000
2016$’000
Franking credits available at the reporting date basedon a tax rate of 30% (2016: 30%): 952 349
952 349
The above available amounts are based on the balance of the franking account at year-end.
Franking credits will arise from the payment of the current tax liabilities.
Note 21: Key Management Personnel CompensationRefer to the remuneration report contained in the Directors’ Report for details of the remuneration paid or payable to each member of the Group’s key management personnel (“KMP”) for the year ended 30 June 2017 and 30 June 2016.
The totals of remuneration paid to KMP of the company and the Group are as follows:
2017$
2016$
Short-term employee benefits 1,791,843 1,178,180 Post-employment benefits 138,522 108,197 Other long-term benefits1 232,798 - Share-based payments 5,408 - Total KMP compensation 2,168,571 1,286,377
1. KMP did not accrue leave entitlements until 2016. During 2017, provisions were made on a length of service basis.
These amounts include fees and benefits paid to the executive Chair and non-executive directors as well as all salary, paid leave benefits, fringe benefits and cash bonuses awarded to executive directors and other KMP.

56
Notes to the Financial Statements (continued) Annual Report 2017
Zenith Energy Limited
Post-employment benefitsThese amounts are the current-year’s costs of providing for superannuation contributions made during the year.
Other long-term benefitsThese amounts represent long service leave benefits accruing during the year.
Share-based paymentsThese amounts represent the expense related to the participation of KMP in equity-settled benefit schemes as measured by the fair value of the Performance Rights on grant date. Refer to note 25 for additional details.
Note 22: Related Party TransactionsRelated Parties
a. The Group’s main related parties are as follows:Entities exercising control over the Group
− The ultimate parent entity that exercises control over the Group is Zenith Energy Limited, which is incorporated in Australia. For interest in subsidiaries, refer to Note 23.
Key management personnel:
− Any person(s) having authority and responsibility for planning, directing and controlling the activities of the entity, directly or indirectly, including any director (whether executive or otherwise) of that entity, are considered key management personnel.
− For details of disclosures relating to key management personnel, refer to Note 21.
Entities subject to significant influence by the Group:
− An entity that has the power to participate in the financial and operating policy decisions of an entity, but does not have control over those policies, is an entity which holds significant influence. Significant influence may be gained by share ownership, statute or agreement. Zenith Energy Limited does not have any entities in which it exerts significant influence over.
Other related parties:
− Other related parties include entities controlled by the ultimate parent entity and entities over which key management personnel have joint control. Zenith Energy Limited does not have any entities in which it exerts joint control.
b. Transactions with related parties − The Company leases its Cairns office premises from Pacific Synergy Pty Ltd ATF for Pacific Synergy Unit Trust (Pacific
Synergy), an entity controlled by existing Directors Mr Doug Walker and Mr Gavin Great. The lease is on standard tenancy terms, with $138,000 (plus GST) pa in rent and no fixed term.
− The Company leases an apartment in West Perth for the benefit of its travelling employees. This lease is on standard tenancy terms through a third-party property manager, with $28,600 (plus GST) pa in rent and a one year term (initial expiry February 2018). The property is owned by an associate of existing Director Mr Doug Walker.
c. Loans to/from related parties Loans to key management personnel
30 JUNE 2017$
Balance at beginning of the yearLoans advanced 2,099,100Fair value adjustment (a) (316,291)Interest income (b) 94,807Balance at end of year 1,877,616

57
Notes to the Financial Statements (continued) Annual Report 2017
Zenith Energy Limited
(a) The loans advanced are interest free and repayable in 18 months from reporting date. The difference between the fair value of the loans (discounted based on a market rate of 7.90%) and the face value of the loans has been recognised during the period as an employee benefit.
(b) Interest income represents the unwinding of the loan to its face value from the date of issue to 30 June 2017.
Terms and conditions
Following completion of the common control transaction referred to in the Directors’ Report, loans were provided to Mr Hamish Moffat and Mr Graham Cooper to fund the issue of 2,400,000 and 4,800,000 ordinary shares, respectively in Zenith Energy Limited. The loans are interest free and will be repaid within 18 months of reporting date.
The shares issued are in escrow until the loans are fully repaid.
In 2016, Mr Moffat and Mr Walker loaned $0.750 million each to Zenith Pacific Pty Ltd. These loans were on normal commercial terms with the interest paid monthly in arrears. Prior to IPO, Zenith Pacific Pty Ltd paid $0.250 million to Mr Moffat and Mr Walker respectively. Post-IPO, the remaining funds were paid as per the uses of funds section in the Company’s prospectus. Prior to IPO, $0.013 million in other director’s loans were also cleared by Zenith Pacific Pty Ltd. As at 30 June 2017, no related party loans payable were recognised.
d. Guarantees by related parties At 30 June 2017, the Group’s bankers had not completed their activities with respect to removing personal Director’s guarantees from the Group’s facilities. The follows guarantees were still in place at 30 June 2017, however subsequently to year-end have been removed:
− WD Walker – guarantee limited to $418,000
− Gavin Great – guarantee limited to $342,000
Note 23: Interests in Subsidiaries Information about Principal SubsidiariesThe subsidiaries listed below have share capital consisting solely of ordinary shares, which are held directly by the Group. The proportion of ownership interests held equals the voting rights held by the Group. Each subsidiary’s principal place of business is also its country of incorporation.
NAME OF SUBSIDIARY
PRINCIPAL PLACE OF BUSINESS
OWNERSHIP INTEREST HELD BY THE GROUP
2017 (%) 2016 (%)
Zenith Pacific Pty Ltd Australia 100% 100%Zenith Pacific (Kundana) Pty Ltd Australia 100% -Zenith Pacific (NOVA-PV) Pty Ltd Australia 100% -Zenith Pacific (JUN) Pty Ltd Australia 100% 100%Zenith Pacific (SLR) Pty Ltd Australia 100% 100%Zenith Pacific (BWI) Pty Ltd Australia 100% 100%Zenith Pacific (NSR) Pty Ltd Australia 100% 100%Zenith Micro-Grid Pty Ltd Australia 100% 100%Zenith Solea Pty Ltd* Australia - 50.1%Zenith Solea (NOVA) Pty Ltd* Australia - 100%Zenith Solea International (Singapore)* Singapore - 50%Zenith Pacific (HCM) Pty Ltd Australia 100% -
*In the process of de-registration with ASIC and overseas regulators.
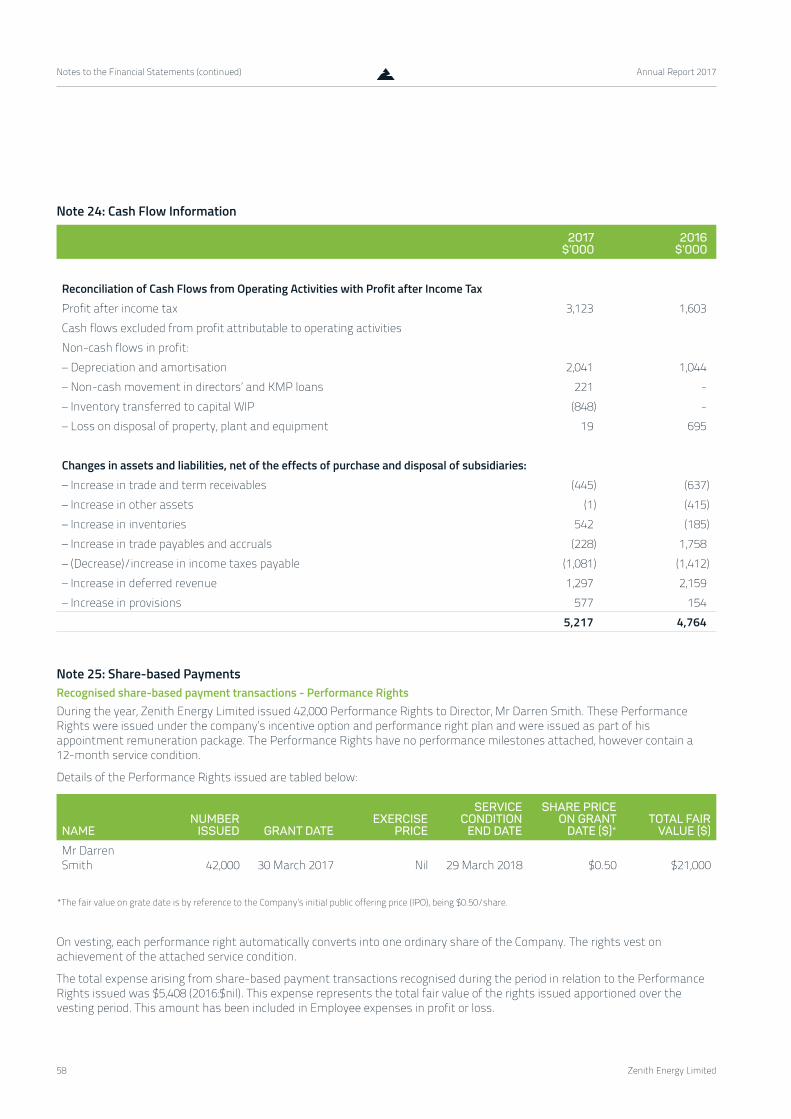
58
Notes to the Financial Statements (continued) Annual Report 2017
Zenith Energy Limited
Note 24: Cash Flow Information
2017$’000
2016$’000
Reconciliation of Cash Flows from Operating Activities with Profit after Income TaxProfit after income tax 3,123 1,603Cash flows excluded from profit attributable to operating activitiesNon-cash flows in profit:– Depreciation and amortisation 2,041 1,044– Non-cash movement in directors’ and KMP loans 221 -– Inventory transferred to capital WIP (848) -– Loss on disposal of property, plant and equipment 19 695
Changes in assets and liabilities, net of the effects of purchase and disposal of subsidiaries:– Increase in trade and term receivables (445) (637)– Increase in other assets (1) (415)– Increase in inventories 542 (185)– Increase in trade payables and accruals (228) 1,758– (Decrease)/increase in income taxes payable (1,081) (1,412)– Increase in deferred revenue 1,297 2,159– Increase in provisions 577 154
5,217 4,764
Note 25: Share-based PaymentsRecognised share-based payment transactions - Performance Rights During the year, Zenith Energy Limited issued 42,000 Performance Rights to Director, Mr Darren Smith. These Performance Rights were issued under the company’s incentive option and performance right plan and were issued as part of his appointment remuneration package. The Performance Rights have no performance milestones attached, however contain a 12-month service condition.
Details of the Performance Rights issued are tabled below:
NAME NUMBER
ISSUED GRANT DATEEXERCISE
PRICE
SERVICE CONDITION
END DATE
SHARE PRICE ON GRANT
DATE ($)*TOTAL FAIR
VALUE ($)
Mr Darren Smith 42,000 30 March 2017 Nil 29 March 2018 $0.50 $21,000
*The fair value on grate date is by reference to the Company’s initial public offering price (IPO), being $0.50/share.
On vesting, each performance right automatically converts into one ordinary share of the Company. The rights vest on achievement of the attached service condition.
The total expense arising from share-based payment transactions recognised during the period in relation to the Performance Rights issued was $5,408 (2016:$nil). This expense represents the total fair value of the rights issued apportioned over the vesting period. This amount has been included in Employee expenses in profit or loss.
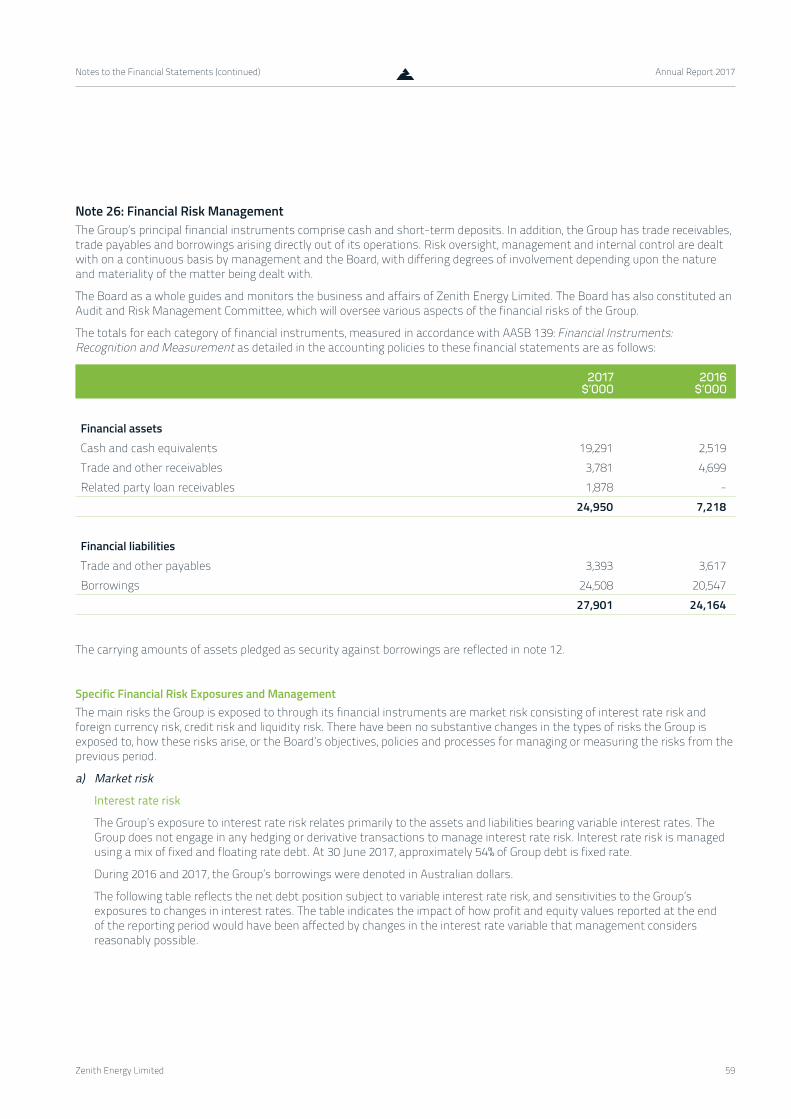
59
Notes to the Financial Statements (continued) Annual Report 2017
Zenith Energy Limited
Note 26: Financial Risk Management The Group’s principal financial instruments comprise cash and short-term deposits. In addition, the Group has trade receivables, trade payables and borrowings arising directly out of its operations. Risk oversight, management and internal control are dealt with on a continuous basis by management and the Board, with differing degrees of involvement depending upon the nature and materiality of the matter being dealt with.
The Board as a whole guides and monitors the business and affairs of Zenith Energy Limited. The Board has also constituted an Audit and Risk Management Committee, which will oversee various aspects of the financial risks of the Group.
The totals for each category of financial instruments, measured in accordance with AASB 139: Financial Instruments: Recognition and Measurement as detailed in the accounting policies to these financial statements are as follows:
2017$’000
2016$’000
Financial assets Cash and cash equivalents 19,291 2,519Trade and other receivables 3,781 4,699Related party loan receivables 1,878 -
24,950 7,218
Financial liabilities Trade and other payables 3,393 3,617Borrowings 24,508 20,547
27,901 24,164
The carrying amounts of assets pledged as security against borrowings are reflected in note 12.
Specific Financial Risk Exposures and ManagementThe main risks the Group is exposed to through its financial instruments are market risk consisting of interest rate risk and foreign currency risk, credit risk and liquidity risk. There have been no substantive changes in the types of risks the Group is exposed to, how these risks arise, or the Board’s objectives, policies and processes for managing or measuring the risks from the previous period.
a) Market risk
Interest rate risk
The Group’s exposure to interest rate risk relates primarily to the assets and liabilities bearing variable interest rates. The Group does not engage in any hedging or derivative transactions to manage interest rate risk. Interest rate risk is managed using a mix of fixed and floating rate debt. At 30 June 2017, approximately 54% of Group debt is fixed rate.
During 2016 and 2017, the Group’s borrowings were denoted in Australian dollars.
The following table reflects the net debt position subject to variable interest rate risk, and sensitivities to the Group’s exposures to changes in interest rates. The table indicates the impact of how profit and equity values reported at the end of the reporting period would have been affected by changes in the interest rate variable that management considers reasonably possible.

60
Notes to the Financial Statements (continued) Annual Report 2017
Zenith Energy Limited
30 JUNE 2017
WEIGHTED AVERAGE INTEREST
RATE
CARRYING VALUE $’000
PROFIT (BEFORE
TAX)+ 2%
$’000
EQUITY (BEFORE
TAX)+ 2%
$’000
PROFIT (BEFORE
TAX)- 2%
$’000
EQUITY (BEFORE
TAX)- 2%
$’000
Financial assets Cash and cash equivalents 0.15% 19,291 386 - (29) -
Financial liabilities CBA trade advance facility 4.11% (11,232) (225) - 225 -
30 JUNE 2016
WEIGHTED AVERAGE INTEREST
RATE
CARRYING VALUE $’000
PROFIT (BEFORE
TAX)+ 2%
$’000
EQUITY (BEFORE
TAX)+ 2%
$’000
PROFIT (BEFORE
TAX)- 2%
$’000
EQUITY (BEFORE
TAX)- 2%
$’000
Financial assets Cash and cash equivalents 0.31% 2,519 50 - (8) -
Financial liabilities CBA trade advance facility 4.11% (13,406) (268) - 268 -
Foreign currency riskThe Group is not currently exposed to significant foreign exchange risk arising from the foreign currency risk exposure. Majority of the Group’s transactions are denoted in Australian dollars.
b) Credit risk
Exposure to credit risk relating to financial assets arises from the potential non-performance by counterparties of contract obligations that could lead to a financial loss to the Group.
Credit risk is managed through the maintenance of procedures (such as the utilisation of systems for the approval, granting and renewal of credit limits, regular monitoring of exposures against such limits and monitoring of the financial stability of significant customers and counterparties), ensuring to the extent possible that customers and counterparties to transactions are of sound credit worthiness. Such monitoring is used in assessing receivables for impairment. Credit terms are generally 30 days from the invoice date.
The maximum exposure to credit risk at reporting date is the carrying amount of the financial assets summarised below.
Maximum credit risk
2017$’000
2016$’000
Trade and other receivables 3,871 4,691Allowance for impairment of receivables - -Total trade and other receivables 3,871 4,691

61
Notes to the Financial Statements (continued) Annual Report 2017
Zenith Energy Limited
A summary of the credit risk and trade and other receivables past due is tabled below.
GROSS AMOUNT
$’000
PAST DUE AND
IMPAIRED$’000
PAST DUE BUT NOT IMPAIRED WITHIN INITIAL TRADE TERMS
$’000<30 DAYS
$’000
31 – 60 DAYS$’000
61 – 90 DAYS$’000
2017Trade and other receivables 3,871 - - - - 3,8712016 Trade and other receivables 4,691 - - - - 4,691
The Group’s credit risk on liquid funds is limited because the counterparties are with banks with a minimum credit rating of –AA, as assigned by reputable credit rating agencies. At reporting date, the Group’s cash and cash equivalents were held with counterparties with credit ratings summarised below.
2017$’000
2016$’000
Cash and cash equivalents -AA rated 19,291 2,519
19,291 2,519
c) Liquidity risk
Liquidity risk arises from the possibility that the Group might encounter difficulty in settling its debts or otherwise meeting its obligations related to financial liabilities. The Group manages this risk through the following mechanisms:
− preparing forward-looking cash flow analyses in relation to its operating, investing and financing activities;
− monitoring undrawn credit facilities;
− obtaining funding from a variety of sources;
− maintaining a reputable credit profile;
− managing credit risk related to financial assets;
− only investing surplus cash with major financial institutions; and
− comparing the maturity profile of financial liabilities with the realisation profile of financial assets.

62
Notes to the Financial Statements (continued) Annual Report 2017
Zenith Energy Limited
The table below reflects an undiscounted contractual maturity analysis for financial liabilities.
Cash flows realised from financial assets reflect management’s expectation as to the timing of realisation. Actual timing may therefore differ from that disclosed. The timing of cash flows presented in the table to settle financial liabilities reflects the earliest contractual settlement dates and does not reflect management’s expectations that banking facilities will be rolled forward.
WITHIN 1 YEAR 1 - 5 YEARS OVER 5 YEARS
TOTAL CARRYING
VALUE
TOTAL CONTRACTUAL CASH FLOWS
2017$’000
2016$’000
2017$’000
2016$’000
2017$’000
2016$’000
2017$’000
2016$’000
2017$’000
2016$’000
Financial liabilitiesTrade and other payables 3,393 3,617 - - - - 3,393 3,617 3,393 3,617CBA trade advance facility 11,232 - - 13,406 - - 11,232 13,406 11,694 13,957Premium funding - 48 - - - - - 48 - 48Lease liabilities 5,102 2,173 8,174 3,407 - - 13,276 5,580 17,251 5,944Related party loans - 1,513 - - - - - 1,513 - 1,513Total financial liabilities 19,727 7,351 8,174 16,813 - - 27,901 24,164 32,338 25,079
In relation to the Group’s CBA trade advance facility, as at 30 June 2017, the facility was repayable within a 12-month period and as a result was recognised as a current liability. Subsequent to year end, the Group has converted this facility into a five year facility with equal quarterly repayments commencing in August 2017.
Capital Management
Management controls the capital of the Group in order to maintain a sustainable debt to equity ratio, generate long-term shareholder value and ensure that the Group can fund its operations and continue as a going concern.
The Group’s debt and capital include ordinary share capital and financial liabilities, supported by financial assets.
The Group is not subject to any externally imposed capital requirements.
Management effectively manages the Group’s capital by assessing the Group’s financial risks and adjusting its capital structure in response to changes in these risks and in the market. These responses include the management of debt levels, and in future could include distributions to shareholders and share issues.
There have been no changes in the strategy adopted by management to control the capital of the Group since the prior year. This strategy is to ensure that the Group’s gearing ratio moves towards a consolidated overall gearing of ~50% debt funding, in line with market expectations. This will fluctuate between 50-70% when the Group is in the construction phase of new projects. The gearing ratios for the years ended 30 June 2017 and 30 June 2016 are as follows:
2017$’000
2016$’000
Total borrowings 24,508 20,547Less cash and cash equivalents 19,291 2,519Net debt 5,217 18,028Total equity 36,048 7,154Total capital 41,265 25,182Gearing ratio 12.6% 71.6%

63
Notes to the Financial Statements (continued) Annual Report 2017
Zenith Energy Limited
Note 27: Capital and leasing commitments Capital expenditure commitments Significant capital expenditure contracted at the end of the reporting period but not recognised as liabilities is as follows:
2017$’000
2016$’000
Property, plant and equipment - -Capital expenditure projects (Purchase orders raised but not received) 1,677 -Total capital expenditure not recognised 1,677 -
Operating lease commitments Non-cancellable operating lease rentals are payable
2017$’000
2016$’000
Less than one year 351 344 Between one and five years 498 - Later than five years - - Total operating lease rentals 849 344
The Brennan Way (Perth) property lease is a non-cancellable lease with a 5 year (48 months remaining as at 1 November 2017) term, with rent payable monthly in advance. Contingent rental provisions within the lease agreement require that minimum lease payments shall be increased by 3% per annum. An option exists to renew the lease at the end of the five-year term for an additional term of five years. The Fearnley St (Cairns) premises is currently on a periodic tenancy arrangement, and therefore 12 months has been reported.
Note 28: Contingent Liabilities and Contingent AssetsAs at 30 June 2017, the Group had no material contingent liabilities or contingent assets.
Note 29: Auditor’s Remuneration
2017$’000
2016$’000
Remuneration of the auditor for:- Auditing or reviewing the financial report 116,970 27,500- Non audit services 118,759 34,000
235,729 61,500

64
Notes to the Financial Statements (continued) Annual Report 2017
Zenith Energy Limited
Note 30: Parent Entity Disclosures
2017$’000
ASSETSCurrent assets 18,529Non-current assets 5,100TOTAL ASSETS 23,629
LIABILITIES Current liabilities 302Non-current liabilities 253TOTAL LIABILITIES 555
EQUITYIssued capital 25,989Share based payment reserve 5Retained earnings (2,922)TOTAL EQUITY 23,071
Statement of Profit or Loss and Other Comprehensive Income Total Loss 2,922Total comprehensive loss 2,922
The parent entity was incorporated on 2 November 2016 in Australia, and accordingly no comparative financial information is available.
Commitments and contingent liabilities and assets The parent entity has no contingent liabilities or assets and has not entered into any new contractual commitments to purchase property, plant or equipment at year-end (30 June 2016: nil). There was $1.67 million in outstanding purchase orders for the three power stations under construction which have since been fulfilled.

65
Notes to the Financial Statements (continued) Annual Report 2017
Zenith Energy Limited
Note 31: Events after the Reporting PeriodOther than the following, the directors are not aware of any significant events since the end of the reporting period.
− On 11 July 2017, Zenith Energy Limited advised the ASX that it had begun producing power under a BOO Power Purchase Agreement (“PPA”) for Northern Star Resources at their Jundee Gold Project Operation. This PPA was included in Zenith Energy Limited’s forecast at IPO.
− On 15 August 2017, Zenith Energy Limited advised the ASX it had secured a three year MOM contract extension with Ok Tedi Mining Limited at its Tabubil Power Station. This PPA was included in Zenith Energy Limited’s forecast at IPO.
− On 22 August 2017, Zenith Energy Limited advised the ASX it had signed a one year extension (with a possible further one year extension) to its MOM contract at the Phosphate Hill Power Station near Mt Isa. This PPA was included in Zenith Energy Limited’s forecast at IPO.
− On 28 August 2017, Zenith Energy Limited and Dacian Gold Limited advised the ASX that they had entered into a Letter of Intent to build the Power Station for Dacian at the Mt Morgan Project. The PPA has a supply commencement date of 7 March 2018 and will positively impact FY18 earnings. This PPA was not included in Zenith Energy Limited’s forecast at IPO.
− At 30 June 2017, the CBA Trade Advance Facility for the financing of the IGO Nova Power Station was classed as a current liability. This facility has since converted to a five year facility with a straight line amortisation profile and quarterly repayments.
− The Group finalised its remuneration policy and the proposed calculations for LTI and STI opportunities as disclosed in the Remuneration Report. The expected cash payment is $0.462m and a non-cash LTI of $0.247 million. These amounts have not been accrued at reporting date.
− On 11 September 2017, Ms Stephanie Unwin was appointed to the Board of Directors.
Note 32: Company Details The registered office of the company is:Zenith Energy Limited Level 1, 160 Stirling Highway Nedlands WA 6009
The principal places of business are:24 Brennan Way Belmont WA 6104
80 Fearnley Street Portsmith QLD 4870
66
Directors’ Declaration Annual Report 2017
Zenith Energy Limited
Directors’ DeclarationThe directors of Zenith Energy Limited declare that, in their opinion:
1. the financial statements and notes, as set out on pages 28-65, are in accordance with the Corporations Act 2001 and:
a. comply with Australian Accounting Standards, which, as stated in accounting policy Note 2(a) to the financial statements, constitutes compliance with International Financial Reporting Standards; and
b. give a true and fair view of the financial position as at 30 June 2017 and of the performance for the year ended on that date of the consolidated Group;
2. in the directors’ opinion there are reasonable grounds to believe that the company will be able to pay its debts as and when they become due and payable; and
3. the directors have been given the declarations required by s295A of the Corporations Act 2001 from the Managing Director and Chief Financial Officer.
4. The remuneration disclosures set out in the Directors Report as part of the audited remuneration report comply with S300A of the Corporations Act 2001 for the year ended 30 June 2017.
Mr William (Doug) Walker Executive Chairman
Dated: 29 September 2017

67
Independent Auditors’ Report Annual Report 2017
Zenith Energy Limited
Independent Auditors’ Report
BDO Audit (WA) Pty Ltd ABN 79 112 284 787 is a member of a national association of independent entities which are all members of BDO Australia Ltd ABN 77 050 110 275,an Australian company limited by guarantee. BDO Audit (WA) Pty Ltd and BDO Australia Ltd are members of BDO International Ltd, a UK company limited by guarantee, andform part of the international BDO network of independent member firms. Liability limited by a scheme approved under Professional Standards Legislation other than forthe acts or omissions of financial services licensees
Tel: +61 8 6382 4600Fax: +61 8 6382 4601www.bdo.com.au
38 Station StreetSubiaco, WA 6008PO Box 700 West Perth WA 6872Australia
INDEPENDENT AUDITOR'S REPORT
To the members of Zenith Energy Limited
Report on the Audit of the Financial Report
Opinion
We have audited the financial report of Zenith Energy Limited (the Company) and its subsidiaries (theGroup), which comprises the consolidated statement of financial position as at 30 June 2017, theconsolidated statement of profit or loss and other comprehensive income, the consolidated statementof changes in equity and the consolidated statement of cash flows for the year then ended, and notesto the financial report, including a summary of significant accounting policies and the directors’declaration.
In our opinion the accompanying financial report of the Group, is in accordance with the CorporationsAct 2001, including:
(i) Giving a true and fair view of the Group’s financial position as at 30 June 2017 and of itsfinancial performance for the year ended on that date; and
(ii) Complying with Australian Accounting Standards and the Corporations Regulations 2001.
Basis for opinion
We conducted our audit in accordance with Australian Auditing Standards. Our responsibilities underthose standards are further described in the Auditor’s Responsibilities for the Audit of the FinancialReport section of our report. We are independent of the Group in accordance with the CorporationsAct 2001 and the ethical requirements of the Accounting Professional and Ethical Standards Board’sAPES 110 Code of Ethics for Professional Accountants (the Code) that are relevant to our audit of thefinancial report in Australia. We have also fulfilled our other ethical responsibilities in accordancewith the Code.
We confirm that the independence declaration required by the Corporations Act 2001, which has beengiven to the directors of the Company, would be in the same terms if given to the directors as at thetime of this auditor’s report.
We believe that the audit evidence we have obtained is sufficient and appropriate to provide a basisfor our opinion.
Key audit matters
Key audit matters are those matters that, in our professional judgement, were of most significance inour audit of the financial report of the current year. These matters were addressed in the context ofour audit of the financial report as a whole, and in forming our opinion thereon, and we do not providea separate opinion on these matters.

68
Independent Auditors’ Report (continued) Annual Report 2017
Zenith Energy Limited
Lease classification
Key audit matter How the matter was addressed in our audit
The Group’s principle activity is to build, own,operate and maintain remote power plants forentities in the resources industry.
As at 30 June 2017, the Group recognised currentand non-current lease liabilities of $13.276million (2016: $5.580 million), as disclosed inNote 15 of the financial report.
The Group’s policy for the classification of leasesis disclosed in Note 3 of the financial report. Theclassification determines the balances recognisedin the statement of financial position, and theclassification and quantum of expenditurerecognised in the statement of profit or loss.
The determination of the classification of a leaserequires management’s judgement in relation todetermining whether the terms of the leasetransfer substantially all the risks and rewardsincidental to ownership of the equipment asdisclosed in Note 2(iv) of the financial report.
Our audit procedures included, but were notlimited to:
• Reviewing lease agreements executed duringthe year, including understanding the keyterms and conditions of the lease agreements;
• Evaluating management’s significantjudgements with respect to the leaseclassification based on the criteria for financeand operating leases, as described under theAustralian Accounting Standard, AASB 17Leases;
• Evaluating whether the risks and rewards ofthe equipment items transferred substantiallyto the Group under the lease agreements; and
• Assessing adequacy of the related disclosuresin Notes 2(iv), 3 and 15 of the financialreport.
Other information
The directors are responsible for the other information. The other information comprises theinformation in the Group’s annual report for the year ended 30 June 2017, but does not include thefinancial report and the auditor’s report thereon.
Our opinion on the financial report does not cover the other information and we do not express anyform of assurance conclusion thereon.
In connection with our audit of the financial report, our responsibility is to read the other informationand, in doing so, consider whether the other information is materially inconsistent with the financialreport or our knowledge obtained in the audit or otherwise appears to be materially misstated.
If, based on the work we have performed, we conclude that there is a material misstatement of thisother information, we are required to report that fact. We have nothing to report in this regard.
Responsibilities of the directors for the Financial Report
The directors of the Company are responsible for the preparation of the financial report that gives atrue and fair view in accordance with Australian Accounting Standards and the Corporations Act 2001and for such internal control as the directors determine is necessary to enable the preparation of thefinancial report that gives a true and fair view and is free from material misstatement, whether due tofraud or error.

69
Independent Auditors’ Report (continued) Annual Report 2017
Zenith Energy Limited
In preparing the financial report, the directors are responsible for assessing the ability of the group tocontinue as a going concern, disclosing, as applicable, matters related to going concern and using thegoing concern basis of accounting unless the directors either intend to liquidate the Group or to ceaseoperations, or has no realistic alternative but to do so.
Auditor’s responsibilities for the audit of the Financial Report
Our objectives are to obtain reasonable assurance about whether the financial report as a whole is freefrom material misstatement, whether due to fraud or error, and to issue an auditor’s report thatincludes our opinion. Reasonable assurance is a high level of assurance, but is not a guarantee that anaudit conducted in accordance with the Australian Auditing Standards will always detect a materialmisstatement when it exists. Misstatements can arise from fraud or error and are considered materialif, individually or in the aggregate, they could reasonably be expected to influence the economicdecisions of users taken on the basis of this financial report.
A further description of our responsibilities for the audit of the financial report is located at theAuditing and Assurance Standards Board website (http://www.auasb.gov.au/Home.aspx) at:
http://www.auasb.gov.au/auditors_responsibilities/ar1.pdf
This description forms part of our auditor’s report.
Report on the Remuneration Report
Opinion on the Remuneration Report
We have audited the Remuneration Report included in pages 15 to 26 of the directors’ report for theyear ended 30 June 2017.
In our opinion, the Remuneration Report of Zenith Energy Limited, for the year ended 30 June 2017,complies with section 300A of the Corporations Act 2001.
Responsibilities
The directors of the Company are responsible for the preparation and presentation of theRemuneration Report in accordance with section 300A of the Corporations Act 2001. Our responsibilityis to express an opinion on the Remuneration Report, based on our audit conducted in accordance withAustralian Auditing Standards.
BDO Audit (WA) Pty Ltd
Neil Smith
Director
Perth, 29 September 2017
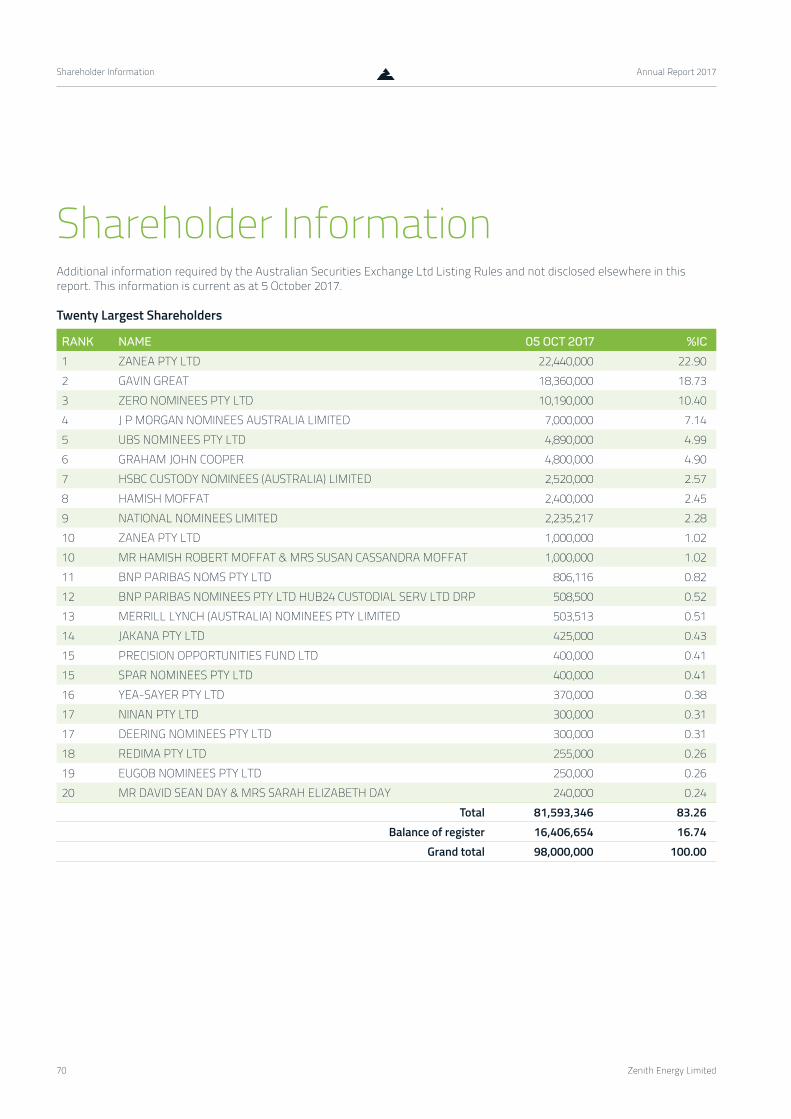
70
Shareholder Information Annual Report 2017
Zenith Energy Limited
Shareholder InformationAdditional information required by the Australian Securities Exchange Ltd Listing Rules and not disclosed elsewhere in this report. This information is current as at 5 October 2017.
Twenty Largest Shareholders
RANK NAME 05 OCT 2017 %IC
1 ZANEA PTY LTD 22,440,000 22.902 GAVIN GREAT 18,360,000 18.733 ZERO NOMINEES PTY LTD 10,190,000 10.404 J P MORGAN NOMINEES AUSTRALIA LIMITED 7,000,000 7.145 UBS NOMINEES PTY LTD 4,890,000 4.996 GRAHAM JOHN COOPER 4,800,000 4.907 HSBC CUSTODY NOMINEES (AUSTRALIA) LIMITED 2,520,000 2.578 HAMISH MOFFAT 2,400,000 2.459 NATIONAL NOMINEES LIMITED 2,235,217 2.2810 ZANEA PTY LTD 1,000,000 1.0210 MR HAMISH ROBERT MOFFAT & MRS SUSAN CASSANDRA MOFFAT 1,000,000 1.0211 BNP PARIBAS NOMS PTY LTD 806,116 0.8212 BNP PARIBAS NOMINEES PTY LTD HUB24 CUSTODIAL SERV LTD DRP 508,500 0.5213 MERRILL LYNCH (AUSTRALIA) NOMINEES PTY LIMITED 503,513 0.5114 JAKANA PTY LTD 425,000 0.4315 PRECISION OPPORTUNITIES FUND LTD 400,000 0.4115 SPAR NOMINEES PTY LTD 400,000 0.4116 YEA-SAYER PTY LTD 370,000 0.3817 NINAN PTY LTD 300,000 0.3117 DEERING NOMINEES PTY LTD 300,000 0.3118 REDIMA PTY LTD 255,000 0.2619 EUGOB NOMINEES PTY LTD 250,000 0.2620 MR DAVID SEAN DAY & MRS SARAH ELIZABETH DAY 240,000 0.24
Total 81,593,346 83.26Balance of register 16,406,654 16.74
Grand total 98,000,000 100.00
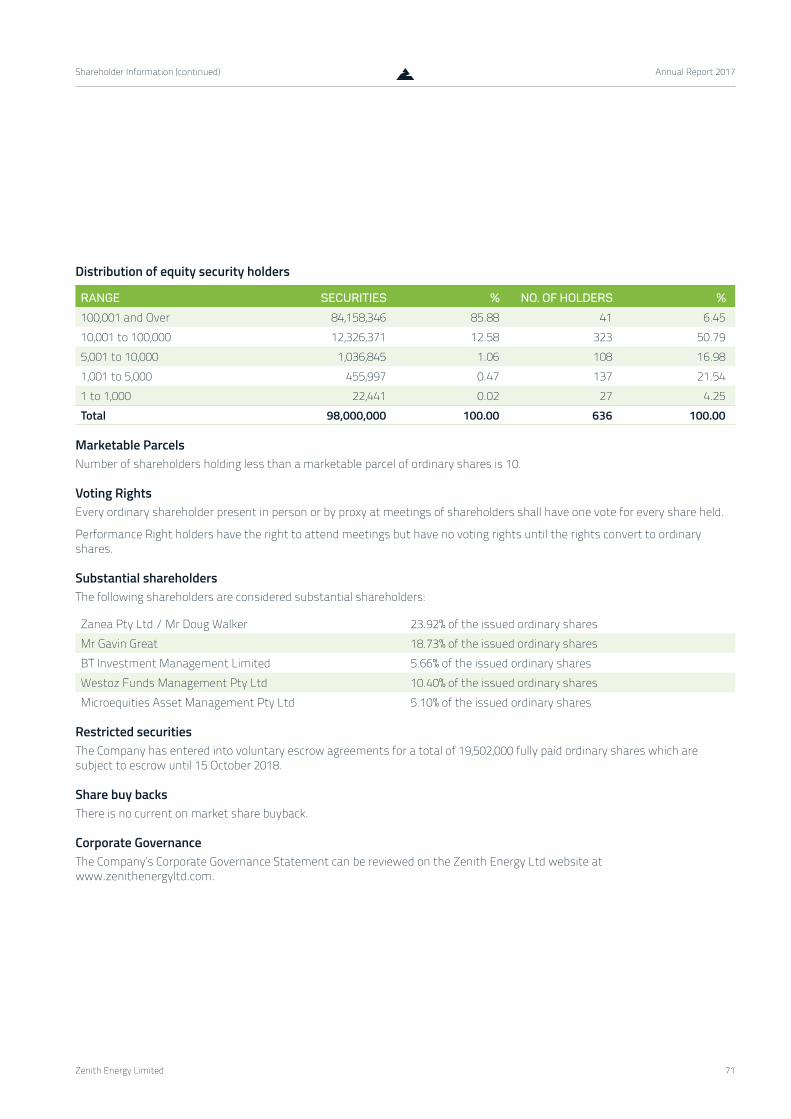
71
Shareholder Information (continued) Annual Report 2017
Zenith Energy Limited
Distribution of equity security holders
RANGE SECURITIES % NO. OF HOLDERS %
100,001 and Over 84,158,346 85.88 41 6.4510,001 to 100,000 12,326,371 12.58 323 50.795,001 to 10,000 1,036,845 1.06 108 16.981,001 to 5,000 455,997 0.47 137 21.541 to 1,000 22,441 0.02 27 4.25Total 98,000,000 100.00 636 100.00
Marketable ParcelsNumber of shareholders holding less than a marketable parcel of ordinary shares is 10.
Voting RightsEvery ordinary shareholder present in person or by proxy at meetings of shareholders shall have one vote for every share held.
Performance Right holders have the right to attend meetings but have no voting rights until the rights convert to ordinary shares.
Substantial shareholdersThe following shareholders are considered substantial shareholders:
Zanea Pty Ltd / Mr Doug Walker 23.92% of the issued ordinary sharesMr Gavin Great 18.73% of the issued ordinary sharesBT Investment Management Limited 5.66% of the issued ordinary sharesWestoz Funds Management Pty Ltd 10.40% of the issued ordinary sharesMicroequities Asset Management Pty Ltd 5.10% of the issued ordinary shares
Restricted securitiesThe Company has entered into voluntary escrow agreements for a total of 19,502,000 fully paid ordinary shares which are subject to escrow until 15 October 2018.
Share buy backsThere is no current on market share buyback.
Corporate GovernanceThe Company’s Corporate Governance Statement can be reviewed on the Zenith Energy Ltd website at www.zenithenergyltd.com.

ZENITH PACIFIC PTY LTDACN: 091 534 637
PERTH24 Brennan Way, Belmont Western Australia 6104
Phone: +61 8 9416 2000
CAIRNS80 Fearnley Street, Cairns Queensland, Australia 4870
Phone: +61 7 4051 9533


