ENVIRONMENT COMMITTEE REPORT Agenda Item 5.6 6 May 2008 ZERO NET UPDATE – DRAFT FOR PUBLIC CONSULTATION Division Sustainability and Regulatory Services Presenter David Mayes, Manager Strategic Planning and Sustainability Purpose 1. To provide the Environment Committee the draft of the Update of Zero Net Emissions by 2020 and to seek endorsement for the draft to be released for consultation. Recommendation from Management 2. That the Environment Committee: 2.1. note the findings in the draft Update of Zero Net Emissions by 2020; 2.2. endorse the release of the draft Update of Zero Net Emissions by 2020 for public consultation; and 2.3. note the proposed consultation process. Key Issues 3. The Update of Zero Net Emissions by 2020 provides the City of Melbourne with a revised carbon emissions inventory and targeted suite of actions for greenhouse mitigation within the municipality. This update was deemed essential for the following reasons: 3.1. The original Zero Net Emissions by 2020 was prepared in 2002 and was based on data collected from 2000-2002. Climate science, community expectations and available solutions have changed very significantly since this time. 3.2. The update will assist the City of Melbourne to shape its sustainability programs so as to maintain its leadership position, both within Australia and internationally. 4. Key findings from the Update of Zero Net 2020 are: 4.1. Total carbon emissions from the municipality for 2006 were 5.8 million tonnes of carbon dioxide equivalent. This is an increase of 54 percent from 2002’s figure of 3.75 million tonnes. The increase is due to a number of factors including: increase in workers and residents and an increase in the uptake of appliances such as plasma screen televisions. 4.2. The Update of Zero Net Emissions by 2020 provides a suite of strategies that can deliver a reduction of emissions between 50 and 60 percent. Strategies target residents, business, low carbon energy and transport. Page 1 of 101
Transcript
E N V I R O N M E N T C O M M I T T E E R E P O R T Agenda Item 5.6 6 May 2008
ZERO NET UPDATE – DRAFT FOR PUBLIC CONSULTATION
Division Sustainability and Regulatory Services
Presenter David Mayes, Manager Strategic Planning and Sustainability
Purpose
1. To provide the Environment Committee the draft of the Update of Zero Net Emissions by 2020 and to seek endorsement for the draft to be released for consultation.
Recommendation from Management
2. That the Environment Committee:
2.1. note the findings in the draft Update of Zero Net Emissions by 2020;
2.2. endorse the release of the draft Update of Zero Net Emissions by 2020 for public consultation; and
2.3. note the proposed consultation process.
Key Issues
3. The Update of Zero Net Emissions by 2020 provides the City of Melbourne with a revised carbon emissions inventory and targeted suite of actions for greenhouse mitigation within the municipality. This update was deemed essential for the following reasons:
3.1. The original Zero Net Emissions by 2020 was prepared in 2002 and was based on data collected from 2000-2002. Climate science, community expectations and available solutions have changed very significantly since this time.
3.2. The update will assist the City of Melbourne to shape its sustainability programs so as to maintain its leadership position, both within Australia and internationally.
4. Key findings from the Update of Zero Net 2020 are:
4.1. Total carbon emissions from the municipality for 2006 were 5.8 million tonnes of carbon dioxide equivalent. This is an increase of 54 percent from 2002’s figure of 3.75 million tonnes. The increase is due to a number of factors including: increase in workers and residents and an increase in the uptake of appliances such as plasma screen televisions.
4.2. The Update of Zero Net Emissions by 2020 provides a suite of strategies that can deliver a reduction of emissions between 50 and 60 percent. Strategies target residents, business, low carbon energy and transport.
Page 1 of 101
Attachments: 1. List of people targeted for the public consultation 2. Draft of the Update of Zero Net Emissions
2
5. The public consultation process will commence early May 2008 and finish early June 2008. This will allow the finalised report to be presented for consideration at the July Environment Committee meeting. The scope of the consultation includes:
5.1. Directly seeking comments from internal and external stakeholders. A full list of external stakeholders is at Attachment 1.
5.2. Making the draft available through the City of Melbourne website and Frontline.
5.3. A notice seeking public comment/submission will be published in Melbourne News, the Green Leaflet (electronic), Melbourne Weekly, and the Leader Newspaper.
6. The timeframe for consultation is the same as the timeframe for the final round of public consultation on the draft Future Melbourne. The Eco City Goal of the draft Future Melbourne Plan will include the high level directions and actions of the Update of Zero Net Emissions by 2020. This will provide a further avenue of consultation.
Relation to Council Policy
7. This report relates to the City Plan 2010, Zero Net Emissions by 2020 and Council’s commitment to the C40 Large Cities Climate Leadership Group (C40).
Government Relations
8. The City of Melbourne’s work to reduce greenhouse gas emissions supports international and national commitments and objectives including developing a national carbon pricing scheme.
Finance
9. There is no direct financial implication arising from the recommendation contained in this report.
Legal
10. The subject matter of the report is within the objectives of the Council.
Sustainability
11. Reducing greenhouse emissions is an important objective of Council as set out in the Council Plan and the Zero Net Emissions by 2020 policy.
Page 2 of 101
ATTACHMENT 1 List of people targeted for the public consultation. Name Position: Organisation Adrian Burrage Forum Future Melbourne Panellist Adriana Frescura City of Port Phillip Adrienne Clarke AC The University of Melbourne Alex Ben-Mayor Ygen Alister Thorpe Artist Alun Chapman AILA Andrew McSweeney Artist Angela Costi Artist Anita Struck Future Melbourne Future Melbourne Project Partner Anne Turley Forum Panellist Annette Nicol Australian Institute of International Affairs Vic Anthony McInneny Lecturer RMIT Arron Wood Future Melbourne Reference Group Ashley Chaleyer Ygen Gary Jamieson Assistant Commisioner Victoria Police Bala Star Ian Potter Museum - University of Melbourne
Barbara Norman Business and Partnerships Manager Global Cities Institute, RMIT University
Barbara Watterson Centre for Strategic Education Ben Foskett CEO Invest Victoria Bernadette O'Connor Southern Gippsland Learning Communities Bernie Carolan Metlink
Beth Riordan Federal Department of Environment, Water, Heritage and the Arts
Bich Ha North Yarra Comm Health Bill Horman Crown Limited Bill Russell GAMUT, University of Melbourne Bindi Gove VECCI Bob Williamson AO The University of Melbourne Brendan McClements VMEC
Brian Joyce Department of Human Services North & West Metro Region
Brian McNamee CSL Limited Bruce Wilson RMIT Cameron Reilly Podcast Network Carol Schwartz Future Melbourne Reference Group Carolyn Parker Forum Panellist Cath Smith Cathryn Kriewaldt Ygen Chanel Williams Artist Cheryl Batagol Future Melbourne Reference Group Chris Brown TTF Australia Chris Loader Bus Association of Victoria Chris Ryan VEIL, University of Melbourne Chris Ziguras Professor Global Cities Institute, RMIT University Christine Denmead Smart Geelong Clem Gillings Department Planning & Community Development Clement Mariotte The Climate Group Cobina Crawford Artist Curtis Riddington Ygen Dan Richardson Ygen
Attachment 1Agenda Item 5.6
Environment Committee6 May 2008
Page 3 of 101
Daniel Grollo Forum Panellist Daniel Khong Senior Designer VicUrban Daniel Mullerworth Ygen Danielle Johnston Future Melbourne Project Partner Danny Schwartz
David Buntine CEO Port Phillip and Westernport Catchment Mangagement Authority
David Crofts Agile David Gould Committee for Melbourne Future Focus Group David Hunt VicUrban David Imber David McCaffrey City of Port Phillip David Penington AC The University of Melbourne David Teller Committee for Melbourne Deni Greene Deni Greene Consulting Denis Moriarty Our Family Derek Denton The University of Melbourne Dianne Moy VEIL, University of Melbourne Don Henry Future Melbourne Project Partner Don Richter Tourism Victoria Donald Speagle The University of Melbourne Donna Lorenz Maunsell Dr Adam Sutton University of Melbourne Dr Clare Wright Forum Panellist Dr Gael Jennings Forum Panellist Dr Julie Jackson La Trobe University Dr Julie Wells RMIT University Dr Kate Shaw Forum Panellist Dr Patrick Greene Museum Victoria Dr Stella Clark Bio21 Australia Ltd Dr. David Wilmoth Learning Cities International Pty Ltd Dr. Paul Mees GAMUT, University of Melbourne Eddie Silviera Ygen Eli Greig Ygen Elizabeth Proust Future Melbourne Reference Group Elliot Fishman Institute for Sensible Transport – Director Emily Ballantyne-Brodie Ygen Fiona Sweetman Hidden Secret Tours Florence Forzy Yarra Trams Fred Mendelsohn The University of Melbourne Gavin Jennings (The Honourable) Victorian government Gayle Seddon City Wide Genevieve Overell Department of Sustainability and Environment Geoff Munro Australian Drug Foundation Geoffrey Conaghan Melbourne Airport George Lekakis Future Melbourne Reference Group George Pappas Future Melbourne Reference Group Graeme Liebelt Orica Limited Graham Curry Monash University/BAH Graham Tupper Forum Panellist Greg Andrews arts victoria Greg Hywood Tourism Victoria Guy Carvalho eVillage Manager eVillage Melbourne Harold Mitchell Future Melbourne Reference Group Harry Leather Citi Cite Helen Hayes Future Melbourne Project Partner Ian Butterworth City of Maribyrnong
Page 4 of 101
Ian Corcoran Artist Ian Wilcock Department of Foreign Affairs and Trade Jack Fuller Centre for Sustainability Leadership, Ygen Jack Holden Ecos Consulting Jago Dodson Forum Panellist James Angus The University of Melbourne James Fleming Ygen James McClusky The University of Melbourne James Savage Ygen Jan Scheurer RMIT University Jan Simmons Mt Evelyn Learning Town Jane Homewood ARUP
Jane Niall Department of Innovation, Industry & Regional
Development Jane Pound Social Ventures Australia( Vic Director) Jane-Frances Kelly Government Advisor Janet Rice Mayor Maribyrnong City Council Janet Russell Learning City Bendigo Jasna Dolic Artist Jason den Hollander Bicycle Victoria Jason Eades Artist Jeff Stewart Artist Jennifer Barry Keep Breathing Pty Jennifer Cunich Future Melbourne Project Partner Jenny Ford Manager Tourism Melbourne Jenny McGregor Asialink Jess Fritze Victorian Council of Social Services (VCOSS) Jim Saleeba Learning City Albury Wodonga Jo Cavanagh Forum Panellist John Denton Victorian Government Architect's Office John Fien Professor Global Cities Institute, RMIT University John Noonan John Pritchard Australian Local Government Association Judy Verlin Ballarat a Learning City Kate Brennan Federation Square Kate Colvin Future Melbourne Project
Partner
Kate Noble Future Melbourne Project Partner Kate Redwood eVillage Lounge Guest Katherine McLean Artist Keira McDonald Artist Ozanam Comm Centre Kerry McConnell Team Leader Road
Safety Behavioural Programs
VicRoads
Kevin Luten UrbanTrans Kevin Nuttall Waterfield Consulting Kim Kruger Artist Kirsten Larsen VEIL, University of Melbourne Kirsty Myer Foundation Kutcha Edwards Artist Lawrence Harvey Lecturer RMIT Leah Sertori Melbourne Cares Leon Kempler OAM Australia-Israel Chamber of Commerce Leonie Wheeler RMIT - Community Partnerships Linda Allison Future Melbourne Project Partner Lisa Warraner Global Arts Projects
Page 5 of 101
Lissa Zass Department of Justice Liz Suda The Melbourne Museum Louise Clarke Ygen Louise Dunn UoM Louise Smith Capital City LLEN Lowanna Norris Artist Luke Hodge Manager Future Melbourne Website
Lyn Harrop Department of Planning and Community Development
Lynne Lucas Deakin University Madeleine Tate Ygen Magdalena Moren Artist
Malcolm Baalman Department of Infrastructure Mandy Nicholson Artist Marcia Langton The University of Melbourne Marianne Fee UoM
Mario Maldoni Metro West Region – Traffic Engineer VicRoads
Mark Brophy Adult Learning Australia/Dept of Sustainability and Development
Martin Brennan Mary Sontrop CSL Limited Maureen Ngan Waterfield Consulting Maureen O'Keeffe AMES May Maloney Ygen Megan Evans Artist Melanie Hearne Ygen Michael Chew Ygen Michael Clanchy Consultant Michael Cox Sustainability Victoria Michelle Dawson City of Yarra Mick Douglas RMIT University
Mike Berry RMIT Global Studies Social Science and Planning Mike Scott Planisphere Monique Conheady Flexicar Morry Schwartz Forum Panellist Nancy De Losa Trawalla Foundation Natalia Thompson Agile Natalie King Artist Nick Alsop Sustainability Victoria
Page 6 of 101
Nick Green OAM Future Melbourne Reference Group Nick Low GAMUT, University of Melbourne Nicole Stockinger Tourism Victoria Nigel Bertram Arcjitect Norman Rosenblatt Pablo Brait Municipal Association of Victoria
Pamela Webb Knowledge Capital - Contractor Patricia Vickers-Rich Monash Unversity Patrick Green The Melbourne Museum Patrick Moriarty Monash University/GAMUT Paul James Professor Global Cities Institute, RMIT University Paul Matthews Yarra Trams Paul Murfitt Moreland Energy Foundation Paul Smith City of Port Phillip Paula Bradley Agile
Peter Chaffey Knowledge Capital Executive Peter Doherty AC The University of Melbourne Peter Keage Tourism Victoria Peter Mares Forum Panellist Peter Newman Forum Panellist Peter Rathjen The University of Melbourne
Peter Sheldrake RMIT
Peter Winckler Victorian Learning Towns Network Peter Yates Future Melbourne Reference Group Phil Hall ArtLab Philip Batterham The University of Melbourne Phillip Scanlan AM Singer Scanlan Group Phllip Adams Artist
Prof Andrew Flitman Swinburne University of Technology Prof Brian King Victoria University Prof David Copolov Monash University Prof Gabrielle Mc Mullen Australian Catholic University Prof James Angus Future Melbourne Project Partner
Prof John Freebairn Forum Panellist Prof John Wiseman Forum Panellist Prof Peter Creamer Victoria University Prof Peter Rathjen Future Melbourne Project Partner
Prof Rob Moodie Forum Panellist Prof Vijoleta Braach-Maksvytis University of Melbourne Prof Warren Bebbington Future Melbourne Project Partner Prue Holstein Asia Society Australasia Centre Ralph Horne Associate Professor Global Cities Institute, RMIT University Ray David student
Page 7 of 101
Ray Kinnear DoI Rhian Hinkley Artist Rhondah Galbally Our Community Richard Smithers City of Yarra, Transport Coordinator Rinske Ginsberg Artist Rob Campbell Ygen Rob Gell eVillage Lounge Guest Rob McGauran MGS Rob Turk Arup Robbie Guevara RMIT Global Studies Robin Laure Artist Roger Grant Tourism Alliance Victoria
Ron Jones Jones & Whitehead Pty Ltd Ross Onley_Zerkel Rosslynd Piggott Rupert Posner The Climate Group Ruth Whittingham Arts Access Sacha Cunningham Artist Sally Capp Committee for Melbourne
Sally Semmens DoI - Office of the Coordinator General Samatha Comte Artist Sandra Chipchase MCVB Sarah Bond Artist Sarah Merat Ygen Scott Willey RAIA Sid Myer Future Melbourne Reference Group Simon Maidment Architect Simon Reddy C40 Large Cities Climate Leaders Group Siska Waddington Ygen Snow Barlow The University of Melbourne Stefan Romaniw Community Languages Australia Stella Gray Ygen Stephen McGrail Ygen Steve Bright Steve Howard Global Foundation Steve Thorne Design Urban Pty Ltd Steven McKinnon Ygen Stuart Niven DPCD Urban Design Unit Sue Maclellan Consumer Affairs Victoria Sue Mcaculey Sue Nattrass Arts Consultant Superintendent John Cooke Victoria Police Swee Lim Asialink
Page 8 of 101
Tai Snaith Artist Terry Kennedy Brimbank/Melton LLEN Tim Costello Future Melbourne Reference Group Tim Murphy CEO BioMelbourne Network
Tim Patton Walking and Cycling Branch DoI
Tim Piper Victoria Australian Industry Group Tim Sullivan MCVB Tom Kvan Future Melbourne Project Partner
Tony Barton Manager Bicycle Programs VicRoads
Uncle Herb Patten Artist Victoria Foster Education Foundation Vijoleta Braach- Maksvytis
Future Melbourne Project Partner
Vince Punaro VicRoads Wayne Kayler-Thomson VECCI Wayne Wescott ICLEI, Local Governments for Sustainability
Wendy Williams Department of Innovation, Industry & Regional
This report has been prepared by Arup Pty Ltd for the City of Melbourne. It is not intended for and should not be relied upon by any third party and no responsibility is undertaken to any third party
Page 12 of 101
City of Melbourne Zero Net Emissions by 2020 Update 2008
Contents
Page Executive Summary i 1 Introduction 1
1.1 Overview 1 2 The case for urgent action 3
2.1 The global context 3 3 Leading by example 7
3.1 The sustainable vision for Melbourne 7 3.2 Implementation of Zero Net by 2020 emission strategies 7 3.3 Council emissions 8
4 Melbourne as a sustainable and healthy city – setting the conditions for low-impact living 9 4.1 Community emissions 9
5 A roadmap for emission reductions to 2020 13 5.1 Towards a low carbon future 13 5.2 The role of City of Melbourne as a leader in climate change 13 5.3 Commercial sector 14 5.4 Residential sector 22 5.5 Decarbonising the Energy Supply 28 5.6 Transport 34
6 Conclusion 38 Table 1 Combined emission reduction strategies in the commercial sector ......................................15 Table 2 City of Melbourne building types consumption characteristics ..............................................20 Table 3 Intervention points for existing buildings................................................................................22 Table 4 Total Emissions reductions in existing residential buildings..................................................24 Table 5 Main source of water heating in Melbourne...........................................................................27 Table 6 Carbon emission reduction potential energy supply initiatives ..............................................29 Figure 1 Conceptual approach to comparing divergent paths over the long term................................4 Figure 2 Greenhouse gas emissions by sector for the City of Melbourne 2005–06 – total emissions
estimated at 6.3 million tonnes carbon dioxide equivalents.............................................9 Figure 3 Projected greenhouse gas emissions by sector for the City of Melbourne 2020 – total
emissions estimated at 7.9 million tonnes carbon dioxide equivalents..........................10 Figure 4 Greenhouse gas emissions (kilotonnes carbon dioxide equivalents) for the City of
Melbourne from 2002, 2005–06 to 2020 (under a business-as-usual and Zero Net Update 2008 scenario) ...................................................................................................11
Figure 5 City of Melbourne – the municipality business strategy map ...............................................12 Figure 6 Options for a program to retrofit City of Melbourne unrenovated buildings..........................17 Figure 7 Options for a retrofit program for education, health and community buildings.....................18 Figure 8 Victorian domestic emissions by end use.............................................................................23 Figure 9 Principle of least-cost measures...........................................................................................34 Appendices Appendix A Melbourne Climatic Trends
Appendix B Zero Net Emissions by 2020 Action Implementation
Appendix C Leading City Actions
Page 13 of 101
City of Melbourne Zero Net Emissions by 2020 Update 2008
Appendix D Data Methodology
Appendix E Financial Modelling Methodology
Appendix F Decarbonising the Energy Supply
Glossary Abbreviation Meaning
5 Star 5 Star standard as required in the Building Code of Australia, Victoria Appendix Volume 2. From 1 May 2008, this requirement will be extended to home renovations and relocations.
ABARE Australian Bureau of Agriculture and Resource Economics
ABGR Australian Building Greenhouse Rating Scheme
ABS Australian Bureau of Statistics
ANZSIC Australia and New Zealand Standard Industrial Classification
CCI Clinton Climate Initiative
CEO Chief Executive Officer
CH4 methane
CHP Combined Heat and Power
CLUE City of Melbourne Census of Land Use and Employment
CO2-e carbon dioxide equivalents
CO2 carbon dioxide
GDP Gross Domestic Product
HFC hydrofluorocarbons
IPCC Intergovernmental Panel on Climate Change
kt kilotonnes
LGA Local government area
N20 nitrous oxide
PFC perfluorocarbons
ppm parts per million
PV photovoltaic cells
SF6 sulfur hexafluoride
VGGI Victorian Greenhouse Gas Inventory
VEET Victorian Energy Efficiency Target
Page 14 of 101
Page i
Executive Summary
The publication in 2002 of Zero Net Emissions by 2020 – A roadmap to a climate neutral city (Zero Net 2002) positioned the City of Melbourne as a world leader by setting an ambitious target of zero net emissions by 2020. These emissions were defined as greenhouse gases associated with the City of Melbourne’s own activities and those generated by the community within its municipal boundaries. To achieve this target, Zero Net 2002 defined three strategies: leading edge design, greening the power supply, and sequestration – each with a series of supporting actions. These actions were predominantly structured over a five-year timeframe to 2007 and as such, this strategy update, Zero Net Emissions by 2020 –Update 2008, reviews progress against these actions and sets a revised path to zero net emissions by 2020.
Of the three strategies contained in Zero Net 2002, the majority of actions under the strategy of leading edge design have been completed, in turn contributing to the development of Melbourne as a hub for sustainable building design. Greening the power supply is a longer-term strategy and therefore not as much as progress has been made in relation to these actions, while the actions under sequestration have been largely surpassed by the commitment of the Australian Government to a National Emissions Trading Scheme by 2010.
Since the adoption of Zero Net in 2002, the City of Melbourne has continued to develop at the heart of a thriving, vibrant metropolis. High population growth rates and a robust economy have delivered significant benefits to the municipality, both economically and socially.
In the intervening period, as our understanding of climatic systems and the rate of global carbon emissions has increased, the need for urgent action to mitigate carbon emissions has become increasingly clear. The need for urgent action has stemmed from recognition that climate change is occurring and emission rates are increasing, while the cost of early action on mitigation will be significantly less over time (compared with no action being taken and mitigation being left to later years). Early mitigation also has the potential to drive the development of new technologies and business opportunities.
The global increase in emissions has reflected a similar trend in community-generated emissions within the municipality of the City of Melbourne. Emissions over the period from 2001-02 to 2005–06 have increased 54 per cent, from 3.75 million tonnes of carbon dioxide equivalents (t CO2-e) to 5.8 million t CO2-e.
This increase is significant and has been driven by the City of Melbourne’s growth in all areas; specifically in the commercial sector and the number of residents and associated dwellings within municipal boundaries. This growth has been combined with an ongoing change in the way we live, with the number and energy intensity of appliances continuing to increase. The inclusion of Docklands from 1 July 2007 within the administrative bounds of the City of Melbourne has also driven an increase in emissions.
While community emissions have increased, greenhouse gas emissions associated with the City of Melbourne’s own activities have continued to decline and are on track to meet the target of zero net by 2020, as well as the interim target of a 50 per cent reduction on 1996–97 emission levels by 2010.
This Zero Net Update 2008 reinforces the City of Melbourne’s commitment to zero net greenhouse gas emissions by 2020 and realigns and updates the strategies and actions for achieving this goal. It builds on the achievements of Zero Net 2002 and incorporates actions identified by other leading city municipalities.
The four strategies with supporting actions within Zero Net Update 2008 have been more closely aligned with how the data is determined and comprise the following:
• commercial
• residential
Page 15 of 101
Page ii
• decarbonising the energy supply
• transport.
Under a business-as-usual scenario it is anticipated the community emissions will increase to 7.9 million t CO2-e by 2020. Through the application of the above strategies, it is predicted that emissions can be reduced by 2.9 million t CO2-e per annum (excluding any reductions in transport emissions). This represents an approximate 46 per cent decrease in non-transport emissions by 2020.
Commercial sector
By 2020 an emission-reduction target of approximately 1,004 kt CO2-e, or a 24 per cent reduction in business-as-usual emissions across the commercial sector, has been set. Achievement of this level of reduction depends, however, on a range of variables – so low and medium targets have also been set. The City of Melbourne will facilitate achieving targets in each of the following sub-sectors:
• existing office buildings through a large-scale program to retrofit about 1200 buildings over a period of eight years, accompanied by appropriate sanctions, incentives and promotions to achieve this challenging goal within the timeframe
• new office buildings by increasing greenhouse performance standards to Australian Building Greenhouse Rating Scheme (ABGR) 5 Stars or greater by 2012
• education, health and community buildings through facilitating this sector to establish a program to retrofit its buildings
• sales and tourism sector by encouraging the accommodation sector and the retail and wholesale sector to retrofit buildings and by establishing new standards for hotel, retail and wholesale developments.
Residential sector
The target for the residential sector is to reduce emissions from business-as-usual by 26 per cent by 2020, or 195 kt CO2-e. This will be achieved by focusing on the largest proportional sources of emissions that can be reduced for the least cost, specifically:
• space and water heating (approximately 12,000 households)
• common areas in high-rise developments (75 per cent of all high-rise developments, or a total of 24,507 dwellings)
• lighting and other measures.
The City of Melbourne will enable emissions reductions in the residential sector using three strategies:
• a house-to-house audit program targeting space, water heating and insulation in approximately 12,000 households
• commissioning retrofits on common areas in 75 per cent of all high-rise residential developments and communal hot water and space heating where feasible and appropriate
• a behaviour-change program to encourage resident involvement in the audit program, and provide broader energy efficiency advice and information to residents about living and working in Melbourne.
Decarbonising the energy supply
A target of 1455 kt CO2-e of emission reductions has been set, which represents just under 20 per cent of total emissions in 2020. Major contributors to this reduction target are to be derived from combined heat and power or combined cycle cooling, heat and power systems. It is anticipated that a small proportion of emissions reductions will derive from proven renewable technologies such as wind on a large and small scale and solar power (photovoltaic cells).
Page 16 of 101
Page iii
This target is based on an assessment of targets set by other cities, and against the technologies available to meet the target. It is highly likely that the new market conditions created by the National Emissions Trading Scheme and the new Mandatory Renewable Energy Target will ensure that market investment can be realised to support the most economically viable, locally sourced, renewable and low-carbon technologies within the boundaries of the City of Melbourne.
To complete the steps necessary for implementation, the City of Melbourne will look to establish an arms-length agency with appropriate legal and financial powers.
The agency will have its own high-profile board with sufficient expertise and acumen to drive critical decisions for the agency and proactively develop relationships with other partners as required.
The agency could also undertake the administrative functions to support the other two main streams of this strategy in the residential and commercial sectors.
A business case will be developed to establish such an arms-length agency to drive the implementation of this decarbonisation strategy. The City of Melbourne will consider both business cases by June 2009.
Transport
The City of Melbourne will a range of measures to reduce emissions from road-based transport, and the carbon intensity of the public transport system, including:
• decarbonisation of the public transport system by 20 per cent through the introduction of low-carbon or clean source energy into the public transport network, thereby reducing reliance on emission-intensive sources
• institution of a congestion charge for emitting vehicles entering the City of Melbourne, with consideration of a scale of tariffs for vehicles with high emission levels, to achieve a 15 per cent reduction in car emissions by 2012 and maintained to 2020
• introduction of an integrated Cycle Melbourne scheme combining bicycle hire, greatly expanded end-of-trip facilities and cycling infrastructure to be supported by revenue raised by the congestion charge, resulting in a 100 per cent increase in bicycle use by 2015, and an associated target of 10 per cent reduction in car emissions.
Limitations
The baseline data for the individual sector emissions have been sourced mainly from the Australian Bureau of Agricultural and Resource Economics (ABARE) data on energy use, which is reported by Australia and New Zealand Standard Industrial Classification (ANZSIC) sectors at the Victorian scale. The energy use was then converted to emissions in terms of carbon dioxide equivalents which include the gases CO2, N2O and CH4. The other Kyoto gases (HFCs, PFCs and SF6) are generally associated with industrial process emissions. Industrial process emissions have been excluded from this strategy as they represent a very small proportion of the total emissions.
The emissions calculated at the Victorian scale were apportioned to the City of Melbourne based on indicator sets that were available at both the Victorian scale and the City of Melbourne scale for both 2005–06 and 2020 projections. This was generally limited to employment data. Emissions growth is therefore predicted to occur in proportion to the employment growth within each sub-sector.
Page 17 of 101
Page 1
1 Introduction 1.1 Overview
The publication in 2002 of Zero Net Emissions by 2020 – A roadmap to a climate neutral city (Zero Net 2002) positioned the City of Melbourne as a world leader by setting an ambitious target of zero net emissions by 2020. These emissions were defined as greenhouse gases associated with the City of Melbourne’s own activities and those generated by the community within its municipal boundaries. To achieve this target, Zero Net 2002 defined three strategies: leading edge design, greening the energy supply, and sequestration – each with a series of supporting actions.
Since the adoption of Zero Net in 2002 the City of Melbourne has continued to develop at the heart of a thriving, vibrant metropolis. High population growth rates and a robust economy have delivered benefits to the municipality.
As the City of Melbourne has prospered, so the debate surrounding climate change has developed and matured internationally and at all levels of Australian government. During this period, as our understanding of climate change and global emission levels has increased, the need for urgent action has become more apparent.
Key developments that have shaped the climate change debate over this period are:
International
• recognition that global economic growth is driving higher emissions
• acceptance that a certain level of climate change is inevitable to 2040
• commencement of operation in January 2005 of the European Union Greenhouse Gas Emissions Trading Scheme
• in principle agreement at the United Nations Climate Change Conference in Bali of the need to develop an international framework that moves beyond the Kyoto Protocol and engages developing countries in greenhouse gas mitigation.
Australian
• ratification of the Kyoto Protocol by the Australian Government in December 2007 at the United Nations Climate Change Conference in Bali
• a commitment by the Australian Government towards development and operation of an Australian National Emissions Trading Scheme by 2010.
Victorian
• the proliferation and acceptance of voluntary ‘green building’ rating schemes within the Victorian and in particular the Melbourne built-environment market
• the introduction in 2005 of the requirement that all new residential developments have a 5 Star energy rating for building fabric.
City of Melbourne
• the opening in 2006 of the 6 Star Green Star rated City of Melbourne Council House 2 (CH2), a flagship development in terms of environmental performance that has proven a catalyst for the development of Melbourne as a hub for sustainable building design
• the significant reduction of 41 per cent in council emissions over the period from 1996–97 to 2006–07
• the introduction of a mandatory energy performance requirement by the City of Melbourne through the C60 planning amendment for office developments greater than 2500 m2
• the City of Melbourne joining the C40 Large Cities Climate Leadership Group.
Within the context of these developments, the City of Melbourne has recognised a need to build on the success of Zero Net 2002 in areas such as progressing Melbourne as a centre
Page 18 of 101
Page 2
for leading edge design and to update it to reflect the current political, technological and behavioural environment surrounding climate change.
There is also recognition of the need for the City of Melbourne to align with other like-minded climate change cities. At an international level a significant number of city authorities, such as the Greater London Area, New York City and Tokyo have now developed and are implementing climate mitigation strategies that move beyond those defined within the original Zero Net 20021. As with the City of Melbourne, these cities are members of the Large Cities Climate Leadership Group. This group of cities, backed by the William J Clinton Foundation, has committed to leadership in climate change and a reduction in greenhouse gas emissions.
This Zero Net Update 2008 reinforces the City of Melbourne’s commitment to zero net greenhouse gas emissions by 2020 and updates the actions for achieving this goal. It builds on the achievements of Zero Net 2002 and incorporates actions identified by other leading city municipalities.
It does this through:
• reviewing progress against the three strategies contained within Zero Net 2002
• providing revised strategies under the headings of commercial, residential, decarbonising the energy supply, and transport
• defining pathways to implementation for each strategy.
1 Greater London Area Action Today to Protect Tomorrow The Mayor’s Climate Change Action Plan 2007, New York City and Tokyo; New York City A Greener, Greater New York Plan NYC and Tokyo Tokyo Climate Change Strategy – A 10 Year Project for a Carbon-minus Tokyo 2007
Page 19 of 101
Page 3
2 The case for urgent action 2.1 The global context
The case for urgent action on greenhouse gas emissions is clear. The Intergovernmental Panel on Climate Change (IPCC), Garnaut Climate Change Review and the Stern Review in the UK have identified that:
• we are now experiencing the initial stages of climate change
• the financial costs of not acting significantly outweigh that of early action
• early action has the potential to drive the development of new industries and economic prosperity
• the growth in global emissions has accelerated since the start of 2000
• the window of opportunity to stabilise levels of global carbon dioxide levels is rapidly diminishing.
2.1.1 Initial stages of climate change Since 1990 the IPCC has produced four assessments that combine and review existing scientific knowledge and research surrounding the rate of climate change and the level of carbon emissions. The latest report published in 20072 noted that there was now an unequivocal greater-than-90-per-cent chance that since 1950 the global net effect of human activities has been warming.
The Garnaut Review, in summarising key trends in relation to climate change, notes that over the past century the temperature of the planet has risen by about 0.7oC, a change that represents more than 10 per cent of all of the temperature change that occurred between the last Ice Age and the present.
In the Australian and Victorian context, the CSIRO and Bureau of Meteorology in 2007 built on the projections prepared by the IPCC and identified that underlying annual climatic variability in Australia has mirrored the global trend with higher temperatures towards the end of the twentieth century and into the start of the twenty-first century, and a reduction in rainfall in areas such as south-western Victoria.
Those trends are replicated in Melbourne with the average temperature increasing since 1950 by 1.30°C and average rainfall declining. These climate changes are set to continue until 2040 as the emissions that will contribute to this change have already occurred. Further details on historical and predicted climate changes in relation to Melbourne are provided in Appendix A.
2.1.2 The financial cost of action The economic implications of climate change have been considered in the review undertaken by the head of the UK Government Economic Service, Sir Nicholas Stern, in the Stern Review: The Economics of Climate Change 3 (the Stern Review).
In terms of economic impact, the Stern Review notes that as the average global temperature increases, the consequences of climate change will become disproportionately more damaging, as measured by changes in mortality, income and ecosystems. That is, an increase by 1oC in the global average from 3oC to 4oC will lead to significantly more damage, than from 1oC to 2oC.
Figure 1 provides two conceptual mitigation paths taken from the Stern Review, one route illustrating the income impact over time of early-action mitigation (path with mitigation) and the other route the implications of delayed mitigation (path without mitigation). The path with mitigation indicates that economic growth in the short term will be less than without mitigation, as the costs of implementing measures reduces the level of economic growth. Over time, however, economic growth without mitigation decreases relative to the path with mitigation as the damage associated with climatic change impacts the global economy.
2 IPCC 2007) 3 HM Treasury (2006)
Page 20 of 101
Page 4
Figure 1 Conceptual approach to comparing divergent paths over the long term4
Underpinning Figure 1 is the concept of disproportionate damage: if action is not taken to mitigate greenhouse gas emissions and the global average temperature continues to increase beyond 1oC to 2oC, the level of financial burden will be five to 20 per cent of Gross Domestic Product (GDP) compared with the cost of acting now, which the Stern Review estimates would represent one per cent of GDP.
The extent of the actual financial impact depends on the specific circumstances of a country and the ability of that country to geographically, financially and from a governance perspective withstand climate-associated damage. The Garnaut Review has identified Australia as potentially the most susceptible developed country, directly through our predominantly arid climate and historically variable rainfall and indirectly through our geographical proximity to a range of vulnerable economies and societies. On this basis the financial burden for future generations of Australians, if action is not taken, is likely to be towards the higher end of the scale identified in the Stern Review.
The City of Melbourne, through Zero Net 2002 and this Zero Net Update 2008, has placed the municipality on the path with mitigation. The challenge is to ensure the mitigation is of a level sufficient to assist in reducing the rate of climate change.
2.1.3 Early action as a driver of economic prosperity The impacts of climate change and associated policies will affect significant macro and micro economic transformations. National economies will undergo fundamental industry-centric shifts, and individual businesses will be compelled to change by policy and price-related influences. The largest impact will most likely be on energy intensive sectors, however, increasing resource scarcity and the associated cost implications of climate change will have ramifications for all.
Business and government are recognising the pending changes and the opportunities and benefits associated with early action, particularly involving the recognition of the commercial benefits associated with a transition to a low-emissions economy.
This recognition is already driving a range of opportunities across industries and services such as the creation of alternative technologies and products, more efficient logistics and production processes, and associated marketing and branding opportunities.
In the service sector particularly, financial institutions have been swift to capture the commercial opportunities associated with climate change such as capital raising for low-carbon technologies, investment in carbon businesses, and the creation of specialist carbon-trading environments and financial instruments.
4 ibid
Page 21 of 101
Page 5
Governments that are quick to recognise the opportunities inherent in the emerging carbon-constrained economy will support early movers by setting appropriate policy levers to support new carbon businesses and providing an initial environment to ensure they are competitive on a national and international level.
Swift commercial action to capture climate change opportunities will potentially have significant positive spin-offs such as assisting to manage the macro economic employment ‘shift’ as jobs transition away from carbon-intensive activities, identification of inefficiencies and cost reductions in business processes and government policy, and the encouragement of businesses to address the broader environmental agenda.
2.1.4 Growth in global emissions Developed countries have historically been responsible for a significant proportion of global greenhouse gas emissions. It is estimated that since 1850, North America, Europe and Australia have accounted for 70 per cent of cumulative carbon dioxide emissions from energy production. Developing countries by contrast have accounted for less that one per cent of cumulative carbon dioxide emissions over this period.
The growth in global carbon dioxide emissions from 2000 to 2006 has been close to three times that of the preceding decade. Growth in this period has been on average over three per cent per year compared with 1.1 per cent from 1990 to 1999.
In its assessment reports, the IPCC has prepared a series of carbon dioxide emission growth scenarios to 2100 that consider emission trends and how economic, social and technological drivers may influence these trends. These scenarios effectively represent plausible futures of how emission profiles may develop based on current approaches to carbon mitigation. The most extreme of these scenarios – in terms of emissions growth –represents a situation where continued strong economic growth is coupled with a heavy reliance on fossil fuels. If this scenario is continued to 2100 it is predicted that the average global temperature could rise by an average of six degrees.
The Garnaut Review has identified that on the basis of actual growth, the concentration of carbon dioxide in the atmosphere will exceed the extreme scenario identified by the IPCC sometime between 2015 and 2020.
The primary reasons for this rate of growth in global emissions is the continued and sustained period of global economic growth since the turn of the century, the acceleration of growth in the economies of China (10 per cent per annum) and India (nine per cent per annum), the energy intensity of global growth and carbon intensity of this energy.
This increase in emissions has been replicated by a growth in emissions from community activities within the boundaries of the City of Melbourne. In the period since Zero Net 2002 was published, total emissions from community activities has increased from 3.75 million tonnes to 5.8 million tonnes in 2005–06, a 54 per cent increase. A discussion of the factors influencing this growth is provided in Section 4.1, as is consideration of the relative contribution of different sectors to these emissions.
2.1.5 Opportunity to act A consequence of the increased rate of global growth in emissions is that the window of opportunity to act is rapidly diminishing. The target atmospheric concentration identified in the Garnaut Review and discussed at the Climate Change Conference in Bali in late 2007 is 450 ppm tonnes of CO2-e.
To limit atmospheric levels to this concentration, global emission levels would need to peak in 2010, reduce to 2000 levels by 2020 and halve by 2050. The Garnaut Review also considers a target of 550 ppm tonnes of CO2-e, which would require a peak in emissions around 2030 and then a reduction to 2000 levels by 2050. As the concentration of carbon in the atmosphere rises from 450 ppm to 550 ppm, so too do the risks to society associated with climate change.
Given the current underlying growth in emission levels, stabilisation at 450 ppm tonnes of CO2-e is considered highly unlikely. The focus is therefore on stabilisation at an atmospheric
Page 22 of 101
Page 6
concentration of 550 ppm tonnes of CO2-e. The Garnaut Review identifies that to achieve this target, urgent, large and effective policy change is required.
Page 23 of 101
Page 7
3 Leading by example 3.1 The sustainable vision for Melbourne
The City of Melbourne’s vision for its municipal area is for a thriving and sustainable city that simultaneously pursues economic prosperity, social equity and environmental quality. A key element of this vision has been to encourage people to reside in the city. As noted in the 2004 Places for People study, this vision has guided the regeneration of the city during the past two decades from an under-used and inhospitable location to a vibrant and charming 24-hour place.
A key element of this revitalisation has been the City of Melbourne’s active promotion of the city as a place to reside – through its strategic planning process and urban design policies. The council’s Postcode 3000 program promoted the city as a place to reside through financial incentives, technical and street level support and city-living promotions. The success of this program is evident today with 71,226 residents now living in the City of Melbourne. The number of apartments in the city area has increased a significant 3311 per cent in the period from 1982 to 2002 and this movement of residents to the city is set to continue. By 2020 it is estimated that there will be 109,100 residents living in the city.
Through active encouragement of residential development and by providing a centre of culture and entertainment, the City of Melbourne has created an attractive location for Melburnians to reside. From a whole-of-Melbourne perspective, this vision has the potential to assist in reducing overall emissions as it removes or significantly reduces the need for residents to use a motor vehicle to commute for work, entertainment or shopping purposes.
3.2 Implementation of Zero Net by 2020 emission strategies
In late 2007 the City of Melbourne commissioned Business Outlook and Evaluation to undertake a review of progress against the three key strategies contained in Zero Net 2002.
The resulting report, City of Melbourne’s Zero Net Emissions by 2020 – A Brief Review5, indicated that the council had made good progress towards its goal of zero net carbon emissions and a summary of the progress against each of the three strategies is provided below. A breakdown of progress against each of the actions contained in Zero Net 2002 is contained in Appendix B.
3.2.1 Leading edge design A majority of the actions contained in Zero Net 2002 have been achieved by the City of Melbourne in regard to the leading edge design strategy. Since the City of Melbourne adopted Zero Net 2002, there has been a transformation in the building sector, with Melbourne emerging as a leader in terms of green building design and performance.
While this transformation is not solely due to the actions of the City of Melbourne, its direction as a leader is viewed as influencing this transformation. Highlights during this period include the opening in 2006 of the 6 Star Green Star CH2. CH2 is now considered to be a benchmark in terms of sustainability performance within Melbourne’s central business district.
Also of note has been the City of Melbourne’s introduction of a mandatory requirement for developments greater than 2,500 m2 to achieve an energy performance rating of 4.5 Stars under the Australian Buildings Greenhouse Rating Scheme (ABGR). This was achieved through the C60 planning amendment.
3.2.2 Greening the power supply Greening the power supply, or decarbonising the energy supply, is identified as a longer-term objective and less progress has been made in relation to this strategy. Part of this stems from the City of Melbourne’s need to have the support of a range of parties in order to progress the actions contained in this strategy.
5 Business Outlook and Evaluation (2007)
Page 24 of 101
Page 8
The increasing cost of energy and the introduction of a National Emissions Trading Scheme are likely to increasingly influence decisions and improve the attractiveness of energy efficiency measures and renewable energy.
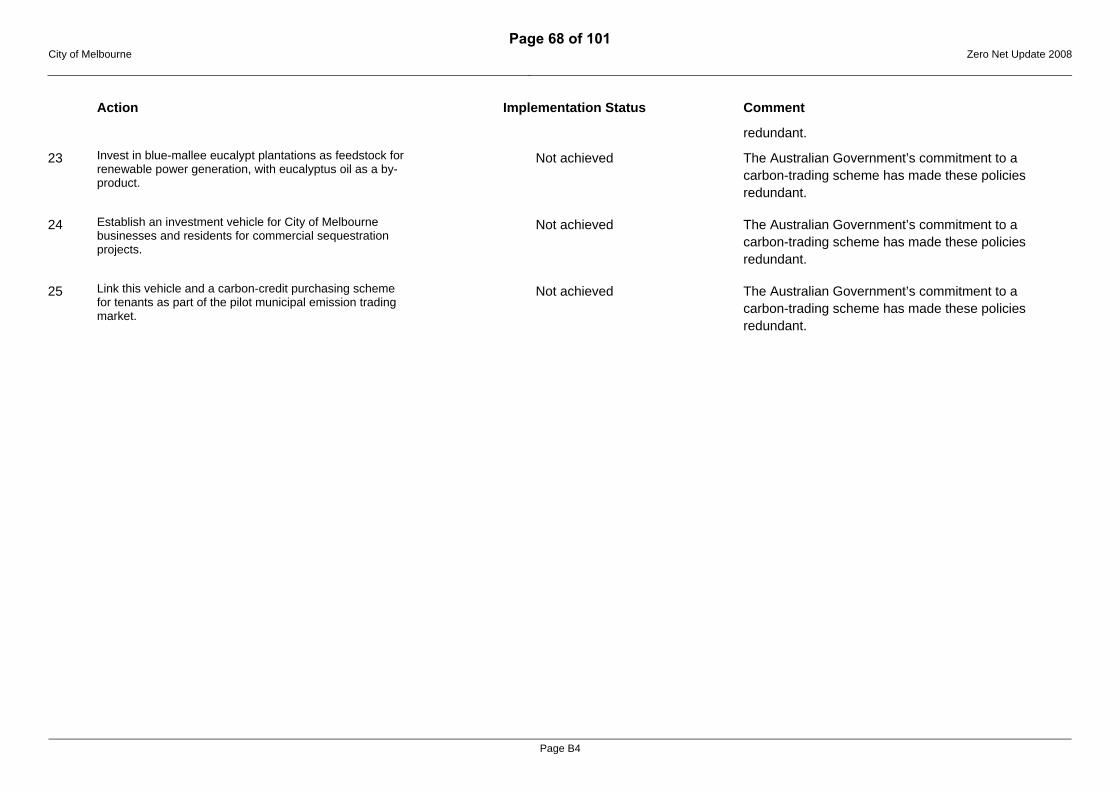
3.2.3 Sequestration This strategy was largely built around the City of Melbourne developing and assisting with the formation of a process whereby the sequestration of carbon emissions would be recognised in the absence of an emissions trading scheme. Sequestration is a form of offsetting and is central part of Zero Net 2002. The commitment by the Australian Government to the development and commencement of a National Emissions Trading Scheme in 2010 has resulted in the majority of actions within this strategy being considered unnecessary.
3.3 Council emissions
In addition to defining the path for reducing emissions within the municipality, Zero Net 2002 provided the framework for the City of Melbourne to reach zero net emissions from its own operations by 2020. As with the approach for the municipality, this approach was defined through the strategies of:
• reducing energy use through efficiency measures
• increasing the purchase of energy from renewable sources
• sequestration of the remaining emissions through the purchasing offsets.
On the basis of this framework, in 2006 the City of Melbourne produced the Draft City of Melbourne Greenhouse Action Plan 2006–2010 (Council Operations) (Greenhouse Action Plan). As well as reinforcing the Zero Net 2002 target of zero net emissions by 2020, the Greenhouse Action Plan set an interim target for 2010 of a 50 per cent reduction in council emissions from the 1996–97 base year figure of 31,165 tonnes of greenhouse gases.
The most recent determination of council emissions for 2006–07 indicated there had been a substantial reduction in emissions to 18,311 tonnes of greenhouse gases, a 41 per cent reduction on 1996–97 levels that places the city on course to meet its 2010 target. In terms of council activities that contributed to the 2006–07 emissions, over half were from the provision of street lighting, while energy for council buildings, both administrative and community, represented approximately 42 per cent of emissions.
In terms of actions over the period from 2006 to 2010, the Greenhouse Action Plan builds on the approach in Zero Net 2002. For energy efficiency it focuses on four sectors of council operations that contribute to emissions:
• buildings
• public lighting
• vehicle fleet
• waste and other emissions
Complementing the measures within these sectors, the City of Melbourne, in line with Zero Net 2002, has increased the procurement of renewable energy from 20 per cent in 2005–06 to 33 per cent in 2006–07. In terms of sequestration, the City of Melbourne is investigating a trial to offset the residual emissions associated with the operation of CH2 and the Town Hall.
A key development in the Greenhouse Action Plan was a commitment by council to start accounting for emissions from those operations outsourced for external management or service delivery. Activities that fall within this category are:
• waste collection services provided to the City of Melbourne
• street cleaning activities
• wholly owned subsidiaries and assets in the City of Melbourne investment portfolio.
The process and reporting frameworks for accounting for these emissions is still being developed and will be included in future City of Melbourne emissions calculations.
Page 25 of 101
Page 9
4 Melbourne as a sustainable and healthy city – setting the conditions for low-impact living 4.1 Community emissions
4.1.1 Overview The focus of Zero Net 2002 and this Zero Net Update 2008 is on mitigating the level of emissions from community activities. An understanding of the contribution of each sector to these emissions is crucial to maximise the effectiveness of the zero net strategy and supporting actions.
Zero Net 2002 estimated that community emissions for 2001-02 financial year were 3.75 million t CO2-e and categorised these emissions on the basis of four categories: commercial, industrial, residential, and vehicles and other. Zero Net Update 2008 has updated the community emission inventory to 2005–06 and provides further detail by classifying emissions under the standard categories specified by the IPCC. In addition, the consideration of transport-related emissions has been expanded to include emissions from freight transport in addition to those from passenger transport. A detailed explanation of the approach taken for calculating the 2005–06 financial year inventory is contained in Appendix D.
4.1.2 Current emissions The community emissions for 2005–06 are provided in Figure 2 and provide an overall total of 6.35 million t CO2-e. If the contribution from freight transport is removed to enable direct comparison with Zero Net 2002, total emissions decline to 5.8 million t CO2-e, a 54 per cent increase in emissions from 2002.
Figure 2 Greenhouse gas emissions by sector for the City of Melbourne 2005–06 – total emissions estimated at 6.3 million tonnes carbon dioxide equivalents6
Residential 9%
Commercial55%
Manufacturing12%
Water 1%
Passenger transport
(road+rail) 12%
Freight transport (road+rail) 8%
Waste4%
Other1%
4.1.3 Emission trends While the increase in emissions from 2001-02 to 2005–06 is significant, it is necessary to consider the underlying factors that have contributed to this growth. These factors can be classified in terms of growth in the City of Melbourne, changes in the way we are living and an expansion of the municipal boundary.
A thriving city
The City of Melbourne undertakes on a biennial basis a Census of Land Use and Employment (CLUE), with the latest survey undertaken in 2005–06. Comparison with the previous surveys of 2004 and 2002 reveals a city in a period of prosperity and expansion, with the emergence of Docklands as a residential, commercial and entertainment district providing a significant contribution to this growth. Key trends of note are a:
• 45 per cent increase in the number of residential apartments
6 ‘Other’ incorporates emissions from agriculture, construction, transport services and wastewater.
Page 26 of 101
Page 10
• 12.8 per cent increase in the number of workers in the city
• 15 per cent increase in office floorspace
• 12.6 per cent increase in employment.
The significant expansion in the number of residential apartments in the city has been reflected in the residential sector’s relative contribution between 2001-02 and 2005–06, increasing from three per cent to 10 per cent of emissions.
A changing way of living
In terms of how we are living, there are a number of trends leading to an increase in the level of emissions, specifically from the residential sector. These are an:
• increasing number of household appliances and the electricity demand of non-white goods
• increase in the number of residences with air-conditioning in response to a warming of the climate.
City of Melbourne boundary changes
In addition to these underlying socio-economic trends, as of 1 July 2007 the City of Melbourne assumed administrative responsibility for the Docklands precinct. Given the level of development within Docklands over the previous four years, the inclusion of this area within the boundary of the City of Melbourne is considered to have significantly influenced the level of greenhouse gas emissions.
Further boundary changes will occur on 1 July 2008 as a result of the Kensington Boundary Review, when the City of Melbourne assumes administrative responsibility for the suburbs of Kensington and the section of North Melbourne currently under the municipal authority of Moonee Valley City Council. It is expected that the inclusion of these additional areas will influence total emissions during future reporting periods.
4.1.4 Projected emissions The projected change in the contribution of each sector to emissions to 2020 is illustrated in Figure 3 and indicates an emissions total of 7.9 million t CO2-e without mitigation measures. If freight transport is removed to enable comparison with Zero Net 2002, total emissions decrease to 7.2 million t CO2-e or the equivalent of a 91 per cent increase in emissions on 2002 levels.
Figure 3 Projected greenhouse gas emissions by sector for the City of Melbourne 2020 – total emissions estimated at 7.9 million tonnes carbon dioxide equivalents
Other0%
Freight transport (road+rail) 10%
Passenger transport
(road+rail) 12%
Water1%
Manufacturing11%
Waste4% Residential
9%
Commercial54%
4.1.5 Zero net emissions Zero Net 2002 outlined how the strategies of leading edge design, greening the power supply and sequestration would enable zero net emissions by 2020 for community emissions. These strategies have been realigned to accord more closely with how the emissions data is compiled. The revised strategies are:
• commercial
Page 27 of 101
Page 11
• residential
• decarbonising the energy supply
• transport.
Manufacturing has not been included as a strategy because it will be partly addressed through the strategy of decarbonising the energy supply and is being addressed through other programs of the Victorian Government (Environment and Resource Efficiency Program) and Australian Government (Energy Efficiency Opportunities Program). Further, as noted in Wedges: Understanding the Potential to Reduce Victoria’s Greenhouse Gas Emissions7, emissions from industrial processes, of which manufacturing is a component, are likely to be sensitive to a carbon price established through the introduction of a National Emissions Trading Scheme. This report notes that a 10 per cent reduction in emissions within the industrial sector is predicted and this figure has been applied to the emission reductions within the Zero Net Update 2008.
The Figure illustrates that with implementation of the strategies under the Zero Net Update 2008, it is expected that there will be a reduction in commercial, residential and manufacturing emissions. Transport-related emission reductions stemming from the implementation of Zero Net Update 2008 will be modelled for the final draft of this strategy.
The emission reduction expected from decarbonising the energy supply and the level of sequestration required to offset the remaining emissions is also provided in Figure 4. Once modelled, the emission reductions associated with transport emissions will reduce the level of sequestration required.
Figure 4 Greenhouse gas emissions (kilotonnes carbon dioxide equivalents) for the City of Melbourne from 2002, 2005–06 to 2020 (under a business-as-usual and Zero Net Update 2008 scenario)
Sequestration was included as a strategy in Zero Net 2002 and was largely focused on the City of Melbourne establishing its own processes for the sequestration of carbon emissions in the absence of an accepted and robust scheme for the procurement of carbon offsets. As noted in the brief review of Zero Net 20028, the need for the City of Melbourne to establish its own processes has been largely removed through the commitment by the Australian
7 Nous Group and SKM (2008) 8 Business Outlook and Evaluation (2007)
Page 28 of 101
Page 12
Government to establish a National Emissions Trading Scheme by 2010. While the National Emissions Trading Scheme is still being developed, the Emissions Trading Scheme Discussion Paper9 notes that offsets10 will be an intrinsic feature of the National Emissions Trading Scheme. To enable sequestration of community emissions, the City of Melbourne will need to participate in the National Emissions Trading Scheme.
Figure 5 updates the City of Melbourne – the Municipality Business Strategy Map contained within Zero Net 2002 with the revised 2020 projections. To reach zero net community emissions, the reductions considered achievable through the implementation of the strategies contained in the Zero Net Update 2008 have been determined in addition to the contribution required from decarbonising the energy supply and sequestration. At this stage, the reduction in emissions from the transport strategy is yet to be determined and this has been represented as ‘X’ in Figure 5.
Figure 5 City of Melbourne – the municipality business strategy map
9 Garnaut Climate Change Review (2008) 10 Garnaut Climate Change Review (2008) defines ‘offsets’ as: ‘a reduction or removal of emissions from activities in one area of the economy that can be used to counterbalance (‘offset’)emissions in other sectors the economy’
Page 29 of 101
Page 13
5 A roadmap for emission reductions to 2020 5.1 Towards a low-carbon future
The roadmap for emissions reduction builds on the original strategies contained within Zero Net 2002 and redefines them to take account of the developments described previously at all levels of government. The strategies within this Zero Net Update 2008 have been more closely aligned to a sectoral base to reflect how the emissions data has been prepared. In addition, the strategy of greening the energy supply has been continued as decarbonising the energy supply. As previously noted the revised strategies are:
• commercial
• residential
• decarbonising the energy supply
• transport
For each strategy the relevant contribution or target that must be achieved for each sector has been determined. In turn this target is supported by a proposed pathway or actions for implementation.
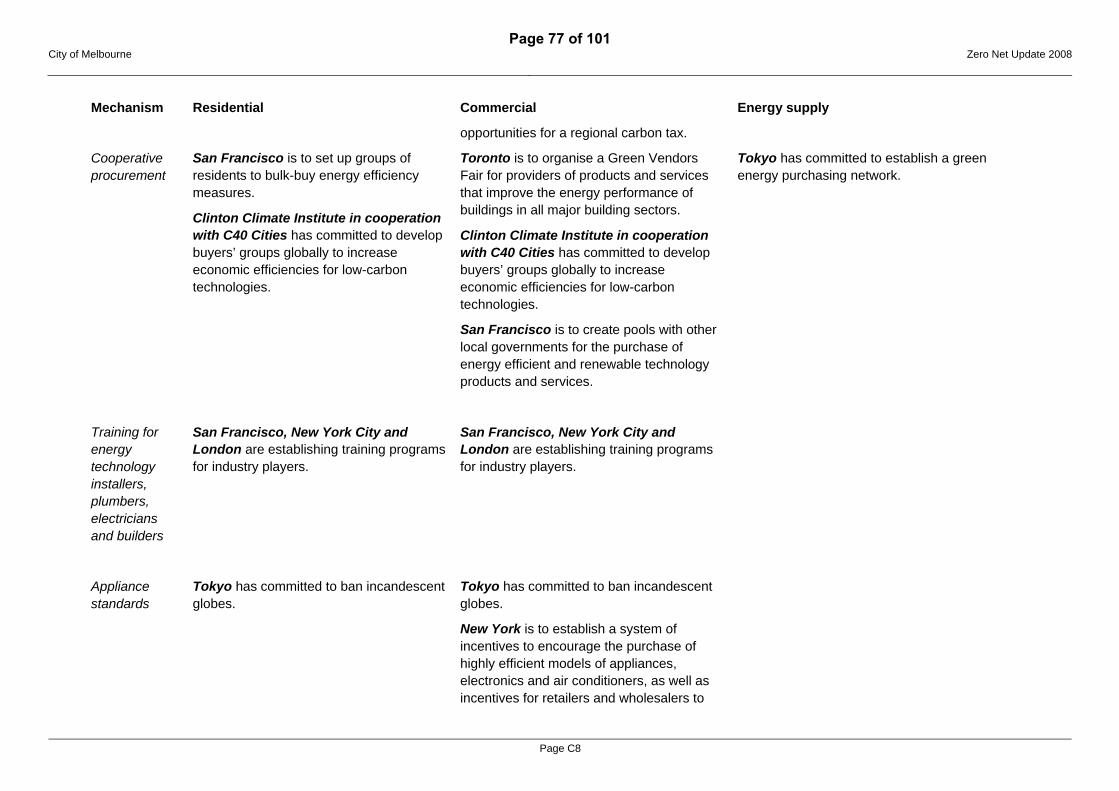
Determination of these pathways has occurred by consideration of current programs and developments at the Australian, state and local government levels, as well as through a best practice review of international, local government, regional and sector specific guidance. The best practice review focused primarily on the strategies and actions of leading cities under the headings of residential, commercial and energy supply to align with the direction in Zero Net Update 2008. A summary of this review is provided in Error! Reference source not found.Appendix C.
5.2 The role of the City of Melbourne as a leader in climate change
The City of Melbourne has a history of innovation and has used its powers to establish legal and financial mechanisms to help meet its goals.
The City of Melbourne can draw on the following powers in fulfilling its role to:
• spend funds, give grants and provide subsidies
• buy and sell land, and develop land in its own right
• invest funds
• make representations to state and federal governments on policy and regulation
• zone lands for development and other purposes
• determine development applications
• call a temporary or permanent halt to building and demolition work and to businesses trading
• create independent legal structures with the capacity to raise funds
• make new laws relating to new and existing developments
• advertise through a range of media outlets and via its own channels such as rates notices.
Through these powers the City of Melbourne has a significant ability to influence the sustainability of activities within its boundaries, including carbon emissions. A recent example is the Sustainable Melbourne Fund which has been established to garner commercial investment in sustainable projects.
Page 30 of 101
Page 14
In addition to direct powers, the City of Melbourne has as an equally important ability to influence sustainability outcomes through its leadership and lobbying influence. The City of Melbourne has comparatively very little direct control over the emissions that relate to activities within its boundaries. It can, however, use its influence to lobby state and federal governments, private sector leaders and individuals to take the necessary action to reduce carbon emissions. These abilities enable the City of Melbourne to bring together the key players from within government, industry and community.
An example of how a combination of direct powers, leadership and lobbying has been applied is the role of the City of Melbourne in establishing Melbourne as a hub for sustainable building design. It has applied direct powers, through the C60 planning amendment implemented under the auspices of the Planning and Environment Act 1987 (Vic); and leadership, through the opening of CH2 and in sponsoring events such as the Sustainable Building Pathway workshop11 in 2006.
In order to achieve zero net emissions by 2020, the council’s range of powers and leadership and lobbying abilities will need to be fully exploited if deep cuts to emissions are to be achieved. This understanding of the current and potential role of the City of Melbourne has informed the pathways and implementation actions identified for each sector strategy.
5.3 Commercial sector
The City of Melbourne’s commercial sector accounts for 55 per cent of emissions, or 3,474 kt CO2-e of the total greenhouse emissions deriving from three major types of activity:
• office work (finance, insurance, government, communications, property and business services)
• sales, accommodation, restaurants and tourism (retail and wholesale trade, cultural and personal services, accommodation)
• education, health and community services.
Between 2002 and 2005–06 emissions grew by 37 per cent in this sector. Total emissions from this sector are expected to grow 3,981 kt CO2-e or by 23 per cent by 2020 if no action is taken. Emissions when considered on a per employee basis are 15.36 tonnes a head. There are 117 tonnes of CO2-e emitted for every $1 million of Gross Regional Product.
Growth in the amount of floor space and the number of employees in office-based activities and in the sales and tourism sub-sector reflects the nature of the booming Melbourne economy. Corresponding growth in emissions and a projected future growth rate present large challenges for the City of Melbourne which relies on a growing economy for success.
5.3.1 Target for emissions reductions By 2020 an emission reduction target of nearly 1,004 kt CO2-e or a 24 per cent reduction in emissions across the commercial sector has been set. Table 1 provides a summary of where the focus is planned for reducing emissions in the commercial sector and the expected level of greenhouse gas reduction. Achievement of the level of reduction depends, however, on a range of variables and so low and medium targets have also been set as highlighted in Table 1. The City of Melbourne will facilitate achieving targets in each of the sub-sectors.
11 The Sustainable Pathway for the Building Industry bought together 50 senior executives from industry and the three levels of Government in February 2006 to define seven core strategies to continue the development and promotion of sustainable building design.
Page 31 of 101
Page 15
Table 1 Combined emission reduction strategies in the commercial sector
Scale of reductions
(kt CO2-e)
Commercial reduction strategies
Lower Medium High Existing office buildings 193 285 383 New building office buildings 0 134 163 Education, health and community 29 43 57 Retail and wholesale (existing) 26 52 78 Retail and wholesale (new) 137 Hotels (existing) 83 Hotels (new) 103 Total 248 514 1004
Existing office buildings
There is approximately 7.7 million square metres devoted to office space within the City of Melbourne. When benchmarked against the Australian Building Greenhouse Rating Scheme (ABGR), renovated buildings typically achieve a 4.5 Star rating12. Using this typical improved performance as a benchmark, unrenovated office buildings in the City of Melbourne are to be progressively retrofitted to improve their energy performance with an expected overall greenhouse saving of 383 kt CO2-e. This represents a retrofit program of about 1,200 buildings over a period of eight years with an average improvement in performance of 38 per cent. Lower and medium targets are based on retrofitting 50 per cent or 75 per cent of unrenovated buildings respectively.
New office buildings
The City of Melbourne will look to increase greenhouse performance standards for new commercial developments to require them to meet an ABGR rating of 5 stars or greater, to come into force by 2012 (a common international target for tougher energy performance in new buildings). This will deliver approximately 163 kt CO2-e savings by 2020. The most recent enhancement to standards, which requires all buildings over 2,500m2 to achieve a 4.5 Star ABGR rating, will achieve the medium target.
The London Borough of Merton became a world leader when it required all new developments to achieve a 10 per cent contribution to final energy demand from renewable on-site sources. The City of Melbourne will consider this approach, known as the ‘Merton Rule’, to reduce the footprint of new developments and help to decarbonise the energy supply.
Education, health and community buildings
The City of Melbourne will encourage this sub-sector to retrofit 230 buildings to 2020, with an average reduction of 15 per cent in emissions. This is expected to result in savings of up to 57 kt CO2-e if all 230 buildings are retrofitted, 29 kt CO2-e if 50 per cent of buildings are retrofitted or 37 kt CO2-e if 75 per cent of buildings are retrofitted. This target of 15 per cent reduction in emissions excludes the potential impact of in-building or district combined heat and power schemes which are addressed under Section 5.5.
Sales and tourism sector
The City of Melbourne already facilitates a program of retrofitting hotel accommodation in the city. Evidence based on retrofits of 30 hotels suggests that a total of 83 kt CO2-e could be saved if this were applied to the entire hotel sector. The City of Melbourne will work with the Victorian Government to introduce a greenhouse performance standard for the hotel sector, with the aim of achieving minimum carbon savings of 83 kt CO2-e by 2020.
12 The Australian Government through its Energy Efficiency in Government Operations Policy has set a standard of 4.5 Star ABGR for all new build and major refurbishment.
Page 32 of 101
Page 16
For the retail and wholesale sector, the City of Melbourne will consider available regulatory mechanisms to set greenhouse performance standards in new retail and wholesale developments to achieve a 15 per cent reduction on current performance, or 137 kt CO2-e by 2020. Further, the City of Melbourne will also encourage energy efficiency and the adoption of low-carbon approaches in the retail and wholesale sector to achieve a 15 per cent reduction in emissions associated with this sector by 2020, or 78 kt CO2-e.
5.3.2 Pathway to reductions
Existing office buildings
The City of Melbourne will take a three-pronged approach to improving building energy performance in existing commercial developments: incentives, awareness raising and sanctions (among building owners and tenants) by:
• Incentives – facilitating a large-scale retrofit program that would complement and incorporate the existing Clinton Carbon Initiative (CCI). The program should, in conjunction with CCI, provide the necessary support to facilitate the matching of Energy Performance Contractors with building owners, targeting those buildings which are unrenovated in the first instance.
• Promotion – establishing a sophisticated and highly targeted public relations and marketing campaign drawing on Melbourne’s appeal as a world-class city and the individuals who make it so. The campaign should aim to recognise individuals’ actions and commitments, as well as create a space for Melbourne’s business owners to differentiate themselves by agreeing to participate in the program.
• Sanctions – exploit the range of regulatory options available to encourage building owners to improve building energy performance. Options to be explored will include the potential for requiring disclosure of building energy performance at the time of lease and sale, and the potential of a special levy or stepped rates according to building energy performance.
The potential trajectory of the program is illustrated in Figure 6 A suitable ramp-up period will be required to provide sufficient time for building owners to be signed up and the Energy Performance Contracting industry to be prepared for significant increases in workload.
Page 33 of 101
Page 17
Figure 6 Options for a program to retrofit City of Melbourne unrenovated buildings
All unrenovatedbuildings50% of unrenovatedbuldings75% of unreovatedbuildings
New office buildings
The City of Melbourne will look to increase greenhouse performance standards for new commercial developments to require them to meet an ABGR rating of 5 Stars or greater, with a potential start date of no later than 2012. This will ensure that new developments are achieving the current maximum greenhouse performance standard.
Education, health and community centre buildings
The City of Melbourne will facilitate the development of an appropriate mechanism to enable the commissioning and retrofitting of the larger buildings in this sector. As a first step, the City of Melbourne will convene an education, health and community facility committee including Chief Executive Officers and Vice-Chancellors to devise a collective approach to reducing carbon emissions from this sector. The potential for a retrofit program to be rolled out to this sector is demonstrated in Figure 7.
Page 34 of 101
Page 18
Figure 7 Options for a retrofit program for education, health and community buildings
All unrenovatedbuildings50% of unrenovatedbuldings75% of unreovatedbuildings
Sales and tourism sector
The City of Melbourne will carry out a three-fold strategy for the sales and tourism sector:
• lobby the Victorian Government for energy performance regulation of retail and wholesale, accommodation and cultural/sporting new developments
• explore the use of existing regulatory power to curb high-energy-consuming equipment such as lighting and chillers in existing developments
• develop a campaign to encourage operators and business owners to reduce energy and save on operating costs as a result, drawing on the evidence gathered from its innovative program to retrofit hotels to be energy and water-wise.
Non emission-based impact of measures
The scale of the approach proposed is unequalled in the past 50 years. It will represent one of the biggest investments in energy efficiency ever undertaken worldwide, with the number of office buildings being retrofitted peaking at about 200 per year in the latter half of the program. Given that there will be potentially three parallel streams of energy retrofitting occurring in the area (residential; office buildings; and health, education and community buildings) the logistical impact is unprecedented. This will require considerable logistical resources including long lead times to enable the Energy Performance Contracting industry to scale up to meet the challenge. A number of co-benefits would derive from this approach, including:
• a boost in employment numbers in the City of Melbourne
• Melbourne being acknowledged as an international hub for expertise on commercial building retrofits
• increased demand for locally-sourced energy efficiency technology and applications
• resulting economic and social benefits for Melbourne.
Page 35 of 101
Page 19
5.3.3 Next steps for implementation
Retrofit program for existing office buildings
The City of Melbourne will develop a business case to support the establishment of a large-scale retrofit program for Melbourne’s office buildings using private Energy Performance Contractors. The business case will:
• confirm the number of buildings to be included in the program and the total floor area
• model the anticipated supply chain impact in terms of additional energy efficient products and technologies required to be supplied to Melbourne
• scope the number of Energy Performance Contractors required to manage the number of retrofit projects at program peak
• consult with the Energy Performance Contracting industry over the steps needed to prepare the industry for the program
• scope the size of the administrative resource necessary to establish the program and provide the coordination services required to link building owners with Energy Performance Contractors
• consult with CCI to determine how best to accommodate it in the program structure
• provide options to the council for funding the administrative program structure.
The business case will also scope the cost for a sophisticated public relations and publicity campaign designed to attract and sign up building owners to the program, taking into consideration:
• how the program can link strategically to other public relations and behaviour change campaigns targeted at the residential sector
• what role employees and tenants can play in influencing building owners to sign up
• what incentives are required to persuade building owners to sign up, for example, rates holidays, awards and recognition mechanisms
• what communication methods could be used, such as peer group roundtables, one-to-one meetings, letters to the editor and opinion pieces, use of industry and peak groups
• the duration of the program and the level of intensity of the program throughout its duration.
Finally, the business case will explore options to impose sanctions on building owners to encourage them to sign up to the new program, including:
• a special levy on building owners who have not met minimum greenhouse performance standards by a set date
• a stepped rates system according to greenhouse performance
• mandatory disclosure of greenhouse performance at point of lease and of sale.
The business case will be prepared by November 2008 and the new program will be ready to be implemented by June 2009.
New office buildings and regulatory requirements for retail buildings
The City of Melbourne will, in liaison with the Victorian Government, make amendments to the Planning Scheme to increase greenhouse performance standards for new office buildings of 2,500 m2 and over from 4.5 to 5 Stars as soon as practical, but with a start date of no later than 2012.
The City of Melbourne will liaise with the Victorian Government over appropriate energy performance regulation for lighting and chillers in retail development, and seek from the Victorian Government a commitment to develop comprehensive energy performance standards for retail development and other buildings supporting Victoria’s tourism industry.
Page 36 of 101
Page 20
Education, health and community centre buildings
The City of Melbourne will facilitate the development of an appropriate mechanism to enable the commissioning and retrofitting of the larger buildings in this sector. As a first step, the City of Melbourne will convene an education, health and community facility committee including Chief Executive Officers and Vice-Chancellors to devise a collective approach to reducing carbon emissions from this sector. The committee will be encouraged to:
• identify what initiatives, if any, are occurring in the sector to reduce emissions
• identify the barriers to carrying out retrofits, for example, can financial savings derived from energy reductions be retained by the institutions from year to year?
• agree to a collective approach to reducing emissions and set a deadline and a target for reductions
• call on, where necessary, the City of Melbourne to provide some support for the agreed approach.
Information will be shared with the committee on other approaches to supporting Energy Performance Contracting that are being explored with respect to commercial developments.
The first meeting of the committee will be held no later than December 2008.
Supporting information
The nature of the activities in part determines the building type and the resultant emissions. This in turn impacts on the nature of emission reduction strategies. A summary of the building types and consumption characteristics is contained in Table 2.
.
Table 2 City of Melbourne building types consumption characteristics
Building type Energy consumption characteristics
Offices Generally open plan format. Main sources of energy consumption from computers and other equipment, lighting, heating, cooling and ventilation and lifts
Sales, accommodation, restaurants and tourism
In sales areas, high lighting load, high chiller load from cool display units and resultant high air-conditioning load (to compensate for excess heat from lights and chillers). Other key loads include those from kitchen and other back-of-house activities, and entertainment loads such as poker machines, televisions, DVDs
Education, health and community services
Education facilities include a combination of large communal spaces and smaller office areas. Lighting and computing loads, lifts and air-conditioning. Health facilities include more intensive air-conditioning loads, ancillary activities such as cooking and laundry and significant load from hospital equipment (bedside, operating theatres, refrigeration)
Existing office buildings
The City of Melbourne’s development began in earnest with the nineteenth century Gold Rush. Many of Melbourne’s finest buildings were completed before 1900 and remain as major locations for office and retail activity. More recent development is typified by prestigious towers such as Eureka Tower. There are approximately 1,800 office buildings in the City of Melbourne and about one third of these have been renovated in the past 30 years.
Innovations in heating, lighting, equipment and building techniques and design now mean that significant energy savings can be made in typical office environments. These savings can be as high as 70 per cent but typically are between 30–50 per cent; for example, a typical renovation of a building to improve its greenhouse performance from average to best
Page 37 of 101
Page 21
practice under the ABGR Scheme (the national scheme to rate the energy performance of commercial buildings) would deliver a 38 per cent improvement in performance.
Typical savings can be achieved by:
• improving air-conditioning systems
• using more efficient office appliances and reducing standby losses
• better insulation and improved heating and ventilation, including use of building energy management systems and other building shell measures
• using energy efficient lighting fixtures, timers and linear fluorescent lights for interior, exterior and parking lighting
• more efficient water heating systems and technologies, including solar heating13.
Most buildings that have not been renovated in the past five years could perform more efficiently given that the rate of energy efficiency innovation has been rapid over that time. In order to make in-roads on emissions in this growing sector, a large-scale retrofit of existing office buildings needs to occur.
New office buildings
The City of Melbourne’s current growth rate suggests that by 2020, total office space will have increased by about 23 per cent. The City of Melbourne has already moved to curb emissions from this sector by requiring all new buildings with a gross floor area of 2,500 m2 or greater to meet a 4.5 Star ABGR standard. This is an improvement in performance of 35 per cent on the average performance for Victorian commercial development. Most new commercial developments will be captured by this new requirement, which will deliver a maximum total benefit of 79.5 kt CO2-e in greenhouse savings by 2020. However, this tougher requirement will not be sufficient to offset the impact of growth in new development on emissions for the City of Melbourne.
Education, health and community sector
Unlike other commercial sub-sectors, this sub-sector is not experiencing any significant growth. Potential greenhouse savings are greater, because hospitals in particular contain large and energy hungry equipment. However, the barriers are also potentially more difficult to overcome, as hospitals and education providers balance service provision with retrofitting for building performance, and other essential refurbishment.
Sales and tourism sector
Melbourne‘s city centre is a magnet for tourists and Melburnians alike. Sporting facilities, hotels, restaurants, shops, bars and cafés make up a substantial proportion of the commercial sector. A range of carbon-related activities occur within this sub-sector including catering, laundering, cleaning, entertainment and packaging. This sub-industry is comparatively difficult to influence because they are wary of losing their competitive edge through the increasing costs that might result, or a perceived loss of amenity.
The City of Melbourne intends to develop a campaign that in part will focus on reducing greenhouse emissions from this sector. The barriers hindering energy efficient behaviour and investment for improved energy performance are similar, but arguably greater in this sector, as there is a very strong driver to maintain perceived amenity and often a misconception about the impact of energy saving measures on amenity.
As with the education, health and community sector, there is currently no building rating scheme under which it falls. This means that nearly half the emissions deriving from the commercial sector in Melbourne are effectively unregulated. The danger here is twofold:
• emissions will continue to grow unchecked in this sector
• market distortions will be created between the development of new office buildings and development of buildings for the sales and tourism sector.
13 CIE 2007
Page 38 of 101
Page 22
Intervention points in the commercial sector
The three sub-sectors in the commercial sector have quite different characteristics. The City of Melbourne’s influence and capacity to regulate is a common factor for energy performance across the sector and hinges around life stages in the built form. There are a number of life-stages at which there are opportunities for intervention in building management and fabric, as summarised in Table 3.
Table 3 Intervention points for existing buildings
Intervention point Primary consent authority Role
Renovation City of Melbourne Development approval
New plant installed City of Melbourne Health/safety inspection
Leased/sold City of Melbourne/Victorian Government
Health/safety inspection/ approval of sale – stamp duties
Demolition City of Melbourne Approval of DA to demolish. Site inspections
Inspections City of Melbourne/Victorian Government
As defined by range of Acts
Rates – taxation City of Melbourne To apply rates in accordance with council policy and Victorian Government approval
Licence to operate City of Melbourne/State Govt As defined by range of Acts Authorities around the world faced with similar structural barriers tend to use a range of levers to encourage, require or publicise building energy performance. These levers include:
• requiring mandatory disclosure of building energy performance at the time of sale or lease
• providing a subsidy for improving performance
• setting a levy on buildings that have poor energy performance
• encouraging building owners through voluntary programs
• facilitating market/fiscal mechanisms via Energy Performance Contracting (where building owners engage a third party to retrofit the building in return for a share of the cost savings resulting from lower energy bills).
The City of Melbourne is fortunate to have CCI working within its boundaries with a focus on commercial buildings. The CCI has a focus on working with building owners to improve energy efficiency. CCI also aims to work with the supply chain to create a buyers’ group for energy efficient products.
A range of measures that complement the CCI and provide a strategic framework for action has the potential to be highly beneficial, particularly where additional resources are required.
Barriers
The barriers to implementing energy efficiency measures within commercial buildings are linked to the disconnection between building ownership and building tenancy. Not only are running costs a small proportion of the overall rent in a building, often tenants have no direct incentive to seek changes because these costs are absorbed into the rent. Building owners have little incentive because the savings tend to be minor on total rent earned.
5.4 Residential sector
This sector in 2005–06 comprised 7.8 per cent or 552 kt CO2-e of the total greenhouse emissions in the City of Melbourne. Emissions grew by 490 per cent in this sector between
Page 39 of 101
Page 23
2001-02 and 2005–06. This growth is largely due to the expansion of the City of Melbourne’s boundaries to take in new residential areas such as Docklands. Growth in emissions is also due to an increase in new residential development and partly because of increases in energy consumption related to appliances and lighting.
In total the City of Melbourne has 46,256 residential properties and 71,226 residents. Each resident’s carbon footprint is eight tonnes, not including emissions from transport. Total emissions from this sector are expected to grow to 737 kt CO2-e by 2020, or by 33 per cent if no action is taken.
A substantial proportion of dwellings are high-rise apartments (about 70 per cent, or 32,677 dwellings) and this market is expected to continue to expand. Low-rise and single dwellings account for the remaining 30 per cent (6,483 dwellings) and are fairly evenly split.
A high proportion of energy demand is met by natural gas, reflecting Melbourne’s cool winter climate and the associated winter-time heating demand. The three prime contributors to residential emissions overall are appliances, heating and cooling demands of dwellings and water heating, as illustrated in Figure 8.
Figure 8 Victorian domestic emissions by end use14
Heating and cooling, 26%
Hot water, 20%
Lighting, 9%
Cooking, 4%
Appliances, 29%
Fridge freezer, 12%
5.4.1 Target For this strategy to succeed, emissions from the residential sector need to reduce by 17 per cent by 2020. This will be achieved by targeting the largest proportional sources of emissions that can be reduced for the least cost, specifically:
Space and water heating (approximately 12,000 households)
• space heating – upgrading from electric to gas in existing dwellings (all dwellings where gas is able to be reticulated, or to high-efficiency electric where gas is not available)
• water heating – upgrading from electric to gas (instant or gas-boosted solar) in single and low-rise dwellings or to electric heat-pump in high-rise dwellings.
Common areas in high-rise developments (in 75 per cent of all high-rise developments or a total of 24,507 dwellings)
• reductions in common area energy demand or fuel switching via on-site renewables (high-rise buildings).
Lighting and other measures
Other measures including the impact of Smart Meters (if introduced) and the Victorian Energy Efficiency Target (VEET) Scheme on appliances and lighting:
• appliances – moving to higher efficiency models and removing standby options (all dwellings)
• reductions in lighting demand, particularly in new dwellings (all dwellings).
The combined impact of the possible introduction of Smart Meters15, the VEET Scheme16 and a behaviour change campaign from the City of Melbourne will have an effect on those
14 Sustainability Victoria, 2007
Page 40 of 101
Page 24
households not being reached directly by a house audit program. This impact is estimated to result in a modest on-average one per cent reduction in emissions in relation to the use of appliances (all households) on the basis that growth in emissions from appliances is predicted to grow by 10 per cent by 2020 if no action is taken17.
New residential developments
The challenge of improving the thermal performance of new residential buildings (above the current 5 Star standard) rests with the Victorian Government. Research for the Victorian Government suggests that while some improvements could be made by raising the minimum requirement to six or seven stars (around eight per cent), this is not where the largest gains can be made in the short to medium term (the most significant gains being in appliances, lighting, heating and cooling, and water heating)18. This contribution has been modelled in the expectation that the Victorian Government will consider increasing minimum thermal performance standards in the near future. Table 4 provides a summary of the total emissions reductions in existing dwellings and potential savings in new dwellings.
Table 4 Total emissions reductions in existing residential buildings
Reduction measure Emission reduction (kt CO2-e)
Space heating 60.5 Hot water 40.7 Common areas 21.8 Lighting 9.5 Impact of other measures (1%) 2.0 New residential 7 Star rating 59.0 Total 193.6
5.4.2 Pathway to reductions The City of Melbourne will enable emission reductions in the residential sector through three strategies:
• house-to-house audit program targeting space, water heating and insulation in approximately 12,000 households
• commissioning retrofits on common areas in 75 per cent of all high-rise residential developments and communal hot water and space heating where feasible and appropriate
• a behaviour change program to support and encourage resident involvement in the audit program, and providing broader energy efficiency advice and information to residents about living and working in Melbourne.
These measures have been designed to complement existing measures of the City of Melbourne, the Victorian Government and the Australian Government, such as the VEET Scheme, the forthcoming National Emissions Trading Scheme, existing residential energy performance building standards, and appliance standards under the Mandatory Energy Performance Scheme.
5.4.3 Next steps for implementation In order to implement these proposals, in the next six months the City of Melbourne will develop and cost a business case for each strategy. In 2009, the City of Melbourne will have three operational strategies that are fully ready to be implemented. Issues for consideration in the development of the business case are outlined below.
Home auditing scheme targeting space and hot water heating and insulation
The City of Melbourne will develop a business case to establish a house-by-house audit program in consultation with the Victorian Government and energy retailers. The program
15 COAG has agreed to a mandatory roll-out of Smart Meters where benefits outweigh costs. COAG is make determinations on this issue in 2008 (MCE 2007) 16 DPI 2007 17 GWA 2008 18 GWA 2007
Page 41 of 101
Page 25
will be in conjunction with a behaviour change scheme to target space and water heating and insulation, as well as provide information on other energy saving measures.
The business case will consider how the program will provide a single conduit for householders to access the information they require to make decisions about a range of energy performance issues in their homes. The business case will also consider how the program will link to existing and appropriate subsidies, grants and other new measures to minimise high up-front costs, offering householders an affordable way to reduce energy use and save money in the longer term.
Specifically the business case will:
• Consider the best options for funding the management and administration of the program. This will include liaison with other government partners such as the Victorian Government and other local authorities.
• Consider the most viable potential market and other mechanisms to fund the technologies to be applied in the program, including:
o green loans and green mortgages to meet up-front costs of technology
o institutional investment in the program as a whole in exchange for energy trading certificates and other carbon tradeable receipts (could be negotiated or the opportunity tendered out)
o sign-up of dwelling owners via Energy Performance Contracts (to be provided via tender through individual contractors, or as a business unit within the City of Melbourne or a special purpose vehicle
o potential provision of a tax credit from the City of Melbourne via a rates rebate for accredited installation of specific technologies
o forming an agreement with the energy retailer to extend the VEET Scheme to ensure active coverage of all target households in exchange for in-kind opportunities; for example, the right to develop air-space and roof-space on City of Melbourne property for renewable and other low-carbon energy installations
o potential for the City of Melbourne’s existing grants program (currently providing about $20 million in grants) to target a portion of these grants towards organisations that assist the roll-out of energy efficiency schemes in the residential sector, or other mechanisms for reducing emissions associated with the residential sector.
Common area improvements in high-rise developments
The City of Melbourne will develop a business case to support the establishment of a program to facilitate retrofits on the common areas of high-rise developments using private Energy Performance Contractors considering, where appropriate, communal gas heating and hot water. As part of the business case, the City of Melbourne will consider:
• how it can contribute to, or fully fund, the management and administration component of the program
• how the City of Melbourne can provide leverage for the program to get sign-up from building owners/management companies/strata companies.
Behaviour change program
The City of Melbourne will consider in developing a business case for the behaviour change program:
• how the program can link strategically to other public relations and behaviour change campaigns targeted at the commercial sector (see below)
• what role residents also play as workers and how messaging can influence energy consumption behaviour throughout residents’ activities during the day and in the evening
Page 42 of 101
Page 26
• what incentives are required for residents to sign up to the auditing program and to make broader changes; for example, competitions, rates holidays, awards and recognition mechanisms
• what communication methods could be used, such as rates notices, forums and community meetings, letters to the editor and opinion pieces, festivals, ‘energy days’ and direct approaches
• the duration of the program and the level of intensity of the program throughout its duration.
5.4.4 Supporting information Victoria recently introduced higher energy standards for all new dwellings (5 Star), including a requirement for all new stand-alone dwellings to have solar-gas boosted hot water systems installed. Despite substantial increases in energy efficiency, analysis undertaken for the Victorian Government suggests that the projected carbon emissions from new homes is expected to slightly exceed the average carbon emissions from existing homes due to increases in dwelling size and lighting demand19. This same research suggests that the largest future gains in energy efficiency could be made through focusing on energy consuming activities in homes (as opposed to higher building energy performance standards in the residential sector). While the decision to increase minimum thermal performance standards rests with the Victorian Government, the City of Melbourne’s planning scheme will continue to play an important role in encouraging high-density development and facilitating low-carbon approaches, particularly in the case of mixed residential and commercial development.
The Victorian Government has announced its intention to introduce a new scheme to cut emissions from the residential sector by 10 per cent. The VEET Scheme will require energy retailers to offer greenhouse friendly space heating, hot water and appliance options to customers at discounted prices. Due to start in 2009, the details of how the scheme will operate are still being resolved.
It is expected that VEET Scheme will also complement the possible introduction of Smart Meters in Victoria which, if implemented, will provide half hourly updates to householders on energy use and on energy pricing. At this stage there is no date set for introduction. Smart Meters would encourage householders to make active choices about when to use certain high-energy consuming appliances and for how long. Modelling undertaken on behalf of the Victorian Government in relation to the impact of Smart Meters has suggested that greenhouse savings overall will be extremely modest (less than one per cent), but that energy savings at peak times will occur20. Overseas studies suggest that Smart Meters can achieve typical savings in energy of about 10 per cent21. It may be that the divergence in findings is to do with the nature of the Victorian modelling, which has focused on the financial benefit to consumers of altering behaviour according to pricing signals. If consumers are motivated and encouraged to use Smart Meters to help them reduce greenhouse costly consumption across the board (not just at times of peak demand), then Smart Meters could play a powerful role in reducing energy consumption that relates to appliances and even to installed consumption such as lighting.
Heating and cooling
Victoria-wide, most households now rely on gas for heating their homes. About 14 per cent of households across Victoria rely on electric heating or have no heating at all (less than two per cent).22 In total, approximately 10,000 dwellings in the City of Melbourne are estimated to be using high greenhouse gas emitting space-heating systems, or are without heating systems.
An analysis for the Victorian Government suggests that while there are a range of efficiencies in gas and electric space heating, the potential greenhouse differential between
low-efficiency electric and gas space heating or high-efficiency electric systems is in the order of six to eight tonnes per dwelling, representing about 50 per cent of the total carbon burden23.
Water heating
The biggest contributors to emissions in water heating are in multi-unit developments where there is a higher proportional reliance on low-efficiency electric heating. In total, just under 9,000 dwellings in the City of Melbourne are estimated to be using high greenhouse gas emitting hot-water systems. As with space heating, natural gas is the predominant energy source for water heating as shown in Table 5.
Table 5 Main source of water heating in Melbourne24
Energy Source Percentage Natural gas 76.90% Electric – off-peak 11.60% Electric – peak 7.60% Solar 0.60%
Central services in high-rise buildings
In an analysis undertaken for the Victorian Government, central services in high-rise developments are assumed to account for up to 38 per cent of total emissions for high-rise buildings and include common lighting, lifts, car parks and other ventilation and services such as pools, saunas and spas25. However, the relative greenhouse impact of central services varies considerably depending on the number of services offered in a building and whether the technology to support these optimises energy and greenhouse gas efficiency.
While central services appear to add to the carbon burden of residential developments, providing central services for a number of households in a high-rise development is arguably more efficient than for a less dense development where these are provided externally to the dwelling and therefore not counted as part of the dwelling’s emissions burden; for example, street lighting, road-laying and public baths.
Potential savings in central services have been estimated at 0.89 tonnes per high-rise dwelling, in line with modelling by George Wilkenfeld and Associates26.
Lighting
Lighting is a growing source of carbon emissions and is not currently covered by building rating schemes. This means it is difficult to rely on potential carbon savings from lighting as this very much depends on householders deciding on low-carbon lighting options, and for this approach to be maintained throughout the life of the building. An analysis undertaken for the Victorian Government suggests that carbon savings in lighting schemes for residential developments can be achieved in the order of 0.5–1.5 tonnes, depending on occupancy behaviour27.
Appliances
There has been a consistent trend across Australia for householders to have more appliances, and of those, more high-energy consumption appliances such as plasma television screens and other home entertainment systems. There is some evidence suggesting that the number of high-energy consuming appliances in each household correlates with relative wealth, with wealthier households having a greater number of appliances28. While the efficiency of white-goods such as fridges and freezers now regulated nationally under the Mandatory Energy Performance Scheme, so-called ‘black goods’ or electronic equipment is not currently covered by a mandatory scheme. This is
reflected in the large proportion of average household greenhouse gas emissions deriving from appliances.
Appliances on average accounted for 27.7 per cent of household emissions, or approximately 4.2 tonnes per household in 2005. This contribution is expected to grow to 37.7 per cent of total household emissions by 2020. The potential for savings is theoretically considerable but in practice this depends on a combination of household behaviour and purchasing choices. A confounding factor is the disproportionate impact of individual appliances; for example, a household could effectively nullify the impact of in-home energy efficient behaviour by purchasing and using a single new plasma screen television.
Barriers
There are a number of barriers to householders taking up more energy efficient appliances, and making the change to more efficient fuel sources such as natural gas and renewable energy. These include:
• level of awareness about energy and its effect on the environment and the impact of energy efficiency on household bills
• high up-front costs involved in making changes
• decision-making by third parties such as plumbers and electricians
• split incentives for tenants and landlords
• complexity and the limitations of markets
• personal choices being influenced by time-constraints, lack of information, and point-in-time priorities; for example, accessing the benefits of a particular appliance over its relative energy efficiency.29
These barriers are common to household energy efficiency programs around the world and are mirrored by a common set of solutions and strategies to resolve them.
5.5 Decarbonising the energy supply
Most stationary energy consumed within the City of Melbourne is in the form of electricity from coal and natural gas in the residential and commercial sectors. In addition to electricity and gas, the manufacturing sector also uses a range of petrochemical fuels such as diesel.30
Not only does generating electricity from coal release considerable emissions, a significant component of the energy contained in coal is lost through the generation process and the subsequent transmission of electricity via the national grid. This means that the amount of energy used in a home or business is only a fraction of the energy that has been used to deliver the electricity to the consumer.
A particular benefit of locally sited renewable infrastructure and low-carbon forms of energy generation is that heat and transmission losses are eradicated. In meeting a local electricity demand, for example, a locally sited wind turbine is removing the need for almost twice as much energy to be turned into electricity at the coal-fired power station.
Decarbonising the energy supply through decentralised low-carbon energy infrastructure in urban areas is now a leading strategy for many city governments around the world. Most notably, London has recently adopted a target of meeting 25 per cent of its energy supply by 2025 and the majority by 2050 and has established a special purpose vehicle, the London Climate Change Agency, to implement the proposal31. The City of Sydney recently announced plans to provide for 70 per cent of the city’s energy needs from a combined demand reduction and decentralised energy strategy32.
29 DPI, 2007 30 Due to the nature of the data available, it is not possible to determine the fuel mix for the manufacturing sector for this report. 31 Mayor of London 2007 32 City of Sydney 2008
Page 45 of 101
Page 29
The Victorian Government recently announced plans to introduce a new feed-in tariff for small producers of renewable energy (domestic and other micro applications). If implemented, this will help to make on-site renewable energy more cost effective for individual householders and building owners, by providing a cost-neutral basis for feeding electricity generated back to the grid. Depending on the design of the scheme, the tariff may even enable renewable producers to receive a cost-positive benefit for the energy they generate.33
Locally sourced and/or sited renewable and low-carbon energy generation can include:
• residential, commercial and manufacturing buildings (roof-tops and walls) to site micro wind turbines and solar photovoltaics
• structures such as bridge pylons to site wind turbines and photovoltaics (PV)
• dense built structures such as city blocks where there are 24-hour heating/cooling demands; for example, in mixed-use developments or in hospitals and manufacturing activities (combined heat and power systems)
• any business or activity that has a high electricity demand (clean source hydrogen fuel cells) or a high physical energy demand (Stirling engines)
• in open space corridors and in low-density manufacturing lands, or in offshore locations such as Port Phillip Bay (wind turbines).
5.5.1 Target for emissions reductions A target of 1,455 kilotonnes of emission reductions has been set, which represents just under 25 per cent of total emissions from stationary energy in 2020. The major contributors to this reduction target are expected to be derived from combined heat and power or combined cycle cooling, heat and power systems. It is anticipated that a small proportion of emissions reductions will derive from proven renewable technologies such as large- and small-scale wind and from solar power (photovoltaics). A summary of the reduction potential is provided in Table 6.
Table 6 Carbon emission reduction potential energy supply initiatives
Potential technology to decarbonise the energy
supply
Installed capacity (MW)
Number of generators
Estimated abatement (kt CO2-e)
Wind (based on abating
5% residential emissions)
11 6–10 27.6
Combined heat and power (CHP) at an abatement factor of 3.5 tonnes CO2
/MW
400 1-400+ * 1400
PV (based on abating 5% of residential emissions
15 9375 1.6 kW
systems ** 27.6
Total 1455.2 * The size of the CHP systems will depend on the relative heat and power load to be met. A system designed to meet the load of a single building might be as small as 1 MW, whereas a system designed to meet a city block or group of buildings might be around 10 MW. A single unit designed to meet a large proportion of the city’s heat and power needs would require separate siting and pipe laying to existing and new developments.
** A typical household photovoltaic system is between 1 kW and 2 kW to meet up to two-thirds of a household’s total electricity demand. Some locations for photovoltaic arrays might be found in the City for a larger scale application (as with the Victoria Markets).
This target is based on an assessment of targets set by other cities and against the technologies available to meet the target. It is highly likely that the new market conditions
33 DPI 2007
Page 46 of 101
Page 30
created by the National Emissions Trading Scheme and the new Mandatory Renewable Energy Target will ensure that market investment can be realised to support the most economically viable, locally sourced, renewable and low-carbon technologies within the boundaries of the City of Melbourne. Analysis undertaken for the Victorian Government is in line with these assumptions (proposing that cogeneration will contribute to a 20 per cent reduction in base-load electricity demand by 2030, and that renewable energy will account for a 20 per cent reduction in coal and gas electricity generation by 2035)34.
5.5.2 Pathway to reductions The timescale of this strategy is fairly limited in terms of investigating and commissioning new energy infrastructure, so weight has been given to the strategies already proven internationally and domestically (wind, gas-fired combined heat and power, and photovoltaics). Within the boundaries of the City of Melbourne there is a large industrial area that could be better used to support energy infrastructure and this would match well against medium- to large-scale infrastructure investment. A summary of the relative merits of strategies available in priority order is outlined in Appendix F.
The key technologies that could contribute to emission reductions in the City of Melbourne and which are to be scoped include:
• large-scale wind (in industrial areas and potentially in Port Phillip Bay)
• district combined heat and power (sited in a new development and feeding new and existing developments)
• localised combined heat and power (sited as part of a precinct energy approach);\
• micro wind (sited on suitable high-rise buildings)
• solar photovoltaic (on residential developments and other suitable sites)
• waste to energy (subject to discussions with other councils and the Victorian Government).
To complete the steps necessary for implementation, the City of Melbourne will look to establish an arms-length company with appropriate legal and financial powers as follows:
• fund/carry out the necessary range of capacity, scoping and feasibility studies
• develop a detailed strategic spatial plan for decentralised energy systems in the City of Melbourne
• act as a development proponent where appropriate and commission energy infrastructure
• manage interaction with energy retailers and distributors
• own energy infrastructure as appropriate
• attract investment to support the implementation of specific technologies as appropriate.
The agency will have its own high-profile board with sufficient expertise and acumen to drive critical decisions for the agency and proactively develop relationships with other partners as required.
The agency could also undertake the administrative functions to support the other two main streams of this strategy in the residential and commercial sectors.
5.5.3 Next steps for implementation A business case will be developed to establish an arms-length agency to drive the implementation of this decarbonisation strategy. The business case will:
• confirm the functions and powers of the agency
• confirm the size and administrative resources required for the agency
• scope options for make-up of the board
34 Nous Group & SKM 2007
Page 47 of 101
Page 31
• scope optimum legal and financial structure for the agency
• identify optimum methods for the agency to garner investment for decarbonising implementation measures
• determine whether other elements of this strategy should be administered by the agency.
A business case for pursuing the decarbonisation strategy will be developed which will:
• confirm the priority order of strategy elements
• cost the range of studies required to support implementation
• prepare a 24-month critical path to reach a point where implementing the strategy can start.
The City of Melbourne will consider both business cases by June 2009.
5.5.4 Supporting information Decentralising the energy supply inherently requires that multiple strategies be pursued, as no single decentralised energy supply will on its own make sufficient inroads into the energy mix used within the City of Melbourne’s boundaries. For action to occur, it will be important to address each decentralisation strategy in order of priority, according to the speed with which strategies can be implemented, the relative carbon impact of each strategy and the capacity to attract market investment. The key actions to pursue these strategies are detailed in Appendix F and outlined below.
Large-scale wind
There is potential for some contribution from wind turbines within the bounds of the City of Melbourne, and possibly even in Port Phillip Bay. In order to progress this strategy, the following will need to occur:
• a wind map/capacity study focusing on industrial lands, the bay area, the Yarra and other under-used land in inner Melbourne to identify sites which are suitable from a planning perspective and which have sufficient wind resource
• ensure appropriate zoning arrangements for land with high potential
• agree with neighbouring councils and the Victorian Government on sites to be prioritised for wind resource.
District combined heat and power
It is feasible to plan for a large gas-fired combined CHP plant that could provide enough heat and power to offset about half of the commercial sector’s emissions (after other demand reduction measures have been taken into account). A system of this nature could be designed to be initially run on natural gas, but with the potential to be fed in future through biomass feedstock. In order to progress this strategy, the following will need to occur:
• a study to identify potential sites for a large-scale (over 100MW) CHP system in Melbourne’s industrial lands and liaison with energy distributors over grid constraints and opportunities to bolster grid resilience against dips in supply
• as part of the study, identify current and proposed developments that have day/night heating, cooling and power loads which could match to a CHP system, and the relative build times for the CHP infrastructure relative to developments
• an economic analysis identifying capital and recurrent costs, risks, net present value and investment potential.
Localised combined heat and power
Alternatively, a more localised approach to CHP could be adopted, where smaller systems designed to meet heat and power loads in individual buildings or blocks could be investigated. In order to progress this strategy, the following will need to occur:
Page 48 of 101
Page 32
• a study to identify suitable locations where several heating and cooling loads could be matched to a precinct supply (for example, commercial/rental/residential or university/hospital)
• establish a Smart Energy Zone over priority sites and work with building owners on a collective investment strategy
• review building regulations to identify barriers to building owners installing localised CHP
• as part of a siting study, identify critical city infrastructure that could be made more resilient by being linked to a private wire network for electricity supply from CHP.
Micro wind
Micro wind turbine generators do not in themselves make large inroads into the carbon emissions of a business or building (typically less than one per cent), but if a strategy is adopted of installing micro wind turbines on all of Melbourne’s tall buildings, this would collectively contribute considerably to carbon reductions. In order to progress this strategy, the following will need to occur:
• a study to identify which buildings would be suitable for micro wind applications
• require all new developments to include a proportion of on-site renewable or low-carbon energy supply (so-called Merton Rule)
• establish Smart Energy Zones within the central business district and target building owners within this zone to reduce energy use and displace a percentage of energy use with local supply
• encourage building owners to participate through incentives such as recognition events
• an economic analysis to determine net present value of micro wind generation.
Solar photovoltaic
The City of Melbourne already has a record of supporting photovoltaics, having installed the southern hemisphere’s largest array of photovoltaic cells on the Victoria Markets. While photovoltaics are comparatively low efficiency, they are an effective visual signal to consumers that energy is being generated through clean sources. In order to progress this strategy, the following will need to occur:
• carry out a net present value assessment to determine whether a commercial or a break-even approach to installing PV on residential developments is viable over the life of Zero Net Update 2008 (for example, through an Energy Performance Contracting mechanism operated by City of Melbourne or commercially)
• encourage the Victorian Government to honour its commitment to the introduction of net-metering to support local generators reap the full financial benefit of electricity generation.
Waste to energy35
Waste to energy technology includes pyrolysis, anaerobic digestion and biomass boiling. While the treatment of waste currently occurs outside of the City of Melbourne’s boundaries, responsibility for emissions arising from waste lies with the City of Melbourne under international greenhouse reporting protocols. It is logical, however, for this strategy to be carried out in conjunction with other councils to optimise the benefit of investment. A trial CHP system is planned for installation in an outer Melbourne municipality, which will provide valuable information on technology performance and process issues including working with the local energy distributor.
Ways to optimise the energy content of waste while reducing harmful emissions will be explored as follows:
35 WMAA 2003
Page 49 of 101
Page 33
• carry out a study to track commercial and industrial waste to determine the percentage of the carbon/methane resource being under-used, including scoping the potential biomass load from parks and from combined waste, which could be used in biomass boilers or pyrolysis (and available feedstock from elsewhere)
• carry out an options analysis of the best approach to optimise the carbon/methane value of commercial, industrial and municipal waste in Greater Melbourne
• as part of the study, identify suitable locations for a pyrolysis/anaerobic digestion plant within greater Melbourne
• via regulatory powers require commercial and industrial waste collection and treatment processes to optimise the carbon/methane value of waste.
Governance structure
This update has included a review of climate change strategies in cities around the world, revealing that most city governments, regional and local authorities have established a range of institutional mechanisms to drive the implementation of specific measures. Institutional mechanisms enable governments to ensure that delivery of their climate change plans is fit-for-purpose. They are often required because existing institutional mechanisms have not been designed to tackle issues such as climate change that are at once broad-ranging and very specific, needing a range of specific actions and strategies to address the issue.
The implementation of this decarbonising approach requires the City of Melbourne to consider an appropriate legal and financial structure that is fit-for-purpose. The strategy requires detailed negotiations with a range of potential partners: the Victorian Government, neighbouring councils, landowners, developers and potential investors. The strategy will also need to garner substantial investment.
Economic analysis
Much of the work proposed requires an economic analysis to support an assessment of whether particular technologies can be implemented via market mechanisms. It is beyond the scope of this consultation paper to undertake this analysis, and indeed much of the economic landscape will change within the next 12–24 months as the form of the National Emissions Trading Scheme is defined and the new target Mandatory Renewable Energy Target begins to impact on the supply chain for renewables.
The principle of least-cost measures becoming cost-effective first will apply and this is illustrated in Figure 9.
The relative price of carbon and energy will be largely determined by where the cap is set by the government in relation to total emissions, and therefore the extent to which carbon certificates deriving from different abatement measures come on to the market. In other words, high-cost measures may never become price competitive, whereas low-cost measures are likely to always be price competitive.
Page 50 of 101
Page 34
Figure 9 Principle of least-cost measures
A basic economic assessment has been developed to provide an indicative guide for how measures will be assessed in economic terms over the next 12 months. This is detailed in Appendix E.
Barriers
The City of Melbourne faces a range of barriers to tackling energy at the source. These include:
• lack of an obvious institutional mechanism to complete the steps necessary to decarbonise the energy supply (from negotiating with energy distributors through to packaging up proposals to attract investment)
• the historical reluctance of energy retailers and distributors to make allowances for a more distributed energy network as opposed to a centralised one
• the lack of industry experience in Australia to explore CHP on a large scale
• uncertainty of outcome and the difficulty this will pose for investors should these options be considered as commercial propositions.
5.6 Transport
Transport emissions associated with the City of Melbourne accounted for 20 per cent of all emissions in 2005–06 and this is predicted to grow by 61 per cent by 2020. Passenger transport (road and rail) accounts for 12 per cent of total emissions, with freight at eight per cent. The focus of the transport solutions is on passenger transport.
The primary source of passenger transport emission reduction in the short- to medium-term (and which the City of Melbourne can reasonably influence) are policies and actions to facilitate a mode shift away from cars to public transport, cycling and pedestrian options.
5.6.1 Target for emissions reductions The emission-reduction targets associated with the three key initiatives are as follows:
• reducing the carbon intensity of the public transport system will target a 20 per cent reduction in public transport emissions by 2020
• a 15 per cent reduction in car emissions by 2012 and maintained to 2020
• a 100 per cent increase in bicycle use by 2015 to be maintained to 2020.
Page 51 of 101
Page 35
5.6.2 Pathway to reductions Expanding existing and establishing new train and tram networks would greatly expand the access of the wider Melbourne population to relatively low-emission transport options to access the city, the City of Melbourne will seek to influence this outcome. However, this is a longer term outcome; therefore, this strategy focuses on short to medium term measures that affect modal shift and the carbon intensity of the transport system as follows:
• decarbonisation of the public transport system through the introduction of low-carbon or clean source energy to the public transport network, thereby reducing reliance on emission-intensive sources
• implementation of a congestion charge for emitting vehicles entering the City of Melbourne with consideration of a scale of tariffs for vehicles with high-emission levels
• introduction of an integrated Cycle Melbourne scheme combining bicycle hire, expanded end-of-trip facilities and cycling network throughout the city, which will be supported by revenue raised by the congestion charge.
Decarbonising the public transport system is direct and strategically separate from the last two measures, which are predicated on the realisation of an underlying mode shift away from cars to public transport and cycling options.
5.6.3 Next steps for implementation Decarbonising the transport system
Existing fuel sources for road and rail include energy intensive electricity and petroleum based fuels. The City of Melbourne will develop a business case for assessing options to reduce the carbon intensity of public transport through the following strategies:
• the establishment of a gas-fired power plant specifically for public transport energy supply. The plant could be used responsively on the tram and train network, and depending on whether suitable uses for waste heat can be found, the plant will be a combined cooling heat and power plant, thereby greatly increasing efficiency
• requirement that all public buses entering the City of Melbourne will need to use low-carbon or clean fuel sources by 2012 such as clean-source hydrogen, hybrid electric and Compressed Natural Gas.
Specifically, the City of Melbourne will consider:
• siting options for large-scale gas-fired power station(s) and the potential to link this with broader decarbonising options
• the potential for heat and cooling demand in the residential, commercial and manufacturing sectors to be met through the gas-fired plant
• finance, build, own and operate options for the gas-fired power station including private-public partnerships
• spatial and regulatory conditions required to support the establishment of refuelling centres for CNG and clean-sourced hydrogen to be used by public buses inside the ‘congestion zone’
• potential partnership arrangements with neighbouring councils to initiate an investment strategy for base-load solar power in wider Victoria.
Establishing a congestion charge scheme
A congestion charge will surround the perimeter of the central business district and link to arterial roads around the City of Melbourne. Temporally, the congestion charge will be levied on emitting vehicles that enter the charge area during working hours from Monday to Saturday. In addition, the charge will have a stepped levy – increasing the fee payable for vehicles of different emission capacities. After a consultation process and installation of associated infrastructure, it is planned that the congestion charge could be operable by 2009.
Page 52 of 101
Page 36
The congestion charge is a direct economic policy to facilitate mode shift away from car use in and around the City of Melbourne. It is expected that most of the mode shift will be toward public transport usage.
The City of Melbourne will develop a business case to drive the establishment of the congestion charge. The business case will:
• establish, with the Department of Transport, the improvement in public transport required to accommodate the projected mode shift away from private cars
• identify a timeline for consultation and scoping of the congestion charge
• determine the parameters for an economic analysis of the impact of the congestion charge on businesses and residents within the City of Melbourne
• scope a spatial and technical feasibility study to identify options for the boundaries of the congestion charge, its temporal application and the technological systems required to support it.
Cycle Melbourne
As demonstrated in the Melbourne Transport Strategy, the City of Melbourne has a series of planned cycling-specific initiatives under consideration. By combining the key elements of the existing cycling strategy, into a Cycle Melbourne strategy, emissions will be further reduced.
In particular the program will include:
• The introduction of technology to provide an integrated bicycle hire scheme for the City of Melbourne which would see bicycles available for use at strategic locations around the city. Users would hire bicycles using their credit cards or a Transport Smart Card.
• The existing bicycle network would be extended and improved and where possible new Copenhagen-style routes established on key east-west/north-south routes to the edge of the municipality, enabling cyclists to move around the inner city and suburbs with ease.
• The creation of a statutory requirement for end-of-trip facilities within city buildings, and the creation of city ‘super bicycle stations’. Both concepts would provide appropriate changing facilities and secure parking for bicycles and personal items.
The required investment for improvement to bicycle routes and end-of-trip facilities will be derived from revenue generated from the congestion charge.
The realisation of these primary elements of a Cycle Melbourne strategy will enable an increase of 100 per cent of trips made by cycling.
By 2009 the City of Melbourne, in conjunction with the Department of Transport and private providers will:
• have identified the up-front costs and implementation issues of similar schemes in Barcelona and Paris
• scoped the siting options for infrastructure to support the scheme
• scoped the potential for the scheme to be linked via a City of Melbourne Transport Smart Card
5.6.4 Supporting information Emissions from transport are growing in cities around the world. Achieving fundamental cuts in emissions from transport requires deep and structural measures that create modal shift and which reduce the carbon intensity of public transport.
Few cities have been able to achieve these goals, but those that have made progress have been at the cutting edge. London has established a congestion charge which has achieved a 16 per cent reduction in emissions within the charge zone since its establishment. The
Page 53 of 101
Page 37
Mayor of London has also made a commitment to decarbonise the transport system by 20 per cent.36
In Barcelona and Paris, new bike hire schemes are already in place, drawing on the benefits of ‘smart’ technology to enable bikes to be electronically tagged, booked and paid for.
36 Transport for London 2007
Page 54 of 101
Page 38
6 Conclusion Zero Net Update 2008 positions the City of Melbourne to resume its leadership in carbon strategy domestically and on the international stage. However, the council cannot achieve this vision alone. Residents, employees, businesses, institutions and other levels of government all have a part to play in creating Melbourne's low-carbon future. Nor is it a matter of choice, but one of necessity. Expert analysis is now pointing to a very narrow timeframe for global action if climate change is to be contained. Globally the rate of carbon emissions continues to increase and this trend is reflected in the growth of community emissions within the municipal boundaries of the City of Melbourne. In this context, the City of Melbourne would be failing in its duty if it did not look to exploit every lever at its disposal to reduce emissions from activity that occurs within these boundaries.
Zero Net Update 2008 ensures that implementation strategies remain appropriate for the task at hand. It sets out the vision for achieving zero net emissions by 2020 and clearly defines how the vision will be reached by incorporating many of the approaches that have been committed to by other leading international cities. Many of the challenges set out in Zero Net 2002 have already been met, and this experience provides the City of Melbourne with confidence that its new goals will be met to achieve the overarching aim of deep carbon reductions.
Page 55 of 101
Page 39
REFERENCES
Page 56 of 101
References Apelbaum Consulting Group 2007, Australian Rail Industry Report 2006.
Australian Bureau of Agricultural and Resource Economics 2007, ‘Energy Update’, Australian Energy Production, Consumption and Trade, 1973–74 to 2005–06.
Australian Bureau of Statistics 2005, Environmental issues: People's views and practices 4602, March.
Australian Bureau of Statistics 2006, Survey of Motor Vehicle Use, (SMVU) Data Cubes, Australia, 12 Months ended 31 October 2006.
Australian Bureau of Statistics 2006, Labour Force, Australia, Detailed – Electronic Delivery, May.
Centre for International Economics 2007, Capitalising on the building sector’s potential to lessen the costs of a broad based GHG emissions cut, prepared for ABSEC Climate Change Taskforce.
City of Camden (London) 2006, Climate Change in Camden – a Joint Effort, Camden’s Climate Change Action Plan 2006-2009.
City of Melbourne 2007, City of Melbourne Annual Report 2006–07, Melbourne.
City of Melbourne 2002, City of Melbourne Zero Net Emissions by 2020 Strategy, Melbourne.
City of Melbourne 2007, CLUE 2006 Census of Land Use and Employment, Melbourne, June.
City of Melbourne 2006, Draft City of Melbourne Greenhouse Action Plan 2006–2010 (Council Operations), unpublished, 5 September 2006.
City of Melbourne Waste Data 2005–06, unpublished.
City of Melbourne and GEHL Architects 2004, Places for People, GEHL Architects, Copenhagen.
City of Sydney 2008, ‘Sustainable Sydney 2030‘, City of Sydney Strategic Plan Final Consultation Draft, www.cityofsydney.gov.nsw.au.
City of Vancouver 2004, ‘Sustainability: The Climate Friendly City’, A Corporate Climate Change Action Plan for the City of Vancouver.
City of Wellington 2007, Towards Carbon Neutrality: A Climate Change Vision for Wellington.
Climate Action Programme (UK) 2007, The buildings challenge – entering the climate change agenda, http://www.climateactionprogramme.org.
CSIRO and Bureau of Meteorology 2007, Climate Change in Australia – Technical Report 2007 Accessed from www.climatechangeinaustralia.gov.au.
Department of Climate Change (Australia) 2008, National Greenhouse Accounts (NGA) Factors.
Department of Climate Change (Australia) 2007, Australian Methodology for the Estimation of Greenhouse Gas Emissions and Sinks: Waste 2006.
Department of Infrastructure (Victoria) 2007, Calculation of Greenhouse Gas Intensities (Draft).
Department of Primary Industries (Victoria) 2007, ‘Victorian Energy Efficiency Target Scheme’, Issues Paper, March, http://www.dpi.vic.gov.au.
East of England (UK) 2007, Towards a Low Carbon Housing Partnership Plan for the East of England.
Enkvist, P Naucler, T & Rosander, J 2007, ‘A cost curve for greenhouse gas reduction’, The McKinsey Quarterly, May 2007.
Garnaut Climate Review 2007, Issues Paper 3, Climate Change and Emissions Stabilisation, November, accessed from www.garnautreview.org.au/.
Garnaut Climate Review 2008, Interim Report to the Commonwealth, State and Territory Governments of Australia, February, accessed from www.garnautreview.org.au/.
George Wilkenfeld & Associates 2002, Victoria’s Greenhouse Gas Emissions 1990, 1995 and 1999, End-use Allocation of Emissions.
George Wilkenfeld & Associates 2007, Options to reduce greenhouse emissions from new homes in Victoria through the building approval process.
Victorian Government 2008, A Climate of Opportunity – Summit Paper, Melbourne, accessed from www.climatechange.vic.gov.au/summit/index.html.
HM Treasury (UK) 2006, Stern Review: The Economics of Climate Change, accessed from http://www.hm-treasury.gov.uk/independent_reviews/stern_review_economics_climate_change/sternreview_index.cfm.
Intergovernmental Panel on Climate Change 2007, Fourth Assessment Report – Working Group 1 Report, The Physical Science Basis, accessed from http://www.ipcc.ch/.
Independent Pricing and Regulatory Tribunal of NSW 2004, Residential Energy Use in Sydney, the Blue Mountains and Illawarra, http://www.ipart.nsw.gov.au.
Koeppel, S & Urge-Vorsatz, D 2007, Assessment of policy instruments for reducing greenhouse gas emissions from buildings, UNEP – Sustainable Buildings and Construction Initiative, September.
London Energy Partnership 2007, Making ESCOs work: Guidance and advice on setting up and delivering an ESCO.
Manchester City Council 2008, Manchester Pledges First 1M in Strategy to Tackle Climate Change.
Mayor of London 2007, Action Today to Protect Tomorrow, The Mayor’s Climate Change Action Plan, www.london.gov.uk.
Mayor’s Summit, Global City 2007, The challenges of climate change.
Ministerial Council on Energy 2007, Communiqué, Perth, 13 December 2007, www.mce.gov.au.
New York City 2007, A Greener, Greater New York Plan NYC.
NERA 2008, Cost Benefit Analysis of Smart Metering and Direct Load Control, Report for the Ministerial Council on Energy Smart Meter Working Group, February, www.egov.vic.gov.au.
San Francisco 1996, Sustainability Plan for the City of San Francisco.
Seattle 2006, Seattle, a Climate of Change: Meeting the Kyoto Challenge.
Suppiah, R & Whetton, PH 2007, Projected changes in temperature and heating degree days for Melbourne and Victoria, 2008–2012, CSIRO, Aspendale.
Sustainable Building Pathway a document reflecting the outcomes of a national workshop on achieving sustainable buildings in Australia.
Sustainability Victoria 2007, Wind Energy Myths and Facts, accessed from www.sustainability.vic.gov.au/resources/documents/SV_WindEnergy.pdf
Sustainability West Midlands (UK), Sustainable Housing Action Programme 2006–07, Planning for Sustainable Homes: Meeting the Low Carbon Challenge.
Tokyo 2007, Tokyo Climate Change Strategy – A 10 Year Project for a Carbon-minus Tokyo.
Toronto 2007, Change is in the Air: Climate Change, Clean Air and Sustainable Energy Action Plan: Moving from Framework to Action Phase 1.
Tyndall Centre 2006, Living within a carbon budget.
United Nations Environment Program Sustainable Buildings & Construction Initiative 2007, Assessment of Policy Instruments for Reducing Greenhouse Gas Emissions from Buildings.
Vancouver (BC) 1999, Climate Change Strategy.
Victorian Government 2006, Energy Efficiency for Victoria Action Plan 2006.
Waste Management Association of Australia 2003, Sustainability Guide for EfW Projects and Processes.
Page 59 of 101
Page 60 of 101
Appendix A Melbourne’s climatic trends
Page 61 of 101
City of Melbourne Zero Net Update 2008
C:\DOCUMENTS AND SETTINGS\ALAHAI.MCC\DESKTOP\COM_SERVICE_PROD-#4611823-V3-MAY08_EC_ZERO_NET_UPDATE_-_DRAFT_FOR_PUBLIC_CONSULTATION_ATT_2.DOC
Page A1 ArupFinal 24 April 2008
A1 Melbourne’s climatic trends
Annual precipitation decreases are likely – changes of +3% to -10% by 2030 and +10 to -25% by 2070 for Port Phillip and Western Port.
Figure A1 Annual rainfall for Melbourne region
Melbourne’s average rainfall since 1900 is shown in Figure A1. There has been a marked decline in rainfall since 1994. In the period between 1996 and 2004, Melbourne had its lowest rainfall on record.
Rainfall changes
Present
(1971–2000)
2030
(average mid emissions)
2070
(average low emissions)
2070
(average high emissions)
9.1 11.4
(11–13)
14
(12–17)
20
Table A1 Predicted average number of Melbourne days above 35oC
It is predicted that Port Phillip and Western Port Catchment will experience annual warming of 0.2– 1.4ºC by 2030 and 0.7–4.3ºC by 2070. Due to the urban heat-island effect there is the potential for this change to be exacerbated within the City of Melbourne. Another parameter of relevance to adaptation is the number of extreme heat days (days over 35 degrees). Table A1 presents the predicted changes for Melbourne.
Maximum, minimum and mean temperatures in Melbourne have increased since 1860. Since 1950, maximum temperatures have increased by 0.81°C, mean temperatures by 1.30°C, and minimum temperatures by 1.79°C. It is noted that the minimum temperature increase is 0.32°C higher than the Victorian average, but there is no significant difference in the maximum temperature increases when compared with the rest of Victoria.
Temperature changes
Melbourne’s historical and predicted climatic trends
Page 62 of 101
Page 63 of 101
Appendix B Zero Net Emissions by 2020 actions implementation
Page 64 of 101
City of Melbourne Zero Net Update 2008
B1 Zero Net Emissions actions implementation overview a) Leading edge design
Action Implementation status Comment
1 Create a showcase out of the City of Melbourne’s administration building current procedures by 2005.
Achieved CH2 opened in August 2006 and has a 6 Star Green Star rating from the Green Building Council of Australia (GBCA). It cost $51 million and the estimated payback period of the sustainable design features will be 10 years.
2 Facilitate tenants/developers into consortia to invest in landmark green building developments.
Partially achieved No consortium was formed, but the Melbourne Forum has helped encourage many of the recent green developments.
3 Commit to best practice for the Commonwealth Games Village.
Achieved The Athlete’s Village achieved a 6 Star energy rating, games venues used Green Power, free public transport reduced the use of cars and solar PV panels were installed at the Athletes Village and the MCG.
4 5 Star energy regulation for residential housing by 2003.
Achieved 7 Star is the current international best practice level and it is suggested that the City of Melbourne look to adopt this in the future.
5 New energy regulations for commercial property by 2004.
Achieved Achieved through the City of Melbourne’s C60 Planning Scheme, introduced in December 2005.
6 Encourage the Property Council of Australia (PCA) to revise its rating code to include energy efficiency.
Achieved Guide to Office Building Quality was released by the PCA in May 2006. This criteria grades buildings against Green Star and the Australian Building Greenhouse Rating Scheme (ABGRS).
7 Accelerate approvals for green buildings and environmentally sustainable development (ESD) features.
Partially achieved Used in the approval of the QV and Southern Cross developments but used little since.
8 Introduce mandatory energy modelling for buildings greater than 5,000 sq m.
Achieved Achieved through the City of Melbourne’s C60 Planning Scheme, introduced in December 2005.
Page B1
Page 65 of 101
City of Melbourne Zero Net Update 2008
Action Implementation status Comment
9 Introduce a procurement scheme for green offices.
Not achieved A commercial opportunity exists for a service such as this. The Your Building website and the GBCA offer some information on this topic but many companies still experience difficulties in sourcing green products in Australia.
10 Establish a green building ‘learning hub’ as part of a Global Centre of Greenhouse Expertise and Technology.
Not achieved No formal centre has been established. The City of Melbourne could add value to its reputation by holding a roundtable information-sharing exercise with some of the universities that have been showing leadership in this area.
11 Fund design charettes for new buildings.
Achieved Sustainability Victoria’s Commercial Office Building Environment Initiative and Resource Smart Commercial Buildings programs both helped to achieve this objective.
12 Develop an energy assurance scheme for buildings greater than 5,000 sq m.
Achieved Achieved through the City of Melbourne’s C60 Planning Scheme, introduced in December 2005.
(b) Greening the supply
Action Implementation status Comment
13 Progressively increase the City of Melbourne’s use of renewable energy.
Partially achieved Australian Government renewable energy targets will be greater than those set by the City of Melbourne. The council should continue to increase use of renewable energy.
14 Pass on innovative energy-efficient technologies to the City of Melbourne’s Sustainable Investment Fund Independent Board of Trustees.
Not achieved
15 Participate in a fuel cell demonstration project. Not achieved A fuel cell has been included at 40 Albert Rd but it is recommended that the City of Melbourne
Page B2
Page 66 of 101
City of Melbourne Zero Net Update 2008
Action Implementation status Comment
incorporate a fuel cell demonstration into its CH1 development.
16 Establish a green supply chain by 2004, using the Green Tick and Greenhouse Challenge standards.
Not achieved The City of Melbourne’s supply chain remains a potent instrument for influencing behaviour within the municipality. Opportunities exist for the council in this area.
17 Participation in a Green Power buying consortium to access green power at the lowest possible price.
Not achieved
18 Better coordination of expertise.
Not achieved
19 Promote Melbourne’s expertise and technologies abroad and assist local firms to attract international investment in sustainable energy technologies.
Not achieved
20 Support the Victorian Government in encouraging the use of embedded energy, solar hot water and co-generation.
Not achieved Difficult consumer purchasing decisions are the key barrier to solar hot water. The City of Melbourne could address this as part of the strategy to leverage Australian Government support programs, such as the low-income loans for retrofits.
Co-generation is currently being explored by the council in an upcoming study.
21 Support energy retailers and contractors to move to value-added services: examine solar hot water financing as a first step
Not achieved
(c) Sequestration
Action Implementation Status Comment
22 Establish a city-rural partnering arrangement to invest in a carbon sink.
Not achieved The Australian Government’s commitment to a carbon-trading scheme has made these policies
Page B3
Page 67 of 101
City of Melbourne Zero Net Update 2008
Action Implementation Status Comment
redundant.
23 Invest in blue-mallee eucalypt plantations as feedstock for renewable power generation, with eucalyptus oil as a by-product.
Not achieved The Australian Government’s commitment to a carbon-trading scheme has made these policies redundant.
24 Establish an investment vehicle for City of Melbourne businesses and residents for commercial sequestration projects.
Not achieved The Australian Government’s commitment to a carbon-trading scheme has made these policies redundant.
25 Link this vehicle and a carbon-credit purchasing scheme for tenants as part of the pilot municipal emission trading market.
Not achieved The Australian Government’s commitment to a carbon-trading scheme has made these policies redundant.
Page B4
Page 68 of 101
Appendix C Leading actions of other global cities
Page 69 of 101
City of Melbourne Zero Net Update 2008
C1 Leading actions of other global cities C1.1 Strategies reviewed
The carbon-reduction strategies and commitments from the following major cities were reviewed.
City strategies
• New York City*: A Greener, Greater New York Plan NYC
• City of Melbourne*: City of Melbourne Zero Net Emissions by 2020 Strategy, 2002
• Greater London Area*: Action Today to Protect Tomorrow, The Mayor’s Climate Change Action Plan, 2007
• Tokyo*: Tokyo Climate Change Strategy – A 10 Year Project for a Carbon-minus Tokyo, 2007
• Manchester City Council: No formal strategy released, but announcement of key elements in February 2008
• Seattle: Seattle, a Climate of Change: Meeting the Kyoto Challenge, 2006
• San Francisco: Sustainability Plan for the City of San Francisco, 1996
• Wellington: No formal strategy released, but announcement of commitment to carbon neutrality
• City of Vancouver: Sustainability: The Climate Friendly City, A Corporate Climate Change Action Plan for the City of Vancouver, 2004
• Vancouver, BC: Climate Change Strategy, 1999
• Toronto: Change is in the Air: Climate Change, Clean Air and Sustainable Energy Action Plan: Moving from Framework to Action Phase 1, June 2007
• *Cities that are part of the C40 group of cities committed to reducing carbon emissions.
Local government area strategies
• City of Camden (London): Climate Change in Camden – a Joint Effort, Camden’s Climate Change Action Plan 2006-2009
• Borough of Woking (UK): Think Globally Act Locally, Climate Change Strategy, Woking Borough Council
Page C1
Page 70 of 101
City of Melbourne Zero Net Update 2008
C1.2 Best practice review
Cities and regions around the world are committing to and implementing a range of measures to reduce emissions and which address the barriers that exist. A summary of leading measures categorised in accordance with the Zero Net Update 2008 is outlined below.
Mechanism Residential Commercial Energy supply
Planning and building guidelines
London Mayor’s Supplementary Planning Guide for Sustainable Design and Construction and the London Plan requires comprehensive standards on energy use, lighting, water use, proximity to transport, on-site renewable energy, noise, ecology, materials and other environmental considerations. http://www.london.gov.uk/mayor/strategies/sds/sustainable_design.jsp
San Francisco building code is to be changed to require at least 80 per cent of all permanent light fixtures in new construction have an efficiency of 20 lumens per watt or greater.
Toronto has committed to develop new standards that require and regulate green roofs.
Germany has introduced a law which requires renovations to meet energy performance standards where the renovation is 20 per cent of the gross floor area.
London Mayor’s Supplementary Planning Guide for Sustainable Design and Construction and the London Plan requires comprehensive standards on energy use, lighting, water use, proximity to transport, on-site renewable energy, noise, ecology, materials and other environmental considerations. http://www.london.gov.uk/mayor/strategies/sds/sustainable_design.jsp
San Francisco building code is to be changed to require at least 80 per cent of all permanent light fixtures in new construction have an efficiency of 20 lumens per watt or greater.
New York City is requiring new construction to exceed the energy performance requirements in the building code by 20 per cent and for major renovations to exceed the code by 15 per cent. The City will pursue an aggressive program of upgrades and enforcement of the state energy code. It will
London has put mechanisms in place to promote the uptake of on-site renewable energy (20 per cent target with all new development). Aims to decentralise the energy supply by 25 per cent by 2025 and the majority by 2050.
San Francisco has committed to develop a plan to obtain 25 per cent of the city’s electricity needs from green energy sources over a four-year phase-in period starting in 2008.
Camden has committed to investigating a focus on decentralised energy solutions to achieve 60 per cent cuts in carbon emissions, supported by a range of infrastructural and administrative measures.
also require lighting systems in existing buildings to meet the building code at the point of renovation/retrofit or at change of tenancy.
Residential
Woking UK to include a new 80 per cent reduction target for new development in its next review of its development plan.
Vancouver has set a 25 per cent target for improvement in energy efficiency in new construction by 2012 on a 2000 baseline.
Zoning and planning requirements
London has established Energy Action Areas to act as spatial catalysts for renewable energy and low-carbon technologies.
Victoria has launched Smart Energy Zones as a similar program.
London has established Energy Action Areas to act as spatial catalysts for renewable energy and low-carbon technologies.
Victoria has launched Smart Energy Zones as a similar program.
San Francisco has committed to establish Solar Enterprise Zones in two districts within the city
London has established Energy Action Areas to act as spatial catalysts for renewable energy and low-carbon technologies.
San Francisco has committed to establish a simplified permit process for renewable energy systems, such as solar photovoltaics; to establish Solar Enterprise Zones in two districts within the city; and to develop a solar access ordinance.
Toronto has committed to create permissive regulations for district-based energy distribution between multiple properties.
Onsite and locally sourced renewables
The Mayor of London has set a new target for all new development to include a 20 per cent contribution to energy use from on-site renewables.
San Francisco has committed to every residential building becoming a ‘renewable energy provider’.
The Mayor of London has set a new target for all new development to include a 20 per cent contribution to energy use from on-site renewables.
San Francisco is committed to decrease energy use in municipal and commercial buildings by 50 per cent through
London has established a Climate Change Agency to enhance the roll-out of combined cooling, heat and power through new development and existing development; is committed to rapid development and delivery of waste-to-energy mechanisms (not including mass burn); and to pursuing
Page C3
Page 72 of 101
City of Melbourne Zero Net Update 2008
Mechanism Commercial Energy supply Residential
Manchester City Council is to introduce district heating schemes for 20,000 households using heat and fuel derived from biomass material (30,000 tonnes).
Manchester City Council has set a requirement for 20 per cent of final energy demand in new development and major refurbishments to be met from renewables, saving the City 50,000 tonnes in emissions.
Tokyo has committed to roll-out a photovoltaic program for its residents
conservation and use of on-site renewable resources.
Manchester City Council is committed to 10 per cent of businesses introducing combined heat and power units and micro generation schemes, reducing emissions by a total of 30,000 tonnes.
Manchester City Council has set a requirement for 20 per cent of final energy demand in new development and major refurbishments to be met from renewables, saving the City 50,000 tonnes in emissions.
Toronto has committed to establish an Eco-Roofs program to make a minimum of 10 per cent of the total industrial, commercial and institutional roof spaces more environmentally friendly by 2020.
large-scale renewable power generation in London e.g. wind turbines sufficient to power 47,000 households.
New York has committed to pilot one or more technologies for producing energy from waste and end methane emissions from sewage treatment plants and expand the use of digester gas, and consider expansion of gas capture and energy production from landfill gas.
San Francisco has committed to initiate demonstration projects that use solar, wind, ocean and/or biogas as energy sources.
Manchester has committed to the creation of 20 large wind turbines in or around Manchester (abating 150,000 tonnes CO2).
Toronto has committed to including 1500 city buildings and landfill sites to be included in an Expression of Interest for on-site renewable energy systems.
Woking UK has established a 200 kW fuel cell project.
Camden UK has committed to investigate establishing an energy services company to manage the approach to decentralised energy.
Mandatory energy and reporting labelling
The UK Code for Sustainable Homes sets mandatory rating standards for all new homes at point-of-sale, with rating criteria including energy and CO2, water, materials, surface water run-off, waste,
San Francisco has committed to revive, strengthen and enforce mandatory point-of-sale information on energy performance of commercial development under its Commercial Energy Conservation
Page C4
Page 73 of 101
City of Melbourne Zero Net Update 2008
Mechanism Commercial Energy supply
pollution, health and wellbeing, management and ecology. http://www.communities.gov.uk/publication
San Francisco has committed to introducing mandatory point-of-sale information on energy performance of residential development.
Mandatory auditing
The UK has a requirement for all social housing dwellings to meet minimum ‘decent homes’ standards. A key component to meeting the standard is an audit of all building stock and the application of an energy performance rating.
New York has committed to make mandatory by 2015 benchmarking and retro commissioning or audit/retrofit (where payback measures are guaranteed within five years).
San Francisco has committed to conduct a baseline survey of CFC-based cooling and refrigeration equipment in the city.
Utility demand-side management and voluntary auditing
London Green Concierge Service offers households a bespoke auditing and retrofit service to reduce energy use (can be linked to mandatory reduction programs on utilities).
Camden UK is considering establishing a proactive on-site/door-to-door energy audit and advice service.
NSW: ‘Big Switch’37 is a recent a house-by-house auditing approach to individual householders in the Wollongong area to
London has committed to establish the Green Organisations Program which includes a Better Buildings Partnership to upgrade commercial buildings through routine refurbishment in partnership with building owners.
Manchester has committed to establish a Building Engagement in Energy Demand Reduction program with a target to reduced emissions by 100,000 tonnes.
Toronto has committed to establish an
37 Big Switch http://www.bigswitch.com.au/home.html 38 DPI 2007
Page C5
Page 74 of 101
City of Melbourne Zero Net Update 2008
Mechanism Commercial Energy supply Residential
provide bespoke solutions. The scheme, which was presented to householders as a household emissions saving competition, was subsidised by the NSW Government.
Victoria: the Victorian Government carried out audits on over 3000 low-income households in 2006 and found that savings could be made of 15 per cent on average household energy use38.
Enviro-Business Working Group to create a comprehensive efficiency and improvement program.
Large-scale retro commissioning and Energy Performance Contracting
New York City has established a program for energy efficiency upgrades of large residential buildings using energy performance contracts that enable a guarantee of energy savings over a period of time in exchange for the implementation of energy efficiency and other improvements.
New York City has established a program for energy efficiency upgrades for large commercial and industrial buildings greater than 100,000 square feet with a target of 30 per cent reduction in emissions from buildings and operations by 2017.
Vancouver has set a 20 per cent improvement in energy efficiency target for 25 per cent of medium to large commercial buildings through retrofits, equipment replacement and operator training, and a 15 per cent improvement in the energy efficiency of 20 per cent of smaller commercial buildings.
Smart meters
New York and San Francisco introduced smart meters to provide a two-way flow of information in real time on energy pricing and consumption to enable the consumer to tailor their behaviour to least-cost outcomes.
New York and San Francisco introduced a requirement for smart meters in all new buildings to provide a two-way flow of information in real time on energy pricing and consumption to enable the consumer to tailor their behaviour to least-cost outcomes.
Page C6
Page 75 of 101
City of Melbourne Zero Net Update 2008
Mechanism Commercial Energy supply Residential
Capital subsidies, grants and subsidised loans
Seattle has established a Neighbourhood Climate Protection Matching Fund to promote and help finance neighbourhood-based climate protection projects.
Tokyo has committed to revitalise the solar thermal market.
Vancouver has committed to connect householders to the resources required to facilitate behavioural change.
Camden is to explore options to create incentives for energy efficiency measures in households.
Manchester is to offer incentives for the uptake of solar hot-water heating and micro-generation to all existing homes.
San Francisco is to subsidise a number of programs assisting low-income households including weatherisation and lighting.
New York City has committed to a range of financial incentives for residents to reduce energy use.
London has offered subsidies on the installation of insulation.
San Francisco has committed to facilitate small-business access to loan and rebate programs for energy efficiency services.
New York City has committed to a system of graduated incentives for higher energy savings and environmental performance for Gold or Platinum LEED equivalent with superior energy and water savings.
New York has committed to foster the market for renewable energy and increase the use of solar energy in buildings through creative financing via long-term contracts let by the City.
San Francisco has committed to establish incentives for projects that increase energy resources with solar, wind, ocean, and/or biogas energy; to remove disincentives for utility buy-back of renewable energy; and to dedicate 50 per cent of the utility franchise fee to the promotion of energy efficiency and renewables.
Camden UK has committed to investigating the establishment of a 250,000 pounds sterling fund as a revolving energy fund.
Taxation
San Francisco has committed to establishing a revenue-neutral property transfer tax to provide matching funds for energy-efficiency improvements.
Tokyo is considering establishing an energy efficiency tax promotion system.
San Francisco has also committed to lobby for state tax laws to discourage waste and encourage efficiency, such as a revenue-neutral carbon tax, and to investigate the
New York has committed to create a property tax abatement for solar panel installations.
Page C7
Page 76 of 101
City of Melbourne Zero Net Update 2008
Mechanism Commercial Energy supply Residential
opportunities for a regional carbon tax.
Cooperative procurement
San Francisco is to set up groups of residents to bulk-buy energy efficiency measures.
Clinton Climate Institute in cooperation with C40 Cities has committed to develop buyers’ groups globally to increase economic efficiencies for low-carbon technologies.
Toronto is to organise a Green Vendors Fair for providers of products and services that improve the energy performance of buildings in all major building sectors.
Clinton Climate Institute in cooperation with C40 Cities has committed to develop buyers’ groups globally to increase economic efficiencies for low-carbon technologies.
San Francisco is to create pools with other local governments for the purchase of energy efficient and renewable technology products and services.
Tokyo has committed to establish a green energy purchasing network.
Training for energy technology installers, plumbers, electricians and builders
San Francisco, New York City and London are establishing training programs for industry players.
San Francisco, New York City and London are establishing training programs for industry players.
Appliance standards
Tokyo has committed to ban incandescent globes.
Tokyo has committed to ban incandescent globes.
New York is to establish a system of incentives to encourage the purchase of highly efficient models of appliances, electronics and air conditioners, as well as incentives for retailers and wholesalers to
Page C8
Page 77 of 101
City of Melbourne Zero Net Update 2008
Mechanism Commercial Energy supply Residential
stock more efficient products.
Awareness raising, education, information and campaigns
London has established London Leaders, to provide leadership on making London a sustainable world city through the actions of everyday Londoners.
New York City has committed to a series of targeted campaigns aimed at schools, buildings and trades and press campaigns.
San Francisco has committed to develop outreach programs that use multiple media such as telephone books (an energy page), print and broadcast advertisements and websites.
Vancouver has created a comprehensive community engagement plan to empower, connect and engage the community and partner in reducing greenhouse emissions.
London has committed to establish a green organisations’ badging scheme to work with private and public tenants to reduce emissions through behaviour change and improved building operations with targets linked to badging. London will also establish a lobbying campaign to focus on key barriers to the uptake of energy savings and clean energy.
San Francisco has committed to conduct a global campaign about the city’s energy successes. As well, the city plans to target tourists by highlighting businesses that practise sustainable energy.
Seattle is to run a campaign to encourage all 10,000 City employees to reduce climate pollution on the job and at home.
Camden UK has established a Better Climate for Camden Scheme that provides detailed advice to businesses and has developed ‘Green Office Surgeries’.
Woking, UK has introduced a local awards scheme for sustainable developments.
Infrastructure New York has committed to facilitate the re-powering and construction of power plants and dedicated transmission lines, expand clean distributed generation, and modernise grid infrastructure.
Woking UK has established a private wire network for heating and cooling.
Page C9
Page 78 of 101
City of Melbourne Zero Net Update 2008
Page C10
Page 79 of 101
Appendix D Data Methodology
Page 80 of 101
Page D1
D1 Data sources and reliability Overview The general approach adopted in the preparation of the City of Melbourne’s Community Greenhouse Gas Inventory groups emissions under the standard categories specified by the International Panel on Climate Change (IPCC), which are adopted for reporting of the national and state level inventories. However, the City of Melbourne requires data further disaggregated by the end-use sector to understand the emissions associated with specific activities and to facilitate a greenhouse gas emission reduction policy.
Due to lack of data at the local scale, the community inventory generally takes a top-down approach, firstly determining emissions at a wider geographical scale (Australia, Victoria, or Melbourne Statistical Division) and then assigning a percentage to City of Melbourne based on the most appropriate indicator. Where sufficiently local data was available, this was used as the preferred method to develop a bottom-up approach.
Stationary energy D1.1 End-use emissions on Victorian scale
Emissions associated with the stationary energy sector were calculated by end-use within each economic sector on an all-of-Victoria level due to a greater degree of data availability aggregated at the state level. ABARE publishes state-based energy use by fuel type for each sector (under ANZSIC 1993). The most recent year of data was 2005–06 which then set the inventory year for all subsequent calculations.
The ABARE data was used to calculate emissions attributable to energy by each fuel type within each sector. This approach is similar to that adopted for the preparation of the Victorian Greenhouse Gas Inventory (VGGI) by the Department of Climate Change. However, for the purposes of this study, it was important to only include emissions associated with end-use within Victoria.
Sustainability Victoria commissioned George Wilkenfeld & Associates to produce a comprehensive report on end-use allocation of emissions in Victoria for the 2005 inventory (GWA 2008). This report was used to cross check the end-use emissions on the Victorian scale and source the most accurate full fuel cycle emission factors for Victoria for the inventory year.
These account for emissions associated with extraction production, transmission and distribution. This approach allows energy use reported for the sectors involved in fuel extraction, fuel production, transmission and distribution to be omitted from the emission calculations. Therefore energy associated with fuel extraction, power generation and fuel production for energy forms that were ultimately exported from Victoria was not included. It is for this reason that the VGGI data by ANZSIC category could not be directly used for the stationary energy sector for the purposes of this study.
For some sub-sectors, ABARE fuel-use data is not reported separately and is aggregated at either the sector level, total Victorian or Australian level. This particularly impacts on the calculations for end-use by the manufacturing sector to the extent that for these categories, the ABARE data could not be used. In these instances the data reported by GWA for these sectors was used.
Furthermore, the GWA report reallocates the emissions between the commercial and residential sectors, resulting in an increase in the commercial sector and decrease in the residential sector compared with the ABARE data. This is explained as below:
“Detailed bottom-up modelling by Energy Efficient Strategies (EES 2008) estimates significantly lower consumption of electricity than was reported by ABARE for the period 2002–05. The EES and ABARE trends for residential electricity use are very close from 1990 to 2002, but diverge sharply in 2003, and in 2005 the EES estimate was 14 per cent lower than the ABARE trend).
Page 81 of 101
Page D2
Residential electricity sales forecasts by Victoria’s electricity distributors compiled by the Essential Services Commission (ESC) are very close to EES’s projections.
As the residential sector end-use breakdown in the present report is based on the EES study, the EES electricity estimates are used in preference to the ABARE estimates. However, it is likely that the ABARE estimates of total Victorian electricity consumed are correct, because they can be checked against NEMMCO and ESAA data. Therefore the electricity removed from the residential sector must be reallocated elsewhere. The most likely sector is the commercial sector, where the ABARE data show a complete cessation of growth after 2002. There is no obvious reason why this should have been so – the economic output of the commercial sector continued to increase at a roughly constant rate from 2000 to 2005.
The conclusion is that there is a high probability that ABARE misallocated some of the electricity use in the commercial sector to the residential sector in the period 2003–05, and this has been adjusted for the present study.”
D1.2 Determine end-use emissions on City of Melbourne scale
Once the estimate of end-use allocation of Victoria’s 2005-06 emissions had been produced, the percentage of Victoria’s emissions for which the City of Melbourne community was responsible was determined for each sector. This was achieved using an appropriate indicator depending on sector characteristics. The indicators were chosen based on their correlation to emissions and more importantly the availability of indicator data on both the Victorian and City of Melbourne scale. The indicator selection process for each sector is further detailed under the relevant sector headings below.
D1.3 Residential
For the residential sector, the total emissions for Victoria could be calculated from the ABARE energy used data for this sector and full fuel cycle emission factors.
The indicator used for this sector was based on the number of each type of dwelling (Class 1, Class 2 Low Rise, Class 2 High Rise) weighted by the average emission intensity of each of these dwelling types.
Building Class
Vic Dwellings (a)
Emission Intensity Factor39 (b)
Vic Emissions (a) x (b)
City of Melbourne Dwellings as a % of Vic Dwelling by Dwelling Type (c)
City of Melbourne Emissions as a % of Vic Residential Emissions (a) x (b) x (c)
Class 1 89.50% 0.99 88.4% 0.40% 0.35%
Class 2 LR (<3 storey) 2.80%
0.74 2.1% 11.72%
0.25%
Class 2 HR (>3 storey) 7.70%
1.23 9.5% 21.48%
2.04%
This assumes that the energy-use profile in the average City of Melbourne dwelling is the same as for the whole of Victoria. In reality, gas may constitute a higher proportion of energy use within City of Melbourne dwellings, which may have resulted in a slight overestimation of the emissions associated with the City of Melbourne’s residential sector.
39 GWA 2007
Page 82 of 101
Page D3
D1.4 Commercial
For the combined commercial sector, the total emissions for Victoria could be calculated from the ABARE 2005-06 energy use data and full fuel cycle emission factors. The commercial sector ABARE data includes the combined fuel use for the following ANZSIC 1993 divisions:
• wholesale trade
• retail trade
• accommodation, cafés and restaurants
• communication services
• finance and insurance
• property and business services
• government administration and defence
• education
• health and community services
• cultural and recreational services
• personal and other services.
To further disaggregate the 2005 Victorian end-use emissions by commercial division, the 1999 end-use allocation breakdown (GWA 2002) was then used to distribute the Victorian 2005–06 commercial emissions total amongst sub-sectors as shown below.
Wholesale and Retail Trade 37.7%
Finance, Insurance, Property and Business Services 16.5%
Communication 3.5%
Government Administration and Defence 13.6%
Education, Health and Community Services 14.9%
Accommodation, Cultural and Personal Services 13.8%
Total Commercial 100%
The GWA report for the 2005 end-use allocation does not provide this breakdown of emissions by subdivision. This is because the ABARE data has been further aggregated since the previous report was done, making such analysis impossible.
This methodology assumes that:
• the growth in each commercial sector in Victoria between 1999 and 2005–06 was the same; and
• the relative emission intensity of these sectors within Victoria has not changed over this time.
For each commercial sub-sector, an indicator was developed to assign a proportional quantity of Victoria’s emissions to the City of Melbourne. A number of indicators were considered including floor area, contribution to GRP and number of facilities. However, due to data availability, the number of employees for each sector was selected to be the most appropriate indicator. The study therefore assumes that the emissions in each sub-sector are directly attributable to the number of persons employed in that sub-sector. This would result in inaccuracies if there were gross operational differences between facilities operating in each sub-sector affecting employment numbers. However, Victoria is considered an adequately refined boundary and the sectors adequately disaggregated to avoid such gross differences.
Page 83 of 101
Page D4
Vic Commercial Emissions (a)
City of Melbourne Employment as a % Vic Employment by Sector (b)
City of Melbourne Emissions as a % of Vic Total Commercial Emissions (a) x (b)
Wholesale and Retail Trade
37.7% 7.21% 2.72%
Finance, Insurance, Property and Business Services
16.5% 9.74%
1.61%
Communication 3.5% 31.56% 1.10%
Government Administration and Defence
13.6% 36.23% 4.93%
Education, Health and Community Services
14.9% 13.34% 1.99%
Accommodation, Cultural and Personal Services
13.8% 33.08% 4.57%
Total Commercial 100% 12.79% 16.9%
A further data challenge in determining employment-based indicators is the way in which employment numbers are categorised on the City of Melbourne scale and Victoria scale. For the City of Melbourne, the new ANZSIC 2006 categories are used, whereas the ABARE fuel-use data is only available under the ANZSIC 1993 categories. To enable comparison, the City of Melbourne CLUE employment data was re-categorised into 1993 sectors. A complete re-categorisation exercise requires details of each business down to the four-digit ANZSIC sub-sector level. The complete CLUE employment data set can only be provided at the two-digit level due to confidentiality reasons. Therefore the re-categorisation may have resulted in some inaccuracies which are not likely to have significantly affected the results. In future years the ABARE data should be published according to ANZSIC 2006 categories, which will make this process easier.
Page 84 of 101
Page D5
D1.5 Industrial
Manufacturing
For the manufacturing sectors, the total emissions for Victoria were sourced from the GWA 2008 report and further distributed amongst sub-sectors as shown below.
Food, beverages, tobacco 8.9%
Textiles, clothing, footwear 1.7%
Wood, paper and printing 8.3%
Chemicals 11.0%
Non-metal mineral products 4.3%
Iron and steel 7.4%
Non ferrous and other metal products 53.8%
Machinery, equipment and other 4.7%
For each manufacturing sub-sector, an indicator was developed to assign a proportional quantity of Victoria’s emissions to the City of Melbourne. Due to data availability, the number of employees for each sector was selected to be the most appropriate indicator. The study therefore assumes that the emissions in each sub-sector are directly proportional to the number of persons employed in that sub-sector. This would result in inaccuracies if there were gross operational or level-of-automation differences between facilities operating within each sub-sector affecting employment numbers. However, Victoria is considered an adequately refined boundary and the sectors adequately disaggregated to avoid such gross differences.
% Vic Manufacturing emissions (a)
City of Melbourne employment as a % Vic employment by sector (b)
City of Melbourne emissions as a % of Vic total manufacturing emissions (a) x (b)
Food, beverages, tobacco
8.9% 3.51% 0.31%
Textiles, clothing, footwear
1.7% 1.85% 0.03%
Wood, paper and printing 8.3% 2.82% 0.23%
Chemicals 11.0% 7.14% 0.79%
Non-metal mineral products
4.3% 4.55% 0.20%
Metal products 7.4% 1.20% 0.08%
Non ferrous and other metal products
53.8% 0% 0.00%
Machinery, equipment and other
4.7% 11.92% 0.56%
Page 85 of 101
Page D6
A further data challenge in determining employment-based indicators is the way in which employment numbers are categorised on the City of Melbourne scale and Victoria scale. For the City of Melbourne, the new ANZSIC 2006 categories are used, whereas the ABARE fuel-use data is only available under the ANZSIC 1993 categories. The City of Melbourne employment data has been re-categorised to allow for the indicator to be developed. In future years the ABARE data should be published according to ANZSIC 2006 categories, which will make this process easier.
Non-energy mining
For the non-energy mining sector the total emissions for Victoria were sourced from the GWA 2008 report.
The non-energy mining sector emissions were then allocated to the City of Melbourne based on employment data. The City of Melbourne CLUE data set identifies an unexpectedly high number of employees in the non-energy mining sector. This is likely due to the number of office-based services to mining based in the local government area (LGA) which are included in the non-energy mining 1993 ANZSIC category. Emissions per employee in this sector are relatively high due to the emission intensity of on-site mining activity and therefore may represent an overestimation of the emissions attributable to the City of Melbourne. However, there is an argument that the support services located in the City of Melbourne do have some control over the on-site mining emissions and therefore should be reported in this way.
Agriculture
For the combined agricultural sector, the total emissions for Victoria could be calculated from the ABARE 2005–06 energy use data and full fuel cycle emission factors. These emissions were then attributed to the City of Melbourne based on employment numbers. Employment in the agricultural industry within the City of Melbourne is largely limited to small-scale nurseries and horticulture as well as a number of agricultural, fishery and forestry support services. Emissions per employee in this sector as a whole are relatively high due to the emission intensity of large-scale forestry and livestock industries which are not typically located in the City of Melbourne.
Transport services and storage
For the combined transport services and storage sector, the total emissions for Victoria could be calculated from the ABARE 2005–06 energy use data and full fuel cycle emission factors. These emissions were then attributed to the City of Melbourne based on employment numbers in this industry.
Construction
For the construction sector, the total emissions for Victoria could be calculated from the ABARE 2005–06 energy use data and full fuel cycle emission factors. These emissions were then attributed to the City of Melbourne based on employment numbers. The employment numbers reported in CLUE may not be representative of the construction occurring within the City of Melbourne’s boundaries. The CLUE data reports full-time, casual and part-time employees at facilities based in the City of Melbourne. Contractors may therefore not be picked up in this employment category, where their main place of employment is off-site and not within the City of Melbourne’s boundaries. This may have ultimately resulted in an underestimation of construction-related emissions.
Transport D1.6 Passenger transport (road and rail)
For passenger road transport, emissions were calculated from fuel-use data for vehicles registered in the wider Melbourne metropolitan area from the ABS Survey of Motor Vehicle Users (SMVU) for the 12-month period ending 31 October 2005. This data is categorised by both fuel and vehicle type allowing full fuel cycle factors to be applied.
For passenger rail transport, emissions were determined for the wider Melbourne Statistical District by fuel-use data provided by the Department of Infrastructure sourced from Yarra Trams (trams) and Connex (trains). Full fuel cycle emission factors could then be applied.
Page 86 of 101
Page D7
An indicator was then derived to assign a fraction of the Melbourne Statistical District area emissions to the City of Melbourne. The most appropriate indicator was determined to be the sum total of the number of residents and employees within each boundary. This would then capture emissions associated with one way of the return trips made by people to the City of Melbourne as well as both ways for trips within the City of Melbourne. The approach also includes non-work-related trips assuming that such trips follow a similar pattern as work-related trips (i.e. into and out of the city). This approach is not consistent with the Draft International Local Government GHG Emissions Analysis Protocol (ICLEI 2008), which requires only the emissions that occur within the geopolitical boundary to be included.
The approach also assumes that for trips with the City of Melbourne as the origin or destination and for all trips within the Melbourne Statistical District:
• the average trip length is the same
• the modal split is the same for road-based transport
• the number of passengers per vehicle is the same.
More refined data relating to average trip length, modal split and passengers per vehicle, tourist and other non-work related trips will be included in the City of Melbourne transport study concurrently being undertaken by Arup.
It should be further noted that this approach does not include emissions associated with vehicles not registered within Melbourne Statistical District area.
D1.7 Freight transport (road and rail)
Freight emissions include emissions associated with freight generating industries that operate within City of Melbourne.
Freight emissions were firstly determined for the whole of Victoria for roads using the fuel-use data from SMVU and the whole of Australia for rail using the fuel-use data from the 2006 Australian Rail Industry Report. The full fuel cycle emissions were then determined and apportioned to the City of Melbourne according to the concentration of freight-generating industries located within the City of Melbourne boundaries.
A number of indicators were considered to determine the percentage of Victoria’s or Australia’s freight emissions which should be attributed to the City of Melbourne, including contribution to GSP/GDP. However, such an indicator was ruled out as it would include the high contribution of financial and business service industries to GSP within the City of Melbourne, which are not high freight-generating industries. Due to this consideration and data availability, the number of employees within freight-generating industries (manufacturing, mining, agriculture and wholesale and retail trade) was selected to be the most appropriate indicator.
It should be noted that this approach includes emissions which physically occur outside of City of Melbourne boundaries for the purpose of travelling to (or from) the City of Melbourne. This is consistent with the City of Melbourne strategy for emissions from transport concurrently being produced by Arup. This approach is not consistent with the Draft International Local Government GHG Emissions Analysis Protocol (ICLEI 2008), which requires only the emissions that occur within the geopolitical boundary to be included.
D1.8 Air and sea transport
Greenhouse gas emissions from air and sea transport occur over a very large area and it is nearly impossible to determine which portion occurs within different geopolitical boundaries. For the purposes of emissions accounting at the local government scale, it is more practical to either 1) assign emissions to the LGA at the source of fuel loading or to 2) assign emissions based on the population of each LGA served.
The argument against approach 1) is that airports and seaports generally serve a region much larger than the individual local communities in which they are physically located and it is not
Page 87 of 101
Page D8
equitable to assign all airport or seaport emissions to the community in which it operates. The argument for approach 1) is that in many cases local government authorities do have some control over development of airports or seaports within their geopolitical boundaries and therefore are able to as is the case with the Port of Melbourne located within the City of Melbourne boundaries.
For the purposes of the City of Melbourne community inventory, sea transport emissions associated with the fuel loaded at the Port of Melbourne have been allocated to the City of Melbourne in their entirety. Although there is no airport physically located within the City of Melbourne’s boundaries, air transport emissions have been allocated based on the business travel of employees working within the City of Melbourne and the personal travel of residents living in the City of Melbourne. This methodology combines the two approaches above to give the maximum quantity of emissions to the City of Melbourne from air and sea transport.
Air transport
Air transport emissions for Victoria could be calculated from the ABARE 2005–06 energy use data and full fuel cycle emission factors. Melbourne airport reports that 21.8 per cent of trips are for business purposes. This factor was used to determine emissions which are attributable to the business travel of employees working within the City of Melbourne and the personal travel of residents living in the City of Melbourne as shown below.
Victoria trips (a)
Indicator City of Melbourne indicator as a % Vic indicator (b)
City of Melbourne emissions as a % of Vic air transport emissions (a) x (b)
Employment related 21.8% # Employees 16.94% 3.6%
Personal 78.2% # Residents 1.44% 1.1%
This assumes that the trip length and combustion profile for employment-related trips is the same as for personal trips.
Water transport
Water transport emissions for Victoria could be calculated from the ABARE 2005–06 energy-use data for sea and full fuel cycle emission factors. For the purposes of this assessment, it was assumed that 100 per cent of these emissions are associated with fuel loaded at Victorian ports. The City of Melbourne emissions were therefore allocated based on the mass of throughput at the Port of Melbourne compared with all Victorian ports derived from the Association of Australian Ports and Marine Authorities.
This assumes that fuel used in all other vessels including recreation vessels is allocated to the City of Melbourne in the same ratio as port throughput. This would result in an overestimation of the non-port-related sea transport emissions for City of Melbourne. However, it is likely that these emissions are not significant in comparison with port-related sea transport emissions
Waste Emissions associated with waste were determined using both a top-down and bottom-up approach. Estimates of the total municipal waste to landfill were sourced from records for 2005–06 from City Wide waste management contractors responsible for collection of 100 per cent of the City of Melbourne’s municipal waste.
The relative quantities of commercial and industrial, and construction and demolition waste compared with municipal waste for the City of Melbourne were then determined. The methodology applied involved using the data for the percentage breakdown of waste types for the whole of Victoria allocated to the City of Melbourne based on the relevant indicator as shown below.
Page 88 of 101
Page D9
Victoria waste40 (a) Indicator City of Melbourne indicator as % of Vic indicator (b)
City of Melbourne waste as a % of Vic waste (a) x (b)
Municipal 36% # Residents 1.44% 0.52%
Commercial and industrial 24%
# Employees
16.94% 4.07%
Construction and demolition 40%
# Employees (ANZSIC 1993 construction sector) 1.66% 0.67%
Waste emission factors for the three waste types above were then applied to determine the emissions associated with each waste type.
Wastewater Wastewater emissions were obtained directly from Melbourne Water, which operates the Western Treatment Plant and is responsible for 100 per cent of the treatment of City of Melbourne’s sewerage. Melbourne Water calculates all emissions from its operations for the purposes of its own corporate inventory. This includes both energy emissions and fugitive emissions of nitrogen dioxide and methane from the anaerobic treatment process. The fugitive emissions only are included within the City of Melbourne’s community inventory, based on the volume of sewerage from the City of Melbourne sent to the plant as a percentage of the total sewerage treated at the plant.
The inclusion of fugitive emissions from wastewater in the inventory is consistent with the methodology on both the state and national greenhouse inventory preparation protocols. Energy emissions associated with the operation of the plant, however, would not be included within the stationary energy sector above, as this plant operates outside the City of Melbourne’s geopolitical boundaries.
Normalisations and projections The emissions from all categories were normalised to an indicator and then projected based on the projection of the indicator.
Sector Indicator
Residential Dwellings
Commercial Employees (by sub-sector)
Manufacturing Employees (by sub-sector)
Agriculture Employees
Non-energy mining Employees
Construction Employees
Water Employees
Transport services Employees
Passenger transport (road and rail) Sum of residents and employees
Freight transport (road and rail) Sum of residents and employees
Air transport Residents/employees
40 DCC 2007
Page 89 of 101
Page D10
Sector Indicator
Water transport Mass tonne Port of Melbourne throughput
Municipal waste Residents
C&I waste Employees
C&D waste Employees
Wastewater ML
Dwelling and population
Projections for residents and dwellings were obtained from the City of Melbourne population and household forecasts.
Employment
There is limited information projecting employment within the City of Melbourne to 2020. The projection data used was sourced from the Small Area Projections for Inner Core study produced for the Department of Infrastructure in March 2007 by SGS Economics and Planning. The Inner Core in this study represented the eight Statistical Local Areas representing the inner city, namely:
• Melbourne – Inner
• Melbourne – Southbank/Docklands
• Melbourne – Remainder
• Port Phillip – St Kilda
• Port Phillip – West
• Stonnington – Prahran
• Yarra – North
• Yarra – Richmond
The area is therefore larger than the City of Melbourne LGA.
The study projected growth in the Inner Core using the Labour Force Constrained Employment Forecasting Model which simulates the regional economy through a regional Input – Output (IO) Model and projects employment based on two key economic stimuli – growth in exports (international and inter-regional exports) and growth in resident population and the resultant consumer spending, constrained to take into account the growth in working age population. The model did not take into account development capacities/ constraints and therefore may have resulted in an overestimation of growth in some industries where development is anticipated to be constrained within City of Melbourne.
The percentage growth rates determined for each sector to 2020 were applied to the CLUE employment data set.
Port throughput
The growth in throughput at the Port of Melbourne was determined from the Port of Melbourne’s published Development Plan to 2030 which provides predictions to 2015 and 2030 for various types of cargo. The total mass tonnes for 2020 for each cargo type was determined on a pro rata basis using this data.
Wastewater volumes
The increase in wastewater volumes was first determined by allocating a percentage of the wastewater to residents and a percentage to commercial/industrial/council. Data provided by the Ecological Engineering Practice Area of the City of Melbourne in the preliminary draft report, City
Page 90 of 101
Page D11
as a Catchment: A Strategy for Adaptation, suggests that in 2000, approximately 22 per cent of mains water supply was supplied for residential purposes. For the purposes of this study it was assumed that this also represented the percentage of wastewater produced by residents in the City of Melbourne. Residential and employment projection data as above was therefore used to determine the total predicted increase in megalitres per year of wastewater generated by the community
Page 91 of 101
Appendix E Financial modelling methodology
Page 92 of 101
City of Melbourne Zero Net Update 2008
Page E1
E1.1 Introduction
The following is an outline of the methodology for the financial consideration of carbon management solutions identified as part of the Zero Net Update 2008.
The methodology incorporates the basic project approach of firstly identifying the carbon reduction solutions and quantifying the associated emissions, and then modelling the identified cost, regulatory and macroeconomic influences.
E1.2 Process
1. Select solution
3. Development of cost, regulatory and macroeconomic scenarios
4. Financial calculations
2. Energy estimation
a. Direct costs b. Supporting regulatory and
funding environment c. Macro economic influences
o Internal rates of return o Payback periods o Net present value o Cash flows o Cost-benefit analysis
5. Solution viability decision
Figure E1: Zero Net Emissions by 2020 strategy review solutions – financial modelling
Page 93 of 101
City of Melbourne Zero Net Update 2008
Page E2
1. Select solution
The potential carbon management solution is identified during the Zero Net Emissions by 2020 strategy review.
2. Solution emission reduction contribution
As per the Zero Net Emissions by 2020 strategy review scope, the emission reduction contribution of each solution will be calculated.
Although the project process may have identified many potential solutions at this initial stage, a review will be undertaken to assess which solutions should proceed through a process of financial assessment.
3. Development of cost, regulatory and macroeconomic scenarios
Once the solutions to undergo a financial review have been confirmed, the parameters and influences that will define the viability of each solution need to be identified.
This will involve the consideration of a series of associated cost, regulatory and macroeconomic influences as discussed below.
a. Direct costs
Consideration of the direct associated costs of a suggested solution will involve aspects such as:
o initial capital costs
o installation expenditure
o project implementation costs (e.g. project management and administration)
o maintenance costs
o operating costs.
Direct costs are a particularly important factor given the scale of the solutions, the nature of the associated technology, and the relative experience of the recipients.
b. Supporting regulatory and funding aspects
The identified solutions will be subject to a range of both government and non-government influences, particularly in the area of regulation, policy and funding.
Each solution will be affected differently, requiring a tailored financial assessment approach. In addition, the regulatory and funding influences will need to be considered in the long-term (up to 2020 and beyond), and will require a series of assumptions of increasing variability.
Regulatory and funding influences that will have to be considered include:
• tax incentives which may support the implementation of a solution such as investment tax breaks
• tax structures which support the implementation of a solution by making alternative, more emissions-intensive solutions less attractive
• state and federal government subsidies
• one-off government grants for specific initiatives
• supportive regulatory frameworks for initiatives such as renewable power generation
• fiscal incentives for local governments
• direct fiscal incentives for individual households and businesses
• the emergence of a more robust framework to trade carbon and environmental assets such as that being proposed as part of the Australian Emissions Trading Scheme
• red-tape reduction on climate change initiatives.
Page 94 of 101
City of Melbourne Zero Net Update 2008
Page E3
c. Probable macroeconomic influences
In addition to the rapidly emerging regulatory and funding environment associated with government and non-government institutions, the financial assessment of identified solutions will also include the consideration of probable macroeconomic influences.
Such issues will include:
• the price of carbon which will need to be incorporated into investment decisions as price transparency improves
• the escalation of fuel prices due to scarcity issues such as peak oil.
4. Financial calculations
After determining the relevant cost, regulatory and macroeconomic influences, a financial model shall be built to undertake the assessment.
The model shall:
• use a series of financial parameters (discount rates, payback periods) agreed with the City of Melbourne to ensure alignment with the established financial assessment processes
• provide a set of financial outputs which shall have associated trigger points for decision making (internal rates of return, payback periods, net present value).
5. Solution viability decision
The set of financial outcomes will allow the City of Melbourne to make a decision regarding the viability of a solution on financial grounds.
Page 95 of 101
Appendix F Decarbonising the energy supply
Page 96 of 101
Page F1
F1 Decarbonising the energy supply Infrastructure type
Scale Application Emissions efficiency
Potential for market investment
Barriers to implementation
Actions for City of Melbourne/another appropriate vehicle to encourage implementation
Large-scale wind
State/ regional
Off-shore array or in industrial lands
High Medium/ high
Lack of detailed information to identify wind resource and available sites. Energy retailer concerns. Resident concerns and potential environmental impact.
• Fund/carry out capacity study focusing on industrial lands, the bay area, the Yarra and other under-used land in inner Melbourne.
• Make appropriate zoning arrangements for land with high potential.
• Agree with neighbouring councils and Victorian Government on sites to be prioritised for wind resource.
Decentralised combined cooling, heat and power
Regional/local
District systems that can match existing heating and cooling loads (e.g. hospital, retail, manufacturing)
Medium Medium/ high
No track record of implementation in Australia. Energy retailer concerns.
• Fund/carry out study to identify suitable locations where heating and cooling loads could be matched to a district supply (e.g. commercial/rental/residential, or university/hospital).
• Establish a Smart Energy Zone over priority sites and work with building owners on a collective investment strategy.
Solar photovoltaics
Regional/local
On buildings and other structures
Low Low Cost. Lack of net-metering.
• Carry out net present value assessment to determine whether a commercial or a break-even approach to installing PV on residential development is viable over the life of the Strategy (for example, through an Energy Performance Contracting mechanism operated by City of Melbourne or commercially).
• Encourage state governments to honour their commitment to the introduction of net-metering to support local generators in reaping the full financial benefit of electricity generation.
Page 97 of 101
Page F2
Infrastructure type
Scale Application Emissions efficiency
Potential for market investment
Barriers to implementation
Actions for City of Melbourne/another appropriate vehicle to encourage implementation
Micro wind Local On buildings and other structures
High Medium/ high
Lack of incentive for building owners and developers to install.
• Require all new developments to include a proportion of on-site renewable or low-carbon energy supply (so-called Merton rule).
• Establish Smart Energy Zones within CBD and target building owners within this zone to reduce energy use and displace a percentage of energy use with local supply.
• Encourage building owners to participate through incentives such as recognition events.
Pyrolysis of waste
Regional Discrete electricity plant to feed into grid
High Low/ medium
No track record of implementation in Australia.
• Carry out study to track commercial and industrial waste to determine the percentage of the carbon/methane resource being under-used.
• Carry out options analysis of best approach to optimise carbon/methane value of commercial, industrial and municipal waste in greater Melbourne.
• As part of the study, identify suitable locations for a pyrolysis/AD plant within greater Melbourne.
• Via regulatory powers require commercial and industrial waste collection and treatment processes to optimise carbon and methane value of waste.
Anaerobic digestion or green waste
Regional Discrete electricity plant to feed into grid
High Medium Limited track record of implementation. Competition for feedstock from compost industry.
As above
Page 98 of 101
Page F3
Infrastructure type
Scale Application Emissions efficiency
Potential for market investment
Barriers to implementation
Actions for City of Melbourne/another appropriate vehicle to encourage implementation
Clean source hydrogen fuel cell
Local In commercial and manufacturing operations
Medium Low No significant track record of implementation in Australia
• Encourage investment in local market by providing opportunities for local industry through appropriate zoning in manufacturing and industrial lands.
Stirling engine Local In commercial and manufacturing operations
Medium Low No track record of implementation in Australia
• Encourage investment in local market by providing opportunities for local industry through appropriate zoning in manufacturing and industrial lands.
Geothermal State/ regional
As part of combined heating and cooling plant
Medium Medium Identifying suitable geothermal conditions within City of Melbourne boundary
• Lobby Victorian Government to fund study to determine location of further geothermal sites within greater Melbourne (other than Rye).
Page 99 of 101
Agenda Item 5.6 Environment Committee
6 May 2008
FINANCE ATTACHMENT
ZERO NET UPDATE – DRAFT FOR PUBLIC CONSULTATION
There is no direct financial implication arising from the recommendation contained in this report.
Joe Groher Manager Financial Services
Page 100 of 101
Agenda Item 5.6 Environment Committee
6 May 2008
LEGAL ATTACHMENT
ZERO NET UPDATE – DRAFT FOR PUBLIC CONSULTATION
There are no legal implications arising from the recommendations in this report.
Section 3C(1) of the Local Government Act 1989 (“the Act”) provides that the primary objective of a Council:
“is to endeavour to achieve the best outcomes for the local community having regard to the long term and cumulative effects of decisions.”
Section 3C(2) of the Act goes on to state that in seeking to achieve its primary objective, a Council must have regard to facilitating objectives, including —
“(a) to promote the social, economic and environmental viability and sustainability of the municipal district;”
Under section 3F of the Act, Council also has the power to do all things necessary and convenient to be done in connection with the achievement of its objectives and performance of its functions.