ZERO-ORDER DRAFT IPCC WGII AR5 Chapter 8 Do Not Cite, Quote, or Distribute 1 25 July 2011 Chapter 8. Urban Areas 1 2 Coordinating Lead Authors 3 Aromar Revi (India), David Satterthwaite (UK) 4 5 Lead Authors 6 Fernando Aragon (Mexico), Jan Corfee-Morlot (USA / OECD), Robert B.R. Kiunsi (United Republic of Tanzania), 7 Mark Pelling (UK), Debra Roberts (South Africa), William Solecki (USA) 8 9 Review Editors 10 John Balbus (USA), Omar-Dario Cardona (Colombia) 11 12 Volunteer Chapter Scientist 13 Alice Sverdlik (USA) 14 15 16 Contents 17 18 Executive Summary 19 20 8.1. Introduction 21 8.1.1. Key Issues 22 8.1.2. Scope of the Chapter 23 8.1.3. Context – an Urbanizing World 24 8.1.4. Conclusions from Fourth Assessment Report and What this Chapter does beyond that Assessment 25 26 8.2. Urbanization Processes, Sustainable Habitats, and Climate Change Risks 27 8.2.1. Introduction 28 8.2.2. Urbanization 29 8.2.2.1. Magnitude and Connections to Climate Change 30 8.2.2.2. Spatial 31 8.2.2.3. Temporal 32 8.2.2.4. Sustainability and Ecological Habitat 33 8.2.2.5. Regional Patterns 34 8.2.3. Direct Climate Impacts 35 8.2.3.1. Introduction 36 8.2.3.2. Water and Sanitation 37 8.2.3.3. Energy 38 8.2.3.4. Transportation and Telecommunications 39 8.2.3.5. Built Environment, and Recreation and Heritage Sites 40 8.2.3.6. Ecosystem Services and Green Infrastructure 41 8.2.3.7. Social and Public Services 42 8.2.4. Urbanization Impacts 43 8.2.4.1. Introduction 44 8.2.4.2. Uncertainty and Surprise 45 8.2.4.3. Extreme Event Probability 46 8.2.4.4. Transitions 47 8.2.4.5. Social Dynamics and Economic Tensions 48 8.2.4.6. Historical Analogs 49 8.2.5. Changes in Risk and Vulnerability 50 8.2.5.1. Introduction 51 8.2.5.2. Inland Flooding 52 8.2.5.3. Coastal Flooding, Sea-Level Rise, and Storm Surge 53 8.2.5.4. Urban Heat and Cold 54
Transcript
ZERO-ORDER DRAFT IPCC WGII AR5 Chapter 8
Do Not Cite, Quote, or Distribute 1 25 July 2011
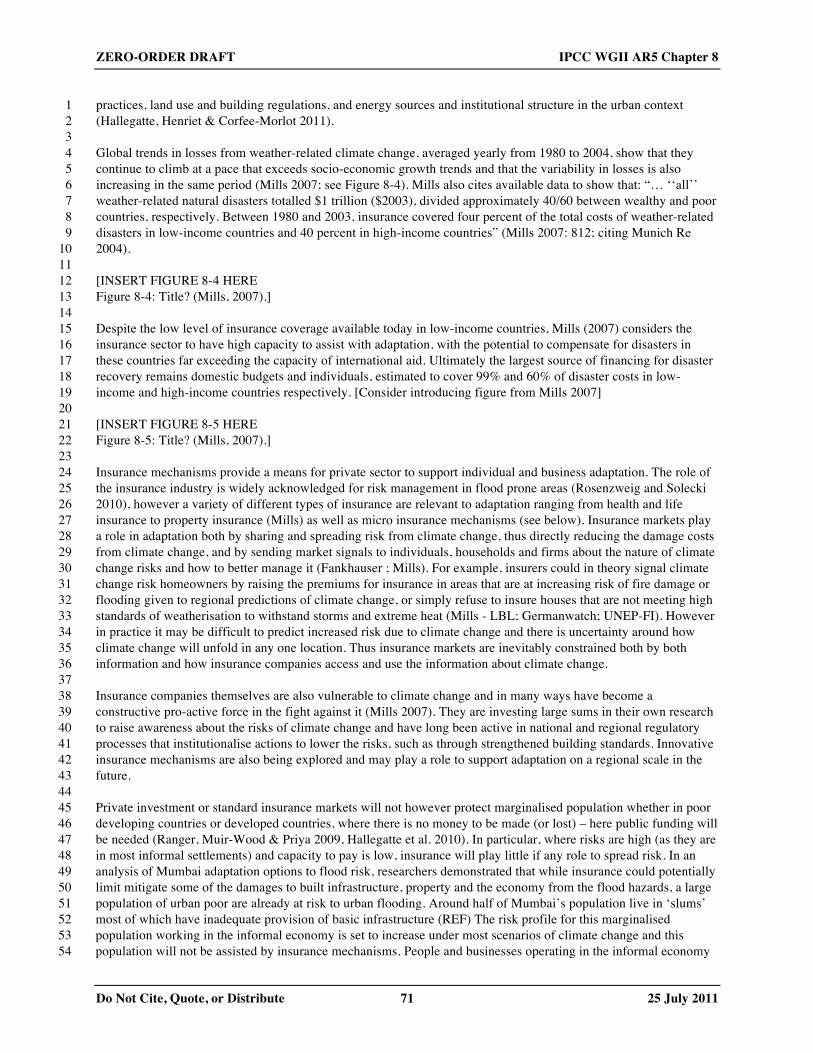
Chapter 8. Urban Areas 1 2 Coordinating Lead Authors 3 Aromar Revi (India), David Satterthwaite (UK) 4 5 Lead Authors 6 Fernando Aragon (Mexico), Jan Corfee-Morlot (USA / OECD), Robert B.R. Kiunsi (United Republic of Tanzania), 7 Mark Pelling (UK), Debra Roberts (South Africa), William Solecki (USA) 8 9 Review Editors 10 John Balbus (USA), Omar-Dario Cardona (Colombia) 11 12 Volunteer Chapter Scientist 13 Alice Sverdlik (USA) 14 15 16 Contents 17 18 Executive Summary 19 20 8.1. Introduction 21
8.1.1. Key Issues 22 8.1.2. Scope of the Chapter 23 8.1.3. Context – an Urbanizing World 24 8.1.4. Conclusions from Fourth Assessment Report and What this Chapter does beyond that Assessment 25
8.2.2.1. Magnitude and Connections to Climate Change 30 8.2.2.2. Spatial 31 8.2.2.3. Temporal 32 8.2.2.4. Sustainability and Ecological Habitat 33 8.2.2.5. Regional Patterns 34
8.2.3. Direct Climate Impacts 35 8.2.3.1. Introduction 36 8.2.3.2. Water and Sanitation 37 8.2.3.3. Energy 38 8.2.3.4. Transportation and Telecommunications 39 8.2.3.5. Built Environment, and Recreation and Heritage Sites 40 8.2.3.6. Ecosystem Services and Green Infrastructure 41 8.2.3.7. Social and Public Services 42
8.2.4. Urbanization Impacts 43 8.2.4.1. Introduction 44 8.2.4.2. Uncertainty and Surprise 45 8.2.4.3. Extreme Event Probability 46 8.2.4.4. Transitions 47 8.2.4.5. Social Dynamics and Economic Tensions 48 8.2.4.6. Historical Analogs 49
8.2.5. Changes in Risk and Vulnerability 50 8.2.5.1. Introduction 51 8.2.5.2. Inland Flooding 52 8.2.5.3. Coastal Flooding, Sea-Level Rise, and Storm Surge 53 8.2.5.4. Urban Heat and Cold 54
ZERO-ORDER DRAFT IPCC WGII AR5 Chapter 8
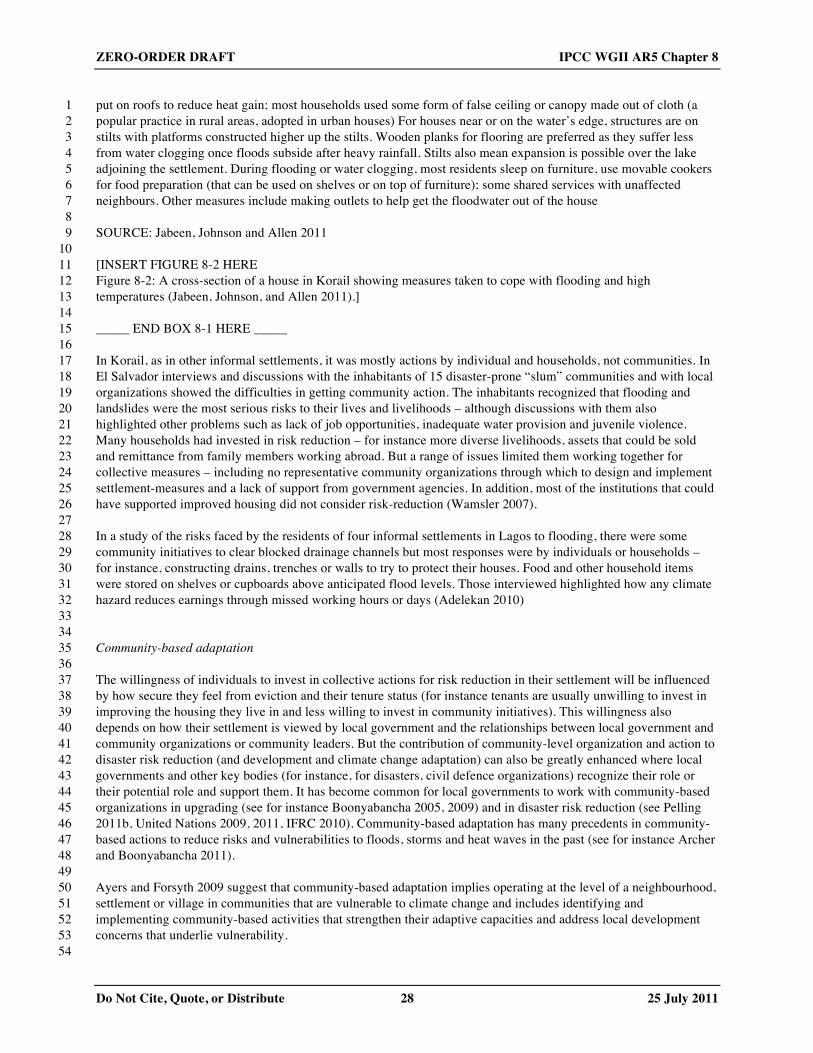
Do Not Cite, Quote, or Distribute 2 25 July 2011
8.2.5.5. Drought and Water Scarcity 1 8.2.5.6. Air Pollution and Public Health 2 8.2.5.7. Geohydrological Hazards 3
8.2.6. Urban Governance 4 8.2.6.1. Introduction 5 8.2.6.2. Institutional Environment 6 8.2.6.3. Governance and Civil Society 7 8.2.6.4. Science-Policy Linkages 8 8.2.6.5. Decision-Support Tools 9 8.2.6.6. Development as Risk and Vulnerability Reduction 10 8.2.6.7. Private Sector 11
12 8.3. Adapting Urban Areas 13
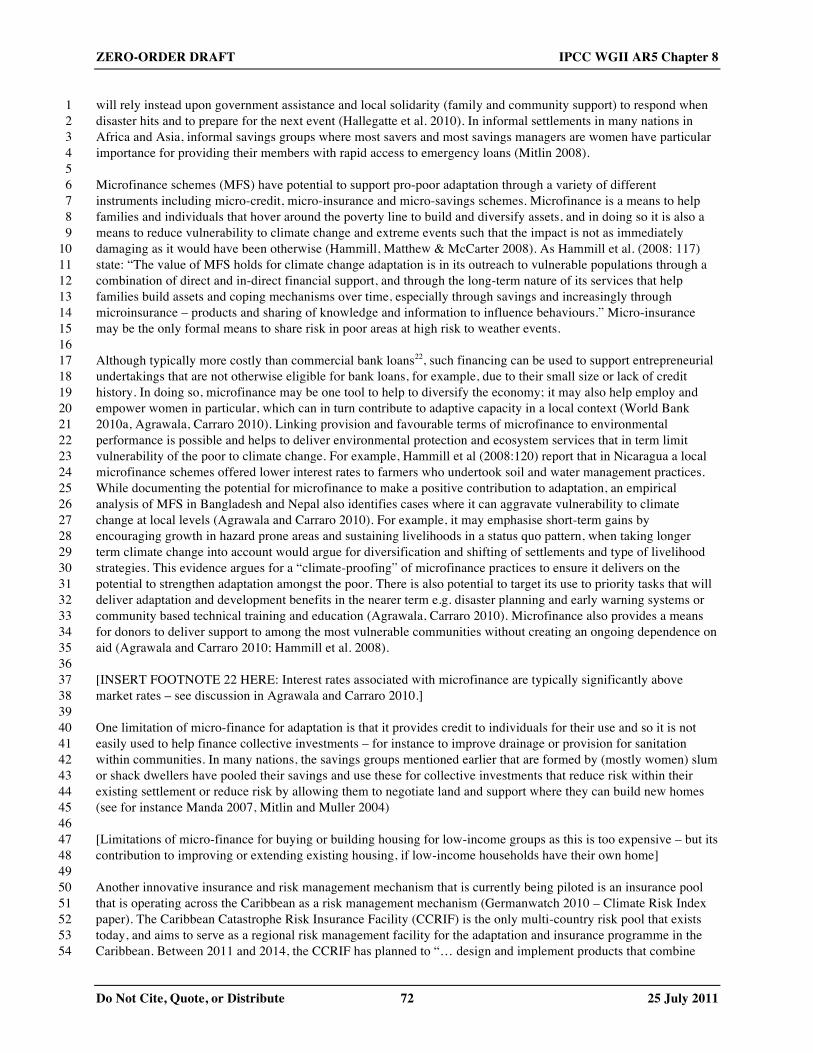
8.3.1. Introduction 14 8.3.2. Development Plans and Pathways 15
8.3.2.1. Adaptation and Development Planning 16 8.3.2.2. Mainstreaming Adaptation into Development Planning 17 8.3.2.3. Risk Reduction, Disaster Prevention, and Adaptation to Climate Change at the Policy 18
Level 19 8.3.2.4. Household- and Community-Based Adaptation in Urban Areas 20
8.3.3. Adapting Key Sectors 21 8.3.3.1. Adapting the Economic Base of Urban Centers 22 8.3.3.2. Adapting Food and Biomass for Urban Populations 23 8.3.3.3. Adapting Housing and Settlement 24 8.3.3.4. Water, Sanitation, Drainage, and the Larger Systems of which They are Part 25 8.3.3.5. Electricity and Other Energy Sources 26 8.3.3.6. Adapting Transport and Telecommunications 27 8.3.3.7. Green Infrastructure and Ecosystem Services within Urban Adaptation 28 8.3.3.8. Adapting Public Services 29
8.3.4. Urban Planning, Management, and Governance 30 8.3.5. Landscape and Regional Connections 31 8.3.6. Building Resilience in Urban Areas within a Commitment to Mitigation 32 8.3.7. The Limits to Adaptation and How these Change over Time 33
34 8.4. Enabling and Supporting Urban Adaptation and Adaptive Capacity 35
8.4.1. Enabling Frameworks 36 8.4.1.1. Introduction 37 8.4.1.2. Building Urban Capacity to Adapt across Levels and Government across Levels, 38
Stakeholders 39 8.4.1.3. Need to Align Action across Levels of Government – Nested Institutions 40 8.4.1.4. Local Government as a Central Actor in Risk Assessment and Adaptation 41 8.4.1.5. Assessment and Delivery of Co-Benefits 42 8.4.1.6. Summary Points 43
8.4.2. Funding and Supporting Urban Governments – Public Sector Domestic Action 44 8.4.3. Recognizing Role of and Supporting Community-Based Adaptation 45
8.4.3.1. Community-Based Action and Local Government 46 8.4.3.2. Community-Based Risk and Vulnerability Mapping 47
8.4.4. Role of Private Sector (including Market-Driven Responses) and Civil Society 48 8.4.4.1. Introduction 49 8.4.4.2. Incentivizing Private Investment and Action – Policy Frameworks, Information 50
8.4.5. Role of International (Development) Assistance Agencies and Humanitarian Sector 51 8.4.6. Learning Cycles and Systems 52
8.4.6.3. City Networks – Sharing Experiences with Spreading Learning between Urban Centers 1 2 8.5. Draft Conclusions: What has been Learned from City Adaptation Strategies to Date 3
8.5.1. Introduction 4 8.5.2. What Contributes to Cities Developing Adaptation Plans? 5 8.5.3. What Hinders Adaptation Progress in Urban Areas? 6
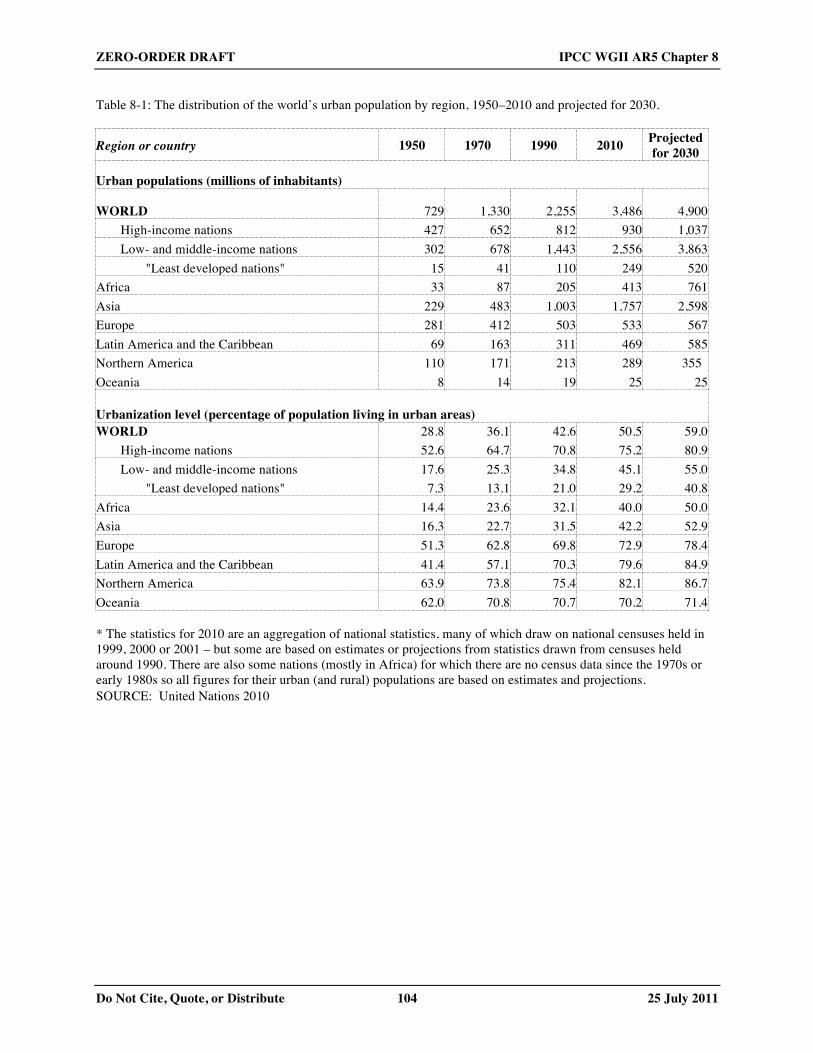
7 References 8 9 10 Executive Summary 11 12 [to be developed] 13 14 15 8.1. Introduction 16 17 8.1.1. Key Issues 18 19 [to be developed] 20 21 22 8.1.2. Scope of the Chapter 23 24 [to explain key linkages with Chapter 9 and 10 and other chapters] 25 26 27 8.1.3. Context – an Urbanizing World 28 29 The world’s urban centres now house more than 3.5 billion people; over half the world’s total population (see Table 30 8-1). This chapter describes how a large and growing proportion of this urban population is at risk from climate 31 change impacts. United Nations projections suggest that the urban population in what are today low- and middle 32 income nations will grow by 1.3 billion between 2010 and 2030; this represents almost all the growth in the world’s 33 population in these two decades since the urban population in high-income nations is projected to increase by less 34 than 100 million and the world’s rural population is projected to decrease by 13 million (United Nations 2010). 35 Thus, the challenge facing national and urban governments is not only around building resilience for the current 3.5 36 billion urban dwellers but also for making provisions to build resilience to climate change impacts for this growth of 37 1.3 billion urban dwellers. 38 39 [INSERT TABLE 8-1 HERE 40 Table 8-1: The distribution of the world’s urban population by region, 1950–2010 and projected for 2030.] 41 42 Urban populations are also expanding in almost all low and middle income nations; for some nations and 43 many cities, very rapidly (United Nations 2010). This can increase the number exposed to climate-related 44 risks and particularly sensitive to these risks. The high proportion of the world’s urban population live in 45 informal settlements with inadequate or no provision of the services, infrastructure, and institutional frameworks 46 needed for climate change adaptation. The effects of climate change may be disproportionately borne by such dense, 47 high-risk areas (Hardoy and Romero Lankao 2011: 158-9, UN-Habitat 2011). Low-income households may require 48 particular assistance due to their greater exposure to hazards, lower adaptive capacity, more limited access to 49 infrastructure or insurance, and fewer possibilities to relocate to safer accommodation as compared to wealthier 50 residents (Satterthwaite et al. 2007, Bartlett 2008, Hardoy and Pandiella 2009). 51 52 Urban centres also house the enterprises that generate most of the world’s GDP (over 90 percent REF NEEDED) 53 and are homes to a high proportion of the world’s wealthy population. So in regard to adaptation, they include a high 54
ZERO-ORDER DRAFT IPCC WGII AR5 Chapter 8
Do Not Cite, Quote, or Distribute 4 25 July 2011
proportion of the world’s assets – assets of households, businesses, cultures and public or private institutions. A 1 large proportion of greenhouse gas emissions are generated within their boundaries or, less directly, by the 2 consumption of their residents. Approximately 70% of the world’s greenhouse emissions emerge from urban-related 3 demands (Hoornweg et al. 2011). Urbanization can be considered as a continuous process that is always unfinished 4 as cities and smaller urban centres continue to undergo transformations (Solecki and Leichenko 2006). 5 6 AR4 emphasized how human settlements have demonstrated a capacity to adapt to environmental conditions and 7 resource availabilities. Every successful city has had to do so. The fact that cities concentrate people, enterprises and 8 motor vehicles and their wastes could imply high levels of environmental health risks. But successful, well-governed 9 cities demonstrate that this concentration can also be associated with good health standards - for instance in regard 10 to low infant, child and maternal mortality rates and high life expectancies. The concentration of people and 11 enterprises in cities not only provides economies of scale or agglomeration for business but also potential economies 12 of scale or agglomeration for most forms of infrastructure and services that reduce environmental health risks 13 (Hardoy et al 2001, Satterthwaite 2011). However, in a high proportion of the world’s urban centres, these 14 economies are not acted upon and there are very large deficits or deficiencies in provision for water, sanitation, 15 drainage, health care, emergency services and disaster risk reduction. 16 17 The concentration of people (and their demands) and economic activities in urban centres also provides economies 18 of scale and proximity for much of what constitutes adaptive capacity. This includes lower unit costs per person 19 served in most forms of infrastructure and services that are central to adaptive capacity (refs). Many cities have 20 demonstrated a capacity to reduce risks from local environmental hazards including extreme weather events on 21 which climate change adaptation can build (Velasquez 1998, Hardoy et al 2001, Wilbanks, Romero Lankao et al 22 2007, IFRC 2010, UN Habitat 2011). As UN Habitat 2011 notes, “Perhaps not enough recognition has been given to 23 the enormous progress achieved over the last 100–120 years within successful, well governed cities, in dramatically 24 reducing environmental hazards and their impacts on potentially vulnerable populations. This is also an important 25 part of why life expectancies have increased so much over the last 100-150 years in successful cities, including 26 many in developing countries” (page xx) 27 28 Cities can be considered as “hubs of development” that can facilitate effective responses to climate change (Romero 29 Lankao and Dodman 2011: 113) and that often have capacities to mobilize resources for investment in adaptation. 30 But this depends on the effectiveness of city and municipal governments and their capacity to work with a range of 31 government and civil society institutions at local and national level. Thus, urbanization is likely to bring increased 32 risk levels to a range of climate-related hazards for a large and growing proportion of the world’s population – while 33 also having the potential to support increased adaptive capacity. 34 35 Many scholars have commented on the importance of equity issues in regard to the consequences of climate change 36 and how they are connected to development challenges, particularly in low-income countries (O’Brien and 37 Leichenko, 2000; Mirza, 2003; O’Brien et al, 2004; Tol et al, 2004; Thomas and Twyman, 2005; Paavola and 38 Adger, 2006; Reid and Vogel, 2006). The close association of vulnerability and inequity is highlighted by 39 contributions drawing attention to factors influencing individuals’ or groups’ capacity to anticipate, cope, resist and 40 recover from the impact of a natural hazard (Bohle et al, 1994; Wisner, 2004). These factors (assets, sources of 41 livelihood, class, race, ethnicity, gender and poverty) are also part of the discussion of social justice presented in 42 approaches seeking higher states of social well-being (development, sustainable development and decentralization). 43 Scholars have also raised awareness about equity issues in adaptation to climate change. Adger et al (2005) call 44 attention to distributional issues of adaptation and to the balance between private and public costs and benefits of 45 adaptation action. Their efforts to identify the criteria for success in adaptation recognize possible externalities at 46 other geographical and temporal scales and the risk that actions effective for the adapting agent may produce 47 negative externalities and spatial spill-overs, potentially increasing impacts upon others or reducing their capacity to 48 adapt. Dow et al (2006) argue that a moral imperative exists for the most vulnerable people in adaptation efforts if 49 social justice is to be achieved; as this chapter emphasizes, a significant proportion of the world’s most vulnerable 50 people live and work in urban areas. 51 52 Most cities have significant spatial and socioeconomic disparities in regard to vulnerability to environmental hazards 53 (Stephens 1996, Hardoy et al 2001, GRNUHE 2010) and climate change may reinforce inequalities based on 54
ZERO-ORDER DRAFT IPCC WGII AR5 Chapter 8
Do Not Cite, Quote, or Distribute 5 25 July 2011
income, gender, or other differences (Terry 2009). In all urban centres, there are likely to be differentials within the 1 population in vulnerability to climate change impacts – for instance by income group, age and gender (Bartlett 2 2008). These differentials are usually in all three of the components of vulnerability – exposure, sensitivity and 3 adaptive capacity. Almost all the likely impacts of climate change may disproportionately affect low-income groups 4 (see for example Revi 2008). Most of those who are killed or injured in most extreme weather events in urban areas 5 and most of those who lose most or all their assets are from low-income groups (UN 2009, IFRC 2010, UN Habitat 6 2011). For low-income groups, the scale of these differentials are much influenced by the extent to which these 7 groups can find and afford accommodation that is structurally safe and served by infrastructure and services. Also 8 by the extent to which low-income groups are served by measures for disaster prevention and preparedness (and 9 these measures’ effectiveness). The likely increase in risks from the expansion of the range of the mosquitoes that 10 cause dengue fever and malaria are likely to impact those who live and work in homes and neighbourhoods where 11 public health measures to eliminate disease vectors are absent or ineffective and where access to appropriate health 12 care services is limited or absent. Higher temperatures and less reliable water supplies will also increase risks from 13 diarrhoeal diseases, especially from flooding. 14 15 In regard to who is least able to cope with impacts, the increased health risks noted above become all the more 16 serious if those who get sick or injured by extreme events have to rely on overtaxed and often ineffective health care 17 systems, and lose school and work days to health problems that should have been prevented (United Nations 2009, 18 2011). Here the speed and effectiveness of post-disaster response has such importance for helping the groups 19 affected to cope with the impacts – for instance in making immediate provision for safe locations for those who have 20 been displaced, in rapid and effective treatment for those who are injured and in supporting those who have been 21 displaced to plan and implement their own individual, household and community recovery (Boonyabancha and 22 Archer 2011, Carcellar et al 2011, IFRC 2010.) Post-disaster responses including the provision for temporary 23 accommodation also need to understand the different needs and priorities by different age groups and the different 24 risks they face; of course, this also applies to women and girls. 25 26 Differentials in vulnerability by gender and age issues here? 27 Residents in more affluent cities may face ‘double exposure,’ stemming from climate change and globalization that 28 encouraged settlement in ‘amenity landscapes’ or other areas vulnerable to the effects of climate change (Leichenko, 29 O’Brien, and Solecki 2010: 965). 30 31 In relation to the potential vulnerability of urban populations and economies to climate change, two aspects need 32 attention. The first is the extent to which in each urban centre, current provisions for infrastructure and services and 33 for ensuring health and safety standards in all buildings (and the governance base needed to achieve this) provide a 34 basis for building resilience to different climate change impacts. There are very large differences among the world’s 35 urban centres in the extent to which there is such a basis. The second is how the current and likely future drivers of 36 urbanization change this – including the extent to which the growth in urban areas and economic activities within 37 existing urban centres or new ones is taking into consideration climate change risks and making provision for 38 adaptation. 39 40 Thus, this chapter has to present a summary of what is very diverse. From urban centres with high living standards 41 where environmental health risks including those associated with extreme weather have been greatly reduced - to 42 those with very poor living standards for most of all of the population where there are very large deficits in 43 provision for most or all the infrastructure and services that should reduce environmental health risks. From urban 44 centres with competent governments that have substantial capacities to invest in climate change adaptation to those 45 that have weak and ineffective governments with little or no investment capacity. From urban centres and systems 46 that are very large (including the 21 city agglomerations that had more than 10 million inhabitants by 2010 and so 47 were termed mega-cities) to the tens of thousands of urban centres with under 10,000 inhabitants. From urban 48 centres on sites at very high risk from sea-level rise and/or extreme weather and other very likely climate change 49 impacts to those on sites that are, at least for the likely climate change impacts for the next few decades, facing 50 relatively low risks (and a proportion whose economies will benefit from climate change). From urban centres with 51 successful economies that continue to attract new enterprises to those with weak economic bases, including major 52 cities that are losing population and have lost their previous comparative advantage. From urban economic bases 53
ZERO-ORDER DRAFT IPCC WGII AR5 Chapter 8
Do Not Cite, Quote, or Distribute 6 25 July 2011
that are comparatively insensitive to climate change to those that are very sensitive – for instance agro-industrial 1 centres reliant on crops whose production faces constraints or tourist centres whose attraction is lessened. 2 3 In high-income nations, urban populations expect there to be a web of institutions, infrastructure, services and 4 regulations that protect them from extreme weather/floods. Much of this comes from infrastructure and services that 5 also provides everyday needs including health care services and storm and surface drainage. Early warning for 6 approaching storms are expected, as is a rapid emergency response from the police, armed services, health services 7 and fire services, when needed. Almost all buildings conform to health and safety regulations and are served by 8 piped water, sewers, all-weather roads, electricity and drains 24 hours a day. The costs of such infrastructure and 9 services represent a small proportion of income for most citizens - whether paid direct as service charges or within 10 taxes. While coverage for some services may be sub-standard and some groups ill-served or excluded, a high 11 proportion of the urban population are well served and well protected. In addition, there are functioning systems of 12 city planning and land-use regulation that can adjust to new or heightened risk that climate change will or may bring 13 – and this is likely to be supported by changes in private sector investments (over time shifting from high-risk areas) 14 and changes in insurance premiums and coverage. So most urban centres in high income nations have the capacity to 15 adapt to most of the likely impacts from climate change in the next few decades (although this does not mean they 16 are currently doing so). 17 18 The financial and institutional capacity for urban adaptation is weaker in urban centres in low-income and most 19 middle-income nations (Bicknell et al 2009, UN Habitat 2011). For most such urban centres, large sections of their 20 population and workforce are not served by a comparable web of institutions, infrastructure, services and protective 21 regulations. This can be seen in the proportion of their populations living in poor quality and often overcrowded 22 accommodation that lacks provision for (among other things) water piped into homes, provision for sanitation and 23 drainage, health care services , schools and emergency services. It is common for a high proportion of this 24 population to be living in settlements that are illegal – either on land occupied illegally or on land sub-divided 25 illegally. For instance, it is common for 20 to 60 percent of the population of cities to live in such informal or illegal 26 settlements. This means that the homes, neighbourhoods and livelihoods of their population fall outside the 27 regulatory framework (see for instance Awuor, Orindi and Adwerah 2008, Adelekan 2010, Jabeen, Allen and 28 Johnson 2010). For a high proportion of the world’s urban centres, the scale of current deficiencies in provision for 29 infrastructure and services makes it difficult to see how they can adapt to climate change. For instance, most urban 30 centres in low-income nations in Africa and Asia have no sewers (including many major cities) and much of the 31 population have no water piped to their home and no official solid waste collection service (Hardoy, Mitlin and 32 Satterthwaite 2001, UN-Habitat 2003a). For cities in these nations that do have sewers, these often serve less than 10 33 percent of the population. 34 35 Add here a paragraph on where risks are highest and note where in the text there is more detail on this. Note the two 36 recent World Bank Reports: Cities and Climate Change: An Urgent Agenda (2010) and Economics of Adaptation to 37 Climate Change (2010) indicate that up to 80 percent of the expected $80 billion to $100 billion per year in climate 38 change adaptation costs are expected to be associated with cities in low- and middle-income nations/ 39 40 Thus, each urban centre falls within a continuum in regard to at least four key factors in regard to adaptation: the 41 competence, capacity and accountability of its government; the proportion of its population with incomes too low to 42 allow them to afford food and non-food needs; the extent to which the whole population (and vulnerable groups 43 within this population) live in good quality homes on safe sites and are served by the basic infrastructure and 44 network of services that should serve as the main reducers of risk; and the extent to which their site is at risk from 45 climate change impacts. 46 47 HERE OR CONCLUSIONS? In urban areas, the challenges and opportunities for adaptation are often 48 derived from the same features of city life – the concentration of people, buildings and economic activities. 49 Large, dense urban centres serve to concentrate and often exacerbate climate-related risks in regard to health impacts 50 and economic losses (Munich Re 2005, United Nations 2009). The risks from rising temperatures due to climate 51 change may be further elevated by the urban heat island effect (McMichael et al. 2008, Kovats and Akhtar 2008, 52 Harlan and Ruddell 2011). Floods and other climate-related extreme events may have more severe impacts as a 53 result of how urban development alters hydrological patterns and where inadequate provision is made for drainage 54
ZERO-ORDER DRAFT IPCC WGII AR5 Chapter 8
Do Not Cite, Quote, or Distribute 7 25 July 2011
(Douglas et al 2008, Nicholls 2004, others). Many of the world’s largest cities are on the coast and with substantial 1 proportions of their urbanized areas in low elevation coastal zones and so at risk from sea-level rise and storm surges 2 (McGranahan, Balk, and Anderson 2007: 19). Many large cities are dependent on freshwater resources that are 3 likely to become more constrained – and this is particularly serious for cities where demands (and water needs) are 4 already facing serious constraints (REFS). The inhabitants and enterprises concentrated in cities depend on reliable 5 supply chains for food and many other essential goods and so are vulnerable to any climate-related change that 6 disrupts or diminishes supplies. 7 8 There is a growing literature discussing how successful adaptation requires recognising the interrelations and 9 interdependence between sectors (Roberts 2010, Gasper, Blohm, and Ruth 2011, Sánchez-Rodriguez 2009). 10 Adaptation is “deeply and complexly linked with other economic and social goals”, so that climate policies in cities 11 may need to be embedded in responses to multiple threats and stresses (Wilbanks and Kates 2010: 720). Some 12 assessments have examined the effects of climate change in multiple sectors, helping to inform integrated adaptation 13 measures (Kirshen, Ruth, and Anderson 2008). Other plans have identified sectoral strategies to overcome deficits in 14 housing, water, or other infrastructures critical in adapting to climate change (see section 3.3). 15 16 (This is a summary section pointing the reader to where more detailed discussions of these issues are) 17 Many of the responsibilities for reducing environmental health risks and preparedness for disasters in urban 18 areas fall to local governments. But it is now widely recognized that adapting urban centres to climate change 19 requires support for urban governments from higher levels of government and support from residents, community-20 based and other civil society organizations and enterprises – hence the increased focus in the literature on adaptation 21 on ‘governance, ’ on its multi-level aspects and on the roles and responsibilities of local stakeholders. Issues of 22 governance and the role of non-state stakeholders increase in importance where local governments lack the capacity 23 or commitment to meet their responsibilities for risk reduction. 24 25 Note here mentioning what section 4 covers on this issue 26 27 Role of local government. Examples of local government acting on adaptation. Local governments have shaped a 28 range of adaptation plans and strategies (Hunt and Watkiss 2011, Zimmerman and Faris 2011). Local adaptation 29 plans may be stand-alone, as in London or Copenhagen, and further integration into urban planning frameworks may 30 be needed (Carter 2011). Transnational urban networks have encouraged action by urban governments on climate 31 change, though usually with a focus upon mitigation (Toly 2008, Bulkeley 2010). (THIS MAY HAVE DETAIL 32 BETTER PLACED ELSEWHERE) 33 34 35 8.1.4. Conclusions from Fourth Assessment Report and What this Chapter does beyond that Assessment 36 37 In AR4, urban areas were covered in chapter 7 that dealt with industries, settlements and human society. This 38 chapter noted that all three are accustomed to variability in environmental conditions; in many ways they become 39 more resilient to it when this is part of their normal experience. But they are more at risk if change is more extreme, 40 persistent or rapid, especially if not foreseen or capacities for adaptation limited. 41 42 One of the most valuable contributions of AR4’s Chapter 7 was to describe how climate change impacts and most 43 key vulnerabilities are rooted in local contexts in terms of geographic location, sectoral focus, local government 44 capacity, development pathways and population groups unable to avoid dangerous sites and homes. Key 45 vulnerabilities are most often related to climate phenomena that exceed thresholds for adaptation (eg extreme 46 weather or abrupt changes) and limited resources or institutional capacities to cope (development context); 47 adaptation in urban areas depends on competence and capacity of local governments. Thus, climate change impacts 48 are likely to require responses that go beyond normal adaptations to varying conditions. 49 50 AR4 noted that except for abrupt extreme events, climate change impacts are not the dominant issues in urban 51 centres – but their importance is in their interactions with other stresses such as rapid population growth, political 52 and social instability, poverty and inequality, weak or ineffective local governments (and jurisdictional 53 fragmentation) and aging or inadequate infrastructure. Climate change can ease or aggravate such stresses. 54
ZERO-ORDER DRAFT IPCC WGII AR5 Chapter 8
Do Not Cite, Quote, or Distribute 8 25 July 2011
1 AR4 described key vulnerabilities of urban centres, urban populations and urban enterprises to: 2
1) Interactions between climate change and global urbanization, especially in urban areas in low- and 3 middle-income nations which are housing most of the increase in the world’s population and where 4 adaptation capacity is usually weakest. 5
2) Interactions between climate change and the globalized economy – for instance in how climate change 6 impacts resource supplies and prices (water, fuels). The global economy depends on long supply chains and 7 multiple complex linkages between urban centres. Climate change impacts spread from directly impacted 8 areas and sectors to other areas and sectors through extensive and complex linkages. Many impacts are 9 unanticipated and total impacts are poorly estimated by considering only direct impacts. Vulnerabilities 10 include interregional trade patterns and migration patterns. 11
3) The availability of infrastructure and services important for human needs and for adaptation. These 12 are susceptible to damage from extreme weather, sea level rise and other climate change impacts. Where 13 infrastructure and services are inadequate, an additional source of stress could push system over threshold 14 of failure 15
16 Key points from AR4 of relevance to urban areas: 17 18 Climate change impacts and most key vulnerabilities are rooted in local contexts in terms of geographic 19 location (for instance sites at high risk from extreme weather), sectoral focus (for instance much tourism and agro-20 industry), development pathways and segments of the population (particular groups being more at risk to climate 21 change impacts by age, gender and income-level or living in particularly dangerous areas). 22 23 The importance of developing a better local knowledge on risks and vulnerabilities. But it is difficult to project 24 the magnitudes of changes in particular places and sectors (and thresholds) with precision, whether by downscaling 25 global climate models or extrapolating from past experience with climate variation. Historic experience of limited 26 value when potentially impacted systems are changing. Limits on predictability will delay adaptation. So too will the 27 weak knowledge base on the costs of adaptation. There are also all the uncertainties about socio-economic and 28 technological and institutional change within each location, nationally and globally. 29 30 Vulnerabilities tend to be localized. The vulnerabilities of industry, infrastructure, settlements and society greater 31 in certain high risk locations, particularly coastal and riverine locations Rapid urbanization in most low and middle 32 income nations are often in relatively high risk areas, increasing the proportion of their economies and populations 33 at risk. 34 35 Vulnerable sectors: There are large differentials in how sensitive urban economies are to climate change impacts – 36 for instance where urban economies are closely linked with climate sensitive resources such as agro processing, 37 water resources and tourism). Industry is considered less sensitive to climatic variability and with high capacity to 38 adapt, except where it is in high risk areas, or dependent on climate-sensitive inputs (food processing). However, 39 where extreme weather events threaten infra, bridges, pipelines and transmission networks, industry can experience 40 large losses or have the supply of key inputs disrupted. Perishable commodities among the most climate sensitive 41 retail markets; climate change may alter sourcing and processing of agricultural produce. For many businesses 42 including informal industries, adaptation will require a greater awareness of threats and alternatives that go beyond 43 historic experience and current access to finance. Many adaptations are incremental adjustments to current business 44 activities. Planning guidance and risk management by insurers will have role for structural adaptations such as 45 choice of location for industry. 46 47 Much tourism is sensitive to climate change – and increases in temperature, more rain and other aspects of climate 48 change can make popular tourist centres less attractive. Climate change may damage some key tourist assets eg coral 49 reefs and beaches. Energy price changes will affect travel and costs of comfort. 50 51 Technological innovation for climate change adaptation comes largely from industry and services motivated by 52 market signals and these may not be well matched with climate change adaptation needs and residual uncertainties. 53 54
ZERO-ORDER DRAFT IPCC WGII AR5 Chapter 8
Do Not Cite, Quote, or Distribute 9 25 July 2011
Vulnerable infrastructures and services. Infrastructure plans and investments generally include some scope for 1 coping with climate variability but in many locations, these will need to increase reserve margins, develop back up 2 capacity and take other adaptation measures. Certain types of infrastructure are more at risk – for instance most 3 transport, drainage and electricity transmission systems and many water supply abstraction and treatment works. 4 5 Climate change will increase demands on water and energy supplies and often on health care and emergency 6 response systems in many locations. 7 8 Vulnerable populations. Among groups of the population particularly at risk are those with limited or inadequate 9 incomes and limited asset bases (which limits their adaptation capacity) and living in substandard accommodation 10 lacking infrastructure and services and in at risk locations (which increases the risks they face). Particular attention 11 needs to be paid not only to those with inadequate incomes and assets but also infants and children, the elderly, the 12 least skilled, the powerless, those who are linguistically isolated and those who face discrimination (including 13 women). 14 15 Adapting to climate change involves cascading decisions across a landscape made up of agents from individuals, 16 firms and civil society and public bodies operating at different scales. Individual adaptation may not produce 17 systemic adaptation, adaptation of systems may not benefit all (some increase vulnerabilities of people and places). 18 Adaptation is not a capital stock that can be invested in projects but a process of learning about changing risks and 19 opportunities, making decisions, revising strategies. 20 21 Adaptation of infrastructure and building stock often dependent on changes in institutions and governance 22 framework (what is often termed soft infrastructure). But institutions that can address risk and vulnerability also 23 depend on hard infrastructure – for instance for health care and emergency services to function. Climate change 24 becomes one of many changes to be understood and planned by for by local managers and decision makers. 25 26 Prospects for adaptation depend on magnitude and rate of climate change; slowing climate change makes adaptation 27 easier 28 29 The long time horizon of climate change and impacts makes potential for technological change a critical issue in 30 evaluating adaptation prospects. 31 32 Adaptation not necessarily optimal. Plausible actions can create net social and economic losses. 33 34 Key uncertainties and research priorities: 35
• Research on vulnerabilities and adaptation potentials of human systems lagging behind 36 • Understanding of impacts of climate change at fine grained geographic and sectoral scale; also of second 37
and third order impacts eg from temperature or precipitation change, storm behaviour change, sea level 38 rise, 39
• Uncertainties about potentials, costs and limits of adaptation 40 • Uncertainties about trends in societal, economic and technological change with or without climate change. 41 • Underlying all these research needs are often painfully serious limitations on data on nature-society links 42
and detailed scale contexts. Have to incorporate physical and earth science based data and in situ 43 observation systems with socio-economic data. 44
45 What has changed since AR4? 46 47 A larger and more diverse literature on current and potential vulnerabilities of different urban centres and different 48 sectors of urban economies to the impacts of climate change on their structure and functioning 49 50 A much larger body of evidence on adaptation responses being considered or taken by cities with more discussion of 51 the factors that encourage this 52 53
ZERO-ORDER DRAFT IPCC WGII AR5 Chapter 8
Do Not Cite, Quote, or Distribute 10 25 July 2011
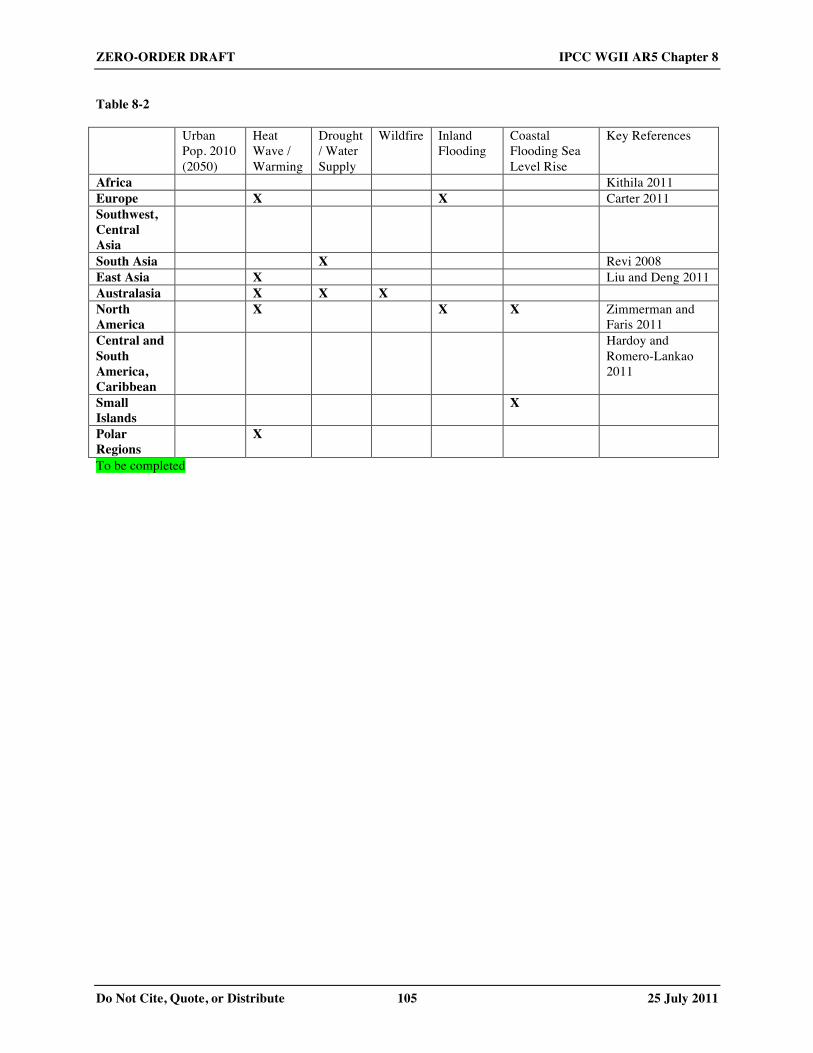
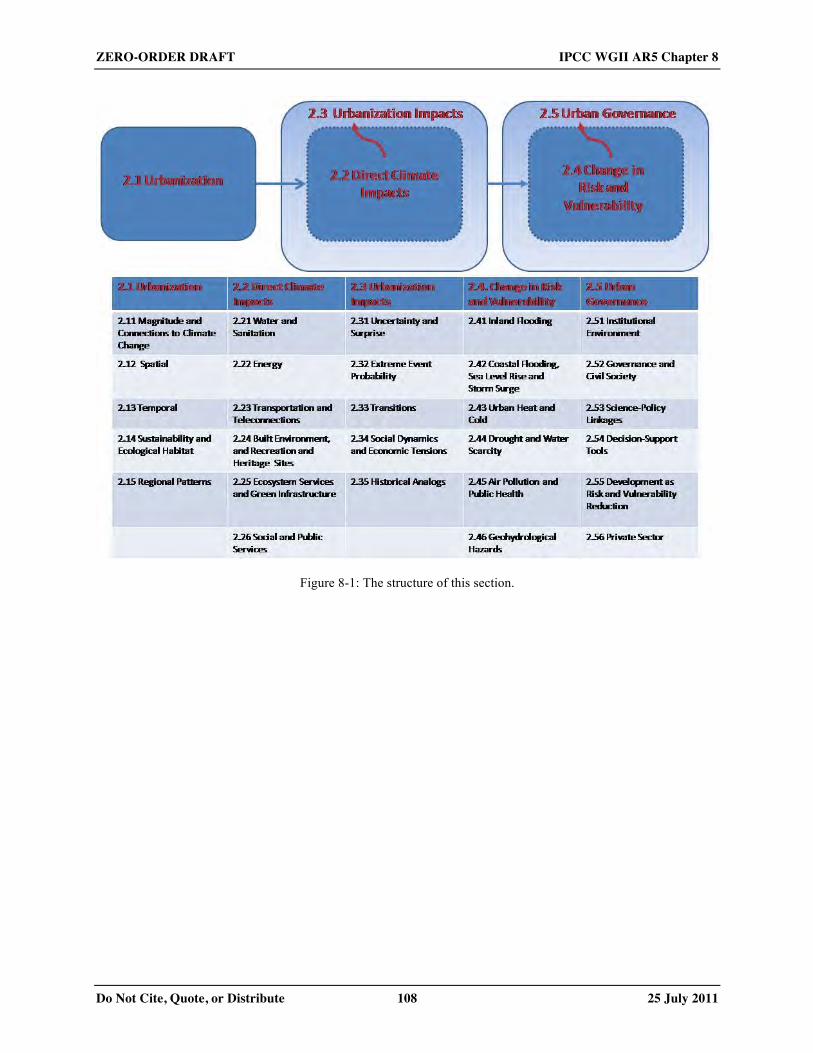
A more detailed and nuanced understanding of the many ways by which poverty exacerbates vulnerability to climate 1 change impacts 2 3 More consideration of the role of green infrastructure and eco system services in adaptation strategies 4 5 More considerations on the financing, enabling and supporting of adaptation 6 7 More case studies of community-based adaptation both in its potential contributions in urban areas and in its 8 limitations 9 10 More on learning from innovation in disaster risk reduction 11 12 13 8.2. Urbanization Processes, Sustainable Habitats, and Climate Change Risks 14 15 8.2.1. Introduction 16 17 The objective of this section is to summarize and assess connections between ongoing urbanization and climate 18 change with respect to changing patterns and conditions of climate risk and vulnerability. Focus will be on 19 urbanization and its environmental consequences, impacts and challenges (locally, regionally, and globally) and the 20 processes that lead to risk exposure and constrain people in high-risk livelihoods and residences, and generate 21 vulnerabilities in critical infrastructure. Governance and the institutional environment in the context of shifting 22 urban risk and vulnerability conditions are examined as well. Understanding urbanization is critical for an effective 23 global response to climate change as well-governed cities demonstrate a capacity to adapt and to learn from 24 difficulties and recover from crises (Solnit 2009; Vale and Campanella 2005). 25 26 The section is organized into the following sub-sections and topics detailed in Figure 8-1. Section 2.1 introduces the 27 conditions and process of contemporary urbanization, urban livelihoods, and the prospects for future growth. The 28 next section (2.2) assesses the recognized direct impacts of climate change on critical urban systems and functions, 29 focusing more explicitly on changes in exposure. The effect on these direct impacts on the process of ongoing 30 urbanization is detailed in section 2.3. These effects include shifts in the understanding and management of urban 31 functions. Together, the direct climate impacts and shifts in urbanization change the profile of societal risk and 32 vulnerability in urban communities. These conditions are assessed in section 2.4. The final section (2.5) reviews the 33 conditions of governance which are in direct reaction to changes in actual and perceived risk and vulnerability. As 34 such, the focus is on exposure and vulnerability reduction as opposed to adaptation outlined more completed in 35 sections 3 and 4. 36 37 [INSERT FIGURE 8-1 HERE 38 Figure 8-1: The structure of this section.] 39 40 41 8.2.2. Urbanization 42 43 Even the high concentration of the world’s GDP and assets in urban centers and the growing concentration of people 44 who live and work as described in section 1, it is anticipated that with time more people will be exposed to impacts 45 of climate change due to not only the increase in number of population living in urban areas but also due to an 46 increase in large cities, including mega cities (Sherbinin, et. al. 2007; Revi 2007). Sherbinin et al. (2007) point out 47 that the mega cities of Mumbai, Rio de Janeiro and Shanghai will be more vulnerable to climate change impacts 48 especially those related to flooding based on a business as usual scenario. 49 50 51
52
ZERO-ORDER DRAFT IPCC WGII AR5 Chapter 8
Do Not Cite, Quote, or Distribute 11 25 July 2011
8.2.2.1. Magnitude and Connections to Climate Change 1 2 The conditions of urbanization vary widely throughout the world and as discussed in section 1, the factors that 3 influence these conditions include the competence, capacity and accountability of its government; the proportion of 4 the population with incomes too low to allow them to afford food and non-food needs; the extent to which the whole 5 population (and vulnerable groups within this population) are served by the basic infrastructure and network of 6 services that should serve as the main reducers of risk; and the extent to which their site is at risk from climate 7 change impacts. This variation has important consequences both for the process of climate change and how cities 8 might be able to respond to climate change (Seto and Satterthwaite 2010; Güneralp and Seto 2008). This section 9 reviews urbanization across a set of important parameters and qualities – e.g., spatiality, temporal, and sustainability 10 - and within a global-regional context. 11 12 Urbanization brings forward a set of environmental challenges and opportunities vis-à-vis climate change (Simon 13 and Leck 2010). Urbanization alters local environments via a series of phenomena (e.g., heat islands, hydrologic) 14 that can be exacerbated with climate change. Extensive research has been done recently which attempts to connect 15 recent climate shifts and weather variable changes (mostly during the 20th century) and rates of urbanization with 16 linkages to on-going and future climate change (Manton 2010). For example, urban heat island intensity has been 17 found to be associated with the intensity of urbanization (Chen et al. 2011; Iqbal et al. 2011; Fujibe XXXX; Rim 18 2009; Santos et al. 2009; Tayanc et al. 2009; Sajjad et al. 2009; Jung 2008; He et al. 2007; Stone 2007). 19 20 21 8.2.2.2. Spatial 22 23 The pattern of urban spatial development is a critical component of understanding the interactions between 24 urbanization and climate risk and vulnerability. While urban form can vary widely in different regional and 25 development settings, urban areas include a range of conditions from concentrated to disperse. Most urban areas 26 include core, suburban, and exurban components. In general, recent patterns of urbanization continue a long term 27 trend of de-centralization and with many large cities developing into extended metropolitan regions which include a 28 diversity of settlement density conditions (Leichenko and Solecki 2005). The expansion of cities both with respect to 29 total population and density has fostered the development of extensive networks of critical infrastructure and market 30 connectivity which are vulnerable to climate change (e.g., Crona et al. 2009). 31 32 33 8.2.2.3. Temporal 34 35 The rate of urbanization (which includes the level of population growth, urban spatial expansion, and redevelopment 36 of existing urbanized areas) in any individual city or region is critical to understanding the connection to climate risk 37 and vulnerability. Urbanization is associated with changing dimensions of migration and materials flows both into 38 and out of cities and within them. The level of increase and some case decrease of these conditions create a dynamic 39 quality in cities. Rapidly changing cities have the challenge of managing this growth via housing and infrastructure 40 development while also attempting to simultaneously understand the relative impact of climate change. The 41 conflation of local environmental change resulting from urbanization with climate change shifts make the 42 identification and implementation of effective adaptation strategies more difficult. For example, urban water 43 shortages in many developing country cities are already a chronic condition, and typically worsen as the population 44 continues to grow. Overlaying climate change, related water supply deficiencies over this existing instability creates 45 the conditions for greater management and governance crises. 46 47 48 8.2.2.4. Sustainability and Ecological Habitat 49 50 Contemporary urbanization is directly connected to the question of sustainability, and to the ecological underpinning 51 of urban life. As cities grow and change, the demand for resources expands and transforms increasing the cities’ 52 ecological footprint and long distance resource linkages (e.g., teleconnections). In many cases, city-resource supply 53 connections have become more distant and fragile (e.g., Darrel and Larsen 2006). Cities can have specific 54
ZERO-ORDER DRAFT IPCC WGII AR5 Chapter 8
Do Not Cite, Quote, or Distribute 12 25 July 2011
environmental and ecological thresholds in their development trajectories. Cities, particularly those within 1 developing country contexts, have local ecological carrying capacities. Climate change impacts can accelerate the 2 approach to the carrying capacity. For example, climate change will reduce or make available local water supplies 3 more at risk to shortage because of shifts in precipitation and/or evaporation at the same time of increased water 4 demands. 5 6 7 8.2.2.5. Regional Patterns 8 9 The impact of climate change will be experienced by the wide diversity of cities throughout the various regions of 10 the globe. The level of climate change impact and associated risk and vulnerability is in part associated with the 11 extent and character of urbanization in each of these regional settings. This is the result of similar urban 12 development patterns within each region. Region-specific case studies have been conducted recently which reveal 13 trends and conditions within each. Some common threads to the conditions of urbanization and types of impacts that 14 are highlighted in the recent literature across the different regions are noted below. 15 16 [INSERT TABLE 8-2 HERE 17 Table 8-2: Title? To be completed….] 18 19 Risk distribution in urban areas at the global level will be determined by economic status of the country, percentage 20 of the national populations living in urban areas, the size city, and urban governance. Economic status of the country 21 may partly contribute to the distribution of the risks among the global cities as it is expected that urban areas in 22 developed countries compared to urban areas in less developed countries have more resources for climate change 23 mitigation and adaptation. Hence less risk for climate change impacts. Global regions like Latin America, which has 24 a high urban population in urban areas compared to Africa are likely to have higher numbers of its population being 25 exposed to the impacts of climate change, although the improvements in this region in urban governance and 26 capacity may also mean greater adaptive capacity for many urban centres. Due to the inherent characteristics of the 27 urban centers in low and middle income countries, the exposure to climatic extreme events will be higher in 28 countries that have mega cities like China and India compared to countries that have small cities. 29 30 Revi (2007); Sharma and Tomar (2010); Adelekan, (2010); Sherbinin et. al., (2007); and Hardoy and Pandiella 31 (2009) all point out that a large percentage of the population in African, Asian and Latin American urban areas are 32 poor and live in informal settlements, many located in unsafe areas. UN Habitat estimates that around 900 million 33 urban dwellers live in informal settlements or other settlements classified as ‘slums’ (UN 2003, others). Many urban 34 centres in India have 25 to 50 percent of the population live in “slums” while in Latin American cities about 50 35 percent of the urban dwellers are classified as poor and in Rio de Janeiro alone about 1.1 million people live in 36 favelas. In Africa using the 2006 UN-HABITAT data, it is estimated, that about 72 percent of African urban 37 dwellers live in unplanned settlements (Wisner and Pelling 2008). Service provision in terms of water supply, waste 38 water disposal, and solid waste management is inadequate in most urban areas of low and middle income countries 39 (Kovats and Akhtar 2008; Sharma and Tomar 2010; Lwasa 2010). The situation in terms of service provision is 40 much worse in the unplanned settlements and a large proportion of urban communities in low and middle income 41 economies work in the informal sector. 42 43 Based on the studies from African, Asian and Latin American cities, though the distribution of risks due to climate 44 change impacts is likely to vary in an urban settlement and among the national and global urban areas, the most at 45 risk in all cases are vulnerable communities. However, it should be pointed out that the most vulnerable in the poor 46 communities are the women, children, health compromised, and the old people due to the fact that either they have 47 less mobile (e.g., women with child care responsibilities), less resources or are physically weak. One key primary 48 factor contributing to vulnerability is lack of capital assets available to prepare for and cope with disasters (Moser 49 and Satterthwaite 2008). Other key factors which result from this deficiency or occur simultaneously is lack of 50 infrastructure and services. The vulnerable communities in urban areas are likely to be living and working in 51 unplanned settlements, or in settlements located in hazardous areas, including steep slopes and low lands adjacent to 52 unprotected river banks or ocean shorelines, or areas that have poor public services such as drainage, sanitary, solid 53
ZERO-ORDER DRAFT IPCC WGII AR5 Chapter 8
Do Not Cite, Quote, or Distribute 13 25 July 2011
waste and transportation systems or in areas where structures are built on unconsolidated soil materials, or areas 1 where building codes are not enforced. 2 3 4 8.2.3. Direct Climate Impacts 5 6 8.2.3.1. Introduction 7 8 The objective of this section is to assess the observed and forecasted direct impacts that climate change will have on 9 city residents, infrastructure, and systems. Particular focus will be on climate risk-related impacts that might place 10 increased stress, burden or instability on the operation of critical resource supply activities and the presence of 11 resource constraints in cities. Two critical aspects of the urban sector discussed in this context include the types of 12 hazards they are vulnerable to and the associated costs. The section examines both the temporal and spatial scale of 13 the shifts in climate risk across cities and urbanizing sites in the next several decades and beyond. The focus is on 14 how the scale and character of risks may change and grow in cities with respect to shifts in climate extremes, means 15 and long-term trends (e.g., sea-level rise). 16 17 Direct impacts, following the UN-ECLAC methodology, include all costs and losses attributed to the impact of 18 hazard events, but exclude systemic impacts for example on urban economies through price fluctuations following 19 disaster or the impact of disaster losses on production chains. Costs impacting the health, livelihoods and wellbeing 20 (most importantly psychological wellbeing) will be assessed as well where appropriate. 21 22 Climate impacts will have profound impacts on a broad spectrum of city functions, infrastructure, and services 23 (Rosenzweig et al. 2011; UN Habitat 2011). Climate change will connect with ongoing underlying stresses in cities 24 (e.g., poverty, rapid population growth) (Mehrotra et al. 2011). Interaction between ongoing environmental stresses 25 in urbanizing areas and climate change impacts lead to a wide range of synergies, acceleration of crises, challenges 26 and opportunities for adaptation. These connections are complex and present a set of uncertainties with respect to 27 individual and multi-hazards. The origin of these hazards can occur both in situ and as well as through long-distance 28 connections between cities and other, often rural locations, such as sites of resource production and extraction. 29 30 Similarly, it is understand that urban infrastructure also will be impacted by systematic or cascading risks (e.g. Hunt 31 and Watkiss 2011). Climate stresses and particularly extreme events will have effects across interconnected urban 32 systems – both within specific sectors and across multiple sectors. This condition can be especially prevalent in 33 water and sanitation, energy, and transportation sectors. This process results from the often tightly coupled character 34 of urban infrastructure systems (see Rosenzweig and Solecki 2010 for a discussion of New York infrastructure). 35 These cascades of impact can have both direct economic as well as indirect economic impacts (e.g. Hallegatte et al. 36 2011; Ranger et al. 2011). The impacts also can extend from built environment sectors to other types of impacts 37 particularly on urban public health. 38 39 A critical element of climate impacts is that they will affect many infrastructure investments that have long 40 operational lives - in some cases up to 100 years or more. It is important to recognize that there are regional (e.g., 41 Africa, North America, Europe) and income level distinctions (e.g., least developed, low, lower-middle, upper-42 middle and high income nations) with respect to how urban systems will be impacted by climate change. 43 44 45 8.2.3.2. Water and Sanitation 46 47 Climate change will have dramatic impacts on local and regional water supply and sanitation systems for cities (e.g., 48 Capetown – Ziervogel et al. 2010). The impacts will be significant with respect the availability and quality of the 49 resource. Emerging water shortages have increasingly forced cities to enhance their supplies by extending their 50 water withdrawal demands from more remote rural places (e.g., Mumbai, Delhi, Mexico City), and huge engineering 51 solutions (e.g., Andean cities and Mexico City). 52 53
ZERO-ORDER DRAFT IPCC WGII AR5 Chapter 8
Do Not Cite, Quote, or Distribute 14 25 July 2011
Climate will exacerbate existing and expected increases in urban water resource tensions and conflicts that are 1 present in the varying water sectors: residential, commercial, industrial, agricultural, and infrastructural. Water and 2 climate change will impact residential water demand and supply and its management. Large-scale critical 3 infrastructure also will be impacted. For example, warming has forced the closure of nuclear power stations in the 4 UK as river water was too warm to provide adequate water (REF). 5 6 Wastewater and sanitation systems during extreme precipitation events can be overburdened due to the limited 7 capacity of drainage systems in old cities and in unplanned settlements or where drains are not maintained (Howard 8 et al. 2010; Wong and Brown 2009). Solutions include waste collection businesses, cleaning of drains, and 9 construction of the bigger systems. In New York City, city maintenance crews as part of improved storm water 10 management clean drains when intense precipitation is predicted. 11 12 13 8.2.3.3. Energy 14 15 Climate change will alter the patterns of energy consumption in cities, particularly with respect to electricity demand 16 and/or energy needed for cooling or heating. In settings with extensive air conditioning use, climate change will 17 bring increases in air conditioning demand and in turn heightened electricity demand. Warmer temperatures and 18 more and more intense heat waves also makes likely the rapid increase in the use of air conditioning in cities where 19 extensive air conditioning use is not now present particularly among populations that can afford it ( e.g. much of 20 Europe). 21 22 Conversely, in temperate and more northern regions winter temperatures increases will bring decreases in energy 23 demand for heating. In most cases within individual cities, potential increases in summertime energy demand from 24 climate change will exceed reductions in winter energy demand reductions. 25 26 Another globally widespread energy-related impact and vulnerability from climate change is the disruption of 27 energy systems during peak demands which exceed capacity or extreme weather events. Electricity energy demand 28 will spike during summer time heat waves in areas with extensive use of air conditioning resulting in brownouts or 29 blackouts. Furthermore, the projected increased projected frequency of snow storms or ice storms during the next 30 decades in the northeast U.S. for example will disrupt the electricity distribution systems because of the collapse of 31 powerlines and other infrastructure. The role of distributed urban energy production as it related to adaptation and 32 mitigation also need to will be assessed. 33 34 35 8.2.3.4. Transportation and Telecommunications 36 37 Transportation (impacts on capital stock - extreme events, wear and tear, bridges, specialist equipment, roads, 38 railways; evacuation). Assessing the disruption of transport networks inside and outside the city is critical. 39 Disruptions outside cites can impact the urban economy (e.g., Mombasa urban region and Mozambique floods). 40 Telecommunications (phone networks: crashing post-disaster or working better than land-lines). 41 42 43 8.2.3.5. Built Environment, and Recreation and Heritage Sites 44 45 The built environment – buildings and other structures including heritage sites – will be impacted by climate change. 46 Structures include residential, commercial, and industrial sites. Recreational sites such as parks, playground and 47 playground will be affected as well. Climate warming, increased climate variability, precipitation shifts, and 48 increased humidity will accelerate the deterioration and weathering of many stone and metal structures in cities 49 (Stewart et al. 2011; Bonazza et al. 2009; Smith et al. 2008; Thornbush and Viles 2007; Carlota et al. 2007). 50 51 52
53
ZERO-ORDER DRAFT IPCC WGII AR5 Chapter 8
Do Not Cite, Quote, or Distribute 15 25 July 2011
8.2.3.6. Ecosystem Services and Green Infrastructure 1 2 A wide variety of ecosystem services and green infrastructure will be impacted by climate change. Climate change 3 will alter ecosystem functions such as temperature and precipitation regimes, evaporation, humidity, soil moisture 4 levels, vegetation growth rates (and allergen levels), water tables and aquifer levels, and air quality. These can 5 influence the effectiveness of pervious surfaces used in storm water management, green/white/blue roofs, coastal 6 marshes such as flood protection, food and urban agriculture and overall biomass production, shifts in disease 7 vectors (e.g., seasonality and intensity of mosquitoes), and decline in air quality because of increase in secondary air 8 pollutants. 9 10 11 8.2.3.7. Social and Public Services 12 13 The effects of climate change also will be evident within a diverse set of climate change impacts on urban social and 14 public services. These include services such as health and social care provision, education, and police and 15 emergency services. 16 17 18 8.2.4. Urbanization Impacts 19 20 8.2.4.1. Introduction 21 22 The objective of this section is to assess how aspects of climate change risks impact the process of urbanization. 23 Climate change because it represents increased uncertainty of the future, probability of extreme events, and 24 environmental dynamism overall is affecting how cities are managed, developed, and even conceived at a time when 25 many cities continue to face a set of other significant stressors such as rapid population growth, increased pollution, 26 resource demands, and concentrated poverty. 27 28 This section assesses several metrics of this shift in the process of urbanization as driven by the qualities of climate 29 impacts, and does not in of itself represent a review of formal integrated climate risk planning and management. But 30 rather, this section attempts to illustrate how climate change knowledge, perception, and understanding increasingly 31 held by city stakeholders and residents affects their decision making frames vis-a-vis conception of their city as an 32 engine for economic growth, as a mechanism for political aspirations, and as a vehicle for meeting livelihoods and 33 basic needs. 34 35 36 8.2.4.2. Uncertainty and Surprise 37 38 Climate change creates increased dynamism in environmental conditions in cities. As a result past environmental 39 responses and baselines have become less a valuable predictor of future urban environments. Adaptation planning at 40 urban levels will need to take into account uncertainty about future climates and extremes and consider direct and 41 indirect economic costs, notably the trade-off of inaction and thus locking in to ill-adapted infrastructure versus 42 investment in adaptation when change in climate is less than anticipated (Hallegatte et al. 2007). There are several 43 decision-making settings in cities that are influenced by shifts in the likelihood of extreme weather events and 44 responding to climate-related surprises. Urban decision-making venues which have been most impacted include 45 water resource managers (e.g., Fane and Turner 2010), insurance companies, emergency health responders, disaster 46 preparedness planners, and urban infrastructure engineering offices. 47 48 49 8.2.4.3. Extreme Event Probability 50 51 The objective of this section is to assess how shifts in extreme event probability have impacted how cities are 52 understood by stakeholders and decision-makers, and how in turn these understandings are integrated into local 53 decision-making. In many major cities such as London and New York, the prospect of increased climate variability 54
ZERO-ORDER DRAFT IPCC WGII AR5 Chapter 8
Do Not Cite, Quote, or Distribute 16 25 July 2011
has spurred an integration of climate resiliency efforts into extreme event planning. Actions include increased 1 stormwater management during intense precipitation events to forestall or prevent inland and street-level flooding 2 (Rosenzweig and Solecki 2010). 3 4 5 8.2.4.4. Transitions 6 7 Climate change has encouraged stakeholders and decision-makers to revaluate the environment of their cities as 8 dynamic and increasingly variable. This situation also is associated with an understanding of the urban systems and 9 functions that are more and more under stress and potentially being pushed toward a state of transition – i.e., what 10 was done in the past will not work in the future. 11 12 Transitions in the context of climate change emerge in two contexts: 1) a systems level perspective where urban 13 systems could reach a tipping point in which a failure or collapse could occur; and 2) a broader scale societal 14 transition to enhanced resilience and adaptive capacity in the face of accelerated climate change (Ernstson et al. 15 2010; Tompkins et al. 2010; Gusdorf et al. 2008). The first context can occur often without resulting in a broader 16 scale transition; while, a broader scale transition almost invariably must result from a series of smaller and more 17 discrete system failures. 18 19 In recent years, several urban environmental transition models (e.g.,McGranahan and Marcotullio 2007) have been 20 introduced to show transitions between environmental degradation and health hazards as cities and neighbourhoods 21 develop. Within these models, key variables have been identified that make cities vulnerable to climate change (e.g., 22 concentrated urban form and extensive infrastructure networks). Several elements of transitions have addressed 23 these concerns within the context of established sustainability approaches (e.g., compact cities, eco-regions, 24 polycentric new-town planning systems, rural development as a strategy for moderating urbanization). 25 26 27 8.2.4.5. Social Dynamics and Economic Tensions 28 29 Climate change impacts can exacerbate existing social dynamics and economic tensions in cities – frequently 30 accelerating the pace and condition of societal conflict. Climate change makes the management of social impacts 31 more complex because it enhances income disparities and poverty conditions, and deepens existing social 32 differentials - e.g., impacts on income, assets, health, need to migrate. 33 34 Climate change creates implications for equity from different management solutions. For example, the privatization 35 of urban water supply and sanitation systems will advantage specific groups over others. Conversely, community-36 based solutions that also build social capital can be a component in generating generic urban resilience. 37 38 Specific tensions emerging from climate change impacts have been derived from studies connecting climate impacts 39 with the disaster recovery literature (Solecki et al. 2011). These tensions include 1) temporary or permanent poverty; 40 2) food security; and 3) shifts in the informal economy. Shifts in social dynamics include the possibility and 41 aspiration that reconstruction and recovery can improve people’s livelihoods, changing structure of the urban 42 economy through the disaster cycle; changes in city administration; private and public property ownership; lifestyle 43 (Coombes and Jones 2010) and in more dramatic cases change in the urban center’s economic base. 44 45 46 8.2.4.6. Historical Analogs 47 48 The experience of cities in coping with environmental/resource crises in the past can provide a useful analog to 49 understand the impact of climate change and the prospects for meaningful shifts in urbanization (Ranger et al. 2011; 50 Hallegate et al 2007; Gibbons et al. 2006). In the past, many cities have been able to respond to localized risks and 51 vulnerabilities such as resource shortages and environmental quality issues by externalizing the problems either 52 through expansion of the resource catchment or by casting the environmental quality threats (e.g., sewerage, 53
ZERO-ORDER DRAFT IPCC WGII AR5 Chapter 8
Do Not Cite, Quote, or Distribute 17 25 July 2011
rubbish) to more remote and distant locations. What is more complex in the case of climate change, the source of the 1 risk and vulnerability is external to individual cities. 2 3 Urban development and urbanization has been dramatically impacted by past changes associated with large scale 4 exogenous factors which have either been pervasive (e.g., globalization) and/or profound (e.g. wartime devastation, 5 civil war (Hewitt XXXX), and natural hazards such as earthquakes, hurricanes, as well as the application of new 6 technologies (e.g., automobile, electricity). For these cases, it is evident that well-governed cities demonstrate a 7 capacity to adapt and to learn from difficulties (and crises). Identity is particularly important in this context because 8 the physical fabric can be rebuilt but in so-doing the identity of a city may be changed – for good and bad. 9 10 11 8.2.5. Changes in Risk and Vulnerability 12 13 8.2.5.1. Introduction 14 15 This section focuses on how climate change impacts influence the distribution of risk within urban centres and 16 across urban populations globally. It includes changes in those exposed and in turn the relative vulnerability across a 17 set of key urban climate risks. Climate change is likely to lead increased occurrences of extreme weather events such 18 as heavy rainfall, warm spells and heat events, drought, intense storm surges and sea-level rise (see Hunt and 19 Watkiss 2011; Romero-Lankao and Dodman 2011; Rosenzweig and Solecki 2011 for recent reviews). 20 21 This section’s explicit focus is on how the scale and nature of risk and vulnerability from climate change is 22 influenced by both the modulated process of urbanization and by socio-economic context specific conditions 23 including income-levels, asset bases, age, sex and gender. A key component is a discussion of which are the most 24 vulnerable populations and of populations most at risk, and the overall impact of climate change on urban 25 livelihoods, economic opportunity, and public health (e.g., Few and Pham 2010; Palutikof 2010). An assessment of 26 the discrimination in individual-household and community/urban centres ability to adapt (e.g., by ethnic group, 27 migrant status) is included as well. A critical component of the changes in risk and vulnerability are how they are 28 manifest socially (e.g., equity and justice issues), geographically (e.g., high density locations, suburban, exurban 29 locations) and temporally (e.g., short, medium, and long term shifts). The distribution of risk within an urban area 30 will vary due to a number of factors including first, physical features of the different parts of an urban area, 31 especially topography and geological conditions. 32 33 34 8.2.5.2. Inland Flooding 35 36 Heavy rainfall and storms surges would impact the urban areas through flooding which in turn could lead to the 37 destruction of properties and public infrastructure, contamination of water sources, water logging, loss of business 38 and livelihood options and increase in water borne diseases as noted in wide range of studies - Revi (2007); Dossou 39 and Gl’ehouenou-Dossou (2007); Kovats and Akhtar (2008); Sharma and Tomar (2010); Adelekkan (2010); Hardoy 40 and Pandiella (2009); Sherbinin et. al., (2007); Douglas et. al,(2008); Roberts (2008); Nie et al. 2009). Extensive 41 studies have attempted to better model the frequency and condition of extreme precipitation events and associated 42 flooding (e.g., Detlef et al. 2011; Ranger et al. 2011; Onof and Arnbjerg-Nielsen 2009; Nelson et al. 2009; Olsson et 43 al. 2009; Sen 2009). 44 45 Lowland areas in Dhaka, Lagos, Mombasa or Mumbai cities are likely to be more prone to flooding than areas of 46 higher elevation in same cities (Adelekan 2010, Awuor et al. 2007, Revi 2005). Dhaka is a particularly important 47 example because in that case most of the hazard is from river flooding where many other example cities include sites 48 that have both a riverine and coastal storm surge component to the flooding. Similarly the steep slopes of many 49 Latin American cities are likely to be more to prone to landslides. Houses and structures built on in-filled soils in the 50 lowlands of Lagos, Mumbai and Shanghai are more exposed to risks of flood hazards than similar structures built on 51 consolidated materials. 52 53 54
ZERO-ORDER DRAFT IPCC WGII AR5 Chapter 8
Do Not Cite, Quote, or Distribute 18 25 July 2011
8.2.5.3. Coastal Flooding, Sea-Level Rise, and Storm Surge 1 2 Sea-level rise represent one of the primary if not primary shift in vulnerability that results from climate change given 3 the accelerating urban growth of cities in coastal locations. Coastal sea level rise and associated coastal and 4 riverbank erosion, flooding with storm surge could lead to widespread vulnerability of populations, property and 5 coastal vegetation and ecosystems, and threats to commerce, business, and livelihoods (Hanson et al. 2011; 6 Carbognin et al. 2010; Pavri et al. 2010; El Banna and Frihy 2009; Zanchetting 2007). Urban areas located in coastal 7 areas throughout the world such as Lagos, Cape Town, Miami, Shanghai or Mombasa will in addition to other risks, 8 face risks related to sea-level rise, which will not be the case for urban areas that are located in the hinterland of 9 these countries (See discussion of this for Cotonou in Dossou and Glehouenou-Dossou 2007) 10 11 Hanson et al. 2011 estimate the change in exposure of large global port cities to coastal flooding in the 2070s 12 compared to today with plausible scenarios of socio-economic growth, sea level rise, storm surge and subsidence; 13 they find that population could more than triple while asset exposure is expected to increase more than ten-fold in 14 this period with a 0.5 metre rise in sea-level – a change which is driven simultaneously by climate change and socio-15 economic growth to flood prone coastal areas. The study identifies the “top-20” cities for both population and asset 16 exposure to coastal flooding. 17 18 With respect to population, some cities in both current and future 2070s rankings are spread across developed and 19 developing countries, concentrating in Asian deltaic cities, to include Mumbai, Guangzhou, Shanghai, Miami, Ho 20 Chi Minh City, Kolkata, New York, Osaka-Kobe, Alexandria, Tokyo, Tianjin, Bangkok, Dhaka and Hai Phong. 21 Using asset exposure as the metric, a different ranking is obtained with greater dominance of the developed 22 countries (e.g. Miami, New York City, Tokyo and New Orleans as well as China (e.g. Guangzhou, Shanghai, 23 Tianjin). This type of analysis underscores the urgent need for urban risk reduction measures. 24 25 26 8.2.5.4. Urban Heat and Cold 27 28 Heat waves and warm spells could exacerbate urban heat island effects, including increased air pollution, heat 29 related health problems, increased salinity of shallow aquifers in drylands due increased evapo-transpiration and 30 spread to new areas of some diseases including malaria. Conversely, widespread reduction in cold waves will induce 31 shifts in heating demands. Occasional more intense cold waves resulting from increased climate variation could also 32 have intense localized impacts. Increased warming is predicted in a wide variety of cities including sub-tropical, 33 semi-arid, and temperate sites (e.g., Thorsson et. al. 2011). 34 35 36 8.2.5.5. Drought and Water Scarcity 37 38 Drought will lead to food insecurity, increase in fuelwood prices, water shortages, increased rural urban migration, 39 electricity power shortages for urban areas that depend mostly on hydropower, increased food prices and an increase 40 in water related diseases (e.g., Farley et al. 2011; Herrfahrdt-Pahle 2010; Vairavamoorthy et al. 2008) 41 42 43 8.2.5.6. Air Pollution and Public Health 44 45 Climate change will exacerbate existing air pollution related public health issues in cities via a variety of 46 mechanisms. Most significantly, increased temperatures will raise the potential for secondary air pollutant 47 production (e.g. ozone) which in turn results in more frequent acute and chronic respiratory exposure among urban 48 residents. 49 50 51
52
ZERO-ORDER DRAFT IPCC WGII AR5 Chapter 8
Do Not Cite, Quote, or Distribute 19 25 July 2011
8.2.5.7. Geohydrological Hazards 1 2 The exposure to climate related hazards will vary due to differences in the geomorphologic characteristics of the 3 city. Climate change will increase the risk and vulnerability of urban populations to a range of geohydrological 4 hazards including groundwater and aquifer quality reduction (e.g., Praskievicz and Chang 2009; Taylor and Stefan 5 2009) and subsidence and increased salinity intrusion. As an example, urban areas located in lowlands will have a 6 high risk to flooding while urban centers located in hilly areas will be exposed to landslides. The number of people 7 exposed to a hazards or hazards will partly be determined by the size of the city. The number of people will be 8 greater in a megacity compared to a small urban settlement, especially in low and medium income countries. 9 10 11 8.2.6. Urban Governance 12 13 8.2.6.1. Introduction 14 15 The objective of this section is to assess what roles and responsibilities have fallen to city and municipal 16 governments in regard to changing risks and vulnerability, and how urban governance (government and civil society 17 and their interactions) has responded to climate change. A crucial issue is where and whether there is capacity to 18 address the direct and indirect impacts of climate change. Significant limitations and lack of capacities to address 19 climate change risks are present in much of the world’s urban centres – including a proportion within failed or 20 fragile states where there is almost no capacity. In many cases there is the large disjuncture between the magnitude 21 of the problem and the resources available. Several specific factors compromise governance response capacity of 22 cities to climate change. These include human and capital resources, understanding of local environmental change, 23 and limited institutional capacity to develop, initiate and implement public policy. 24 25 The section draws on specific country or city case studies to make clear the multiple roles of urban governments for 26 which there is no credible substitute. In many cases, urban areas that have sound urban governance have lower risks 27 compared with urban areas that are economically weak and have poor urban governance. In settings where enhanced 28 capacity exists, governance focus is on response strategies and decision-support tools. 29 30 Overall, it is clear that literature on multi-level governance shows how adaptive capacity in cities depends on 31 coherent policies, support from higher levels of government, and capacities of city governments to work at 32 neighbourhood levels. Where urban management and governance has proved effective in building resilience – 33 including building this for impacts that are uncertain – and their limits is a critical issue discussed in section 3 34 below. 35 36 37 8.2.6.2. Institutional Environment 38 39 City governments increasingly are seen as active agents in the management of increased climate risk and 40 vulnerability (Howe et al. 2010; Rosenzweig et al. 2010; Wolf et al. 2010). City managers and stakeholders have 41 grouped themselves together in national, regional, and international networks such as C40, Mayor’s Summit (Roman 42 2010). ICLEI Individual cities such as Chicago, Seattle (Kings County), New York, London, and Melbourne 43 (Donald and Seeger 2010) have become widely recognized as global leaders. This activity has significantly 44 enhanced the institutional environment for robust climate change adaptation and mitigation. 45 46 Cities also maintain limitations with respect to their ability to limit risk and vulnerability. Studies in African, Asian 47 and Latin American cities have shown that the risks due to climate change impacts are likely to be higher in squatter 48 areas, which have poor public services compared to planned areas with good public services. Spatial distribution of 49 communities within the urban areas is partly based on income levels, which gives rise to poor and rich 50 neighborhoods. The rich neighborhoods are likely to face fewer risks compared to areas where the poor people live. 51 Urban areas that have high population density are likely to have higher risks compared to low population density 52 areas. 53 54
ZERO-ORDER DRAFT IPCC WGII AR5 Chapter 8
Do Not Cite, Quote, or Distribute 20 25 July 2011
1 8.2.6.3. Governance and Civil Society 2 3 In many urban settings, civil society including non-governmental organizations plays a significant role particularly 4 in those areas of informal settlement where no or limited formal infrastructures and services are provided for urban 5 environmental management. The role of civil society particularly as a means for participatory community risk, local 6 expert knowledge, and local capacity building are areas of significant contribution (e.g., Krishnamurthy et al. 2011; 7 Fazey et al. 2010; Shaw et al. 2009; Tompkins et al. 2008; Van Aalst et al. 2008). 8 9 10 8.2.6.4. Science-Policy Linkages 11 12 The evolving understanding of climate risks and vulnerability demand a continuous re-assessment of the scientific 13 knowledge of local climate conditions and how this information can be translated into local decision-making. 14 Understanding the structure and dynamic quality of science-policy linkages are critical to the governance and 15 management of climate risk (Rosenzweig and Solecki 2010). 16 17 18 8.2.6.5. Decision-Support Tools 19 20 A variety of climate risk and vulnerability decision-support tools have been developed in recent years. These tools 21 are designed around a variety of methods and objectives. A central element of tools that organize and rank 22 information is to identify relative and absolute differences in risk and vulnerability and resilience capacity (e.g., 23 Manuel-Navarrete et al. 2011; Hahna et al. 2009; Posey 2009; Milman and Short 2008). Another theme of decision-24 support tools is to make the climate scenarios and modelling results more useful for local decision-making (e.g., 25 Hallegatte et al. 2011; Van Vuuren 2007). 26 27 28 8.2.6.6. Development as Risk and Vulnerability Reduction 29 30 An emerging central component of urban governance and climate risk and vulnerability management is its direct 31 connection to urban development strategies. Urban development initiatives are seen as a way of simultaneously 32 promoting climate resilience, adaptive capacity, and community empowerment (e.g., Burch 2010; Johnson and 33 Krishnamurthy 2010; Ebert et al. 2009; Gujja et al. 2009; Yu 2009). A significant focus has been on how to make 34 these linkages with respect to urban water supply development projects. 35 36 37 8.2.6.7. Private Sector 38 39 The private sector increasingly serves as an important consideration within the governance decision-making process. 40 The insurance industry is particularly important for risk management in flood prone areas (Rosenzweig and Solecki 41 2010). In other contexts, the private sector can play a relatively prominent role when the local governments and/or 42 civil society component of the governance structure are limited (Eakin et al. 2010; Chu and Schroeder 2010). 43 44 45 8.3. Adapting Urban Areas 46 47 8.3.1. Introduction 48 49 This section draws from a growing literature that discusses how and what urban centres can and should be do to 50 address climate change adaptation – often based on local risk and vulnerability assessments. But there is less 51 evidence from the literature of government decisions to act and to include climate change adaptation in the plans and 52 investment programmes of city and municipal governments. One of the constraints on this that is often noted is the 53 uncertainty as to what climate change will bring (and when) in each locality. For most urban centres in low- and 54
ZERO-ORDER DRAFT IPCC WGII AR5 Chapter 8
Do Not Cite, Quote, or Distribute 21 25 July 2011
middle-income nations and many in high-income nations, it is also constrained by city government priorities 1 focusing on economic growth in ways that as yet do not recognize the importance of incorporating adaptation 2 measures (and often also of addressing mitigation). Local decision-makers frequently view climate change as a 3 marginal issue, with adaptation usually ranked even lower than mitigation in urban policy agendas (Bulkeley 2010, 4 Simon 2010). 5 6 Perhaps the main exception to this is the documentation on cities where local or regional governments have engaged 7 in disaster risk reduction to extreme weather (United Nations 2009, 2011. IFRC 2010, Hardoy, Pandiella and 8 Velasquez 2011, others). Little of this was done with climate change adaptation in mind but this has often built an 9 information base and a network of institutions and invested in risk reduction measures that contribute to resilience 10 and adaptive capacity to some climate change risks. One limitation is that disaster risk reduction in cities is usually 11 based on precise and detailed analyses of the impact of past extreme weather events (or other catalysts for disasters) 12 and for this to serve climate change adaptation, this has to include a consideration as to how these will or may 13 change in the future. 14 15 Although there are examples of city governments giving some consideration to climate change adaptation, 16 these still represent a small proportion of all cities and small urban centres. In addition, there are often 17 institutional constraints to acting on the findings of assessments of climate change related risks and 18 vulnerabilities (Roberts 2010, Hunt & Watkiss 2011, Corfee-Morlot et al 2011). 19 20 Limited data to support adaptation. The inadequacies in climate data available at the city scale may constrain city 21 governments and enterprises from taking action. Climate data are limited in many cities, rarely downscaled to urban 22 areas, or often fragmented across local departments (Hardoy and Pandiella 2009). Jakarta’s urban planning agencies 23 already have geographic information system (GIS) data, yet they are not connected with other social or economic 24 statistics nor are there sufficient longitudinal climate data (Firman et al. 2011: 375-6). Detailed data on urban 25 climate or proactive adaptation strategies or quantitative assessments remain exceptional (Hunt and Watkiss 2011). 26 Many adaptation measures are adopted “only in response to specific local or regional natural disasters, which may or 27 may not be climate-related” (Bulkeley 2010: 245). To be useful to stakeholders and spark local dialogue, climate 28 data needs to be integrated geographically, across time-scales, and consider a range of regional benefits and costs of 29 climate policy (Ruth 2010). 30 31 Nevertheless, there is a growing documentation on opportunities to strengthen urban resilience to climate change 32 through including this in household, community and city development plans (section 3.2), sectoral responses 33 (Section 3.3), responsive planning and governance (Section 3.4) and managing cities’ physical expansion (Section 34 3.5). Underscoring the interrelations in urban systems, there is some discussion of synergies that can be created 35 between mitigation and adaptation policies in cities (Section 3.6). Local governments may be able to simultaneously 36 address adaptation and mitigation using the “same policy levers”, such as building standards, transportation 37 infrastructure, and other urban planning tools (Hallegate, Henriet and Corfee-Morlot 2011: 72). Finally, limits to 38 adaptation are reviewed (Section 3.7) such as questions of scale, overlapping or conflicting jurisdictions, or 39 inadequate resources. A further challenge is to develop methods to evaluate adaptation measures, though methods 40 have recently been proposed (Hedger et al. 2009, Preston, Westaway and Yuen 2011). 41 42 This section will also present details of community-based adaptation in urban centres – where it is civil society 43 groups that have taken the initiatives. This includes community-based initiatives that have sought to work with local 44 governments. These also illustrate possibilities to address adaptation-vulnerability and development together. 45 46 47 8.3.2. Development Plans and Pathways 48 49 As AR4 emphasized, many of the forces shaping greenhouse gas emissions are those underlying development 50 pathways – including the scale, nature and location of private investment and of public investment in infrastructure 51 (Wilbanks, Romero Lankao et al 2007). These also influence the scale and location of climate-related risks to urban 52 enterprises and populations and thus also what is needed for adaptation. Urbanization is largely driven by where 53 private enterprises choose to locate or concentrate. Both national and local governments generally prioritize 54
ZERO-ORDER DRAFT IPCC WGII AR5 Chapter 8
Do Not Cite, Quote, or Distribute 22 25 July 2011
economic growth over environmental protection. Even where national and regional governments do not use spatial 1 development planning (for instance specifying the locations where new investment is allowed or not allowed), they 2 directly or indirectly influence the location of private investment through many other measures – for instance in 3 which urban centres and regions are best served with infrastructure, in special incentives given to investors in 4 particular regions or settlements and in the powers, responsibilities, financial capacities and revenue-raising powers 5 permitted to local governments. At the regional and national scales,. The responsibility to encourage new 6 investments and migration flows to safe sites and away from sites at high risk from climate/weather - through a 7 combination of disaster risk management and urban planning/zoning – is often be shared between local and national 8 and provincial governments. 9 10 Government’s social policies and priorities also influence the social and spatial distribution of climate related risk 11 and vulnerability. Sánchez-Rodríguez 2009 notes that “...despite the fact that social change is a central element of 12 development, there is perhaps not enough attention to livelihoods in development studies to connect adaptation, 13 vulnerability, and development mentioned above. This can be particularly relevant to address adaptation in informal 14 settlements and incorporate individual and groups agency in bottom-up adaptation strategies in low-income and 15 medium-income countries. (page 203). 16 17 To ADD? - Need to summarize literature on NAPAs and other national level measures as they relate to urban 18 centres and their adaptation. Also on the extent to which these influence the development plans and investment 19 priorities of national and regional governments in ways that support or go against climate change adaptation (Urwin 20 and Jordan 2008; Corfee-Morlot et al. 2011). Examples of conventional, government-led routes with adaptation 21 folded into development and disaster risk reduction; strong examples of where this is happening (good examples 22 from some Latin American nations in this). Good practice for adaptation and development. Costs and benefits of 23 adaptation strategies (impacts if people are moved, additional costs), prioritization strategies, equity issues (Ranger 24 et al. 2011 – for Mumbai on the benefits of adaptation [no info on the costs]). Difficulties in getting detailed local 25 information base to support these. 26 27 28 8.3.2.1. Adaptation and Development Planning 29 30 Adaptation for urban areas is becoming an issue of concern for some national and regional governments and city 31 governments where the first steps have come from different actors, institutions and sectors. Some local programmes 32 and national and international initiatives are being designed and implemented at city level (Roberts, 2008, Solecki, 33 200XX) One of the most interesting aspects of recent contributions of adaptation to climate change in urban areas is 34 the growing attention to middle-income and low-income countries (Sánchez-Rodríguez 2009:202). Several scholars 35 (Blanco, 2007; Carolini, 2007, Martine et al. 2007, Mc Granahan et al. 2007, Satterthwaite et al. 2007, Scherbinin et 36 al. 2007, UN-Habitat, 2007; United Nations Population Fund, 2007, Agrawala and van Aalst, 2008; Ayers, 2008, 37 Bartlett, 2008, Caney, 2008, Douglas et al. 2008, , Kovatrs and Akhtar, 2008, Revi, 2008, Roberts, 2008, Stren, 38 2008, Tanner et al. 2008, , O’Demsey, 2009, Hardoy and Pandiella, 2009,Wong 2009, Navarrete et al. 2010) have 39 studied different dimensions of climate change adaptation in these low and middle-income countries. 40 41 To Sánchez-Rodríguez (2009:202) there are four significant contributions from these publications to urban 42 adaptation: first, they provide attention to urban areas in low and middle-income countries where the large majority 43 of current and future urban inhabitants in the world live; second, they consider poverty and social inequality are 44 multidimensional problems likely to be aggravated by climate change; third, they consider human agency among 45 poor inhabitants an important resource in building local responses to climate change; fourth, they highlight the 46 importance of multilevel governance in adaptation strategies. 47 48 Although few of these contributions suggest specific steps for operational strategies for climate change, they stress 49 the important relation between adaptation to climate change and development. In this regard, Manuel-Navarrete et 50 al. (2011) outline a critical approach to adaptation and explores the interplay between visions of development, 51 governance structures, and strategies to cope with hurricanes in the Mexican Caribbean, a region at the ‘front line’ 52 of both globalization and climatic extreme phenomena. Critical adaptation formulates the experiencing of hazards as 53 essentially political and tied to contingent development paths, which may eventually become hegemonic. 54
ZERO-ORDER DRAFT IPCC WGII AR5 Chapter 8
Do Not Cite, Quote, or Distribute 23 25 July 2011
1 According to Sánchez-Rodríguez (2009:201), during the last few years the debate on adaptation to climate change in 2 urban areas has shown two developments; on the one hand, there are diverse and useful disciplinary contributions 3 and experiences to build adaptation strategies, but few efforts to create multidimensional approaches guiding 4 operational strategies; and on the other, there is growing attention to integrate adaptation as part of a development 5 process addressing structural condition causing social and urban vulnerability. In this regard, the author discusses 6 the relation between adaptation and development in middle-income and low-income countries. Mexico City, 7 Cartagena and San Andrés de Tumaco, Colombia provide interesting early lesson potentially useful to other cities. 8 9 [Possible box summarizing experience from these cities] 10 11 However, many sources note how the growing concern among city and national governments on climate change 12 often focuses more on mitigation. For instance, a closer look at Mexico City climate change agenda shows that 13 mitigation mainly through the reduction GHG emissions prevails and adaptation is still a vague concept that has not 14 been incorporated into concrete actions and decisions (GDF, 2007; GDF, 2008, GDF, 2011). El Programa de Acción 15 Climática de la Ciudad de México 2008-2012 includes a brief section on adaptation and policy actions; it identifies 16 the main hazards as the basis for vulnerability analysis, adaptation `mainstreaming` into Mexico City ministries 17 taking into consideration both the civil protection system and the environment. Implementation, on the other hand, is 18 conceived as the needed modifications in water infrastructure, buildings and bio-diversity to cope with the impact 19 associated to climate change. However no clear guidelines or concrete measures are detailed in the document. In the 20 short-run, adaptation is seen as the capacity to withstand weather-related impacts such as floods and forest fire 21 through early warning systems, whereas in the long-run adaptation to climate change relies on micro-basin 22 conservation. It is worth mentioning that, so far, implementation has not been assessed. 23 24 As yet, there is little academic and policy literature on climate change adaptation for Brazilian cities (Ojima, 2009; 25 Soares de Moura, 2009). The government of the city of Sao Paulo has expressed its commitment to climate change 26 actions but as in the case of Mexico City, mitigation actions are in forefront of the agenda whereas adaptation 27 measures are broad declarations about the needed actions in different sectors like water and sanitation, green spaces 28 and urban parks, among others (INPE, UNICAMP, USP, 2010) According to Ojima (2009) it has been very difficult 29 to integrate climate change adaptation into urban policies in Brazil due to two reasons: there is no connection 30 between climate and social policies and the few existing initiatives are drawn from the international context. 31 Apparently there is no Brazilian Adaptation Programme (More references and details to come). 32 33 In Colombia there are few references concerning global warming and associated phenomena like sea level rise and 34 climate change. In the policy document entitled Preparándose para el futuro. Amenazas, riesgos, vulnerabilidad y 35 adaptación frente al cambio climático published by United Nations Office on Drugs and Crime (UNODC, 2008) a 36 brief section is devoted to the impact on settlements by climate change with no indication, specifically, on how this 37 interaction will likely be. The document contains some Colombian experiences on vulnerability assessment: water 38 and mountain ecosystems. With regards to adaptation, in this document the UNDP adaptation policy framework is 39 adopted and described with the intention of designing adaptation indicators for vulnerability assessment. 40 41 In Argentina, there are no in-depth analysis on vulnerability and adaptation for urban areas. Even though the federal 42 government is actively participating in UNCCC and other forums, and that within the Ministry of Environment and 43 Sustainable Development there is an office in charge of urban affairs, few concrete actions have been proposed to 44 foster adaptation. The office of urban affairs is too weak to influence other ministries so implementation has not 45 taken place. There has also been little funding available to advance this (Hardoy and Pandiella, 2007). For Uruguay, 46 Nagy et al. (2007) estimate trends and vulnerabilities as a result of sea level rise on the coastal areas of Rio de la 47 Plata. The authors identify some barriers for adaptation within the framework Integrated Management of Coastal 48 Zone, EcoPlata Programme. The aim of the programme is to link knowledge to action in order to promote a cultural 49 change in policy makers and public servants. This study addresses vulnerability and existing and potential impacts in 50 coastal zone of Metropolitan Montevideo and the city of La Plata. Barriers identified are: 1) no public awareness of 51 climate change, integrated coastal management, stakeholders participation and 2) gaps of information regarding 52 monitoring and economic-environment assessments. In turn adaptation measures proposed are: 1) to improve 53 monitoring systems and modelling of the sea level, winds, coastal rivers, flooding prone areas, among others; 2) to 54
ZERO-ORDER DRAFT IPCC WGII AR5 Chapter 8
Do Not Cite, Quote, or Distribute 24 25 July 2011
develop an early warning system comprising storms and SIG and risk communication to social actors and 3) 1 estimate physical, environmental, economic and human thresholds and conservation of native ecosystems. 2 3 Besides, framing adaptation within the context of development and urban planning in middle-income nations 4 implies, among other issues, looking at how knowledge of vulnerability and adaptation is produced within the two 5 different epistemic communities involved: scientists and policy makers. The origin, destination and use of 6 knowledge differ between them, so it is not unusual to find a “gap” between knowledge and practice. When it comes 7 to adaptation policy and planning these differences have to be acknowledged. In this regard, the study of city of 8 Tijuana, Baja Califonia, México (Sanchez-Rodríguez, 2011) illustrates the existence of this “knowledge gap” and 9 the participation of scientists and policy makers in seeking ways to be better prepared for negative consequences of 10 climate variability. In this vein, it is worth asking whether adaptation can be conceived as a rational management 11 practice given its cross-sectoral and cross-institutional nature, involving a broad range of stakeholders and, as 12 discussed above, their particular ways of framing vulnerability and therefore adaptation practices. 13 14 Need to balance this good level of detail from Latin America with more material from other regions 15 16 17 8.3.2.2. Mainstreaming Adaptation into Development Planning 18 19 There are now some case studies of how climate change adaption requirements are being considered by city 20 government – including whether and how these may be introduced into mainstream municipal planning systems is a 21 major avenue for achieving adaptation. This has importance, particularly in the Global South where it makes little 22 sense to introduce an additional layer of climate change planning to already complex (and often fragmented) 23 planning systems (Kithiia, 2010 pg 3; Roberts, 2008 pg 533). This approach faces significant challenges such as lack 24 of information, institutional constraints and resource limitations (Measham et al., 2010 pg 4) and the fact that in 25 “any given authority the planning agenda is usually already full” (Measham et al., 2010 pg 19). As a result it is often 26 hard to find the requisite institutional space for climate change adaptation. Not to mainstream adaptation plans, 27 however, increases the danger that climate change issues will be seen merely as “add-ons to the overall strategies 28 driven by economic and spatial concerns” (Kithiia and Dowling, 2010 pg 474). Mainstreaming also has the added 29 advantage, that given municipalities’ resource limitations the adaptation agenda can be significantly advanced by 30 ensuring that local levels funds are spent “with adaptation needs in mind” (Lowe et al., 2009 pg 6). “For example, 31 integrating climate change in urban development could help planners to rethink the traditional approach of designing 32 infrastructure based on weather patterns and changes in sea level experienced in the past and move towards a new 33 approach of forward looking risk-based design for a range of climate conditions projected in the future” (Kithiia, 34 2010, pg 3) 35 36 Often the most effective way to mainstream adaptation issues within government agencies is not to focus on climate 37 change per se, but to talk in terms of improved service delivery, economic development (and protecting economic 38 success) and resilience. Other effective mainstreaming tools include encouraging adaptation action at a sectoral 39 level, rather than adopting a more cross-sectoral approach and initiating pilot projects. A sectoral approach makes 40 the climate message easier to understand and the associated responsibilities and actions clearer and simpler to 41 identify and assign (Roberts, 2010, pg 401; UN-Habitat, 2011 pg 147) while pilot projects root the (often vague) 42 concept of adaptation in reality and allow a practical demonstration of the gains to be achieved (Roberts, 2010 pg 43 408, Tyler et al, 2010 pg 21). In this vein municipal authorities in India can perceive climate change adaptation as a 44 priority if they see co-benefits between adaptation and measures to address development and environmental health 45 concerns (Sharma, D and Sanjay Tomar, 2010) 46 47 48 8.3.2.3. Risk Reduction, Disaster Prevention, and Adaptation to Climate Change at the Policy Level 49 50 From the late 1980s, a new approach to reducing disaster risk in urban areas was developed in some Latin American 51 nations that had three important characteristics: it was based on analyses of detailed local records of disasters that 52 included ‘small’ disasters that are not recorded in international disaster databases; it recognized that most disasters 53 were caused by local failures to assess and act on risk; and it recognized the importance of local governments and 54
ZERO-ORDER DRAFT IPCC WGII AR5 Chapter 8
Do Not Cite, Quote, or Distribute 25 25 July 2011
national and local civil defence organizations working with civil society groups including community organizations 1 within the settlements or districts most at risk (United Nations 2009, IFRC 2010). This can be seen in the work of 2 the academics and practitioners that were part of La Red that was founded in 1992 (IFRC 2010). From this and from 3 some experiences in Asian cities with community-driven ‘slum’ upgrading (see Boonyabancha 2005, 2009) came a 4 recognition of the potential of community-based initiatives in disaster risk reduction, especially where these were 5 supported by local government and by civil defence or emergency response agencies (Archer and Boonyabancha 6 2011, Pelling 2011b). 7 8 This new focus on identifying measures to reduce disaster risk also brought new methods of documenting and 9 mapping informal settlements, including detailed enumerations in informal settlements that are undertaken by their 10 inhabitants, supported by local governments (Patel 2004, Karanja 2010). These provide the data needed to plan for 11 the installation or upgrading of infrastructure including that needed to reduce risks from extreme weather. From this 12 has developed the inclusion in these community-managed data gathering of documenting and mapping risks and 13 vulnerabilities to extreme weather (and other hazards) (Pelling 2011b, Carcellar et al 2011, Livengood 2012). This 14 kind of risk and vulnerability mapping also helps raise awareness among the inhabitants of informal settlements of 15 the risks they face, as well as getting their engagement in planning risk reduction and making early warning systems 16 and when needed emergency evacuation effective (Pelling 2011b). 17 18 A few studies have addressed the existing and potential synergies between civil protection, disaster prevention and 19 climate change as a way to foster adaptation within policies and programmes for middle-income nations. In Latin 20 America and particularly in Mexico, Aragón-Durand (2008) analysed civil protection and hydro-meteorological risk 21 reduction strategies within the context of climate change. He argues that in order to link climate change adaptation 22 to such risk reduction measures, two issues need consideration: 1) To recognise that risk perception and natural 23 hazards, risk and vulnerability mean different things to the two policy communities: the disaster management 24 community and the climate change community, 2) To understand that those conceptual differences imply different 25 policy values and therefore different institutional responses. (Add detail here from SREX?) The study identifies 26 existing opportunities and strengths in Mexico’s National System of Civil Protection that can allow improvements to 27 the hydrometeorological risk management to then promote climate change adaptation, in particular regarding the 28 Fund for Natural Disasters Prevention and the Fund for Natural Disasters. The study proposes concrete linkages 29 between the Program of Climate Change of Veracruz with the Civil Protection Program of Veracruz; however, a 30 more detailed analysis for the main cities exposed to climate risks is necessary in order to propose concrete 31 adaptation actions for cities. It concludes that there are already institutional and policy values (not clear what is 32 meant by policy values) in Mexico to foster climate change adaptation through hidrometeorological risk reduction. 33 The case of the State of Veracruz can serve as a framework to be applied to other States that already have Civil 34 Protection Programmes and that are currently elaborating their Climate Change Action Plans as proposed by the 35 Federal Programme on Climate Change. No other policy documents like the one referred above for Veracuz were 36 found so far for other Latin America cases. 37 38 The innovations in disaster risk reduction within urban centres in Latin America have also led to institutional 39 changes at national or regional level and new legislation or amendments to existing legislation to support disaster 40 risk reduction (Gavidia 2006, other refs). These provide precedents from which to learn how these can support local 41 action. For instance, in Colombia, a national law supports disaster risk reduction and a National System for 42 Prevention and Response to Disasters (Sistema Nacional para la Prevención y Atención de Desastres). This system 43 works on prevention and includes public and private organizations, NGOs and citizen groups at different territorial 44 levels (national, regional and local) – but the main responsibility for action lies with the municipal administrations. 45 A National Calamity Fund (Fondo Nacional de Calamidades) was set up to address the needs generated by disasters 46 and implement preventive actions (Von Hesse, Kamiche and de la Torre 2008). The National System for Disaster 47 Prevention, Mitigation and Response (SINAPRED)1 developed in Nicaragua share some of the approaches of that in 48 Colombia (IFRC 2010). This was set up in 2000 to work with local governments to strengthen disaster preparedness 49 and management by integrating disaster mitigation and risk reduction into local development processes (Von Hesse, 50 Kamiche and de la Torre 2008). Several municipalities are incorporating preventive planning especially in regard to 51 approving building licences and land use changes, and different sectors including health, education, and planning are 52 sharing disaster risk information (IFRC 2010). The system is supported by a National Disaster Fund. There are also 53
ZERO-ORDER DRAFT IPCC WGII AR5 Chapter 8
Do Not Cite, Quote, or Distribute 26 25 July 2011
international networks that help support innovation and inter-city learning – for instance and Andes network and 1 CEPREDENAC. 2 3 [INSERT FOOTNOTE 1 HERE: The Sistema Nacional para la Prevencion, Mitigacion y Atencion de Desastres was 4 initially known by the acronym SNPMAD and later changed to SINAPRED.] 5 6 However, there is a worry that local governments can be allocated responsibilities for disaster risk reduction (and 7 other key aspects of adaptation) for which they lack the capacities and resources (Von Hesse, Kamiche and de la 8 Torre 2008). There is also the issue that the duration of policies is often tied to the duration of particular party 9 political groups/administrations and as new administrations come in, programmes are abandoned and staff changed 10 (Mansilla with Brenes and Icaza 2008, Hardoy, Pandiella and Velasquez 2011). No government gets recognition for 11 the disasters its programmes prevented – so risk reduction investments are not seen as priorities and have to compete 12 for scarce resources with what are judged to be more pressing needs. In most cases, disaster risk reduction is still not 13 integrated into development plans and there is reticence to address disaster risk as a cross-cutting issue, drawing in 14 all relevant departments and divisions of local government. There are examples of where this is overcome, as in 15 Manizales where disaster risk reduction is seen as part of local development and where collective interests overcome 16 individual and party political interests (Hardoy, Pandiella and Velasquez 2011). 17 18 Other routes to adaptation include autonomous community based adaptation (with all its strengths and limits in 19 urban areas) and community based adaptation in partnership with local governments (where these complement each 20 other). A credible urban future with resilience to climate change for cities in low- and middle-income nations as well 21 as high-income nations. Building on long experience of poor with coping and autonomous adaptation. 22 23 24 8.3.2.4. Household- and Community-Based Adaptation in Urban Areas 25 26 Community-based adaptation implies that a group of people (usually residents in a particular settlement) agree to 27 work together to address some perceived vulnerability to climate change (or variability). It implies that community-28 action is needed (i.e. that government agencies are not going to take this action). The action may take the form of 29 autonomous action (i.e. done without external support) or action to engage with local governments or other groups 30 to get action. 31 32 In high-income nations, although discussions within particular cities on adaptation have usually included measures 33 to encourage community participation, ‘communities’ however defined are not considered as major providers of risk 34 reducing infrastructure and services. In low- and middle-income nations, there has been more discussion of 35 Community Based Adaptation, in part because of the incapacity of governments to provide needed risk-reducing 36 infrastructure and services, in part because of higher risks and vulnerabilities among urban populations, in part in 37 recognition that local populations have knowledge and capacities that could reduce their vulnerabilities (Dodman 38 and Mitlin 2011, Anguelovski and Carmin 2011pg 4). In part, community based adaptation is a response to the lack 39 of action on adaptation by governments and international agencies (Boyd et al 2009, Dodman and Mitlin 2011). 40 41 Within urban areas, as describe already, hundreds of millions of people live and work in settlements that are or are 42 considered ‘illegal’ by local governments and this may inhibit or prevent government provision of risk-reducing 43 infrastructure and public services. It also often means that not only do a high proportion live in settlements lacking 44 infrastructure but they also live on sites at high risk from extreme weather because they would not be permitted to 45 settle on less dangerous, more valuable sites (Hardoy et al 2001). 46 47 In these informal settlements, both individual/households actions (for instance building, improving or extending 48 homes) and ‘community-based development’ (where groups of individuals and households undertake measures 49 together) have long been important for improving conditions and reducing risks from extreme weather. The 50 unwillingness or incapacity of city and municipal governments to provide the infrastructure and services that can 51 reduce vulnerability to climate change implies a need to support individual/household action and community-based 52 action for adaptation. One reason why certain international agencies have supported CBA is because of the 53 incapacity or unwillingness of local governments to act. 54
ZERO-ORDER DRAFT IPCC WGII AR5 Chapter 8
Do Not Cite, Quote, or Distribute 27 25 July 2011
1 For community-based adaptation, this can take the form of autonomous action (as residents within a particular 2 settlement work together to install or repair infrastructure or provide services) or action that seeks to engage local 3 government and where possible work with it. There are many precedents for this from development – including 4 ‘slum’ or ‘squatter’ upgrading programmes through which community organizations formed by the residents of 5 these settlements work with government agencies. Many upgrading programmes have reduced many of the risks and 6 vulnerabilities associated with climate change as the quality of housing improved, as provision for piped water, 7 sanitation and drainage was made – and, more generally, as those living in these settlements became incorporated 8 into ‘the formal’ city (Almansi 2009, Boonyabancha 2005, Fernandes 2007, Ferguson and Navarrete 2003, Imparato 9 and Ruster 2003, Some, Hafidz and Sauter 2009, UN Millennium Project 2005). The issue of land tenure, however, 10 remains difficult to resolve and is likely to impede local level adaptation action, particularly given that the GLTN 11 (2008 pg 13) states that in 2005, an estimated 934 million people lived without secure tenure in informal settlements 12 in the urban areas of developing countries, and predicts that the number will increase to 1.5 billion by 2020 and two 13 billion by 2030. 14 15 16 Household based adaptation in urban areas 17 18 Many case studies of risk and vulnerability in informal settlements show the responses of individuals and 19 households, where there is a history of extreme events (for instance floods, heat waves and high winds) (Wamsler 20 2007, Adelekan 2010, Jabeen, Johnson and Allen 2010, Livengood 2012). These measures include those that reduce 21 the risk to themselves (eg ventilation and roofs or roof covering that reduce maximum temperatures during heat 22 waves, barriers built to prevent floodwater entering homes) or reduce their exposure (moving temporarily to safer 23 locations, sleeping and keeping food stores on top of high furniture). 24 25 In some instances, the inhabitants of informal settlements have taken developed a range of measures for risk 26 reduction. For instance, in Dar es Salaam, in settlement x, walls with steps have been constructed around doors. 27 28 Measures that limit exposure to the risks are the most common. For instance, one inhabitant of an informal 29 settlement in Freetown reported that “When we see very dark clouds up the hills, we expect heavy rains to come. So 30 we get ourselves prepared by transferring our valuable things on our very high beds which are reached by climbing 31 ladders. Also children who sleep on the floor are transferred to the high beds”(Douglas et al 2008). Box 8-1 32 outlines the various measures taken by household in Korail, one of the largest informal settlements in Dhaka, that 33 includes adjustments to housing and measures to reduce exposure. Interviews with Korail’s inhabitants revealed that 34 some moved to safer locations when monsoon rains were expected but most did not as they felt this risked losing 35 assets and disrupting income-sources and livelihoods (Jabeen, Allen and Johnson 2010). They also worried about 36 whether they would be allowed to return to their settlement if they moved. Similar concerns were expressed by the 37 inhabitants of informal settlements in Santa Fe, Argentina; part of their reluctance to move from their homes to 38 escape floods was a worry that their homes would be looted and that they would not be allowed back (Hardoy, 39 Pandiella and Velasquez 2011). Cultural concerns are also a significant factor influencing the adaptive responses of 40 communities (Carter, 2011 pg 196) and these may include beliefs that hinder household or community adaptation 41 (Golder Associates, 2010 pg 24). Other factors affecting the opportunities for community based adaptation included 42 issues of land tenure and cost effectiveness. For example “buying” a plot on a floodplain for a once-off cost of 43 R500, was preferable to renting a room in a safe high lying area for R300 (Golder Associates, pg 24). 44 45 _____ START BOX 8-1 HERE _____ 46 47 Box 8-1. Household Adaptation in Korail 48 49 In this informal settlement, most impact-minimizing actions were temporary and part of regular practice – for 50 instance putting temporary barriers across door fronts to limit flood waters entering the home or temporarily 51 increasing furniture height (for instance putting them onto bricks). Other measures included changes to the house 52 structure – for instance, making higher plinths and arranging higher storage facilities (eg shelves higher up walls). 53 To help cope with very high temperatures, creepers were grown in courtyards to cover roofs and other materials are 54
ZERO-ORDER DRAFT IPCC WGII AR5 Chapter 8
Do Not Cite, Quote, or Distribute 28 25 July 2011
put on roofs to reduce heat gain; most households used some form of false ceiling or canopy made out of cloth (a 1 popular practice in rural areas, adopted in urban houses) For houses near or on the water’s edge, structures are on 2 stilts with platforms constructed higher up the stilts. Wooden planks for flooring are preferred as they suffer less 3 from water clogging once floods subside after heavy rainfall. Stilts also mean expansion is possible over the lake 4 adjoining the settlement. During flooding or water clogging, most residents sleep on furniture, use movable cookers 5 for food preparation (that can be used on shelves or on top of furniture); some shared services with unaffected 6 neighbours. Other measures include making outlets to help get the floodwater out of the house 7 8 SOURCE: Jabeen, Johnson and Allen 2011 9 10 [INSERT FIGURE 8-2 HERE 11 Figure 8-2: A cross-section of a house in Korail showing measures taken to cope with flooding and high 12 temperatures (Jabeen, Johnson, and Allen 2011).] 13 14 _____ END BOX 8-1 HERE _____ 15 16 In Korail, as in other informal settlements, it was mostly actions by individual and households, not communities. In 17 El Salvador interviews and discussions with the inhabitants of 15 disaster-prone “slum” communities and with local 18 organizations showed the difficulties in getting community action. The inhabitants recognized that flooding and 19 landslides were the most serious risks to their lives and livelihoods – although discussions with them also 20 highlighted other problems such as lack of job opportunities, inadequate water provision and juvenile violence. 21 Many households had invested in risk reduction – for instance more diverse livelihoods, assets that could be sold 22 and remittance from family members working abroad. But a range of issues limited them working together for 23 collective measures – including no representative community organizations through which to design and implement 24 settlement-measures and a lack of support from government agencies. In addition, most of the institutions that could 25 have supported improved housing did not consider risk-reduction (Wamsler 2007). 26 27 In a study of the risks faced by the residents of four informal settlements in Lagos to flooding, there were some 28 community initiatives to clear blocked drainage channels but most responses were by individuals or households – 29 for instance, constructing drains, trenches or walls to try to protect their houses. Food and other household items 30 were stored on shelves or cupboards above anticipated flood levels. Those interviewed highlighted how any climate 31 hazard reduces earnings through missed working hours or days (Adelekan 2010) 32 33 34 Community-based adaptation 35 36 The willingness of individuals to invest in collective actions for risk reduction in their settlement will be influenced 37 by how secure they feel from eviction and their tenure status (for instance tenants are usually unwilling to invest in 38 improving the housing they live in and less willing to invest in community initiatives). This willingness also 39 depends on how their settlement is viewed by local government and the relationships between local government and 40 community organizations or community leaders. But the contribution of community-level organization and action to 41 disaster risk reduction (and development and climate change adaptation) can also be greatly enhanced where local 42 governments and other key bodies (for instance, for disasters, civil defence organizations) recognize their role or 43 their potential role and support them. It has become common for local governments to work with community-based 44 organizations in upgrading (see for instance Boonyabancha 2005, 2009) and in disaster risk reduction (see Pelling 45 2011b, United Nations 2009, 2011, IFRC 2010). Community-based adaptation has many precedents in community-46 based actions to reduce risks and vulnerabilities to floods, storms and heat waves in the past (see for instance Archer 47 and Boonyabancha 2011). 48 49 Ayers and Forsyth 2009 suggest that community-based adaptation implies operating at the level of a neighbourhood, 50 settlement or village in communities that are vulnerable to climate change and includes identifying and 51 implementing community-based activities that strengthen their adaptive capacities and address local development 52 concerns that underlie vulnerability. 53 54
ZERO-ORDER DRAFT IPCC WGII AR5 Chapter 8
Do Not Cite, Quote, or Distribute 29 25 July 2011
Interest in community-based adaptation has grown among researchers and international agencies but this has tended 1 to focus more on rural areas and in relation to rural livelihoods (Dodman and Mitlin 2011). In part, this is because 2 much of the exposure to environmental risk among urban populations is because of deficiencies in provision for 3 infrastructure and services to those living in informal settlements. For instance, community organizations may be 4 able to help construct or improve drainage and collect solid waste within their settlement but there are obvious limits 5 in what community-organizations can do; community based organization and action cannot provide the network 6 infrastructure that local infrastructure needs (eg piped water systems or drainage networks) or city-region 7 management – for instance land-use management that avoids settlement on sites at risk, needed revisions in building 8 codes (Satterthwaite, Dodman and Bicknell 2009). Most informal settlements are embedded in a larger built up area 9 and if community action does improve drains and solid waste collection, these need larger systems – for the drains 10 to feed into, for the solid waste collected to be removed. They need road, path and bridge networks beyond their 11 settlements that can withstand extreme weather and which allow them to evacuate if needed. A focus on community-12 action may mean a lack of attention to the structural inequalities that underlie these deficiencies (Mohan 2002) and a 13 lack of attention to the responsibilities of local governments and international agencies (Dodman and Mitlin 2011). 14 In addition, low-income communities may not see climate change adaptation as a priority, especially if confronted 15 with pressing issues such as daily difficulties in generating sufficient income and a threat of eviction (see Banks et al 16 2011). 17 18 The effectiveness of community-based action is also dependent on how representative and inclusive the community 19 leaders and organizations are. In Durban, a high reliance on government grants for income, general community 20 apathy and high levels of crime act as barriers to community mobilisation (Golder Associates, pg 25). Also 21 significant is the issue of social cohesion and distrust. For example, in Durban, the use of water tanks for rain water 22 harvesting is affected by the fear that neighbours or other groups may contaminate the tanks (ibid). 23 24 Examples of community based adaptation 25 Lessons. Gender. 26 How representative are community organizations 27 Does it generate pressure for larger changes. 28 Does it learn from participatory development. Does it engage with key development agendas that reduce poverty and 29 vulnerability (Sabates-Wheeler et al 2008). Does it underplay local inequalities and adverse power relations at 30 district, city, national and transnational levels (Mohan and Stokke 2000). 31 What about the difficulties of those who are chronically ill or disabled – including role of HIV 32 33 34 8.3.3. Adapting Key Sectors 35 36 This section reviews what is known about adapting the key sectors of urban areas to climate change – sectors whose 37 vulnerability to such change was discussed in section 2. 38 39 40 8.3.3.1. Adapting the Economic Base of Urban Centers 41 42 Cities concentrate a high proportion of the world’s GNP and its economic assets and a high proportion of all new 43 private sector investment (World Bank 2008, Munich Re 2004, McKinsey 2011). They are often leading nodes of 44 growth and innovation, with clusters of significant industries and services (World Bank 2008. more cites). As 45 described in section 2, a large and growing proportion of disasters associated with extreme weather in urban centres 46 show their vulnerability to extreme weather events whose intensity and/or frequency climate change is likely to 47 increase. Adjustments for many manufacturing industries may be especially challenging as a result of the lengthy 48 lead times, slow turnover rates for capital stock, and significant capital requirements (Ruth 2010: 390). Without 49 farsighted adaptation strategies in manufacturing and other sectors, climate change is likely to hamper growth in 50 most urban centres. 51 52 As section 8.3.x describes in more detail, the economic underpinning of cities includes the ecosystems and 53 ecosystem services that provide the platform for human well-being and economic development (see e.g. MA, 2005, 54
ZERO-ORDER DRAFT IPCC WGII AR5 Chapter 8
Do Not Cite, Quote, or Distribute 30 25 July 2011
TEEB, 2010). Adaptation of these natural ecosystems in urban areas is therefore also critical as the ecosystem 1 services contribute to the economic base. For instance, one estimate for Durban suggested that these were worth 2 R3.1 billion (eThekwini Municipality, 2007). 3 4 For any urban centre, a failure to adapt to climate change is likely to discourage new investments and over the long 5 term also to some of its enterprises moving or expanding to other safer, better adapted locations. Multinational 6 corporations and many national businesses have long been adept at changing the location of their production (and 7 also their headquarters) in response to changing opportunities and risks (refs) so they can choose to avoid urban 8 centres facing high risks linked both to climate change and a failure to adapt. 9 10 Disasters can also have important long-term economic consequences, as illustrated by the economic difficulties that 11 still face the city of New Orleans, after Hurricane Katrina (although even before Katrina, new investments there had 12 been discouraged by previous disasters). These arise from changes in risk perceptions that deter new investments. 13 They also derive from clustered and increasing-return effects that lead businesses to move outside the affected area 14 when many other businesses and services that they use (especially basic services like utilities, schools, and 15 hospitals) are seriously affected (Hallegatte and Dumas 2008). A lack of capacity to reconstruct means increased 16 vulnerability to the next extreme weather event and less new investment (that in turn weakens the economic base) 17 (see Benson and Clay 2004; Hallegatte et al. 2007, Hallegatte, Henriet and Corfee-Morlot 2011): 18 19 THIS PARAGRAPH AND SOME OTHER PARTS IN THIS MAY BELONG IN SECTION 2: Many case studies 20 show how extreme weather events can impede economic activities in cities, such as damaging industrial 21 infrastructure, disrupting coastal ports and broader supply chains, or curtailing urban tourism (Gasper, Blohm, and 22 Ruth 2011). This is illustrated by the costs of flooding for the city of Villahermosa in the state of Tabasco, Mexico 23 located in the delta of Grijalva river. This also illustrates both primary and secondary impacts. As a result of the 24 floods in 2007 that covered 65% of Tabasco State, Villahermosa´s economic base got seriously depleted. Regional 25 damages and asset and infrastructure losses amounted for up to US$ 3.1 billion, equivalent to 30% of Tabasco State 26 GDP (CEPAL, 2008). Reconstruction of the city and the region is still underway. Even though the Integrated 27 Hydraulic Integral Programme of Tabasco (PHIT) was designed and still being implemented, not enough 28 information is available on to what extent this has become a successful water management planning process oriented 29 to reduce the urban risk of future flooding events that may be caused by climatic factors. This is in part due to the 30 lack of policy assessment and research and the mismatch between local economy needs and policies aimed at 31 restoring the Tabasco state economy. In this regard, adaptation of key economic city sectors such as peri-urban 32 agriculture, services including water and sanitation and tourism is a must. It is worth noting that Villahermosa 33 neighbouring medium-sized cities such as Cárdenas and Huimanguillo are also vulnerable to regional flooding – and 34 were affected in 2008- so a comprehensive disaster prevention and climate change adaptation plan is required. 35 Tabasco´s main public university, along with other research institutes, are about to release the Climate Change 36 Action Plan for Tabasco2,CCAP Tabasco (UJAT-INE, 2011) that comprises both mitigation and adaptation 37 measures. However, scientific research and evaluation of current and potential vulnerabilities to climate change in 38 this region are focused on primary sectors and on coastal ecosystems so adaptation measures proposed are centred 39 on the impact of sea-level rise and coastal-line depletion and saline intrusion in aquifers near rural communities – 40 such as Sánchez-Magallanes and Frontera, Tabasco (Vázquez-Botello, 2010). The consideration of urban 41 vulnerability and therefore cities´ adaptation to climate and weather hazards is lacking in the CCAP Tabasco. This is 42 in part due to the professional background and institutional adscription of those who are in charge of drafting the 43 CCAP Tabasco and also to the fact that urban planning has not yet envisioned an adaptation route. 44 Case study of flooding, the inadequacies of local government responses and the costs to the economy in Santa Fe 45 (Argentina) could be added here (Hardoy, Pandiella and Velasquez 2011). 46 47 [INSERT FOOTNOTE 2 HERE: Climate Change Action Plan of Tabasco will be published in 2011.] 48 49 Drought will threaten cities like Naivasha, Kenya, that rely upon high-value horticultural exports (Simon 2010: 50 243). NEED DISCUSSION HERE OF CITIES WHOSE ECONOMIC BASE IS TIED TO PROSPEROUS 51 AGRICULTURE IN AREAS WHERE DROUGHT OR DECREASES IN RAILFALL THREATEN THIS 52 Some regions and sectors will be particularly affected by climate change – for instance many tourist centres and 53 agricultural production as discussed in later sections. Losses in these can lead to significant indirect economic losses 54
ZERO-ORDER DRAFT IPCC WGII AR5 Chapter 8
Do Not Cite, Quote, or Distribute 31 25 July 2011
and unemployment. Past experience of de-industrialization (e.g., in many cities in the U.S. and Europe whose 1 prosperity was based on industry) has shown how difficult it is for a region to shift from one activity to another. 2 When the main activity of a region disappears, inhabitant revenue and local authority revenues (through taxes) 3 decrease, making it more difficult to re-invest in new business and less attractive for alternative businesses to 4 establish in the region. If climate change forces many regions to change their business models, transitions may prove 5 difficult to manage (see Berger 2003), and specific adaptation policy may be useful to help make the transition more 6 rapid and less painful. 7 8 Climate change adaptation is generally cheaper and easier to implement in new urban developments – for instance as 9 new areas within or around cities are settled, rather than retrofitting infrastructure and where industries are already 10 in place (McGranahan, Balk, and Anderson 2007: 21). 11 12 Within and around urban centres, local governments may need to utilise several strategies including selective 13 relocation, land use planning to reduce exposure and shifting development from floodplains, and revised building 14 regulations to retrofit or flood-proof structures (Hanson et al. 2011: 103). 15 There may be important opportunities for proactive adaptation outside the larger cities where, as noted in section 1 16 much of the future urban growth is likely to occur (Satterthwaite 2007). But smaller urban centres are often 17 institutionally weaker and lack critical infrastructure. Local authorities can seek to adapt and mitigate climate 18 change as these facilities are established (Hardoy and Romero-Lankao 2011: 159) The local government in 19 Manizales, Colombia, has begun incorporating climate change and environmental management into its local 20 development agenda, including the establishment of city climate monitoring systems (ibid., p. 160). In many low 21 and middle income nations with successful economies, a new generation of cities have emerged that are attracting 22 new investment away from the largest cities – often supported by decentralization, more accountable and competent 23 local governments and better quality national systems of infrastructure for transport and communications (ibid, 24 Satterthwaite et al 2010, Dávila 2009). 25 26 Adapting the urban economic base may require short- and long-term strategies to assist vulnerable sectors 27 and households. The consequences of climate change for urban livelihoods may be profound in poorer households, 28 which lack assets or insurance that help them cope with shocks (Moser and Satterthwaite 2008). Although many of 29 the urban poor engage in informal livelihood strategies, the effects of extreme weather on the informal economy are 30 rarely measured. For instance, the floods in Santa Fe, Argentina in 2003 caused an estimated US$1bn in losses but 31 these estimates do not include lost workdays and income for informal labourers (Hardoy and Pandiella 2009). Social 32 protection and safety nets for vulnerable groups, “particularly in the informal economy,” may be needed to cope 33 with the short-term impacts of climate change (Sánchez and Poschen 2009: 21). 34 The importance of support for a ‘green economy’ and for its support with green infrastructure to help shift the 35 economic base (and employment) towards lower carbon, more climate resilient urban patterns is recognized but as 36 yet not much developed. 37 38 The scale, nature and importance of the ‘waste economy’ in cities in low- and middle-income nations and its 39 importance for livelihoods for large sections of the low-income population is now well documented (Thieme 2010, 40 Medina 2007, Hasan 2010, others), as are its contribution to waste reduction and greenhouse gas emission reduction 41 (Huq and Ayers 2009). For example, in Brazil’s main cities, over 500,000 people are engaged in waste picking and 42 recycling (REFS); an estimated 17,000 people in Lima and 40,000 in Cairo earn their livelihoods from informal 43 recycling (Scheinberg et al. 2011: 193). 44 45 For some cities, there is some documentation of the kinds of adaptation needed to protect or enhance their economic 46 base. For instance, climate change is likely to have major impacts on Mombasa and its surrounding regional 47 economy. As well as a tourist destination and industrial centre, Mombasa is the second largest city in Kenya, the 48 largest seaport in East Africa and gateway for Kenya’s landlocked neighbours (Kithiia and Dowling 2010). The 49 city’s annual costs of coastal flooding due to sea level rise may reach $7-58m in 2030 and perhaps $31-313m 50 annually by 2050 (Kithiia 2011: 177 using 2009 SEI report). Local authorities may need to redesign and 51 reconstruct the city’s ports; cement industries and oil refineries may necessitate major financial and capital 52 investments as well (Awuor, Orindi and Adwera 2009: 84). Relocation of industries further inland may be required 53 in other cases (ibid.). Recent plans have sought to restore coastal zones, improve climate data collection, and 54
ZERO-ORDER DRAFT IPCC WGII AR5 Chapter 8
Do Not Cite, Quote, or Distribute 32 25 July 2011
strengthen disaster management capacities (ibid.), but further steps are needed to adapt Mombasa’s economy to 1 climate change. (ADD DETAILS OF VULNERABILTY OF INFORMAL ECONOMY FROM MOSER AND 2 STEIN 2011) 3 4 Climate change may have similarly negative effects upon Rio de Janeiro’s diverse economy (including industry, oil 5 refineries, shipyards and tourism) and adaptive measures may create difficult trade-offs for the city (de Sherbinin, 6 Schiller, and Pulsipher 2007). Many parts of the city are also vulnerable to climate hazards, including erratic 7 precipitation, flooding, and landslides (ibid.). It is mostly those living in informal settlements (favelas) on land at 8 risk of landslides that are most impacted (REFS). Defences needed to help safeguard coastal industries and 9 residential areas could threaten the city’s beach tourist industry (de Sherbinin et al 2007.). Adapting Rio’s economic 10 base will need to resolve such tensions and trade-offs, necessitating dialogue amongst local stakeholders (Ruth 11 2010). In this regard, a policy document on Rio de Janeiro´s vulnerability and adaptation to climate change is to be 12 released in 2011. To check adaptation measures proposed <Fernando will try to get that information> 13 14 Many cities’ economies will be impacted if climate change brings water scarcity and variability that interrupt 15 hydropower supplies. Climate change may interrupt Brazil’s hydroelectric supplies, with negative knock-on effects 16 upon the economies of many urban centres – for instance Rio’s industries (de Sherbinin, Schiller, and Pulsipher 17 2007). Cities in sub-Saharan African often rely on hydropower for their electricity, and failures in hydropower 18 supplies “can lead to more general ‘urban failure’ ” (Muller 2007). Declining water levels in the Hoover Dam have 19 raised the possibility that Los Angeles will lose “a major power source as hydroelectric turbines shut down,” and 20 that Las Vegas will experience a severe decline in drinking water availability (Gober 2010: 145). 21 22 As yet, there is little evidence that the location of private sector investments is influenced by climate-change related 23 risks or by cities adaptive capacities, although of course it is influenced by the availability of infrastructure and 24 services that are an essential part of adaptive capacity. Many of the cities in Asia with successful economies are 25 located on low-lying coastal areas, which are undergoing rapid urbanisation and economic transformation 26 (McGranahan, Balk, and Anderson 2007).3 Many of these coastal settlements are also within areas where cyclones 27 are common. Without adaptive measures and with rising concentrations of population, infrastructure, and industries 28 along India’s coasts, there will likely be a non-linear increase in coastal vulnerability over the next 2 decades (Revi 29 2009: 322). The same is true for China (McGranahan et al 2007). Recent assessments have projected the rising 30 population and asset exposure in large port cities (Hanson et al. 2011, also Munich Re 2004)), alongside case studies 31 in Copenhagen (Hallegatte et al. 2011) and Mumbai (Ranger et al. 2011). By 2070, the exposed assets in cities such 32 as Ningbo (China), Dhaka (Bangladesh) and Kolkata (India) may increase by more than 60-fold (Hanson et al. 2011: 33 100-1). Additionally, frameworks have sought to capture the direct and indirect economic impacts of climate change 34 in urban areas (Hallegatte, Henriet and Corfee-Morlot 2011) 35 36 [INSERT FOOTNOTE 3 HERE: These ‘low-elevation coastal zones’ (LECZ) are defined as the contiguous area 37 along the coast that is less than 10 metres above sea level (McGranahan, Balk, and Anderson 2007).] 38 39 Few economic assessments have been completed in West African coastal cities, which are threatened by climate 40 change as well as facing ecological degradation and urban management challenges. But national and city 41 governments will face difficulties protecting many cities or parts of cities, including industries, infrastructure and 42 tourism (see Doussou and Gléhouenou-Doussou 2009: 116 no source). Lagos, Dakar, and other important economic 43 centres in the Gulf of Guinea have large areas on the coast that are close to mean sea level, leaving them highly 44 vulnerable to erosion and rising sea levels (Simon 2010: 244). Compounding the climate change-induced flooding 45 risks are the cities’ rapid coastal construction, destruction of mangrove swamps, and inadequate refuse collection 46 (ibid.). Artisanal fishing communities, tourism, and other industries may require adaptive strategies to manage these 47 complex risks to local economic development. This is also happening in the Caribbean coast of Mexico where 48 tourism and cities such as Cancun and Tulum have grown close to areas exposed to hurricanes (Pelling 2011) and 49 also in the coast of the city of Campeche, in Mexico, Gulf of Mexico (Palacio, A et al 2005) 50 51 52
53
ZERO-ORDER DRAFT IPCC WGII AR5 Chapter 8
Do Not Cite, Quote, or Distribute 33 25 July 2011
8.3.3.2. Adapting Food and Biomass for Urban Populations 1 2 For the world’s growing urban population, climate change adaptation in regard to food and biomass fuels will 3 require measures to ensure sufficient food and fuel supplies within each nation (and region within these) and to 4 ensure that urban and rural dwellers have the means to access sufficient food and fuel. A very large (rural and urban) 5 population currently suffer hunger and a larger population experiences food insecurity irrespective of the challenges 6 from climate change (FAO 2010). Of course, climate-change related constraints on agricultural production and the 7 food supply chain can impact urban areas through reduced supplies or higher prices. But there is also the disruption 8 to agricultural production that can come from reductions in urban demand for agricultural products or reductions in 9 remittance flows from urban to rural areas or disruptions to the urban based enterprises that provide farmers and 10 rural dwellers with goods and services and some rural dwellers with employment (Satterthwaite, McGranahan and 11 Tacoli 2010: 2817) 12 13 The impacts of climate change on agriculture will vary between regions and over time, but the overall effects will 14 likely be negative (IPCC 4AR). Population growth, increased affluence, and competing pressures for water or bio-15 fuels may further erode food security (Godfray et al. 2010). However, globally, agriculture has managed to keep up 16 with rising demands worldwide, including the rapid growth in the population, the rapid increase in the proportion of 17 non-agricultural workers to agricultural workers that accompanies urbanisation and consumer shifts in diets that are 18 far more meat and carbon intensive and often land intensive (Satterthwaite, McGranahan and Tacoli 2010). There 19 are many examples of cities expanding onto valuable agricultural land, although the global and regional scale of this 20 may be exaggerated. One recent study suggests that the urban built up area represents only 0.5 percent of global land 21 area and it is only in Europe that it exceeds 1 percent (Schneider, Friedl and Potere 2009). In addition, the loss of 22 agricultural land to urban development may in part be compensated by the development of urban agriculture and 23 shifts in agriculture to higher value agricultural products, in part stimulated by rising demand from urban 24 populations. Although adjustments in farming practices are essential, adapting urban food systems represents a 25 major challenge as well and will necessitate radical changes in food production, storage, processing, distribution, 26 and access (Godfray et al.). 27 28 Climate change is likely to have far-reaching influence on food security, but its impact “will crucially depend on the 29 future policy environment for the poor” (Schmidhuber and Tubiello 2007: 708). The fact that large sections of the 30 urban population in low- and middle-income countries suffer hunger while a larger number face food insecurity is 31 due more to their low incomes and limited capacities to access food than to overall food shortages (Cohen and 32 Garrett 2010). 33 34 In low-income urban households in low and middle income nations, food expenditures generally represent more 35 than half of total expenditures (and often more than this) (Cohen and Garrett 2011: 469). This makes low income 36 urban populations particularly at risk from food price rises. While discussions of hunger and food insecurity usually 37 focus on rural areas, there is a growing literature showing the scale and nature of under nutrition and food insecurity 38 in urban areas (Montgomery et al 2004, Ahmed et al 2007, Cohen and Garrett 2010). 39 In general, urban dwellers have far fewer possibilities of producing food than rural dwellers (although urban 40 agriculture may be important) so rising prices may increase under nutrition and prevent the urban poor from 41 purchasing a healthy diet (Godfray et al. 2010: 814 or other cite). PERHAPS A BOX HERE SUMMARIZING 42 RECENT EVIDENCE ON THE SCALE AND IMPORTANCE OF URBAN AGRI AND THE SIGNIFICANCE 43 FOR CLIMATE CHANGE ADPATATION? a study utilising nationally-representative household survey data in 15 44 low- and middle-income countries found that the shares of urban households earning income from agriculture 45 “varied from 11% in Indonesia to almost 70% in Vietnam and Nicaragua. In 11 of the 15 countries...the share of 46 households participating is over 30%” (Zezza and Tasciotti 2010: 267). Prolonged drought in Australia, for instance, 47 may decrease the availability of fresh produce and costs could be prohibitive for poorer urban households (Bambrick 48 et al. 2011: 70). 49 50 Urban centres that are seriously impacted by extreme weather also face serious challenges in ensuring that the 51 affected population have access to adequate food supplies. Flooding, drought, or other extreme events often lead to 52 food price shocks in cities (Bartlett 2008). After the 2004 floods in Bangladesh, Dhaka’s rice prices increased by 30 53
ZERO-ORDER DRAFT IPCC WGII AR5 Chapter 8
Do Not Cite, Quote, or Distribute 34 25 July 2011
percent and vegetable prices more than doubled (Douglas 2009: 131 no source). Bangladesh’s urban slum-dwellers 1 and rural landless poor were the groups worst-affected by food insecurity (ibid.). 2 3 When facing increased food prices, the urban poor adopt a range of coping strategies such as reduced consumption, 4 purchasing less nutritious foods, or increasing labour particularly by women and children (Cohen and Garrett 2011: 5 473-5). But households may thereby erode vital assets and fail to achieve resilience, particularly in the context of 6 more frequent disasters due to climate change. 7 8 Other adaptive responses have included support for urban agriculture, local markets, or enhanced safety nets. Food 9 price increases may be moderated by improving the efficiency of urban markets, regulations to promote farmers’ 10 markets, or investing in infrastructure and production technologies (Cohen and Garrett 2011: 478-9). Food security 11 may also be enhanced by government support for urban agriculture and street food vendors (ibid., also Lee-Smith 12 2011). Food security for urban dwellers with low incomes is also obviously increased if these groups’ purchasing 13 power increases or they have access to cheaper food or to social incomes – for instance conditional credit or cash 14 transfers (for instance in Brazil the bolsa familia) or, for older groups pensions (Soares, Ribas and Guerreiro Osório 15 2010). 16 17 Additionally, various studies have shown how improving food security in the context of climate change needs to 18 consider the multiple connections between rural and urban areas. In India, for example, the urban metabolism is still 19 heavily shaped by flows of traditional bio-fuels and unprocessed food (Revi 2009: 331). Rather than focusing only 20 on cities, “regional climate change risk adaptation strategies and action plans are needed” (ibid.). Complex rural-21 urban linkages may be decisive in shaping food policies that can address climate change.. Thus, a portfolio of 22 responses that can bridge rural and urban boundaries, as well as action at the household, local, national, and 23 international levels, will be needed to strengthen food security. 24 25 26 8.3.3.3. Adapting Housing and Settlement 27 28 Housing is a key social determinant of health so it “clearly plays a role in the susceptibility of the target group to 29 climatic conditions and in planned adaptive strategies by government, the community, and families...” (Maller and 30 Strengers 2011: 4). Housing is “often the major part of the infrastructure affected [by disasters]...” (Jacobs and 31 Williams 2011: 176) although good quality housing is also among the factors that limit the impact of extreme 32 weather. Adapting housing can also help to minimise losses, ill-health, mental distress, or displacement following 33 extreme weather. Housing that is well adapted to climate change also has particular importance for safeguarding 34 potentially vulnerable groups including children (Bartlett 2008), older residents or those with pre-existing chronic 35 health conditions. These can be especially vulnerable to extreme heat (Hajat, O’Connor, and Kosatsky 2010). 36 However, passive cooling or other design measures can reduce the health impacts of heat waves and help maintain 37 comfortable temperatures (Roberts 2008a, Hacker and Holmes 2007). 38 39 As the vulnerability of housing to climate change is shaped by multiple factors, resilience may be enhanced via a 40 range of structural and non-structural interventions. Wealthier households in Latin American cities often live in 41 risky sites near rivers, coasts, or on slopes; but they frequently have insurance and the assets “to reinforce their 42 house structures, get protective infrastructure, and lobby for policies and actions that protect their homes and 43 neighbourhoods” (Hardoy and Pandiella 2009: 215). By contrast, low-income households who live in areas at risk 44 usually live in poor quality housing lacking infrastructure and insurance (Moser and Satterthwaite 2008). Adaptation 45 interventions in low-income and most middle-income nations will need to address the high risks facing those living 46 in informal settlements – and so adaptation interventions encompass those that improve the quality and safety of 47 existing and new buildings as well as access to insurance, services, or infrastructure. Strategies will be needed both 48 to retrofit the existing stock and to guide new-build construction, both of which are needed to ensure resilience in 49 the housing sector. The relative contribution of these varies. For instance, the UK’s housing stock is replaced at just 50 1% annually (Roberts 2008a) whereas for many rapidly growing cities, the new housing stock is growing much 51 more rapidly and measures to ensure the resilience of new housing to climate change have great importance for the 52 city’s adaptation. 53 54
ZERO-ORDER DRAFT IPCC WGII AR5 Chapter 8
Do Not Cite, Quote, or Distribute 35 25 July 2011
In the absence of appropriate adaptation, housing damages may increase with possible knock-on effects on 1 residents’ health, the economy, or resettlement patterns. Chittagong’s landslides in June 2007 were prompted by 2 heavy rain and illegal “hill-cutting,” resulting in the deaths of 126 people who were mainly slum-dwellers in steep 3 hillside areas (Rahman, Haughton, and Jonas 2010: 561). Climate change may amplify the risks by promoting more 4 frequent or intense storms (posing particular challenges in marginal or hazardous sites where low-income residents 5 frequently reside, as in Chittagong). Although climate-related effects on migration cannot be reliably predicted 6 (Tacoli 2009), adapting housing can help to minimise the displacement and disruption that climate change may 7 otherwise bring. 8 9 This section discusses shelter design strategies and planned interventions by local governments, while later sections 10 consider complementary interventions in health, public services, infrastructure, energy, or other sectors. Passive 11 cooling designs (section a) and measures to ensure resilience to floods or other storms (section b) have gained 12 attention in the literature. Few urban policy-makers have implemented such measures, although some cities’ plans 13 have begun to identify strategies to adapt the housing sector (section c). Community-based adaptation (considered in 14 section 8.2.3.4) provides another route to improve housing, and households’ private adaptation measures will likely 15 be significant in many cities (Fankhauser 2010: 28). The range of actors in the housing sector, its myriad 16 connections to other sectors, and its potential to promote mitigation, adaptation, and development goals all suggest 17 the need for better-coordinated strategies that can support resilience (see also Maller and Strengers 2011 for a 18 research agenda on housing, health and climate change). 19 20 21 Housing and extreme heat: cooling strategies 22 23 Measures to cope with extreme heat will be increasingly important in many cities, given the interactions between 24 climate change, housing, and higher temperatures due to the already-existing urban heat island (cites on UHI). A 25 review of the health effects of hot weather identified contextual risk factors in residential settings, including “living 26 in homes with high thermal mass and little ventilation,” occupying the upper stories of high-rise buildings, or “no 27 access to an air-conditioned environment” (Hajat, O’Connor, and Kosatsky 2010: 858). Mechanical cooling can 28 provide relief from high temperatures, but these devices are potentially mal-adaptive as they contribute to 29 greenhouse gas emissions4 and may exacerbate residents’ vulnerabilities “if blackouts occur on the hottest days 30 when peak demand is at its worst” (Maller and Strengers 2011: 3). As discussed below, extreme heat may instead be 31 reduced using passive cooling measures and adapting green infrastructure (section 8.3.3.7) could readily 32 complement the residential interventions discussed below. Cities will also need heat-wave plans to ensure adequate 33 water provision, back-up electricity supplies, emergency healthcare, and other public services particularly for 34 vulnerable residents such as the elderly.5 35 36 [INSERT FOOTNOTE 4 HERE: For instance, Australia’s cooling and heating appliances accounted for 19% of 37 residential greenhouse gas emissions in 2008 (cited in Maller and Strengers 2011: 3).] 38 39 [INSERT FOOTNOTE 5 HERE: These sectoral strategies are discussed in 3.3.XX-XXX, while local government 40 plans to adapt the housing sector are considered below.] 41 42 Passive cooling can be used in both new-build and retrofitted structures to reduce solar gain and internal heat gains, 43 while enhancing natural ventilation or improving insulation (Roberts 2008a and 2008b). Although developments 44 such as BedZED in suburban London6 (Chance 2009) or Germany’s PassiveHaus standard (Rees 2009) have set 45 precedents for mitigating household emissions, these passive designs can simultaneously contribute to adaptation. 46 For instance, loft and wall insulation or double-glazed windows can keep structures cooler in the summer and reduce 47 winter heating demand (Roberts 2008a and 2008b). Other passive measures may include external awnings, or light-48 coloured paint to increase reflectivity of external walls (ibid.). Thermal mass is another key dimension to promote 49 residential cooling, “because it introduces a time-delay between changes in the outside temperature and the 50 building’s thermal response necessary to deal with the high daytime temperatures” (Hacker and Holmes 2007: 103). 51 Structures in southern Europe have already utilised solar shading, ventilation, and thermal mass in the building 52 fabric to promote cooling7 (ibid.). Simulations for London buildings (under UKCIP02 Medium-High emissions 53
ZERO-ORDER DRAFT IPCC WGII AR5 Chapter 8
Do Not Cite, Quote, or Distribute 36 25 July 2011
scenarios) suggested that utilising shade, thermal mass, control of ventilation and other advanced passive designs 1 was an “eminently viable option for the UK, at least over the next 50 years or so” (ibid., p. 111). 2 3 [INSERT FOOTNOTE 6 HERE: The designers of Beddington Zero Energy Development (BedZED) sought to 4 reduce energy demand for heating, cooling and ventilation “by 90 per cent compared to the average UK home,” 5 while also utilising super-insulation, ventilation, and other measures to ensure energy is not required for most of the 6 year (Chance 2009: 532).] 7 8 [INSERT FOOTNOTE 7 HERE: Info on indigenous architecture +cooling elsewhere?] 9 10 Nevertheless, several obstacles may complicate the incorporation of passive designs. Interventions with residents 11 may be needed to ensure proper utilisation of passive cooling features, as BedZED households’ modification 12 (closing windows for privacy, e.g.) increased energy consumption (Chance 2009: 540). Opening windows may also 13 be hampered by cities’ security concerns or noise pollution, and architectural intentions may conflict with the need 14 for high thermal mass or external shading (Hacker and Holmes 2007: 111). Additionally, modern windows "often do 15 not ventilate well," and site restrictions, cost, or other constraints may impede the use of passive cooling 16 “particularly in the refurbishment of existing buildings” (Roberts 2008b: 4554). 17 18 Special attention may also be needed to support adaptation among the elderly in nursing homes, although there is 19 limited research to date on this vulnerable population. A review notes that elderly people in hospitals or residential 20 facilities are at higher risk of heat-related ill-health (Hajat, O’Connor, and Kosatsky 2010: 858). Detailed 21 discussions remain rare and in an observation-based pilot study from a nursing home in northwest England, 22 researchers suggested that pre-existing safety measures and residents’ dependence on nursing staff may actually 23 increase their vulnerability during hot weather (Brown and Walker 2008: 368). For instance, safety-related limiters 24 on windows may obstruct ventilation and wedges to prop doors were banned “because they pose a trip hazard, again 25 making ventilation potentially difficult” (ibid., p. 370). Nursing staff may need additional training in coping with 26 heat and forging appropriate adaptations, such as changing clothes, adjusting food and drink intake, or promoting 27 ventilation and cooling (ibid.). 28 29 30 Housing and disaster-preparedness measures 31 32 Housing-related adaptations to withstand extreme weather may include revising building codes, providing 33 emergency shelter, and proactive interventions to enhance buildings’ resistance and resilience to flooding. Extreme 34 events such as cyclones and floods may inflict a heavy toll on housing, particularly those structures built with 35 flimsier materials. For instance, floods in Dhaka in 1998 damaged 30% of the city’s units and of these, 32% were 36 permanent/semi-permanent homes belonging to wealthier households, but 36% were lower-quality owned by the 37 lower-middle classes and 32% by the poorest (Alam and Rabbani 2007). Measures to prevent entry points (or 38 ‘resistance’ to flooding) may include blocking doors, covering gaps in external walls around pipes, or preventing 39 water entering through walls (Roberts 2008: 4484). Further steps can be taken that cumulatively reduce the time and 40 cost of recovering from floods (‘resilience’), such as raising electrical points and appliances above water level, or 41 utilising rising hinges to enable door removal (ibid.). Many low-income communities have already developed a 42 range of effective responses to flooding (as discussed further in section 8.2.3.4 and 8.4.3 on community-based 43 adaptation). Poorer households in Georgetown, Guyana, utilise stilts or raise their floors with concrete or mud, and 44 findings suggested they were better able to protect their homes from inundation than households in wealthier areas 45 (Linnekamp, Koedam, and Baud 2011: 454). 46 47 But other proactive interventions in the housing sector may be needed to ensure residents can cope with more 48 frequent or severe storms. Rotterdam has prioritised adaptive building to provide “permanent protection against 49 flooding” as well as a sustainable, attractive living environment (Rotterdam 2010: 15). The city is developing plans 50 to build floating urban districts by 2040, including 13,000 climate-resilient homes with 1,200 located on water (ibid., 51 see also section 8.3.3.4 on adaptation in the water sector). 52 53
ZERO-ORDER DRAFT IPCC WGII AR5 Chapter 8
Do Not Cite, Quote, or Distribute 37 25 July 2011
Local housing authorities may also need to facilitate emergency shelter and support vulnerable residents or 1 migrants,8 as occurred after Australia’s recent extreme events (Jacobs and Williams 2011). For instance, housing 2 agencies established shelters and recovery centres after Cyclone Larry in Queensland (in 2006) and New South 3 Wales’ coastal flooding (in 2007). However, interviewed officials recalled the strains facing 24-hour providers in the 4 shelters and coordination difficulties with emergency health workers, police, insurance, and other agencies (ibid.). A 5 Queensland official also noted it was “necessary [that] we conveyed our empathy, especially as many tenants were 6 elderly and vulnerable” (quoted in ibid., p. 188). While not addressing climate change explicitly, the study helps 7 illuminate the range of social support, structural strategies, and interagency efforts that housing authorities may need 8 to develop in order to adapt to climate change. Section c) below considers cities’ proposed strategies that may better 9 cope with disasters and promote long-term resilience in the housing sector. 10 11 [INSERT FOOTNOTE 8 HERE: See Tacoli 2009 and Adamo 2010 for further discussion of migration and climate 12 change in urban areas.] 13 14 15 Urban adaptation plans in the housing sector 16 17 Bangkok Metropolitan Administration (BMA) recently completed a climate change assessment, and interrelated 18 adaptation measures in the residential sector were identified (BMA and UNEP 2009). For instance, it may be 19 necessary to flood-proof homes, build elevated basements, and relocate power-supply boxes upstairs; households 20 will be encouraged to maintain sufficient food, water, fuel, and other supplies to ensure 72 hours of self-sufficiency 21 (ibid., p. 71). The plan also identified regulatory changes that may be needed to bolster resilience. Land use 22 restrictions may be implemented in floodplains, areas prone to land-slides, or other at-risk sites (ibid., p. 72), 23 although the BMA may sponsor flood insurance for areas outside of floodplains. Safety and fire codes may be re-24 formulated for buildings and other structures; revised floodplain mapping and return frequencies may be 25 reconsidered; and emergency management was identified as a “high priority” (together suggesting the 26 interconnections between housing, public services, and infrastructure in adapting to climate change). 27 28 Cape Town’s climate change framework (2006) proposed housing interventions, which are seen to support 29 adaptation in the health sector and emergency response services. Thus, health adaptations included improving 30 construction and regulations for building informal housing so as to “minimise health impacts of poor living 31 conditions” (p. 48). Disaster response strategies also “need to be broadened to include adaptation strategies”, in 32 order to “reduce the need for emergency response and anticipate projected climatic change” (ibid., p. 44). Recent 33 disaster responses already highlighted the linkages between housing, emergency services, and lasting reconstruction 34 in informal settlements. After fires left 12,000 low-income residents homeless in January 2005, Cape Town’s Mayor 35 issued a statement with plans outlining emergency shelter provision, pre-fabricated fire-resistant structures, and a 36 move towards more formal housing (ibid.). To reinforce the linkages between housing, health, emergency services, 37 and reconstruction, Cape Town’s adaptation framework will need to be fully implemented...more info 38 39 Regulations in New York and Boston are being updated to address climate-related risks to the built environment. In 40 2010, the Boston Redevelopment Authority (BRA) inserted an adaptation requirement into the permit for the city’s 41 Seaport Square project: developers must “comply with applicable State and City strategies for addressing sea-level 42 rise and climate change” (quoted in Boston 2011: 11). This applies to all the residential, commercial, cultural, and 43 educational components of the 6.3-million ft2 project; BRA is also modifying its Development Review Guidelines to 44 explicitly identify where climate change and adaptation should be incorporated into new projects (ibid.). PlaNYC 45 recently identified the need to adjust New York City’s regulations to increase the resilience of buildings to climate 46 change (PlaNYC 2011: 156). The city already significantly reduced the flood insurance rates for buildings using 47 ‘freeboard’ (raising the occupied space by 1 to 2 feet above the Federal Emergency Management Administration’s 48 1-in-100-year flood zone). Future studies will explore the implications of amending New York City’s Building Code 49 to require freeboard for a wider range of buildings beyond hospitals, schools, utilities, etc. (ibid.). As the plan notes, 50 more extensive use of freeboard “can help property-owners manage risk, but may also change the character of 51 buildings and the streetscape” (ibid.). With carefully-formulated regulations, policymakers can more effectively 52 balance urban design considerations with the need to adapt to climate change. 53 54
ZERO-ORDER DRAFT IPCC WGII AR5 Chapter 8
Do Not Cite, Quote, or Distribute 38 25 July 2011
Other cities have made slower progress in adjusting their building regulations and housing strategies to reflect 1 climate change. Portland committed to participating in Oregon’s state-wide efforts “to ensure that building codes 2 support buildings that can adapt to higher temperatures, stronger storms, and other physical impacts of climate 3 change” (Portland 2009: 35). But a subsequent report noted that Oregon’s changes to the building code do not 4 address adaptation, so that Portland will instead address building adaptation in its own forthcoming Climate Action 5 Plan (Portland 2010: 25). The report identifies challenges to Portland’s building and energy climate strategy, such as 6 the “continued slump in new construction” that has delayed development of “any new policy or program efforts 7 about high-performance new construction” (ibid., p. 7). Chicago’s 2008 Climate Action Plan included the adaptation 8 strategy of "pursue innovative cooling," which will "seek out innovative ideas for cooling the city and encourage 9 property owners to make green landscape and energy efficiency improvements" (CCAP 2008: 52). By 2009, 120 10 green alleys were completed and 13,000 homes retrofitted; another 4 million square feet of green roofs have been 11 “planned or completed since 2008” (CCAP 2010: 2 and 10). But Chicago does not yet seem to have regulations to 12 manage climate-related impacts in the housing sector, and researchers noted that the Chicago Housing Authority had 13 not identified any infrastructure or operating costs that would be altered by climate change (Hayhoe et al. 2010: 99). 14 [check if other sources on this] 15 16 London and Melbourne’s adaptation plans discuss climate-related impacts on the housing sector, as well as detailing 17 extensive adaptation measures. London’s draft plan considers management strategies at city level, neighbourhood, 18 and building scale, which combine green infrastructure and housing interventions. For instance, building 19 management strategies can reduce heat island by incorporating green roofs and walls; planting trees to promote 20 summer shade; and avoiding high-glare facades and finishing (London 2010: 80). Approved in 2009, Melbourne’s 21 plan similarly combines housing, water, and green infrastructure strategies to promote cooling and long-term 22 adaptation. 23 24 [INSERT TABLE 8-3 HERE 25 Table 8-3: Adaptation measures – long-term (Melbourne).] 26 27 28 8.3.3.4. Water, Sanitation, Drainage, and the Larger Systems of which They are Part 29 30 By affecting the operations of water, sanitation, and drainage systems, climate change is likely to have far-reaching 31 knock-on impacts on a range of urban systems thereby affecting issues such as urban health and development 32 outcomes. Water and sanitation systems strongly shape household well-being and health, while exerting a wider 33 influence upon urban economic activities, energy demands, and the rural-urban water balance (Gober 2010, more 34 cites). Local government departments responsible for water supply and management must confront new climatic 35 patterns, major uncertainties, and a rapidly evolving knowledge base which have rendered stationarity obsolete as a 36 management principle (Milly et al. 2008). It has been suggested that water management is at the “centre of 37 adaptation to climate change,” but few cities have made concerted efforts to identify what adaptations are needed 38 and adapt key systems (Muller 2007: more cites). 39 40 Among the projected impacts of climate change are altered precipitation and runoff patterns in cities; changes in sea 41 level and water availability and quality; and rising uncertainty in the assumptions that underpinned planning and 42 investment in water systems. 43 44 Historical records that have formed the basis of water plans may no longer be appropriate but there may be no 45 downscaled or reliable climate projections to inform adaptation (Ziervogel et al. 2010). Cities may be increasingly at 46 risk of water stress, water-borne illnesses, and more intense or frequent flooding although the impacts (particularly 47 with respect to precipitation levels) are difficult to predict accurately (Ludwig and Moench 2009). Extreme events 48 whose frequency and/or intensity climate change is likely to be increasing can damage or destroy critical water, 49 sanitation, and storm-water infrastructure. Rising temperatures and/or decreased precipitation levels can have “a 50 double impact” in cities: greater evapo-transpiration and lowered recharge rates may together decrease total water 51 availability and increase the total end-user demand, so that “supply declines while demand increases” (Matthias et 52 al. 2007: 1032). Climate change can also affect water treatment by increasing turbidity, algal growth and by 53 reducing the efficacy of water treatment processes such as chlorination (Loftus, 2011). Urban water agencies face 54
ZERO-ORDER DRAFT IPCC WGII AR5 Chapter 8
Do Not Cite, Quote, or Distribute 39 25 July 2011
the two-pronged challenge of managing these impacts and with the uncertainty regarding water availability (Milly et 1 al. 2008, O’Hara and Georgakakos 2008, Fane and Turner 2010).. Another important consideration is the ecological 2 impacts of reduced water availability which would make meeting minimum ecological flow requirements more 3 challenging, and could have implications for water licence renewals (Zwolsman et al., 2009) and the provision of 4 ecosystem services, which in turn would affect opportunities for ecosystem based adaptation. 5 6 Provision for water, sanitation and drainage are obviously central to city’s economies and the welfare of their 7 population – and in many cities in low and middle income nations, existing systems are very vulnerable to extreme 8 weather-related events. As detailed above, in October-November 2007, the city of Villahermosa, Tabasco, suffered 9 the impact of floods caused by cold front Nº 4 and the associated heavy rainfalls. Damages and losses in the water 10 and sanitation system amounted to US$ 50 million. Direct damages in Villahermosa were US$ 26.5 million, which 11 represented 65% of the whole state of Tabasco. Both water supplies for human consumption and sewage system 12 were affected; water pumps, pipes, treatment plants were damaged. Besides, the flowing of wastes obstructed 13 stormwater drains (CEPAL, 2008) Currently the Hydraulic Integral Programme of Tabasco (PHIT) constitutes the 14 main institutional federal programme to manage and control in-city flooding through reinforcing river and open-air 15 sanitation canal walls and constructing and operating dams to divert river flows. 16 17 In this section, as in almost all the sections in this chapter, there are the difficulties in summarizing the key 18 adaptation issues for urban centres globally, when there are such large differences between (and often within) urban 19 centres in the quality and extent of provision for urban dwellers’ water needs and for sanitation and drainage. In 20 high-income nations and in some middle-income nations, virtually all the urban population is served by water piped 21 to the home of drinking quality 24 hours a day, by sewers or other systems of sanitation that minimize risks of faecal 22 contamination and by storm and surface drainage. As examples given below show, there are many urban centres in 23 such nations that face serious challenges for water from climate change. But their plans do not have to address large 24 deficits in provision for water, sanitation and drainage. They also have in place billing systems that generate a 25 substantial proportion of the funds needed for water provision and management and management systems. At the 26 other extreme there are a very large number of urban centres in low-income and middle-income nations with very 27 large deficits in provision for water, sanitation and drainage and with weak, under-resourced institutions (UN 28 Habitat 2003, 2006). In many urban centres, there are also the large proportion of the population living in informal 29 settlements and the authorities or companies responsible for water and sanitation provision may not be allowed to 30 work in such informal settlements. So in considering how to adapt water and waste water systems to climate change, 31 there are not only large differences between nations and cities in the scale and nature of likely impacts – but also 32 very large differences in the quality and extent of provision for water, sanitation and drainage and the quality and 33 resources available to local water and sanitation providers. 34 35 (Draw from WHO and UNICEF (2010) Progress on Sanitation and Drinking-water: 2010 Update, 60 pages on the 36 scale of the deficit in provision for water and sanitation?) 37 38 39 Impacts, vulnerabilities, and adaptation costs in urban water systems 40 41 For most urban centres in Africa, a high proportion in Asia and many in Latin America and the Caribbean, any 42 impacts on from climate change on rainfall and water supplies come to systems with very inadequate provisions for 43 water, sanitation and drainage (Hardoy et al 2001, UN Habitat 2003, other cites). United Nations estimates for 2000 44 suggest that for sub-Saharan Africa, 35-50% of the urban population lacks adequate provision for water. Most large 45 cities have more than half their population lacking piped connections to their house (some have less than 10%) and 46 the proportion unserved is generally higher in smaller urban centres. Urban poor groups unserved by piped water to 47 their home or yard also generally face higher prices for water (from kiosks, vendors or tankers) that also makes them 48 more vulnerable to water price increases (REFS). 50-60% of the urban population lacks adequate provision for 49 sanitation. Apart from South Africa, most urban centres in sub-Saharan Africa have no sewers – and for those that 50 do, the sewers only reach a small proportion of the population (eg Dar es Salaam the largest and most successful city 51 in Tanzania, with less than 10% of the population connected to sewers; for Nouakchott, 5%, for Bujumbura and 52 Conakry 7%) (REFS). Many cities in this region are growing rapidly but with water resources already poorly-53
ZERO-ORDER DRAFT IPCC WGII AR5 Chapter 8
Do Not Cite, Quote, or Distribute 40 25 July 2011
managed, with perhaps half the urban population lacking adequate water and sanitation provision (Hardoy et al 1 2001, UN Habitat 2003, Satterthwaite et al. 2007: 25, more cites). 2 3 For Asia, estimates for 2000 suggested 35-50 percent of the urban population lacking adequate provision for water 4 and 45-60 % lacking adequate provision for sanitation (UN Habitat 2003) 5 6 For Latin America and the Caribbean, the deficits are lower, in part because many cities have extended provision 7 and increased the proportion of their population adequately served – but 20 percent or more of their urban 8 population may still lack adequate provision for water and 20-30 percent lack adequate provision for sanitation (UN 9 Habitat 2003). 10 11 These deficits in provision are likely to have grown considerably since 2000. For most urban centres in Africa, 12 adaptation will require ‘leapfrogging’ over current approaches and meeting their future water needs “in a manner 13 that leaves them more resilient to the potential impacts of climate change” (Muller 2007, page ). This is also the case 14 for a high proportion in Asia and many in Latin America and the Caribbean. 15 16 In many rapidly-developing cities, climate change’s impacts on water supplies will likely interact with growing 17 population, growing demand and economic pressures to heighten water stress and increased negative impacts on the 18 natural resource base, which exacerbate the negative impacts on water quality and quantity. Caribbean nations are 19 urbanising with an expanding middle class, sharply raising the demand for water and increasing the associated 20 challenges of managing runoff, stormwater, and solid wastes (Cashman, Nurse and Charlery 2010). Aggravating 21 such water stresses, climate change could significantly reduce rainfall levels especially during the Caribbean’s 22 crucial rainy season (ibid., p. 57). 23 24 Water demand may be strongly influenced by factors other than climate change, and studies have found that certain 25 water systems, under some scenarios and short-term time frames, are not projected to experience negative impacts. 26 For instance, Chicago’s Metropolitan Water Reclamation District (MWRD) found that reduced precipitation due to 27 climate change would decrease pumping and general operations costs, since sewers will contain less rainwater in 28 drier seasons (Hayhoe et al. 2010: 103). MWRD is thus projected to save money until 2100, but as precipitation is 29 likely to increase afterwards so too will the costs of water management. In another inland city of Hamilton, New 30 Zealand, population pressure was found to be a more significant driver of water demand than climate change (Ruth 31 et al. 2007). But under high population scenarios, a small increase in temperature or decrease in rainfall would likely 32 create water shortfalls by 2030 (ibid., p. 1043). These cities’ water systems may not experience severe impacts as a 33 result of climate change in the short term, yet results may vary with longer time horizons, faster population or 34 economic growth, higher emissions scenarios, or other factors. 35 36 Climate change in arid or semi-arid regions may significantly constrain urban water supplies, especially over 37 longer time horizons. Cities in arid regions frequently “are on the cusp of severe water shortages”, although future 38 problems may be hidden by current unsustainable practices such as depriving in-stream flows, high-energy solutions 39 like desalination plants, or excessive groundwater extraction (Gober 2010: 148). Palestinians in the West Bank rely 40 mainly upon 2 overexploited groundwater aquifers, and rising sea levels will further reduce freshwater supplies by 41 promoting saltwater intrusion in the aquifers (Hassan et al. 2010). In the short term, the West Bank’s rising 42 population is more likely to stress water supplies than climate change. But the combination of population growth 43 and climate change “is likely to create a serious water crisis in the region” (ibid., p. 145). OTHER CITIES THAT 44 RELY ON OVER-EXPLOITING GROUNDWATER RESOURCES. LIMA AND LOSS OF GLACIER-MELT? 45 In many cities, climate change is likely to contribute both to increased risks of flooding and water stress, 46 necessitating adaptation plans to cope with a range of management challenges. Water availability in Mombasa is just 47 45% of the amount required, leading residents to drill boreholes that may promote salt-water intrusion into aquifers, 48 while sea-level rise may exacerbate the risks of salinization, flooding, and erosion (Kithiia and Dowling 2010: 271). 49 Mombasa also has many deficiencies in provision for water to homes and businesses (REFS) and still lacks a water 50 planning framework which could help to address its complex bundle of stresses (Kithiia and Dowling 2010). In 51 Shanghai, climate change is likely to promote flooding, salinization, coastal subsidence, and decreased water 52 availability. The city’s population of 17 million is projected to continue expanding, often within areas that are 53 “likely increasingly flood-prone” (de Sherbinin, Schiller, and Pulsipher 2007: 60). Groundwater depletion has 54
ZERO-ORDER DRAFT IPCC WGII AR5 Chapter 8
Do Not Cite, Quote, or Distribute 41 25 July 2011
contributed to land subsidence in these already vulnerable areas, reinforcing the water stresses and risks of erosion, 1 but Shanghai’s wealth and correspondingly greater adaptive capacity may help to manage these complex risks 2 (ibid.). 3 4 A few studies have sought to estimate the costs of adapting urban water and sanitation systems. In sub-Saharan 5 African cities, perhaps US$2bn-$5bn may be required annually to adapt water, wastewater, and drainage systems 6 (Muller 2007). Other research also suggests significant investments needed in low- and middle-income regions to 7 overcome current shortfalls in water and sanitation as well as to cope with climate change (Arnell 2009 more info?). 8 Findings suggest that the cost of adapting water supplies in San Diego may again be high, even under a short-term 9 time horizon of 2030 (O’Hara and Georgakakos 2008). San Diego currently utilises 9 reservoirs to meet 10-20% of 10 its water demand, importing the residual demand, and by 2030 the estimated adaptation costs of expanding reservoir 11 capacities reached hundreds of millions of dollars (ibid.). 12 13 14 Stormwater, drainage, and sewerage impacts 15 16 Climate change is likely to exacerbate the challenge of providing adequate drainage and sewerage in 17 underserved areas in many urban centres, while making such infrastructure ever more critical. 18 Drainage systems in many urban centres in low- and middle-income nations already struggle to cope with climate 19 variability: Dhaka’s drainage congestion, waterlogging, and poor management contributed to large flood damages in 20 1998 and 2004 (Alam and Rabbani 2007). The storm-water drainage and sewage systems in Dar es Salaam and 21 Mombasa were built in 1950, but are now extremely congested and inadequate (Kithiia 2011: 177). In many cities in 22 India, drainage, flood protection, and storm-surge systems also date from the pre-colonial or colonial era, leaving 23 many of them “dysfunctional or irrelevant” today (Revi 2009: 330). In turn, cyclones and storm surges can have a 24 “devastating impact” upon India’s mega-cities like Mumbai, million-cities including Surat and Bharuch, or cause 25 major bottlenecks in ports such as Kandla (ibid., p. 320). Cost-benefit analyses will need to consider whether to 26 repair and strengthen, relocate, or adopt other responses, so that these systems can withstand more intense or 27 frequent storms due to climate change (ibid.) 28 29 Mexico City is currently implementing a set of engineering works in the drainage system to prepare the city to cope 30 with floods mainly during rainy season. Along with this project, there is an emergency assistance group called 31 Unidad Tormenta Storm Unit enabled to provide prompt assistance when floods occur. These measures are part of 32 the adaptation agenda of Mexico City. <No papers or policy document have been found so far. Fernando will get 33 more info on this> 34 35 Caribbean cities are often subject to flash flooding, largely as a result of poor drainage and stormwater management, 36 and climate change may exacerbate the vulnerabilities of these low-lying and precarious areas (Vojinovic and Van 37 Teeffelen 2007). Urban areas usually have inadequate, short drainage channels; additionally, steep hillsides denuded 38 of vegetation frequently experience erosion and landslides after “almost any rainfall at all” (ibid., p. 213). Climate 39 change will likely increase the frequency and intensity of rainfall events in the Caribbean, where a combination of 40 structural and non-structural interventions may be needed to adapt (ibid.). To improve water management in St. 41 Maarten, Netherlands Antilles, the government recently initiated a stormwater modelling study and is developing a 42 flood warning system (ibid., p. 225). Other options under consideration include institutional adaptations (such as a 43 new decision-support framework, centralised GIS to enhance all infrastructure planning measures, and public 44 education), alongside structural improvements like improving the channel network and draining of areas with a high 45 groundwater table (ibid., p. 229). 46 47 Comparable problems have been observed in many cities of middle-income nations such as Mexico City and it can 48 be argued that heavy rainfalls associated to climate change will likely worsen the situation (Romero-Lankao, 2010). 49 For example, the southeast peri-urban interface of Mexico City became a chronic flood prone zone. Aragón-Durand 50 (2007) analysed flooding in the context of illegal urbanization in the south-eastern peri-urban interface of Mexico 51 City and found that flooding was the result of a complex interaction between urbanisation in an ex-lacustrine area, 52 permanent ecological deterioration and ground subsidence, poor sanitation –including the malfunctioning of the 53 main sewage canal- La Compañía Canal- and inadequate policy responses. Far from solving the flooding problem, 54
ZERO-ORDER DRAFT IPCC WGII AR5 Chapter 8
Do Not Cite, Quote, or Distribute 42 25 July 2011
short-term policy responses have created increasingly unsafe conditions for current vulnerable residents. So far no 1 adequate solution has been designed considering the whole socio-ecological context and technical-engineering 2 measures still dominate sanitation policy such as the piping of La Compañía Canal (Aragón-Durand, 2007) 3 Some studies have pointed to the need for adaptation measures for stormwater and drainage systems in the United 4 States and United Kingdom. An analysis of 3 cities in Washington State sought to assess future stream-flows and the 5 magnitudes of peak discharges, concluding that “concern over present [drainage] design standards is warranted” 6 (Rosenberg et al. 2010: 347). Adapting drainage infrastructure may help to cope with a changing rainfall regime, 7 since it is likely to diverge from current design standards, but findings were still tentative and require further 8 modelling (ibid.).Climate change was identified as one of the key drivers affecting Britain’s future sewer systems, 9 according to workshops with experts and a literature review (Tait et al. 2008). According to a model of urbanisation 10 and climate change impacts in an urban catchment, the volume of sewage released to the environment by combined 11 sewage overflow spills and flooding was projected to increase by 40% (ibid., p. 82). Possible responses included 12 optimising existing infrastructure performance, utilising emerging technologies, and developing new institutional, 13 planning, or legislative arrangements (ibid.). 14 15 16 Adaptation strategies for water 17 18 Major et al 2011 listed a range of cities that have begun to plan for and adapt water systems and other infrastructure 19 including Boston, London, Halifax (Canada), New York, Seattle and Toronto (in Rosenzweig, Solecki, Hammer and 20 Mehrotra 2011). But there is no evidence that developing such measures is commonplace. 21 22 Supply-side approaches to water shortages such as increasing reservoirs are frequently advocated, and Rotterdam 23 has developed strategies that simultaneously seek to enhance reservoirs, adapt to climate change, and promote urban 24 renewal (van der Brugge and de Graaf 2010). Online databases and other tools have also sought to inform adaptation 25 strategies amongst water planners in Cape Town (Ziervogel et al. 2010) and in the UK (Wilby and Vaughan 2011). 26 Demand-side approaches have been adopted in Seattle (Vano et al. 2010), though more water-stressed cities like 27 Phoenix have yet to embrace such stringent controls (Bolin et al. 2010). 28 29 In Mexico City, the government of the Federal District has launched two programmes: the Local Strategy of Climate 30 Action of Mexico City and the Programme of Climate Action of Mexico City (2008-2012). Some of the actions 31 suggested to address climate change in the water sector have been proposed many times since the 1950s, without 32 success, including decreases in water use and the restoration and management of both urban and rural micro-basins. 33 Other actions proposed to enhanced adaptation include monitoring of disasters, an early warning systems and 34 provision of disaster relief (Romero-Lankao, 2010) Since the strategy and programme mentioned above privilege 35 mitigation over adaptation, adaptation measures for the water sector have been conceived as too general and lack of 36 institutional commitment. 37 38 In cities where a proportion of the population currently lack adequate provision for water and sanitation, adaptation 39 will need to be integrated into plans to address these inadequacies and to incorporate into water plans the needs of 40 those ill-served or un-served. 41 42 In Durban, the importance of getting climate change adaptation within the water sector was recognized as a priority 43 – and the water sector is influential within the city government because of its importance in delivering development 44 benefits and also it is revenue-earning, well-resources and retains skilled staff (Roberts 2010). The water sector has 45 also shown an interest in developing its municipal adaptation programme (ibid). 46 47 An analysis of 21 draft Water Resources Management Plans (WRMPs) in the UK found that agencies usually 48 favoured supply-side measures to adapt to climate change (Charlton and Arnell 2011). Reservoirs were frequently 49 cited as key adaptations: for instance, Bristol Water noted that a new reservoir was the most sustainable means of 50 addressing supply-demand mismatches due to climate change (ibid., p. 246). Other proposed adaptations included 51 enhancing the inter-connections of water supply and inter-company transfers. The authors suggest that additional 52 demand-side interventions may be needed to cope with reductions in water availability, though some northern UK 53 regions may not face significant climate-related impacts (ibid., p. 247). Although based upon draft plans from 2008 54
ZERO-ORDER DRAFT IPCC WGII AR5 Chapter 8
Do Not Cite, Quote, or Distribute 43 25 July 2011
rather than implemented strategies, the study indicates some key trade-offs and portfolio of responses currently 1 under consideration. 2 3 Seattle has already utilised demand-side strategies to curtail water consumption, and findings suggest that these 4 measures will promote future resilience (Vano et al. 2010). The city currently serves over 1.3m people and has 5 utilised aggressive conservation measures, system savings, and price increases for water supply and wastewater 6 treatment linked to consumption levels (ibid., p. 265). Total water use has declined from 7.5 m3/s (171 mgd) in 1989 7 and is projected to remain under 6.6 m3/s (150 mgd) through 2050 (ibid.). A simulation exercise suggested the 8 system can withstand climate change-induced alterations in reservoir inflows, and the authors note that the “primary 9 reason” for such robustness is Seattle’s successful reductions in demand (ibid., p. 283). 10 11 Cape Town has also utilised water restrictions and tariffs, although it faces profound challenges in ensuring future 12 supplies (Mukheibir and Ziervogel 2009). According to the Department of Water Affairs and Forestry, Cape Town 13 will be the first major South African urban area where demand for water exceeds the potential yield (ibid., p. 278). 14 The city has responded by commissioning water management studies, which identified the need to consider stresses 15 including climate change as well as effects of population and economic growth (ibid.). Recent experiences with 16 climate variability have led to some improvements in water management. During the 2005 drought, the local 17 authority substantially increased water tariffs, and such tariff mechanisms may represent “one of the most effective 18 ways” to promote efficient water usage (Mukheibir 2008: 1271). Additional measures may include water 19 restrictions; reuse of grey water; consumer education; or technological solutions such as low-flow systems or dual 20 flush toilets (ibid., pp. 1271-2). Looking at the 2011 State of Cities report (by South African Cities Network) it 21 indicates: “In Cape Town, the number of households in informal dwellings increased by almost 100 000. This was 22 the steepest growth rate in the country, reflecting strong urbanisation.” Pg 50 “Despite the number of informal 23 settlements, few households in the cities have only rudimentary sanitation. In 2009 the proportion of households in 24 the Gauteng metros and eThekwini with basic sanitation was only 1% compared to 6% in Cape Town and Nelson 25 Mandela Bay, and 3% in the secondary cities” pg 53 “Just over one in ten metro households have no access to piped 26 water (off or on-site) compared to nearly one in five in the secondary cities. eThekwini is somewhere in between, 27 perhaps because it includes a sizeable rural catchment.” Pg 55. 28 29 To expand its reservoir capacity, Rotterdam developed plans that combine the goals of adaptation and urban renewal 30 (van der Brugge and de Graaf 2010). Floods in 1998 exposed the inadequacies of existing water infrastructure, 31 particularly in the context of climate change, and municipal water authorities committed to expand retention 32 capacity by 900,000 m3 in 2050 (ibid., p. 388). New designs and water planning frameworks were developed to 33 realise these goals. As a contribution to the 2005 International Architecture Biennale (with the theme of ‘The 34 Flood’), engineers from the Public Works Department collaborated with designers from the Urban Design and 35 Planning Department to create Rotterdam Water City 2035. The proposal responded to a possible 6m sea-level rise 36 by mixing economic activities with water-based adaptive designs, including ‘water retention squares’ and green 37 roofs; floating houses; and networks of channels (ibid., p. 389). Water retention can create a more attractive city 38 centre, supporting urban renewal as well as resilience to climate change. These provide an example of how 39 municipalities can creatively redesign urban environments while developing concrete water plans to meet the 40 challenge of adaptation. 41 42 Rainwater harvesting can enhance water supplies, particularly in low-income areas, but scaling-up may be a 43 challenge. In Sydney, rainwater harvesting has “barely begun” although new houses are required under a 2004 law 44 to save 40% of reticulated water for use in gardens and toilets (Warner 2009: 235). Subsidies are being granted to 45 install household roof tanks, with over 36,000 rebates issued to date, and there is scope for expanding the 46 programme (ibid., p. 239). Many low-income Caribbean households rely on rainwater collection systems for 47 domestic use, yet upper-income groups in Barbados have voiced resistance to the practice (Cashman, Nurse, and 48 Charlery 2010: 60). Extending the existing communal collection and distribution systems would require community 49 financing or governmental interventions, as well as overcoming such resistance (ibid.). 50 51 Information-sharing has supported urban water adaptation in the UK and South Africa, but steps may be needed to 52 ensure data are relevant to local stakeholders (Ziervogel et al. 2010). In Cape Town, researchers conducted 53 workshops on adaptation with local water managers and produced an online toolkit ‘Climate for Water’ 54
ZERO-ORDER DRAFT IPCC WGII AR5 Chapter 8
Do Not Cite, Quote, or Distribute 44 25 July 2011
(www.c4w.org.za). The toolkit linked to a range of forecasts and sought to train stakeholders about climate change, 1 but the authors note that “it was not adopted as a regular source of information and so had limited success” 2 (Ziervogel et al. 2010). More effective communication may require improving water managers’ education and 3 awareness of climate change, while research funders and forecast producers “need to be aware of the changing and 4 developing needs of users” (ibid., p. 552). Online tools have been developed for British water managers, including 5 the Water Research Foundation’s online Climate Change Clearinghouse9 (Wilby and Vaughan 2011). Additionally, 6 the Department for Communities and Local Government (DCLG) and the Department of Environment, Food and 7 Rural Affairs (Defra) published tables of prescriptive allowances for engineering design, such as “add a 20% 8 sensitivity allowance to daily rainfall, peak river flow volumes and urban drainage volumes to account for climate 9 change by 2050” (quoted in ibid., p. 274). General guidance on adaptation has also been disseminated through 10 online checklists or toolkits.10 11 12 [INSERT FOOTNOTE 9 HERE: http://www.theclimatechangeclearinghouse.org/Intro/default.aspx.] 13 14 [INSERT FOOTNOTE 10 HERE: See, for instance, the Greater London Authority’s Adapting to Climate Change: 15 A Checklist for Development (2005) and the Nottingham Declaration Action Pack 2009 (cited in Wilby and 16 Vaughan 2011: 275).] 17 18 Research in Phoenix, Arizona, has sought to improve water forecasting data and inform adaptation interventions 19 (Gober et al. 2010). Simulations explored how water usage may be reduced to achieve safe yield while 20 accommodating future growth; decision-makers may also require methods to assess the risk and uncertainty 21 associated with climate change (ibid.). The rapidly-expanding desert city is projected to reach 11 million people by 22 2050, with most growth in peripheral areas that depend entirely on groundwater (Bolin et al. 2010: 261). Phoenix 23 instituted groundwater restrictions under the 1980 Groundwater Management Act, while also drawing upon the 24 Sale/Verde and Colorado Rivers (ibid.). But usage remains high (per capita consumption has stagnated at 220 25 gallons per day), and water pressures may be exacerbated by reduced precipitation, rising power and water demands 26 due to warmer temperatures, and reduced river runoff levels as a result of climate change (ibid., p. 270). Reducing 27 per capita water use may be achieved through urban densification, increased water prices (which remained less than 28 half the 2007 unit cost of water in Seattle), and water conservation measures (ibid., p. 277). Another study agreed 29 that stringent demand and supply policies can forestall “even the worst climate conditions and accommodate future 30 population growth, but would require dramatic changes to the Phoenix water supply system” (Gober et al. 2010: 31 370). 32 33 New technologies and transfer projects could help to address North China’s water shortages, while improved flood 34 and disaster preparedness may be needed in southern and eastern cities (Liu and Deng 2011). Over 400 of China’s 35 669 cities experienced water shortages in 2006, according to the Ministry of Water Resources (cited in ibid., p. 189). 36 Climate change may exacerbate Beijing’s water shortages, for example, but the South-to-North Water Transfer 37 Project will add 1 x 10⁹ m3 fresh water supplies to Beijing when completed (ibid.). Adapting China’s southern 38 coastal cities may require typhoon and flood warning systems, improved pollution controls, rainwater harvesting, 39 and curtailing groundwater exploitation to prevent saltwater intrusion (Shen 2010: 1068). 40 41 The local government of Quito has formulated a range of adaptation plans to address water shortages (Hardoy and 42 Pandiella 2009). Quito is projected to experience reduced freshwater supplies as a result of glacier retreat and other 43 impacts of climate change. Among the municipality’s responses are developing dams; encouraging a culture of 44 rational water use; reducing water losses; and developing mechanisms to reduce water conflicts (ibid.). However, 45 Quito has not sought to incorporate community participation in planning and implementation (ibid.). Participatory 46 water planning has occurred elsewhere in Latin America: stakeholders in Hermosillo, Mexico, identified and 47 prioritized specific adaptations such as rainwater harvesting and water-saving technologies (Eakin et al. 2007). 48 49 While only a small-scale process in 2003, Hermosillo’s experience suggests that cities can utilise proactive, 50 participatory strategies to enhance resilience in the water sector. 51 52 The linkages between provisions for water, sanitation and drainage and other sectors means that water adaptation 53 plans will need to work with a range of partners, consider broader development goals, and identify tensions or trade-54
ZERO-ORDER DRAFT IPCC WGII AR5 Chapter 8
Do Not Cite, Quote, or Distribute 45 25 July 2011
offs. Water and energy sectors are frequently linked and problems may ensue if they are considered separately, such 1 as utilising water from distant, low-quality sources that require high levels of energy for conveyance or treatment 2 (Gober 2010: 145). Adaptation in the water sector will requiring identifying such trade-offs, as well as working with 3 multi-partner networks, adopting low-regret anticipatory solutions, and forging multi-partner networks (Wilby and 4 Vaughan 2011). Long-term adaptation strategies still need to meet local developmental needs, improve water 5 management, and address the impacts of climate change (Mukheibir 2008: 1274). In addition, water adaptation 6 planning will need to be developed in concert with green infrastructure strategies (discussed in 3.3.7 below). 7 Integrated strategies can minimise possible conflicts between water-intensive parks or gardens, support local 8 industries, and ensure equitable access to water in cities confronting climatic change. 9 10 11 8.3.3.5. Electricity and Other Energy Sources 12 13 Urban economic activities and infrastructure and most urban households rely heavily on power supplies so 14 any disruption or unreliability in provision due to climate change may have far-reaching consequences upon 15 other sectors. Power supplies are also important in for many other urban activities including households’ income 16 generation possibilities, education, health, leisure (Halsnaes and Garg 2011: 999-1000). 17 18 The IPCC fourth assessment recognized that the energy sector is “particularly sensitive to climate change” (IPCC 19 4AR, quoted in Mideksa and Kallbekken 2010). Zimmerman and Faris 2010 describe how in New York, electricity 20 provision poses a number of challenges to adaptation. There are around 24 power plants of various size operating 21 within the city and over a dozen more proposed (as of 2005). Transmission lines that service the city are relatively 22 concentrated and provide little flexibility should one of these lines be compromised. Most infrastructure in the city 23 relies on the city’s power grid for energy, thus if it fails the other infrastructures that are dependent on it fail. The 24 facilities that produce and distribute energy have traditionally been located in low-lying areas and are difficult and 25 expensive to relocate. In addition, many power plants need to be located near the water to accommodate fuel 26 deliveries, the use of water for cooling and steam generation, and water discharges, making relocation to areas not 27 susceptible to flooding virtually impossible. These facilities are also concentrated in a relatively few locations within 28 the city increasing the impacts of a climate hazard occurring at one location. The electric power industry is subject 29 to a variety of regulations which presents a challenge to incorporating any new demands, such as climate change 30 information, into its portfolio. Limited resources and multiple demands on those resources present another challenge 31 to meeting energy needs. This situation is not only specific to New York City but is also common to the energy 32 sector in general, occurring in many other urban areas as well. 33 34 The 2005 hurricanes alone cost the US energy industry about $15 billion (cited in Mideksa and Kallbekken 2010: 35 3580). Further studies are needed of the costs of adapting power infrastructures to withstand the more extreme 36 weather due to climate change (Mideksa and Kallbekken 2010). Adaptation may also be necessary to cope with 37 more intense peak demand for electricity during heat waves. 38 39 In turn, cities are vulnerable to any damage or disruption to the larger systems on which they depend such as “water 40 supply and treatment, transport and electricity (and thus everything that depends on electricity, including lighting, 41 pumping and communications)” (Huq, Kovats, Reid, and Satterthwaite 2007: 3). Past experiences with power 42 outages may indicate some of the knock-on effects: New York City’s blackout of 2003 lasted 28 hours and halted 43 electricity, mass transport, surface vehicles due to signalling outages, “and water supply for a much longer period” 44 (Rosenzweig and Solecki 2010: 20). Research on climate change impacts in Hamilton, New Zealand, suggests that 45 disrupted electricity supplies may also disrupt water supplies and treatment; interrupt traffic signals (during extreme 46 events); and affect public health provision (Jollands et al. 2007: 472). The interrelations between energy and other 47 sectors suggests the need for an integrated approach in understanding vulnerability and shaping appropriate 48 responses (Gasper, Blohm and Ruth 2011 more cites) 49 50 With the literature on energy and climate change focusing on mitigation concerns, “relatively few assessments in the 51 energy sector focus on adaptation issues” (Mdluli and Vogel 2010: 206) and “research on the impacts of climate 52 change on the energy sector has been surprisingly scant” (Mideksa and Kallbekken 2010: 3580). 53 54
ZERO-ORDER DRAFT IPCC WGII AR5 Chapter 8
Do Not Cite, Quote, or Distribute 46 25 July 2011
The costs of adapting the energy sector may be substantial but there are few estimates of costs. The UNFCCC 1 did not estimate the costs of adapting the energy sector (Fankhauser 2009: 26). 2 One important component of adaptation will be “private autonomous measures” that “will dominate the adaptation 3 response as people adjust their buildings, [or] change space-cooling and -heating preferences...” (ibid., p. 27). 4 5 In the State of Veracruz, Gulf of Mexico, there are cities such as Coatzacoalcos and Minatitlan surrounded by oil, 6 gas and petrochemical plants and that can be affected by the impact of weather-related events. Even though there is 7 a growing concern on the potential impact climate change and extreme weather events will have in the oil industry 8 in Canada, US and Mexico and how floods and the sea level rise will disrupt oil, gas and petrochemical provisions 9 few climate change adaptation studies have been undertaken. Huang (2008) explores the differential impact climate 10 change will have on the various oil activities: exploration, production processing, transportation and storage and 11 states that adaptation measures must be sensitive to the oil cycle. More research on this regard for Mexico is needed 12 in order to inform oil companies (PEMEX, Mexico Oil Company) on how to adapt its facilities and activities to 13 climate hazards. <To developed in more detail if it´s necessary> 14 15 16 8.3.3.6. Adapting Transport and Telecommunications 17 18 Cities depend on road and often rail, air, waterway and subway transport systems for their daily functioning – 19 moving people and goods in and around the city and its surrounds and to and from other locations. Many cities 20 depend on (often large) commuter fields and the transport systems that support these and allowed these to develop. 21 The increased dependence of prosperous cities on regional, national and international supply chains (80 percent of 22 the food consumed in London is imported (GLA) that in turn rely on reliable transport systems so a consideration of 23 transport for urban centres needs to consider their transport links to locations outside their boundaries as well as 24 within them. 25 26 A paper that highlights the cost of inaction on climate change noted that “about 60, 000 jobs and US$ 3 billion 27 annually depend directly on the movement of goods in the Great Lakes–St. Lawrence route in the United States. 28 Drought could lower water levels, requiring additional dredging at an annual cost of US$ 85 to US$ 142 million, 29 simply to maintain shipping lanes. Climate-induced changes in water levels and the associated overall decreases in 30 the connectivity of the shipping network will cost the manufacturing sector upward of US$ 850 million per year. 31 The impacts will be higher prices, reduced income and job losses. Estimates for Michigan and Illinois suggest that 32 for every 10 jobs lost as a direct result of these impacts, another 5–7 are lost elsewhere in these states’ economies. 33 And because this is one of the manufacturing centres of the United States, the ripple impacts will be felt in the rest 34 of the nation” (Ruth 2010: 390). 35 36 Most large and successful cities have also spread spatially with the expansion of transport systems supporting a 37 decentralization of the workforce and businesses, many of which depend on a well-functioning transport system. 38 Daily deliveries are crucial to support a range of economic activities: “manufacturing and service sectors depend 39 heavily on highly reliable delivery of goods and services”, while markets “readily penalize cost increases and delays 40 in delivery” (Ruth 2010: 390). The economic importance of transport systems has increased with the rise of just-in-41 time delivery methods, heightening the risk of losses due to extreme weather (Hunt and Watkiss 2011: 14). 42 43 The daily functioning of most transport systems is sensitive to weather extremes, such as extreme precipitation, 44 temperature, winds, visibility, and, for coastal cities, sea level (HIGH TIDES?) (Love, Soares, and Püempel 2010). 45 Such climate-related sensitivities in transport may produce severe delays and affect the provision of emergency 46 services or evacuation procedures. Melbourne’s adaptation plan notes that intense storms and wind may lead to 47 blocked roads and disrupted traffic lights, trains, and trams (Melbourne 2009: 60). The extent of the impact will 48 depend largely “on the timing, duration, and extent of the disruption” and may be “further exacerbated by any 49 additional compounding factors such as large-scale events, power disruptions or emergency situations, such as 50 multiple deaths or injuries” (ibid.). 51 52 The direct impacts on transport systems of extreme weather are often more easily assessed than the indirect impacts. 53 Studies have often examined the direct impacts of flooding upon transport infrastructure, but the indirect costs of 54
ZERO-ORDER DRAFT IPCC WGII AR5 Chapter 8
Do Not Cite, Quote, or Distribute 47 25 July 2011
delays, detours, and trip cancellation “may also be substantial” (Koetse and Rietveld 2009: 209). During Mumbai’s 1 2005 floods, most city services were shut down for 5 days without contact via rail, road or air and over 1000 people 2 died (Revi 2009: 320) 3 4 The literature on transport and climate change focuses more on mitigation11 than on adaptation and as yet, transport 5 gets relatively little attention within the urban adaptation literature (Hunt and Watkiss 2011). Existing studies on 6 climate change impacts are often limited to the short-run demand side, particularly in passenger transport (Koetse 7 and Rietveld 2009). In addition to adapting road transport, it will be necessary to ensure bridges, railway cuttings, 8 and other hard infrastructure are resilient to climate change over their lifespan (Jaroszweski, Chapman, and Petts 9 2010: 332). 10 11 [INSERT FOOTNOTE 11 HERE: See Section 3.6 on the co-benefits that may be created by combining mitigation 12 and adaptation in the transport sector.] 13 14 Most cities in low- and middle-income nations are still developing their transport systems, especially in the larger, 15 more successful and more rapidly growing cities. Few studies have examined transport adaptation for these cities. 16 For instance most cities in Asia are still developing their transport networks and these are often at risk from extreme 17 weather events (Regmi and Hanaoka 2011: 23). India’s transport and telecommunications networks are still being 18 built, and adaptation as well as mitigation measures “will need to be integrated within the design of these systems” 19 (Revi 2009: 329). In low-income and many middle-income nations, there are major deficits in transport and other 20 infrastructure and resilience to climate change usually depends on addressing these deficiencies (Dodman and 21 Satterthwaite 2009). In addition, in reviewing available literature on the vulnerability of urban transport systems to 22 climate change, there is a far more extensive and detailed literature on this topic in high-income nations, even as 23 these have less than a quarter of the world’s urban population. 24 25 Incorporating adaptation measures during the planning phase may be easier than after construction is completed. 26 EVIDENCE FOR THIS? 27 28 Transport and other urban infrastructure networks are often interdependent and located in close physical proximity 29 to one another (Kirshen, Ruth and Anderson 2008). Yet only a few assessments have jointly considered the impacts 30 upon transport and other associated sectors (Hayhoe et al. 2010 for Chicago; Kirshen, Ruth, and Anderson 2008 for 31 Boston). Implementing adaptation strategies in the transport sector requires “coordination at national, regional, and 32 local levels”, since climate change impacts are widespread and extend across scales (Regmi and Hanaoka 2011: 39). 33 34 Adaptation will require transport planners to account for climate uncertainties, utilise a whole-of-life approach to 35 managing infrastructure, and constantly update risk assessments (Love, Soares, and Püempel 2010: 144). An 36 interdisciplinary approach can incorporate not only changing meteorological hazards, but also consider the social 37 and political values and governance that can shape more resilient transportation systems (Jaroszweski, Chapman, 38 and Petts 2010). 39 40 Adapting roads. Climate change may increase the costs of maintaining and repairing road transport networks. For 41 instance, a study in Chicago indicated….. (Hayhoe et al. 2010). To adapt road networks, transport planners are 42 beginning to reassess maintenance costs and traditional materials. Choice of materials will need to reflect local 43 climatic conditions: stiffer bituminous binding materials can help cope with rising temperatures, but softer bitumen 44 may be appropriate in colder regions (Regmi and Hanaoka 2011: 28). However, current cost considerations may 45 impede the use of adaptive materials. For instance, the Chicago Department of Transportation (CDOT) considered 46 whether to use more permeable, adaptive road materials instead of asphalt and concrete (Hayhoe et al. 2010: 104). 47 CDOT rejected the adaptive materials because of higher cost, although it recognised costs may fall with greater 48 economies of scale as worldwide demand rises for such materials (ibid.). Meanwhile, Chicago’s road maintenance 49 costs are expected to rise by the end of the century, due to rising average temperature and more severe rainfall in 50 winter and spring12 (ibid., p. 102). 51 52 [INSERT FOOTNOTE 12 HERE: Road maintenance costs may vary widely, depending upon the season, local 53 context, and future climate scenarios. In Hamilton, New Zealand, changes in rainfall were projected to increase 54
ZERO-ORDER DRAFT IPCC WGII AR5 Chapter 8
Do Not Cite, Quote, or Distribute 48 25 July 2011
repair costs in spring and winter, but reduced rainfall in spring and autumn partly balanced out the cost; results 1 depend upon the scenario and further investigation was recommended (Jollands et al. 2007: 466).] 2 3 Colder regions may enjoy increased opportunities for developing road networks or ports due to loss of sea ice, but it 4 may also be a costly challenge to adapt these regions’ transport networks. Estimates for Alaska, while not broken 5 down by rural-urban areas, found that projected climate change impacts could add 10-20% to infrastructure costs by 6 2030 and 10-12% by 2080 (Larsen et al. 2008: 453).13 The additional costs are relatively higher in the short run, 7 because agencies have not had as much time to adapt infrastructure to changing conditions. But strategic design 8 adaptations had strong potential to reduce extra costs by 2080, when adaptation could save between 10-45% of the 9 costs due to climate change (ibid.). For industries and communities in Northern Canada, reduced freshwater-ice 10 levels may create economic benefits such as longer shipping seasons (Prowse et al. 2009: 279). Lost sea ice could 11 also promote new seaports in marine environments, but inland towns may require sizable investments in land-based 12 roads to replace winter ice roads that formerly utilised small lakes and stream networks (ibid.). More generally, 13 thawing of the ground can result in instability and major damage to roads, infrastructure, and buildings (ibid.). 14 Techniques to reduce ground disturbance, databases of at-risk infrastructure and buildings, and ongoing monitoring 15 are amongst the key adaptation measures in cold regions (ibid. MORE CITES) 16 17 [INSERT FOOTNOTE 13 HERE: According to the sectoral breakdown of additional climate-related costs by 2030, 18 about 25% were for roads, 24% for airports, and 8% for harbours (ibid.).] 19 20 Adapting surface and underground railways: Few studies have examined the effects of climate change on 21 railways, but weather-related rail failures may be caused by high temperatures, icing, and storms (Koetse and 22 Rietveld 2009: 212). Underground transport systems are specific to urban areas and may have “particular 23 vulnerabilities related to extreme events, with uniquely fashioned adaptation responses” (Hunt and Watkiss 2011: 24 14). Heat impacts are often significant in underground railways, as these systems are gradually warming due to 25 engine heat, braking systems, and increased passenger loads (Love, Soares, and Püempel 2010: 137). According to 26 the Greater London Authority, the Underground can already reach temperatures 11°C in excess of ambient 27 temperature above ground (cited in ibid.). To cope with increasing frequency of hot days due to climate change, 28 “substantial investment” in ventilation or cooling may be necessary (ibid.). New York City’s subways may also be 29 vulnerable to climate change, as some are located in coastal or river floodplains, and the system’s age, fragmented 30 ownership, and current overcapacity may augment the challenge of adaptation (Zimmerman and Faris 2010: 69-70). 31 New York already has installed pumps throughout the subway system, which helped to cope with severe floods in 32 August 2007 during the morning commute (ibid., p. 70). 33 34 Additionally, above-ground railways can be disrupted by rising temperatures and other impacts of climate change. 35 Extreme weather has already disrupted some railways: in winter 2006, high water levels in the Gothenburg area 36 submerged railroad tracks and landslides damaged embankments (Lindgren, Jonsson and Carlsson-Kanyama 2009). 37 Floods in Mumbai. During the 2003 heatwave in the UK, buckled rails and large delays ensued with an economic 38 cost of at least £750,000 in the 4 railway sectors around London (Love, Soares, and Püempel 2010: 137). Rail 39 systems that have struggled to cope with existing climate variability may need considerable investment to be able to 40 withstand changes in extreme events and higher temperatures due to climate change. 41 42 Railway systems may be more vulnerable to climate variability and change than the road system, as the latter can 43 more easily redirect traffic during extreme weather events (Lindgren, Jonsson and Carlsson-Kanyama 2009: 175). 44 The costs of delays and lost trips due to extreme weather events were analysed in Boston (Kirshen, Ruth and 45 Anderson 2008) and in Portland (Chang et al. 2010). In both cities, the studies found the costs would be small 46 relative to the damages upon infrastructure and other property, as these mature urban areas have a large number of 47 transport networks and trips (ibid.).14 Portland’s nuisance flooding is still likely to increase, and the authors suggest 48 that floodplain restoration, use of porous pavements, or detention ponds may all help adapt to climate change 49 (Chang et al. 2010: 947). 50 51 [INSERT FOOTNOTE 14 HERE: In Hamilton, New Zealand, future road repair costs and vehicle trips were found 52 to be driven more by population growth than the impacts of climate change (Jollands et al. 2007); however, this 53 study only examined the impacts of gradual climate change, not extreme events.] 54
ZERO-ORDER DRAFT IPCC WGII AR5 Chapter 8
Do Not Cite, Quote, or Distribute 49 25 July 2011
1 But research in some flood-prone cities suggests that more stringent construction standards, design parameters, or 2 even relocation may be needed to adapt transport systems. In Durban, “it may be necessary to revise road 3 construction standards and avoid routes at high risk of flooding” (Roberts 2008: 531). Coastal road adaptation may 4 require strengthening barriers, increasing design parameters to cope with sea-level rise, or realigning existing roads 5 to a higher location (Regmi and Hanaoka 2011: 28). In a study in Portland, 4 out of 5 surveyed bridges and 6 roadways were lower than the current 100-year flood water surface elevation and nuisance flooding was increasingly 7 likely (Chang et al. 2010). Possible adaptation strategies in Portland may include restoration of floodplains, utilising 8 porous pavements, or detention pools (ibid.). Before implementing a Bangladeshi transport project, a study found it 9 was economically viable to raise the road embankment height from 0.5 to 1m to protect from flooding (cited in ibid, 10 p. 29). check if urban Much of central Mumbai is built on landfill (as the area was originally seven islands); the 11 landfill areas are prone to flooding, but they contain the main train stations and train lines as well as large 12 populations and a large part of the city’s economy (de Sherbinin, Schiller, and Pulsipher 2007). Rising sea levels 13 may cause shifts at the sub-surface level of landfill areas and structural instabilities (ibid., pp. 49-50). 14 15 Hundreds of millions of urban dwellers live in informal settlements that have inadequate or no provision for all-16 weather roads and paths and supporting infrastructure (for instance storm and surface drainage) and public transport 17 services. A high proportion of these settlements are also in locations that are at risk from extreme weather – for 18 instance floodplains or steep slopes. So poor transport and infrastructure, hazardous locations, and lack of 19 preparedness often combine to heighten these settlements’ vulnerabilities to disaster. By damaging infrastructure 20 and contributing to more intense or frequent extreme events, climate change may only exacerbate these risks in low-21 income settlements (IPCC 2007). 22 23 Dense informal settlements frequently lack the roads and pathways within the settlement and connection to the 24 wider road system for emergency vehicle access and rapid evacuation. For instance, informal settlements in 25 Chittagong have extremely narrow roads so that “the ambulance and fire services cannot enter most of these 26 neighbourhoods, thus exacerbating the existing health and fire risks at household level” (Rahman, Haughton, and 27 Jonas 2010: 572). Roads in Lagos’s informal settlements are often poorly maintained and lack all-weather surfaces, 28 so that a 2006 resident survey ranked roads second to drainage in terms of needed facilities (Adelekan 2010: 441). 29 Evacuations in low-income areas may also be hampered by hazardous locations, prevailing insecurity, and 30 inadequate governance and infrastructure. Following the 2003 and 2006 floods in Santa Fe, Argentina, the lack of 31 information and official evacuation mechanisms prevented a timely response while some low-income residents 32 chose to stay in their homes in order to protect these and their possessions from looters (Hardoy and Pandiella 2009: 33 210.). Details of Katrina/other evacuation problems in higher-income cities? Evidence of community-based 34 responses that have facilitated evacuation? Details from Surat study? 35 36 Low-income residents can also be profoundly affected by transport disruptions after extreme weather events, which 37 can damage critical public transit links, prevent access to work, and heighten exposure to health risks. Interviews in 38 Georgetown, Guyana, found that poorer households mainly rely on public transport and their limited transport 39 access during floods made them more likely to lose time from work or school, as compared to wealthier households 40 (Linnekamp, Koedam, and Baud 2011). Better-off households were more likely to possess their own vehicles, while 41 poorer households rarely owned cars, waded through floodwaters in bare feet, and were thereby exposed to 42 waterborne pathogens (ibid.). Past studies have also suggested that urban women are more likely than men to walk 43 or utilise public transport (World Bank 2010: 17), so that the gendered impacts of transport disruptions may merit 44 greater consideration. 45 46 Telecommunications: In Alaska, telecommunications towers are already settling due to warming permafrost, and 47 United Utilities has sought funds for its cost overruns in the Yukon- Kuskokwim Delta (Larsen et al. 2008: 444). 48 New York City’s communication equipment is vulnerable to climate impacts: cell towers may be in danger of 49 toppling due to strong winds, or electrical support facilities may be flooded (Zimmerman and Faris 2010: 74). The 50 authors suggest that adaptation may require moving sensitive electrical equipment to avoid floods, or strengthening 51 cell tower construction (ibid.). 52 53 54
ZERO-ORDER DRAFT IPCC WGII AR5 Chapter 8
Do Not Cite, Quote, or Distribute 50 25 July 2011
8.3.3.7. Green Infrastructure and Ecosystem Services within Urban Adaptation 1 2 In recent years, discussions on green infrastructure and its application in and around cities has begun to 3 consider its role in climate change adaptation. ‘Green infrastructure’ denotes urban ecological features, ranging 4 from wetlands to forests, that provide critical services such as purifying water, cleansing air, and moderating climate 5 (Newman 2010). The Millennium Ecosystem Assessment (REF) noted the contribution of ecosystem services to 6 provisioning (eg food including game and seafood, wild crops and water, energy – hydropower and biomass, 7 pharmaceuticals), regulating (control of climate and disease, waste composition), supporting (nutrient cycles, seed 8 dispersal and crop pollination) and cultural (spiritual and recreational benefits). 9 10 Ecosystem based adaptation (EBA) is defined as “the use of biodiversity and ecosystem services as part of an 11 overall adaptation strategy to help people to adapt to the adverse effects of climate change. Ecosystem‐based 12 adaptation uses the range of opportunities for the sustainable management, conservation, and restoration of 13 ecosystems to provide services that enable people to adapt to the impacts of climate change. It aims to maintain and 14 increase the resilience and reduce the vulnerability of ecosystems and people in the face of the adverse effects of 15 climate change. Ecosystem‐based adaptation is most appropriately integrated into broader adaptation and 16 development strategies.” (AHTEG 2009 pg 41).15 17 18 [INSERT FOOTNOTE 15 HERE: A group established by the Secretariat’s office on the Convention on Biological 19 Diversity (CBD) to provide biodiversity‐related information to the United Nations Framework Convention on 20 Climate Change (UNFCCC).] 21 22 In particular, urban green spaces can facilitate cooler microclimates and reduce surface water runoff, with important 23 potential to adapt to climate change (Gill et al. 2007). (Cross reference to cites on urban health island). Other key 24 ecosystem services in cities may include nutrient retention, habitat for diverse biota, and “a sense of place” (Grimm 25 et al. 2008: 759). In urban areas lacking the resources for expensive ‘grey infrastructure’ solutions, adapting green 26 infrastructure may represent a ‘no-regret’, more cost-effective intervention (Kithiia and Lyth 2011). But green 27 infrastructure is not so much a replacement for conventional infrastructure as a key part of infrastructure design and 28 management that enhances urban resilience. It may also create opportunities for income-generation, as demonstrated 29 by Durban’s community ‘treepreneurs’ rehabilitating degraded forest ecosystems (Roberts 2010: 410-1).16 30 31 [INSERT FOOTNOTE 16 HERE: See below for additional discussion of the Greening Durban 2010 programme.] 32 33 Although green infrastructure can enhance urban resilience, many ecosystem services are themselves 34 vulnerable to climate change. Mombasa will likely experience more variable rainfall as a result of climate change, 35 so that initiating and expanding green infrastructure may become more difficult (Kithiia and Lyth 2011). Street trees 36 in British cities may be increasingly prone to heat stress and to attacks by pests, including non-native pathogens and 37 pests that could survive for the first time under warmer or wetter conditions (Tubby and Webber 2010). Dense 38 coastal cities have transformed pre-existing flows of water, energy, and materials—leading to degraded ecosystems, 39 greater exposure to extreme weather events, and in turn heightened vulnerabilities to climate change (McGranahan, 40 Balk, and Anderson 2007). Section (a) briefly reviews the climate-related vulnerabilities of green infrastructure, but 41 most studies are in cities in high-income nations that may have greater adaptive capacity and less severe ecosystem 42 pressures than those facing cities in low and middle-income nations 43 44 Few adaptation plans have prioritised green infrastructure, and water-stressed cities may face tensions in 45 seeking to reduce water use while also promoting resilient ecosystems. (Mention here cities in arid/low rainfall 46 regions where much water demand is for gardens, parks and golf clubs with species that are not indigenous). Some 47 cities have taken steps to enhance green infrastructure (section b), though often without an explicit consideration of 48 climate change. Green roofs have recently spread in many cities (section c). But many policy-makers have yet to 49 connect green infrastructure with climate change adaptation, favouring ‘hard engineering’ solutions instead (Kithiia 50 and Lyth 2011, more cites). Additionally, water-constrained cities may face “critical tradeoffs regarding whether to 51 conserve scarce water resources used for irrigated landscaping at the expense of higher night-time temperatures due 52 to urban heat island effects” (Gober 2010: 146, also Gill et al. 2007: 128). 53 54
ZERO-ORDER DRAFT IPCC WGII AR5 Chapter 8
Do Not Cite, Quote, or Distribute 51 25 July 2011
Creative strategies may help safeguard urban ecosystem services, while collaboration between diverse 1 stakeholders can reconcile tensions and promote resilience. Some authors suggest that successful adaptation may 2 require “flexibility in land use and landscape planning,” as well as “stronger engagement with communities, 3 business, and government” (Seabrook, Mcalpine, and Bowen 2011: 409). Other researchers advocate a range of 4 innovative approaches: adapting Manchester’s green infrastructure may require greenspaces to be “added creatively 5 by making the most of all opportunities”, such as introducing green roofs, building facades, planting street trees, and 6 converting selected streets into greenways (Gill et al. 2007: 127). As the multiple benefits of green infrastructure are 7 recognised, a range of stakeholders could help to adapt these services in new, more appropriate ways. Cities are “hot 8 spots for solutions as well as problems”, and focusing on urban ecology can suggest new breakthroughs to cope with 9 a changing climate (Grimm et al. 2008: 759). 10 11 12 Impacts and models of climate change upon green infrastructure 13 14 This section briefly considers the research on climate-related vulnerabilities of green infrastructure, which may 15 already be under stress from extreme weather events, urban development, and rising population. Nearly 5000 trees 16 in Karachi were cut back from 2001-4 and another 1000 removed from 2005-6, as they were said to hamper 17 infrastructure development (Qureshi, Kazmi, and Breust 2010: 188-9). Additional trees were lost in the aftermath of 18 severe cyclones in Karachi (ibid.). The study did not consider climate change, but by increasing the frequency or 19 severity of storms as well as altering temperatures and precipitation patterns, climate change may only heighten the 20 strains on local ecosystems. In Indian cities, urban wetlands, riverine, estuarine, and coastal ecosystems are amongst 21 the areas most vulnerable to climate change (Revi 2009: 324). 22 23 The impacts of climate change on urban ecosystems may also vary depending upon emission scenarios, local 24 management decisions, land use strategies, and “by the interactions of these factors with climate change” (Hellmann 25 et al. 2010: 75). This case study examined Chicago’s climate-related vulnerabilities in terrestrial ecosystems, such as 26 increasing plant pests and diseases, decreases in some plant species, and rising abundances of heat- and drought-27 tolerant species (ibid.). The authors suggest that adaptation strategies should prioritise maintaining and restoring 28 native ecosystems, particularly wetlands, in order to buffer increased storms and support cooling to cope with 29 climate change (ibid., p. 83). Planners may also create migration corridors for plant and animal species, which may 30 need to shift northward in response to warming temperatures; if ecosystem preservation or restoration is not 31 possible, “residential green space can be used to augment natural preserves (ibid., p. 84). Ongoing monitoring 32 (particularly of invasive pests) will be important, and the study advocates “managing the entire mosaic, including 33 the ‘matrix’ of built-up lands” (ibid.). 34 35 Kyoto has long prioritised landscape measures and its economy depends upon ecosystem services, yet the need for 36 adapting green infrastructure has not gained widespread currency (Morimoto 2011). Although Kyoto has been a 37 “frontrunner in terms of landscape governance”, the surrounding pine and oak ecosystems are experiencing mass 38 dieback; moss withering has intensified due to the urban heat island (ibid, p. 12). These threats can impinge upon 39 Kyoto’s key cultural events, such as the Daimonji Bonfire and Gion festival, and the author suggests Kyoto’s recent 40 changes in biodiversity and ecosystem services “should be reconsidered from the viewpoint of smart adaptation to 41 climate change” (ibid., p. 14). 42 43 Studies have also examined the climate-related vulnerabilities of UK urban street trees (Tubby and Webber 2010) 44 and the potential of green infrastructure to adapt to climate change (Gill et al. 2007). The latter study used an energy 45 exchange model in Manchester and found green infrastructure offered “significant potential in moderating the 46 increase in summer temperatures expected with climate change” (ibid., p. 127). Adding green roofs to all buildings 47 could reduce runoff and exert a “dramatic effect” on maximum surface temperatures, with particular cooling impacts 48 in areas with a high proportion of buildings and low evaporating fraction (ibid., p. 122-3). Additionally, the model 49 “highlights the dangers of removing green [infrastructure]” from the city (ibid.). If green cover in Manchester’s 50 high-density residential areas and town centres falls by 10%, surface temperatures are predicted to increase as much 51 as 7°C-8.2°C by the 2080s under a high-emissions scenario (compared to the 1961–1990 baseline case). The study 52 also considers different adaptation functions that green infrastructure may provide, such as flood storage, infiltration 53
ZERO-ORDER DRAFT IPCC WGII AR5 Chapter 8
Do Not Cite, Quote, or Distribute 52 25 July 2011
capacity, evaporative cooling, and shading (ibid.). Section (c) returns to green roofs, which have proved popular, 1 while section (b) discusses other interventions adopted to date. 2 3 4 Adapting green spaces, urban wildscapes, and terrestrial and marine ecosystems 5 6 Durban has developed proactive interventions to adapt its green infrastructure, beginning with studies to attempt to 7 understand the impacts of climate change on local biodiversity (Roberts 2008, Roberts 2010). These were 8 undertaken to determine if it were possible to ‘climate-proof’ the extensive biodiversity resources protected by the 9 Durban Metropolitan Open Space System(covering some 75 000ha), (Roberts 2008: 533). Strategies that are used to 10 achieve biodiversity goals also have adaptation co-benefits include developing corridors to facilitate species 11 migration; enlarging core conservation areas; and identifying areas for improved matrix management to enhance 12 ecological viability of these core areas (ibid.). The cost benefit of such interventions is highlighted by the fact that in 13 Durban in 2002 the replacement value of the ecosystem services supplied by the city’s open space system was R3.1 14 billion per annum, approximately half the value of the city’s operating budget at the time (EThekwini Municipality, 15 2007 pg 15). Furthermore, a community reforestation project resulted in planting 82,000 trees in a regional landfill 16 site to offset Durban’s World Cup carbon footprint (Roberts 2010: 410). 17 (ABOVE PARA TO BE UPDATED BY DEBRA) 18 19 Singapore has also used several anticipatory plans and projects to enhance green infrastructure. The city actively 20 manages its growth boundary and is already “one of the best landscaped cities in tropical Asia,” but has recently 21 sought to improve ecosystem services (Newman 2010: 166). The Streetscape Greenery Master Plan created roads 22 “with complete canopy cover and heritage tree programs,” while the Park Connector Network “drives green 23 connections across the city along with tree top walks” (ibid.). Guidelines have been developed for water-sensitive 24 urban design and constructed wetlands or drains, which are green instead of concrete (ibid.). Fruit trees have been 25 planted and 300 community gardens established by 2005, but an urban agriculture strategy could help encourage 26 greater productivity in lawn areas (ibid.). [climate change tie-in or adaptation plans in Singapore? not clear 27 from Newman] 28 29 Authorities in England and the Netherlands are recognising the linkages between spatial planning and biodiversity, 30 though “there is less evidence of direct response to the needs of climate change adaptation” (Wilson and Piper 2008: 31 143). One proactive response was the 2006 Masterplan for Queensborough and Rushenden (a regeneration area on 32 the Thames estuary). This plan took account of biodiversity under a changing climate: a network of permeable 33 habitat spaces was planned for, while green and blue infrastructures were integrated into the site (ibid.). Although 34 the Netherlands has a long record of planning for biodiversity and supporting water ecosystems, a stakeholder 35 workshop in the Hague “considered that the link between climate change and biodiversity is not fully apparent” 36 (ibid., p. 142). The authors concluded it was “rare” for French, Dutch, and English authorities to safeguard new sites 37 explicitly for climate change adaptation, and identified several policy barriers to implementing adaptive responses 38 (ibid.). Barriers to action included short-term planning horizons, uncertainty of climate change impacts, and 39 problems of creating habitats due to inadequate resources, ecological challenges, or limited authority (ibid., p. 145). 40 41 In many urban centres in coastal areas, adaptation is needed to withstand the impacts of climate change and 42 strengthen urban livelihoods dependent on ecosystem services. Rio de Janeiro’s Guanabara Bay has lost the majority 43 of its coastal mangroves, while its coastal marshes have largely been filled in (de Sherbinin, Schiller, and Pulsipher 44 2007: 56). The few remaining wetlands have limited capacity to act as buffers during storm surges, which are 45 increasingly likely as a result of climate change. Furthermore, warmer water temperatures may create algae blooms 46 “especially if no effort is made to treat discharges into the bay” (ibid.). Mumbai’s combination of fragile wetlands, 47 inadequate waste treatment and sanitation, and rising prevalence of extreme weather could similarly create a ‘stress 48 bundle’ that leaves the city highly vulnerable to climate change (ibid., p. 50). 49 50 West African coastal cities are already experiencing ecosystem degradation and reduced fish stocks, which may be 51 exacerbated by climate change. Lagos’ natural vegetation cover declined from 30.1% in 1986 to 19.4% between 52 1986 and 2002; wetlands and naturally occurring water bodies have also been sharply reduced by rapid urbanisation 53 and land cover changes (Adelekan 2010: 439). In turn, the expanding coastal settlements are increasingly vulnerable 54
ZERO-ORDER DRAFT IPCC WGII AR5 Chapter 8
Do Not Cite, Quote, or Distribute 53 25 July 2011
to sea-level rise, storms, and other impacts of climate change (ibid.). Coastal fishing is limited in Lagos, but fisheries 1 in nearby Cotonou support 15,000 fishers, wholesalers, and associated labourers (Dossou and Gléhouenou-Dossou 2 2009: 113). A sea-level rise of 50cm would drastically reduce Cotonou’s plant formations, particularly mangroves, 3 and disrupt species such as crabs and turtles (ibid., p. 120). The authors suggest that fish farming may restore fauna, 4 ameliorate overfishing, and bolster livelihoods in the face of climate change (ibid., p. 124).17 5 6 [INSERT FOOTNOTE 17 HERE: Additional adaptations to sea-level rise and erosion in Cotonou may include 7 technical measures, such as groynes or barriers, and relocating infrastructure (Dossou and Gléhouenou-Dossou 8 2009: 122-4) as discussed in Section XX on the urban economic base.] 9 10 Climate change may exacerbate pressures on Cape Town’s marine and terrestrial ecosystems, requiring a range of 11 adaptation strategies. Harvesting of marine resources and fynbos products together generate 10% of the region’s 12 Gross Geographic Product (Crane and Swilling 2008: 275). But unsustainable exploitation, invasive species, and 13 poor management have led to declining soil productivity and nearly 1,400 plant species currently endangered or 14 near-extinction (ibid.). Rising temperatures and decreased precipitation due to climate change may substantially 15 increase the risk of wildfire and promote further losses in biodiversity, increased alien plant invasions, and degraded 16 soils (Mukheibir and Ziervogel 2009: 283). However, fire risks may be reduced by removing plantations, controlling 17 alien species, and creating fire breaks between vegetation and residential areas (ibid., p. 284). Increased capacity for 18 fire-fighting and rapid response measures may also be required (ibid.). Interventions to enhance marine biodiversity 19 may include controlling erosion and wetlands, neighbourhood-based sewage treatment linked to greening, and 20 rebuilding fish stocks through quota allocations to benefit fishing communities (Crane and Swilling 2008: 283-4). 21 22 Evidence suggests that bottom-up strategies or partnerships can help to restore green infrastructure. In Mombasa, the 23 Bamburi Cement Company has rehabilitated 220 hectares of quarry land now known as Haller Park (Kithiia and 24 Lyth 2011: 258). The restoration began in 1972 and the park currently attracts over 150,000 visitors per year, with 25 “the potential to create adaptation co-benefits despite this not being the original intent” (ibid., p. 260). To involve 26 further businesses or civil-society actors, Mombasa’s municipal authority could adopt bye-laws to regulate or 27 encourage green landscaping; offer incentives for residents or local groups; or facilitate other collaborations between 28 diverse stakeholders (ibid., pp. 262-3). Cape Town has already initiated community partnerships to conserve 29 biodiversity, including the Cape Flats Nature project with the para-statal South African National Biodiversity 30 Institute (Ernstson et al. 2010: 539). The participating schools and local organisations explore ecosystem services 31 (such as flood mitigation and wetland restoration), and the project facilitates “champion forums” to support 32 conservation efforts (ibid.). 33 34 Some cities have made large investments in green infrastructure, linked both to regeneration and to climate change 35 adaptation. For instance, the Green Grid for East London seeks to create “a network of interlinked, multi-purpose 36 open spaces in east London to support the wider regeneration of the sub-region. The Green Grid is being delivered 37 through a programme of projects that are designed to enhance the potential of existing and new green spaces to 38 connect people and places, to absorb and store water, to cool the vicinity, and to provide a diverse mosaic of habitats 39 for wildlife. More than £20 million-worth of projects have already been delivered. The Mayor has published 40 Supplementary Planning Guidance100 to enable the implementation of the Green Grid through borough and 41 subregional planning. The same principles will apply to the London wide Green Grid.” (GLA, 2010 pg 96). 42 43 Worth considering a box on the approach taken by New York to protect and enhance its water supply through its 44 watershed protection programme but making clear what aspects of this are related to climate change adaptation. “To 45 protect our customers and maintain our unfiltered water supply, we must continue to protect water quality. That is 46 why we are implementing a $462 million Watershed Protection Program that targets the greatest potential threats 47 and enlists the help of the surrounding towns, businesses, and organizations. The Watershed Protection Program is a 48 unique strategy that combines protection, land acquisition, and environmentally- sustainable economic development 49 to maintain the high quality of our water supply. We will replace failing septic systems, preserve wetlands, and 50 upgrade wastewater treatment facilities in towns near our reservoirs. We will work with private land owners to 51 improve land management practices. By working with surrounding communities, we will continue to implement 52 sustainable practices that bring economic development to the region and clean water to New York City. We will 53 continue to acquire watershed lands from willing sellers when possible. City ownership of land ensures that crucial 54
ZERO-ORDER DRAFT IPCC WGII AR5 Chapter 8
Do Not Cite, Quote, or Distribute 54 25 July 2011
natural areas remain undeveloped, while eliminating the threat from more damaging uses. New York City protects 1 more than 115,000 acres of watershed land through land ownership or conservation easement—including more than 2 78,000 acres acquired since 2002. To maintain this successful program and meet the requirements of our current 3 FAD, we will contact the owners of at least 50,000 acres of land every year. To achieve our land acquisition goals, 4 we secured re-authorization of our Land Acquisition Program from the New York State Department of 5 Environmental Conservation (State DEC) in 2010. We will continue to strike a careful balance between protecting 6 drinking water quality and facilitating sustainable local economic development. The success of this program is 7 possible thanks to strong partnerships with local stakeholders and communities throughout the watershed. Through 8 our work with the Catskill Watershed Corporation, 203 watershed businesses have received $48 million in loans 9 over the last 12 years to support tourism, hospitality, manufacturing, and other industries. We worked with local 10 communities to rehabilitate more than 3,500 septic systems. We will continue to rehabilitate an estimated 300 11 residential septic systems per year and install new wastewater treatment systems in a number of communities. We 12 will also continue our partnership with the Watershed Agricultural Council to promote sustainable farming 13 techniques that limit the amount of fertilizer and other waste products that run into our reservoirs. The Watershed 14 Protection Program is costly, but compared to the costs of constructing and operating a filtration plant, as well as the 15 environmental impacts of the additional energy and chemicals required by filtration, it is the most cost-effective 16 choice for New York.” (City of New York, pg 81). 17 18 19 Green roofs and cooling impacts of green infrastructure 20 21 Green roofs have been introduced in a range of cities, with the potential to create synergies between mitigation and 22 adaptation.18 Rooftop vegetation helps decrease solar heat gain (reducing the cooling demand and emissions from air 23 conditioning) while cooling the air above the building (Gill et al. 2007). Durban has a pilot green roof project on a 24 municipal building; indigenous plants are also being identified for the project and rooftop food production is being 25 investigated (Roberts 2010: 411). New York’s lack of space for street-level planting helped encourage the adoption 26 of living roofs, which can provide additional area for cooling vegetation (Corburn 2009: 417). Under its Skyrise 27 Greenery project, Singapore has provided subsidies and handbooks for rooftop and wall greening initiatives 28 (Newman 2010: 166-7). 29 30 [INSERT FOOTNOTE 18 HERE: See also section XX below on mitigation-adaptation synergies.] 31 32 However, a recent meta-analysis suggests that green roofs and parks may have limited effects on cooling (Bowler et 33 al. 2010). Findings on green roofs were “mixed, with some evidence of lower air temperatures above green sections 34 in some studies, but not in others” (ibid., p. 153). Additionally, an urban park was found to be “around 1 ◦C cooler 35 than a non-green site” (ibid.) and larger parks had a greater cooling effect. Yet studies were mainly observational, 36 lacking rigorous experimental designs, and “it is not clear if there is a minimum size threshold or if there is a simple 37 linear relationship” between the park’s size and cooling impact (ibid.). While different types of vegetation have 38 stronger effects, the analysis could not demonstrate “exactly how green infrastructure should be designed in terms of 39 the abundance, type, and distribution of greening” (ibid.). further research needed; add review of other citations 40 on green roofs (below) 41 42 A new methodology seeks to evaluate the impacts on local climate of current land uses and proposed planning 43 policies (Schwarz, Bauer, and Haase 2011). In a case study of Leipzig, several policies were found to increase local 44 temperatures according to the indicators of evapotranspiration and land surface emissivity (ibid., p. 106). Green 45 areas and water surfaces had cooling effects, as expected, and “increasing sealed surfaces leads to increasing 46 temperatures” (ibid., p. 109). The study also identified unintended conflicts between planning strategies, and the 47 authors suggest the method may help set priorities “especially with respect to climate change and increasing 48 temperatures” (ibid.). 49 50 51
52
ZERO-ORDER DRAFT IPCC WGII AR5 Chapter 8
Do Not Cite, Quote, or Distribute 55 25 July 2011
Need to consider relevance of green walls, green alleys, urban forestry etc 1 2 Comment from Debra: Not sure where we deal with the threshold/mitigation/adaptation conflict issue – in many 3 ways it impacts on green infrastructure arguments the most. It is generally accepted that mitigating climate change 4 will require a denser urban form in order to maximize economies of scale, reduce the need for transport and to 5 reduce building energy use. Adaptation alternatively speaks to an urban form that favours green infrastructure such 6 as the provision of open space for stormwater management, species migration, and urban cooling (Hamin and 7 Garrun, 2009 pg 242). This raises the question of thresholds i.e. when will densities be so high that they create 8 negative feedbacks such as the inability to maintain ecologically viable and biodiverse systems, or positive 9 feedbacks such as the exacerbation of the urban heat island which in turn generates the need for more cooling and 10 increases energy use, thereby further escalating the urban heat island effect. Hamin and Garrun (2009 pg 242) refer 11 to this as the “density conundrum”. 12 13 The dangers to biodiversity particularly are highlighted by Hamin and Garrun’s (2009 pg 242) assertion that an 14 appropriate response to the density conundrum would be to provide multi-use greenspace within settlements along 15 linear features (such as transportation routes and rivers and floodplains) while larger open areas are limited to the 16 urban periphery. While this may make sense from a climate perspective – it makes little biological sense, especially 17 in situations where urban areas are located in areas of high biodiversity and endemism. Under these conditions it is 18 often necessary to protect and conserve sizeable natural areas within the heart of the urban fabric to meet local, 19 national and international conservation targets and the associated ecosystem services they deliver. Such is the case in 20 South African cities such as Durban and Cape Town, both of which are both located within global biodiversity 21 hotspots (EThekwini Municipality, 2007 pg 4; Holmes et al., 2008 pg 4). 22 23 24 8.3.3.8. Adapting Public Services 25 26 [The problem with this section is how little discussion there is in the academic literature on this topic – and how 27 most of the existing literature is for cities in high-income nations. We need to draw more on city risk and 28 vulnerability assessments that have been produced and published by city governments even though these are ‘grey’ 29 literature] 30 31 As more cities develop risk and vulnerability assessments for climate change, so attention is beginning to be given to 32 the operations of public services in cities. This is both in regard to the impacts that these services might face from 33 (say) extreme weather and in regard to what these public services can contribute as part of climate change adaptation 34 (or disaster risk reduction). This has been supported by city governments taking measures for disaster risk reduction, 35 as this usually helps reduce risks and vulnerabilities to extreme weather and builds resilience to many likely impacts 36 of climate change – even if the disaster risk reduction methodologies need adjustment to address climate change 37 (ISDR 2009, 2011). 38 39 Obviously, health care and emergency services (including those that respond to fires and acute illness and injury) 40 along with agencies with responsibilities for disaster response have particular importance in responding to extreme 41 weather and themselves having the needed resilience to extreme weather. There is also the recognition that public 42 service agencies within urban governments have particular importance in disaster risk reduction – i.e. in identifying 43 the most serious risks and vulnerabilities based on analyses of the impacts of past events and acting on these both to 44 reduce or remove the risks and take damage limitation measures just before an extreme-event (for instance 45 evacuating people temporarily from locations or settlements at particular risk). Table 8-4 highlights the range of 46 local government responsibilities for infrastructure, buildings and services that have importance for risk reduction, 47 damage limitation and immediate and longer term rebuilding. 48 49 [INSERT TABLE 8-4 HERE 50 Table 8-4: The role of city/municipal governments in preventing disasters from extreme weather, limiting their 51 impact and post-disaster responses (Satterthwaite, Dodman, and Bicknell, 2009.] 52 53
ZERO-ORDER DRAFT IPCC WGII AR5 Chapter 8
Do Not Cite, Quote, or Distribute 56 25 July 2011
The interrelated impacts of climate change in urban areas may strain municipalities’ limited resources, “all while 1 making the delivery of services more difficult” (Gasper, Blohm, and Ruth 2011: 155). Although there are few 2 studies on adapting education, police, or other key services, a growing public health literature has discussed multi-3 sectoral adaptation strategies (Huang et al. 2011). Cities’ existing public health measures may provide a foundation 4 for adapting to climate change, such as heat warning systems or disease surveillance (Bedsworth 2009, McMichael 5 et al. 2008). However, more frequent or severe extreme weather events could heighten the demands on emergency 6 medical services. Multisystem failures (such as power outages during heat-waves) could compound the pressures on 7 emergency responders (Hess et al. 2009: 787). Adapting health services may require multi-dimensional strategies 8 and action across local, regional, and national scales (Frumkin et al. 2008: 440). As the system failures during 9 Hurricane Katrina revealed, responding to extreme events may require “effective, coordinated approaches for 10 delivering clinical services” (ibid.). 11 12 The quality, timeliness, and integration of urban public services may help to moderate the impacts of climate 13 variability and change. Even in cities with low-quality housing and deficient infrastructure, the presence of 14 effective early-warning systems, measures taken just before the extreme event, and post-disaster responses can 15 greatly reduce the impacts on populations (IFRC 2010, Dodman and Satterthwaite 2009). Comprehensive urban 16 disaster management may help to minimise economic damages, reduce mental and physical trauma, and enhance 17 resilience to climate change (ISDR 2009; other cites). Schooling is often interrupted by disasters, so that 18 maintaining educational and informal enrichment activities may help to adapt to climate change and promote 19 children’s future development (Bartlett 2008). 20 21 The discussion begins with health and emergency services, followed by a consideration of education and fire-22 fighting, police, and other public services. Extreme weather events “rarely cause large loss of life or serious injury” 23 in high-income nations with early warning systems, adequate healthcare and emergency services, as well as police, 24 fire services, and other systems to provide rapid response (Moser and Satterthwaite 2008: 14). Integrated, well-25 functioning public services are uncommon in urban centres in low and most middle income nations and the evidence 26 below suggests that services in high-income areas may need major adaptation. 27 28 29 Adapting health services and emergency care 30 31 There is a growing literature on the role of health care services and systems in climate change adaptation in urban 32 areas. Yet few health service officials have identified climate change as a focus area or sought to adapt urban health 33 services. Studies in the U.S. have examined health adaptation strategies, perceptions of climate change, and barriers 34 to adaptation.19 Amongst 133 randomly-selected local health department directors surveyed in 2007, only 19% said 35 climate change was among their top 10 current priorities; 83% felt their health department lacked expertise to create 36 an effective adaptation plan (Maibach et al. 2008). Research in California found higher levels of concern regarding 37 climate change, but these health officials similarly reported limited adaptive capacity (Bedsworth 2009). In a 2007 38 survey of 34 local health officers, respondents felt climate change posed a large risk to public health but nearly two-39 thirds said they lacked the information and resources to address such risks (ibid., p. 621). More positively, cities had 40 relevant programmes such as San Diego’s heat emergency plan (including a reverse 911 system to all vulnerable 41 groups regarding heat risks and how to minimise them), which could be built upon to respond to climate change 42 (ibid., pp. 618-9). 43 44 [INSERT FOOTNOTE 19 HERE: See also Carthey et al. 2009 for limited knowledge and barriers to adaptation 45 amongst health facilities managers in New South Wales, Australia. More info + more cites] 46 47 Many urban centres in low- and middle-income nations are facing or likely to face more serious health impacts 48 while also having major deficiencies in health care and emergency services. “More assessments of the impacts of 49 climate change on health at the city level are needed in order to inform decision making” (Kovats and Akhtar 2008: 50 172). Durban’s Municipal Climate Protection Plan already identified the potential health impacts of climate change, 51 and a range of future measures were proposed including an early warning system, public education to enhance 52 community response, and further research on health and climate (Roberts 2008). The development of more detailed, 53 and sectorally focused Municipal Adaptation Plans, however, highlighted that the most urgent requirement in the 54
ZERO-ORDER DRAFT IPCC WGII AR5 Chapter 8
Do Not Cite, Quote, or Distribute 57 25 July 2011
health sector was the need to strengthen the primary health care services, and to increase their ability to respond to 1 emergencies with fewer referrals to overburdened hospitals (Constable and Cartwright, 2009) The Indonesian 2 Ministry of Health has instructed provincial governments to prepare for dengue outbreaks before the rainy season 3 (Wirawan 2010: 29) and sub-district primary health centres (PHCs) can help to collect and integrate health 4 surveillance data particularly in low-lying settlements vulnerable to climate change (ibid.). 5 6 Adapting to extreme weather will require enhanced emergency response as well as long-term measures to protect 7 vulnerable communities, as suggested by research in Cavite City, Philippines (Sales, Jr. 2009). With a population of 8 100,000 bordering the Manila Bay, Cavite City is a largely coastal settlement at high risk of sea-level rise and 9 increased flooding due to climate change (as well as suffering from overfishing, ecosystem degradation, erosion, and 10 other non-climate concerns). The local government has launched strategies to minimise risks and enhance 11 emergency services in low-lying areas, including information campaigns and public advisories; resettling vulnerable 12 coastal families; and constructing breakwaters, seawalls, etc. (ibid., p. 399). But a vulnerability assessment with 13 residents suggested that additional evacuation and health centres were needed, as well as further logistical support 14 (such as ambulances and emergency kits). 15 16 Enhanced emergency medical services may help cope with extreme events (Hess et al. 2009), while health officials 17 can also improve surveillance, forecast the health risks and benefits of adaptation strategies, and support public 18 education campaigns (McMichael et al. 2008). Responding to the heightened risk of infectious disease may require 19 health-workers to enhance vector control (e.g. screening windows), improve peri-domestic sanitation to prevent 20 dengue, or bolster food hygiene measures to prevent salmonella poisoning that may increase with rising 21 temperatures (Blashki et al. 2011: 137S). Local-level partnerships may be necessary, since action at the local and 22 regional levels are the sites of “identifying health threats and vulnerable populations, designing and implementing 23 adaptive measures, and responding to emergencies” (Frumkin et al. 2008: 440). These local health adaptation 24 activities “are also enhanced by a supportive policy environment at the national and international levels” (Keim 25 2008: 515). 26 27 Health infrastructure will also require attention. The Boston Redevelopment Authority for example “has begun 28 asking developers of projects that may be subject to more frequent coastal flooding due to sea-level rise to analyze 29 the effects of climate change. In 2009, as a result of such an analysis, Partners HealthCare raised the base elevation 30 of the proposed Spaulding Rehabilitation Hospital by two feet at its new location in the Charlestown Navy Yard 31 (now under construction). (City Of Boston, 2011 pg 11) 32 33 The costs of integrated health adaptation may be considerable, according to some estimates. The U.S. federal 34 funding directly addressing the health risks of climate change was $3m per annum in 2009, but as much as $200m 35 annually may be needed for a comprehensive surveillance and monitoring system, regional centres and programs, 36 and modelling software that can capture the health risks of climate change (Ebi et al. 2009). Limited funds for public 37 health are a significant barrier to adaptation in developing regions, but investment alone “is not sufficient to improve 38 health” (Kovats 2009: 52). Other constraints to adapting health services include poor urban governance, low 39 adaptive capacity, and high levels of inequality (ibid.). (the literature cited here seems to treat health as “hospitals 40 and medication”. Is there a literature on a more preventative and holistic level in terms encouraging local level food 41 gardens (people who eat better stand less chance of getting ill) etc. For instance, Toronto’s identification of 42 initiatives that help build a healthy and sustainable food system including making food an essential element of the 43 green economy and linking city and countryside. http://www.toronto.ca/civic-engagement/council-briefing/pdf/1-3-44 41.pdf in New York, “approximately 80% of the city’s community gardens grow food. Most food-producing 45 gardens are located in neighborhoods with limited open space and inadequate access to fresh produce and other 46 healthy foods”. Establishment of farmers markets at community garden sites. support for gardens in schools (City of 47 New York, 2011 pg 37). (See also Chehimi et al 2011) 48 49 50 Adapting schools 51 52 In urban centres impacted by extreme weather events, schools and disadvantaged students may be negatively 53 affected. These events can damage or close schools or disrupt classes as schools are needed for emergency shelters 54
ZERO-ORDER DRAFT IPCC WGII AR5 Chapter 8
Do Not Cite, Quote, or Distribute 58 25 July 2011
(Bartlett 2008: 35). All of the primary schools, high schools, and colleges in east Dhaka were closed during the 1998 1 floods; the Water and Sewerage Authority reported that in the September 2004 floods, 250 schools were again 2 affected by waterlogging (Alam and Rabbani 2007: 87 and 91). In areas where school drop-out is common, 3 “children are much less likely to continue with school after an interruption” and low-income or female students may 4 be disproportionately affected (Bartlett 2008: 35) 5 6 Short-term adaptation measures may include risk assessments of school locations, strengthening disaster 7 preparedness capacities and educational infrastructure, and responding to seasonality changes by adjusting exam 8 schedules (Bangay and Blum 2010: 361). A recent assessment in Chicago explored climate-related vulnerabilities to 9 the school system, which was predicted to save in energy heating costs as winter temperatures rise (Hayhoe et al. 10 2010). But like other municipal buildings, the School Board may experience increased costs for maintenance, 11 repairs, or rising cooling demands due to changes in mean and extreme temperatures (ibid., p.102). Other 12 assessments needed particularly in low-income cities... 13 14 Adaptations in the education sector may help students and teachers to cope with extreme events, as well as to shape 15 innovative responses to climate-related and other emerging concerns. After a disaster, re-establishing schools can 16 serve to introduce one aspect of ‘normal’ life to children and their families (Bartlett 2009). The long-term task in 17 adapting educational systems is to “develop education systems that equip learners with the requisite skills, 18 knowledge, and attributes to deal with future challenges” (Bangay and Blum 2010: 361). More cites here on 19 environmental education/CC awareness? 20 21 22 Adapting public transport 23 24 [to be developed] 25 26 27 Emergency response and disaster risk reduction – 28 including roles of civil protection, fire and police services, and army 29 30 Without adequate adaptation and coordination, climate change may strain the operations of key disaster response 31 providers. The interrelated impacts of climate change in urban areas may strain municipalities’ limited resources, 32 “all while making the delivery of services more difficult” (Gasper, Blohm, and Ruth 2011: 155). The disaster risk 33 reduction network in many cities may already be complex, with a range of actors “extending from applied 34 emergency and risk management to development regulation and planning” (Pelling 2011: 80). Research after 35 Australia’s recent bushfires and flooding suggested the need for a coordinated response between police, emergency 36 providers, and housing authorities (Jacobs and Williams 2011). The interviewed housing officials were sometimes 37 unsure of each agency’s precise remit, and to improve coordination the authors recommended preparing templates or 38 toolkits and establishing “a strong chain of command and clear communication” (ibid., p. 190). 39 40 For cities without a robust emergency response network, adapting to climate change may require significant 41 improvements in staffing, resources, and preparedness plans (including particular attention to providing emergency 42 services in informal settlements lacking adequate roads or infrastructure, as discussed in section 3.3.6). In Durban, a 43 significant challenge is the fact that disaster management services are (as a result of past operational exigencies) 44 more reactive than proactive (Roberts, 2010 pg 402) thereby limiting their ability to respond strategically to the 45 growing range of climate change impacts. This highlights the importance of addressing institutional operations as 46 well as the more technical aspects of risk management (Roberts, 2010 pg 402). 47 48 Risk of fires is likely to increase in and around many urban centres because of increased prevalence of drought and 49 rising temperatures (cite). Studies have suggested that “serious fire disasters are commonplace in many informal 50 settlements,” although the events may go unrecorded due to a lack of emergency fire services or the inaccessibility 51 of such settlements (ISDR 2010: 44). Cape Town’s fire incidents are most common during hot, dry, and windy 52 summers; informal settlements are highly at risk due to overcrowded, dense, and flammable housing structures; the 53 use of candles or kerosene; and the lack of piped water supplies (ibid.). The public health impacts of wildfire may 54
ZERO-ORDER DRAFT IPCC WGII AR5 Chapter 8
Do Not Cite, Quote, or Distribute 59 25 July 2011
include burn injuries, exacerbated asthma or chronic obstructive pulmonary disease (COPD), and population 1 displacement necessitating humanitarian relief measures (Keim 2008: 512). Anticipatory measures may include a 2 fire hazard evaluation, developing emergency plans, and public education outreach and exercises (ibid.). In the 3 absence of such adaptation measures, climate change may only exacerbate the risks of fire in both low- and high-4 income cities. 5 6 Improved fire-fighting responses have been identified as a priority adaptation measure in several cities and at-risk 7 regions. Amongst 34 local health officials in California, 62% reported that wildfire was a ‘very serious’ health risk 8 associated with climate change (Bedsworth 2009: 620). A climate change assessment in Chicago outlined possible 9 impacts on the Fire Department, such as increased firehouse maintenance and greater volume of fire responses and 10 safety checks (Hayhoe et al. 2010). Researchers in Australia noted the need to enhance responses to bushfires in the 11 context of climate change, advocating greater coordination between the health sector and broader community “to 12 develop regional bushfire health response plans and to support community care options and social networks that 13 have a protective effect” on vulnerable populations (Blashki et al. 2011: 137S). 14 15 To cope with increasingly frequent extreme heat events, Chicago’s police department may experience higher costs 16 and challenging trade-offs (Hayhoe et al. 2010). This climate change assessment predicted increased overtime costs 17 for Chicago’s police and more frequent safety checks. Extreme heat-events may require several responses by police, 18 such as coping with increased crime levels or evacuating residents experiencing electrical black-outs (ibid., p. 102). 19 Moreover, police charged with evacuation assistance “could draw away from the ability to deal with concurrent 20 crime and disorder” (ibid., p. 100). Managing such trade-offs, as well as coordinating with other emergency 21 responders, may be important in adapting to climate change. 22 23 In Boston, there are plans by Boston City Government to acquire portable emergency generators adaptation that can 24 be used to power air-conditioning equipment at cooling centers in the event of power outages (The City of Boston, 25 2011).. 26 27 For the civil protection services, It is likely that urban disasters will increase in number and magnitude as a result 28 of climate change and variability, civil protection services will need to adapt to an increasing demand from local, 29 state and federal governments in order to assist affected residents. Since civil protection department (defesa civil in 30 Brazil) provides in many countries (to check concrete examples>, along with the Army and Red Cross, prompt 31 assistance during and after the impact of a disaster, it is important to assess to what extent civil protection protects 32 affected people by doing mainly humanitarian work. <No papers, documents have been found so far concerning this 33 issue. Fernando will keep an eye on this> 34 35 Army. Similar discussion applies to the Army. In many Latin American countries, the Army constitutes the 36 forefront when a disaster strikes. <To check if there is literature in the context of increasing floods, droughts, etc 37 38 39 8.3.4. Urban Planning, Management, and Governance 40 41 What studies have discussed the means used to get local government to recognize that there is a problem they have 42 to address and understanding how climate change adaptation can and should be folded into larger processes. Getting 43 adaptation strategies into the core of local government investment and management with buy-in from key sectors 44 and directorates (draw on Roberts 2010). The experiences with integrating development, disaster risk reduction and 45 climate change adaptation 46 47 Tools and methods for risk and vulnerability assessments and how these feed into adaptation plans and strategies 48 and then into key city plans and investment frameworks. Mapping and enumerating risk and vulnerability (reference 49 text in section 4 on this) 50 51 Studies showing how building codes, planning regulations and land-use management are being changed in relation 52 to disaster risk reduction (United Nations 2011)– and for climate change 53 54
ZERO-ORDER DRAFT IPCC WGII AR5 Chapter 8
Do Not Cite, Quote, or Distribute 60 25 July 2011
Key obstacles to action at the metropolitan level are the lack of actionable climate information and the vertical and 1 horizontal fragmentation of jurisdictions – for instance, in Argentina, between the city of Buenos Aires and the 26 2 separate municipalities that are within the province of Buenos Aires and between the different ministries and 3 departments within the national government that are involved in flood management and disaster management 4 (Natenzon and Viand 2008, Mehrotra et al 2011 in Rosenzweig, Solecki, Hammer and Mehrotra 2011, Hallegatte et 5 al. 2011 – Copenhagen study) 6 7 8 8.3.5. Landscape and Regional Connections 9 10 Managing urban areas’ physical growth and development. Land use planning and management (remembering point 11 about how much low-cost risk reduction often needs areas protected from being built over). Protecting and utilizing 12 productive and protective ecological services. Green infrastructure - How to protect and maintain existing ecosystem 13 services in cities, and how to restore and enhance ecosystem services – promoting ‘good transitions’ (Does the 14 section on Green Infrastructure in 3.3 belong here?) 15 16 Are sprawling cities more vulnerable to climate change than compact cities? Stone, Hess and Frumkin (2010) 17 found that extreme health events (weather events?) in US large cities between 1956 and 2005 in the most sprawling 18 metropolitan region was more than double the rate of increase observed in the most compact metropolitan regions. 19 They propose that the design and management of land use in metropolitan regions may offer an important tool for 20 adapting to the heath-related health effects associated with ongoing climate change. 21 22 23 8.3.6. Building Resilience in Urban Areas within a Commitment to Mitigation 24 25 Reviewing what has been discussed above in regard to where and when there are opportunities for 26 mitigation/avoidance of greenhouse gas emission. Co-benefits discussions. Impacts of climate change policy. 27 (Review Wilbanks, Sathaye 2007; Hunt, Watkiss 2011) 28 29 30 8.3.7. The Limits to Adaptation and How these Change over Time 31 32 and with this change so influenced by the extent (or not) of effective emissions reduction agreements for wealthy 33 nations and emissions-moderation by others 34 35 36 8.4. Enabling and Supporting Urban Adaptation and Adaptive Capacity 37 38 8.4.1. Enabling Frameworks 39 40 8.4.1.1. Introduction 41 42 Enabling conditions and frameworks to support urban adaptation are grounded in local-national institutional 43 structures, local competences and interests. The context for adaptation decisions will inevitably vary from country to 44 country and location to location. Some of the preconditions for sound adaptation decisions can nevertheless be 45 generalised across locations and relate to principles of good practice in public decision-making as well as to science-46 policy deliberative practice and risk governance (Adger et al. 2009; NRC 2007, 2008, 2009; Renn 2008; Moser 47 2009). 48 49 In many urban settings, civil society including non-governmental and community-based organizations play an 50 important role in urban environmental management. In particular, the role of civil society is key to participatory 51 community risk assessment, local expert knowledge, and local capacity building (e.g., Krishnamurthy et al. 2011; 52 Fazey et al. 2010; Shaw et al. 2009; Tompkins et al. 2008; Van Aalst et al. 2008). 53 54
ZERO-ORDER DRAFT IPCC WGII AR5 Chapter 8
Do Not Cite, Quote, or Distribute 61 25 July 2011
Actor engagement matters to the quality and effectiveness of public policy decision-making, and conceptually can 1 be organised around core, inner and outer peripheries of influence, where information and circuits of power flow 2 inward and outward from the core to ensure legitimacy (see Figure 8-3; Corfee-Morlot et al. 2011). In this 3 framework, governments are at the core with the central authority for policy decisions, however in climate change 4 adaptation decisions, scientific information and expertise is also central to understanding the nature of the problem. 5 Successful urban adaptation thus requires grappling with a complex and uncertain regional climate science as well 6 as advancing understanding and decision making on this “new” issue across levels of government and a variety of 7 stakeholders (e.g. businesses, households and consumers, and a wide variety government stakeholders themselves 8 within a single level of government). 9 10 [INSERT FIGURE 8-3 HERE 11 Figure 8-3: Title? (adapted from Corfee-Morlot, Cochran, Teasdale, and Hallegatte, 2011).] 12 13 In urban adaptation decision making, “semi-autonomous” institutions such as local water authorities or insurance 14 regulators (in the “inner circle”) will need to engage along side of local stakeholders such as businesses, consumers 15 or even scientific experts situated in the “outer circle”. The media and other forms civil-social infrastructure act as 16 filters of substantive knowledge and help to join expert information with local knowledge to build understanding 17 and engagement. The credibility, legitimacy and salience of adaptation decisions will depend in part upon how well 18 governance processes mediate across these different actors and sources of information and influence to co-produce 19 knowledge (Wagsaether, Ziervogel 2011, Corfee-Morlot et al. 2011, Renn 2008). 20 The capacity to act will also vary with organisational form and of problem complexity (Habermas 98; Corfee-Morlot 21 et al. 2011) which in turn will relate to levels of development and more generally the development context (Bicknell 22 et al. 2009). 23 24 25 8.4.1.2. Building Urban Capacity to Adapt across Levels and Government across Levels, Stakeholders 26 27 Given the uncertainty and complexity of the problem, decision-making will necessarily be iterative and evolve along 28 with scientific understanding (Dietz 2003b, Corfee-Morlot et al. 2011). Where uncertainty is high, such as in the 29 case of future climate change, how decisions get made will be as important as what decisions are made (Funtowicz, 30 Ravetz 1993, Liberatore, Funtowicz 2003). In the context of adaptation decision-making, this implies that both 31 strategy and actions as well as the process through which these are determined are important (Lim et al. 2005, 32 Mukheibir, Ziervogel 2007). Thus not only cost-effectiveness and the delivery of direct local benefits in the form of 33 reduced vulnerability will be important, but also participatory inclusiveness, equity, awareness raising, deliberation, 34 argument, and persuasion. 35 36 Access to sound scientific predictions and physical and economic assessments of climate change at local scale (that 37 are rooted in understandings of local risk contexts) is a central challenge. A recent review of urban adaptation and 38 impact assessments found that useful information about climate change at urban spatial scales is still lacking (Hunt, 39 Watkiss 2011). For example Hunt and Watkiss (2011) found that only a small number of cities largely in high-40 income countries have quantified the possible costs of climate change risks under different climate and/or socio-41 economic scenarios and more generally that quantitative risk analysis in local contexts is rare. Sea level rise/coastal 42 flood risk and health and water resources are among the impact sectors where urban analyses exist, while energy, 43 transport and built infrastructure receive far less attention yet are equally important to urban development (Hunt, 44 Watkiss 2011, Hunt, Watkiss 2011, Hunt, Watkiss 2011). Overtime, it will be possible to establish institutional 45 mechanisms that support innovation, collaboration and learning within and across sectors to advance urban 46 adaptation action but this will take time and resources (Mukheibir, Ziervogel 2007, Burch 2010, Anguelovski, 47 Carmin 2011). 48 49 Despite limited information, some action is moving ahead on adaptation at urban scale particularly through initial 50 planning and awareness raising (Hunt, Watkiss 2011, Anguelovski, Carmin 2011, Lowe, Foster & Winkelman 2009, 51 Carmin, Anguelovski 2009). Experience in a handful of cities – i.e. Capetown, London, New York -- demonstrate 52 that the benefits of engaging a wide number and variety of stakeholders at early stages in the risk assessment helping 53 to create political support and momentum for follow-on research and ultimately adaptation planning (Hunt, Watkiss 54
ZERO-ORDER DRAFT IPCC WGII AR5 Chapter 8
Do Not Cite, Quote, or Distribute 62 25 July 2011
2011, Anguelovski, Carmin 2011). Carmin and Anguelovski 2009 also highlight the importance of local leadership 1 and the capacity to be continuously resourceful (despite resource constraints). They show that city leaders can be 2 innovative in the absence of formal institutionalisation of the issue of climate change, often connecting the 3 adaptation (and mitigation) agenda to other local priorities and agendas (e.g. sustainable development and 4 comprehensive urban planning) (Carmin, Anguelovski 2009). 5 6 As a way forward, a climate change/environmental focal point or office can help to champion and coordinate 7 climate action across government departments or line management agencies (Anguelovski, Carmin 2011; Hunt, 8 Watkiss 2011; OECD 2011). Yet there may be downsides to that when the urban climate change function is housed 9 by the environmental line department (e.g. Durban - Roberts, 2008 pg 523; Boston - 10 http://www.cityofboston.gov/environment/; Sydney - Measham et al., 2020 pg 17). Roberts (2010: 401) notes that 11 environment line management or departments are typically among the weakest parts of government. This in turn can 12 marginalise the climate change coordination function given the low or lower priority and limited resources usually 13 assigned to environmental departments within government structures, which results in limited institutional influence. 14 15 There are also important political constraints to making adaptation decisions at the local level. Although there is 16 growing evidence of adaptation leadership in urban contexts (Anguelovski, Carmin 2011, Lowe, Foster & 17 Winkelman 2009, Carmin, Anguelovski 2009, Foster, Winkelman & Lowe 2011), local government decisions are 18 often driven by short term priorities and nearer term concerns about economic growth and competitiveness, making 19 it difficult for them to focus on the more distant implications of climate change (OECD 2009). Inattention by 20 international bilateral and multilateral donors, and tension between governments and the growing numbers of the 21 urban poor in low and medium income developing countries, is partly what makes cities in the South highly 22 vulnerable to climate change. Indeed an ongoing failure to provide basic services – clean water, sewerage, health 23 services and adequate housing – for this large segment of the world’s population can only aggravate vulnerability to 24 inevitable climate change in the decades to come (Satterthwaite et al. 2009). 25 26 27 8.4.1.3. Need to Align Action across Levels of Government – Nested Institutions 28 29 The multilevel nature of institutional and policy interactions in the case of local adaptation governance adds another 30 layer of complexity to the urban adaptation challenge. In particular, it highlights the need for alignment of policy 31 incentives and actions across multiple levels of government (Corfee-Morlot et al. 2011, Mukheibir, Ziervogel 2007, 32 Urwin, Jordan 2008, Cash et al. 2006, Young 2002, Bulkeley, Kern 2006, Kern, Gotelind 2009). From an 33 institutional and policy perspective, local governments will have authority in some of the right domains for 34 adaptation decisions but not in all of them. Also many of their decisions will be bounded or constrained in one way 35 or another by national policies and infrastructure investment decisions. Urwin and Jordan examined top-down and 36 bottom-up approaches to policy in the UK across three sectors (agriculture, nature conservation and water), 37 demonstrating the need to both audit (pre-)existing policies and screen new policies to ensure integration of climate 38 change adaptation concerns. Failing to do so risks mal-adaptation despite the development of pro-active adaptation 39 policies. This can occur when long-standing sector policies do not take climate change into account and lock-in 40 outcomes that raise the vulnerability of people, infrastructure and/or natural systems to climate change (e.g. rising 41 sea levels and storm surge; increased levels and frequency of extreme temperatures or precipitation; risk of flooding 42 or drought/water stress) (OECD 2009, Urwin, Jordan 2008). 43 44 Although adaptation can be guided, incentivised, mandated or constrained by top-down national policies or 45 frameworks, its implementation will ultimately be local in nature. Opportunities for learning and accelerating action 46 may stem from horizontal coordination and networking across actors and institutions in different municipalities – 47 and greater metropolitan areas – many of which will face similar challenges (Lowe, Foster & Winkelman 2009, 48 Aall, Groven & Lindseth 2007, Schroeder, Bulkeley 2008). The local implementation agenda also underscores the 49 need for broad consultation and tailoring and any national goals and policies to local circumstances and preferences, 50 such that they can succeed. A recent example can be found in the public backlash in response to the French 51 government’s attempt to ban urban development and strategic retreat in areas of current and increasing risk to 52 coastal flooding following the storm Xynthia in 2010, due to lack of consultation between government experts and 53 local citizens (Laurent 2010). 54
ZERO-ORDER DRAFT IPCC WGII AR5 Chapter 8
Do Not Cite, Quote, or Distribute 63 25 July 2011
1 2 8.4.1.4 Local Government as a Central Actor in Risk Assessment and Adaptation 3 4 Given their unique access to local residents, businesses & stakeholders, local governments can be effective leaders 5 in urban adaptation efforts. Their role includes not just political representation of local population but also essential 6 strategic urban development and master planning functions. This includes the coordination of more localised 7 community-based plans, and the delivery of a range of public services (e.g. water, waste and wastewater 8 management, transport, education, land use regulation, disaster planning and management, sometimes regulation of 9 built infrastructure and/or energy services) (Bulkeley, Kern 2006, Kern, Gotelind 2009). 10 11 The exact balance of authority for the provision and regulation of key services, land use and infrastructure provision 12 will vary by national and sometimes even regional and local context, making it difficult to generalise notions of 13 “good practice” across locations, however a number of key opportunities can be identified. Given their political 14 representation and strategic planning functions, city governments may be particularly well-placed to work closely 15 with businesses, households and civil society organisations understand and integrate climate change into a common 16 vision for urban development (OECD 2010). As preferences of actors tend to be more homogeneous in small groups 17 (Healy 1997; Ostrom 2009), local level decision-making may have greater potential to envisage a common approach 18 to contentious issues raised by climate change, compared to efforts at national or international levels. With an open 19 and participatory decision process that emphasises “governance” rather than “government”, urban leaders may offer 20 a unique opportunity to work in close proximity to stakeholders, raise awareness and create a “policy space” to 21 create a unique vision of the future that takes climate change into account (Brunner 1996, 2005; Cash and Moser 22 2000; Grindle and Thomas 1991). If the goal is a resilient, safe, and clean city, having a common understanding or 23 vision of what such a future might comprise and the influence of climate change at urban scale is a first step to 24 achieving it (Corfee-Morlot et al. 2011; Moser 2006; Moser and Dilling 2006). Cities also have an opportunity to 25 lead by doing in the way they manage the vulnerability of city-owned infrastructure and municipal operations to 26 climate change. 27 28 A number of local actions can support climate change adaptation decisions in urban contexts. These include 29 performance of local climate change risk assessments, risk mapping and identification of priority “most vulnerable” 30 populations/locations at risk (Ranger et al 2009; Hallegatte et al. 2010; Bigio and Hallegatte 2011 forthcoming; 31 Annecke – get ref Tiempo, Oct 2010). Annecke describes the LOCATE methodology (Local Options for 32 Communities to Adaptat and Technologies to Enhance Capacity), which is being tested in 8 African countries20; in 33 each country a non-governmental organisation partner is working with one or more communities to test it. The 34 methodology steps through i) identification of local “hot spots” and an identification of a “project owner”, ii) project 35 design, iii) implementation, and iv) monitoring, evaluation and learning. Within the vulnerability identification 36 stage, hazard and vulnerability maps are developed; overlaying the two can be a useful tool to inform assessments 37 and choices about what target populations, infrastructure and areas may be priorities for action. Another element is 38 to identify local stakeholders who can help design and subsequently lead implementation of adaptation efforts, in 39 this case the “project owner” or champion on the ground. Climate change adaptation project design or planning is 40 another distinct undertaking however, Satterthwaite et al. (2010) suggest it will remain difficult to implement such 41 plans if they are not conceived and fully integrated with broader development planning initiatives and combined 42 with a clear timeframe for implementation and financing strategy. 43 44 [INSERT FOOTNOTE 20 HERE: Sudan, Kenya, Tanzania, Uganda, Malawi, Zambia, Zimbabwe and South 45 Africa.] 46 47 Where cities are growing rapidly, both challenges and opportunity lie in the routine public and private infrastructure 48 investment that will need to accompany such growth. Provision of basic water and sanitation as well as housing 49 services is a necessary prerequisite for adaptation to occur, however integration of climate change considerations 50 will not occur automatically (Satterthwaite et al. 2009). Public policies that require consideration of the implications 51 of climate change for such investment (e.g. through Environmental Impact Assessment that includes climate change, 52 or building standards that integrate consideration of increased risk from climate hazards), or that provide robust, 53 timely and place-based information to private sector decision makers can help deliver climate-resilient infrastructure 54
ZERO-ORDER DRAFT IPCC WGII AR5 Chapter 8
Do Not Cite, Quote, or Distribute 64 25 July 2011
(OECD 2010b). Notably urban sector policies – such as water, wastewater and other natural resource management, 1 building regulations and transportation planning, disaster management– all provide key entry points for integration 2 of climate change considerations at urban levels of governance. A recent review suggests that this is an effective 3 regulatory tool that requires integration of climate change into infrastructure at the design phases; it is one that is 4 already receiving attention at sub-national government level even where national governments do not necessarily 5 require it (e.g. in Australia). Canada and The Netherlands have also shown that they are quite far along in the use of 6 this tool. 7 8 A number of other steps may help build institutional capacity to make urban adaptation happen. For example, 9 budgetary integration can help ensure that climate change is addressed at urban and other levels of government by 10 establishing resources to support decision but also by making clear who in an organisation is responsible for the 11 decision (OECD forthcoming). In each urban governmental department that has responsibilities to address climate 12 change issues, a separate budget line may be established both to fund relevant actions and to track progress over 13 time. This will make the work visible and also recognise that planning for climate change is an explicit task that 14 requires time and some amount of budget even if small at the outset. 15 16 17 8.4.1.5. Assessment and Delivery of Co-Benefits 18 19 A number of studies look at why and how urban climate action is advancing, asking the question: why act, what are 20 the local near-term benefits of climate change action including adaptation? They suggest that a key to successful 21 action is not only local leadership but also understanding and championing development and other environmental 22 co-benefits of adaptation. Such benefits connect to the overarching goals of urban policy and development, such as 23 delivering safer, more comfortable and healthier urban environments, poverty reduction and reducing the 24 vulnerability of the poor (Burch 2010, Clapp et al. 2010, Hallegatte, Henriet & Corfee-Morlot 2011)(Kousky, 25 Schneider 2003)(Carmin, Anguelovski 2009) Roberts 2010]. Some studies show that climate change considerations 26 can help to finance investment in infrastructure that provide basic service provision and climate protection 27 simultaneously. For example, this is the case in Rio de Janeiro where the CDM has facilitated a methane capture and 28 waste to energy project that provides both a new low cost source of energy as well as an ongoing revenue stream 29 which has allowed the local government to invest in local community amenities (e.g. greenspaces and parks) (Clapp 30 et al. 2010). [Need to consider the scale of the ‘new source’ of energy, GHG reduction and revenue and whether it 31 does bring local benefits; worry that these benefits may be overstated]. Numerous examples of ecosystem-based 32 adaptation to better manage scarce water resources or limit flood risk,21 or renovation of low cost housing to provide 33 basic weatherisation, are receiving increased attention in development finance portfolios as “adaptation” projects or 34 programmes but these projects also deliver multiple development co-benefits to urban areas. 35 36 [INSERT FOOTNOTE 21 HERE: See BMU May 2011, “Harnessing the Potential of Ecosystems for Climate 37 Change Adaptation” – project operating in Brazil, Philippines, South Africa – from 2011-2015, 4.4 million Euros, 38 implemented by Conservation International Foundation.] 39 40 Co-benefits may be particularly important in the global South, where climate change planning and adaptation suffer 41 from low political priority as they are not perceived to be central to urban development priorities. As noted by UN-42 Habitat (undated: 17) when discussing the prevailing situation in Esmeraldas (Ecuador) “it is important to note that 43 most of what has been accomplished in sanitation, infrastructure, and urban planning capacity has not been 44 motivated by concerns over climate change, but through strategies seeking better planning processes and poverty 45 reduction.” The reality is that in the urban areas of the global South, climate change is generally of low political 46 significance because of other pressing development needs, e.g. infrastructure, public health, education, housing and 47 energy, which are not considered to be linked to climate change (Roberts, 2008 pg 523; Kithiia, 2009: 25 and 1). 48 This situation is compounded by the escalating ‘urbanization of poverty’ that has occurred in these parts of the 49 world, making cities the nexus where poverty and climate change compete for political attention (Kithiia, 2009: 1). 50 Within this context the challenges posed by climate change are viewed as marginal when compared with other 51 socio-economic problems faced by authorities responsible for urban development and security. 52 53
ZERO-ORDER DRAFT IPCC WGII AR5 Chapter 8
Do Not Cite, Quote, or Distribute 65 25 July 2011
The potential tension between attention to poverty alleviation and development on the one hand, and climate change 1 strategies on the other, is affirmed by other recent work by urban development practitioners from the South. A 2 recent UN-Habitat report states (undated b: 18); “People in the developing world take advantage of the resources at 3 their disposal (labour, capital, entitlements) and are willing to accept a necessary level of risk. Adaptation strategies 4 need to recognize and accept this reality rather than propose ideal courses of action that cannot be realized.” Given 5 this situation, local authorities in the global South often do not view climate change as a management problem 6 requiring immediate attention due to the plethora of competing stresses and development challenges (Kithiia and 7 Dowling, 2010 pg 470; Roberts 2008, pg 523). 8 9 Similarly in the North, development and climate change or green growth issues are often seen as separate challenges 10 in a sub-national, regional policy context (OECD 2010, Ch. 8). A recent review of regional policy and climate 11 change in OECD countries revealed that only Japan and South Korea are championing climate action as an integral 12 part of development policy at sub-national levels, while Finland and Sweden also have innovative sub-national 13 climate policies and action programmes which are incentivised and funded by the central government. For the 14 majority of OECD countries territorial development and climate protection remain separate or parallel areas of 15 action, raising inevitable tension and conflict between the two and limiting the ability to seek and exploit co-16 benefits. 17 18 As a general rule, any adaptation strategy has to be developed within “the development context of the city or country 19 and should lead to harmonization with the country’s priorities such as poverty alleviation, food security and disaster 20 management” (UN-Habitat, undated b, pg 15; see also Satterthwaite et al. 2009). If the adaptation agenda is to be 21 advanced, it will require the use of innovative measures that couple climate change impacts with the reduction of 22 poverty and development more generally (Lwasa, 2010 pg 167). As concluded by Kithiia (2010: 4): “In general, 23 without combating urban poverty and providing alternative sources of livelihood, little will be achieved towards 24 climate change mitigation and adaptation, not just in East Africa but also in other low income countries.” 25 26 27 8.4.1.6. Summary Points 28 29 In summary, effective urban adaptation governance will depend at least in part on regional (sub-national, multiple 30 localities) and national institutional capacity and policy, suggesting that it will necessarily be polycentric in nature 31 (Ostrom 2009). There is a need not only to create new urban policy and incentives for action but also to “climate 32 proof” or audit existing policies to ensure that they do not lead to greater vulnerability and risk (Urwin and Jordan 33 2008). Yet capacity constraints, including limited technical expertise and ill-designed institutional mechanisms, will 34 limit the ability of local authorities to work more effectively with other local, regional and national authorities on the 35 adaptation agenda. Similarly in many instances national governments are lagging in efforts to support local leaders 36 on this important agenda (OECD 2010a). 37 38 Some review articles, and the foregoing discussion, suggest a number key institutional drivers of success to advance 39 adaptation at urban levels (Anguelovski & Carmin 2011; Corfee-Morlot et al. 2011; Vogel et al. 2007;) + OECD 40 2010: 41
• Stable, local leadership and an open, iterative process that encourages stakeholder engagement; 42 • Sound information and continuous learning about risk and risk assessment including i) hazard assessment; 43
ii) vulnerability assessment; iii) capacity/institutional assessment and capacity building; 44 • Policy level commitment to design and implement adaptation policy (integrating a long term planning 45
perspective with short term goals), mainstream it into sector or core development principles, recognising 46 and exploiting co-benefits between climate action and development goals 47
• Support from national and regional governments for local adaptation action 48 • Institutional reforms to establish functions/responsibilities within government (possibly through 49
independent climate office or part of the administration) as well as clear rules and norms to take adaptation 50 action 51
52 Further an important starting point is to establish mechanisms for information diffusion, awareness raising about 53 climate change – both mitigation & adaptation and their interconnections -- to provide political support for action. 54
ZERO-ORDER DRAFT IPCC WGII AR5 Chapter 8
Do Not Cite, Quote, or Distribute 66 25 July 2011
1 2 8.4.2. Funding and Supporting Urban Governments – Public Sector Domestic Action 3 4 Funding and other forms of support for urban adaptation action can come from the public or private sector, from 5 domestic or international sources. Among the possible sources of funding, domestic public funding may be the most 6 significant and sustainable source in many countries, including revenues from locally levied fiscal policies as well as 7 revenue transfers or grants from sub-national regional and central governments (OECD 2010, Ch 9; Hedger and Bird 8 2011). 9 10 In countries where property markets are well-functioning and some fiscal authority exists at local levels of 11 government, revenue sources that might be used to support adaptation and include taxes, fees & charges. Looking 12 across OECD countries, analysis shows that local governments are responsible for about 70% of public spending 13 and for roughly 50% of the public spending that occurs on the environment, often operating in partnership with other 14 levels of government (OECD 2010, ch 9). The source of funds for such spending varies widely by city and location, 15 including not just local sources of revenues but also grants from central or higher levels of governments (OECD 16 2010, Ch 9). Fore example, in Melbourne, Australia, property tax is the main local tax revenue source for the city, 17 while in Stockholm it is local income tax and in Prague it is a mix of income, sales and business tax. The balance of 18 local revenue sources available to a city depends upon the national institutional and legislative framework that 19 devolves some authority to tax or impose other fiscal policies on local residents, property owners and businesses. In 20 all instances there is some scope to green local fiscal policies for example through congestion charges or value-21 capture taxes that make visible the cost of environmental externalities and/or the benefits of infrastructure and 22 services provided to property owners (e.g. transportation or wastewater or water services). Much less is known about 23 local revenue sources in developing countries. 24 25 Another important source of funding for local adaptation action is national or regional (sub-national) grants, loans 26 and other forms of revenue transfer. OECD (2010) states: “In cases where environmental policies with large 27 spillovers are assigned to local governments, intergovernmental grants could make sense in order to compensate 28 local governments for the external benefits of its expenditures.” See for example the case of municipal financing 29 distributed according to ecosystem quality rankings in Brazil (see Box 8-2). 30 31 _____ START BOX 8-2 HERE _____ 32 33 Box 8-2. Environmental indicators in allocating tax shares to local governments in Brazil 34 35 The tax on the circulation of goods and services (ICMS) is a value-added tax collected by state governments, and 36 part of these revenues must be redistributed among municipalities. Three-quarters of this redistribution is defined by 37 the federal constitution, but the remaining 25% is allocated to each state’s legislation. The state of Paraná was the 38 first Brazilian state to introduce the ecological ICMS (ICMS-E) in 1992, followed by the states of Minas Gerais in 39 1996, and several other states including São Paulo in 1996 and Rio de Janeiro in 2009. The ICMS-E was introduced 40 against the background of state-induced land-use restrictions (protected areas) for several municipalities, which 41 prevented them from developing land and generating value added, without being compensated for these restrictions: 42 in the municipality of Piraquara, for example, 90% of the municipal territory was a designated protected area for 43 conserving a major watershed to supply the Curitiba metropolitan region with drinking water (May et al., 2002). 44 45 Depending on the different states, the share of the ICMS allocated on the basis of ecological indicators ranges from 46 0.5% in São Paulo to 13% in Tocantins. Rio de Janeiro started with 1% in 2009, which will be gradually increased 47 to 2.5% in 2011. Although the states have different systems in place, there are many commonalities in the allocation 48 mechanism. The revenues are allocated according to the ecological index of a municipality, which is based on the 49 total area set aside for protection, in relation to the total area of the municipality. The protected areas are weighted 50 according to the different categories of conservation management, with weights ranging from 1.0 (for ecological 51 research centres and biological reserves) to 0.1 (for special local areas of tourist interest, and buffer zones). 52 53
ZERO-ORDER DRAFT IPCC WGII AR5 Chapter 8
Do Not Cite, Quote, or Distribute 67 25 July 2011
Some states, such as Paraná, have included an evaluation of the quality of the protected areas in the calculation of 1 the ecological index. The quality of the protected area is assessed by regional officers of the state environmental 2 agency on the basis of physical quality, biological quality (fauna and flora), quality of water resources, physical 3 representativeness, and quality of planning, implementation and maintenance. 4 5 Evaluations of in Paraná and Minas Gerais show that the introduction of the ICMS-E has been associated with the 6 creation of new protected areas and have improved environmental management and quality of these areas. In Paraná, 7 the total area measured in conservation units increased with 165% between 1992 and 2000; the increase in Minas 8 Gerais was 62% over 1995-2000 (May et al., 2002). The ICMS-E has also improved relations between protected 9 areas and the surrounding inhabitants, as they start to see them as an opportunity to generate revenue, rather than an 10 obstacle to development. The ICMS-E has built on existing institutions and administrative procedures, and thus has 11 had very low transaction costs (Ring, 2008). 12 13 Source: Ring, I. (2008), “Integrating Local Ecological Services into Intergovernmental Fiscal Transfers: The Case of 14 the Ecological ICMS in Brazil”, Land Use Policy, Vol. 25, pp. 485-497; May, P. et al. (2002), “Using Fiscal 15 Instruments to Encourage Conservation: Municipal Responses to the ‘Ecological’ Value Added Tax in Paraná and 16 Minas Gerais, Brazil”, in S. Pagiola, J. Bishop and N. Landell-Mills (eds.), Selling Forest Environmental 17 Services:Market-based Mechanisms for Conservation and Development, Earthscan, London. – as cited in OECD 18 2010 19 20 _____ END BOX 8-2 HERE _____ 21 22 Large economic and humanitarian spillovers are clearly associated with adaptation actions that limit the risk from 23 extreme climate events in urban areas. Recent extreme events in a variety of development contexts demonstrate this 24 – from Hurricane Katrina in New Orleans in 2005 to devastating floods in Colombia in 2010, from the deadly heat 25 wave in Europe in 2003 to the paralysing snowstorm in China in January 2008. Failing to anticipate and plan for 26 such events can lead to large scale disaster with national or international economic repercussions spanning multiple 27 years if not a decade for both poor and wealthy nations (World Bank 2010b). In many locations, climate change 28 shortens the return period of large storms, increasing their frequency. Many large, rapidly growing cities that are 29 already ill-adapted and exposed to natural hazards and extreme weather events -- cyclones, coastal flooding due to 30 storm surge, extended heat waves or heavy precipitation or drought. These cities will suffer significantly from 31 increased exposure to such events in the coming decades if their vulnerability is not well managed (World Bank 32 2010a, Hallegatte, Corfee-Morlot 2011). That climate change increases risk of weather-related disasters in urban 33 areas argues for increased funding and attention from national budgets for disaster planning, early warning and 34 evacuation procedures along side of preventive measures (World Bank 2010b, World Bank 2010a, Hallegatte, 35 Corfee-Morlot 2011). 36 37 A number of other innovative financial mechanisms exist and may be drawn upon to support urban adaptation 38 action, including revolving funds and the energy services company (or the “esco”) model (OECD 2010, Ch. 9 & Ch 39 8). The latter may take revenue streams say from a CDM project (Puppim de Oliveira 2009), or financial savings 40 from an energy efficiency investment in municipal buildings to feed an ongoing public fund that can in turn support 41 public investments that yield adaptation benefits. 42 43 Cities and other governments in developed and in high and medium income developing countries, may also have 44 direct access to debt instruments such as bond markets or loans from national (or regional) development banks or 45 financial institutions (OECD 2010)(+EIB 2011). Local access to capital markets to fund adaptation investments can 46 also be facilitated through risk-sharing mechanisms or financial guarantees instruments provided by external or 47 domestic development banks (e.g. Kfw provides low-interest funds to local banks which in turn finances energy 48 efficiency renovations in building /EIB example to support residential and commercial retrofit and renovation 49 investments)(OECD 2010; Kfw 2011 – ppt; EIB xx) 50 51 52
53
ZERO-ORDER DRAFT IPCC WGII AR5 Chapter 8
Do Not Cite, Quote, or Distribute 68 25 July 2011
8.4.3. Recognizing Role of and Supporting Community-Based Adaptation 1 2 8.4.3.1. Community-Based Action and Local Government 3 4 As discussed above, community based adaptation does not remove the need for extra-local interventions – including 5 investments in infrastructure and services and support for community action. Now, it is increasingly seen as an 6 important component of adaptation whose effectiveness depends on extra-local support and its integration within 7 adaptation at other scales and levels (Tanner et al 2009, Burton 2008). 8 9 A study of three experiences with disaster risk reduction in informal settlements in Georgetown, Santo Domingo and 10 Port-au-Prince highlighted the importance of support from local governments and civil defence organizations 11 (Pelling 2011b). In the Guyanese and Haitian cases, community action was stifled by bureaucratic processes; the 12 government was not actively hostile to community action but such action was discouraged by the lack of active 13 support and official recognition. In Santo Domingo, a more open and diversified urban governance regime and one 14 with a long history of local action at political and practical levels meant local activity was recognised as legitimate. 15 This received further support from a local NGO that was respected by communities and local government and that 16 provided continuity in support. In these cases, key actors in urban governance included the Red Cross, Civil 17 Protection and local development committee members who sat on community committees. 18 19 This study showed how generating trust between local government and community groups takes time and external 20 funders may under-estimate the time needed to achieve this (Pelling 2011b). Governments and international 21 agencies often over-estimate community capacity and under-estimate the difficulties for community organizations to 22 develop and sustain community initiatives for risk reduction (Wamsler 2007, GAR 2011, Hardoy and Pandiella 23 2011, Colina F et al 2004). External agencies may assume that each informal settlement (or other residential 24 neighbourhoods) has an organized body with community leaders that are representative and also interested in 25 working on risk reduction. But they often have other more pressing priorities or they have community organizations 26 that are not representative. 27 28 The case studies of community based action in urban areas suggest that their effectiveness may be as much in what 29 they can catalyze as do – for instance as community organizations or networks and federations of community 30 organizations are successful in making demands for action within their locality and in it forming part of a larger 31 coalition to undertake work on a larger scale or to have more influence in dealings with government and 32 international agencies. 33 34 Douglas et al 2008 highlighted how effective action to reduce flood risks in urban areas often depended on 35 community organizations, local government and higher levels of government working together – within different but 36 complementary capacities. In relation to flooding, local communities were often best positioned to manage localized 37 flooding resulting from inadequate drainage with local authorities best placed to cope with flooding from small 38 streams with catchment areas almost entirely within the urban built up areas. Action was also required from national 39 agencies if major rivers (with their river basins in several different administrative regions) overtop their banks. 40 The 2011 Global Assessment Report on Disaster Risk Reduction noted that effective local governance relies on 41 adopting approaches to local planning, financing and investment that build on partnerships with civil society, 42 particularly with risk-prone households and their representative organizations. “This allows for the scaling up of 43 community initiatives. Where community organizations have only limited capacity to reduce disaster risk and to 44 hold governments to account, meso-level partnerships with other organizations, expert institutions and government 45 bodies can improve the success of local and community-driven disaster risk reduction” (GAR 2011, page 156) 46 47 48 8.4.3.2. Community-Based Risk and Vulnerability Mapping 49 50 One increasingly common method by which the residents of low-income informal settlements seek to develop their 51 relations with local governments is by documenting and mapping their settlements (see for instance Patel 2004, 52 Weru 2004, Karanja 2010). This has been supported by the development of national federations of slum or shack 53 dwellers in many nations – and many national federations have prepared city-wide surveys of informal settlements 54
ZERO-ORDER DRAFT IPCC WGII AR5 Chapter 8
Do Not Cite, Quote, or Distribute 69 25 July 2011
and enumerations and censuses of informal settlements – the documentation needed for acting to improve conditions 1 and install or improve infrastructure (CORC 2006, Weru 2004, Pamoja Trust and SDI 2008, Karanja 2010). 2 Although community-based surveys, enumerations and maps were not developed with climate change adaptation in 3 mind, some have collected detailed data about the impacts of local severe weather events and have analyzed these so 4 they include risk and vulnerability assessments (Livengood 2012). The community mapping process in Cuttack 5 covered over 300 informal settlements and included the preparation of digital maps at the city scale for the city 6 authorities that showed each informal settlement. The mapping and data gathering about each informal settlement 7 was done by the federation of women’s savings groups (Mahila Milan), supported by a local NGO and local 8 government. These maps and the data gathered about each informal settlement are being used to negotiate the 9 support needed for upgrading (or where existing sites are too risky, land for rehousing) and thus also risk reduction 10 to extreme weather. The first step in this mapping was to develop a complete list of informal settlements. This 11 included the Mahila Milan savings groups identifying many informal settlements that were not on the local 12 government list. Each informal settlement was visited by Mahila Milan representatives and staff from a support 13 NGO to develop a profile of the settlement (including details of how they had been impacted by extreme weather. 14 This group then walks the boundaries of the settlement, marking it with a GPS device. So this provided the basis for 15 a digital map of the city showing the informal settlements and detailed data on each informal settlement linked to the 16 map and so incorporated into a GIS system. This provides the information base through which the residents of 17 informal settlements and city government discuss what needs to be done. 18 19 Some of these surveys and maps have had an explicit focus on identifying settlements at high risk from extreme 20 weather. In the Philippines, as described in Box 8-3, this now includes an interest in documenting and mapping 21 vulnerabilities and risks to extreme weather in ways that identify how to reduce these and build resilience. 22 23 _____ START BOX 8-3 HERE _____ 24 25 Box 8-3. Shifting from community-driven disaster response to disaster risk reduction in the Philippines 26 27 The Philippines Homeless People’s Federation is a national network of 161 urban poor community associations and 28 savings groups with more than 70,000 members from 18 cities and 15 municipalities. The national federation and 29 member local federations are engaged in many initiatives to secure land tenure, build or improve homes and increase 30 economic opportunities, working wherever possible with local governments. They have also been working in 31 locations impacted by disasters, building community-capacity to take action to meet immediate and long-term needs 32 (refs). Drawing from this experience, the Federations is also developing initiatives for risk reduction to extreme 33 weather as it identifies at-risk communities in cities and municipalities and supports the design and implementation 34 of risk reduction. City-wide enumerations identify and support at-risk communities and help provide documentation 35 on informal settlements for which there is little or no official data. The Federation and PACSII (an NGO that 36 supports the Federation) are identifying and profiling at-risk communities in 12 cities and 10 municipalities located 37 in Luzon, Visayas and Mindanao. This focuses on informal settlements located under bridges, on cliffs and other 38 landslide prone areas, coastal shorelines and riverbanks, public cemeteries, near open dumpsites and those in flood-39 prone locations. 40 41 The Federation works with The Environmental Science for Social Change (ESSC) that is knowledgeable in disaster 42 mapping and risk assessment and this helps to capacitate communities to undertake a community-driven risk 43 assessment. The Federation overlays the data from these assessments with local maps which the ESSC helped 44 develop for the selected high risk communities. This provides the basis for the federation to negotiate with local 45 government in planning for disaster risk reduction. The Climate Change Act of 2009 (RA 9729) and the Philippine 46 Risk Reduction and Management Act of 2010 encourage neighbourhood level (barangay) and city government to 47 take the results of enumerations into consideration in their disaster response and risk reduction plans. 48 49 A review of the work of the federation to date with many local governments on disaster response and disaster risk 50 reduction suggests the possibilities for this to develop to include climate change adaptation will be supported and 51 sustained by four factors: strong community networks (that can lobby for risk reduction policies that are community-52 driven), alternative financial facilities (including support for insurance for low income households and loans for 53 reconstruction or rehabilitation and upgrading), technical support (to advise on site selection, land acquisition, 54
ZERO-ORDER DRAFT IPCC WGII AR5 Chapter 8
Do Not Cite, Quote, or Distribute 70 25 July 2011
housing and settlement designs, zoning based on geo-hazard maps and easy-to-comply building standards) and 1 community-based information systems (including community enumeration and risk assessment). 2 3 Source: Carcellar, Rayos Co and Hipolito 2011 4 5 _____ END BOX 8-3 HERE _____ 6 7 8 8.4.4. Role of Private Sector (including Market-Driven Responses) and Civil Society 9 10 8.4.4.1. Introduction 11 12 Some analysts argue that adaptation investments will be largely undertaken by the private sector (Bowen , OECD 13 2008), while in international discussions it is often assumed that the public goods nature of adaptation will require a 14 major public investment to cover the principal needs in the South (AGF 2010 CHECK). Another way to look at the 15 need for private sector engagement in adaptation is to note that the scope for adaptation investments will far exceed 16 available funds from public budgets (Hedger 2011)(OECD 2008, World Bank 2010). Both public and private 17 investment will be required to address adaptation. Where markets are well functioning, reliable information and 18 good awareness of climate change risks should be sufficient to incentivize individuals, households, businesses to 19 make pro-active adaptation decisions. However the heightened risk of disaster due to increased climate change 20 cannot be easily addressed through private action alone, where the poorest and most vulnerable populations will be 21 the least able to protect themselves through private action and where insurers may be reluctant to act. 22 23 24 8.4.4.2. Incentivizing Private Investment and Action – Policy Frameworks, Information 25 26 Private sector engagement in adaptation can help to limit climate impacts and risks. The majority of the investment 27 required for sound adaptation is likely to come from a multitude of small scale private decisions spanning 28 individuals, households and firms (Bowen , Fankhauser et al. 2008). If reliable information about climate change is 29 available, adaptation will occur where markets are well functioning, even without policy incentives. For private 30 autonomous adaptation to occur however, a pre-condition is well-functioning property markets where individuals 31 and businesses are responding to economic signals and information about past weather events and climate, as well as 32 future reliable predictions of climate change. Eakin et al. 2010 and Chu and Schroeder 2010 suggest that the private 33 sector role may become more prominent when the local governments and/or other civil society component of the 34 governance structure are limited [need to discuss, is this likely?] 35 36 Public policy will be needed to establish enabling conditions for markets to function and allocate scarce resources 37 most efficiently to highest adaptation options with the highest benefits. For example, where information is highly 38 uncertain or not consistent with past experience, such as is the case for the prediction of extreme weather events and 39 potential losses from these, public policy may also play a role to facilitate what will inevitably be gaps in insurance 40 markets (Fankhauser et al. 2008, Mills 2007). Public policy will also be needed to establish markets and valuation of 41 relevant market externalities; for example policy is needed to value ecosystem services that provide adaptation 42 benefits such as storm buffering and flood protection delivered through mangrove protection in coastal zones 43 (Fankhauser 2008). 44 45 For markets to work in favour of urban adaptation, businesses and consumers will need access to reliable 46 downscaled projections of climate change and tools for risk screening and management (AGF 2010; UNEP-FI – 47 SBI/jan 2011). A recent UNEP-FI survey of the financial business sector underscores the need for regional and local 48 climate predictions and hazard mapping, as well as risk screening tools; it suggests that there is both a public and a 49 private role to invest in and provide such information (UNEP-FI, 2011). Local information on other possible stress 50 factors in an urban context that intertwine to affect the impacts of climate change is also necessary to help 51 understand possible climate change impacts; these include socio-economic factors such as urban population growth, 52 age distribution, and wealth as well as natural resource profiles such as urban water supply and management 53
ZERO-ORDER DRAFT IPCC WGII AR5 Chapter 8
Do Not Cite, Quote, or Distribute 71 25 July 2011
practices, land use and building regulations, and energy sources and institutional structure in the urban context 1 (Hallegatte, Henriet & Corfee-Morlot 2011). 2 3 Global trends in losses from weather-related climate change, averaged yearly from 1980 to 2004, show that they 4 continue to climb at a pace that exceeds socio-economic growth trends and that the variability in losses is also 5 increasing in the same period (Mills 2007; see Figure 8-4). Mills also cites available data to show that: “… ‘‘all’’ 6 weather-related natural disasters totalled $1 trillion ($2003), divided approximately 40/60 between wealthy and poor 7 countries, respectively. Between 1980 and 2003, insurance covered four percent of the total costs of weather-related 8 disasters in low-income countries and 40 percent in high-income countries” (Mills 2007: 812; citing Munich Re 9 2004). 10 11 [INSERT FIGURE 8-4 HERE 12 Figure 8-4: Title? (Mills, 2007).] 13 14 Despite the low level of insurance coverage available today in low-income countries, Mills (2007) considers the 15 insurance sector to have high capacity to assist with adaptation, with the potential to compensate for disasters in 16 these countries far exceeding the capacity of international aid. Ultimately the largest source of financing for disaster 17 recovery remains domestic budgets and individuals, estimated to cover 99% and 60% of disaster costs in low-18 income and high-income countries respectively. [Consider introducing figure from Mills 2007] 19 20 [INSERT FIGURE 8-5 HERE 21 Figure 8-5: Title? (Mills, 2007).] 22 23 Insurance mechanisms provide a means for private sector to support individual and business adaptation. The role of 24 the insurance industry is widely acknowledged for risk management in flood prone areas (Rosenzweig and Solecki 25 2010), however a variety of different types of insurance are relevant to adaptation ranging from health and life 26 insurance to property insurance (Mills) as well as micro insurance mechanisms (see below). Insurance markets play 27 a role in adaptation both by sharing and spreading risk from climate change, thus directly reducing the damage costs 28 from climate change, and by sending market signals to individuals, households and firms about the nature of climate 29 change risks and how to better manage it (Fankhauser ; Mills). For example, insurers could in theory signal climate 30 change risk homeowners by raising the premiums for insurance in areas that are at increasing risk of fire damage or 31 flooding given to regional predictions of climate change, or simply refuse to insure houses that are not meeting high 32 standards of weatherisation to withstand storms and extreme heat (Mills - LBL; Germanwatch; UNEP-FI). However 33 in practice it may be difficult to predict increased risk due to climate change and there is uncertainty around how 34 climate change will unfold in any one location. Thus insurance markets are inevitably constrained both by both 35 information and how insurance companies access and use the information about climate change. 36 37 Insurance companies themselves are also vulnerable to climate change and in many ways have become a 38 constructive pro-active force in the fight against it (Mills 2007). They are investing large sums in their own research 39 to raise awareness about the risks of climate change and have long been active in national and regional regulatory 40 processes that institutionalise actions to lower the risks, such as through strengthened building standards. Innovative 41 insurance mechanisms are also being explored and may play a role to support adaptation on a regional scale in the 42 future. 43 44 Private investment or standard insurance markets will not however protect marginalised population whether in poor 45 developing countries or developed countries, where there is no money to be made (or lost) – here public funding will 46 be needed (Ranger, Muir-Wood & Priya 2009, Hallegatte et al. 2010). In particular, where risks are high (as they are 47 in most informal settlements) and capacity to pay is low, insurance will play little if any role to spread risk. In an 48 analysis of Mumbai adaptation options to flood risk, researchers demonstrated that while insurance could potentially 49 limit mitigate some of the damages to built infrastructure, property and the economy from the flood hazards, a large 50 population of urban poor are already at risk to urban flooding. Around half of Mumbai’s population live in ‘slums’ 51 most of which have inadequate provision of basic infrastructure (REF) The risk profile for this marginalised 52 population working in the informal economy is set to increase under most scenarios of climate change and this 53 population will not be assisted by insurance mechanisms. People and businesses operating in the informal economy 54
ZERO-ORDER DRAFT IPCC WGII AR5 Chapter 8
Do Not Cite, Quote, or Distribute 72 25 July 2011
will rely instead upon government assistance and local solidarity (family and community support) to respond when 1 disaster hits and to prepare for the next event (Hallegatte et al. 2010). In informal settlements in many nations in 2 Africa and Asia, informal savings groups where most savers and most savings managers are women have particular 3 importance for providing their members with rapid access to emergency loans (Mitlin 2008). 4 5 Microfinance schemes (MFS) have potential to support pro-poor adaptation through a variety of different 6 instruments including micro-credit, micro-insurance and micro-savings schemes. Microfinance is a means to help 7 families and individuals that hover around the poverty line to build and diversify assets, and in doing so it is also a 8 means to reduce vulnerability to climate change and extreme events such that the impact is not as immediately 9 damaging as it would have been otherwise (Hammill, Matthew & McCarter 2008). As Hammill et al. (2008: 117) 10 state: “The value of MFS holds for climate change adaptation is in its outreach to vulnerable populations through a 11 combination of direct and in-direct financial support, and through the long-term nature of its services that help 12 families build assets and coping mechanisms over time, especially through savings and increasingly through 13 microinsurance – products and sharing of knowledge and information to influence behaviours.” Micro-insurance 14 may be the only formal means to share risk in poor areas at high risk to weather events. 15 16 Although typically more costly than commercial bank loans22, such financing can be used to support entrepreneurial 17 undertakings that are not otherwise eligible for bank loans, for example, due to their small size or lack of credit 18 history. In doing so, microfinance may be one tool to help to diversify the economy; it may also help employ and 19 empower women in particular, which can in turn contribute to adaptive capacity in a local context (World Bank 20 2010a, Agrawala, Carraro 2010). Linking provision and favourable terms of microfinance to environmental 21 performance is possible and helps to deliver environmental protection and ecosystem services that in term limit 22 vulnerability of the poor to climate change. For example, Hammill et al (2008:120) report that in Nicaragua a local 23 microfinance schemes offered lower interest rates to farmers who undertook soil and water management practices. 24 While documenting the potential for microfinance to make a positive contribution to adaptation, an empirical 25 analysis of MFS in Bangladesh and Nepal also identifies cases where it can aggravate vulnerability to climate 26 change at local levels (Agrawala and Carraro 2010). For example, it may emphasise short-term gains by 27 encouraging growth in hazard prone areas and sustaining livelihoods in a status quo pattern, when taking longer 28 term climate change into account would argue for diversification and shifting of settlements and type of livelihood 29 strategies. This evidence argues for a “climate-proofing” of microfinance practices to ensure it delivers on the 30 potential to strengthen adaptation amongst the poor. There is also potential to target its use to priority tasks that will 31 deliver adaptation and development benefits in the nearer term e.g. disaster planning and early warning systems or 32 community based technical training and education (Agrawala, Carraro 2010). Microfinance also provides a means 33 for donors to deliver support to among the most vulnerable communities without creating an ongoing dependence on 34 aid (Agrawala and Carraro 2010; Hammill et al. 2008). 35 36 [INSERT FOOTNOTE 22 HERE: Interest rates associated with microfinance are typically significantly above 37 market rates – see discussion in Agrawala and Carraro 2010.] 38 39 One limitation of micro-finance for adaptation is that it provides credit to individuals for their use and so it is not 40 easily used to help finance collective investments – for instance to improve drainage or provision for sanitation 41 within communities. In many nations, the savings groups mentioned earlier that are formed by (mostly women) slum 42 or shack dwellers have pooled their savings and use these for collective investments that reduce risk within their 43 existing settlement or reduce risk by allowing them to negotiate land and support where they can build new homes 44 (see for instance Manda 2007, Mitlin and Muller 2004) 45 46 [Limitations of micro-finance for buying or building housing for low-income groups as this is too expensive – but its 47 contribution to improving or extending existing housing, if low-income households have their own home] 48 49 Another innovative insurance and risk management mechanism that is currently being piloted is an insurance pool 50 that is operating across the Caribbean as a risk management mechanism (Germanwatch 2010 – Climate Risk Index 51 paper). The Caribbean Catastrophe Risk Insurance Facility (CCRIF) is the only multi-country risk pool that exists 52 today, and aims to serve as a regional risk management facility for the adaptation and insurance programme in the 53 Caribbean. Between 2011 and 2014, the CCRIF has planned to “… design and implement products that combine 54
ZERO-ORDER DRAFT IPCC WGII AR5 Chapter 8
Do Not Cite, Quote, or Distribute 73 25 July 2011
risk reduction and insurance for low income groups such as small-holding farmers and day labourers in the 1 Caribbean.” [Possible to add box on CCRIF] It is a form of public-private partnership, which centres on both new 2 instruments and information provision to guide adaptation decisions, including but not limited to policies, in the 3 region. Emerging from a 2007 ministerial meeting, it pools resources from Bermuda, Canada, France, the UK, the 4 Caribbean Development Bank and the World Bank with a total of US $47 million pledged to date [Check]. Lessons 5 learnt from this experience will undoubtedly prove useful for other regions. 6 7 8 8.4.5. Role of International (Development) Assistance Agencies and Humanitarian Sector 9 10 [will need to look for urban angle here; hard enough to monitor adaptation finance; impossible to monitor urban 11 adaptation finance. Worth discussing reluctance of many bilateral agencies to invest in urban areas or even to have 12 an urban policy] 13 14 15 Multilateral humanitarian assistance, disaster management and the MDGs 16 17 • Multitude of different channels to funnel funding for adaptation, e.g. Humanitarian Hyogo framework for action 18
2005-2015; MDGs – how they relate to urban adaptation: 19 – Key outcomes – recent international commitments to climate change and disaster risk reduction financing. 20
• Other Disaster management funds – are there any – urban dimensions? 21 (Satterthwaite et al. 2007) 22
23 24 Multilateral development and bilateral climate finance channels 25 26 The UNFCCC decisions at COP16 in Cancun committed developed countries to a scaling up of financial support for 27 climate change, with balanced attention to mitigation and adaptation. For the first time, adaptation is expected to 28 receive relatively large sums of funding through both multilateral and bilateral channels. In the Cancun Agreements, 29 developed countries committed to provide 30 bn USD of new and additional funding between 2010 and 2012, and to 30 the goal of mobilizing 100 bn USD per year (from both public and private sources) by 2020. 31 32 In general there are no consistent and complete data sets available yet to track adaptation funds as part of the 33 emerging international effort to direct public finance to support climate change, however some data and evidence is 34 emerging. For example, an initial review of progress made to deliver “fast start finance” (FSF) is available from 35 Parties’ recent submissions to the UNFCCC. These submissions suggest that significantly more public funding is 36 available for adaptation from bilateral donors and their multilateral partners than ever before documented.23 [need to 37 cite submissions; also to review submissions & add detail – how much is committed in FSF to adaptation?] One 38 study across 5 development cooperation agencies24 suggests that just under one-third of climate change funding in 39 2009 was committed to adaptation, representing close to 4 bn USD per year, of which about 95% is estimated to be 40 concessional or aid (largely loans with about 14% of the total being grants) (UNEP 2010). This is estimated to 41 represent about a 30% increase by the same agencies in funds committed to adaptation compared to 2008. While the 42 data reported do not allow separation of the concessional and non-concessional financing at a sector level, it is 43 interesting to note that three-quarters of adaptation funding identified by these donors is in the water supply and 44 treatment sector25 and another 20% is directed to sectors that are urban relevant (i.e. transport, policy loans, disaster 45 risk reduction) (see Figure 8-6; UNEP, 2010). Interestingly health and energy have not received any attention to date 46 from these donors despite the fact that these sectors are amongst the most exposed to climate change. 47 48 [INSERT FIGURE 8-6 HERE 49 Figure 8-6: Title? (based on data from UNEP 2010, Bilateral Finance Institutions and Climate Change: A Mapping 50 of 2009 Climate Financial Flows to Developing Countries).] 51 52 [INSERT FOOTNOTE 23 HERE: This ignores the question of “new and additional”, for which a technical 53 definition and means of measurement does not exist. Estimates from these submissions as well as from a recent 54
ZERO-ORDER DRAFT IPCC WGII AR5 Chapter 8
Do Not Cite, Quote, or Distribute 74 25 July 2011
studies suggest growing attention to climate change and within this adaptation within development assistance 1 portfolios.] 2 3 [INSERT FOOTNOTE 24 HERE: The study covers three bilateral agencies: Japan’s JICA, French AFD, German 4 KFW; and 2 multilateral or regional development agencies: the European Union’s European Investment Bank and 5 the five Nordic country donor organisation of the Nordic Environmental Finance Corporation (NEFCO).] 6 7 [INSERT FOOTNOTE 25 HERE: Interestingly about half of all adaptation funds in 2009 from this cluster of donors 8 are from a single donor – JICA –the water supply/treatment area.] 9 10 One of the newest developments in climate change financing is the large number of vertical (dedicated) climate 11 change funds operated by the World Bank and other multilateral financial institutions (cite WBCSD brochure; ODI 12 website; AGF). These have potential to shift the balance of climate change funding somewhat towards adaptation 13 and away from what has been more dominantly attention to the mitigation agenda. However action is slow and 14 design features of these vertical funds, with direct access, may exacerbate problems such as lack of access to funds 15 for the poorest of nations as well as lack of integration with country systems for development and ownership of 16 resulting programmes or projects (Germanwatch 2010; WB; ODI website; Oxfam …). 17
• To add some detail on the vertical funds as they pertain to adaptation 18 • Adaptation fund – unfccc – what role urban? 19 • Cancun; Green Climate Fund – a new mechanism – different windows including adaptation; Cancun 20
commitment to balanced treatment of adaptation and mitigation 21 22 Conventional delivery institutions – through multilateral and bilateral channels – appear to be playing the biggest 23 role in adaptation financing, though new vertical funds have also been created and will be tested in the coming 24 years. Available data, though still partial and limited in scope, do suggest that significant financial support has 25 begun to flow to adaptation, scaling up from previous estimates, with current annual commitments from multilateral 26 and bilateral donors currently amounting to at least several billion USD per year. Despite the encouraging growth in 27 funding available to support adaptation, the proliferation of multiple, single purpose funding mechanisms runs 28 contrary to long-standing principles of sound development cooperation notably harmonisation and alignment 29 (Hedger, 2011; UNDP/OECD Bangkok reports). 30 31 In particular in the face of the proliferation of delivery channels, there is a risk of lack of country ownership and full 32 integration of climate funded programmes with national development planning and goals. In an in-depth assessment 33 of development assistance and adaptation funding in Bangladesh, ODI points to the need for consolidation and 34 convergence across the new funding channels and highlights opportunities for piloting and learning phases where 35 early lessons are reaped to informed next phases of programme design and implementation on the ground (Hedger 36 2011a & b - opinion). Hedger notes that it is clear current commitments fall significantly short of the needs for 37 adaptation support, pointing to the need to ensure that funds are not wasted in initial years. It will also be necessary 38 to mobilise domestic public and private investment to ensure delivery of adaptation in a timely manner to abate 39 climate change risk to development itself. For example, one study suggests that 2.7 bn USD of investment in 40 Bangladesh is now at risk from climate change.26 41 42 [INSERT FOOTNOTE 26 HERE: Asian Tiger Capital Partners 2010. A strategy to engage the private sector in 43 climate change adaptation in Bangladesh. Prepared for the International Finance Corporation. September 2010. – as 44 cited in Hedger, 2011 (opinion)] 45 46 Partner countries will also need assistance to design national systems to effectively direct and utilise climate change 47 finance. An emerging literature in this area highlights that countries lack defined priorities for the use of funds 48 (Peskett and Brown, 2011). When combined with donor tendency to “control” funds to ensure short term results 49 through a large variety of different funding instruments, the result is highly fragmented delivery systems that lead to 50 unclear outcomes (Peskett and Brown, 2011). This raises fundamental questions about the capacity in either the 51 donor or the partner country to effectively manage the magnitude of the funds currently available for adaptation, yet 52 alone scaled up funds. In some medium income developing countries, such as Indonesia, rather than focusing on 53
ZERO-ORDER DRAFT IPCC WGII AR5 Chapter 8
Do Not Cite, Quote, or Distribute 75 25 July 2011
large amounts of new external funding to support climate action, a more effective and sustaining strategy may be 1 national fiscal policy reforms and incentives to steer investment. 2 3 A key to improving effectiveness of international public finance will be country-led planning processes that identify 4 priority projects and programmes for the targeting of adaptation funds. This would present an opportunity for urban 5 adaptation programmes to be identified as a national priority. Even where national climate strategies exist to guide 6 action – such as in the case of Bangladesh which is an “early mover” on adaptation planning – the plan is not yet 7 costed nor is it sequenced and thus proves difficult to be used as a framework for delivery of international climate 8 finance (Hedger 2011, opinion). 9 10 A further challenge is to raise the profile and the attention to urban or local adaptation within national adaptation 11 planning. Currently 45 LDCs have prepared and submitted NAPAs (National Adaptation Programmes of Action) 12 and submitted these to the Least Developed Country Fund managed by GEF (Oxfam 2011 – “ Owning Adaptation”). 13 A process is now in place under the Adaptation Fund of the UNFCCC to support LDCs to formulation National 14 Action Plans. Other countries area also formulating responses at a national level. 15 16 Whether and how urban adaptation needs and efforts figure into those plans remains a question.[Need to look at 17 NAPAs and see if urban is being taken seriously] As a whole, these international public funding and the planning 18 exercises that they have supported remain essentially “top down” and are led by the national government. Urban 19 governments have access to such funds and planning processes only through their national governments, where 20 routine institutional mechanisms for multilevel adaptation planning and risk governance do not yet exist. 21 Multilateral or regional development banks 22
• Other dedicated funds for climate adaptation – what role urban? (i.e. World Bank’s Pilot Program for 23 Climate Resilience (PPCR), which is part of the Strategic Climate Fund, where the objective is to build 24 resilience to climate change by integrating adaptation into national development planning and policy. 25 PPCR will support capacity building, awareness raising, coordination and planning in its first design phase 26 of funding and provide technical and financial assistance in a second implementation phase. 27
• regional cooperation and financing mechanisms (i.e. Caribbean, Pacific ?) – these regions have been invited 28 to participate in the PPCR 29 [other refs: AGF – MDB, IFI paper – 2010] 30
31 32 Assessing progress 33 34 Steps for consistently and internationally harmonised data collection are urgently needed to support monitoring, 35 reporting and verification of both delivery and use of climate finance to ensure that lessons are learnt and funds are 36 being directed in an effective manner (Hedger 2011; Buchner et al. 2011). 37 38 Beyond measurement of flows of climate finance commitments and disbursements, tools for monitoring and 39 evaluation of adaptation are needed to assist both donors and partner countries to assess outcomes and effects of 40 climate finance. In the adaptation area this is particularly difficult …as well as interim indicators of progress 41 overtime. (Lamhauge et al. 2011) 42 43 While urban development and adaptation has not necessarily received much attention in climate finance to date, 44 there is clearly a link and a need for this on both the adaptation and mitigation side given the close linkages between 45 urban resilience to climate change and development itself, particularly in rapidly urbanising medium and high 46 income developing countries of the world. 47 48 49
50
ZERO-ORDER DRAFT IPCC WGII AR5 Chapter 8
Do Not Cite, Quote, or Distribute 76 25 July 2011
8.4.6. Learning Cycles and Systems 1 2 8.4.6.1. Science-Policy Exchange: Expert – Policy – Stakeholder Interactions 3 4 Principles of good practice in public decision-making and climate risk governance include an important component 5 of science – policy exchange and deliberation where good adaptation decisions will necessarily be based on credible 6 scientific information (Corfee-Morlot et al. 2011; Rosenzweig and Solecki 2010). Understanding of climate risks 7 and vulnerability demands a continuous re-assessment of the scientific knowledge about local climate conditions 8 and translating this information into local decision-making. This will depend upon local capacity to monitor and use 9 climate change as it becomes available. 10 11 Climate science refers to the ability to predict future changes in local temperature, sea level and precipitation 12 sufficiently well such that people and governments can plan for and adapt these changes. How climate predictions 13 alter local climatic conditions will vary with local contextual factors (such as local physical and socio-economic 14 conditions e.g. the size of the local population and its distribution across the land; age, thermal characteristics and 15 location of the built environment; and altitude, soil an vegetation conditions, proximity to the sea or river basins of 16 the area, etc). Combined with the dimension of time which often brings rapid socio-economic change in urban areas, 17 the complexity and uncertainty of climate change impacts increase over time and at smaller scales (Figure 8-1). Both 18 dimensions are important to predicting how climate change might impact local population, economies and 19 infrastructure ) (Hallegatte et al. 2011 – concept paper). 20 21 A broad literature on the use of science in policy assessments – from local to global – points to the need for 22 credibility, legitimacy and salience in such processes (Cash et al. 2006; NRC 2007). Boundary work or organisations 23 can play a key role to negotiate between political and scientific endpoints – interpreting scientific inputs such that 24 they become more useable in a political context (Jasanoff 1990, Gieryn 1999, Vogel et al. 2007, Guston 2001). In a 25 local and regional context, boundary organisations may take a variety of institutional forms and have been shown to 26 actively help advance adaptation decision-making at local and regional levels (Vogel et al. 2007; Tribbia & Moser; 27 NRC 2009; Corfee-Morlot et al. 2011). Another important area for urban adaptation is how decision makers actually 28 access or use scientific information, what sources do they rely upon and are they reliable? One study shows that 29 resource managers are more likely to rely upon informal sources such as maps or in-house experts, media and 30 internet rather than turning to scientific journals; rendering information useable for coastal zone and water resource 31 managers or city planners extends beyond technical boundaries for science-policy assessment venturing into the 32 world of communications (Tribbia & Moser 2006). Other research has shown that even where ongoing boundary 33 organisations and support exists for urban decision-making, economic analysis is often missing (Corfee-Morlot et al. 34 2011, Hunt, Watkiss 2011). Building economic analytical capacity and communications efforts to generate policy 35 relevant local information may be critical gaps to fill if urban adaptation is to become more effective and 36 widespread. 37 38 39 8.4.6.2. Risk Assessment, Planning Tools 40 41 A variety of climate risk and vulnerability decision-support tools have been developed in recent years. These tools 42 are designed around a variety of methods and objectives. A central element of tools that organize and rank 43 information on vulnerability in different locations is to identify relative and absolute differences in risk and 44 vulnerability and resilience capacity (e.g., Manuel-Navarrete et al. 2011; Hahna et al. 2009; Posey 2009; Milman 45 and Short 2008). Hammill and Tanner (2011, forthcoming OECD) review and compare risk screening and 46 assessment tools, and current experience with their use across six different donors and their partner countries. These 47 tools span various functions ranging from a quick screening to identify risks to a risk analysis and/or adaptation 48 options evaluation. Although the diversity of approaches may be confusing, it can also be helpful to fit diverse local 49 contexts. Nevertheless Hammill and Tanner suggest that harmonisation may be valuable, particularly for the 50 screening tools. Another theme within decision-support or planning tools is to make climate scenarios and modelling 51 results more useful for local decision-making (e.g., Van Vuuren 2007; Hallegatte, Henriet and Corfee-Morlot 2011). 52 53 54
ZERO-ORDER DRAFT IPCC WGII AR5 Chapter 8
Do Not Cite, Quote, or Distribute 77 25 July 2011
8.4.6.3. City Networks – Sharing Experiences with Spreading Learning between Urban Centers 1 2 Horizontally, there is also increasing evidence of multilevel governance through transnational networks on climate 3 change, where actors work across organisational boundaries to influence outcomes (Bulkeley and Betsill, 2005; 4 Bulkeley & Moser 2007). At the sub-national level, some of these horizontal relationships have been created 5 through formalised information networks and coalitions acting both nationally and internationally, including 6 ICLEI’s Cities for Climate Protection, the Climate Alliance, the C-40 Large Cities Climate Leadership Group, and 7 the Urban Leaders Adaptation Initiative in the US, among others. These networks have received increasing attention 8 in social research on climate policy. For example, ICLEI’s Cities for Climate Protection network has been 9 extensively analyzed in the literature (Aall et al. 2007; Betsill & Bulkeley 2004, 2006; Lindseth 2004). The focus of 10 such networks has typically been on mitigation however attention to adaptation is growing. See for example Foster 11 et al. 2011 on the US Urban Leaders Adaptation Initiative. These groups have given an institutional foundation to 12 concerted effort and collaboration on climate change at city level (Aall et al. 2007). (Kern, Gotelind 2009, Romero-13 Lankao 2007). 14 15 16 Interactions between research institutions and urban governments and stakeholders 17 18 [see Mehotra et al. 2009; Anguelovski & Carmin 2011 – see refs there] 19 20 21 8.5. Draft Conclusions: What has been Learned from City Adaptation Strategies to Date 22 23 8.5.1. Introduction 24 25 In recent years, as more city governments have begun to discuss and develop adaptation strategies (as described in 26 8.3.x), so too has a discussion developed on what factors contribute to or hinder effective adaptation strategies. Part 27 of this discussion comes from researchers external to these strategies, part from reflections by those engaged in 28 particular city processes (researchers, government officials, civil society organizations). This discussion focuses 29 mostly on the local (city-scale) institutional and political basis for adaptation, rather than on assessing what is 30 proposed. This section draws from these discussions as they have begun to identify a range of factors that have been 31 important in introducing, developing and implementing a local level adaptation agenda and also factors that 32 constrain this agenda 33 34 Because of the inherent complexities and uncertainties associated with local level adaptation there has been a 35 tendency for most urban interventions to begin with ‘low hanging institutional fruit’, for example, focusing on 36 existing city initiatives where climate change adaptation can be achieved as a co-benefit rather than creating new 37 work streams with climate change adaptation as the sole driver. Priority is often given to ‘no-risk’ options and soft 38 solutions that can be implemented at a reasonable cost, and produce a variety of real benefits under a range of 39 potential future scenarios (Roberts, 2008 pg 401, Toronto Environment Office, 2008 pg 9). Another characteristic of 40 these early adaptation initiatives is the strong initial reliance on risk and vulnerability assessments, linked in most 41 cases to down-scaled climate change projections (e.g. Greater London Authority, 2010 pg 22; MWH, 2008 pg 5; 42 City of Boston, 2011 pg 10; Roberts, 2008 pg 528; UN-Habitat, undated b pg 6). 43 44 This focus on risk assessment and business-as-usual (but with climate benefits) has meant more focus on 45 infrastructural adaptation i.e. “hard” (Lwasa, 2010, pg 168) or “asset-oriented” (Jones et al. 2010, pg 1) adaptation, 46 particularly given the concern around aging urban infrastructure in the Global North and the often very large 47 infrastructure deficits in the Global South (UN-Habitat, 2011 pg 130). This approach to adaptation has to a certain 48 extent masked the importance of the “soft” or process (i.e. human and ecological) elements of adaptation such as 49 governance, links to poverty reduction and livelihood systems, social cohesion and ecosystem based adaptation 50 (Lwasa, 2010 pg 168; Jones et al. 2010 pg 1). 51 52 As pointed out by Kithiia (2009, pg 19) “understanding the difference between taking adaptation measures and 53 building adaptive capacity is very crucial for city decision-makers” especially in the global South where “adaptive 54
ZERO-ORDER DRAFT IPCC WGII AR5 Chapter 8
Do Not Cite, Quote, or Distribute 78 25 July 2011
capacity is limited by resources, weak institutions, poor/inadequate infrastructure and poor governance.” This means 1 that adaptation planning has to be able to address these constraints. Also, as Jones et al 2010 notes, adaptation has to 2 recognise various intangible processes such as “decision-making and governance; the fostering of innovation, 3 experimentation and opportunity exploitation; and the structure of institutions and entitlements” and moving away 4 “from simply looking at what a system has that enables it to adapt, to recognising what a system does to enable it to 5 adapt” (page 1). 6 7 This implies the need for interventions that facilitate a “bouncing forward” in resilience and risk reduction rather 8 than the more conventional meaning of resilience as an ability to return to the initial state (Shaw and Theobald, 2011 9 pg 2 Lowe et al., 2009, pg 2; UN-Habitat, 2011 pg 130; Fünfgeld and McEvoy 2011, pg 45) ). The conceptualisation 10 of adaptation as being a transformative process that changes the way urban areas are understood, planned and 11 managed also answers the question of: “how is adaptation different from good development?” and links well with 12 the idea of adaptation as a proactive solution rather than just being reactive to the climate change problem (Foster et 13 al., 2011b pg 18). For example, such transformation would include the prioritisation of the kinds of “green 14 infrastructure” initiatives described in section 8.3.x - such as green, blue, and white roofs; hard and soft permeable 15 surfaces; green streets; urban forestry; green open spaces such as parks; and biodiversity networks of indigenous 16 ecosystems (Roberts, 2008 pg 533; Roberts, 2010 pg 401). These go alongside the conventional infrastructure, that 17 is, the more traditional approaches of building wastewater treatment facilities to deal with increased runoff from 18 more intense precipitation events, or building dams to deal with the greater irregularity in precipitation events 19 (Foster et al., 2011a pg 3). Some progress on this is already evident in some cities. 20 21 22 8.5.2. What Contributes to Cities Developing Adaptation Plans? 23 24 The importance of senior government staff becoming champions for adaptation (Lowe et al., 2009, pg 4; Roberts, 25 2008 pg 527; Parzen, 2009 pg 7; Shaw and Theobald, 2011 pg 10, Anguelovski, I and J.Carmin, 2011 pg 4). These 26 have proved important in providing initial leadership and promoting and sustaining the adaptation agenda. Measham 27 et al. (2010) in their discussion of barriers and opportunities for adapting to climate change through municipal 28 planning highlighted how in Sydney, the opinions and value system of the Mayor and CEO (or General Manager) 29 had influenced the opinions held by others. But such leadership may lack needed continuity as the champions 30 change positions or leaving office; Tyler et al., 2010, pg v and Roberts 2010 note the importance of developing a 31 broad base of support for adaptation so that progress is not stalled or undermined by leadership changes. 32 33 Institutional changes were needed to support and give continuity to city adaptation strategies (Lowe et al., 2009 pg 34 4; Roberts, 2008 pg 529). Section 8.3.x discussed how climate change adaptation requires working across 35 departmental lines and jurisdictions. Lowe et al. (2009) note that “Because of the complex nature of the impacts, 36 proper departmental organization can help to make or break adaptation efforts” (page 4). In this regard, for Durban, 37 the development of adaptation strategies has been facilitated by having champions from different sectors within city 38 government (Mather et al., 2011). Another important institutional reform is establishing functions and 39 responsibilities within government – possibly through a climate change office. In the development of adaptation 40 plans for Chicago and Durban, an important factor has been dedicated city staff assigned to undertake the work 41 (Roberts, 2008 pg 535; Parzen, 2009 pg 7); without this, adaptation can be sidelined by the many developmental 42 pressures facing local governments and their staff. The experience with developing an adaptation strategy in Durban 43 has also shown how this is not a linear process of identifying impact and acting in response; the approach has often 44 been more circuitous and iterative in order to deal with institutional limitations, such as leadership change, lack of 45 resources and buy-in and competing powerbases (Roberts 2010, pg 405; Anguelovski, I and J.Carmin 2011, pg 3; 46 Fünfgeld and McEvoy (2011pg 57). 47 48 Scientific support for adaptation, both in access to reliable, accurate and useable science and to relevant research 49 institutions (Lowe et al., 2009, pg 4; Roberts, 2008 pg 528). Section 3.x discussed the lack of data available to most 50 local governments and the difficulties in establishing what climate change is likely to bring for each locality. Other 51 barriers include the fact that official data may be difficult to access due to bureaucratic difficulties or financial 52 limitations, or local government staff cannot utilize it because of the language gap between the information 53 producers (scientists) and the information users (local decision makers) (Lowe et al., 2009 pg 4; Opitz-Stapleton, 54
ZERO-ORDER DRAFT IPCC WGII AR5 Chapter 8
Do Not Cite, Quote, or Distribute 79 25 July 2011
2010 pg iv). Where there is a lack of “useful, relevant and credible information” about the nature of climate risk 1 (Measham et al., 2010 pg 14), the experience to date in a range of cities suggests that it may be preferable to start 2 local level risk assessments with an assessment of existing hazards, challenges and vulnerabilities that are likely to 3 be exacerbated by climate change (Tyler et al., 2010, pg vi). This allows the development of adaptation strategies, 4 without detailed down-scaled climate impact data. It is also important to acknowledge that while scientific 5 information is important, adaptation decisions will also be affected by local cultural, environmental, economic and 6 political values and priorities and governance patterns (Opitz-Stapleton, 2010 pg v). 7 8 In Chicago (MWH, 2008 pg 5) and Durban (Roberts, 2008 pg 528), city government partnerships with local 9 research institutions have proved valuable in developing adaptation strategies. Lowe et al 2009 notes that “Because 10 of the importance of accurate and specific climate data and projections, creating partnerships with academic 11 institutions can be a useful tool for gaining knowledge about climate impacts from a trusted source. Collaborating 12 with universities also allows for more efficient expenditure of local resources while utilizing local expertise” (page 13 5). Generally the more locally specific the information, the more powerful it becomes (Measham et al., 2010 pg 15). 14 15 Networking and sharing experiences amongst practitioners: there are various examples of support for the sharing of 16 experiences and practices amongst practitioners – including the Urban Leader Adaptation Initiative (Lowe et al., 17 2009 pg 5) Asian Cities Climate Change Resilience Network (Tyler et al., 2010 pg v) and the Cities for Climate 18 Protection Australia Adaptation Initiative (ICLEI Oceania, 2008 pg 12). DETAILS OF OTHER NETWORKS 19 NEED TO BE ADDED? Peer influence and learning as well as reputational issues have also proven to be powerful 20 motivators for local governments beginning to tackle climate adaptation (Foster et al., 2011b pg 4; Greater London 21 Authority, 2010 pg 5). 22 23 Engaging Stakeholders: Experiences to date in developing city adaptation strategies highlight the importance of 24 creating the necessary dialogue and political and institutional platform required to advance the adaptation agenda – 25 although the forms and processes for engaging stakeholders vary between cities depending on institutional, political 26 and social contexts. These range from cross-cutting technical advisory groups often with sectoral or task group focal 27 areas (Lowe et al., 2009 pg 5; Parzen, 2009 pg 10; City of Boston, 2011 pg 8; City of New York, 2011 pg 150; 28 Anguelovski, I and J.Carmin, 2011 pg 3; Carter, 2011 pg 195) to more broadly representative multistakeholder 29 groups with a core working group (Tyler et al., 2010, pg v; Roberts, 2010 pg 411; Boston, 2010 pg 10; Anguelovski 30 and Carmin, 2011 pg 3). The importance of broad outreach to build public awareness and support is also 31 recognized” above all, the adaptation story will need to be a local one that is told locally with actions undertaken 32 neighborhood by neighborhood” (Foster et al., 2011b pg 17). As discussed in sections 8.3 and 8.4 on community-33 based adaptation, the issue of stakeholder engagement becomes all the more important where significant sections of 34 the population currently live and work in informal settlements (and include a high proportion of those most at risk 35 from climate change; section 8.4 also gave examples of a more active stakeholder engagement where community 36 organizations formed by those living in informal settlements worked in partnership with local governments to 37 identify and address risks and vulnerabilities. 38 39 Getting local attention to adaptation. In some cities, local government attention to adaptation has been triggered by 40 extreme weather events that have shown the vulnerability of that locality to such events (Roberts 2008, Lowe et al., 41 2009 pg 6). Some of the innovations in disaster risk reduction in city governments in Central America were in 42 response to the damage caused by hurricanes and these also serve to build resilience to hurricanes – although with 43 mixed outcomes in terms of how much they managed to embed disaster risk reduction within local development and 44 thus address the structural causes of vulnerability (Gavidia 2006). Section 8.x noted the creation of a municipal 45 system for disaster prevention and response in the city of Medellin in response to a landslide in 1987 and cold spells 46 in 1988 and 1989 (Cardona et al 2007). The availability of new research findings that focus on local impacts and 47 possibilities (or support for such research) has also been important in some cities (Roberts, 2008 pg 536; Hamin, 48 2011 pg 132). In some instances, the attention of local governments was stimulated by the identification of local 49 economic, social, and environmental co-benefits that will result from adaptation interventions (Foster et al., 2011b 50 pg 6; Roberts 2010 pg 410) such as the reforestation projects in Durban which offer the opportunities to improve 51 water quality and quantity, protect important recreational and economic assets and create community wide 52 opportunities for job-creation and skills development. Benefits and protecting and enhancing competitiveness have 53
ZERO-ORDER DRAFT IPCC WGII AR5 Chapter 8
Do Not Cite, Quote, or Distribute 80 25 July 2011
been a principal framing element in adaptation strategies for cities such as London (Greater London Authority, 2010 1 pg 5) New York (City of New York, 2011 pg 3) and Copenhagen (City of Copenhagen, 2011 pg 11). 2 3 Phased approaches that prioritize the more urgent issues have helped encourage city government engagement with 4 adaptation: Such approaches allows the most urgent matters or near term impacts to be dealt with first and a longer 5 time period to plan for those impacts that may occur in the future and be associated with greater uncertainty (Foster 6 et al., 2011b pg 10; City of Copenhagen, 2011 pg 11; City of Boston, 2011 pg 8; Wajih et al, 2010 pg 27). “There 7 are often good reasons for local governments not to act prematurely in the face of climate change impacts but 8 preparing ahead to act in the future is a robust risk management strategy offering ‘no-regrets’ for a range of future 9 conditions” (Foster et al., 2011b pg 11). In addition, in the Global South, given the complex mix of physical, social 10 and institutional systems with varying levels of capacity and a generally resource poor environment, an evolving 11 approach to strategy development allows greater flexibility and responsiveness (Roberts, 2008 pg 528; Wajih et al 12 2010 pg 27). This phased approach is also important when considering the different types of responses required to 13 sudden versus slow onset climate impacts. Fünfgeld and McEvoy (2011pg 25) note: “For sudden, short-term events 14 such as storms and flooding, adaptation efforts may need to focus on improved disaster prevention, establishing 15 early warning systems, and effective disaster response. For slow-onset, continuous impacts such as sea-level rise, 16 however, strategic forward planning is critical, and existing planning instruments such as land use planning may 17 need to be altered to take gradual changes in climatic stressors into account.” 18 19 The importance of mainstreaming climate change adaption requirements into municipal planning systems, building 20 codes and land-use management. 8.3.2.2 noted how it makes little sense to introduce an additional layer of climate 21 change planning to already complex and often fragmented and inadequate planning systems in the Global South. It 22 also noted how such mainstreaming faces significant challenges such as lack of information, institutional 23 constraints, resource limitations (Measham et al., 2010 pg 4). Climate change issues need local development plans 24 to be spent “with adaptation needs in mind” (Lowe et al., 2009 pg 6) and move towards a new approach of risk-25 based design for a range of climate conditions projected in the future” (Kithiia, 2010, pg 3). 26 27 Some city adaptation strategies got the attention of senior politicians and civil servants by focusing on improved 28 service delivery, economic resilience (and success) and risk management. In others, mainstreaming was enhanced by 29 encouraging each sector to consider its need for and role in adaptation action. A sectoral approach makes the climate 30 message easier for local governments and other stakeholders to understand and the associated responsibilities and 31 actions clearer and simpler to identify and assign (Roberts, 2010, pg 401; UN-Habitat, 2011 pg 147; Anguelovski 32 and Carmin 2011 pg 2). Most city adaptation strategies included some pilot projects and these can root the (often 33 vague) concept of adaptation in reality and allow a practical demonstration of the gains to be achieved (Roberts, 34 2010 pg 408, Tyler et al., 2010 pg 21). But a major challenge encountered with adaptation pilot projects was that 35 they did not provide the evidence for how to scale them up 36 37 Institutional learning: Adaptation planning requires that urban areas plan for an uncertain future using variable 38 projections about the future and often with limited and unreliable data about the past. As a result “municipalities and 39 businesses need to continually incorporate new data and reassess decisions. The successful adaptation to climate 40 change requires a learning organization, one that adapts to changing environmental factors” (MWH 2008, pg 7). It is 41 difficult to see how this can be achieved in most city or municipal governments in low- and middle-income nations 42 given their weakness, lack of funding and lack of trained staff - and what Kithiia 2009 notes as a situation of “ 43 ‘organized’ chaos, where decisions are delayed, correspondences lost in bureaucratic black-holes and ascription of 44 responsibility is obfuscated” (page 23). 45 46 Leading with ecosystem based adaptation: Ecosystem based adaptation has been put forward as one of the more cost 47 effective approaches to adaptation (Nature Conservancy, 2009 pg 8) given what needs to be spent to manage and 48 preserve ecosystems and the climate adaptation value derived from that spend. But there are many knowledge gaps 49 here on determining where the limits or thresholds to adaptation of various ecosystems lie; also on where and how 50 they can integrate with other adaptation measures. 51 52 A growing number of cities around the world are recognizing the value of biodiversity (particularly indigenous and 53 endemic biodiversity) and recognizing that nature’s resilience to the impacts of climate change can be used to 54
ZERO-ORDER DRAFT IPCC WGII AR5 Chapter 8
Do Not Cite, Quote, or Distribute 81 25 July 2011
protect people and infrastructure (e.g. flood control, preventing coastal erosion) and meet basic needs (e.g. assist 1 with energy and food security) (Greater London Authority, 2010 pg 95; Roberts, 2010 pg 411; City of New York, 2 2011 pg 163; Institute for Sustainable Communities, undated pg 14; Carter, 2011 pg 194; Zimmerman and Faris, 3 2011 pg.183) in a cost effective and sustainable way. The TEEB study concluded that “ecosystem conservation and 4 restoration should be regarded as a viable investment option in support of a range of policy goals including food 5 security, urban development, water purification and waste water treatment, regional development, as well as climate 6 change mitigation and adaption” (TEEB, 2010 pg 28). 7 8 Such ecosystem-based approaches in urban areas are “not simply about saving ecosystems, but rather about using 9 ecosystems to help ‘save’ people and the resources on which they depend” (Burgiel and Muir, 2010 pg 4). Shaw and 10 Theobald (2011) suggest that these approaches characterize forward-thinking and responsive local governments that 11 are capable of “bouncing forward” (pg 2). For example in London, there is a strong focus on ecosystem services as 12 being “essential to the wellbeing of Londoners and London’s resilience to climate change. Improving the quality, 13 quantity, connectivity and diversity of London’s green spaces will increase their resilience and therefore increase the 14 capacity of London and London’s biodiversity to adapt to a changing climate” (Greater London Authority, 2010 pg 15 95). This ecosystem services based approach is particularly important in the Global South where the livelihood 16 systems of the peri-urban and urban population is heavily dependent on natural resources. For example in Kampala, 17 many people in the urban and peri-urban areas “rely on natural resources for some or all of their household 18 livelihood strategies.” (UN-Habitat, undated c, pg 9). In Durban in 2002 it was calculated that the replacement value 19 of the ecosystem services supplied by the city’s (largely indigenous) open space system was R3.1 billion per annum, 20 approximately half the value of the city’s operating budget at the time (EThekwini Municipality, 2007 pg 15). 21 22 Water as an early focal point for action: Many urban adaptation plans focus strongly on the issue of water 23 management. As observed by Pickett et al. (2010 pg 355) “sustainability has become a concern of many cities, and 24 vegetation and water will play key roles in advancing this goal.” Water (i.e. issues of quantity and quality, runoff, 25 waste water etc.) features prominently in the adaptation thinking and planning of a diverse range of cities e.g., 26 Seattle (EPA, 2011 pg 23), New York (EPA, 2011 pg. 37), Chicago (Zimmerman and Faris, 2011 pg.183), London 27 (GLA, 2010 pg 7), Durban (2010, pg 402), Semerang (Tyler et al., 2010, pg 37) and Indore (TARU 2010 pg 28). 28 Copenhagen’s adaptation strategy notes that “In our society, rainwater is considered something we must get rid of. 29 Water is however, also a resource we cannot do without. So, there is much to be gained by using rainwater to make 30 the city a better place to live in. This can be achieved by managing rainwater locally with the help of green, low-tech 31 solutions which can absorb the rainwater or clean it” (City of Copenhagen 2011, page 6). The city’s planners have 32 also acknowledged that preemptive action is required to deal with changes which may still be in the future, such as 33 sea level rise: “Changes in sea water levels take place slowly. We expect that the risk of serious damage to 34 Copenhagen as a result of rising seas will first begin to change significantly in about 30 years…For this reason, 35 preparations are starting now. It takes time to find the right solutions, and the sooner we start the easier it will be to 36 implement the necessary actions in conjunction with other construction projects, so we can keep costs down” (ibid 37 page 9). While issues of water scarcity and flood management provide an obvious institutional and conceptual hook 38 to draw local authorities into adaptation agendas and to encourage early, low risk action, other issues such as the 39 emerging ‘green economy’ may provide equally useful anchors through highlighting the job creation and investment 40 promotion advantages of adaptation (Copenhagen, 2011 pg 3; Roberts 2010, pg 410; City of Boston 210, pg 43). 41 42 Links between adaptation and mitigation: In reviewing the role of urban governments in climate change over the last 43 decade, mitigation got more attention than adaptation (e.g. Satterthwaite 2008, Hardoy and Romero Lankao, 2011 44 pg 160; Carter. 2011 pg 195) – and it is often seen as competing with adaptation. In part, this was sustained by the 45 political fear that pursuing adaptation might undermine the importance of the mitigation agenda. The identification 46 of co-benefits between adaptation and mitigation may help encourage more attention to adaptation – for instance 47 green roofs that cool the city and retain water during storms, promote local biodiversity and food production (all 48 adaptation) while also helping to increase the energy efficiency of buildings (mitigation). Increasing the size of 49 urban open space networks and tree plantings can also provide shade to decrease the urban heat island effect 50 (adaptation) and reduce energy demand to cool buildings (mitigation) (Lowe et al., 2009 pg 6; MWH, 2008 pg 5; 51 City of Boston, 2011 pg 13). 52 53
ZERO-ORDER DRAFT IPCC WGII AR5 Chapter 8
Do Not Cite, Quote, or Distribute 82 25 July 2011
NEED CONCLUSIONS HERE ON LESSONS FROM SECTIONS 8.3 AND 8.4 FOR NATIONAL AND 1 REGIONAL LEVEL ACTION AND INSTITUTIONAL CHANGE IN SUPPORT OF URBAN ADAPTATION 2 3 4 8.5.3. What Hinders Adaptation Progress in Urban Areas? 5 6 The complexities of developing adaptation: Mitigation-focused interventions provided the early experiential training 7 ground for most cities and local governments engaging with climate change for the first time (Anguelovski and 8 Carmin, 2011pg 4)– and a series of steps for developing mitigation strategies were developed. Experience with 9 adaptation programmes to date show that these are less open to a standard set of steps – as they are complex and 10 often chaotic, cross-sectoral, cross-institutional, operate across a range of scales and timelines, involve more 11 stakeholders and include a high level of uncertainty. The realities of this more organic and complex type of process 12 is acknowledged by ICLEI Oceania who acknowledge that in addressing adaptation local level staff must 13 demonstrate clarity, creativity and courage (ICLEI Oceania, 2008 pg 2) if they are to successfully balance the 14 tension between short-term and long-term needs, engage a broad range of stakeholders and lead through action, even 15 in the face of uncertainty. 16 17 The weakness of the climate change focal points within local governments: The climate change function within 18 urban areas is often housed or championed by the environmental line department (e.g. Durban - Roberts, 2008 pg 19 523; Boston - http://www.cityofboston.gov/environment/; Sydney - Measham et al., 2020 pg 17; Anguelovski and 20 Carmin 2011 pg 2). This can lead to a marginalisation of the climate function (Roberts, 2010 pg 401) particularly 21 given the low or lower priority usually assigned to environmental departments within government structures, and the 22 resulting limited institutional influence and access to resources. 23 24 Lack of mandate: As noted by Measham et al. (2010 pg 16) “without the legal basis for adjusting local 25 environmental planning in terms of climate change, it is difficult to do so in the face of competing planning 26 interests”. The jurisdictional issues relating to which sphere of government has the legal mandate to act on climate 27 change issues poses a significant barrier to action if local government is not empowered to act through the 28 appropriate allocation and assignment of constitutional and legal powers. Without these formal mandates, adaptation 29 action becomes an optional and discretionary extra, dependent largely on local level interest and resources and is 30 particularly vulnerable to leadership change, as opposed to a situation where it is a mainstreamed and 31 institutionalised commitment. Difficulties also arise when the need for adaptation action extends beyond the 32 boundaries over which cities and their local governments have jurisdiction e.g. in sectors such as coastal planning 33 and catchment management (Anguelovski and Carmin, 2011 pg4; Carter, 2011 pg 196). This requires that a high 34 level of co-operative governance is established and maintained, which is often difficult in given problematic 35 governance systems and institutional issues, particularly in the Global South (Hardoy and Romero Lankao, 2011 pg 36 161). 37 38 Political obstacles: “The political nature of local government means that all decisions, including climate adaptation, 39 are affected by political interests and competing preferences vying for support at the municipal scale” (Measham et 40 al., 2010 pg 19). This means that addressing constraints such as information and resources alone will not necessarily 41 enable local adaptation if there is political resistance, particularly as political leaders control local level resources 42 (Roberts, 2008 pg 535). There is also the disjuncture between political and climate time lines, which set the short-43 term (often personal advancement) priorities of political terms against the generational, public good impacts of 44 climate change. 45 46 The assumption that development produces adaptation. Although this chapter has stressed how adaptation is served 47 when city populations and enterprise are comprehensively served by have adequate provision for infrastructure and 48 services, Lowe et al., 2009 and TARU 2010 note that the assumption that adaptation requires little more than the 49 expansion of existing efforts (e.g. Carter, 2011 pg 195) using existing skills and institutional forms, is too simplistic 50 and could generate a false sense of complacency. There is some evidence (especially in the urban areas of the Global 51 South) that new patterns and forms of urban development and new management skills (e.g. restoring previously 52 deforested areas to sequester carbon, protect catchments and create employment or identifying new staple food crops 53 Roberts, 2010 pgs 409 and 408) may be required to compensate for the adaptation deficit that currently exists in 54
ZERO-ORDER DRAFT IPCC WGII AR5 Chapter 8
Do Not Cite, Quote, or Distribute 83 25 July 2011
these cities. New approaches will in turn generate the need for new information, new technical skills, new funding 1 (or the use of existing funding in new and creative ways) new understanding of what might constitute progress and 2 new ways to set targets for and to measure this progress (Foster et al., 2011b pg 4; Shaw and Theobald, 2011 pg 5; 3 Roberts 201, pg 412). 4 5 The constraints on transformative approaches: Initiating system transformation is beset by a range of challenges. 6 Even under existing patterns of climate variability there are many competing priorities at the local government level. 7 Most local governments are already “involved with everything from babies to bitumen” (Measham et al., 2010 pg 8 11). There are also concerns that in the current recessionary environment that local authorities will have to prioritise 9 traditional and untransformed service delivery, and that the climate change agenda will become an additional burden 10 that will be displaced by seemingly more urgent, short-term priorities (Shaw and Theobald, 2011 pg 5). 11 12 Dealing with uncertainty: The uncertainty associated with climate change projections and impacts contrasts strongly 13 with the immediate nature of adaptation costs and the fact that benefits are likely to be delayed (OECD, 2010 pg 23). 14 A key question is how can planners “make effective use of available climate information despite large uncertainties 15 and unfamiliar or unhelpful data formats”? (Tyler et al., 2010, pg vi). A pragmatic approach suggests a stepwise 16 approach of focusing initially on existing vulnerabilities (as “adaptation to present climate variability and extreme 17 events forms the basis for reducing vulnerability to future climate change” - UN-Habitat undated c, pg 15) 18 identifying no-regrets options that have near and long-term co-benefits, using scenario planning instead of trying to 19 precisely predict future climate change through down scaled projections, undertaking further studies to develop 20 better local data, avoiding maladaptation and increasing awareness (Tyler et al., 2010, pg vi; OECD, 2010 pg 23; 21 TARU, 2010 pg 18). Understanding the cost of inaction is also an important mechanism for dealing with the 22 institutional hesitancy that can result from confronting the challenges of uncertainty. 23 24 The issue of thresholds and conflicting agendas: Despite the fact that most urban areas acknowledge the value of 25 both mitigation and adaptation - Toronto for example defines mitigation as “the globally responsible thing to do” 26 and adaptation as the “locally responsible thing to do” (Toronto Environment Office, 2008 pg 3) - there is often the 27 tendency for cities to treat adaptation and mitigation separately, and to lead with one or the other depending on their 28 circumstances, priorities, resources and institutional affiliations (Roberts, 2010 pg 397; Carmin et al., 2009 pg 1; 29 Hamin, 2011 pg 133). As a result little progress has been made in ensuring that adaptation and mitigation policy 30 goals are not in conflict (Hamin and Gurran, 2009 pg 238). A key nexus for both is the issue of densification. It is 31 generally accepted that mitigating climate change will require a denser urban form in order to maximize economies 32 of scale, reduce the need for motorized transport and to reduce building energy use. Adaptation alternatively speaks 33 to an urban form that favours green infrastructure such as the provision of open space for stormwater management, 34 species migration, and urban cooling (Hamin and Garrun, 2009 pg 242). This raises the question of thresholds i.e. 35 when will densities be so high that they create negative feedbacks such as the inability to maintain ecologically 36 viable and biodiverse systems, or positive feedbacks such as the exacerbation of the urban heat island which in turn 37 generates the need for more cooling and increases energy use, thereby further escalating the urban heat island effect. 38 Hamin and Garrun (2009 pg 242) refer to this as the “density conundrum”. 39 40 The dangers to biodiversity particularly are highlighted by Hamin and Garrun’s (2009 pg 242) assertion that an 41 appropriate response to the density conundrum would be to provide multi-use greenspace within settlements along 42 linear features (such as transportation routes and rivers and floodplains) while larger open areas are limited to the 43 urban periphery. While this may make sense from a climate perspective – it makes little biological sense, especially 44 in situations where urban areas are located in areas of high biodiversity and endemism. Under these conditions it is 45 often necessary to protect and conserve sizeable natural areas within the heart of the urban fabric to meet local, 46 national and international conservation targets and the associated ecosystem services they deliver. Such is the case in 47 South African cities such as Durban and Cape Town, both of which are both located within global biodiversity 48 hotspots (EThekwini Municipality, 2007 pg 4; Holmes et al., 2008 pg 4). A not insignificant number of cities in the 49 Global South are likely to face similar dilemmas given that the three most biodiverse countries in the world are 50 Brazil, Indonesia and South Africa (Endangered Wildlife Trust, 2002 pg 2). Such an approach is also counter to 51 long-accepted conservation network design principles which favour larger, rounded areas over smaller fragmented 52 or linear areas (Diamond, 1975 pg 143) and also does not acknowledge the higher costs and per unit effort 53 associated with maintaining and managing smaller and linear areas. These are important considerations given that 54
ZERO-ORDER DRAFT IPCC WGII AR5 Chapter 8
Do Not Cite, Quote, or Distribute 84 25 July 2011
the impacts of climate change on biodiversity (even without the additional pressures of urban development) are 1 likely to be “disastrous” and that current protected area systems (including those in urban areas) are already unlikely 2 to be sufficient to deal with the projected impacts of climate change (Lovejoy and Karsh, 2008 pg 3). Given that 3 biodiversity is key to the “continued functioning of complex ecosystem interactions which underpin the habitability 4 of the planet and provide a host of services to humans” (Gill et al., 2009 pg 9) it is critical not only that adaptation 5 and mitigation agendas are not in conflict, but that climate protection actions do not undermine other agendas such 6 as biodiversity. This will require that research is undertaken to determine the thresholds for unacceptable 7 biodiversity change in urban areas and that this information is used to determine acceptable limits to urban 8 densification. Similarly it will be necessary to carefully analyse the negative impacts of planned mitigation and 9 adaptation activities on biodiversity in urban areas such as has recently occurred in London (Gill et al., 2009, pg 71). 10 11 The issue of thresholds is pertinent not only to biodiversity concerns, but will also be of general relevance in other 12 areas. For example, in determining when and where adaptation is no longer possible, due either to technical 13 difficulties or cost (or both) – so called residual damage (UN-Habitat, 2011 pg 130; Parry et al, 2009 pg). This 14 knowledge about limits within existing systems will be vital in developing appropriate planning responses to future 15 climate challenges. 16 17 Prioritising poverty within the climate change debate: A dichotomy exists between the Global North and South 18 regarding the level of emphasis placed on the issue of poverty and poverty alleviation in the adaptation debate. 19 While cities such as Boston (City of Boston, 2011 pg 8) and London (Greater London Authority, 2010 pg 7) 20 acknowledge the need to consider vulnerable groups in their planning, for most cities in low and middle income 21 nations, poverty reduction is a central item of any adaptation agenda. As noted by UN-Habitat (undated b, pg 17) 22 when discussing the prevailing situation in Esmeraldas (Ecuador) “it is important to note that most of what has been 23 accomplished in sanitation, infrastructure, and urban planning capacity has not been motivated by concerns over 24 climate change, but through strategies seeking better planning processes and poverty reduction.” In urban areas of 25 the Global South climate change is generally of low political significance because of pressing development needs 26 e.g. infrastructure, public health, education, housing and energy (Roberts, 2008 pg 523; Kithiia, 2009 pg 25 and 1). 27 This situation is compounded by the escalating ‘urbanization of poverty’ that has occurred in these parts of the 28 world, making cities the nexus where poverty and climate change compete for political attention (Kithiia, 2009 pg 29 1). Within this context the challenges posed by climate change are viewed as marginal when compared with other 30 socio-economic problems. If the adaptation agenda is to be advanced, it will require the use of innovative measures 31 that couple climate change impacts with the reduction of poverty (Lwasa, 2010 pg 167). As concluded by Kithiia 32 (2010 pg 4): “In general, without combating urban poverty and providing alternative sources of livelihood, little will 33 be achieved towards climate change mitigation and adaptation, not just in East Africa but also in other low income 34 countries.” 35 36 Role of international institutions: Despite the fact that in many instances the adaptation efforts of local governments 37 are a response to internal motivations (e.g. the perception of threat, city agendas, leadership, improving city image) 38 rather than external pressures (Anguelovski and Carmin , 2011 pg 2), in the Global South, because of the lack of 39 skills and resources, international institutions still play a significant role in initiating and shaping the adaptation 40 agenda. This occurs through programmes such as UN-Habitat’s Cities and City Change Initiative (CCCI), ICLEI- 41 Local Governments for Sustainability’s Sub-Saharan African Cities Adaptation Initiative (SSACAI) and the Asian 42 Cities Climate Change Resilience Network (ACCCRN). These initiatives (and others like them) often constitute the 43 main form of encouragement and institutional and financial support to mitigation and adaptation work at the local 44 level (UN-Habitat, undated b pg 16; Kithiia 2010, pg 2; Roberts 2008, pg 524). The danger of the donor driven 45 model approach is that the resulting programmes tend to focus on the funding agency’s agenda, which may or may 46 not coincide with local priorities, often with little lasting ownership by the local participants once the support is 47 withdrawn (Roberts, 2008 pg 525; Kithiia and Dowling, 2010 pg 468). Furthermore, the manner in which 48 information is delivered by international agencies during the course of these programmes is critical in determining 49 the efficacy of the intervention, as local decision-makers access and use scientific and expert information about 50 climate change in a manner that is different to the research community. For example, instead of relying on scientific 51 journals they tend to rely on more informal sources and formats such as colleagues and the internet (Corfee-Morlot 52 et al 2011 pg 183). Failure to note this distinction can result in a significant waste of effort and resources and 53
ZERO-ORDER DRAFT IPCC WGII AR5 Chapter 8
Do Not Cite, Quote, or Distribute 85 25 July 2011
experience has shown that “without developing a meaningful understanding of the science, climate change and its 1 significance are unlikely to be effectively understood at the local government level” (Roberts, 2008 pg 525). 2 3 Different risk reduction priorities Local authorities in the Global South often do not view climate change as a 4 management problem requiring immediate attention due to the plethora of competing stresses and development 5 challenges (Kithiia and Dowling, 2010 pg 470; Roberts 2008, pg 523). As a result any adaptation strategy has to be 6 developed within “the development context of the city or country and should lead to harmonization with the 7 country’s priorities such as poverty alleviation, food security and disaster management” (UN-Habitat, undated c, pg 8 15). 9 10 Undervaluing social capital: There is limited work available on adaptive capacity at the community or household 11 levels (Jones et al., 2010 pg 2). This is a critical gap given that social capital may provide a key opportunities to 12 achieve the “bouncing forward” required by adaptation, as community collaboration, relationships and trust can 13 provide a platform to generate material interventions directed at reducing vulnerability to climate variability and 14 change (Kithiia, 2009 pg 17). The issue of social capacity has been identified as important to urban resilience in a 15 number of urban areas (TARU 2011, pg 38; UN-Habitat undated d, pg 22; Roberts 2010, pg. 408). However, as with 16 ecosystem based adaptation, it is necessary to determine the limits of community based intervention, as communities 17 may be able to restore and protect mangrove forests but they are unable to install, maintain and fund infrastructure 18 and services at scale (UN-Habitat, 2011 pg 136). The issue of scaling up community level interventions, 19 nevertheless remains an ongoing challenge (Lwasa 2010 pg 168) as does addressing the gender aspect of social 20 capital. 21 22 Finally, in reviewing the development of urban adaptation interventions and strategies by climate hazard type and 23 their linkage with core policy and practical concerns, certain key questions will need to be addressed and are as yet 24 not adequately addressed. These include: 25
• Does it reduce mortality? 26 • Does it help reduce illness and injury and/or their impacts, especially for vulnerable groups? 27 • Does it make livelihoods more resilient and improve choices on employment and livelihoods? 28 • Does it reduce negative impacts on economic output and urban centre’s capital stock 29 • Does it increase the resilience of lifeline physical and social infrastructure and services? 30 • Does it increase the resilience of housing, especially for those with limited incomes and assets? 31 • Does it mitigate impact and improve the productivity and resilience of ecosystem services? 32 • Does it have potential co-benefits with poverty reduction and with other adaptation and mitigation 33
interventions? 34 35 36 References 37 38 Aall, C., Groven, K. & Lindseth, G. 2007: The Scope of Action for Local Climate Policy: The Case of Norway, 39
Global Environmental Politics, 2, 83. 40 Adamo, Susana B. 2010: Environmental migration and cities in the context of global environmental change, Current 41
Opinion in Environmental Sustainability 2, 161-165. 42 Adger, N., N. Arnell and E. Tomkins 2005: Successful adaptation to climate change across scales. Global 43
Environmental Change 15(2) 77-86. 44 45 Adelekan, I. O. 2010: Vulnerability of poor urban coastal communities to flooding in Lagos, Nigeria. Environment 46
and Urbanization, 22(2), 433-450. 47 Agarwal, Siddharth 2011: The state of urban health in India; comparing the poorest quartile to the rest of the urban 48
population in selected states and cities, Environment and Urbanization, 23(1), 13-28. 49 Agrawala S, van Aalst M 2008: Adapting development cooperation to adapt climate change. Clim Policy 8(2), 183-50
193. 51 Agrawala, S. & Carraro, M. 2010, Assessing the Role of Microfinance in Fostering Adaptation to Climate Change, 52
Organisation for Economic Co-operation and Development. 53
ZERO-ORDER DRAFT IPCC WGII AR5 Chapter 8
Do Not Cite, Quote, or Distribute 86 25 July 2011
AHTEG (Second Ad‐hoc Technical Expert Group on Biodiversity and Climate Change) 2009: Connecting 1 biodiversity and climate change mitigation and adaptation. Report of the Second Ad Hoc Technical Expert 2 Group on Biodiversity and Climate Change. CBD Technical Series No. 41. CBD Secretariat, Montreal. 3
Alam, Mozaharul and MD. Golam Rabbani 2007: Vulnerabilities and responses to climate change for Dhaka. 4 Environment and Urbanization 19(1), 81-97. 5
Alexandri, E. and P. Jones, Temperature decreases in an urban canyon due to green walls and green roofs in diverse 6 climates, Building and Environment 43 (2008), pp. 480–493. 7
Almansi, Florencia 2009: Regularizing land tenure within upgrading programmes in Argentina; the cases of 8 Promeba and Rosario Hábitat. Environment and Urbanization, 21( 2), 389-414. 9
Anger, N. R. Muir-Wood, and S. Priya (2009) Assessing extreme climate hazards and options for risk mitigation and 10 adaptation in the developing world. Background note on Development and Climate change prepared for World 11 Development Report. 12
Anguelovski, I and J. Carmin 2011: Something borrowed, everything new: innovation and institutionalization in 13 urban climate governance. Current Opinion in Environmental Sustainability 3, 1–7 14
Annecke article, Tiempo, Oct 2010 15 Aragón-Durand, Fernando 2007: Urbanisation and flood vulnerability in the peri-urban interface of Mexico City. 16
Disasters 31(4), 477- 494. 17 Aragón-Durand, Fernando, 2008: Estrategias de Protección Civil y Gestión del Riesgo Hidro-meteorológico ante el 18
cambio climático Instituto Nacional de Ecología- SEMARNAT, México. 19 Archer, Diane and Somsook Boonyabancha 2011: Seeing a disaster as an opportunity; harnessing the energy of 20
disaster survivors for change, Environment and Urbanization 23(2). 21 Arnell 2009 in Parry, Martin, Nigel Arnell, Pam Berry, David Dodman, Samuel Fankhauser, Chris Hope, Sari 22
Kovats, Robert Nicholls, David Satterthwaite, Richard Tiffin and Tim Wheeler 2009, Assessing the Costs of 23 Adaptation to Climate Change; A Review of the UNFCCC and other Recent Estimates, IIED and Grantham 24 Institute, London, 111 pp. 25
Asian Cities Climate Change Resilience Network (ACCCRN) 2010: City resilience strategy: Semerang’s adaptation 26 plan in responding to climate change. ACCCRN, Semerang 27
Awuor, Cynthia B. Victor A. Orindi and Andrew Adwerah 2008: Climate change and coastal cities: The case of 28 Mombasa, Kenya. Environment and Urbanization, 20(1), 231-242. 29
Ayers J, 2008: International funding to support urban adaptation to climate change. Environment and Urbanization, 30 20(1), 225-240. 31
Ayers and Forsyth 2009 32 Bambrick, Hilary Jane, Anthony Guy Capon, Guy Bruce Barnett, R. Matthew Beaty and Anthony John Burton 33
2011: Climate Change and Health in the Urban Environment: Adaptation Opportunities in Australian Cities, 34 Asia-Pacific Journal of Public Health 23, Supplement 2, March, 67S-79S. 35
Bangay, Colin and Nicole Blum 2010: Education responses to climate change and quality: Two parts of the same 36 agenda?, International Journal of Educational Development 30 (4), July, 359-368. 37
Banks, Nicola Manoj Roy and David Hulme 2011: Neglecting the urban poor in Bangladesh: research, policy and 38 action in the context of climate change, Environment and Urbanization 23(2). 39
Bartlett S., 2008: Climate change and urban children: impacts and implications for adaptation in low-and middle-40 income countries. Environment and Urbanization 20(2), 501-519. 41
Bedsworth, Louise 2009: Preparing for Climate Change: A Perspective from Local Public Health Officers in 42 California, Environmental Health Perspectives Vol 117, No 4, 617-623. 43
Blanco A., 2007: Local initiatives and adaptation to climate change. Disasters, 30(1), 140-147. 44 Blashki G, Armstrong G, Berry HL, Weaver HJ, Hanna EG, Bi P, Harley D, Spickett JT, 2011: Preparing health 45
services for climate change in Australia, Asia Pac J Public Health. 23(2 Suppl):133S-43. 46 BMA and UNEP 2009: Bangkok Assessment Report on Climate Change. Bangkok: BMA, GLF and UNEP 47 Bohle et al, 1994 48 Bolin, Bob, Mohan Seetharam, and Brian Pompeii 2010, Water resources, climate change, and urban vulnerability: a 49
case study of Phoenix, Arizona, Local Environment Vol 15, No 3, 261-280. 50 Bollin, Christina and Friedegund Mascher 2005: Honduras: Community – based disaster risk management and 51
intermunicipal cooperation. A review of experience gathered by the special intermunicipal association 52 MAMUCA. GTZ 53
ZERO-ORDER DRAFT IPCC WGII AR5 Chapter 8
Do Not Cite, Quote, or Distribute 87 25 July 2011
Bonazza, A, Messina P, Sabbioni C, Grossi CM, Brimblecombe P. (2009), Mapping the impact of climate change on 1 surface recession of carbonate buildings in Europe, Science of the Total Environment Vol 407, No 6, pages 2 2039-50. 3
Boonyabancha, Somsook 2005, Baan Mankong; going to scale with 'slum' and squatter upgrading in Thailand, 4 Environment and Urbanization 17(1) 21-46 5
Boonyabancha, Somsook 2009, Land for housing the poor by the poor: experiences from the Baan Mankong 6 nationwide slum upgrading programme in Thailand, Environment and Urbanization 21(2) 309-330 7
Bowen, A. Raising finance to support developing country action: some economic considerations, Grantham 8 Research Institute on Climate Change and the Environment;. 9
Bowler, Diana E et al. 2010:, Urban greening to cool towns and cities: A systematic review of the empirical 10 evidence, Landscape and Urban Planning 97(3), September, 147-155. 11
Boyd et al 2009 12 Brody, Sam et al. 2010:, Examining climate change mitigation and adaptation behaviours among public sector 13
organisations in the USA, Local Environment 15(6), 591-603. 14 Brown, Sam and Walker, Gordon 2008: Understanding heat wave vulnerability in nursing and residential homes. 15
Building Research & Information 36(4), 363 —372. 16 Bulkeley, Harriet 2010: Cities and the Governing of Climate Change, Annual Review of Environment and Resources 17
35, 229-254. 18 Bulkeley, H. & Kern, K. 2006, Local Government and the Governing of Climate Change in Germany and the UK, 19
Urban Studies, vol. 43, no. 12, pp. 2237-2259. 20 Burch, S. 2010: Transforming barriers into enablers of action on climate change: insights from three municipal case 21
studies in British Columbia, Canada. Global Environmental Change, 20, 287-297. 22 Burgiel, S.W. and A.A. Muir 2010). Invasive Species, Climate Change and Ecosystem-Based Adaptation: 23
Addressing Multiple Drivers of Global Change. Global Invasive Species Programme (GISP), Washington, DC, 24 US, and Nairobi, Kenya. 25
Burton 2008 26 Cape Town 2006: Framework for Adaptation to Climate Change in the City of Cape Town 27 Carbognin, Laura, Pietro Teatini, Alberto Tomasin and Luigi Tosi (2010), Global change and relative sea level rise 28
at Venice: what impact in term of flooding, Climate Dynamics Volume 35, Number 6, November, Pages 1039-29 1047. 30
Carcellar, Norberto, Jason Christopher Rayos Co and Zarina O. Hipolito 2011: Addressing disaster risk reduction 31 through community-rooted interventions in the Philippines: experience of the Homeless People’s Federation of 32 the Philippines, Environment and Urbanization 23(2). 33
Cardona Arboleda, Omar D, Luis F Gonzalez Miranda and Luis F Linares Lopez 2007: Organizacion Institucional 34 para la Gestion de Riesgos in Clarke Caroline and Carlos Pineda Mannheim (eds) Riesgo y Desastres. Su 35 Gestion Municipal en Centro America. Publicaciones especiales sobre el Desarrollo No 3. BID, 142-185. 36
Carlota M. Grossi, Peter Brimblecombe, Ian Harris (2007), Predicting long term freeze–thaw risks on Europe built 37 heritage and archaeological sites in a changing climate, Science of The Total Environment Volume 377, Issues 38 2-3, May, pages 273-281 39
Carmin, J. & Anguelovski, I. 2009, Governmental institutions and innovations in governance in achieving climate 40 adaptation, Urban Research Symposium Cities and Climate Change: Responding to an Urgent Agenda, 41 MarseilleWorld Bank, , June 28-30, 2009. 42
Carmin, J., Roberts, D. and I. Anguelovski 2009). Planning climate resilient cities: early lessons from early adapters. 43 Paper prepared for the World Bank 5th Urban Research Symposium: Cities and Climate Change: Responding to 44 an Urgent Agenda, Marseille, France, 28–30 June. 45
Carolini G: Organizations of the urban poor and equitable urban development: process and product. In The New 46 Global Frontier. Urbanization, Poverty and Environment in the 21st Century. Edited by Martine G, 47 McGranahan G, Montgomery M, Fernandez-Castilla R. Earthscan; 2007:133-150. 48
Carter, Jeremy G. 2011: Climate change adaptation in European cities, Current Opinion in Environmental 49 Sustainability 2011, 3:193–198. 50
Carter, T and L. Fowler, Establishing green roof infrastructure through environmental policy instruments, 51 Environmental Management 42 (2008), pp. 151–164. 52
Carthey, Jane, Venny Chandra and Martin Loosemore 2009: Adapting Australian health facilities to cope with 53 climate-related extreme weather events, Journal of Facilities Management Vol 7, no. 1 2009): 36-51 54
ZERO-ORDER DRAFT IPCC WGII AR5 Chapter 8
Do Not Cite, Quote, or Distribute 88 25 July 2011
Cash, D.W., Adger, W.N., Berkes, F., Garden, P., Lebel, L., Olsson, P., Pritchard, L. & Young, O. 2006, Scale and 1 cross-scale dynamics: governance and information in a multilevel world. , Ecology and Society, vol. 11, no. 2, 2 pp. 8. 3
Cashman, Adrian, Leonard Nurse and John Charlery 2010: Climate Change in the Caribbean: The Water 4 Management Implications, Journal of Environment and Development Vol 19, No 1, March, 42-67 5
Center for Science in the Earth System (The Climate Impacts Group), King County, Washington and ICLEI – Local 6 Governments for Sustainability 2007). Preparing for Climate Change: A Guidebook for Local, Regional, and 7 State Governments. Center for Science in the Earth System (The Climate Impacts Group), King County, 8 Washington and ICLEI – Local Governments for Sustainability, King County, Washington. 9
CEPAL 2008: Tabasco: Características e impacto socio-económico de las inundaciones provocadas a finales de 10 octubre y a comienzos de noviembre de 2007 por el frente frío Nº4 11
Chance, Tom 2009: Towards sustainable residential communities; the Beddington Zero Energy Development 12 (BedZED) and beyond, Environment and Urbanization, 21(2), 527-544. 13
Chang, H., Lafrenz, M., Jung, I.-W., Figliozzi, M., Platman, D., Pederson, C. 2010: Potential impacts of climate 14 change on Flood-Induced Travel Disruptions: A Case Study of Portland, Oregon, USA, Annals of the 15 Association of American Geographers 100 (4), pp. 938-952. 16
Charlton, Matthew B. and Nigel W. Arnell 2011: Adapting to climate change impacts on water resources in 17 England—An assessment of draft Water Resources Management Plans, Global Environmental Change, Vol 21, 18 No 1, February, 238-248. 19
Chehimi, Sana Larry Cohen and Erica Valdovinos (2011), In the First Place: Community Prevention’s Promise to 20 Advance Health and Equity 21
Chen, Ji, Qinglan Li, Jun Niu and Liqun Sun (2011), Regional climate change and local urbanization effects on 22 weather variables in Southeast China, Stochastic Environmental Research and Risk Assessment, online since 13 23 July 2010 24
Chicago Climate Change Action Plan 2008 and 2010 update 25 Chu, Shu Yi and Heike Schroeder (2010), Private Governance of Climate Change in Hong Kong: An Analysis of 26
Drivers and Barriers to Corporate Action, Asian Studies Review Vol 34, No 3 September, pages 287 - 308. 27 City of Boston 2010: Sparking Boston’s Climate Revolution: Recommendations of the Climate Action Leadership 28
Committee and Community Advisory Committee. Full Report. City of Boston, Boston.* 29 City of Boston 2011: A climate of progress. City of Boston Climate Action Plan update 2011. City of Boston, 30
Boston 31 City of Copenhagen 2011: Copenhagen Climate Adaptation Plan. City of Copenhagen, Copenhagen.* 32 City of New York 2011: PlaNYC. Update April 2011. City of New York, New York. 33 Clapp, C., Leseur, A., Sartor, O., Briner, G. & Corfee-Morlot, J. 2010, Cities and Carbon Market Finance, 34
Organisation for Economic Co-operation and Development. 35 Cohen, Marc and James Garrett 2010: The food price crisis and urban food (in)security. Environment and 36
Urbanization 22(2), 467-482. 37 Colina F et al 2004 38 Constable, L and A. Cartwright 2009:. EThekwini Municipality: Municipal Adaptation Plan – Health and Water. 39
Unpublished Report. 40 Coombes, Emma G. and Andy P. Jones (2010), Assessing the impact of climate change on visitor behaviour and 41
habitat use at the coast: A UK case study, Global Environmental Change Vol 20, No 2, May, pages 303-313. 42 Corburn, Jason 2009: Cities, Climate Change and Urban Heat Island Mitigation: Localising Global Environmental 43
Science, Urban Studies 46: 413-427 44 CORC 2006: Profiles of the Informal Settlements within Cape Town Metropole, Community Organisation Resource 45
Centre, Cape Town, 220 pp. 46 Corfee-Morlot, J., Cochran, .I, Hallegatte, S., and P-J Teasdale 2011: Multilevel risk governance and urban 47
adaptation policy. Climatic Change 104(1), 169–197. 48 Crane, Wendy and Mark Swilling 2008: Environment, Sustainable Resource Use and the Cape Town Functional 49
Region – An Overview, Urban Forum Volume 19, Number 3, September, 263-287. 50 Crona, Beatrice I., Patrik Rönnbäck, Narriman Jiddawi, Jacob Ochiewo, Sam Maghimbi, and Salomão Bandeira 51
(2009), Murky water: Analyzing risk perception and stakeholder vulnerability related to sewage impacts in 52 mangroves of East Africa, Global Environmental Change Vol 19, No 2, May, pages 227-239. 53
ZERO-ORDER DRAFT IPCC WGII AR5 Chapter 8
Do Not Cite, Quote, or Distribute 89 25 July 2011
Dávila, Julio D. 2009: Being a mayor: The view from four Colombian cities. Environment and Urbanization, 21(1), 1 37-57. 2
De Sherbinin, Alex, Andrew Schiller and Alex Pulsipher 2007: The vulnerability of global cities to climate hazards, 3 Environment and Urbanization Vol 19, No 1, April, 39–64. 4
Detlef P. van Vuuren, Morna Isaac, Zbigniew W. Kundzewicz, Nigel Arnell, Terry Barker, Patrick Criqui, Frans 5 Berkhout, Henk Hilderink, Jochen Hinkel, Andries Hof, Alban Kitous, Tom Kram, Reinhard Mechler, Serban 6 Scrieciu (2011), The use of scenarios as the basis for combined assessment of climate change mitigation and 7 adaptation, Global Environmental Change, 8
Diamond, J.M. 1975). The island dilemma: lessons of modern biogeographic studies for the design of natural 9 preserves. Biological Conservation 7 : 129-146. 10
Dietz, T. 2003b, The Darwinian Trope in the Drama of the Commons: Variations on Some Themes by the Ostroms 11 in Paper prepared for the Academic Conference in Honor of the Work of Elinor and Vincent Ostrom, George 12 Mason University, Arlington, Virginia. 13
Dodman and Satterthwaite 2009 in Parry 14 Dodman, David and Diana Mitlin 2011: Challenges for community-based adaptation; discovering the potential for 15
transformation. Journal of International Development, on-line. 16 Donald, Alieta and Carolin Seeger (2010), Melbourne: responding to a changing climate, Journal of Water and 17
Climate Change Vol 1, No 3 pages 220–226. 18 Dossou, Krystel and Bernadette Glehouenou-Dossou 2007: The vulnerability to climate change of Cotonou (Benin): 19
the rise in sea level, Environment and Urbanization, Vol. 19, No. 1, 65-79. 20 Douglas, Ian 2009: Climate change, flooding and food security in south Asia, Food Security Vol 1, No 2, June, 127-21
136. 22 Douglas.I, Alam. K.,Maghenda, M., Macdonnell, Y, Mclean, L and Campbell, J. al. 2008: Unjust waters: climate 23
change, flooding and the urban poor in Africa. Environment and Urbanization, 20(1), pp.187-205. 24 Dow et al 2006 25 Eakin, Hallie et al. 2007: A stakeholder driven process to reduce vulnerability to climate change in Hermosillo, 26
Sonora, Mexico, Mitigation and Adaptation Strategies for Global Change Vol 12, No 5, June, 935-955. 27 Eakin, Hallie, Amy M. Lerner, and Felipe Murtinho (2010), Adaptive capacity in evolving peri-urban spaces: 28
Responses to flood risk in the Upper Lerma River Valley, Mexico, Global Environmental Change Vol 20, No 1, 29 February, pages 14-22. 30
Ebert, Suzanne, Orieta Hulea and David Strobel (2009), Floodplain restoration along the lower Danube: a climate 31 change adaptation, Climate and Development Vol 1, No 3, September, pages 212-9. 32
Ebi, Kristie L et al. 2009: U.S. Funding is insufficient to address the human health impacts of and public health 33 responses to climate variability and change, Environmental Health Perspectives 117(6), 857–62. 34
El Banna, Mahmoud M. and Omran E. Frihy (2009), Natural and anthropogenic influences in the northeastern coast 35 of the Nile delta, Egypt, Environmental Geology Volume 57, Number 7, June, Pages 1593-1602. 36
Endangered Wildlife Trust 2002). The biodiversity of South Africa 2002: Indicators, trends and human impacts. 37 Endangered Wildlife Trust (compiled by Jenny Le Roux), Parkview. 38
Eriksen S.; Oyen C.; Kasa S.; Underthun A. 2009: Weakening adaptive capacity? Effects of organizational and 39 institutional change on the housing sector in Norway, Climate and Development, v1 n2 (2009 12 01): 111-129 40
Ernstson, Henrik, Sander E. van der Leeuw, Charles L. Redman, Douglas J. Meffert and George Davis, et al. (2010), 41 Urban Transitions: On Urban Resilience and Human-Dominated Ecosystems, AMBIO: A Journal of the Human 42 Environment Volume 39, Number 8, December, Pages 531-545. 43
EThekwini Municipality 2007: Durban: Biodiversity Report 2007. EThekwini Municipality, Durban. 44 Fane, S. and A. Turner (2010), Integrated water resource planning in the context of climate uncertainty, Water 45
Science and Technology Vol 10, No 4, pages 487-496. 46 Fankhauser, S., Agrawala, S., Hanrahan, D., Pope, D., Skees, J., Stephens, C. & Yearley, S. 2008, Economic and 47
Policy Instruments to Promote Adaptation in Economic Aspects of Adaptation to Climate Change: Costs, 48 Benefits and Policy Instruments, eds. S. Agrawala & S. Fankhauser, pp. 85-133. 49
Farley, Kathleen A., Christina Tague, and Gordon E. Grant (2011), Vulnerability of water supply from the Oregon 50 Cascades to changing climate: Linking science to users and policy, Global Environmental Change 21(1), 51 February, pages 110-122. 52
ZERO-ORDER DRAFT IPCC WGII AR5 Chapter 8
Do Not Cite, Quote, or Distribute 90 25 July 2011
Fazey, Ioan, Mike Kesby, Anna Evely, Ian Latham, Daniel Wagatora, Jude-Edward Hagasua, Mark S. Reed, Mike 1 Christie (2010), A three-tiered approach to participatory vulnerability assessment in the Solomon Islands, 2 Global Environmental Change Vol 20, No 4, October, pages 713-728. 3
Ferguson, Bruce and Jesus Navarrete 2003: A financial framework for reducing slums: lessons from experience in 4 Latin America, Environment and Urbanization 15(2) 201-216. 5
Fernandes, Edesio 2007, Implementing the urban reform agenda in Brazil, Environment and Urbanization 19(1) 6 177-189. 7
Few, Roger and Pham Gia Tran (2010), Climatic hazards, health risk and response in Vietnam: Case studies on 8 social dimensions of vulnerability, Global Environmental Change Vol 20, No 3, August, pages 529-538. 9
Foster, J. Lowe, A. and S. Winkelman 2011a. The value of green infrastructure for urban climate adaptation. Centre 10 for Clean Air Policy, Washington D.C..* 11
Foster, J., Winkelman, S. & Lowe, A. 2011, Lessons learned on Local Climate Adaptation from the Urban Leaders 12 Adaptation Initiative, Center for Clean Air Policy - Urban Leaders Adaptation Initiative, Washington. 13
Foster, J., Winkelman, S. and A. Lowe 2011b: Lessons learned on local climate change adaptation from the Urban 14 leaders Adaptation Initiative. Centre for Clean Air Policy, Washington, D.C..* 15
Frankhauser 2010 Wiley Interdisciplinary Reviews 16 Frumkin, Howard, et al. 2008: Climate Change: The Public Health Response, American Journal of Public Health, 17
Vol 98, No 3, March, 435-445. 18 Fulco Ludwig et al. eds., Climate Change Adaptation in the Water Sector, published in association with the Co-19
operative Programme on Water and Climate, London: Earthscan, 35-50. 20 Fumiaki Fujibe, Urban warming in Japanese cities and its relation to climate change monitoring, pages 162–173. 21 Fünfgeld, H and D. McEvoy 2011) VCCCAR Project: Framing Adaptation in the Victorian Context Framing 22
Climate Change Adaptation in Policy and Practice. Working Paper 1. RMIT University, Melbourne. 23 Funtowicz, S. & Ravetz, J. 1993, Science for a Post-Normal Age, Futures, vol. 25, no. 7, pp. 739-755. 24 Gasper, Rebecca, Andrew Blohm, Matthias Ruth 2011: Social and economic impacts of climate change on the urban 25
environment, Current Opinion in Environmental Sustainability Vol 3, No 3, May, 150-157. 26 Gavidia Jorge 2006: Priority Goals in Central America. The development of sustainable mechanisms for 27
participation in local risk management, in Milenio Ambiental, No 4, pp 56 -59. Journal of the Urban 28 Environment Programme (UPE) of the International Development Research Centre, (IDRC) Montevideo; 29
GDF, Gobierno del Distrito Federal 2006) Estrategia Local de Acción Climática del Distrito Federal. 30 GDF, Gobierno del Distrito Federal 2008) Programa de Acción Climática de la Ciudad de México 2008-2012. 31 Germanwatch reports 32 Gibbons, Sheila J. Arenstam and Robert J. Nicholls (2006), Island abandonment and sea-level rise: An historical 33
analog from the Chesapeake Bay, USA, Global Environmental Change Vol 16, No 1, February, pages 40-47. 34 Gieryn, T. 1999, Cultural Boundaries of Science: Credibility on the Line, Chicago University Press, Chicago. 35 Gill, S. et al. 2007: Adapting cities for climate change: the role of the green infrastructure, Built Environment Vol 36
33, No 1, pp. 97–115. 37 Gill, S., Goodwin, C., Gowing, R.,Lawrence, P., Pearson, J. and Smith, P. 2009). Adapting to climate change: 38
Creating natural resilience. Technical Report. Greater London Authority, London, UK 39 Global Land Tool Network (GLTN), 2008: Secure Land Rights for All, UN-Habitat, Nairobi. 40 Gober, Patricia 2010: Desert urbanization and the challenges of water sustainability, Current Opinion in 41
Environmental Sustainability Vol 2, No 3, August, 144-150 42 Gober, Patricia, et al. 2010: Water Planning Under Climatic Uncertainty in Phoenix: Why We Need a New 43
Paradigm, Annals of the Association of American Geographers Vol 100, No 2, April, pages 356 – 372. 44 Godfray, H. Charles J. et al. 2010: Food Security: The Challenge of Feeding 9 Billion People, Science 327, 812-8. 45 Golder Associates 2010: Understanding community perceptions of vulnerability to climate change: Advancing 46
Capacity to Support Climate Change Adaptation. Unpublished report prepared for eThekwini Municipality. 47 Greater London Authority 2010: The draft climate change adaptation strategy for London. Public consultation draft. 48
Greater London Authority, London. 49 Gregorio Posada Vanegas y Rafael Val Segura 2005: Diagnóstico de riesgos por inundación para la Ciudad de 50
Campeche, SESEDOL, UN-HABITAT, Gobierno de Campeche 51 Grimm, Nancy B. et al 2008: Global Change and the Ecology of Cities, Science 8 February 2008 Vol 319 756-760. 52
ZERO-ORDER DRAFT IPCC WGII AR5 Chapter 8
Do Not Cite, Quote, or Distribute 91 25 July 2011
GRNUHE 2010: Improving Urban Health Equity through Action on the Social and Environmental Determinants of 1 Health, Global Research Network on Urban Health Equity, University College London and the Rockefeller 2 Institute, London, 92 pp. 3
Gujja, Biksham, Sraban Dalai, Hajara Shaik and Vinod Goud (2009), Adapting to climate change in the Godavari 4 River basin of India by restoring traditional water storage systems, Climate and Development Vol 1, No 3, 5 September, pages 229-240. 6
Güneralp, Burak and Karen C. Seto (2008), Environmental impacts of urban growth from an integrated dynamic 7 perspective: A case study of Shenzhen, South China, Global Environmental Change Vol 18, No 4, 8 October, pages 720-735 9
Gusdorf, Francois, Stephen Hallegatte and Allain Lahellec (2008), Time and space matter: How urban transitions 10 create inequality, Global Environmental Change Vol 18, No 4, October, pages 708-719. 11
Guston, D.H. 2001, Towards a Best Practice of Constructing Serviceable Truths in Knowledge, Power and 12 Participation, eds. M. Hisschemoller, J.R. Hoppe & W. Dunn, Transaction Publishers, pp. 97-119. 13
Habermas 98 14 Hacker, Jacob N and Michael J Holmes 2007: Thermal Comfort: Climate Change and the Environmental Design of 15
Buildings in the United Kingdom. Built Environment 33(1), March, 97-114. 16 Hahna, Micah B., Anne M. Riederer, and Stanley O. Foster (2009), The Livelihood Vulnerability Index: A 17
pragmatic approach to assessing risks from climate variability and change—A case study in Mozambique, 18 Global Environmental Change Vol 19, No 1, February, pages 74-88. 19
Hajat, S, M O'Connor; and T Kosatsky 2010: Health effects of hot weather: from awareness of risk factors to 20 effective health protection, Lancet Vol 375, No 9717, March, 856-63. 21
Hallegatte et al 2007 22 Hallegatte S., N. Ranger, O. Mestre, P. Dumas, J. Corfee-Morlot, C. Herweijer, R. Muir Wood, 2011, Assessing 23
Climate Change Impacts, Sea Level Rise and Storm Surge Risk in Port Cities: A Case Study on Copenhagen, 24 Climatic Change, 104(1), 113-137. 25
Hallegatte S.; J.-C. Hourcade ; P. Ambrosi, 2007, Using Climate Analogues for Assessing Climate Change 26 Economic Impacts in Urban Areas, Climatic Change 82 (1-2), 47-60 27
Hallegatte, S. & Corfee-Morlot, J. 2011, Understanding climate change impacts, vulnerability and adaptation at city 28 scale: an introduction, Climatic Change, vol. 104, no. 1, pp. 1—12 29
Hallegatte, S., Ranger, N., Bhattacharya, S., Bachu, M., Priya, S., Dhore, K., Rafique, F., Mathur, P., Naville, N., 30 Henriet, F., Patwardhan, A., Narayanan, K., Ghosh, S., Karmakar, S., Patnaik, U., Abhayankar, A., Pohit, S., 31 Corfee-Morlot, J. & Herweijer, C. 2010, Flood Risks, Climate Change Impacts and Adaptation Benefits in 32 Mumbai, Organisation for Economic Co-operation and Development. 33
Hallegatte, Stéphane, Fanny Henriet and Jan Corfee-Morlot 2011), The economics of climate change impacts and 34 policy benefits at city scale: a conceptual framework, Climatic Change Volume 104, Number 1, January, 51-87. 35
Hamin, E.M. and N. Gurran 2009: Urban Form and Climate Change: Balancing Adaptation and Mitigation in the 36 U.S. and Australia. Habitat International 33(3): 238-245. 37
Hamin, E.M. Integrating Adaptation and Mitigation In Local Climate Change Planning. Forthcoming (2011) in 38 Ingram and Hong, Eds., The Environment, Climate Change, and Land Policies. Lincoln Institute of Land 39 Policy, Cambridge. 40
Hammill, A., Richard Matthew, R. & McCarter, E. 2008, Microfinance and Climate Change Adaptation, IDS 41 Bulletin, vol. 39, no. 4, pp. 113-122. 42
Hanson, Susan, Robert Nicholls, N. Ranger, S. Hallegatte and J. Corfee-Morlot, et al. 2011: A global ranking of port 43 cities with high exposure to climate extremes, Climatic Change Vol 104, No 1, January, 89–111. 44
Hardoy, Jorge E., Diana Mitlin and David Satterthwaite 2001, Environmental Problems in an Urbanizing World: 45 Finding Solutions for Cities in Africa, Asia and Latin America, Earthscan Publications, London, 448 pp 46
Hardoy and Pandiella 2007: Adaptación de las ciudades argentinas a los efectos del cambio y la variabilidad 47 climática. Medio Ambiente y Urbanización Vol. 67, Argentina. 48
Hardoy, Jorgelina and Gustavo Pandiella 2009: Urban poverty and vulnerability to climate change in Latin America, 49 Environment and Urbanization 21(1) 203-224. 50
Hardoy, Jorgelina and Patricia Romero Lankao 2011: Latin American cities and climate change: challenges and 51 options to mitigation and adaptation responses, Current Opinion in Environmental Sustainability Vol 3, No 3, 52 May, 158–163. 53
ZERO-ORDER DRAFT IPCC WGII AR5 Chapter 8
Do Not Cite, Quote, or Distribute 92 25 July 2011
Hardoy, Jorgelina, Gustavo Pandiella and Luz Stella Velasquez 2011, Local disaster risk reduction in Latin 1 American urban areas, Environment and Urbanization 23(2). 2
Harlan and Ruddell 2011 Current Opinion in Environmental Sustainability 3 Hassan, Marwan A., Khaled Shahin, Brian Klinkenberg, Graham McIntyre, Mousa Diabat, Abed Al-Rahman 4
Tamimi and Ronit Nativ 2010: Palestinian Water II: Climate Change and Land Use, Geography Compass Vol 5 4, No 2, February, 139–157. 6
Hayhoe, Katharine, Mark Robson, John Rogula, Maximilian Auffhammer, Norman Miller, Jeff VanDorn, and 7 Donald Wuebbles 2010: An integrated framework for quantifying and valuing climate change impacts on urban 8 energy and infrastructure: A Chicago case study, Journal of Great Lakes Research Vol 36, Supplement 2, 94-9 105. 10
He, J.F., J. Y. Liu, D. F. Zhuang, W. Zhang and M. L. Liu (2007), Assessing the effect of land use/land cover 11 change on the change of urban heat island intensity, Theoretical and Applied Climatology Volume 90, Numbers 12 3-4, November, Pages 217-226 13
Hedger, M., Mitchell, T., Leavy, J., Greeley, M. and Horrocks, L. 2008: 'Evaluating Climate Change Adaptation 14 from a Development Perspective', IDS, 60 pages, available at 15 http://www.ids.ac.uk/index.cfm?objectid=E7F528D9-D84A-8558-5512ADF4C4807209 16
Hellmann, Jessica J. et al. 2010: Climate change impacts on terrestrial ecosystems in metropolitan Chicago and its 17 surrounding, multi-state region, Journal of Great Lakes Research Volume 36, Supplement 2, 74-85. 18
Herrfahrdt-Pahle, Elke (2010), South African water governance between administrative and hydrological 19 boundaries, Climate and Development Vol 2, No 2, April, pages 111-127. 20
Hess, JJ et al. 2009: Climate change and emergency medicine: impacts and opportunities, Academic Emergency 21 Medicine Vol 16, No 8, August, 782-94. 22
Hewitt K. 23 Holmes, P., Wood, J. and C. Dorse 2008). City of Cape Town Biodiversity Report. City of Cape Town, Cape Town. 24 Hoornweg, Daniel, Lorraine Sugar and Claudia Lorena Trejos Gomez 2011: Cities and greenhouse gas emissions: 25
moving forward. Environment and Urbanization 23(1) 207-227. 26 Howard, Guy, Katrina Charles, Kathy Pond, Anca Brookshaw, Rifat Hossain and Jamie Bartram (2010), Securing 27
2020 vision for 2030: climate change and ensuring resilience in water and sanitation services, Journal of Water 28 and Climate Change Vol 1, No 1, pages 2-16. 29
Howe, Carol (2010), Cities taking action: An introduction, Journal of Water and Climate Change Vol 1, No 3, page 30 219. no abstract 31
Huang, C et al. 2011: Constraints and barriers to public health adaptation to climate change: a review of the 32 literature, American journal of preventive medicine, 2011 Feb; 40(2): 183-90. 33
Hunt A and Watkiss P. 2011. Climate change impacts and adaptation in cities: A review of the literature. Climatic 34 Change.104:13-49 35
Huq, Saleemul and Jessica Ayers 2009: The Value of Linking Mitigation and Adaptation: A Case Study of 36 Bangladesh, Environmental Management Volume 43, Number 5, May, 753-764. 37
ICLEI Canada 2010: Changing Climate, Changing Communities: Guide and Workbook for Municipal Climate 38 Adaptation. ICLEI Canada,Toronto. 39
ICLEI Oceania 2008: Local Government Climate Change Adaptation Toolkit. Cities for Climate Protection 40 Australia Adaptation Initiative. ICLEI Oceania, Melbourne. 41
IFRC 2010, World Disasters Report 2010: Focus on Urban Risk, International Federation of Red Cross and Red 42 Crescent Societies, Geneva, 211 pp. 43
Imparato, Ivo and Jeff Ruster 2003, Slum Upgrading and Participation; Lessons from Latin America, World Bank, 44 Washington DC, 489 pp. 45
INPE, UNICAMP, USP 2010) Vulnerabilidade das Megacidades Brasileiras às mudanças climáticas: Regiao 46 Metropolitana de Sao Paulo. Summário Executivo. Brasil, Sao Paulo. 47
Institute for Sustainable Communities (ISC) (Undated). Promising Practices in Adaptation & Resilience: A 48 Resource Guide for Local Leaders Version 1.0. Produced in partnership with the Centre for Clean Air Policy.* 49
Iqbal, M Jawed and J Quamar (2011), Measuring temperature variability of five major cities of Pakistan, Arabian 50 Journal of Geosciences, Online First™, 9 November 2010. 51
ISDR 2010 – see United Nations 2011 52 Jabeen, Huraera, Adriana Allen and Cassidy Johnson 2010: Built-in resilience: learning from grassroots coping 53
strategies to climate variability, Environment and Urbanization 22(2) 415-431. 54
ZERO-ORDER DRAFT IPCC WGII AR5 Chapter 8
Do Not Cite, Quote, or Distribute 93 25 July 2011
Jacobs, Keith and Stewart Williams 2011: What to do now? Tensions and Dilemmas in Responding to Natural 1 Disasters: A Study of Three Australian State Housing Authorities'. International Journal of Housing Policy, 2 11(2), 175 — 193. 3
Jaroszweski, David, Lee Chapman, and Judith Petts 2010: Assessing the potential impact of climate change on 4 transportation: the need for an interdisciplinary approach, Journal of Transport Geography Volume 18, Issue 2, 5 March, 331-335. 6
Jasanoff, S. 1990, The fifth branch: science advisers as policymakers, Harvard University Press, Cambridge, Mass. 7 Jenerette, G. Darrel and Larissa Larsen (2006), A global perspective on changing sustainable urban water supplies, 8
Global and Planetary Change Vol 50, Nos 3-4, April, pages 202-211. 9 Johnson, Craig A. and Krishna Krishnamurthy (2010), Dealing with displacement: Can social protection facilitate 10
long-term adaptation to climate change?, Global Environmental Change, Vol 20, No 4, October, pages 648-655. 11 Jollands, N., M. Ruth, C. Bernier, and N. Golubiewski 2007: The climate's long-term impact on New Zealand 12
infrastructure (CLINZI) project—A case study of Hamilton City, New Zealand, Journal of Environmental 13 Management Vol 83, No 4, June, 460-477 14
Jones, L., Ludi E. and S. Levine 2010). Towards a characterisation of adaptive capacity: a framework for analysing 15 adaptive capacity at the local level. Overseas Development Institute: Background paper.* 16
Jung S (2008), Spatial variability in long-term changes of climate and oceanographic conditions in Korea, J Environ 17 Biol. 2008 Jul; 29(4):519-29. 18
Karanja, Irene 2010: An enumeration and mapping of informal settlements in Kisumu, Kenya, implemented by their 19 inhabitants, Environment and Urbanization 22(1) 217-239. 20
Keim ME 2008: Building human resilience: the role of public health preparedness and response as an adaptation to 21 climate change, Am J Prev Med. Nov;35(5):508-16 22
Kern, K. & Gotelind, A. 2009, Governing climate change in cities: modes of urban climate governance in multi-23 level systems in Competitive Cities and Climate Change, OECD Conference Proceedings, Milan, Italy, 9-10 24 October 2008 OECD, Paris, pp. 171-196. 25
Kirshen, Paul, Matthias Ruth and William Anderson 2008: Interdependencies of urban climate change impacts and 26 adaptation strategies: a case study of Metropolitan Boston USA, Climatic Change Volume 86, Numbers 1-2, 27 January, 105-122 28
Kithiia J. and R. Dowling (2010). An integrated city-level planning process to address the impacts of climate change 29 in Kenya: The case of Mombasa. Cities 27: 466-475. 30
Kithiia, J. (2009). Old notion–new relevance: setting the stage for the use of social capital resource in adapting East 31 African coastal cities to climate change. IJUASD 1(1-2): 17-32 32
Kithiia, J. (2010). Climate change risk responses in East African cities: need, barriers and opportunities. Current 33 Opinion in Environmental Sustainability 3:1-5. 34
Kithiia, Justus 2011: Climate change risk responses in East African cities: need, barriers and opportunities, Current 35 Opinion in Environmental Sustainability 2011, 3:176–180. 36
Kithiia, Justus and Anna Lyth 2011: Urban wildscapes and green spaces in Mombasa and their potential contribution 37 to climate change adaptation and mitigation, Environment and Urbanization Vol 23, No 1, April, pp. 251-265. 38
Koetse, Mark J. and Piet Rietveld 2009: The impact of climate change and weather on transport: An overview of 39 empirical findings, Transportation research. Part D, Transport and environment Vol 14, No 3, May, 205-221. 40
Kousky, C. & Schneider, S.H. 2003, Global climate policy: will cities lead the way?, Climate Policy, vol. 3, no. 4, 41 pp. 359-372. 42
Kovats 2009 in Parry 43 Kovats, S and Akhtar, R. (2008) Climate, climate change and human health in Asian cities. Environment and 44
Urbanization, vol 20(1), pp.165-175. 45 Krishnamurthy, Krishna P., Joshua B. Fisher and Craig Johnson (2011), Mainstreaming local perceptions of 46
hurricane risk into policymaking: A case study of community GIS in Mexico, Global Environmental Change 47 Vol 21, No 1, February, pages 143-153. 48
Larsen, P et al. 2008: Estimating future costs for Alaska public infrastructure at risk from climate change, Global 49 Environmental Change Vol 18, Issue 3, August, 442-457. 50
Laurent, S. 2010, Xynthia : une communication qui passe mal, April 19 edn, Paris. 51 Lee-Smith, Diana 2011 E&U 52 Leichenko R. and Solecki W. 2005. 53
ZERO-ORDER DRAFT IPCC WGII AR5 Chapter 8
Do Not Cite, Quote, or Distribute 94 25 July 2011
Leichenko, Robin M. , O'Brien, Karen L. and Solecki, William D.2010: 'Climate Change and the Global Financial 1 Crisis: A Case of Double Exposure', Annals of the Association of American Geographers Vol 100, No 4, 2 December, 963-972. 3
Liberatore, A. & Funtowicz, S. 2003, 'Democratising' expertise, 'expertising' democracy: what does this mean, and 4 why bother?, Science and Public Policy, vol. 30, no. 3, pp. 146-155. 5
Lim, B., Spranger-Siegfried, E., Burton, I., Malone, E. & Huq, S. 2005, Adaptation Policy Frameworks for Climate 6 Change: Developing Strategies, Policies, Measures, Cambridge University Press, Cambridge, UK. 7
Lindgren J.; Carlsson-Kanyama A.; Jonsson D.K. 2009: Climate adaptation of railways: Lessons from Sweden, 8 European Journal of Transport and Infrastructure Research, v9 n2 (2009 06 08): 164-181. 9
Linnekamp, F., A. Koedam, and I.S.A. Baud 2011: Household vulnerability to climate change: Examining 10 perceptions of households of flood risks in Georgetown and Paramaribo, Habitat International Vol 35, Issue 3, 11 July, 447-456. 12
Liu, Jiyuan and Xiangzheng Deng 2011: Impacts and mitigation of climate change on Chinese cities, Current 13 Opinion in Environmental Sustainability 3:188–192 14
Livengood, Avery 2012: Enabling participatory planning with GIS: a case study of settlement mapping in Cuttack, 15 India, Environment and Urbanization 24(1). 16
Loftus, A-C. 2011). Adapating urban water systems to climate change: a handbook for decision makers at the local 17 level. ICLEI, Freiburg. 18
Love, Geoff, Alice Soares, and Herbert Püempel 2010: Climate Change, Climate Variability and Transportation, 19 Procedia Environmental Sciences, Volume 1, 130-145 20
Lovejoy, T. E. and M.B. Marsh 2008). Climate change and biodiversity in the Americas in Fenech, A., MacIver, D. 21 and F. Dallmeier (eds). 2008. Climate Change and Biodiversity in the Americas. Environment Canada, Toronto, 22 Canada. 23
Lowe, A., Foster, J. and S. Winkelman 2009). Ask the Climate Question: Adapting to Climate Change Impacts in 24 Urban Regions. A report by the Centre for Clean Air Policy: Urban Leaders Adaptation Initiative, Washington 25 D.C..* 26
Ludwig, Fulco and Marcus Moench 2009: The Impacts of Climate Change on Water, in ?? 27 Lwasa, S. (2010) Adapting urban areas in Africa to climate change: the case of Kampala. Current opinion in 28
Environmental Sustainability 2:166-171. 29 Mabala, Richard 2011: Youth and the 'hood': livelihoods and neighbourhoods, Environment and Urbanization, Vol. 30
23, No. 1, 157-181. 31 Maibach EW, Chadwick A, McBride D, Chuk M, Ebi KL, Balbus J. 2008: Climate change and local public health in 32
the United States: preparedness, programs and perceptions of local public health department directors, PLoS 33 One. 2008 Jul 30;3(7):e2838, 1-8. 34
Maller, Cecily J. and Yolande Strengers 2011: Housing, heat stress and health in a changing climate: promoting the 35 adaptive capacity of vulnerable households, a suggested way forward. Health Promotion International, e-pub 36 before print. 37
Manda, Mtafu A Zeleza (2007), Mchenga - urban poor housing fund in Malawi, Environment and Urbanization, 38 Vol. 19, No. 2, pages 337-359. 39
Mansilla with Brenes and Icaza 2008, 40 Manuel-Navarrete, David, Mark Pelling and Michael Redlift 2011) Critical adaptation to hurricanes in the Mexican 41
Caribbean: Development visions, governance structures and doping strategies. Global Environmehtal Change 42 Vol. 21, pp.249-258 43
Martine G, McGranahan G, Montgomery M, Fernandez-Castilla R: Introduction. In The New Global Frontier. 44 Urbanization, Poverty and Environment in the 21st Century. Edited by Martine G, McGranahan G, 45 Montgomery M, Fernandez-Castilla R. Earthscan; 2007:1-16. 46
Mather, A., Roberts, D. and G. Tooley 2011). Adaptation in Practise: Durban, South Africa in Resilient Cities Cities 47 and Adaptation to Climate Change – Proceedings of the Global Forum 2010. Otto-Zimmermann, Konrad, 48 ICLEI – Local Governments for Sustainability, Bonn, Germany (Ed.). Springer, Heidelberg. 49
Matthias, Ruth et al. 2007: Adaptation of urban water supply infrastructure to impacts from climate and 50 socioeconomic changes: The case of Hamilton, New Zealand, Water Resources Management Vol 21, No 6, 51 June, 1031-1045. 52
ZERO-ORDER DRAFT IPCC WGII AR5 Chapter 8
Do Not Cite, Quote, or Distribute 95 25 July 2011
McGranahan G and Marcotullio PJ Eds. 2007. Scaling Urban Environmental Challenges: From Local to Global and 1 Back. 2
McGranahan G, Balk D, Anderson B: Risk of Climate Change forUrban SettlementsinLowElevationCoastalAreas.In 3 TheNew Global Frontier. Urbanization, Poverty and Environment in the 21st Century. Edited by Martine G, 4 McGranahan G, Montgomery M, Fernandez-Castilla R. Earthscan; 2007:77-98. 5
McGranahan, Gordon, Deborah Balk and Bridget Anderson 2007: The rising tide: assessing the risks of climate 6 change and human settlements in low elevation coastal zones, Environment and Urbanization Vol 19, No 1, 7 April, 17–37. 8
McKinsey 2011 9 McMichael AJ, et al. 2008: International study of temperature, heat and urban mortality: the ‘ISOTHURM’ project, 10
International Journal of Epidemiology 2008, 37:1121-1131. 11 McMichael, AJ et al. 2008: Global environmental change and health: impacts, inequalities, and the health sector, 12
BMJ Volume 336, Issue 7637, 26 January, 191-4. 13 Measham, T.G., Preston, B.L., Brook, C., Smith T.F., Morrison, C., Withycombe, G. and R. Gorddard 2010). 14
Adapting to climate change through local municipal planning: barriers and opportunities. Socio-Economics and 15 the Environment in Discussion. CSIRO Working Paper Series 2010-05. 16
Mehotra et al 2009 – Risk Assessment… [paper from Marseille meeting] 17 Mehrotra S, Rosenzweig C, Solecki WD, Natenzon CE, Omojola A, Folorunsho R, Gilbride J: Cities, disasters and 18
climate risk, In First Assessment Report on Climate Change and Cities (ARC3). Edited by Rosenzweig C, 19 Solecki WD, Hammer SA, Mehrotra S. Cambridge University Press; 2011. 20
Melbourne 2009 21 Millennium Ecosystem Assessment 2005). Millennium Ecosystem Assessment, General Synthesis Report. Island 22
Press, Washington DC. 23 Mills, E. 2007, Synergisms between climate change mitigation and adaptation: an insurance perspective, Springer 24
Netherlands. 25 Milly PCD, Betancourt J, Falkenmark M, Hirsch RM, Kundzewic, Lettenmaier DP, Stouffer RJ 2008: Stationarity is 26
dead: whither water management? Science Vol 319:573-574. 27 Milman, Anita and Anne Short (2008), Incorporating resilience into sustainability indicators: An example for the 28
urban water sector, Global Environmental Change Vol 18, No 4, October, pages 758-767. 29 Mirza 2003 30 Mitlin, Diana (2008), With and beyond the state; co-production as a route to political influence, power and 31
transformation for grassroots organizations, Environment and Urbanization, Vol. 20, No. 2, pages 339-360. 32 Mitlin, Diana and Anna Muller (2004), Windhoek, Namibia: towards progressive urban land policies in Southern 33
Africa, International Development Planning Review, Vol 26, No 2, pages 167-186. 34 Mohan 2002 35 Mohan and Stokke 2000 36 Morimoto, Yukihiro 2011: Biodiversity and ecosystem services in urban areas for smart adaptation to climate 37
change: Do you Kyoto? Landscape and Ecological Engineering Volume 7, Number 1, January, 9-16. 38 Moser, Caroline and David Satterthwaite 2008: ‘Towards Pro-poor Adaptation to Climate Change in the Urban 39
Centres of Low and Middle-Income Countries’ in Climate Change and Cities Discussion Paper 3, IIED, 50 40 pages. 41
Mukheibir, Pierre 2008: Water Resources Management Strategies for Adaptation to Climate-Induced Impacts in 42 South Africa, Water Resources Management Vol 22, Number 9, September, 1259-1276. 43
Mukheibir, Pierre and Gina Ziervogel 2007: Developing a Municipal Adaptation Plan (MAP) for climate change: 44 the city of Cape Town, Environment and Urbanization, Vol. 19, No. 1, 143-158. 45
Muller, Mike 2007: Adapting to climate change: water management for urban resilience. Environment and 46 Urbanization 19(1) 99-113. 47
Munich Re Group 2004: Megacities; Megarisks; Trends and Challenges for Insurance and Risk Management, 48 Munich Reinsurance, Munich, 79 pp. 49
MWH 2008: Chicago Area Climate Change Quick Guide: Adapting to the physical impacts of climate change. Ed. J. 50 Parzen. MWH, Chicago.* 51
Nagy, Gustavo, Gómez Erache, Mónica and Virgina Fernández 2007) El aumento del nivel del mar en la costa 52 uruguaya del Río de la Plata. Tendencias, vulnerabilidades y medidas para la adaptación. Medio Ambiente y 53 Urbanización, Vol. 67 54
ZERO-ORDER DRAFT IPCC WGII AR5 Chapter 8
Do Not Cite, Quote, or Distribute 96 25 July 2011
Nelson, Kären C., Margaret A. Palmer, James E. Pizzuto, Glenn E. Moglen, Paul L. Angermeier, Robert H. 1 Hilderbrand, Michael Dettinger, and Katharine Hayhoe (2009), Forecasting the Combined Effects of 2 Urbanization and Climate Change on Stream Ecosystems: From Impacts to Management 3
Newman, Peter 2010: Green Urbanism and its Application to Singapore, Environment and Urbanization ASIA, 1, 4 no. 2 (2010): 149-170. 5
Nicholls 2004 6 Nie, Linmei, Oddvar Lindholm, Geir Lindholm, and Elisabeth Syversen (2009), Impacts of climate change on urban 7
drainage systems - a case study in Fredrikstad, Norway, Urban Water Journal Vol 6, No 4, August, pages 323-8 332. 9
Niemelä, Jari et al. 2010: Using the ecosystem services approach for better planning and conservation of urban 10 green spaces: a Finland case study, Biodiversity and Conservation 19, no. 11 (2010): 3225-3243. 11
O’Brien and Leichenko 2000 12 O’Brien et al, 2004 13 O’Demsey T: Fair training: a new direction in humanitarian assistance. Prog Dev Stud 2009, 9(1):81-86. 14 Oberndorfer, E., J. Lundholm, B. Bass, R.R. Coffman, H. Doshi, N. Dunnett, S.R. Gaffin, M. Köhler, K.K.Y. Liu 15
and B. Rowe, Green roofs as urban ecosystems: ecological structures, functions, and services, BioScience 57 16 (10) (2007), pp. 823–833. 17
OECD 2008, Economic Aspects of Adaptation to Climate Change, . 18 OECD 2009, Integrating Climate Change Adaptation into Development Cooperation: Policy Guidance, OECD, 19
Paris. 20 OECD 2010a, Cities and Climate Change, OECD, Paris. 21 OECD 2010b, Strategic Environmental Assessment and Adaptation to Climate Change, OECD, Paris. 22 O'Hara, Jeffrey and Konstantine Georgakakos 2008: Quantifying the Urban Water Supply Impacts of Climate 23
Change, Water Resources Management Vol 22, No 10, October, 1477-1497. 24 Ojima, Ricardo 2009) Perspectivas para a adaptação frente às mudanzas ambientais globais no contexto da 25
urbanização brasileira: cenários para os estudos de população. In Hogan, Daniel and Eduardo Marandola (Ed.) 26 População e mudança climática. United Nations Population Fund, UNICAMP, São Paulo. 27
Olsson, J., K. Berggren, M. Olofsson, and M. Viklander (2009), Applying climate model precipitation scenarios for 28 urban hydrological assessment: A case study in Kalmar City, Sweden, Atmospheric Research Volume 92, Issue 29 3, May, Pages 364-375 30
Onof, C. and K. Arnbjerg-Nielsen (2009), Quantification of anticipated future changes in high resolution design 31 rainfall for urban areas, Atmospheric Research Volume 92, Issue 3, May, Pages 350-363. 32
Opitz-Stapleton, S. 2010). Only death is certain, yet you still get out of bed in the morning: observations on the use 33 of climate information in adaptation and resilience practice. Climate Resilience in Concept and Practice 34 Working Paper Series. Boulder, Colorado. 35
Paavola and Adger 2006 36 Palacio, A, Paulo Salles Afonso de Almeida Rodolfo Silva Casarín, Erick Gustavo Bautista Godínez, 37 Palutikof, J.P. (2010), The view from the front line: Adapting Australia to climate change, Global Environmental 38
Change Vol 20, No 2, May, pages 218-9. 39 Pamoja Trust and Slum Dwellers International 2008: Nairobi Slum Inventory, Pamoja Trust, Urban Poor Fund 40
International and Shach/Slum Dwellers International, Nairobi, 175 pp. 41 Parry, M., Arnell, N., Berry, P., Dodman,D., Fankhauser, S., Hope, C., Kovats, S., Nicholls,R., Satterthwaite, D., 42
Tiffin, R. and T. Wheeler 2009). Assessing the Costs of Adaptation to Climate Change: A Review of the 43 UNFCCC and Other Recent Estimates, International Institute for Environment and Development (IIED) and 44 Grantham Institute for Climate Change, London. 45
Parzen, J. 2009). Lessons learned: creating the Chicago Climate Action Plan. City of Chicago, Chicago.* 46 Patel, Sheela 2004, Tools and methods for empowerment developed by slum and pavement dwellers’ federations in 47
India. Participatory Learning and Action PLA 50, 118-119 (CHECK); 48 Pavri, Firooza (2010), Urban Expansion and Sea-Level Rise Related Flood Vulnerability for Mumbai (Bombay), 49
India Using Remotely Sensed Data, Geotechnologies and the Environment, 1, Volume 2, Geospatial Techniques 50 in Urban Hazard and Disaster Analysis, Part 1, Pamela S. Showalter and Yongmei Lu, eds., Springer, Pages 51 31-49. 52
Pelling, M 2011a: Adaptation to Climate Change: from resilience to transformation, Routledge, London, 203 pages. 53
ZERO-ORDER DRAFT IPCC WGII AR5 Chapter 8
Do Not Cite, Quote, or Distribute 97 25 July 2011
Pelling, M 2011b: Urban governance and disaster risk reduction in the Caribbean: The experiences of Oxfam GB. 1 Environment and Urbanization 23(2). 2
Pickett , S.T.A., Cadenasso , M.L., Grove, J.M., Boone, C.G., Groffman, P.M. , Irwin, E., Kaushal, S.S., Marshall, 3 V., McGrath, B.P., Nilon, C.H., Pouyat, R.V., Szlavecz, K., Troy, A. and P. Warren 2010). Urban ecological 4 systems: Scientific foundations and a decade of progress. Journal of Environmental Management 92 (2011) 5 331-362. 6
Portland 2009 and 2010 7 Posey, John (2009), The determinants of vulnerability and adaptive capacity at the municipal level: Evidence from 8
floodplain management programs in the United States, Global Environmental Change Vol 19, No 4, October, 9 pages 482-493. 10
Praskievicz, Sarah and Heejun Chang (2009), A review of hydrological modelling of basin-scale climate change and 11 urban development impacts, Progress in Physical Geography Vol 33, No 5, October, pages 650 - 671. 12
Preston, Benjamin L., Richard M. Westaway and Emma J. Yuen 2011: Climate adaptation planning in practice: an 13 evaluation of adaptation plans from three developed nations, Mitigation and Adaptation Strategies for Global 14 Change Vol 16, No 4, April, 407-438. 15
Prowse, T. et al. 2009: Implications of climate change for economic development in northern Canada: energy, 16 resource, and transportation sectors, Vol 38, No 5, July, 272-81. 17
Puppim de Oliveira, J.A. 2009, The implementation of climate change related policies at the subnational level: An 18 analysis of three countries, Habitat International, vol. 33, no. 3, pp. 253-259. 19
Qureshi, Syed, Jamil Hasan Kazmi, and Jürgen H. Breuste 2010: Ecological disturbances due to high cutback in the 20 green infrastructure of Karachi: Analyses of public perception about associated health problems, Urban 21 Forestry & Urban Greening Volume 9, Issue 3, 2010, 187-198 22
Rahman, M. Maksudur, Graham Haughton, and Andrew E G Jonas 2010: The challenges of local environmental 23 problems facing the urban poor in Chittagong, Bangladesh: a scale-sensitive analysis. Environment and 24 Urbanization 22(2), 561-578. 25
Ranger N., S. Hallegatte, S. Bhattacharya, M. Bachu, S. Priya, K. Dhore, F. Rafique, P. Mathur, N. Naville, F. 26 Henriet, C. Herweijer, S. Pohit, J. Corfee-Morlot, 2011. A Preliminary Assessment of the Potential Impact of 27 Climate Change on Flood Risk in Mumbai, Climatic Change, 104(1), 139-167 28
Ranger, N., Muir-Wood, R. & Priya, S. 2009, Assessing extreme climate hazards and options for risk mitigation and 29 adaptation in the developing world. Development and Climate Change Background note., World Bank, 30 Washington, DC. 31
Rees W.E. 2009: The ecological crisis and self-delusion: Implications for the building sector. Building Research and 32 Information 37(3), 300-311. 33
Regmi, Madan and Shinya Hanaoka 2011: A survey on impacts of climate change on road transport infrastructure 34 and adaptation strategies in Asia, Environmental Economics and Policy Studies Vol 13, No 1, January, 21-41. 35
Reid and Vogel 2006 36 Renn, O. 2008, Risk Governance: Coping with Uncertainty in a Complex World, Earthscan, London, UK. 37 Revi, Aromar (2005), Lessons from the deluge: priorities for multi-hazard risk mitigation,, Economic and Political 38
Weekly, Vol. 40, No. 36, pages 3911-3916. 39 Revi, A. (2008) Climate change risk: an adaptation and mitigation agenda for Indian cities. Environment and 40
Urbanization, vol 20(1), pp.207-229. 41 Rim, Chang-Soo (2009), The effects of urbanization, geographical and topographical conditions on reference 42
evapotranspiration, Climatic Change Vol 97, Nos 3-4, December, pages 483-514. 43 Roberts, D. 2008: Thinking globally, acting locally- institutionalizing climate change at the local government level 44
in Durban South Africa. Environment and Urbanization, Vol 20(2), pp.521-537. 45 Roberts, D. (2010), Prioritising climate change adaptation and local level resiliency in Durban South Africa 46
Environment and Urbanization Vol 22, No 2, October, pages 397-413. 47 Roberts, Simon 2008a: Altering existing buildings in the UK. Energy Policy 36(12), 4482-4486. 48 Roberts, Simon 2008b: Effects of climate change on the built environment. Energy Policy, 36(12), 4552-4557. 49 Román, Mikael (2010), Governing from the middle: the C40 Cities Leadership Group, Corporate Governance Vol 50
10, No 1, pages 73 – 84. 51 Romero-Lankao, P. 2007, How do local governments in Mexico City manage global warming?, Local Environment, 52
, no. 12, pp. 519-535. 53
ZERO-ORDER DRAFT IPCC WGII AR5 Chapter 8
Do Not Cite, Quote, or Distribute 98 25 July 2011
Romero-Lankao, Patricia 2010) Water in Mexico City: what will climate change nring to its history of water-related 1 hazards and vulnerabilities? Environment and Urbanization Vol. 22 Nº1 2
Romero Lankao, Patricia and David Dodman 2011: Cities in transition: transforming urban centers from hotbeds of 3 GHG emissions and vulnerability to seedbeds of sustainability and resilience: Introduction and Editorial 4 overview, Current Opinion in Environmental Sustainability Vol 3, No 3, May, 113–120. 5
Rosenberg, Eric A., Patrick W. Keys, Derek B. Booth, David Hartley and Jeff Burkey, et al. 2010: Precipitation 6 extremes and the impacts of climate change on stormwater infrastructure in Washington State, Climatic Change 7 Vol 102, Nos 1-2, September, 319-349 8
Rosenzweig C, Solecki W, Hammer S, Shagun M. Eds. 2011. First Assessment of Research on Climate Change in 9 Cities. Cambridge University Press. 10
Rosenzweig C, Solecki W, Hammer SA, Mehrotra S. Cities lead the way in climate-change action. Nature 2010. 11 467:909-911. 12
Rosenzweig C, Solecki W. 2010) (Eds): Climate Change Adaptation in New York City: Building a Risk 13 Management Response. New York Academy of Sciences 1196; 2010. 14
Rotterdam 2010 Rotterdam Climate Proof 2010 15 Ruth, Matthias 2010: Economic and Social Benefits of Climate Information: Assessing the Cost of Inaction, 16
Procedia Environmental Sciences; World Climate Conference-3 Vol.1 387-394. 17 Sabates-Wheeler et al 2008 18 Sajjad, S.H., Babar Hussain, M. Ahmed Khan, Asif Raza and B. Zaman, et al. (2009), On rising temperature trends 19
of Karachi in Pakistan, Climatic Change Vol 96, No 4, October, pages 539-547. 20 Sales, Jr., Ramon Faustino M. (2009), Vulnerability and adaptation of coastal communities to climate variability and 21
sea-level rise: Their implications for integrated coastal management in Cavite City, Philippines, Ocean & 22 Coastal Management Vol 52, No 7, July, pages 395-404 23
Sánchez, Ana Belen and Peter Poschen 2009: The social and decent work dimensions of a new Agreement on 24 Climate Change: A Technical Brief, Geneva: ILO, 39 pages. Available at: 25 http://www.ilo.org/wcmsp5/groups/public/---dgreports/---integration/documents/briefingnote/wcms_107814.pdf 26
Sánchez-Rodriguez, Roberto 2009: Learning to adapt to climate change in urban areas. A review of recent 27 contributions, Current Opinion in Environmental Sustainability Vol 1, No 1, 201–206. 28
Sánchez-Rodríguez, Roberto 2011: Urban and Social Vulnerability to Climate Variability in Tijuana, Mexico in 29 Kasperson, Roger and Mimi Berberian (ed) Integrating Science and Policy Vulnerability and Resilience in 30 Global Environmental Change. Earthscan. check 31
Santos, João and Solange Leite (2009), Long-term variability of the temperature time series recorded in Lisbon, 32 Journal of Applied Statistics Volume 36, Issue 3, March, pages 323 - 337. 33
Satterthwaite, David 2007: The Transition to a Predominantly Urban World and its Underpinnings Human 34 Settlements Working Paper Series Urban Change No. 4, London: IIED, 91 pages. 35
Satterthwaite, David 2008: Cities’ contribution to global warming; notes on the allocation of greenhouse gas 36 emissions. Environment and Urbanization 20(2), 539-550 37
Satterthwaite, David 2011: How urban societies can adapt to resource shortage and climate change. Philosophical 38 Transactions of the Royal Society A, 369, 1762-1783. 39
Satterthwaite D, Saleemul H, Pelling M, Reid H, Lankau-Romero P 2007: Adapting to climate change in urban 40 areas: Possibilities and constraints in low-and-middle-income nations. IIED, Human Settlements Discussion 41 Paper: Climate Change and Cities 1. 42
Satterthwaite, D., Huq, S., Pelling, M., Reid, H. & Romero-Lankao, P. 2007, Building Climate Change Resilience in 43 Urban Areas and Among Urban Populations in Low- and Middle- income Nations, CENTER FOR 44 SUSTAINABLE URBAN DEVELOPMENT. 45
Satterthwaite, Dodman and Bicknell 2009 46 Satterthwaite, David, Gordon McGranahan, and Cecilia Tacoli 2010: Urbanization and its implications for food and 47
farming, Phil. Trans. R. Soc. B Vol 365, No 1554, September, 2809-2820. 48 Scheinberg, Anne, Sandra Spies, Michael H. Simpson, and Arthur P.J. Mol (2011), Assessing urban recycling in 49
low- and middle-income countries: Building on modernised mixtures, Habitat International, Volume 35, Issue 50 2, April 2011, Pages 188-198. 51
Schmidhuber J and F Tubiello 2007: Global food security under climate change, Proc Natl Acad Sci USA 104(50): 52 19 703–8. 53
ZERO-ORDER DRAFT IPCC WGII AR5 Chapter 8
Do Not Cite, Quote, or Distribute 99 25 July 2011
Schroeder, H. & Bulkeley, H. 2008, Governing Climate Change Post-2012: The Role of Global Cities Case-Study: 1 Los Angeles. 2
Schwarz, Nina, Annette Bauer, and Dagmar Haase 2011: Assessing climate impacts of planning policies—An 3 estimation for the urban region of Leipzig (Germany), Environmental Impact Assessment Review Volume 31, 4 Issue 2, March 2011, 97-111. 5
Seabrook, Leonie, Clive A. Mcalpine, and Michiala E. Bowen 2011: Restore, repair or reinvent: Options for 6 sustainable landscapes in a changing climate, Landscape and Urban Planning, v100 n4 (20110430): 407-410 7
Semadeni-Davies A., Hernebring C., Svensson G., and L-G Gustafsson (2008), The impacts of climate change and 8 urbanisation on drainage in Helsingborg, Sweden: combined sewer system, Journal of Hydrology Vol 350, Nos 9 1-2, 15 February, pages 100-113. 10
Sen, Zekai (2009), Precipitation downscaling in climate modelling using a spatial dependence function, 11 International Journal of Global Warming Vol 1, Nos 12
Sharma, D and Tomar, S. (2010) Mainstreaming climate change adaptation in Indian cities. Environment and 13 Urbanization, 22(2), 451-465. 14
Shaw, Alison, Stephen Sheppard, Sarah Burch, David Flanders, Arnim Wiek, Jeff Carmichael, John Robinson, 15 Stewart Cohen (2009), Making local futures tangible—Synthesizing, downscaling, and visualizing climate 16 change scenarios for participatory capacity building, Global Environmental Change Vol 19, No 4, October, 17 pages 447-463. 18
Shaw, K. and K. Theobald 2011). Resilient local government and climate change interventions in the UK. Local 19 Environment 16(1) 1-15. 20
Shen, Dajun 2010: Climate change and water resources: evidence and estimate in China, Current Science Vol. 98 21 Issue 8, 1063-1068. 22
Sherbinin. A, Schiller. A and Pulsipher. A. (2007) The vulnerability of global cities to climate hazards. Environment 23 and Urbanization, vol 19(1), pp.39-64. 24
Simon, David 2010: The Challenges of Global Environmental Change for Urban Africa, Urban Forum Vol 21, No 25 3, 235-248. 26
Simon, David and Hayley Leck (2010), Urbanizing the global environmental change and human security agendas, 27 Climate and Development Vol 2, No 3, July, pages 276-290. 28
Smith K.R.; Roebber P.J. 2011: Green roof mitigation potential for a proxy future climate scenario in Chicago, 29 Illinois, Journal of Applied Meteorology and Climatology, v50 n3 (2011 03 01): 507-522 30
Smith, B.J. M. Gomez-Heras, and S. McCabe (2008), Understanding the decay of stone-built cultural heritage, 31 Progress in Physical Geography Vol 32, No 4, August, pages 439 - 461. 32
Smith, B.J. M. Gomez-Heras, and S. McCabe (2008), Understanding the decay of stone-built cultural heritage, 33 Progress in Physical Geography Vol 32, No 4, August, pages 439 - 461. 34
Sofia Thorsson, Fredrik Lindberg, Jesper Björklund, Björn Holmer and David Rayner, Potential changes in outdoor 35 thermal comfort conditions in Gothenburg, Sweden due to climate change: the influence of urban geometry, 36 pages 324–335. 37
Solecki WD et al. 2011. 38 Solecki WD, Leichenko R: Urbanization and the Metropolitan Environment: Lessons from New York and Shanghai. 39
Environment 2006. 48:8-23. 40 Solnit R. 2008. A Paradise Built in Hell: The Extraordinary Communities that Arise in Disaster. New York: Penguin 41
Books. 42 Some, Wawan Wardah Hafidz and Gabriela Sauter 2009: Renovation not relocation: the work of Paguyuban Warga 43
Strenkali PWS in Indonesia, Environment and Urbanization, 21(2) 463-476. 44 South African Cities Network 2011).Towards resilient cities: areflection on the first decade of a democratic and 45
transformed local government in South Africa 2001- 2011. SACN, Johannesburg. 46 Stephens, Carolyn 1996: Healthy cities or unhealthy islands: the health and social implications of urban inequality. 47
Environment and Urbanization 8(2) 9-30. 48 Stewart, Mark G., Xiaoming Wang, and Minh N. Nguyen (2011), Climate change impact and risks of concrete 49
infrastructure deterioration, Engineering Structures Volume 33, Issue 4, April 2011, Pages 1326-1337. 50 Stone, Brian (2007), Urban and rural temperature trends in proximity to large US cities: 1951-2000, International 51
Journal of Climatology Vol 27, No 13, pages 1801–1807. 52
ZERO-ORDER DRAFT IPCC WGII AR5 Chapter 8
Do Not Cite, Quote, or Distribute 100 25 July 2011
Stone, Brian, Jeremy Hess and Howard Frumkin 2010) Urban Form and Extreme Heat Events: Are Sprawling Cities 1 More Vulnerable to Climate Change Than Compact Cities? Environmental Health Perspectives, Vol. 18, Nº 10, 2 october, 2010. 3
Stren R: International assistance for cities in low and middle- income countries. Environment and Urbanization 4 2008, 20(2):377-393 5
Tacoli, Cecilia 2009: Crisis or adaptation? Migration and climate change in a context of high mobility, Environment 6 and Urbanization, Vol. 21, No. 2, 513-526. 7
Tait, S. J. , Ashley, R. M. , Cashman, A. , Blanksby, J. and Saul, A. J.2008: Sewer system operation into the 21st 8 century, study of selected responses from a UK perspective, Urban Water Journal Vol 5, No 1, 79-88. 9
Tanner T, Mitchell T, Polack E, Guenther B 2008: Urban Governance for Adaptation: Assessing Climate Change 10 Resilience in Ten Asian Cities, IDS Working Paper 315. Brighton: IDS. IS THIS 2008 OR 2009? 11
Tanner et al 2009, 12 TARU 2010: City resilience strategy Indore. Working Draft.* 13 TARU 2011: Surat City Resilience Strategy. City of Surat, Surat.* 14 Tayanç, Mete, Ulaş İm, Murat Doğruel and Mehmet Karaca (2009), Climate change in Turkey for the last half 15
century, Climatic Change Vol 94, No 3-4, June, pages 483-502. 16 Taylor, Craig A. and Heinz G. Stefan (2009), Shallow groundwater temperature response to climate change and 17
urbanization, Journal of Hydrology Vol 375, Nos 3-4, September, pages 601-612. 18 Terry, Geraldine 2009) 'No climate justice without gender justice: an overview of the issues', Gender and 19
Development Vol 17, No 1, 5-18. CHECK 20 The Economics of Ecosystems and Biodiversity (TEEB) 2010). The Economics of Ecosystems and Biodiversity: 21
Mainstreaming the Economics of Nature: A synthesis of the approach, conclusions and recommendations of 22 TEEB. Progress Press, Malta. 23
The Nature Conservancy 2009). Adapting to climate change: ecosystem-based approaches for people and nature. 24 The Nature Conservancy, Arlington VA. 25
Thomas and Twyman 2005 26 Thornbush, M. J. and Viles, H. A. (2007), Simulation of the dissolution of weathered versus unweathered limestone 27
in carbonic acid solutions of varying strength, Earth Surface Processes and Landforms Vol 32, No 6, May, 28 pages 841-852. 29
Tol et al, 2004 30 Toly 2008 31 Tompkins, Emma L., Maria Carmen Lemos and Emily Boyd (2008), A less disastrous disaster: Managing response 32
to climate-driven hazards in the Cayman Islands and NE Brazil, Global Environmental Change Vol 18, No 4, 33 October, pages 736-745. 34
Tompkins, Emma, W. Neil Adger, Emily Boyd, Sophie Nicholson-Cole, Keith Weatherhead, and Nigel Arnell 35 (2010), Observed adaptation to climate change: UK evidence of transition to a well-adapting society, Global 36 Environmental Change Vol 20, No 4, October, pages 627-635. 37
Toronto Environment Office 2008). Ahead of the storm; preparing Toronto for climate change (highlights). City of 38 Toronto, Toronto.* 39
Tubby, K. V. and J.F. Webber 2010: Pests and diseases threatening urban trees under a changing climate, Forestry 40 Vol 83, No 4, October, 451-459 41
Tyler, S., Orleans Reed, S. Macclune, K. and S. Chopde 2010). Planning for Urban Climate Resilience: Framework 42 and Examples from the Asian Cities Climate Change Resilience Network (ACCCRN). Climate Resilience in 43 Concept and Practice Working Paper Series. Boulder, Colorado. 44
U.S. Environmental Protection Agency EPA 2011: Climate change vulnerability assessments: four case studies of 45 water utility practices. Global Change Research Program, National Center for Environmental Assessment, 46 Washington, DC; EPA/600/R-10/077F. Available from the National Technical Information Service, Springfield, 47 VA, and online at http://www.epa.gov/ncea. 48
UNEP-FI reports 49 UN Millennium Project 2005: A Home in the City, The report of the Millennium Project Taskforce on Improving the 50
Lives of Slum Dwellers, Earthscan Publications, London and Sterling Va, 175 . 51 52 United Nations 2009: Global Assessment Report on Disaster Risk Reduction: Risk and Poverty in a Changing 53
Climate, ISDR, United Nations, Geneva, 207 pages 54
ZERO-ORDER DRAFT IPCC WGII AR5 Chapter 8
Do Not Cite, Quote, or Distribute 101 25 July 2011
United Nations 2011: Revealing Risk, Redefining Development: The 2011 Global Assessment Report on Disaster 1 Risk Reduction, United Nations International Strategy for Disaster Reduction, Geneva, 178 pages. 2
UN-Habitat: Enhancing Urban Safety and Security; Global Report on Human Settlements 2007. Earthscan 3 Publications; 2007. 4
United Nations Human Settlements Programme (UN-Habitat) (undated d). Climate Change Assessment for 5 Sorsogon, Phillipines: A Summary. UN Habitat, Nairobi. 6
United Nations Human Settlements Programme (UN-Habitat) (undated a) Cities and Climate Change. Initial 7 Lessons from UN-Habitat. UN Habitat, Nairobi. 8
United Nations Human Settlements Programme (UN-Habitat) (undated b). Climate Change Assessment for 9 Esmeraldas, Ecuador: A Summary. UN Habitat, Nairobi. 10
United Nations Human Settlements Programme (UN-Habitat) (undated c). Climate Change Assessment for 11 Kampala, Uganda: A Summary. UN Habitat, Nairobi. 12
United Nations Human Settlements Programme (UN-Habitat) (undated a). Climate Change Assessment for 13 Esmeraldas, Ecuador: A Summary. UN Habitat, Nairobi. United Nations Human Settlements Programme (UN-14 Habitat) (undated b). Climate Change Assessment for Kampala, Uganda: A Summary. UN Habitat, Nairobi. 15
UN-Habitat 2003: The Challenge of Slums: Global Report on Human Settlements 2003, Earthscan Publications, 16 London, 310 pp. 17
United Nations Human Settlements Programme (UN-Habitat) 2011). Cities and Climate Change: Global report on 18 Human Settlements 2011. Earthscan, London. 19
United Nations Office on Drugs and Crime (UNODC, 2008) Preparándose para el futuro. Amenazas, riesgos, 20 vulnerabilidad y adaptación frente al cambio climático , Colombia. 21
United Nations, Department of Economic and Social Affairs, Population Division, 2010: World Urbanization 22 Prospects: The 2009 Revision, CD-ROM Edition - Data in digital form, POP/DB/WUP/Rev.2009, United 23 Nations, New York. 24
United Nations Population Fund: State of the World Population 2007. Unleashing the potential of Urban Growth. 25 United Nations; 2007. 26
Urwin, K. & Jordan, A. 2008, Does public policy support or undermine climate change adaptation? Exploring policy 27 interplay across different scales of governance, Global Environmental Change, vol. 18, no. 1, pp. 180-191. 28
Vairavamoorthy, Kala, Sunil D. Gorantiwar, and Assela Pathirana (2008), Managing urban water supplies in 29 developing countries – Climate change and water scarcity scenarios, Physics and Chemistry of the Earth, Parts 30 A/B/C Vol 33, No 5, 2008, pages 330-339 31
Vale LJ and Campanella TJ 2005. The resilient city: how modern cities recover from disaster 32 van Aalst, Maarten K., Terry Cannon, and Ian Burton (2008), Community level adaptation to climate change: The 33
potential role of participatory community risk assessment, Global Environmental Change Vol 18, No 1, 34 February, pages 165-179. 35
van der Brugge, Rutger and Rutger de Graaf 2010: Linking water policy innovation and urban renewal: the case of 36 Rotterdam, The Netherlands, Water Policy 12(3), 381-400. 37
van Vuuren, Detlef P., Paul L. Lucas and Henk Hilderinka (2007), Downscaling drivers of global environmental 38 change: Enabling use of global SRES scenarios at the national and grid levels, Global Environmental Change 39 Vol 17, No 1, February, pages 114-130. 40
Vano, Julie A et al. 2010: Climate change impacts on water management in the Puget Sound region, Washington 41 State, USA, Climatic Change 102(1-2), September, 262-286 42
Vázquez-Botello 2010) (Ed.) Vulnerabilidad de las Zonas Costeras Mexicanas ante el Cambio Climático UNAM. 43 Vogel, C., Moser, S.C., Kasperson, R.E. & Dabelko, G. 2007, Linking Vulnerability, Adaptation and Resilience 44
Science to Practice: Pathways, Players and Partnerships, Global Environmental Change, vol. 17, pp. 349-364. 45 Vojinovic, Z. and Van Teeffelen, J.2007: An integrated stormwater management approach for small islands in 46
tropical climates, Urban Water Journal 4(3), September, 211-231. 47 Wagsaether, K. & Ziervogel, G. 2011, An Exploration of the Climate Science-Water Management Interface, 48
Environment, vol. 53, no. 3, pp. 33-43. 49 Wajih, S.A., Singh, B., Bartarya, E., Basu, S. and ACCCRN ISET Team 2010: Towards a resilient Gorakphur. 50
Gorakphur Environmental Action Group, Gorakphur.* 51 Wamsler, Christine 2007: Bridging the gaps: stakeholder-based strategies for risk reduction and financing for the 52
Do Not Cite, Quote, or Distribute 102 25 July 2011
Warner, Robin 2009: Secular Regime Shifts, Global Warming and Sydney's Water Supply, Geographical Research 1 47 (3), September, 227-241. 2
Weru, Jane 2004, Community federations and city upgrading: the work of Pamoja Trust and Muungano in Kenya, 3 Environment and Urbanization 16(1) 47–62 4
Wilbanks, T.J. & Sathaye, J. 2007, Integrating mitigation and adaptation as responses to climate change: a synthesis, 5 Mitigation and Adaptation Strategies for Global Change, 12 (5), , 957-962. 6
Wilbanks, Tom and Patricia Romero-LankaO with Manzhu Bao, Frans Berkhout, Sandy Cairncross, Jean-Paul 7 Ceron, Manmohan Kapshe, Robert Muir-Wood and Ricardo Zapata-Marti (2007), Chapter 7: Industry, 8 Settlement and Society,, in M.L. Parry, O.F. Canziani, J.P. Palutikof, P.J. van der Linden and C.E. Hanson 9 (Editors), Climate Change 2007: Impacts, Adaptation and Vulnerability., Cambridge University Press, 10 Cambridge, pages 357-390. 11
Wilbanks, Thomas J. and Kates, Robert W. 2010: Beyond Adapting to Climate Change: Embedding Adaptation in 12 Responses to Multiple Threats and Stresses, Annals of the Association of American Geographers 100 (4), 719-13 728. 14
Wilby R L 2007: A review of climate change impacts on the built environment, Built Environment 33(1), 31-45 15 Wilby, R. and Vaughan, K. 2011: Hallmarks of organisations that are adapting to climate change, Water and 16
Environment Journal 25(2), June, 271–281 17 Wilson, Elizabeth and Jake Piper 2008: Spatial planning for biodiversity in Europe's changing climate, European 18
Environment 18(3), May/June, 135–151. 19 Wilson, Elizabeth et al. 2008: Public Urban Open Space and Human Thermal Comfort: The Implications of 20
Alternative Climate Change and Socio-economic Scenarios, Journal of Environmental Policy & Planning, 21 10(1), pages 31-45. 22
Wirawan, I Made Ady 2010: Public health responses to climate change health impacts in Indonesia, Asia Pac J 23 Public Health. Jan; 22(1), 25-31 24
Wisner 2004 25 Wisner, B and Pelling, M (2008) African cities of Hope. In Pelling, M and Wisner, B. Disaster Risk Reduction 26
Cases from Urban Africa. earthscan, London 27 Wolf, Johanna, W. Neil Adger, Irene Lorenzoni, Vanessa Abrahamson, Rosalind Raine (2010), Social capital, 28
individual responses to heat waves and climate change adaptation: An empirical study of two UK cities, Global 29 Environmental Change Vol 20, No 1, February, pages 44-52. 30
Wong S: Climate change and sustainable technology: re-linking poverty, gender, and governance. Gender Dev 2009, 31 17(1), 95-118. 32
Wong, TH and Rebecca Brown (2009), The water sensitive city: principles for practice, Water Science and 33 Technology Vol 60, No 3, March, pages 673-82. 34
World Bank 2008: Reshaping Economic Geography; World Development Report 2009, The World Bank, 35 Washington, DC, 383 pp. 36
World Bank 2009: Climate resilient cities; a primer on reducing vulnerabilities to disasters. City profiles: Jakarta, 37 Indonesia, Washington DC, USA. 38
World Bank 2010, World Development Report 2010: Development and Climate Change, International Bank of 39 Reconstruction and Development/World Bank, Washington D.C. 40
World Bank 2010: Mainstreaming Gender in Road Transport: Operational Guidance for World Bank Staff, 41 Transport Papers-28, Washington, D.C., 43 pages. 42
World Bank 2010a, Natural Hazards, Unnatural Disasters: The Economics of Effective Prevention, International 43 Bank of Reconstruction and Development/World Bank, Washington D.C. 44
World Bank 2010b, World Development Report 2010: Development and Climate Change, International Bank of 45 Reconstruction and Development/World Bank, Washington D.C. 46
World Bank, 2010: Natural Hazards, Unnatural Disasters: The Economics of Effective Prevention, International 47 Bank of Reconstruction and Development/World Bank, Washington D.C. 48
World Bank, 2011: North African Coastal Cities: Climate Change Adaptation and Natural Disaster Preparedness in 49 the Coastal Cities of North Africa, Summary of Regional Study, World Bank, Washington DC. 50
Wyman, O. 2008). Corporate Risk case study: City of Chicago Climate Change Task force. Oliver Wyman, 51 Chicago.* 52
Young, O.R. 2002, The Institutional Dimensions of Environmental Change: Fit, Interplay, and Scale, MIT Press, 53 Cambridge, MA. 54
ZERO-ORDER DRAFT IPCC WGII AR5 Chapter 8
Do Not Cite, Quote, or Distribute 103 25 July 2011
Yu, Xiubo, Luguang Jiang, Lifeng Li, Jinxin Wang, Limin Wang, Gang Lei and Jamie Pittock (2009), Freshwater 1 management and climate change adaptation: experiences from the central Yangtze in China, Climate and 2 Development Vol 1, No 3, September, pages 241-8. 3
Zanchettin, Davide, Pietro Traverso and Mario Tomasino (2007), Observations on future sea level changes in the 4 Venice lagoon, Hydrobiologia Volume 577, Number 1, February, pages 41-53. 5
Zezza, Alberto and Luca Tasciotti (2010), Urban agriculture, poverty, and food security: Empirical evidence from a 6 sample of developing countries, Food Policy Volume 35, Issue 4, August 2010, Pages 265-273. 7
Ziervogel, Gina, Peter Johnston, Margaret Matthew and Pierre Mukheibir 2010: Using climate information for 8 supporting climate change adaptation in water resource management in South Africa, Climatic Change Vol 103, 9 Nos 3-4, December, 537-554. 10
Ziervogel, Gina Moliehi Shale and Minlei Du (2010), Climate change adaptation in a developing country context: 11 the case of urban water supply in Cape Town, Climate and Development Vol 2, No 2, April, pages 94-110. 12
Ziervogel, Gina Moliehi Shale and Minlei Du (2010), Climate change adaptation in a developing country context: 13 the case of urban water supply in Cape Town, Climate and Development Vol 2, No 2, April, pages 94-110. 14
Zimmerman, R., C Faris 2010: Chapter 4: infrastructure impacts and adaptation challenges, Annals of the New York 15 Academy of Sciences, May; 1196, 63-85. 16
Zimmerman, Rae and Craig Faris 2011: Climate change mitigation and adaptation in North American cities, Current 17 Opinion in Environmental Sustainability 3, 181–187 18
Zwolsman, G., Vanham, D. Fleming, P, Davis, C Lovell, A, Nollasco, D…Johannessen, A 2009: Climate change 19 and the water industry – practical responses and actions. International Water Association (IWA), London and 20 the Hague. 21
22
ZERO-ORDER DRAFT IPCC WGII AR5 Chapter 8
Do Not Cite, Quote, or Distribute 104 25 July 2011
Table 8-1: The distribution of the world’s urban population by region, 1950–2010 and projected for 2030.
Region or country 1950 1970 1990 2010 Projected for 2030
"Least developed nations" 15 41 110 249 520 Africa 33 87 205 413 761 Asia 229 483 1,003 1,757 2,598 Europe 281 412 503 533 567 Latin America and the Caribbean 69 163 311 469 585 Northern America 110 171 213 289 355 Oceania 8 14 19 25 25 Urbanization level (percentage of population living in urban areas) WORLD 28.8 36.1 42.6 50.5 59.0
"Least developed nations" 7.3 13.1 21.0 29.2 40.8 Africa 14.4 23.6 32.1 40.0 50.0 Asia 16.3 22.7 31.5 42.2 52.9 Europe 51.3 62.8 69.8 72.9 78.4 Latin America and the Caribbean 41.4 57.1 70.3 79.6 84.9 Northern America 63.9 73.8 75.4 82.1 86.7 Oceania 62.0 70.8 70.7 70.2 71.4 * The statistics for 2010 are an aggregation of national statistics, many of which draw on national censuses held in 1999, 2000 or 2001 – but some are based on estimates or projections from statistics drawn from censuses held around 1990. There are also some nations (mostly in Africa) for which there are no census data since the 1970s or early 1980s so all figures for their urban (and rural) populations are based on estimates and projections. SOURCE: United Nations 2010
ZERO-ORDER DRAFT IPCC WGII AR5 Chapter 8
Do Not Cite, Quote, or Distribute 105 25 July 2011
Table 8-2 Urban
Pop. 2010 (2050)
Heat Wave / Warming
Drought/ Water Supply
Wildfire Inland Flooding
Coastal Flooding Sea Level Rise
Key References
Africa Kithila 2011 Europe X X Carter 2011 Southwest, Central Asia
South Asia X Revi 2008 East Asia X Liu and Deng 2011 Australasia X X X North America
X X X Zimmerman and Faris 2011
Central and South America, Caribbean
Hardoy and Romero-Lankao 2011
Small Islands
X
Polar Regions
X
To be completed
ZERO-ORDER DRAFT IPCC WGII AR5 Chapter 8
Do Not Cite, Quote, or Distribute 106 25 July 2011
Table 8-3
ZERO-ORDER DRAFT IPCC WGII AR5 Chapter 8
Do Not Cite, Quote, or Distribute 107 25 July 2011
Table 8-4: The role of city/municipal governments in preventing disasters from extreme weather, limiting their impact and post-disaster responses.
Role for city/municipal government Long term protection
Pre-disaster damage limitation
Immediate post-disaster response
Rebuilding
Built environment Building codes High High* High Land use regulations and property registration
High Some High
Public building construction and maintenance
High Some High
Urban planning (including zoning and development controls)
High High* High
Infrastructure Piped water provision including treatment High Some High High Sanitation High Some High High Drainage High High** High High Roads, bridges, pavements High High High Electricity supply High Some? High High Solid waste disposal facilities High Some? High Waste water treatment High High
Services Fire-protection High Some High Some Public order/police/delivery of early warning
Medium High High Some
Solid waste collection High High** High High Schools Medium Medium Medium*** Health care/public health/environmental health/ambulances
Medium Medium High High
Public transport Medium High High High Social welfare (includes provision for child care and old-age care)
Medium High High High
Disaster response (over and above those listed above)
High High
The extent to which the roles listed above are the responsibilities of city or municipal governments obviously varies; this table is intended to illustrate the wide range of relevant responsibilities that they usually have. * Obviously it is important that these do not inhibit rapid responses ** Clearing/desilting drains and ensuring collection of solid wastes have particular importance just prior to extreme rainfall; many cities face serious flooding from extreme rainfall that is expected (for instance the monsoon rains) and this is often caused or exacerbated by the failure to keep storm and surface drains in good order. *** Rebuilding/repairing schools quickly to allow them to serve as community meeting points and also get the children back to school as soon as possible (that helps restore aspects of normality for the children and provides more time for parents in rebuilding homes and livelihoods) Source: Satterthwaite, Dodman and Bicknell 2009
ZERO-ORDER DRAFT IPCC WGII AR5 Chapter 8
Do Not Cite, Quote, or Distribute 108 25 July 2011
Figure 8-1: The structure of this section.
ZERO-ORDER DRAFT IPCC WGII AR5 Chapter 8
Do Not Cite, Quote, or Distribute 109 25 July 2011
Figure 8-2: A cross-section of a house in Korail showing measures taken to cope with flooding and high temperatures (Jabeen, Johnson, and Allen, 2011).
ZERO-ORDER DRAFT IPCC WGII AR5 Chapter 8
Do Not Cite, Quote, or Distribute 110 25 July 2011
Figure 8-3: Title? Adapted from Corfee-Morlot, Cochran, Teasdale and Hallegatte 2011. Figure 8-4
Source: Mills 2007 from Mills 2006
ZERO-ORDER DRAFT IPCC WGII AR5 Chapter 8
Do Not Cite, Quote, or Distribute 111 25 July 2011
Figure 8-5
Source: Mills 2007
ZERO-ORDER DRAFT IPCC WGII AR5 Chapter 8
Do Not Cite, Quote, or Distribute 112 25 July 2011
Figure 8-6
JICA, AFD, KfW, NEFCO Adapation Finance Commitments in 2009
est 4 bn USD
Transport
Agriculture
Forestry
Water supply/treatment
Waste
Policy loans
Coastal protection
Other disaster risk reduction
Other capacity building
Other
Source: based on data from UNEP 2010, Bilateral Finance Institutions and Climate Change: A Mapping of 2009 Climate Financial Flows to Developing Countries