Page 1
Princeton Plasma Physics Laboratory
PPPL-5306
Dynamic analysis and inertia load of ITER equatorial port plug EPP9
DSM2
H. Zhang, Y. Zhai, P. Titus
August 2016
Prepared for the U.S.Department of Energy under Contract DE-AC02-09CH11466.
Page 2
Princeton Plasma Physics Laboratory Report Disclaimers
Full Legal Disclaimer
This report was prepared as an account of work sponsored by an agency of the United States Government. Neither the United States Government nor any agency thereof, nor any of their employees, nor any of their contractors, subcontractors or their employees, makes any warranty, express or implied, or assumes any legal liability or responsibility for the accuracy, completeness, or any third party’s use or the results of such use of any information, apparatus, product, or process disclosed, or represents that its use would not infringe privately owned rights. Reference herein to any specific commercial product, process, or service by trade name, trademark, manufacturer, or otherwise, does not necessarily constitute or imply its endorsement, recommendation, or favoring by the United States Government or any agency thereof or its contractors or subcontractors. The views and opinions of authors expressed herein do not necessarily state or reflect those of the United States Government or any agency thereof.
Trademark Disclaimer
Reference herein to any specific commercial product, process, or service by trade name, trademark, manufacturer, or otherwise, does not necessarily constitute or imply its endorsement, recommendation, or favoring by the United States Government or any agency thereof or its contractors or subcontractors.
PPPL Report Availability Princeton Plasma Physics Laboratory:
http://www.pppl.gov/techreports.cfm
Office of Scientific and Technical Information (OSTI):
http://www.osti.gov/scitech/ Related Links:
U.S. Department of Energy
U.S. Department of Energy Office of Science
U.S. Department of Energy Office of Fusion Energy Sciences
Page 3
Dynamic analysis and inertia load of ITER equatorial port plug EPP9 DSM2
Han Zhang1, Yuhu Zhai1, Julio Guirao2, Silvia Iglesias3, Peter Titus1
1Prineton Plasma Physics Lab,Princeton, New Jersey, [email protected] 2Numerical Analysis Technologies S.L. (NATEC), Gijon, Spain
3CHD, ITER Organization, Route de Vinon-sur-Verdon, CS 90 046, 13067 St. Paul Lez Durance Cedex, France ABSTRACT
The work presented in this paper mainly focuses on the response spectrum analysis of ITER diagnostic
equatorial port plug structure assembly (PPs) to extract dynamic behavior of PPs and the in-port diagnostic systems
due to transient vacuum vessel (VV) movements during Non-symmetric plasma vertical displacement events
(VDEs) and during the seismic loading. A generic equatorial port plug Structural (GEPP) analysis model was
provided by ITER Organization (IO), Based on the GEPP model, the US ITER equatorial port #9 Diagnostic
Shielding Module (DSM) with in-port systems such as the Electron Cyclon Emission (ECE) was integrated in and
the latest design of closure plate was used to replace the simple plate in the generic model too to ensure structural
integrity. Two types of response spectrum analysis were performed The floor response spectra (FRS) analysis based
on random vibration (PSD) is to provide the input spectra for the response spectrum analysis of next level
components that will be mounted to the DSM or the closure plate The dynamic behavior of PPs and the in-port
diagnostic systems due to vacuum vessel (VV) movements during plasma vertical displacement events (VDEs) and
during the seismic loading is simulated with response spectrum analysis based on the deterministic method (Multi-
Point Response Spectrum (MPRS)).
Keywords: EPP9; ECE; Inertia load; Response spectrum analysis.
I. MODELING OF EPP
The EPP model is based on the generic models from ITER IO1. The US ITER equatorial port #9 Diagnostic
Shielding Module (DSM2) with in-port systems such as the Electron Cyclon Emission (ECE) was integrated in and
toroidal interferometer/polarimeter (TIP) will also be included later to DSM3 when the CAD design model is
provided. Latest design of the closure plate was used to replace the simple plate in the generic model too. With more
accurate mass, mass distribution and stiffness of the model, the natural frequencies will be more precisely
calculated, and so do the vibration behavior of PPs, the inertial loads on the whole assembly and on board
components (DSM, Diagnostic first wall and PPs (fig. 1)).
Page 4
EPP Port and externsion
Cryostat Bellow Bioshield Plug
VV Section
Figure 1: E9 port plug.
Two types of response spectrum analysis were done. The floor response spectra (FRS) analysis based on
random vibration (PSD) is to provide the input spectra for the response spectrum analysis of next level components
that will be mounted to any part of the port. The dynamic behavior of PPs and the in-port diagnostic systems due to
vacuum vessel (VV) movements during plasma vertical displacement events (VDEs) and during the seismic loading
is simulated with response spectrum analysis based on deterministic method (Multi-Point Response Spectrum
(MPRS)).
Ansys modal and response spectrum analysis will automatically convert a nonlinear model to a linear one, but
how to make conversion is not clear and this is not described in any published document. In the generic models,
there are lots of contact pairs (e.g. the bolted joints and positioning mechanism etc.) and also pretensions are added
to the bolts. We ran the same model under ANSYS 16.2 and 15.0 and then 17.0. With ANSYS 16.2, it doesn’t
converge. With 15.0 and 17.0, it does, but the results have some variance. Finally, we changed all the contact pairs
to “all bonded” setting, and remove the pretensions. The variance between different ANSYS versions still exists
which might be due to the internal contact stiffness setting according to the reply of ANSYS.
FRS of several points of the ECE and closure plates is provided in this report. Results of inertial loads, stress
and deformation will also be discussed.
II. BOUNDARY CONDITIONS
Excitations for PP, i.e. FRS calculated by IO, were added to the component attachment point of PP (Fig. 2).
Current input spectra are from the symmetric VDE results of IO, but to estimate the rotating VDE effects, all the
Page 5
spectra are maximized at 5-8 Hz, which is very conservative (Fig. 3). FRS derivation is based on direct spectra-to-
spectra method (random vibration analysis in ANSYS). The input is power spectrum density (PSD), which is
calculated from the equation given by IO and ANSYS documentation2:
Where2:
Spi = power spectral density for the ith mode (obtained from the input PSD spectrum at frequency ωi and effective
damping ratio ξ)
ξ = damping ratio (input as RATIO, DMPRAT command, defaults to .01)
However, the equation seems still problematic because the calculated PSD based on this equation will
sometimes produce negative values.
Deformation, stress and reaction force etc. are calculated using the deterministic response spectrum method
(Multipoint Response Spectrum analysis in ANSYS).
Figure 2: GEPP model with the latest design of DSM integrated.
Page 6
Figure 3: Input spectra from IO for GEPP.
III. RESULTS
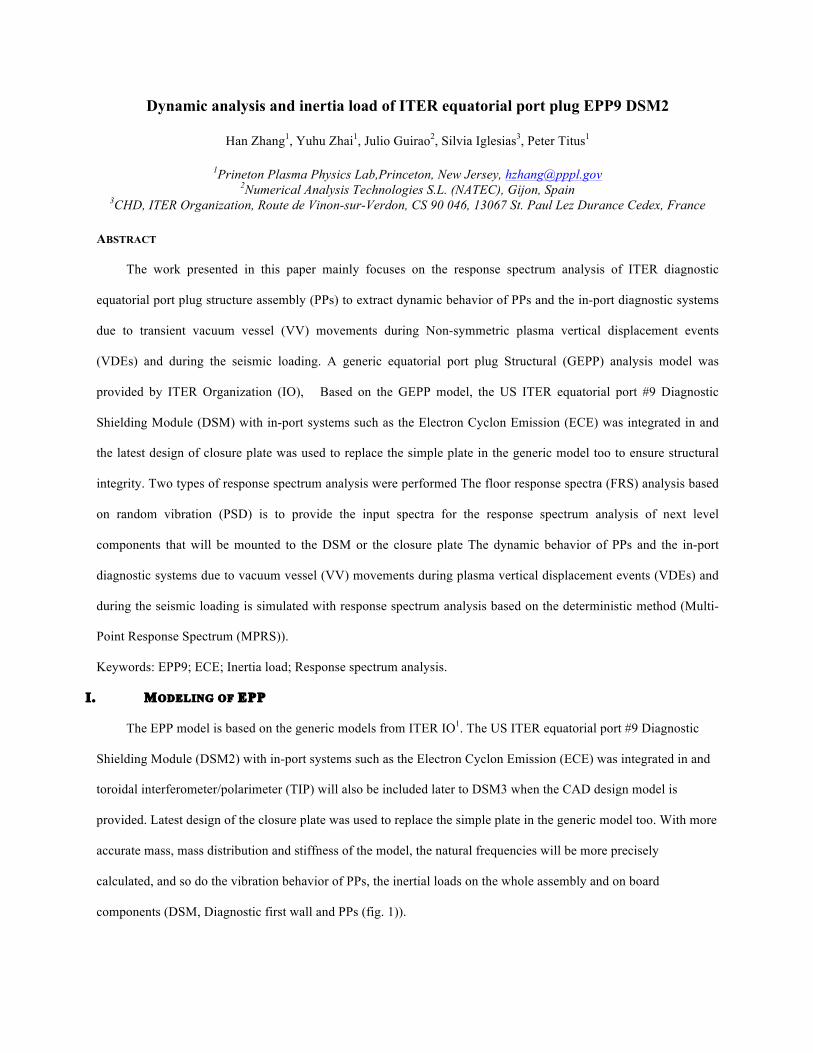
Fig. 4 shows the major modal shapes which are related to the DSM2 of our interest. Comparing to IO’s result
of natural frequencies, the major frequencies are about 3~5 Hz lower, which may due to the added mass to DSMs.
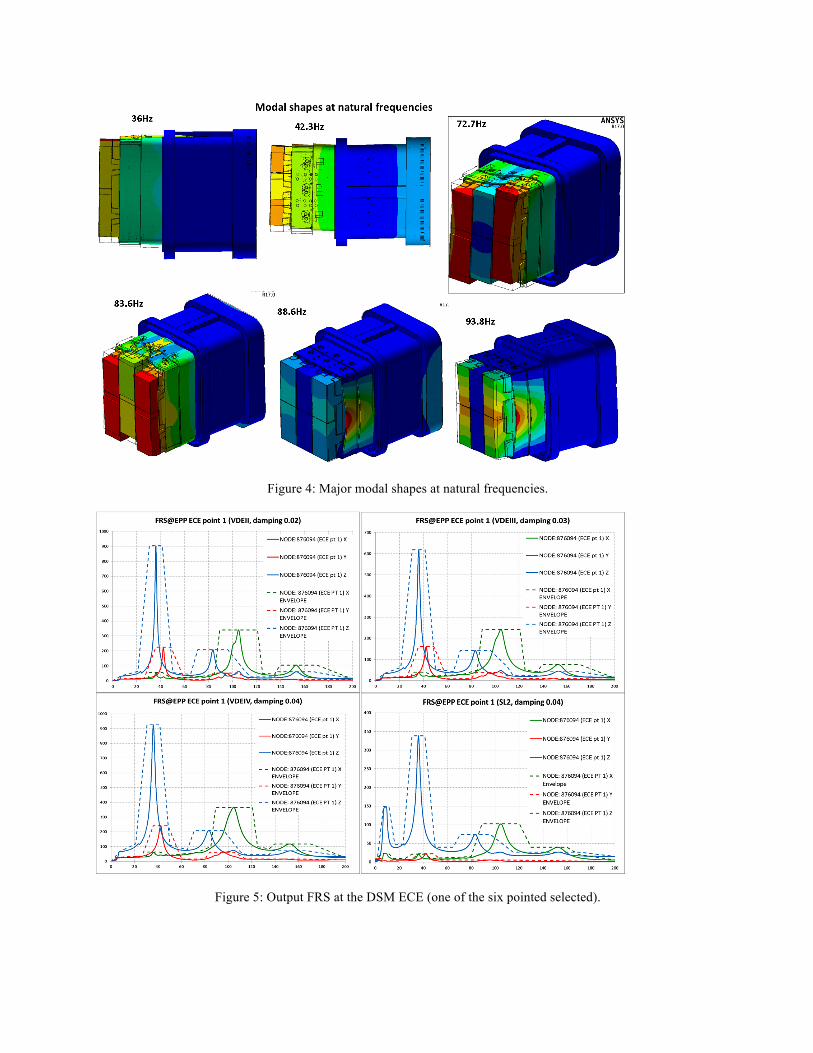
Fig. 5 is the output FRS at one point of the ECE of DSM2 with Envelop (broadened spectra) and Fig. 6 is at the
center of closure plate. These FRS are the input of future response spectrum analysis of the component that will be
mounted to this DSM. Generally speaking, future components that will be mounted to this DSM should be designed
to avoid the resonance frequencies of it. If not possible, more damping should be designed and analysis should be
done to evaluate the dynamic behavior.
Page 7
Figure 4: Major modal shapes at natural frequencies.
Figure 5: Output FRS at the DSM ECE (one of the six pointed selected).
Page 8
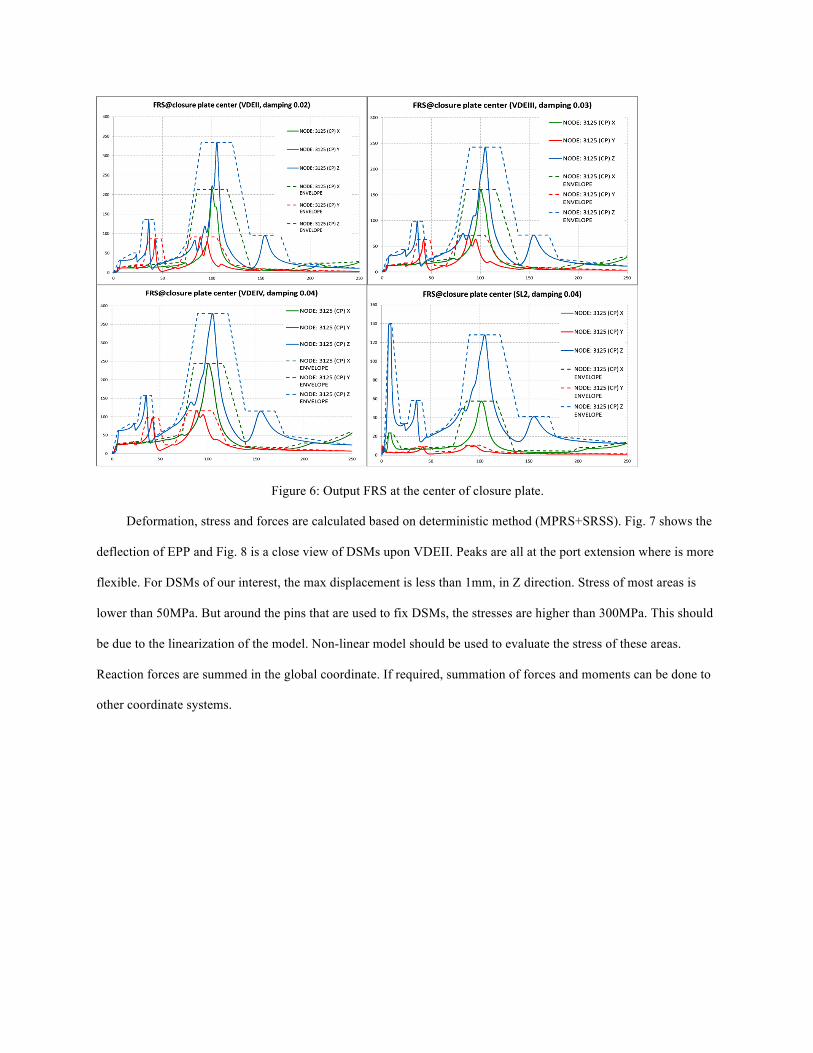
Figure 6: Output FRS at the center of closure plate.
Deformation, stress and forces are calculated based on deterministic method (MPRS+SRSS). Fig. 7 shows the
deflection of EPP and Fig. 8 is a close view of DSMs upon VDEII. Peaks are all at the port extension where is more
flexible. For DSMs of our interest, the max displacement is less than 1mm, in Z direction. Stress of most areas is
lower than 50MPa. But around the pins that are used to fix DSMs, the stresses are higher than 300MPa. This should
be due to the linearization of the model. Non-linear model should be used to evaluate the stress of these areas.
Reaction forces are summed in the global coordinate. If required, summation of forces and moments can be done to
other coordinate systems.
Page 9
Figure 7: Deformation, equivalent stress and reaction forces of EPP.
Figure 8: close view of DSMs.
Page 10
IV. CONCLUSIONS AND DISCUSSIONS
Response spectrum analysis is used to determine inertial load. However, response spectrum analysis can only
be done with linearized model. Non-linear factors, like contact pairs or non-linear material properties, will be
automatically linearized. Results should be carefully checked where strong non- linearity may exist.
Current input spectra are all maximized at 5-8 Hz, which is very conservative.
Stresses are not very high at most places. For the connection areas, stresses are high which may be due to the
model linearization. These stresses should be further evaluated.
Response spectrum analysis is the steady state result. For VDEs which are last only for a very short time, less
than 1s, forces may be better determined by a transient analysis of the dynamic process.
Floor response spectra (FRS) are calculated with random vibration method. For the component that will be
mounted to any points and is missing in this model, the FRS of that location is the input for the response spectrum
analysis of the next level system components.
Although random vibration method can give the results of deformation, stress and force etc., these results for
the port are simulated with deterministic method (MPRS+SRSS). Comparing the two, deterministic method
(MPRS+SRSS) will produce more conservative and reliable results when input spectra can be clearly given.
ACKNOWLEDGMENTS
*This work is supported by US DOE Contract No. DE-AC02-09CH11466. All US activities are managed by
the US ITER Project Office, hosted by Oak Ridge National Laboratory with partner labs Princeton Plasma Physics
Laboratory and Savannah River National Laboratory. The project is being accomplished through a collaboration of
DOE Laboratories, universities and industry. The views and opinions expressed herein do not necessarily reflect
those of the ITER Organization.
REFERENCES
1. V.S. Udintsev et. al.,” Final design of the generic equatorial port plug structure for ITER diagnostic systems”,
Fusion Engineering and Design, Volume 96–97, October 2015, Pages 993–997, Proceedings of the 28th Symposium
On Fusion Technology (SOFT-28).
2. ANSYS documentation, https://www.sharcnet.ca/Software/Ansys/16.2.3/en-us/help/ans_thry/thy_anproc7.html.
Page 11
Princeton Plasma Physics Laboratory Office of Reports and Publications
Managed by Princeton University
under contract with the U. S . D e p a r t m e nt of E n e rgy
(DE-AC02-09CH11466)
P.O. Box 451, Princeton, NJ 08543 Phone: 609-243-2245 Fax: 609-243-2751
E-mail: [email protected] Website: http://www.pppl.gov