16
| Date post: | 25-Jan-2017 |
| Category: |
Health & Medicine |
| Upload: | driversofdisease |
| View: | 319 times |
| Download: | 2 times |
Zika: epidemiology & control
Imperial College London
Neil Ferguson

Timeline
• Apparent gradual spread across Pacific, though phylogeography not
yet certain
(Samantha Lycett, virological.org)

Why flaviviruses are
hard to model
• Acute immunising infections – hard to
measure transmission intensity
• Immune-mediated interactions
between flaviviruses
• Disease not always apparent
• Aedes aegypti population density
highly spatiotemporally variable
• So transmission dynamics also highly
variable

• Secondary cases per case
• Determines age at infection,
attack rate, impact of controls
• Attack rate depends on weakly on
transmissibility for R0>2 –
implications for control
• Endemic age distribution of cases
will vary markedly with
transmission intensity
Importance of R0
0
10
20
30
40
50
60
70
0%
10%
20%
30%
40%
50%
60%
70%
80%
90%
0 1 2 3 4 5 6 7
Ave
rage
age
at
infe
ctio
n
Life
tim
e c
han
ce o
f in
fect
ion
R0
Risk of infection
Age at infection
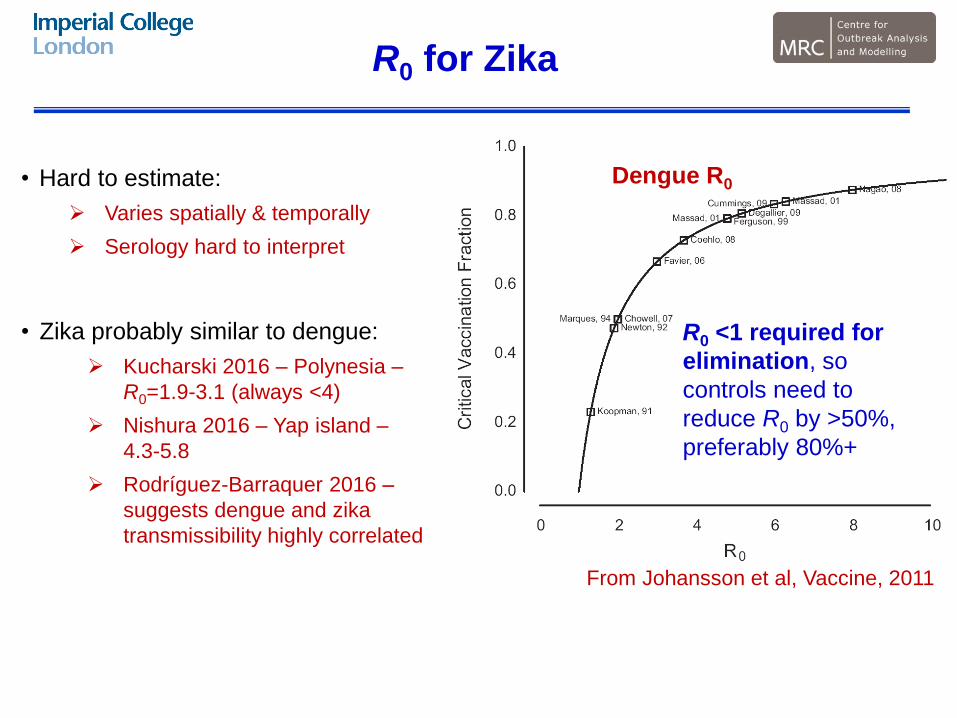
R0 for Zika
• Hard to estimate:
Varies spatially & temporally
Serology hard to interpret
• Zika probably similar to dengue:
Kucharski 2016 – Polynesia –
R0=1.9-3.1 (always <4)
Nishura 2016 – Yap island –
4.3-5.8
Rodríguez-Barraquer 2016 –
suggests dengue and zika
transmissibility highly correlated
From Johansson et al, Vaccine, 2011
R0 <1 required for
elimination, so
controls need to
reduce R0 by >50%,
preferably 80%+
Dengue R0
Dynamics of invasion

Why now?
• Pure chance?
• Genetic change?
• El Niño–Southern Oscillation?
If climate driven, then transmissibility
might be less in future years

Disease invasions
• Key – lack of population
immunity
• Speed dependent on R0,
generation time, population
connectivity, seasonality
• Models need to be spatial
Initial wave of transmission will
be over within 1-2 years in a
single location
But may take up to 5 years to
affect whole of Latin America
Initial wave of transmission
likely to be followed by 10+
years of v low incidence (due to
herd immunity from 1st wave)
Simulations show results from simple spatial
stochastic model for incidence in total modelled
population. Results are illustrative rather than
predictive.
0
100
200
300
400
500
600
0 10 20 30 40 50 60
An
nu
alis
ed
we
ek
ly
inc
ide
nc
e/1
0k
Years since introduction
Simulated incidence in
Latin America
peak R0=2.0-4.0
0
20
40
60
80
100
120
140
160
2 4 6 8 10
Rep
ort
ed
cases /
100,0
00
Week (2016)
Surveillance - Zika Colombia
Neiva
Cúcuta
Medellín
Sincelejo
Piedecuesta
COLOMBIA

What if dengue cross-reacts
with Zika?
• Scenario: immunity
increasing with age - 35
year olds have 50% of
the susceptibility of new-
borns
• Results in smaller initial
wave
• Shorter time to become
endemic
• Enhancement may also
facilitate persistence
0
10
20
30
40
50
60
70
80
90
100
0 10 20 30 40 50 60
An
nu
alis
ed
we
ek
ly
inc
ide
nc
e/1
0k
Years since introduction
Simulated incidence in
Latin America
peak R0=2.0-4.0

How does age of infection
change over time?
• Depends on R0
• All ages equally affected during
initial epidemic
• After initial wave, the mean age
of infection falls – older people
immune, newborn children
susceptible
• But for reasonable values of
R0, likely than endemic mean
age at infection will be around
start of child-bearing age range0
5
10
15
20
25
30
35
0 10 20 30 40 50 60
An
nu
al
av
era
ge
of
me
an
ag
e a
t in
fec
tio
n
Years since introduction
low
medium
high

Data needs
• Infection attack rates from serological surveys:
infer R0, per-infection risk of microcephaly,…
Age stratified – infer risk over time &/or by age
Multiple locations – assess geographic heterogeneity
Cohorts – compare seroconversion rates and disease incidence
• Need sensitive and specific tests (dengue cross-reactivity an issue)
Imai et al, Plos
NTD, 2014

Interventions

Interventions in first wave
• Motivation: reduce attack
rate
• But interventions need
sustained effect
• Benefits of even sustained
vector control now are
limited unless they reduce
R0 below 1
0
10
20
30
40
50
60
2 3 4 5 6 7 8 9 10 11 12
An
nu
alis
ed
we
ek
ly
inc
ide
nc
e/1
0k
Years since introduction
No controls
With controls
Simulated incidence in Latin
America (peak R0=1.4-2.2), with
1/3 reduction in mosquito density
in Y4 in 40% of continent
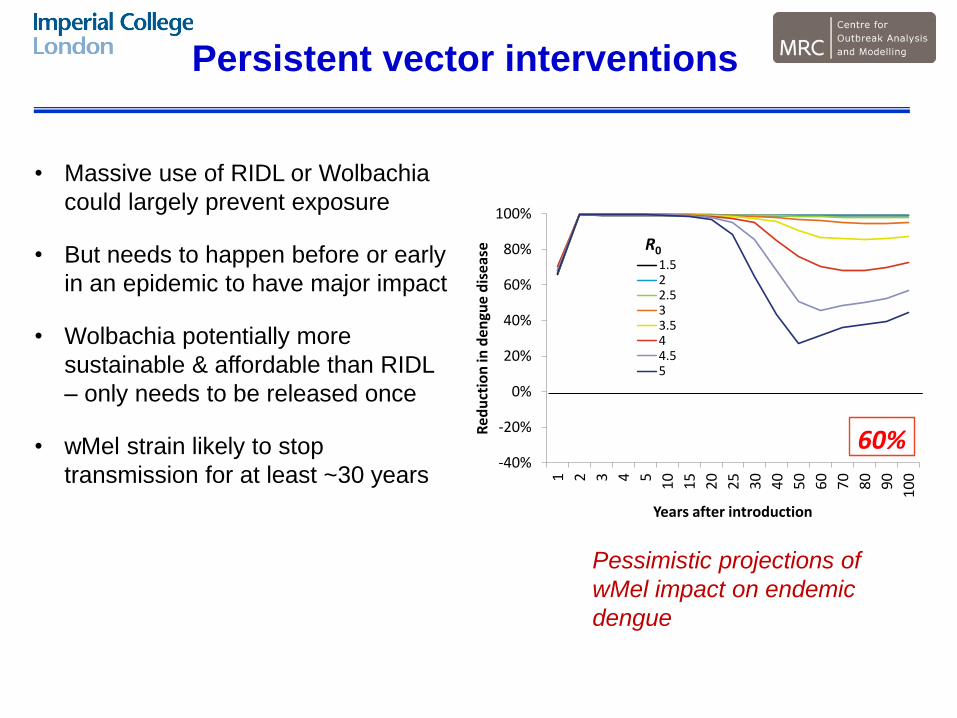
Persistent vector interventions
• Massive use of RIDL or Wolbachia
could largely prevent exposure
• But needs to happen before or early
in an epidemic to have major impact
• Wolbachia potentially more
sustainable & affordable than RIDL
– only needs to be released once
• wMel strain likely to stop
transmission for at least ~30 years
-40%
-20%
0%
20%
40%
60%
80%
100%
1 2 3 4 5
10
15
20
25
30
40
50
60
70
80
90
10
0
Re
du
ctio
n in
de
ngu
e d
ise
ase
Years after introduction
1.522.533.544.55
R0
20%-40%
-20%
0%
20%
40%
60%
80%
100%
1 2 3 4 5
10
15
20
25
30
40
50
60
70
80
90
10
0
Re
du
ctio
n in
de
ngu
e d
ise
ase
Years after introduction
1.522.533.544.55
R0
40%
-40%
-20%
0%
20%
40%
60%
80%
100%
1 2 3 4 5
10
15
20
25
30
40
50
60
70
80
90
10
0
Re
du
ctio
n in
de
ngu
e d
ise
ase
Years after introduction
1.522.533.544.55
R0
60%-40%
-20%
0%
20%
40%
60%
80%
100%
1 2 3 4 5
10
15
20
25
30
40
50
60
70
80
90
10
0
Re
du
ctio
n in
de
ngu
e d
ise
ase
Years after introduction
1.522.533.544.55
R0
80%-40%
-20%
0%
20%
40%
60%
80%
100%
1 2 3 4 5
10
15
20
25
30
40
50
60
70
80
90
10
0
Re
du
ctio
n in
de
ngu
e d
ise
ase
Years after introduction
1.522.533.544.55
R0
20%-40%
-20%
0%
20%
40%
60%
80%
100%
1 2 3 4 5
10
15
20
25
30
40
50
60
70
80
90
10
0
Re
du
ctio
n in
de
ngu
e d
ise
ase
Years after introduction
1.522.533.544.55
R0
40%
-40%
-20%
0%
20%
40%
60%
80%
100%
1 2 3 4 5
10
15
20
25
30
40
50
60
70
80
90
10
0
Re
du
ctio
n in
de
ngu
e d
ise
ase
Years after introduction
1.522.533.544.55
R0
60%-40%
-20%
0%
20%
40%
60%
80%
100%
1 2 3 4 5
10
15
20
25
30
40
50
60
70
80
90
10
0
Re
du
ctio
n in
de
ngu
e d
ise
ase
Years after introduction
1.522.533.544.55
R0
80%
Pessimistic projections of
wMel impact on endemic
dengue

Vaccine
• If it can be licensed in the next 12-24 months, might still
have an impact in some areas of Latin America
• Impact likely to be much lower outside that timeframe
• Trial design will be challenging:
Sites with recent transmission are unlikely to see
much more for 10+ years
Hard to predict which sites will be affected next year,
with what attack rate
Microcephaly endpoints difficult

• Very different epidemiology from both Ebola and MERS-CoV – not ‘containable’
• Need R0 estimates to project likely incidence trends in the next few years
• Serological surveys will allow transmissibility, microcephaly risk to be assessed
• First wave of transmission in Latin America will mostly be over within ~3 years.
• Herd immunity means there likely 10+ year gap before transmission restarts
• Interventions need to be effective, sustained & timely to have substantial effect
• RIDL and Wolbachia both have potential
• Vaccine efficacy trials will need to be innovative
Conclusions


