112
Zimbabwe Resilience Research Report February 1 2018

Zim
babwe Resilience
Res earch Report Febru ary 1 2018

Prepared for: Center for Resilience (C4R), USAID Mission Zimbabwe
Recommended Citation:
TANGO International. 2018. Zimbabwe Resilience Research Report. Produced as part of the
Resilience Evaluation, Analysis and Learning (REAL) Associate Award. Photo Credit: Colin Crowley/Save the Children
Disclaimer: This report is made possible by the Resilience Monitoring, Evaluation, Assessment, Strategic
Analysis and Capacity Building Associate Award (The REAL Award). The REAL Award is made
possible by the generous support and contribution of the American people through the United
States Agency for International Development (USAID). The contents of the materials
produced through the REAL Award do not necessarily reflect the views of USAID or the
United States Government.
Prepared by:
TANGO International, Inc.
376 South Stone Avenue
Tucson, Arizona 85701 USA
Photo Credit: Colin Crowley/Save the Children
Zimbabwe Resilience Research Report
ACKNOWLEDGEMENTS iii
Acknowledgements
We would first and foremost like to thank the Center for Resilience and USAID/Zimbabwe for the
opportunity to conduct this study and their invaluable guidance over the course of its
implementation. In particular, Tiffany Griffin, Jason Taylor and Justin Mupeyiwa who responded to
questions, clarified information, and provided insightful comments.
We would also like to express our appreciation to George Kembo, the Zimbabwe Food and
Nutrition Council (FNC), and all others who attended the USAID-sponsored Resilience
Measurement Workshop in Harare, in August 2017, and contributed important suggestions for
improving the analysis and presentation of study findings. These contributions immensely improved
the quality of this report.
Finally, we would like to acknowledge the Zimbabwe Vulnerability Assessment Committee
(ZimVAC) who implemented the four household surveys and two community surveys. Without
their high-quality data collection, data cleaning, and analysis, this study would not have been
possible.

Resilience Evaluation, Analysis and Learning (REAL)
CONTENTS iv
Table of Contents
Acknowledgements ............................................................................................................... iii
Table of Tables ......................................................................................................................... v
Table of Figures ...................................................................................................................... vii
Acronyms ......................................................................................................................... viii
Executive Summary ............................................................................................................... ix
1. Introduction ....................................................................................................................... 1
2. Methodology ...................................................................................................................... 6
Data sources ............................................................................................................................................... 6
Factor analysis – household resilience capacity index ....................................................................... 7
Multivariate analysis ................................................................................................................................. 10
Limitations ................................................................................................................................................. 11
3. Descriptive statistics ....................................................................................................... 13
Shock exposure ........................................................................................................................................ 13
Household resilience capacity ............................................................................................................... 16
Coping strategies...................................................................................................................................... 19
NGO and government support ............................................................................................................ 21
Well-being/development outcomes ..................................................................................................... 24
4. Results from multivariate equations combining data over four years ...................... 26
Coping strategies 2013-2016................................................................................................................. 27
Well-being outcomes 2013-2016 ......................................................................................................... 28
DFSAs and CSI .......................................................................................................................................... 32
5. Results from equations for 2013, 2014, 2015 and 2016 ............................................... 34
Price shocks ............................................................................................................................................... 34
NGO and government support ............................................................................................................ 35
Elasticities ................................................................................................................................................... 40
6. Summary ......................................................................................................................... 41
7. Recommendations .......................................................................................................... 42
Appendix A: Regression equations – four years combined .............................................. 44
Appendix B: Regression equations – year by year ............................................................. 47
Appendix C: The household resilience capacity index ...................................................... 55
Appendix D: Relationships between household resilience capacity elements and
well-being outcomes 2013, 2014, 2015, 2016 .............................................. 57
Appendix E: Comparing the effects of explanatory variables .......................................... 89

Zimbabwe Resilience Research Report
TABLE OF TABLES v
Table of Tables
Table 1: Sample sizes, non-DFSA vs DFSA, 2013-2016................................................................................... 7
Table 2: Livestock ownership and unexpected losses (% HH) .................................................................... 15
Table 3: Household exposure to shocks in 2013 and 2014 (%HH) ........................................................... 15
Table 4: Shock exposure 2016 ............................................................................................................................ 16
Table 5: Severity of shocks .................................................................................................................................. 16
Table 6: Household resilience capacity elements ........................................................................................... 17
Table 7: Household resilience capacity elements – factor loadings ........................................................... 18
Table 8: Coping strategies index (CSI) 2013-2016 ......................................................................................... 20
Table 9: Non-food coping strategies (% HH) .................................................................................................. 21
Table 10: NGO and government support ........................................................................................................ 23
Table 11: NGO and government support by DFSA ...................................................................................... 23
Table 12: Well-being outcomes .......................................................................................................................... 25
Table 13: Results from regression equation (Tobit) estimating CSI, 2013-2016 .................................... 44
Table 14: Results from regression equation (logit) estimating negative coping strategies 2014-2016
.................................................................................................................................................................. 45
Table 15: Results from regression equations estimating well-being outcomes over four years ......... 46
Table 16: Results from regression equation (Tobit) estimating CSI, 2013 ............................................... 47
Table 17: Results from regression equations estimating well-being outcomes, 2013 ............................ 48
Table 18: Results from regression equations estimating coping strategies, 2014 ................................... 49
Table 19: Results from regression equations estimating well-being outcomes, 2014 ............................ 50
Table 20: Results from regression equations estimating coping strategies, 2015 ................................... 51
Table 21: Results from equations estimating well-being outcomes, 2015 ................................................ 52
Table 22: Results from regression equations estimating coping strategies, 2016 ................................... 53
Table 23: Results of equations estimating well-being outcomes, 2016 ...................................................... 54
Table 24: Household resilience capacity elements ......................................................................................... 55
Table 25: Relationships between elements of household resilience capacity & adequate food
consumption 2013 ................................................................................................................................ 57
Table 26: Relationships between elements of household resilience capacity and HDDS 2013 ........... 59

Resilience Evaluation, Analysis and Learning (REAL)
TABLE OF TABLES vi
Table 27: Relationships between elements of household resilience capacity & per capita daily
expenditures 2013 ................................................................................................................................ 61
Table 28: Relationships between resilience capacity & moderate to severe hunger 2013 ................... 63
Table 29: Relationships between household resilience capacity elements and adequate food
consumption 2014 ................................................................................................................................ 65
Table 30: Relationships between household resilience capacity elements and HDDS 2014 ............... 67
Table 31: Relationships between household resilience capacity elements and per capita daily
expenditures 2014 ................................................................................................................................ 69
Table 32: Relationships between household resilience capacity elements and moderate to severe
hunger 2014 ........................................................................................................................................... 71
Table 33: Relationships between household resilience capacity elements and adequate food
consumption 2015 ................................................................................................................................ 73
Table 34: Relationships between household resilience capacity elements and HDDS 2015 ............... 75
Table 35: Relationships between household resilience capacity elements and per capita daily
expenditures 2015 ................................................................................................................................ 77
Table 36: Relationships between househld resilience capacity elements and moderate to severe
hunger 2015 ........................................................................................................................................... 79
Table 37: Relationships between household resilience capacity elements and adequate food
consumption 2016 ................................................................................................................................ 81
Table 38: Relationships between household resilience capacity elements and HDDS 2016 ............... 83
Table 39: Relationships between household resilience capacity elements and per capita daily
expenditures 2016 ................................................................................................................................ 85
Table 40: Relationships between household resilience capacity elements and moderate to severe
hunger 2016 ........................................................................................................................................... 87

Zimbabwe Resilience Research Report
TABLE OF FIGURES vii
Table of Figures
Figure 1: Relationship of TANGO/USAID and ZimVAC variables to absorptive, adaptive and
transformative capacities ...................................................................................................................... 9
Figure 2: Monthly rainfall (mm), June 2012-May 2016 ................................................................................... 14
Figure 3: Results from regression equation (Tobit) estimating CSI, 2013-2016 ..................................... 27
Figure 4: Results from regression equation (logit) estimating negative coping strategies,
2014-2016 .............................................................................................................................................. 28
Figure 5: Results from regression equations estimating adequate food consumption, 2013-2016 ..... 29
Figure 6: Results from regression equation (OLS) estimating HDDS, 2013-2016 .................................. 30
Figure 7: Results from regression equation (GLM) estimating per capita daily expenditures
(USD 2016), 2013-2016 ...................................................................................................................... 31
Figure 8: Results from a regression equation (logit) estimating moderate to severe hunger,
2013-2016 .............................................................................................................................................. 32
Figure 9: Results from equation estimating CSI (Tobit), by DFSA and non-DFSA wards ..................... 33
Figure 10: Results of equation estimating per capita daily expenditures (USD2016) – shocks and
household resilience capacity .......................................................................................................... 35
Figure 11: Results from equations measuring well-being outcomes, 2015 ............................................... 37
Figure 12: Results from equations estimating well-being outcomes, 2016 ............................................... 39
Figure 13: Comparing the effects of resilience, NGO/govt. support, and shocks on CSI, 2013 ......... 90
Figure 14: Comparing the effects of resilience, NGO/govt. support, coping strategies and
shocks on outcomes, 2013 ............................................................................................................... 91
Figure 15: Comparing the effects of resilience, NGO/govt. support, and shocks on coping
strategies 2014 .................................................................................................................................... 93
Figure 16: Comparing the effects of resilience, NGO/govt. support, coping strategies and
shocks on outcomes, 2014 ............................................................................................................... 95
Figure 17: Comparing the effects of resilience, NGO/govt. support, and shocks on coping
strategies 2015 .................................................................................................................................... 97
Figure 18: Comparing the effects of resilience, NGO/govt. support, coping strategies and
shocks on outcomes, 2015 ............................................................................................................... 98
Figure 19: Comparing the effects of resilience, NGO/govt. support, and shocks on coping
strategies, 2016 ................................................................................................................................... 99
Figure 20: Comparing the effects of resilience, NGO/govt. support, coping strategies and
shocks on outcomes, 2016 ............................................................................................................. 100

Resilience Evaluation, Analysis and Learning (REAL)
ACRONYMS viii
Acronyms
AFDM African Flood and Drought Monitor
CBO Community-based organization
CFA Cash for assets
CI Confidence interval
CSI (Food) Coping strategies index
DFSA Development Food Security Activity
ENSURE Enhancing Nutrition, Stepping up Resilience and Enterprise
FANTA Food and Nutrition Technical Assistance
FCS Food consumption score
FEWS NET Famine Early Warning Systems Network
FFA Food for assets
FFP Food for Peace
FNC Food and Nutrition Council
FSN Formal safety net
GLM Generalized linear model
GMB Grain Marketing Board
HDDS Household dietary diversity score
HH Household
HHS Household hunger scale
IGA Income-generating activity
IR Intermediate result
ISAL Internal savings and lending
KMO Kaiser–Meyer–Olkin (statistical test)
MFI Microfinance Institution
NGO Non-governmental organization
PCA Principal component analysis
SACCO Savings and Credit Cooperative Organization
SAFIRE Southern Alliance for Indigenous Resources
SO Strategic objective
SNV Stichting Nederlandse Vrijwilliger Netherlands Development Organization
TLU Tropical livestock units
USAID United States Agency for International Development
USD United States dollars
VS&L Village savings and lending
WASH Water, Sanitation, and Hygiene
WFP World Food Programme
ZimVAC Zimbabwe Vulnerability Assessment Committee
Zimbabwe Resilience Research Report
EXECUTIVE SUMMARY ix
Executive Summary
This study adapted a USAID/TANGO resilience analysis framework to use with secondary datasets.
The goals were to describe the relationships between resilience capacity and well-being outcomes
in the face of a drought (adequate food consumption, household dietary diversity score, per capita
daily expenditures, and moderate to severe hunger), to empirically test whether resilience capacity
mitigates the effects of shocks on well-being outcomes, and to better understand the relationships
between programming, resilience capacity, and well-being outcomes.
The study covers four provinces in Zimbabwe – Manicaland, Matabeleland North, Matabeleland
South, and Masvingo1 – from 2013 through 2016. The provinces were chosen because they are sites
for USAID/Zimbabwe Development Food Security Activities (DFSAs). The study uses several
secondary data sources: ZimVAC household surveys from 2013, 2014, 2015, and 2016, ZimVAC
community surveys from 2014 and 2015, precipitation estimates from the Africa Flood and Drought
Monitor (AFDM), and World Food Programme (WFP) price data of key commodities. ZimVAC
household and community survey data are coded to identify wards with DFSAs and non-DFSA
wards. The initial study design was to compare households in DFSA wards to households in wards
without a DFSA. However, household survey data show that households in both DFSA and non-
DFSA wards are receiving similar programming (water and sanitation, food and cash support,
agriculture and veterinary services, and credit programs). The analysis shifted to examine the
relationship between types of programming and well-being outcomes. The key feature of the
USAID/TANGO methods was the computation of a household resilience capacity index to use in
multivariate regression equations. Equations tested whether increased household resilience capacity
is associated with better well-being outcomes, and whether household resilience capacity mitigates
the effect of shocks on well-being outcomes.
El Niño induced droughts in 2015 and 2016, and caused two successive crop failures. By 2016, all
households were under extreme and increasing stress. Living conditions were worsened by a drop
in the value of remittances in 2016 due to devaluation of the South African rand, and by macro-
economic conditions in Zimbabwe. A cash shortage nationwide in 2016 meant that workers were
not being paid on time or at all, the Grain Management Board (GMB) was late making payments to
farmers, and formal financial institutions were unable to provide credit to rural farmers and
livestock owners. Overall, in terms of shock exposure, coping strategies, and well-being outcomes,
people were worse off in 2015 than they were in 2014, and these conditions and outcomes further
deteriorated in 2016.
The drought was already underway in 2015, as DFSA implementation was ongoing. This, in addition
to macro-economic issues, severely curtailed the ability of programming to build resilience capacity.
In turn, this limited households' ability to cope with the droughts. Following the failed harvest in
1 The 2015 dataset includes 23 households in Midlands province.

Resilience Evaluation, Analysis and Learning (REAL)
EXECUTIVE SUMMARY x
2015, DFSAs expanded to include supplementary feeding and scale-up cash for assets (CFA). These
were further expanded when the 2016 harvest also failed.
Findings from this study document difficulties building resilience capacity during a prolonged
drought and unstable macro-economic conditions. Data from ZimVAC and other sources
document worsening drought in 2015 and 2016 and increasing downstream shocks to households.
Household survey data also show deterioration of assets and social capital, and lower levels of well-
being. In general, households drew down cereal stores, livestock assets, and savings over the course
of the drought. Cereal stores decreased with the onset of the drought and continued to fall
throughout. Households were able to maintain some livestock and savings at or near pre-drought
levels through year one but not through the second year. In the second year of the drought, the
percentage of households owning livestock decreased and the percentage of households reporting
loss of all livestock doubled. The mean value of livestock assets (estimated in Tropical Livestock
Units), also decreased. Data also show that in 2015 few agricultural and livestock producers had
access to formal markets. Market access mirrors crop and livestock depletion. Use of formal
markets for agricultural products dropped by half from 2015 to 2016, coinciding with the large
share of households reporting crop failure. Use of livestock markets increased between 2015 and
2016, coinciding with drought-related diseases2 and destocking programs in 20163.
Even though shocks were worsening and assets were being depleted, food coping strategies and
some non-food coping strategies improved or did not continue to worsen. Important exceptions
are withdrawing children from school, which did not increase until the second year of the drought,
and selling the last breeding female livestock, which increased in both years. An increased
percentage of households that sold their last breeding female livestock in year two of the drought is
consistent with findings discussed in the previous paragraph.
Program documentation and household survey data show that program emphasis shifted from a
development focus to emergency relief. This may explain why coping strategy index (CSI) scores
improved and some negative coping strategies did not increase in both years.
The study included as well-being outcomes: adequate food security, the household dietary diversity
score (HDDS), per capita daily expenditures, moderate to severe hunger and recovery (2016 only).
All four outcomes deteriorated over the course of the drought. The percentage of households
reporting adequate food consumption fell in both years. The HDDS and the percentage of
households reporting moderate to severe hunger did not worsen until year two of the drought.
Households may have been able to maintain HDDS by substituting less nutritious foods or
consuming nutritious food less often. The sharp increase in household hunger in year two may be
due to similar reasons: food shortages did not occur until the second year. Per capita daily
2 https://www.pressreader.com/zimbabwe/sunday-news-zimbabwe/20160828/281938837341395
3 https://zimbabweland.wordpress.com/2016/02/22/the-el-nino-drought-hits-livestock-hard-in-zimbabwe/
Zimbabwe Resilience Research Report
EXECUTIVE SUMMARY xi
expenditures dropped in year one and stayed at lower levels than before the drought. As of 2016,
almost no one reported any recovery.
Multivariate analysis shows that household resilience capacity is associated with improvements in all
well-being outcomes. In some cases (with HDDS over all four years and per capita daily
expenditures in 2016) household resilience capacity has a larger effect on households as shock
exposure increases, helping to mitigate the effects of shocks. Analysis also shows that agricultural
and/or livestock support is associated with improvements in nearly all well-being outcomes. Formal
safety nets generally improve food-related outcomes, and credit increases per capita daily
expenditures. Results from analyses of data from 2014 show that low producer prices (measured by
goat prices) and high consumer prices (measured by maize or maize meal) have large effects on
household well-being, even outside of drought conditions.


Zimbabwe Resilience Research Report
INTRODUCTION 1
1. Introduction
The objective of this research is to utilize secondary data from a variety of sources within a
USAID/TANGO resilience analytical framework to better understand how resilience capacity can
buffer the negative effects of shocks on well-being in Zimbabwe. In particular, the research
examines factors that can provide information about resilience programming in Zimbabwe. The
study includes wards in four provinces – Manicaland, Matabeleland North, Matabeleland South, and
Masvingo4 – and covers four years from 2013 through 2016. Surveys were conducted in May of
each year. Development Food Security Activities (DFSAs) were funded in 2013 and implementation
started in late 2014. Data from 2013 and 2014 provide a baseline for analysis, describing conditions
prior to DFSA implementation and prior to two years of drought. Data from 2015 and 2016
describe household resilience capacity and well-being in the face of drought and with DFSAs in
place. In addition, data cover wards in both DFSA and non-DFSA areas, allowing comparison.
Across the study area, two years of El Niño-induced droughts affected everyone. In 2015 and 2016,
all households were under extreme and increasing stress. Overall, in terms of shock exposure,
coping strategies, and well-being outcomes, people were worse off in 2015 than they were in 2014,
and these outcomes continued to decline in 2016. The drought was already underway in 2015 when
Development Food Security Activities began implementation. This severely curtailed programming
effectiveness in building resilience capacity. In turn, this limited households' ability to cope with the
droughts. In addition, following the failed harvest in 2015, Development Food Security Activities
shifted emphasis to expand supplementary feeding and scale-up cash for assets (CFA) activities.
These were further expanded when the 2016 harvest also failed.
This report examines changes in relationships over time between shocks and well-being outcomes,
as well as the effects of household resilience capacity, humanitarian, and development programming
(in both non-DFSA and DFSA wards) on household well-being outcomes.
The research questions are:
Are resilience capacities associated with improvements in coping strategies and well-being
outcomes?
Do resilience capacities help buffer the negative effects of shocks on well-being outcomes?
Is programming associated with increased resilience capacity and improvements in coping
strategies and well-being outcomes?
Of the elements directly related to programming, which are the strongest predictors of
improved well-being outcomes?
4 The 2015 dataset includes 23 households in Midlands province.

Resilience Evaluation, Analysis and Learning (REAL)
INTRODUCTION 2
In this study, well-being outcomes are measured by the following indicators: adequate food
consumption, household dietary diversity score (HDDS), per capita expenditures, and moderate to
severe household hunger. Coping strategies are measured using the food coping strategies index
(CSI) and the use of negative coping strategies. Shocks are measured by exposure to drought (using
satellite data obtained from ADFM), producer and consumer prices, and self-reported shock
exposure. Resilience capacities are measured as a combination of livestock assets, cereal stores,
education of household members, social capital, livelihood diversification, savings, market
participation, and exposure to information. Access to non-governmental organization (NGO)
and/or government programming is measured by whether a household received agricultural or
livestock assistance, improved water and sanitation, formal safety nets (FSN), and loans from other
than family and friends.
Description of USAID/DFSA programming
Enhancing Nutrition, Stepping Up Resilience and Enterprise (ENSURE) is a USAID Food for Peace
Title II DFSA. The activity started in June 2013 and will end in June 2018. ENSURE is implemented
by World Vision (consortium lead), CARE, Stichting Nederlandse Vrijwilliger
Netherlands Development Organization (SNV), and Southern Alliance for Indigenous Resources
(SAFIRE). It is implemented in Manicaland and Masvingo provinces. ENSURE targets vulnerable, food
insecure communities and works in the areas of nutrition and health, agriculture-focused income
generation, and household and community resilience. The goal is to improve the food security of
targeted communities and households in Manicaland and Masvingo provinces by 2018.
The strategic objectives (SOs) and intermediate results (IRs) of ENSURE are as follows:
SO1: Nutrition among women of reproductive age and children under 5 improved
IR1.1: Consumption of nutritious food Improved
IR1.2: Prevalence of diarrhea in children under 5 reduced
SO2: Household income increased
IR2.1: Agricultural productivity and production increased
IR2.2: Increased net revenue from targeted value chains
SO3: Resilience to food insecurity of communities improved
IR3.1: Community disaster preparedness and management capacities improve
IR3.2: Access to and management of disaster risk and mitigation assets improved
The focus of the development activity is multi-sectoral, achieving change via empowerment and
training activities, and service provision. As described in activity documents,5 the key vehicles for
5 USAID 2016, 2015. Annual Results Reports for World Vision Zimbabwe ENSURE DFSA, award AID-FFP-A-13-00003; FY
2016 and FY 2015.
Zimbabwe Resilience Research Report
INTRODUCTION 3
driving behavior change among program participants are via four cohesive groups of praxis: care
groups (nutrition), production and marketing groups (agricultural income generation), village savings
and lending (VS&L) groups (income generation), and disaster management committees (resilience),
all of which are supported by a strong gender equity training and empowerment component. In the
area of resilience, a robust food for assets (FFA) intervention enables ENSURE communities to
engage in infrastructure development that helps them to address vulnerabilities and risks –
especially related to drought – that are major underlying causes of food insecurity.
Major activity features include:
Providing supplementary and protective rations for pregnant and lactating mothers and
children 6-23 months to address critical nutrition needs related to the first 1,000 days of
life.
Working via VS&L groups to provide household-level financing for agricultural input
purchases, infrastructure maintenance, latrine construction, and small income-generating
activities (IGAs).
Addressing drought conditions by building climate change awareness, developing irrigation
infrastructure, and promoting climate-smart agriculture.
Lean season assistance activity serving close to 300,000 food insecure people (end of fiscal
year 2016)
Addressing gender issues via training and dialogues with women and men.
The Amalima program6, implemented by Cultivating New Frontiers in Agriculture (CNFA) was
funded in 2013 through 2018. The program’s name, Amalima, is the word for 'social contract', the
Ndebele custom by which families come together to help each other. Amalima is a USAID Food for
Peace-funded development activity operating in Matabeleland North and South. The activity
builds on existing community programs to strengthen food security and improve resilience. Amalima
provides supplementary food to pregnant and lactating women and children under the age of two,
and training on child care, hygiene and feeding practices7. Amalima also provides vouchers to
purchase productive assets such as goats and inputs, and utilizes matching grants to help producer
groups scale up production, as well as providing training in agricultural and livestock practices8.
6 USAID. 2016, 2015. Annual Results Reports for CNFA Zimbabwe, Amalima project. Award number: CNFA FFP-A-13-00004, FY
2016, 2015. 7 USAID. 2014. USAID Food for Peace Program, Amalima, supports rural households. https://www.usaid.gov/zimbabwe/press-
releases/usaid-food-peace-program-amalima-supports-rural-households 8 USAID. 2016, 2015. Annual Results Reports for CNFA Zimbabwe, Amalima project. Ibid.
Resilience Evaluation, Analysis and Learning (REAL)
INTRODUCTION 4
The strategic objectives of Amalima are:
SO 1: Household access to and availability of food improved
IR 1.1: Agricultural production and productivity Improved
IR 1.2 Agricultural marketing improved
IR 1.3 Post harvest losses reduced
SO 2: Community Resilience to Shocks Improved
IR 2.1 Agricultural basic infrastructure and other production assets developed/rehabilitated
IR 2.2 Community social capital leveraged
IR 2.3: Community-managed disaster risk reduction systems strengthened
SO 3: Nutrition and health among pregnant and lactating women; and boys and girls under 2
improved
IR 3.1 Consumption of diverse and sufficient foods for pregnant and lactating women; and
boys and girls under 2 improved
IR 3.2 Health and hygiene and caring practices of pregnant and lactating women, caregivers
and boys and girls under 2 improved
IR 3.3 Accessibility to and effectiveness of community health and hygiene services improved
Droughts and, to a lesser extent, macro-economic financial conditions impacted DFSA
programming in 2015 and 2016. As the drought progressed into 2016,9 a second year of crops
failed, livestock deaths increased, and widespread livestock disease (hoof and mouth, tick borne
diseases, Anthrax, and lumpy skin) were reported in several districts. Cattle were particularly hard
hit. DFSA emphasis shifted by suspending or curtailing livestock and agricultural support programs
and expanding cash for assets (CFA), food for assets (FFA), supplemental feeding, rations, and
voucher programs.
Among Zimbabwe's macro-economic issues are a cash shortage, induced by government spending
and restrictions on foreign investment.10 The shortage was exacerbated by a subsequent run on
banks and is expected to continue.11 Lack of liquidity means that workers and agricultural and
livestock producers were not getting paid. Commercial financial institutions stopped providing
credit to rural farmers. Internationally, the value of remittances from South Africa decreased as the
rand continued to fall in value against the US dollar. These added to difficulties for both households
and DFSA implementing agencies.
Data used in this analysis cover 2013-2016 and include household, ward, and district level
information from a variety of secondary sources (specific sources are listed in Section 3 of this
9 USAID. 2016. Annual Results Report: ENSURE. Ibid, USAID. 2016. Annual Results Report: Amalina. Ibid 10 https://www.thestandard.co.zw/2017/07/16/imf-raises-red-flag-cash-crisis/ 11 https://www.thestandard.co.zw/2017/07/16/imf-raises-red-flag-cash-crisis/, Ibid.

Zimbabwe Resilience Research Report
INTRODUCTION 5
report) for areas with DFSA programming and without DFSA programming. The 2013 and 2014
data provide baseline levels of households coping strategies and well-being outcomes prior to and in
early stages of DFSA programming. Data from 2015 and 2016 cover a period of extreme drought
and are used to analyze DFSA programming in the face of shocks.
The remainder of the report is organized as follows: Section 2 describes the data sources and
methodology, and discusses limitations to the study. Section 3 presents descriptive statistics;
covering shock exposure, elements of household resilience capacity and household resilience
capacity scores, the coping strategies index (CSI) and negative coping strategies, well-being
outcomes (adequate food consumption, HDDS, per capita daily expenditures, moderate to severe
hunger), and recovery (self-reported recovery was collected in 2016 only), as well as NGO and
government assistance. Section 4 reports the results of multivariate analysis using combined data
from 2013-2016 to show predicted values of coping strategies and well-being outcomes
corresponding to levels of household resilience capacity and shock exposure and changes over four
years in the coping strategies index (CSI), comparing households in DFSA vs non-DFSA wards.
Section 5 presents results from multivariate analysis of data year by year to show predicted values
of well-being outcomes at different levels of household resilience capacity, and changes in well-being
outcomes corresponding to types of NGO and government assistance, and the relationship
between prices and well-being outcomes. Section 6 is a summary of findings and recommendations.
Resilience Evaluation, Analysis and Learning (REAL)
METHODOLOGY 6
2. Methodology
This study applied a modified USAID/TANGO resilience analysis method to ZimVAC survey data.
The resilience analysis methods were originally developed to utilize survey data collected specifically
for resilience analysis,12 but have been modified over time to use data collected for other
purposes.13 For the Zimbabwe dataset used here, the resilience analysis methods have been
tailored, due to some differences between the ZimVAC dataset and datasets designed specifically to
measure resilience that would otherwise pose limitations for analysis.
Data sources
Data for this study come from several secondary sources: ZimVAC household surveys, the African
Flood and Drought Monitor (AFDM) (precipitation data),14 ZimVAC community surveys, and
World Food Programme (WFP) consumer price data.15
ZimVAC household and community survey data were provided by USAID/Zimbabwe and are
subsets of national datasets. Each of the four years is an independent sample. Datasets include
information from households in wards with and without DFSAs. Surveys took place in mid-May of
each year, during harvest season. Sample sizes are shown in Table 1. Detailed information about
survey methodology and results is reported in annual rural livelihoods assessment reports.16
12 Smith, L., T. Frankenberger, B. Langworthy, S. Martin, T. Spangler, S. Nelson, and J. Downen. 2015. Ethiopia Pastoralist Areas
Resilience Improvement and Market expansion (PRIME) Project impact evaluation baseline survey report. Report for USAID Feed the
Future FEEDBACK project. January.
Feed the Future FEEDBACK. 2015. Feed the Future Northern Kenya Resilience and Economic Growth in Arid Lands Impact Evaluation
Midline Report. Rockville, MD: Westat. December.
Frankenberger, T and L. Smith. 2015. Ethiopia Pastoralist Areas Resilience Improvement and Market Expansion (PRIME) Project Impact
Evaluation: Report of the Interim Monitoring Survey 2014-2015. Report for USAID Feed the Future FEEDBACK project. January.
September.
Langworthy, M., M. Vallet, S. Martin, T. Bower and T. Aziz. 2016. Baseline Study of the Enhancing Resilience and Economic Growth in
Somalia Program. Submitted by TANGO International to Save the Children Federation, December.
TANGO International. 2016. Building Resilience and Adaptation to Climates Extremes and Disasters (BRACED) Monitoring and
Evaluation. Report prepared for DFID.
TANGO International, 2016, Zimbabwe Resilience Research Initiative (ZRRI) Final report. October 31.
TANGO International, 2017, Nepal Resilience Research Report. Final report. May 4. 13 Smith, L. C. and T. R. Frankenberger. 2016. Does resilience capacity reduce the negative impact of shocks on household food
security? Evidence from the 2014 floods in Northern Bangladesh. Working paper.
TANGO International. 2016. Malawi IMS3 Resilience Analysis. Report prepared for USAID. October.
14 African Flood and Drought Monitor (AFDM). 2017. Accessed at:
http://stream.princeton.edu:9090/dods/AFRICAN_WATER_CYCLE_MONITOR/3B42RT_BC/MONTHLY.ascii? 15 WFP consumer price data accessed at: http://dataviz.vam.wfp.org/economic_explorer/prices 16 ZimVAC. 2013. Rural livelihoods assessment.
http://www.fnc.org.zw/downloads/zimvac%20reports/zimvac%202013/2013%20Rural%20Livelihoods%20Assessment%20Report.
ZimVAC 2014 Rural livelihoods assessment.
http://www.fnc.org.zw/downloads/zimvac%20reports/zimvac%202014/ZimVAC%202014%20FINAL_web.pdf

Zimbabwe Resilience Research Report
METHODOLOGY 7
Table 1: Sample sizes, non-DFSA vs DFSA, 2013-2016
Year Non-DFSA DFSA Total
2013 768 1,033 1,801
2014 779 1,020 1,799
2015 701 1,122 1,823
2016 1,032 1,332 2,364
Sources: ZimVAC (2013, 2014, 2015 2016) Household survey datasets
The African Flood and Drought Monitor (AFDM) is a real-time drought monitoring and seasonal
forecast system for sub-Saharan Africa developed through a collaboration of the United Nations
Educational, Scientific and Cultural Organization (UNESCO) and the International Hydrological
Programme. AFDM provided monthly estimates of precipitation (rainfall) based on satellite data.
These data are not the same as rainfall data collected using rainfall gauges at monitoring stations on
the ground. However, the data cover the study area in detail and are available for all four years.
Price data come from WFP and ZimVAC community surveys. ZimVAC community price data were
used in estimation equations for 2014 and 2015. WFP data were used in estimation equations for
2013.
Factor analysis – household resilience capacity index
USAID/TANGO resilience analysis methods typically use exploratory factor analysis to combine
data from community and household surveys to create three indexes measuring resilience
capacities: absorptive, adaptive, and transformative. Exploratory factor analysis is a multivariate
statistical method that uses the relationship among observed variables to identify one or more
underlying factors,17 See appendix 3 for a detailed description of the USAID/TANGO methods to
compute resilience capacity elements and index.
ZimVAC surveys did not include all the variables typically needed for computing the resilience
capacities, therefore some of the components for each capacity were adjusted to accommodate the
ZimVAC data. For example, the social capital index typically is computed based on responses to
questions about whether a household could receive (or give) food, cash, crops or WASH in the
event of a shock. Social capital in ZimVAC is based on whether a household actually received food,
cash, crops or WASH. In addition, the ZimVAC survey data lack the detail needed to compute
bonding and bridging social capital separately. Separate measures of bonding and bridging social
capital are key to differentiating between absorptive and adaptive capacities. In addition, community
ZimVAC 2015 Rural livelihoods assessment.
http://www.fnc.org.zw/downloads/zimvac%20reports/zimvac%202015/2015%20ZimVAC%20Report%20_.pdf
ZimVAC 2016 Rural livelihoods assessment.
http://www.fnc.org.zw/downloads/Bulletins/2016%20Bulletins/ZimVAC%202016%20Rural%20Livelihoods%20Assessment.pdf 17 Kim, J. & C. W. Mueller. 1978. Factor Analysis. Sage publications
Resilience Evaluation, Analysis and Learning (REAL)
METHODOLOGY 8
data are not available for all four years, and in those years for which they are available, the data lack
measures of most of the variables needed to compute transformative capacity. Therefore, instead of
three indexes, this study uses a single household resilience capacity index for each year (See
appendix 3 for computational details). Figure 1 shows how the standard (“USAID/TANGO”)
resilience variables and the variables available in the ZimVAC data correspond and feed into the
computation of the three resilience capacity indexes. The three indexes are: absorptive, adaptive
and transformation capacity indexes. They are then combined into an overall resilience capacity
index. This report uses the terms “household resilience capacity” to refer to the single index
computed from the ZimVAC data. Household resilience capacity is a streamlined combination of
absorptive and adaptive capacities from the USAID/TANGO methods. It contains only household
level information.

Zimbabwe Resilience Research Report
METHODOLOGY 9
Figure 1:
Relationship of TANGO/USAID and ZimVAC variables to absorptive, adaptive and transformative capacities
Absorptive TransformativeAdaptive
Savings BridgingBonding AssetsHuman
capital
Info
exposure
Livelihood
riskLinking
Social
capital*Education*
TANGO/
USAID
ZimVAC SavingsCereals*
LivestockLivelihood
risk
Household
Community***
ISN
ISN**
Disaster
prep
* Variables used to compute measures are different than in other TANGO/USAID studies
** Household data were used to compute these.
*** Community data are available for 2014 and 2015.
Natural
resourcesFSN
Market
access
FSN**
Public
services
ZimVAC
TANGO
/USAID
Market
accessRoadsIrrigation
Resilience Evaluation, Analysis and Learning (REAL)
METHODOLOGY 10
Multivariate analysis
The analysis uses multivariate regression analysis to estimate household use of coping strategies and
household well-being outcomes. The key feature of the analyses is an interaction term to test
whether household resilience capacity mitigates the effects of shocks on coping strategies and well-
being outcomes. The interaction term is equal to the household resilience capacity index score
multiplied by the shock measure. Multivariate equations are defined as follows:
Coping strategies:
Coping strategies index (CSI)= f(HH resilience capacity * shock exposure, programming
variables, HH characteristics and geographic controls). A censored regression equation
(Tobit) estimates CSI.
Negative coping strategies= f(HH resilience capacity * shock exposure, programming
variables, HH characteristics and geographic controls). The dependent variable is coded 0
if equal to 'no' and 1 if equal to 'yes'. A logit equation estimates the probability that a
household engages in negative coping strategies.
Well-being outcomes:
Adequate food consumption= f(HH resilience capacity * shock exposure, coping
strategies, programming variables, HH characteristics and geographic controls). The
dependent variable is coded 0 if equal to 'no' and 1 if equal to 'yes'. A logit equation
estimates the probability of adequate food consumption.
HDDS= f(HH resilience capacity * shock exposure, coping strategies, programming
variables, HH characteristics and geographic controls). An Ordinary Least Squares (OLS)
regression estimates HDDS.
Per capita daily expenditures (USD 2016)= f(HH resilience capacity * shock exposure,
coping strategies, programming variables, HH characteristics and geographic controls). A
Generalized Linear Model (GLM) is used to estimate per capita daily expenditures.
Moderate to severe hungers= f(HH resilience capacity * shock exposure, coping
strategies, programming variables, HH characteristics and geographic controls). The
dependent variable is coded 0 if equal to 'no' and 1 if equal to 'yes'. A logit equation
estimates the probability of moderate to severe hunger.
A similar USAID/TANGO study18 allowed estimation of a simultaneous regression equation to
examine changes in well-being outcomes associated with programming designed to strengthen
18 TANGO International. 2017. Nepal Resilience Research Report.

Zimbabwe Resilience Research Report
METHODOLOGY 11
absorptive, adaptive and transformative capacities. The hypothesis being tested was that program
activities improve these capacities, which in turn buffer the effects of shocks on well-being
outcomes. In that study, programming variables were statistically significant in multivariate equations
estimating absorptive, adaptive and transformative capacities but not in equations estimating well-
being outcomes, making estimation using a simultaneous equation mathematically possible and
analytically appropriate.19 This study tested the relationships between programming variables,
household resilience capacity, and well-being outcomes to see if the same model was appropriate.
Programming variables were statistically significant in equations estimating resilience capacity and in
equations estimating well-being outcomes so it is not possible to estimate a simultaneous equation.
Instead, programming variables are included in equations estimating coping strategies and well-being
outcomes directly.
Limitations
Household surveys did not collect the same information in all four years. Consequently, household
resilience capacity indexes use different variables for each year. In addition, the difference in
variables across years means that the factor loadings assigned to variables are not comparable
across years.
Except for 2016,20 household surveys do not include detailed information about exposure to
specific shocks. Shock exposure information is essential for resilience analysis. For 2013-2015 this
study uses information from AFDM (127-159 reporting sites, roughly corresponding to wards) and
from WFP (8 markets) and ZimVAC community surveys (2014 and 2015) to measure household
exposure to price-related shocks. Because these data are reported at a higher level of aggregation
than household data, there is less variation, making estimates less precise.
The 2016 household survey shock module has a limited list of shocks and does not include livestock
disease, crop disease, wild animals destroying livestock and crops, theft, fire, cash shortages or
conflict (shocks that were noted in the community survey and/or found to be important in other
studies).
Community data for 2014 and 2015 measure only a few of the elements of transformative capacity
(markets and roads) as it is computed by TANGO/USAID. Lack of community data for 2013 and
2016 mean that well-being estimates do not fully take into account community-level factors. This is
an important caveat for interpreting results of the current analysis, given that other studies have
shown the importance of transformative capacity and its elements such as infrastructure, access to
19 Wooldridge, Jeffrey M. 2006. Introductory Econometrics: A Modern Approach (Third edition.). Mason, OH: Thomson/South-
Western 20 The 2013 and 2014 surveys ask about a main shock.
Resilience Evaluation, Analysis and Learning (REAL)
METHODOLOGY 12
services, governance, natural resource management, conflict mitigation, and disaster planning for
household well-being.
Community level data on goat prices (as a proxy for producer prices) and maize or maize meal
prices (as a proxy for consumer prices) provided an objective measure of price shocks. Price data
were incorporated into estimation equations for 2014 and 2015.
ZimVAC household surveys do not collect sufficiently detailed data to compute several resilience
capacity elements according to USAID/TANGO methods. Livelihood diversification is one example.
In other similar studies, information to measure livelihoods comes from either the household roster
(questions about paid and unpaid work) or from a module asking specifically about livelihoods
activities. Both questions cover the past 12 months. In this study, information about livelihoods
came from an income module asking about income sources (cash or in-kind) over the past 30 days.
Having a 30-day recall means that households generally report fewer livelihoods than over 12
months, giving a less complete picture of how households diversify livelihoods to manage risk. As
mentioned earlier, surveys used in this analysis do not collect information about social capital in a
way that allows for computing bridging and bonding social capital that is consistent with
USAID/TANGO methods. Nor do the surveys contain the information needed to compute linking
social capital. Household survey questions about NGO and government programming are fairly
general and not consistent over survey years, making it difficult to estimate the relationship
between programing, household resilience capacity, and well-being outcomes.
Finally, because data are a subsample from a larger dataset, household sampling weights are
unknown. All statistics reported in this analysis were computed using unweighted data, which limit
the extent to which findings from sampled households can be generalized to the larger population.
Statistics computed using unweighted data have smaller standard errors than those computed using
weighted data, increasing the likelihood of ‘significant’ findings that may not actually be ‘true’.
Zimbabwe Resilience Research Report
DESCRIPTIVE STATISTICS 13
3. Descriptive statistics
This section provides descriptive statistics covering exposure to various shocks, the household
resilience capacity index and its elements, NGO/government support, coping strategies, and well-
being outcomes across years. Tables provide means or percentages for 2013-2016 and results of
pairwise tests comparing values between years. Meaningful differences with significance levels of
0.10 or better are presented in the tables in order to show findings that may be interesting but do
not meet the 0.05 standard for statistical significance.
Shock exposure
In Zimbabwe, as elsewhere, droughts typically trigger a series of downstream shocks. Lack of water
and pasture causes livestock to become emaciated and diseased, and some die; animals also become
more vulnerable to theft and predation. Herders (often children) travel further distances in search
of water and pasture, and cannot attend school because they are tending livestock. Livestock prices
fall because markets are over-supplied with sick and emaciated animals. Drought also causes crop
failure, and food prices to rise because of shortages. Farmers don’t have money for inputs.
Household members, especially those who work in agriculture and livestock, lose their jobs and
cannot afford to buy food. These events are documented using data from ZimVAC household
surveys and other secondary sources. Data from multiple sources: precipitation (AFDM 2017),
livestock and crop loss (ZimVAC household surveys 2013-2016), and price shocks (ZimVAC
community surveys 2014, 2015; WFP 2013) show high levels of exposure to drought and
downstream shocks in 2015 and increased exposure in 2016.
Precipitation estimates (June 2012 through May 2016) from AFDM are presented in Figure 2. The
figure shows monthly rainfall and 30-year mean monthly rainfall (103 mm) for the rainy season
(October-January21). The figure shows drought conditions followed by flooding in 2013, above
normal rainfall in 2014, then two years of drought in 2015 and 2016. Rainfall patterns shown in the
figure are noted in other sources. Examples are: early season drought in 2013,22,23 more evenly
distributed rainfall across the rainy season in 201424, and high rainfall (flooding) in December 2014.25
AFDM rainfall estimates provide data to compute mean monthly rainfall during the six months prior
to the survey (November-May), which is one of the shock exposure variables used in multivariate
regression equations.
21 ZimVAC. 2016. ZimVAC lean season monitoring report.
http://www.fnc.org.zw/downloads/Bulletins/2016%20Bulletins/ZimVAC%20Lean%20Season%20Monitoring%20Assessment.pdf 22 http://www.fao.org/emergencies/fao-in-action/projects/detail/en/c/240213/ 23 http://www.aljazeera.com/indepth/features/2013/04/2013416132856364607.html 24 ZimVAC. 2014. Reported that all provinces received normal to above normal rainfall. 25 International Federation of Red Cross and Red Crescent Societies (IFRCRC) 2015. Emergency Plan of Action (EPoA) Zimbabwe:
Floods.

Resilience Evaluation, Analysis and Learning (REAL)
DESCRIPTIVE STATISTICS 14
Figure 2: Monthly rainfall (mm), June 2012-May 2016
Source: AFDM 2017
0
50
100
150
200
250
300
Ju
n-1
2
Se
p-1
2
De
c-1
2
Ma
r-1
3
Ju
n-1
3
Se
p-1
3
De
c-1
3
Ma
r-1
4
Ju
n-1
4
Se
p-1
4
De
c-1
4
Ma
r-1
5
Ju
n-1
5
Se
p-1
5
De
c-1
5
Ma
r-1
6
Ju
n-1
6
Ra
infa
ll (m
m)
Rainy season Nov-Jan
30 yr mean=130mm/mo
(Nov-Jan)
In ZimVAC surveys, households that owned livestock were asked about livestock deaths due to
drought/lack of water, disease, and predation. In survey years 2014, 2015, and 2016, households
were also asked about theft of livestock. Table 2 shows the share of households owning large
livestock (cattle, draught cattle, goats, and sheep) decreased as drought conditions worsened.
Livestock ownership was lower in 2016 than in any of the other years, dropping from between 67.2
to 69.6 percent in 2013-2015 to 64.6 percent in 2016. However, the proportion of households
reporting unexpected livestock losses over the four survey rounds does not differ significantly over
time. The last row of the table presents data on the proportion of households that lost remaining
livestock. This was computed as households that reported owning livestock in the year prior to the
survey but none in the survey year. The proportion of households reporting loss of remaining
livestock was lower in 2015 (2.2 percent) than previous years (5.4 percent in 2013 and 4.7 percent
in 2014). The proportion of households losing all their livestock increased again in 2016 (5.0
percent), providing additional evidence of the intensity of the drought.
Zimbabwe Resilience Research Report
DESCRIPTIVE STATISTICS 15
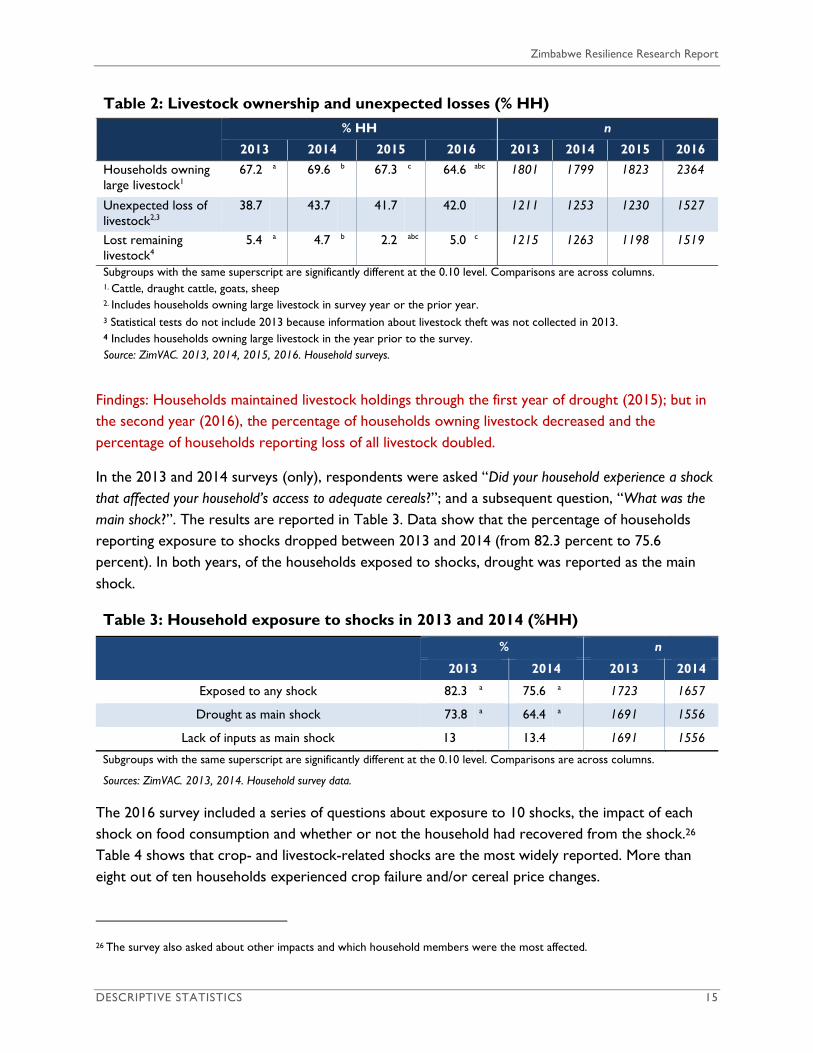
Table 2: Livestock ownership and unexpected losses (% HH)
% HH n
2013 2014 2015 2016 2013 2014 2015 2016
Households owning
large livestock1
67.2 a 69.6 b 67.3 c 64.6 abc 1801 1799 1823 2364
Unexpected loss of
livestock2,3
38.7
43.7
41.7
42.0
1211 1253 1230 1527
Lost remaining
livestock4
5.4 a 4.7 b 2.2 abc 5.0 c 1215 1263 1198 1519
Subgroups with the same superscript are significantly different at the 0.10 level. Comparisons are across columns.
1. Cattle, draught cattle, goats, sheep 2. Includes households owning large livestock in survey year or the prior year.
3 Statistical tests do not include 2013 because information about livestock theft was not collected in 2013. 4 Includes households owning large livestock in the year prior to the survey.
Source: ZimVAC. 2013, 2014, 2015, 2016. Household surveys.
Findings: Households maintained livestock holdings through the first year of drought (2015); but in
the second year (2016), the percentage of households owning livestock decreased and the
percentage of households reporting loss of all livestock doubled.
In the 2013 and 2014 surveys (only), respondents were asked “Did your household experience a shock
that affected your household’s access to adequate cereals?”; and a subsequent question, “What was the
main shock?”. The results are reported in Table 3. Data show that the percentage of households
reporting exposure to shocks dropped between 2013 and 2014 (from 82.3 percent to 75.6
percent). In both years, of the households exposed to shocks, drought was reported as the main
shock.
Table 3: Household exposure to shocks in 2013 and 2014 (%HH)
% n
2013 2014 2013 2014
Exposed to any shock 82.3 a 75.6 a 1723 1657
Drought as main shock 73.8 a 64.4 a 1691 1556
Lack of inputs as main shock 13 13.4 1691 1556
Subgroups with the same superscript are significantly different at the 0.10 level. Comparisons are across columns.
Sources: ZimVAC. 2013, 2014. Household survey data.
The 2016 survey included a series of questions about exposure to 10 shocks, the impact of each
shock on food consumption and whether or not the household had recovered from the shock.26
Table 4 shows that crop- and livestock-related shocks are the most widely reported. More than
eight out of ten households experienced crop failure and/or cereal price changes.
26 The survey also asked about other impacts and which household members were the most affected.

Resilience Evaluation, Analysis and Learning (REAL)
DESCRIPTIVE STATISTICS 16
Table 4: Shock exposure 2016
Shock exposure1 2016
% n
Crop failure 84.3 2332
Cereal price change 51.3 2308
Livestock deaths 25.1 2251
Livestock price change 17.5 2275
Health related2 10.1 2222
Loss of employment 4.0 2223
Death of main breadwinner 3.6 2219
1 Percentages sum to more than 100 because of multiple responses
2 Includes HIV/AIDS, diarrheal and malarial diseases
Source: ZimVAC. 2016. Household survey data.
The severity of shocks score is the mean value of a score ranging from 1 to 4, where higher scores
correspond to worse conditions in terms of household food consumption: 1 is an increase in food
consumption, 2 is no change, 3 is a moderate decline, and 4 is a severe decline. Table 5 shows that
for households exposed to shocks, nearly all shocks resulted in a moderate to severe decline in
food consumption.
Table 5: Severity of shocks
Shock severity1 2016
Mean score n
Cereal price change 3.5 1168
Livestock price change 3.3 381
Crop failure 3.6 1913
Livestock deaths 3.2 533
Death of main breadwinner 3.6 79
Health related2 3.1 215
1 Percentages sum to more than 100 because respondents of multiple responses.
2 Includes HIV/AIDS, diarrheal and malarial diseases
Source: ZimVAC. 2016. Household survey data.
Household resilience capacity
Table 6 shows changes in individual elements of household resilience capacity over the four years.
Detailed information about computing each element is provided in Appendix 3. In general,
households drew down assets and savings over the course of the drought. Data show that
households were able to maintain cereal stores through 2015, based on their estimated value in
2016 USD. They dropped, however, from an estimated high value of $57 in 2014 to $44 in 2016,
year two of the drought. Savings followed a similar pattern. Households maintained savings through
the first year of the drought (2014-2015), but they then dropped from $32.8 in 2015 to $21.2 in the

Zimbabwe Resilience Research Report
DESCRIPTIVE STATISTICS 17
second year of the drought, a reduction of nearly one-third. Livestock holdings (Tropical livestock
units or TLU) increased between 2014 and 2015 (2.8 to 3.3 TLU) but then dropped in 2016 to 2.8
TLU.
Table 6: Household resilience capacity elements
2013 2014 2015 2016
Cereal stores (USD2016, mean) 52.8 a 57.0 b 52.2 c 44.3 abc
Livestock assets (TLU, mean) 2.5 ab 2.8 a 3.3 ab 2.8 b
ISN (0-5, mean) 0.02 ~ 0.02 0.02
Count of livelihoods (0-8, mean) 1.3 a 0.9 a 1.0 a 1.8 a
Education level head of household (1-8, mean) 2.3 a 2.4 b 2.3 c 2.5 abc
Count of adults in hh with more than primary
level education (mean) ~ ~ 1.0 a 1.1 a
Social capital (0-10, mean) 0.46 a ~ 0.39 a 0.41
Savings (USD2016, mean) 29.1 a 27.8 b 32.8 c 21.2 abc
Remittances (0-5, mean) 0.2 a ~ 0.2 b 0.3 ab
Sale of agricultural products to traders, GMG,
millers, markets, or contractors (%) ~ 2.8 a 3.7 b 1.9 ab
Sale of livestock products to traders, abattoirs,
contractors (%) ~ ~ 5.9 a 9.9 a
Information from government, NGOs, newspaper,
TV or Internet (0-8) (mean) ~ ~ 2.7 ~
N 1801 1791 1823 2364
Subgroups with the same superscript are significantly different at the 0.10 level. Comparisons are across columns.
~ Data were not collected.
Sources: ZimVAC. 2013, 2014, 2015, 2016. Household survey data.
Findings: Households drew down cereal stores, livestock assets, and savings over the course of the
drought. They were able to maintain some assets at or near pre-drought levels through year one of
the drought but not through two years of drought. Few agricultural and livestock producers had
access to formal markets. Use of formal markets for agricultural products dropped by one-half from
2015 to 2016. Lower cereal stores and use of markets in 2016 is supported by the large share of
households reporting crop failure (Table 4).
Elements are combined using exploratory factor analysis to compute the household resilience
capacity index (see section 2 for detail on methods). Table 7 shows the variables that make up the
household resilience capacity indexes (one for each year), whether or not they are in each dataset,
and factor loadings. Neither factor loadings nor household resilience capacity index scores are
comparable across years because the factors have different elements in each year. Factor loadings

Resilience Evaluation, Analysis and Learning (REAL)
DESCRIPTIVE STATISTICS 18
are low27 but in line with similar studies.28 Eigenvalues, similarly are fairly low (close to one). An
eigenvalue of less than one means that the factor explains less of the variation among the variables
than each one separately. Kaiser–Meyer–Olkin (KMO) is a measure of sampling adequacy. KMO
takes values between 0 and 1, with small values meaning that overall the variables have too little in
common to warrant a factor analysis29. KMO scores for household resilience capacities are low, but
acceptable. Multivariate equations presented in Appendix 4 compare the relationship between
household resilience capacity and each element on coping strategies and outcomes.
Table 7: Household resilience capacity elements – factor loadings
2013 2014 2015 2016
Cereal stores (USD 2016) 0.48 0.37 0.49 0.54
Livestock (TLU)30 0.69 0.23 0.57 0.58
Education level head of household 0.31 0.38 c c
Savings 0.75 0.44 0.53 0.47
Count of adults in HH with more than primary level
education ~ ~ 0.45 0.42
ISN HH received food, cash, ag inputs, livestock inputs, or
WASH inputs from churches (0-5) § ~ § §
Social capital HH received food, cash, ag inputs, livestock
inputs, or WASH inputs from urban or rural relatives (0-10) § ~ § §
Remittances HH received food, cash, ag inputs, livestock
inputs, or WASH inputs as remittances (0-5) § ~ § §
Count of livelihoods (0-8) 0.20 0.31 0.33 0.43
Remittances as an income source (%) § 0.14 ‡ ‡
HH sold ag products to traders, GMB, millers, markets, or
contractors (%) ~ 0.29 0.39 0.37
HH sold livestock products to traders, CSC, markets, or
contractors (%) ~ ~ 0.42 0.39
Count of information types received from government,
NGOS, newspaper, TV or Internet (0-8)1 ~ ~ 0.53 ~
Eigenvalue 1.39 1.37 1.76 1.46
KMO2 0.52 0.60 0.62 0.58
Household resilience capacity index (0-100, mean) 7.3 16.8 7.1 7.5
n 1801 1791 1822 2364
§ Variable had a negative loading and was dropped from index.
~ Information was not included in ZimVAC survey.
‡ Information was included in survey but a different measure was used in index.
27 Kim, J. & C. W. Mueller. 1978. Ibid. 28 Factor loadings from other studies: loadings for household level variables used to compute in resilience capacity indexes
according to USAID/TANGO methods range from 0.03 to 0.49 (USAID Somalia, Niger, Burkina Faso). 29 Stata. https://www.stata.com/manuals13/mvfactorpostestimation.pdf. 30 Computed using methods described in Food and Agriculture Organization (FAO). 2011. Guidelines for the preparation of
livestock sector reviews.
Zimbabwe Resilience Research Report
DESCRIPTIVE STATISTICS 19
1 'Information types' is a count of whether the household received information about one of more of the following topics:
weather, rainfall, livestock, livestock prices, business, borrowing, food market prices, input markets, child feeding, or
health and that information came from: NGOs, CBOs or churches; government officials; newspaper; radio or TV; Internet
or SMS.
2 The following labels are given to values of KMO:
0.00 to 0.49 unacceptable
0.50 to 0.59 miserable
0.60 to 0.69 mediocre
0.70 to 0.79 middling
0.80 to 0.89 meritorious
0.90 to 1.00 marvelous
Stata. https://www.stata.com/manuals13/mvfactorpostestimation.pdf.
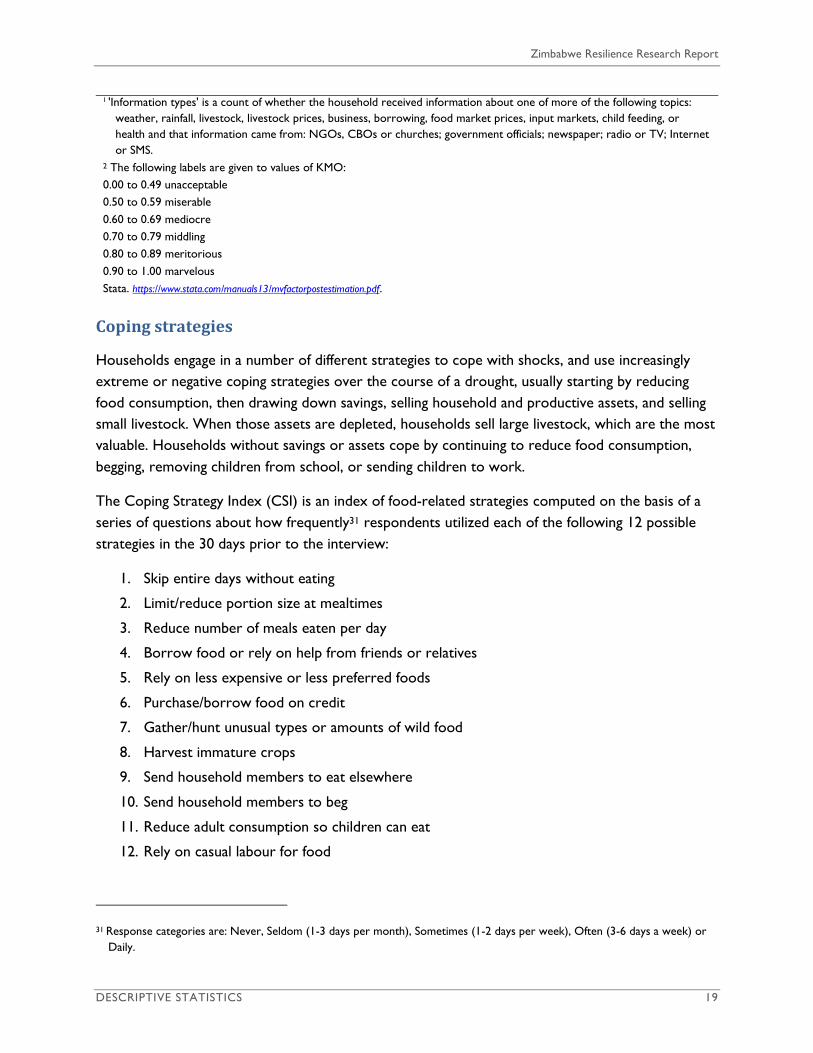
Coping strategies
Households engage in a number of different strategies to cope with shocks, and use increasingly
extreme or negative coping strategies over the course of a drought, usually starting by reducing
food consumption, then drawing down savings, selling household and productive assets, and selling
small livestock. When those assets are depleted, households sell large livestock, which are the most
valuable. Households without savings or assets cope by continuing to reduce food consumption,
begging, removing children from school, or sending children to work.
The Coping Strategy Index (CSI) is an index of food-related strategies computed on the basis of a
series of questions about how frequently31 respondents utilized each of the following 12 possible
strategies in the 30 days prior to the interview:
1. Skip entire days without eating
2. Limit/reduce portion size at mealtimes
3. Reduce number of meals eaten per day
4. Borrow food or rely on help from friends or relatives
5. Rely on less expensive or less preferred foods
6. Purchase/borrow food on credit
7. Gather/hunt unusual types or amounts of wild food
8. Harvest immature crops
9. Send household members to eat elsewhere
10. Send household members to beg
11. Reduce adult consumption so children can eat
12. Rely on casual labour for food
31 Response categories are: Never, Seldom (1-3 days per month), Sometimes (1-2 days per week), Often (3-6 days a week) or
Daily.
Resilience Evaluation, Analysis and Learning (REAL)
DESCRIPTIVE STATISTICS 20
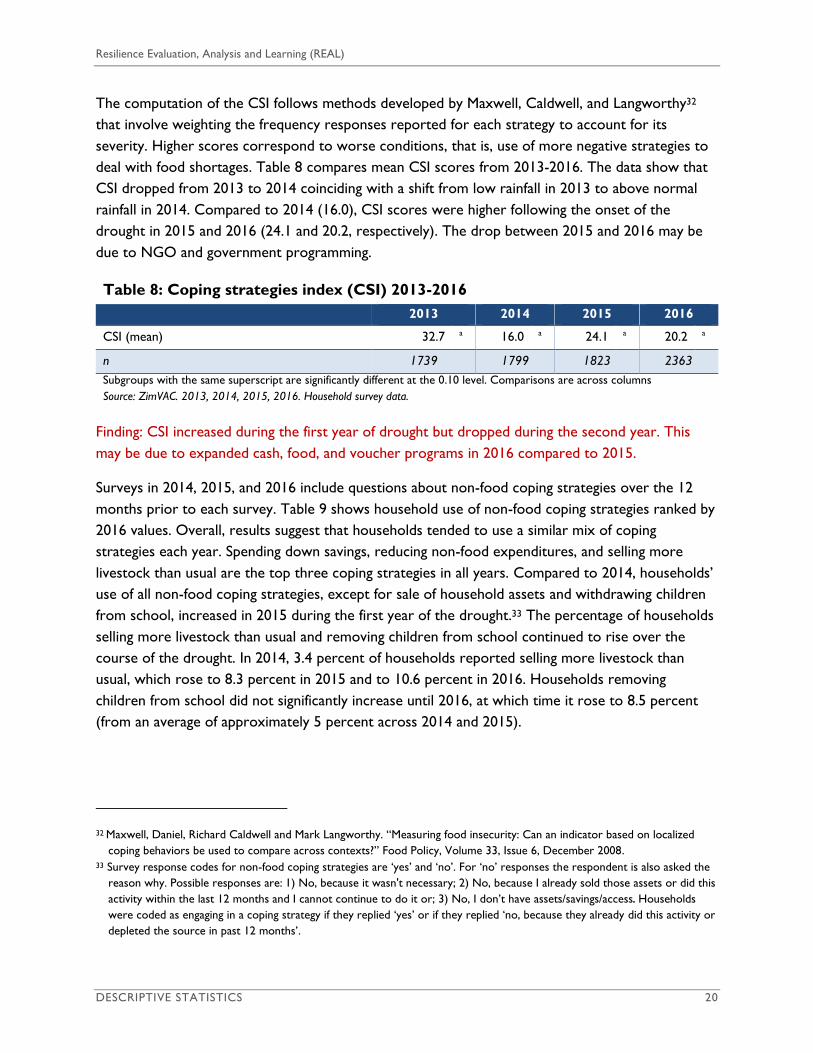
The computation of the CSI follows methods developed by Maxwell, Caldwell, and Langworthy32
that involve weighting the frequency responses reported for each strategy to account for its
severity. Higher scores correspond to worse conditions, that is, use of more negative strategies to
deal with food shortages. Table 8 compares mean CSI scores from 2013-2016. The data show that
CSI dropped from 2013 to 2014 coinciding with a shift from low rainfall in 2013 to above normal
rainfall in 2014. Compared to 2014 (16.0), CSI scores were higher following the onset of the
drought in 2015 and 2016 (24.1 and 20.2, respectively). The drop between 2015 and 2016 may be
due to NGO and government programming.
Table 8: Coping strategies index (CSI) 2013-2016
2013 2014 2015 2016
CSI (mean) 32.7 a 16.0 a 24.1 a 20.2 a
n 1739 1799 1823 2363
Subgroups with the same superscript are significantly different at the 0.10 level. Comparisons are across columns
Source: ZimVAC. 2013, 2014, 2015, 2016. Household survey data.
Finding: CSI increased during the first year of drought but dropped during the second year. This
may be due to expanded cash, food, and voucher programs in 2016 compared to 2015.
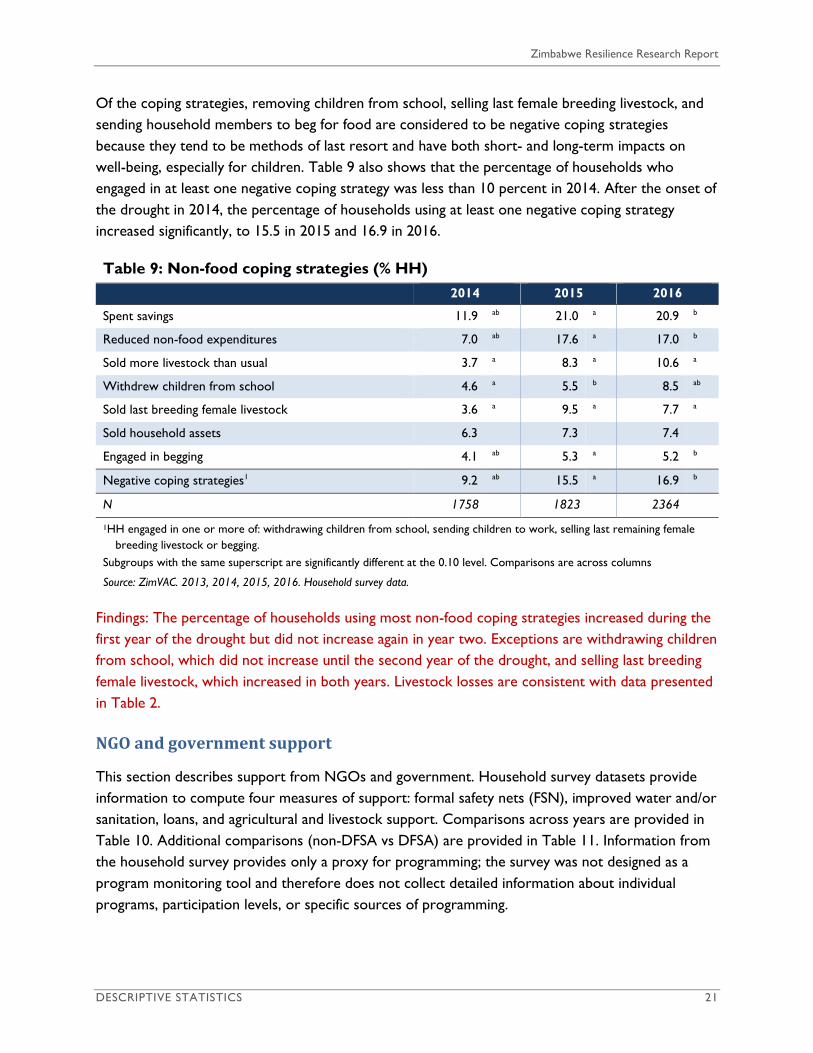
Surveys in 2014, 2015, and 2016 include questions about non-food coping strategies over the 12
months prior to each survey. Table 9 shows household use of non-food coping strategies ranked by
2016 values. Overall, results suggest that households tended to use a similar mix of coping
strategies each year. Spending down savings, reducing non-food expenditures, and selling more
livestock than usual are the top three coping strategies in all years. Compared to 2014, households’
use of all non-food coping strategies, except for sale of household assets and withdrawing children
from school, increased in 2015 during the first year of the drought.33 The percentage of households
selling more livestock than usual and removing children from school continued to rise over the
course of the drought. In 2014, 3.4 percent of households reported selling more livestock than
usual, which rose to 8.3 percent in 2015 and to 10.6 percent in 2016. Households removing
children from school did not significantly increase until 2016, at which time it rose to 8.5 percent
(from an average of approximately 5 percent across 2014 and 2015).
32 Maxwell, Daniel, Richard Caldwell and Mark Langworthy. “Measuring food insecurity: Can an indicator based on localized
coping behaviors be used to compare across contexts?” Food Policy, Volume 33, Issue 6, December 2008.
33 Survey response codes for non-food coping strategies are ‘yes’ and ‘no’. For ‘no’ responses the respondent is also asked the
reason why. Possible responses are: 1) No, because it wasn't necessary; 2) No, because I already sold those assets or did this
activity within the last 12 months and I cannot continue to do it or; 3) No, I don’t have assets/savings/access. Households
were coded as engaging in a coping strategy if they replied ‘yes’ or if they replied ‘no, because they already did this activity or
depleted the source in past 12 months’.
Zimbabwe Resilience Research Report
DESCRIPTIVE STATISTICS 21
Of the coping strategies, removing children from school, selling last female breeding livestock, and
sending household members to beg for food are considered to be negative coping strategies
because they tend to be methods of last resort and have both short- and long-term impacts on
well-being, especially for children. Table 9 also shows that the percentage of households who
engaged in at least one negative coping strategy was less than 10 percent in 2014. After the onset of
the drought in 2014, the percentage of households using at least one negative coping strategy
increased significantly, to 15.5 in 2015 and 16.9 in 2016.
Table 9: Non-food coping strategies (% HH)
2014 2015 2016
Spent savings 11.9 ab 21.0 a 20.9 b
Reduced non-food expenditures 7.0 ab 17.6 a 17.0 b
Sold more livestock than usual 3.7 a 8.3 a 10.6 a
Withdrew children from school 4.6 a 5.5 b 8.5 ab
Sold last breeding female livestock 3.6 a 9.5 a 7.7 a
Sold household assets 6.3 7.3 7.4
Engaged in begging 4.1 ab 5.3 a 5.2 b
Negative coping strategies1 9.2 ab 15.5 a 16.9 b
N 1758 1823 2364
1HH engaged in one or more of: withdrawing children from school, sending children to work, selling last remaining female
breeding livestock or begging.
Subgroups with the same superscript are significantly different at the 0.10 level. Comparisons are across columns
Source: ZimVAC. 2013, 2014, 2015, 2016. Household survey data.
Findings: The percentage of households using most non-food coping strategies increased during the
first year of the drought but did not increase again in year two. Exceptions are withdrawing children
from school, which did not increase until the second year of the drought, and selling last breeding
female livestock, which increased in both years. Livestock losses are consistent with data presented
in Table 2.
NGO and government support
This section describes support from NGOs and government. Household survey datasets provide
information to compute four measures of support: formal safety nets (FSN), improved water and/or
sanitation, loans, and agricultural and livestock support. Comparisons across years are provided in
Table 10. Additional comparisons (non-DFSA vs DFSA) are provided in Table 11. Information from
the household survey provides only a proxy for programming; the survey was not designed as a
program monitoring tool and therefore does not collect detailed information about individual
programs, participation levels, or specific sources of programming.
Resilience Evaluation, Analysis and Learning (REAL)
DESCRIPTIVE STATISTICS 22
The FSN indicator represents the percentage of households reporting they received food, cash,
crop inputs, livestock, or WASH inputs from an NGO or the government during the 12 months
prior to a survey. Table 10 shows that the percentage of households who received formal
assistance from either a NGO or the government rose over the course of the drought, increasing
from 34.7 percent in 2015 to 51.9 percent in 2016. Surprisingly, the percentage in 2016 was lower
than in 2013, during a drought when other programming (prior to DFSA) was in place.
Loans include borrowing from one or more sources: traders, contractors, microfinance institutions
(MFIs), banks, savings and credit groups/ISALs/burial societies, cooperatives or SACCOs. The
percentage of households receiving loans decreased between 2014 and 2016, dropping from 8.8
percent in 2014 to 7.2 percent in 2016. This is coincident with cash shortages nationwide.
Improved water and improved sanitation are computed according to WHO/Unicef guidelines,34 which
consider households to have an improved water source if their water comes from piped water into
the dwelling or yard, public tap/standpipe, tube well/borehole, protected dug well, protected spring,
or rainwater. Improved sanitation facilities are: flush to piped sewer system, flush to septic tank,
flush/pour flush to pit, composting toilet, ventilated improved pit latrine, and a pit latrine with a slab.
Because shared and public facilities are often not as clean as private facilities, they are not
considered as improved (WHO and UNICEF 2006). The water and/or sanitation indicator is a
count (0-2) of whether a household has improved water, improved sanitation, or both. Table 10
shows an increase in improved water and/or sanitation, rising from 1.17 in 2014 to 1.24 in 2016.
Agricultural and livestock assistance measures whether a household received one or more of
agricultural training, cropping advice, or technical or veterinary support. Data are from 2015 and
2016 household surveys and include households reporting that they cultivated one or more crops
or own at least one animal. The data show a drop between 2015 and 2016 in the percentage of
households reporting that they received assistance (46.8 and 41.3 percent, respectively). This
coincides with the length of the drought and a second year of crop failure, as well as with the shift
in DFSA programming from development to emergency assistance.
34 WHO and Unicef. 2006. Core questions on drinking-water and sanitation for household surveys.
http://www.who.int/water_sanitation_health/monitoring/oms_brochure_core_questionsfinal24608.pdf
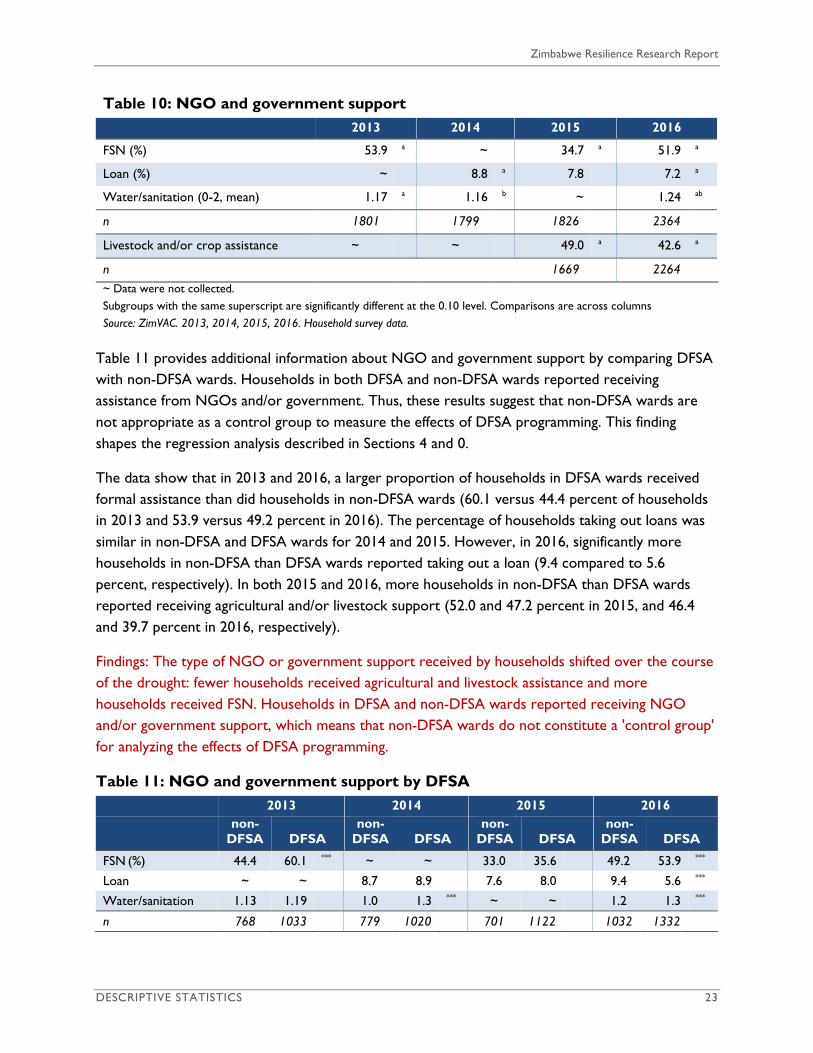
Zimbabwe Resilience Research Report
DESCRIPTIVE STATISTICS 23
Table 10: NGO and government support
2013 2014 2015 2016
FSN (%) 53.9 a ~ 34.7 a 51.9 a
Loan (%) ~ 8.8 a 7.8 7.2 a
Water/sanitation (0-2, mean) 1.17 a 1.16 b ~ 1.24 ab
n 1801 1799 1826 2364
Livestock and/or crop assistance ~ ~ 49.0 a 42.6 a
n 1669 2264
~ Data were not collected.
Subgroups with the same superscript are significantly different at the 0.10 level. Comparisons are across columns
Source: ZimVAC. 2013, 2014, 2015, 2016. Household survey data.
Table 11 provides additional information about NGO and government support by comparing DFSA
with non-DFSA wards. Households in both DFSA and non-DFSA wards reported receiving
assistance from NGOs and/or government. Thus, these results suggest that non-DFSA wards are
not appropriate as a control group to measure the effects of DFSA programming. This finding
shapes the regression analysis described in Sections 4 and 0.
The data show that in 2013 and 2016, a larger proportion of households in DFSA wards received
formal assistance than did households in non-DFSA wards (60.1 versus 44.4 percent of households
in 2013 and 53.9 versus 49.2 percent in 2016). The percentage of households taking out loans was
similar in non-DFSA and DFSA wards for 2014 and 2015. However, in 2016, significantly more
households in non-DFSA than DFSA wards reported taking out a loan (9.4 compared to 5.6
percent, respectively). In both 2015 and 2016, more households in non-DFSA than DFSA wards
reported receiving agricultural and/or livestock support (52.0 and 47.2 percent in 2015, and 46.4
and 39.7 percent in 2016, respectively).
Findings: The type of NGO or government support received by households shifted over the course
of the drought: fewer households received agricultural and livestock assistance and more
households received FSN. Households in DFSA and non-DFSA wards reported receiving NGO
and/or government support, which means that non-DFSA wards do not constitute a 'control group'
for analyzing the effects of DFSA programming.
Table 11: NGO and government support by DFSA
2013 2014 2015 2016
non-
DFSA DFSA
non-
DFSA DFSA
non-
DFSA DFSA
non-
DFSA DFSA
FSN (%) 44.4 60.1 *** ~ ~ 33.0 35.6 49.2 53.9 ***
Loan ~ ~ 8.7 8.9 7.6 8.0 9.4 5.6 ***
Water/sanitation 1.13 1.19 1.0 1.3 *** ~ ~ 1.2 1.3 ***
n 768 1033 779 1020 701 1122 1032 1332

Resilience Evaluation, Analysis and Learning (REAL)
DESCRIPTIVE STATISTICS 24
2013 2014 2015 2016
non-
DFSA DFSA
non-
DFSA DFSA
non-
DFSA DFSA
non-
DFSA DFSA
Livestock and/or
crop assistance ~ ~ ~ ~ 52.0 47.2 *** 46.4 39.7 ***
n 639 1027 991 1273 ~ Data were not collected.
Subgroups with the same superscript are significantly different at the 0.10 level. Comparisons are across columns.
Source: ZimVAC. 2013, 2014, 2015, 2016. Household survey data.
Well-being/development outcomes
Table 12 presents the four well-being development outcomes (2013-2016) and recovery (2016
only). Well-being outcomes are: adequate food consumption, HDDS, per capita daily expenditures,
and moderate to severe hunger. Recovery includes households that experienced crop failure and/or
livestock death.
Adequate food consumption was derived from the food consumption score (FCS), which was
computed following methods developed by WFP.35 It is a weighted count of household
consumption of nine food groups over the seven days prior to a survey. Weights were developed
by WFP and reflect 'nutrient density' so that more nutritious foods, like meat and fish, have the
largest weight (4) and sugar and condiments have the smallest (0.5 and 0). The maximum possible
value is 140 (if a household consumed all food groups every day). The FCS is divided into three
categories: "Poor" corresponds to FCS of 0 to 21; "Borderline" to scores of 22 to 35, and
"Adequate" to scores of 35 and higher. Within the ZimVAC sample, FCS ranged from 0 to 119.
Table 12 shows that the percentage of households reporting adequate food consumption (scores
>= 35) decreased over the course of the drought (i.e., from 2014 to 2016), dropping from 63.9
percent in 2014 to 58.0 percent in 2015, then to 49.4 percent in 2016.
HDDS. Computation of HDDS follows guidelines developed by USAID36 and uses the same survey
questions as the FCS. It is a count of the number of food groups (out of 12) the household
consumed in the seven days prior to a survey. Table 12 shows that households maintained HDDS
through the first year of the drought but not the second. Households may have maintained HDDS,
even though adequate food consumption dropped, by substituting less nutritious foods or eating
nutritious foods less often.
Per capita daily expenditures are computed from households' reported purchases. Note that data
used to compute this measure are different than World Bank Living Standards Measurement Survey
(LSMS) data, (LSMS measures consumption and includes own production as a source) and so cannot
35 World Food Programme, Vulnerability Analysis and Mapping Branch (ODAV). 2008. Food consumption analysis: Calculation and
use of the food consumption score in food security analysis. Rome: WFP. 36 Swindale, Anne, and Paula Bilinsky. 2006. Household Dietary Diversity Score (HDDS) for Measurement of Household Food Access:
Indicator Guide (v.2). Washington, D.C.: FHI 360/FANTA.
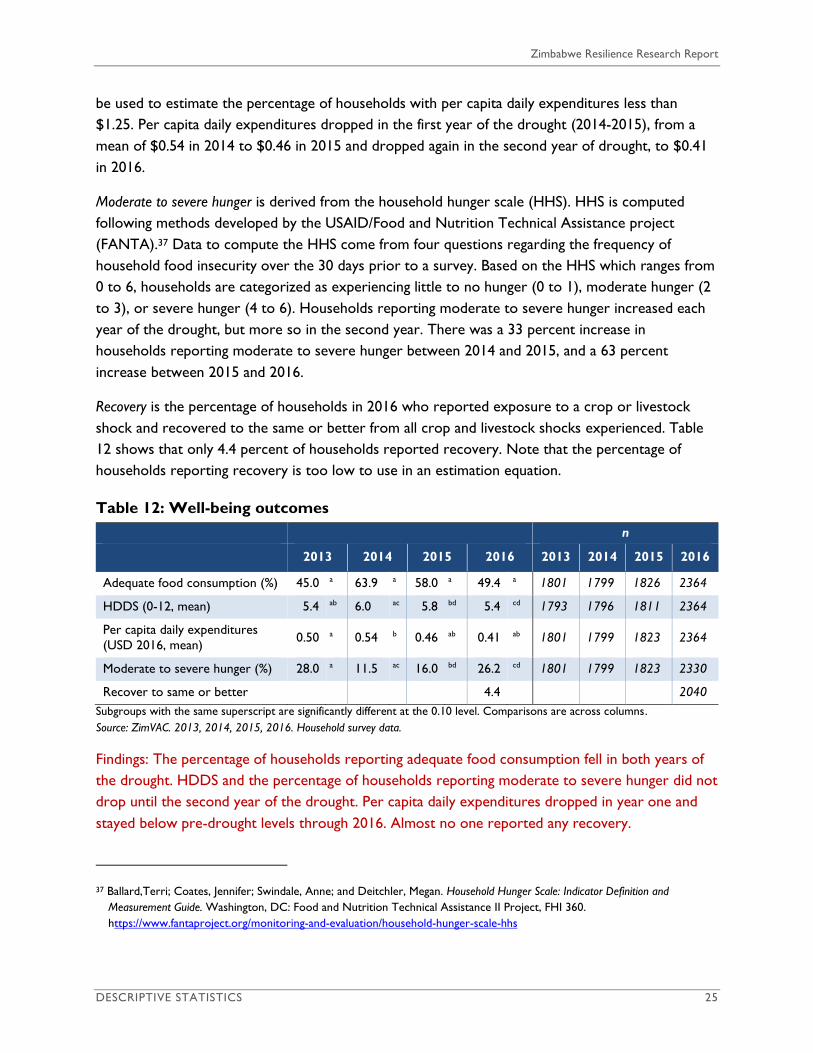
Zimbabwe Resilience Research Report
DESCRIPTIVE STATISTICS 25
be used to estimate the percentage of households with per capita daily expenditures less than
$1.25. Per capita daily expenditures dropped in the first year of the drought (2014-2015), from a
mean of $0.54 in 2014 to $0.46 in 2015 and dropped again in the second year of drought, to $0.41
in 2016.
Moderate to severe hunger is derived from the household hunger scale (HHS). HHS is computed
following methods developed by the USAID/Food and Nutrition Technical Assistance project
(FANTA).37 Data to compute the HHS come from four questions regarding the frequency of
household food insecurity over the 30 days prior to a survey. Based on the HHS which ranges from
0 to 6, households are categorized as experiencing little to no hunger (0 to 1), moderate hunger (2
to 3), or severe hunger (4 to 6). Households reporting moderate to severe hunger increased each
year of the drought, but more so in the second year. There was a 33 percent increase in
households reporting moderate to severe hunger between 2014 and 2015, and a 63 percent
increase between 2015 and 2016.
Recovery is the percentage of households in 2016 who reported exposure to a crop or livestock
shock and recovered to the same or better from all crop and livestock shocks experienced. Table
12 shows that only 4.4 percent of households reported recovery. Note that the percentage of
households reporting recovery is too low to use in an estimation equation.
Table 12: Well-being outcomes
n
2013 2014 2015 2016 2013 2014 2015 2016
Adequate food consumption (%) 45.0 a 63.9 a 58.0 a 49.4 a 1801 1799 1826 2364
HDDS (0-12, mean) 5.4 ab 6.0 ac 5.8 bd 5.4 cd 1793 1796 1811 2364
Per capita daily expenditures
(USD 2016, mean) 0.50 a 0.54 b 0.46 ab 0.41 ab 1801 1799 1823 2364
Moderate to severe hunger (%) 28.0 a 11.5 ac 16.0 bd 26.2 cd 1801 1799 1823 2330
Recover to same or better 4.4 2040
Subgroups with the same superscript are significantly different at the 0.10 level. Comparisons are across columns.
Source: ZimVAC. 2013, 2014, 2015, 2016. Household survey data.
Findings: The percentage of households reporting adequate food consumption fell in both years of
the drought. HDDS and the percentage of households reporting moderate to severe hunger did not
drop until the second year of the drought. Per capita daily expenditures dropped in year one and
stayed below pre-drought levels through 2016. Almost no one reported any recovery.
37 Ballard,Terri; Coates, Jennifer; Swindale, Anne; and Deitchler, Megan. Household Hunger Scale: Indicator Definition and
Measurement Guide. Washington, DC: Food and Nutrition Technical Assistance II Project, FHI 360.
https://www.fantaproject.org/monitoring-and-evaluation/household-hunger-scale-hhs
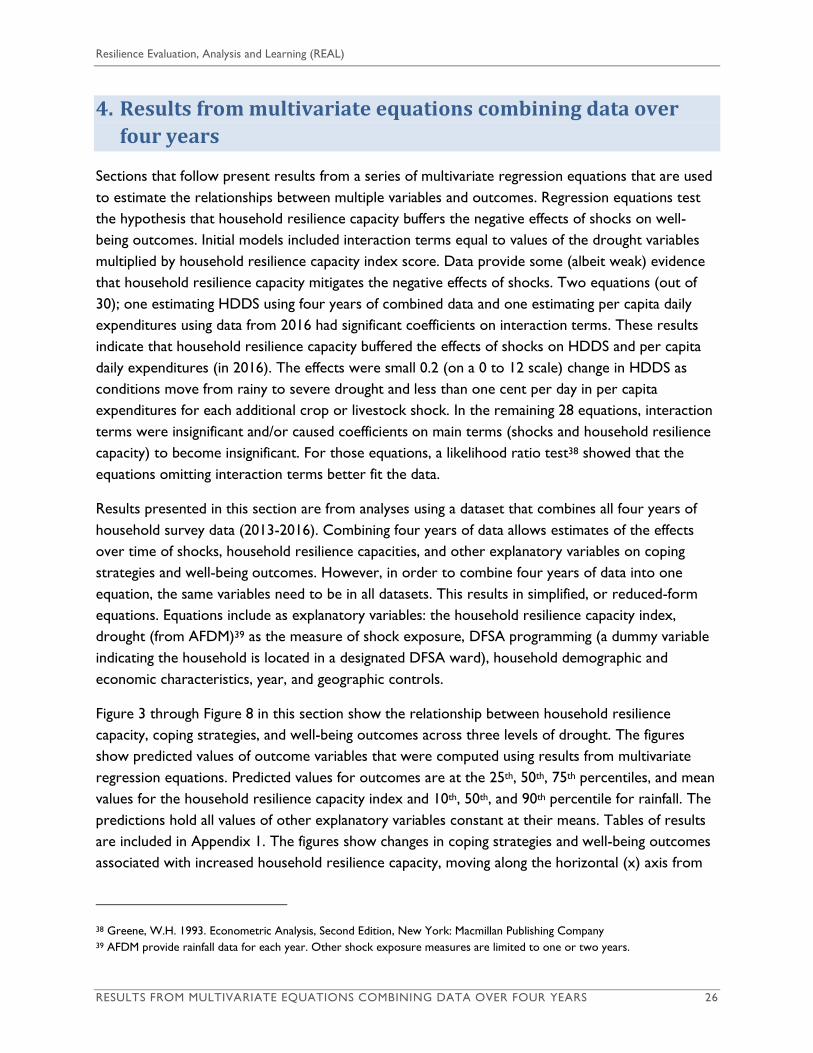
Resilience Evaluation, Analysis and Learning (REAL)
RESULTS FROM MULTIVARIATE EQUATIONS COMBINING DATA OVER FOUR YEARS 26
4. Results from multivariate equations combining data over
four years
Sections that follow present results from a series of multivariate regression equations that are used
to estimate the relationships between multiple variables and outcomes. Regression equations test
the hypothesis that household resilience capacity buffers the negative effects of shocks on well-
being outcomes. Initial models included interaction terms equal to values of the drought variables
multiplied by household resilience capacity index score. Data provide some (albeit weak) evidence
that household resilience capacity mitigates the negative effects of shocks. Two equations (out of
30); one estimating HDDS using four years of combined data and one estimating per capita daily
expenditures using data from 2016 had significant coefficients on interaction terms. These results
indicate that household resilience capacity buffered the effects of shocks on HDDS and per capita
daily expenditures (in 2016). The effects were small 0.2 (on a 0 to 12 scale) change in HDDS as
conditions move from rainy to severe drought and less than one cent per day in per capita
expenditures for each additional crop or livestock shock. In the remaining 28 equations, interaction
terms were insignificant and/or caused coefficients on main terms (shocks and household resilience
capacity) to become insignificant. For those equations, a likelihood ratio test38 showed that the
equations omitting interaction terms better fit the data.
Results presented in this section are from analyses using a dataset that combines all four years of
household survey data (2013-2016). Combining four years of data allows estimates of the effects
over time of shocks, household resilience capacities, and other explanatory variables on coping
strategies and well-being outcomes. However, in order to combine four years of data into one
equation, the same variables need to be in all datasets. This results in simplified, or reduced-form
equations. Equations include as explanatory variables: the household resilience capacity index,
drought (from AFDM)39 as the measure of shock exposure, DFSA programming (a dummy variable
indicating the household is located in a designated DFSA ward), household demographic and
economic characteristics, year, and geographic controls.
Figure 3 through Figure 8 in this section show the relationship between household resilience
capacity, coping strategies, and well-being outcomes across three levels of drought. The figures
show predicted values of outcome variables that were computed using results from multivariate
regression equations. Predicted values for outcomes are at the 25th, 50th, 75th percentiles, and mean
values for the household resilience capacity index and 10th, 50th, and 90th percentile for rainfall. The
predictions hold all values of other explanatory variables constant at their means. Tables of results
are included in Appendix 1. The figures show changes in coping strategies and well-being outcomes
associated with increased household resilience capacity, moving along the horizontal (x) axis from
38 Greene, W.H. 1993. Econometric Analysis, Second Edition, New York: Macmillan Publishing Company 39 AFDM provide rainfall data for each year. Other shock exposure measures are limited to one or two years.

Zimbabwe Resilience Research Report
RESULTS FROM MULTIVARIATE EQUATIONS COMBINING DATA OVER FOUR YEARS 27
household resilience capacity scores at the 25th through the 50th (median) and to the 75th
percentile, as well as the mean. The vertical (y) axis shows three levels of rainfall. The change
associated with increased household resilience capacity is equal to the slope of the line(s). The
estimated impact of drought on coping strategies and well-being outcomes is equal to the y-
intercept. In all equations except per capita daily expenditures, household resilience capacity and
drought both were statistically significant (<0.05). In the equation estimating per capita food
expenditures, household resilience capacity was significant.
Coping strategies 2013-2016
CSI. Figure 3 shows predicted values of CSI across household resilience capacity index scores.
Coefficients from a censored (Tobit) regression equation are used to compute predicted values.
Complete results are in Table 15. Figure 3 compares the relationship between CSI and household
resilience capacity over three levels of drought exposure and shows that CSI scores decreases as
household resilience capacity increases. A decrease in the CSI of about 1.7 is associated with
moving from the 25th to 75th percentile on the household resilience capacity index. As household
resilience capacity increases, households' use of food coping strategies decreases. Shifting from non-
drought to drought conditions increases the CSI by about 17. As drought conditions worsen, use of
food coping strategies increases.
Figure 3: Results from regression equation (Tobit) estimating CSI, 2013-2016
Sources: ZimVAC household surveys 2013, 2014, 2015, 2016; AFDM, 2017.
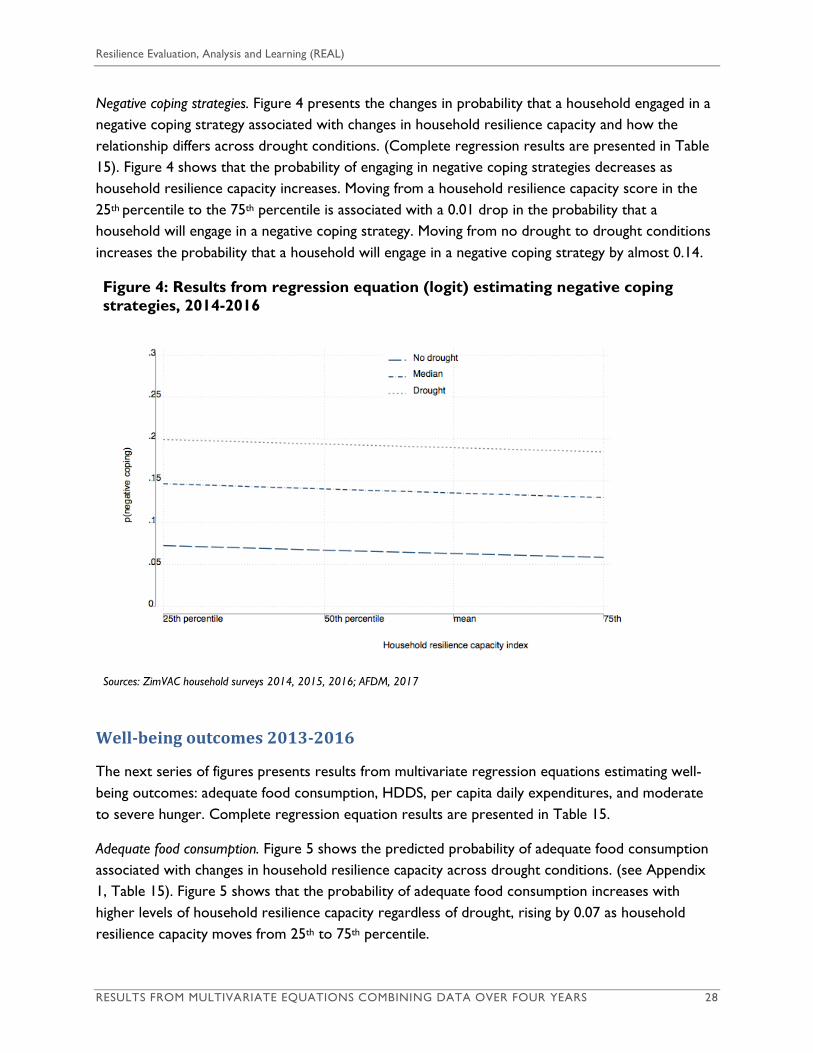
Resilience Evaluation, Analysis and Learning (REAL)
RESULTS FROM MULTIVARIATE EQUATIONS COMBINING DATA OVER FOUR YEARS 28
Negative coping strategies. Figure 4 presents the changes in probability that a household engaged in a
negative coping strategy associated with changes in household resilience capacity and how the
relationship differs across drought conditions. (Complete regression results are presented in Table
15). Figure 4 shows that the probability of engaging in negative coping strategies decreases as
household resilience capacity increases. Moving from a household resilience capacity score in the
25th percentile to the 75th percentile is associated with a 0.01 drop in the probability that a
household will engage in a negative coping strategy. Moving from no drought to drought conditions
increases the probability that a household will engage in a negative coping strategy by almost 0.14.
Figure 4: Results from regression equation (logit) estimating negative coping
strategies, 2014-2016
Sources: ZimVAC household surveys 2014, 2015, 2016; AFDM, 2017
Well-being outcomes 2013-2016
The next series of figures presents results from multivariate regression equations estimating well-
being outcomes: adequate food consumption, HDDS, per capita daily expenditures, and moderate
to severe hunger. Complete regression equation results are presented in Table 15.
Adequate food consumption. Figure 5 shows the predicted probability of adequate food consumption
associated with changes in household resilience capacity across drought conditions. (see Appendix
1, Table 15). Figure 5 shows that the probability of adequate food consumption increases with
higher levels of household resilience capacity regardless of drought, rising by 0.07 as household
resilience capacity moves from 25th to 75th percentile.

Zimbabwe Resilience Research Report
RESULTS FROM MULTIVARIATE EQUATIONS COMBINING DATA OVER FOUR YEARS 29
Figure 5: Results from regression equations estimating adequate food
consumption, 2013-2016
Sources: ZimVAC household surveys 2013, 2014, 2015, 2016; AFDM, 2017
HDDS. Figure 6 shows results from an OLS regression equation estimating the relationship between
HDDS and household resilience capacity across different levels of drought. Complete results are
presented in Table 15 (Appendix 1). For HDDS, the estimation equation showed that household
resilience capacity has a larger effect on households during a drought, helping to mitigate the effects
of drought. Figure 6 shows that HDDS improves by 0.2 as households move from the 25th to 75th
percentile of household resilience capacity during non-drought conditions and by 0.4 during drought
conditions.

Resilience Evaluation, Analysis and Learning (REAL)
RESULTS FROM MULTIVARIATE EQUATIONS COMBINING DATA OVER FOUR YEARS 30
Figure 6: Results from regression equation (OLS) estimating HDDS, 2013-
2016
Non-overlapping CIs (red vertical lines) indicate statistically significant differences (<0.10).
Sources: ZimVAC household surveys 2013, 2014, 2015, 2016; AFDM, 2017
Per capita daily expenditures. Figure 7 shows results from a generalized linear model (GLM)
estimating the relationship between household resilience capacity and per capita daily expenditures.
GLM is the general linear regression model of which OLS is a special case. GLM allows for response
variables that have error distributions other than a standard normal distribution. In this case, the
distribution of per capita daily expenditures is highly skewed (following a log linear rather than a
normal distribution). Accordingly, the estimation equation uses a log transformation. Complete
results are presented in Table 15 (Appendix 1). The data show that as households move from the
25th to 75th percentile in household resilience capacity, per capita daily expenditures increase by
about $0.06. Drought was not statistically significant in the estimation equation so is not displayed
in the figure.

Zimbabwe Resilience Research Report
RESULTS FROM MULTIVARIATE EQUATIONS COMBINING DATA OVER FOUR YEARS 31
Figure 7: Results from regression equation (GLM) estimating per capita daily
expenditures (USD 2016), 2013-2016
Sources: ZimVAC household surveys 2013, 2014, 2015, 2016; AFDM, 2017
Moderate to severe hunger. Figure 8 shows results from a regression equation (logit) estimating the
relationship between household resilience capacity and the probability that a household
experienced moderate or severe hunger. Complete results are presented in Table 15 (Appendix 1).
Figure 8 shows that as household resilience capacity increases from the 25th to 75th percentile, the
probability of moderate to severe hunger drops by 0.04. Moving from non-drought to drought
conditions increases the probability of moderate to severe hunger by about 0.14.
Resilience Evaluation, Analysis and Learning (REAL)
RESULTS FROM MULTIVARIATE EQUATIONS COMBINING DATA OVER FOUR YEARS 32
Figure 8: Results from a regression equation (logit) estimating moderate to
severe hunger, 2013-2016
Sources: ZimVAC household surveys 2013, 2014, 2015, 2016; AFDM, 2017
Findings: Higher levels of household resilience capacity are associated with better well-being
outcomes. For HDDS, household resilience capacity mitigates the effects of drought.
DFSAs and CSI
This section presents additional findings from analysis of the combined dataset (2013-2016)
(complete results are presented in Table 13). The four-year analysis does not have detailed
information on programming, so DFSA and non-DFSA dummy variables provide proxies for the
mix of respective programming. The figure shows that during the baseline (2013 and 2014) CSI
scores were higher (worse) for households in DFSA than in non-DFSA wards. This supports
DFSAs targeting households in poorer wards. In 2015, compared to 2014 (i.e., during the first
year of the drought), CSI scores increased significantly (worsened) in non-DFSA wards but
were not significantly different in DFSA wards (Figure 12). In 2016 CSI scores dropped from
2015 levels for households in both DFSA and non-DFSA wards, but were lower in DFSA than
non-DFSA wards, a switch from prior to programming. Over the four years CSI scores for
households in DFSA wards dropped by more than one-half. Descriptive data in Table 11 help to
interpret this finding. Increased access to FSN and improved water and sanitation in DFSA
wards may have contributed to lower CSI. In turn, other equations (Table 15) show that CSI is

Zimbabwe Resilience Research Report
RESULTS FROM MULTIVARIATE EQUATIONS COMBINING DATA OVER FOUR YEARS 33
a key determinate of adequate food consumption, HDDS, and per capita daily expenditures.
DFSA programming may be working indirectly on well-being outcomes by reducing CSI40.
Because multiple pair-wise comparisons are possible, Figure 12 includes vertical lines to show
90% confidence intervals (CIs) around estimates. The length of the vertical line (CI) shows the
range of the estimate. Shorter lines mean more precise estimates and narrower ranges. Longer
lines mean less precise estimates and wider ranges. Comparing across years and between DFSA
and non-DFSA wards; overlapping CIs mean the ranges overlap and there are no meaningfully
significant differences. Non-overlapping CIs show meaningfully significant differences (0.10).
Figure 9: Results from equation estimating CSI (Tobit), by DFSA and non-DFSA
wards
40 Note that CSI is not used in equations estimating the probability of moderate to severe hunger because questions for both
indictors are very similar.

Resilience Evaluation, Analysis and Learning (REAL)
RESULTS FROM EQUATIONS FOR 2013, 2014, 2015, AND 2016 34
5. Results from equations for 2013, 2014, 2015, and 2016
This section presents results from regression equations estimating coping strategies (CSI and
negative coping) and well-being outcomes (adequate food consumption, HDDS, per capita daily
expenditures, and moderate to severe hunger) separately for 2013, 2014, 2015, and 2016. Analysis
of datasets one year at a time provides additional information about shocks and household
resilience capacity. Year by year analysis provides more detailed information about factors
associated with coping strategies and well-being outcomes than are reported in the previous
section. Equations underlying results reported in this section include survey-specific measures of
shocks and NGO/government support, such as prices (2013, 2014, 2015), self-reported shocks
(2016), and crop and livestock assistance (2015 and 2016). These are in addition to the household
resilience capacity index, household demographic and economic characteristics, and geographic
control variables.
Price shocks
Price data are included in estimation equations for 2013, 2014, and 2015. Results (Table 16 through
Table 21) indicate that price shocks have negative impacts on household coping strategies and well-
being outcomes. Data from 2014 show that this is the case even in the absence of drought. Prices
may be picking up other information, such as access to markets, services, and infrastructure,
however they may also be an area where the government can assist by modifying pricing policies.
Overall, across coping strategies (CSI and negative coping) and well-being outcomes in each of the
four years (Table 16 to Table 23), analyses showed that increases in household resilience capacity
were associated with improvements in coping strategies and well-being outcomes. Exceptions were
per-capita income in 2013, and negative coping in 2014 and 2015.
Analyses using data from 2016 showed that household resilience capacity mitigates the effects of
crop and livestock shocks on per capita daily expenditures. Predicted values from the equation are
presented in Figure 10. The figure shows that as households move from the 25th percentile to the
75th percentile of household resilience capacity, per capita daily expenditures increase but the rate
of increase varies across shocks (slopes of the lines are different). For households who report no
shocks, per capita daily expenditures increase by $0.03 as households move from the 25th to 75th
percentile. For households reporting four shocks, per capita daily expenditures increase by by $0.07
as they move from the 25th to 75th percentile. The difference is just under $0.01 per shock. This
shows that as shock exposure increases, household resilience capacity mitigates the negative
impacts on per capita daily expenditures.
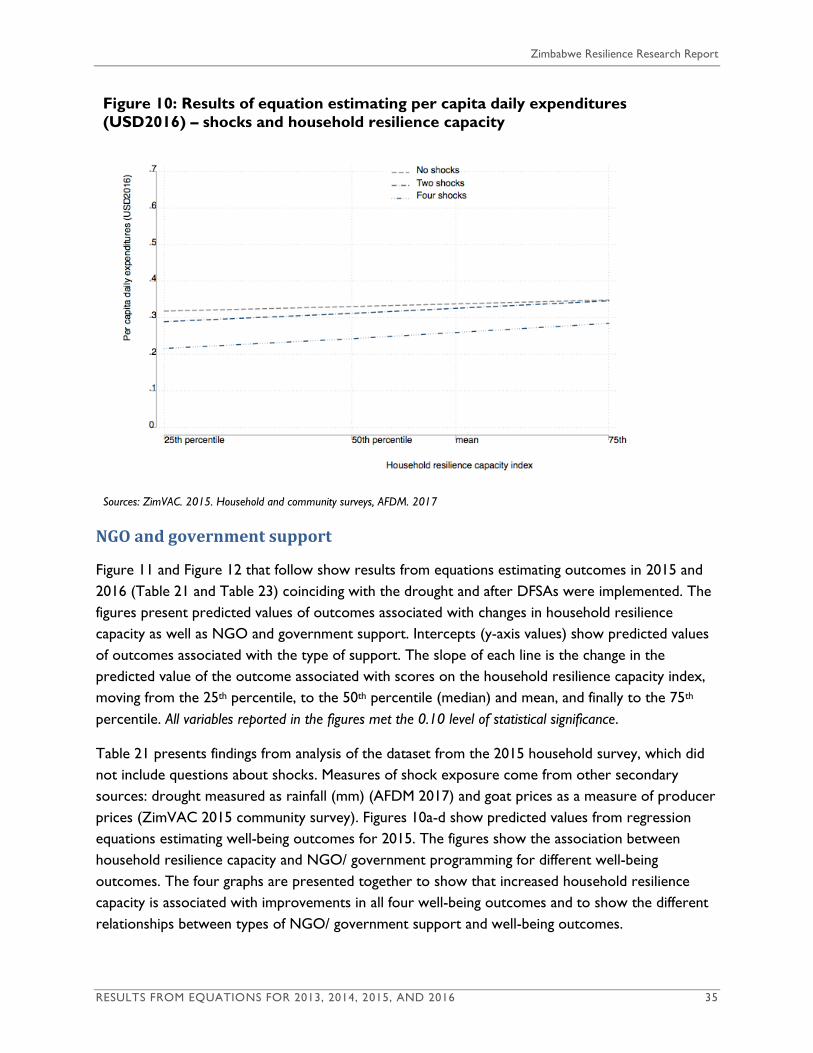
Zimbabwe Resilience Research Report
RESULTS FROM EQUATIONS FOR 2013, 2014, 2015, AND 2016 35
Figure 10: Results of equation estimating per capita daily expenditures
(USD2016) – shocks and household resilience capacity
Sources: ZimVAC. 2015. Household and community surveys, AFDM. 2017
NGO and government support
Figure 11 and Figure 12 that follow show results from equations estimating outcomes in 2015 and
2016 (Table 21 and Table 23) coinciding with the drought and after DFSAs were implemented. The
figures present predicted values of outcomes associated with changes in household resilience
capacity as well as NGO and government support. Intercepts (y-axis values) show predicted values
of outcomes associated with the type of support. The slope of each line is the change in the
predicted value of the outcome associated with scores on the household resilience capacity index,
moving from the 25th percentile, to the 50th percentile (median) and mean, and finally to the 75th
percentile. All variables reported in the figures met the 0.10 level of statistical significance.
Table 21 presents findings from analysis of the dataset from the 2015 household survey, which did
not include questions about shocks. Measures of shock exposure come from other secondary
sources: drought measured as rainfall (mm) (AFDM 2017) and goat prices as a measure of producer
prices (ZimVAC 2015 community survey). Figures 10a-d show predicted values from regression
equations estimating well-being outcomes for 2015. The figures show the association between
household resilience capacity and NGO/ government programming for different well-being
outcomes. The four graphs are presented together to show that increased household resilience
capacity is associated with improvements in all four well-being outcomes and to show the different
relationships between types of NGO/ government support and well-being outcomes.
Resilience Evaluation, Analysis and Learning (REAL)
RESULTS FROM EQUATIONS FOR 2013, 2014, 2015, AND 2016 36
Adequate food consumption. Figure 10a shows that higher levels of household resilience capacity are
associated with increased probability of adequate food consumption. Moving from the 25th to 75th
percentile on the household resilience capacity index increases the probability of adequate food
consumption by 0.11. Variables measuring NGO and government support did not meet the 0.10 cut
off for inclusion in the figure, suggesting different types of NGO or government support (as they
are measured in the survey) did not have any effect on adequate food consumption.
HDDS. Figure 11b shows that as household resilience capacity increases (e.g., moving from the 25th
to 75th percentile on the household resilience capacity index), HDDS increases by 0.2. Figure 10b
also shows that for any given level of household resilience capacity, households who receive both
FSN and agricultural and/or livestock assistance have higher HDDS. HDDS is 0.44 higher for
households who received agricultural and/or livestock assistance than household that did not
receive agricultural and/or livestock support, and 0.24 higher for households who received FSN
compared to those that did not. Households that received both types of support had an estimated
increase of almost 0.7 in HDDS compared to households receiving neither.
Per capita daily expenditures (USD 2016). Figure 10c shows that household resilience capacity is
associated with higher per capita daily expenditures, such that moving from the 25th to 75th
percentile is associated with an increase of $0.04. Households receiving agricultural and/or livestock
assistance show an estimated increase of about $0.19 in per capita daily expenditures. Per capita
daily expenditures of households receiving loans were $0.06 higher than households without loans.
Combining agricultural and livestock assistance and loans nearly doubled per capita daily
expenditures of households, increasing them by $0.25 compared to households receiving neither.
Moderate to severe hunger. Figure 10d shows that higher levels of household resilience capacity are
associated with lower probability of moderate to severe hunger. As households increase their
resilience capacity (i.e., moving from the 25th to 75th percentile on the household resilience capacity
index), there is an associated 0.01 reduction in the probability that a household will experience
moderate to severe hunger.

Zimbabwe Resilience Research Report
RESULTS FROM EQUATIONS FOR 2013, 2014, 2015 AND 2016 39
Figure 11: Results from equations measuring well-being outcomes, 2015
Figure 11a: Adequate food consumption (logit),
2015
Figure 11b: HDDS (OLS), 2015
Sources: ZimVAC. 2015. Household and community surveys,
AFDM. 2017
Sources: ZimVAC. 2015. Household and community surveys,
AFDM. 2017
Figure 11c: Per capita daily expenditures (GLM),
2015
Figure 11d: Moderate to severe hunger (logit),
2015
Sources: ZimVAC. 2015. Household and community surveys,
AFDM. 2017
Sources: ZimVAC. 2015. Household and community surveys,
AFDM. 2017
.

Resilience Evaluation, Analysis and Learning (REAL)
RESULTS FROM EQUATIONS FOR 2013, 2014, 2015, AND 2016 38
Figure 12 presents estimates of the relationship between household resilience capacity and
NGO/government support for the four well-being outcomes in 2016. Complete results are
presented in Table 23. The ZimVAC 2016 household survey included a shock exposure module
that provided the self-reported measures of shock exposure used in the equation. The measure is a
count of exposure to crop and/or livestock shocks ranging from 0 to 4 (Table 4) Rainfall (mm)
(AFDM) is the other shock variable. As with Figure 11, all results met the 0.10 level of statistical
significance.
Adequate food consumption. Figure 12a shows that higher levels of household resilience capacity are
associated with increased probability that a household has adequate food consumption. Moving
from the 25th to 75th percentile of household resilience capacity provides households with an
associated increase of 0.08 in the probability of adequate food consumption. Agricultural and/or
livestock assistance and FSN are both associated with increased probabilities of adequate food
consumption; agricultural and/or livestock assistance is associated with a 0.06 increase and FSN with
a 0.07 increase. Households receiving both are estimated to have an increase of 0.13 in the
probability of adequate food consumption, compared to households with neither.
HDDS. Figure 12b shows that as household resilience capacity moves from the 25th to 75th
percentile, HDDS increases by 0.2. Agriculture and/or livestock assistance is associated with an
increase of 0.2. HDDS scores for households with improved water and improved sanitation is 0.4
higher than for households with neither. The water and sanitation variable may be picking up effects
of access to other services (unmeasured in the survey), as households with improved water and
sanitation often have improved access to other infrastructure and services.
Per capita daily expenditures (USD 2016). Figure 12c shows that higher levels of household resilience
capacity are associated with higher per capita daily expenditures. Moving from the 25th to 75th
percentile on the household resilience capacity index increases per capita daily expenditures by
about $0.06. Agricultural and/or livestock assistance is associated with a $0.10 increase, loans with a
$0.03 increase. Per capita daily expenditure for households receiving loans and agricultural/livestock
assistance are estimated to be about $0.13 higher than households receiving neither.
Moderate to severe hunger. Figure 12d shows that increased household resilience capacity reduces
the probability that a household will experience moderate to severe hunger. As a household moves
from the 25th to 75th percentile in the household resilience capacity index, the probability of the
household experiencing moderate to severe hunger is reduced by 0.06. As in the analysis using 2015
data, agricultural and/or livestock assistance is associated with a 0.05 decrease in the probability of
household hunger.

Zimbabwe Resilience Research Report
RESULTS FROM EQUATIONS FOR 2013, 2014, 2015, AND 2016 39
Figure 12: Results from equations estimating well-being outcomes, 2016
Figure 12a: Adequate food consumption, 2016 Figure12b: HDDS, 2016
Sources: ZimVAC. 2016. Household survey, AFDM. 2017 Sources: ZimVAC. 2016. Household survey, AFDM. 2017
Figure12c: Per capita daily expenditures, 2016 Figure12d: Moderate to severe hunger, 2016
Sources: ZimVAC. 2016. Household survey, AFDM. 2017 Sources: ZimVAC. 2016. Household survey, AFDM. 2017

Resilience Evaluation, Analysis and Learning (REAL)
RESULTS FROM EQUATIONS FOR 2013, 2014, 2015, AND 2016 40
Of the programming variables, agriculture and livestock assistance was associated with improved
HDDS and higher per capita daily expenditures in both 2015 and 2016 and higher probability of
adequate food consumption in 2016, but paradoxically with increases in the probability of moderate
to severe hunger in both years. This seeming inconsistency could be measuring volatility in food
security conditions and imprecise measurement of programming. The agricultural and livestock
assistance measure covers the 2015-2016 agricultural season. Households reporting that they
received agriculture and livestock assistance may have received other programming (not measured
in the survey) as well. Household hunger covers the 30 days prior to a survey, whereas HDDS only
reflects seven days prior to a survey. Poorer households (more likely to experience moderate to
severe hunger) may have been targeted for support, then received support, in which case it might
be expected they would see improved food security after participating.
Elasticities
Figures in Appendix 3 present elasticities to compare the magnitude of change in dependent
variables for a one percent increase in explanatory variables. The figures show that in all four years,
a one percent increase in household resilience capacity was associated with increases in FCS and
HDDS of about 0.1 percent, increases in per capita daily expenditures of 0.2 percent, and decreases
of 0.1 percent in the probability that a household will experience moderate to severe hunger.
Findings from both the 2015 and 2016 show that agriculture and/or livestock assistance is
associated with improvements in adequate food consumption, HDDS, and per capita daily
expenditures, but has a negative association with moderate to severe hunger. This may be due to a
combination of programs targeting the poorest households, as well as the differences in survey
recall period for each outcome. Loan programs were associated with increased per capita
expenditures in both years. FSN was associated with higher HDDS and lower probability of
moderate to severe hunger in 2015 and with adequate food consumption in 2016.

Zimbabwe Resilience Research Report
SUMMARY 41
6. Summary
This study documents the detrimental effects of prolonged drought in four provinces of Zimbabwe.
The data cover 2013-2016: two years prior to the onset of the drought and two years during the
drought. Development Food Security Activities were implemented beginning in late 2014, after the
drought had already started. DFSA documents show – and household survey data corroborate – an
expansion in programming to include emergency activities as the drought progressed.
Households were able to maintain some assets through one year of drought but by the second
year, all assets were lower than – or at – pre-drought levels. CSI increased (worsened) in year one
of the drought but improved in year two. This is likely due to increased food, cash, and voucher
programs during the drought. Analysis of negative coping strategies shows that households deplete
savings and household assets first, then move to more negative strategies that can have longer-term
consequences (e.g., removing children from school).
Estimation equations provide some evidence that household resilience capacity mitigates the
negative impacts of shocks. Household resilience capacity increases HDDS by 0.2 (on a scale of 0-
12) as rainfall levels move from rainy to drought. Estimation equations for 2016 show that
household resilience capacity mitigates the negative impacts of crop and livestock shocks on per
capita daily expenditures. However, the effect is small. As the number of crop and livestock shocks
increases, household resilience capacity increases per capita daily expenditures by an additional
$0.01 per shock.
Even though programming was provided to households in both DFSA and non-DFSA wards, analysis
of the combined dataset (2013-2016) shows higher levels of improvement in CSI for households in
DFSA wards, indicating that the mix of programming in DFSA wards has lessened reliance on food
coping strategies.
Because the datasets are repeated cross-sections (independent samples) rather than a panel of the
same households over time, it is difficult to test whether programming in one time period increased
household resilience capacity and improved outcomes in later time periods. Additionally, data
indicate that in each cross-section (survey year) NGO and government programming have a
statistically significant relationship in both household resilience capacity (and its elements) and
outcomes. Because of this, it was not possible to estimate a simultaneous equation (two-stage) to
estimate the relationship between programming and resilience capacity (stage one), then between
resilience capacity and outcomes (stage two).
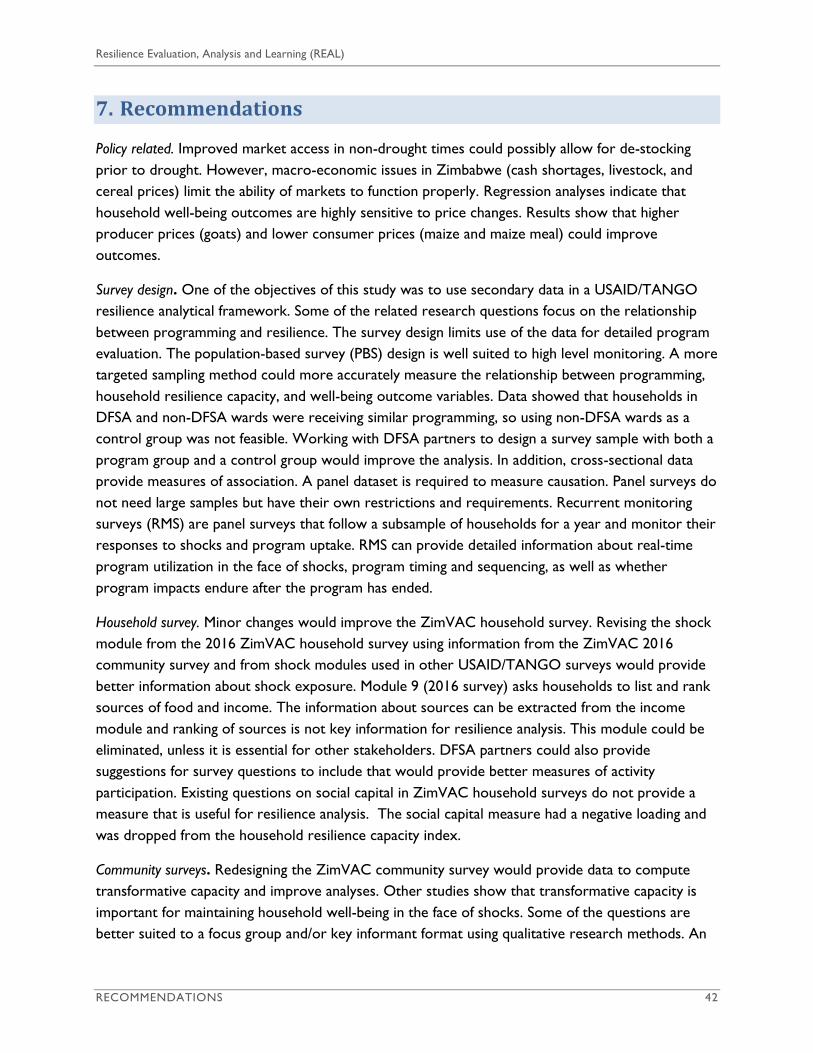
Resilience Evaluation, Analysis and Learning (REAL)
RECOMMENDATIONS 42
7. Recommendations
Policy related. Improved market access in non-drought times could possibly allow for de-stocking
prior to drought. However, macro-economic issues in Zimbabwe (cash shortages, livestock, and
cereal prices) limit the ability of markets to function properly. Regression analyses indicate that
household well-being outcomes are highly sensitive to price changes. Results show that higher
producer prices (goats) and lower consumer prices (maize and maize meal) could improve
outcomes.
Survey design. One of the objectives of this study was to use secondary data in a USAID/TANGO
resilience analytical framework. Some of the related research questions focus on the relationship
between programming and resilience. The survey design limits use of the data for detailed program
evaluation. The population-based survey (PBS) design is well suited to high level monitoring. A more
targeted sampling method could more accurately measure the relationship between programming,
household resilience capacity, and well-being outcome variables. Data showed that households in
DFSA and non-DFSA wards were receiving similar programming, so using non-DFSA wards as a
control group was not feasible. Working with DFSA partners to design a survey sample with both a
program group and a control group would improve the analysis. In addition, cross-sectional data
provide measures of association. A panel dataset is required to measure causation. Panel surveys do
not need large samples but have their own restrictions and requirements. Recurrent monitoring
surveys (RMS) are panel surveys that follow a subsample of households for a year and monitor their
responses to shocks and program uptake. RMS can provide detailed information about real-time
program utilization in the face of shocks, program timing and sequencing, as well as whether
program impacts endure after the program has ended.
Household survey. Minor changes would improve the ZimVAC household survey. Revising the shock
module from the 2016 ZimVAC household survey using information from the ZimVAC 2016
community survey and from shock modules used in other USAID/TANGO surveys would provide
better information about shock exposure. Module 9 (2016 survey) asks households to list and rank
sources of food and income. The information about sources can be extracted from the income
module and ranking of sources is not key information for resilience analysis. This module could be
eliminated, unless it is essential for other stakeholders. DFSA partners could also provide
suggestions for survey questions to include that would provide better measures of activity
participation. Existing questions on social capital in ZimVAC household surveys do not provide a
measure that is useful for resilience analysis. The social capital measure had a negative loading and
was dropped from the household resilience capacity index.
Community surveys. Redesigning the ZimVAC community survey would provide data to compute
transformative capacity and improve analyses. Other studies show that transformative capacity is
important for maintaining household well-being in the face of shocks. Some of the questions are
better suited to a focus group and/or key informant format using qualitative research methods. An

Zimbabwe Resilience Research Report
RECOMMENDATIONS 43
example is responses from community representatives about challenges, issues and constraints
related to livelihoods, inputs, markets, irrigation, and trade. Representatives could be interviewed as
a group using topical outlines and qualitative reporting methods. As they are currently collected
(using CSPro), data are stored as text fields, generating more than 55,000 different data points. (The
2015 community survey collects data from 880 communities and has 64 fields for information). Even
though the topics vary (livelihoods, inputs, markets, irrigation and trade), responses are similar
across topics and could be consolidated. Community data do provide information for updating the
household shocks and stresses module in the household survey. In 2015, community respondents
noted livestock and crop diseases and pests, wildlife destroying livestock, wildlife and livestock
destroying crops, veld fires, lack of inputs, high prices of inputs, late delivery of inputs as stressors.
These are in addition to shocks already included in the 2016 household survey. The community
survey also provides information about programming-related needs: inputs, market access,
veterinary care, draught power (tractor rental), and borehole repair. Finally, it provides information
about other issues that helps to understand how households are faring. These include difficulties
with border crossings into South Africa, encounters with police, non-payment by the Grain
Management Board (GMB), devaluation of the rand, and a severe cash shortage.
Price data were useful for this study. For the purpose of this study, data on all commodities are not
necessary. Also, data are incomplete across all commodities. However, complete information on
key consumer commodities and key producer commodities would be sufficient. If data collected by
WFP or other market surveys are representative, ZimVAC could use those data, saving on data
collection costs.

Resilience Evaluation, Analysis and Learning (REAL)
APPENDIX A: REGRESSION EQUATIONS FOUR YEARS COMBINED 44
Appendix A: Regression equations – four years combined
Table 13: Results from regression equation (Tobit) estimating CSI, 2013-2016
CSI
Household resilience capacity -0.318***
Rainfall (mm) -0.320***
DFSA Ward 7.922***
Survey year/2013
2014 -5.459**
2015 2.972
2016 -11.474***
Interaction DFSA ward & year/ DFSA 2013
DFSA 2014 -0.96
DFSA 2015 -13.549***
DFSA 2016 -16.119***
Household characteristics
Household size 1.305***
Gendered household type/male and female adults
Female headed, no adult males 0.463
Child headed, no adults 6.187
Male headed, no adult females -1.641
Education hh head -0.456
Age hh head -0.806*
Livelihood risk profile/No regular livelihoods
Climate -1.518
Econ-Salary -16.184***
Econ-Wages and trade 0.501
Climate-econ 1.145
Mining 4.17
Wealth tercile/Lowest tercile
Middle tercile -6.027***
Highest tercile -12.580***
Province/Manicaland
Matabeleland North 0.412
Matabeleland South -7.128***
Masvingo 6.716***
Constant 40.321***
sigma 35.748***
Observations 7643
Log likelihood -29799.347 a1986 left-censored observations at CSI=0
Sources: ZimVAC household surveys, 2013-2016
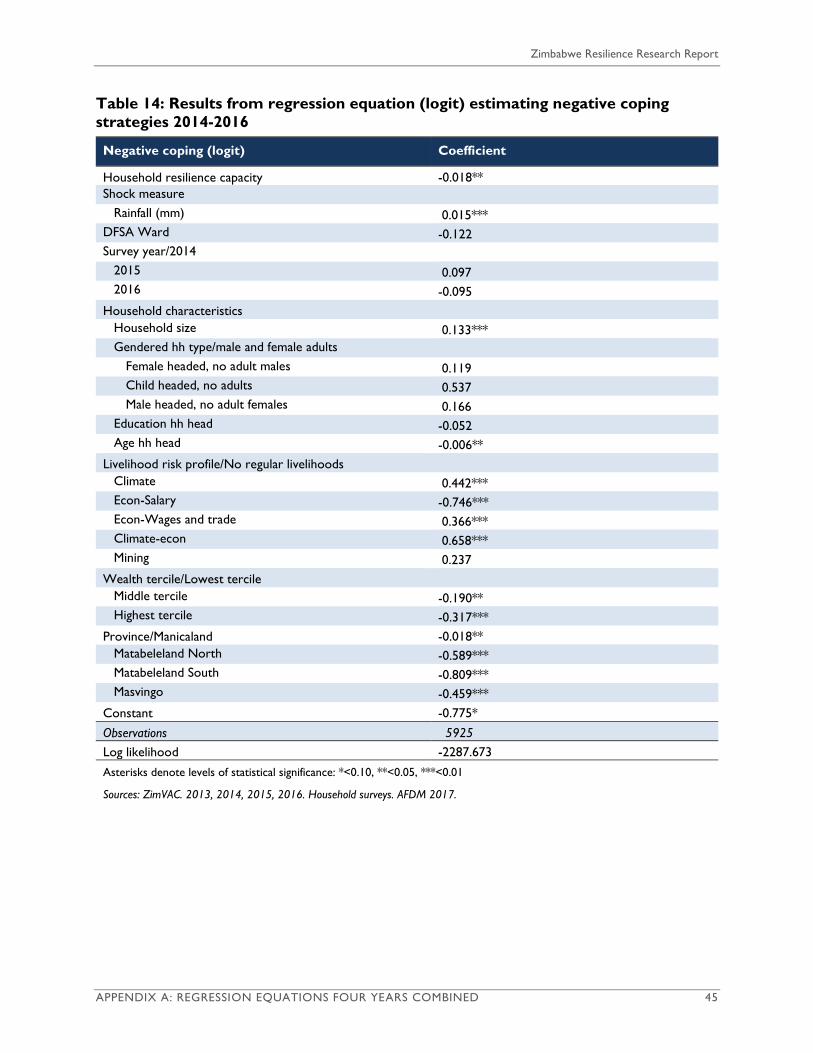
Zimbabwe Resilience Research Report
APPENDIX A: REGRESSION EQUATIONS FOUR YEARS COMBINED 45
Table 14: Results from regression equation (logit) estimating negative coping
strategies 2014-2016
Negative coping (logit) Coefficient
Household resilience capacity -0.018**
Shock measure
Rainfall (mm) 0.015***
DFSA Ward -0.122
Survey year/2014
2015 0.097
2016 -0.095
Household characteristics
Household size 0.133***
Gendered hh type/male and female adults
Female headed, no adult males 0.119
Child headed, no adults 0.537
Male headed, no adult females 0.166
Education hh head -0.052
Age hh head -0.006**
Livelihood risk profile/No regular livelihoods
Climate 0.442***
Econ-Salary -0.746***
Econ-Wages and trade 0.366***
Climate-econ 0.658***
Mining 0.237
Wealth tercile/Lowest tercile
Middle tercile -0.190**
Highest tercile -0.317***
Province/Manicaland -0.018**
Matabeleland North -0.589***
Matabeleland South -0.809***
Masvingo -0.459***
Constant -0.775*
Observations 5925
Log likelihood -2287.673
Asterisks denote levels of statistical significance: *<0.10, **<0.05, ***<0.01
Sources: ZimVAC. 2013, 2014, 2015, 2016. Household surveys. AFDM 2017.

Resilience Evaluation, Analysis and Learning (REAL)
APPENDIX A: REGRESSION EQUATIONS FOUR YEARS COMBINED 46
Table 15: Results from regression equations estimating well-being outcomes over four years Adequate food
consumption (logit) HDDS (OLS) Per capita daily
expenditures (USD2016) (GLM)
Moderate to severe hunger (logit)
Household resilience capacity Drought - rainfall in past 6 mo. (mm) HH resilience capacity * drought DFSA wards Survey year/2013
2014 2015 2016
CSI Household characteristics
Household size Gendered household type/male and female adults
Female headed, no adult males Child headed, no adults Male headed, no adult females
Education hh head Age hh head
Livelihood risk profile/No regular livelihoods Climate Econ-Salary Econ-Wages and trade Climate-econ Mining
Wealth tercile/Lowest tercile Middle tercile Highest tercile
Province/Manicaland Matabeleland North Matabeleland South Masvingo
Constant
0.039*** -0.009***
-0.192***
-0.203* 0.343*** -0.065 -0.013***
-0.050***
-0.139** -0.167 -0.038 0.137*** 0.004**
0.260*** 0.313** 0.046 0.164** 0.420
0.561*** 0.875***
0.054 0.513*** 0.550*** -1.398***
0.055*** -0.024*** 0.000*** -0.146***
-0.730*** 0.063 -0.128** -0.010***
-0.056***
-0.047 -0.105 -0.151 0.109*** 0.002
0.227*** 0.427*** 0.008 0.208*** -0.058
0.449*** 0.750***
0.118 0.779*** 0.540*** 3.609***
0.020*** -0.001
-0.053
-0.402*** -0.139 -0.306*** -0.003***
-0.198***
-0.020 0.094 0.109 0.142*** 0.000
0.205*** 0.436*** 0.156*** 0.260*** -0.236
0.291*** 0.395***
-0.071 0.298*** -0.001 -0.595***
-0.034*** 0.012***
-0.032
-0.217 -0.464*** 0.036
0.087***
-0.033 -0.058 0.033 -0.103*** 0.003
0.204** -0.556*** 0.118 0.162* 0.089
-0.638*** -0.949***
0.368*** 0.017 -0.185** -0.275
Observations 7643 7620 7643 7672 r2 Log likelihood
-4668.648 0.204 -14730.346
-5289.874
-3588.712 Asterisks denote levels of statistical significance: *<0.10, **<0.05, ***<0.01Sources: ZimVAC. 2013, 2014, 2015, 2016. Household surveys. AFDM 2017.
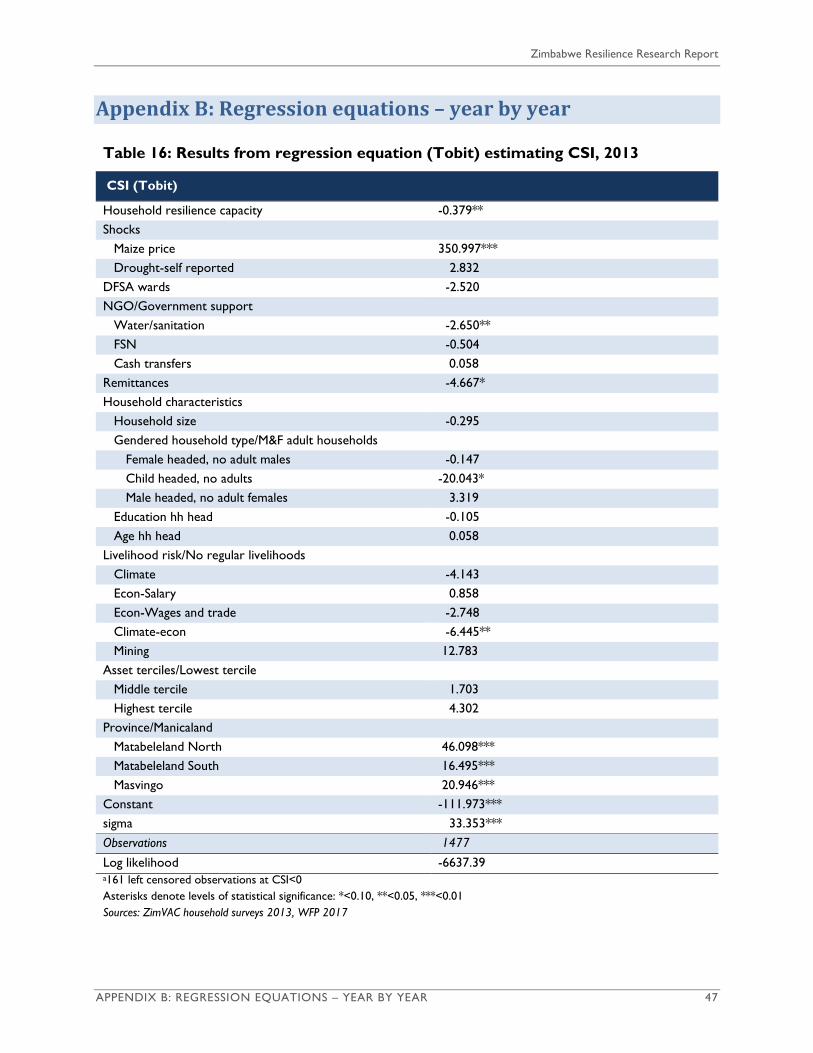
Zimbabwe Resilience Research Report
APPENDIX B: REGRESSION EQUATIONS – YEAR BY YEAR 47
Appendix B: Regression equations – year by year
Table 16: Results from regression equation (Tobit) estimating CSI, 2013
CSI (Tobit)
Household resilience capacity -0.379**
Shocks
Maize price 350.997***
Drought-self reported 2.832
DFSA wards -2.520
NGO/Government support
Water/sanitation -2.650**
FSN -0.504
Cash transfers 0.058
Remittances -4.667*
Household characteristics
Household size -0.295
Gendered household type/M&F adult households
Female headed, no adult males -0.147
Child headed, no adults -20.043*
Male headed, no adult females 3.319
Education hh head -0.105
Age hh head 0.058
Livelihood risk/No regular livelihoods
Climate -4.143
Econ-Salary 0.858
Econ-Wages and trade -2.748
Climate-econ -6.445**
Mining 12.783
Asset terciles/Lowest tercile
Middle tercile 1.703
Highest tercile 4.302
Province/Manicaland
Matabeleland North 46.098***
Matabeleland South 16.495***
Masvingo 20.946***
Constant -111.973***
sigma 33.353***
Observations 1477
Log likelihood -6637.39 a161 left censored observations at CSI<0
Asterisks denote levels of statistical significance: *<0.10, **<0.05, ***<0.01
Sources: ZimVAC household surveys 2013, WFP 2017

Resilience Evaluation, Analysis and Learning (REAL)
APPENDIX B: REGRESSION EQUATIONS – YEAR BY YEAR 48
Table 17: Results from regression equations estimating well-being outcomes, 2013
p(Adequate
food
consumption)
(logit)
HDDS (OLS)
Per capita
daily
expenditures
(USD2016)
GLM)
p(Moderate to
severe
hunger)
(Logit)
Household resilience capacity 0.057*** 0.059*** 0.013 -0.068***
Shocks
Maize price -13.454** -13.266*** 1.395 10.141*
Drought-self reported -0.006*** -0.005*** 0 0.004***
DFSA wards -0.436*** -0.136 -0.254*** 0.305**
NGO/Government support 0 0 0 0
Water/sanitation 0.009 0.047 0.072 -0.043
Formal safety nets 0.193 0.092 -0.019 0.019
Transfer -0.39 -0.856*** -0.097 0.787***
Remittances 0.478*** 0.597*** 0.136 -0.06
Coping strategies
CSI -0.003* -0.003** -0.003
Household characteristics
Household size -0.025 -0.025 -0.222*** 0.103***
Female headed, no adult males -0.207 -0.019 0.093 0.191
Child headed, no adults -0.549 -0.356 -0.331 -0.925
Male headed, no adult females 0.033 -0.261 0.328 -0.124
Education hh head 0.044 0.055 0.319*** -0.026
Age hh head -0.002 -0.003 0.003 0.004
Livelihood risk/No regular
livelihoods 0 0 0 0
Climate 0.330* 0.522*** 0.451** -0.231
Econ-Salary 0.679* 0.222 1.010*** -0.321
Econ-Wages and trade -0.051 -0.039 0.592** -0.02
Climate-econ 0.059 0.216 0.578*** 0.096
Mining -0.617 -0.08 0.510** 0.492
Asset terciles/Lowest tercile 0 0 0 0
Middle tercile 0.539*** 0.416*** 0.427** -0.680***
Highest tercile 0.493** 0.441*** 0.435* -0.636**
Province/Manicaland 0 0 0 0
Matabeleland North -0.437* -1.042*** 0.245 1.508***
Matabeleland South -0.027 0.334* 0.441** 0.277
Masvingo -0.259 -0.369*** -0.144 0.350*
Constant 5.078** 10.389*** -2.108 -5.657**
Observations 1477 1473 1477 1537
r2 0.2
Log likelihood -920.243 -2833.283 -1063.756 -810.442
Asterisks denote levels of statistical significance: *<0.10, **<0.05, ***<0.01
Sources: ZimVAC. 2013.. Household survey. AFDM 2017. WFP. 2017.
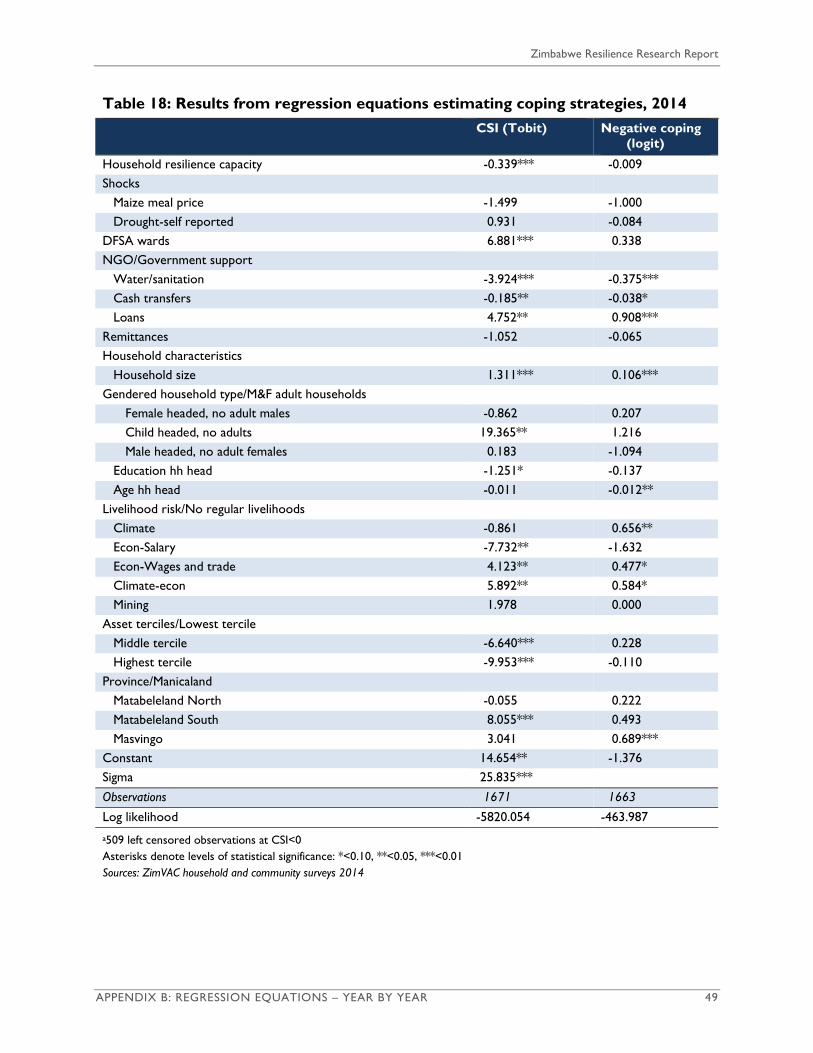
Zimbabwe Resilience Research Report
APPENDIX B: REGRESSION EQUATIONS – YEAR BY YEAR 49
Table 18: Results from regression equations estimating coping strategies, 2014
CSI (Tobit) Negative coping
(logit)
Household resilience capacity -0.339*** -0.009
Shocks
Maize meal price -1.499 -1.000
Drought-self reported 0.931 -0.084
DFSA wards 6.881*** 0.338
NGO/Government support
Water/sanitation -3.924*** -0.375***
Cash transfers -0.185** -0.038*
Loans 4.752** 0.908***
Remittances -1.052 -0.065
Household characteristics
Household size 1.311*** 0.106***
Gendered household type/M&F adult households
Female headed, no adult males -0.862 0.207
Child headed, no adults 19.365** 1.216
Male headed, no adult females 0.183 -1.094
Education hh head -1.251* -0.137
Age hh head -0.011 -0.012**
Livelihood risk/No regular livelihoods
Climate -0.861 0.656**
Econ-Salary -7.732** -1.632
Econ-Wages and trade 4.123** 0.477*
Climate-econ 5.892** 0.584*
Mining 1.978 0.000
Asset terciles/Lowest tercile
Middle tercile -6.640*** 0.228
Highest tercile -9.953*** -0.110
Province/Manicaland
Matabeleland North -0.055 0.222
Matabeleland South 8.055*** 0.493
Masvingo 3.041 0.689***
Constant 14.654** -1.376
Sigma 25.835***
Observations 1671 1663
Log likelihood -5820.054 -463.987
a509 left censored observations at CSI<0
Asterisks denote levels of statistical significance: *<0.10, **<0.05, ***<0.01
Sources: ZimVAC household and community surveys 2014
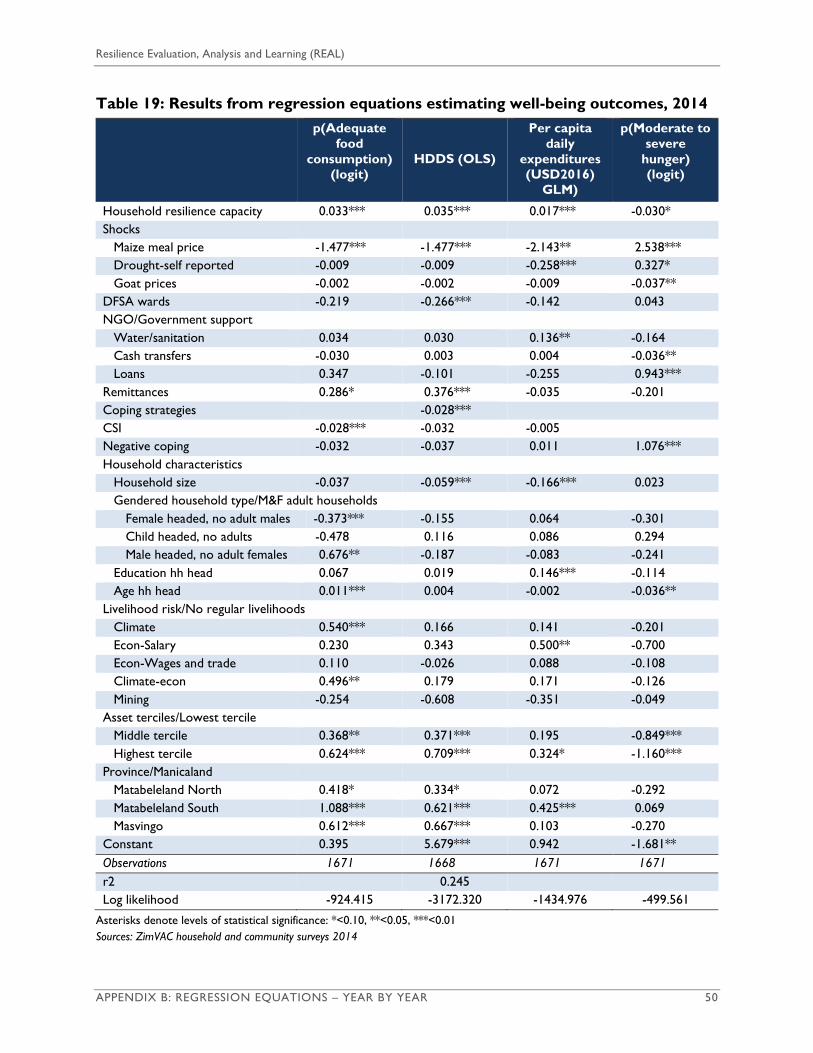
Resilience Evaluation, Analysis and Learning (REAL)
APPENDIX B: REGRESSION EQUATIONS – YEAR BY YEAR 50
Table 19: Results from regression equations estimating well-being outcomes, 2014
p(Adequate
food
consumption)
(logit)
HDDS (OLS)
Per capita
daily
expenditures
(USD2016)
GLM)
p(Moderate to
severe
hunger)
(logit)
Household resilience capacity 0.033*** 0.035*** 0.017*** -0.030*
Shocks Maize meal price -1.477*** -1.477*** -2.143** 2.538***
Drought-self reported -0.009 -0.009 -0.258*** 0.327*
Goat prices -0.002 -0.002 -0.009 -0.037**
DFSA wards -0.219 -0.266*** -0.142 0.043
NGO/Government support Water/sanitation 0.034 0.030 0.136** -0.164
Cash transfers -0.030 0.003 0.004 -0.036**
Loans 0.347 -0.101 -0.255 0.943***
Remittances 0.286* 0.376*** -0.035 -0.201
Coping strategies -0.028*** CSI -0.028*** -0.032 -0.005 Negative coping -0.032 -0.037 0.011 1.076***
Household characteristics Household size -0.037 -0.059*** -0.166*** 0.023
Gendered household type/M&F adult households
Female headed, no adult males -0.373*** -0.155 0.064 -0.301
Child headed, no adults -0.478 0.116 0.086 0.294
Male headed, no adult females 0.676** -0.187 -0.083 -0.241
Education hh head 0.067 0.019 0.146*** -0.114
Age hh head 0.011*** 0.004 -0.002 -0.036**
Livelihood risk/No regular livelihoods
Climate 0.540*** 0.166 0.141 -0.201
Econ-Salary 0.230 0.343 0.500** -0.700
Econ-Wages and trade 0.110 -0.026 0.088 -0.108
Climate-econ 0.496** 0.179 0.171 -0.126
Mining -0.254 -0.608 -0.351 -0.049
Asset terciles/Lowest tercile Middle tercile 0.368** 0.371*** 0.195 -0.849***
Highest tercile 0.624*** 0.709*** 0.324* -1.160***
Province/Manicaland Matabeleland North 0.418* 0.334* 0.072 -0.292
Matabeleland South 1.088*** 0.621*** 0.425*** 0.069
Masvingo 0.612*** 0.667*** 0.103 -0.270
Constant 0.395 5.679*** 0.942 -1.681**
Observations 1671 1668 1671 1671
r2 0.245 Log likelihood -924.415 -3172.320 -1434.976 -499.561
Asterisks denote levels of statistical significance: *<0.10, **<0.05, ***<0.01
Sources: ZimVAC household and community surveys 2014

Zimbabwe Resilience Research Report
APPENDIX B: REGRESSION EQUATIONS – YEAR BY YEAR 51
Table 20: Results from regression equations estimating coping strategies, 2015
CSI (Tobit)
Negative coping
(logit)
Household resilience capacity -0.975*** -0.016
Shocks
Drought (rainfall mm) -0.114 -0.017***
Maize meal price -14.468*** 0.312*
Goat prices -0.369*** 0.013
DFSA wards -0.114 -0.088
NGO/Government support
FSN -1.606 -0.243
Ag/Livestock support 3.475** 0.476***
Cash transfers 5.605 -0.784
Loans 5.740** 0.186
Remittances 2.414 0.066
Household characteristics
Household size 2.490*** 0.219***
Gendered household type/M&F adults
Female headed, no adult males -0.262 0.164
Male headed, no adult females 0.992 0.700**
Education hh head -0.574 -0.035
Age hh head 0.077 -0.008*
Livelihood risk/No regular livelihoods
Climate 3.860 0.646***
Econ-Salary -18.959*** -0.107
Econ-Wages and trade 4.334** 0.366*
Climate-econ 7.455*** 0.730***
Mining 0.609 0.787
Asset terciles/Lowest tercile 0.000 0.000
Middle tercile -7.909*** -0.546***
Highest tercile -15.218*** -0.645***
Province/Manicaland
Matabeleland North -13.620*** -2.079***
Matabeleland South -3.302 -1.439***
Masvingo -21.519*** -1.275***
Constant 40.641*** -1.284*
Sigma 31.065*** 1794
Observations 1794 Log likelihood -7543.874 -691.181
a291 left censored observations at CSI<0. Asterisks denote levels of statistical significance: *<0.10, **<0.05, ***<0.01
Sources: ZimVAC household and community surveys 2015, AFDM 2017

Resilience Evaluation, Analysis and Learning (REAL)
APPENDIX B: REGRESSION EQUATIONS – YEAR BY YEAR 52
Table 21: Results from equations estimating well-being outcomes, 2015 Adequate
food
consumption
(logit)
HDDS
(OLS)
Per capita
daily
expenditures
(USD2016)
(GLM)
(Moderate
to severe
hunger)
(Logit)
Household resilience capacity 0.076*** 0.032*** 0.021*** -0.047**
Shocks
Drought -0.015*** -0.011*** 0.004 0.011*
Goat prices 0.007 0.021*** 0.020*** 0.021*
DFSA wards 0.068 -0.028 0.036 -0.155
Coping strategies
CSI -0.011*** -0.012*** -0.006***
Negative coping -0.186* -0.271*** -0.047 0.634***
NGO/government support
Formal safety nets 0.149 0.229*** -0.005 -0.241
Ag/livestock support 0.100 0.443*** 0.191** 0.367**
Transfers 0.006 0.002 0.001 -0.003
Loan 0.310 0.521*** 0.498*** 0.000
Remittances 0.566*** 0.173 0.218** 0.265
Household characteristics
Household size -0.080*** -0.084*** -0.244*** 0.116***
Female headed household -0.202 -0.139 -0.315*** -0.136
Male headed household 0.092 -0.353* 0.009 0.508
Education hh head 0.081 0.077** 0.043 -0.020
Age hh he 0.001 -0.003 -0.004 0.004
Livelihood risk/No regular livelihoods
Climate 0.256 -0.031 0.204* 0.254
Econ-Salary 0.387 0.528*** 0.491*** -0.574
Econ-Wages and trade 0.199 0.107 0.054 0.288
Climate-econ 0.271 0.105 0.186 0.505**
Mining 1.315* 0.074 -0.455* -0.348
Asset terciles/Lowest tercile
Middle tercile 0.623*** 0.255*** 0.344*** -0.602***
Highest tercile 1.002*** 0.822*** 0.504*** -1.289***
Province/Manicaland
Matabeleland North 0.357 -0.494** -0.972*** -0.672**
Matabeleland South 0.663** -0.114 -0.240 -0.999***
Masvingo 0.470*** 0.129 -0.230* -1.466***
Constant -1.900*** 4.450*** -0.386 -1.381**
Observations 1794 1782 1794 1794
r2 0.233
Log likelihood -1049.478 -3347.347 -994.450 -689.569
Asterisks denote levels of statistical significance: *<0.10, **<0.05, ***<0.01
Sources: ZimVAC household and community surveys 2015, AFDM 2017
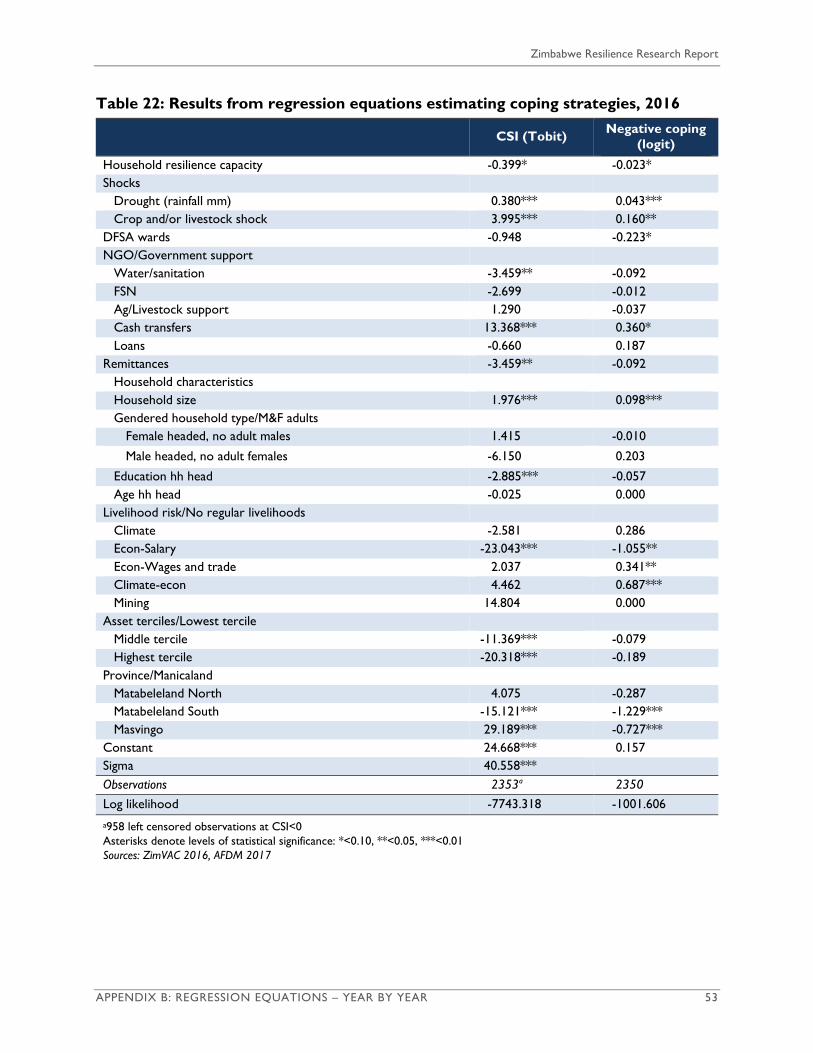
Zimbabwe Resilience Research Report
APPENDIX B: REGRESSION EQUATIONS – YEAR BY YEAR 53
Table 22: Results from regression equations estimating coping strategies, 2016
CSI (Tobit) Negative coping
(logit)
Household resilience capacity -0.399* -0.023*
Shocks
Drought (rainfall mm) 0.380*** 0.043***
Crop and/or livestock shock 3.995*** 0.160**
DFSA wards -0.948 -0.223*
NGO/Government support
Water/sanitation -3.459** -0.092
FSN -2.699 -0.012
Ag/Livestock support 1.290 -0.037
Cash transfers 13.368*** 0.360*
Loans -0.660 0.187
Remittances -3.459** -0.092
Household characteristics
Household size 1.976*** 0.098***
Gendered household type/M&F adults
Female headed, no adult males 1.415 -0.010
Male headed, no adult females -6.150 0.203
Education hh head -2.885*** -0.057
Age hh head -0.025 0.000
Livelihood risk/No regular livelihoods
Climate -2.581 0.286
Econ-Salary -23.043*** -1.055**
Econ-Wages and trade 2.037 0.341**
Climate-econ 4.462 0.687***
Mining 14.804 0.000
Asset terciles/Lowest tercile
Middle tercile -11.369*** -0.079
Highest tercile -20.318*** -0.189
Province/Manicaland
Matabeleland North 4.075 -0.287
Matabeleland South -15.121*** -1.229***
Masvingo 29.189*** -0.727***
Constant 24.668*** 0.157
Sigma 40.558***
Observations 2353a 2350
Log likelihood -7743.318 -1001.606
a958 left censored observations at CSI<0
Asterisks denote levels of statistical significance: *<0.10, **<0.05, ***<0.01
Sources: ZimVAC 2016, AFDM 2017
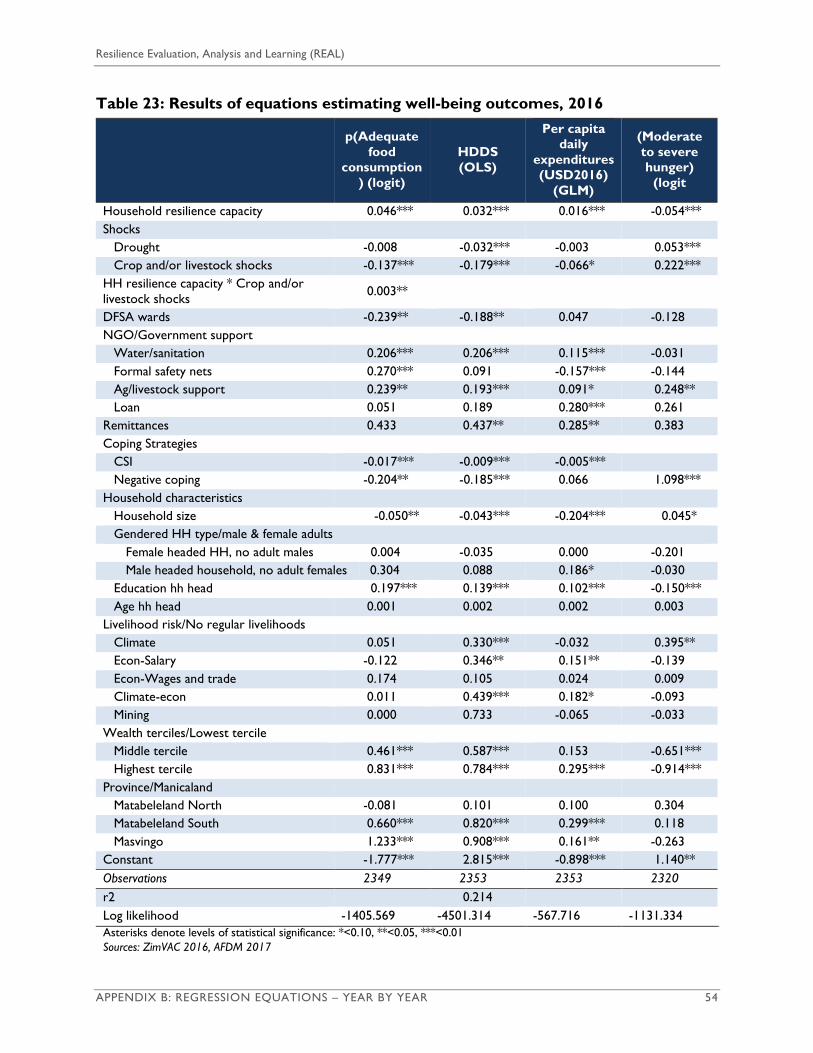
Resilience Evaluation, Analysis and Learning (REAL)
APPENDIX B: REGRESSION EQUATIONS – YEAR BY YEAR 54
Table 23: Results of equations estimating well-being outcomes, 2016
p(Adequate
food
consumption
) (logit)
HDDS
(OLS)
Per capita
daily
expenditures
(USD2016)
(GLM)
(Moderate
to severe
hunger)
(logit
Household resilience capacity 0.046*** 0.032*** 0.016*** -0.054***
Shocks
Drought -0.008 -0.032*** -0.003 0.053***
Crop and/or livestock shocks -0.137*** -0.179*** -0.066* 0.222***
HH resilience capacity * Crop and/or
livestock shocks 0.003**
DFSA wards -0.239** -0.188** 0.047 -0.128
NGO/Government support
Water/sanitation 0.206*** 0.206*** 0.115*** -0.031
Formal safety nets 0.270*** 0.091 -0.157*** -0.144
Ag/livestock support 0.239** 0.193*** 0.091* 0.248**
Loan 0.051 0.189 0.280*** 0.261
Remittances 0.433 0.437** 0.285** 0.383
Coping Strategies
CSI -0.017*** -0.009*** -0.005***
Negative coping -0.204** -0.185*** 0.066 1.098***
Household characteristics
Household size -0.050** -0.043*** -0.204*** 0.045*
Gendered HH type/male & female adults
Female headed HH, no adult males 0.004 -0.035 0.000 -0.201
Male headed household, no adult females 0.304 0.088 0.186* -0.030
Education hh head 0.197*** 0.139*** 0.102*** -0.150***
Age hh head 0.001 0.002 0.002 0.003
Livelihood risk/No regular livelihoods
Climate 0.051 0.330*** -0.032 0.395**
Econ-Salary -0.122 0.346** 0.151** -0.139
Econ-Wages and trade 0.174 0.105 0.024 0.009
Climate-econ 0.011 0.439*** 0.182* -0.093
Mining 0.000 0.733 -0.065 -0.033
Wealth terciles/Lowest tercile
Middle tercile 0.461*** 0.587*** 0.153 -0.651***
Highest tercile 0.831*** 0.784*** 0.295*** -0.914***
Province/Manicaland
Matabeleland North -0.081 0.101 0.100 0.304
Matabeleland South 0.660*** 0.820*** 0.299*** 0.118
Masvingo 1.233*** 0.908*** 0.161** -0.263
Constant -1.777*** 2.815*** -0.898*** 1.140**
Observations 2349 2353 2353 2320
r2 0.214
Log likelihood -1405.569 -4501.314 -567.716 -1131.334
Asterisks denote levels of statistical significance: *<0.10, **<0.05, ***<0.01
Sources: ZimVAC 2016, AFDM 2017

Zimbabwe Resilience Research Report
APPENDIX C: THE HOUSEHOLD RESILIENCE CAPACITY INDEX 55
AppendixC:Thehouseholdresiliencecapacityindex
The household resilience capacity index was constructed separately for each year 2013, 2014, 2015, and 2016. The index is made up of up to eight elements, some of which are themselves indexes. The elements corresponding to each year are as follows:
Table 24: Household resilience capacity elements
2013 2014 2015 2016
Cereal stores (USD 2016) √ √ √ √ Livestock (TLU) √ √ √ √
Education level head of household √ √
Adults in HH with more than primary level education √ √ Savings √ √ √ √ Livelihood diversification √ √ √ √ Remittances as an income source √
ISN1
Social capital1 Agricultural markets √ √ √ Livestock markets √ √ Information sources √
1Variables had negative loadings, so were dropped from the final factor
The cereal stores index replaces household assets41 which is used in other USAID/TANGO studies because data on household and productive assets were not collected in the ZimVAC household surveys. The ZimVAC surveys asked households about food stocks (cereal and pulses) on hand as of April 1 of the survey year. Respondents were asked about quantity and units of maize, sorghum, millet, wheat, rice ground nuts (shelled and unshelled), round nuts (shelled and unshelled), chick peas, and beans. Computation entailed converting units to kilograms and then attaching prices to each commodity using WFP price per kilogram. All values were then summed and converted to USD 2016 to be comparable across years.
Livestock assets were computed according to USAID/TANGO methods, which follow FAO guidelines42. The index is a count of each type of livestock multiplied by its TLU. Subtotals are summed to create the index.
Education is measured in two ways. The 2013 and 2014 surveys ask about education of the head of household only, not all household members. For those years, that is the education element. For 2015 and 2016 education is the sum of adults in the households (18 and older) with more than a primary level education.
41 Household assets is a count of approximately 25 household and approximately 20 productive assets. 42 Food and Agriculture Organization (FAO). 2011. Guidelines for the preparation of livestock sector reviews.

Resilience Evaluation, Analysis and Learning (REAL)
APPENDIX C: THE HOUSEHOLD RESILIENCE CAPACITY INDEX 56
Savings is the dollar amount of savings. It comes from an income module asking about
income from various sources over the past month. Savings is equal to what households
reported as the starting balance.
Livelihood diversification also comes from the income module. A household is counted as having an
income source if they report cash or in-kind earnings from that source. Income sources are
grouped into seven livelihood categories then totaled.
1. Sale of livestock, livestock products or draught animal hiring=livestock
2. Food crops, cash crops or vegetables=crops
3. Formal employment or own business (if own business earned more than $500)=formal
4. Casual labor=casual labor
5. Cross border trade, brewing, petty trade, artisanal trade and own business (if own business
earned less than $500 in past month)=trade
6. Small scale mining=mining
7. Gathering=wild products
Remittances as an income source also comes from the income module. It is the dollar amount or
dollar equivalent of cash or in-kind from remittances in the past month.
ISN is a count (0-5) of cash, food, agriculture, livestock or wash inputs household received from
churches over the past 12 months. It comes from the social protection module.
Social capital also comes from the social protection module. It is a count (0-10) of cash, food,
agriculture, livestock or wash inputs household received from friends and/or relatives in rural areas
or friends and/or relatives in urban areas over the past 12 months.
Agricultural markets. This is a dummy variable, coded as one if the household sold agricultural
products to traders, GMB, millers, markets, or contractors, and zero otherwise.
Livestock markets. This is a dummy variable, coded as one if the household sold agricultural products
to traders, CSC, other abattoirs or distant markets and zero otherwise.
Information sources. Is a count (0-10) of whether a household received information on the following
topics from NGOs, government, newspaper, radio/TV or Internet/SMS:
1. Long term changes in weather patterns
2. Rainfall prospects for the season just ended
3. Livestock disease threats
4. Current market prices for live animals in the area
5. Business and investment opportunities
6. Opportunities for borrowing money
7. Market prices of food that you buy
8. Market prices of agricultural inputs and veterinary supplies
9. Child feeding and caring practices
10. Health information

Zimbabwe Resilience Research Report
APPENDIX D: RELATIONSHIPS BETWEEN HOUSEHOLD RESILIENCE CAPACITY ELEMENTS AND WELL-BEING OUTCOMES 57
Appendix D: Relationships between household resilience capacity elements and well-
being outcomes 2013, 2014, 2015, 2016
Table 25: Relationships between elements of household resilience capacity & adequate food consumption 2013
p(Adequate food consumption) (logit) 2013
Shocks
Maize price -13.803*** -14.282*** -12.252** -11.910** -13.470** -13.454**
Drought - self reported -0.005*** -0.005*** -0.006*** -0.006*** -0.006*** -0.006***
Resilience capacity elements
Cereal stores 0.001**
Livestock assets
0.055***
Count of livelihoods
0.233*
Education HH head
0.150***
Savings
0.006***
HH resilience capacity
0.057***
DFSA wards -0.361*** -0.404*** -0.409*** -0.427*** -0.438*** -0.436***
CSI -0.004** -0.003* -0.004** -0.004** -0.003* -0.003*
Household characteristics
Household size -0.006 -0.013 -0.026 -0.025 -0.029 -0.025
Female headed household -0.274** -0.231* -0.235* -0.227 -0.231 -0.207
Child headed household -0.760 -0.765 -0.629 -0.605 -0.555 -0.549
Male headed household 0.017 -0.016 0.052 0.057 0.038 0.033
Education HH head 0.167*** 0.149*** 0.145***
0.102* 0.044
Age HH head 0.003 0.001 -0.001 -0.001 -0.002 -0.002
Livelihood risk category/No regular livelihoods
Climate 0.403** 0.423** 0.136 0.394** 0.435** 0.330*
Econ-Salary 0.701* 0.770** 0.523 0.807** 0.771** 0.679*
Econ-Wages & trade -0.067 -0.046 -0.266 0.012 0.055 -0.051
Climate-econ 0.172 0.223 -0.369 0.165 0.230 0.059
Mining -0.501 -0.424 -0.747 -0.481 -0.702 -0.617
Asset terciles/Lowest tercile
Middle tercile
0.691*** 0.694*** 0.617*** 0.539***

Resilience Evaluation, Analysis and Learning (REAL)
APPENDIX D: RELATIONSHIPS BETWEEN HOUSEHOLD RESILIENCE CAPACITY ELEMENTS AND WELL-BEING OUTCOMES 58
p(Adequate food consumption) (logit) 2013
Highest tercile
1.031*** 1.045*** 0.866*** 0.493**
NGO/government programming
Water/sanitation -0.004 -0.014 0.010 0.010 0.021 0.009
FSN 0.113 0.107 0.143 0.136 0.218* 0.193
Cash or in-kind transfer -0.364 -0.361 -0.358 -0.389 -0.415 -0.390
Remittances 0.494*** 0.513*** 0.273 0.500*** 0.455*** 0.478***
Province/Manicaland
Matabeleland North -0.337 -0.381 -0.411 -0.417* -0.403 -0.437*
Matabeleland South 0.108 0.060 0.036 0.035 -0.035 -0.027
Masvingo -0.198 -0.157 -0.223 -0.217 -0.261 -0.259
Constant 5.087*** 5.406*** 4.501** 4.372** 4.994** 5.078**
Observations 1477 1477 1477 1477 1477 1477
Log likelihood -950.440 -947.007 -927.765 -929.331 -913.549 -920.24
Asterisks denote levels of statistical significance: * p<0.10, ** p<0.05, *** p<0.01
Sources: ZimVAC. 2013. Household surveys, WFP. 2017.
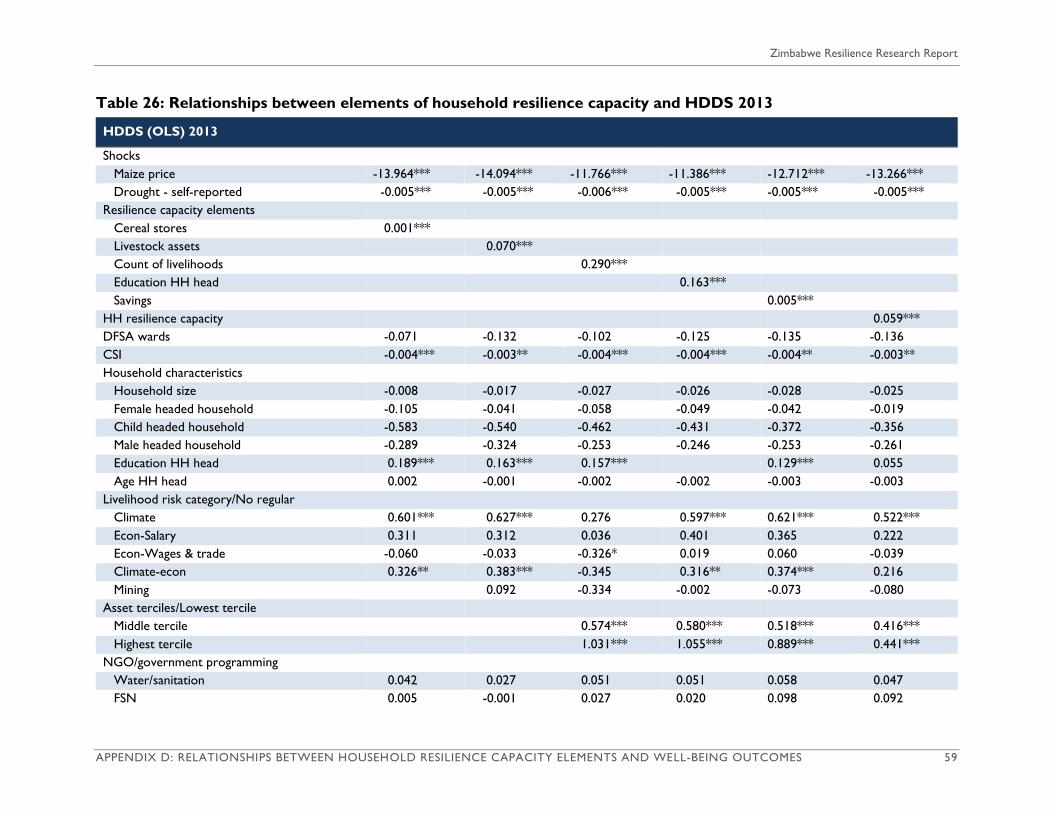
Zimbabwe Resilience Research Report
APPENDIX D: RELATIONSHIPS BETWEEN HOUSEHOLD RESILIENCE CAPACITY ELEMENTS AND WELL-BEING OUTCOMES 59
Table 26: Relationships between elements of household resilience capacity and HDDS 2013
HDDS (OLS) 2013
Shocks
Maize price -13.964*** -14.094*** -11.766*** -11.386*** -12.712*** -13.266***
Drought - self-reported -0.005*** -0.005*** -0.006*** -0.005*** -0.005*** -0.005***
Resilience capacity elements
Cereal stores 0.001***
Livestock assets
0.070***
Count of livelihoods
0.290***
Education HH head
0.163***
Savings
0.005***
HH resilience capacity
0.059***
DFSA wards -0.071 -0.132 -0.102 -0.125 -0.135 -0.136
CSI -0.004*** -0.003** -0.004*** -0.004*** -0.004** -0.003**
Household characteristics
Household size -0.008 -0.017 -0.027 -0.026 -0.028 -0.025
Female headed household -0.105 -0.041 -0.058 -0.049 -0.042 -0.019
Child headed household -0.583 -0.540 -0.462 -0.431 -0.372 -0.356
Male headed household -0.289 -0.324 -0.253 -0.246 -0.253 -0.261
Education HH head 0.189*** 0.163*** 0.157***
0.129*** 0.055
Age HH head 0.002 -0.001 -0.002 -0.002 -0.003 -0.003
Livelihood risk category/No regular
Climate 0.601*** 0.627*** 0.276 0.597*** 0.621*** 0.522***
Econ-Salary 0.311 0.312 0.036 0.401 0.365 0.222
Econ-Wages & trade -0.060 -0.033 -0.326* 0.019 0.060 -0.039
Climate-econ 0.326** 0.383*** -0.345 0.316** 0.374*** 0.216
Mining
0.092 -0.334 -0.002 -0.073 -0.080
Asset terciles/Lowest tercile
Middle tercile
0.574*** 0.580*** 0.518*** 0.416***
Highest tercile
1.031*** 1.055*** 0.889*** 0.441***
NGO/government programming
Water/sanitation 0.042 0.027 0.051 0.051 0.058 0.047
FSN 0.005 -0.001 0.027 0.020 0.098 0.092

Resilience Evaluation, Analysis and Learning (REAL)
APPENDIX D: RELATIONSHIPS BETWEEN HOUSEHOLD RESILIENCE CAPACITY ELEMENTS AND WELL-BEING OUTCOMES 60
HDDS (OLS) 2013
Cash or in-kind transfer -0.856*** -0.849*** -0.831*** -0.868*** -0.878*** -0.856***
Remittances 0.640*** 0.658*** 0.345** 0.631*** 0.584*** 0.597***
Province/Manicaland
Matabeleland North -0.947*** -1.012*** -1.012*** -1.021*** -1.012*** -1.042***
Matabeleland South 0.497*** 0.413** 0.409** 0.410** 0.347** 0.334*
Masvingo -0.306** -0.268** -0.324** -0.316** -0.361*** -0.369***
Constant 10.493*** 10.711*** 9.706*** 9.561*** 10.081*** 10.389***
Observations 1473 1473 1473 1473 1473 1473
r2 0.144 0.161 0.180 0.175 0.198 0.200
Log likelihood -2883.117 -2868.632 -2852.069 -2855.987 -2835.661 -2833.283
Asterisks denote levels of statistical significance: * p<0.10, ** p<0.05, *** p<0.01
Sources: ZimVAC. 2013. Household surveys, WFP. 2017.

Zimbabwe Resilience Research Report
APPENDIX D: RELATIONSHIPS BETWEEN HOUSEHOLD RESILIENCE CAPACITY ELEMENTS AND WELL-BEING OUTCOMES 61
Table 27: Relationships between elements of household resilience capacity & per capita daily expenditures 2013
Per capita daily expenditures (USD2016) (GLM) 2013
Shocks
Maize price 2.600 1.896 1.948 3.487 0.359 0.083
Drought - self-reported -0.000 0.000 -0.001 0.000 0.000 0.000
Resilience capacity elements
Cereal stores 0.000**
Livestock assets
0.010
Count of livelihoods
0.259***
Education HH head
0.346***
Savings
0.002***
HH resilience capacity
0.014
DFSA wards -0.115 -0.143* -0.216** -0.206** -0.285*** -0.271***
CSI -0.004* -0.003 -0.003* -0.003* -0.003 -0.003
Household characteristics
Household size -0.195*** -0.206*** -0.211*** -0.218*** -0.218*** -0.225***
Female headed household 0.084 0.098 0.095 0.070 0.082 0.104
Child headed household -0.623 -0.601 -0.346 -0.391 -0.307 -0.311
Male headed household 0.342 0.360 0.367* 0.319 0.313 0.343
Education HH head 0.388*** 0.388*** 0.355***
0.307*** 0.314***
Age HH head 0.004 0.005 0.003 0.001 0.001 0.003
Livelihood risk category/No regular livelihoods
Climate 0.458*** 0.489** 0.141 0.422** 0.442** 0.454***
Econ-Salary 1.094*** 1.031*** 0.759*** 1.116*** 1.038*** 0.997***
Econ-Wages & trade 0.622** 0.653** 0.322 0.610** 0.548** 0.571**
Climate-econ 0.666*** 0.710***
0.589*** 0.543*** 0.562***
Mining 0.481 0.504* 0.310 0.555** 0.427* 0.483*
Asset terciles/Lowest tercile
Middle tercile
0.424*** 0.460*** 0.439** 0.443**
Highest tercile
0.493*** 0.599*** 0.548*** 0.427*
NGO/government programming
Water/sanitation 0.079 0.050
0.081
FSN 0.036 0.004
0.012
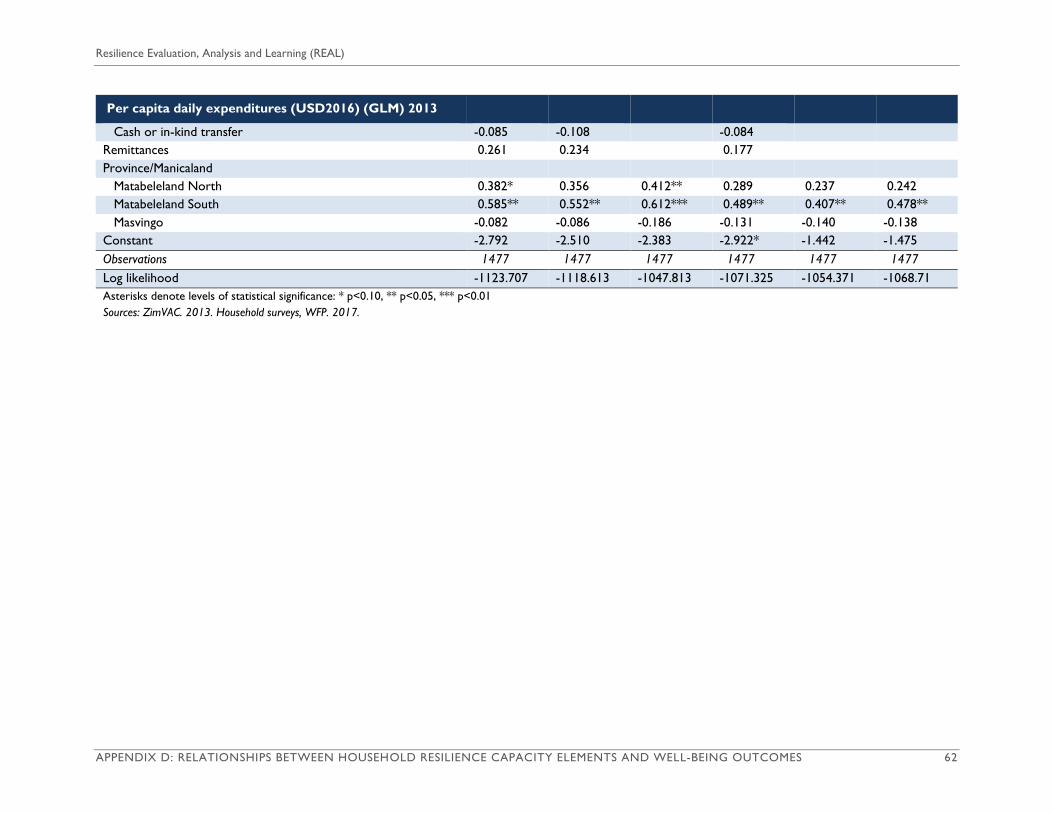
Resilience Evaluation, Analysis and Learning (REAL)
APPENDIX D: RELATIONSHIPS BETWEEN HOUSEHOLD RESILIENCE CAPACITY ELEMENTS AND WELL-BEING OUTCOMES 62
Per capita daily expenditures (USD2016) (GLM) 2013
Cash or in-kind transfer -0.085 -0.108
-0.084
Remittances 0.261 0.234
0.177
Province/Manicaland
Matabeleland North 0.382* 0.356 0.412** 0.289 0.237 0.242
Matabeleland South 0.585** 0.552** 0.612*** 0.489** 0.407** 0.478**
Masvingo -0.082 -0.086 -0.186 -0.131 -0.140 -0.138
Constant -2.792 -2.510 -2.383 -2.922* -1.442 -1.475
Observations 1477 1477 1477 1477 1477 1477
Log likelihood -1123.707 -1118.613 -1047.813 -1071.325 -1054.371 -1068.71
Asterisks denote levels of statistical significance: * p<0.10, ** p<0.05, *** p<0.01
Sources: ZimVAC. 2013. Household surveys, WFP. 2017.

Zimbabwe Resilience Research Report
APPENDIX D: RELATIONSHIPS BETWEEN HOUSEHOLD RESILIENCE CAPACITY ELEMENTS AND WELL-BEING OUTCOMES 63
Table 28: Relationships between resilience capacity & moderate to severe hunger 2013
p(moderate to severe hunger) (logit) 2013
Shocks
Maize price 10.365* 12.381** 9.193 9.124 9.555 10.141*
Drought - self-reported 0.003** 0.004*** 0.004*** 0.004*** 0.004*** 0.004***
Resilience capacity elements
Cereal stores -0.003***
Livestock assets -0.148***
Count of livelihoods -0.091
Education HH head -0.148**
Savings -0.002
HH resilience capacity -0.068***
DFSA wards 0.222 0.323** 0.292* 0.300** 0.305** 0.305**
CSI
Household characteristics
Household size 0.075*** 0.096*** 0.101*** 0.100*** 0.102*** 0.103***
Female headed household 0.236 0.157 0.196 0.194 0.198 0.191
Child headed household -0.835 -0.786 -0.904 -0.910 -0.922 -0.925
Male headed household -0.063 -0.070 -0.143 -0.144 -0.134 -0.124
Education HH head -0.172*** -0.124* -0.146** -0.133** -0.026
Age HH head -0.001 0.003 0.003 0.003 0.003 0.004
Livelihood risk category/No regular livelihoods
Climate -0.347* -0.334* -0.201 -0.303 -0.311 -0.231
Econ-Salary -0.332 -0.478 -0.347 -0.461 -0.441 -0.321
Econ-Wages & trade -0.038 -0.043 0.007 -0.100 -0.112 -0.020
Climate-econ -0.059 -0.100 0.162 -0.046 -0.061 0.096
Mining 0.411 0.337 0.476 0.374 0.407 0.492
Asset terciles/Lowest tercile
Middle tercile -0.86*** -0.86*** -0.83*** -0.680***
Highest tercile -1.25*** -1.25*** -1.18*** -0.636**
NGO/government programming
Water/sanitation -0.025 -0.015 -0.041 -0.041 -0.044 -0.043
FSN 0.094 0.090 0.065 0.066 0.041 0.019
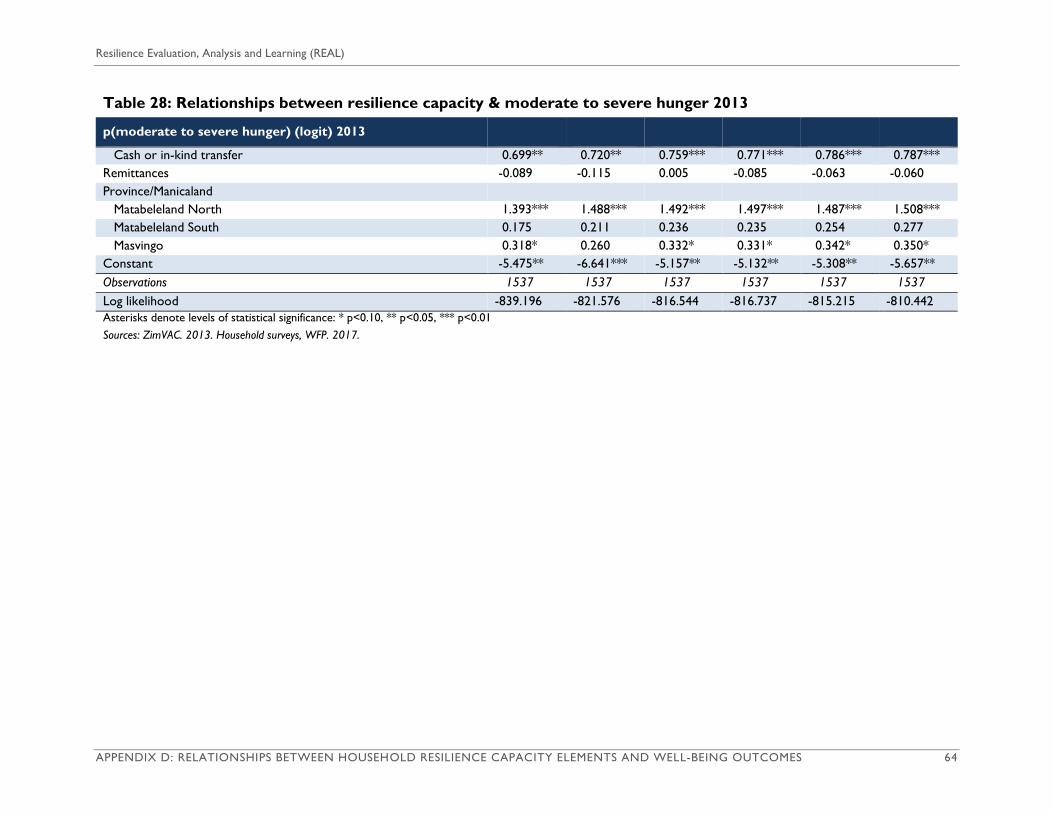
Resilience Evaluation, Analysis and Learning (REAL)
APPENDIX D: RELATIONSHIPS BETWEEN HOUSEHOLD RESILIENCE CAPACITY ELEMENTS AND WELL-BEING OUTCOMES 64
Table 28: Relationships between resilience capacity & moderate to severe hunger 2013
p(moderate to severe hunger) (logit) 2013
Cash or in-kind transfer 0.699** 0.720** 0.759*** 0.771*** 0.786*** 0.787***
Remittances -0.089 -0.115 0.005 -0.085 -0.063 -0.060
Province/Manicaland
Matabeleland North 1.393*** 1.488*** 1.492*** 1.497*** 1.487*** 1.508***
Matabeleland South 0.175 0.211 0.236 0.235 0.254 0.277
Masvingo 0.318* 0.260 0.332* 0.331* 0.342* 0.350*
Constant -5.475** -6.641*** -5.157** -5.132** -5.308** -5.657**
Observations 1537 1537 1537 1537 1537 1537
Log likelihood -839.196 -821.576 -816.544 -816.737 -815.215 -810.442
Asterisks denote levels of statistical significance: * p<0.10, ** p<0.05, *** p<0.01
Sources: ZimVAC. 2013. Household surveys, WFP. 2017.

Zimbabwe Resilience Research Report
APPENDIX D: RELATIONSHIPS BETWEEN HOUSEHOLD RESILIENCE CAPACITY ELEMENTS AND WELL-BEING OUTCOMES 65
Table 29: Relationships between household resilience capacity elements and adequate food consumption 2014
p(adequate food consumption) (logit) 2014
Shocks
Maize meal price -1.297** -1.427*** -1.440*** -1.501*** -1.440*** -1.453*** -1.492*** -1.477***
Goat prices -0.006 -0.005 -0.009 -0.008 -0.009 -0.009 -0.009 -0.009
Drought -0.002 -0.002 -0.002* -0.002* -0.002* -0.002 -0.002 -0.002
HH resilience capacity elements
Cereal stores 0.003*** Livestock assets 0.053*** Education HH head 0.213*** Count of livelihoods 0.453** Remittances 0.459*** Savings 0.003** HH sold crops to markets, GMB, traders, contractors 0.919**
HH resilience capacity 0.033***
DFSA wards -0.216 -0.182 -0.224 -0.236* -0.224 -0.218 -0.201 -0.219
CSI -0.031*** -0.031*** -0.029*** -0.030*** -0.029*** -0.029*** -0.029*** -0.028***
Negative coping -0.032 -0.002 -0.020 -0.042 -0.020 -0.020 -0.018 -0.032
Household characteristics Household size -0.017 -0.023 -0.029 -0.031 -0.029 -0.033 -0.031 -0.037
Female headed household -0.385*** -0.389*** -0.396*** -0.392*** -0.396*** -0.396*** -0.394*** -0.373***
Child headed household -0.467 -0.563 -0.412 -0.411 -0.412 -0.503 -0.399 -0.478
Male headed household -0.675** -0.743*** -0.656** -0.638** -0.656** -0.678** -0.672** -0.676**
Education HH head 0.221*** 0.200*** 0.209*** 0.213*** 0.197*** 0.206*** 0.067
Age HH head 0.013*** 0.011*** 0.011*** 0.012*** 0.011*** 0.011*** 0.011*** 0.011***
Livelihood risk category/No regular livelihoods
Climate 0.730*** 0.714*** 0.717*** 0.236 0.717*** 0.710*** 0.711*** 0.540***
Econ-Salary 0.558* 0.524* 0.515 -0.019 0.515 0.423 0.523 0.230
Econ-Wages & trade 0.251 0.273* 0.284* -0.246 0.284* 0.279* 0.295* 0.110
Climate-econ 0.860*** 0.876*** 0.852*** -0.166 0.852*** 0.850*** 0.829*** 0.496**
Mining -0.060 0.039 0.030 -0.771 0.030 -0.002 0.045 -0.254
Asset terciles/Lowest tercile
Middle tercile 0.400** 0.396** 0.400** 0.407** 0.403** 0.368**
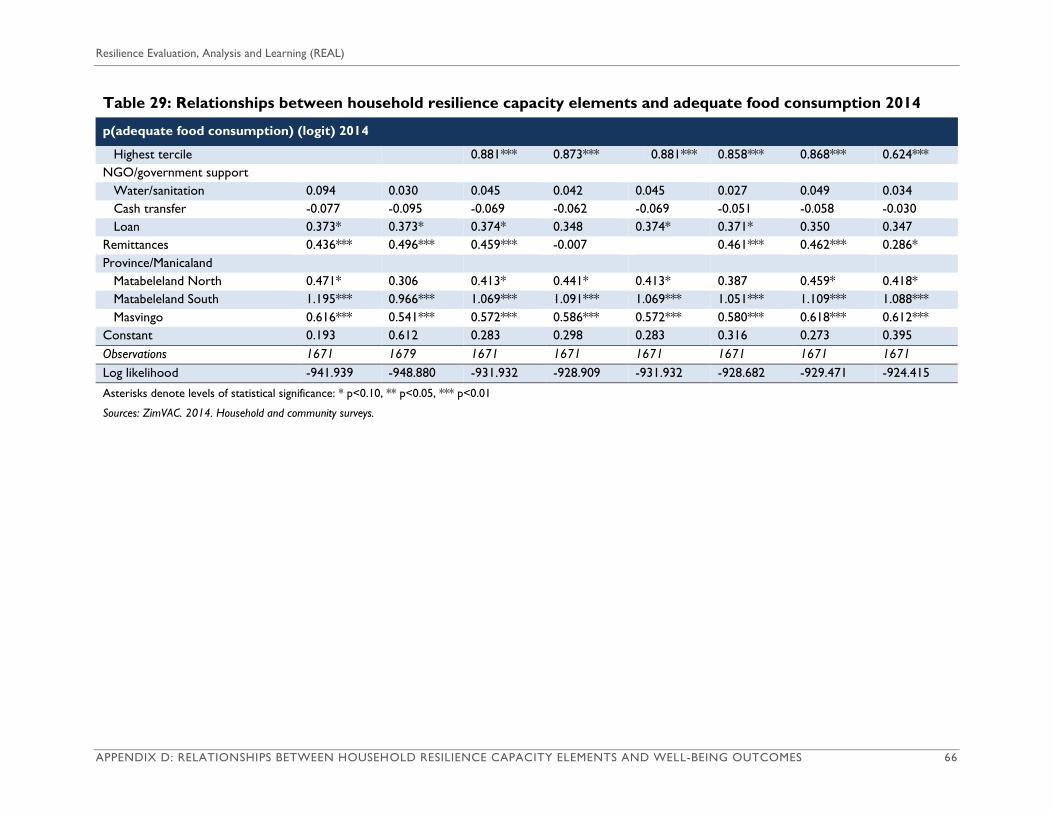
Resilience Evaluation, Analysis and Learning (REAL)
APPENDIX D: RELATIONSHIPS BETWEEN HOUSEHOLD RESILIENCE CAPACITY ELEMENTS AND WELL-BEING OUTCOMES 66
Table 29: Relationships between household resilience capacity elements and adequate food consumption 2014
p(adequate food consumption) (logit) 2014
Highest tercile 0.881*** 0.873*** 0.881*** 0.858*** 0.868*** 0.624***
NGO/government support
Water/sanitation 0.094 0.030 0.045 0.042 0.045 0.027 0.049 0.034
Cash transfer -0.077 -0.095 -0.069 -0.062 -0.069 -0.051 -0.058 -0.030
Loan 0.373* 0.373* 0.374* 0.348 0.374* 0.371* 0.350 0.347
Remittances 0.436*** 0.496*** 0.459*** -0.007 0.461*** 0.462*** 0.286*
Province/Manicaland
Matabeleland North 0.471* 0.306 0.413* 0.441* 0.413* 0.387 0.459* 0.418*
Matabeleland South 1.195*** 0.966*** 1.069*** 1.091*** 1.069*** 1.051*** 1.109*** 1.088***
Masvingo 0.616*** 0.541*** 0.572*** 0.586*** 0.572*** 0.580*** 0.618*** 0.612***
Constant 0.193 0.612 0.283 0.298 0.283 0.316 0.273 0.395
Observations 1671 1679 1671 1671 1671 1671 1671 1671
Log likelihood -941.939 -948.880 -931.932 -928.909 -931.932 -928.682 -929.471 -924.415
Asterisks denote levels of statistical significance: * p<0.10, ** p<0.05, *** p<0.01
Sources: ZimVAC. 2014. Household and community surveys.

Zimbabwe Resilience Research Report
APPENDIX D: RELATIONSHIPS BETWEEN HOUSEHOLD RESILIENCE CAPACITY ELEMENTS AND WELL-BEING OUTCOMES 67
Table 30: Relationships between household resilience capacity elements and HDDS 2014
HDDS (OLS) 2014
Shocks Maize meal price -0.812* -0.935** -0.931** -0.977** -0.931** -0.938** -0.987** -1.001**
Goat prices 0.009 0.008 0.005 0.006 0.005 0.005 0.005 0.005
Drought -0.004*** -0.005*** -0.005*** -0.005*** -0.005*** -0.004*** -0.005*** -0.004***
HH resilience capacity elements
Cereal stores 0.003*** Livestock assets 0.065*** Education HH head 0.184*** Count of livelihoods 0.475*** Remittances 0.573*** Savings 0.003*** HH sold crops to markets, GMB, traders,
contractors 0.669*** HH resilience capacity 0.035***
DFSA wards -0.276*** -0.249** -0.284*** -0.290*** -0.284*** -0.270*** -0.265*** -0.267***
CSI -0.017*** -0.017*** -0.015*** -0.016*** -0.015*** -0.015*** -0.015*** -0.014***
Negative coping -0.070 -0.051 -0.063 -0.086 -0.063 -0.059 -0.061 -0.068
HH characteristics Household size -0.042** -0.047*** -0.052*** -0.053*** -0.052*** -0.056*** -0.053*** -0.059***
Female head HH -0.184* -0.193* -0.194* -0.185* -0.194* -0.189* -0.192* -0.155
Child HH 0.129 0.018 0.178 0.159 0.178 0.081 0.193 0.116
Male head HH -0.231 -0.298 -0.194 -0.165 -0.194 -0.199 -0.203 -0.188
Education HH head 0.197*** 0.175*** 0.178*** 0.184*** 0.161*** 0.177*** 0.019
Age HH head 0.006** 0.004 0.004 0.004 0.004 0.004 0.004 0.003
Livelihood risk category/No regular livelihoods
Climate 0.400*** 0.382*** 0.392*** -0.127 0.392*** 0.368*** 0.385*** 0.169
Econ-Salary 0.713*** 0.648*** 0.686*** 0.118 0.686*** 0.579*** 0.697*** 0.347
Econ-Wages & trade 0.126 0.159 0.168 -0.391** 0.168 0.165 0.175 -0.027
Climate-econ 0.584*** 0.590*** 0.569*** -0.513 0.569*** 0.567*** 0.550*** 0.181
Mining -0.406 -0.289 -0.314 -1.145* -0.314 -0.335 -0.301 -0.602
Asset terciles/Lowest tercile

Resilience Evaluation, Analysis and Learning (REAL)
APPENDIX D: RELATIONSHIPS BETWEEN HOUSEHOLD RESILIENCE CAPACITY ELEMENTS AND WELL-BEING OUTCOMES 68
Table 30: Relationships between household resilience capacity elements and HDDS 2014
HDDS (OLS) 2014
Middle tercile 0.401*** 0.397*** 0.401*** 0.411*** 0.404*** 0.370***
Highest tercile 1.010*** 1.001*** 1.010*** 0.980*** 0.995*** 0.709***
NGO/government support
Water/sanitation 0.105* 0.032 0.046 0.037 0.046 0.021 0.050 0.030
Cash transfer 0.206 0.161 0.214 0.211 0.214 0.233 0.214 0.244
Loan -0.063 -0.035 -0.064 -0.086 -0.064 -0.081 -0.080 -0.102
Remittances 0.542*** 0.592*** 0.573*** 0.088 0.574*** 0.574*** 0.378***
Province/Manicaland
Matabeleland North 0.375** 0.192 0.347* 0.364** 0.347* 0.306* 0.389** 0.340*
Matabeleland South 0.732*** 0.460*** 0.599*** 0.609*** 0.599*** 0.581*** 0.639*** 0.622***
Masvingo 0.660*** 0.592*** 0.625*** 0.630*** 0.625*** 0.633*** 0.669*** 0.668***
Constant 5.466*** 5.947*** 5.536*** 5.542*** 5.536*** 5.569*** 5.534*** 5.689***
Observations 1668 1676 1668 1668 1668 1668 1668 1668
r2 0.201 0.195 0.221 0.227 0.221 0.233 0.224 0.246
Log likelihood -3219.84 -3244.61 -3199.26 -3191.97 -3199.26 -3186.06 -3195.66 -3171.96
Asterisks denote levels of statistical significance: * p<0.10, ** p<0.05, *** p<0.01
Sources: ZimVAC. 2014. Household and community surveys.

Zimbabwe Resilience Research Report
APPENDIX D: RELATIONSHIPS BETWEEN HOUSEHOLD RESILIENCE CAPACITY ELEMENTS AND WELL-BEING OUTCOMES 69
Table 31: Relationships between household resilience capacity elements and per capita daily expenditures 2014
Per capita daily expenditures (USD2016) (GLM) 2014
Shocks
Maize meal price -1.205 -1.489 -1.553 -1.538 -1.553 -1.621** -1.678 -2.155**
Goat prices -0.003 -0.007 -0.005 -0.003 -0.005 -0.009 -0.005 -0.009
Drought -0.003*** -0.002** -0.003*** -0.003*** -0.003*** -0.003*** -0.003*** -0.003***
HH resilience capacity elements
Cereal stores 0.000
Livestock assets 0.029***
Education HH head 0.199***
Count of livelihoods 0.233**
Remittances -0.021
Savings 0.002***
HH sold crops to markets, GMB, traders, contractors 0.292
HH resilience capacity 0.017***
DFSA wards -0.054 -0.104 -0.101 -0.086 -0.101 -0.062 -0.093 -0.143
CSI -0.009*** -0.007** -0.008** -0.008** -0.008** -0.006** -0.008** -0.004
Negative coping -0.012 -0.000 0.024 0.037 0.024 0.034 0.020 0.009
Household characteristics
Household size -0.175*** -0.192*** -0.178*** -0.174*** -0.178*** -0.170*** -0.178*** -0.165***
Female head HH -0.105 -0.115 -0.068 -0.040 -0.068 0.035 -0.048 0.067
Child HH -0.374 -0.184 0.086 0.166 0.086 -0.294 0.117 0.086
Male head HH -0.206 -0.245 -0.168 -0.107 -0.168 -0.049 -0.165 -0.082
Education HH head 0.202*** 0.200*** 0.204*** 0.199*** 0.217*** 0.192*** 0.147***
Age HH head -0.000 -0.001 -0.002 -0.001 -0.002 -0.001 -0.002 -0.002
Livelihood risk category/No regular livelihoods
Climate 0.343** 0.285** 0.293** 0.015 0.293** 0.224 0.277* 0.139
Econ-Salary 0.723*** 0.701*** 0.678*** 0.407 0.678*** 0.578*** 0.697*** 0.499**
Econ-Wages & trade 0.156* 0.144 0.140 -0.142 0.140 0.227** 0.116 0.088
Climate-econ 0.376*** 0.357** 0.316** -0.239 0.316** 0.409*** 0.259 0.171
Mining -0.240 -0.093 -0.266 -0.697* -0.266 -0.136 -0.252 -0.351
Asset terciles/Lowest tercile
Middle tercile 0.222 0.269 0.222 0.148 0.242 0.198
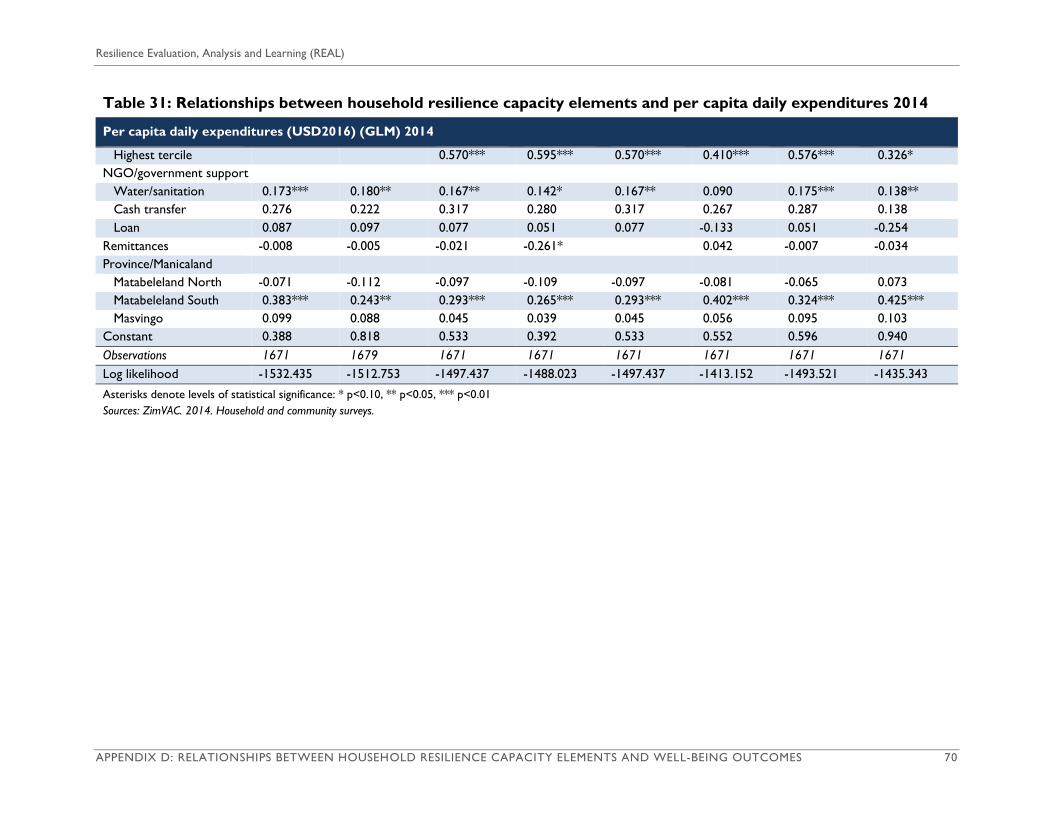
Resilience Evaluation, Analysis and Learning (REAL)
APPENDIX D: RELATIONSHIPS BETWEEN HOUSEHOLD RESILIENCE CAPACITY ELEMENTS AND WELL-BEING OUTCOMES 70
Table 31: Relationships between household resilience capacity elements and per capita daily expenditures 2014
Per capita daily expenditures (USD2016) (GLM) 2014
Highest tercile 0.570*** 0.595*** 0.570*** 0.410*** 0.576*** 0.326*
NGO/government support
Water/sanitation 0.173*** 0.180** 0.167** 0.142* 0.167** 0.090 0.175*** 0.138**
Cash transfer 0.276 0.222 0.317 0.280 0.317 0.267 0.287 0.138
Loan 0.087 0.097 0.077 0.051 0.077 -0.133 0.051 -0.254
Remittances -0.008 -0.005 -0.021 -0.261* 0.042 -0.007 -0.034
Province/Manicaland
Matabeleland North -0.071 -0.112 -0.097 -0.109 -0.097 -0.081 -0.065 0.073
Matabeleland South 0.383*** 0.243** 0.293*** 0.265*** 0.293*** 0.402*** 0.324*** 0.425***
Masvingo 0.099 0.088 0.045 0.039 0.045 0.056 0.095 0.103
Constant 0.388 0.818 0.533 0.392 0.533 0.552 0.596 0.940
Observations 1671 1679 1671 1671 1671 1671 1671 1671
Log likelihood -1532.435 -1512.753 -1497.437 -1488.023 -1497.437 -1413.152 -1493.521 -1435.343
Asterisks denote levels of statistical significance: * p<0.10, ** p<0.05, *** p<0.01
Sources: ZimVAC. 2014. Household and community surveys.

Zimbabwe Resilience Research Report
APPENDIX D: RELATIONSHIPS BETWEEN HOUSEHOLD RESILIENCE CAPACITY ELEMENTS AND WELL-BEING OUTCOMES 71
Table 32: Relationships between household resilience capacity elements and moderate to severe hunger 2014
p(Moderate to severe hunger) (logit) 2014
Shocks
Maize meal price 2.173*** 2.369*** 2.505*** 1.963*** 2.021*** 2.042*** 2.025*** 2.040***
Goat prices -0.040*** -0.037** -0.037** -0.033** -0.034** -0.033** -0.034** -0.034**
Drought 0.003 0.003* 0.004* 0.003 0.003 0.003 0.003 0.003
HH resilience capacity elements
Cereal stores -0.006***
Livestock assets
-0.141***
Education HH head
-0.246***
Count of livelihoods
0.362
Remittances
-0.316
Savings
-0.005*
HH sold crops to markets, GMB, traders, contractors
-0.111
HH resilience capacity
-0.029*
DFSA wards 0.060 -0.032 0.049 0.047 0.067 0.047 0.064 0.059
Negative coping 1.080*** 1.007*** 1.073***
Household characteristics
Household size 0.001 0.008 0.018 0.040 0.042 0.046 0.042 0.047
Female head HH -0.268 -0.317 -0.286 -0.252 -0.262 -0.258 -0.262 -0.276
Child HH 0.394 0.492 0.270 0.385 0.416 0.501 0.413 0.454
Male head HH -0.134 -0.073 -0.249 -0.202 -0.219 -0.178 -0.219 -0.210
Education HH head -0.274*** -0.245***
-0.282*** -0.279*** -0.258*** -0.279*** -0.151
Age HH head 0.003 0.006 0.006 0.005 0.005 0.005 0.005 0.005
Livelihood risk category/No regular livelihoods
Climate -0.433 -0.423 -0.396 -0.673* -0.273 -0.267 -0.272 -0.111
Econ-Salary -1.005 -0.916 -1.018 -1.465** -0.985 -0.776 -0.985 -0.684
Econ-Wages & trade -0.229 -0.306 -0.258 -0.611 -0.175 -0.177 -0.177 -0.022
Climate-econ -0.462 -0.492 -0.452 -1.186* -0.362 -0.368 -0.357 -0.044
Mining -0.300 -0.355 -0.282 -1.077 -0.383 -0.363 -0.385 -0.153
Asset terciles/Lowest tercile
Middle tercile
-0.889*** -0.760*** -0.759*** -0.749*** -0.759*** -0.721***
Highest tercile
-1.396*** -1.356*** -1.354*** -1.300*** -1.353*** -1.121***

Resilience Evaluation, Analysis and Learning (REAL)
APPENDIX D: RELATIONSHIPS BETWEEN HOUSEHOLD RESILIENCE CAPACITY ELEMENTS AND WELL-BEING OUTCOMES 72
Table 32: Relationships between household resilience capacity elements and moderate to severe hunger 2014
p(Moderate to severe hunger) (logit) 2014
NGO/government support
Water/sanitation -0.258** -0.137 -0.174 -0.241** -0.246** -0.222* -0.247** -0.239**
Cash transfer -1.570** -1.560** -1.520* -1.469** -1.488** -1.503** -1.488** -1.511**
Loan 0.861*** 0.884*** 0.923*** 0.994*** 1.019*** 1.014*** 1.022*** 1.037***
Remittances -0.291 -0.365 -0.361 -0.692**
-0.306 -0.316 -0.154
Province/Manicaland
Matabeleland North -0.382 -0.098 -0.275 -0.158 -0.186 -0.146 -0.191 -0.190
Matabeleland South -0.127 0.301 0.094 0.212 0.191 0.219 0.187 0.170
Masvingo -0.315 -0.135 -0.240 -0.089 -0.096 -0.101 -0.102 -0.125
Constant -1.309* -2.054*** -1.578** -1.203 -1.219 -1.255 -1.215 -1.312*
Observations 1671 1679 1671 1671 1671 1671 1671 1671
Log likelihood -514.453 -514.432 -501.962 -527.480 -528.544 -526.230 -528.525 -526.405
Asterisks denote levels of statistical significance: * p<0.10, ** p<0.05, *** p<0.01
Sources: ZimVAC. 2014. Household and community surveys.

Zimbabwe Resilience Research Report
APPENDIX D: RELATIONSHIPS BETWEEN HOUSEHOLD RESILIENCE CAPACITY ELEMENTS AND WELL-BEING OUTCOMES 73
Table 33: Relationships between household resilience capacity elements and adequate food consumption 2015
p(Adequate food consumption) (logit) 2015
Shocks
Drought -0.015*** -0.017*** -0.015*** -0.016*** -0.014*** -0.013** -0.016*** -0.017*** -0.015***
Goat prices 0.007 0.009 0.010 0.010 0.007 0.007 0.010 0.010 0.007
Maize meal price 0.016 -0.027 0.028 0.025 0.014 -0.045 0.029 0.037 0.034
HH resilience capacity elements
Cereal stores 0.005***
Livestock assets 0.066***
Adults w/gt primary educ 0.028
Count of livelihoods 0.032
Information 0.091***
Savings 0.004***
HH sold crops to markets, GMB, traders, contractors 0.279
HH sold livestock products to traders, CSC, markets, or contractors (%) 0.660**
HH resilience capacity 0.076***
DFSA wards 0.073 0.069 0.068 0.063 0.054 0.042 0.065 0.070 0.069
CSI -0.014*** -0.014*** -0.012*** -0.012*** -0.012*** -0.012*** -0.012*** -0.012*** -0.011***
Negative coping -0.189* -0.207** -0.169 -0.171 -0.166 -0.167 -0.167 -0.182* -0.186*
Household characteristics
Household size -0.033 -0.041 -0.062** -0.059** -0.066** -0.063** -0.061** -0.065** -0.080***
Female head
HH -0.357*** -0.316** -0.246* -0.258* -0.251* -0.255* -0.256* -0.262* -0.202
Male head HH 0.079 0.002 0.037 0.032 0.043 0.050 0.029 0.038 0.092
Educ HH head 0.148*** 0.150*** 0.129** 0.141*** 0.126** 0.139*** 0.140*** 0.145*** 0.081
Age HH head 0.004 0.002 -0.000 0.000 0.001 0.000 0.000 0.000 0.001
Livelihood risk categories/No regular livelihoods
Climate 0.467*** 0.436*** 0.391** 0.355 0.354** 0.388** 0.389** 0.356** 0.253
Econ-Salary 0.531* 0.472* 0.519* 0.478 0.491* 0.427 0.526* 0.534* 0.385
Econ-
Wages/trade 0.278* 0.249* 0.292** 0.251 0.261* 0.273* 0.292** 0.289* 0.196
Climate-econ 0.456*** 0.491*** 0.470*** 0.401 0.446*** 0.440*** 0.467*** 0.469*** 0.266
Mining 1.248* 1.262* 1.337* 1.286* 1.318* 1.375* 1.338* 1.385* 1.311*

Resilience Evaluation, Analysis and Learning (REAL)
APPENDIX D: RELATIONSHIPS BETWEEN HOUSEHOLD RESILIENCE CAPACITY ELEMENTS AND WELL-BEING OUTCOMES 74
Table 33: Relationships between household resilience capacity elements and adequate food consumption 2015
p(Adequate food consumption) (logit) 2015
Asset terciles/ Lowest tercile
Middle tercile 0.709*** 0.706*** 0.695*** 0.703*** 0.707*** 0.711*** 0.624***
Highest tercile 1.388*** 1.385*** 1.356*** 1.306*** 1.388*** 1.349*** 1.000***
NGO/government support
FSN 0.205* 0.235** 0.200* 0.205* 0.162 0.226* 0.203* 0.184 0.149
Ag/livestock
support 0.308*** 0.302*** 0.211* 0.211* 0.081 0.202* 0.202* 0.204* 0.101
Cash transfer 0.063 0.050 0.126 0.120 0.182 0.134 0.124 0.167 0.232
Loan 0.334 0.333 0.336 0.335 0.290 0.321 0.339 0.343 0.308
Remittances 0.667*** 0.657*** 0.660*** 0.658*** 0.655*** 0.631*** 0.657*** 0.661*** 0.565***
Province/Manicaland
Matabeleland N. 0.362 0.166 0.195 0.195 0.329 0.195 0.217 0.249 0.346
Matabeleland S. 0.770*** 0.603** 0.505* 0.507* 0.651** 0.443 0.531* 0.561** 0.654**
Masvingo 0.349** 0.388** 0.341* 0.339* 0.394** 0.348** 0.357** 0.417** 0.468***
Constant -1.792*** -1.795*** -1.886*** -1.900*** -1.852*** -1.654*** -1.930*** -2.025*** -1.910***
Observations 1795 1795 1795 1795 1795 1794 1795 1795 1794
Log likelihood -1085.555 -1094.382 -1061.691 -1061.757 -1054.611 -1053.179 -1061.371 -1058.322 -1049.699
Asterisks denote levels of statistical significance: * p<0.10, ** p<0.05, *** p<0.01
Sources: ZimVAC. 2015 Household and community surveys. AFDM 2017.

Zimbabwe Resilience Research Report
APPENDIX D: RELATIONSHIPS BETWEEN HOUSEHOLD RESILIENCE CAPACITY ELEMENTS AND WELL-BEING OUTCOMES 75
Table 34: Relationships between household resilience capacity elements and HDDS 2015
HDDS (OLS) 2015
Shocks Drought -0.011*** -0.013*** -0.010*** -0.011*** -0.010** -0.010*** -0.011*** -0.011*** -0.010***
Goat prices 0.021*** 0.021*** 0.022*** 0.022*** 0.020*** 0.022*** 0.022*** 0.022*** 0.021***
Maize meal price 0.058 0.006 0.061 0.039 0.030 0.031 0.047 0.043 0.047
HH resilience capacity elements
Cereal stores 0.003*** Livestock assets 0.027*** Adults w/gt primary education 0.129***
Count of livelihoods -0.043
Information 0.050*** Savings 0.000 HH sold crops to markets, GMB, traders, contractors 0.296 HH sold livestock products to traders, CSC, markets, or contractors (%) 0.132
HH resilience capacity 0.032***
DFSA wards -0.001 -0.025 -0.016 -0.035 -0.038 -0.037 -0.034 -0.034 -0.031
CSI -0.013*** -0.014*** -0.012*** -0.012*** -0.012*** -0.012*** -0.012*** -0.012*** -0.012***
Negative coping -0.278*** -0.292*** -0.272*** -0.264*** -0.267*** -0.267*** -0.266*** -0.270*** -0.273***
Household characteristics
Household size -0.059*** -0.061*** -0.089*** -0.075*** -0.078*** -0.075*** -0.076*** -0.076*** -0.084***
Female head HH -0.235** -0.238** -0.113 -0.165* -0.162* -0.165* -0.163* -0.165* -0.138
Male head HH -0.340* -0.394** -0.355* -0.387** -0.374** -0.382** -0.387** -0.383** -0.353*
Education HH head 0.119*** 0.116*** 0.051 0.109*** 0.096*** 0.107*** 0.106*** 0.108*** 0.077**
Age HH head 0.000 -0.000 -0.003 -0.003 -0.002 -0.003 -0.002 -0.002 -0.002
Livelihood risk categories/No regular livelihoods
Climate 0.096 0.101 0.037 0.083 0.011 0.032 0.032 0.027 -0.036
Econ-Salary 0.674*** 0.606*** 0.624*** 0.682*** 0.609*** 0.608*** 0.633*** 0.627*** 0.522**
Econ-Wages & trade 0.144 0.112 0.152 0.191 0.123 0.139 0.144 0.140 0.100
Climate-econ 0.217* 0.223* 0.184 0.280 0.170 0.183 0.181 0.184 0.095
Mining 0.112 0.046 0.106 0.146 0.070 0.091 0.100 0.100 0.065
Asset terciles/Lowest tercile
Middle tercile 0.294*** 0.294*** 0.278*** 0.291*** 0.290*** 0.291*** 0.255***
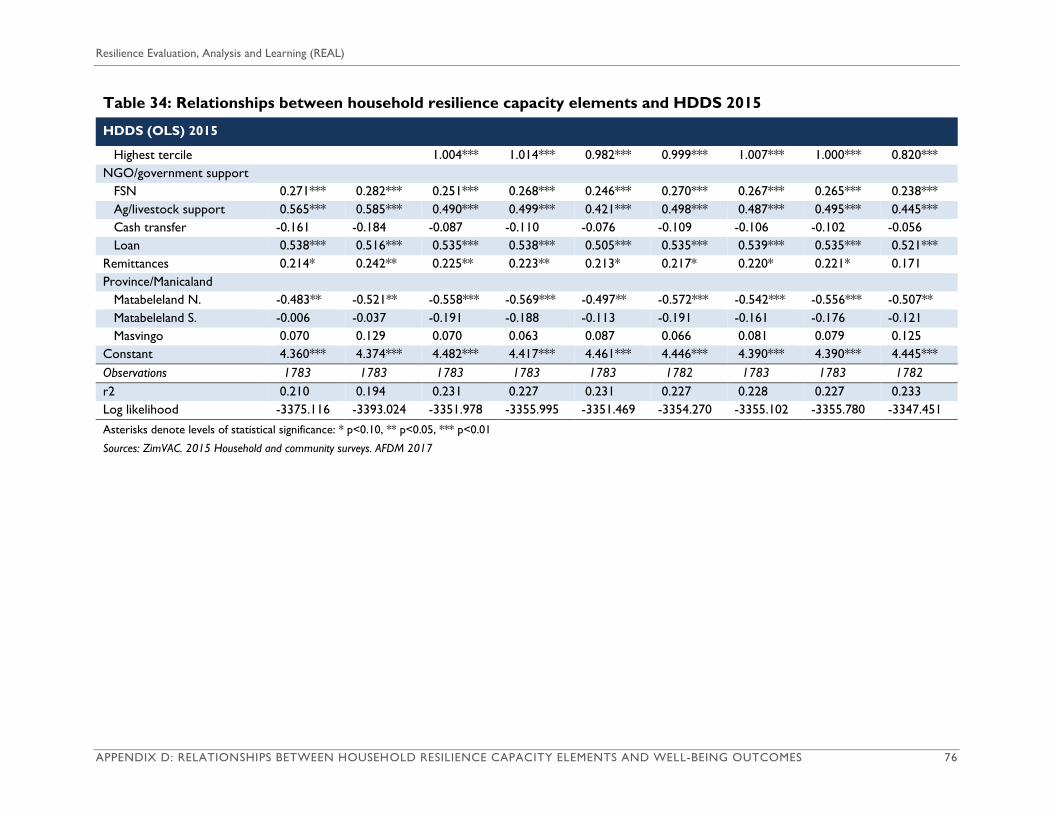
Resilience Evaluation, Analysis and Learning (REAL)
APPENDIX D: RELATIONSHIPS BETWEEN HOUSEHOLD RESILIENCE CAPACITY ELEMENTS AND WELL-BEING OUTCOMES 76
Table 34: Relationships between household resilience capacity elements and HDDS 2015
HDDS (OLS) 2015
Highest tercile 1.004*** 1.014*** 0.982*** 0.999*** 1.007*** 1.000*** 0.820***
NGO/government support
FSN 0.271*** 0.282*** 0.251*** 0.268*** 0.246*** 0.270*** 0.267*** 0.265*** 0.238***
Ag/livestock support 0.565*** 0.585*** 0.490*** 0.499*** 0.421*** 0.498*** 0.487*** 0.495*** 0.445***
Cash transfer -0.161 -0.184 -0.087 -0.110 -0.076 -0.109 -0.106 -0.102 -0.056
Loan 0.538*** 0.516*** 0.535*** 0.538*** 0.505*** 0.535*** 0.539*** 0.535*** 0.521***
Remittances 0.214* 0.242** 0.225** 0.223** 0.213* 0.217* 0.220* 0.221* 0.171
Province/Manicaland
Matabeleland N. -0.483** -0.521** -0.558*** -0.569*** -0.497** -0.572*** -0.542*** -0.556*** -0.507**
Matabeleland S. -0.006 -0.037 -0.191 -0.188 -0.113 -0.191 -0.161 -0.176 -0.121
Masvingo 0.070 0.129 0.070 0.063 0.087 0.066 0.081 0.079 0.125
Constant 4.360*** 4.374*** 4.482*** 4.417*** 4.461*** 4.446*** 4.390*** 4.390*** 4.445***
Observations 1783 1783 1783 1783 1783 1782 1783 1783 1782
r2 0.210 0.194 0.231 0.227 0.231 0.227 0.228 0.227 0.233
Log likelihood -3375.116 -3393.024 -3351.978 -3355.995 -3351.469 -3354.270 -3355.102 -3355.780 -3347.451
Asterisks denote levels of statistical significance: * p<0.10, ** p<0.05, *** p<0.01
Sources: ZimVAC. 2015 Household and community surveys. AFDM 2017
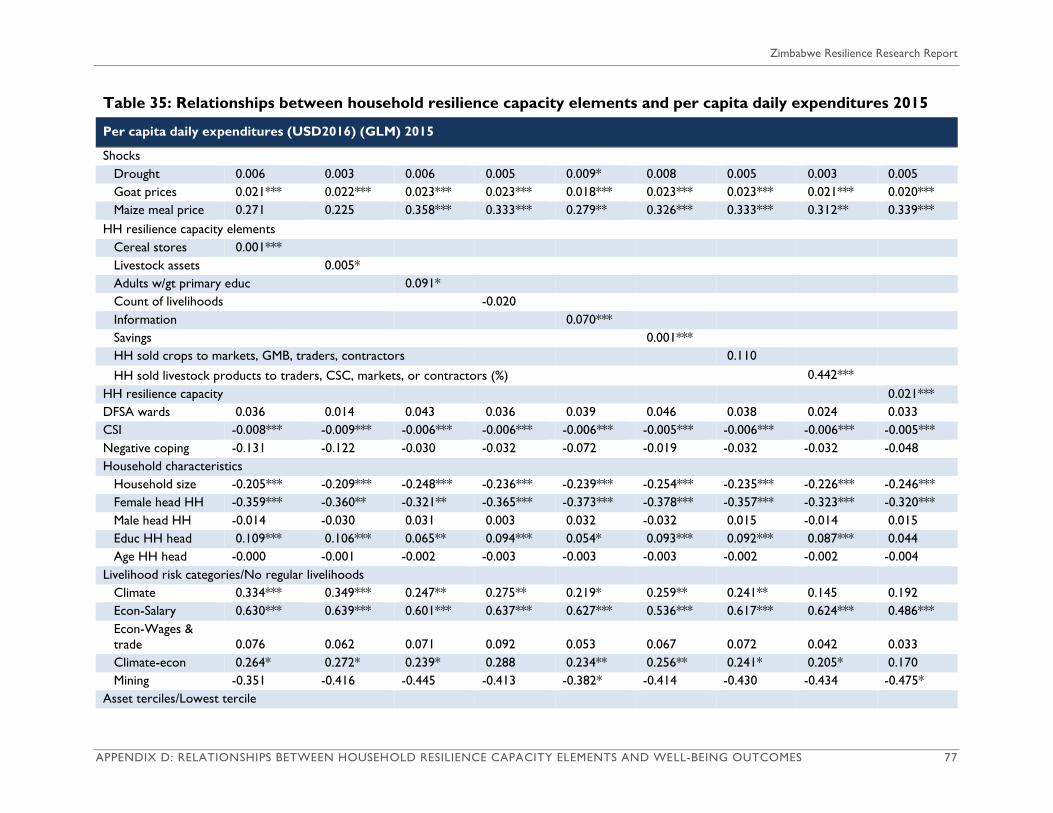
Zimbabwe Resilience Research Report
APPENDIX D: RELATIONSHIPS BETWEEN HOUSEHOLD RESILIENCE CAPACITY ELEMENTS AND WELL-BEING OUTCOMES 77
Table 35: Relationships between household resilience capacity elements and per capita daily expenditures 2015
Per capita daily expenditures (USD2016) (GLM) 2015
Shocks
Drought 0.006 0.003 0.006 0.005 0.009* 0.008 0.005 0.003 0.005
Goat prices 0.021*** 0.022*** 0.023*** 0.023*** 0.018*** 0.023*** 0.023*** 0.021*** 0.020***
Maize meal price 0.271 0.225 0.358*** 0.333*** 0.279** 0.326*** 0.333*** 0.312** 0.339***
HH resilience capacity elements
Cereal stores 0.001***
Livestock assets 0.005*
Adults w/gt primary educ 0.091*
Count of livelihoods -0.020
Information 0.070***
Savings 0.001***
HH sold crops to markets, GMB, traders, contractors 0.110
HH sold livestock products to traders, CSC, markets, or contractors (%) 0.442***
HH resilience capacity 0.021***
DFSA wards 0.036 0.014 0.043 0.036 0.039 0.046 0.038 0.024 0.033
CSI -0.008*** -0.009*** -0.006*** -0.006*** -0.006*** -0.005*** -0.006*** -0.006*** -0.005***
Negative coping -0.131 -0.122 -0.030 -0.032 -0.072 -0.019 -0.032 -0.032 -0.048
Household characteristics
Household size -0.205*** -0.209*** -0.248*** -0.236*** -0.239*** -0.254*** -0.235*** -0.226*** -0.246***
Female head HH -0.359*** -0.360** -0.321** -0.365*** -0.373*** -0.378*** -0.357*** -0.323*** -0.320***
Male head HH -0.014 -0.030 0.031 0.003 0.032 -0.032 0.015 -0.014 0.015
Educ HH head 0.109*** 0.106*** 0.065** 0.094*** 0.054* 0.093*** 0.092*** 0.087*** 0.044
Age HH head -0.000 -0.001 -0.002 -0.003 -0.003 -0.003 -0.002 -0.002 -0.004
Livelihood risk categories/No regular livelihoods
Climate 0.334*** 0.349*** 0.247** 0.275** 0.219* 0.259** 0.241** 0.145 0.192
Econ-Salary 0.630*** 0.639*** 0.601*** 0.637*** 0.627*** 0.536*** 0.617*** 0.624*** 0.486***
Econ-Wages &
trade 0.076 0.062 0.071 0.092 0.053 0.067 0.072 0.042 0.033
Climate-econ 0.264* 0.272* 0.239* 0.288 0.234** 0.256** 0.241* 0.205* 0.170
Mining -0.351 -0.416 -0.445 -0.413 -0.382* -0.414 -0.430 -0.434 -0.475*
Asset terciles/Lowest tercile

Resilience Evaluation, Analysis and Learning (REAL)
APPENDIX D: RELATIONSHIPS BETWEEN HOUSEHOLD RESILIENCE CAPACITY ELEMENTS AND WELL-BEING OUTCOMES 78
Table 35: Relationships between household resilience capacity elements and per capita daily expenditures 2015
Per capita daily expenditures (USD2016) (GLM) 2015
Middle tercile 0.395*** 0.390*** 0.386*** 0.397*** 0.387*** 0.389*** 0.364***
Highest tercile 0.678*** 0.677*** 0.628*** 0.671*** 0.678*** 0.606*** 0.518***
NGO/government support
FSN 0.076 0.067 0.066 0.066 0.053 0.048 0.064 0.062 -0.003
Ag/livestock
support 0.280*** 0.315*** 0.207*** 0.209*** 0.064 0.188** 0.214*** 0.169** 0.195**
Cash transfer -0.103 -0.126 -0.036 -0.055 0.040 -0.007 -0.054 -0.014 0.028
Loan 0.506*** 0.462*** 0.558*** 0.567*** 0.466*** 0.576*** 0.564*** 0.534*** 0.498***
Remittances 0.268*** 0.282*** 0.267*** 0.269*** 0.301*** 0.276*** 0.263*** 0.246** 0.212**
Province/Manicaland
Matabeleland N. -1.055*** -1.001*** -1.129*** -1.139*** -0.995*** -1.169*** -1.132*** -1.058*** -1.034***
Matabeleland S. -0.284 -0.226 -0.426** -0.414* -0.327* -0.463** -0.409* -0.330* -0.285
Masvingo -0.356** -0.264 -0.327** -0.320** -0.322*** -0.296** -0.315** -0.245** -0.217
Constant -0.556 -0.715 -0.663 -0.717 -0.308 -0.451 -0.737 -0.789** -0.521
Observations 1795 1795 1795 1795 1795 1794 1795 1795 1794
Log likelihood -1106.064 -1110.581 -1036.854 -1044.215 -986.601 -991.541 -1043.699 -1010.573 -988.191
Asterisks denote levels of statistical significance: * p<0.10, ** p<0.05, *** p<0.01
Sources: ZimVAC. 2015. Household and community surveys. AFDM 2017
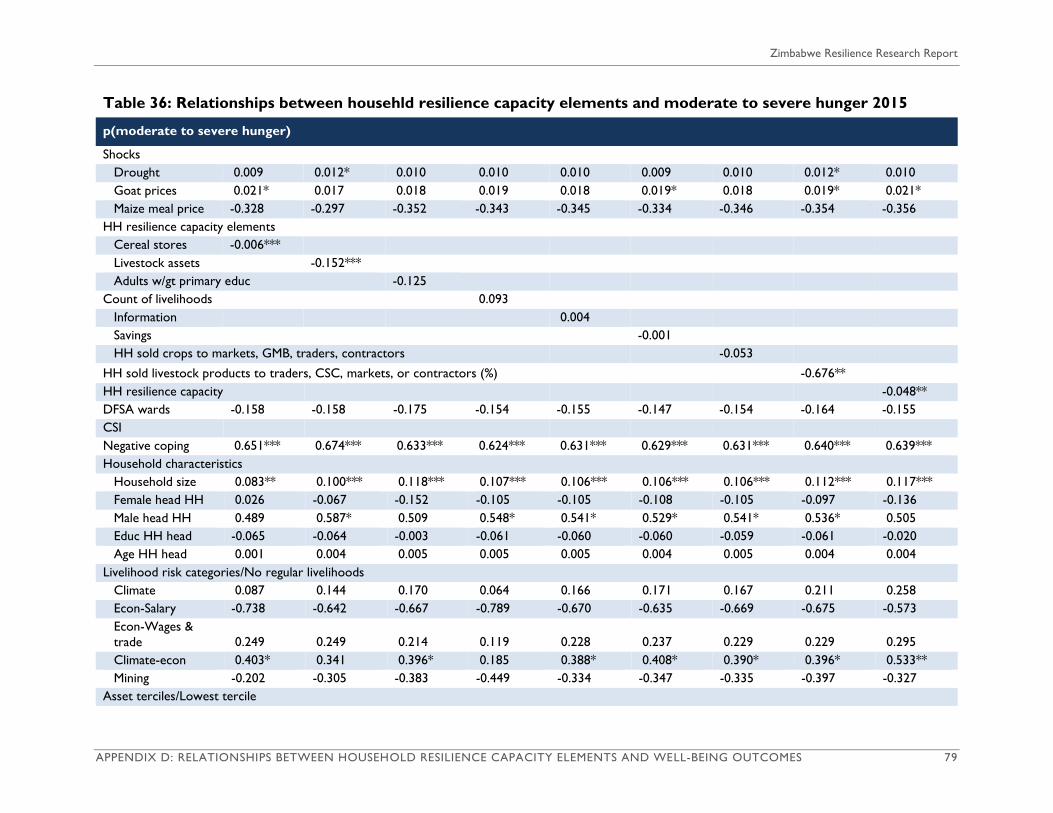
Zimbabwe Resilience Research Report
APPENDIX D: RELATIONSHIPS BETWEEN HOUSEHOLD RESILIENCE CAPACITY ELEMENTS AND WELL-BEING OUTCOMES 79
Table 36: Relationships between househld resilience capacity elements and moderate to severe hunger 2015
p(moderate to severe hunger)
Shocks Drought 0.009 0.012* 0.010 0.010 0.010 0.009 0.010 0.012* 0.010
Goat prices 0.021* 0.017 0.018 0.019 0.018 0.019* 0.018 0.019* 0.021*
Maize meal price -0.328 -0.297 -0.352 -0.343 -0.345 -0.334 -0.346 -0.354 -0.356
HH resilience capacity elements
Cereal stores -0.006*** Livestock assets -0.152*** Adults w/gt primary educ -0.125
Count of livelihoods 0.093 Information 0.004 Savings -0.001 HH sold crops to markets, GMB, traders, contractors -0.053
HH sold livestock products to traders, CSC, markets, or contractors (%) -0.676** HH resilience capacity -0.048**
DFSA wards -0.158 -0.158 -0.175 -0.154 -0.155 -0.147 -0.154 -0.164 -0.155
CSI Negative coping 0.651*** 0.674*** 0.633*** 0.624*** 0.631*** 0.629*** 0.631*** 0.640*** 0.639***
Household characteristics
Household size 0.083** 0.100*** 0.118*** 0.107*** 0.106*** 0.106*** 0.106*** 0.112*** 0.117***
Female head HH 0.026 -0.067 -0.152 -0.105 -0.105 -0.108 -0.105 -0.097 -0.136
Male head HH 0.489 0.587* 0.509 0.548* 0.541* 0.529* 0.541* 0.536* 0.505
Educ HH head -0.065 -0.064 -0.003 -0.061 -0.060 -0.060 -0.059 -0.061 -0.020
Age HH head 0.001 0.004 0.005 0.005 0.005 0.004 0.005 0.004 0.004
Livelihood risk categories/No regular livelihoods
Climate 0.087 0.144 0.170 0.064 0.166 0.171 0.167 0.211 0.258
Econ-Salary -0.738 -0.642 -0.667 -0.789 -0.670 -0.635 -0.669 -0.675 -0.573
Econ-Wages &
trade 0.249 0.249 0.214 0.119 0.228 0.237 0.229 0.229 0.295
Climate-econ 0.403* 0.341 0.396* 0.185 0.388* 0.408* 0.390* 0.396* 0.533**
Mining -0.202 -0.305 -0.383 -0.449 -0.334 -0.347 -0.335 -0.397 -0.327
Asset terciles/Lowest tercile

Resilience Evaluation, Analysis and Learning (REAL)
APPENDIX D: RELATIONSHIPS BETWEEN HOUSEHOLD RESILIENCE CAPACITY ELEMENTS AND WELL-BEING OUTCOMES 80
Table 36: Relationships between househld resilience capacity elements and moderate to severe hunger 2015
p(moderate to severe hunger)
Middle tercile -0.670*** -0.671*** -0.668*** -0.664*** -0.666*** -0.667*** -0.607***
Highest tercile -1.551*** -1.570*** -1.560*** -1.518*** -1.558*** -1.511*** -1.290***
NGO/government support
FSN -0.315** -0.339** -0.268* -0.288* -0.293* -0.297* -0.290* -0.267* -0.249
Ag/livestock
support 0.168 0.257* 0.292** 0.284* 0.283* 0.293** 0.290** 0.299** 0.363**
Cash transfer 0.135 0.053 -0.037 -0.001 0.003 -0.005 -0.000 -0.045 -0.070
Loan -0.012 -0.048 -0.014 -0.021 -0.023 -0.012 -0.021 -0.040 -0.006
Remittances 0.171 0.182 0.199 0.195 0.198 0.212 0.199 0.198 0.269
Province/Manicaland
Matabeleland N. -0.707** -0.411 -0.536 -0.532 -0.527 -0.522 -0.537 -0.590* -0.613*
Matabeleland S. -1.097*** -0.798** -0.853** -0.855** -0.849** -0.832** -0.860** -0.916*** -0.946***
Masvingo -1.397*** -1.410*** -1.398*** -1.394*** -1.388*** -1.392*** -1.393*** -1.467*** -1.463***
Constant -1.269* -1.222* -1.284* -1.224* -1.210* -1.280* -1.207* -1.115 -1.229*
Observations 1795 1795 1795 1795 1795 1794 1795 1795 1794
Log likelihood -710.576 -697.798 -690.958 -691.999 -692.135 -691.456 -692.131 -689.971 -689.211
Asterisks denote levels of statistical significance: * p<0.10, ** p<0.05, *** p<0.01
Sources: ZimVAC. 2015 Household and community surveys. AFDM 2017.

Zimbabwe Resilience Research Report
APPENDIX D: RELATIONSHIPS BETWEEN HOUSEHOLD RESILIENCE CAPACITY ELEMENTS AND WELL-BEING OUTCOMES 81
Table 37: Relationships between household resilience capacity elements and adequate food consumption 2016
p(Adequate food consumption) (logit) 2016
Shocks Drought -0.011* -0.014** -0.010 -0.0102 -0.00765 -0.00701 -0.00984 -0.008
Crop/livestock
shocks -0.074 -0.123** -0.136*** -0.136*** -0.135** -0.127** -0.134** -0.137***
DFSA wards -0.265*** -0.243** -0.258** -0.259** -0.260** -0.241** -0.259** -0.239**
CSI -0.019*** -0.017*** -0.0166*** -0.016*** -0.0160*** -0.0164*** -0.0165*** -0.017***
Negative coping -0.207** -0.214** -0.221** -0.220** -0.198** -0.207** -0.217** -0.204**
HH resilience capacity elements
Cereal stores 0.001*** Livestock assets 0.089*** Count of
livelihoods 0.117 Adults w/gt primary educ 0.159*** Savings 0.00393*** HH sold crops to markets, GMB, traders, contractors 1.042*** HH sold livestock products to traders, CSC, markets, or contractors (%) 0.0210
HH resilience capacity 0.046***
Household characteristics
Household size -0.017 -0.034* -0.0380* -0.0591*** -0.0361* -0.0389* -0.0382* -0.050**
Female head HH -0.091 -0.038 -0.0339 0.0265 -0.0384 -0.0312 -0.0353 0.004
Male head HH 0.285 0.262 0.266 0.291 0.309 0.250 0.260 0.304
Education HH head 0.229*** 0.222*** 0.243*** 0.170*** 0.236*** 0.247*** 0.245*** 0.197***
Age HH head 0.004 0.002 0.00173 0.000545 0.00177 0.00164 0.002 0.001
Livelihood risk categories/No regular livelihoods
Climate 0.277** 0.219 0.0936 0.212 0.223* 0.202 0.216 0.051
Econ-Salary 0.088 0.080 -0.119 0.0151 0.0201 0.0258 0.0307 -0.122
Econ-Wages &
trade 0.236* 0.257** 0.124 0.256** 0.266** 0.257** 0.256** 0.174
Climate-econ 0.319** 0.281** -0.0269 0.244* 0.224 0.246* 0.244* 0.0113
Asset terciles/lowest tercile
Middle tercile 0.504*** 0.507*** 0.489*** 0.501*** 0.506*** 0.461***

Resilience Evaluation, Analysis and Learning (REAL)
APPENDIX D: RELATIONSHIPS BETWEEN HOUSEHOLD RESILIENCE CAPACITY ELEMENTS AND WELL-BEING OUTCOMES 82
Table 37: Relationships between household resilience capacity elements and adequate food consumption 2016
p(Adequate food consumption) (logit) 2016
Highest tercile 1.108*** 1.108*** 1.064*** 1.094*** 1.110*** 0.831***
NGO/government support
Water/sanitation 0.298*** 0.231*** 0.206*** 0.192*** 0.199*** 0.218*** 0.208*** 0.206***
FSN 0.238** 0.283*** 0.266*** 0.264*** 0.264*** 0.264*** 0.262*** 0.270***
Ag/livestock
support 0.302*** 0.271*** 0.259*** 0.258*** 0.268*** 0.249*** 0.260*** 0.239**
Loan 0.044 0.070 0.0640 0.0627 0.0556 0.0538 0.0497 0.0515
Remittances 0.671** 0.605** 0.644** 0.661** 0.570** 0.637** 0.650** 0.433
Province/Manicaland
Matabeleland N. 0.221 -0.027 -0.0498 0.0219 -0.139 -0.0413 -0.0545 -0.081
Matabeleland S. 0.889*** 0.726*** 0.673*** 0.724*** 0.612*** 0.666*** 0.670*** 0.660***
Masvingo 1.347*** 1.308*** 1.221*** 1.204*** 1.185*** 1.224*** 1.220*** 1.233***
Constant -2.019*** -1.899*** -1.912*** -1.777*** -1.851*** -1.864*** -1.927*** -1.777***
Observations 2349 2349 2349 2349 2349 2349 2349 2349
Log likelihood -1454.998 -1430.308 -1415.3 -1411.1 -1407.9 -1412.0 -1415.8 -1405.6
Asterisks denote levels of statistical significance: * p<0.10, ** p<0.05, *** p<0.01
Sources: ZimVAC. 2016. Household surveys AFDM 2017.

Zimbabwe Resilience Research Report
APPENDIX D: RELATIONSHIPS BETWEEN HOUSEHOLD RESILIENCE CAPACITY ELEMENTS AND WELL-BEING OUTCOMES 83
Table 38: Relationships between household resilience capacity elements and HDDS 2016
HDDS (OLS) 2016
Shocks Drought -0.035*** -0.037*** -0.0325*** -0.0332*** -0.0316*** -0.0299*** -0.0331*** -0.0317***
Crop/livestock shocks -0.130*** -0.150*** -0.181*** -0.178*** -0.175*** -0.167*** -0.177*** -0.179***
DFSA wards -0.214*** -0.196** -0.201** -0.203*** -0.199** -0.182** -0.203*** -0.188**
CSI -0.011*** -0.010*** -0.00920*** -0.00879*** -0.00880*** -0.00883*** -0.00897*** -0.00899***
Negative coping -0.192*** -0.197*** -0.200*** -0.196*** -0.186*** -0.183*** -0.194*** -0.185***
HH resilience capacity elements
Cereal stores 0.001*** Livestock assets 0.044*** Count of livelihoods 0.264*** Adults w/gt primary educ 0.102*** Savings 0.00152*** HH sold crops to markets, GMB, traders, contractors 1.039*** HH sold livestock products to traders, CSC, markets, or contractors (%) 0.0445
HH resilience capacity 0.0320***
Household characteristics
Household size -0.020 -0.028* -0.0350** -0.0488*** -0.0325** -0.0362** -0.0356** -0.0430***
Female head HH -0.110 -0.087 -0.0601 -0.0247 -0.0695 -0.0576 -0.0630 -0.0348
Male head HH 0.085 0.073 0.0636 0.0714 0.0757 0.0410 0.0491 0.0880
Education HH head 0.166*** 0.161*** 0.169*** 0.129*** 0.168*** 0.178*** 0.174*** 0.139***
Age HH head 0.005** 0.004* 0.00276 0.00197 0.00253 0.00258 0.00262 0.00196
Livelihood risk categories/No regular livelihoods
Climate 0.505*** 0.477*** 0.173 0.445*** 0.449*** 0.434*** 0.449*** 0.330***
Econ-Salary 0.517*** 0.497*** 0.118 0.441** 0.444** 0.444*** 0.451*** 0.346**
Econ-Wages & trade 0.162* 0.168* -0.136 0.160* 0.167* 0.164* 0.162* 0.105
Climate-econ 0.674*** 0.663*** -0.00703 0.601*** 0.591*** 0.609*** 0.603*** 0.439***
Mining 0.924 0.952 0.481 0.821 0.821 0.818 0.819 0.733
Asset terciles/lowest tercile 0 0 0 0 0 0
Middle tercile 0.616*** 0.620*** 0.608*** 0.614*** 0.620*** 0.587***
Highest tercile 0.980*** 0.984*** 0.962*** 0.968*** 0.985*** 0.784***
NGO/Government support

Resilience Evaluation, Analysis and Learning (REAL)
APPENDIX D: RELATIONSHIPS BETWEEN HOUSEHOLD RESILIENCE CAPACITY ELEMENTS AND WELL-BEING OUTCOMES 84
Table 38: Relationships between household resilience capacity elements and HDDS 2016
HDDS (OLS) 2016
Water/sanitation 0.286*** 0.248*** 0.204*** 0.199*** 0.206*** 0.218*** 0.208*** 0.206***
NGO/government support
FSN 0.084 0.099 0.0962 0.0864 0.0869 0.0868 0.0858 0.0914
Ag/livestock support 0.255*** 0.235*** 0.207*** 0.212*** 0.210*** 0.200*** 0.213*** 0.193***
Loan 0.189 0.217 0.214 0.194 0.182 0.195 0.188 0.189
Remittances 0.632*** 0.625*** 0.584*** 0.601*** 0.543*** 0.576*** 0.595*** 0.437**
Province/Manicaland 0.000 0.000 0 0 0 0 0 0
Matabeleland North 0.358** 0.257 0.129 0.165 0.0807 0.128 0.118 0.101
Matabeleland South 1.037*** 0.961*** 0.835*** 0.863*** 0.801*** 0.824*** 0.830*** 0.820***
Masvingo 1.034*** 1.043*** 0.901*** 0.882*** 0.884*** 0.898*** 0.898*** 0.908***
Constant 2.633*** 2.643*** 2.723*** 2.782*** 2.745*** 2.762*** 2.686*** 2.815***
Observations 2353 2353 2353 2353 2353 2353 2353 2353
r2 0.170 0.176 0.209 0.208 0.211 0.211 0.206 0.214
Log likelihood -4565.170 -4556.088 -4508.0 -4509.3 -4505.5 -4505.1 -4512.7 -4501.3
Asterisks denote levels of statistical significance: * p<0.10, ** p<0.05, *** p<0.01
Sources: ZimVAC. 2016. Household surveys. AFDM 2017.
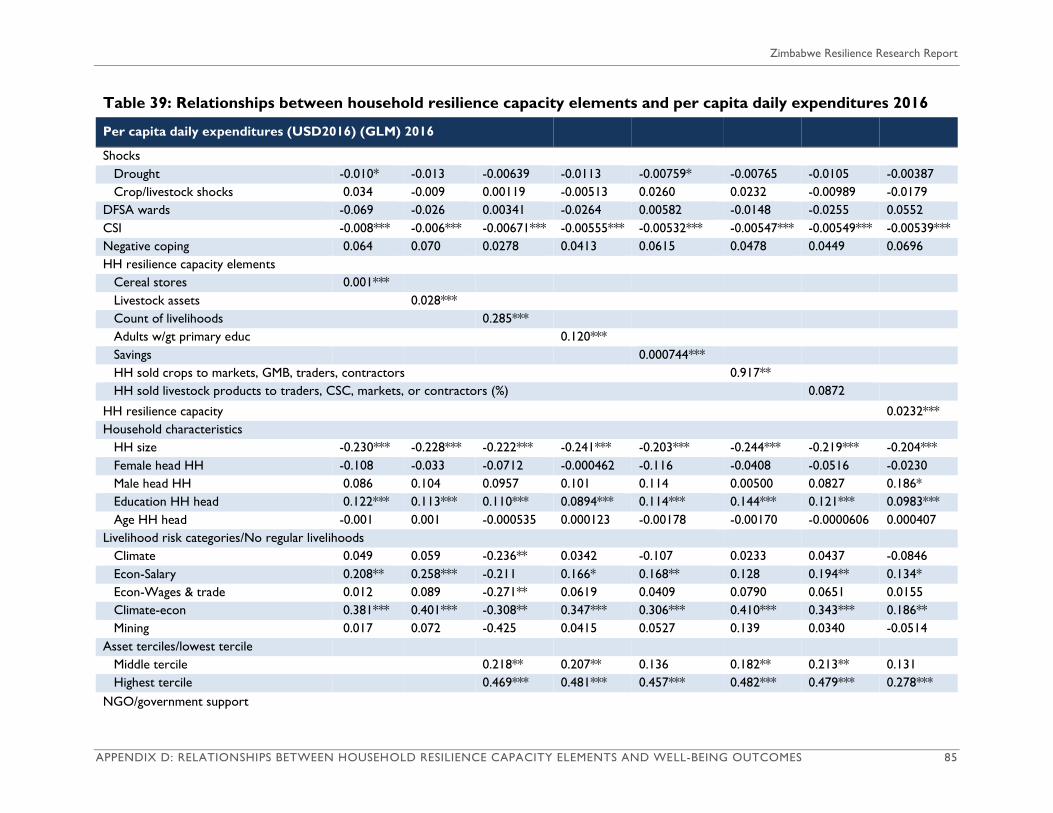
Zimbabwe Resilience Research Report
APPENDIX D: RELATIONSHIPS BETWEEN HOUSEHOLD RESILIENCE CAPACITY ELEMENTS AND WELL-BEING OUTCOMES 85
Table 39: Relationships between household resilience capacity elements and per capita daily expenditures 2016
Per capita daily expenditures (USD2016) (GLM) 2016
Shocks Drought -0.010* -0.013 -0.00639 -0.0113 -0.00759* -0.00765 -0.0105 -0.00387
Crop/livestock shocks 0.034 -0.009 0.00119 -0.00513 0.0260 0.0232 -0.00989 -0.0179
DFSA wards -0.069 -0.026 0.00341 -0.0264 0.00582 -0.0148 -0.0255 0.0552
CSI -0.008*** -0.006*** -0.00671*** -0.00555*** -0.00532*** -0.00547*** -0.00549*** -0.00539***
Negative coping 0.064 0.070 0.0278 0.0413 0.0615 0.0478 0.0449 0.0696
HH resilience capacity elements
Cereal stores 0.001*** Livestock assets 0.028*** Count of livelihoods 0.285*** Adults w/gt primary educ 0.120*** Savings 0.000744*** HH sold crops to markets, GMB, traders, contractors 0.917** HH sold livestock products to traders, CSC, markets, or contractors (%) 0.0872
HH resilience capacity 0.0232***
Household characteristics
HH size -0.230*** -0.228*** -0.222*** -0.241*** -0.203*** -0.244*** -0.219*** -0.204***
Female head HH -0.108 -0.033 -0.0712 -0.000462 -0.116 -0.0408 -0.0516 -0.0230
Male head HH 0.086 0.104 0.0957 0.101 0.114 0.00500 0.0827 0.186*
Education HH head 0.122*** 0.113*** 0.110*** 0.0894*** 0.114*** 0.144*** 0.121*** 0.0983***
Age HH head -0.001 0.001 -0.000535 0.000123 -0.00178 -0.00170 -0.0000606 0.000407
Livelihood risk categories/No regular livelihoods
Climate 0.049 0.059 -0.236** 0.0342 -0.107 0.0233 0.0437 -0.0846
Econ-Salary 0.208** 0.258*** -0.211 0.166* 0.168** 0.128 0.194** 0.134*
Econ-Wages & trade 0.012 0.089 -0.271** 0.0619 0.0409 0.0790 0.0651 0.0155
Climate-econ 0.381*** 0.401*** -0.308** 0.347*** 0.306*** 0.410*** 0.343*** 0.186**
Mining 0.017 0.072 -0.425 0.0415 0.0527 0.139 0.0340 -0.0514
Asset terciles/lowest tercile
Middle tercile 0.218** 0.207** 0.136 0.182** 0.213** 0.131
Highest tercile 0.469*** 0.481*** 0.457*** 0.482*** 0.479*** 0.278***
NGO/government support

Resilience Evaluation, Analysis and Learning (REAL)
APPENDIX D: RELATIONSHIPS BETWEEN HOUSEHOLD RESILIENCE CAPACITY ELEMENTS AND WELL-BEING OUTCOMES 86
Table 39: Relationships between household resilience capacity elements and per capita daily expenditures 2016
Per capita daily expenditures (USD2016) (GLM) 2016
Water/sanitation 0.097* 0.096* 0.0829 0.0856* 0.0762** 0.102*** 0.0896* 0.102***
FSN -0.209*** -0.222*** -0.158*** -0.198*** -0.204*** -0.215*** -0.189*** -0.166***
Ag/livestock support 0.221*** 0.187* 0.152 0.182** 0.154*** 0.183** 0.171* 0.0900
Loan 0.240*** 0.315*** 0.317*** 0.292*** 0.232** 0.311*** 0.284*** 0.273***
Remittances 0.304* 0.413** 0.301* 0.375** 0.252 0.312* 0.352** 0.255*
Province/Manicaland 0.000 0.000 0 0 0 0 0 0
Matabeleland North 0.340** 0.145 0.202 0.254* 0.225** 0.268 0.186 0.135
Matabeleland South 0.543*** 0.448*** 0.397*** 0.456*** 0.382*** 0.460*** 0.402*** 0.326***
Masvingo 0.161* 0.239*** 0.159** 0.171** 0.178** 0.197** 0.168** 0.177**
Constant -0.948*** -1.100*** -0.914*** -1.155*** -0.968*** -1.049*** -1.130*** -0.924***
Observations 2353 2353 2353 2353 2353 2353 2353 2353
Log likelihood -779.725 -830.313 -769.6 -810.1 -674.8 -761.4 -825.4 -576.1
Asterisks denote levels of statistical significance: * p<0.10, ** p<0.05, *** p<0.01
Sources: ZimVAC. 2016. Household surveys. AFDM 2017.

Zimbabwe Resilience Research Report
APPENDIX D: RELATIONSHIPS BETWEEN HOUSEHOLD RESILIENCE CAPACITY ELEMENTS AND WELL-BEING OUTCOMES 87
Table 40: Relationships between household resilience capacity elements and moderate to severe hunger 2016
p(Moderate to severe hunger)
Shocks Drought 0.054*** 0.056*** 0.0533*** 0.0542*** 0.0514*** 0.0529*** 0.0536*** 0.0533***
Crop and/or livestock shocks 0.139** 0.197*** 0.214*** 0.216*** 0.219*** 0.212*** 0.213*** 0.222***
DFSA wards -0.113 -0.140 -0.117 -0.127 -0.110 -0.118 -0.116 -0.128
CSI Negative coping 1.089*** 1.082*** 1.107*** 1.106*** 1.066*** 1.095*** 1.098*** 1.098***
HH resilience capacity elements
Cereal stores -0.002** Livestock assets -0.103*** Count of livelihoods -0.181 Adults w/gt primary educ -0.234***
Savings
-0.0109***
HH sold crops to markets, GMB, traders, contractors -0.337 HH sold livestock products to traders, CSC, markets, or contractors (%)
-0.0260
HH resilience capacity -0.0539***
Household characteristics
HH size 0.014 0.030 0.0305 0.0562** 0.0317 0.0304 0.0304 0.0446*
Female head HH -0.076 -0.138 -0.162 -0.242* -0.153 -0.160 -0.160 -0.201
Male head HH -0.036 -0.014 0.00515 -0.0310 -0.0381 0.00858 0.00712 -0.0300
Education HH head -0.198*** -0.185*** -0.208*** -0.0956 -0.192*** -0.209*** -0.209*** -0.150***
Age HH head -0.001 0.001 0.00234 0.00389 0.00214 0.00245 0.00242 0.00302
Livelihood risk categories/No regular livelihoods
Climate 0.118 0.212 0.397* 0.227 0.191 0.207 0.207 0.395**
Econ-Salary -0.414 -0.360 -0.0913 -0.285 -0.259 -0.308 -0.309 -0.139
Econ-Wages & trade -0.092 -0.088 0.110 -0.0865 -0.111 -0.0929 -0.0932 0.00933
Climate-econ -0.438*** -0.377** 0.0559 -0.351** -0.316* -0.363** -0.363** -0.0932
Mining -0.290 -0.348 0.0481 -0.186 -0.219 -0.183 -0.184 -0.0333
Asset terciles/lowest tercile
Middle tercile -0.698*** -0.695*** -0.681*** -0.699*** -0.699*** -0.651***
Highest tercile -1.227*** -1.218*** -1.154*** -1.226*** -1.226*** -0.914***
NGO/government support
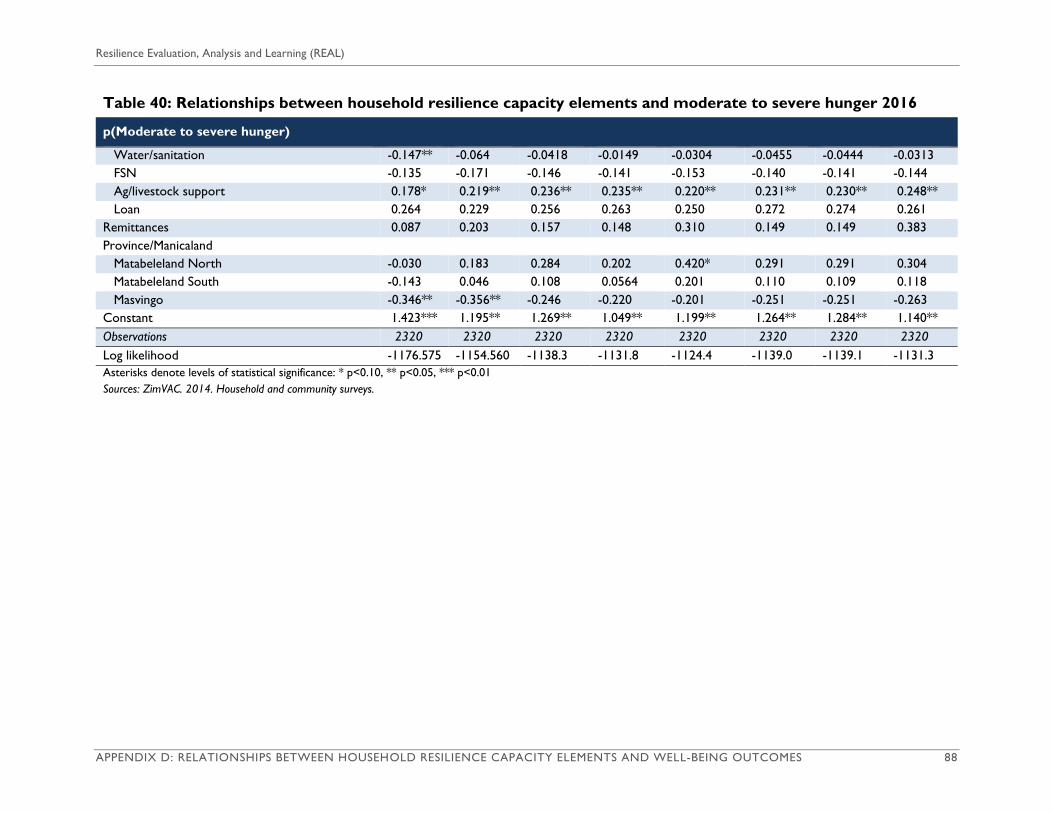
Resilience Evaluation, Analysis and Learning (REAL)
APPENDIX D: RELATIONSHIPS BETWEEN HOUSEHOLD RESILIENCE CAPACITY ELEMENTS AND WELL-BEING OUTCOMES 88
Table 40: Relationships between household resilience capacity elements and moderate to severe hunger 2016
p(Moderate to severe hunger)
Water/sanitation -0.147** -0.064 -0.0418 -0.0149 -0.0304 -0.0455 -0.0444 -0.0313
FSN -0.135 -0.171 -0.146 -0.141 -0.153 -0.140 -0.141 -0.144
Ag/livestock support 0.178* 0.219** 0.236** 0.235** 0.220** 0.231** 0.230** 0.248**
Loan 0.264 0.229 0.256 0.263 0.250 0.272 0.274 0.261
Remittances 0.087 0.203 0.157 0.148 0.310 0.149 0.149 0.383
Province/Manicaland
Matabeleland North -0.030 0.183 0.284 0.202 0.420* 0.291 0.291 0.304
Matabeleland South -0.143 0.046 0.108 0.0564 0.201 0.110 0.109 0.118
Masvingo -0.346** -0.356** -0.246 -0.220 -0.201 -0.251 -0.251 -0.263
Constant 1.423*** 1.195** 1.269** 1.049** 1.199** 1.264** 1.284** 1.140**
Observations 2320 2320 2320 2320 2320 2320 2320 2320
Log likelihood -1176.575 -1154.560 -1138.3 -1131.8 -1124.4 -1139.0 -1139.1 -1131.3
Asterisks denote levels of statistical significance: * p<0.10, ** p<0.05, *** p<0.01
Sources: ZimVAC. 2014. Household and community surveys.

Zimbabwe Resilience Research Report
APPENDIX E: COMPARING THE EFFECTS OF EXPLANATORY VARIABLES 89
Appendix E: Comparing the effects of explanatory variables
Figures that follow in this section compare explanatory variables in terms of the magnitude of their
effects on coping strategies and outcomes (elasticities). Figures show the change in dependent
variables43: resulting from a one percent change in each explanatory variable. Figures allow for
comparison among variables and across outcomes. Data come from regression equations (tables
are included in Appendix 2). Statistically significant variables (<0.10 from regression equations) are
displayed using blue lines. Variables that are not statistically significant are shown with gray dashes.
Non-overlapping confidence intervals indicate statistically significant differences between variables.
Figures in this section show a consistent relationship between household resilience capacity and
well-being outcomes. In all four years, a one percent increase in household resilience capacity was
associated with increases in FCS and HDDS of about 0.1 percent, increases in per capita daily
expenditures of 0.2 percent and decreases in the probability that a household will experience
moderate to severe hunger of 0.1 percent. Of the well-being outcomes, hunger is the most
sensitive to shocks. For years where price data are included as shock exposure measures, coping
strategies and most outcomes are very sensitive to price changes. Note that prices may be picking
up other information, such as access to markets, services, and infrastructure.
Figure 13 presents comparisons of the effects of household resilience, NGO and government
support, remittances, and shocks on CSI in 2013. The figure shows that even though household
resilience capacity, improved water and/or sanitation, and remittances all reduce CSI by a similar
degree (less than 0.1 percent), CSI is more sensitive to changes in maize prices. A one percent
increase in maize prices is associated with increases in CSI by 3.2 percent (on average).
43 Percent change in CSI, FCS, HDDS, and per capita daily expenditures. Change in probability for negative coping strategies
and household hunger

Resilience Evaluation, Analysis and Learning (REAL)
APPENDIX E: COMPARING THE EFFECTS OF EXPLANATORY VARIABLES 90
Figure 13: Comparing the effects of resilience, NGO/govt. support, and
shocks on CSI, 2013
Resilience
NGO/Govtsupport
Shocks
Hh resilience capacity
Water/sanitation
FSN
Cash transfers
Remittances
Maize prices (WFP)
Drought
Lack of inputs
0 1 2 3 4 5
Sources: ZimVAC surveys 2013; AFDM 2017
Figure 14 presents estimates of the magnitude of the effects of household resilience, NGO and
government support, coping strategies, and shocks on well-being outcomes for 2013. Estimates of
the effect of increases in maize meal prices on outcome are presented in a second figure (Figure
14b) because the scale is much wider. Figure 14a shows that household resilience capacity is
associated with improvements in FCS, HDDS, per capita expenditures, and household hunger. A
one percent increase in household resilience capacity is associated with 0.1 percent increase in FCS
and HDDS, about a 0.2 percent increase in per capita daily expenditures, and a 0.1 percent
decrease in the probability that a household will experience moderate to severe hunger. The figure
also shows that remittances were associated with similar levels of improvement in FCS, HDDS, and
per capita daily expenditures. Drought (reported at the household level) had a larger impact on
hunger than FCS or HDDS but no impact on per capita daily expenditures. The second figure
presents similar information for maize prices and shows that a one percent (1 cent) increase in the
price of maize reduces HDDS by about one percent, and increases the probability of moderate to
severe hunger by around nine percent. However, the estimate for the decrease in household
hunger associated with a one cent increase in the price of maize ranges from two percent to 17
percent44.
44 The large range for the estimate is because data are aggregated at a high level. WFP data are for markets, numbering between
one and three in a district.
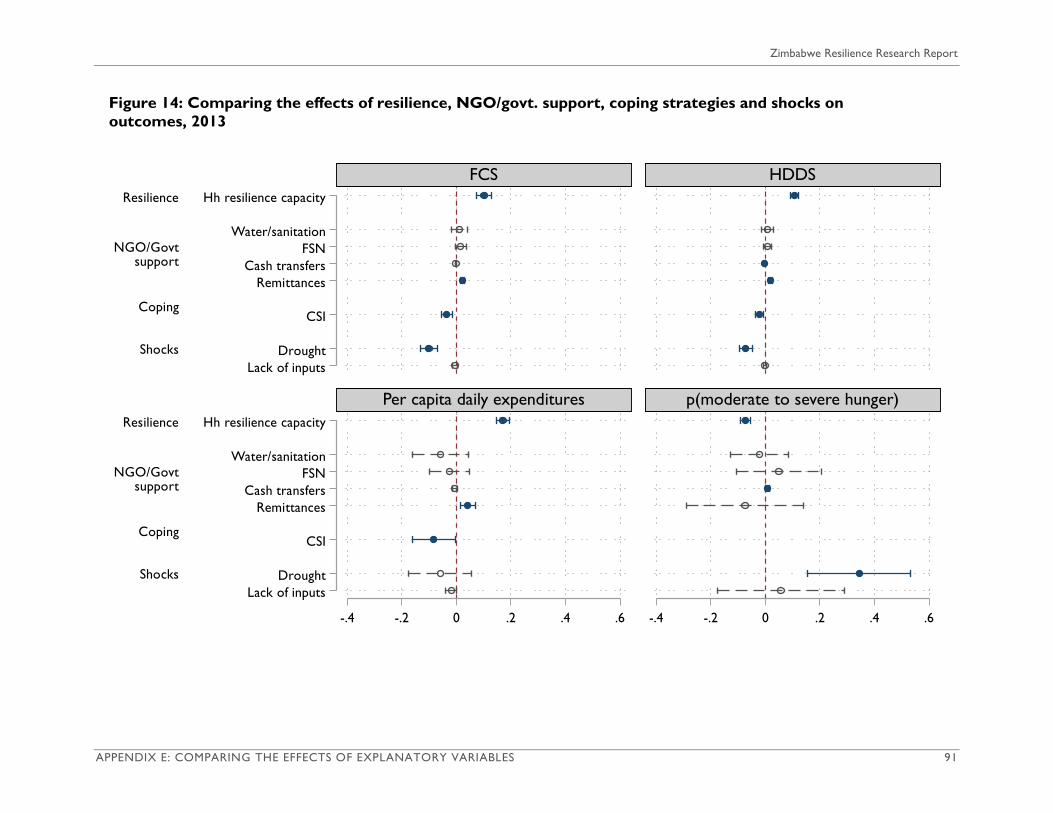
Zimbabwe Resilience Research Report
APPENDIX E: COMPARING THE EFFECTS OF EXPLANATORY VARIABLES 91
Figure 14: Comparing the effects of resilience, NGO/govt. support, coping strategies and shocks on
outcomes, 2013
Resilience
NGO/Govt support
Coping
Shocks
Resilience
NGO/Govt support
Coping
Shocks
Hh resilience capacity
Water/sanitation
FSN
Cash transfers
Remittances
CSI
Drought
Lack of inputs
Hh resilience capacity
Water/sanitation
FSN
Cash transfers
Remittances
CSI
Drought
Lack of inputs
-.4 -.2 0 .2 .4 .6 -.4 -.2 0 .2 .4 .6
FCS HDDS
Per capita daily expenditures p(moderate to severe hunger)
e1
e1

Resilience Evaluation, Analysis and Learning (REAL)
APPENDIX E: COMPARING THE EFFECTS OF EXPLANATORY VARIABLES 92
Figure 14: Comparing the effects of resilience, NGO/govt. support, coping strategies and shocks on
outcomes, 2013
Sources: ZimVAC household surveys 2013; WFP 2017
Shocks
Shocks
Maize prices (WFP)
Maize prices (WFP)
-2 -1 0 1 2 3 4 5 6 7 8 9 10 1112131415 -2 -1 0 1 2 3 4 5 6 7 8 9 10111213 1415
FCS HDDS
Per capita daily expenditures p(moderate to severe hunger)
e1
e1

Zimbabwe Resilience Research Report
APPENDIX E: COMPARING THE EFFECTS OF EXPLANATORY VARIABLES 93
Figure 15 presents estimates for 2014 of the magnitude of the effects of household resilience, NGO and government support, remittances,
and shocks on coping strategies. A one percent increase in household resilience capacity is associated with a drop in the CSI of 0.5
percent. A one percent increase in improved water and/or sanitation is associated with decreases in CSI and negative coping of about 0.4
percent. The relationship between loans CSI and negative coping may reflect loan program targeting.
Figure 15: Comparing the effects of resilience, NGO/govt. support, and shocks on coping strategies 2014
Sources: ZimVAC. 2014. Household and community surveys.
Resilience
NGO/Govtsupport
Shocks
Hh resilience capacity
Water/sanitation
Cash transfers
Loan
Remittances
Maize meal price
Goat prices
Drought
Lack of inputs
-3 -2 -1 0 1 -3 -2 -1 0 1
CSI p(Negative coping)
e0a
e0a

Resilience Evaluation, Analysis and Learning (REAL)
APPENDIX E: COMPARING THE EFFECTS OF EXPLANATORY VARIABLES 94
presents estimates of the magnitude of the effects of household resilience, NGO and government
support, coping strategies, and shocks on well-being outcomes for 2014. Estimates of the effect of
increases in maize meal prices on outcome are presented in a separate figure because the scale is
much wider. The first figure shows that household resilience capacity is associated with
improvements in FCS, HDDS, per capita expenditures, and household hunger. A one percent
increase in household resilience capacity is associated with a 0.1 percent increase in FCS and
HDDS, about a 0.2 percent increase in per capita daily expenditures, and a 0.1 percent decrease in
the probability that a household will experience moderate to severe hunger. The figure also shows
that remittances is associated with improvement in FCS (0.2 percent) and HDDS (one percent).
Drought (reported at the household level) had a larger impact on hunger than FCS or HDDS but
no impact on per capita daily expenditures. The second figure presents similar information for
maize prices and shows that a one percent (1 cent) increase in the price of maize reduces FCS and
HDDS by about 0.1 percent, decreases per capita daily expenditures by 1.5 percent (one and a half
cents) and increases the probability of moderate to severe hunger by 2.2 percent.

Zimbabwe Resilience Research Report
APPENDIX E: COMPARING THE EFFECTS OF EXPLANATORY VARIABLES 95
Figure 16: Comparing the effects of resilience, NGO/govt. support, coping strategies and shocks on
outcomes, 2014
Shocks
Shocks
Maize meal price
Maize meal price
-4 -3 -2 -1 0 1 2 3 4 -4 -3 -2 -1 0 1 2 3 4
FCS HDDS
Per capita daily expenditures p(moderate to severe hunger)
e1
e1

Resilience Evaluation, Analysis and Learning (REAL)
APPENDIX E: COMPARING THE EFFECTS OF EXPLANATORY VARIABLES 96
Figure 16: Comparing the effects of resilience, NGO/govt. support, coping strategies and shocks on
outcomes, 2014
Sources: ZimVAC household and community surveys 2014
Resilience
NGO/Govt support
Coping
Shocks
Resilience
NGO/Govt support
Coping
Shocks
Hh resilience capacity
Water/sanitationCash transfers
LoanRemittances
CSINegative coping
Goat pricesDrought
Lack of inputs
Hh resilience capacity
Water/sanitationCash transfers
LoanRemittances
CSINegative coping
Goat pricesDrought
Lack of inputs
-.5 0 .5 1 1.5 -.5 0 .5 1 1.5
FCS HDDS
Per capita daily expenditures p(moderate to severe hunger)
e1
e1

Zimbabwe Resilience Research Report
APPENDIX E: COMPARING THE EFFECTS OF EXPLANATORY VARIABLES 97
Figure 17 presents estimates of the magnitude of the effects of household resilience, NGO and government support, remittances, and
shocks on coping strategies in 2015. The figure shows that a one percent increase in household resilience capacity is associated with a
drop in the CSI of 0.3 percent. The positive relationship between agricultural and livestock support and CSI and negative coping may
reflect loan program targeting. Maize meal prices have a similar effect on CSI and negative coping strategies, both increase by about 0.2
percent for a one cent increase in maize meal prices. A one percent increase in goat prices (one dollar) is associated with a 0.5 percent
drop in CSI.
Figure 17: Comparing the effects of resilience, NGO/govt. support, and shocks on coping strategies 2015
Sources: ZimVAC. 2015. household surveys AFDM, 2017
NGO/Govt support
Shocks
Hh resilience capacity
FSN
Cash transfers
Ag/livestock support
Loan
Remittances
Rainfall (mm)
Maize meal price
Goat prices
-2 -1 0 1 -2 -1 0 1
CSI p(Negative coping)
e0a
e0a
% change coping strategies for 1% change in X vars

Resilience Evaluation, Analysis and Learning (REAL)
APPENDIX E: COMPARING THE EFFECTS OF EXPLANATORY VARIABLES 98
Figure 18: Comparing the effects of resilience, NGO/govt. support, coping strategies and shocks on
outcomes, 2015
Sources: ZimVAC 2016, AFDM 2017
NGO/Govt support
Coping
Shocks
NGO/Govt support
Coping
Shocks
Hh resilience capacity
FSNCash transfers
Ag/livestock supportLoan
Remittances
CSINegative coping
Rainfall (mm)
Goat pricesMaize meal price
Hh resilience capacity
FSNCash transfers
Ag/livestock supportLoan
Remittances
CSINegative coping
Rainfall (mm)
Goat pricesMaize meal price
-.5 0 .5 1 -.5 0 .5 1
FCS HDDS
Per capita daily expenditures p(moderate to severe hunger)
e1
e1
% change in outcome for 1% change in X vars

Zimbabwe Resilience Research Report
APPENDIX E: COMPARING THE EFFECTS OF EXPLANATORY VARIABLES 99
Figure 19: Comparing the effects of resilience, NGO/govt. support, and shocks on
coping strategies, 2016
Sources: ZimVAC household surveys 2016; AFDM, 2017
NGO/Govt support
Shocks
Hh resilience capacity
Water/sanitation
FSN
Cash transfers
Ag/livestock support
Loan
Remittances
Rainfall (mm)
Crop and/or livestock shocks
-4 -2 0 2 -4 -2 0 2
CSI p(Negative coping)
e0a
e0a
% change coping strategies for 1% change in X vars

Resilience Evaluation, Analysis and Learning (REAL)
APPENDIX E: COMPARING THE EFFECTS OF EXPLANATORY VARIABLES 100
Figure 20: Comparing the effects of resilience, NGO/govt. support, coping strategies and shocks on
outcomes, 2016
Sources: ZimVAC 2016, AFDM 2017
NGO/Govt support
Coping
Shocks
NGO/Govt support
Coping
Shocks
Hh resilience capacity
Water/sanitationFSN
Cash transfersAg/livestock support
LoanRemittances
CSINegative coping
Crop and/or livestock shocks
Hh resilience capacity
Water/sanitationFSN
Cash transfersAg/livestock support
LoanRemittances
CSINegative coping
Crop and/or livestock shocks
-.5 0 .5 -.5 0 .5
FCS HDDS
Per capita daily expenditures p(moderate to severe hunger)
e1
e1


