Important disclosures appear on the last page of this report. The Henry Fund Henry B. Tippie School of Management Charles Schaller [[email protected]] Zimmer Biomet Holdings (ZBH) 10/19/2016 Healthcare – Surgical Instrument Manufacturing Stock Rating HOLD Investment Thesis Target Price $ 130 - 135 We issue a HOLD rating on Zimmer Biomet Holdings, a Warsaw, Indiana based medical supplies company. ZBH is a market leader in joint replacement and surgery technologies which acquired competitor Biomet Inc. in June of 2015. While this acquisition promises to boost revenue and reduce competition it will take several years to realize synergies and increased debt puts future cash flow at risk. In light of this we feel the current market price reflects the appropriate value. Drivers of Thesis Mid-single digit revenue growth will be offset by exchange rate and pricing pressures. $10B in new debt will require nearly $400M in annual interest expenses, requiring a significant portion of operating cash flow. While initial acquisition phases of Biomet are complete the companies are functioning operationally separate and will require several years of expensive integration before realizing cost synergies. ZBH runs the risk of losing highly trained, expensive to replace sales force as they bring legacy Biomet under their structural umbrella. Looming 2.3% excise tax on medical devices paired with pricing pressures could force Zimmer to absorb additional costs without passing them on to customers, further reducing their profit margins. Risks to Thesis 2016 Revenues could surprise, leading to significantly higher cash flows than expected. Integration of legacy Biomet and Zimmer could go much smoother than expected, especially as both companies are headquartered in the same city Strengthened foreign currency could alleviate currency exchange risk. ZBH is the market leader in their top two revenue generating product lines, able to take advantage of economies of scale and premium pricing due to their strong brand. Henry Fund DCF $129.10 Henry Fund DDM $71.01 Relative Multiple $66.38 Price Data Current Price $128.60 52wk Range $88.27 – 133.21 Consensus 1yr Target $140.85 Key Statistics Market Cap (B) $25.37B Shares Outstanding (M) 200.0 Institutional Ownership 89.3% Three Year Beta 1.00 Dividend Yield 0.8% Est. 5yr Growth 1.46 Price/Earnings (TTM) 115.75 Price/Earnings (FY1) 38.65 Price/Sales (TTM) 3.19 Price/Book (mrq) 2.52 Profitability Operating Margin 15.28% 5 Yr Avg. Profit Margin 13.66% Return on Assets (TTM) 0.77% Return on Equity (TTM) 2.09% Earnings Estimates Year 2013 2014 2015 2016E 2017E 2018E EPS $4.60 $4.26 $0.78 $2.69 $3.38 $4.20 growth 7.22% (7.39%) (81.69) 244.87% 25.65% 24.26% 12 Month Performance Company Description Warsaw, Indiana based Zimmer Biomet is a global leader in musculoskeletal healthcare, manufacturing a wide range of orthopedic products. The company has four major product segments: Spine, Bone Healing, CMF, and Dental. Zimmer has been incorporated in Delaware since 2001, which is when it became a publically traded company after it spun off from its parent company, Zimmer Manufacturing Company. ZBH was formed in 2015 after Zimmer purchased fellow Warsaw device company, Biomet. -10% 0% 10% 20% 30% 40% O N D J F M A M J J A S ZBH S&P 500 33.5 2.1 24.5 14.2 39.9 19.8 0 10 20 30 40 50 P/E ROE ZBH Industry Sector Source: Factset Source: Factset
Transcript
Important disclosures appear on the last page of this report.
Healthcare – Surgical Instrument Manufacturing Stock Rating HOLD
Investment Thesis Target Price $ 130 - 135
We issue a HOLD rating on Zimmer Biomet Holdings, a Warsaw, Indiana based medical supplies company. ZBH is a market leader in joint replacement and surgery technologies which acquired competitor Biomet Inc. in June of 2015. While this acquisition promises to boost revenue and reduce competition it will take several years to realize synergies and increased debt puts future cash flow at risk. In light of this we feel the current market price reflects the appropriate value. Drivers of Thesis
Mid-single digit revenue growth will be offset by exchange rate and pricing pressures.
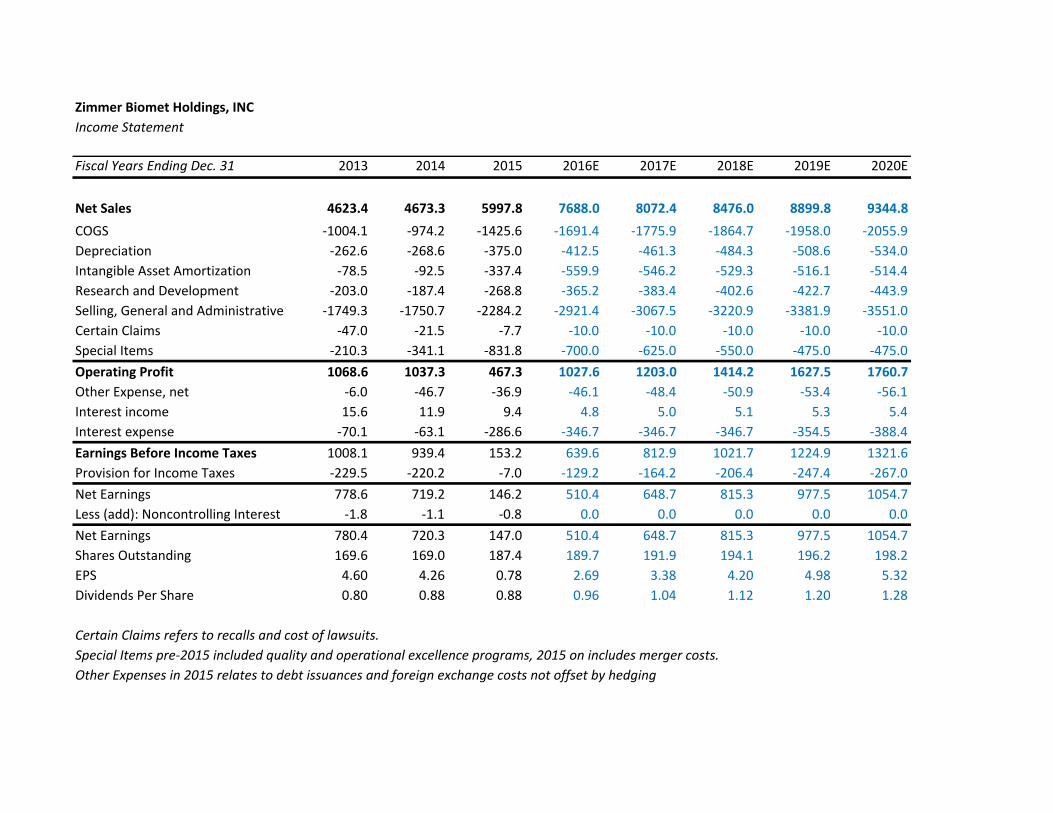
$10B in new debt will require nearly $400M in annual interest expenses, requiring a significant portion of operating cash flow.
While initial acquisition phases of Biomet are complete the companies are functioning operationally separate and will require several years of expensive integration before realizing cost synergies.
ZBH runs the risk of losing highly trained, expensive to replace sales force as they bring legacy Biomet under their structural umbrella.
Looming 2.3% excise tax on medical devices paired with pricing pressures could force Zimmer to absorb additional costs without passing them on to customers, further reducing their profit margins.
Risks to Thesis
2016 Revenues could surprise, leading to significantly higher cash flows than expected.
Integration of legacy Biomet and Zimmer could go much smoother than expected, especially as both companies are headquartered in the same city
Strengthened foreign currency could alleviate currency exchange risk.
ZBH is the market leader in their top two revenue generating product lines, able to take advantage of economies of scale and premium pricing due to their strong brand.
Henry Fund DCF $129.10 Henry Fund DDM $71.01 Relative Multiple $66.38 Price Data Current Price $128.60 52wk Range $88.27 – 133.21 Consensus 1yr Target $140.85 Key Statistics Market Cap (B) $25.37B Shares Outstanding (M) 200.0 Institutional Ownership 89.3% Three Year Beta 1.00 Dividend Yield 0.8% Est. 5yr Growth 1.46 Price/Earnings (TTM) 115.75 Price/Earnings (FY1) 38.65 Price/Sales (TTM) 3.19 Price/Book (mrq) 2.52 Profitability Operating Margin 15.28% 5 Yr Avg. Profit Margin 13.66% Return on Assets (TTM) 0.77% Return on Equity (TTM) 2.09%
Earnings Estimates Year 2013 2014 2015 2016E 2017E 2018E
Warsaw, Indiana based Zimmer Biomet is a global leader in musculoskeletal healthcare, manufacturing a wide range of orthopedic products. The company has four major product segments: Spine, Bone Healing, CMF, and Dental. Zimmer has been incorporated in Delaware since 2001, which is when it became a publically traded company after it spun off from its parent company, Zimmer Manufacturing Company. ZBH was formed in 2015 after Zimmer purchased fellow Warsaw device company, Biomet.
-10%
0%
10%
20%
30%
40%
O N D J F M A M J J A S
ZBH S&P 500
33.5
2.1
24.5
14.2
39.9
19.8
0
10
20
30
40
50
P/E ROE
ZBH Industry Sector
Source: Factset
Source: Factset
Page 2
EXECUTIVE SUMMARY
We give a hold recommendation for Zimmer Biomet Holding Company. The recent purchase of Biomet will boost revenue due to additional product lines, existing contracts and the addition of Biomet. However this revenue boost will be offset by currency exchange risk, pricing pressures and unrealized synergies as ZBH is only in the early phases of merging the day-to-day business practices of the two companies. Additionally, Zimmer issued $10.1B in debt to conduct the Biomet purchase. The interest payments on this debt will lead to a $500 million annual interest payment.
Our valuation models price the company as high as $132.28 using DCF/EP and as low as $66.38 using Relative P/E. Our price range of $130-135 represents the DCF/EP price range which we feel is the most appropriate as ZBH’s current suppressed earnings makes PE comparisons problematic. In light of pricing pressures, currency risks and the potential 2.3% excise tax we do not believe that the potential 3-8% upside warrants the risk.
COMPANY DESCRIPTION
Warsaw, Indiana based Zimmer Biomet Holdings specializes in musculoskeletal healthcare. Zimmer Biomet manufactures and markets orthopedic reconstructive products, sports medicine, extremities, spine, and bone healing as well as a wide range of additional products. Their products are designed to treat patients suffering from disorders of or injuries to bones, joints or supporting soft tissues. Zimmer was founded in 1927 and currently employs 8,500 employees. Zimmer Biomet trades on the NYSE under ticker symbol: ZBH.
Customers:
Zimmer’s primary customers are surgeons, distributors, and hospital purchasing organizations. These clients vary in size from large companies to independent doctors and surgeons.
Product Divisions:
ZBH has a diverse line of product offerings, divided into 6 product divisions: Knees, Hips, S.E.T., Dental, Spine/CMF, and Other.
Knees
ZBH’s knee products are used in Total Knee Replacement. Total Knee Replacement typically includes a femoral component, a patella (knee cap), a tibial tray and articular surface (placed on the tibial tray)1. Additionally ZBH provides products for partial knee replacement, early intervention and joint preservation. Knees make up the largest portion of all products, accounting for an average of 40% of revenue, although this number fell by about 2% after the Biomet acquisition. Major products include:
Persona, Personalized Knee System
NexGen Complete Knee Solution
Vanguard Knee System
Oxford Partial Knee
Hips
Hips products are used in hip replacement surgeries, which replace both the head of the femur and the socket portion of the pelvis. Hips make up the second largest product segment by sales, behind knees. They have seen steady decline as % of revenue over the past five years, falling from 30% in 2012 to 25% in 2015. Major products include:
Persona, Personalized Knee System
NexGen Complete Knee Solution
Vanguard Knee System
Oxford Partial Knee
S.E.T
S.E.T. covers the broadest spectrum of product offerings. S.E.T. products are largely surgical including sports medicine, biologics, foot and ankle, extremities and trauma products. S.E.T. products have been gaining as a %
Page 3
of revenues. Climbing from 16% in 2012 to 20% in 2015. Major products include:
Transposal Fluid Waste Management Systems
JuggarKnot Soft Anchor System
Zimmer Natural Nail System
Dental
ZBH’s Dental products are designed to meet one of three needs. 1) reconstructive implants for individuals missing one or more teeth. 2) Dental prosthetics to resemble original teeth and 3) dental regenerative products for soft tissue and bone rehabilitation.2 Dental has made up a stable 5% of revenues for several years. Major products include:
Tapered Screw-vent implant system
3i T3 Implant
Puros Allograft Products.
Spine & CMF
Spine products are designed to repair or alleviate back and neck pain caused by degenerative conditions, deformities or traumatic injury to the spine.3 CMF products are used for facial reconstruction as well as chest stabilization after open heart surgery. Spine and CMF only made up 7% of revenues in 2015 but it is the fastest growing product line with regards to percent of sales, up from 4.5% in 2012. Major products include:
Polaris Spinal System
Timberline Lateral Fusion System
TraumaOne Plating System
Other
Products falling into the “other” category primarily include bone bonding and healing products. Other products made up about 4% of revenue in 2015.
While not perfectly uniform, ZBH has a fairly diversified portfolio. The anatomical nature of their product treatment area means no risk of cannibalization and they rely on no single product line for more than 40% of their revenue. In recent years ZBH has seen a slight evening out of product distributions as the smaller product line revenues have increased while larger lines have decreased.
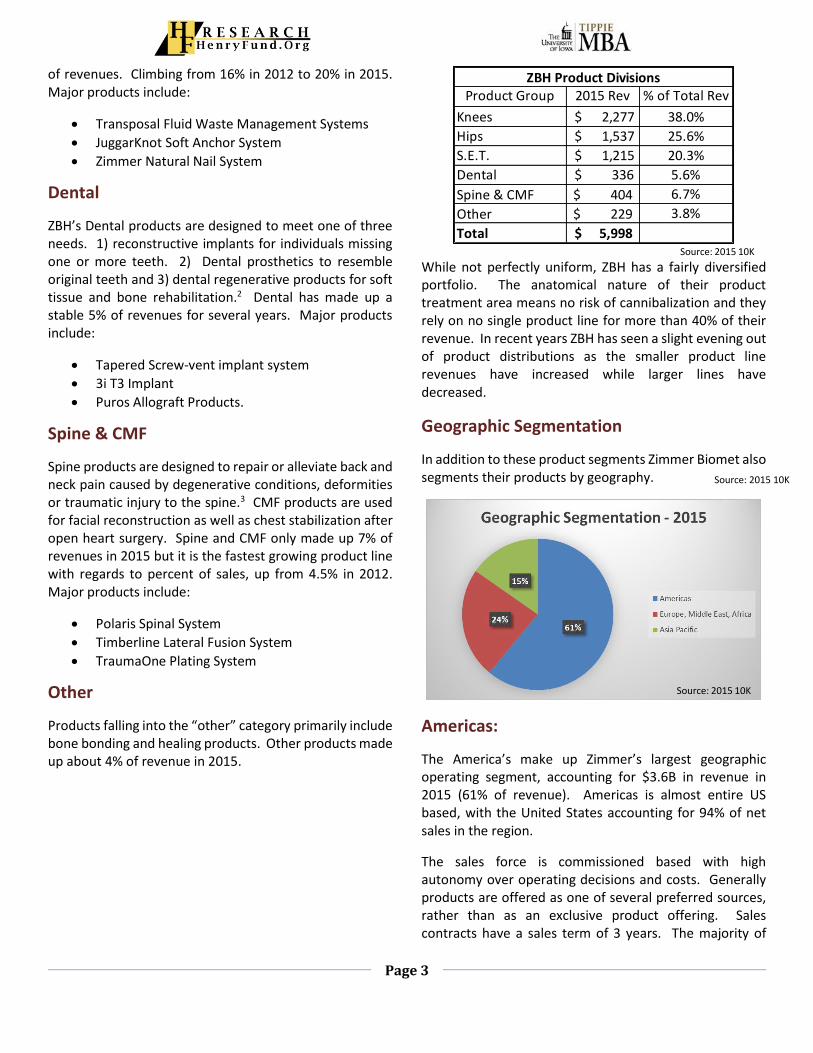
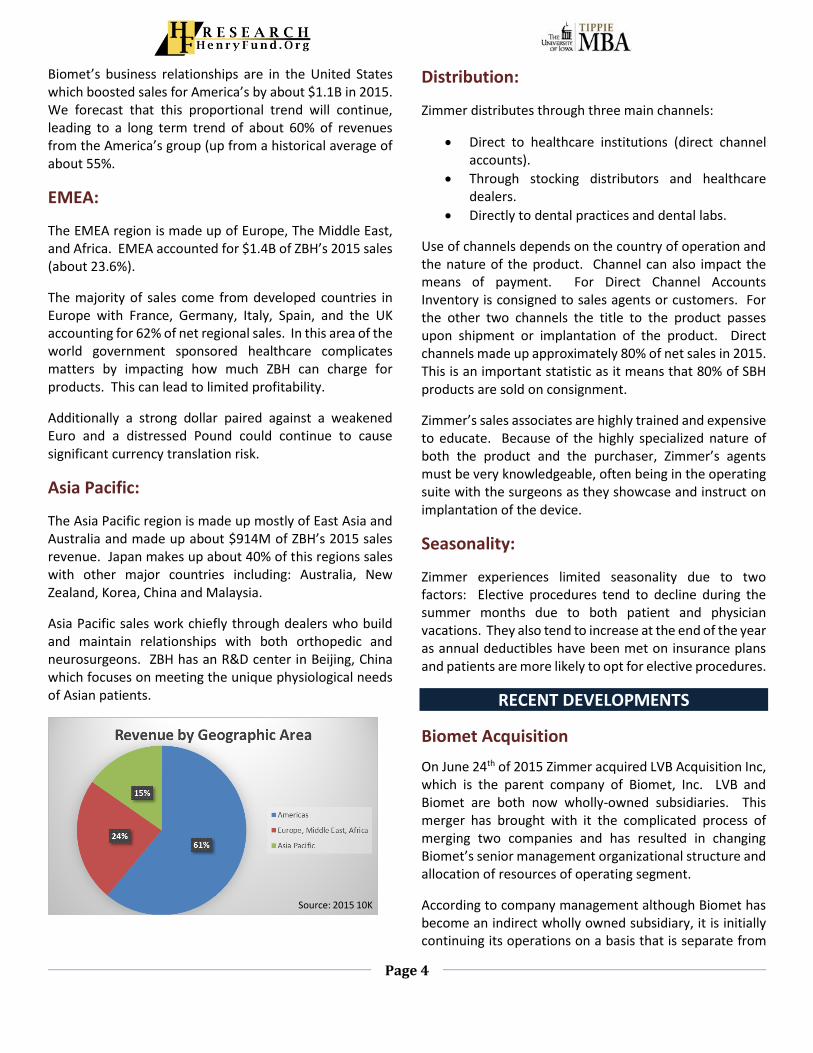
Geographic Segmentation
In addition to these product segments Zimmer Biomet also segments their products by geography.
Americas:
The America’s make up Zimmer’s largest geographic operating segment, accounting for $3.6B in revenue in 2015 (61% of revenue). Americas is almost entire US based, with the United States accounting for 94% of net sales in the region.
The sales force is commissioned based with high autonomy over operating decisions and costs. Generally products are offered as one of several preferred sources, rather than as an exclusive product offering. Sales contracts have a sales term of 3 years. The majority of
Product Group 2015 Rev % of Total Rev
Knees $ 2,277 38.0%
Hips $ 1,537 25.6%
S.E.T. $ 1,215 20.3%
Dental $ 336 5.6%
Spine & CMF 404$ 6.7%
Other 229$ 3.8%
Total 5,998$
ZBH Product Divisions
Source: 2015 10K
Source: 2015 10K
Source: 2015 10K
Page 4
Biomet’s business relationships are in the United States which boosted sales for America’s by about $1.1B in 2015. We forecast that this proportional trend will continue, leading to a long term trend of about 60% of revenues from the America’s group (up from a historical average of about 55%.
EMEA:
The EMEA region is made up of Europe, The Middle East, and Africa. EMEA accounted for $1.4B of ZBH’s 2015 sales (about 23.6%).
The majority of sales come from developed countries in Europe with France, Germany, Italy, Spain, and the UK accounting for 62% of net regional sales. In this area of the world government sponsored healthcare complicates matters by impacting how much ZBH can charge for products. This can lead to limited profitability.
Additionally a strong dollar paired against a weakened Euro and a distressed Pound could continue to cause significant currency translation risk.
Asia Pacific:
The Asia Pacific region is made up mostly of East Asia and Australia and made up about $914M of ZBH’s 2015 sales revenue. Japan makes up about 40% of this regions sales with other major countries including: Australia, New Zealand, Korea, China and Malaysia.
Asia Pacific sales work chiefly through dealers who build and maintain relationships with both orthopedic and neurosurgeons. ZBH has an R&D center in Beijing, China which focuses on meeting the unique physiological needs of Asian patients.
Distribution:
Zimmer distributes through three main channels:
Direct to healthcare institutions (direct channel accounts).
Through stocking distributors and healthcare dealers.
Directly to dental practices and dental labs.
Use of channels depends on the country of operation and the nature of the product. Channel can also impact the means of payment. For Direct Channel Accounts Inventory is consigned to sales agents or customers. For the other two channels the title to the product passes upon shipment or implantation of the product. Direct channels made up approximately 80% of net sales in 2015. This is an important statistic as it means that 80% of SBH products are sold on consignment.
Zimmer’s sales associates are highly trained and expensive to educate. Because of the highly specialized nature of both the product and the purchaser, Zimmer’s agents must be very knowledgeable, often being in the operating suite with the surgeons as they showcase and instruct on implantation of the device.
Seasonality:
Zimmer experiences limited seasonality due to two factors: Elective procedures tend to decline during the summer months due to both patient and physician vacations. They also tend to increase at the end of the year as annual deductibles have been met on insurance plans and patients are more likely to opt for elective procedures.
RECENT DEVELOPMENTS
Biomet Acquisition
On June 24th of 2015 Zimmer acquired LVB Acquisition Inc, which is the parent company of Biomet, Inc. LVB and Biomet are both now wholly-owned subsidiaries. This merger has brought with it the complicated process of merging two companies and has resulted in changing Biomet’s senior management organizational structure and allocation of resources of operating segment.
According to company management although Biomet has become an indirect wholly owned subsidiary, it is initially continuing its operations on a basis that is separate from
Source: 2015 10K
Page 5
the legacy Zimmer operations.4 Biomet is continuing to maintain its customer, supplier and other business relationships under all of its old models and strategies. This poses a potential problem for ZBH. As both companies are effectively existing as separate entities there has been no realization of potential synergies from the merger. In order to realize potential cost savings such as unified production lines and sales group ZBH will have to endeavor to integrate both legacy operations under a single operational strategy. This could prove costly, distracting and frustrating.
From a sales perspective, Legacy Biomet sales people will likely eventually be brought under the sales management and strategy of Legacy Zimmer. Such changes in culture, including potential pay structure changes can be difficult and often lead to employee attrition. SGA is the largest portion of expenses for ZBH, largely because it is so expensive to hire, train, and retain a talented sales force. Employee turnover due to culture clashes would prove more costly for ZBH than the average company.
From a cost perspective, it will prove expensive to consolidate corporate and administrative infrastructures. There could be issues integrating manufacturing, warehousing and distribution. They could also face incompatibility of their purchasing, logistics, marketing, administrative and other systems and processes.5 Even in the absence of problems all of these integrations will take time and money as well as direct focus away from ZBH’s core objectives. Zimmer forecasts these expenses will be long-lived and difficult to estimate. We have accounted for these additional expenses as well as ongoing efficiency initiatives in the other expenses line of our income state forecasts.
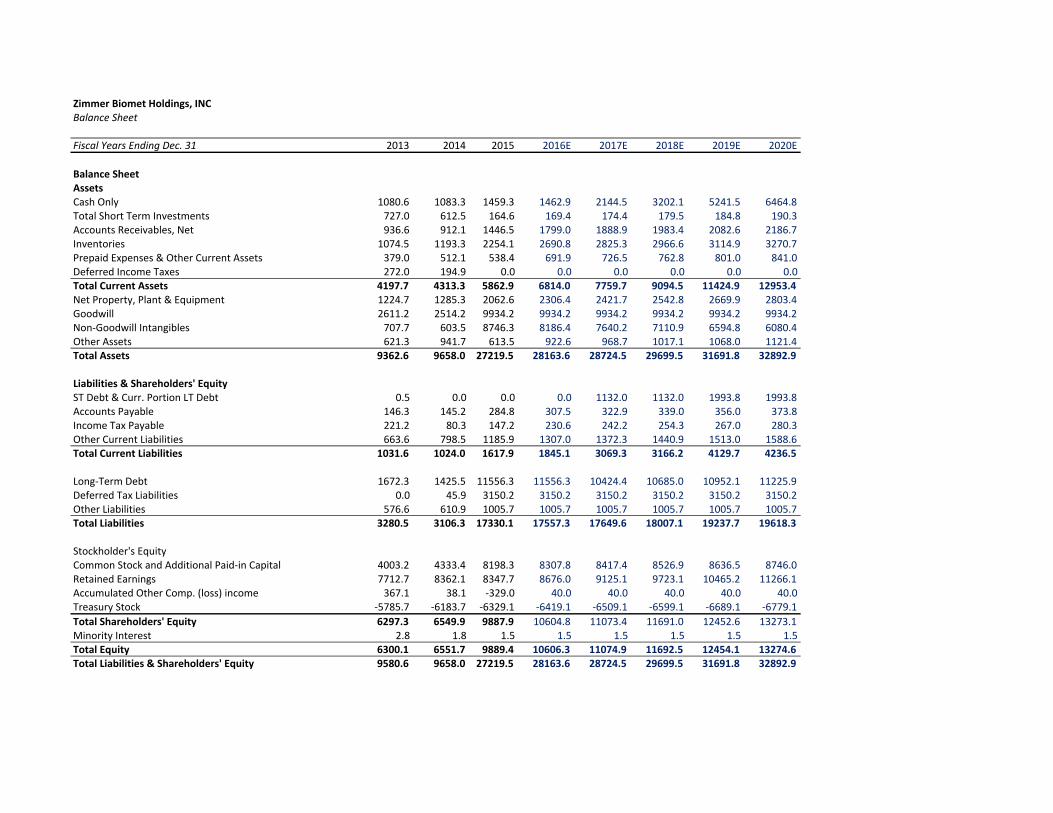
Debt
The Biomet acquisition was costly and Zimmer financed it largely through debt. At the end of FY2015 Zimmer’s total indebtedness was $11.6B compared to $1.4B the year before. This debt increase come from a $7.65B issuance of senior unsecured notes and borrowing of $3.0B under Zimmer’s $4.35B credit agreement. Zimmer’s 2015 10K estimates that their 2016 debt service obligations will be about $339.8M6 (an implied interest rate of 2.93%), the actual amount is on pace to be closer to $350M. This debt service will place significant demand on ZBH’s cash flow from operations. As a point of reference, in the 5 years leading up to the acquisition Legacy Zimmer’s Net
Operating Cash Flow averaged about $1.1B. While Zimmer is on pace to greatly exceed that amount in 2016 the debt service will require a large amount of cash, cash that could have been reinvested or distributed to investors in the form a dividend.
INDUSTRY ANALYSIS
Surgical Instrument Manufacturing Industry Snapshot
Revenue: $42.1B Profit: $3.2B Annual Growth 10-15: 1.1% Est Growth 15-20: 1.9% Exports: $11.3B Number of Businesses: 893
The medical device industry develops and markets medical devices used to improve quality of life, treat ailments and alleviate pain using high tech innovations which are surgically implanted into patients.
Because of the healthcare nature of these products they are usually protected from seasonality and revenue volatility. They also typically command a premium price tag.
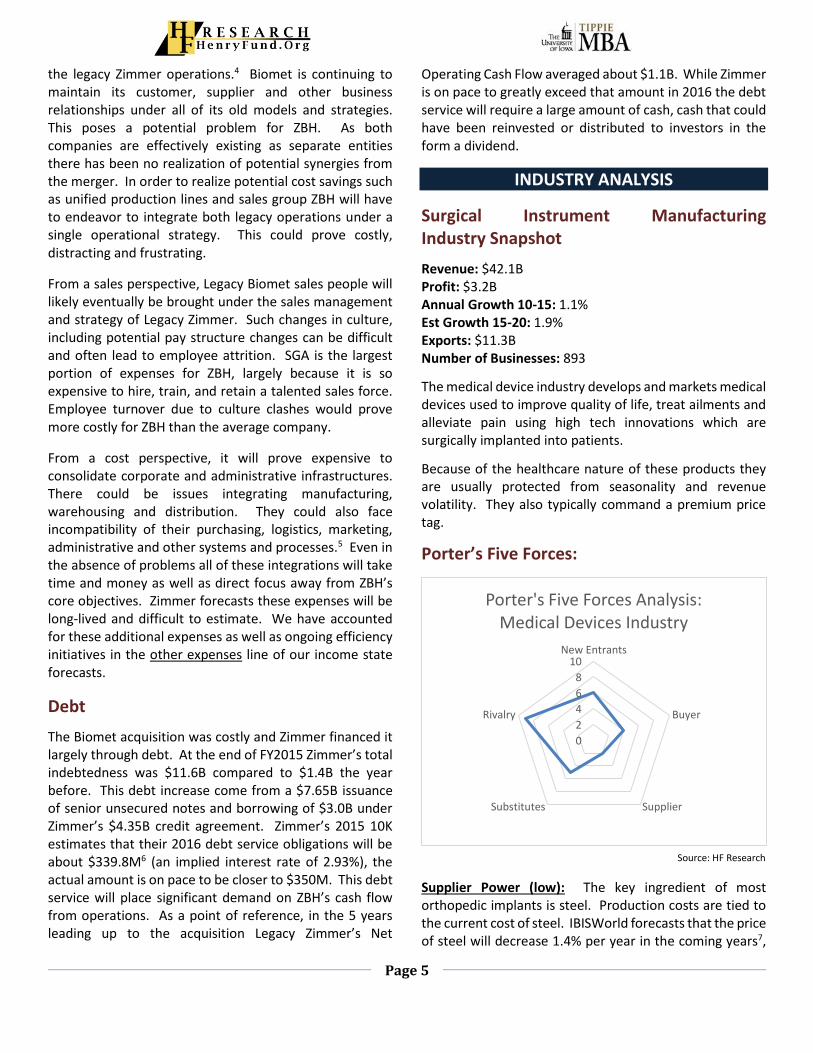
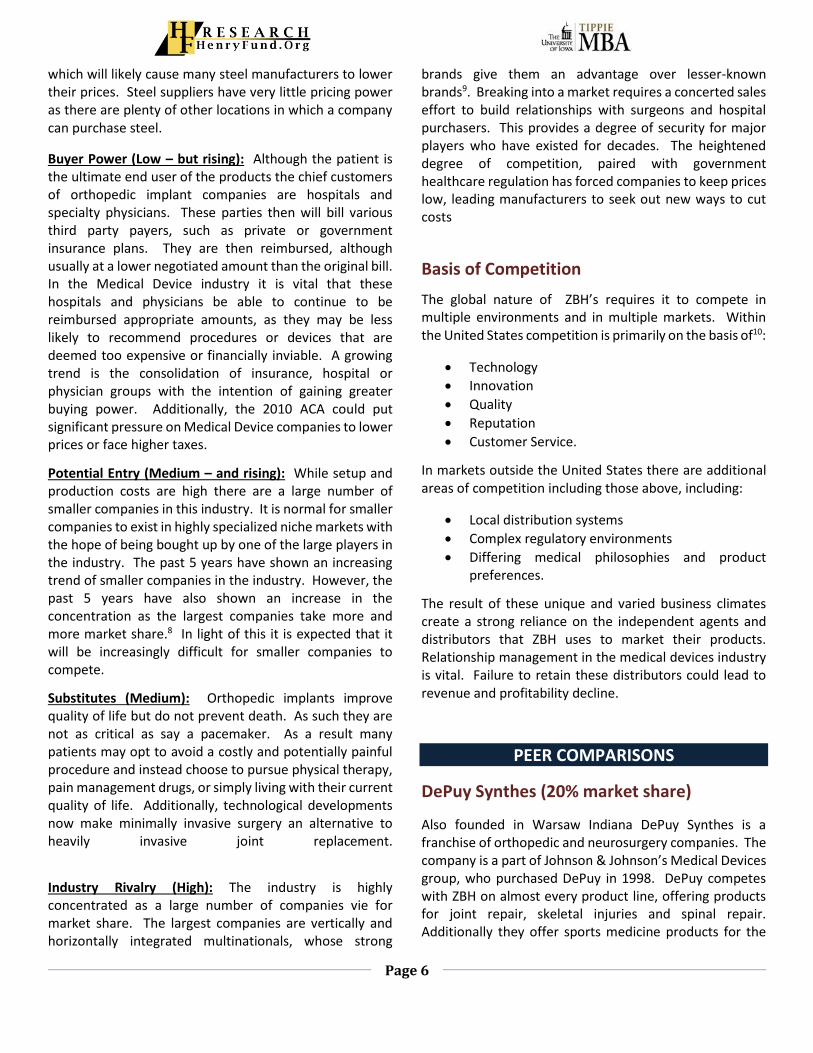
Porter’s Five Forces:
Supplier Power (low): The key ingredient of most orthopedic implants is steel. Production costs are tied to the current cost of steel. IBISWorld forecasts that the price of steel will decrease 1.4% per year in the coming years7,
0
2
4
6
8
10New Entrants
Buyer
SupplierSubstitutes
Rivalry
Porter's Five Forces Analysis:Medical Devices Industry
Source: HF Research
Page 6
which will likely cause many steel manufacturers to lower their prices. Steel suppliers have very little pricing power as there are plenty of other locations in which a company can purchase steel.
Buyer Power (Low – but rising): Although the patient is the ultimate end user of the products the chief customers of orthopedic implant companies are hospitals and specialty physicians. These parties then will bill various third party payers, such as private or government insurance plans. They are then reimbursed, although usually at a lower negotiated amount than the original bill. In the Medical Device industry it is vital that these hospitals and physicians be able to continue to be reimbursed appropriate amounts, as they may be less likely to recommend procedures or devices that are deemed too expensive or financially inviable. A growing trend is the consolidation of insurance, hospital or physician groups with the intention of gaining greater buying power. Additionally, the 2010 ACA could put significant pressure on Medical Device companies to lower prices or face higher taxes.
Potential Entry (Medium – and rising): While setup and production costs are high there are a large number of smaller companies in this industry. It is normal for smaller companies to exist in highly specialized niche markets with the hope of being bought up by one of the large players in the industry. The past 5 years have shown an increasing trend of smaller companies in the industry. However, the past 5 years have also shown an increase in the concentration as the largest companies take more and more market share.8 In light of this it is expected that it will be increasingly difficult for smaller companies to compete.
Substitutes (Medium): Orthopedic implants improve quality of life but do not prevent death. As such they are not as critical as say a pacemaker. As a result many patients may opt to avoid a costly and potentially painful procedure and instead choose to pursue physical therapy, pain management drugs, or simply living with their current quality of life. Additionally, technological developments now make minimally invasive surgery an alternative to heavily invasive joint replacement.
Industry Rivalry (High): The industry is highly concentrated as a large number of companies vie for market share. The largest companies are vertically and horizontally integrated multinationals, whose strong
brands give them an advantage over lesser-known brands9. Breaking into a market requires a concerted sales effort to build relationships with surgeons and hospital purchasers. This provides a degree of security for major players who have existed for decades. The heightened degree of competition, paired with government healthcare regulation has forced companies to keep prices low, leading manufacturers to seek out new ways to cut costs
Basis of Competition
The global nature of ZBH’s requires it to compete in multiple environments and in multiple markets. Within the United States competition is primarily on the basis of10:
Technology
Innovation
Quality
Reputation
Customer Service.
In markets outside the United States there are additional areas of competition including those above, including:
Local distribution systems
Complex regulatory environments
Differing medical philosophies and product preferences.
The result of these unique and varied business climates create a strong reliance on the independent agents and distributors that ZBH uses to market their products. Relationship management in the medical devices industry is vital. Failure to retain these distributors could lead to revenue and profitability decline.
PEER COMPARISONS
DePuy Synthes (20% market share)
Also founded in Warsaw Indiana DePuy Synthes is a franchise of orthopedic and neurosurgery companies. The company is a part of Johnson & Johnson’s Medical Devices group, who purchased DePuy in 1998. DePuy competes with ZBH on almost every product line, offering products for joint repair, skeletal injuries and spinal repair. Additionally they offer sports medicine products for the
Page 7
treatment of soft tissue injuries. DePuy is probably best known for being the subject of more than 11,000 lawsuits related to the recall of a faulty hip replacement system. It is estimates these lawsuits will cost the company billions to resolve.11
Stryker (13% market share)
Based in Kalamazoo, Michigan Stryker Corporation is a Fortune 500 medical technologies company focusing on joint replacement and trauma surgeries as well as non-orthopedic surgery systems.12 Originally founded as a hospital bed producer Stryker now competes with ZBH’s Hip, Knee and spine products and possesses a market share of 13%, just below ZBH’s 15% share.
Smith & Nephew (7% Market Share)
Smith and Nephew is a British-Based multinational medical equipment manufacturing company.13 While S&N’s revenues are comparable to ZBH they hold half the market share due to the diverse nature of their products, many of which are not orthopedic by nature. Smith and Nephew competes with ZBH in the area of hip and knee replacements with the rest of their offerings falling into the categories of Advanced Would Management and Minimally Invasive Therapies. While their businesses are not identical S&N makes a good peer comparison due to their size and the nature of their business.
Medtronic (6% Market Share)
Dublin based Medtronic PLC designs and manufactures medical devices for the treatment of chronic pain, illness and physical ailments. Medtronic is the world’s largest standalone medical technology development company.14 While Medtronic’s $28B in annual revenues dwarf’s ZBH, Medtronic owns a comparably small portion of the orthopedic market due to the fact that the majority of their products fall into the “medical devices” category due to their electronic nature. Medtronic competes with ZBH in the area of spine products. Spinal is Medtronic’s second largest product line, however this is largely due to neuromodulation products (implants similar to pacemakers to manage pain) and is a relatively small competitor in the area of spinal orthopedics. Medtronic’s recent purchase of Covidien led to a tax inversion to
Dublin, which has led to significantly lower taxes and the repatriation of nearly $20B in foreign earnings.
Ratio Comparison
Peer comparison in medical devices is difficult. This is due to the widely diverse product offerings of the large players in the industry. Many of the largest conglomerates (GE for example) have medical device divisions. As a result, there the potential to be in an “apples to oranges” comparison situation. In spite of this there are some valuable things that can be gained by comparing ZBH to its peers.
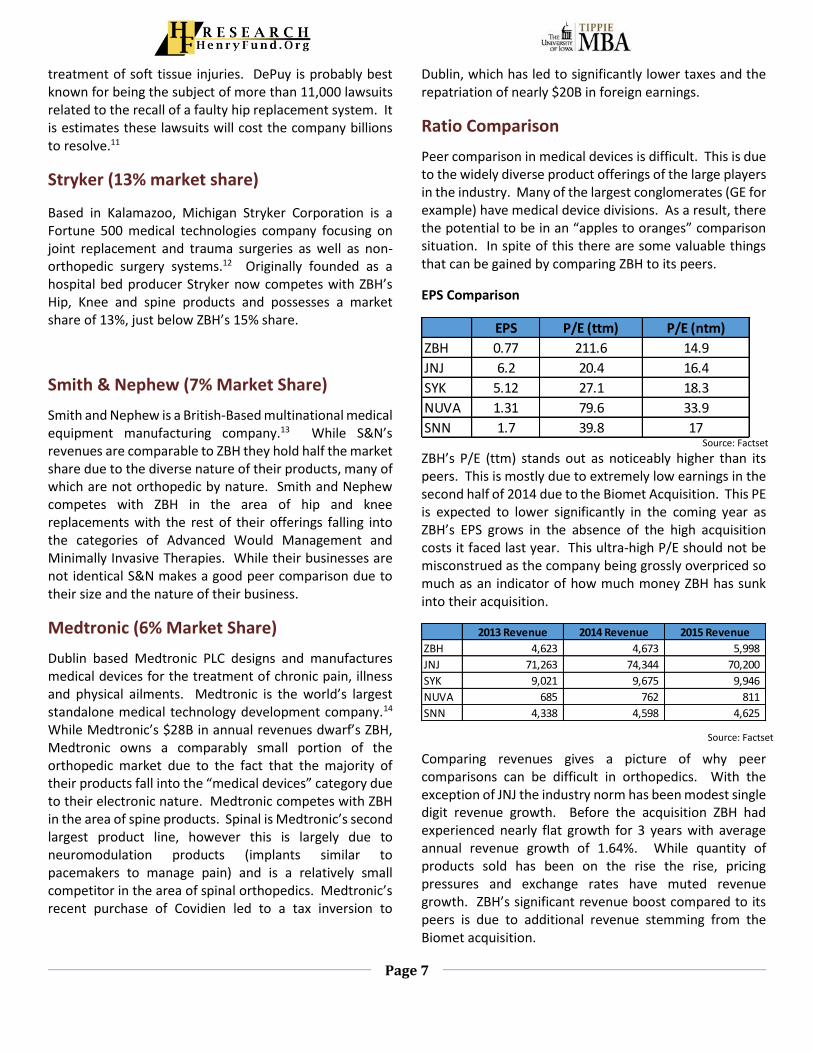
EPS Comparison
ZBH’s P/E (ttm) stands out as noticeably higher than its peers. This is mostly due to extremely low earnings in the second half of 2014 due to the Biomet Acquisition. This PE is expected to lower significantly in the coming year as ZBH’s EPS grows in the absence of the high acquisition costs it faced last year. This ultra-high P/E should not be misconstrued as the company being grossly overpriced so much as an indicator of how much money ZBH has sunk into their acquisition.
Comparing revenues gives a picture of why peer comparisons can be difficult in orthopedics. With the exception of JNJ the industry norm has been modest single digit revenue growth. Before the acquisition ZBH had experienced nearly flat growth for 3 years with average annual revenue growth of 1.64%. While quantity of products sold has been on the rise the rise, pricing pressures and exchange rates have muted revenue growth. ZBH’s significant revenue boost compared to its peers is due to additional revenue stemming from the Biomet acquisition.
EPS P/E (ttm) P/E (ntm)
ZBH 0.77 211.6 14.9
JNJ 6.2 20.4 16.4
SYK 5.12 27.1 18.3
NUVA 1.31 79.6 33.9
SNN 1.7 39.8 17
2013 Revenue 2014 Revenue 2015 Revenue
ZBH 4,623 4,673 5,998
JNJ 71,263 74,344 70,200
SYK 9,021 9,675 9,946
NUVA 685 762 811
SNN 4,338 4,598 4,625
Source: Factset
Source: Factset
Page 8
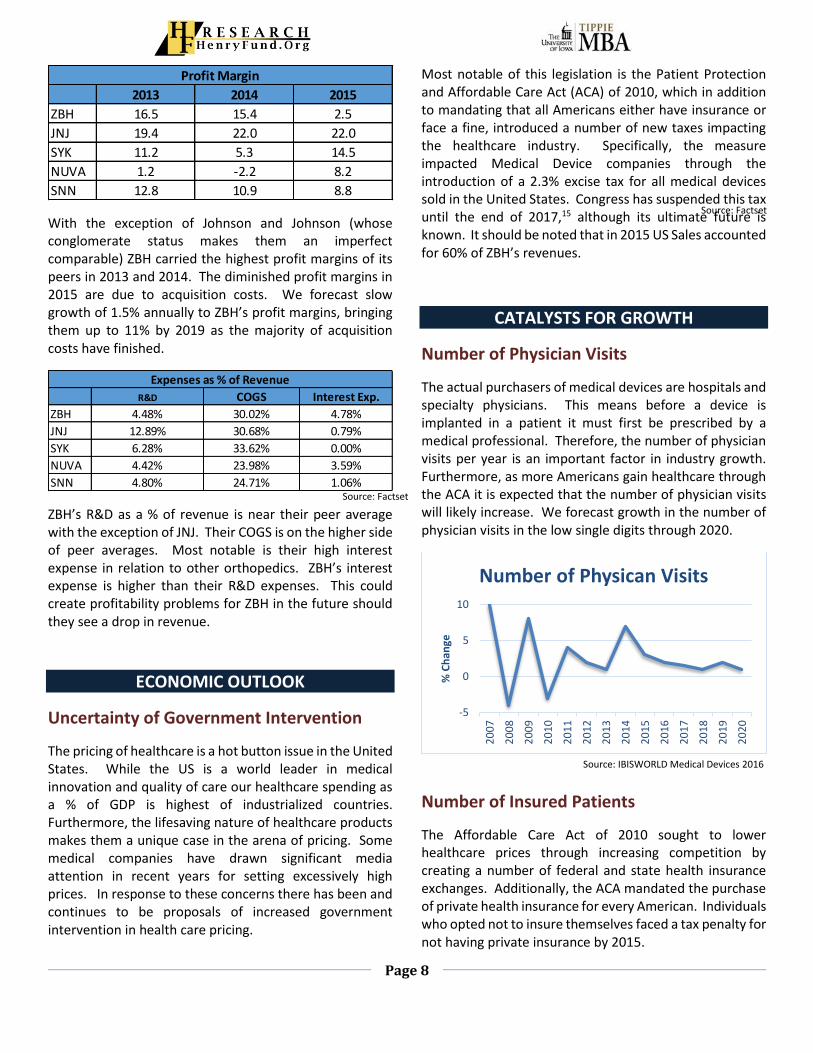
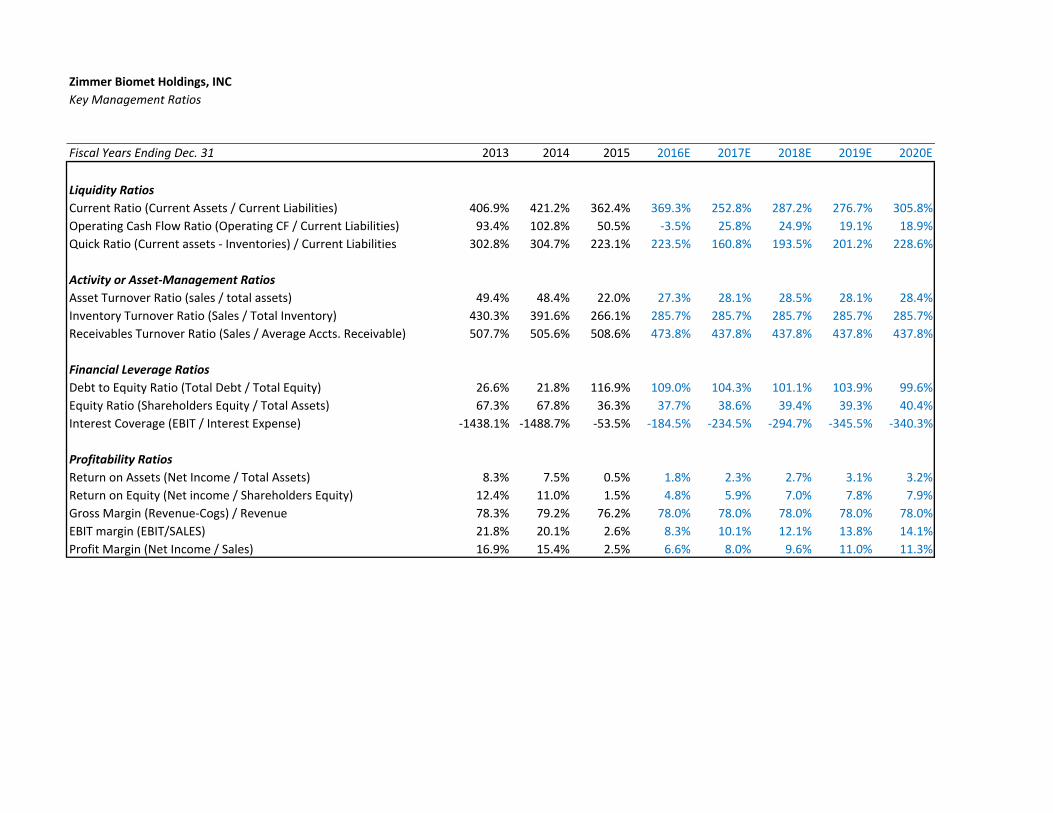
With the exception of Johnson and Johnson (whose conglomerate status makes them an imperfect comparable) ZBH carried the highest profit margins of its peers in 2013 and 2014. The diminished profit margins in 2015 are due to acquisition costs. We forecast slow growth of 1.5% annually to ZBH’s profit margins, bringing them up to 11% by 2019 as the majority of acquisition costs have finished.
ZBH’s R&D as a % of revenue is near their peer average with the exception of JNJ. Their COGS is on the higher side of peer averages. Most notable is their high interest expense in relation to other orthopedics. ZBH’s interest expense is higher than their R&D expenses. This could create profitability problems for ZBH in the future should they see a drop in revenue.
ECONOMIC OUTLOOK
Uncertainty of Government Intervention
The pricing of healthcare is a hot button issue in the United States. While the US is a world leader in medical innovation and quality of care our healthcare spending as a % of GDP is highest of industrialized countries. Furthermore, the lifesaving nature of healthcare products makes them a unique case in the arena of pricing. Some medical companies have drawn significant media attention in recent years for setting excessively high prices. In response to these concerns there has been and continues to be proposals of increased government intervention in health care pricing.
Most notable of this legislation is the Patient Protection and Affordable Care Act (ACA) of 2010, which in addition to mandating that all Americans either have insurance or face a fine, introduced a number of new taxes impacting the healthcare industry. Specifically, the measure impacted Medical Device companies through the introduction of a 2.3% excise tax for all medical devices sold in the United States. Congress has suspended this tax until the end of 2017,15 although its ultimate future is known. It should be noted that in 2015 US Sales accounted for 60% of ZBH’s revenues.
CATALYSTS FOR GROWTH
Number of Physician Visits
The actual purchasers of medical devices are hospitals and specialty physicians. This means before a device is implanted in a patient it must first be prescribed by a medical professional. Therefore, the number of physician visits per year is an important factor in industry growth. Furthermore, as more Americans gain healthcare through the ACA it is expected that the number of physician visits will likely increase. We forecast growth in the number of physician visits in the low single digits through 2020.
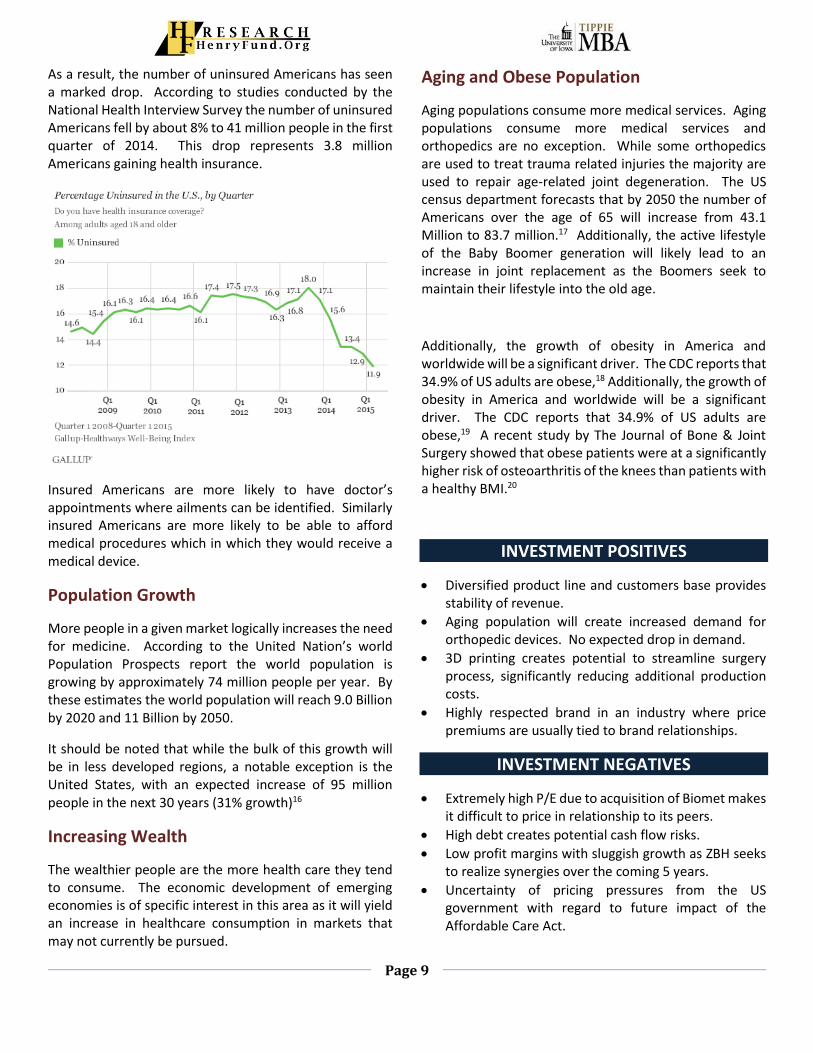
Number of Insured Patients
The Affordable Care Act of 2010 sought to lower healthcare prices through increasing competition by creating a number of federal and state health insurance exchanges. Additionally, the ACA mandated the purchase of private health insurance for every American. Individuals who opted not to insure themselves faced a tax penalty for not having private insurance by 2015.
2013 2014 2015
ZBH 16.5 15.4 2.5
JNJ 19.4 22.0 22.0
SYK 11.2 5.3 14.5
NUVA 1.2 -2.2 8.2
SNN 12.8 10.9 8.8
Profit Margin
R&D COGS Interest Exp.
ZBH 4.48% 30.02% 4.78%
JNJ 12.89% 30.68% 0.79%
SYK 6.28% 33.62% 0.00%
NUVA 4.42% 23.98% 3.59%
SNN 4.80% 24.71% 1.06%
Expenses as % of Revenue
-5
0
5
10
20
07
20
08
20
09
20
10
20
11
20
12
20
13
20
14
20
15
20
16
20
17
20
18
20
19
20
20
% C
han
ge
Number of Physican Visits
Source: Factset
Source: Factset
Source: IBISWORLD Medical Devices 2016
Page 9
As a result, the number of uninsured Americans has seen a marked drop. According to studies conducted by the National Health Interview Survey the number of uninsured Americans fell by about 8% to 41 million people in the first quarter of 2014. This drop represents 3.8 million Americans gaining health insurance.
Insured Americans are more likely to have doctor’s appointments where ailments can be identified. Similarly insured Americans are more likely to be able to afford medical procedures which in which they would receive a medical device.
Population Growth
More people in a given market logically increases the need for medicine. According to the United Nation’s world Population Prospects report the world population is growing by approximately 74 million people per year. By these estimates the world population will reach 9.0 Billion by 2020 and 11 Billion by 2050.
It should be noted that while the bulk of this growth will be in less developed regions, a notable exception is the United States, with an expected increase of 95 million people in the next 30 years (31% growth)16
Increasing Wealth
The wealthier people are the more health care they tend to consume. The economic development of emerging economies is of specific interest in this area as it will yield an increase in healthcare consumption in markets that may not currently be pursued.
Aging and Obese Population
Aging populations consume more medical services. Aging populations consume more medical services and orthopedics are no exception. While some orthopedics are used to treat trauma related injuries the majority are used to repair age-related joint degeneration. The US census department forecasts that by 2050 the number of Americans over the age of 65 will increase from 43.1 Million to 83.7 million.17 Additionally, the active lifestyle of the Baby Boomer generation will likely lead to an increase in joint replacement as the Boomers seek to maintain their lifestyle into the old age.
Additionally, the growth of obesity in America and worldwide will be a significant driver. The CDC reports that 34.9% of US adults are obese,18 Additionally, the growth of obesity in America and worldwide will be a significant driver. The CDC reports that 34.9% of US adults are obese,19 A recent study by The Journal of Bone & Joint Surgery showed that obese patients were at a significantly higher risk of osteoarthritis of the knees than patients with a healthy BMI.20
INVESTMENT POSITIVES
Diversified product line and customers base provides stability of revenue.
Aging population will create increased demand for orthopedic devices. No expected drop in demand.
3D printing creates potential to streamline surgery process, significantly reducing additional production costs.
Highly respected brand in an industry where price premiums are usually tied to brand relationships.
INVESTMENT NEGATIVES
Extremely high P/E due to acquisition of Biomet makes it difficult to price in relationship to its peers.
High debt creates potential cash flow risks.
Low profit margins with sluggish growth as ZBH seeks to realize synergies over the coming 5 years.
Uncertainty of pricing pressures from the US government with regard to future impact of the Affordable Care Act.
Page 10
VALUATION
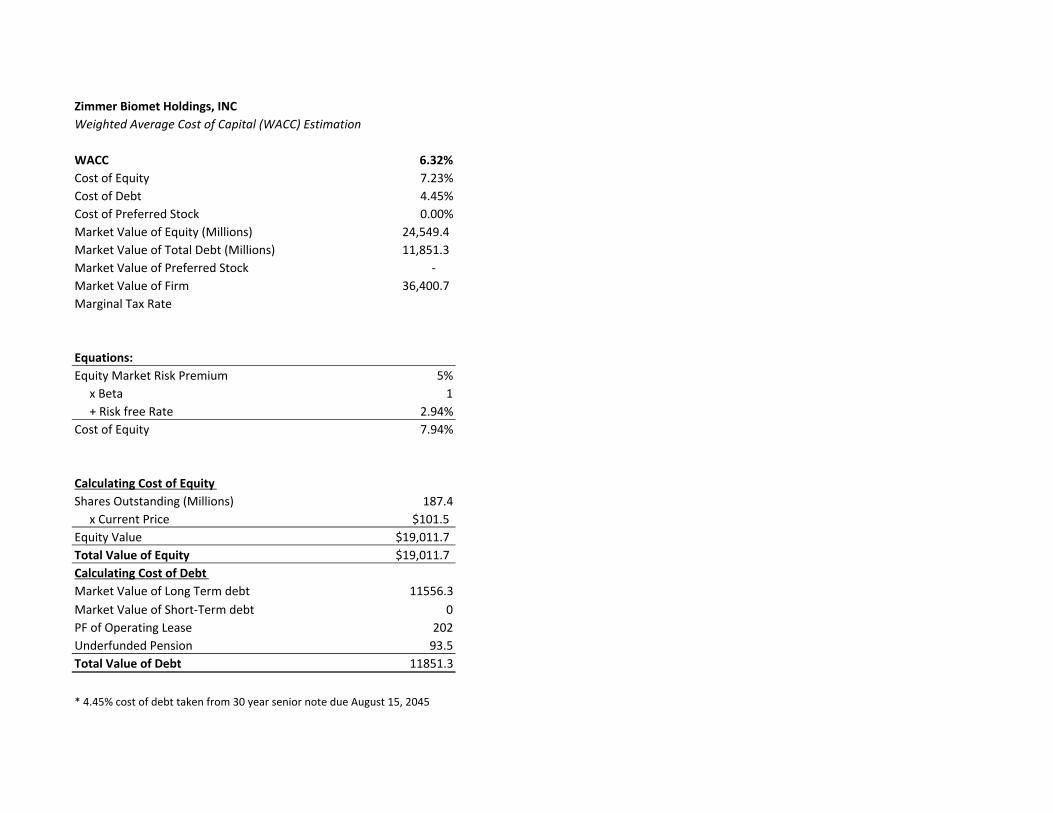
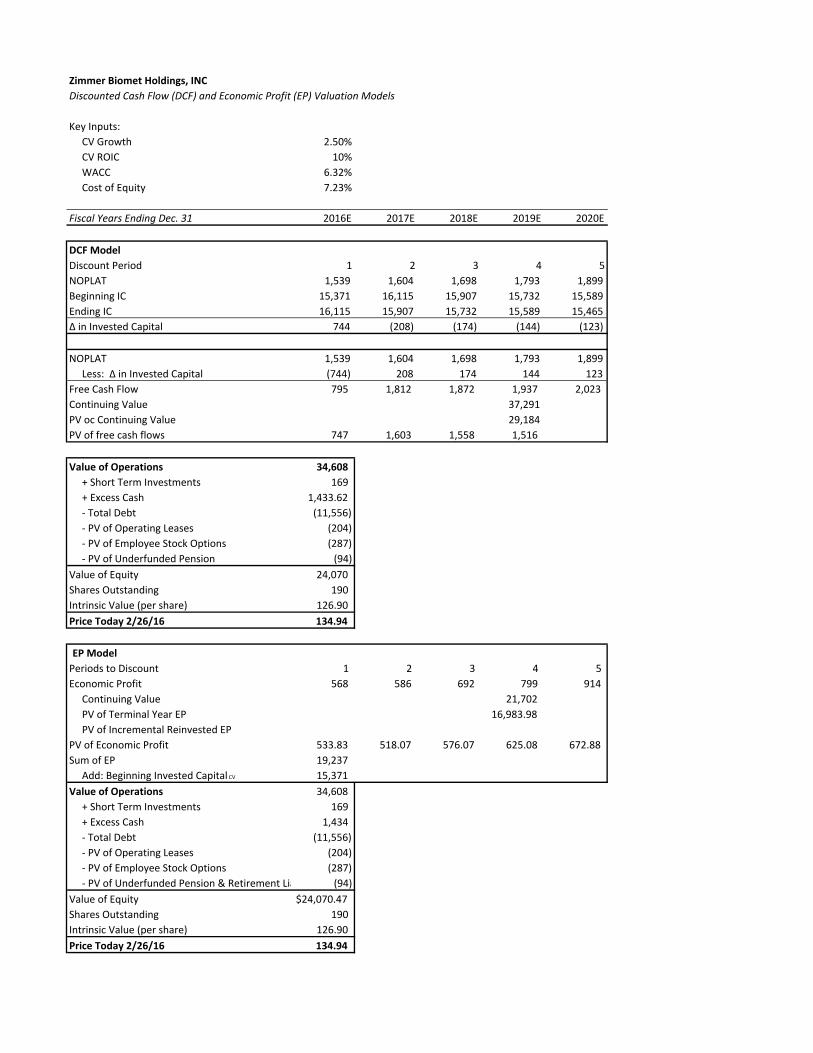
Our valuation model used a 3-year Raw Beta of 1.00.21 We then calculated a WACC of 6.32%. We assume a CV growth of 3% annually beginning in 2021.
Revenue Growth by Product Line
The following table presents estimated 2015 global market size and share information:
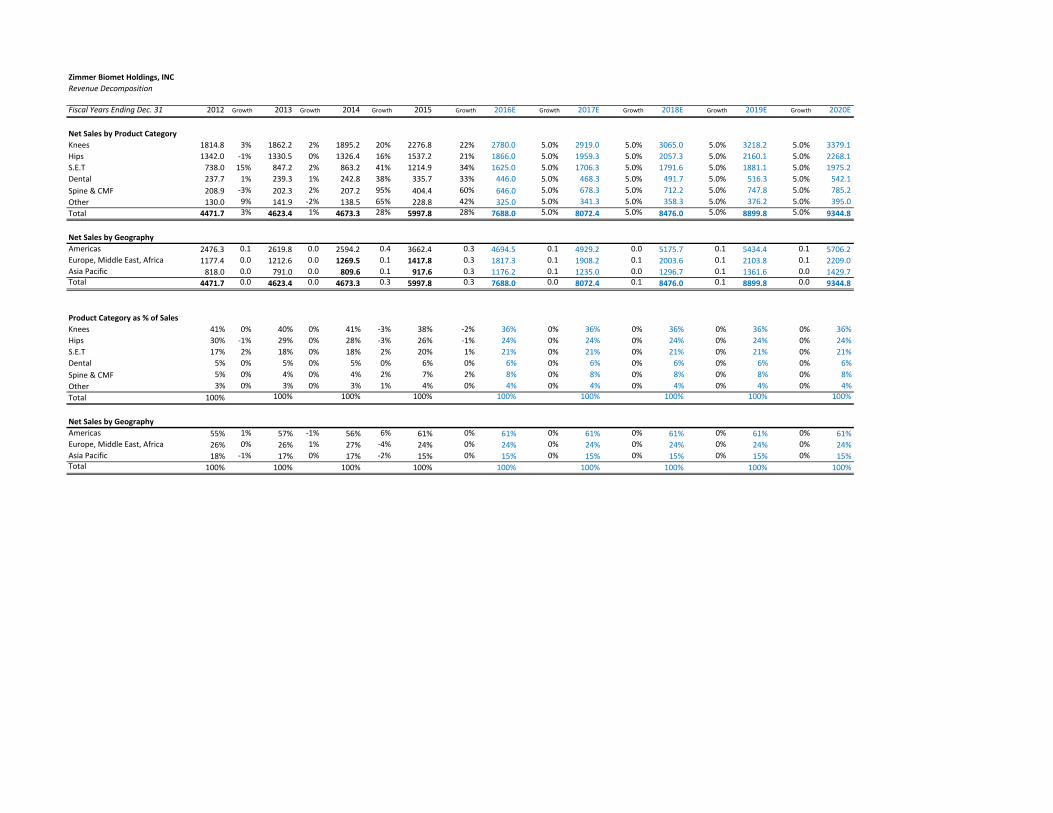
These estimates represent Zimmer’s 2015 earnings, which only contained two quarters of combined legacy Zimmer and Biomet product sales. We believe that a full year’s revenue, paired with increasing synergies and market share growth will yield the following revenue growth:
ZBH will continue to capitalize on its position as the largest provider of knees and hips. This will allow them to gain additional market share in addition to global market growth. We forecast 5% annual growth for knees and 3% annual growth for hips. We forecast the largest growth for S.E.T., which has shown solid annual growth over the previous 5 years. We forecast that in addition to global market growth ZBH will gain additional market share, leading to 8% annual growth. We expect Dental and Spine to grow at 5 and 3% respectively.
Excise Tax Assumptions:
The Affordable Care Act of 2010 hit Medical Device companies hard with a 2.3% excise tax on medical devices. Congress has put this tax on hold until 2017 and its continued fate remains uncertain. Due to the fact that this tax has been in limbo for almost 7 years and the expressed desire of both political parties to limit companies moving overseas we have built our model under the assumption that the 2.3% excise tax will again be shelved as is has been for the last 7 years.
Operating Expense Assumptions
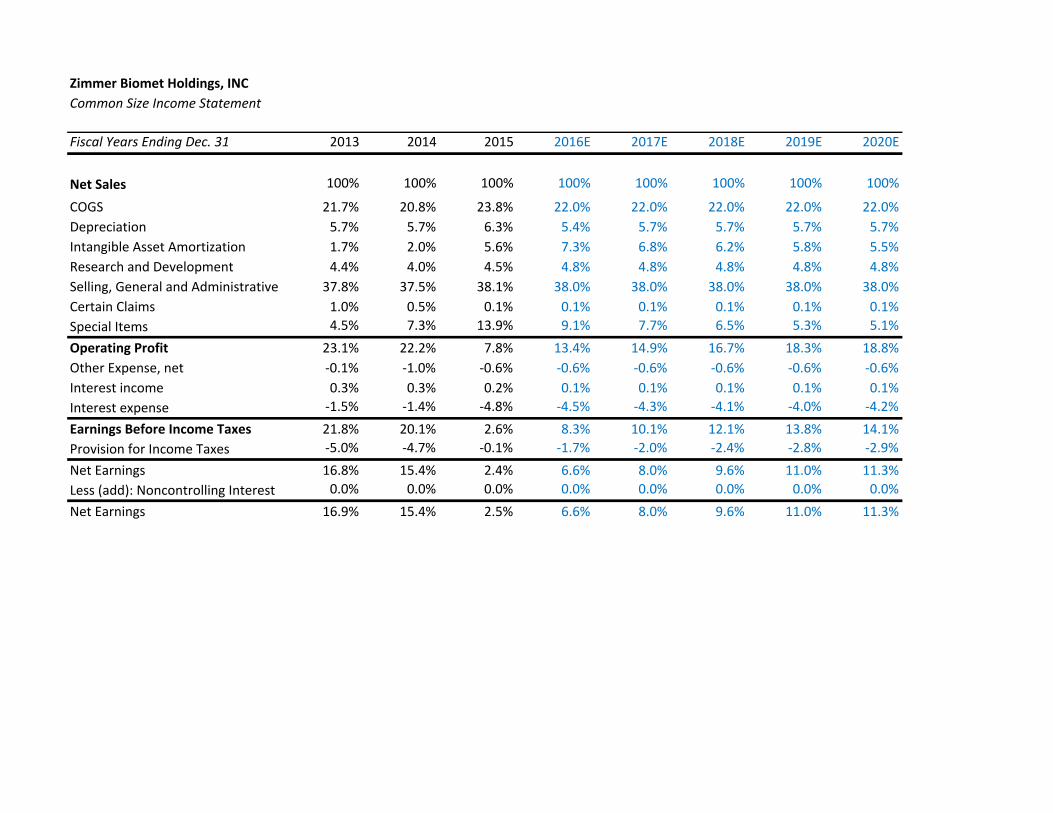
The nature of ZBH’s products makes them expensive to produce and expensive to sell. Within the medical device world a recall can be exceedingly expensive and can cause long-term damage to a company’s brand image. This necessitates the need for an extremely low failure rate and requires a highly specialized production force. Additionally, sales of ZBH devices requires a highly skilled sales force. Product specialists will attend operations, giving instruction and explaining products to doctors, hospital admins and medical students. As a result of this ZBH invests a large portion of their costs into production and sales. We forecast COGS to be 22% of revenue with SGA making up an additional 38% of revenue. We forecast R&D expenses to continue to make up 4.8% of revenues, however the actual amount of the investment will be considerably larger than in previous years due to increased revenue from the Zimmer Biomet merger.
Model Results
Our DCF/EP results reveal that the market’s current price of $129.10 is an appropriate price for ZBH given the present value of their forecasted future cash flows. While it is possible that there is a slight upside (about 3-8%), ZBH’s potential debt risk paired with the potential for the 2.3% excise tax cast enough uncertainty to merit the risk.
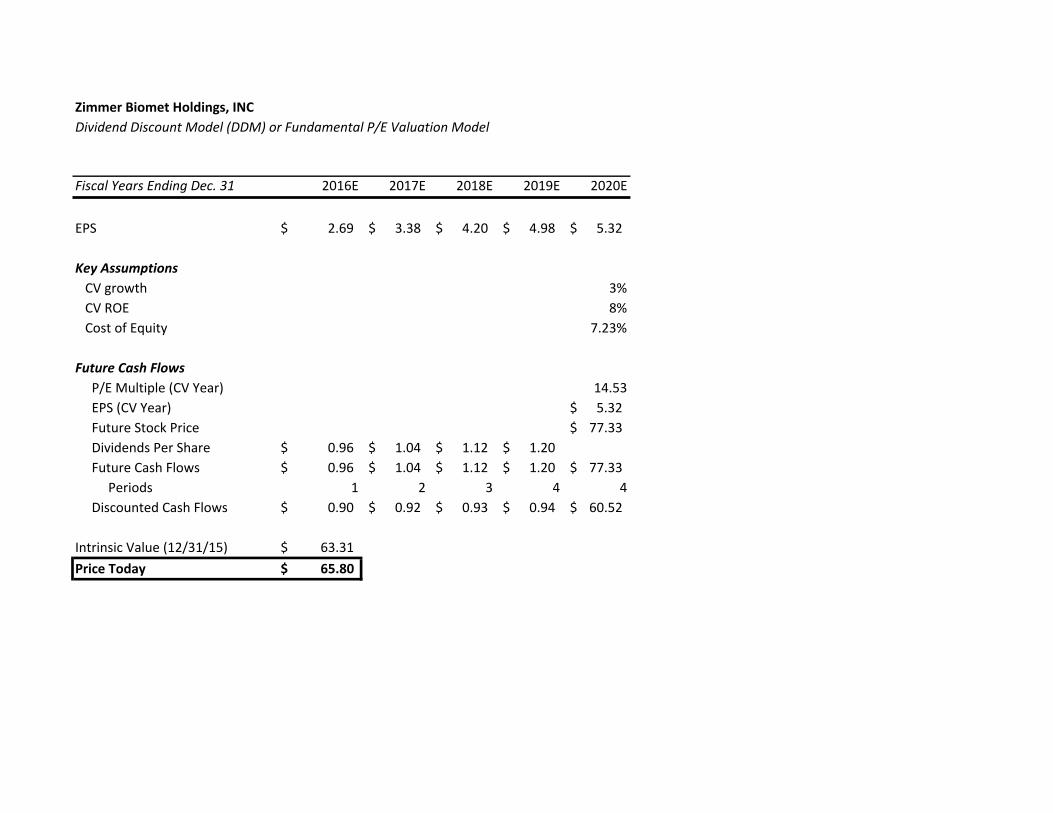
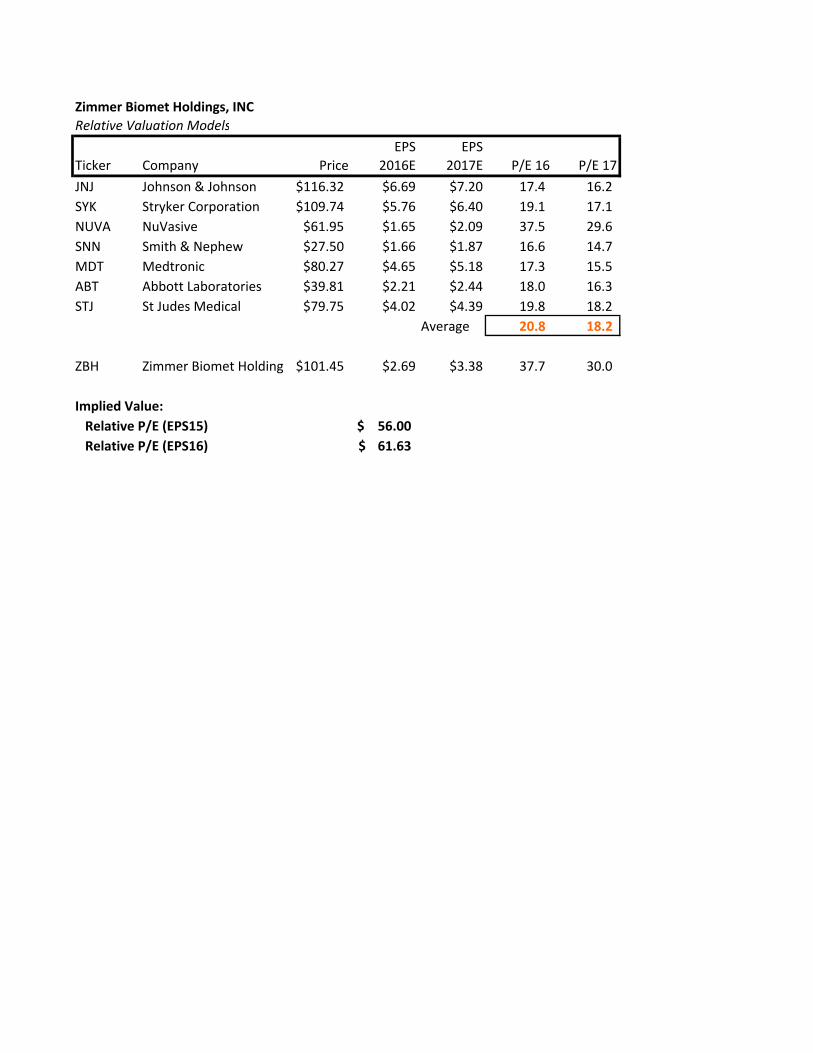
Our DDM model gives a lower price of $71.01. This is low because we modeled a conservative dividend payment, matching the historic increases over the last 10 years. ZBH’s heavy debt service paired with merger costs will not leave large amount of cash to pay out as dividends. Our relative P/E model gives a rock-bottom price of $66.38. This is due to the fact that the Biomet acquisition was so expensive that it brought ZBH’s EPS down from 4.3 to 0.8, making its EPS nearly 10 times that of its competitors.
Potential Cash Flow Risks
As a result of the Biomet acquisition ZBH can look forward to significantly increased revenues. Financial earnings reports from the first half of FY2016 indicate that ZBH is on track for sales of $7.6B, a 65% increase from the pre-acquisition earnings of $4.6B in 2014. However, this $3B in increased sales brings with it some cash flow risks. Between their interest expense and merger-based “special
items” ZBH will see an increase of nearly $800M over pre-acquisition expenses. Additionally, the company is facing increasing pricing pressures and currency exchange expenses due to a strong dollar and a large portion of their business conducted overseas.
We forecast ZBH’s Operating Profit Margin to be 13.4%, which means to meet its $350M debt service they will need to see an $2.6B in sales revenue. When considering this it is sobering to think that 87% of ZBH’s increased revenue will go towards meeting their debt service. Even their pre-acquisition operating margin of 20% would require $1.75B in sales, 60% of forecasted 2016 revenue. This need for cash flow has two implications for ZBH:
Maximizing operating cash flow to meet debt obligations will be a major priority. While we do not forecast that ZBH will be unable to meet their debt obligations it would obviously have significant implications if they were to default. As a result management will be focusing on maximizing operating cash flow to meet their debt obligations.
Free Cash Flow will be spent on debt service, rather than PPE, R&D or additional dividend payments. Obviously, cash spent on meeting their debt service cannot be reinvested in the company. In the event of a short-fall in sales or unforeseen interruption of services ZBH could face a situation in which they must repay debt rather than invest in future capital for the company. This could have long term setbacks as R&D is an important element of ZBH’s competitive advantage.
Our Forecast vs. Analyst Consensus
Our target price and recommendation is keeping in trend with analyst expectations. According to Factset of the 20 analyst estimates given in the last 3 months the average target price is 140.68, about $5.00 above our target price ceiling. Our forecasted sales were slightly lower than consensus. Additionally, we estimate slightly higher SGA and COGS than analyst consensus as we believe that it will take longer than expected for ZBH to realize the synergies of their merger.
KEYS TO MONITOR
ZBH’s Debt Rating. Under our model ZBH will be able to cover its debt service obligations. An industrywide
disruption or company lawsuit could disrupt revenue and leave ZBH unable to meet their obligations. A debt ranking downgrade could signal trouble on the horizon for ZBH.
Quarterly Earnings Reports: A series of earnings misses could prove dangerous for ZBH and potentially leave them with the inability to meet their debt obligations.
Success of Process Mergers for Zimmer and Biomet: A large reason for the Biomet Purchase was that increase synergies could cut costs while increasing revenues. At this point very few of those synergies have been realized. Future operating costs should be examined to confirm that these synergies are beginning to emerge.
Medical breakthroughs by competitors. Specifically, in the areas of Knee and Hips products, as these make up 64% of ZBH revenues. A more effective treatment or less invasive surgery designed by a competing company would certainly have an adverse effect on ZBH’s revenue.
Government legislation. Congressional legislation pertaining to price ceilings, patent life changes and additional regulations would also have a significant impact on the profitability of ZBH’s products.
Status of 2.3% excise tax. The results of the coming presidential election may play a significant role here.
Henry Fund reports are created by student enrolled in the Applied Securities Management (Henry Fund) program at the University of Iowa’s Tippie School of Management. These reports are intended to provide potential employers and other interested parties an example of the analytical skills, investment knowledge, and communication abilities of Henry Fund students. Henry Fund analysts are not registered investment advisors, brokers or officially licensed financial professionals. The investment opinion contained in this report does not represent an offer or solicitation to buy or sell any of the aforementioned securities. Unless otherwise noted, facts and figures included in this report are from publicly available sources. This report is not a complete compilation of data, and its accuracy is not guaranteed. From time to time, the University of Iowa, its faculty, staff, students, or the Henry Fund may hold a financial interest in the companies mentioned in this report.
Certain Claims refers to recalls and cost of lawsuits.Special Items pre‐2015 included quality and operational excellence programs, 2015 on includes merger costs.Other Expenses in 2015 relates to debt issuances and foreign exchange costs not offset by hedging
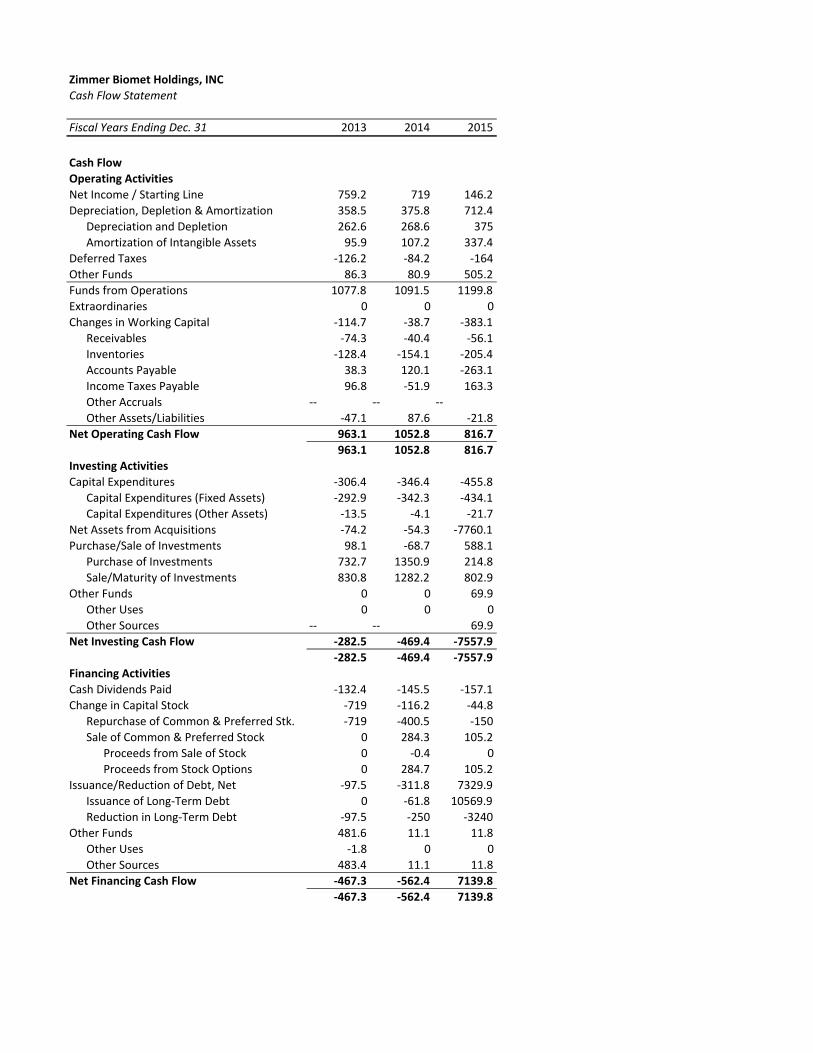
Amortization of Intangible Assets 95.9 107.2 337.4
Deferred Taxes ‐126.2 ‐84.2 ‐164
Other Funds 86.3 80.9 505.2
Funds from Operations 1077.8 1091.5 1199.8
Extraordinaries 0 0 0
Changes in Working Capital ‐114.7 ‐38.7 ‐383.1
Receivables ‐74.3 ‐40.4 ‐56.1
Inventories ‐128.4 ‐154.1 ‐205.4
Accounts Payable 38.3 120.1 ‐263.1
Income Taxes Payable 96.8 ‐51.9 163.3
Other Accruals ‐‐ ‐‐ ‐‐
Other Assets/Liabilities ‐47.1 87.6 ‐21.8
Net Operating Cash Flow 963.1 1052.8 816.7
963.1 1052.8 816.7
Investing Activities
Capital Expenditures ‐306.4 ‐346.4 ‐455.8
Capital Expenditures (Fixed Assets) ‐292.9 ‐342.3 ‐434.1
Capital Expenditures (Other Assets) ‐13.5 ‐4.1 ‐21.7
Net Assets from Acquisitions ‐74.2 ‐54.3 ‐7760.1
Purchase/Sale of Investments 98.1 ‐68.7 588.1
Purchase of Investments 732.7 1350.9 214.8
Sale/Maturity of Investments 830.8 1282.2 802.9
Other Funds 0 0 69.9
Other Uses 0 0 0
Other Sources ‐‐ ‐‐ 69.9
Net Investing Cash Flow ‐282.5 ‐469.4 ‐7557.9
‐282.5 ‐469.4 ‐7557.9
Financing Activities
Cash Dividends Paid ‐132.4 ‐145.5 ‐157.1
Change in Capital Stock ‐719 ‐116.2 ‐44.8
Repurchase of Common & Preferred Stk. ‐719 ‐400.5 ‐150
Sale of Common & Preferred Stock 0 284.3 105.2
Proceeds from Sale of Stock 0 ‐0.4 0
Proceeds from Stock Options 0 284.7 105.2
Issuance/Reduction of Debt, Net ‐97.5 ‐311.8 7329.9
Issuance of Long‐Term Debt 0 ‐61.8 10569.9
Reduction in Long‐Term Debt ‐97.5 ‐250 ‐3240
Other Funds 481.6 11.1 11.8
Other Uses ‐1.8 0 0
Other Sources 483.4 11.1 11.8
Net Financing Cash Flow ‐467.3 ‐562.4 7139.8
‐467.3 ‐562.4 7139.8
Zimmer Biomet Holdings, INCCash Flow Forecast
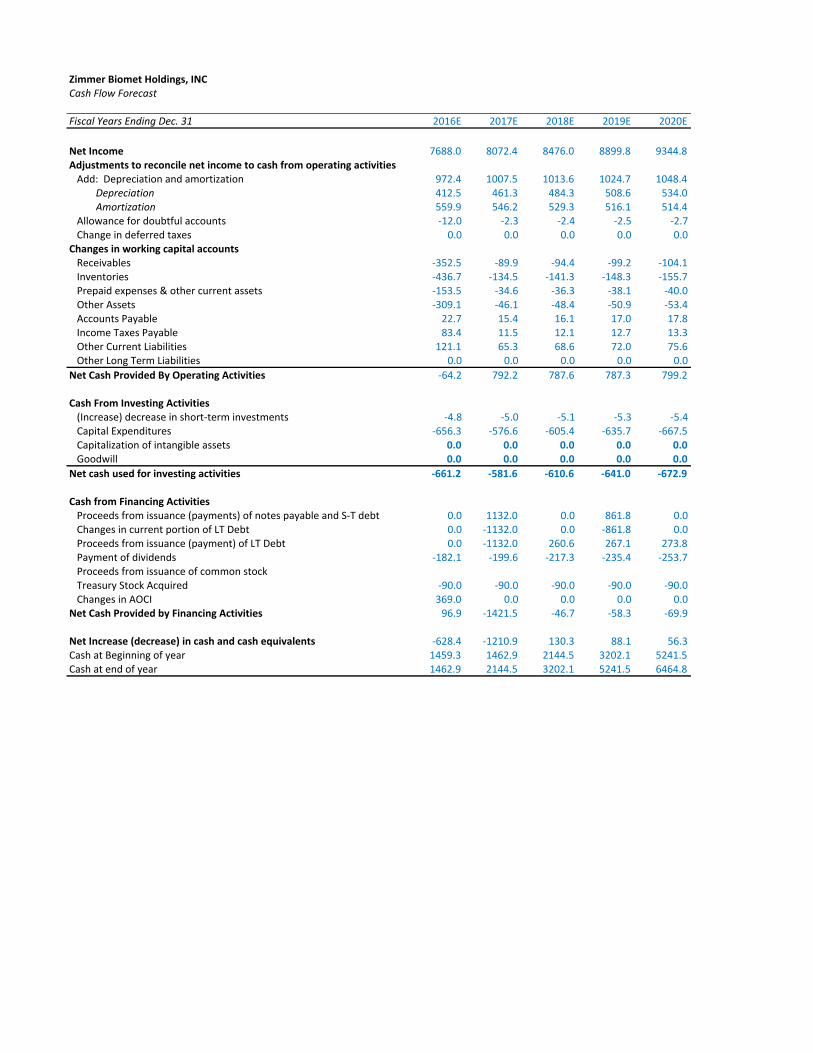
Fiscal Years Ending Dec. 31 2016E 2017E 2018E 2019E 2020E
Net Income 7688.0 8072.4 8476.0 8899.8 9344.8Adjustments to reconcile net income to cash from operating activities Add: Depreciation and amortization 972.4 1007.5 1013.6 1024.7 1048.4 Depreciation 412.5 461.3 484.3 508.6 534.0 Amortization 559.9 546.2 529.3 516.1 514.4 Allowance for doubtful accounts ‐12.0 ‐2.3 ‐2.4 ‐2.5 ‐2.7 Change in deferred taxes 0.0 0.0 0.0 0.0 0.0Changes in working capital accounts Receivables ‐352.5 ‐89.9 ‐94.4 ‐99.2 ‐104.1 Inventories ‐436.7 ‐134.5 ‐141.3 ‐148.3 ‐155.7 Prepaid expenses & other current assets ‐153.5 ‐34.6 ‐36.3 ‐38.1 ‐40.0 Other Assets ‐309.1 ‐46.1 ‐48.4 ‐50.9 ‐53.4 Accounts Payable 22.7 15.4 16.1 17.0 17.8 Income Taxes Payable 83.4 11.5 12.1 12.7 13.3 Other Current Liabilities 121.1 65.3 68.6 72.0 75.6 Other Long Term Liabilities 0.0 0.0 0.0 0.0 0.0
Net Cash Provided By Operating Activities ‐64.2 792.2 787.6 787.3 799.2
Cash From Investing Activities (Increase) decrease in short‐term investments ‐4.8 ‐5.0 ‐5.1 ‐5.3 ‐5.4 Capital Expenditures ‐656.3 ‐576.6 ‐605.4 ‐635.7 ‐667.5 Capitalization of intangible assets 0.0 0.0 0.0 0.0 0.0 Goodwill 0.0 0.0 0.0 0.0 0.0
Net cash used for investing activities ‐661.2 ‐581.6 ‐610.6 ‐641.0 ‐672.9
Cash from Financing Activities Proceeds from issuance (payments) of notes payable and S‐T debt 0.0 1132.0 0.0 861.8 0.0 Changes in current portion of LT Debt 0.0 ‐1132.0 0.0 ‐861.8 0.0 Proceeds from issuance (payment) of LT Debt 0.0 ‐1132.0 260.6 267.1 273.8 Payment of dividends ‐182.1 ‐199.6 ‐217.3 ‐235.4 ‐253.7 Proceeds from issuance of common stock Treasury Stock Acquired ‐90.0 ‐90.0 ‐90.0 ‐90.0 ‐90.0 Changes in AOCI 369.0 0.0 0.0 0.0 0.0Net Cash Provided by Financing Activities 96.9 ‐1421.5 ‐46.7 ‐58.3 ‐69.9
Net Increase (decrease) in cash and cash equivalents ‐628.4 ‐1210.9 130.3 88.1 56.3Cash at Beginning of year 1459.3 1462.9 2144.5 3202.1 5241.5Cash at end of year 1462.9 2144.5 3202.1 5241.5 6464.8
Zimmer Biomet Holdings, INCCommon Size Income Statement
Zimmer Biomet Holdings, INCWeighted Average Cost of Capital (WACC) Estimation
WACC 6.32%Cost of Equity 7.23%Cost of Debt 4.45%Cost of Preferred Stock 0.00%Market Value of Equity (Millions) 24,549.4 Market Value of Total Debt (Millions) 11,851.3 Market Value of Preferred Stock ‐ Market Value of Firm 36,400.7 Marginal Tax Rate
Equations:Equity Market Risk Premium 5% x Beta 1 + Risk free Rate 2.94%Cost of Equity 7.94%
Calculating Cost of EquityShares Outstanding (Millions) 187.4 x Current Price $101.5Equity Value $19,011.7Total Value of Equity $19,011.7Calculating Cost of DebtMarket Value of Long Term debt 11556.3Market Value of Short‐Term debt 0PF of Operating Lease 202Underfunded Pension 93.5Total Value of Debt 11851.3
* 4.45% cost of debt taken from 30 year senior note due August 15, 2045
Zimmer Biomet Holdings, INC
Discounted Cash Flow (DCF) and Economic Profit (EP) Valuation Models
Key Inputs:
CV Growth 2.50%
CV ROIC 10%
WACC 6.32%
Cost of Equity 7.23%
Fiscal Years Ending Dec. 31 2016E 2017E 2018E 2019E 2020E
DCF Model
Discount Period 1 2 3 4 5
NOPLAT 1,539 1,604 1,698 1,793 1,899
Beginning IC 15,371 16,115 15,907 15,732 15,589
Ending IC 16,115 15,907 15,732 15,589 15,465
Δ in Invested Capital 744 (208) (174) (144) (123)
NOPLAT 1,539 1,604 1,698 1,793 1,899
Less: Δ in Invested Capital (744) 208 174 144 123
Free Cash Flow 795 1,812 1,872 1,937 2,023
Continuing Value 37,291
PV oc Continuing Value 29,184
PV of free cash flows 747 1,603 1,558 1,516
Value of Operations 34,608
+ Short Term Investments 169
+ Excess Cash 1,433.62
‐ Total Debt (11,556)
‐ PV of Operating Leases (204)
‐ PV of Employee Stock Options (287)
‐ PV of Underfunded Pension (94)
Value of Equity 24,070
Shares Outstanding 190
Intrinsic Value (per share) 126.90
Price Today 2/26/16 134.94
EP Model
Periods to Discount 1 2 3 4 5
Economic Profit 568 586 692 799 914
Continuing Value 21,702
PV of Terminal Year EP 16,983.98
PV of Incremental Reinvested EP
PV of Economic Profit 533.83 518.07 576.07 625.08 672.88
Sum of EP 19,237
Add: Beginning Invested Capital CV 15,371
Value of Operations 34,608
+ Short Term Investments 169
+ Excess Cash 1,434
‐ Total Debt (11,556)
‐ PV of Operating Leases (204)
‐ PV of Employee Stock Options (287)
‐ PV of Underfunded Pension & Retirement Lia (94)
Value of Equity $24,070.47
Shares Outstanding 190
Intrinsic Value (per share) 126.90
Price Today 2/26/16 134.94
Zimmer Biomet Holdings, INCDividend Discount Model (DDM) or Fundamental P/E Valuation Model
Fiscal Years Ending Dec. 31 2016E 2017E 2018E 2019E 2020E
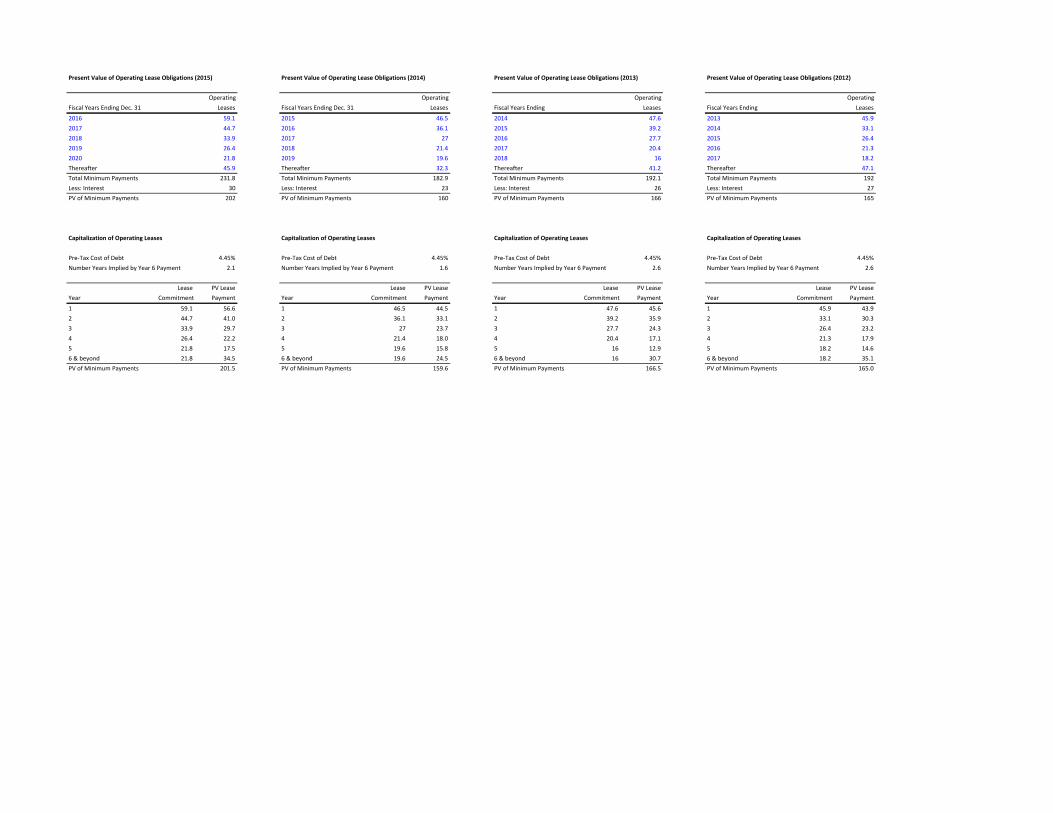
Present Value of Operating Lease Obligations (2015) Present Value of Operating Lease Obligations (2014) Present Value of Operating Lease Obligations (2013) Present Value of Operating Lease Obligations (2012)
Operating Operating Operating OperatingFiscal Years Ending Dec. 31 Leases Fiscal Years Ending Dec. 31 Leases Fiscal Years Ending Leases Fiscal Years Ending Leases
Capitalization of Operating Leases Capitalization of Operating Leases Capitalization of Operating Leases Capitalization of Operating Leases
Pre‐Tax Cost of Debt 4.45% Pre‐Tax Cost of Debt 4.45% Pre‐Tax Cost of Debt 4.45% Pre‐Tax Cost of Debt 4.45%Number Years Implied by Year 6 Payment 2.1 Number Years Implied by Year 6 Payment 1.6 Number Years Implied by Year 6 Payment 2.6 Number Years Implied by Year 6 Payment 2.6
Lease PV Lease Lease PV Lease Lease PV Lease Lease PV LeaseYear Commitment Payment Year Commitment Payment Year Commitment Payment Year Commitment Payment
Effects of ESOP Exercise and Share Repurchases on Common Stock Balance Sheet Account and Number of Shares Outstanding
Number of Options Outstanding (shares): 7,931,000Average Time to Maturity (years): 5.70Expected Annual Number of Options Exercised: 1,391,404
Current Average Strike Price: 78.73$ Cost of Equity: 7.23%Current Stock Price: $101.45
2016E 2017E 2018E 2019E 2020EIncrease in Shares Outstanding: 1,391,404 1,391,404 1,391,404 1,391,404 1,391,404Average Strike Price: 78.73$ 78.73$ 78.73$ 78.73$ 78.73$ Increase in Common Stock Account: 110 110 110 110 110
Change in Treasury Stock ‐90,000,000 ‐90,000,000 ‐90,000,000 ‐90,000,000 ‐90,000,000Expected Price of Repurchased Shares: 101.45$ 108.78$ 116.65$ 125.08$ 134.13$ Number of Shares Repurchased: (887,137) (827,321) (771,539) (719,518) (671,004)
Shares Outstanding (beginning of the year) 187,400 189,679 191,897 194,060 196,171Plus: Shares Issued Through ESOP 1,391 1,391 1,391 1,391 1,391Less: Shares Repurchased in Treasury (887) (827) (772) (720) (671) Shares Outstanding (end of the year) 189,679 191,897 194,060 196,171 198,234
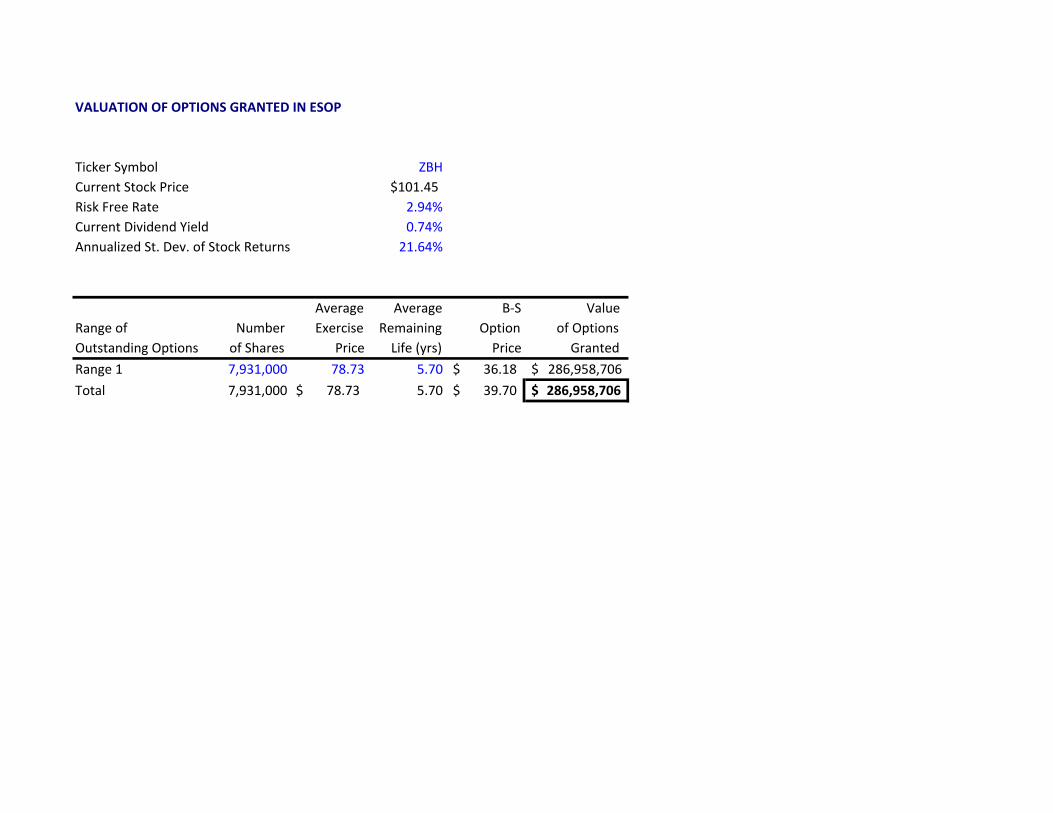
VALUATION OF OPTIONS GRANTED IN ESOP
Ticker Symbol ZBHCurrent Stock Price $101.45Risk Free Rate 2.94%Current Dividend Yield 0.74%Annualized St. Dev. of Stock Returns 21.64%
Average Average B‐S ValueRange of Number Exercise Remaining Option of OptionsOutstanding Options of Shares Price Life (yrs) Price GrantedRange 1 7,931,000 78.73 5.70 36.18$ 286,958,706$ Total 7,931,000 78.73$ 5.70 39.70$ 286,958,706$