223
1 DRAFT REPORT
1
DRAFT REPORT
Foreword
The Zimbabwe Vulnerability Assessment Committee (ZimVAC), as has become the tradition since 2002, conducted the Annual
Rural Livelihoods Assessment (ARLA) number twelve. The assessment is part of a comprehensive information system that informs
Government and its Development Partners on programming necessary for saving lives and strengthening rural livelihoods in
Zimbabwe. ZimVAC is the central pillar around which the Food and Nutrition Council (FNC) plans to build its strategy to fulfil
commitment number 6 of the recently launched Government of Zimbabwe Food and Nutrition Security Policy.
The 2013 ARLA covers and provides updates on pertinent rural household livelihoods issues such as education, food and income
sources, income levels, expenditure patterns, crop production, livestock production, child nutrition, water and sanitation, crop
post-harvest management and issues associated with it. In addition to paying particular focus on and putting households at the
centre of its analysis, the ARLA also collects and records rural communities’ views on their livelihoods challenges as well as their
development aspirations.
The ARLA recognises and draws from other national contemporary surveys that define the socio economic context of rural
livelihoods. Most notable amongst these are Crop and Livestock Assessments, the Health and Demographic surveys, the National
Census, the Poverty Assessment Surveys and national economic performance reviews.
We commit this report to you all for your use and reference in your invaluable work. We hope it will light your way as you search
for lasting measures in addressing priority issues keeping many of our rural households vulnerable to food and nutrition insecurity.
We want to express our profound gratitude to all our Development Partners, in the country and beyond, for their support
throughout the survey. Financial support was received from FAO, WFP and SADC-RVAA. Without this support this ARLA would not
have been the success it is. We also want to thank our staff at FNC for providing leadership, coordination and management to the
whole survey.
It is our joint honour and pleasure to present this report. We hope it will improve short, medium and long term planning aimed at
improving the quality of life amongst rural Zimbabweans.
George Kembo Dr. Robson Mafoti ZimVAC Chairperson Chief Executive Officer - SIRDC
2
Acknowledgements
3
Food And Nutrition Council
Scientific and Industrial Research and Development Centre
Ministry of Local Government, Rural and Urban Development
Ministry of Agriculture, Mechanisation and Irrigation Development
Ministry of Labour and Social Services Zimbabwe National Statistics Agency Ministry of Health and Child Welfare Ministry of Education, Arts, Sports and
Culture Food and Agriculture Organization World Food Programme United States Agency for International
Development Famine Early Warning Systems Network United Nations Office for the
Coordination Of Humanitarian Affairs
Promoting Recovery In Zimbabwe (PRIZE) ACF Practical Action Christian Care World Vision Care International BHASO SAT Save the Children Zimbabwe IRC PLAN
GOAL Caritas ORAP FACT COMMTECH CTDT CADS
SIRDC and FNC, on behalf of the Government of Zimbabwe, wish to express their sincere gratitude and appreciation to the following ZimVAC members for their technical, financial and material support and contributions to the 2013 Rural Livelihoods Assessment:
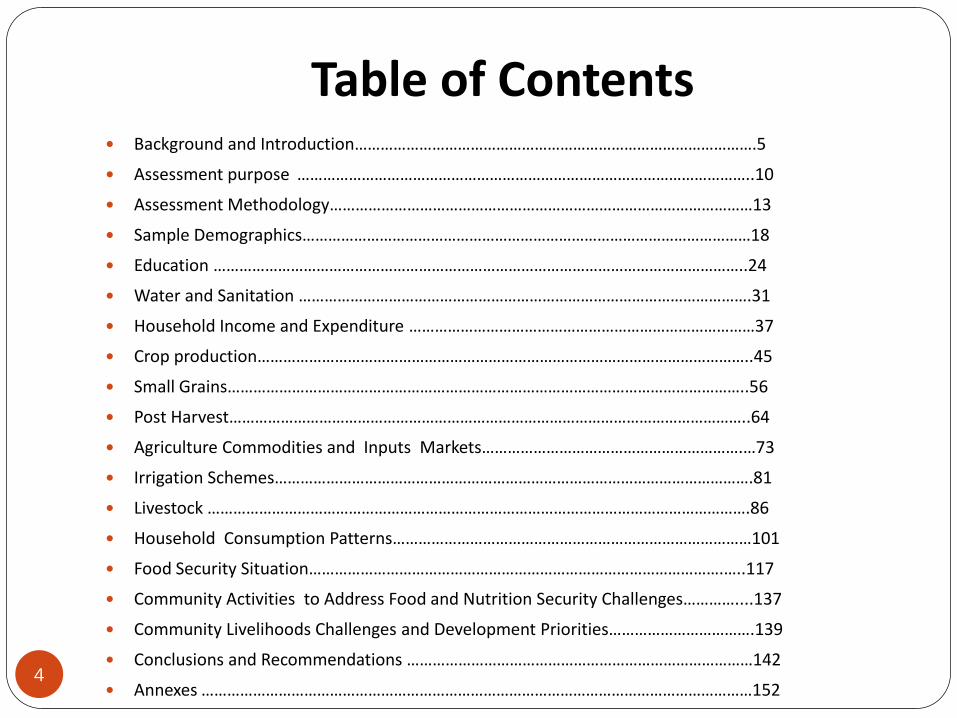
Table of Contents
4
Background and Introduction………………………………………………………………………………….5
Assessment purpose ……………………………………………………………………………………………..10
Assessment Methodology………………………………………………………………………………………13
Sample Demographics……………………………………………………………………………………………18
Education ……………………………………………………………………………………………………………..24
Water and Sanitation …………………………………………………………………………………………….31
Household Income and Expenditure ………………………………………………………………………37
Crop production……………………………………………………………………………………………………..45
Small Grains…………………………………………………………………………………………………………..56
Post Harvest…………………………………………………………………………………………………………..64
Agriculture Commodities and Inputs Markets…………………………………………………….…73
Irrigation Schemes………………………………………………………………………………………………….81
Livestock ……………………………………………………………………………………………………………….86
Household Consumption Patterns…………………………………………………………………………101
Food Security Situation…………………………………………………………………………………….…..117
Community Activities to Address Food and Nutrition Security Challenges…………....137
Community Livelihoods Challenges and Development Priorities…………………………….139
Conclusions and Recommendations ………………………………………………………………………142
Annexes …………………………………………………………………………………………………………………152

Background and Introduction
Background- Economic Overview
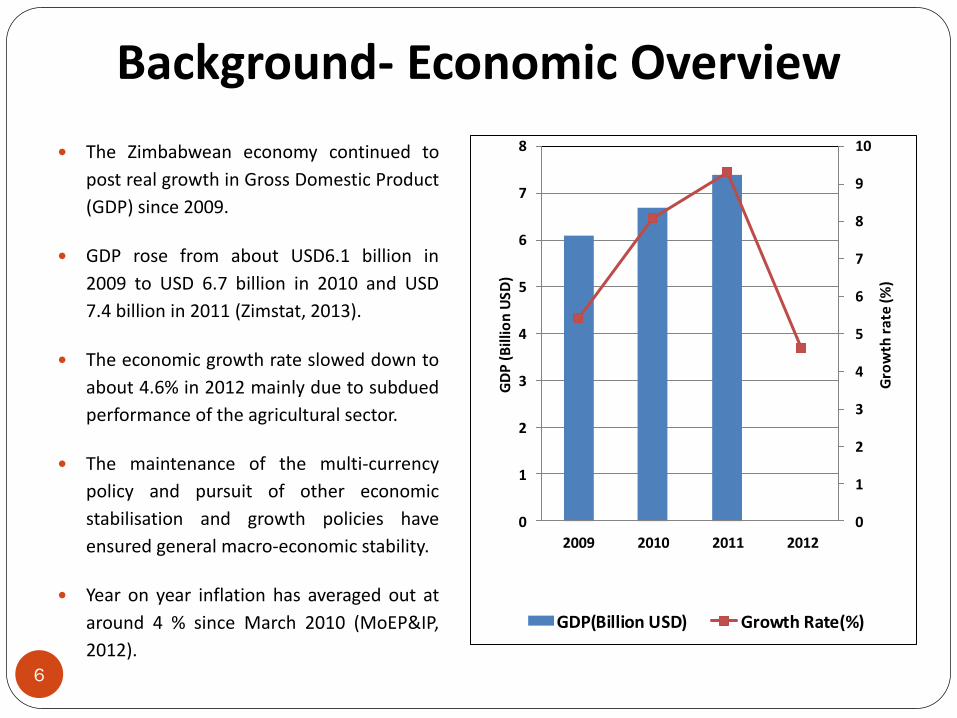
The Zimbabwean economy continued to
post real growth in Gross Domestic Product
(GDP) since 2009.
GDP rose from about USD6.1 billion in
2009 to USD 6.7 billion in 2010 and USD
7.4 billion in 2011 (Zimstat, 2013).
The economic growth rate slowed down to
about 4.6% in 2012 mainly due to subdued
performance of the agricultural sector.
The maintenance of the multi-currency
policy and pursuit of other economic
stabilisation and growth policies have
ensured general macro-economic stability.
Year on year inflation has averaged out at
around 4 % since March 2010 (MoEP&IP,
2012).
0
1
2
3
4
5
6
7
8
9
10
0
1
2
3
4
5
6
7
8
2009 2010 2011 2012
Gro
wth
rat
e (%
)
GD
P (
Bil
lio
n U
SD)
GDP(Billion USD) Growth Rate(%)
6
Background – Rural Poverty
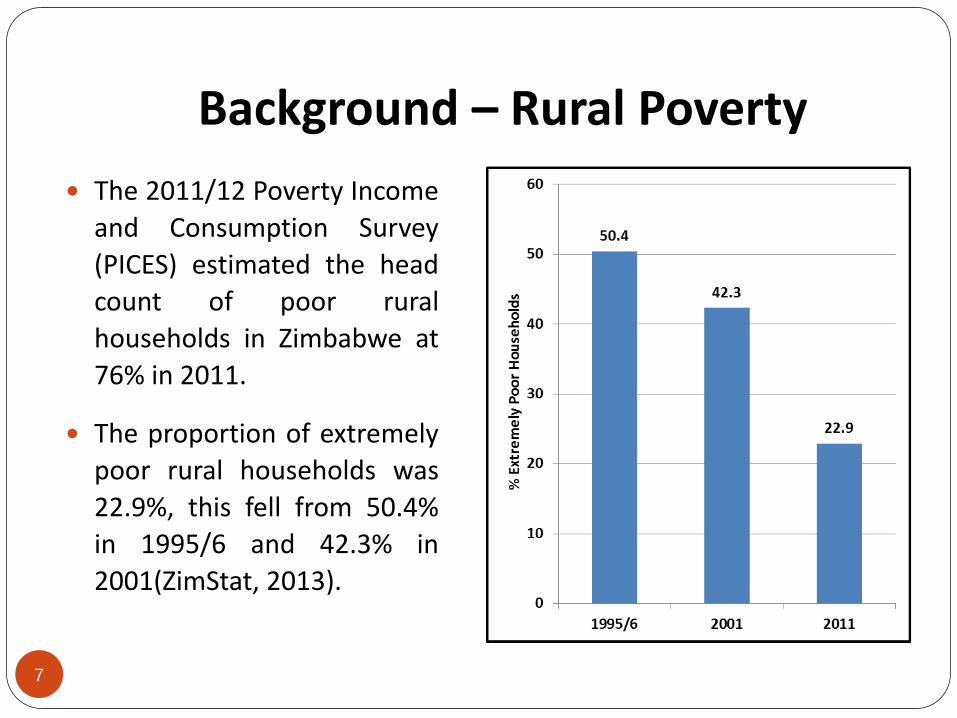
The 2011/12 Poverty Income
and Consumption Survey
(PICES) estimated the head
count of poor rural
households in Zimbabwe at
76% in 2011.
The proportion of extremely
poor rural households was
22.9%, this fell from 50.4%
in 1995/6 and 42.3% in
2001(ZimStat, 2013).
7
Background - Agriculture
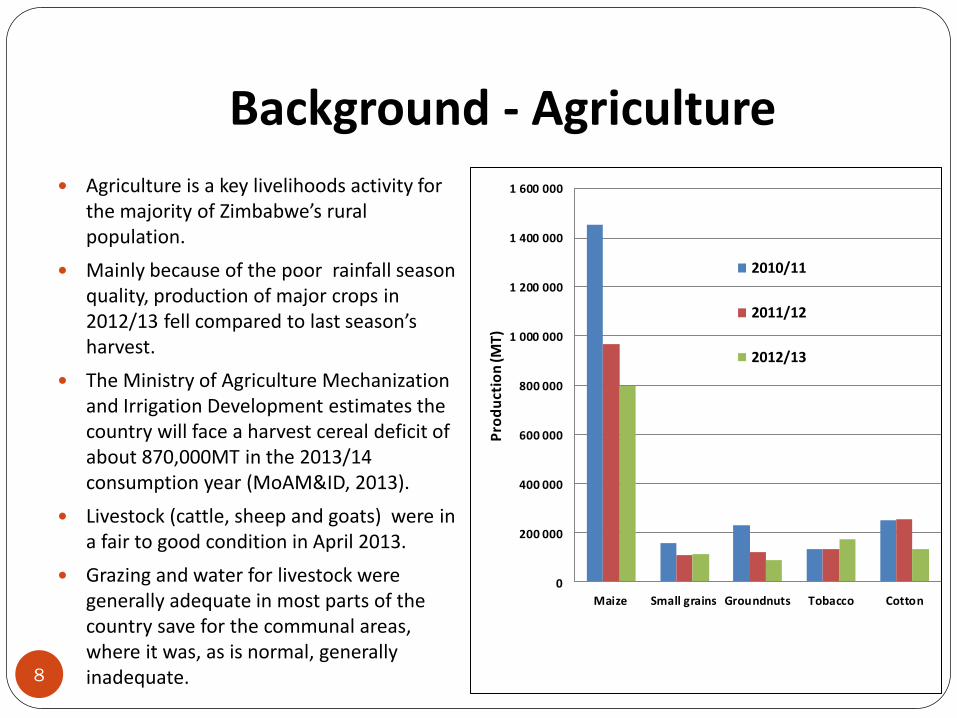
Agriculture is a key livelihoods activity for the majority of Zimbabwe’s rural population.
Mainly because of the poor rainfall season quality, production of major crops in 2012/13 fell compared to last season’s harvest.
The Ministry of Agriculture Mechanization and Irrigation Development estimates the country will face a harvest cereal deficit of about 870,000MT in the 2013/14 consumption year (MoAM&ID, 2013).
Livestock (cattle, sheep and goats) were in a fair to good condition in April 2013.
Grazing and water for livestock were generally adequate in most parts of the country save for the communal areas, where it was, as is normal, generally inadequate.
0
200 000
400 000
600 000
800 000
1 000 000
1 200 000
1 400 000
1 600 000
Maize Small grains Groundnuts Tobacco Cotton
Pro
du
ctio
n (M
T)
2010/11
2011/12
2012/13
8
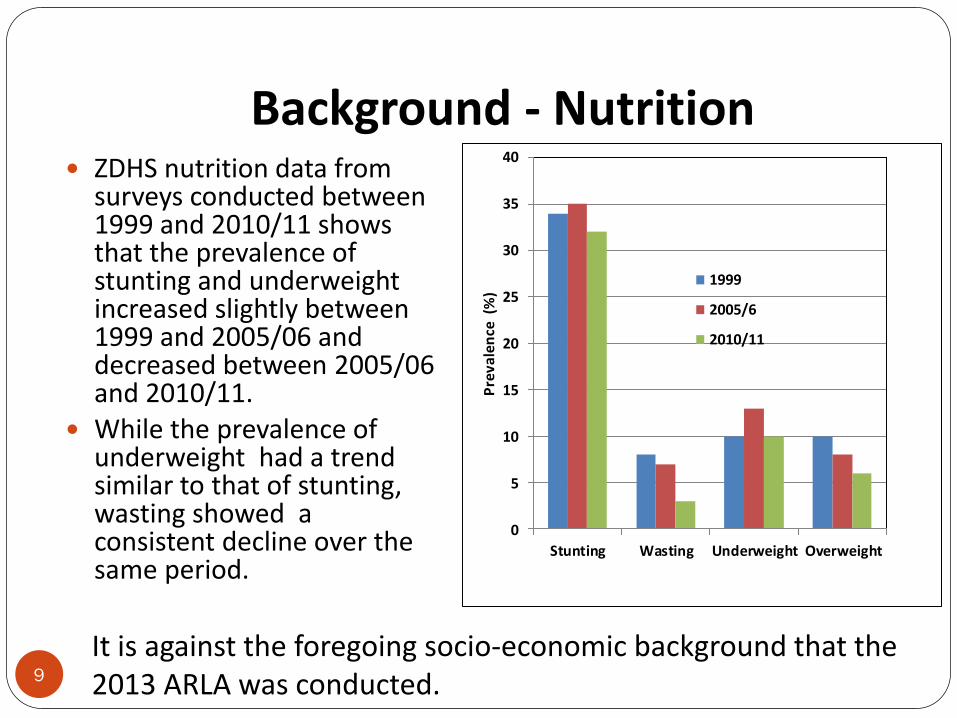
Background - Nutrition ZDHS nutrition data from
surveys conducted between 1999 and 2010/11 shows that the prevalence of stunting and underweight increased slightly between 1999 and 2005/06 and decreased between 2005/06 and 2010/11.
While the prevalence of underweight had a trend similar to that of stunting, wasting showed a consistent decline over the same period.
0
5
10
15
20
25
30
35
40
Stunting Wasting Underweight Overweight
Pre
vale
nce
(%
)
1999
2005/6
2010/11
9
It is against the foregoing socio-economic background that the 2013 ARLA was conducted.
Background - Health
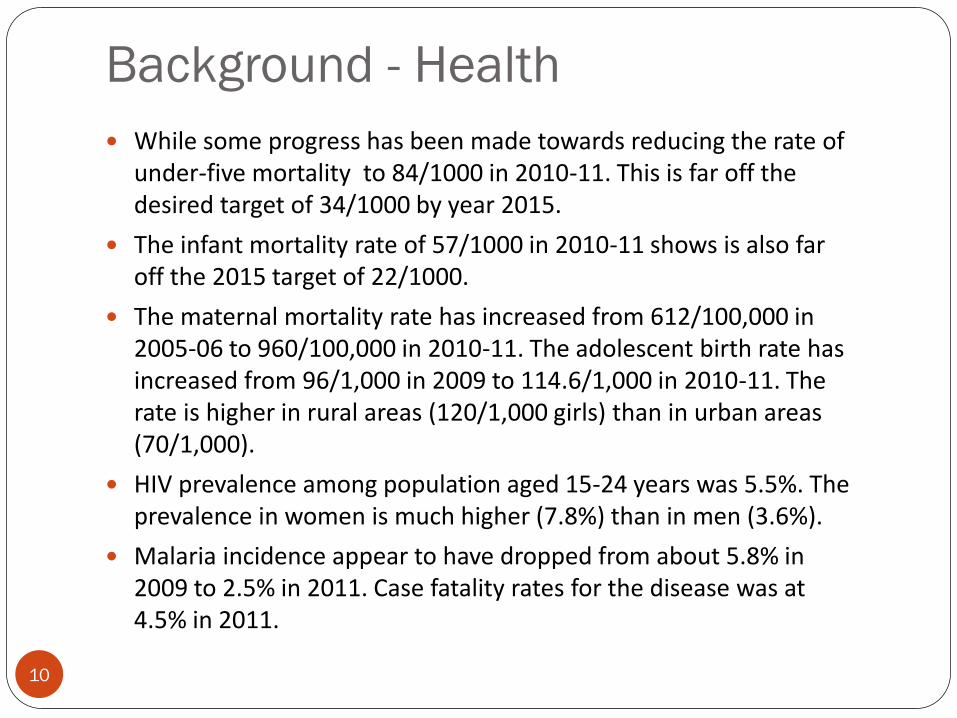
While some progress has been made towards reducing the rate of under-five mortality to 84/1000 in 2010-11. This is far off the desired target of 34/1000 by year 2015.
The infant mortality rate of 57/1000 in 2010-11 shows is also far off the 2015 target of 22/1000.
The maternal mortality rate has increased from 612/100,000 in 2005-06 to 960/100,000 in 2010-11. The adolescent birth rate has increased from 96/1,000 in 2009 to 114.6/1,000 in 2010-11. The rate is higher in rural areas (120/1,000 girls) than in urban areas (70/1,000).
HIV prevalence among population aged 15-24 years was 5.5%. The prevalence in women is much higher (7.8%) than in men (3.6%).
Malaria incidence appear to have dropped from about 5.8% in 2009 to 2.5% in 2011. Case fatality rates for the disease was at 4.5% in 2011.
10

Assessment Purpose
Assessment Objectives
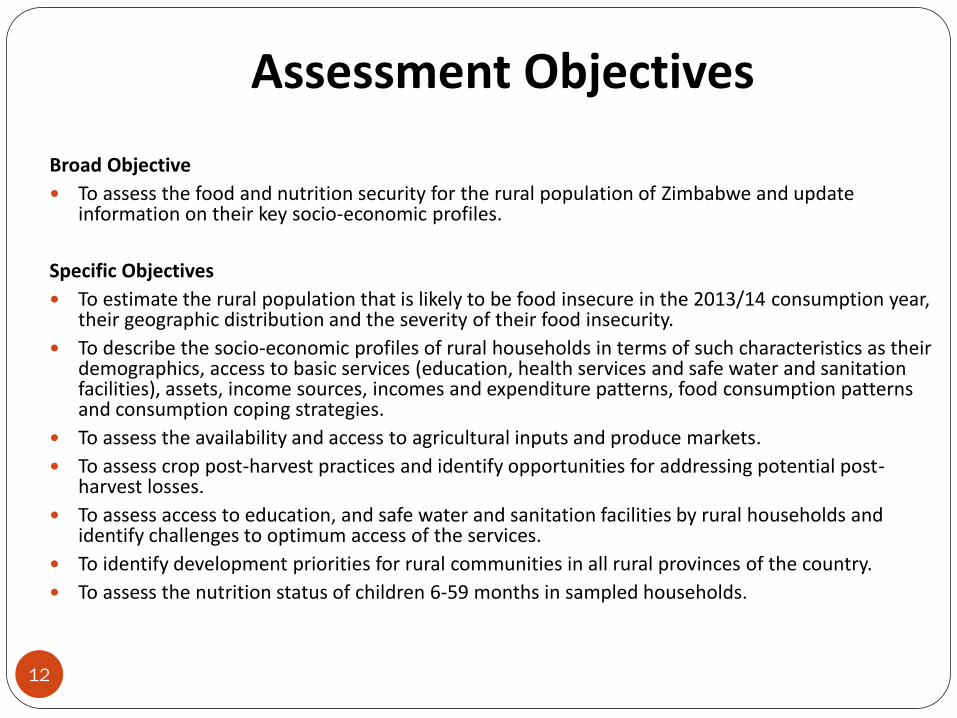
Broad Objective
To assess the food and nutrition security for the rural population of Zimbabwe and update information on their key socio-economic profiles.
Specific Objectives
To estimate the rural population that is likely to be food insecure in the 2013/14 consumption year, their geographic distribution and the severity of their food insecurity.
To describe the socio-economic profiles of rural households in terms of such characteristics as their demographics, access to basic services (education, health services and safe water and sanitation facilities), assets, income sources, incomes and expenditure patterns, food consumption patterns and consumption coping strategies.
To assess the availability and access to agricultural inputs and produce markets.
To assess crop post-harvest practices and identify opportunities for addressing potential post-harvest losses.
To assess access to education, and safe water and sanitation facilities by rural households and identify challenges to optimum access of the services.
To identify development priorities for rural communities in all rural provinces of the country.
To assess the nutrition status of children 6-59 months in sampled households.
12
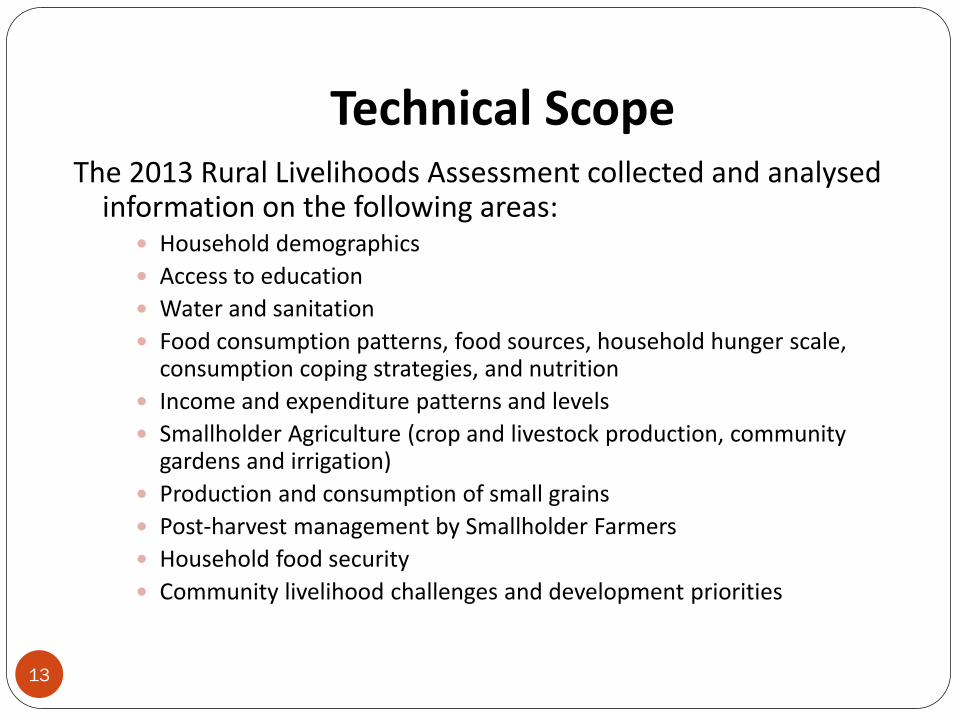
Technical Scope The 2013 Rural Livelihoods Assessment collected and analysed
information on the following areas: Household demographics
Access to education
Water and sanitation
Food consumption patterns, food sources, household hunger scale, consumption coping strategies, and nutrition
Income and expenditure patterns and levels
Smallholder Agriculture (crop and livestock production, community gardens and irrigation)
Production and consumption of small grains
Post-harvest management by Smallholder Farmers
Household food security
Community livelihood challenges and development priorities
13
Assessment Methodology
Assessment Methodology and Process
The assessment design was informed by the multi-sector objectives generated by a multi-stakeholder consultation process.
The technical team developed a community group interview summary form and a structured household questionnaire as the two primary data collection instruments.
A team of assessment supervisors was recruited from the Government, United Nations and Non-Governmental Organisations who are members of ZimVAC. This underwent a training-of trainers training in all aspects of the assessment.
Ministry of Local Government coordinated the recruitment of 8 provincial coordinators for the assessment and these in turn coordinated the recruitment of at least 4 district level enumerators in each of the 60 rural districts of Zimbabwe. Experience in data collection was used as one of the key enumerator selection criteria.
Provincial coordinators mobilised vehicles used by district enumerators from various Government departments as well as relevant NGOs for data collection in the respective districts.
A two day training in assessment data collection of district enumerators was conducted by the assessment supervisors during the period 29 April to 30 April 2013.
Primary data collection took place from 2 May to 13 May 2013 supported by national level supervisors and provincial coordinators.
The assessment made a concerted effort to raise awareness of not only the assessment but also broader ZimVAC activities amongst District Administrators and Rural District Council Chief Executive Officers.
Centralized data entry took place from 6 May to 17 May 2013 in Harare. This was followed by an intensive process of checking the accuracy of data entry.
Data analysis and report writing was done from 21 May to 6 June 2013 by the assessment technical team. Various secondary data was used to contextualise their analysis and reporting. The analysis and reporting was subjected to peer review and correction.
15
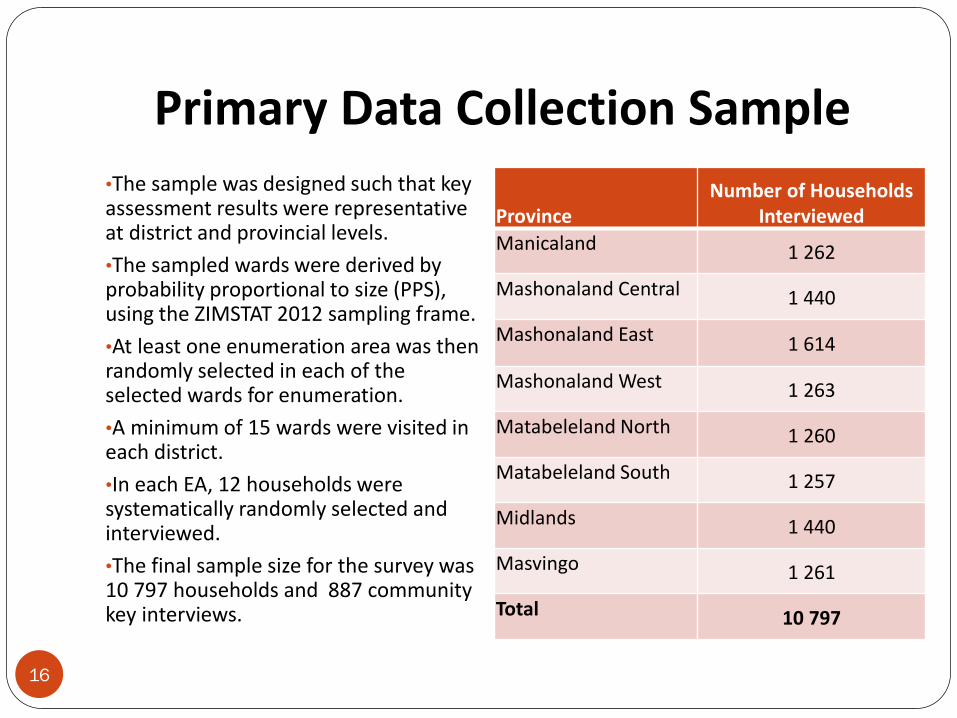
Primary Data Collection Sample •The sample was designed such that key assessment results were representative at district and provincial levels.
•The sampled wards were derived by probability proportional to size (PPS), using the ZIMSTAT 2012 sampling frame.
•At least one enumeration area was then randomly selected in each of the selected wards for enumeration.
•A minimum of 15 wards were visited in each district.
•In each EA, 12 households were systematically randomly selected and interviewed.
•The final sample size for the survey was 10 797 households and 887 community key interviews.
Province Number of Households
Interviewed
Manicaland 1 262
Mashonaland Central 1 440
Mashonaland East 1 614
Mashonaland West 1 263
Matabeleland North 1 260
Matabeleland South 1 257
Midlands 1 440
Masvingo 1 261
Total 10 797
16
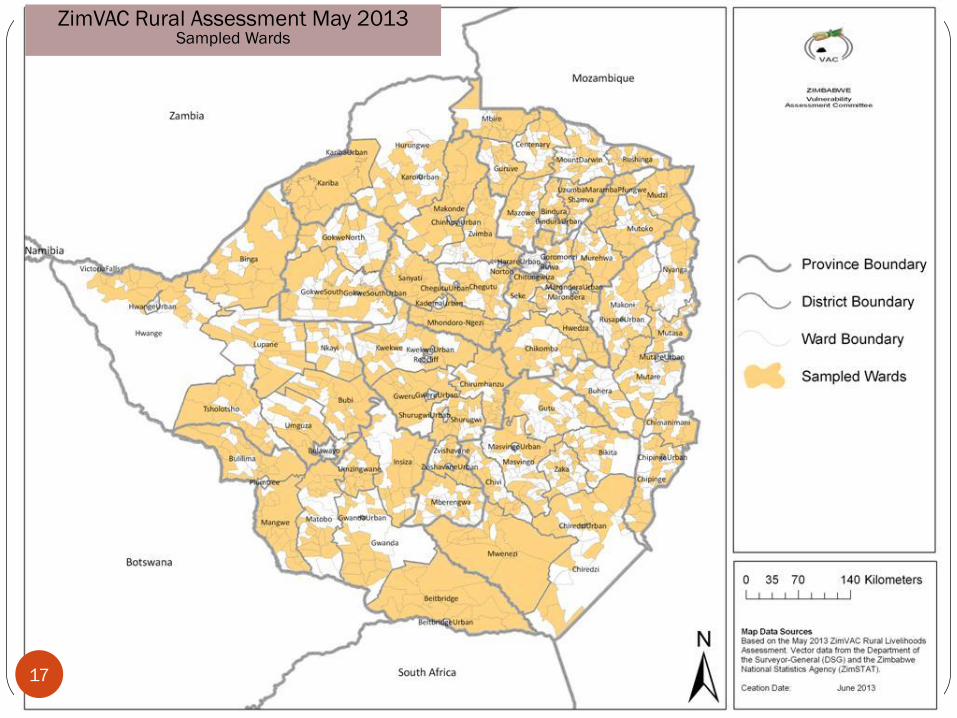
ZimVAC Rural Assessment May 2013 Sampled Wards
17

Data Entry, Cleaning and Analysis Primary data collected was entered using the Census
and Survey Processing System (CSPro) and exported into the Statistical Package for Social Sciences (SPSS).
Most of the data cleaning and analysis was done using SPSS complemented by MS Excel and Geographic Information System (GIS) packages.
18
Sample Demographics
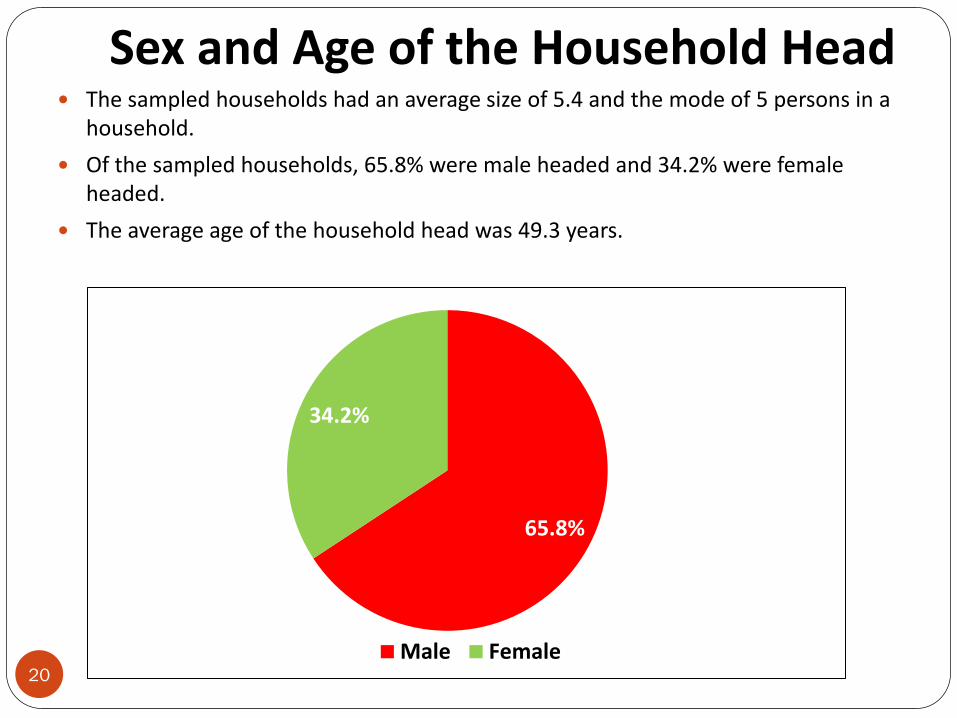
Sex and Age of the Household Head The sampled households had an average size of 5.4 and the mode of 5 persons in a
household.
Of the sampled households, 65.8% were male headed and 34.2% were female headed.
The average age of the household head was 49.3 years.
65.8%
34.2%
Male Female20
Marital Status of Household Head
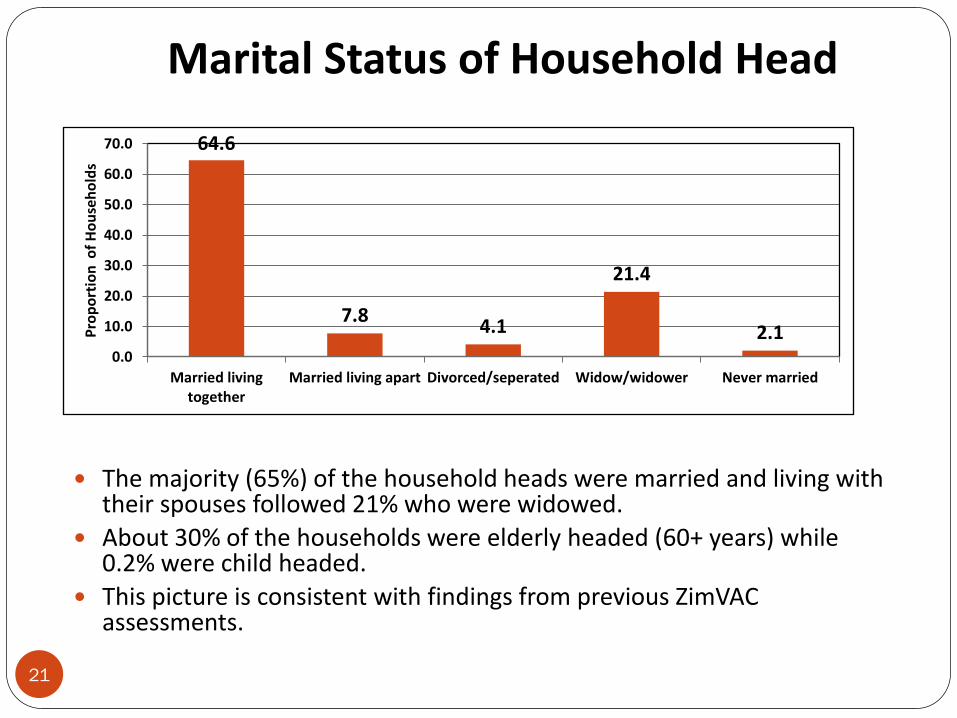
The majority (65%) of the household heads were married and living with their spouses followed 21% who were widowed.
About 30% of the households were elderly headed (60+ years) while 0.2% were child headed.
This picture is consistent with findings from previous ZimVAC assessments.
21
64.6
7.8 4.1
21.4
2.1 0.0
10.0
20.0
30.0
40.0
50.0
60.0
70.0
Married livingtogether
Married living apart Divorced/seperated Widow/widower Never married
Pro
po
rtio
n o
f H
ou
seh
old
s
Sample Distribution by Age and Household Size
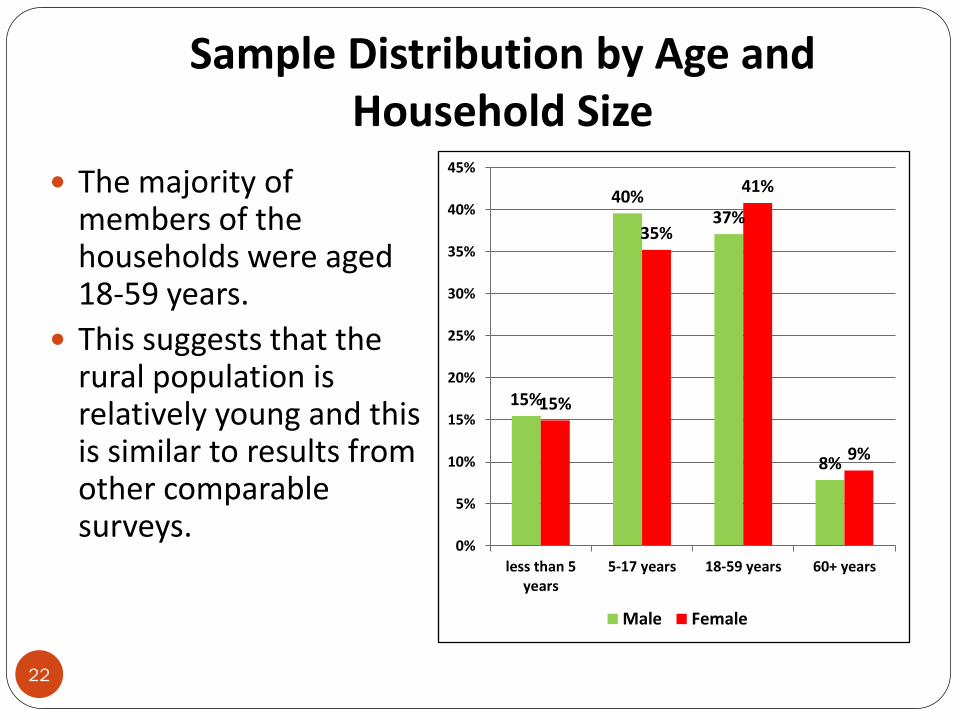
The majority of members of the households were aged 18-59 years.
This suggests that the rural population is relatively young and this is similar to results from other comparable surveys.
15%
40% 37%
8%
15%
35%
41%
9%
0%
5%
10%
15%
20%
25%
30%
35%
40%
45%
less than 5years
5-17 years 18-59 years 60+ years
Male Female
22
Vulnerability Indicators
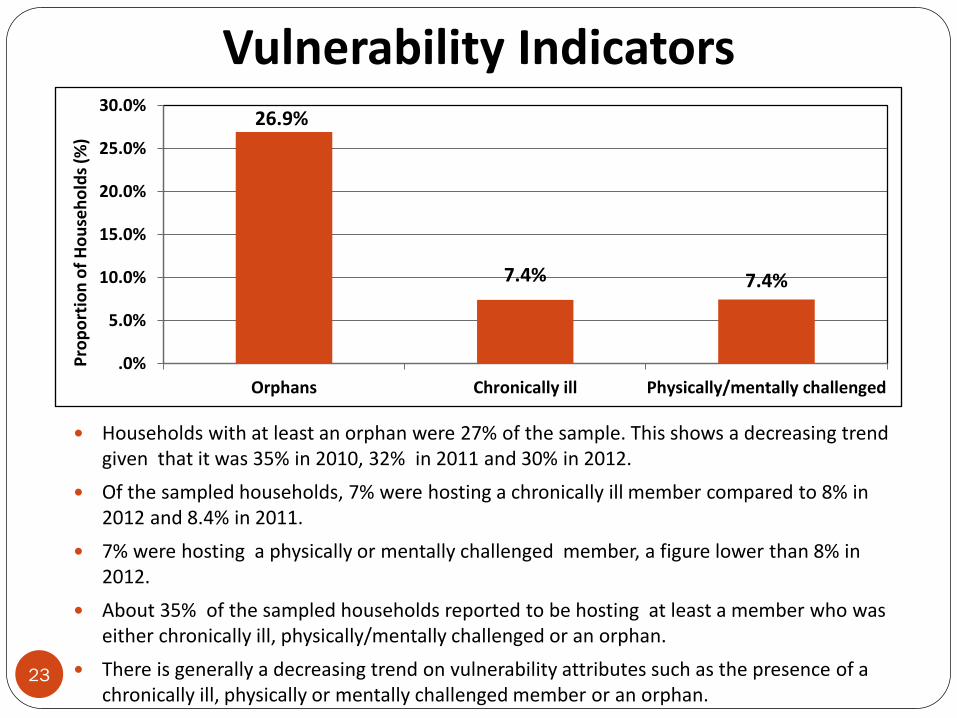
Households with at least an orphan were 27% of the sample. This shows a decreasing trend given that it was 35% in 2010, 32% in 2011 and 30% in 2012.
Of the sampled households, 7% were hosting a chronically ill member compared to 8% in 2012 and 8.4% in 2011.
7% were hosting a physically or mentally challenged member, a figure lower than 8% in 2012.
About 35% of the sampled households reported to be hosting at least a member who was either chronically ill, physically/mentally challenged or an orphan.
There is generally a decreasing trend on vulnerability attributes such as the presence of a chronically ill, physically or mentally challenged member or an orphan.
26.9%
7.4% 7.4%
.0%
5.0%
10.0%
15.0%
20.0%
25.0%
30.0%
Orphans Chronically ill Physically/mentally challenged
Pro
po
rtio
n o
f H
ou
seh
old
s (%
)
23
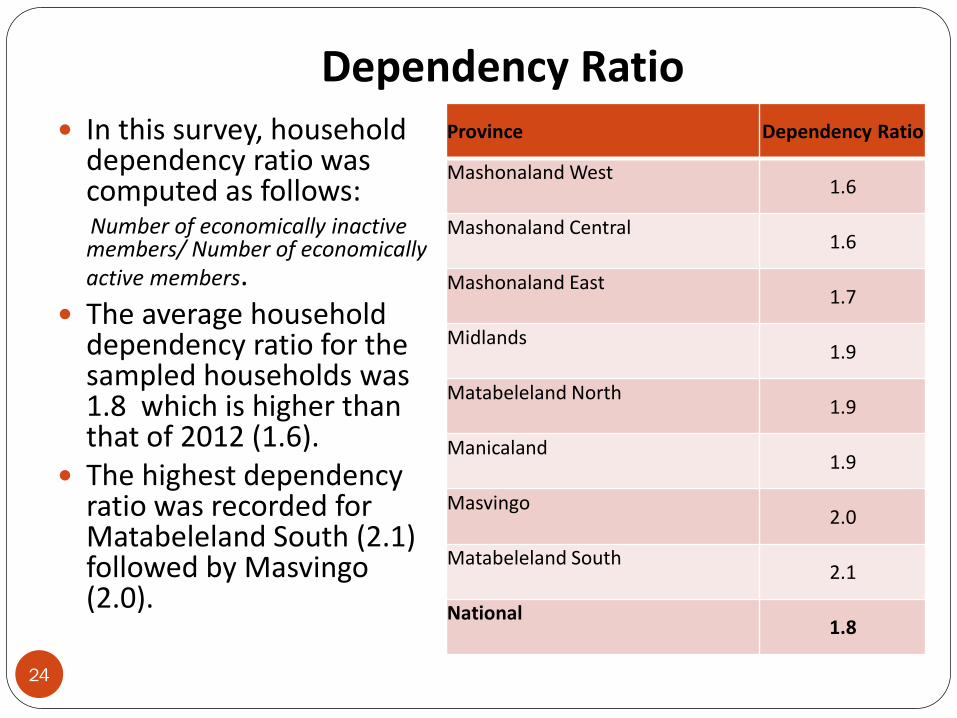
Dependency Ratio In this survey, household
dependency ratio was computed as follows:
Number of economically inactive members/ Number of economically active members.
The average household dependency ratio for the sampled households was 1.8 which is higher than that of 2012 (1.6).
The highest dependency ratio was recorded for Matabeleland South (2.1) followed by Masvingo (2.0).
Province Dependency Ratio
Mashonaland West 1.6
Mashonaland Central 1.6
Mashonaland East 1.7
Midlands 1.9
Matabeleland North 1.9
Manicaland 1.9
Masvingo 2.0
Matabeleland South 2.1
National 1.8
24
To describe the socio-economic profiles of rural households in terms of such
characteristics as their access to education
Education
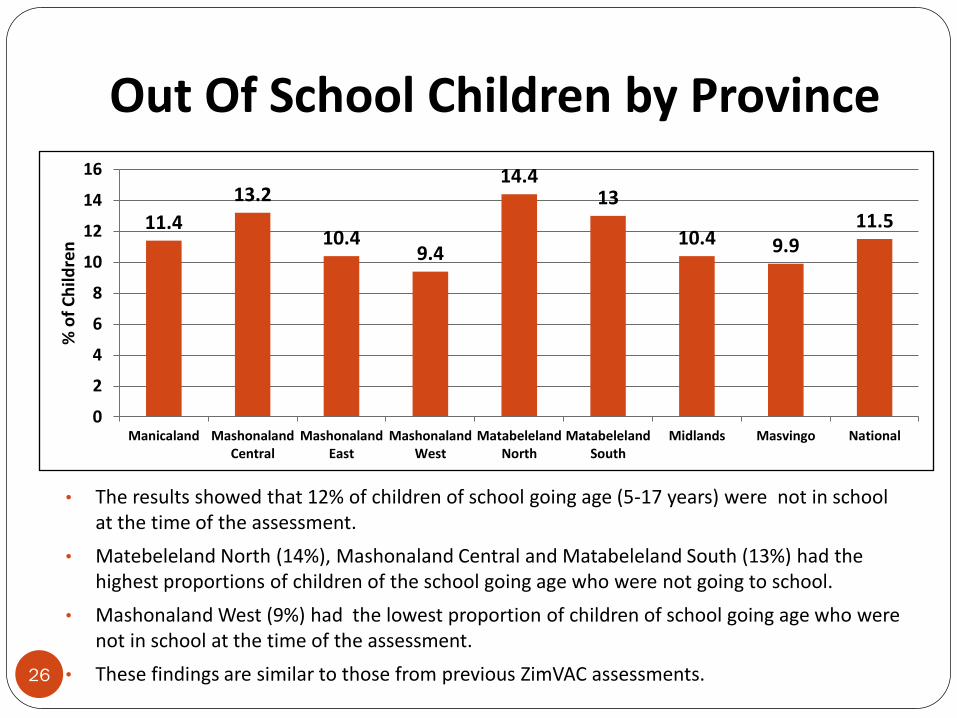
Out Of School Children by Province
• The results showed that 12% of children of school going age (5-17 years) were not in school at the time of the assessment.
• Matebeleland North (14%), Mashonaland Central and Matabeleland South (13%) had the highest proportions of children of the school going age who were not going to school.
• Mashonaland West (9%) had the lowest proportion of children of school going age who were not in school at the time of the assessment.
• These findings are similar to those from previous ZimVAC assessments.
11.4
13.2
10.4 9.4
14.4 13
10.4 9.9 11.5
0
2
4
6
8
10
12
14
16
Manicaland MashonalandCentral
MashonalandEast
MashonalandWest
MatabelelandNorth
MatabelelandSouth
Midlands Masvingo National
% o
f C
hild
ren
26
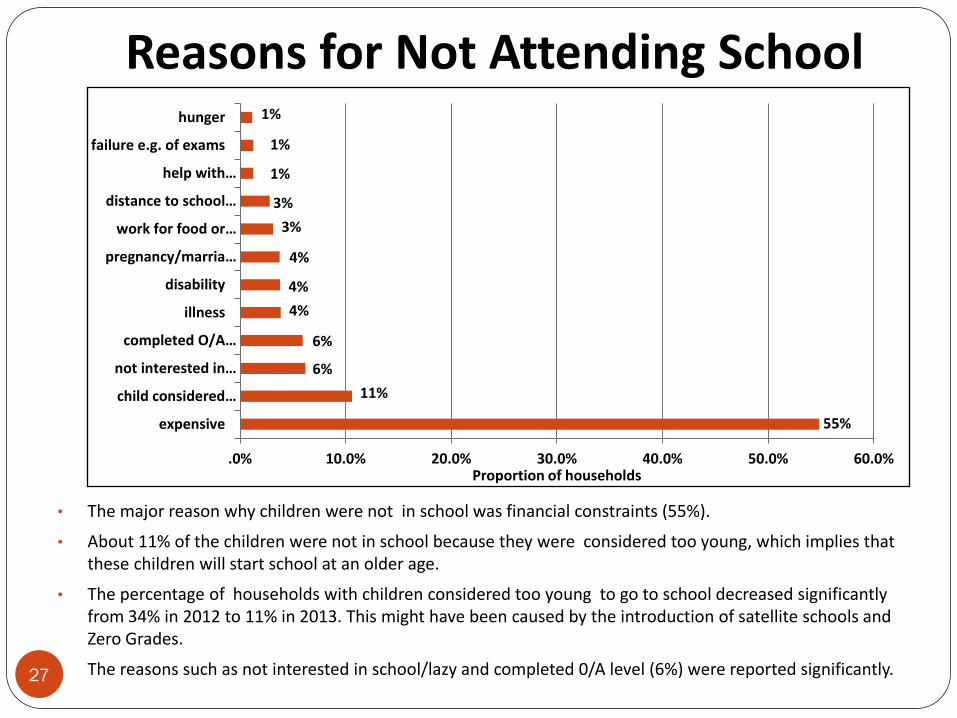
Reasons for Not Attending School
• The major reason why children were not in school was financial constraints (55%).
• About 11% of the children were not in school because they were considered too young, which implies that these children will start school at an older age.
• The percentage of households with children considered too young to go to school decreased significantly from 34% in 2012 to 11% in 2013. This might have been caused by the introduction of satellite schools and Zero Grades.
• The reasons such as not interested in school/lazy and completed 0/A level (6%) were reported significantly.
55%
11%
6%
6%
4%
4%
4%
3%
3%
1%
1%
1%
.0% 10.0% 20.0% 30.0% 40.0% 50.0% 60.0%
expensive
child considered…
not interested in…
completed O/A…
illness
disability
pregnancy/marria…
work for food or…
distance to school…
help with…
failure e.g. of exams
hunger
Proportion of households
27
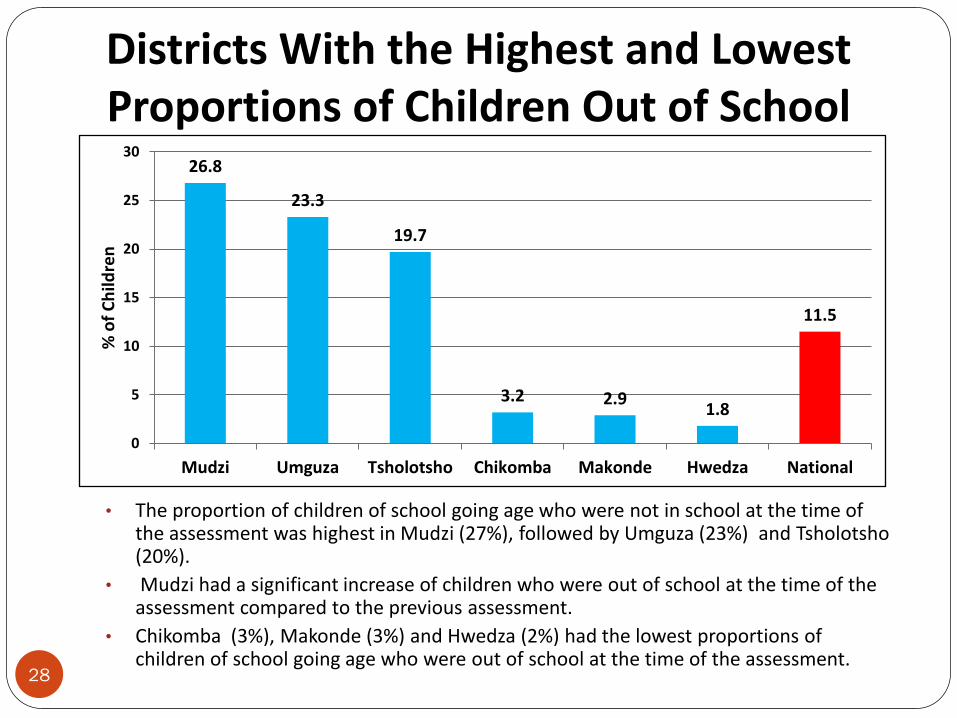
Districts With the Highest and Lowest Proportions of Children Out of School
• The proportion of children of school going age who were not in school at the time of the assessment was highest in Mudzi (27%), followed by Umguza (23%) and Tsholotsho (20%).
• Mudzi had a significant increase of children who were out of school at the time of the assessment compared to the previous assessment.
• Chikomba (3%), Makonde (3%) and Hwedza (2%) had the lowest proportions of children of school going age who were out of school at the time of the assessment.
26.8
23.3
19.7
3.2 2.9 1.8
11.5
0
5
10
15
20
25
30
Mudzi Umguza Tsholotsho Chikomba Makonde Hwedza National
% o
f C
hild
ren
28
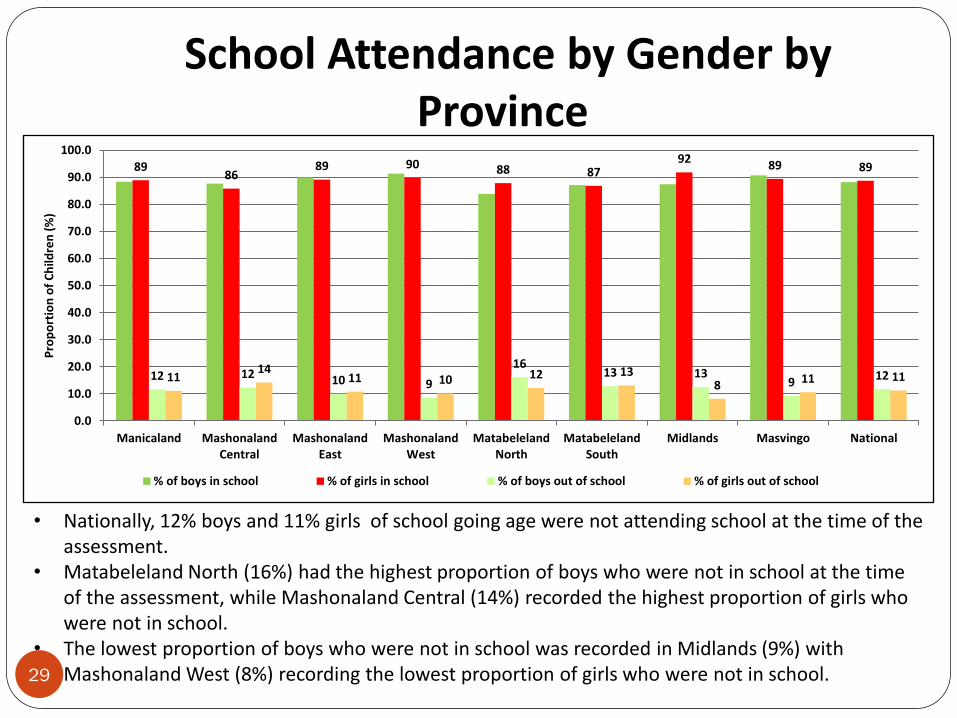
• Nationally, 12% boys and 11% girls of school going age were not attending school at the time of the assessment.
• Matabeleland North (16%) had the highest proportion of boys who were not in school at the time of the assessment, while Mashonaland Central (14%) recorded the highest proportion of girls who were not in school.
• The lowest proportion of boys who were not in school was recorded in Midlands (9%) with Mashonaland West (8%) recording the lowest proportion of girls who were not in school.
89 86
89 90 88 87 92 89 89
12 12 10 9
16 13 13
9 12 11
14 11 10 12 13
8 11 11
0.0
10.0
20.0
30.0
40.0
50.0
60.0
70.0
80.0
90.0
100.0
Manicaland MashonalandCentral
MashonalandEast
MashonalandWest
MatabelelandNorth
MatabelelandSouth
Midlands Masvingo National
Pro
po
rtio
n o
f C
hild
ren
(%
)
% of boys in school % of girls in school % of boys out of school % of girls out of school
School Attendance by Gender by Province
29
Water and Sanitation
To record households’ access to improved drinking-water sources and improved
sanitation facilities
Household Sources of Water
31
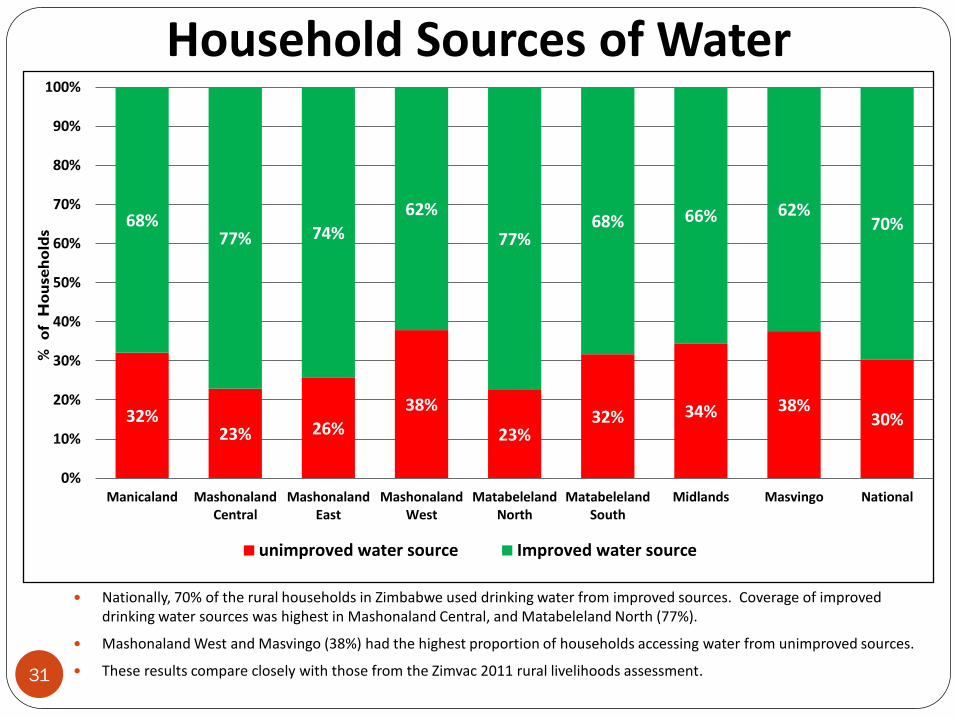
Nationally, 70% of the rural households in Zimbabwe used drinking water from improved sources. Coverage of improved drinking water sources was highest in Mashonaland Central, and Matabeleland North (77%).
Mashonaland West and Masvingo (38%) had the highest proportion of households accessing water from unimproved sources.
These results compare closely with those from the Zimvac 2011 rural livelihoods assessment.
32% 23% 26%
38%
23% 32% 34% 38%
30%
68% 77% 74%
62%
77% 68% 66% 62%
70%
0%
10%
20%
30%
40%
50%
60%
70%
80%
90%
100%
Manicaland MashonalandCentral
MashonalandEast
MashonalandWest
MatabelelandNorth
MatabelelandSouth
Midlands Masvingo National
unimproved water source Improved water source
%
of
Ho
use
ho
lds
32
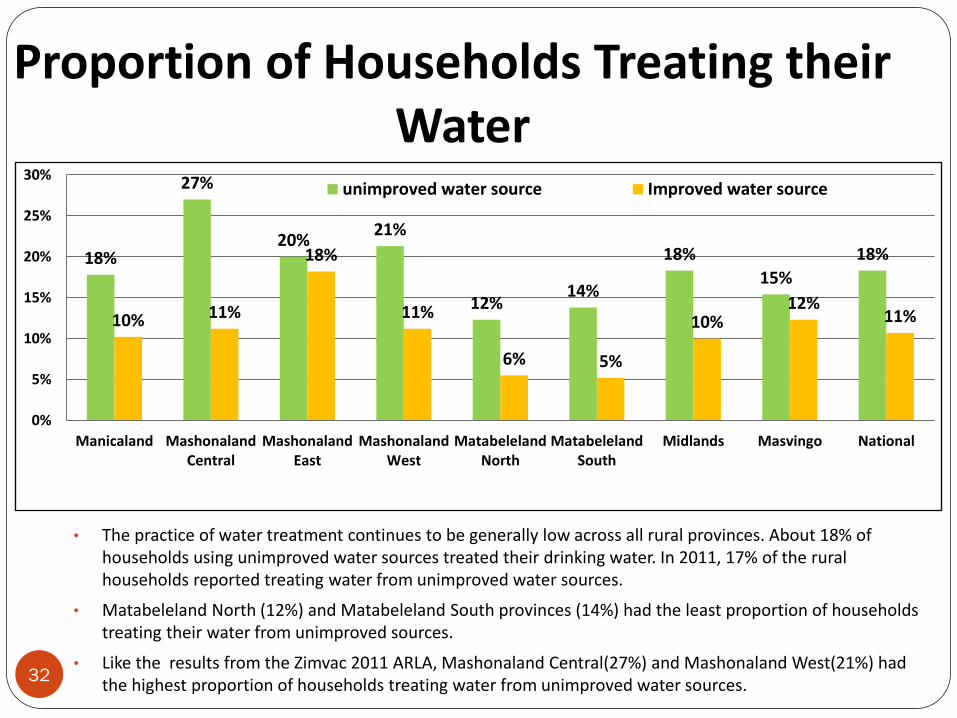
• The practice of water treatment continues to be generally low across all rural provinces. About 18% of households using unimproved water sources treated their drinking water. In 2011, 17% of the rural households reported treating water from unimproved water sources.
• Matabeleland North (12%) and Matabeleland South provinces (14%) had the least proportion of households treating their water from unimproved sources.
• Like the results from the Zimvac 2011 ARLA, Mashonaland Central(27%) and Mashonaland West(21%) had the highest proportion of households treating water from unimproved water sources.
18%
27%
20% 21%
12% 14%
18%
15%
18%
10% 11%
18%
11%
6% 5%
10% 12%
11%
0%
5%
10%
15%
20%
25%
30%
Manicaland MashonalandCentral
MashonalandEast
MashonalandWest
MatabelelandNorth
MatabelelandSouth
Midlands Masvingo National
unimproved water source Improved water source
Proportion of Households Treating their Water
33
Proportion of Households Treating Water from Main Source by Method and Province
Province Boil Add bleach or chlorine
Strain it with a cloth
Use water filter
Solar disinfection
Let stand and settle
Add water treatment
tablet Other
Manicaland 30% 12% 3% 54% 2%
Mashonaland Central 20% 19% 1% 3% 1% 1% 56%
Mashonaland East 19% 39% 0% 0% 39% 2%
Mashonaland West 23% 15% 3% 1% 1% 53% 5%
Matabeleland North 62% 6% 2% 2% 18% 10%
Matabeleland South 59% 14% 4% 1% 22%
Midlands 36% 17% 2% 1% 43% 2%
Masvingo 27% 18% 1% 5% 2% 48% 1%
National 30% 20% 1% 2% 0% 1% 44% 2%
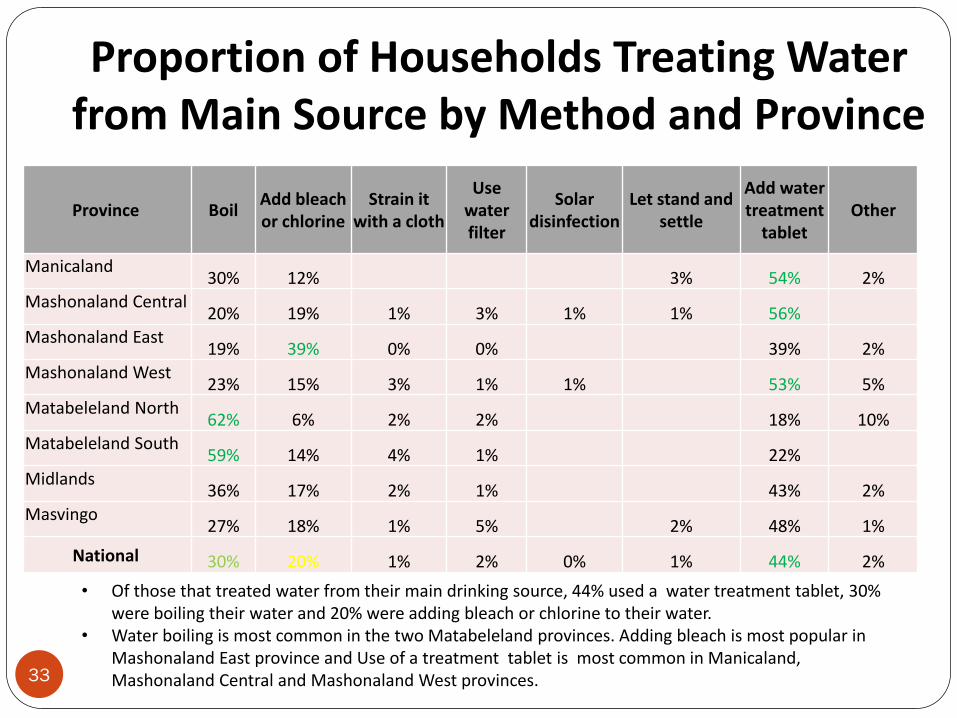
• Of those that treated water from their main drinking source, 44% used a water treatment tablet, 30% were boiling their water and 20% were adding bleach or chlorine to their water.
• Water boiling is most common in the two Matabeleland provinces. Adding bleach is most popular in Mashonaland East province and Use of a treatment tablet is most common in Manicaland, Mashonaland Central and Mashonaland West provinces.
34
35 33 41
32 22
43 34
26 33
19 24 22
17
4
9
10 12
15
25 24 14
11
3
3 12
8
13
21 19 24 40
70
45 45 54
39
0
20
40
60
80
100
Manicaland MashonalandCentral
MashonalandEast
MashonalandWest
MatabelelandNorth
MatabelelandSouth
Midlands Masvingo National
% o
f H
ou
seh
old
s
open defecation unimproved facility
improved sanitation shared Improved Sanitation facility not shared
% Households Sanitation Facility
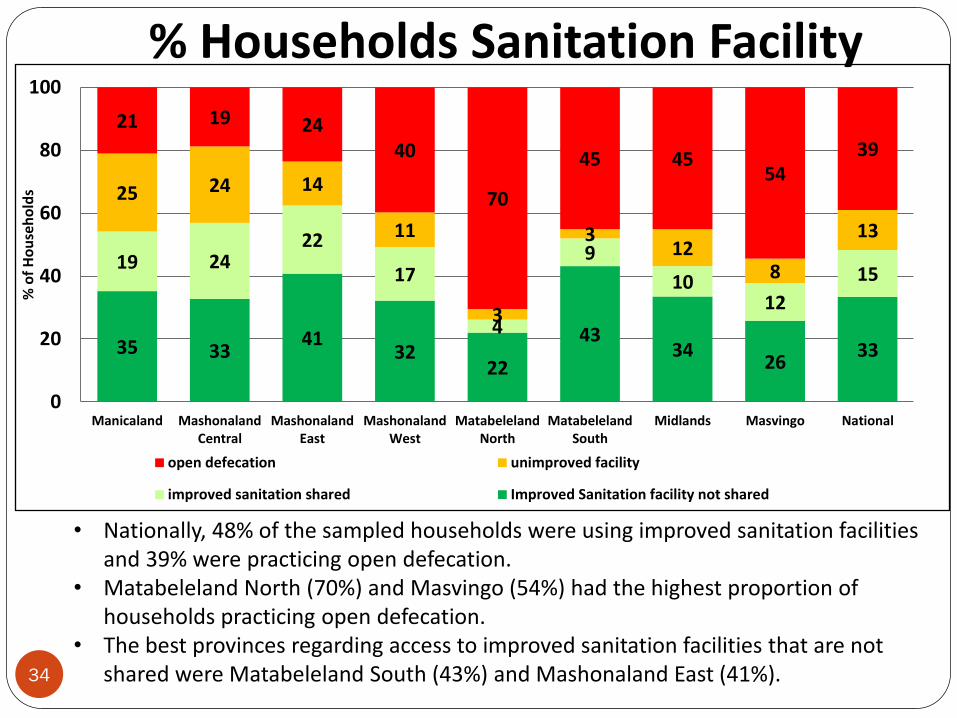
• Nationally, 48% of the sampled households were using improved sanitation facilities and 39% were practicing open defecation.
• Matabeleland North (70%) and Masvingo (54%) had the highest proportion of households practicing open defecation.
• The best provinces regarding access to improved sanitation facilities that are not shared were Matabeleland South (43%) and Mashonaland East (41%).
To describe the socio-economic profiles of rural households in terms of such
characteristics as their income sources, income and expenditure patterns
Household Income and Expenditure Patterns
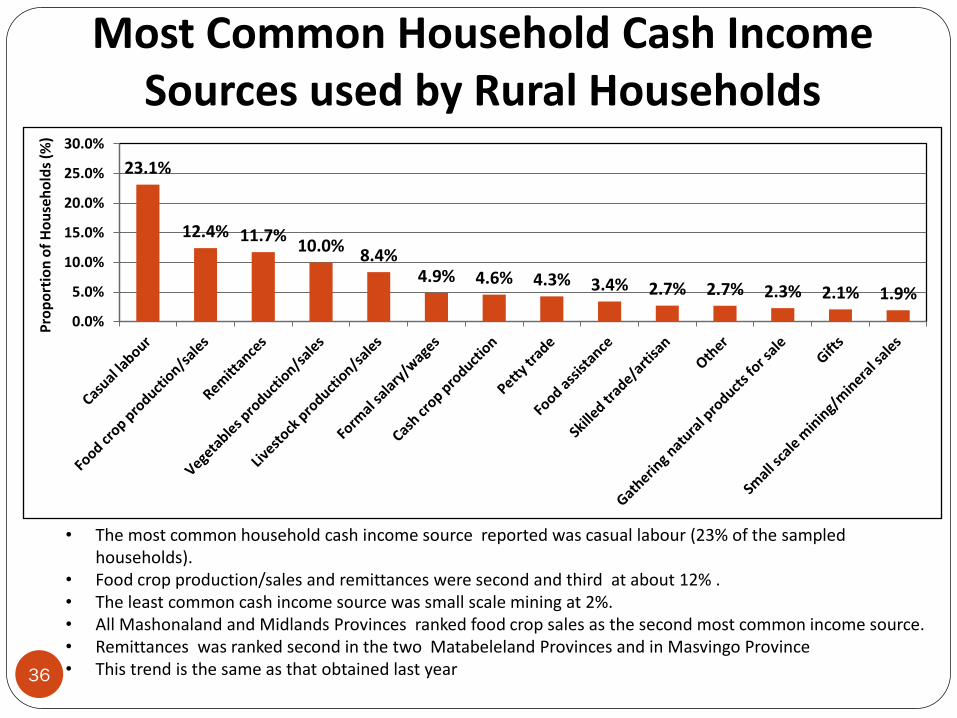
Most Common Household Cash Income Sources used by Rural Households
23.1%
12.4% 11.7% 10.0%
8.4% 4.9% 4.6% 4.3% 3.4% 2.7% 2.7% 2.3% 2.1% 1.9%
0.0%
5.0%
10.0%
15.0%
20.0%
25.0%
30.0%
Pro
po
rtio
n o
f H
ou
seh
old
s (%
)
• The most common household cash income source reported was casual labour (23% of the sampled households).
• Food crop production/sales and remittances were second and third at about 12% . • The least common cash income source was small scale mining at 2%. • All Mashonaland and Midlands Provinces ranked food crop sales as the second most common income source. • Remittances was ranked second in the two Matabeleland Provinces and in Masvingo Province • This trend is the same as that obtained last year 36
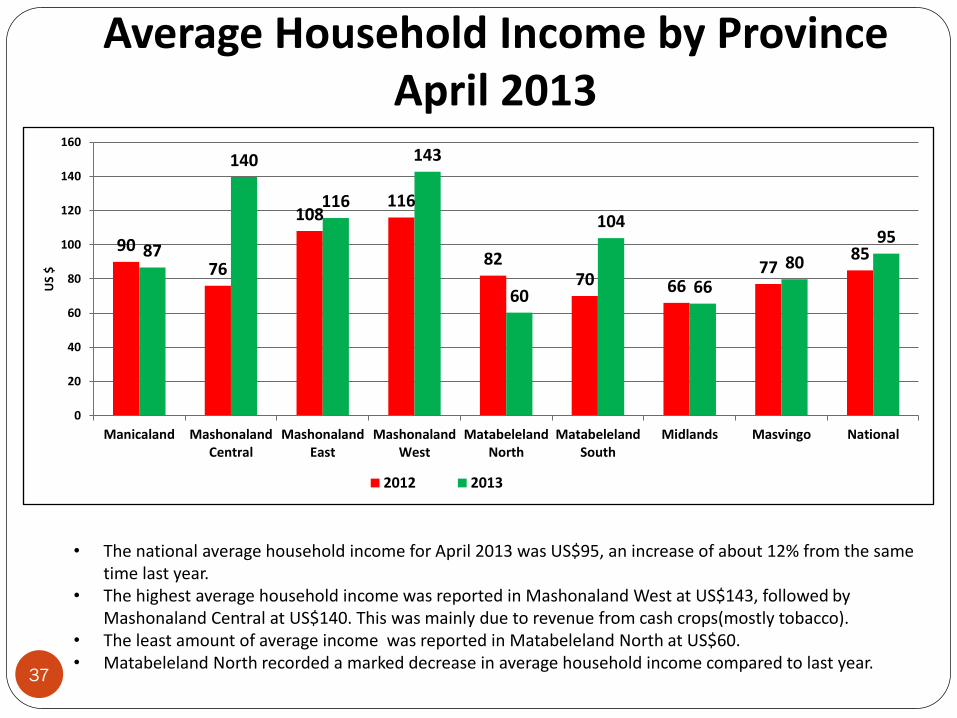
Average Household Income by Province April 2013
• The national average household income for April 2013 was US$95, an increase of about 12% from the same time last year.
• The highest average household income was reported in Mashonaland West at US$143, followed by Mashonaland Central at US$140. This was mainly due to revenue from cash crops(mostly tobacco).
• The least amount of average income was reported in Matabeleland North at US$60. • Matabeleland North recorded a marked decrease in average household income compared to last year.
37
90
76
108 116
82 70 66
77 85 87
140
116
143
60
104
66
80
95
0
20
40
60
80
100
120
140
160
Manicaland MashonalandCentral
MashonalandEast
MashonalandWest
MatabelelandNorth
MatabelelandSouth
Midlands Masvingo National
US
$
2012 2013
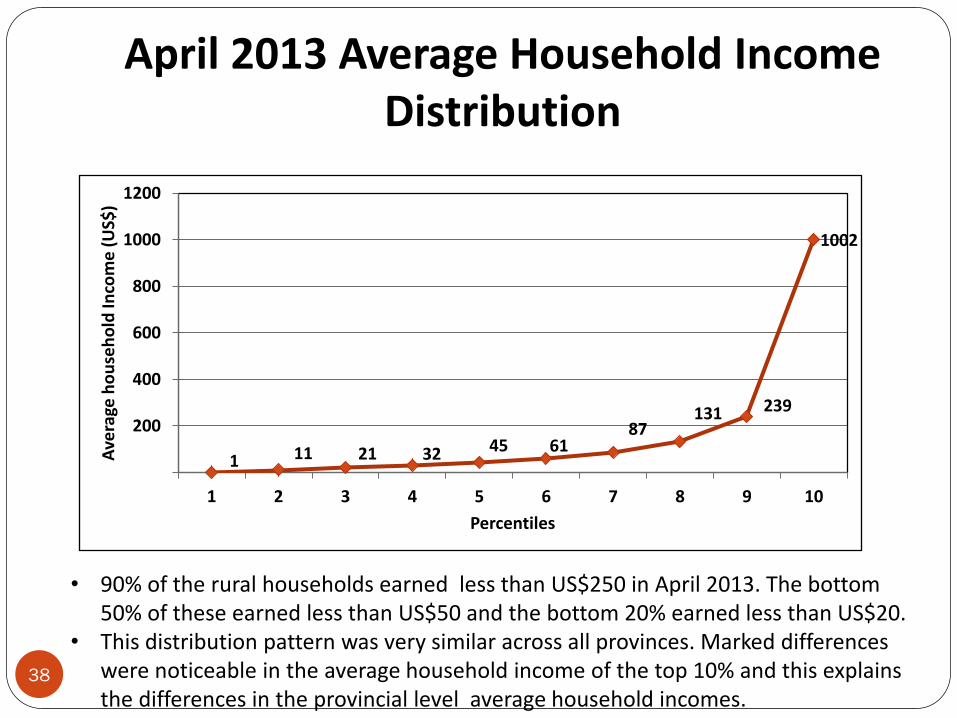
April 2013 Average Household Income Distribution
• 90% of the rural households earned less than US$250 in April 2013. The bottom 50% of these earned less than US$50 and the bottom 20% earned less than US$20.
• This distribution pattern was very similar across all provinces. Marked differences were noticeable in the average household income of the top 10% and this explains the differences in the provincial level average household incomes.
38
1 11 21 32 45 61 87
131 239
1002
200
400
600
800
1000
1200
1 2 3 4 5 6 7 8 9 10
Ave
rage
ho
use
ho
ld In
com
e (
US$
)
Percentiles
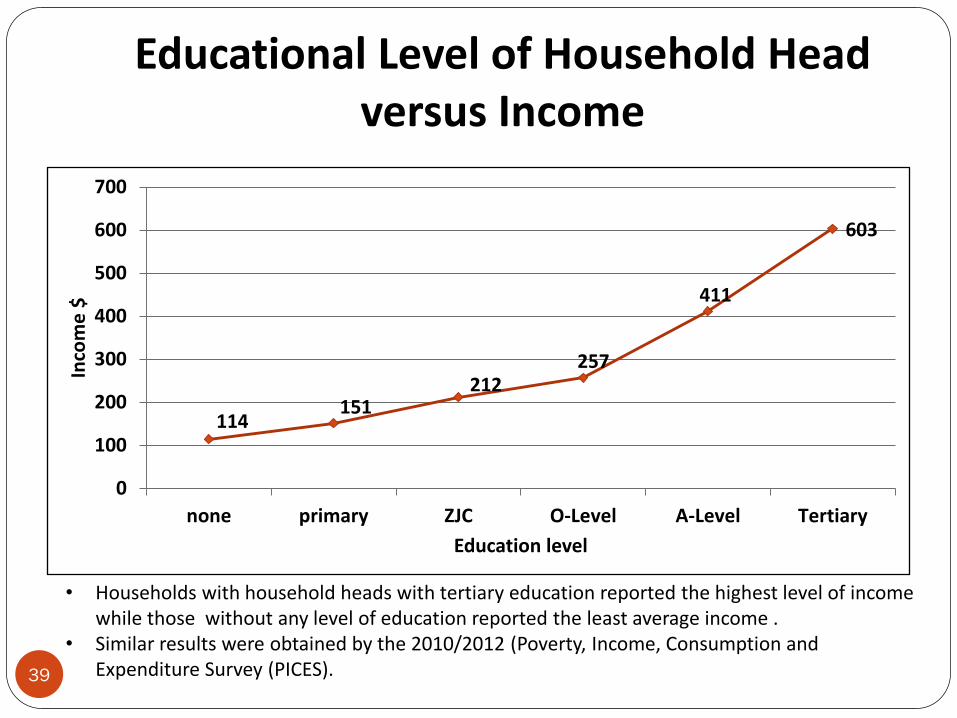
Educational Level of Household Head versus Income
114 151
212 257
411
603
0
100
200
300
400
500
600
700
none primary ZJC O-Level A-Level Tertiary
Inco
me
$
Education level
• Households with household heads with tertiary education reported the highest level of income while those without any level of education reported the least average income .
• Similar results were obtained by the 2010/2012 (Poverty, Income, Consumption and Expenditure Survey (PICES). 39
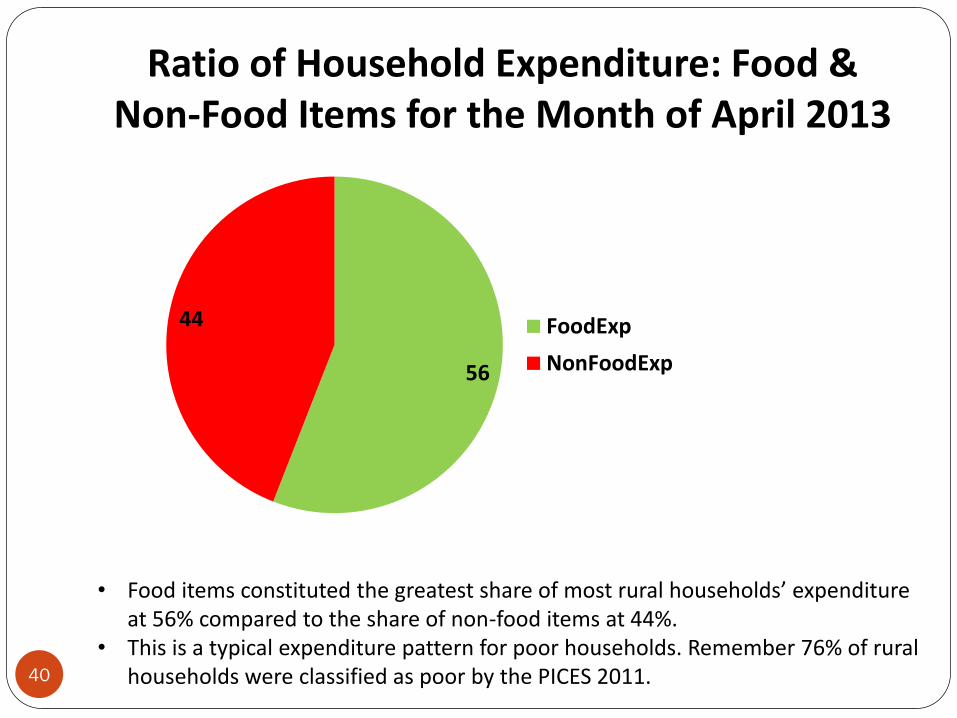
Ratio of Household Expenditure: Food & Non-Food Items for the Month of April 2013
56
44 FoodExp
NonFoodExp
• Food items constituted the greatest share of most rural households’ expenditure at 56% compared to the share of non-food items at 44%.
• This is a typical expenditure pattern for poor households. Remember 76% of rural households were classified as poor by the PICES 2011. 40
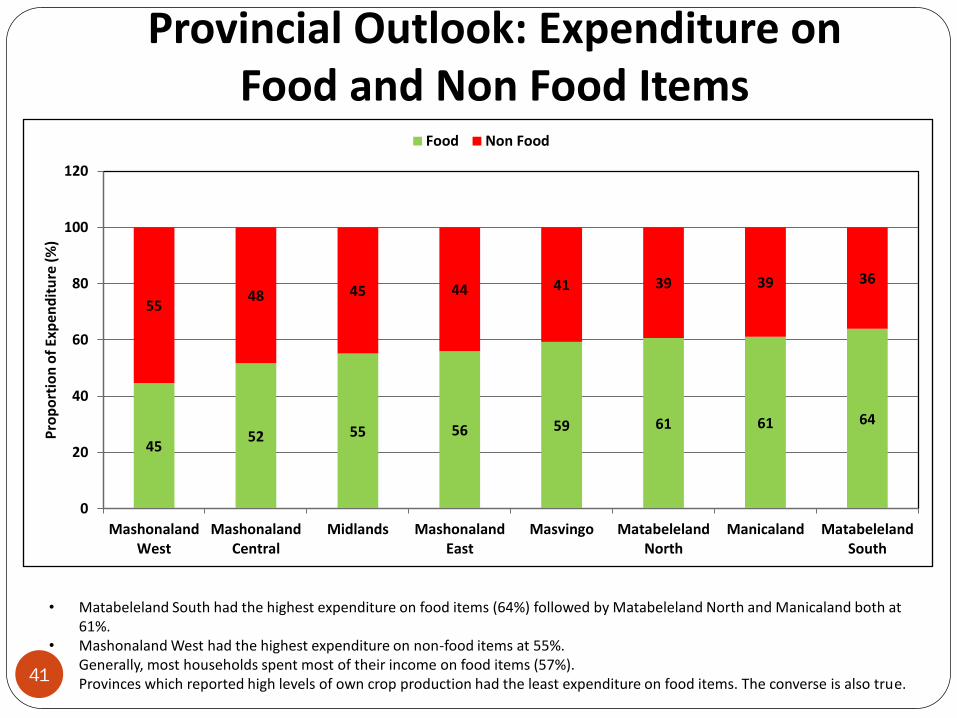
Provincial Outlook: Expenditure on Food and Non Food Items
• Matabeleland South had the highest expenditure on food items (64%) followed by Matabeleland North and Manicaland both at 61%.
• Mashonaland West had the highest expenditure on non-food items at 55%. • Generally, most households spent most of their income on food items (57%). • Provinces which reported high levels of own crop production had the least expenditure on food items. The converse is also true. 41
45 52 55 56 59 61 61 64
55 48 45 44 41 39 39 36
0
20
40
60
80
100
120
MashonalandWest
MashonalandCentral
Midlands MashonalandEast
Masvingo MatabelelandNorth
Manicaland MatabelelandSouth
Pro
po
rtio
n o
f Ex
pen
dit
ure
(%
)
Food Non Food
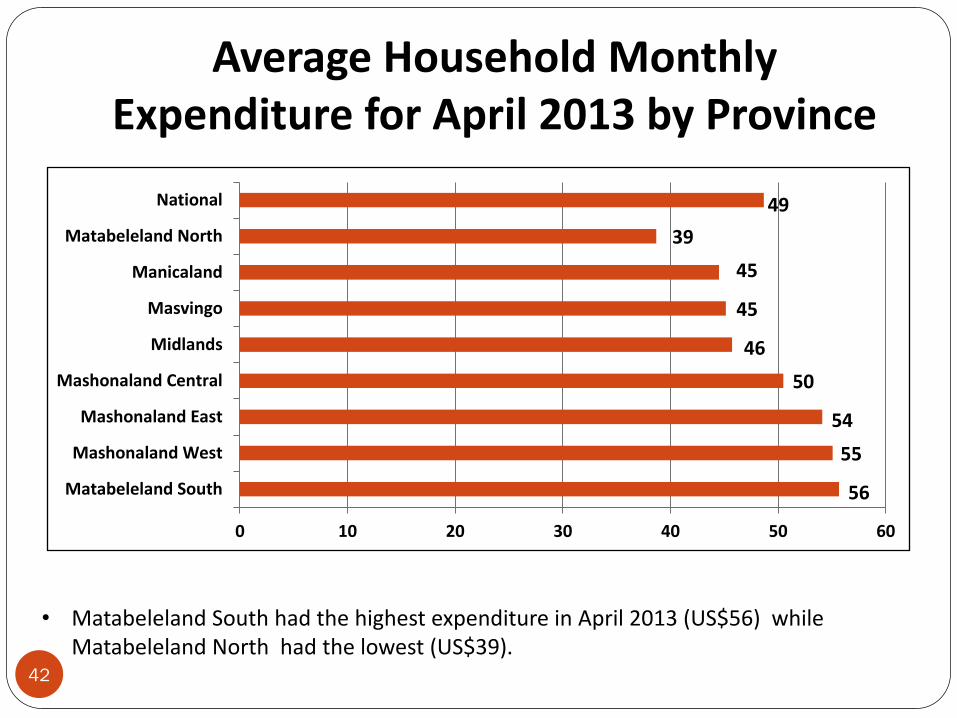
Average Household Monthly Expenditure for April 2013 by Province
56
55
54
50
46
45
45
39
49
0 10 20 30 40 50 60
Matabeleland South
Mashonaland West
Mashonaland East
Mashonaland Central
Midlands
Masvingo
Manicaland
Matabeleland North
National
• Matabeleland South had the highest expenditure in April 2013 (US$56) while Matabeleland North had the lowest (US$39).
42
To describe the socio-economic profiles of rural households in terms of such
characteristics as their income sources and income levels
Crop Production
Proportion of Households Growing Crops
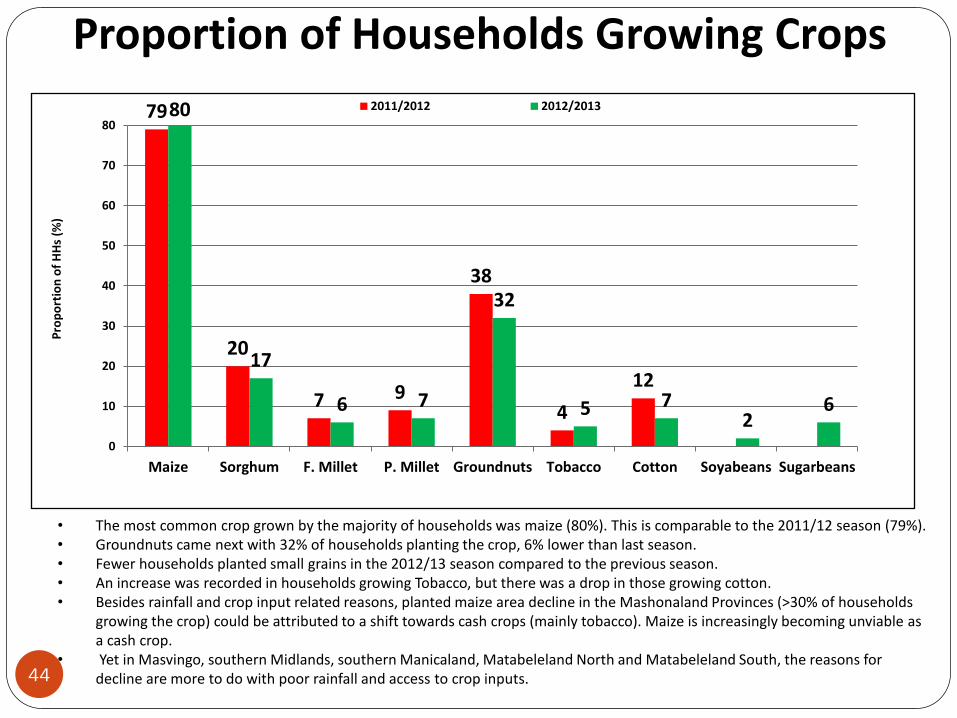
• The most common crop grown by the majority of households was maize (80%). This is comparable to the 2011/12 season (79%). • Groundnuts came next with 32% of households planting the crop, 6% lower than last season. • Fewer households planted small grains in the 2012/13 season compared to the previous season. • An increase was recorded in households growing Tobacco, but there was a drop in those growing cotton. • Besides rainfall and crop input related reasons, planted maize area decline in the Mashonaland Provinces (>30% of households
growing the crop) could be attributed to a shift towards cash crops (mainly tobacco). Maize is increasingly becoming unviable as a cash crop.
• Yet in Masvingo, southern Midlands, southern Manicaland, Matabeleland North and Matabeleland South, the reasons for decline are more to do with poor rainfall and access to crop inputs.
79
20
7 9
38
4
12
80
17
6 7
32
5 7 2
6
0
10
20
30
40
50
60
70
80
Maize Sorghum F. Millet P. Millet Groundnuts Tobacco Cotton Soyabeans Sugarbeans
Pro
po
rtio
n o
f H
Hs
(%)
2011/2012 2012/2013
44
Sources of Maize Seed
45
39.3%
26.0%
3.5%
8.2%
11.5%
8.6%
2.7% .3%
Purchase
Gvt
NGO
Carryover
Retained
Remittances
Other
Pvt contractors
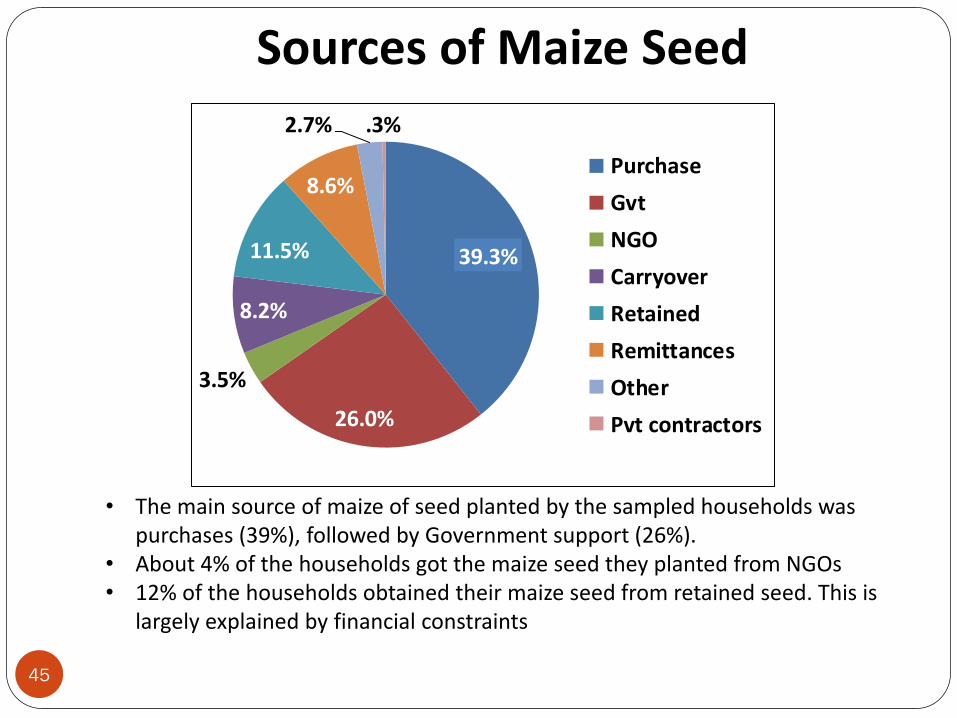
• The main source of maize of seed planted by the sampled households was purchases (39%), followed by Government support (26%).
• About 4% of the households got the maize seed they planted from NGOs • 12% of the households obtained their maize seed from retained seed. This is
largely explained by financial constraints
Sources of Maize Seed by Province
46
Province Purchase Government NGO Carryover Retained Remittances Other Private
Contractors
Manicaland 45% 15% 4% 3% 16% 14% 4% 1%
Mashonaland Central 37% 33% 2% 8% 10% 8% 2% 1%
Mashonaland East 45% 28% 2% 12% 5% 7% 0% 0%
Mashonaland West 41% 24% 2% 5% 13% 8% 5% 1%
Matabeleland North 24% 30% 5% 18% 16% 6% 1% 0%
Matabeleland South 28% 37% 5% 9% 11% 7% 2% 0%
Midlands 49% 21% 2% 6% 12% 9% 2% 0%
Masvingo 39% 22% 7% 5% 11% 11% 5% 0%
National 39% 26% 4% 8% 12% 9% 3% 0%
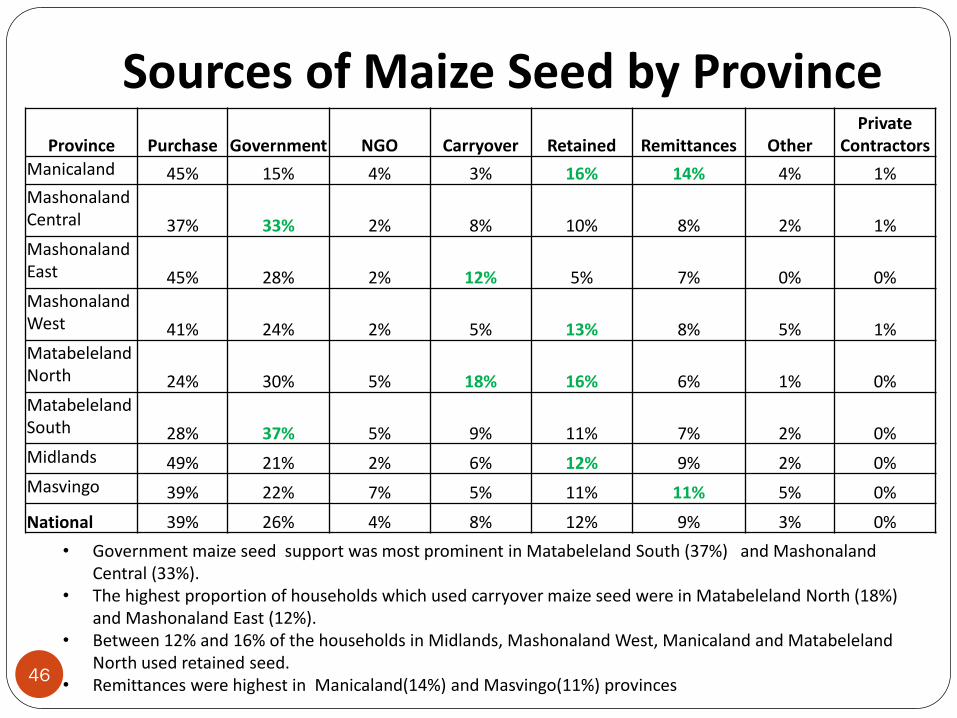
• Government maize seed support was most prominent in Matabeleland South (37%) and Mashonaland Central (33%).
• The highest proportion of households which used carryover maize seed were in Matabeleland North (18%) and Mashonaland East (12%).
• Between 12% and 16% of the households in Midlands, Mashonaland West, Manicaland and Matabeleland North used retained seed.
• Remittances were highest in Manicaland(14%) and Masvingo(11%) provinces
Sources of Seed for Major Crops
47
Source of Seed
Sorghum Finger Millet Pearl Millet Roots and
Tubers Cowpeas Groundnuts Roundnuts
Purchase 13.0% 11.7% 7.7% 17.1% 14.8% 20.2% 20.7%
Gvt 7.9% 4.5% 2.5% 3.0% 3.8% 3.1% 3.3%
NGO 5.5% 3.9% 3.1% 1.3% 4.0% 1.8% 1.4%
Carryover 19.4% 22.1% 19.3% 24.3% 21.4% 21.8% 20.6%
Retained 30.4% 38.3% 49.7% 38.1% 35.2% 39.2% 40.7%
Remittances 19.0% 16.3% 14.3% 14.5% 18.3% 11.8% 11.0%
Other 4.4% 3.1% 3.2% 1.7% 1.6% 2.0% 2.2%
Pvt contractors .4% .1% .1% .8% .2% .1%
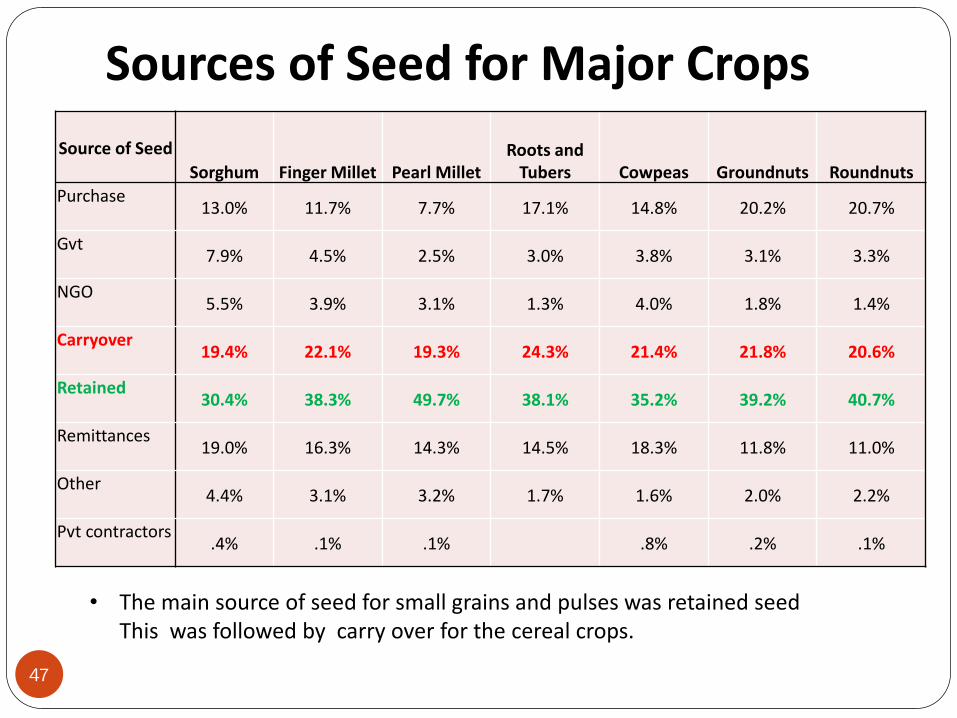
• The main source of seed for small grains and pulses was retained seed This was followed by carry over for the cereal crops.
Sources of Small Grain Seed by Province
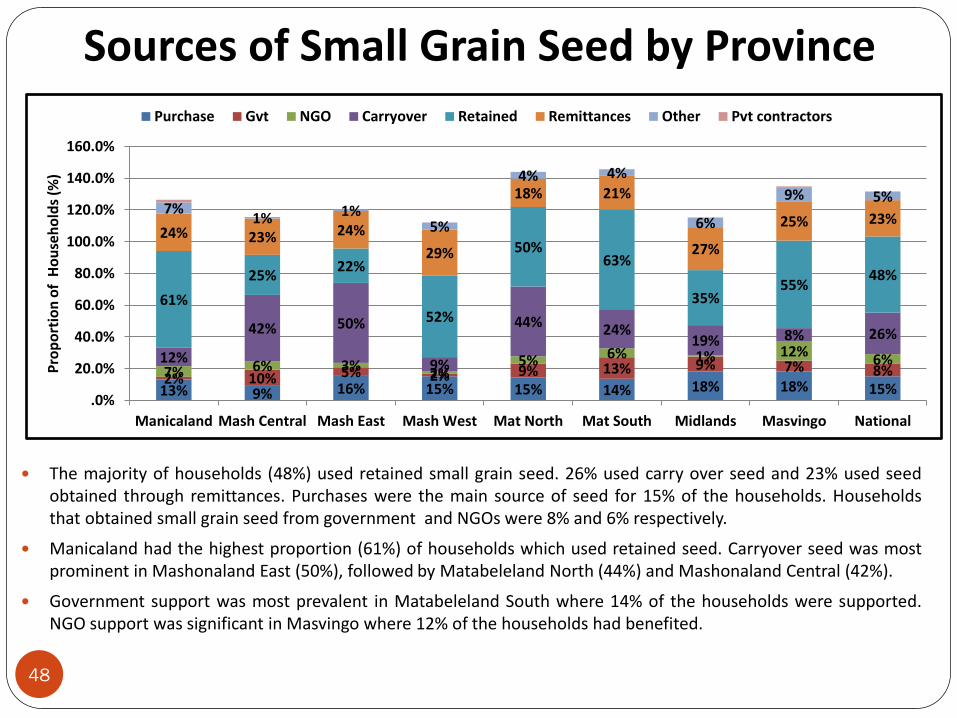
The majority of households (48%) used retained small grain seed. 26% used carry over seed and 23% used seed obtained through remittances. Purchases were the main source of seed for 15% of the households. Households that obtained small grain seed from government and NGOs were 8% and 6% respectively.
Manicaland had the highest proportion (61%) of households which used retained seed. Carryover seed was most prominent in Mashonaland East (50%), followed by Matabeleland North (44%) and Mashonaland Central (42%).
Government support was most prevalent in Matabeleland South where 14% of the households were supported. NGO support was significant in Masvingo where 12% of the households had benefited.
13% 9% 16% 15% 15% 14% 18% 18% 15% 2% 10% 5% 2% 9% 13% 9% 7% 8% 7% 6% 3% 2%
5% 6% 1% 12% 6% 12%
42% 50%
9%
44% 24% 19% 8% 26%
61%
25% 22%
52%
50% 63%
35% 55%
48%
24% 23% 24%
29%
18% 21%
27%
25% 23% 7%
1% 1% 5%
4% 4%
6%
9% 5%
.0%
20.0%
40.0%
60.0%
80.0%
100.0%
120.0%
140.0%
160.0%
Manicaland Mash Central Mash East Mash West Mat North Mat South Midlands Masvingo National
Pro
po
rtio
n o
f H
ou
seh
old
s (%
)
Purchase Gvt NGO Carryover Retained Remittances Other Pvt contractors
48
Proportion of Households Which Planted Maize
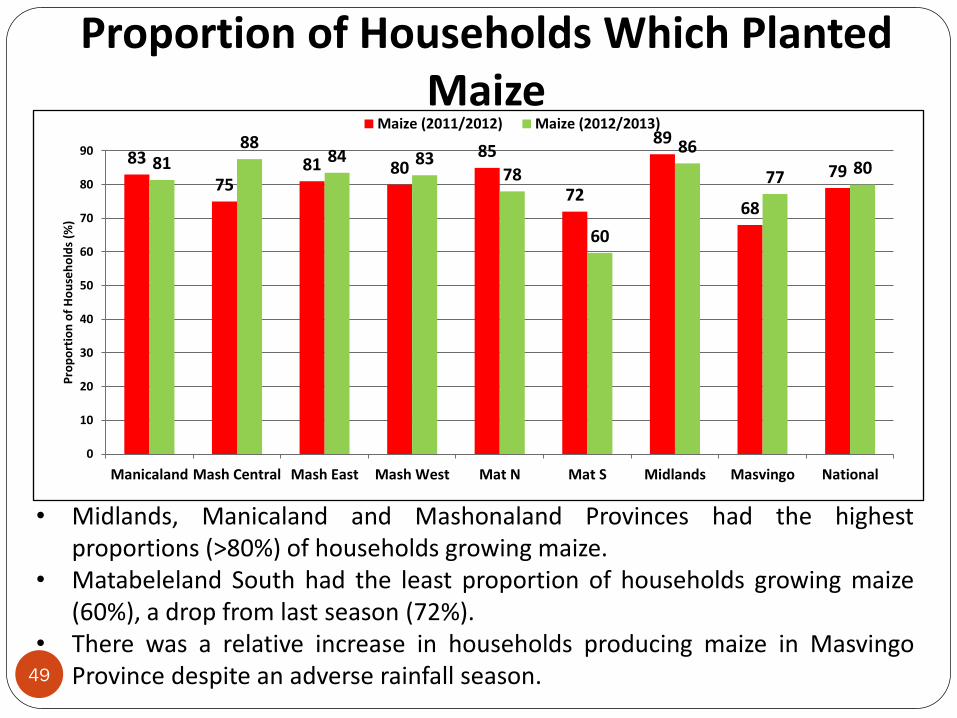
• Midlands, Manicaland and Mashonaland Provinces had the highest proportions (>80%) of households growing maize.
• Matabeleland South had the least proportion of households growing maize (60%), a drop from last season (72%).
• There was a relative increase in households producing maize in Masvingo Province despite an adverse rainfall season.
83
75 81 80
85
72
89
68
79 81 88
84 83 78
60
86
77 80
0
10
20
30
40
50
60
70
80
90
Manicaland Mash Central Mash East Mash West Mat N Mat S Midlands Masvingo National
Pro
po
rtio
n o
f H
ou
seh
old
s (%
)
Maize (2011/2012) Maize (2012/2013)
49
Change In Area under Maize
45
35
20
Same
Decrease
Increase
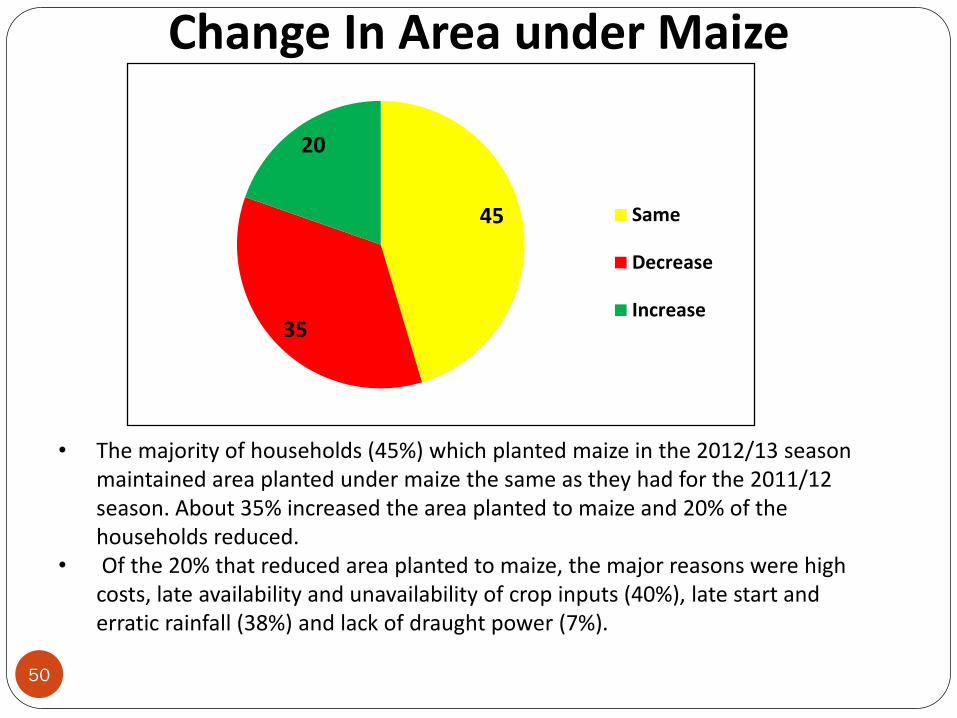
• The majority of households (45%) which planted maize in the 2012/13 season maintained area planted under maize the same as they had for the 2011/12 season. About 35% increased the area planted to maize and 20% of the households reduced.
• Of the 20% that reduced area planted to maize, the major reasons were high costs, late availability and unavailability of crop inputs (40%), late start and erratic rainfall (38%) and lack of draught power (7%).
50
Changes In Area Planted to Maize by Province
53
38
40
36
66
59
44
36
28
38
41
42
20
31
33
43
19
24
19
22
14
10
23
21
0 10 20 30 40 50 60 70
Manicaland
Mash C
Mash E
Mash W
Mat N
Mat S
Midlands
Masvingo
Proportion of Households which planted maize
increase
decrease
same
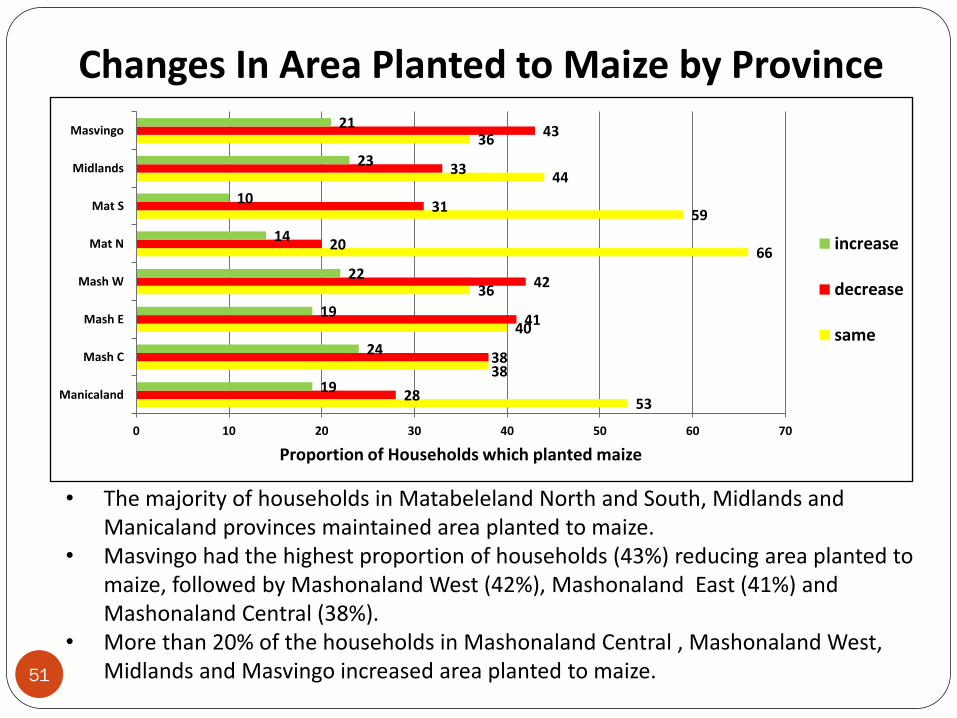
• The majority of households in Matabeleland North and South, Midlands and Manicaland provinces maintained area planted to maize.
• Masvingo had the highest proportion of households (43%) reducing area planted to maize, followed by Mashonaland West (42%), Mashonaland East (41%) and Mashonaland Central (38%).
• More than 20% of the households in Mashonaland Central , Mashonaland West, Midlands and Masvingo increased area planted to maize. 51
Average Household Cereal (kg) Production by Province
52
Province Staple Cereals (kg) Maize (kg) Small Grains (kg) Manicaland 254 227 28
Mashonaland Central 563 546 18
Mashonaland East 340 325 15
Mashonaland West 801 796 5
Matabeleland North 170 119 51
Matabeleland South 105 85 20
Midlands 281 265 16
Masvingo 231 180 51
National 346 321 25
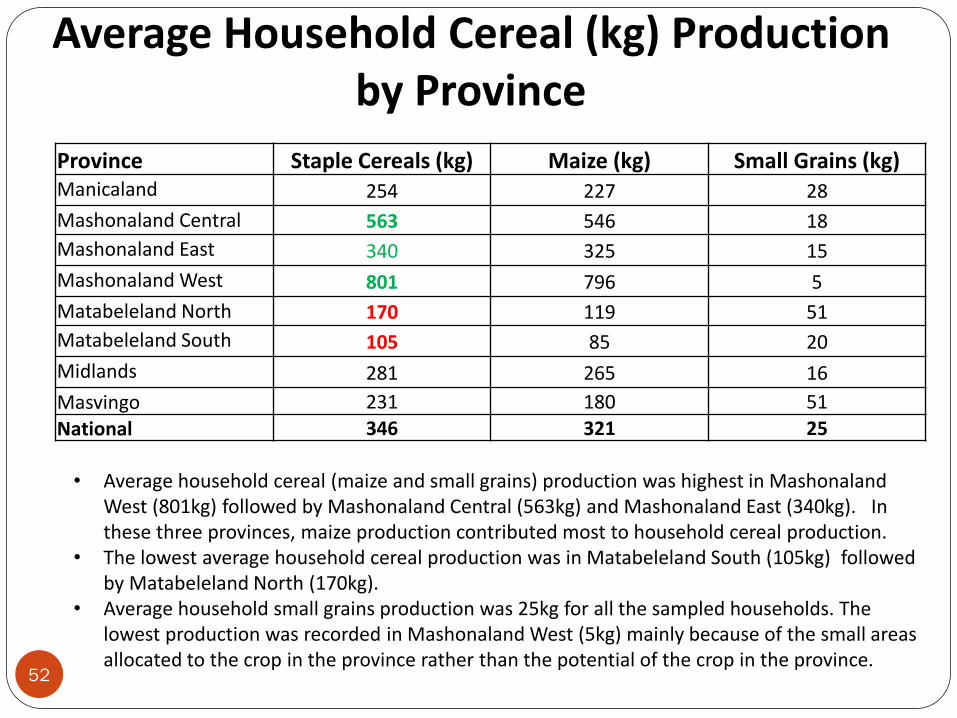
• Average household cereal (maize and small grains) production was highest in Mashonaland West (801kg) followed by Mashonaland Central (563kg) and Mashonaland East (340kg). In these three provinces, maize production contributed most to household cereal production.
• The lowest average household cereal production was in Matabeleland South (105kg) followed by Matabeleland North (170kg).
• Average household small grains production was 25kg for all the sampled households. The lowest production was recorded in Mashonaland West (5kg) mainly because of the small areas allocated to the crop in the province rather than the potential of the crop in the province.
District Average Household Cereal Production
53
District Total
Cereals(kg) Maize(kg) Small
Grains(kg) District Total
Cereals(kg) Maize(kg) Small
Grains(kg) Makonde 2019 2014 5 Buhera 112 63 50
Bindura 1138 1137 1 Umguza 110 104 6
Mazowe 1091 1090 1 Tsholotsho 104 32 72
Zvimba 1079 1078 1 Beitbridge 102 65 37
Chegutu 1012 1009 2 Zvishavane 96 75 21
Shamva 923 922 1 Matobo 64 48 16
Hurungwe 726 725 1 Chivi 47 28 18
Seke 589 587 1 Mangwe 45 15 30
Goromonzi 546 546 0
Gwanda 25 17 8
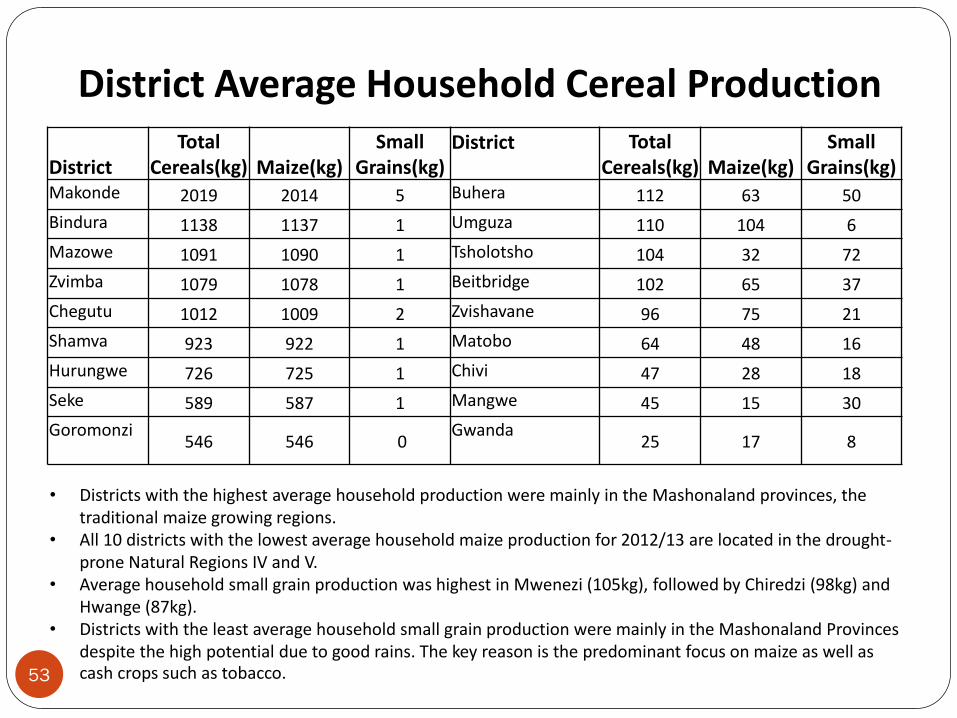
• Districts with the highest average household production were mainly in the Mashonaland provinces, the traditional maize growing regions.
• All 10 districts with the lowest average household maize production for 2012/13 are located in the drought-prone Natural Regions IV and V.
• Average household small grain production was highest in Mwenezi (105kg), followed by Chiredzi (98kg) and Hwange (87kg).
• Districts with the least average household small grain production were mainly in the Mashonaland Provinces despite the high potential due to good rains. The key reason is the predominant focus on maize as well as cash crops such as tobacco.
To assess small-grain production, consumption and identify opportunities to
promote their production
Crop Production with a Focus on Small Grains
Proportion of Households which Reported Growing Small Grains
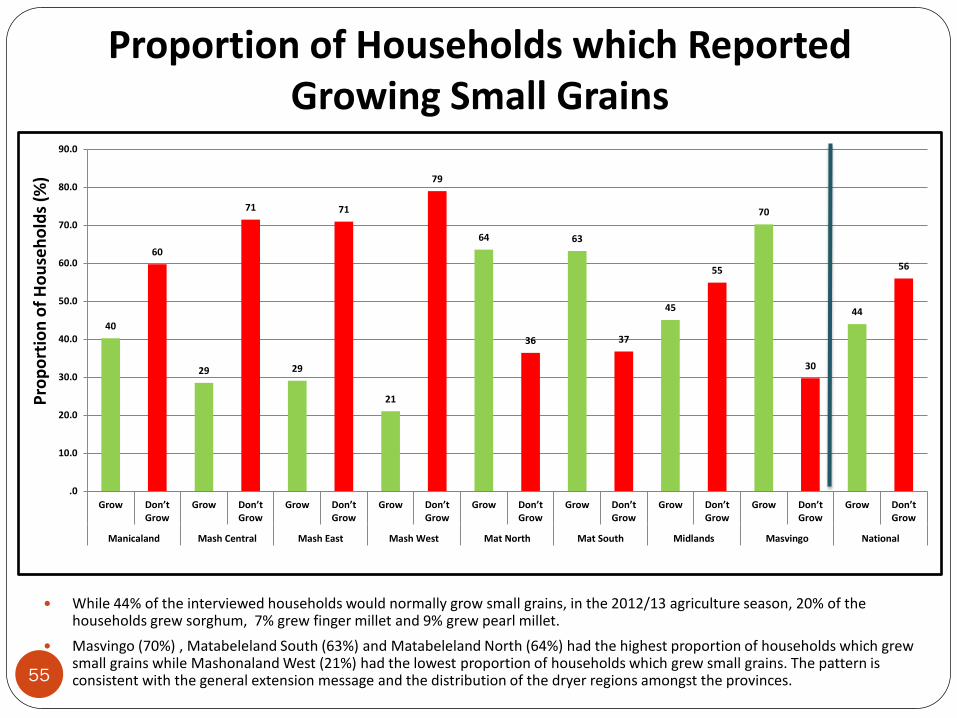
While 44% of the interviewed households would normally grow small grains, in the 2012/13 agriculture season, 20% of the households grew sorghum, 7% grew finger millet and 9% grew pearl millet.
Masvingo (70%) , Matabeleland South (63%) and Matabeleland North (64%) had the highest proportion of households which grew small grains while Mashonaland West (21%) had the lowest proportion of households which grew small grains. The pattern is consistent with the general extension message and the distribution of the dryer regions amongst the provinces.
40
60
29
71
29
71
21
79
64
36
63
37
45
55
70
30
44
56
.0
10.0
20.0
30.0
40.0
50.0
60.0
70.0
80.0
90.0
Grow Don’t Grow
Grow Don’t Grow
Grow Don’t Grow
Grow Don’t Grow
Grow Don’t Grow
Grow Don’t Grow
Grow Don’t Grow
Grow Don’t Grow
Grow Don’t Grow
Manicaland Mash Central Mash East Mash West Mat North Mat South Midlands Masvingo National
Pro
po
rtio
n o
f H
ou
seh
old
s (%
)
55
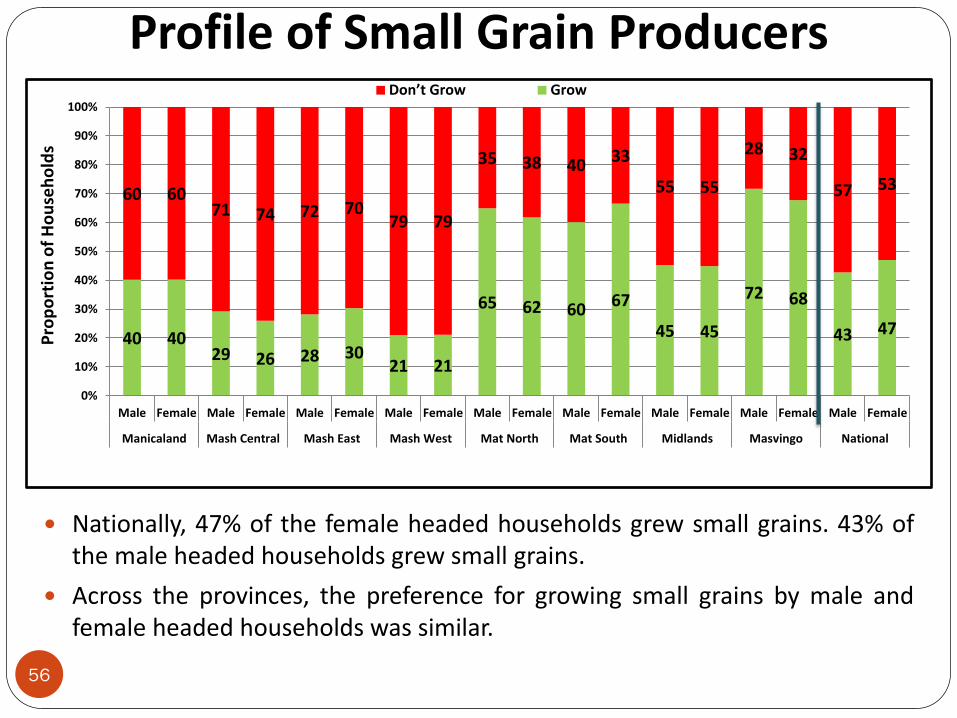
Profile of Small Grain Producers
Nationally, 47% of the female headed households grew small grains. 43% of the male headed households grew small grains.
Across the provinces, the preference for growing small grains by male and female headed households was similar.
40 40 29 26 28 30
21 21
65 62 60 67
45 45
72 68
43 47
60 60 71 74 72 70
79 79
35 38 40 33
55 55
28 32
57 53
0%
10%
20%
30%
40%
50%
60%
70%
80%
90%
100%
Male Female Male Female Male Female Male Female Male Female Male Female Male Female Male Female Male Female
Manicaland Mash Central Mash East Mash West Mat North Mat South Midlands Masvingo National
Don’t Grow Grow
Pro
po
rtio
n o
f H
ou
seh
old
s
56
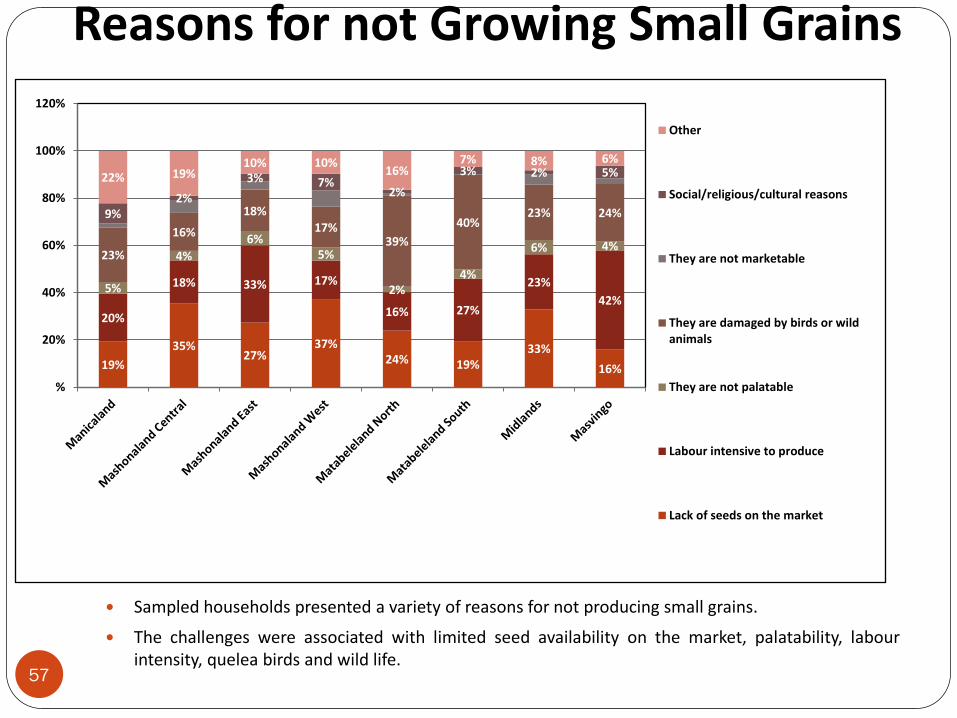
Reasons for not Growing Small Grains
Sampled households presented a variety of reasons for not producing small grains.
The challenges were associated with limited seed availability on the market, palatability, labour intensity, quelea birds and wild life.
57
19%
35% 27%
37% 24% 19%
33%
16%
20%
18% 33% 17%
16% 27%
23%
42% 5%
4%
6% 5%
2% 4%
6% 4% 23%
16%
18% 17%
39%
40% 23% 24% 9%
2%
3% 7% 2%
3% 2% 5% 22% 19% 10% 10%
16% 7% 8% 6%
%
20%
40%
60%
80%
100%
120%
Other
Social/religious/cultural reasons
They are not marketable
They are damaged by birds or wildanimals
They are not palatable
Labour intensive to produce
Lack of seeds on the market
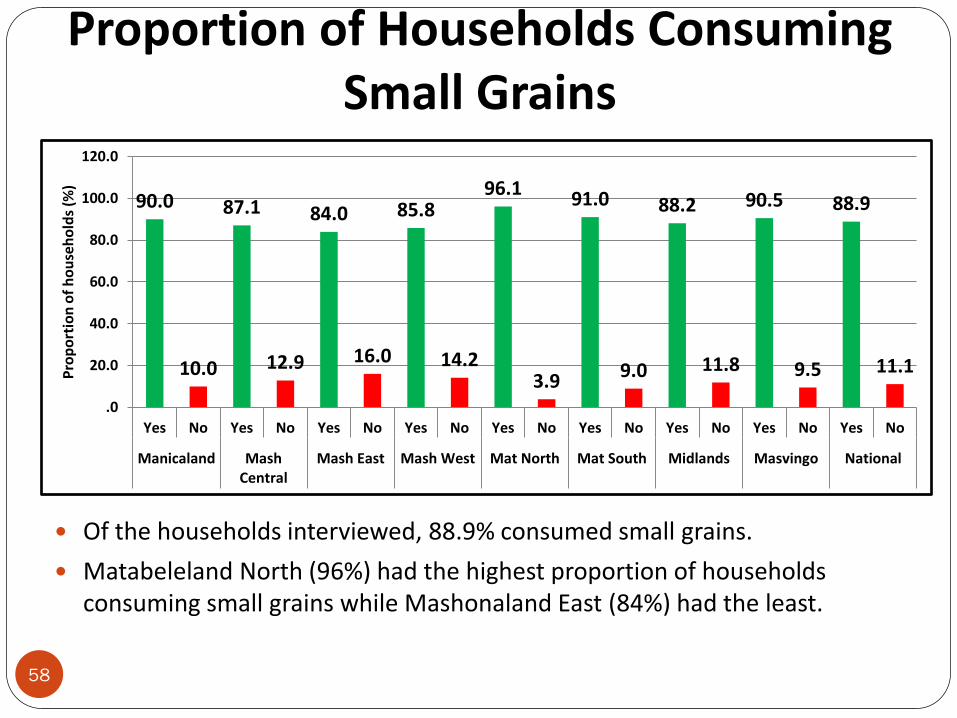
Proportion of Households Consuming Small Grains
Of the households interviewed, 88.9% consumed small grains.
Matabeleland North (96%) had the highest proportion of households consuming small grains while Mashonaland East (84%) had the least.
90.0
10.0
87.1
12.9
84.0
16.0
85.8
14.2
96.1
3.9
91.0
9.0
88.2
11.8
90.5
9.5
88.9
11.1
.0
20.0
40.0
60.0
80.0
100.0
120.0
Yes No Yes No Yes No Yes No Yes No Yes No Yes No Yes No Yes No
Manicaland MashCentral
Mash East Mash West Mat North Mat South Midlands Masvingo National
Pro
po
rtio
n o
f h
ou
seh
old
s (%
)
58
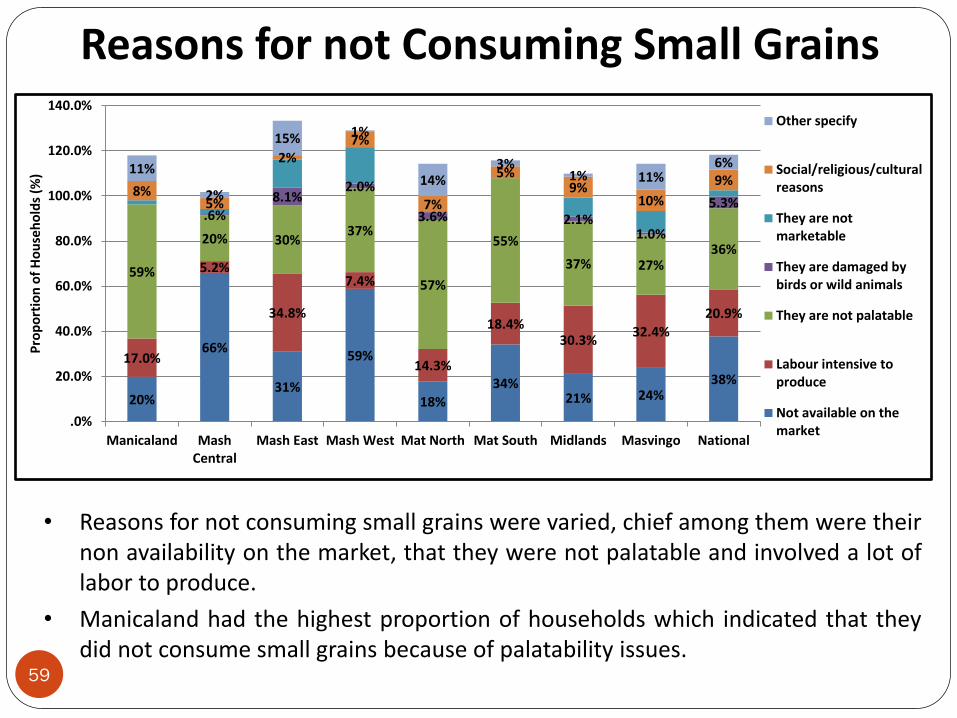
Reasons for not Consuming Small Grains
20%
66%
31%
59%
18%
34% 21% 24%
38%
17.0%
5.2%
34.8%
7.4%
14.3%
18.4% 30.3%
32.4%
20.9%
59%
20% 30% 37%
57%
55%
37% 27% 36%
.6%
8.1% 2.0%
3.6% 2.1% 1.0%
5.3% 8%
5%
2% 7%
7%
5% 9%
10%
9% 11%
2%
15% 1%
14% 3%
1% 11% 6%
.0%
20.0%
40.0%
60.0%
80.0%
100.0%
120.0%
140.0%
Manicaland MashCentral
Mash East Mash West Mat North Mat South Midlands Masvingo National
Pro
po
rtio
n o
f H
ou
seh
old
s (%
)
Other specify
Social/religious/culturalreasons
They are notmarketable
They are damaged bybirds or wild animals
They are not palatable
Labour intensive toproduce
Not available on themarket
• Reasons for not consuming small grains were varied, chief among them were their non availability on the market, that they were not palatable and involved a lot of labor to produce.
• Manicaland had the highest proportion of households which indicated that they did not consume small grains because of palatability issues.
59
Household Expenditure On Small Grains: April 2013
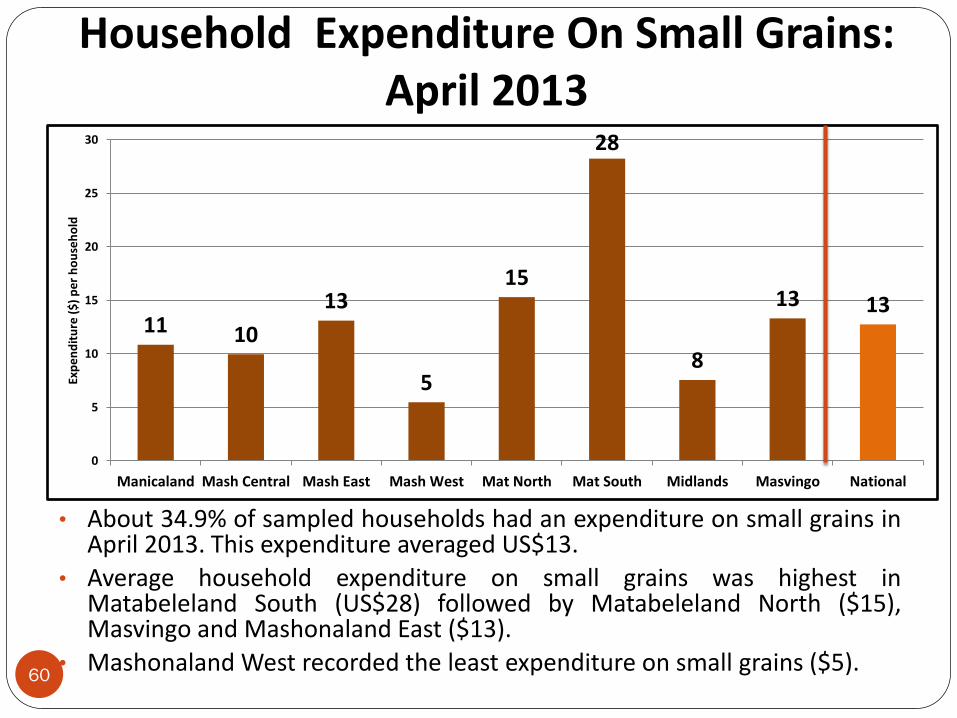
• About 34.9% of sampled households had an expenditure on small grains in April 2013. This expenditure averaged US$13.
• Average household expenditure on small grains was highest in Matabeleland South (US$28) followed by Matabeleland North ($15), Masvingo and Mashonaland East ($13).
• Mashonaland West recorded the least expenditure on small grains ($5).
11 10
13
5
15
28
8
13 13
0
5
10
15
20
25
30
Manicaland Mash Central Mash East Mash West Mat North Mat South Midlands Masvingo National
Exp
en
dit
ure
($
) p
er
ho
use
ho
ld
60
Change in Area Under Small Grains
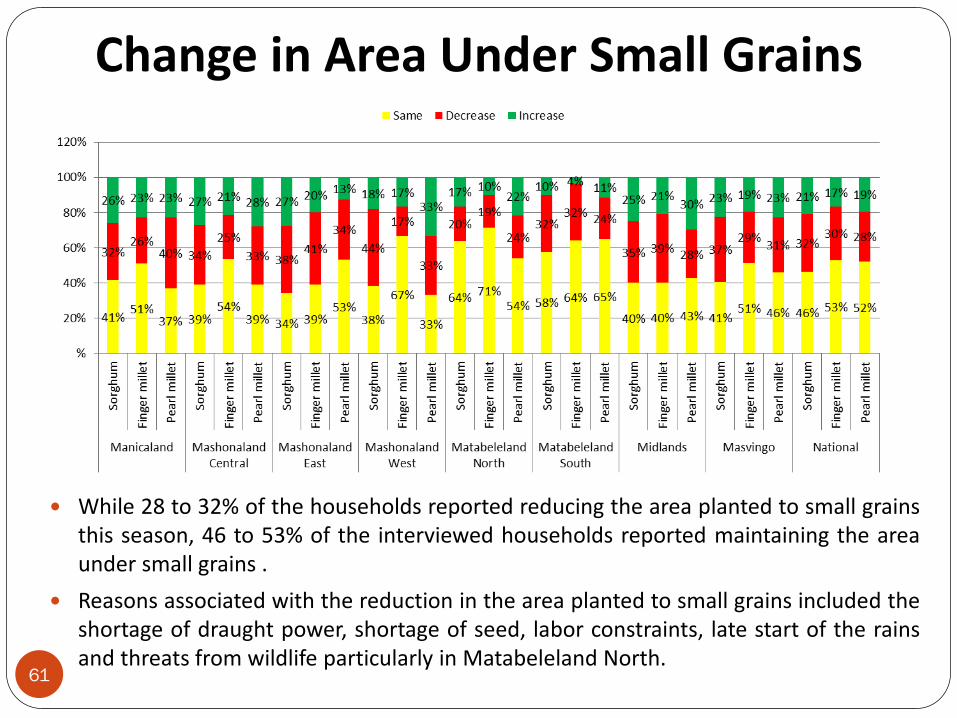
While 28 to 32% of the households reported reducing the area planted to small grains this season, 46 to 53% of the interviewed households reported maintaining the area under small grains .
Reasons associated with the reduction in the area planted to small grains included the shortage of draught power, shortage of seed, labor constraints, late start of the rains and threats from wildlife particularly in Matabeleland North.
61
To assess crop post-harvest practices and identify opportunities for addressing potential
post-harvest losses
Post Harvest
Treatment of Maize Before Storage
64%
77% 74% 71%
40% 42%
71%
53%
0%10%20%30%40%50%60%70%80%90%
Manicaland Mash Central
Mash East Mash West Mat North Mat South Midlands Masvingo
Pro
po
rtio
n o
f H
ou
se
ho
lds (
%)
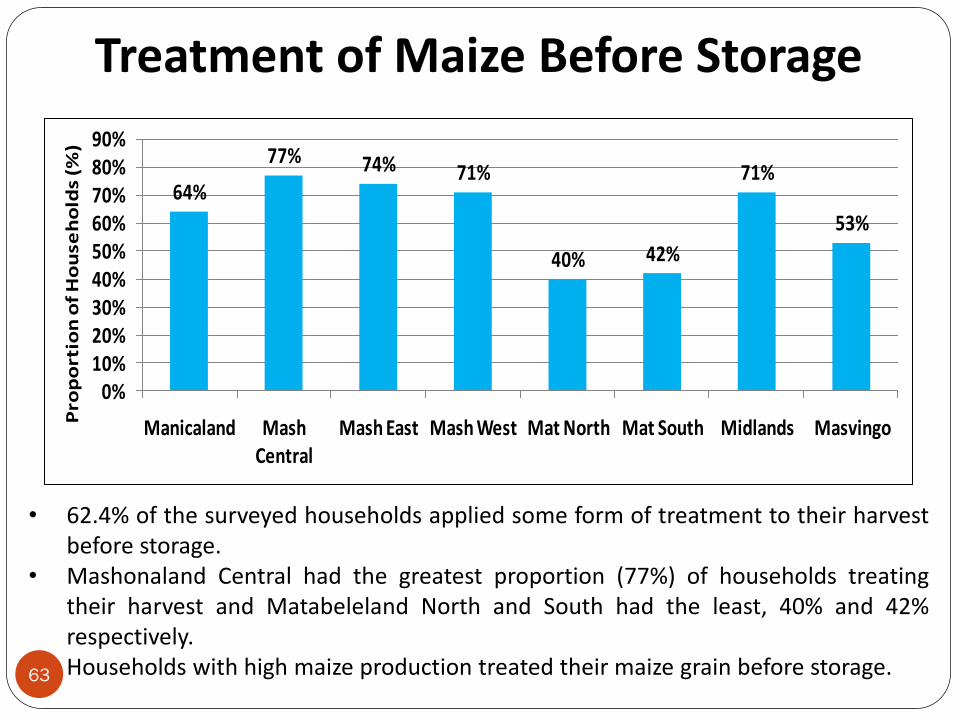
• 62.4% of the surveyed households applied some form of treatment to their harvest before storage.
• Mashonaland Central had the greatest proportion (77%) of households treating their harvest and Matabeleland North and South had the least, 40% and 42% respectively.
• Households with high maize production treated their maize grain before storage. 63
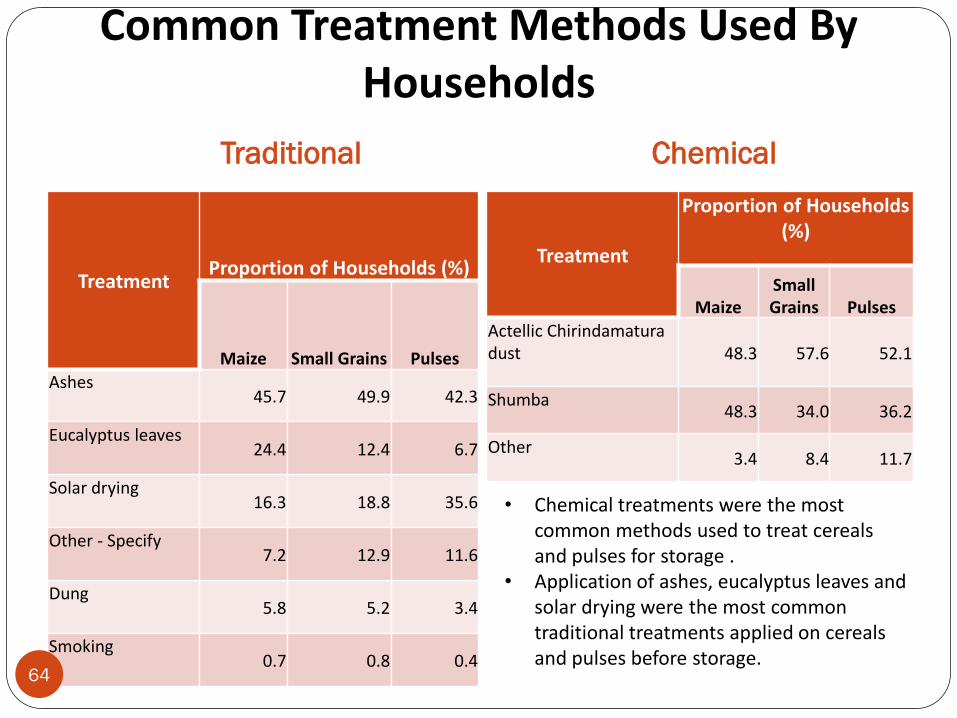
Common Treatment Methods Used By Households
Traditional
Treatment Proportion of Households (%)
Maize Small Grains Pulses
Ashes 45.7 49.9 42.3
Eucalyptus leaves 24.4 12.4 6.7
Solar drying 16.3 18.8 35.6
Other - Specify 7.2 12.9 11.6
Dung 5.8 5.2 3.4
Smoking 0.7 0.8 0.4
Chemical
Treatment
Proportion of Households (%)
Maize Small Grains Pulses
Actellic Chirindamatura dust 48.3 57.6 52.1
Shumba 48.3 34.0 36.2
Other 3.4 8.4 11.7
• Chemical treatments were the most common methods used to treat cereals and pulses for storage .
• Application of ashes, eucalyptus leaves and solar drying were the most common traditional treatments applied on cereals and pulses before storage.
64
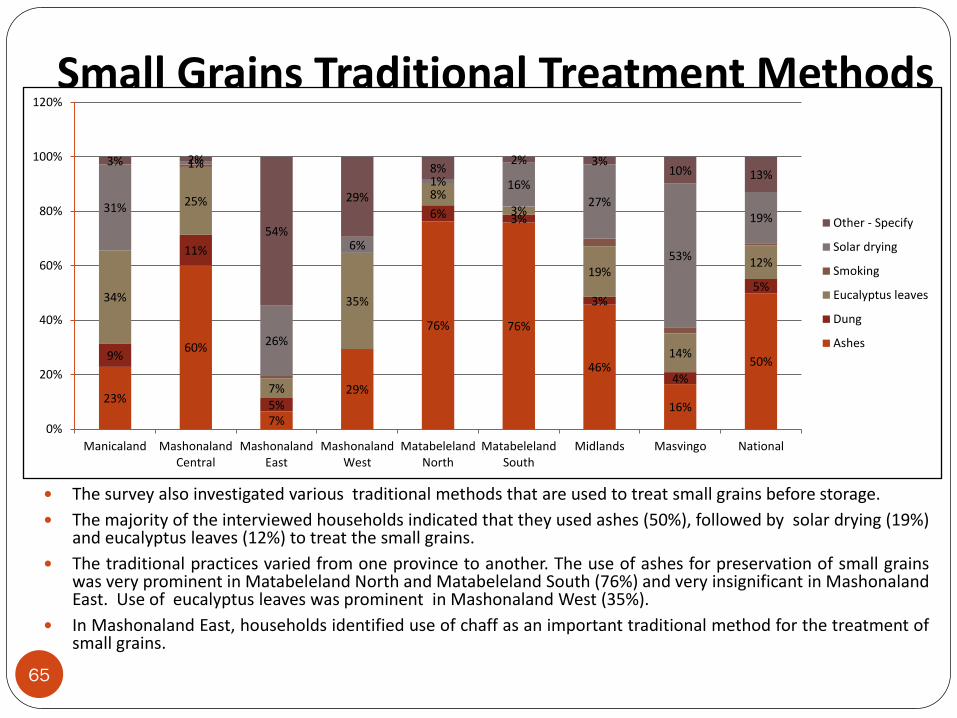
Small Grains Traditional Treatment Methods
The survey also investigated various traditional methods that are used to treat small grains before storage.
The majority of the interviewed households indicated that they used ashes (50%), followed by solar drying (19%) and eucalyptus leaves (12%) to treat the small grains.
The traditional practices varied from one province to another. The use of ashes for preservation of small grains was very prominent in Matabeleland North and Matabeleland South (76%) and very insignificant in Mashonaland East. Use of eucalyptus leaves was prominent in Mashonaland West (35%).
In Mashonaland East, households identified use of chaff as an important traditional method for the treatment of small grains.
65
23%
60%
7%
29%
76% 76%
46%
16%
50% 9%
11%
5%
6% 3%
3%
4%
5% 34%
25%
7%
35%
8% 3%
19%
14%
12%
31%
1%
26%
6%
1% 16%
27%
53%
19%
3% 2%
54%
29%
8% 2% 3%
10% 13%
0%
20%
40%
60%
80%
100%
120%
Manicaland MashonalandCentral
MashonalandEast
MashonalandWest
MatabelelandNorth
MatabelelandSouth
Midlands Masvingo National
Other - Specify
Solar drying
Smoking
Eucalyptus leaves
Dung
Ashes
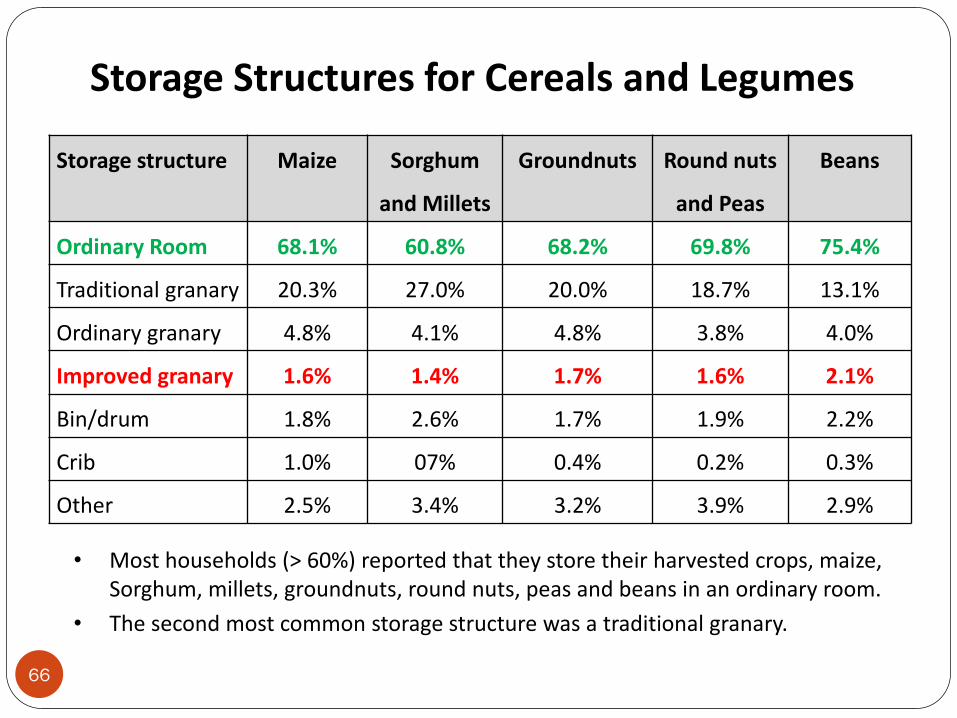
Storage Structures for Cereals and Legumes
Storage structure Maize Sorghum
and Millets
Groundnuts Round nuts
and Peas
Beans
Ordinary Room 68.1% 60.8% 68.2% 69.8% 75.4%
Traditional granary 20.3% 27.0% 20.0% 18.7% 13.1%
Ordinary granary 4.8% 4.1% 4.8% 3.8% 4.0%
Improved granary 1.6% 1.4% 1.7% 1.6% 2.1%
Bin/drum 1.8% 2.6% 1.7% 1.9% 2.2%
Crib 1.0% 07% 0.4% 0.2% 0.3%
Other 2.5% 3.4% 3.2% 3.9% 2.9%
• Most households (> 60%) reported that they store their harvested crops, maize, Sorghum, millets, groundnuts, round nuts, peas and beans in an ordinary room.
• The second most common storage structure was a traditional granary.
66
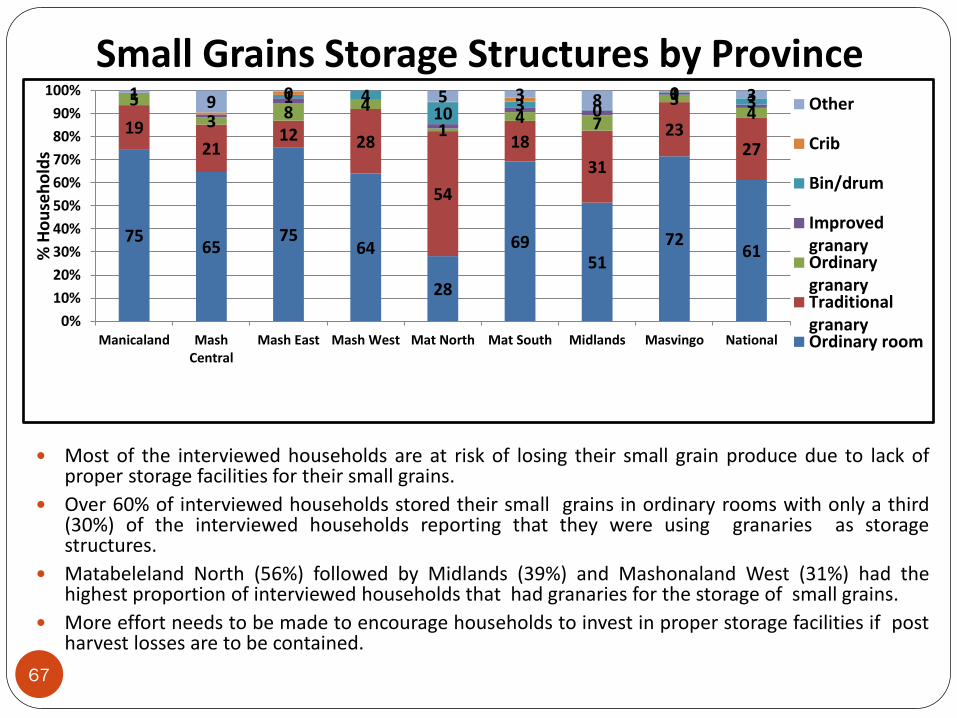
Small Grains Storage Structures by Province
Most of the interviewed households are at risk of losing their small grain produce due to lack of proper storage facilities for their small grains.
Over 60% of interviewed households stored their small grains in ordinary rooms with only a third (30%) of the interviewed households reporting that they were using granaries as storage structures.
Matabeleland North (56%) followed by Midlands (39%) and Mashonaland West (31%) had the highest proportion of interviewed households that had granaries for the storage of small grains.
More effort needs to be made to encourage households to invest in proper storage facilities if post harvest losses are to be contained.
75 65
75 64
28
69 51
72 61
19 21
12 28
54
18
31
23 27
5 3 8 4
1 4 7
3 4
1 4 10 3 0
1 3 1 9 0 5 3 8 0 3
0%
10%
20%
30%
40%
50%
60%
70%
80%
90%
100%
Manicaland MashCentral
Mash East Mash West Mat North Mat South Midlands Masvingo National
% H
ou
seh
old
s
Other
Crib
Bin/drum
ImprovedgranaryOrdinarygranaryTraditionalgranaryOrdinary room
67
Cereal and Pulses Post Harvest Losses
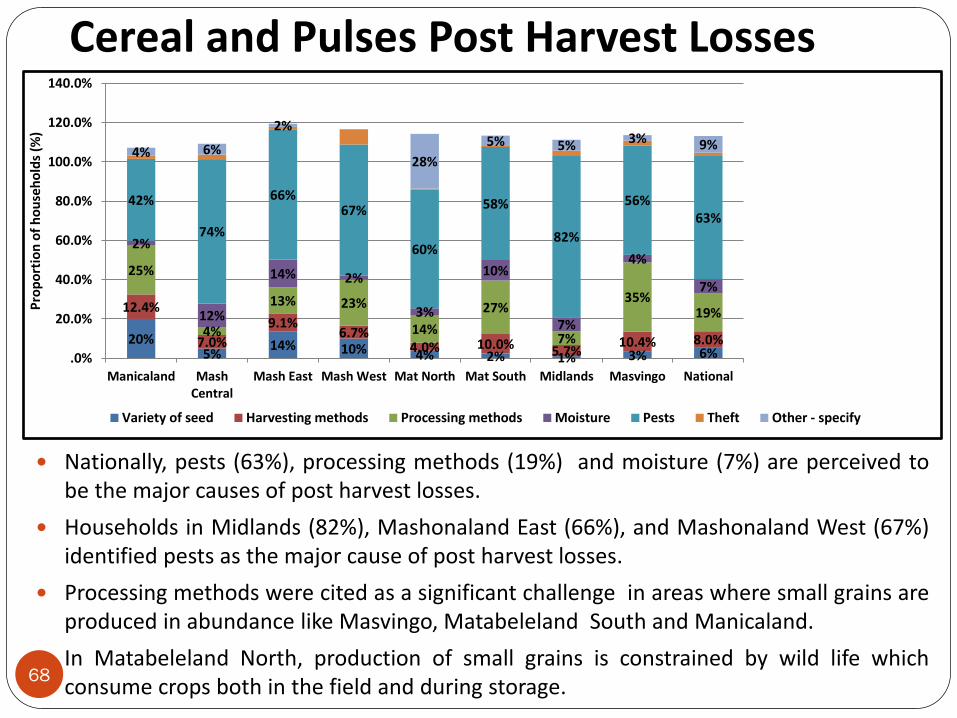
Nationally, pests (63%), processing methods (19%) and moisture (7%) are perceived to be the major causes of post harvest losses.
Households in Midlands (82%), Mashonaland East (66%), and Mashonaland West (67%) identified pests as the major cause of post harvest losses.
Processing methods were cited as a significant challenge in areas where small grains are produced in abundance like Masvingo, Matabeleland South and Manicaland.
In Matabeleland North, production of small grains is constrained by wild life which consume crops both in the field and during storage.
20% 5%
14% 10% 4% 2% 1% 3% 6%
12.4%
7.0%
9.1% 6.7%
4.0% 10.0% 5.7% 10.4% 8.0%
25%
4%
13% 23%
14%
27%
7%
35% 19%
2%
12%
14% 2%
3%
10%
7%
4%
7%
42%
74%
66% 67%
60%
58%
82%
56% 63%
4% 6%
2%
28%
5% 5% 3% 9%
.0%
20.0%
40.0%
60.0%
80.0%
100.0%
120.0%
140.0%
Manicaland MashCentral
Mash East Mash West Mat North Mat South Midlands Masvingo National
Pro
po
rtio
n o
f h
ou
seh
old
s (%
)
Variety of seed Harvesting methods Processing methods Moisture Pests Theft Other - specify
68
Methods of Measuring Moisture Content
Method Maize Small grains Pulses.
Visual 42.7% 48.3% 35.4%
Texture 8.6% 9.0% 4.5%
Reduction in weight 2.6% 3.6% 3.0%
Drying period 21.5% 25.3% 18.3%
Biting / chewing 19.3% 8.7% 10.1%
Shaking / sound 4.7% 4.2% 27.9%
No method 0.5% 1.1% 0.8%
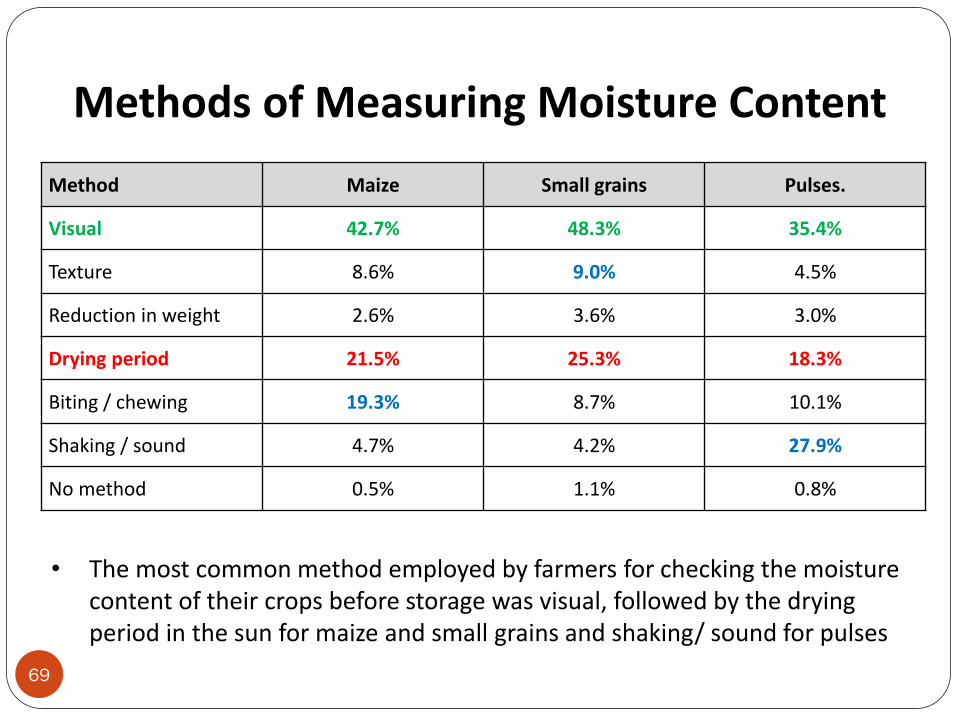
• The most common method employed by farmers for checking the moisture content of their crops before storage was visual, followed by the drying period in the sun for maize and small grains and shaking/ sound for pulses
69
Changes Observed in Stored Maize
4%
21%
2%
73%
Colour
Taste
Smell
No change
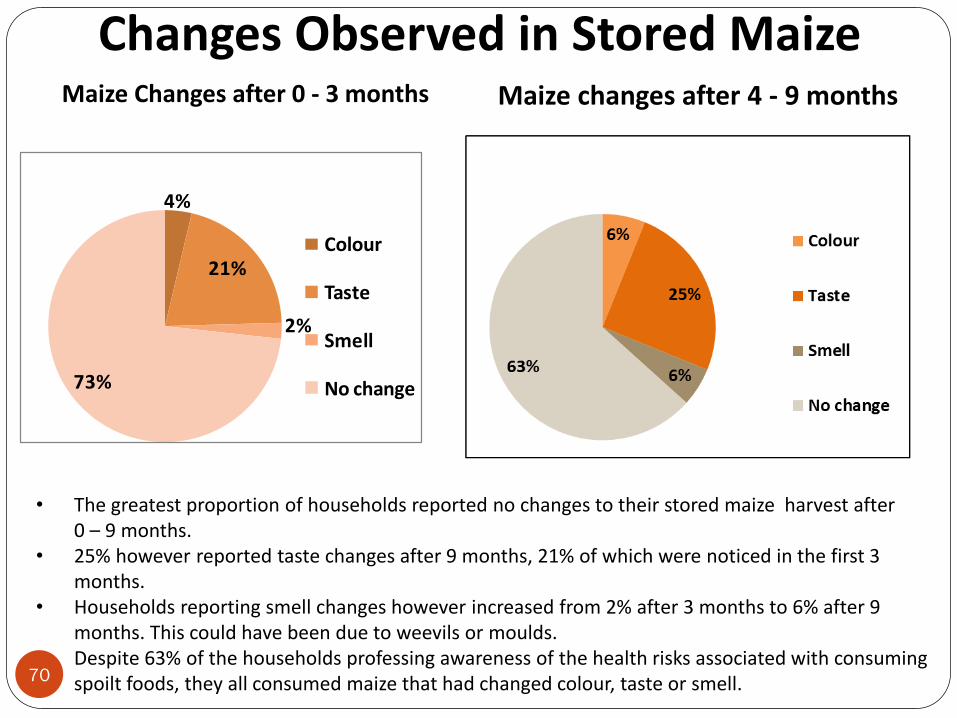
• The greatest proportion of households reported no changes to their stored maize harvest after 0 – 9 months. • 25% however reported taste changes after 9 months, 21% of which were noticed in the first 3
months. • Households reporting smell changes however increased from 2% after 3 months to 6% after 9
months. This could have been due to weevils or moulds. • Despite 63% of the households professing awareness of the health risks associated with consuming
spoilt foods, they all consumed maize that had changed colour, taste or smell.
Maize Changes after 0 - 3 months Maize changes after 4 - 9 months
70
Agriculture Commodities and Inputs Markets
To identify and assess the functioning of current markets in rural districts of Zimbabwe
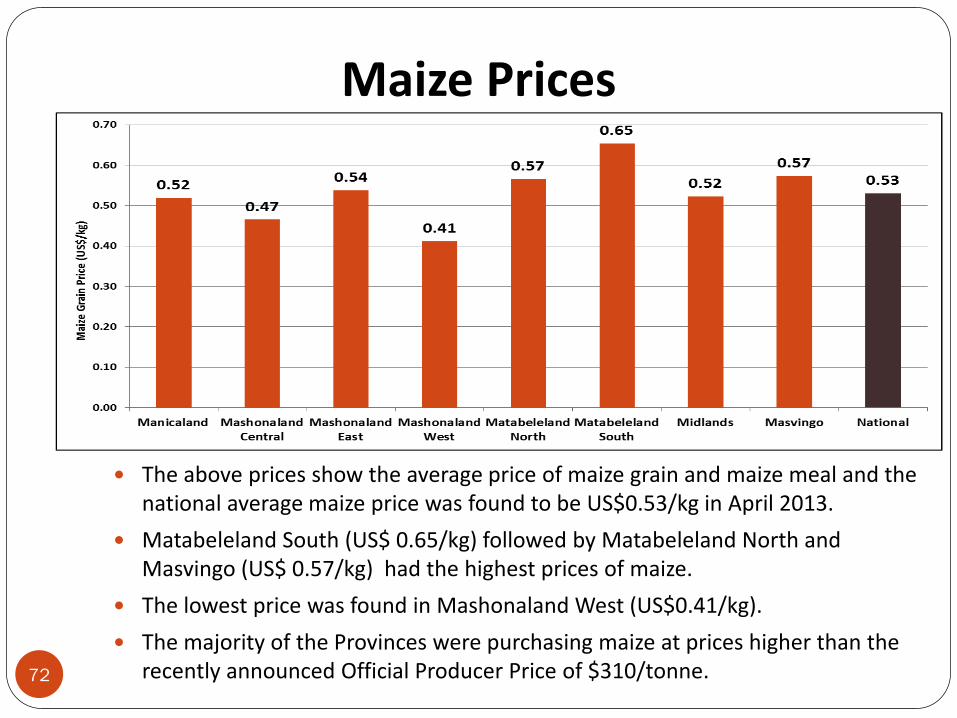
Maize Prices
The above prices show the average price of maize grain and maize meal and the national average maize price was found to be US$0.53/kg in April 2013.
Matabeleland South (US$ 0.65/kg) followed by Matabeleland North and Masvingo (US$ 0.57/kg) had the highest prices of maize.
The lowest price was found in Mashonaland West (US$0.41/kg).
The majority of the Provinces were purchasing maize at prices higher than the recently announced Official Producer Price of $310/tonne.
72
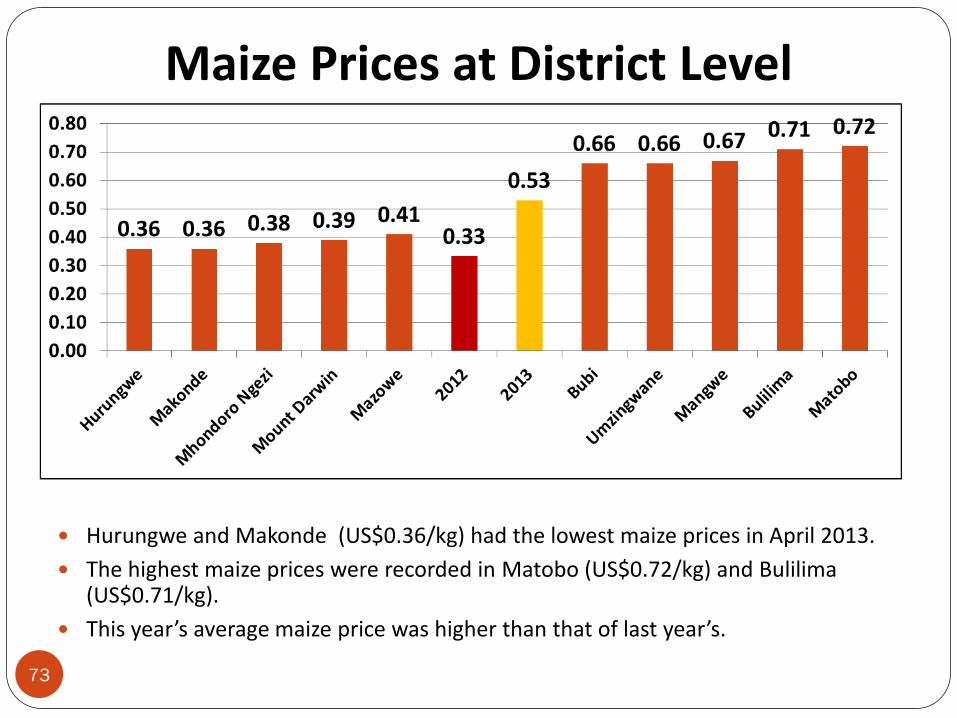
Maize Prices at District Level
Hurungwe and Makonde (US$0.36/kg) had the lowest maize prices in April 2013.
The highest maize prices were recorded in Matobo (US$0.72/kg) and Bulilima (US$0.71/kg).
This year’s average maize price was higher than that of last year’s.
73
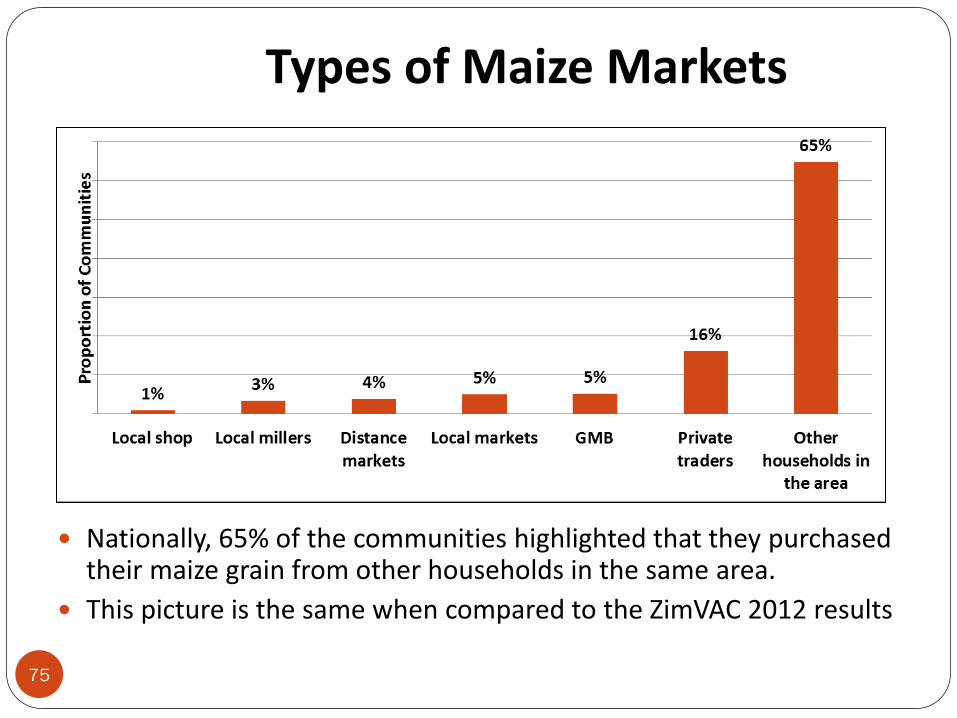
Types of Maize Markets
Nationally, 65% of the communities highlighted that they purchased their maize grain from other households in the same area.
This picture is the same when compared to the ZimVAC 2012 results
75
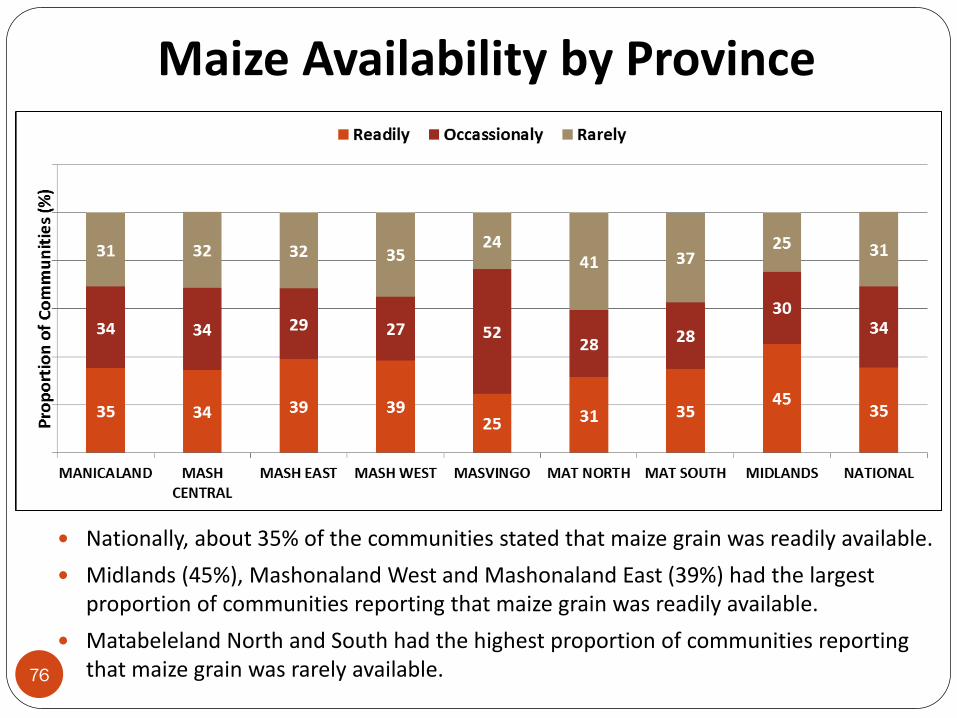
Maize Availability by Province
Nationally, about 35% of the communities stated that maize grain was readily available.
Midlands (45%), Mashonaland West and Mashonaland East (39%) had the largest proportion of communities reporting that maize grain was readily available.
Matabeleland North and South had the highest proportion of communities reporting that maize grain was rarely available. 76
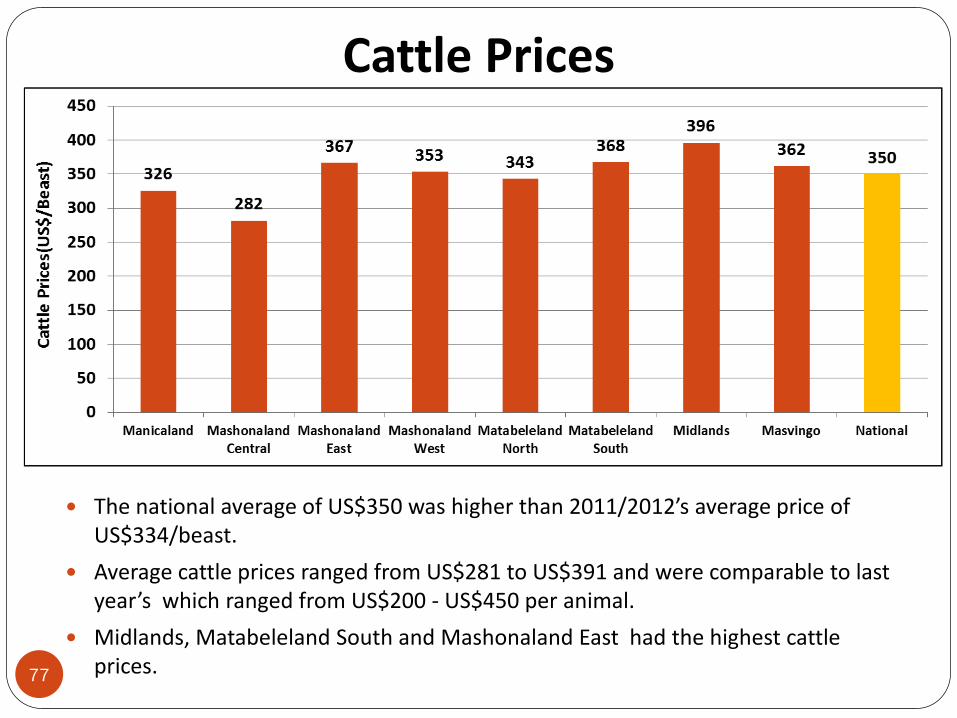
Cattle Prices
The national average of US$350 was higher than 2011/2012’s average price of US$334/beast.
Average cattle prices ranged from US$281 to US$391 and were comparable to last year’s which ranged from US$200 - US$450 per animal.
Midlands, Matabeleland South and Mashonaland East had the highest cattle prices. 77
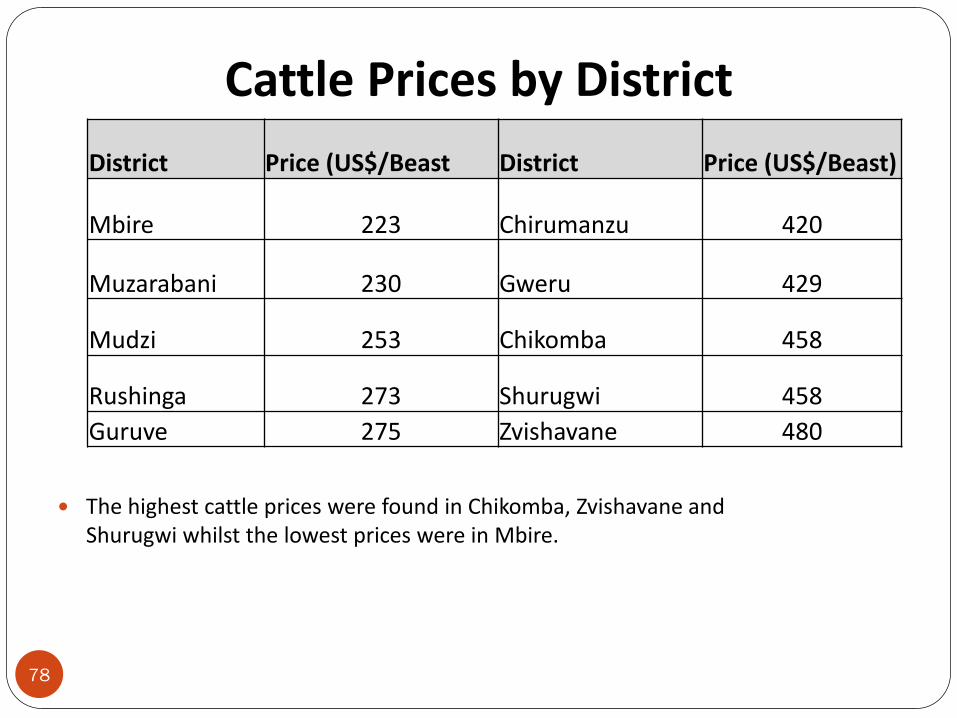
Cattle Prices by District
The highest cattle prices were found in Chikomba, Zvishavane and Shurugwi whilst the lowest prices were in Mbire.
District Price (US$/Beast District Price (US$/Beast)
Mbire 223 Chirumanzu 420
Muzarabani 230 Gweru 429
Mudzi 253 Chikomba 458
Rushinga 273 Shurugwi 458
Guruve 275 Zvishavane 480
78
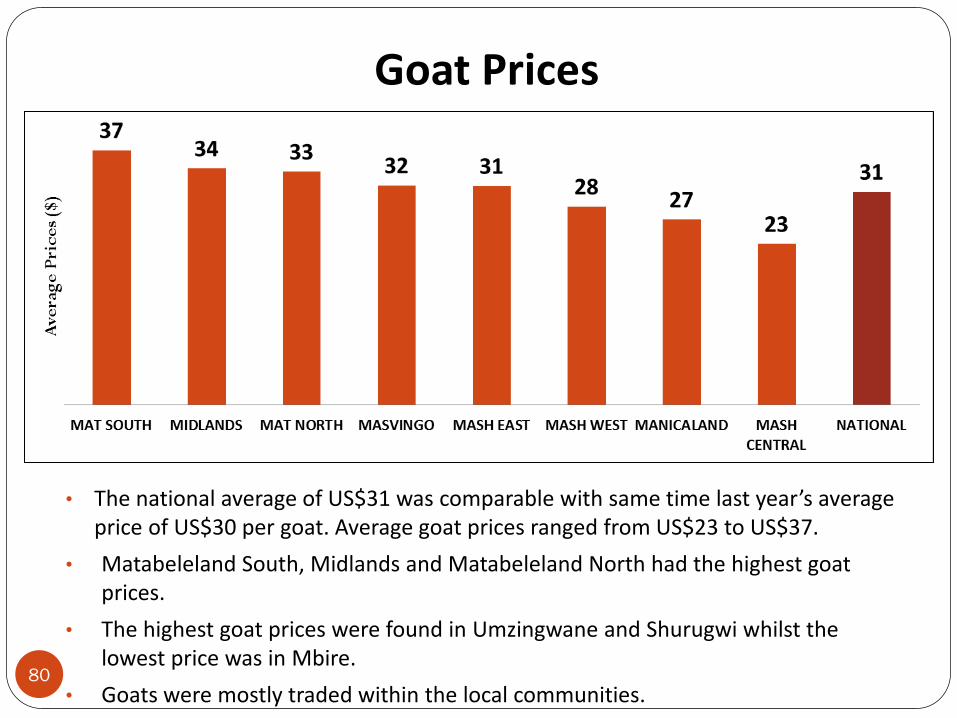
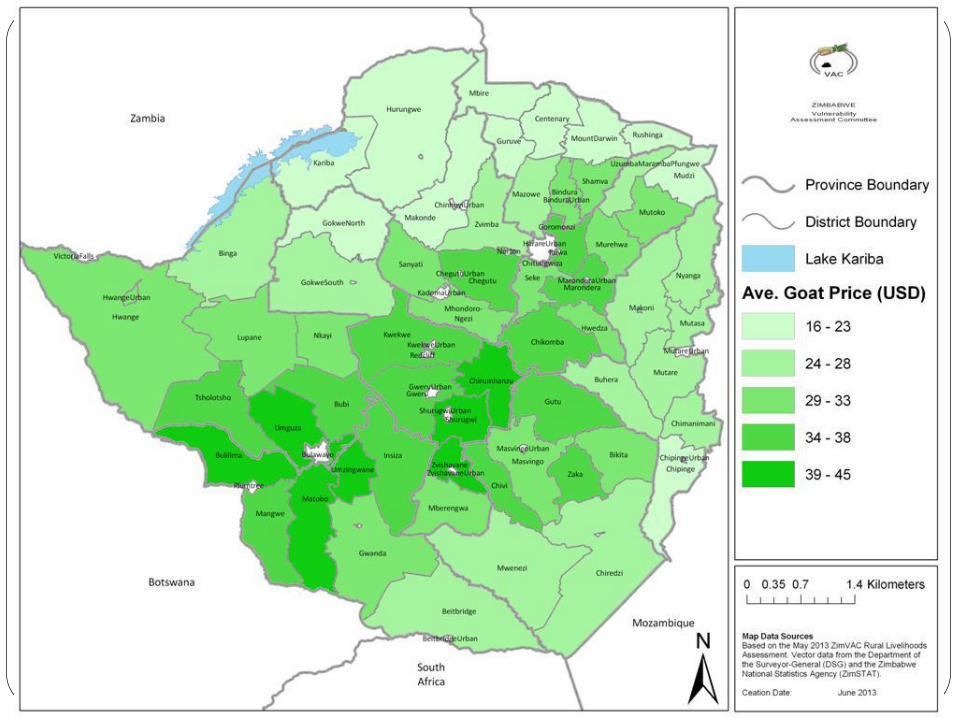
Goat Prices
• The national average of US$31 was comparable with same time last year’s average price of US$30 per goat. Average goat prices ranged from US$23 to US$37.
• Matabeleland South, Midlands and Matabeleland North had the highest goat prices.
• The highest goat prices were found in Umzingwane and Shurugwi whilst the lowest price was in Mbire.
• Goats were mostly traded within the local communities. 80
To assess rural households’ access to irrigation
Irrigation Schemes
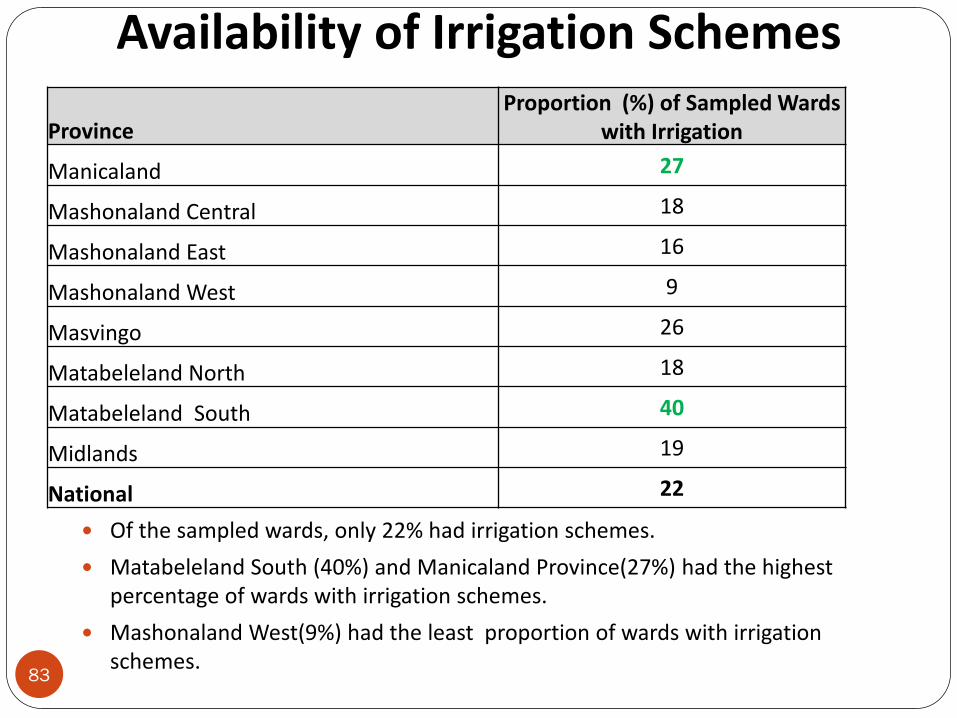
Availability of Irrigation Schemes
Of the sampled wards, only 22% had irrigation schemes.
Matabeleland South (40%) and Manicaland Province(27%) had the highest percentage of wards with irrigation schemes.
Mashonaland West(9%) had the least proportion of wards with irrigation schemes.
Province Proportion (%) of Sampled Wards
with Irrigation
Manicaland 27
Mashonaland Central 18
Mashonaland East 16
Mashonaland West 9
Masvingo 26
Matabeleland North 18
Matabeleland South 40
Midlands 19
National 22
83
32 41 36
17
45 54
47 33
40
46
12 36
17
36
38 39 62
39
21
47
29
67
18 8
14 5
21
MANICALAND MASHCENTRAL
MASH EAST MASH WEST MASVINGO MAT NORTH MAT SOUTH MIDLANDS NATIONAL
Pro
po
rtio
n o
f C
om
mu
nit
ies
(%)
Functional Partially functional Not functional
Condition of Irrigation Schemes
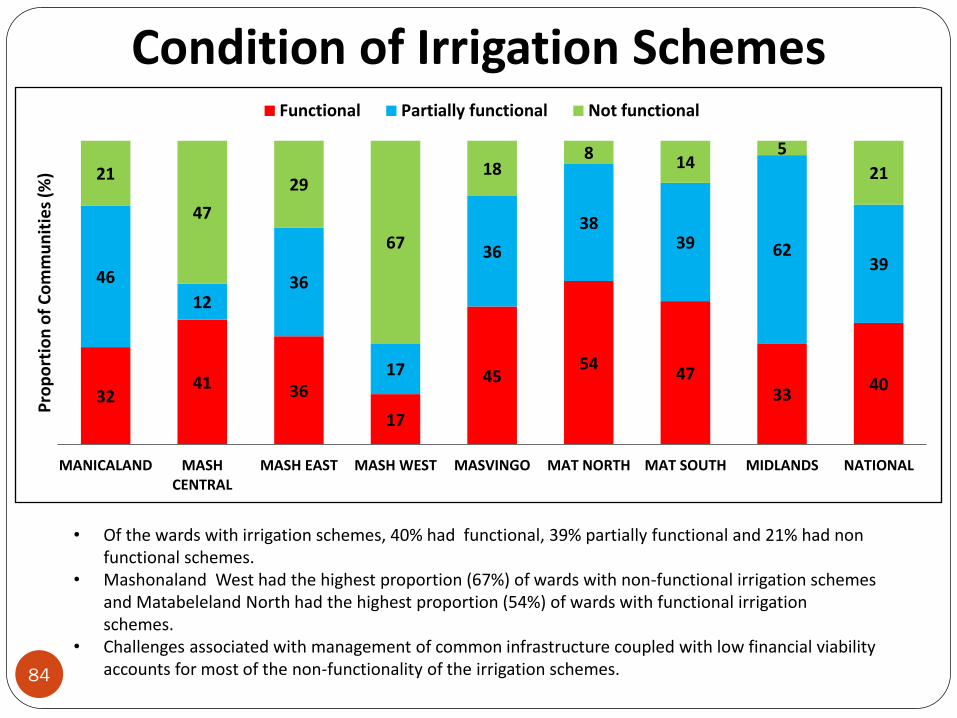
• Of the wards with irrigation schemes, 40% had functional, 39% partially functional and 21% had non functional schemes.
• Mashonaland West had the highest proportion (67%) of wards with non-functional irrigation schemes and Matabeleland North had the highest proportion (54%) of wards with functional irrigation schemes.
• Challenges associated with management of common infrastructure coupled with low financial viability accounts for most of the non-functionality of the irrigation schemes.
84
Community Gardens
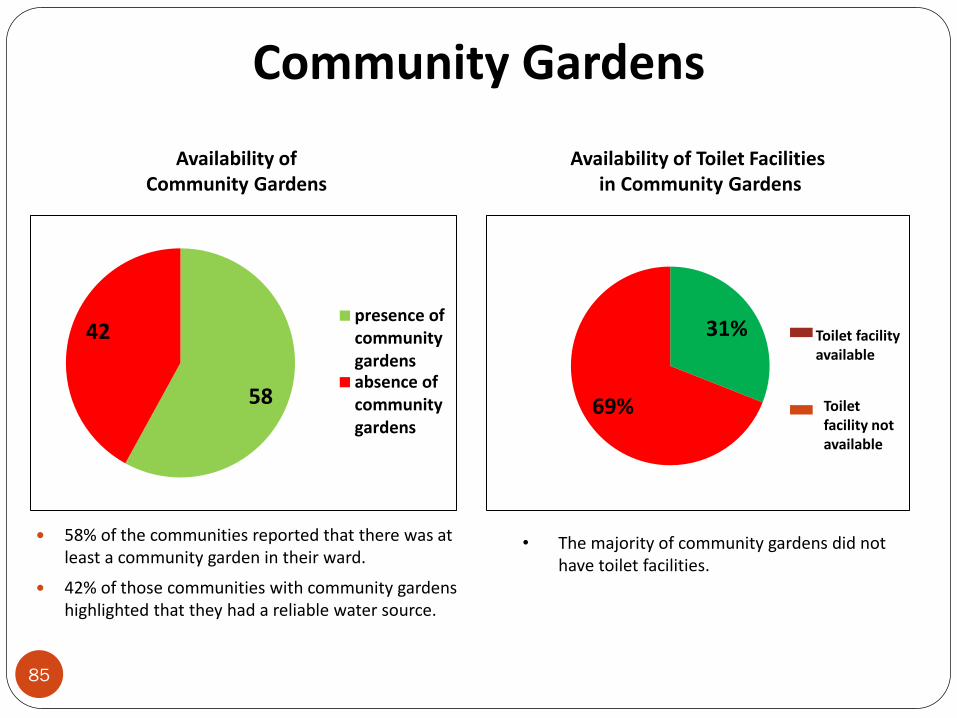
58% of the communities reported that there was at least a community garden in their ward.
42% of those communities with community gardens highlighted that they had a reliable water source.
58
42 presence ofcommunitygardensabsence ofcommunitygardens
31%
69% Toilet facility not available
Toilet facility available
• The majority of community gardens did not have toilet facilities.
Availability of Community Gardens
Availability of Toilet Facilities in Community Gardens
85
Average Number of Community Gardens per Ward
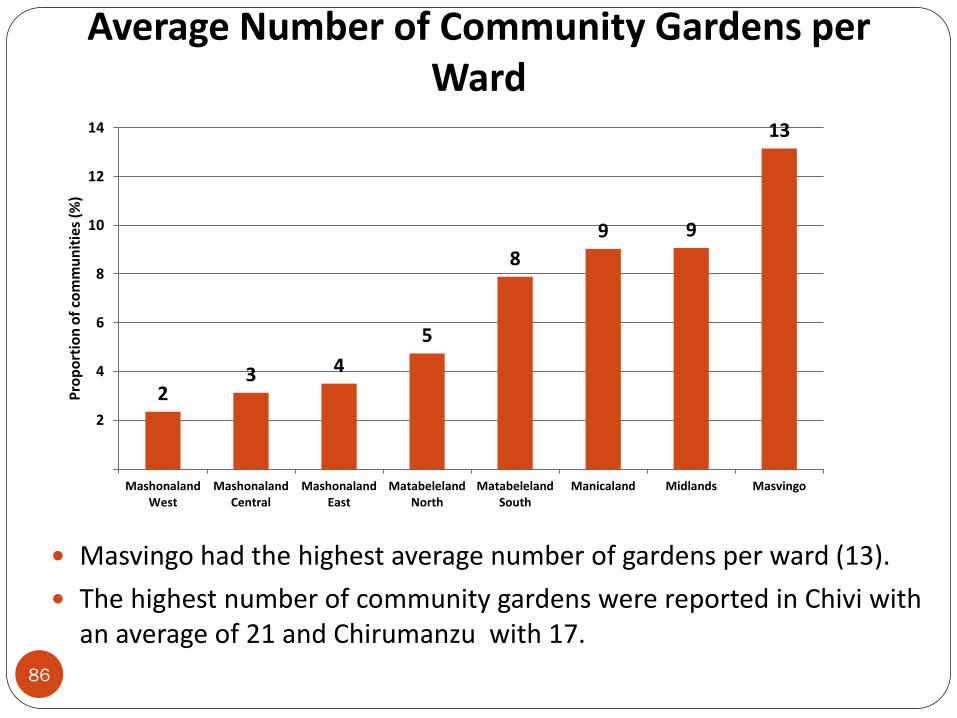
Masvingo had the highest average number of gardens per ward (13).
The highest number of community gardens were reported in Chivi with an average of 21 and Chirumanzu with 17.
2 3 4
5
8
9 9
13
2
4
6
8
10
12
14
MashonalandWest
MashonalandCentral
MashonalandEast
MatabelelandNorth
MatabelelandSouth
Manicaland Midlands Masvingo
Pro
po
rtio
n o
f co
mm
un
itie
s (%
)
86
To describe the socio-economic profiles of rural households in terms of such
characteristics as their assets, income sources and income levels
Livestock
Cattle Ownership
62% 63% 62% 66%56% 55% 52%
60% 60%
20% 19% 19% 15%18% 18% 23%
22% 19%
10% 9% 8% 6%9% 9% 10%
8% 8%
8% 9% 11% 13% 18% 18% 15% 10% 13%
0.00%
20.00%
40.00%
60.00%
80.00%
100.00%
120.00%
Manicaland Mashonaland Central
Mashonaland East
Mashonaland West
Matabeleland North
Matabeleland South
Midlands Masvingo National
% O
f H
ou
seh
old
s
Zero One to Three Four to Five > Five
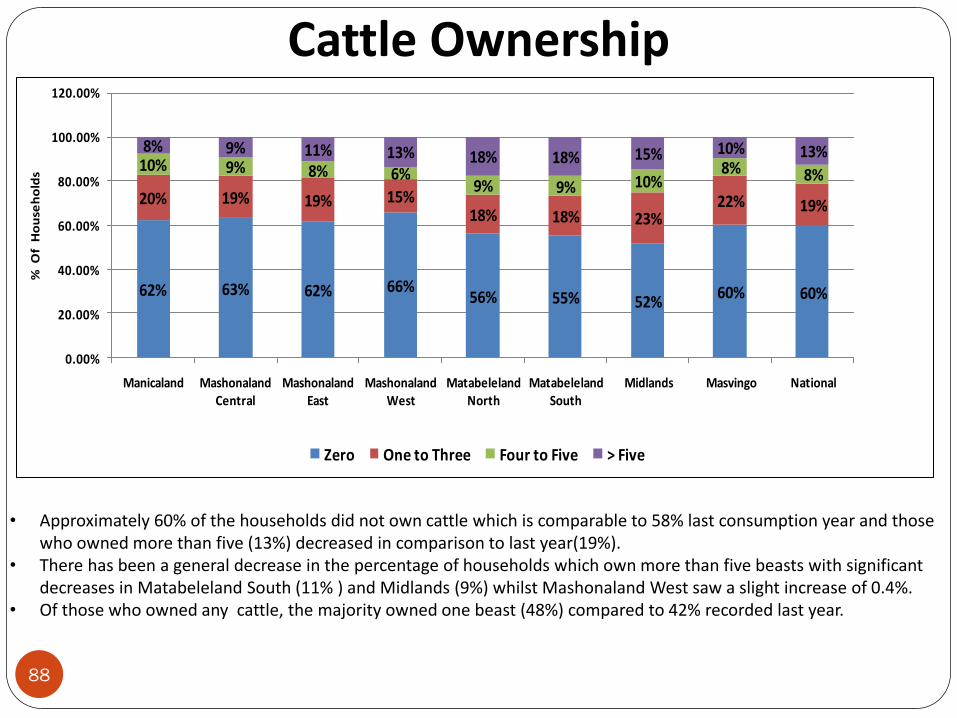
• Approximately 60% of the households did not own cattle which is comparable to 58% last consumption year and those who owned more than five (13%) decreased in comparison to last year(19%).
• There has been a general decrease in the percentage of households which own more than five beasts with significant decreases in Matabeleland South (11% ) and Midlands (9%) whilst Mashonaland West saw a slight increase of 0.4%.
• Of those who owned any cattle, the majority owned one beast (48%) compared to 42% recorded last year.
88
Cattle Herd Dynamics
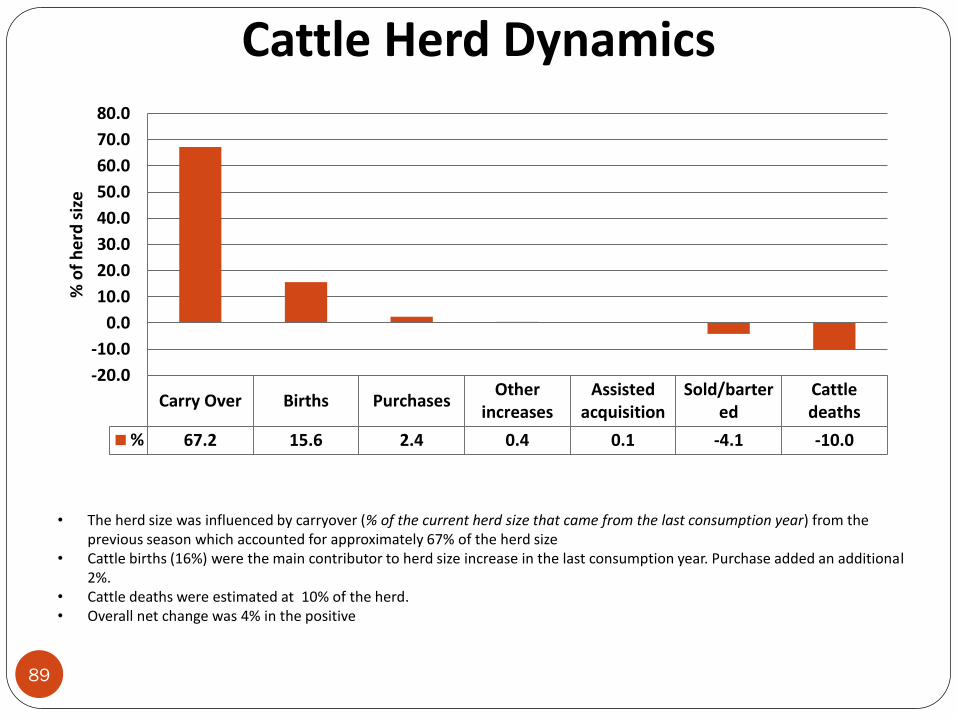
• The herd size was influenced by carryover (% of the current herd size that came from the last consumption year) from the previous season which accounted for approximately 67% of the herd size
• Cattle births (16%) were the main contributor to herd size increase in the last consumption year. Purchase added an additional 2%.
• Cattle deaths were estimated at 10% of the herd. • Overall net change was 4% in the positive
89
Carry Over Births PurchasesOther
increasesAssisted
acquisitionSold/barter
edCattledeaths
% 67.2 15.6 2.4 0.4 0.1 -4.1 -10.0
-20.0
-10.0
0.0
10.0
20.0
30.0
40.0
50.0
60.0
70.0
80.0
% o
f h
erd
siz
e
Causes of Cattle Losses
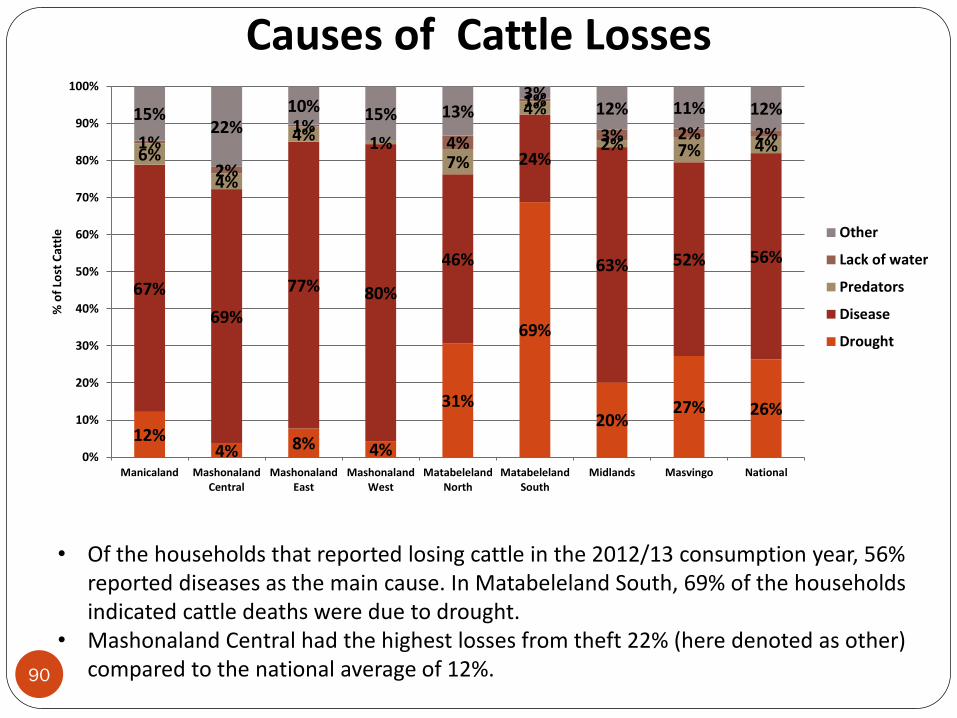
• Of the households that reported losing cattle in the 2012/13 consumption year, 56% reported diseases as the main cause. In Matabeleland South, 69% of the households indicated cattle deaths were due to drought.
• Mashonaland Central had the highest losses from theft 22% (here denoted as other) compared to the national average of 12%.
90
12% 4% 8% 4%
31%
69%
20% 27% 26%
67%
69%
77% 80%
46%
24%
63% 52% 56%
6%
4%
4% 1% 7%
4%
2% 7% 4% 1%
2%
1% 4%
1%
3% 2% 2% 15%
22% 10% 15% 13%
3% 12% 11% 12%
0%
10%
20%
30%
40%
50%
60%
70%
80%
90%
100%
Manicaland MashonalandCentral
MashonalandEast
MashonalandWest
MatabelelandNorth
MatabelelandSouth
Midlands Masvingo National
% o
f Lo
st C
attl
e
Other
Lack of water
Predators
Disease
Drought
Cause of Death by Herd Size
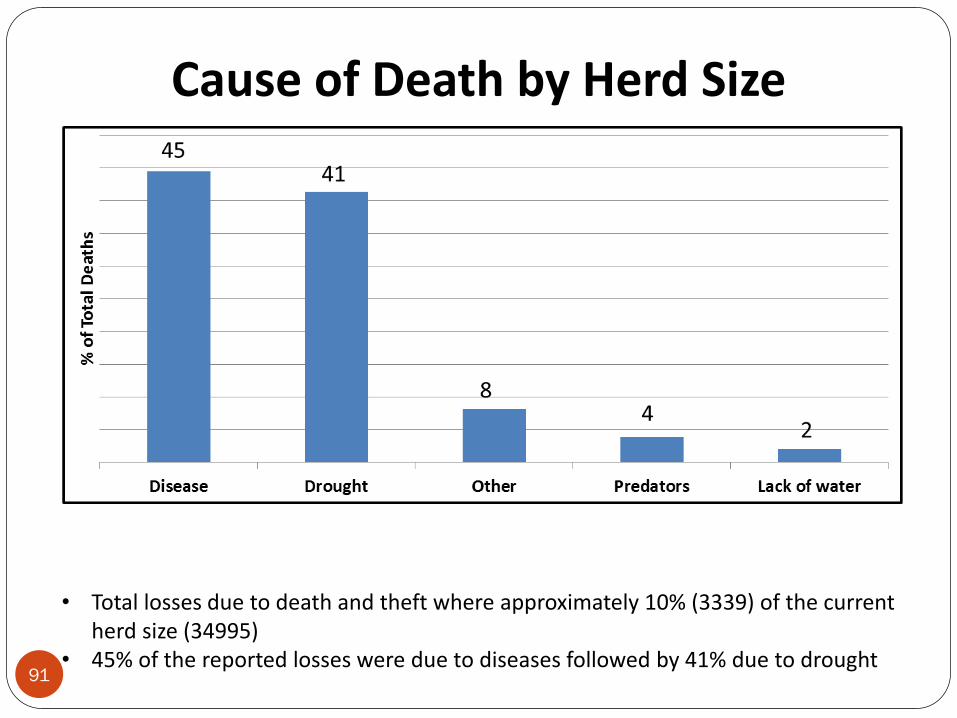
• Total losses due to death and theft where approximately 10% (3339) of the current herd size (34995)
• 45% of the reported losses were due to diseases followed by 41% due to drought
91
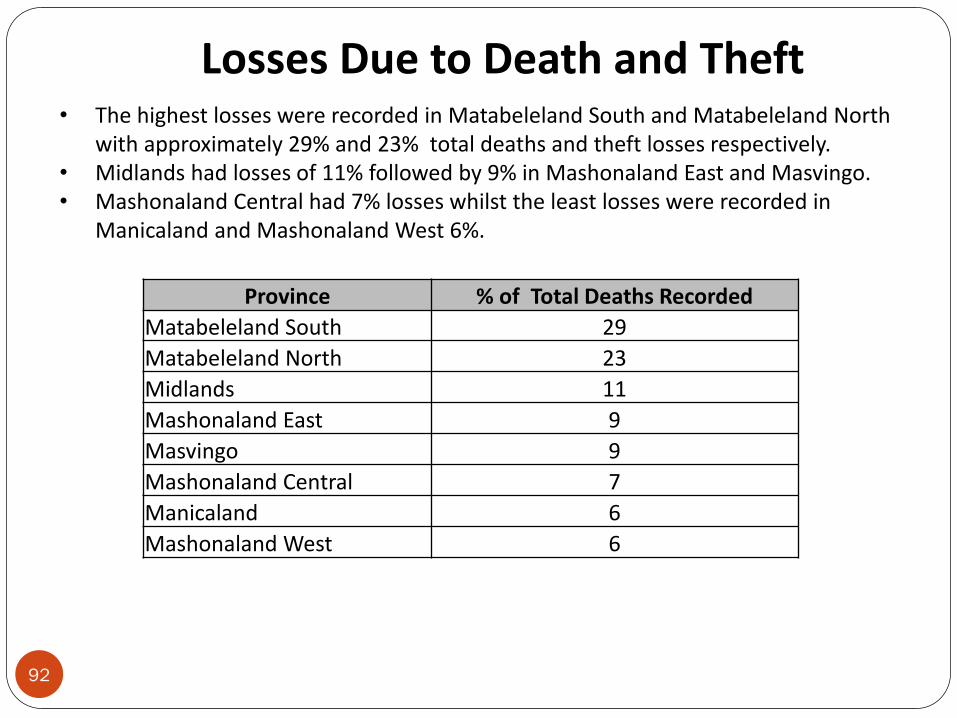
Losses Due to Death and Theft • The highest losses were recorded in Matabeleland South and Matabeleland North
with approximately 29% and 23% total deaths and theft losses respectively. • Midlands had losses of 11% followed by 9% in Mashonaland East and Masvingo. • Mashonaland Central had 7% losses whilst the least losses were recorded in
Manicaland and Mashonaland West 6%.
Province % of Total Deaths Recorded
Matabeleland South 29
Matabeleland North 23
Midlands 11
Mashonaland East 9
Masvingo 9
Mashonaland Central 7
Manicaland 6
Mashonaland West 6
92
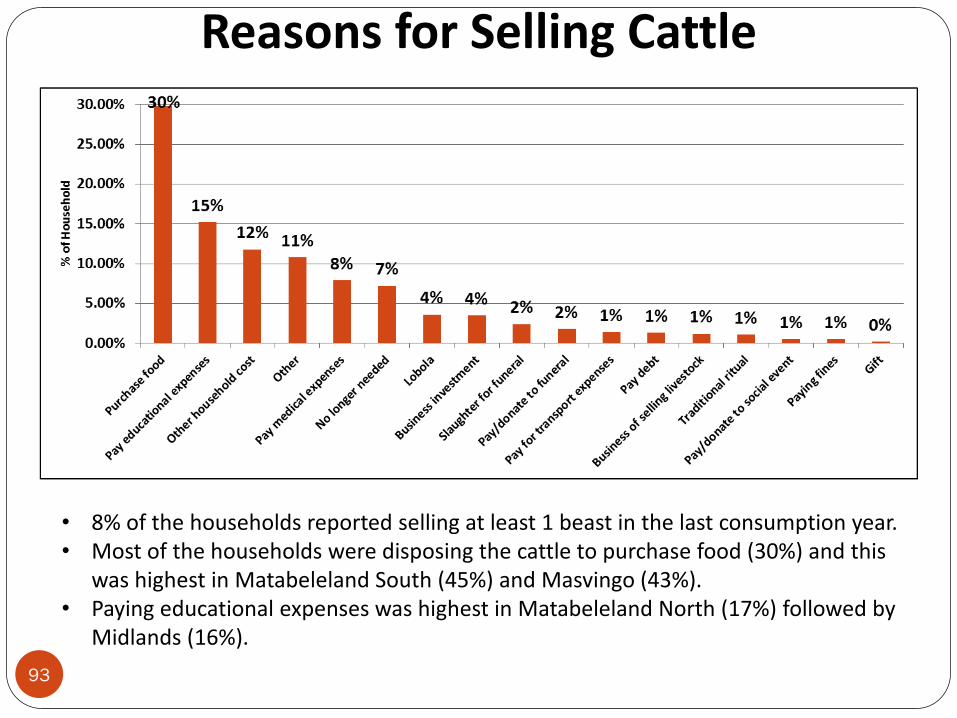
Reasons for Selling Cattle
• 8% of the households reported selling at least 1 beast in the last consumption year. • Most of the households were disposing the cattle to purchase food (30%) and this
was highest in Matabeleland South (45%) and Masvingo (43%). • Paying educational expenses was highest in Matabeleland North (17%) followed by
Midlands (16%). 93
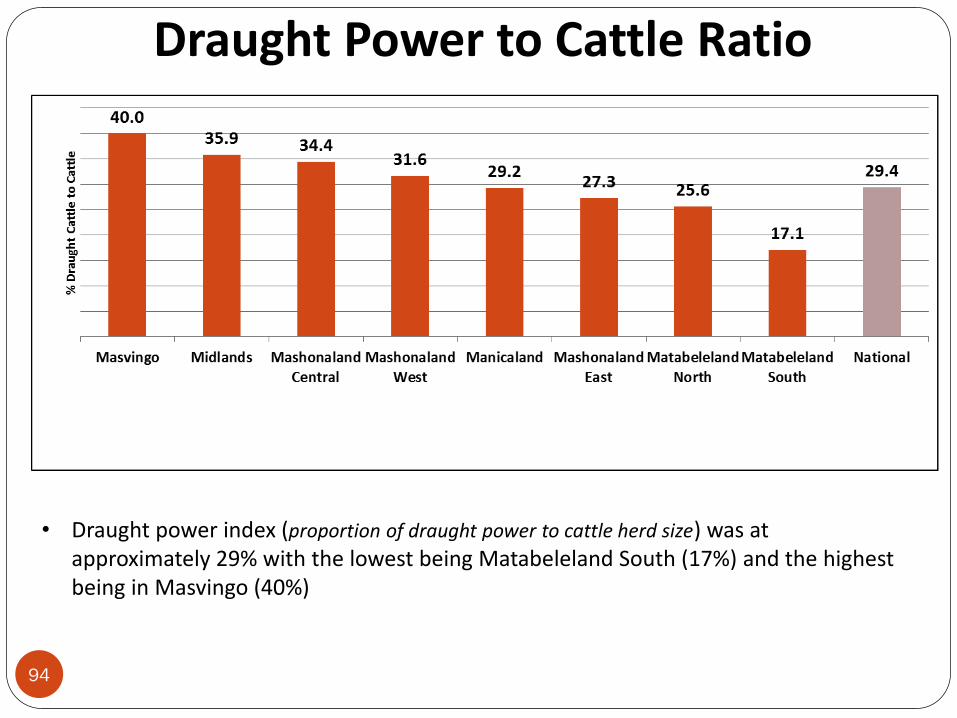
Draught Power to Cattle Ratio
• Draught power index (proportion of draught power to cattle herd size) was at approximately 29% with the lowest being Matabeleland South (17%) and the highest being in Masvingo (40%)
94
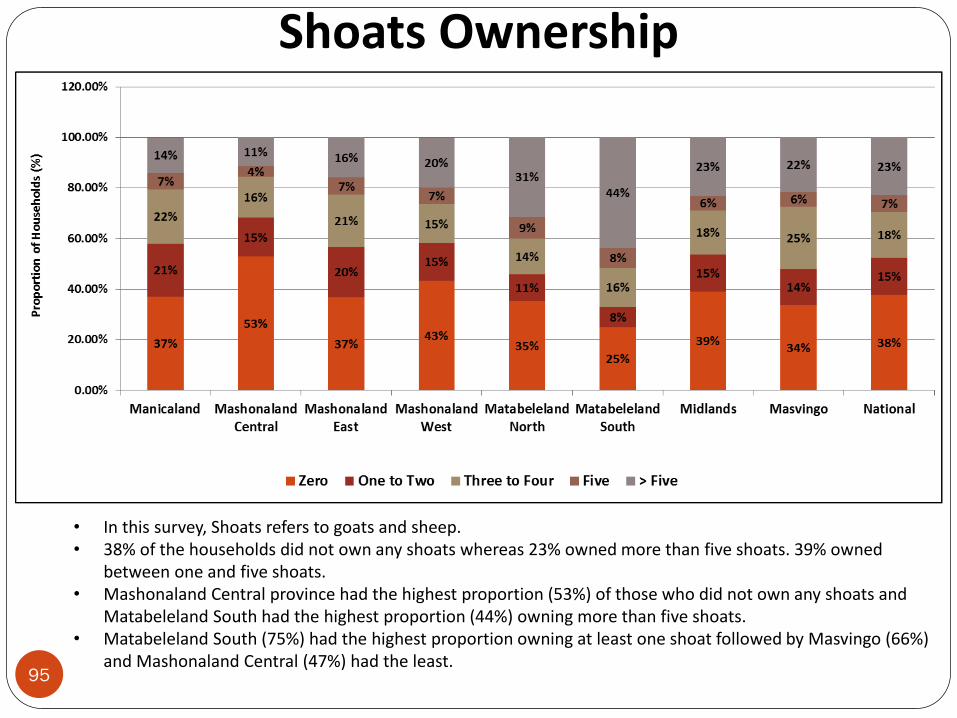
Shoats Ownership
• In this survey, Shoats refers to goats and sheep. • 38% of the households did not own any shoats whereas 23% owned more than five shoats. 39% owned
between one and five shoats. • Mashonaland Central province had the highest proportion (53%) of those who did not own any shoats and
Matabeleland South had the highest proportion (44%) owning more than five shoats. • Matabeleland South (75%) had the highest proportion owning at least one shoat followed by Masvingo (66%)
and Mashonaland Central (47%) had the least. 95
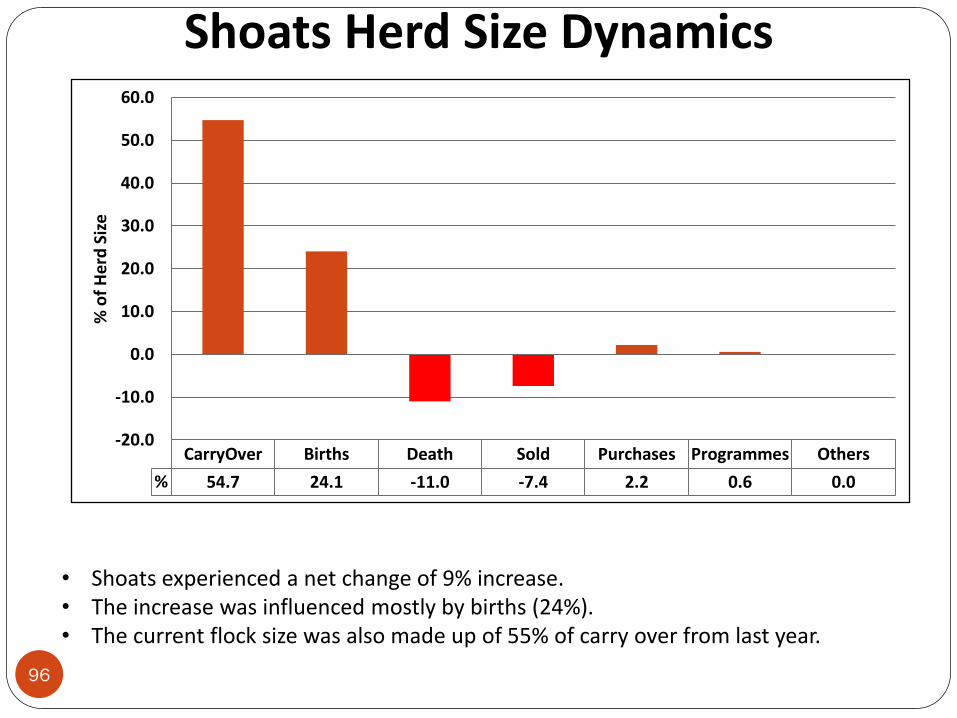
Shoats Herd Size Dynamics
• Shoats experienced a net change of 9% increase. • The increase was influenced mostly by births (24%). • The current flock size was also made up of 55% of carry over from last year.
96
CarryOver Births Death Sold Purchases Programmes Others
% 54.7 24.1 -11.0 -7.4 2.2 0.6 0.0
-20.0
-10.0
0.0
10.0
20.0
30.0
40.0
50.0
60.0%
of
He
rd S
ize
Reasons for Selling Shoats
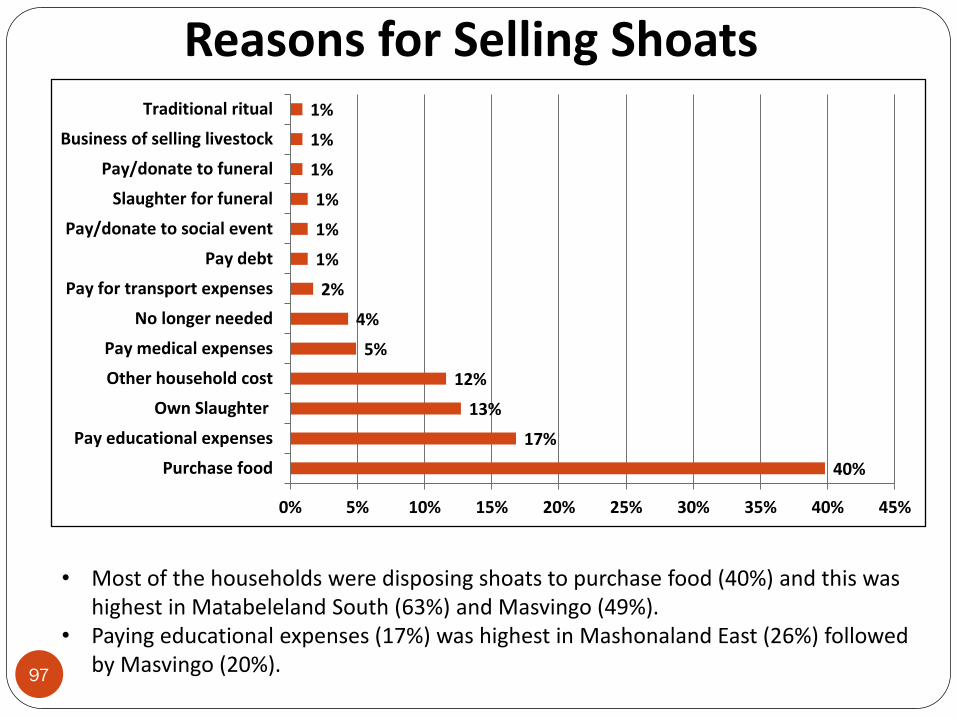
• Most of the households were disposing shoats to purchase food (40%) and this was highest in Matabeleland South (63%) and Masvingo (49%).
• Paying educational expenses (17%) was highest in Mashonaland East (26%) followed by Masvingo (20%).
97
40%
17%
13%
12%
5%
4%
2%
1%
1%
1%
1%
1%
1%
0% 5% 10% 15% 20% 25% 30% 35% 40% 45%
Purchase food
Pay educational expenses
Own Slaughter
Other household cost
Pay medical expenses
No longer needed
Pay for transport expenses
Pay debt
Pay/donate to social event
Slaughter for funeral
Pay/donate to funeral
Business of selling livestock
Traditional ritual
Reasons for Losses of Shoats
2%
4%
4%
3%
10%
36%
6%
7%
12%
77%
65%
60%
77%
50%
40%
69%
70%
59%
9%
11%
11%
7%
20%
19%
9%
15%
14%
3.30%
0.20%
13%
20%
26%
10%
21%
5%
15%
8%
15%
0.00% 20.00% 40.00% 60.00% 80.00% 100.00% 120.00%
Manicaland
Mashonaland Central
Mashonaland East
Mashonaland West
Matabeleland North
Matabeleland South
Midlands
Masvingo
National
Proportion of Households (%)
Drought
Disease
Predators
Lack of water
Other
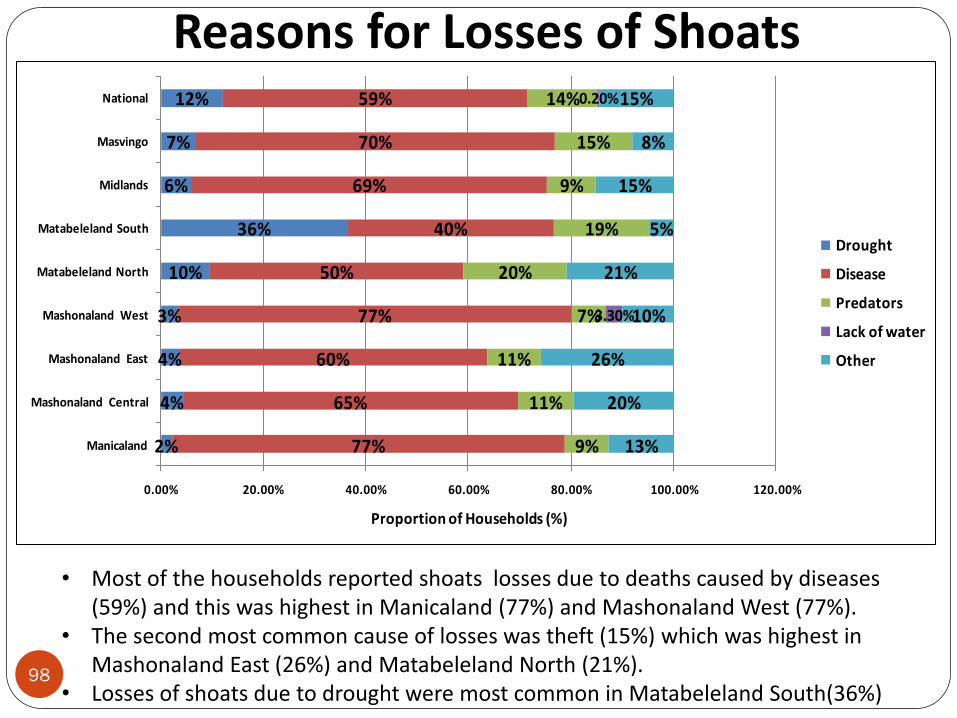
• Most of the households reported shoats losses due to deaths caused by diseases (59%) and this was highest in Manicaland (77%) and Mashonaland West (77%).
• The second most common cause of losses was theft (15%) which was highest in Mashonaland East (26%) and Matabeleland North (21%).
• Losses of shoats due to drought were most common in Matabeleland South(36%) 98
Poultry Ownership
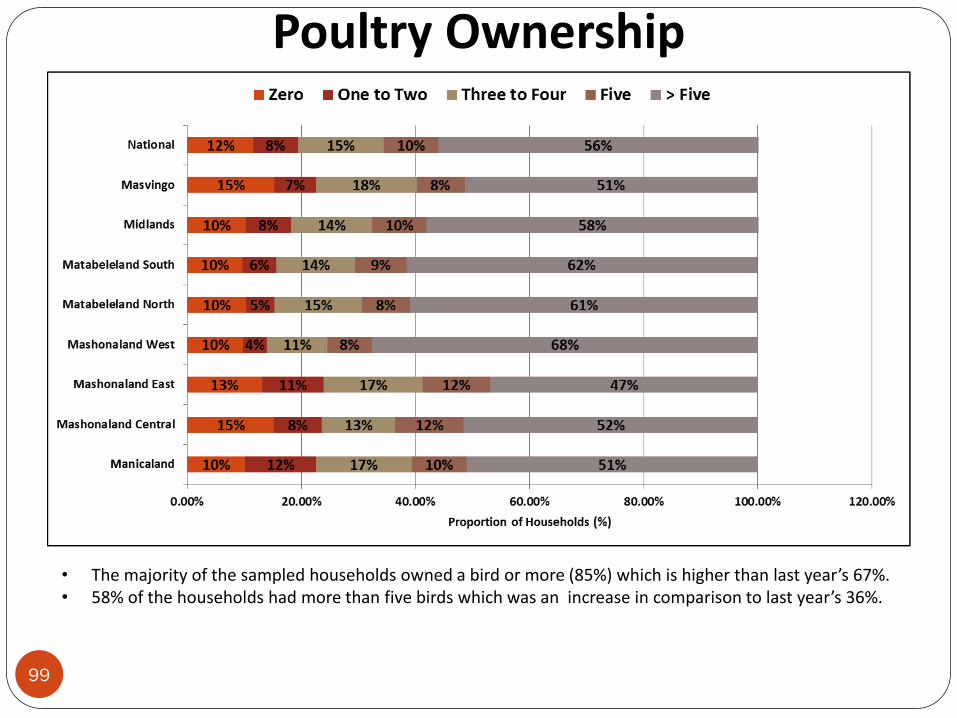
• The majority of the sampled households owned a bird or more (85%) which is higher than last year’s 67%. • 58% of the households had more than five birds which was an increase in comparison to last year’s 36%.
99
Poultry Increases
4.5 5.4
36.2
16.4
1.5 2.4 2.6 2.0
9.1
0.6 3.0
0.7
0.4
0.6 0.1 0.4 0.6
0.7
0.0
5.0
10.0
15.0
20.0
25.0
30.0
35.0
40.0
Manicaland MashonalandCentral
MashonalandEast
MashonalandWest
MatabelelandNorth
MatabelelandSouth
Midlands Masvingo National
Pro
po
rtio
n (
%)
Purchases NGO programmes
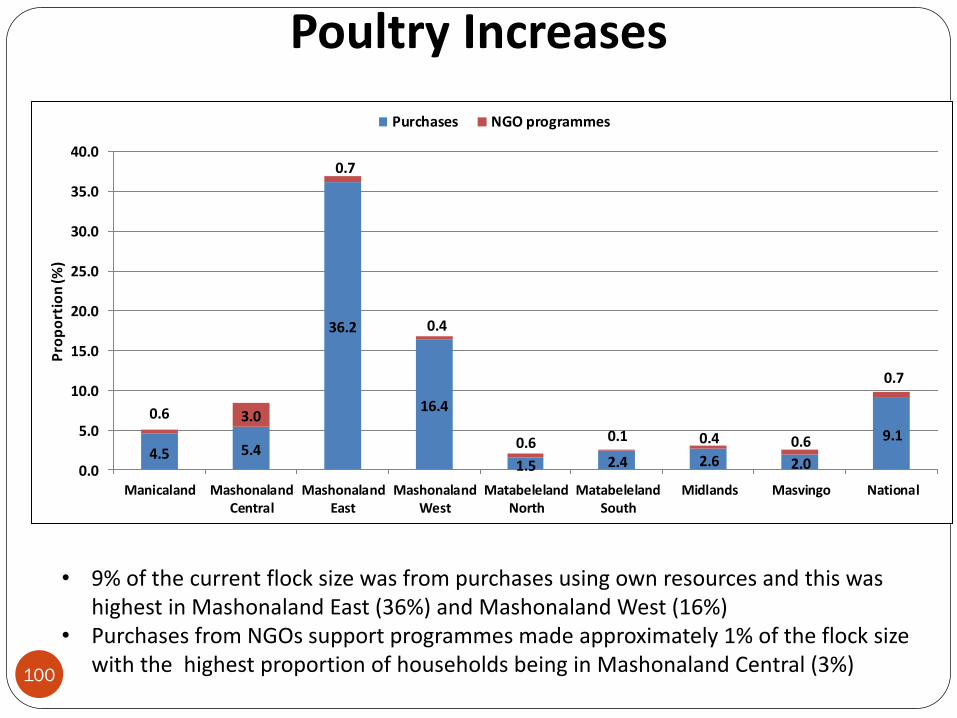
• 9% of the current flock size was from purchases using own resources and this was highest in Mashonaland East (36%) and Mashonaland West (16%)
• Purchases from NGOs support programmes made approximately 1% of the flock size with the highest proportion of households being in Mashonaland Central (3%)
100
Donkeys and Pigs
Approximately 6% of the households owned at least one pig.
Of the 6%, 50% owned one to two pigs, 33% owned 3 to 5 pigs and 17% owned more than five pigs.
Births were 36% and deaths were 14.4%.
Main reason for sale was to purchase food.
16% of the households owned at least one donkey.
Of those who owned donkeys and pigs, 56% owned one to three donkeys, 19% owned four donkeys and 25% owned more than four donkeys.
Deaths were 13% of the herd size and 45% of the deaths were due to drought and 2.7% were due to diseases.
101
To describe the socio-economic profiles of rural households in terms of such
characteristics as their food consumption patterns and consumption coping strategies
Household Consumption Patterns
Number of Meals Consumed by Children
6
37
44
13
5
37
46
12
0
5
10
15
20
25
30
35
40
45
50
1 2 3 4+
% o
f h
ou
seh
old
s
Number of meals
2012
2013
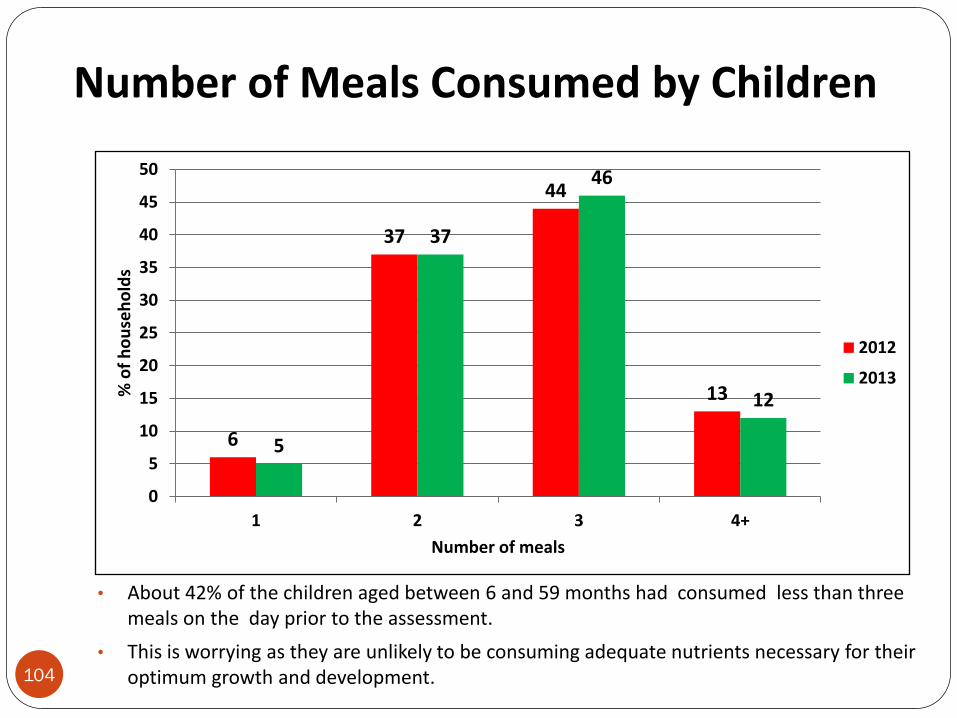
• About 42% of the children aged between 6 and 59 months had consumed less than three meals on the day prior to the assessment.
• This is worrying as they are unlikely to be consuming adequate nutrients necessary for their optimum growth and development. 104
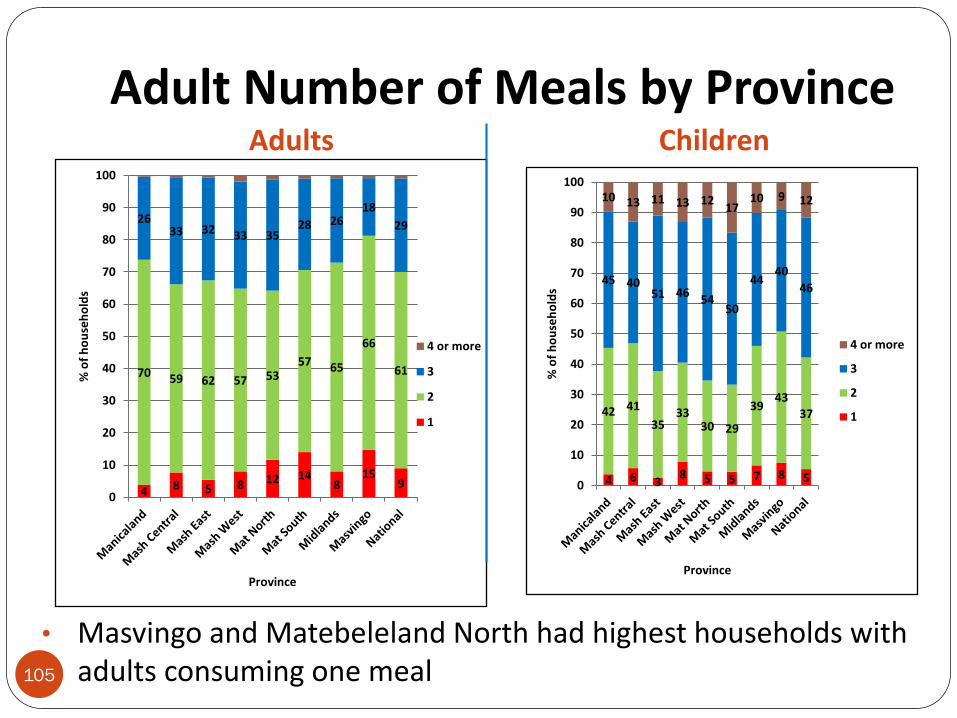
Adult Number of Meals by Province Adults Children
4 6 3 8 5 5 7 8 5
42 41
35 33
30 29
39 43
37
45 40 51 46
54 50
44 40
46
10 13 11 13 12 17
10 9 12
0
10
20
30
40
50
60
70
80
90
100
% o
f h
ou
seh
old
s
Province
4 or more
3
2
1
4 8 5 8 12 14 8
15 9
70 59 62 57 53 57 65
66
61
26 33 32 33 35
28 26 18
29
0
10
20
30
40
50
60
70
80
90
100
% o
f h
ou
seh
old
s
Province
4 or more
3
2
1
• Masvingo and Matebeleland North had highest households with adults consuming one meal 105
Household Dietary Diversity
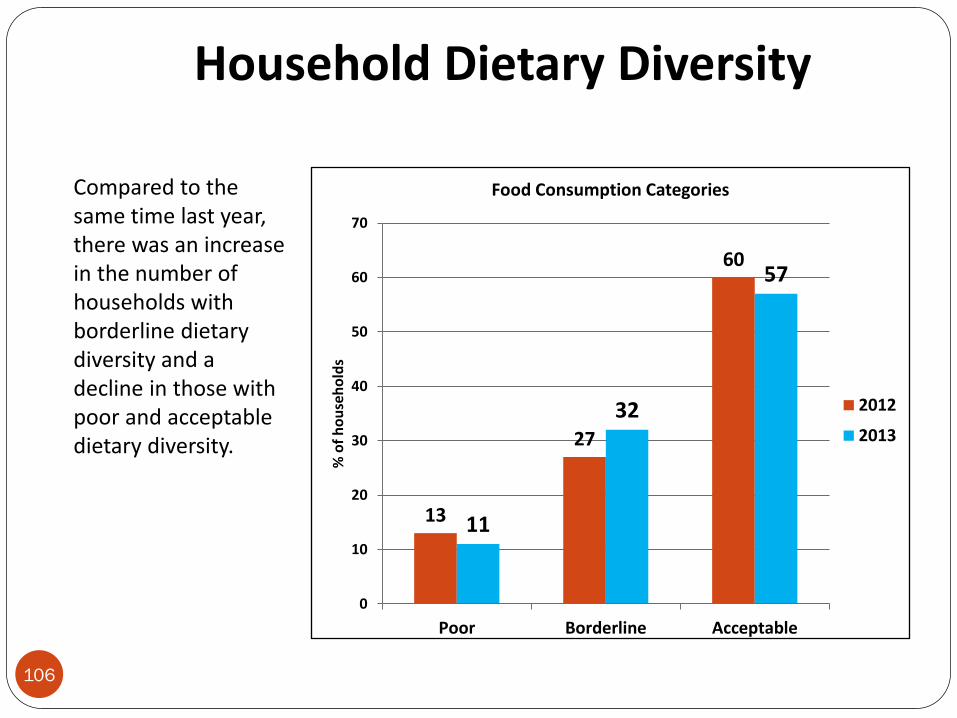
Compared to the same time last year, there was an increase in the number of households with borderline dietary diversity and a decline in those with poor and acceptable dietary diversity.
13
27
60
11
32
57
0
10
20
30
40
50
60
70
Poor Borderline Acceptable
% o
f h
ou
seh
old
s
Food Consumption Categories
2012
2013
106
Household Dietary Diversity by Province
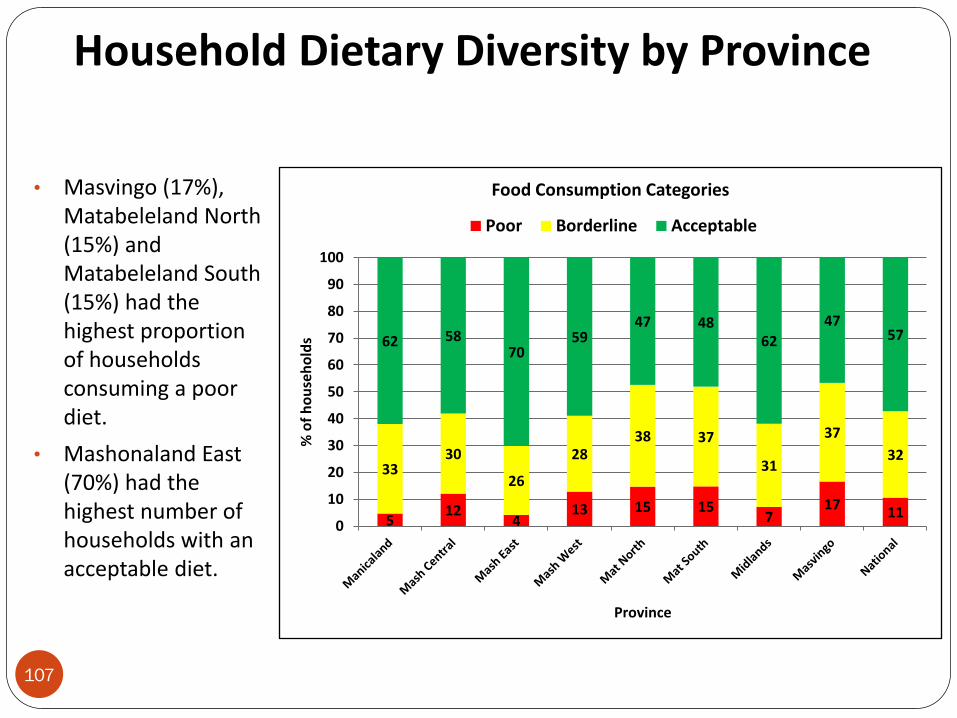
• Masvingo (17%), Matabeleland North (15%) and Matabeleland South (15%) had the highest proportion of households consuming a poor diet.
• Mashonaland East (70%) had the highest number of households with an acceptable diet.
5 12
4 13 15 15
7 17
11
33 30
26
28 38 37
31
37
32
62 58 70
59 47 48
62
47 57
0
10
20
30
40
50
60
70
80
90
100
% o
f h
ou
seh
old
s
Province
Food Consumption Categories
Poor Borderline Acceptable
107
Food Groups Consumed by Households in May 2013
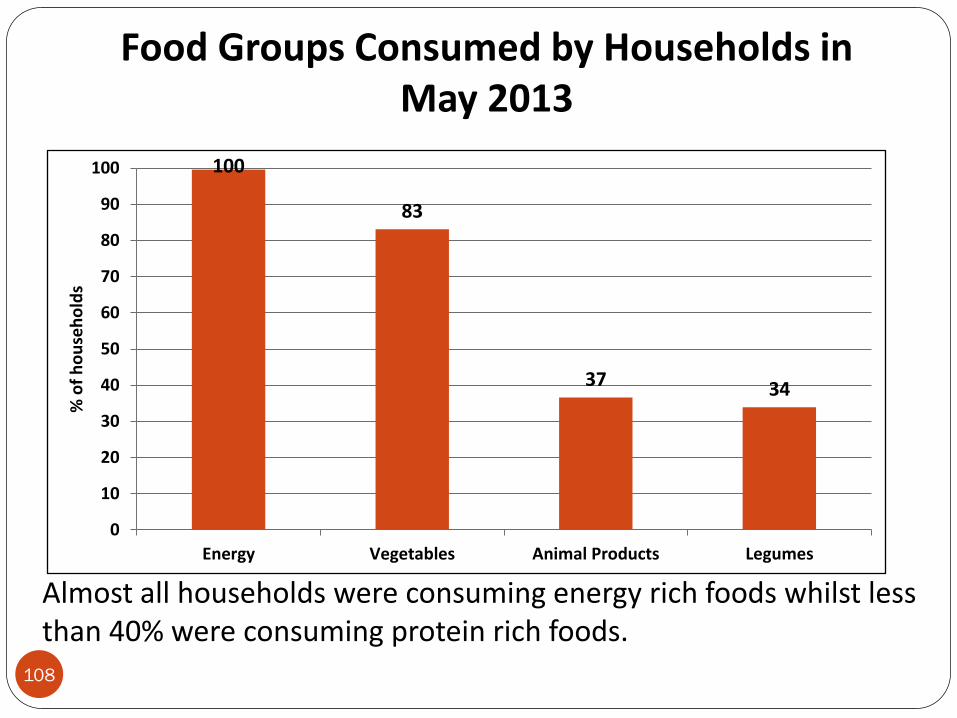
Almost all households were consuming energy rich foods whilst less than 40% were consuming protein rich foods.
100
83
37 34
0
10
20
30
40
50
60
70
80
90
100
Energy Vegetables Animal Products Legumes
% o
f h
ou
seh
old
s
108
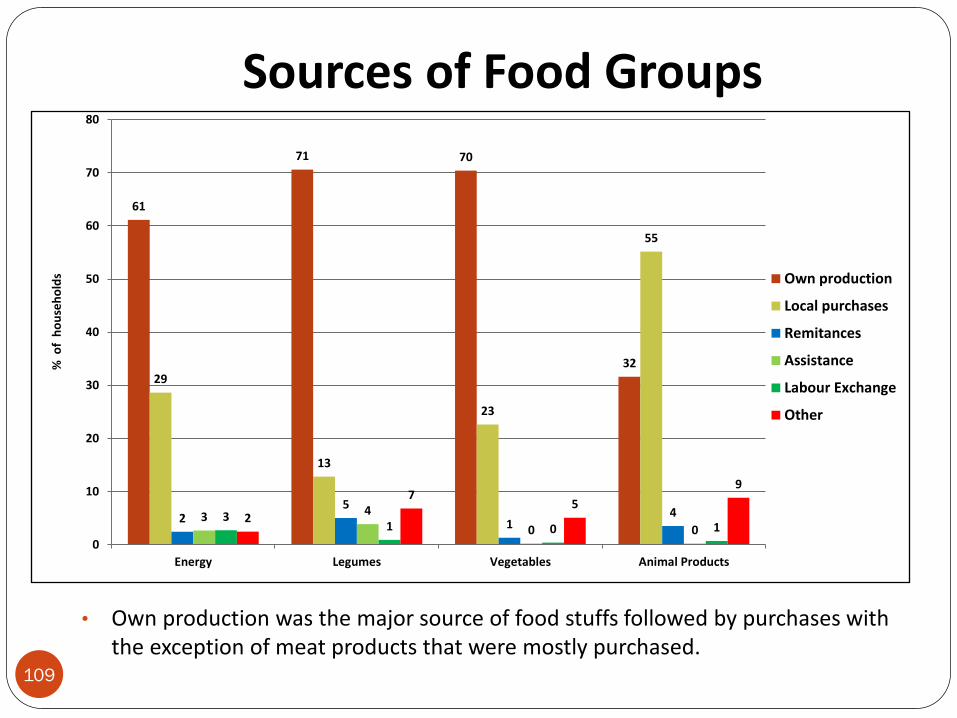
Sources of Food Groups
• Own production was the major source of food stuffs followed by purchases with the exception of meat products that were mostly purchased.
61
71 70
32 29
13
23
55
2 5
1 4 3 4
0 0 3
1 0 1 2
7 5
9
0
10
20
30
40
50
60
70
80
Energy Legumes Vegetables Animal Products
% o
f h
ou
seh
old
s Own production
Local purchases
Remitances
Assistance
Labour Exchange
Other
109
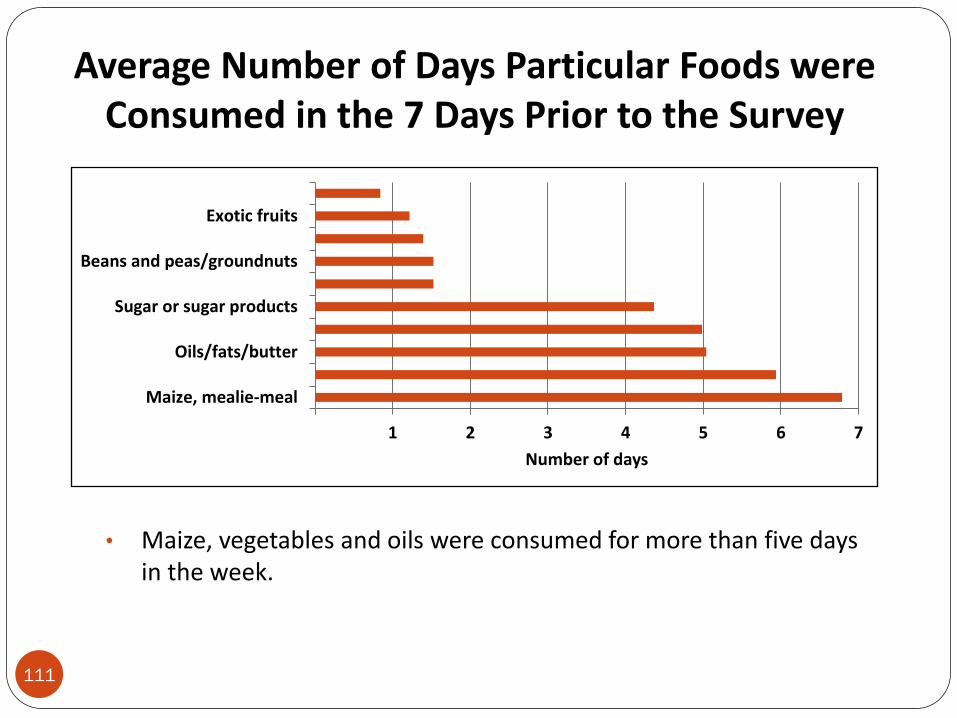
Average Number of Days Particular Foods were Consumed in the 7 Days Prior to the Survey
• Maize, vegetables and oils were consumed for more than five days in the week.
1 2 3 4 5 6 7
Maize, mealie-meal
Oils/fats/butter
Sugar or sugar products
Beans and peas/groundnuts
Exotic fruits
Number of days
111
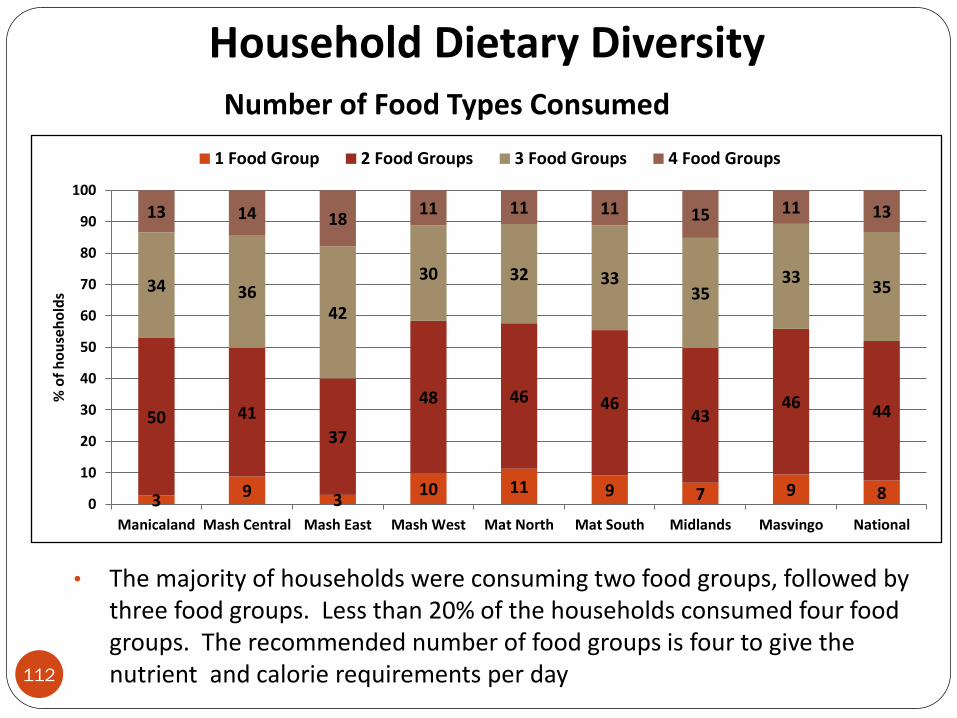
Household Dietary Diversity Number of Food Types Consumed
3 9 3
10 11 9 7 9 8
50 41
37
48 46 46 43
46 44
34 36 42
30 32 33 35
33 35
13 14 18 11 11 11 15 11 13
0
10
20
30
40
50
60
70
80
90
100
Manicaland Mash Central Mash East Mash West Mat North Mat South Midlands Masvingo National
% o
f h
ou
seh
old
s
1 Food Group 2 Food Groups 3 Food Groups 4 Food Groups
• The majority of households were consuming two food groups, followed by three food groups. Less than 20% of the households consumed four food groups. The recommended number of food groups is four to give the nutrient and calorie requirements per day 112
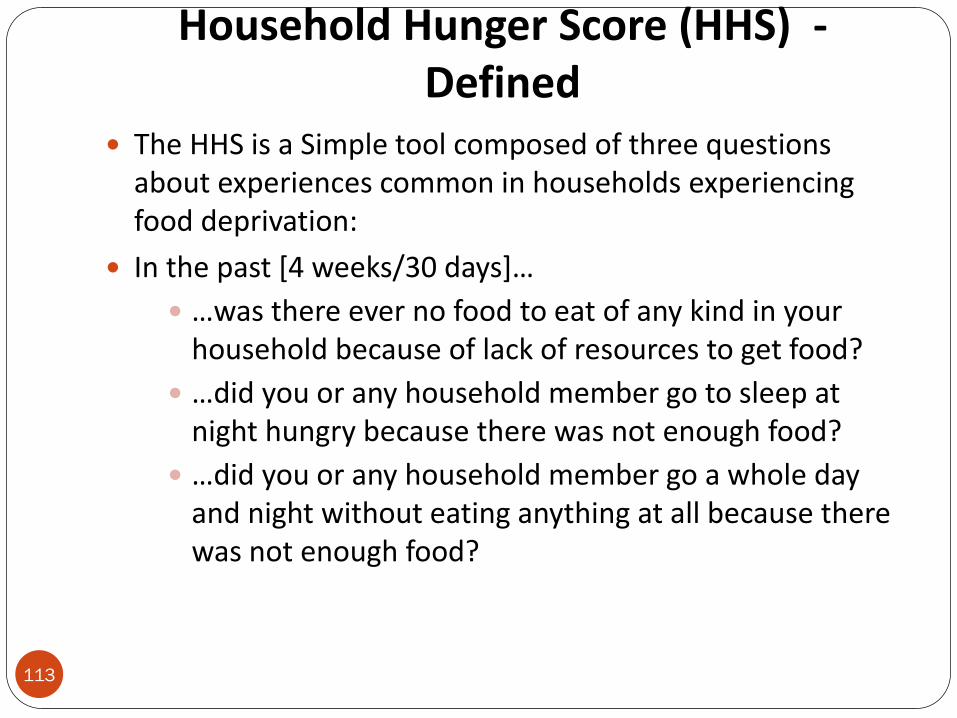
Household Hunger Score (HHS) - Defined
The HHS is a Simple tool composed of three questions about experiences common in households experiencing food deprivation:
In the past *4 weeks/30 days+…
…was there ever no food to eat of any kind in your household because of lack of resources to get food?
…did you or any household member go to sleep at night hungry because there was not enough food?
…did you or any household member go a whole day and night without eating anything at all because there was not enough food?
113
HHS – Definition Continued
114
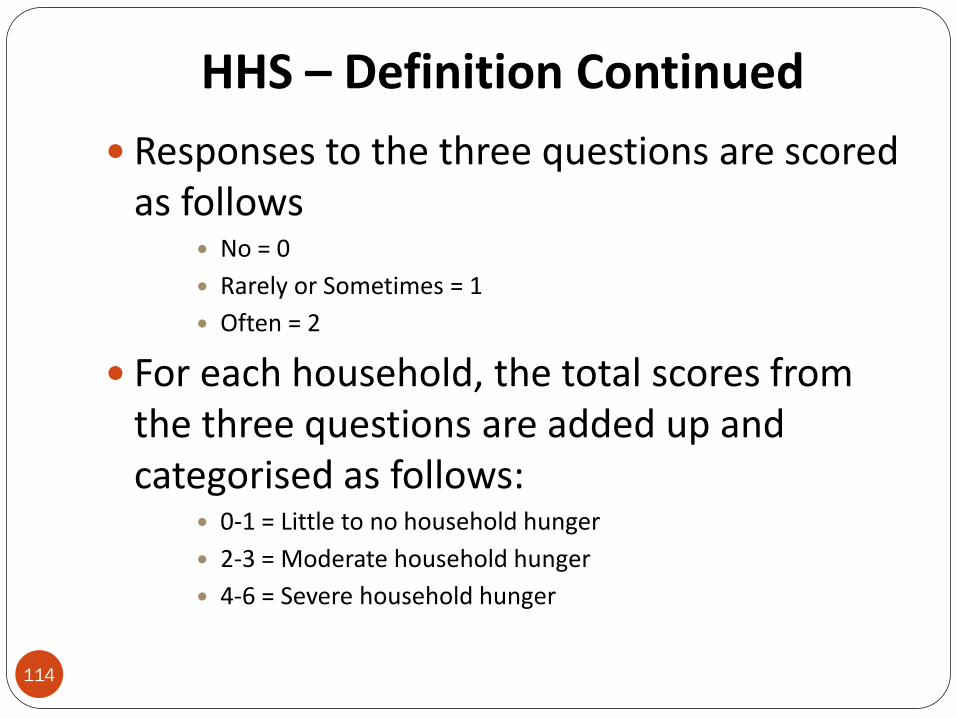
Responses to the three questions are scored as follows
No = 0
Rarely or Sometimes = 1
Often = 2
For each household, the total scores from the three questions are added up and categorised as follows:
0-1 = Little to no household hunger
2-3 = Moderate household hunger
4-6 = Severe household hunger
Household Hunger Scale
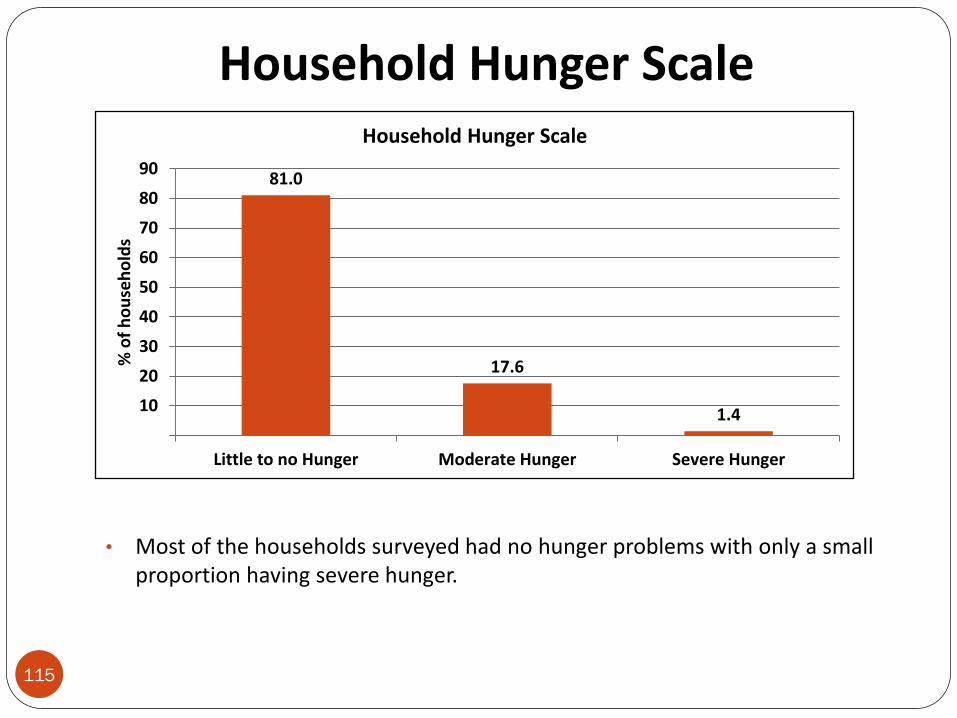
• Most of the households surveyed had no hunger problems with only a small proportion having severe hunger.
81.0
17.6
1.4 10
20
30
40
50
60
70
80
90
Little to no Hunger Moderate Hunger Severe Hunger
% o
f h
ou
seh
old
s Household Hunger Scale
115
Household Consumption Coping Strategy Index (CSI) Defined
116
A household is asked:
“how often it resorted to using each one of a set of 12 possible consumption coping strategies in the past 30days?”
Responses to each of the food consumption coping strategies could be:
never (1), seldom (2), sometimes (3), often (4) and daily (5)
The response codes are used to compute a household index, the CSI.
The assessment presents average CSIs for the last three Aprils.
Household Consumption Coping Strategy Index (CSI)
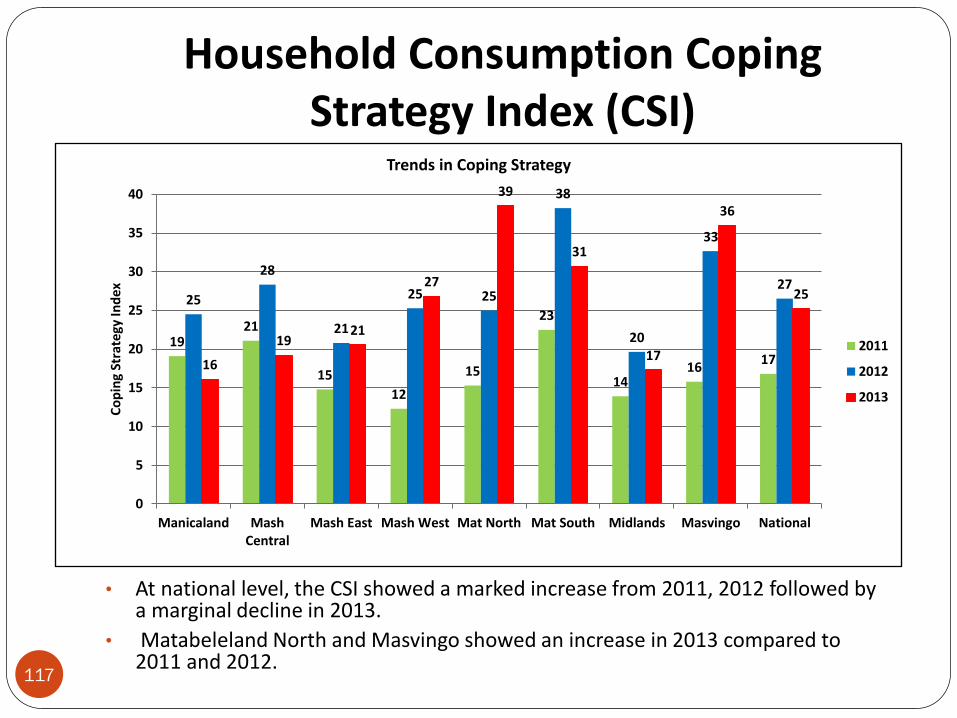
• At national level, the CSI showed a marked increase from 2011, 2012 followed by a marginal decline in 2013.
• Matabeleland North and Masvingo showed an increase in 2013 compared to 2011 and 2012.
19 21
15
12
15
23
14 16
17
25
28
21
25 25
38
20
33
27
16
19 21
27
39
31
17
36
25
0
5
10
15
20
25
30
35
40
Manicaland MashCentral
Mash East Mash West Mat North Mat South Midlands Masvingo National
Co
pin
g St
rate
gy In
de
x
Trends in Coping Strategy
2011
2012
2013
117
To determine the rural population that is likely to be food insecure in the 2013/14 consumption
year, their geographic distribution and the severity of their food insecurity
Food Security Situation
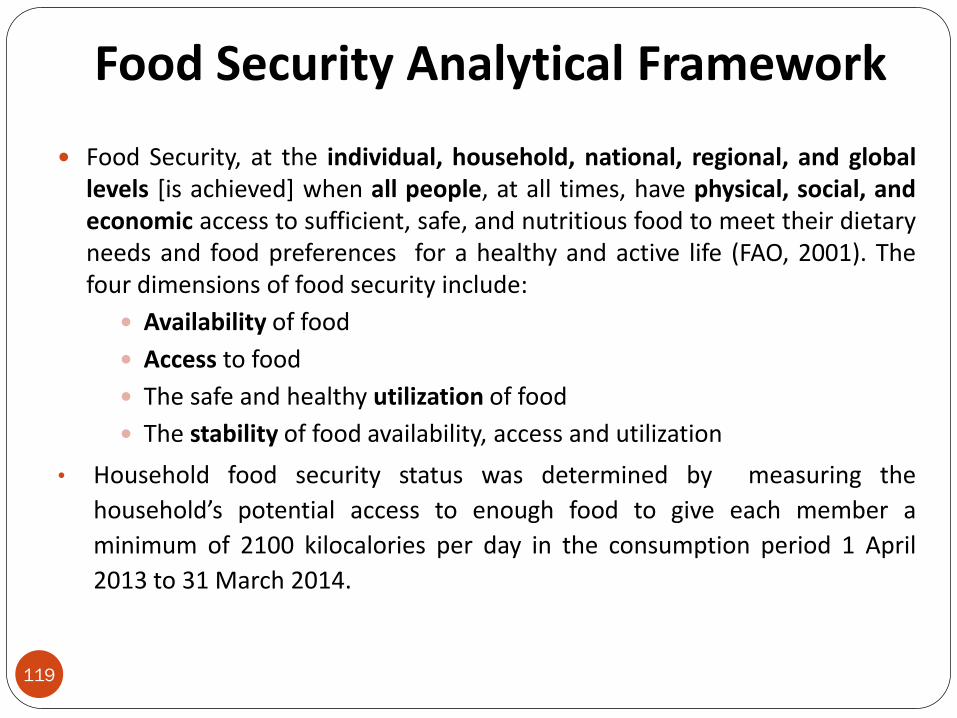
Food Security Analytical Framework
119
Food Security, at the individual, household, national, regional, and global levels [is achieved] when all people, at all times, have physical, social, and economic access to sufficient, safe, and nutritious food to meet their dietary needs and food preferences for a healthy and active life (FAO, 2001). The four dimensions of food security include:
Availability of food
Access to food
The safe and healthy utilization of food
The stability of food availability, access and utilization
• Household food security status was determined by measuring the
household’s potential access to enough food to give each member a
minimum of 2100 kilocalories per day in the consumption period 1 April
2013 to 31 March 2014.
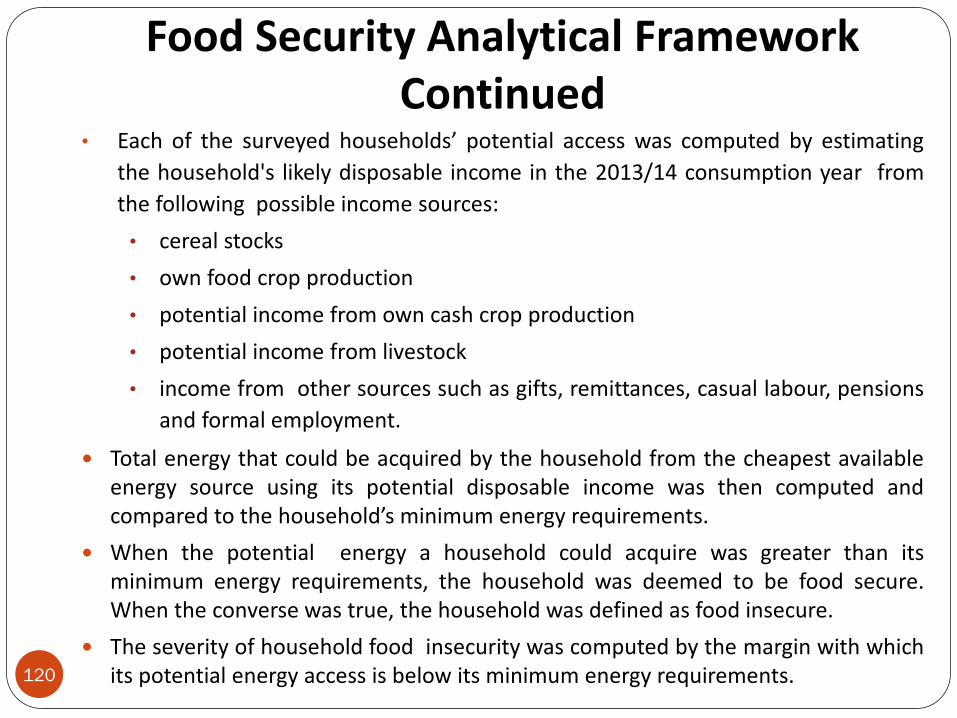
Food Security Analytical Framework Continued
• Each of the surveyed households’ potential access was computed by estimating
the household's likely disposable income in the 2013/14 consumption year from
the following possible income sources:
• cereal stocks
• own food crop production
• potential income from own cash crop production
• potential income from livestock
• income from other sources such as gifts, remittances, casual labour, pensions
and formal employment.
Total energy that could be acquired by the household from the cheapest available energy source using its potential disposable income was then computed and compared to the household’s minimum energy requirements.
When the potential energy a household could acquire was greater than its minimum energy requirements, the household was deemed to be food secure. When the converse was true, the household was defined as food insecure.
The severity of household food insecurity was computed by the margin with which its potential energy access is below its minimum energy requirements.
120
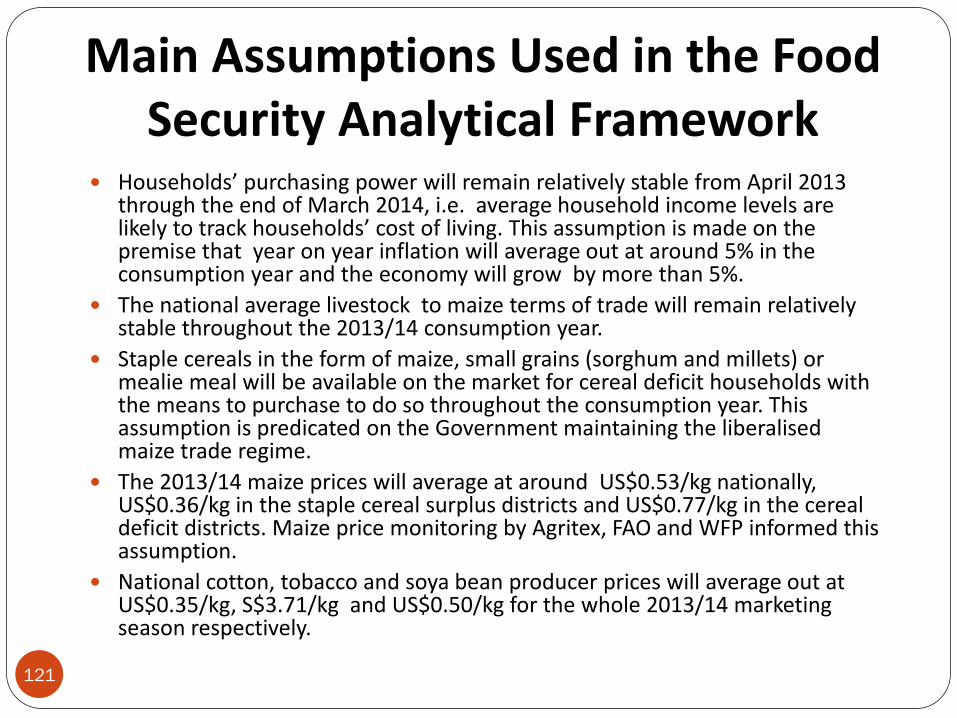
Main Assumptions Used in the Food Security Analytical Framework
121
Households’ purchasing power will remain relatively stable from April 2013 through the end of March 2014, i.e. average household income levels are likely to track households’ cost of living. This assumption is made on the premise that year on year inflation will average out at around 5% in the consumption year and the economy will grow by more than 5%.
The national average livestock to maize terms of trade will remain relatively stable throughout the 2013/14 consumption year.
Staple cereals in the form of maize, small grains (sorghum and millets) or mealie meal will be available on the market for cereal deficit households with the means to purchase to do so throughout the consumption year. This assumption is predicated on the Government maintaining the liberalised maize trade regime.
The 2013/14 maize prices will average at around US$0.53/kg nationally, US$0.36/kg in the staple cereal surplus districts and US$0.77/kg in the cereal deficit districts. Maize price monitoring by Agritex, FAO and WFP informed this assumption.
National cotton, tobacco and soya bean producer prices will average out at US$0.35/kg, S$3.71/kg and US$0.50/kg for the whole 2013/14 marketing season respectively.
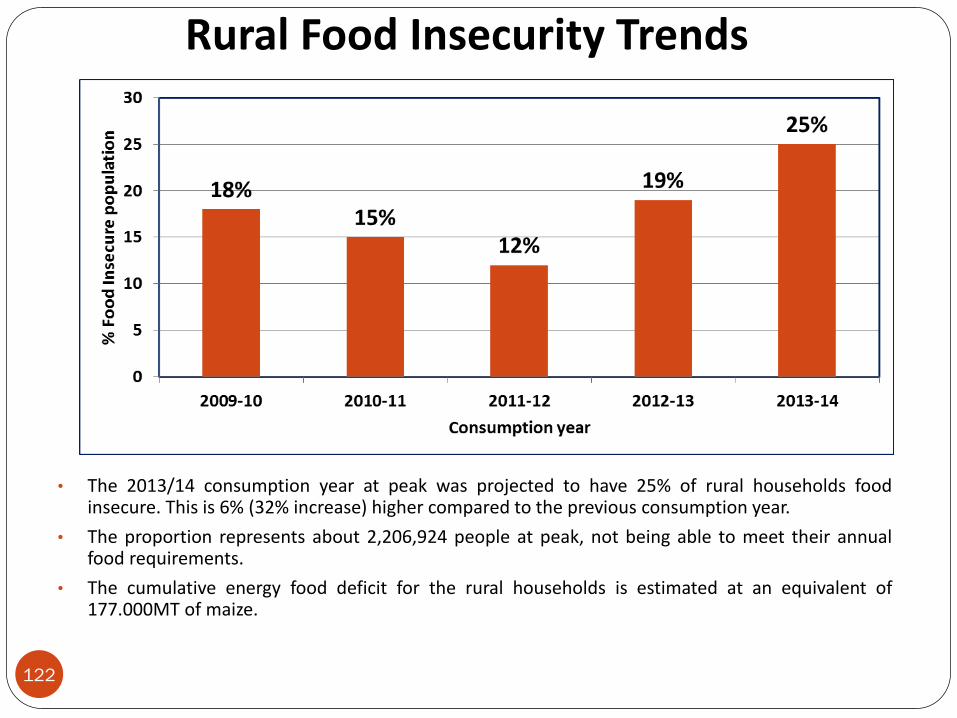
Rural Food Insecurity Trends
• The 2013/14 consumption year at peak was projected to have 25% of rural households food insecure. This is 6% (32% increase) higher compared to the previous consumption year.
• The proportion represents about 2,206,924 people at peak, not being able to meet their annual food requirements.
• The cumulative energy food deficit for the rural households is estimated at an equivalent of 177.000MT of maize.
122
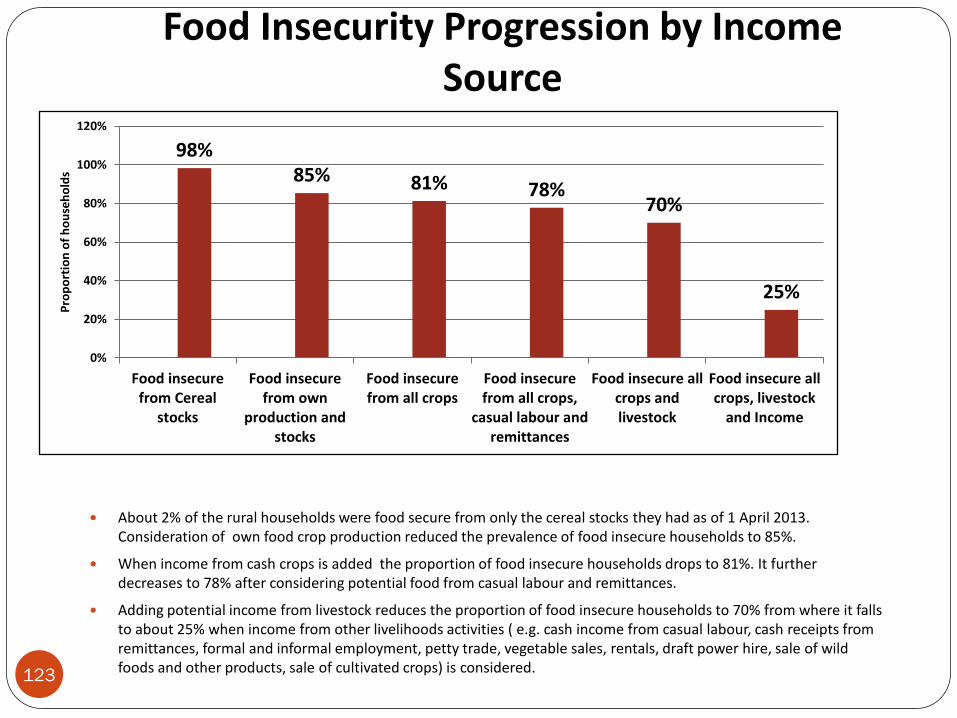
Food Insecurity Progression by Income Source
123
About 2% of the rural households were food secure from only the cereal stocks they had as of 1 April 2013. Consideration of own food crop production reduced the prevalence of food insecure households to 85%.
When income from cash crops is added the proportion of food insecure households drops to 81%. It further decreases to 78% after considering potential food from casual labour and remittances.
Adding potential income from livestock reduces the proportion of food insecure households to 70% from where it falls to about 25% when income from other livelihoods activities ( e.g. cash income from casual labour, cash receipts from remittances, formal and informal employment, petty trade, vegetable sales, rentals, draft power hire, sale of wild foods and other products, sale of cultivated crops) is considered.
98% 85% 81% 78%
70%
25%
0%
20%
40%
60%
80%
100%
120%
Food insecurefrom Cereal
stocks
Food insecurefrom own
production andstocks
Food insecurefrom all crops
Food insecurefrom all crops,
casual labour andremittances
Food insecure allcrops andlivestock
Food insecure allcrops, livestock
and Income
Pro
po
rtio
n o
f h
ou
seh
old
s
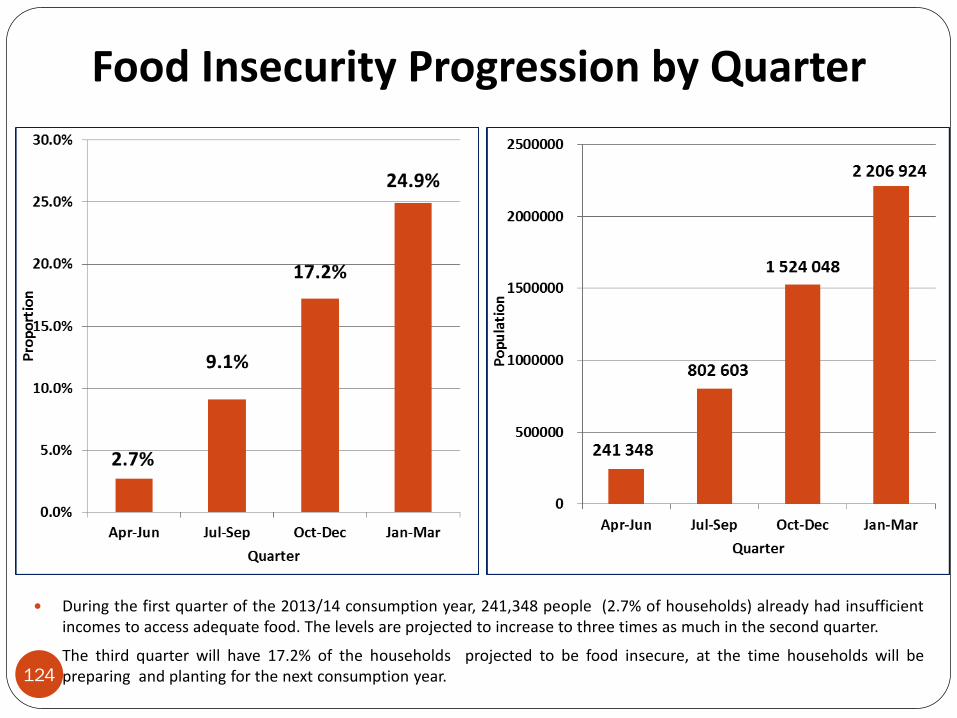
Food Insecurity Progression by Quarter
During the first quarter of the 2013/14 consumption year, 241,348 people (2.7% of households) already had insufficient incomes to access adequate food. The levels are projected to increase to three times as much in the second quarter.
The third quarter will have 17.2% of the households projected to be food insecure, at the time households will be preparing and planting for the next consumption year.
124
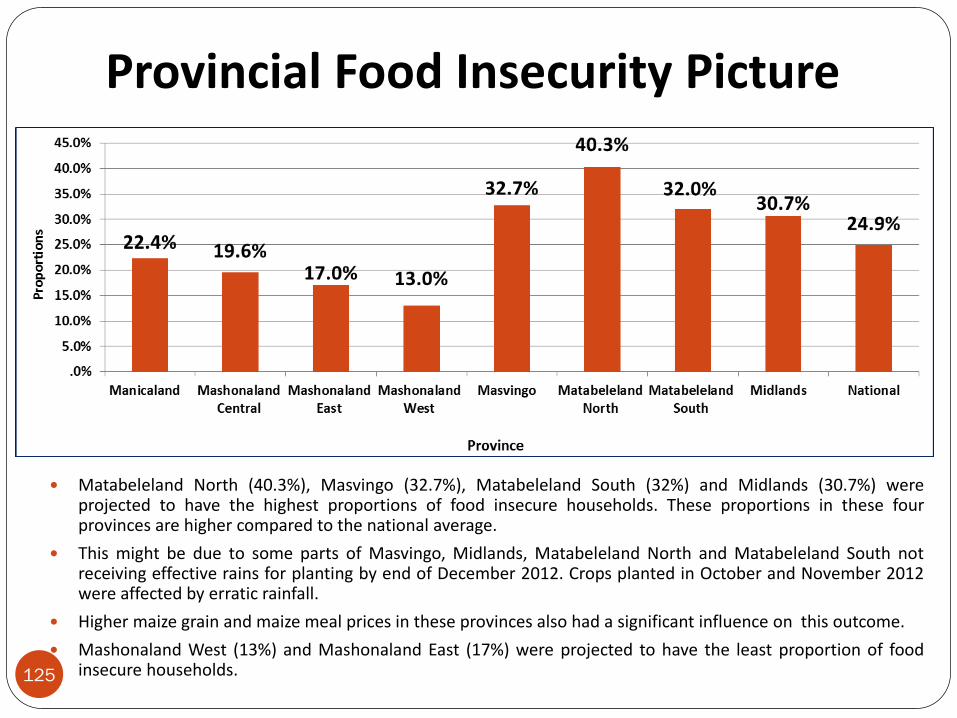
Provincial Food Insecurity Picture
Matabeleland North (40.3%), Masvingo (32.7%), Matabeleland South (32%) and Midlands (30.7%) were projected to have the highest proportions of food insecure households. These proportions in these four provinces are higher compared to the national average.
This might be due to some parts of Masvingo, Midlands, Matabeleland North and Matabeleland South not receiving effective rains for planting by end of December 2012. Crops planted in October and November 2012 were affected by erratic rainfall.
Higher maize grain and maize meal prices in these provinces also had a significant influence on this outcome.
Mashonaland West (13%) and Mashonaland East (17%) were projected to have the least proportion of food insecure households.
125
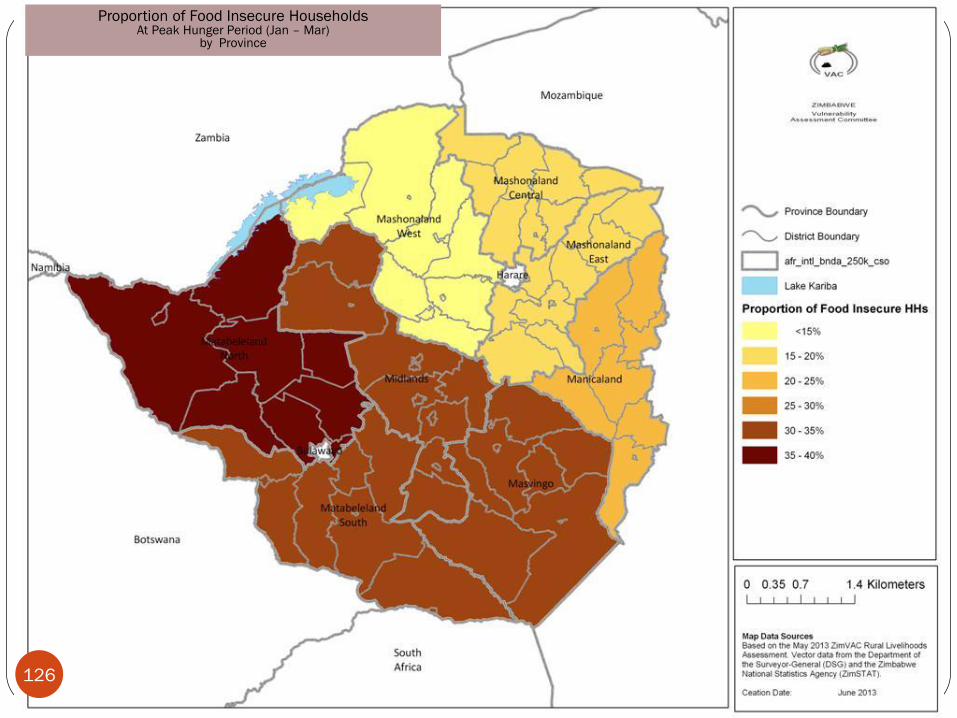
Proportion of Food Insecure Households At Peak Hunger Period (Jan – Mar)
by Province
126
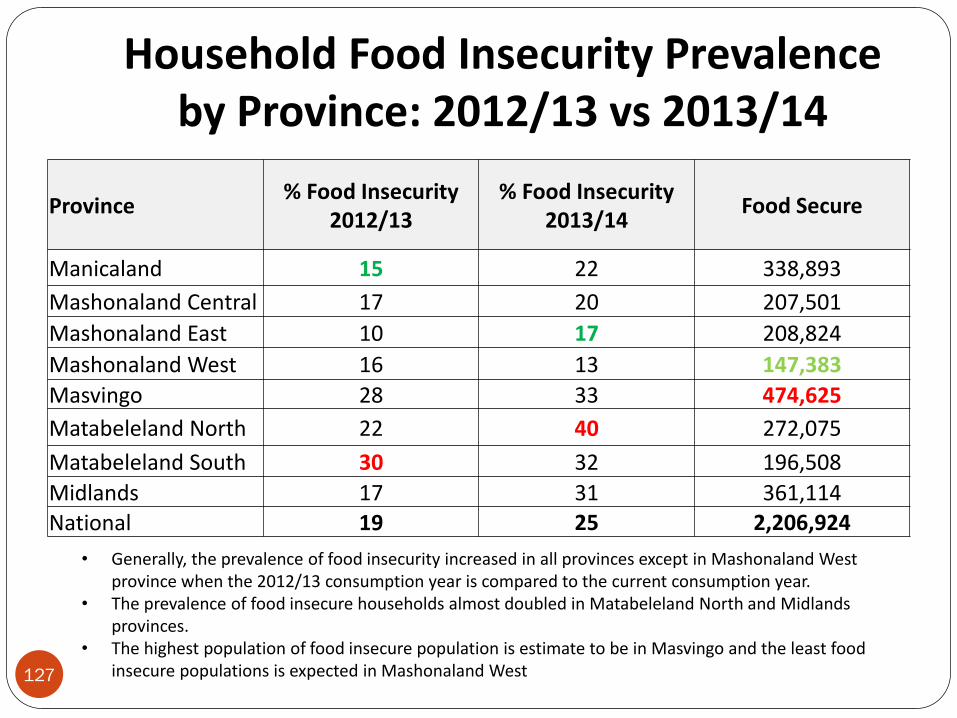
Province % Food Insecurity
2012/13 % Food Insecurity
2013/14 Food Secure
Manicaland 15 22 338,893
Mashonaland Central 17 20 207,501
Mashonaland East 10 17 208,824
Mashonaland West 16 13 147,383
Masvingo 28 33 474,625
Matabeleland North 22 40 272,075
Matabeleland South 30 32 196,508
Midlands 17 31 361,114 National 19 25 2,206,924
Household Food Insecurity Prevalence by Province: 2012/13 vs 2013/14
• Generally, the prevalence of food insecurity increased in all provinces except in Mashonaland West province when the 2012/13 consumption year is compared to the current consumption year.
• The prevalence of food insecure households almost doubled in Matabeleland North and Midlands provinces.
• The highest population of food insecure population is estimate to be in Masvingo and the least food insecure populations is expected in Mashonaland West 127
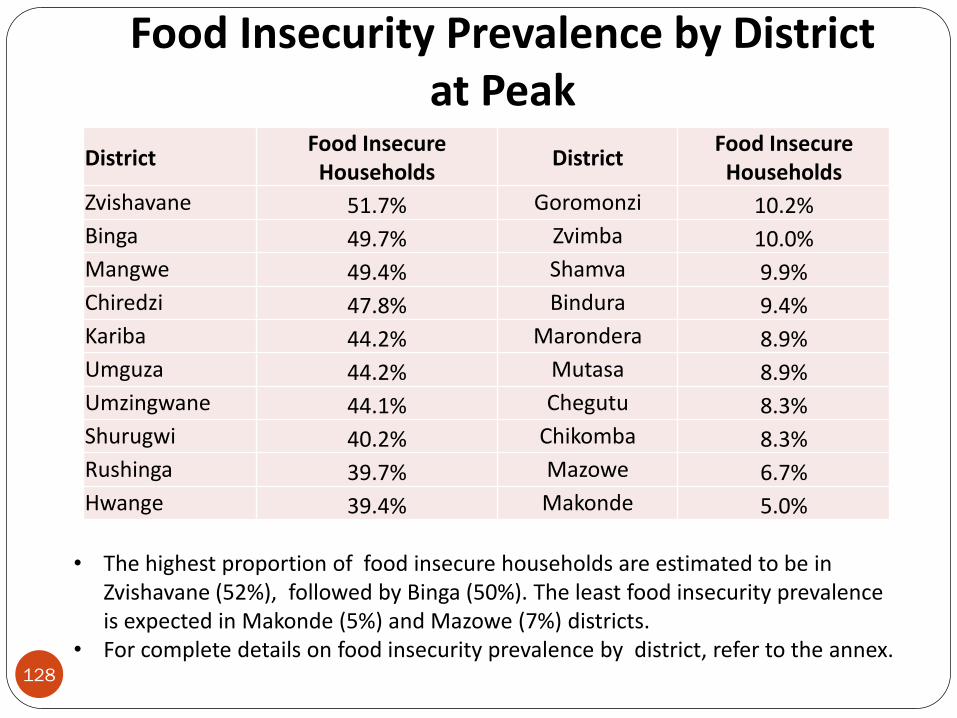
Food Insecurity Prevalence by District at Peak
• The highest proportion of food insecure households are estimated to be in Zvishavane (52%), followed by Binga (50%). The least food insecurity prevalence is expected in Makonde (5%) and Mazowe (7%) districts.
• For complete details on food insecurity prevalence by district, refer to the annex. 128
District Food Insecure
Households District
Food Insecure Households
Zvishavane 51.7% Goromonzi 10.2%
Binga 49.7% Zvimba 10.0%
Mangwe 49.4% Shamva 9.9%
Chiredzi 47.8% Bindura 9.4%
Kariba 44.2% Marondera 8.9%
Umguza 44.2% Mutasa 8.9%
Umzingwane 44.1% Chegutu 8.3%
Shurugwi 40.2% Chikomba 8.3%
Rushinga 39.7% Mazowe 6.7%
Hwange 39.4% Makonde 5.0%
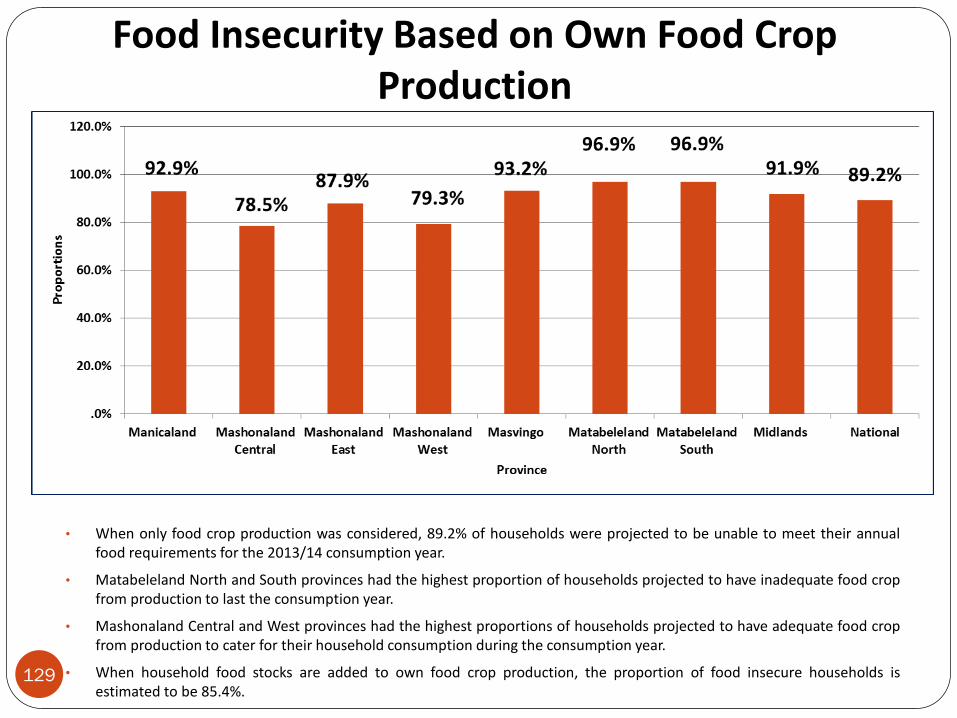
Food Insecurity Based on Own Food Crop Production
• When only food crop production was considered, 89.2% of households were projected to be unable to meet their annual food requirements for the 2013/14 consumption year.
• Matabeleland North and South provinces had the highest proportion of households projected to have inadequate food crop from production to last the consumption year.
• Mashonaland Central and West provinces had the highest proportions of households projected to have adequate food crop from production to cater for their household consumption during the consumption year.
• When household food stocks are added to own food crop production, the proportion of food insecure households is estimated to be 85.4%.
129
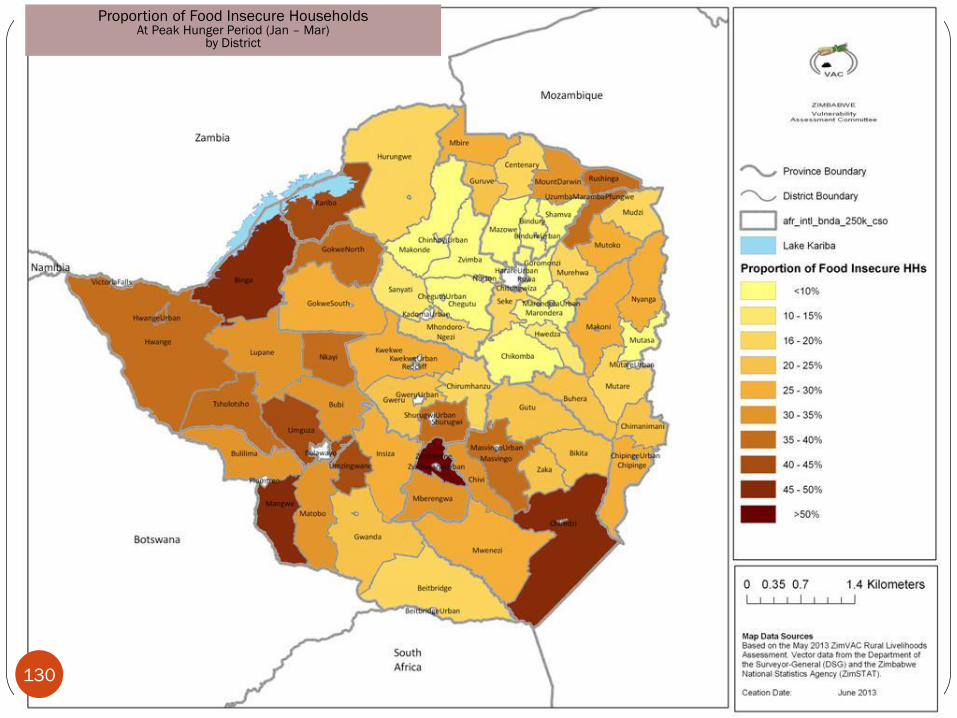
Proportion of Food Insecure Households At Peak Hunger Period (Jan – Mar)
by District
130
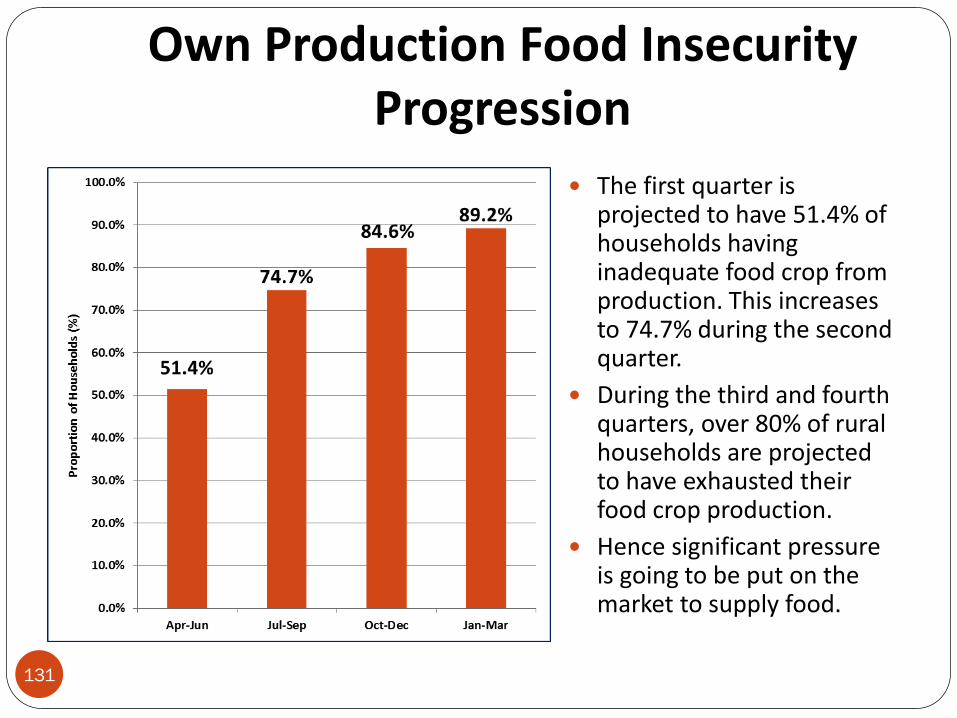
Own Production Food Insecurity Progression
The first quarter is projected to have 51.4% of households having inadequate food crop from production. This increases to 74.7% during the second quarter.
During the third and fourth quarters, over 80% of rural households are projected to have exhausted their food crop production.
Hence significant pressure is going to be put on the market to supply food.
131
To assess the relationship between household food insecurity and the nutritional status of children 6-59
months
Child Nutrition
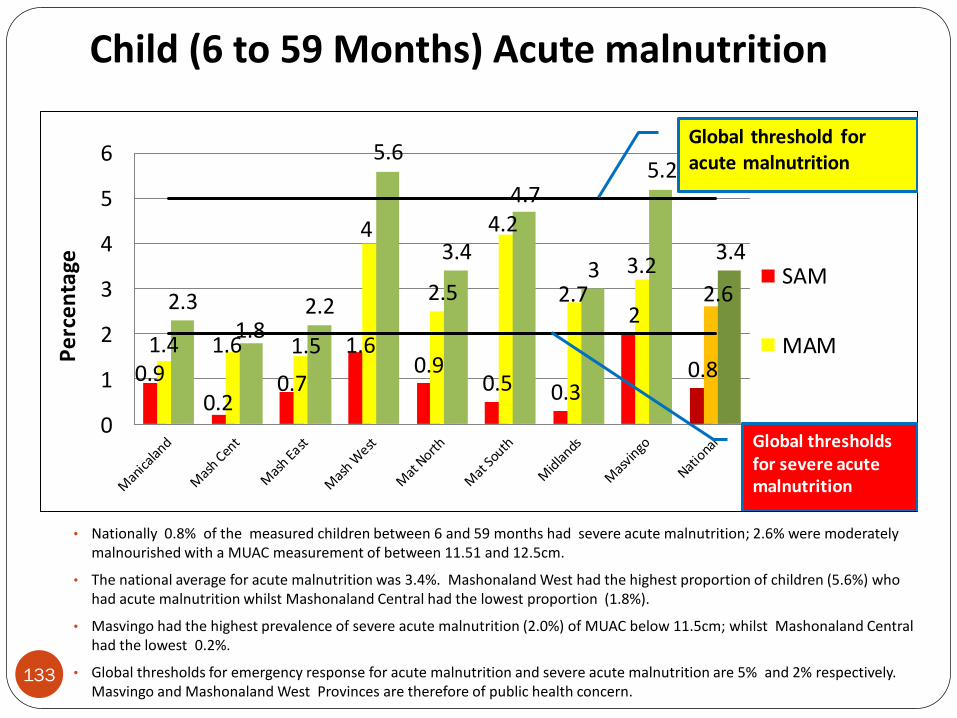
Child (6 to 59 Months) Acute malnutrition
• Nationally 0.8% of the measured children between 6 and 59 months had severe acute malnutrition; 2.6% were moderately malnourished with a MUAC measurement of between 11.51 and 12.5cm.
• The national average for acute malnutrition was 3.4%. Mashonaland West had the highest proportion of children (5.6%) who had acute malnutrition whilst Mashonaland Central had the lowest proportion (1.8%).
• Masvingo had the highest prevalence of severe acute malnutrition (2.0%) of MUAC below 11.5cm; whilst Mashonaland Central had the lowest 0.2%.
• Global thresholds for emergency response for acute malnutrition and severe acute malnutrition are 5% and 2% respectively. Masvingo and Mashonaland West Provinces are therefore of public health concern.
0.9 0.2
0.7
1.6 0.9
0.5 0.3
2
0.8 1.4 1.6 1.5
4
2.5
4.2
2.7 3.2
2.6 2.3 1.8
2.2
5.6
3.4
4.7
3
5.2
3.4
0
1
2
3
4
5
6
Pe
rce
nta
ge
SAM
MAM
Global threshold for acute malnutrition
Global thresholds for severe acute malnutrition
133
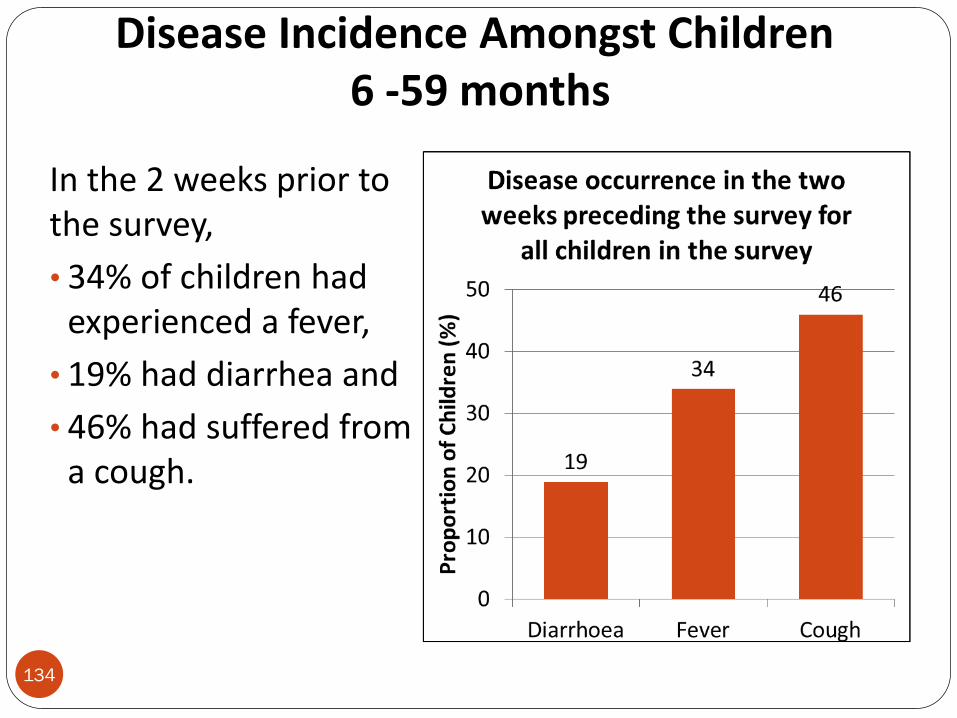
Disease Incidence Amongst Children 6 -59 months
In the 2 weeks prior to the survey,
• 34% of children had experienced a fever,
• 19% had diarrhea and
• 46% had suffered from a cough.
134
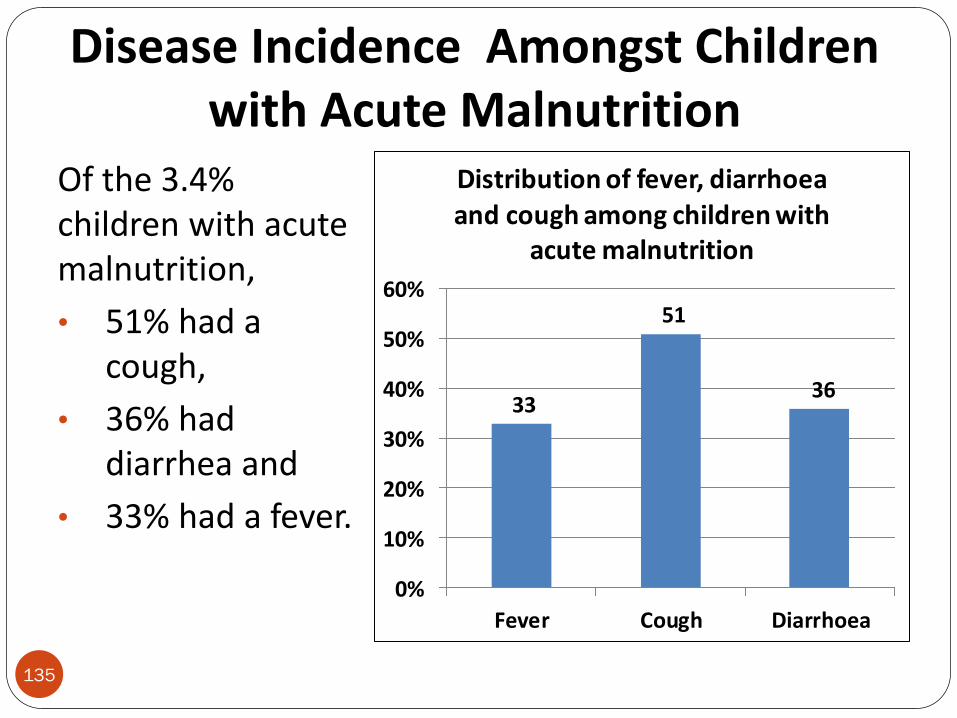
Disease Incidence Amongst Children with Acute Malnutrition
Of the 3.4% children with acute malnutrition,
• 51% had a cough,
• 36% had diarrhea and
• 33% had a fever.
33
51
36
0%
10%
20%
30%
40%
50%
60%
Fever Cough Diarrhoea
Distribution of fever, diarrhoea and cough among children with
acute malnutrition
135
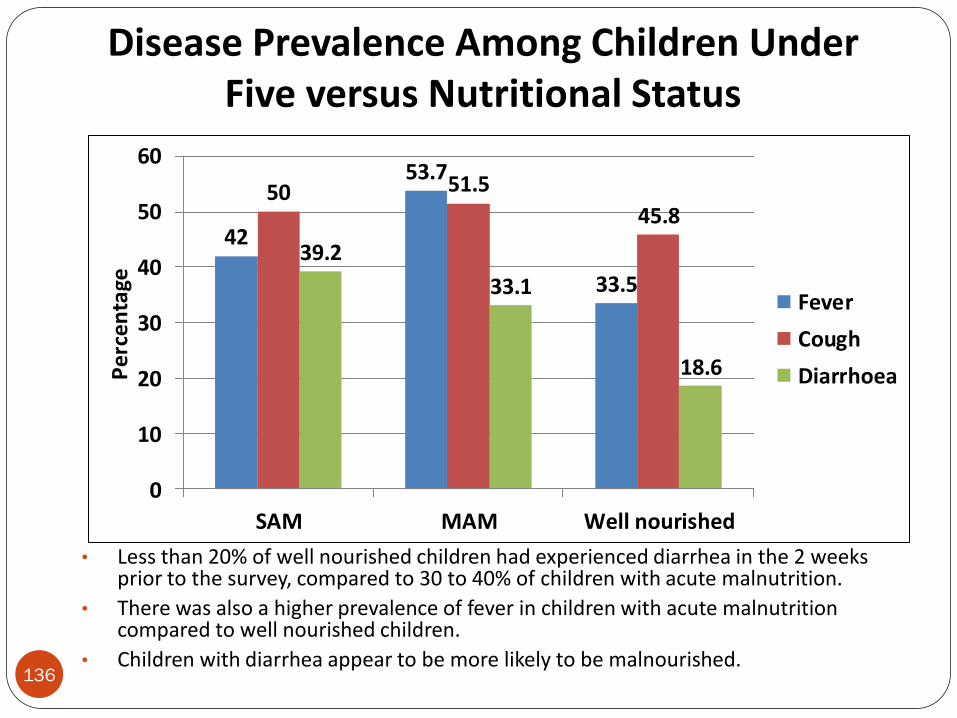
Disease Prevalence Among Children Under Five versus Nutritional Status
42
53.7
33.5
50 51.5
45.8
39.2
33.1
18.6
0
10
20
30
40
50
60
SAM MAM Well nourished
Pe
rce
nta
ge
Fever
Cough
Diarrhoea
• Less than 20% of well nourished children had experienced diarrhea in the 2 weeks prior to the survey, compared to 30 to 40% of children with acute malnutrition.
• There was also a higher prevalence of fever in children with acute malnutrition compared to well nourished children.
• Children with diarrhea appear to be more likely to be malnourished. 136
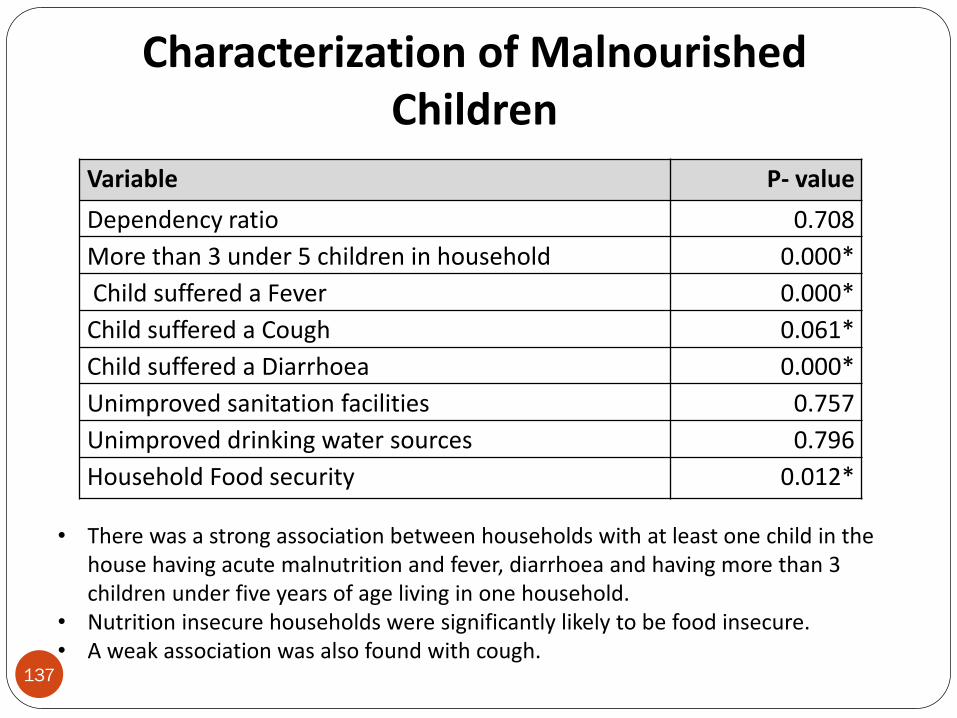
Characterization of Malnourished Children
Variable P- value
Dependency ratio 0.708
More than 3 under 5 children in household 0.000*
Child suffered a Fever 0.000*
Child suffered a Cough 0.061*
Child suffered a Diarrhoea 0.000*
Unimproved sanitation facilities 0.757
Unimproved drinking water sources 0.796
Household Food security 0.012*
• There was a strong association between households with at least one child in the house having acute malnutrition and fever, diarrhoea and having more than 3 children under five years of age living in one household.
• Nutrition insecure households were significantly likely to be food insecure. • A weak association was also found with cough.
137
To identify development priorities for rural communities in all rural provinces of the
country.
Community Activities to Address Food and Nutrition Security Challenges
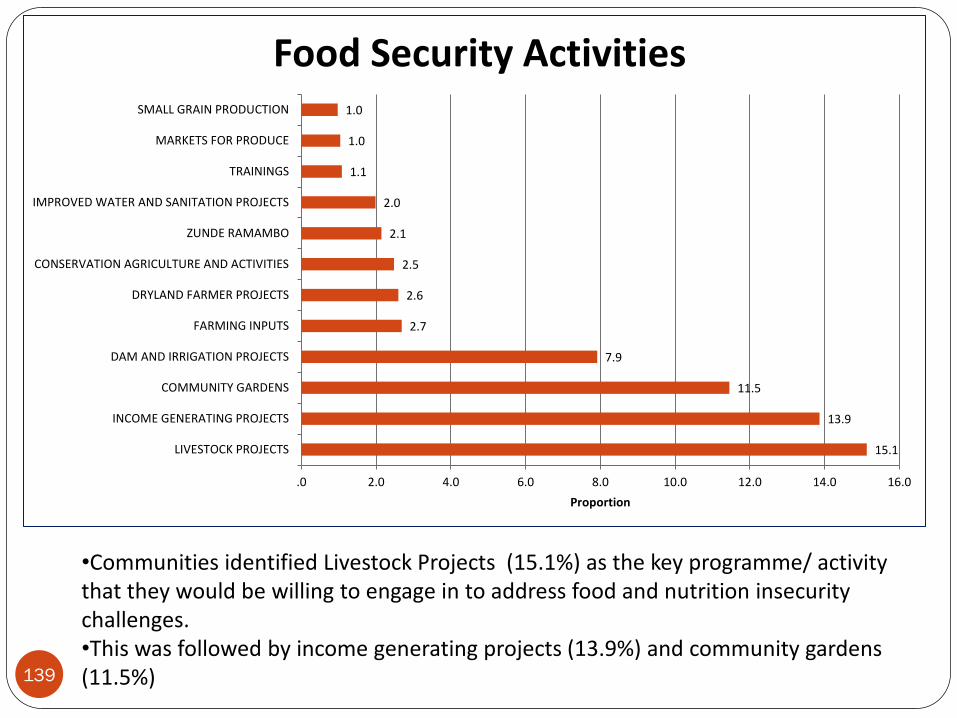
•Communities identified Livestock Projects (15.1%) as the key programme/ activity that they would be willing to engage in to address food and nutrition insecurity challenges. •This was followed by income generating projects (13.9%) and community gardens (11.5%)
15.1
13.9
11.5
7.9
2.7
2.6
2.5
2.1
2.0
1.1
1.0
1.0
.0 2.0 4.0 6.0 8.0 10.0 12.0 14.0 16.0
LIVESTOCK PROJECTS
INCOME GENERATING PROJECTS
COMMUNITY GARDENS
DAM AND IRRIGATION PROJECTS
FARMING INPUTS
DRYLAND FARMER PROJECTS
CONSERVATION AGRICULTURE AND ACTIVITIES
ZUNDE RAMAMBO
IMPROVED WATER AND SANITATION PROJECTS
TRAININGS
MARKETS FOR PRODUCE
SMALL GRAIN PRODUCTION
Proportion
Food Security Activities
139
To identify development priorities for rural communities in all rural provinces of the
country.
Community Livelihoods Challenges and Development Priorities
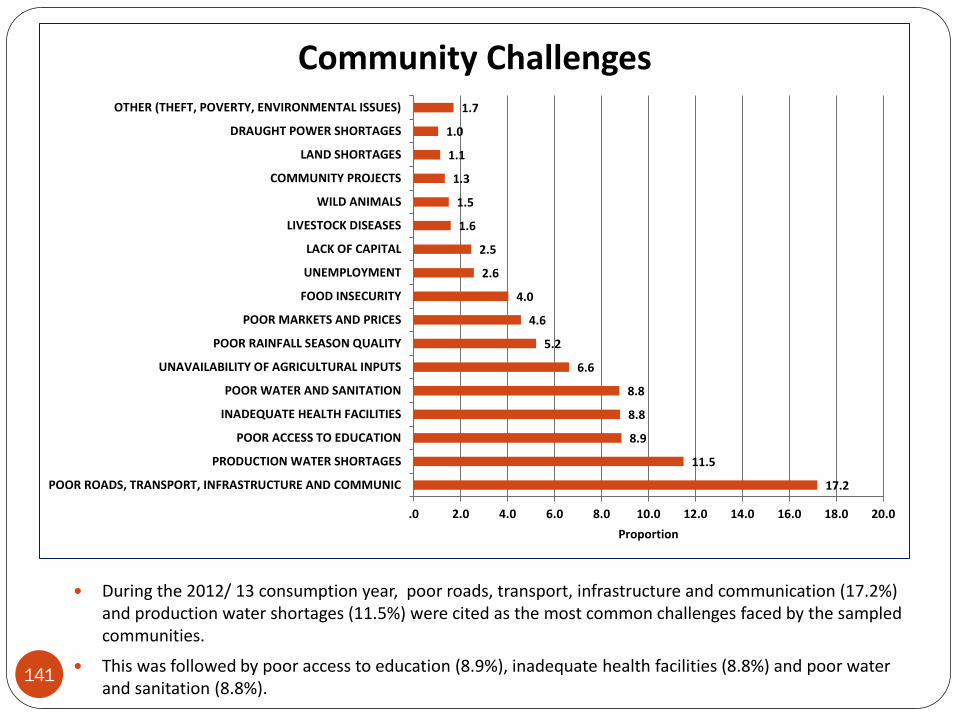
During the 2012/ 13 consumption year, poor roads, transport, infrastructure and communication (17.2%) and production water shortages (11.5%) were cited as the most common challenges faced by the sampled communities.
This was followed by poor access to education (8.9%), inadequate health facilities (8.8%) and poor water and sanitation (8.8%).
17.2
11.5
8.9
8.8
8.8
6.6
5.2
4.6
4.0
2.6
2.5
1.6
1.5
1.3
1.1
1.0
1.7
.0 2.0 4.0 6.0 8.0 10.0 12.0 14.0 16.0 18.0 20.0
POOR ROADS, TRANSPORT, INFRASTRUCTURE AND COMMUNIC
PRODUCTION WATER SHORTAGES
POOR ACCESS TO EDUCATION
INADEQUATE HEALTH FACILITIES
POOR WATER AND SANITATION
UNAVAILABILITY OF AGRICULTURAL INPUTS
POOR RAINFALL SEASON QUALITY
POOR MARKETS AND PRICES
FOOD INSECURITY
UNEMPLOYMENT
LACK OF CAPITAL
LIVESTOCK DISEASES
WILD ANIMALS
COMMUNITY PROJECTS
LAND SHORTAGES
DRAUGHT POWER SHORTAGES
OTHER (THEFT, POVERTY, ENVIRONMENTAL ISSUES)
Proportion
Community Challenges
141
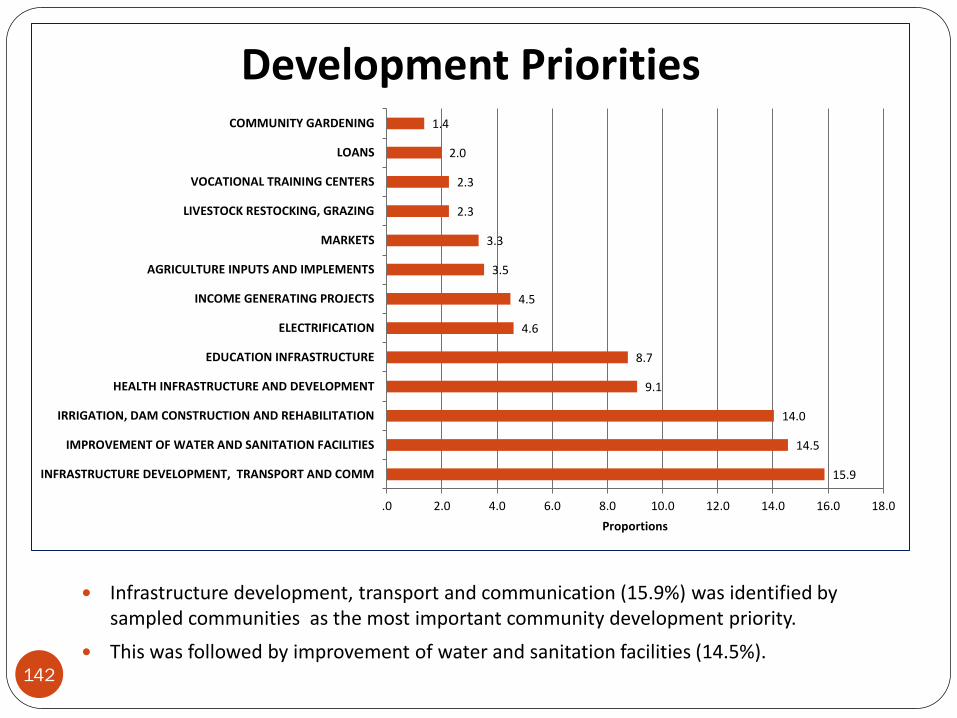
15.9
14.5
14.0
9.1
8.7
4.6
4.5
3.5
3.3
2.3
2.3
2.0
1.4
.0 2.0 4.0 6.0 8.0 10.0 12.0 14.0 16.0 18.0
INFRASTRUCTURE DEVELOPMENT, TRANSPORT AND COMM
IMPROVEMENT OF WATER AND SANITATION FACILITIES
IRRIGATION, DAM CONSTRUCTION AND REHABILITATION
HEALTH INFRASTRUCTURE AND DEVELOPMENT
EDUCATION INFRASTRUCTURE
ELECTRIFICATION
INCOME GENERATING PROJECTS
AGRICULTURE INPUTS AND IMPLEMENTS
MARKETS
LIVESTOCK RESTOCKING, GRAZING
VOCATIONAL TRAINING CENTERS
LOANS
COMMUNITY GARDENING
Proportions
Development Priorities
142
Infrastructure development, transport and communication (15.9%) was identified by sampled communities as the most important community development priority.
This was followed by improvement of water and sanitation facilities (14.5%).

Conclusions and Recommendations
About 3% of rural households are estimated to have insufficient means to meet their basic food requirements between April and June 2013. This proportion is projected to increase to 25% of the rural households in Zimbabwe by January 2014. Resources need to be urgently mobilized to address the immediate food insecurity problem while preparations to deal with the increased problem later in the consumption year are stepped up.
Given that the highest prevalence of food insecurity was recorded in Masvingo, Matabeleland South and Matabeleland North, these provinces should be prioritized in interventions to improve household food and nutrition security.
About 60% of the people will have to rely on the market to meet their food needs, it is therefore imperative to ensure that the markets have adequate food for those with sufficient incomes to purchase.
144
Conclusions and Recommendations
145
The price of maize is a critical factor in determining household food access in the consumption year. Not only does this need to be monitored closely but it needs to be stabilized and at best lowered as far as possible to increase household access.
The malnutrition levels in Mashonaland West and Masvingo Province require further assessment and action as they exceed national and global thresholds.
About 70% of rural households use safe water sources. Not only is this lower than the national MDG target of 85%, but only 11% of households that use water from unsafe sources treat it before use. Furthermore, only 33% of the rural households had access to improved sanitation facilities. This situation encourage poor nutritional outcomes and requires urgent attention in broader national nutrition strategy.
Conclusions and Recommendations
146
Conclusions and Recommendations
•It is worrying that 42 % of children under 5 were consuming 2 or fewer meals per day and therefore unlikely to access adequate nutrients necessary for their optimum growth. Therefore, nutrition programming for children should promote appropriate complementary feeding practices especially within the window of opportunity “6-23 months.” •Generally, foods consumed by rural households are of low diversity and largely unbalanced with a clear dominance of carbohydrates at the expense of protein rich foods, hence there is need to advocate and promote for the consumption of a balanced diet.
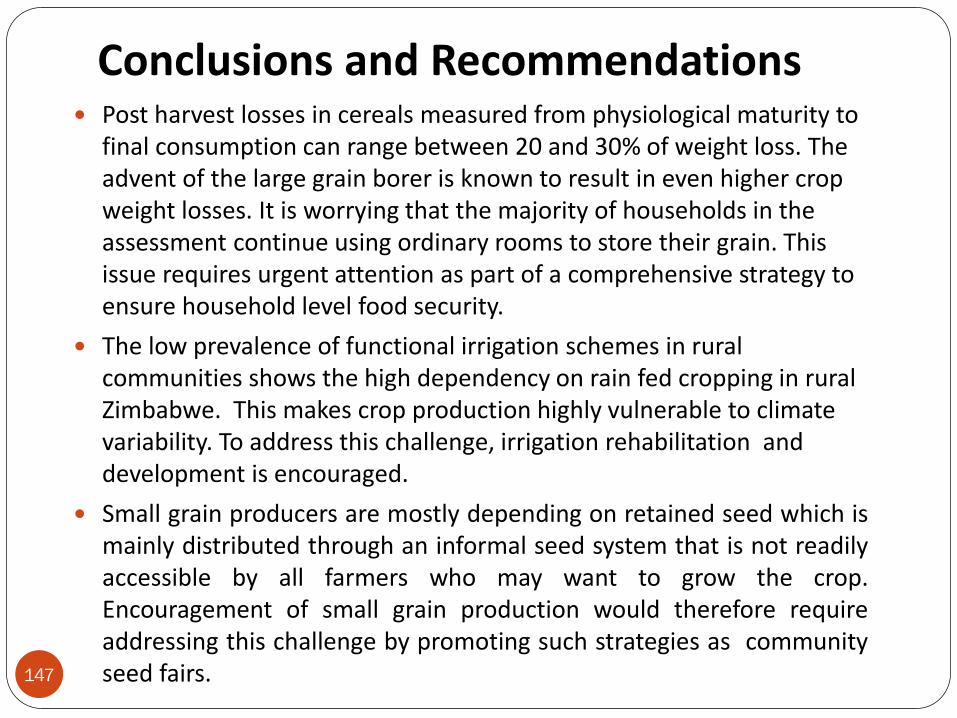
147
Post harvest losses in cereals measured from physiological maturity to final consumption can range between 20 and 30% of weight loss. The advent of the large grain borer is known to result in even higher crop weight losses. It is worrying that the majority of households in the assessment continue using ordinary rooms to store their grain. This issue requires urgent attention as part of a comprehensive strategy to ensure household level food security.
The low prevalence of functional irrigation schemes in rural communities shows the high dependency on rain fed cropping in rural Zimbabwe. This makes crop production highly vulnerable to climate variability. To address this challenge, irrigation rehabilitation and development is encouraged.
Small grain producers are mostly depending on retained seed which is mainly distributed through an informal seed system that is not readily accessible by all farmers who may want to grow the crop. Encouragement of small grain production would therefore require addressing this challenge by promoting such strategies as community seed fairs.
Conclusions and Recommendations
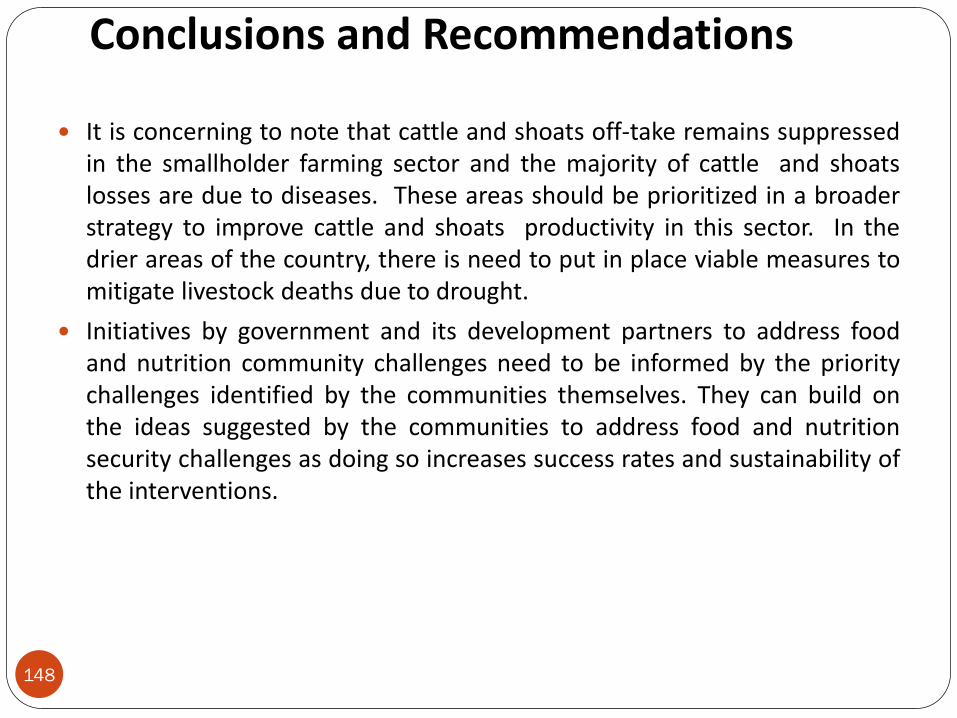
It is concerning to note that cattle and shoats off-take remains suppressed in the smallholder farming sector and the majority of cattle and shoats losses are due to diseases. These areas should be prioritized in a broader strategy to improve cattle and shoats productivity in this sector. In the drier areas of the country, there is need to put in place viable measures to mitigate livestock deaths due to drought.
Initiatives by government and its development partners to address food and nutrition community challenges need to be informed by the priority challenges identified by the communities themselves. They can build on the ideas suggested by the communities to address food and nutrition security challenges as doing so increases success rates and sustainability of the interventions.
148
Conclusions and Recommendations
Appendices 1 Food Insecurity by District- Tables
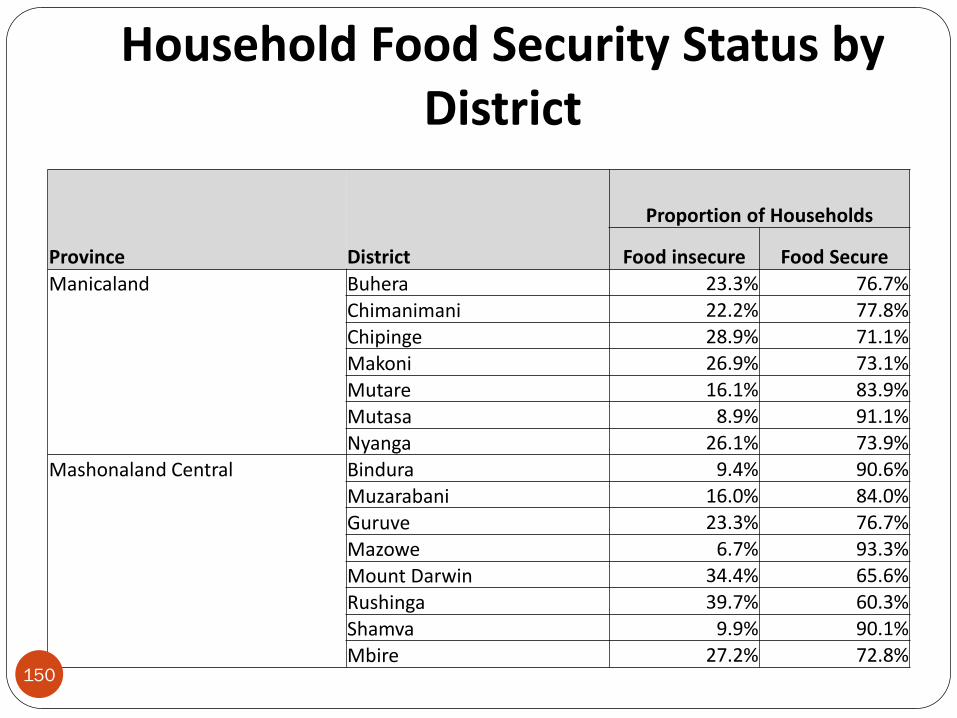
Household Food Security Status by District
Province District
Proportion of Households
Food insecure Food Secure
Manicaland Buhera 23.3% 76.7%
Chimanimani 22.2% 77.8%
Chipinge 28.9% 71.1%
Makoni 26.9% 73.1%
Mutare 16.1% 83.9%
Mutasa 8.9% 91.1%
Nyanga 26.1% 73.9%
Mashonaland Central Bindura 9.4% 90.6%
Muzarabani 16.0% 84.0%
Guruve 23.3% 76.7%
Mazowe 6.7% 93.3%
Mount Darwin 34.4% 65.6%
Rushinga 39.7% 60.3%
Shamva 9.9% 90.1%
Mbire 27.2% 72.8% 150
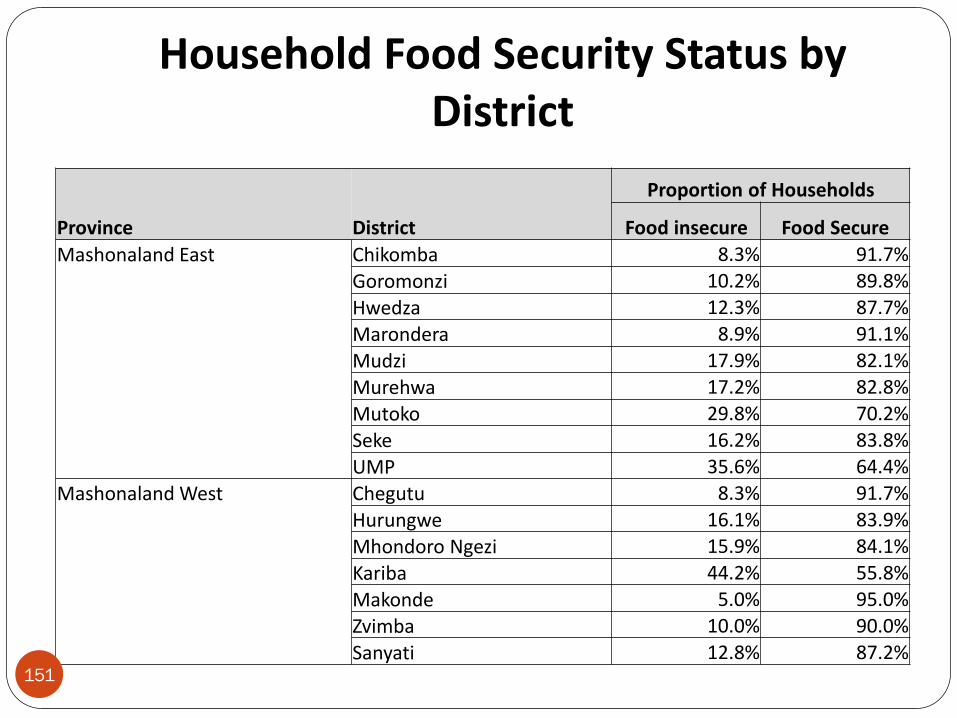
Household Food Security Status by District
Province District
Proportion of Households
Food insecure Food Secure
Mashonaland East Chikomba 8.3% 91.7%
Goromonzi 10.2% 89.8%
Hwedza 12.3% 87.7%
Marondera 8.9% 91.1%
Mudzi 17.9% 82.1%
Murehwa 17.2% 82.8%
Mutoko 29.8% 70.2%
Seke 16.2% 83.8%
UMP 35.6% 64.4%
Mashonaland West Chegutu 8.3% 91.7%
Hurungwe 16.1% 83.9%
Mhondoro Ngezi 15.9% 84.1%
Kariba 44.2% 55.8%
Makonde 5.0% 95.0%
Zvimba 10.0% 90.0%
Sanyati 12.8% 87.2% 151
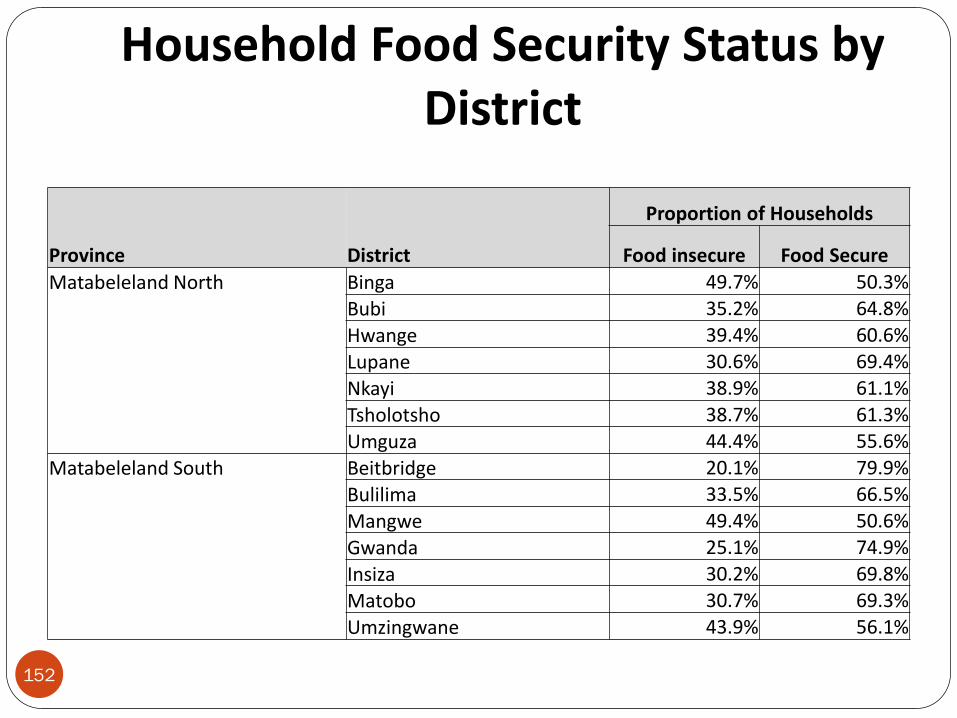
Household Food Security Status by District
Province District
Proportion of Households
Food insecure Food Secure
Matabeleland North Binga 49.7% 50.3%
Bubi 35.2% 64.8%
Hwange 39.4% 60.6%
Lupane 30.6% 69.4%
Nkayi 38.9% 61.1%
Tsholotsho 38.7% 61.3%
Umguza 44.4% 55.6%
Matabeleland South Beitbridge 20.1% 79.9%
Bulilima 33.5% 66.5%
Mangwe 49.4% 50.6%
Gwanda 25.1% 74.9%
Insiza 30.2% 69.8%
Matobo 30.7% 69.3%
Umzingwane 43.9% 56.1%
152
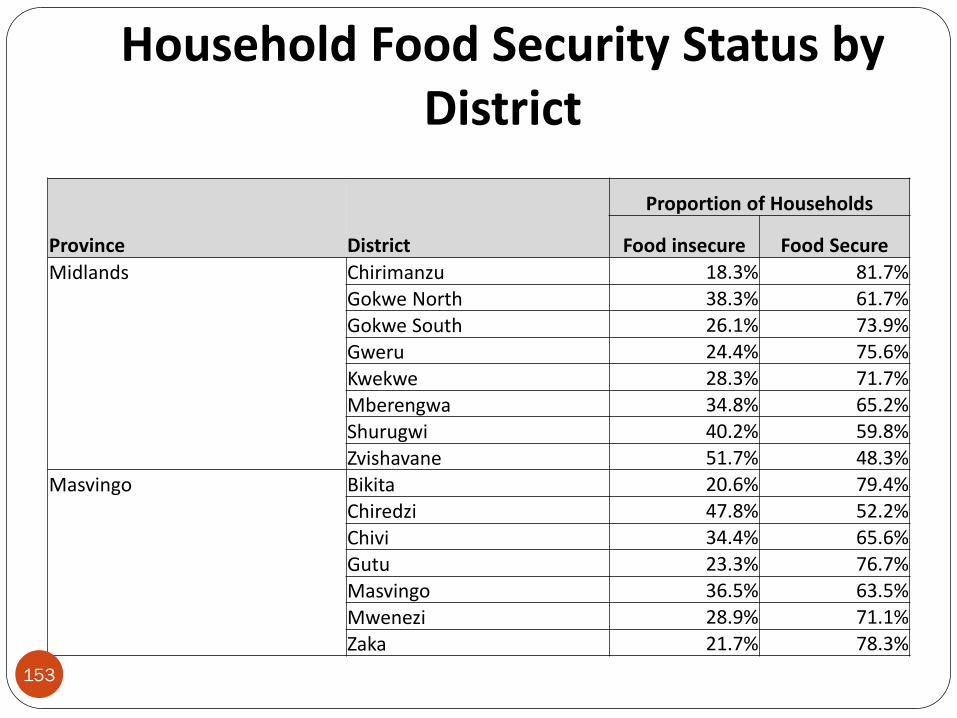
Household Food Security Status by District
Province District
Proportion of Households
Food insecure Food Secure
Midlands Chirimanzu 18.3% 81.7%
Gokwe North 38.3% 61.7%
Gokwe South 26.1% 73.9%
Gweru 24.4% 75.6%
Kwekwe 28.3% 71.7%
Mberengwa 34.8% 65.2%
Shurugwi 40.2% 59.8%
Zvishavane 51.7% 48.3%
Masvingo Bikita 20.6% 79.4%
Chiredzi 47.8% 52.2%
Chivi 34.4% 65.6%
Gutu 23.3% 76.7%
Masvingo 36.5% 63.5%
Mwenezi 28.9% 71.1%
Zaka 21.7% 78.3%
153
Appendix 2
Relative Food insecurity Maps by Province and District
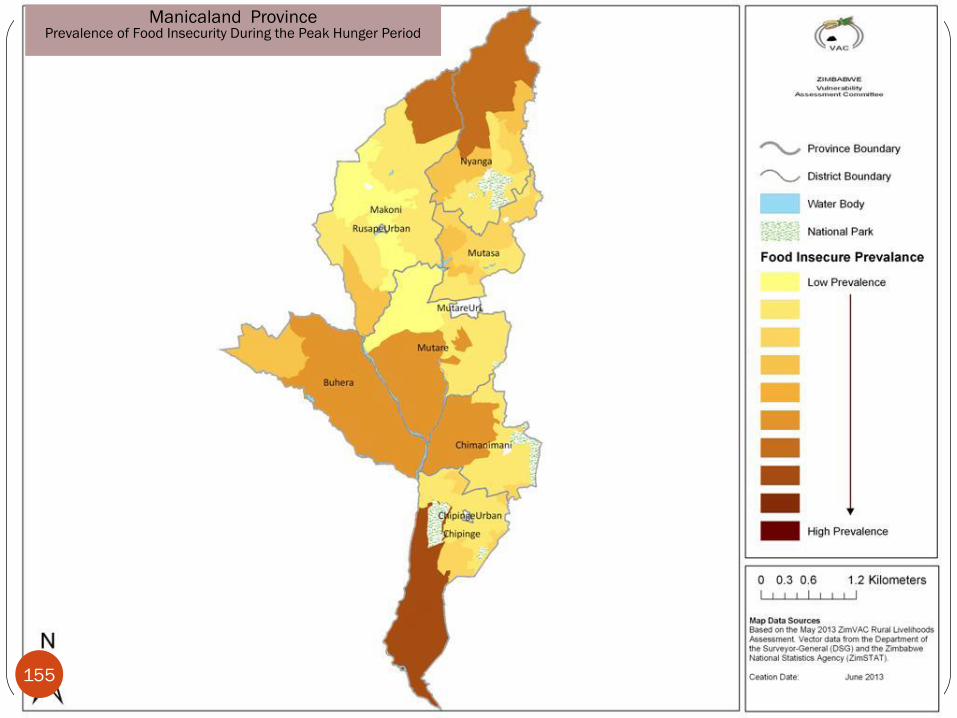
Manicaland Province Prevalence of Food Insecurity During the Peak Hunger Period
155
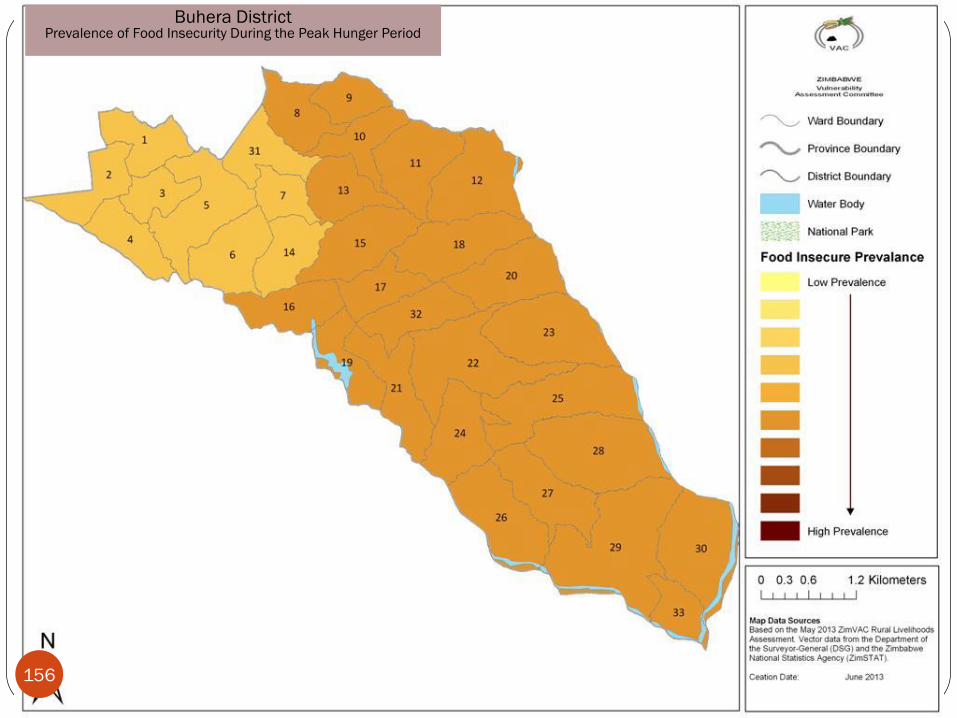
Buhera District Prevalence of Food Insecurity During the Peak Hunger Period
156
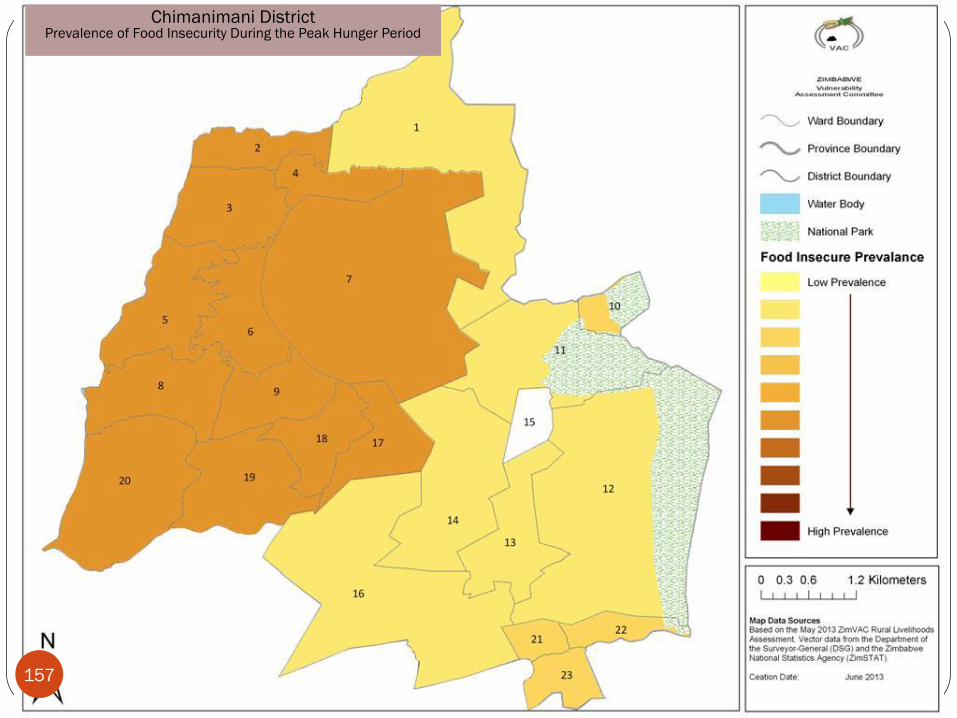
Chimanimani District Prevalence of Food Insecurity During the Peak Hunger Period
157
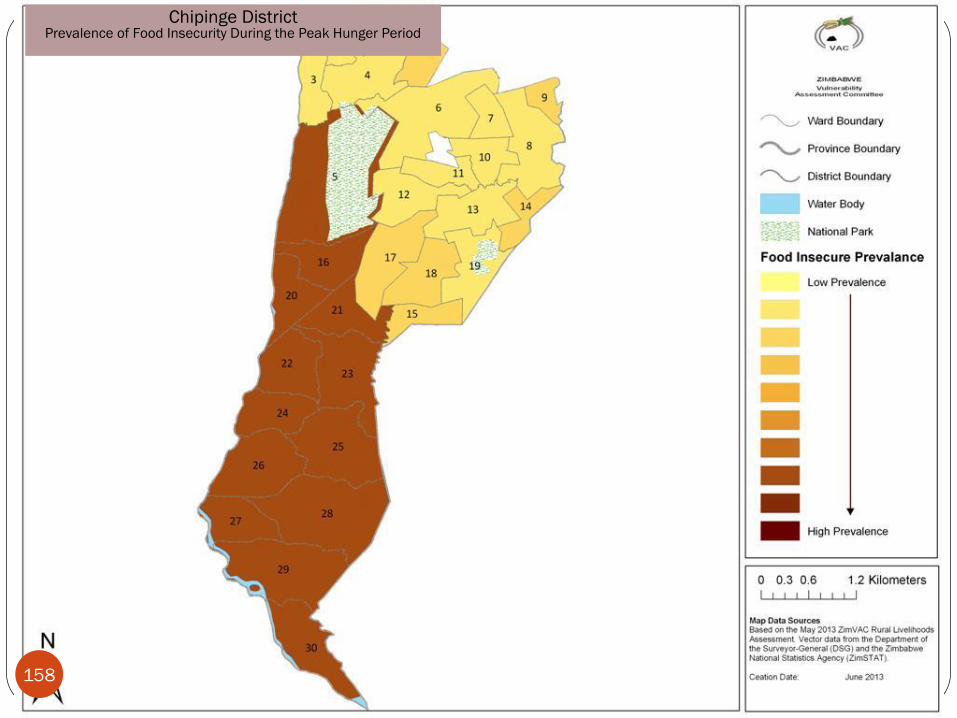
Chipinge District Prevalence of Food Insecurity During the Peak Hunger Period
158
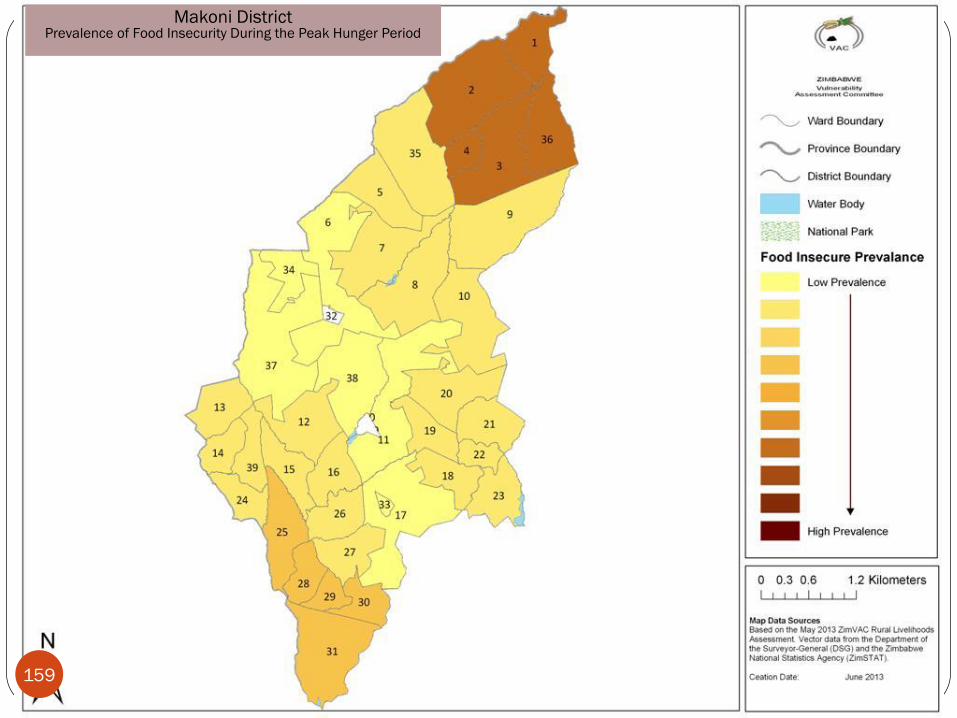
Makoni District Prevalence of Food Insecurity During the Peak Hunger Period
159
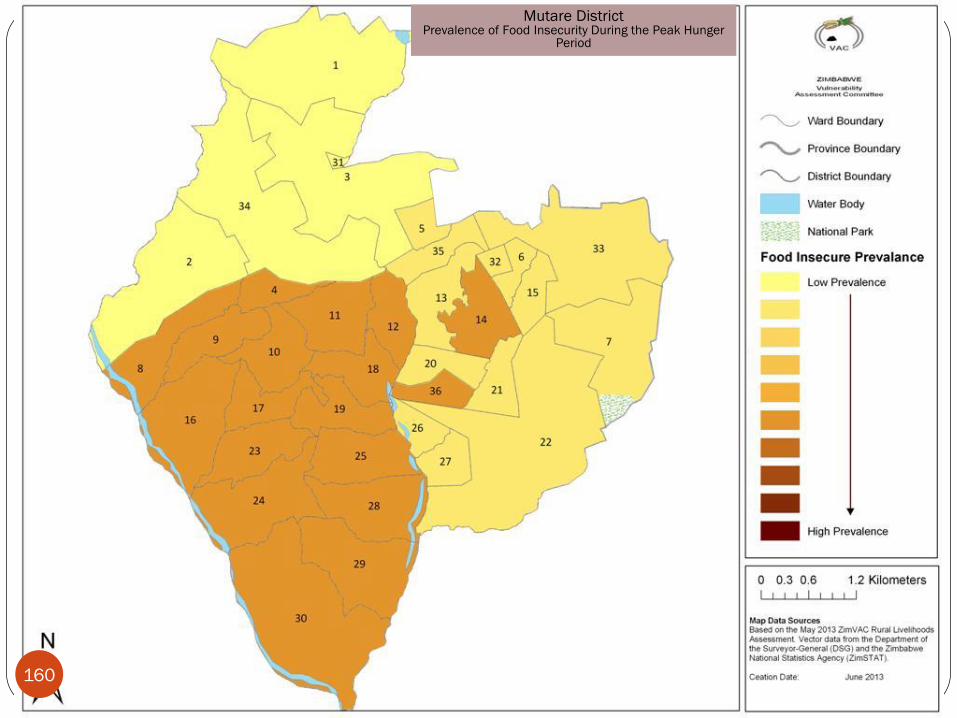
Mutare District Prevalence of Food Insecurity During the Peak Hunger
Period
160
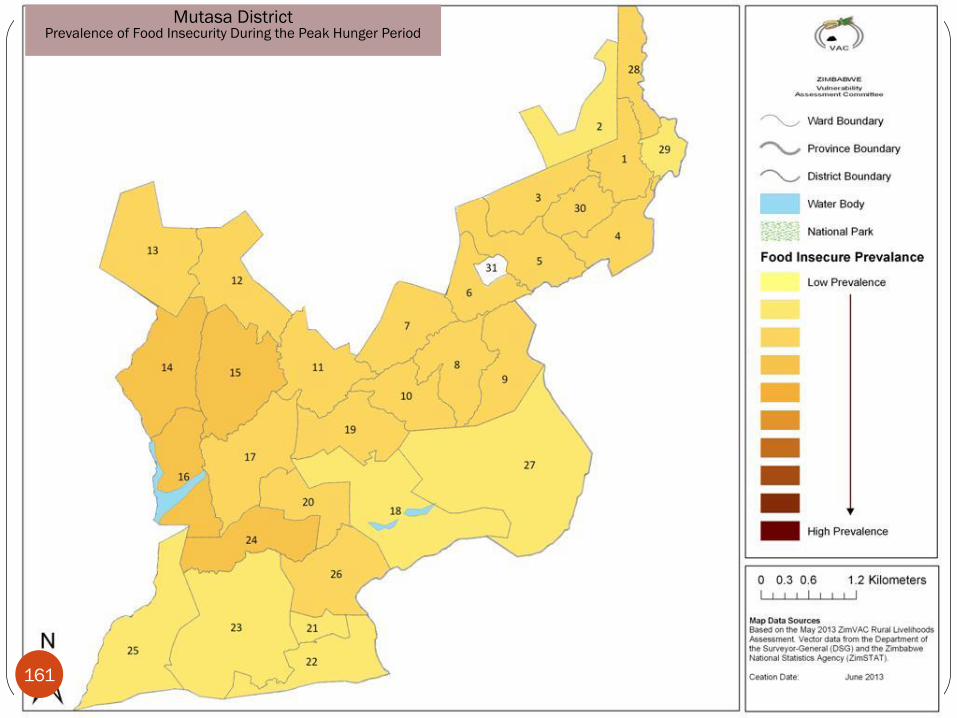
Mutasa District Prevalence of Food Insecurity During the Peak Hunger Period
161
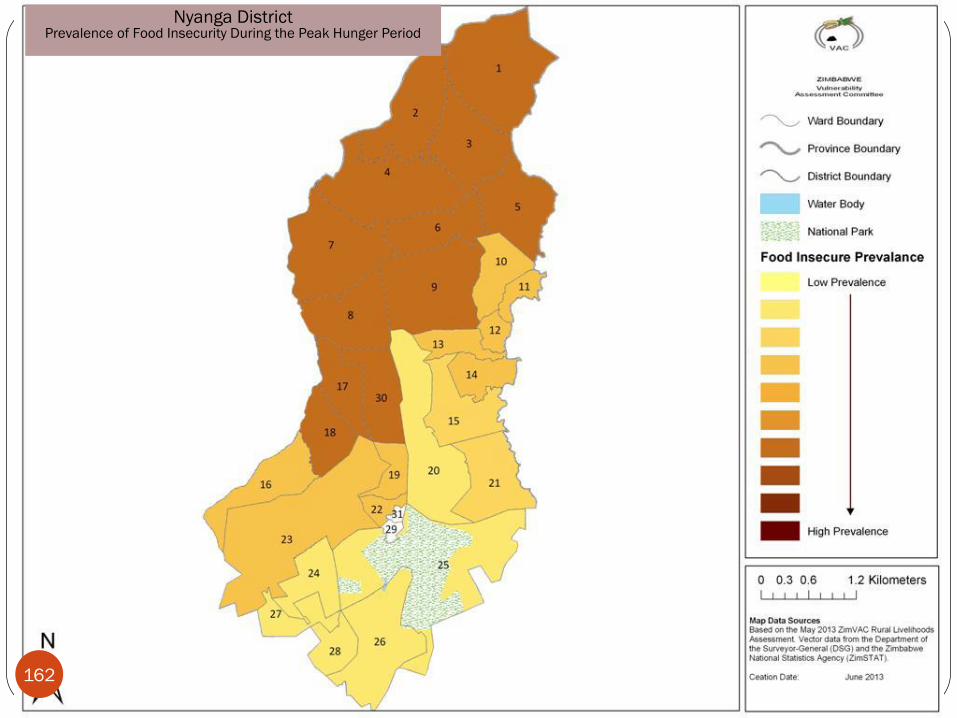
Nyanga District Prevalence of Food Insecurity During the Peak Hunger Period
162
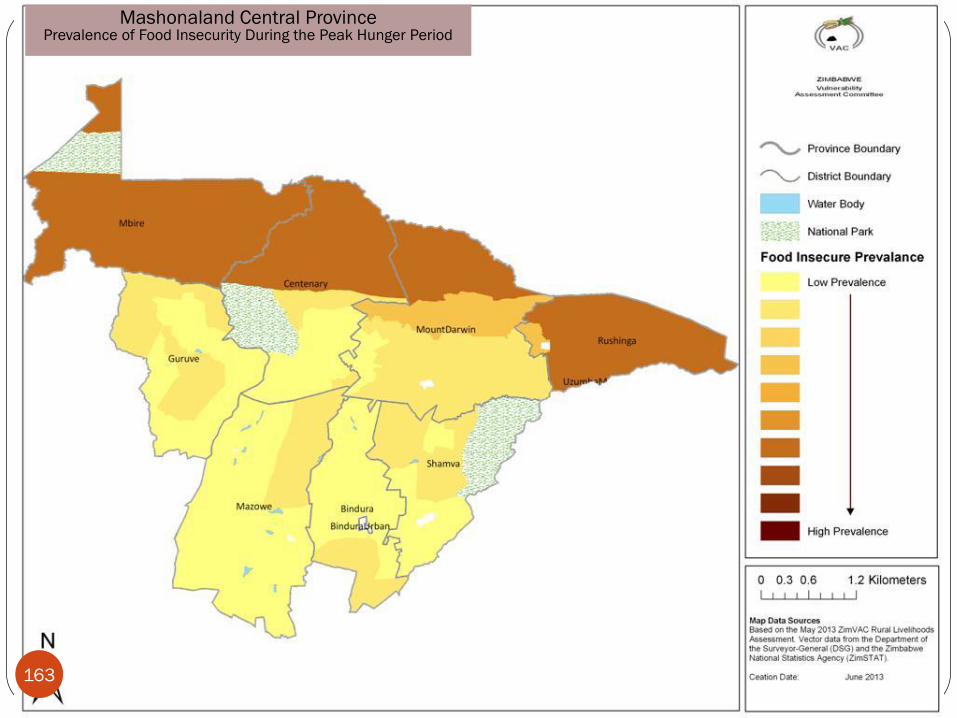
Mashonaland Central Province Prevalence of Food Insecurity During the Peak Hunger Period
163
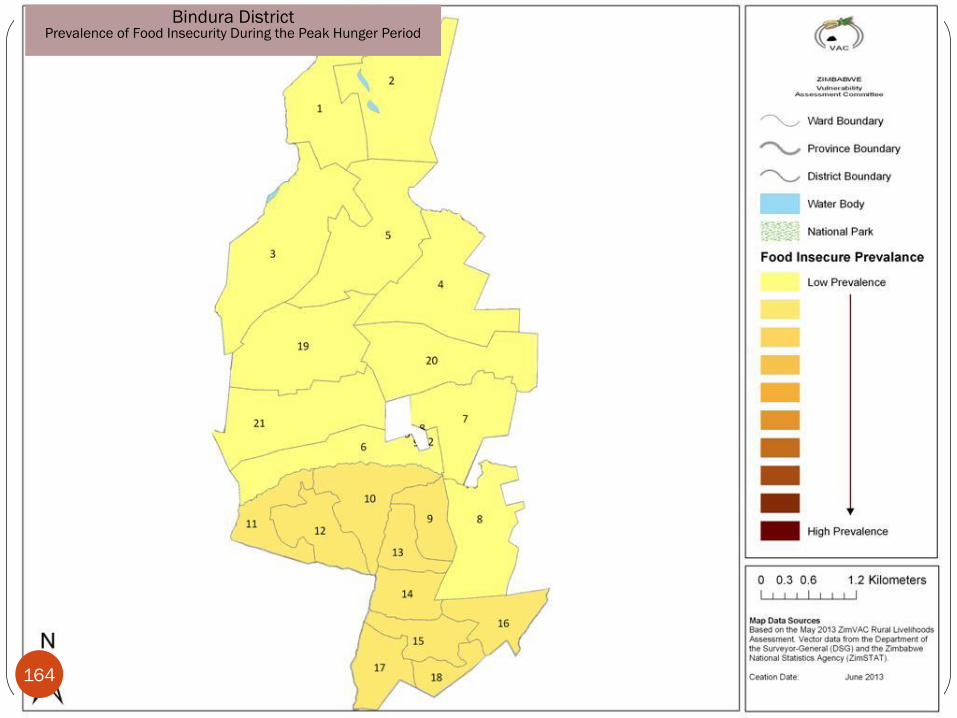
Bindura District Prevalence of Food Insecurity During the Peak Hunger Period
164
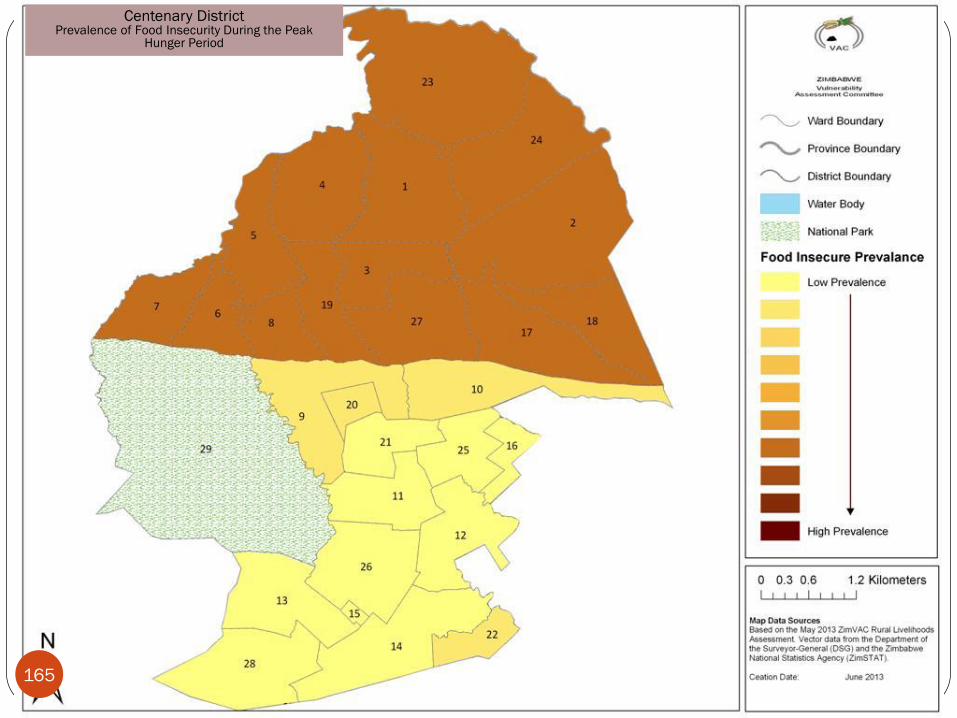
Centenary District Prevalence of Food Insecurity During the Peak
Hunger Period
165
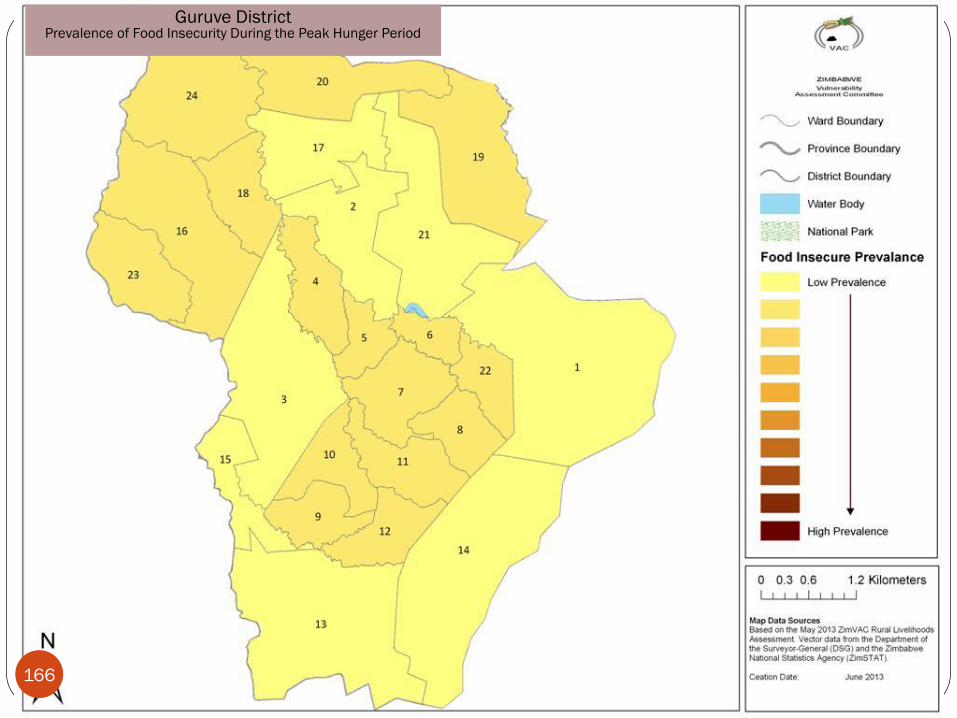
Guruve District Prevalence of Food Insecurity During the Peak Hunger Period
166
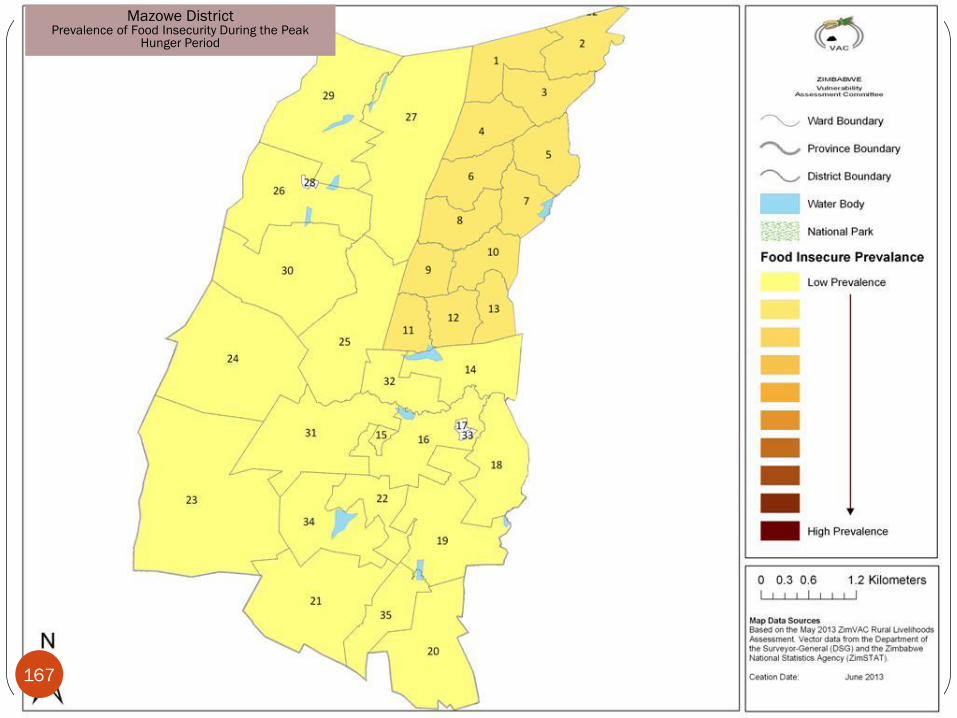
Mazowe District Prevalence of Food Insecurity During the Peak
Hunger Period
167
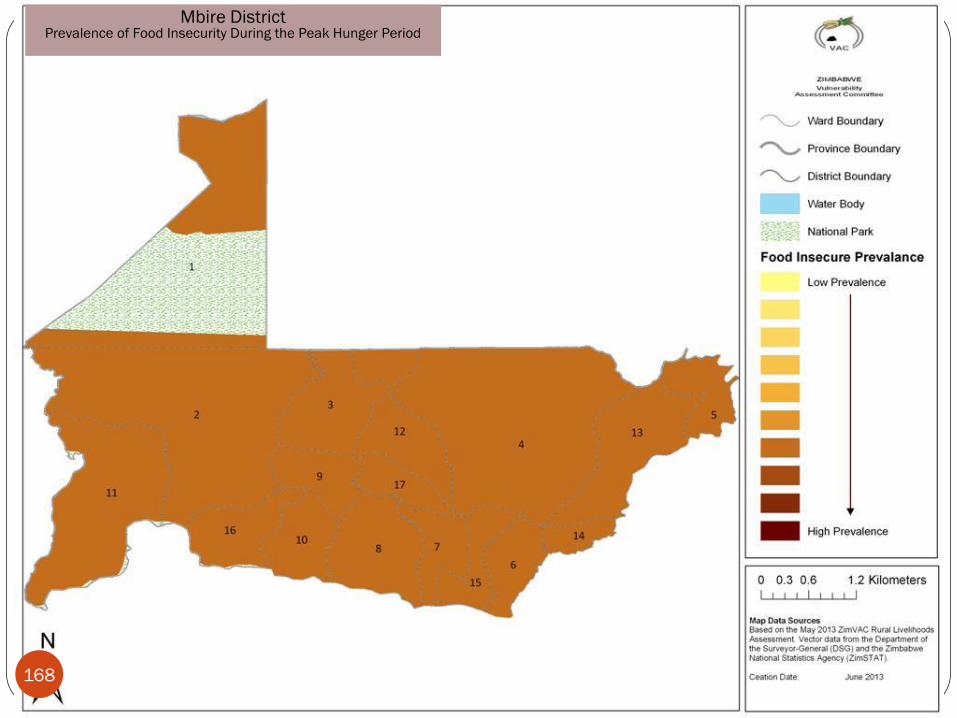
Mbire District Prevalence of Food Insecurity During the Peak Hunger Period
168
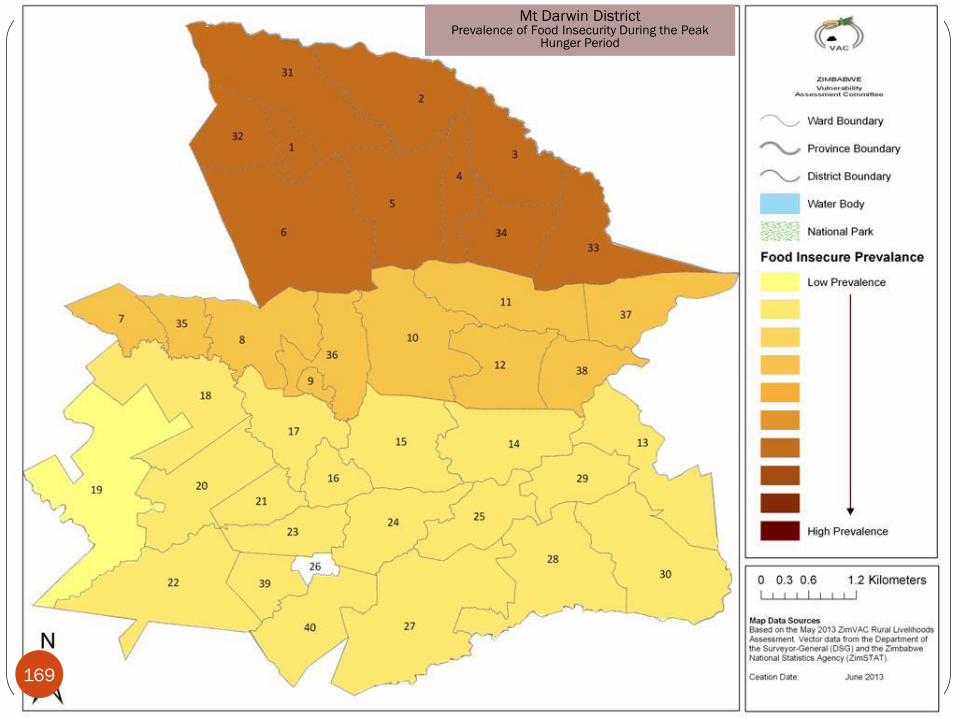
Mt Darwin District Prevalence of Food Insecurity During the Peak
Hunger Period
169
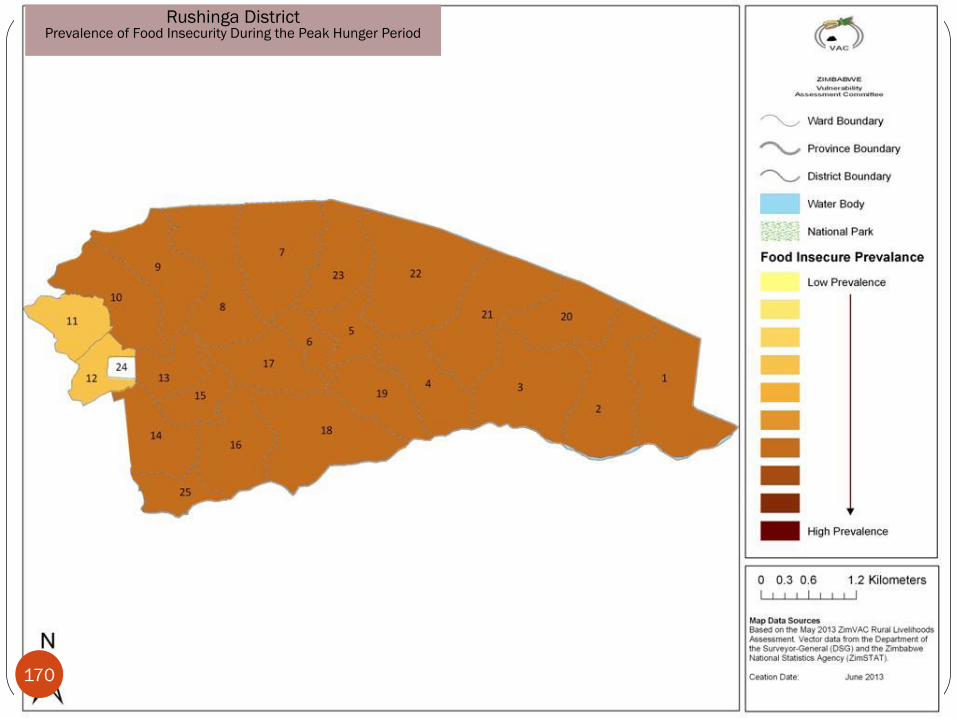
Rushinga District Prevalence of Food Insecurity During the Peak Hunger Period
170
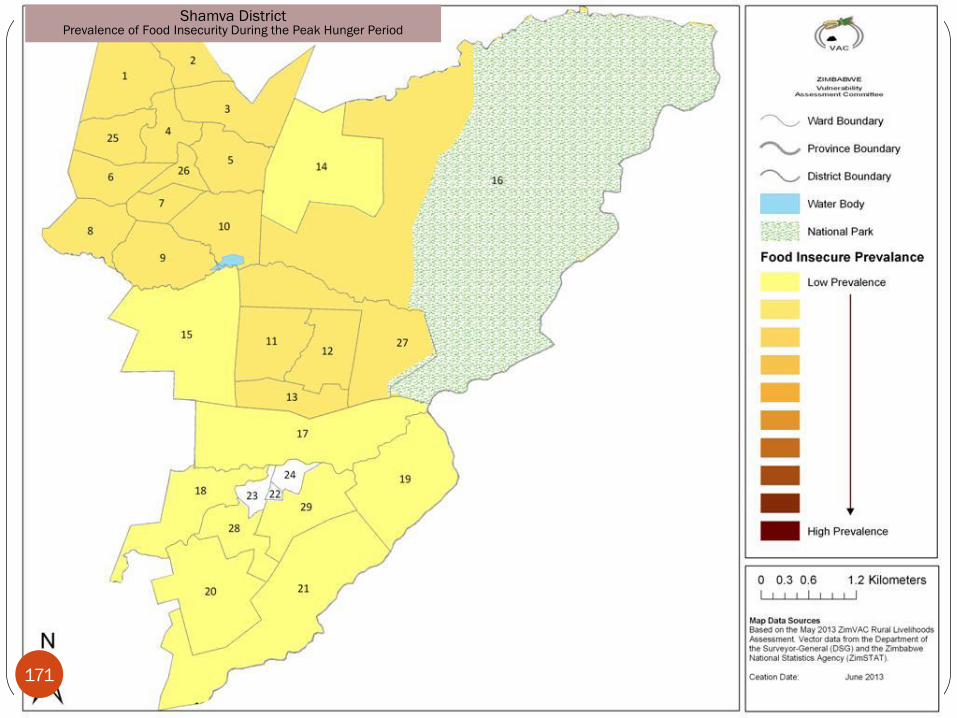
Shamva District Prevalence of Food Insecurity During the Peak Hunger Period
171
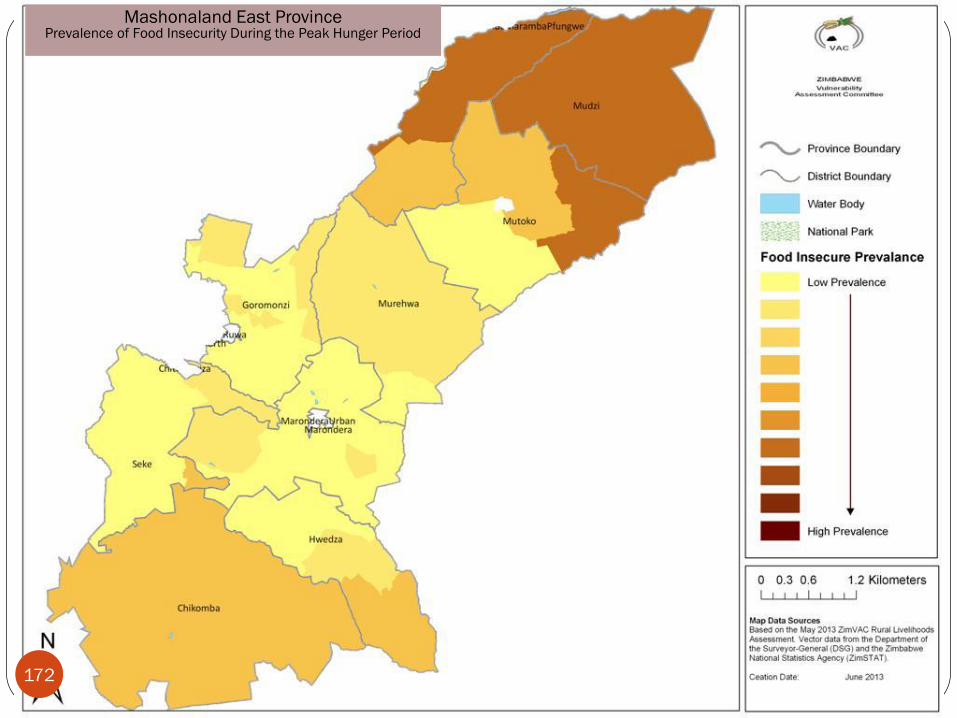
Mashonaland East Province Prevalence of Food Insecurity During the Peak Hunger Period
172
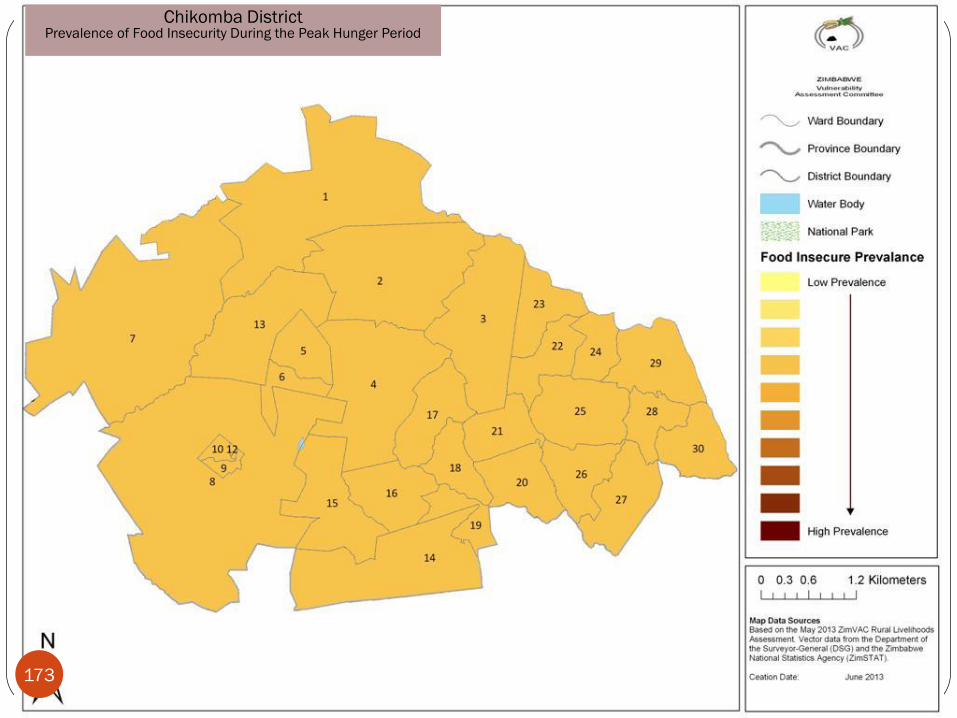
Chikomba District Prevalence of Food Insecurity During the Peak Hunger Period
173
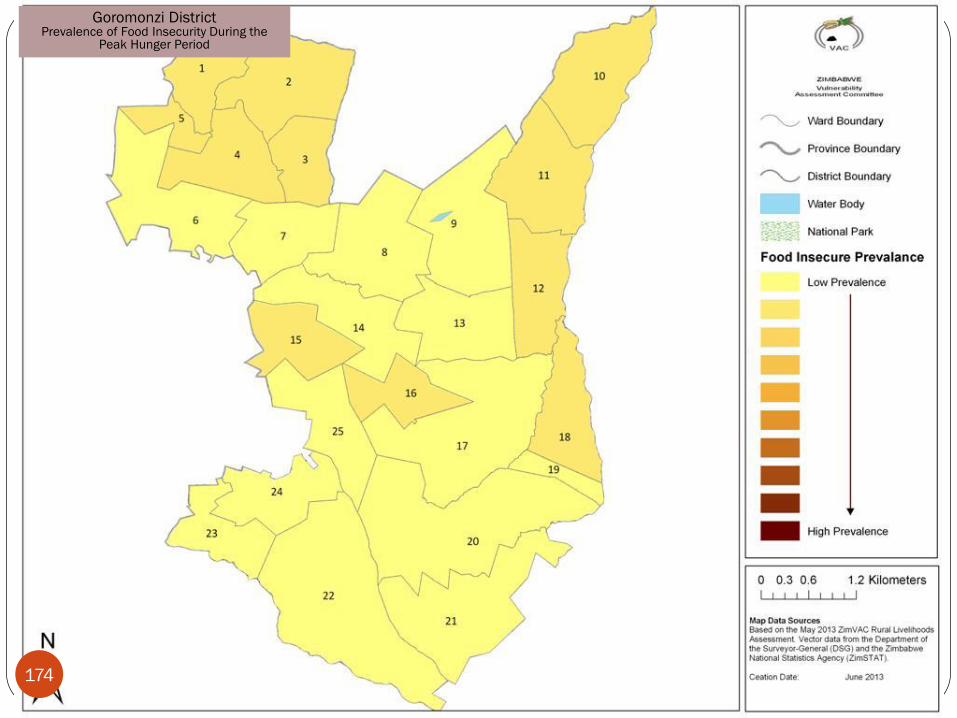
Goromonzi District Prevalence of Food Insecurity During the
Peak Hunger Period
174
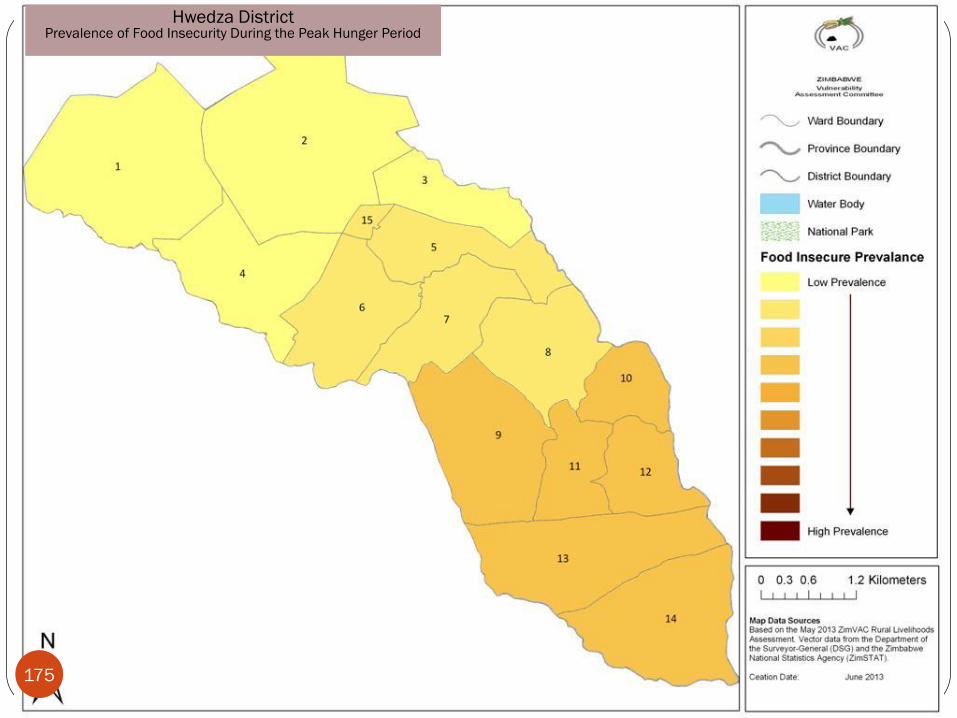
Hwedza District Prevalence of Food Insecurity During the Peak Hunger Period
175
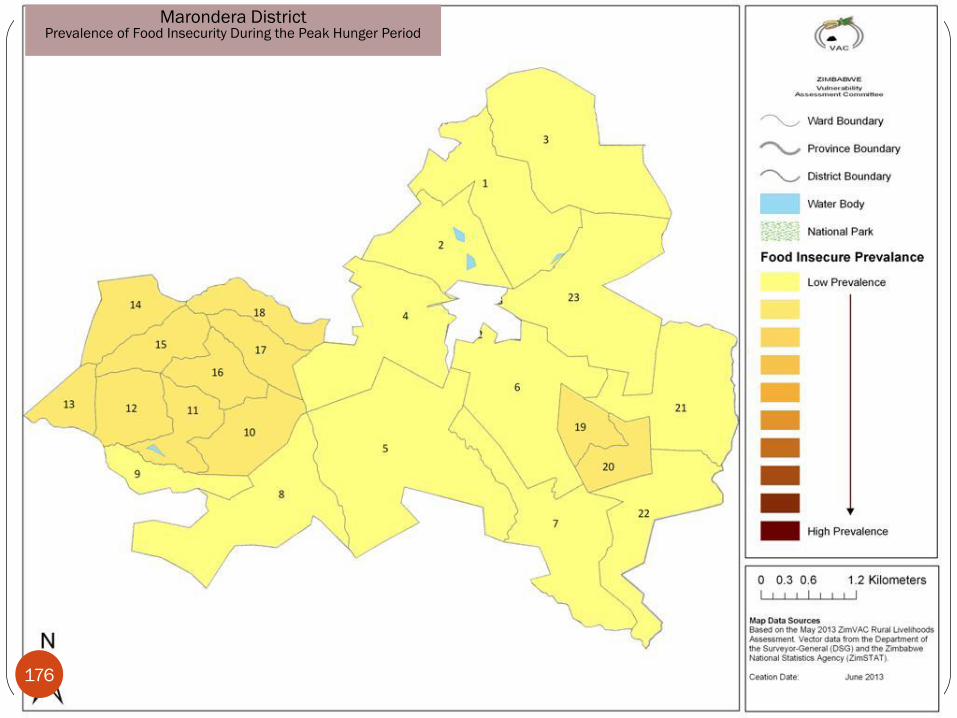
Marondera District Prevalence of Food Insecurity During the Peak Hunger Period
176
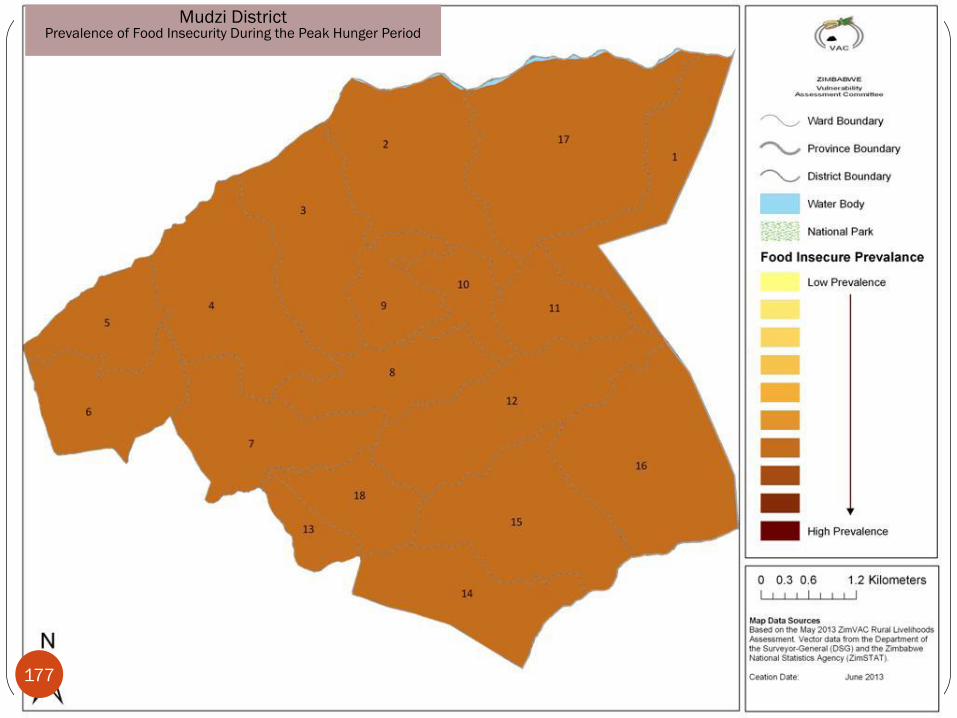
Mudzi District Prevalence of Food Insecurity During the Peak Hunger Period
177
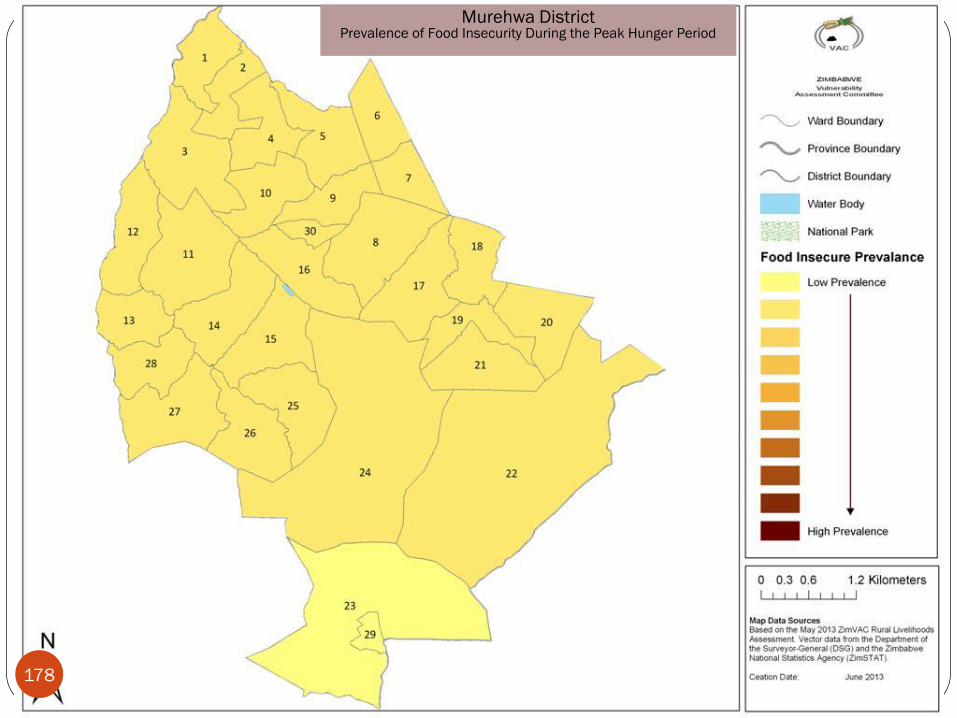
Murehwa District Prevalence of Food Insecurity During the Peak Hunger Period
178
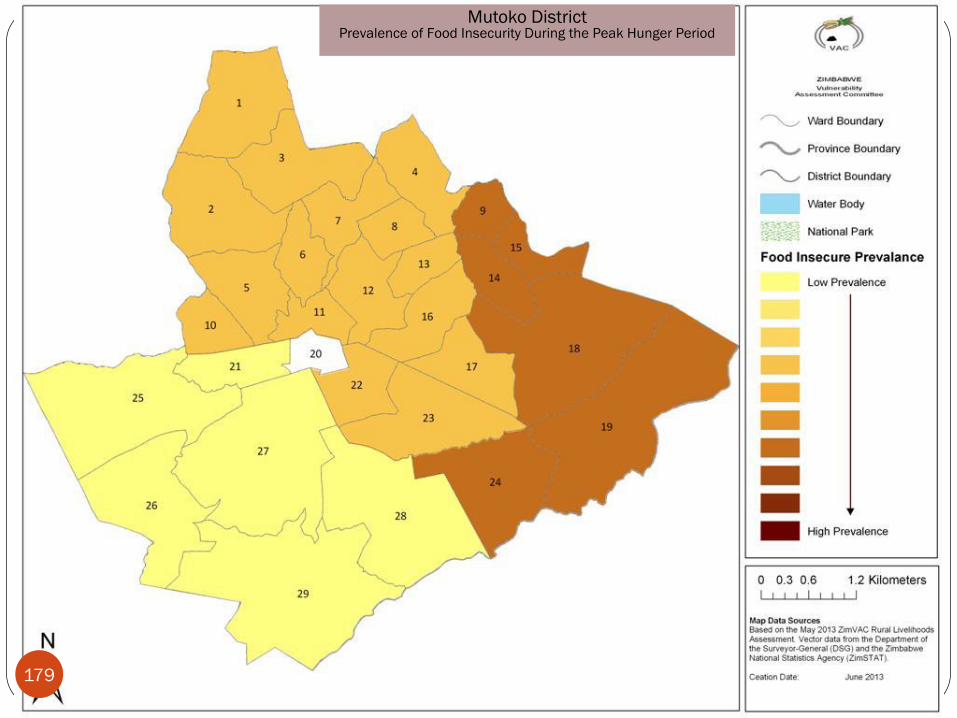
Mutoko District Prevalence of Food Insecurity During the Peak Hunger Period
179
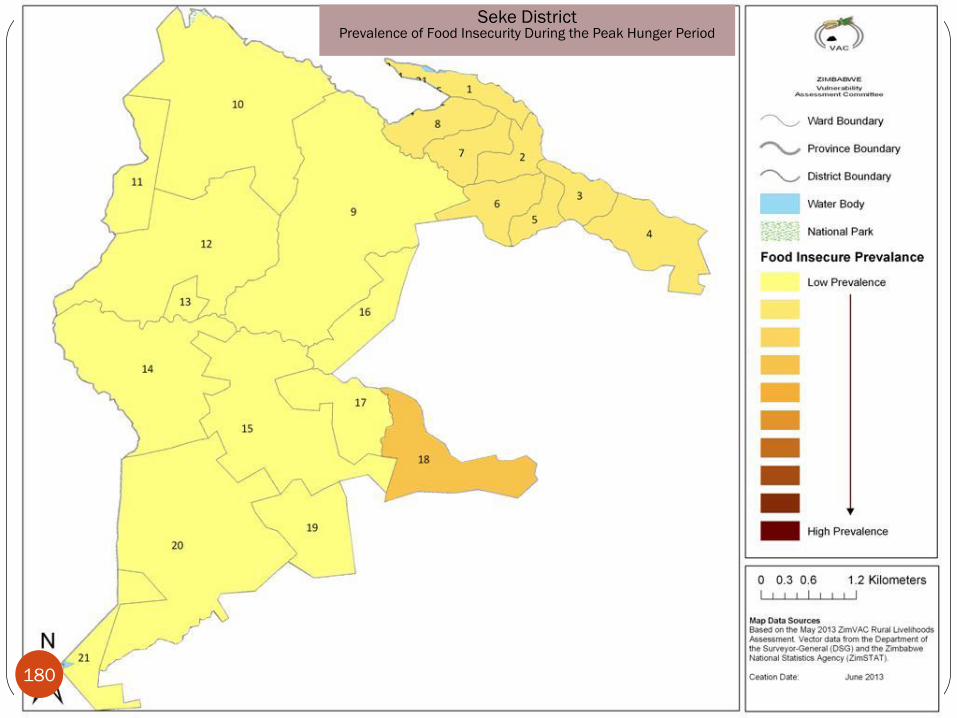
Seke District Prevalence of Food Insecurity During the Peak Hunger Period
180
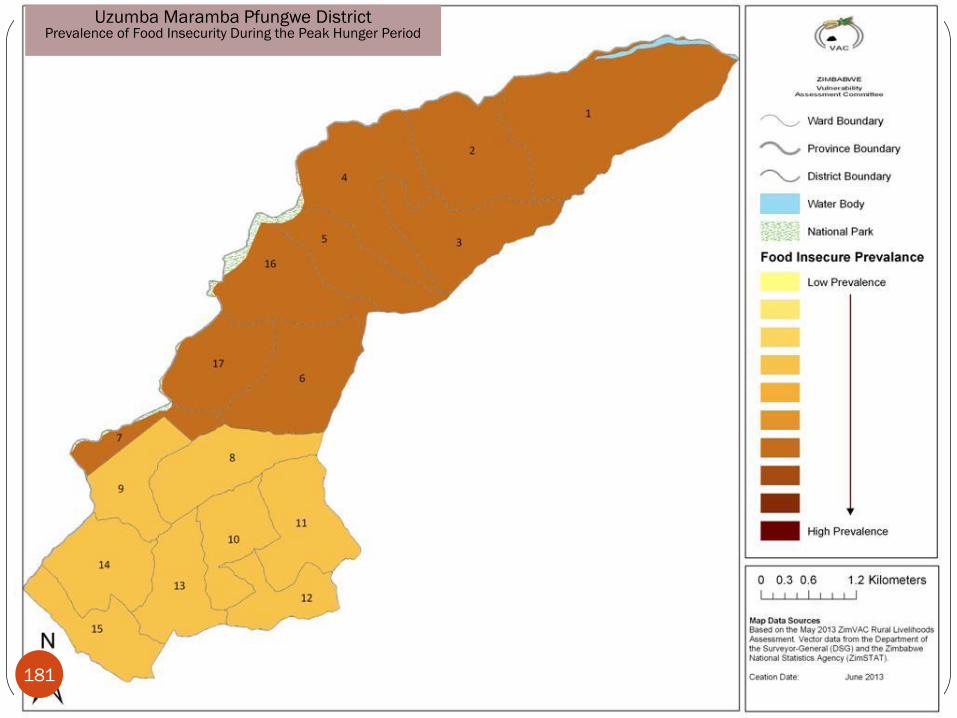
Uzumba Maramba Pfungwe District Prevalence of Food Insecurity During the Peak Hunger Period
181
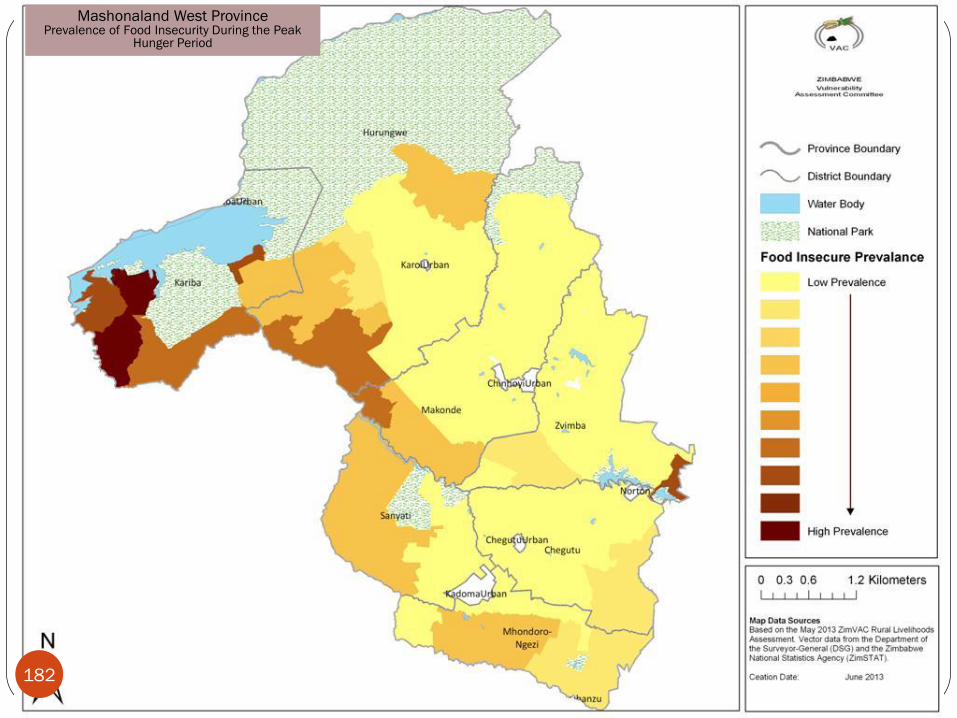
Mashonaland West Province Prevalence of Food Insecurity During the Peak
Hunger Period
182
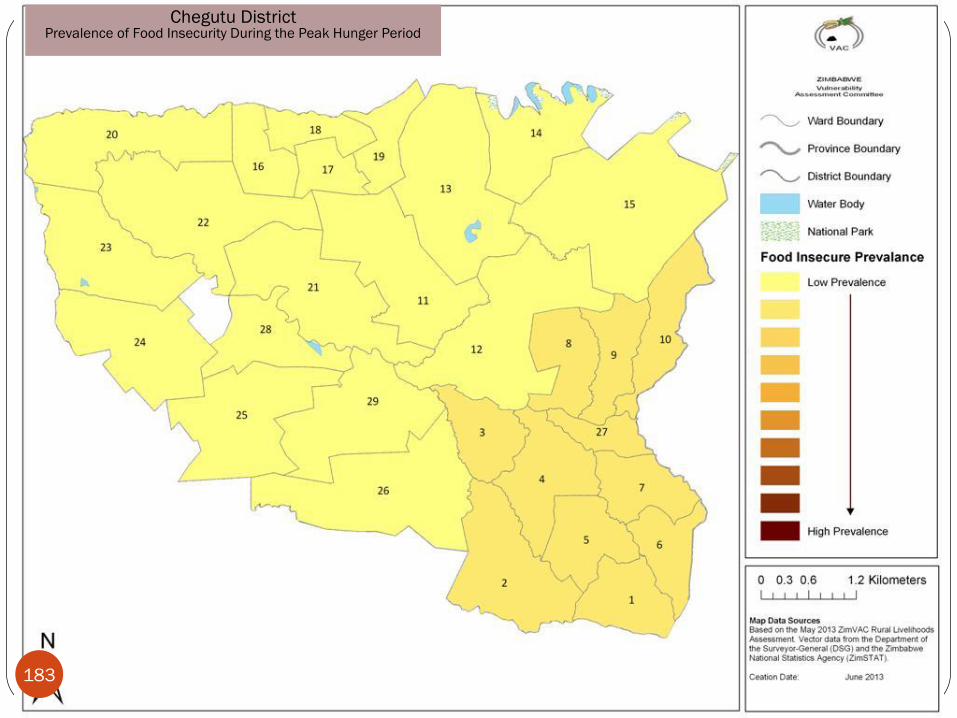
Chegutu District Prevalence of Food Insecurity During the Peak Hunger Period
183
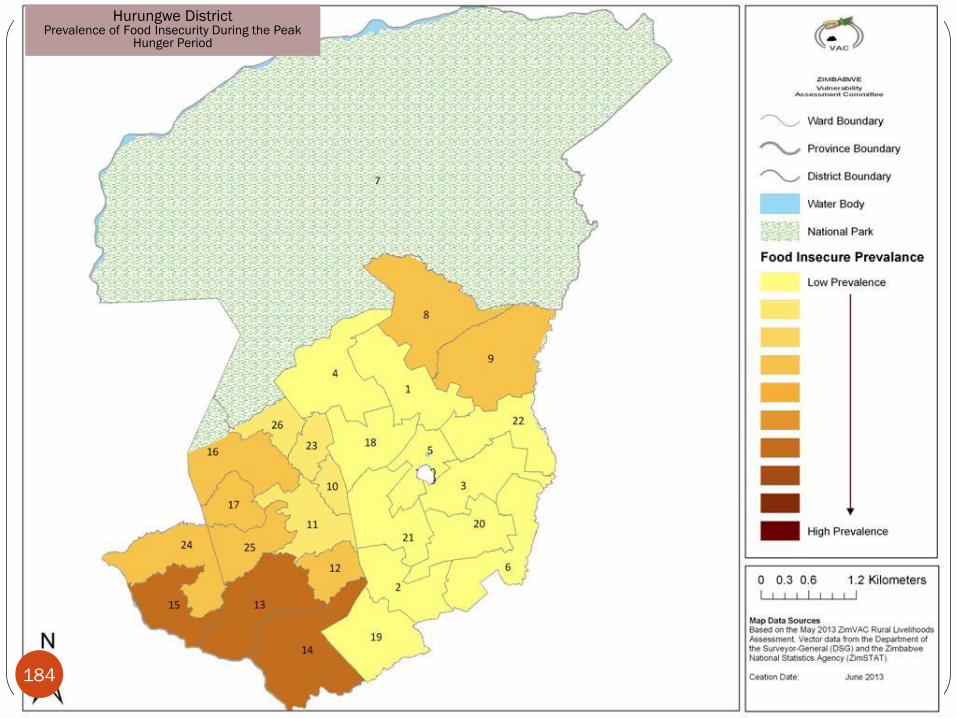
Hurungwe District Prevalence of Food Insecurity During the Peak
Hunger Period
184
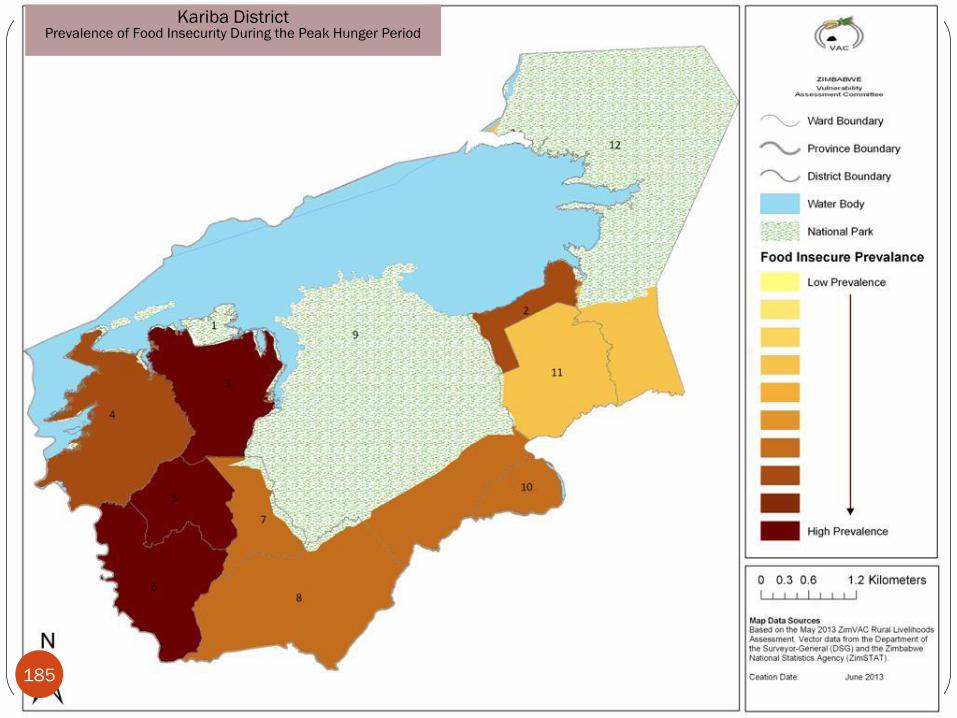
Kariba District Prevalence of Food Insecurity During the Peak Hunger Period
185
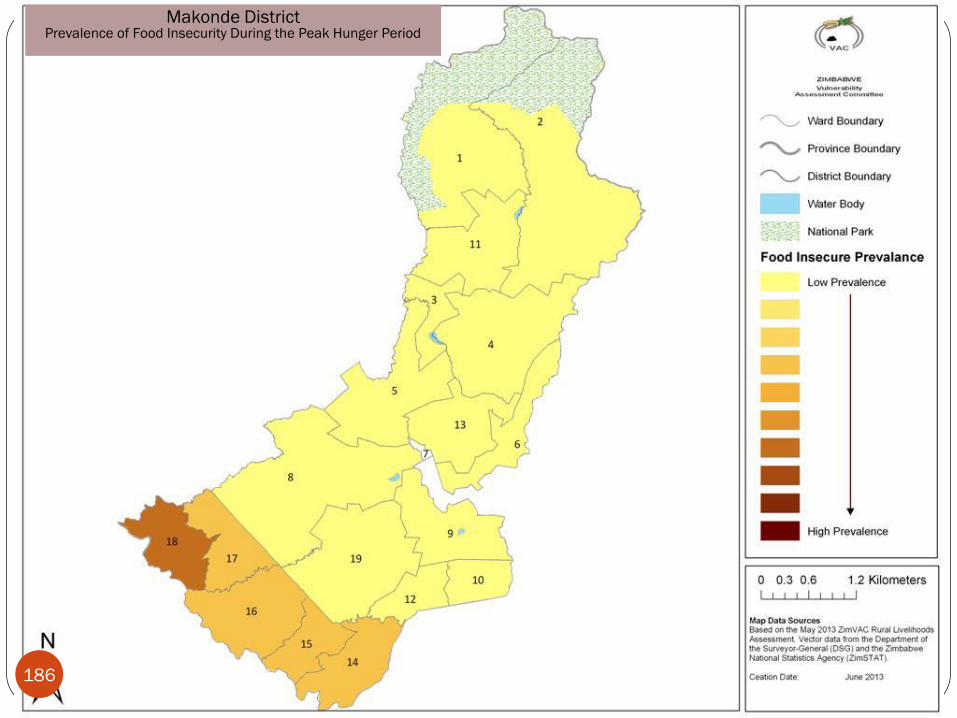
Makonde District Prevalence of Food Insecurity During the Peak Hunger Period
186
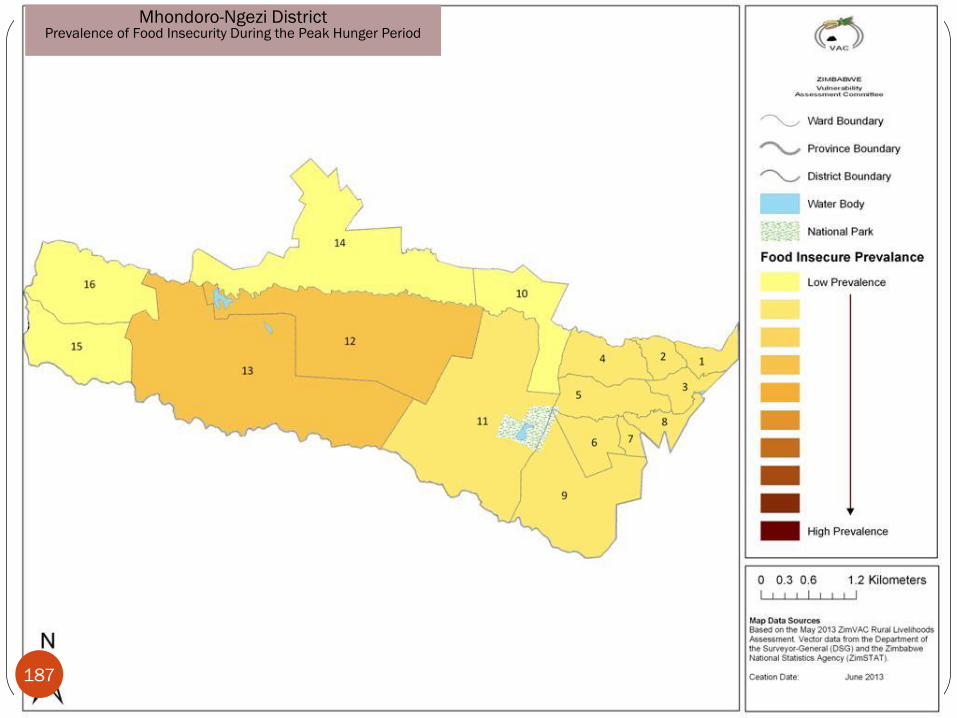
Mhondoro-Ngezi District Prevalence of Food Insecurity During the Peak Hunger Period
187
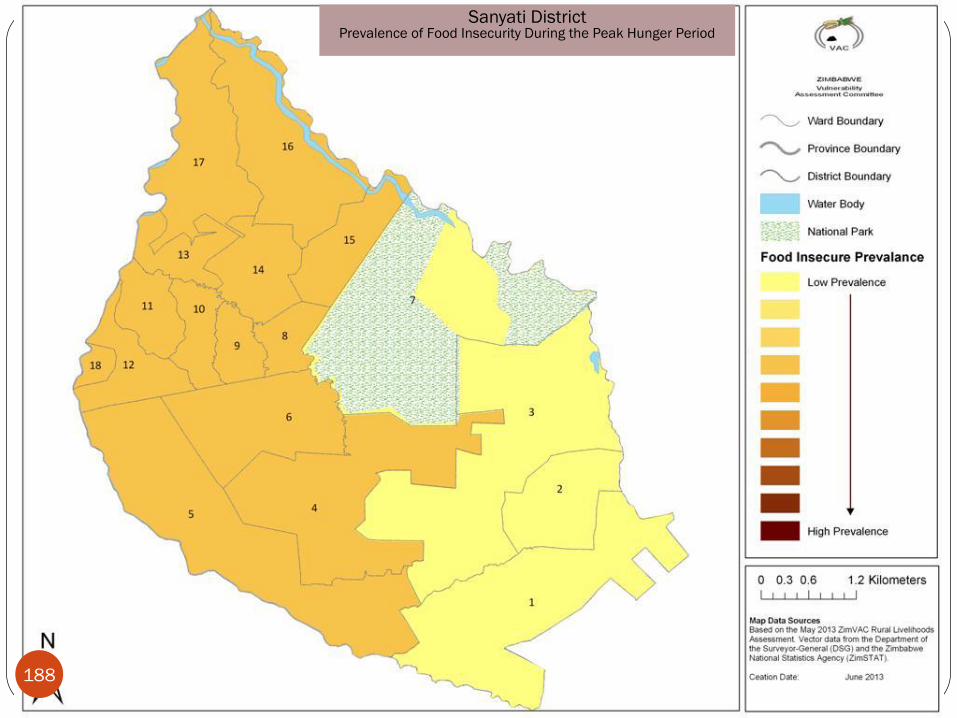
Sanyati District Prevalence of Food Insecurity During the Peak Hunger Period
188
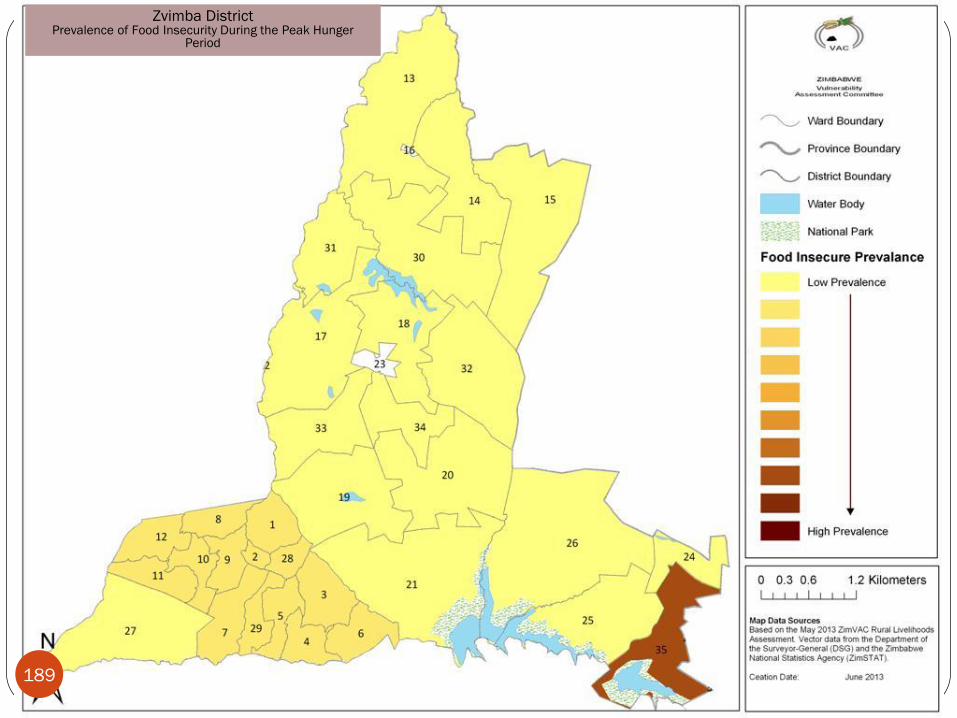
Zvimba District Prevalence of Food Insecurity During the Peak Hunger
Period
189
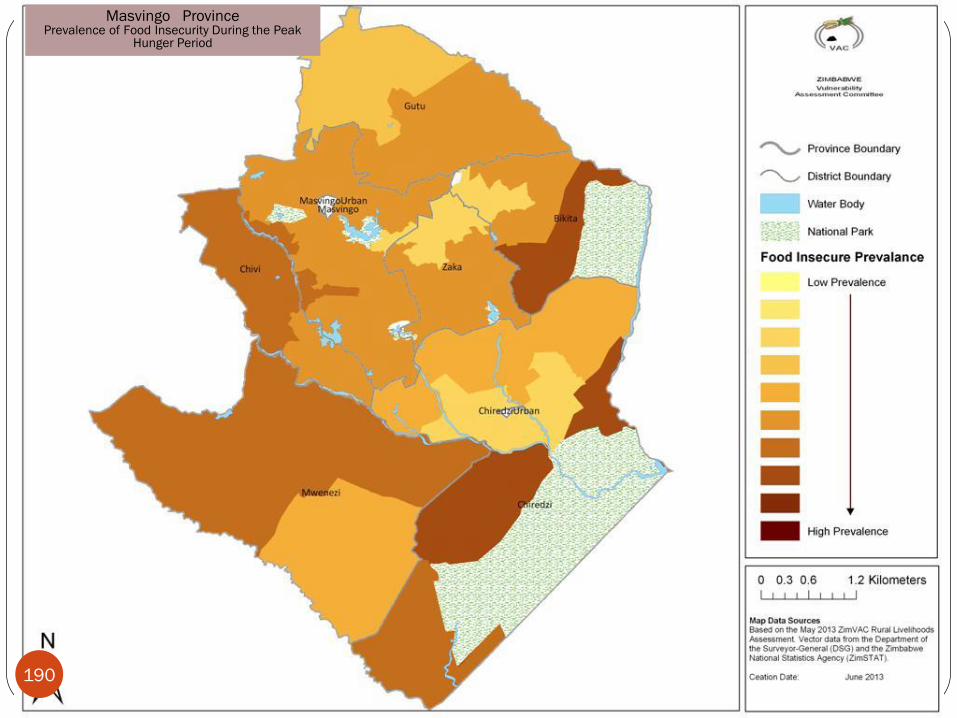
Masvingo Province Prevalence of Food Insecurity During the Peak
Hunger Period
190
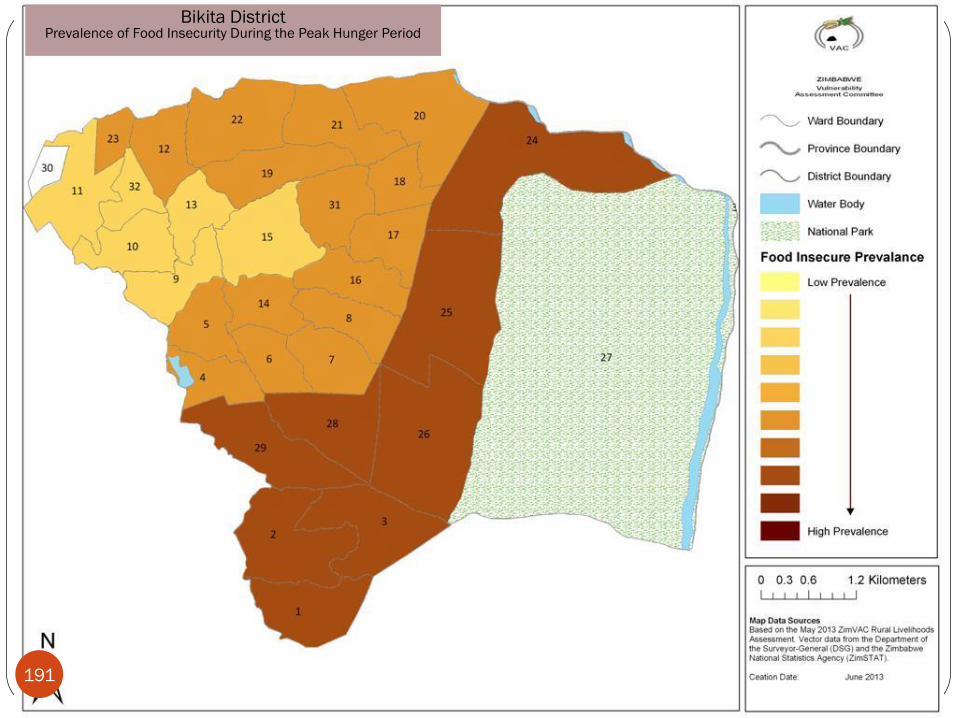
Bikita District Prevalence of Food Insecurity During the Peak Hunger Period
191
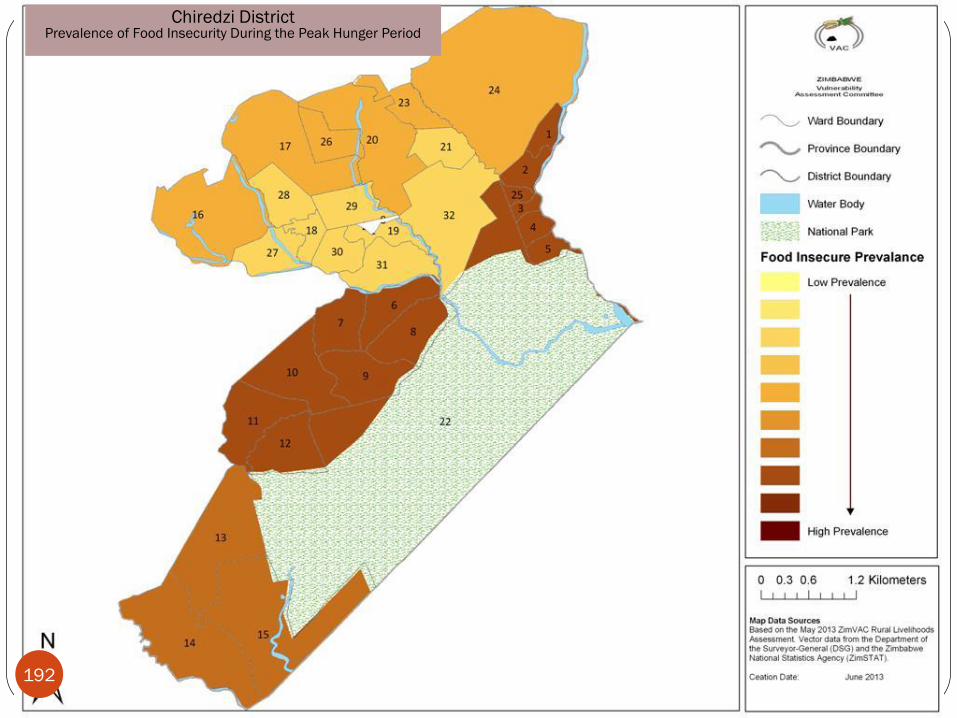
Chiredzi District Prevalence of Food Insecurity During the Peak Hunger Period
192
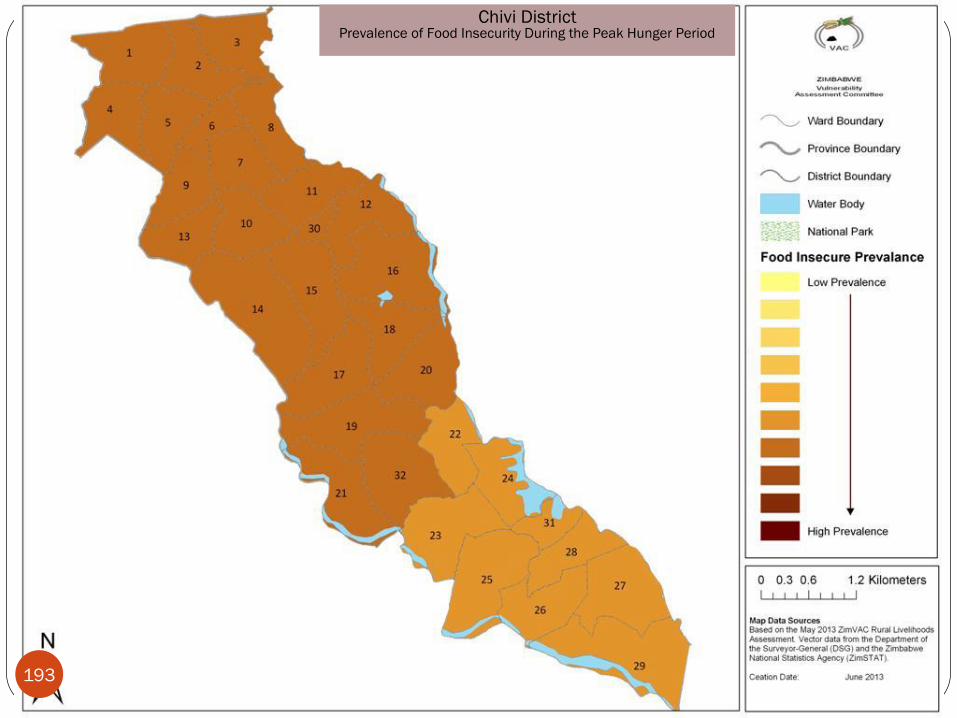
Chivi District Prevalence of Food Insecurity During the Peak Hunger Period
193
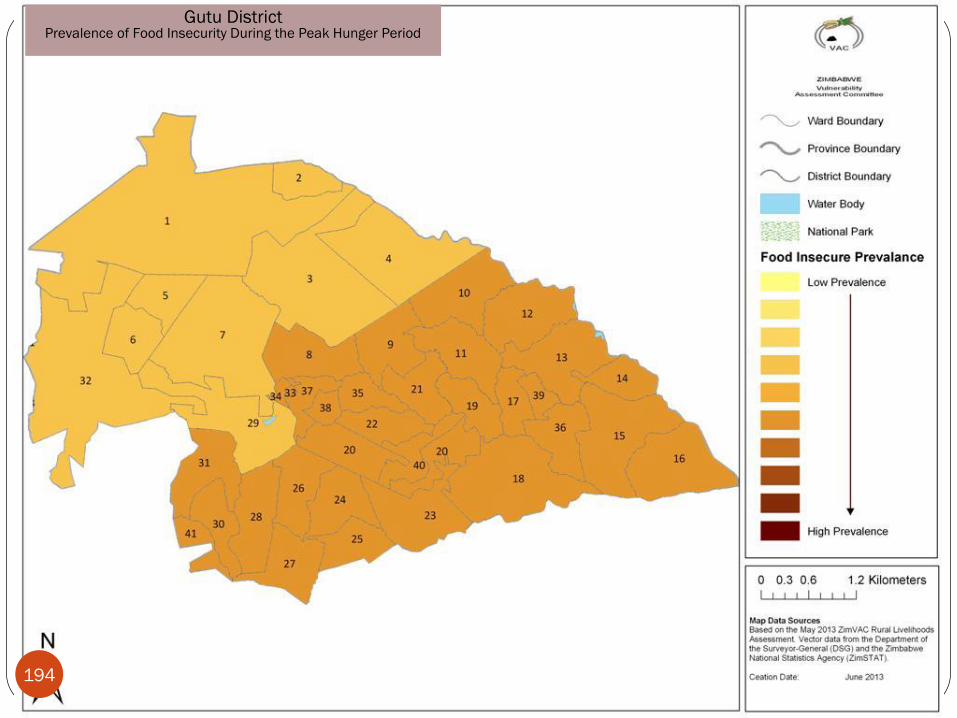
Gutu District Prevalence of Food Insecurity During the Peak Hunger Period
194
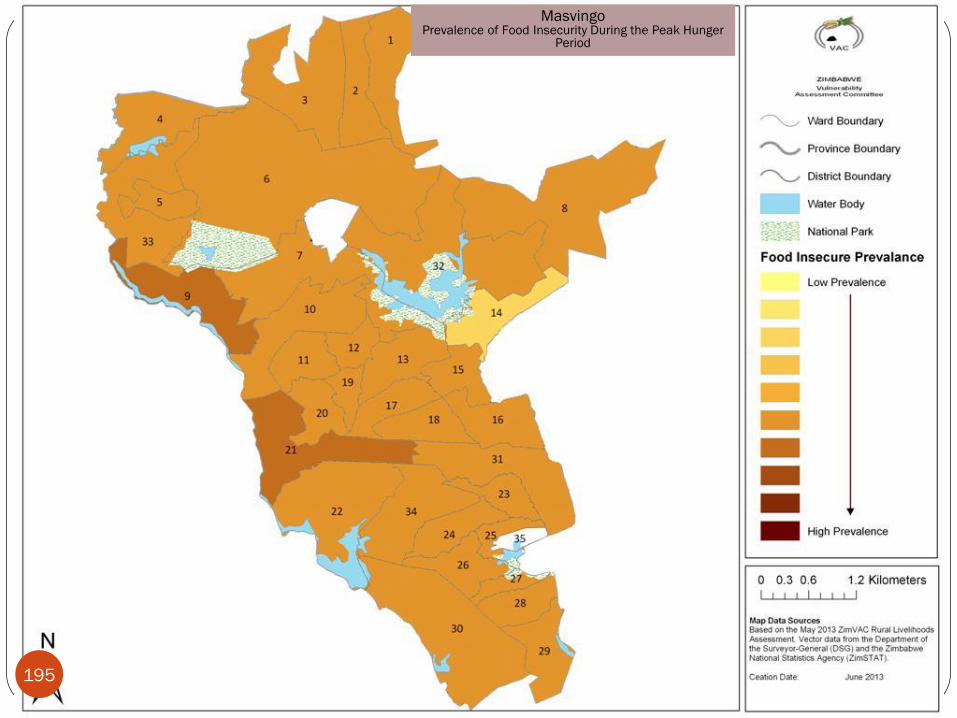
Masvingo Prevalence of Food Insecurity During the Peak Hunger
Period
195
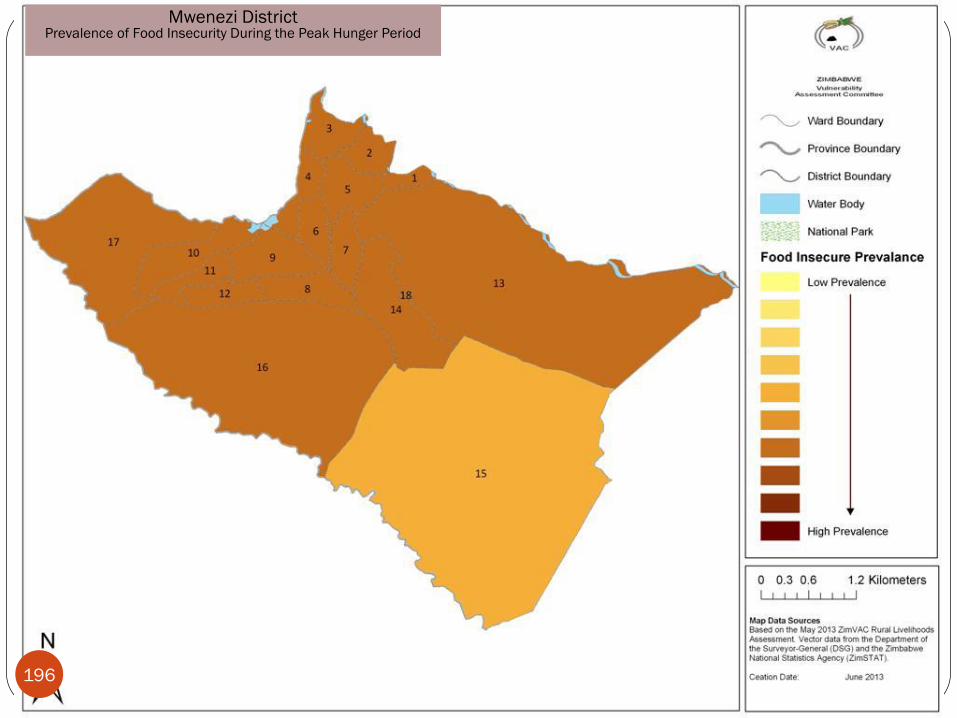
Mwenezi District Prevalence of Food Insecurity During the Peak Hunger Period
196
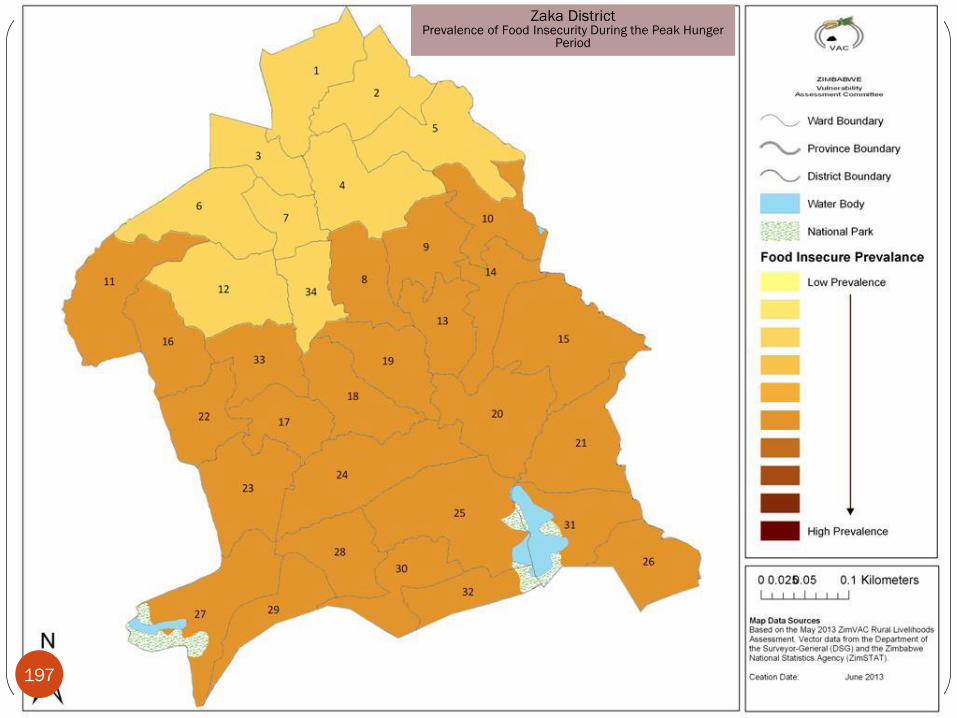
Zaka District Prevalence of Food Insecurity During the Peak Hunger
Period
197
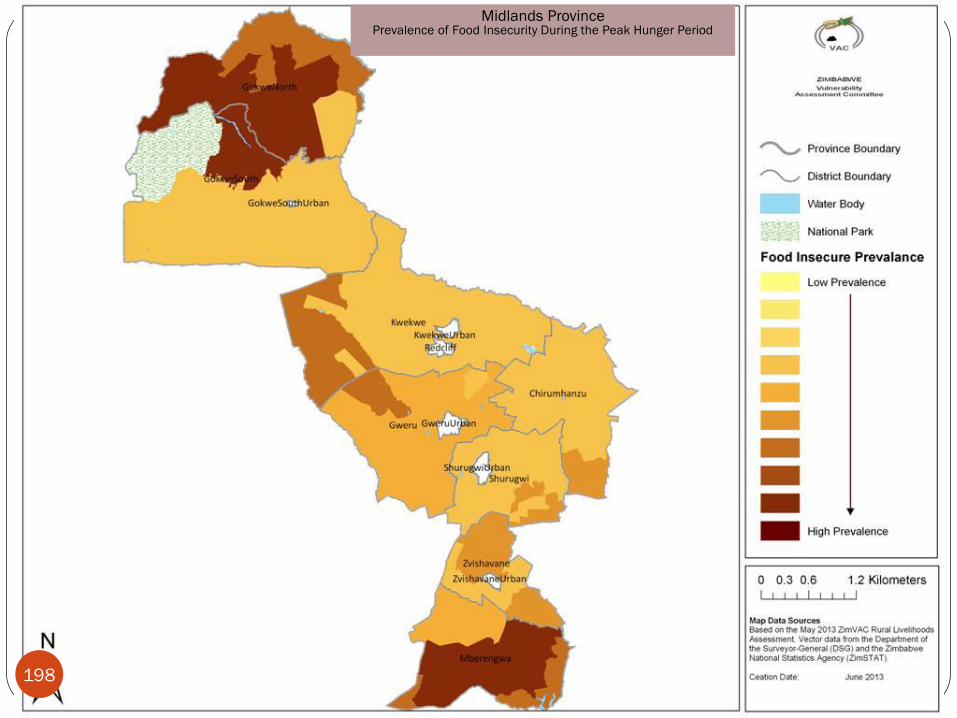
Midlands Province Prevalence of Food Insecurity During the Peak Hunger Period
198
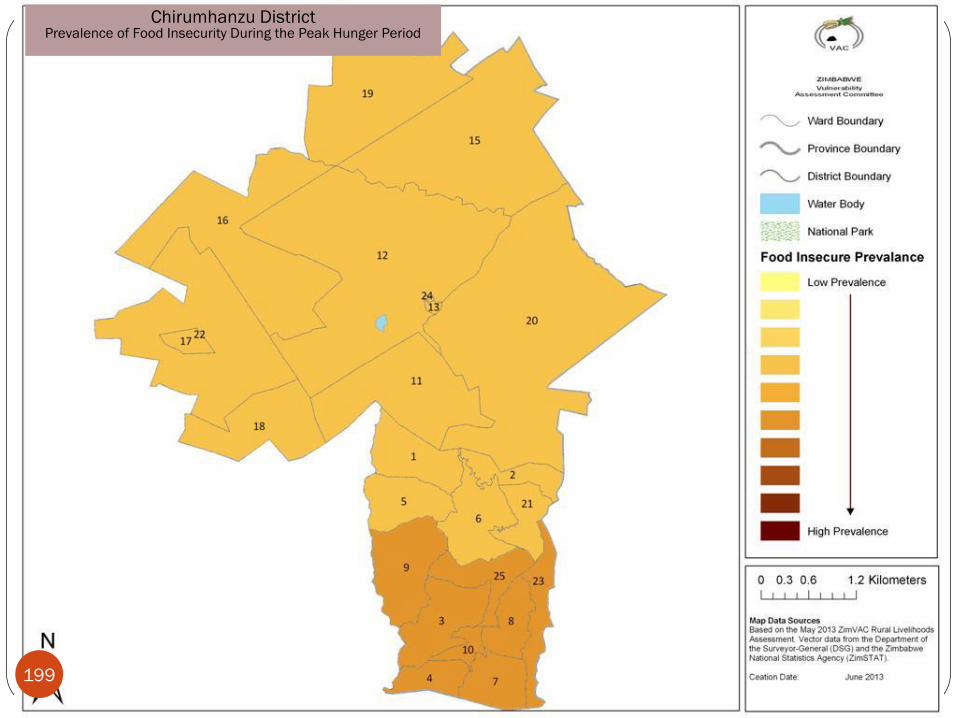
Chirumhanzu District Prevalence of Food Insecurity During the Peak Hunger Period
199
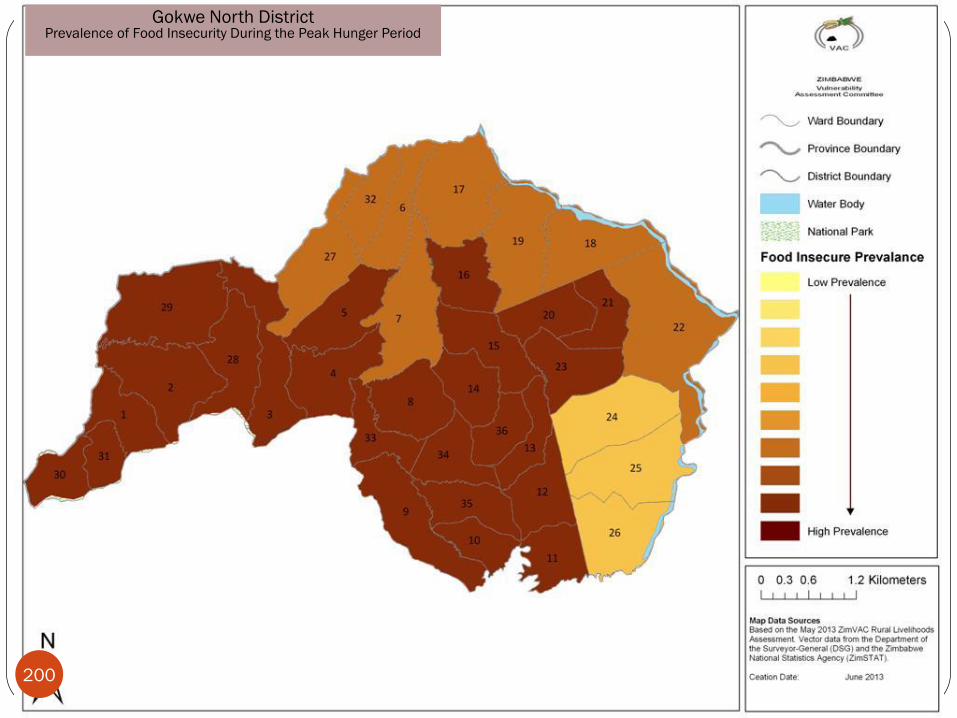
Gokwe North District Prevalence of Food Insecurity During the Peak Hunger Period
200
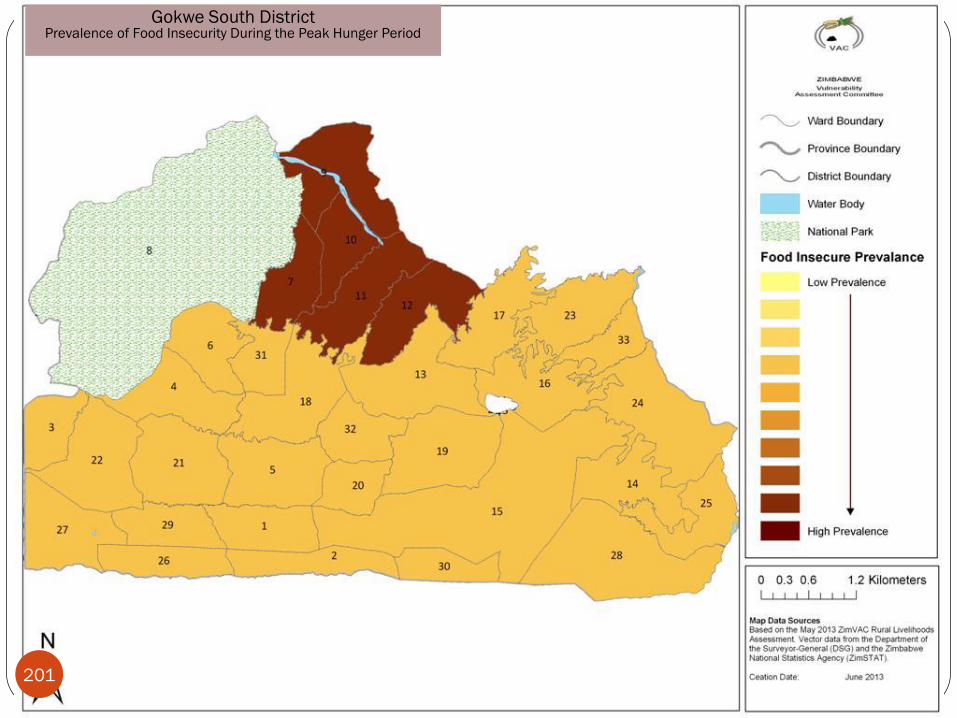
Gokwe South District Prevalence of Food Insecurity During the Peak Hunger Period
201
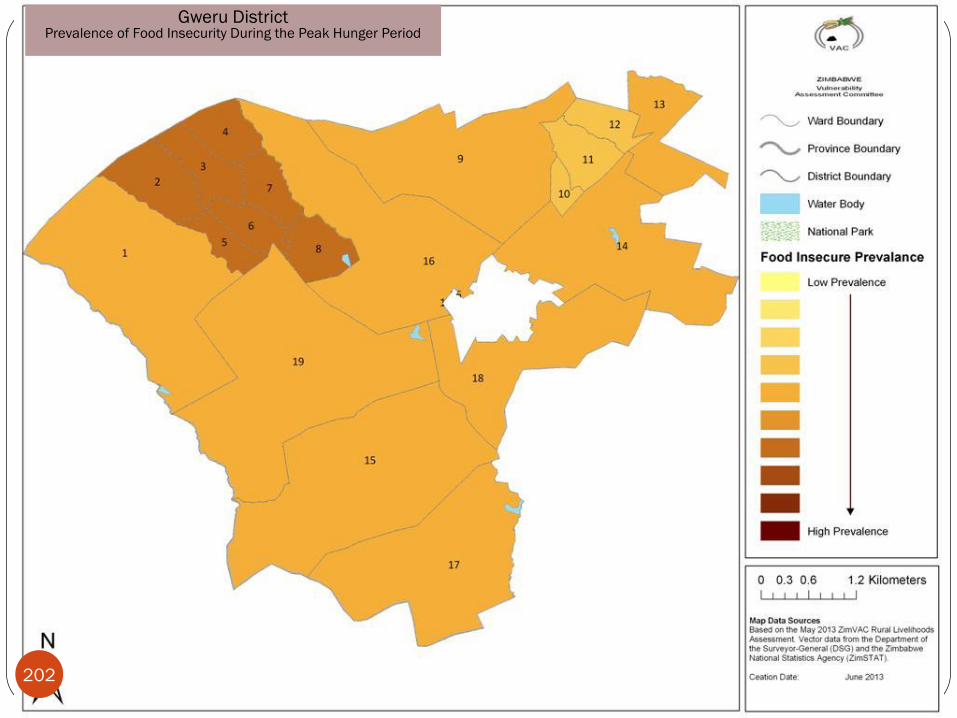
Gweru District Prevalence of Food Insecurity During the Peak Hunger Period
202
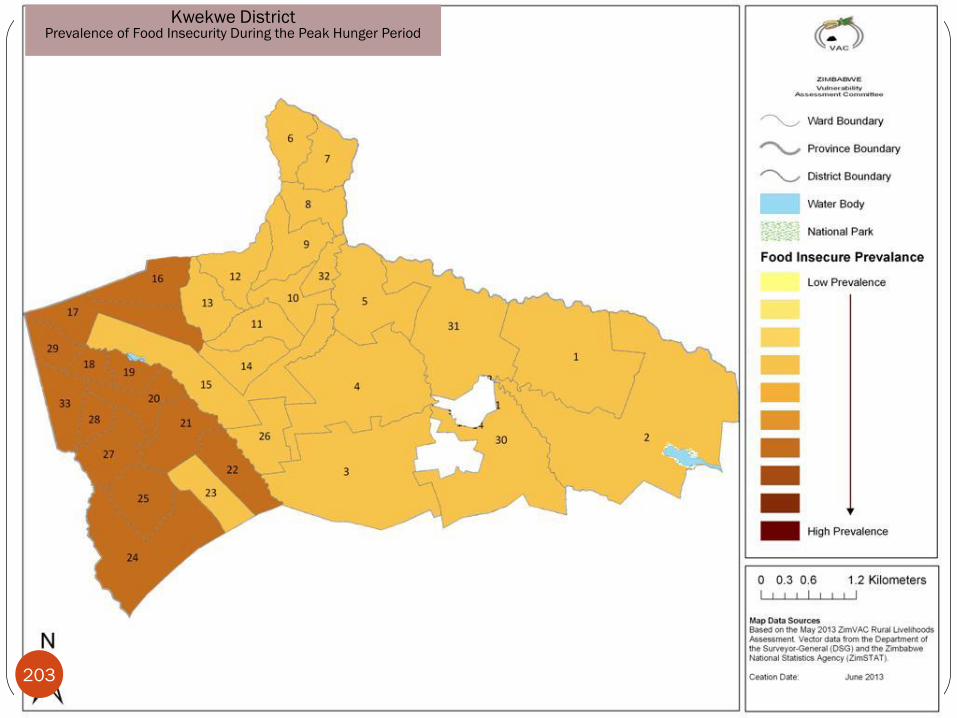
Kwekwe District Prevalence of Food Insecurity During the Peak Hunger Period
203
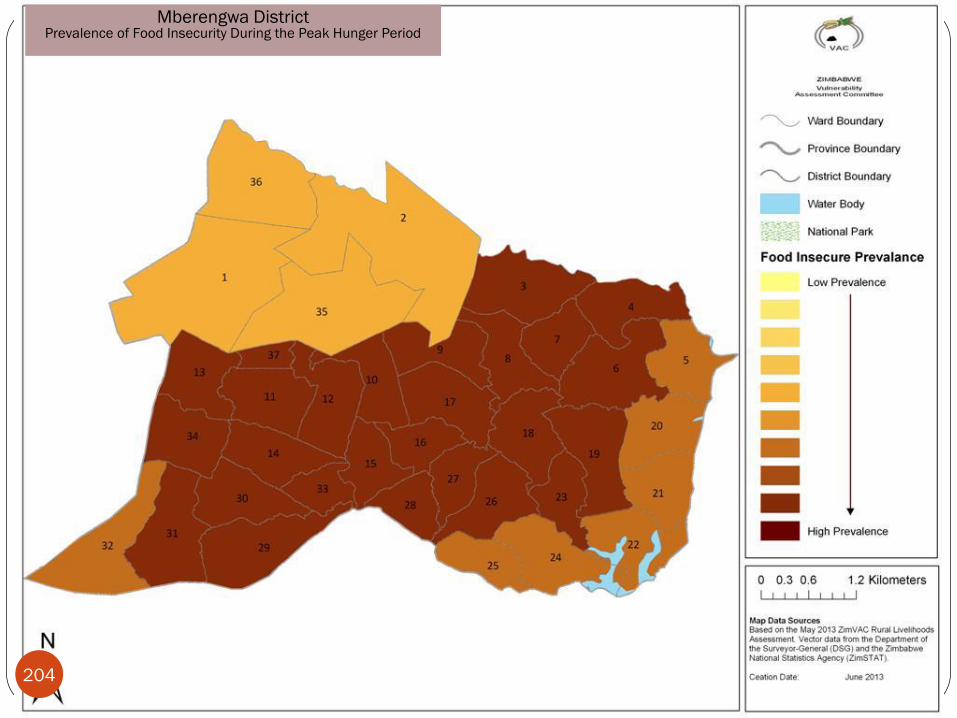
Mberengwa District Prevalence of Food Insecurity During the Peak Hunger Period
204
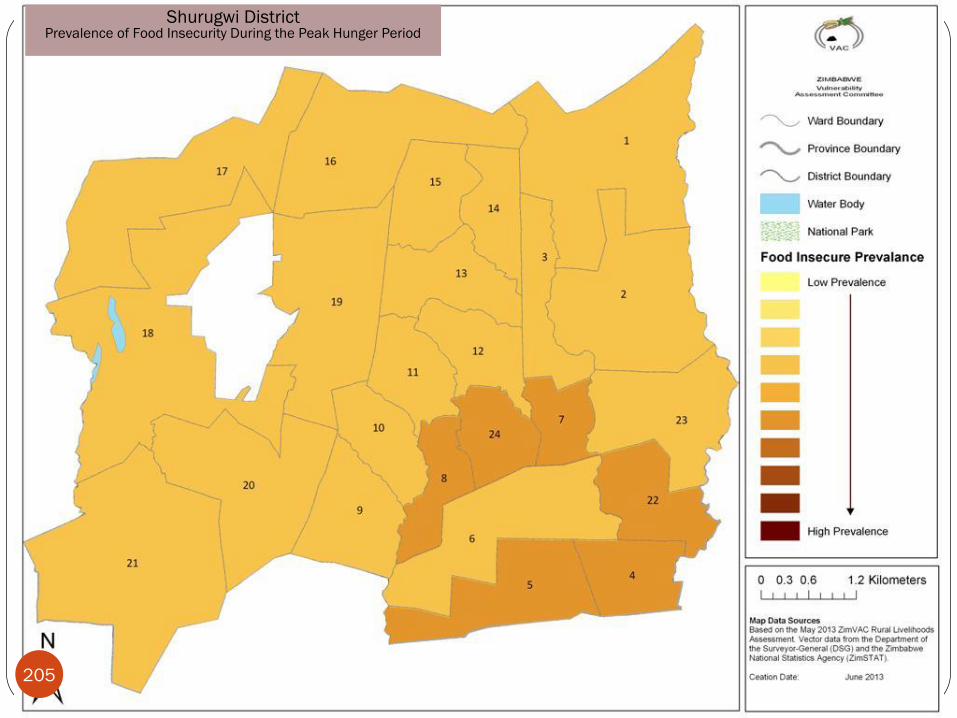
Shurugwi District Prevalence of Food Insecurity During the Peak Hunger Period
205
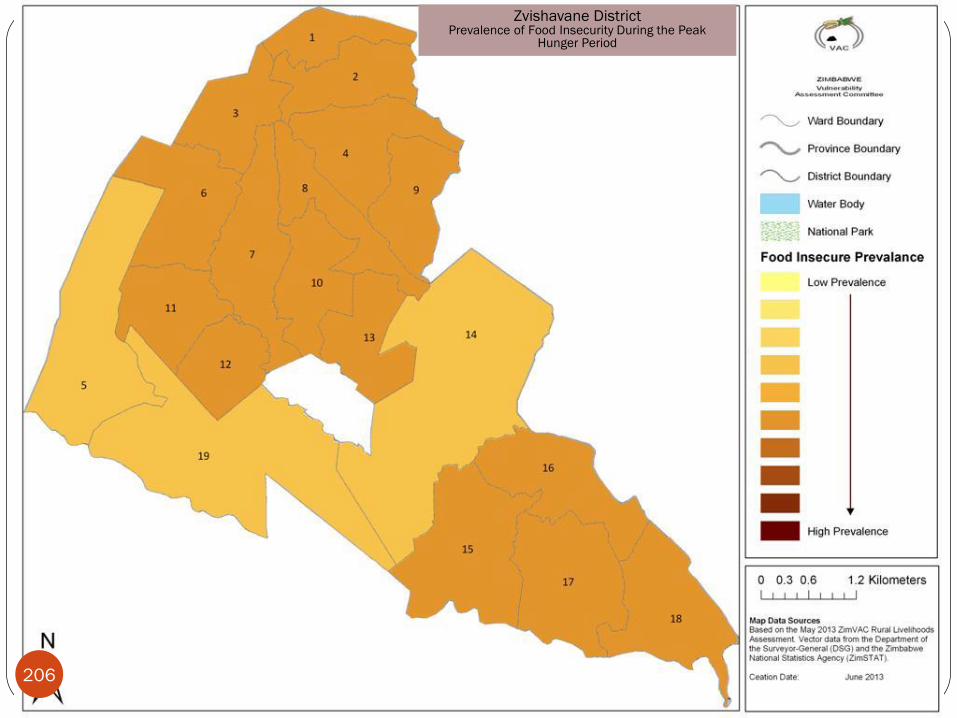
Zvishavane District Prevalence of Food Insecurity During the Peak
Hunger Period
206
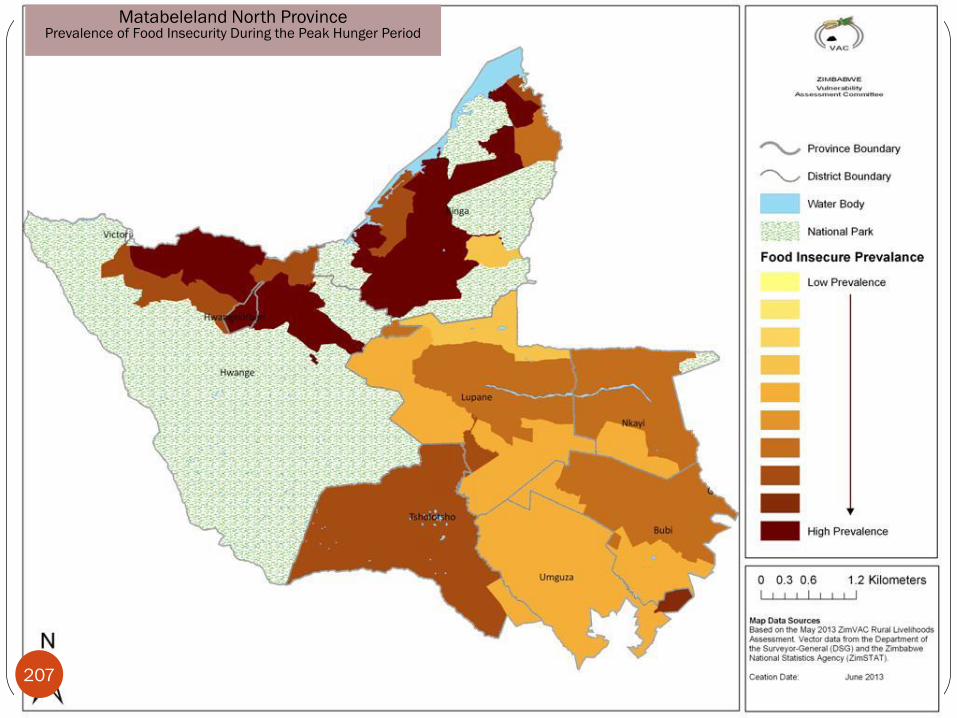
Matabeleland North Province Prevalence of Food Insecurity During the Peak Hunger Period
207
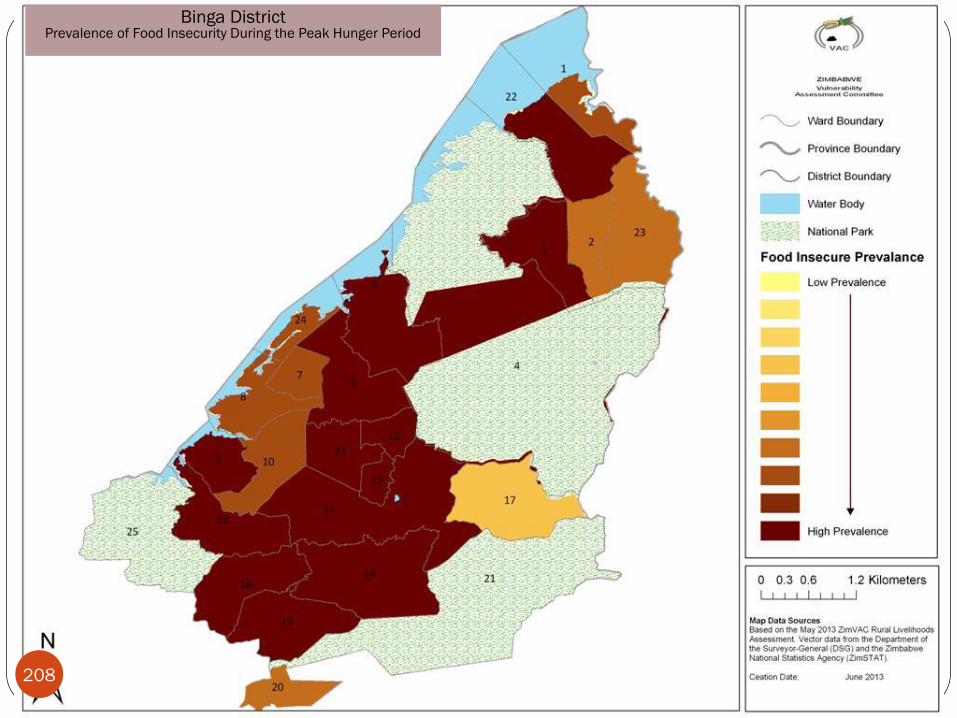
Binga District Prevalence of Food Insecurity During the Peak Hunger Period
208
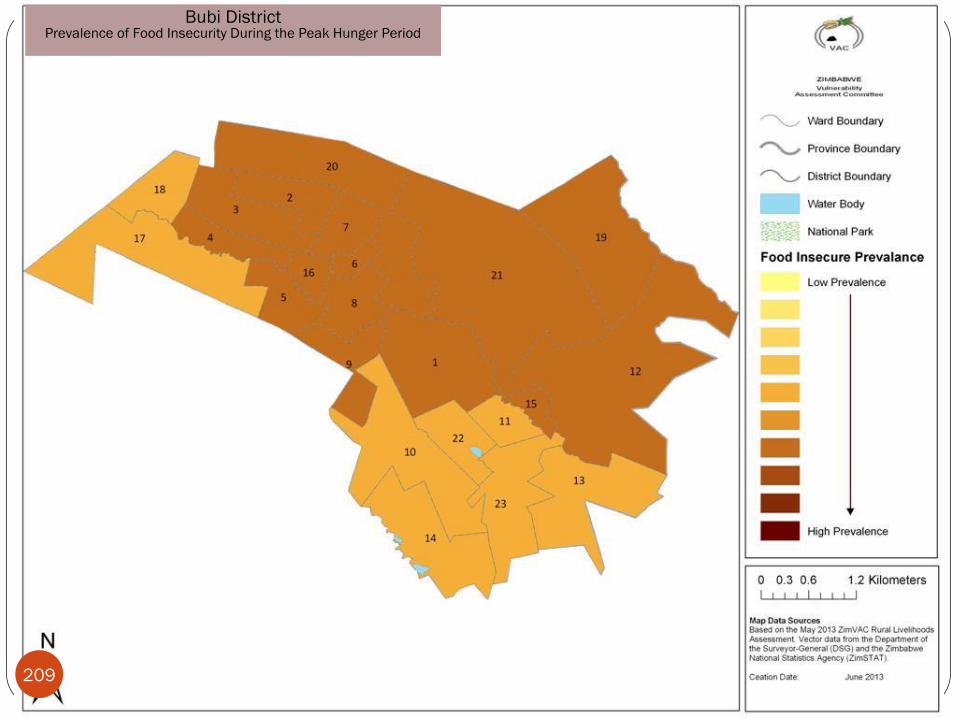
Bubi District Prevalence of Food Insecurity During the Peak Hunger Period
209
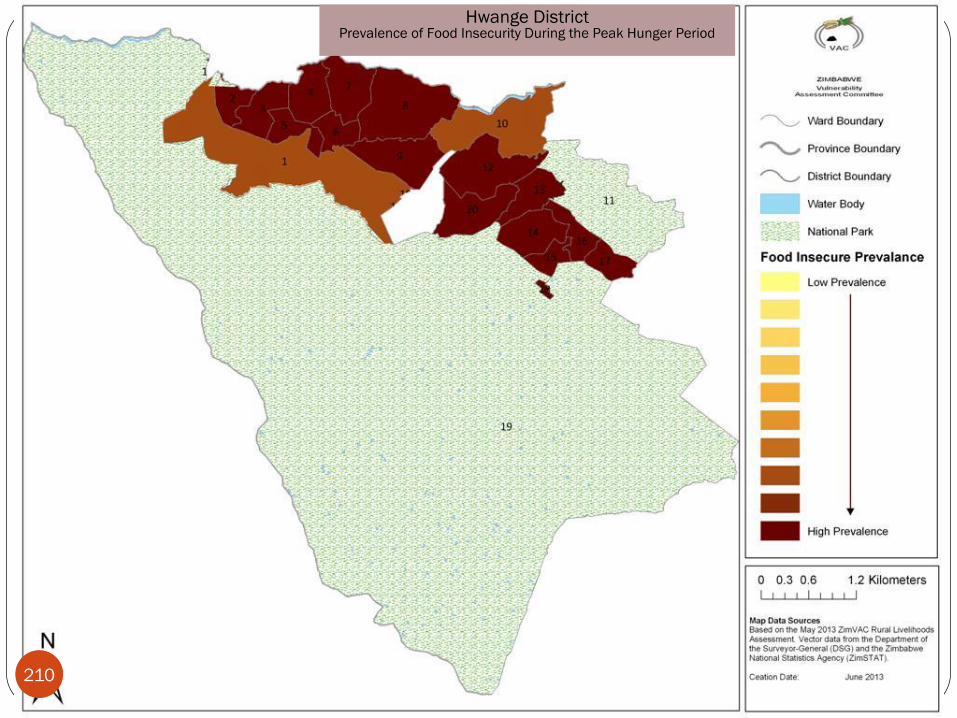
Hwange District Prevalence of Food Insecurity During the Peak Hunger Period
210
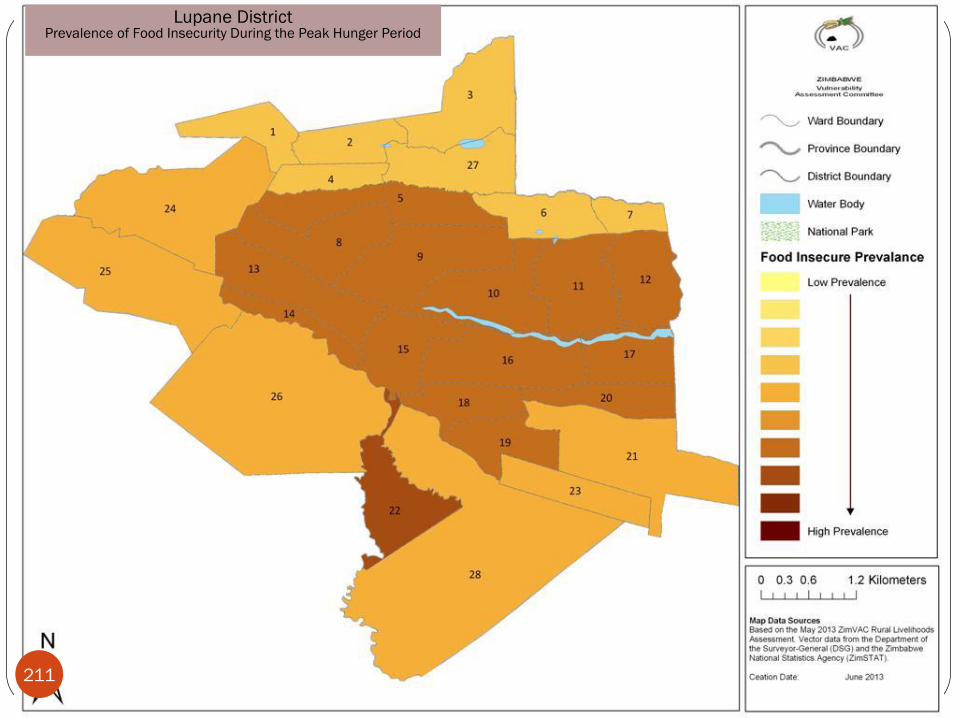
Lupane District Prevalence of Food Insecurity During the Peak Hunger Period
211
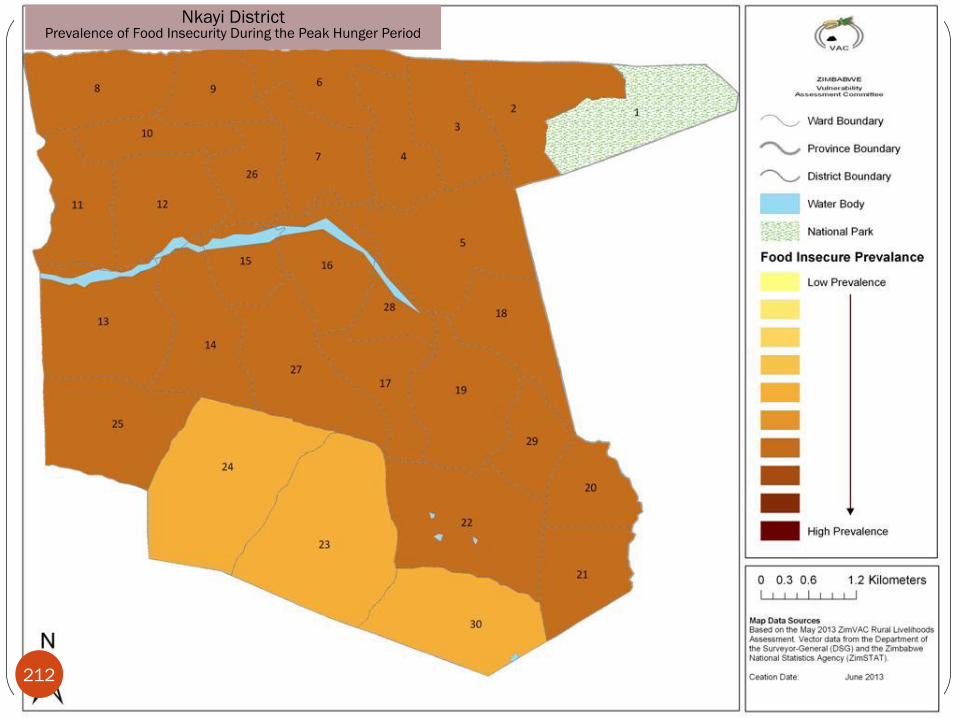
Nkayi District Prevalence of Food Insecurity During the Peak Hunger Period
212
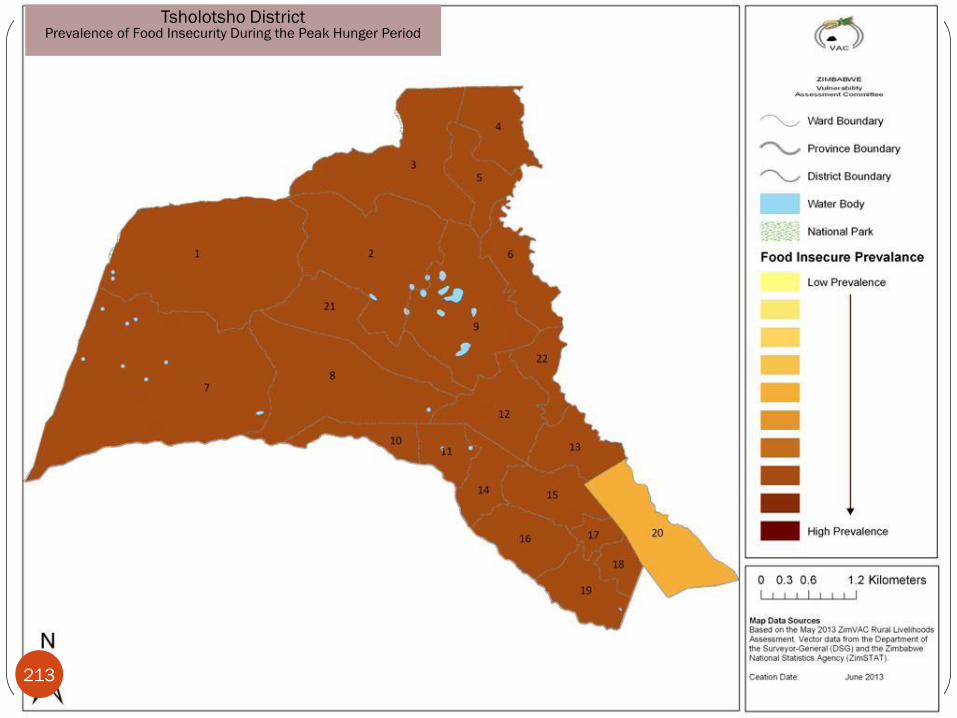
Tsholotsho District Prevalence of Food Insecurity During the Peak Hunger Period
213
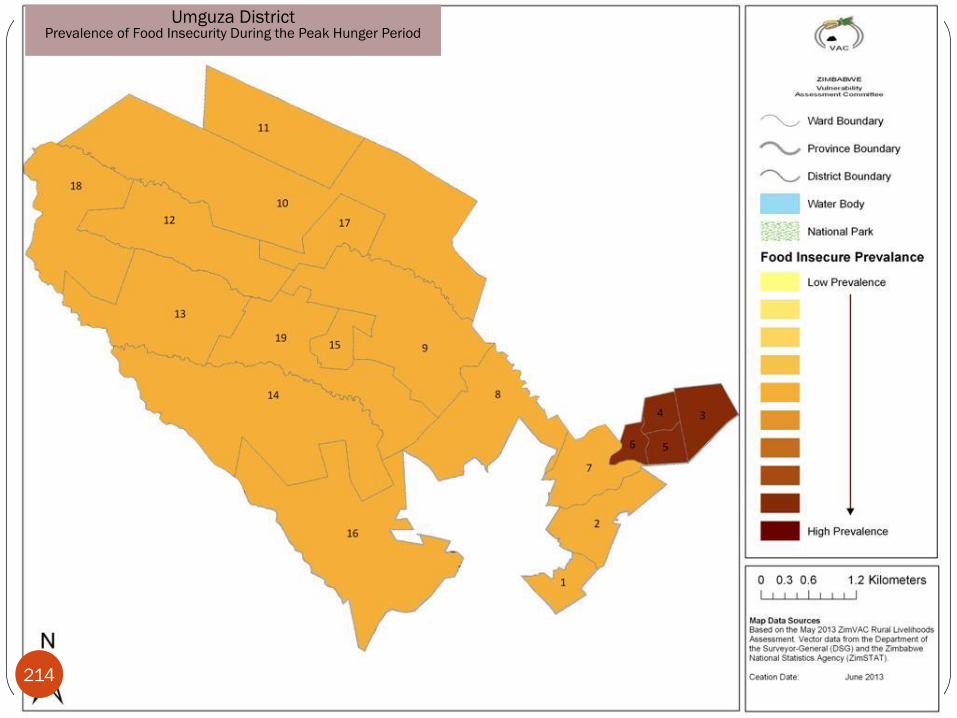
Umguza District Prevalence of Food Insecurity During the Peak Hunger Period
214
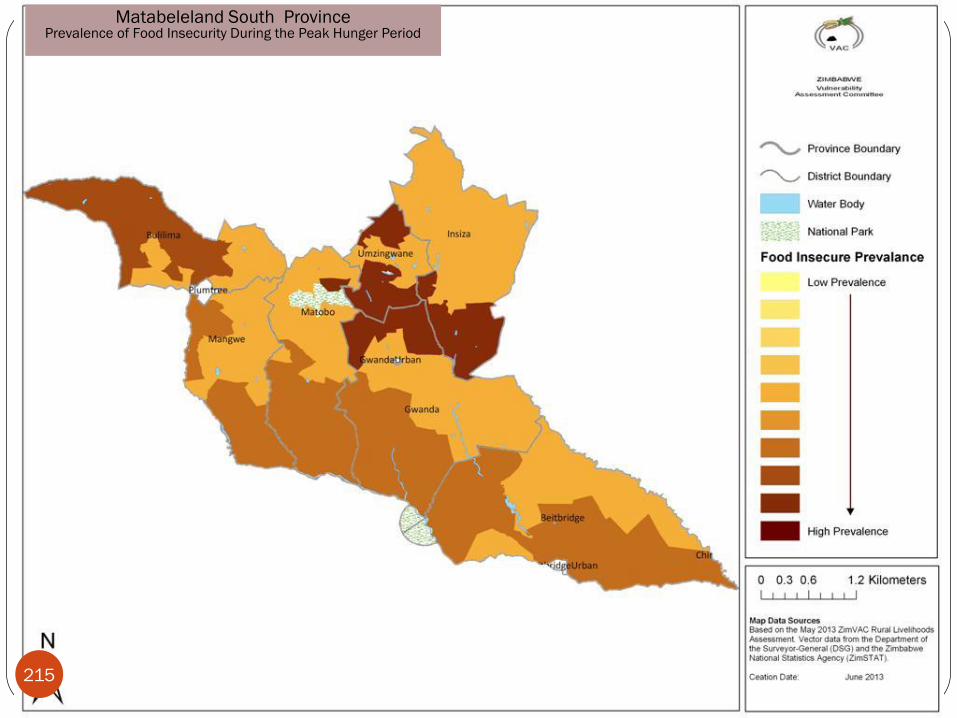
Matabeleland South Province Prevalence of Food Insecurity During the Peak Hunger Period
215
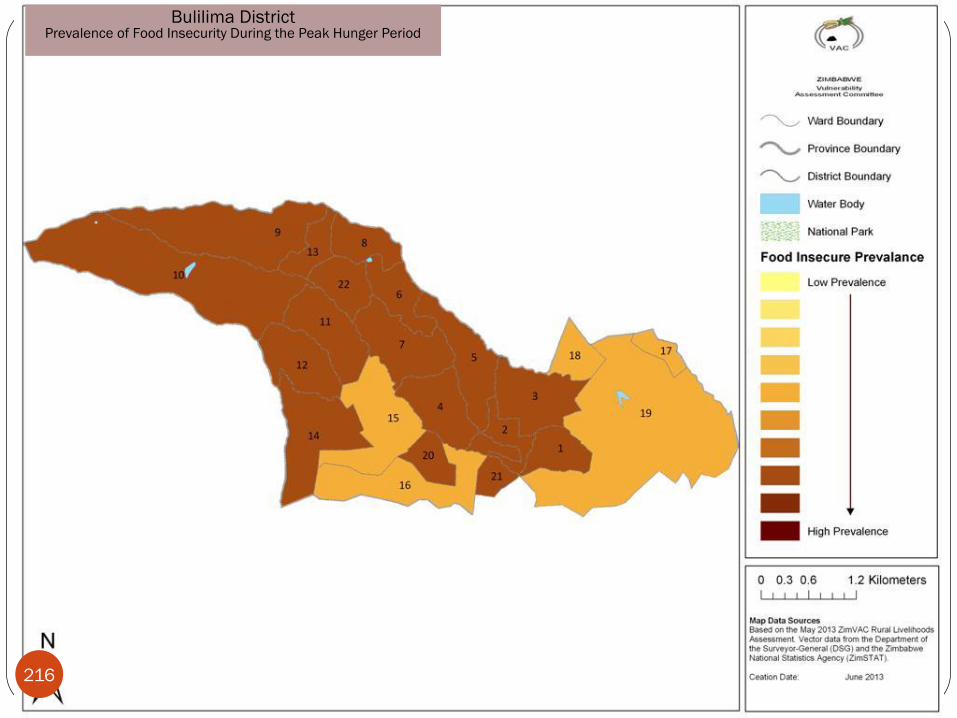
Bulilima District Prevalence of Food Insecurity During the Peak Hunger Period
216
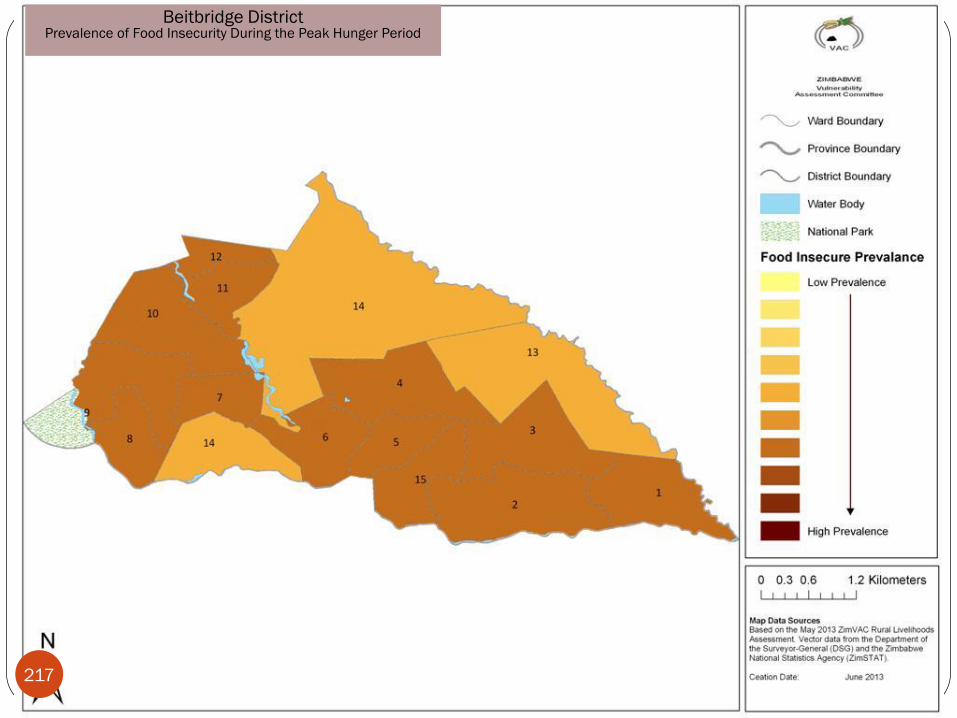
Beitbridge District Prevalence of Food Insecurity During the Peak Hunger Period
217
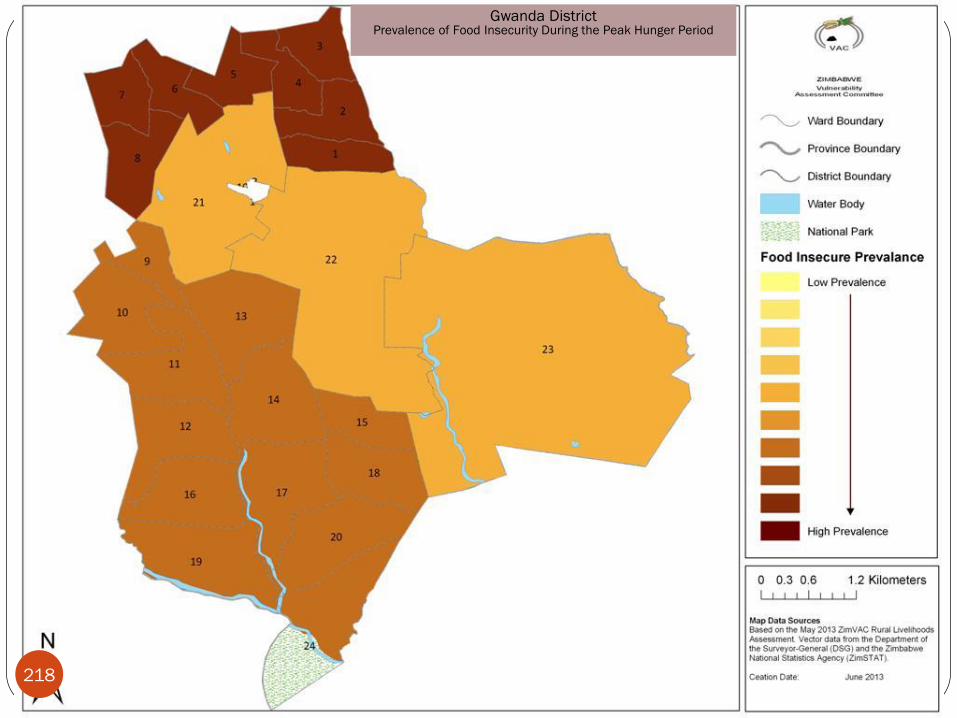
Gwanda District Prevalence of Food Insecurity During the Peak Hunger Period
218
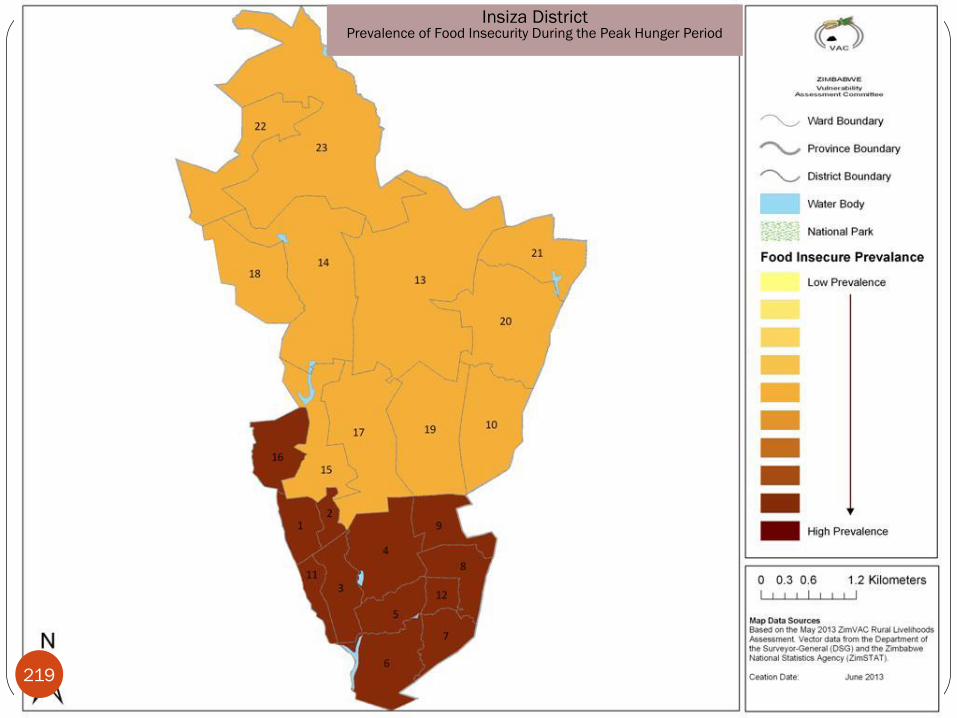
Insiza District Prevalence of Food Insecurity During the Peak Hunger Period
219
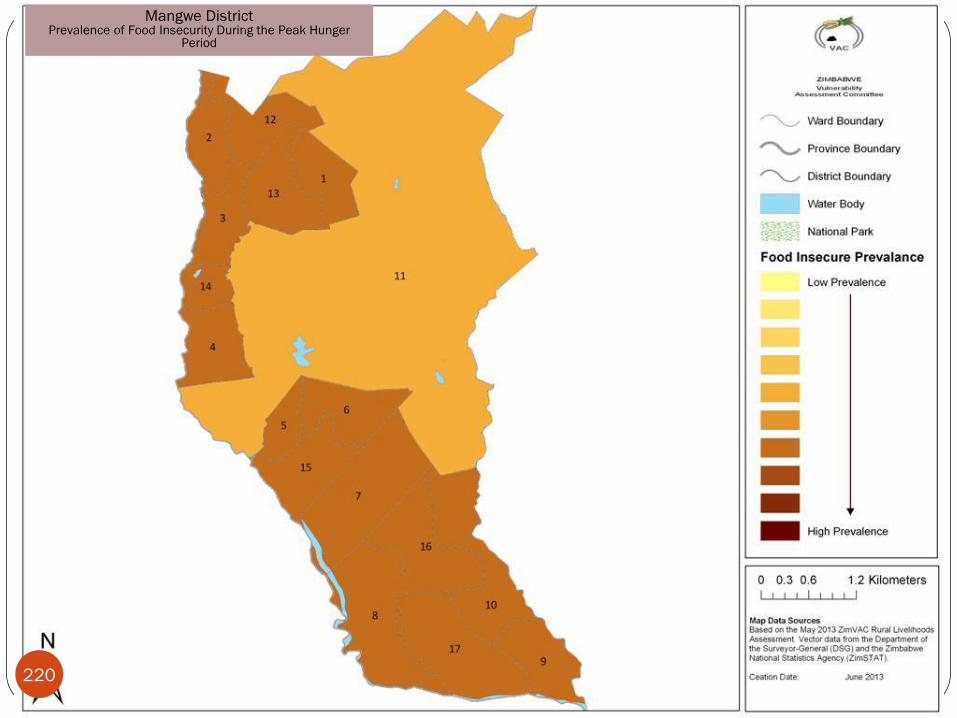
Mangwe District Prevalence of Food Insecurity During the Peak Hunger
Period
220
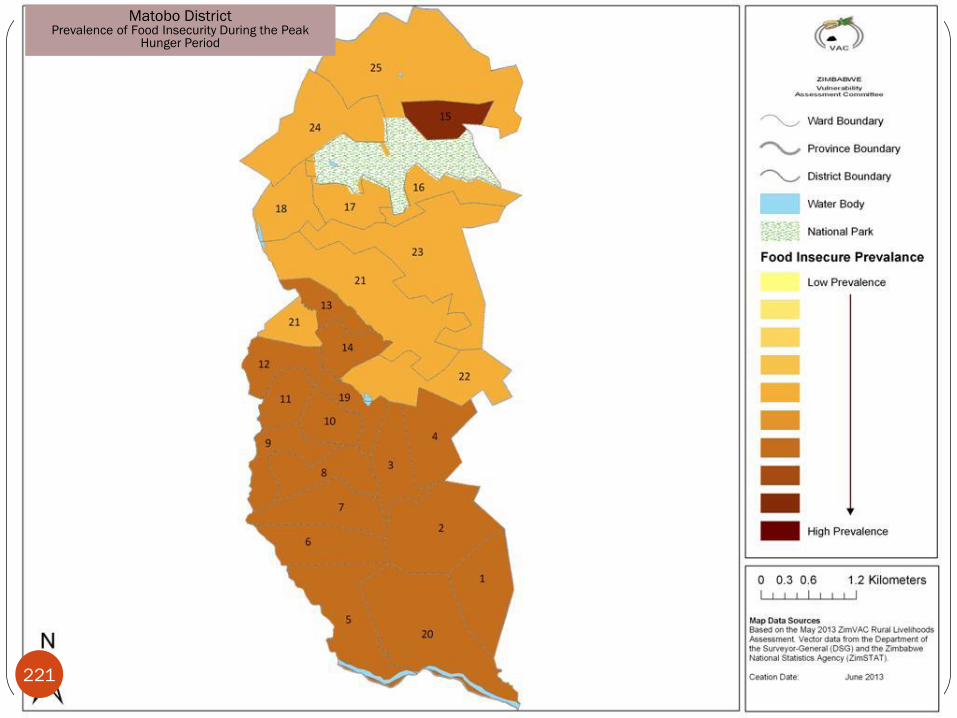
Matobo District Prevalence of Food Insecurity During the Peak
Hunger Period
221
Proportion of Food Insecure Households At Peak Hunger Period (Jan – Mar)
by Natural Region
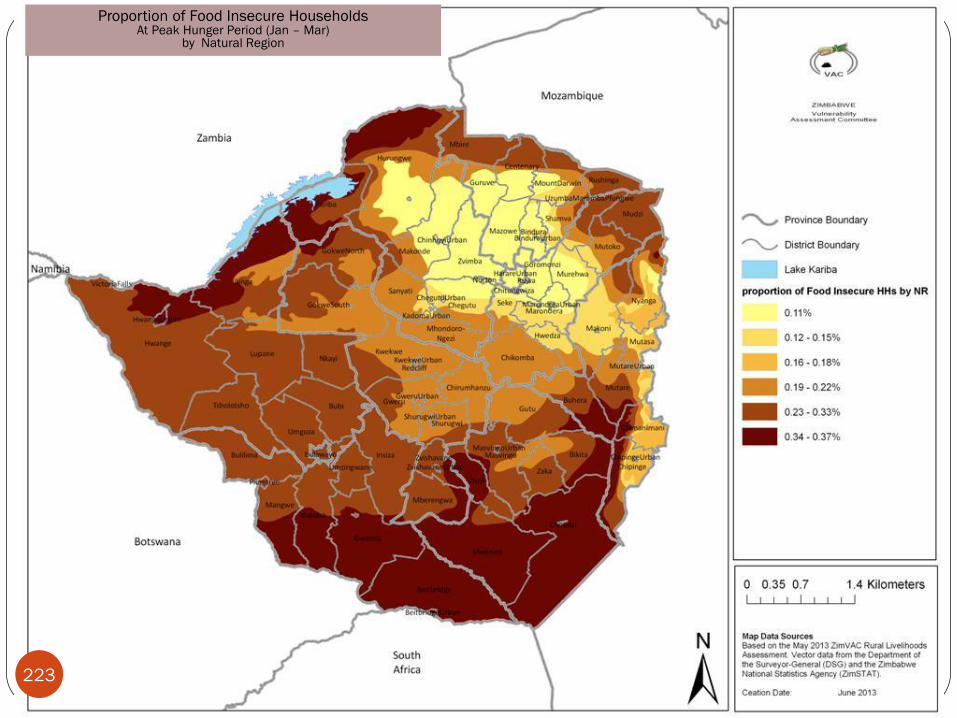
Proportion of Food Insecure Households At Peak Hunger Period (Jan – Mar)
by Natural Region
223

224
Partners Government
Delilah Takawira Ruth Machaka
Sandra Mudzengere
Tiwonge Machiwenyika Kudzai Mukudoka
Mildred Mapani
Brighton Munatsi Ruramai Mpande
Herbert Zvirere
Daison Ngirazi
Yvonne Vhevha
Arnold Damba
Yvonne Mavhunga
Preachered Donga
Brighton Nhau
Lloyd Chadzingwa
Thabisani Moyo
Godfrey Kafera
Tatenda Mafunga
Innocent Mangwiro
Gift Magaya
Justin Mupeiwa
Tamburiro Pasipangodya
Perpetual Nyadenga
Kudzayi Kariri
Kudakwashe Chimanya
Admire Jongwe
Nozizwe Chigonga
The ZimVAC Technical Team For The Assessment

Coordination Team
225
George D Kembo- Overall Coordination
Yvonne Mavhunga-Technical Coordination
Lameck Betera- Logistics Coordination
Blessing Butaumocho- Technical Advisor


