1 Zinc Availability to Rice From Seven Granular Fertilizers J.F. Liscano, C.E. Wilson, Jr., R.J. Norman, and N.A. Slaton INTRODUCTION Zinc deficiency has been documented throughout the rice growing areas of the world (Jones et al., 1982). Most of the reports concerning Zn deficiency in rice have been associated with soil pH values above 6.5 (Nene, 1966; Westfall et al., 1971; Sedberry et al., 1971; Wells et al., 1973; Katyal and Ponnamperuma, 1974; Mikkelsen and Brandon, 1975). Many of the aforementioned researchers observed yield increases resulting from appli- cation of Zn fertilizer. In Arkansas, application of Zn to the rice crop is recommended on silt loam soils that have a pH greater than 6.5 or on silt loam soils that have been precision-leveled within the past 2 years (Slaton et al., 1994). In the mid 1970s, most of the Zn applied to rice fields was granular ZnSO 4 , but in the late 1980s Zn was also applied as dissolved pow- ders of ZnSO 4 and Zn chelate. In addition, new sources have appeared on the market. Some are recommended by the manufacturer for blending with primary nutrients, and some claim to have better efficiency than ZnSO 4 , which is considered the most immediately available source. Zinc deficiency symptoms include a subtle chlorosis beginning at the base of the leaf blade, a purplish-brown discoloration known as bronz-
Transcript
1
Zinc Availability to RiceFrom Seven Granular Fertilizers
J.F. Liscano, C.E. Wilson, Jr., R.J. Norman, and N.A. Slaton
INTRODUCTION
Zinc deficiency has been documented throughout the rice growingareas of the world (Jones et al., 1982). Most of the reports concerning Zndeficiency in rice have been associated with soil pH values above 6.5 (Nene,1966; Westfall et al., 1971; Sedberry et al., 1971; Wells et al., 1973; Katyaland Ponnamperuma, 1974; Mikkelsen and Brandon, 1975). Many of theaforementioned researchers observed yield increases resulting from appli-cation of Zn fertilizer. In Arkansas, application of Zn to the rice crop isrecommended on silt loam soils that have a pH greater than 6.5 or on siltloam soils that have been precision-leveled within the past 2 years (Slatonet al., 1994). In the mid 1970s, most of the Zn applied to rice fields wasgranular ZnSO
4, but in the late 1980s Zn was also applied as dissolved pow-
ders of ZnSO4 and Zn chelate. In addition, new sources have appeared on
the market. Some are recommended by the manufacturer for blending withprimary nutrients, and some claim to have better efficiency than ZnSO
4,
which is considered the most immediately available source.Zinc deficiency symptoms include a subtle chlorosis beginning at
the base of the leaf blade, a purplish-brown discoloration known as bronz-
AAES Research Bulletin 963
2
ing, and loss of turgidity resulting in the plants floating on the surface ofthe water. The symptoms usually appear within 3 d after flooding, gener-ally appear first on the lower (oldest) leaves first, and progress upward asthe plant grows (Wells, 1980). If not corrected, a severe deficiency mayresult in the death of the rice seedlings.
Boawn et al. (1957) found that Zn applied as ground blast-furnaceslag and Zn frits was not readily available to corn (Zea mays L.) or bean(Phaseolus vulgaris L.) plants. But ground ZnSO4, ZnCO3, ZnO, and Zn3(PO4)2
were readily and equally available to corn and beans. Kang and Okoro(1976) observed that rice plants treated with ground ZnSO4, ZnEDTA, frit-ted Zn, and metallic Zn showed an increase in dry matter yield (DMY) overthat associated with no Zn treatment. They showed that uptake of frittedZn was less than that of ZnSO4 and ZnEDTA. These researchers demon-strated that even when the zinc is ground, some sources were not as effec-tive as other Zn fertilizers.
Mordvedt (1992) concluded that powder forms of ZnO and ZnSO4
were as effective as Zn fertilizers. He also found that at least 40% of thetotal Zn in granular fertilizers should be water-soluble to be fully effectivefor corn. Similarly, Amrani et al. (1997) stated that in corn, at least 50% ofthe total Zn in granular fertilizers should be water soluble in order to sup-ply the needs of the current crop. If the water solubility of a Zn fertilizer isrelated to the efficiency of the fertilizer, water-soluble Zn could prove use-ful as a method to characterize Zn sources for rice. However, there is littleinformation regarding the effect of granule size on Zn availability to plants.It would be expected that if placement and distribution of Zn sources playa key role in their agronomic efficiency (Mordvedt, 1991; Wells, 1980) thesize of a granule should also influence the effectiveness of the source.
Since Zn deficiency was first observed in crop plants, many extractingsolutions have been developed to establish a relationship between plant-available Zn, measured as either plant Zn concentration or total Zn uptakeby the plant, and soil-extractable Zn (Martens and Lindsay, 1990). BecauseZn deficiency in rice is more prevalent when the soil pH is greater than 6.5,most of the methods used are those that have been developed for cropsother than rice grown under either calcareous or alkaline conditions.Selvarajah et al. (1982) and Singh and Takkar (1981) found a strong posi-tive correlation between Zn extracted by the EDTA(NH4)2CO3 (Ammoniumcarbonate ethylenediaminetetraacetic acid) method and Zn concentrationin the tissue of the rice plant. However, Ponnamperuma et al. (1981) rec-ommended the use of 0.05N HCl over that of EDTA(NH4)2CO3 on the basisof the availability and superior performance of HCl during the chemicalanalysis when atomic absorption spectroscopy is used. They observed that
Zinc Availability to Rice From Seven Granular Zinc Fertilizers
3
EDTA(NH4)2CO3 tended to clog the atomizer on the spectrophotometer.Ponnamperuma et al. (1981) found the 0.05N HCl method to be moreeffective in identifying Zn-deficient soils than DTPA (diethylene-triaminepentaacetic acid) and EDTA (NH4)2CO3.
Good correlations between nutrient concentrations in plants and DTPAsoil extracts have been found not only for Zn, but also for copper, iron, andmanganese (Lindsay and Norvell, 1978). This has resulted in the adoptionof DTPA as a universal soil extractant for micronutrients (Martens and Lind-say, 1990). Tiller et al. (1979) found a correlation coefficient of 0.79 be-tween DTPA-Zn and Zn concentration in the rice plants. Ziah et al. (1994)found similar results working with soils of Pakistan. He found DTPA-Zn tobe positively correlated to tissue Zn concentration, plant Zn uptake, DMY,and number of tillers per plant.
In Arkansas, prior to 1987, micronutrients were extracted with DTPA.However, recommendations for Zn application to rice fields were basedsolely on soil pH rather than extractable Zn (Slaton et al., 1994). After1987, the University of Arkansas Soil Testing Laboratory at Marianna andthe Diagnostic Research Laboratory at Fayetteville adopted the Mehlich 3extractant. Because Mehlich 3 is suitable for the extraction of macronutri-ents and micronutrients, many laboratories are adopting this method forroutine soil analyses (Martens and Lindsay, 1990). The use of ICPAES (in-ductively coupled plasma atomic emission spectroscopy) for multi-elementanalysis lends itself as a complement to the Mehlich 3 extractant. TheUniversity of Arkansas Cooperative Extension Service established less than1.1 mg of Zn kg–1 soil extracted by Mehlich 3 as a very low soil Zn level (SoilTest Recommendations Guide, University of Arkansas Cooperative Exten-sion Service, 1998). Nevertheless, a critical level for rice has not been estab-lished.
Vocaseck and Friedericks (1994) found that Mehlich 3 correlates posi-tively with DTPA. They developed the following equation to relate Mehlich3-extractable Zn to DTPA-Zn:
M3-Zn = 0.104 + 1.709(DTPA-Zn) [Eq. 1]
In Arkansas it has been suggested that Mehlich 3 extracts approxi-mately two times more Zn than DTPA (W.E. Sabbe, 1997 personal commu-nication).
The objectives of this study were to (1) evaluate several granular Znfertilizer sources for their effectiveness in increasing DMY, Zn concentra-tion, and total Zn uptake by rice shoots and in preventing Zn deficiencysymptoms in the greenhouse; (2) evaluate the solubility of Zn in water and
AAES Research Bulletin 963
4
solubility of Zn in a 2% EDTA solution of these sources as potential indicesof available Zn in various granular Zn sources; (3) determine the effect ofgranule size on the availability of Zn to rice from a low-solubility Znoxysulfate; and (4) establish a relationship between Zn extracted with DTPA(Lindsay and Norvell, 1978), Mehlich 3 (Mehlich,1984), and 0.05 M HCl(Katyal and Ponnamperuma, 1974) and DMY, Zn concentration, and Znuptake by rice grown on a Dewitt silt loam in the greenhouse.
MATERIALS AND METHODS
To achieve the given objectives, three greenhouse and laboratory ex-periments were conducted. Each experiment was conducted at the Univer-sity of Arkansas Main Agricultural Experiment Station with Dewitt (for-merly Crowley) silt loam (fine, montmorillonitic, thermic, Typic Albaqualfs)that was collected from the University of Arkansas Rice Research and Ex-periment Station.
The organic carbon of the soil was 1% , determined by dry combus-tion using a Leco CNS-2000 (Leco Corporation, St. Joseph, Mich.). Theoriginal DTPA-extractable Zn was determined to be 0.33 mg kg–1 by themethod of Lindsay and Norvell (1978). The pH of the soil was increasedfrom 6.8 to 7.5 on the basis of a buffer curve by addition of 1.2 g per pot(1.8 mg ha–1) of reagent-grade CaCO
3 15 d prior to planting to enhance the
probability of Zn deficiency.
Experiment 1
For the first greenhouse study, three rice plants (cv. Cypress) weregrown in black polyethylene pots 15 cm (6 in.) in diameter containing 1.5kg (3.3 lb) of the soil described above. Seven Zn sources described in Table 1were utilized in this study. The Zn sources were applied prior to plantingand mixed with the top 2 cm (0.78 in.) of soil at the rates of 0, 5.6, 11.2,16.8, and 22.4 kg of Zn ha–1 (i.e., 0, 5, 10, 15, and 20 lb acre–1). All sourceswere granules between 1 and 2 mm in diameter (Table 2). To promote Zndeficiency, phosphorus (P) was applied as reagent-grade Ca(H
2PO
4)
2 at a
rate of 0.56 g per pot ( 81 kg of P ha–1; 72 lb of P acre–1; 165 lb of P2O
5
acre–1) prior to planting.Ten pregerminated rice seeds were lightly embedded in the soil, which
had a water content by weight of 33% (Qw = 0.33). This water content was
approximately 80% of saturation. The rice plants were thinned to threeper pot 10 d after seeding. Nitrogen (N) was applied pre-flooding as a solu-tion of urea to provide 0.2 g of N per pot (100 kg N ha–1; 89 lb acre–1) 15 dafter seeding. The flood was established 16 d after seeding and maintained
Zinc Availability to Rice From Seven Granular Zinc Fertilizers
5
Table 2. Average number of granules per pot added to supply four Zn application rates†
for Experiment 1.
Granules
(kg ha–1)
Source 5.6 11.2 16.8 22.4
———————— (no. per pot) —————————
CoZinCo 5 9 14 18
Ruffin 14 26 40 51
F12 13 29 43 68
F20 5 9 13 17
F36 3 7 9 14
FZnS 3 5 8 10
Granusol 4 8 11 15
† Rates based on total Zn from product label.
Table 1. Characteristics of Zn sources used for Experiment 1.
Total Zn Concentration
Source Abbreviation Manufacturer† Labeled Measured‡ WS§ ES
—————— (%) ——————
Zn Sulfate CoZinco CoZinco, Inc. 31 31 100 100
Zn Lignosulfonate Ruffin Ruffin Micronutrients, Inc. 10 11 76 87
Zn Chelate¶ F12 Frit Industries, Inc. 12 16 71 65
Zn Oxy-Sulfate F20 Frit Industries, Inc. 20 27 54 39
Zn Oxy-Sulfate F36 Frit Industries, Inc. 36 28 4 11
Zn Sulfate FZnS Frit Industries, Inc. 36 32 100 100
Zn Carboxylate Granusol American Minerals, Inc. 36 31 3 49
† Note: The mention of a trade name does not constitute endorsement of that product.‡ Analysis of Zn was performed in accordance to the Official Methods of the AOAC and
inductively coupled plasma atomic emission spectroscopy.§ WS = water-soluble zinc; ES = EDTA-soluble Zn.¶ According to MSDS this product contains fulvic and citric acids.
at a depth of 5 cm during the remainder of the experiment.Plants were evaluated for the occurrence of bronzing (a purplish-brown
discoloration, typical of Zn-deficient rice) 7 d after flooding. The shoots ofthe rice plants were harvested 20 d after flooding, passed through a 0.2%phosphate-free detergent solution, rinsed twice with deionized water, dried
AAES Research Bulletin 963
6
to constant weight at 60ºC, ground with a Wiley Mill to pass a 0.850-mm(0.033-in.) screen, digested in nitric acid (HNO3), and analyzed by ICPAES(Jones and Case, 1990) on a Spectro Model D (Spectro Analytical Instru-ments, Finchburg, Mass.). Total Zn, water-soluble Zn, and EDTA-solubleZn were determined following the methods described by the Associationof Official Analytical Chemists (now known as AOAC International) (1995)(Table 1).
The experiment was arranged as a completely randomized factorialdesign with four Zn rates, seven Zn sources, and five replications. Five con-trol pots were also grown to provide a means for comparison. Analysis ofvariance and regression analyses were conducted with the PROC GLM pro-cedure in SAS (SAS Institute, Inc., 1988).
Experiment 2
A second greenhouse experiment was conducted by placing 8 kg (17.6lb) of soil in black polyethylene pots 25.4 cm (10 in.) in diameter. In orderto promote Zn deficiency, P was mixed with the top 2 cm of soil as reagent-grade Ca(H
2PO
4)
2 at a rate of 1.6 g per pot ( 81 kg of P ha–1; 72 lb of P acre–1;
165 lb of P2O
5 acre–1) prior to planting. Zinc was incorporated as granules
to the top 2 cm of soil 1 d prior to planting at a rate of 57 mg of Zn per pot(11.2 kg ha–1; 10 lb acre– 1).
The source utilized to provide the Zn treatments was 36% Znoxysulfate, a product containing 36% total Zn, of which 4% was water-soluble (Table 1). One hundred grams of the Zn oxysulfate was placed in anest of sieves consisting of the following sizes: 2.83, 2.36, 2.00, 1.70, and1.40 mm ( 0.11, 0.09, 0.08, 0.07, and 0.06 in.). The contents of the 2.36-,2.00-, and 1.40-mm sieves were used as treatments and were designated as2.5, 2.0, and 1.5 mm, respectively. The powder treatment consisted of Znoxysulfate ground with a mortar and pestle. A more detailed description ofthe particle size distribution of the powder is shown in Table 3.
Twenty pregerminated rice seeds (cv. Cypress) were lightly embeddedin the soil, which was saturated with water (3 mm of water was standingon the surface of the soil). The rice plants were thinned to 10 per pot 10 dafter planting. Urea was applied at a rate of 1.85 g per pot dissolved in 50 mLof double deionized water in order to provide 853 mg of N per pot (equiva-lent to 150 lb of N acre–1) 1 d prior to flooding. The flood was established15 d after planting and maintained at a depth of 10 cm (4 in.) for theremainder of the experiment.
The plants were evaluated for symptoms of Zn deficiency 7 d afterflooding and harvested 20 d after flooding. Measurements were made forplant height and number of tillers per plant. The plants were then dried,
7
weighed, ground, and analyzed for Zn as previously described.The experiment had a single factor (granule size) and was arranged in
a completely randomized design with five treatments and four replications.The five particle-size treatments were powder (< 1.5 mm), 1.5, 2.0, 2.5 mm,and an untreated check. Analysis of variance and regression analyses wereperformed with the PROC GLM procedure in SAS (SAS institute, 1988).
Experiment 3
One of the limitations to making accurate Zn fertilizer recommenda-tions is the absence of a suitable soil test procedure. As a preliminary ap-proach to developing a Zn soil test method, a greenhouse study was con-ducted to determine whether extractable Zn determined by three methodscould be related to rice dry matter and Zn uptake. The greenhouse experi-ment was implemented by filling black polyethylene pots (15 cm in diam-eter) with 1.5 kg of the Dewitt silt loam described above. Zinc was incorpo-rated as granules of CoZinco ZnSO4 at rates of 0, 5.6, 11.2, 16.8, and 22.4 kgof Zn ha–1 calculated on an area basis. Nitrogen was applied as urea at a rateof 0.2 g of N per pot (100 kg ha–1; 89 lb acre–1) dissolved in 100 mL ofdouble deionized water 6 h prior to flooding.
Fifteen pregerminated rice seeds (cv. Cypress) were lightly embeddedin the soil, which had a water content by weight of 33% (QW = 0.33). Thiswater content was approximately 80% of saturation. The rice plants werethinned to five per pot 10 d after planting. The flood was imposed 15 dafter planting and maintained at a depth of 5 cm throughout the remain-der of the experiment.
The plants were evaluated for symptoms of Zn deficiency 7 d after
Table 3. Approximate particle size (X) of 36 % Zn oxysulfate used as “Powder” treatmentin Experiment 2.
DistributionParticle Size† (%)
X > 1 mm 5.8
1 mm > X > 0.420 mm 24.3
0.420 mm > X > 0.250 mm 19.1
0.250 mm > X > 0.149 mm 34.5
0.149 mm > X 16.3
† Based on a 25-g sample.
AAES Research Bulletin 963
8
flooding. Plants were harvested 20 d after flooding. The shoots were sepa-rated from the roots and washed in a 0.2% phosphate-free detergent solu-tion, and then rinsed two times with double deionized water. The planttissue was dried to constant weight at 80ºC in a forced-air oven, weighed,and ground with a Wiley Mill to pass through a 0.850-mm screen. A 0.5-gsample was digested with HNO3 by the method described by Jones andCase (1990) and analyzed by ICPAES on a Spectro Model D.
A soil sample was obtained from each observation prior to planting,and extracted by DTPA (Lindsay and Norvell, 1978), Mehlich 3 (Mehlich,1984), and 0.05M HCl (Katyal and Ponnamperuma, 1974) following theprocedure described by the original authors of each method. The extrac-tion was performed in 60-ml polyethylene bottles at 200 reciprocationsper minute on a horizontal shaker. The extracted soil was filtered through125-mm Whatman 42 paper and collected in 20-ml polyethylene vials.The extracts were analyzed by ICPAES.
The experiment had a single factor, Zn rate, and was arranged in acompletely randomized design with five treatments and five replications.The treatments were 0, 5.6, 11.2, 16.8, and 22.4 kg of added Zn ha–1 (0, 5,10, 15, and 20 lb acre–1). Analysis of variance was performed to determinethe effect of rate on plant parameters, and regression analysis was used toestablish a relationship among soil test methods and plant parameters withSAS (SAS Institute, 1988).
RESULTS AND DISCUSSION
Experiment 1
Occurrence of Symptoms. The frequency of the occurrence of bronz-ing is shown in Figure 1. When analyzed in a contingency table using achi-squared test of homogeneity, the Zn sources fell into two significantly(a = 0.05) different groups. Group 1: CoZinCo, F12, F20, Ruffin, and FZnShad bronzing showing in 24% of the pots. Group 2: F36, Granusol, and thecontrol showed bronzing in 67% of the pots. Thus the sources in group 1appeared to be effective in reducing the occurrence of bronzing. In most ofthe pots, bronzing symptoms had attenuated by harvest time. The self-recovery of Zn-deficient rice has been previously reported (Nene, 1966).
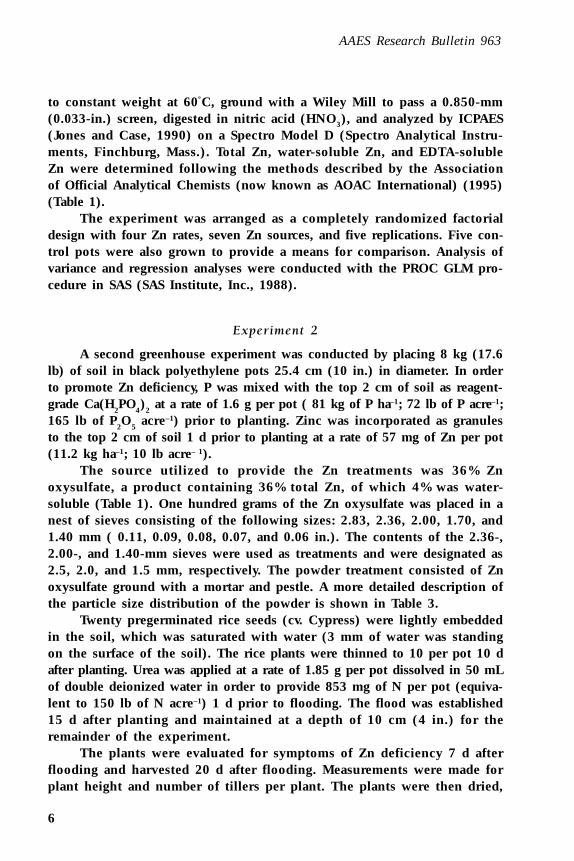
Dry Matter Yield. Rice DMY did not show a statistically significantinteraction between the Zn source and the rate applied. Application ofCoZinco, F12, F20, and Ruffin significantly increased DMY compared withthe control (Fig. 2). There was also an increase in DMY due to applicationof FZnS, but this increase was significantly lower than the increase ob-tained from the sources previously mentioned. Granusol and F36 failed toincrease DMY.
Zinc Availability to Rice From Seven Granular Zinc Fertilizers
9
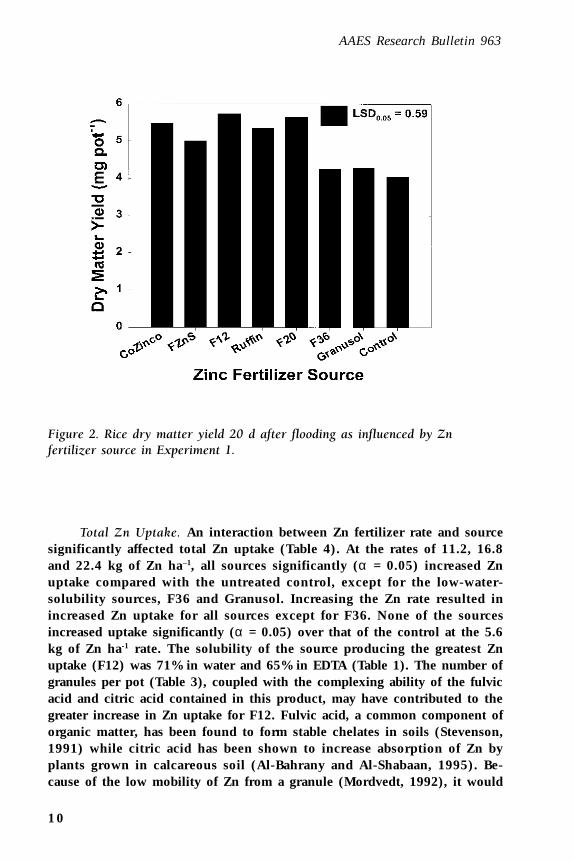
A significant linear increase in DMY was observed with increasingrates of Zn (Fig. 3). The high coefficient of determination (R2 = 0.92) indi-cates a strong relationship between DMY and Zn fertilizer rate. On thissoil, the DMY increased an average of 69 mg per pot (34 lb acre–1; 38 kg ha–1)for each additional kilogram of Zn ha–1 applied.
Tissue Zn Concentration. A significant interaction between Zn sourceand Zn rate was observed for Zn concentration in the rice plant. The tissueZn concentration of the control plants was 19 mg kg–1 (19 ppm) (Table 4).This concentration is in the ‘likely deficient range’ of 15 to 20 mg of Znkg–1, which has been reported by Tanaka and Yoshida (1970) and Sedberryet al. (1971). The mean tissue Zn concentration of plants receiving CoZinco,FZnS, F12, F20, and Ruffin were significantly higher than the tissue Znconcentration of plants in the control pots at all except at the 5.6-kg ha–1
rate. However, the mean Zn concentrations of plants treated with Granusoland F36 at 5.6, 11.2, and 16.8 kg ha–1 were either lower or the same asplants in the control pots (Table 4).
Figure 1. Comparison of the frequency of Zn deficiency symptoms associatedwith seven Zn fertilizer sources in Experiment 1.
AAES Research Bulletin 963
1 0
Figure 2. Rice dry matter yield 20 d after flooding as influenced by Znfertilizer source in Experiment 1.
Total Zn Uptake. An interaction between Zn fertilizer rate and sourcesignificantly affected total Zn uptake (Table 4). At the rates of 11.2, 16.8and 22.4 kg of Zn ha–1, all sources significantly (α = 0.05) increased Znuptake compared with the untreated control, except for the low-water-solubility sources, F36 and Granusol. Increasing the Zn rate resulted inincreased Zn uptake for all sources except for F36. None of the sourcesincreased uptake significantly (α = 0.05) over that of the control at the 5.6kg of Zn ha-1 rate. The solubility of the source producing the greatest Znuptake (F12) was 71% in water and 65% in EDTA (Table 1). The number ofgranules per pot (Table 3), coupled with the complexing ability of the fulvicacid and citric acid contained in this product, may have contributed to thegreater increase in Zn uptake for F12. Fulvic acid, a common component oforganic matter, has been found to form stable chelates in soils (Stevenson,1991) while citric acid has been shown to increase absorption of Zn byplants grown in calcareous soil (Al-Bahrany and Al-Shabaan, 1995). Be-cause of the low mobility of Zn from a granule (Mordvedt, 1992), it would
Zinc Availability to Rice From Seven Granular Zinc Fertilizers
1 1
Tab
le 4
. In
flu
ence
of
Zn
fer
tili
zer
sou
rce
and
rat
e on
ric
e d
ry m
atte
r yi
eld
an
d t
issu
e co
nce
ntr
atio
n 2
0 d
aft
er f
lood
ing
in E
xper
imen
t 1.
Zn
Zn
Tis
sue
Con
cen
trat
ion
Tot
al Z
n U
ptak
e
Rat
eC
oZin
coF
Zn
SF
12R
uffi
nF
20F
36G
ran
uso
lC
oZin
coF
Zn
SF
12R
uffi
nF
20F
36G
ran
uso
l—
——
——
——
——
——
— (
mg
kg–1
) —
——
——
——
——
——
——
——
——
——
——
——
——
(m
g pe
r po
t) —
——
——
——
——
——
—
01
9.7
81
.4
5.6
21
.42
0.5
23
.12
2.1
23
.71
7.1
18
.01
09
.11
03
.01
23
.01
17
.21
25
.57
7.5
68
.2
11
.22
6.9
24
.63
2.0
29
.12
7.3
17
.02
0.1
15
1.7
13
8.4
17
6.1
13
5.9
15
3.7
58
.48
0.4
16
.83
5.0
35
.04
3.7
34
.93
3.0
19
.12
1.9
20
0.8
15
6.3
26
4.7
16
8.6
18
9.7
93
.19
4.7
22
.44
2.6
42
.24
4.4
40
.13
2.8
21
.42
1.0
22
4.5
21
2.4
26
7.4
25
5.1
18
3.7
93
.11
07
.2
LSD
6.8
44
.6
AAES Research Bulletin 963
1 2
Figure 3. Relationship between rice dry matter yield 20 d after flooding and ofZn fertilizer rate in Experiment 1.
be expected that a greater number of granules per pot would enhance theeffectiveness of a granular Zn fertilizer as a result of a more even distribu-tion throughout the soil.
Solubility in Water and in EDTA. Sources with 100% water-solubleZn did not improve uptake over the 71% water-soluble Zn source (Fig. 4).The source with 54% water-soluble Zn improved uptake over that of plantsin the control pots. Sources with 4% or less water-soluble Zn did not pro-vide a significant increase in DMY, Zn concentration, and total Zn uptakeover that of plants in the control pots (Fig. 2, Table 4). Mordvedt (1992)and Amrani et al. (1997) found that at least 40% or 50%, respectively, ofthe total Zn in granular fertilizers should be water-soluble to be effective.
Zinc uptake had both a linear and a quadratic response to water-solubleZn and EDTA-soluble Zn (Fig. 4). The larger values of R2 for water-solubleZn and the smaller levels of significance associated with them (Table 5)indicate that water-soluble Zn is more strongly correlated to Zn uptake andis a better predictor of uptake than EDTA-soluble Zn. With EDTA-solubleZn, the quadratic response was significant (α = 0.05) at only the rates of11.2 and 16.8 kg ha–1 (Table 6). A value of R2 = 0.64 (the highest obtained in
Zinc Availability to Rice From Seven Granular Zinc Fertilizers
1 3
this experiment) indicated that only 64% of the variability in Zn uptakecould be attributed to water-soluble Zn.
Another factor must have influenced Zn uptake, possibly placementor distribution of the granules. Of the effective sources, F12 and Ruffin hadthe greatest number of granules per pot (Table 2). Because of the actual Zncontent of the sources used and their different densities, it was impossibleto apply the same number of granules to each pot (Table 3). The sourcesthat provided a significant increase in uptake were manufactured usingZnSO4 as the source of Zn. Those that did not increase uptake significantly
Figure 4. Total Zn uptake by rice 20 d after flooding as influenced by Znfertilizer rate and the amount of water-soluble Zn (A) or 2% EDTA-soluble Zn(B) in the fertilizer in Experiment 1.
AAES Research Bulletin 963
1 4
were manufactured with ZnO as the primary source of Zn.
Experiment 2
Occurrence of Symptoms. When the degree of bronzing was assessed7 d after flooding the rice, at least some degree of bronzing was observed in80% of the pots (Table 7). Powdered Zn oxysulfate was effective in reduc-ing the occurrence of bronzing. Plants receiving the powder form showedbronzing in only 25% of the pots. Bronzing in cotton has been associatedwith iron toxicity (Ponnamperuma et al., 1955) and with excess P, causingan accentuation of Zn deficiency due to a large P/Zn ratio (Cakmak andMarschner, 1986). In this study, plants showing bronzing appeared to havehigher P and also higher iron concentrations than plants not showing bronz-ing (Table 8).
Dry Matter Yield. Significantly greater DMY (22.5 g per pot) was ob-
Table 5. Statistical parameters associated with regression analysis of uptake andpercentage of water solubility (WS) for Experiment 1.
† WS = percentage of total Zn that is water-soluble.
† ES = percentage of total Zn that is EDTA-soluble.
Zinc Availability to Rice From Seven Granular Zinc Fertilizers
1 5
tained with application of powdered Zn oxysulfate compared with the no-Zn and the 2.5-mm treatments (Table 7). Plants receiving 1.5-mm granulesalso had significantly higher DMY than plants receiving no Zn and 2.5-mmgranules. When compared with all other treatments, the DMY of plantsreceiving 2-mm granules was not significantly different.
Plant heights and number of tillers per plant measured at harvest areshown in Table 7. Although height and tillering differed among treatments,the granule size did not significantly affect plant height or tillering. A posi-tive relationship could be observed between plant height and Zn uptake(R2 = 0.68), and between the number of tillers per plant and Zn uptake (R2
= 0.49) (Fig. 5). The Zn concentration in the rice shoots was not correlatedwith plant height or number of tillers per plant.
Tissue Zn Concentration. Plant Zn concentration was also influencedby the particle size of the Zn fertilizer (Table 7). The mean concentration ofplants receiving powder Zn oxysulfate was 23.4 mg kg–1. This value is inthe range of sufficiency as described by Tanaka and Yoshida (1970). Plantsreceiving granular Zn oxysulfate or no Zn had a significantly lower Znconcentration than plants receiving powdered Zn. The mean concentra-tion for these plants ranged from 17.1 to 17.6 mg kg–1, which is in the“likely Zn-deficient range” of 15-20 mg kg–1 (Tanaka and Yoshida, 1970).Since differences in DMY were significant among plants treated with noZn or granular Zn oxysulfate, the observation of similar concentrationsamong these treatments can be attributed to a dilution effect (Table 7).
Total Zn Uptake. Plants treated with powdered Zn oxysulfate had
Table 7. Plant height, number of tillers per plant, DMY, Zn concentration, Zn uptake, andpercentage of pots showing bronzing in rice treated with different granule size of
36% Zn oxysulfate in Experiment 2.
Granule Height Tillers per DMY Zn Zn Uptake BronzingSize (cm) Plant (g) (mg kg–1) (mg per pot) (%)
No Zn 63.08a 3.75a 12.02a 17.1a 0.20a 100
Powder 69.23b 5.25b 22.49b 23.4b 0.52b 25
1.5 mm 65.78a 5.25b 21.17b 17.2a 0.37ab 75
2.0 mm 69.98b 5.50b 16.96ab 17.6a 0.31ab 100
2.5 mm 64.58a 4.25ab 13.66a 17.6a 0.24a 100
LSD† 2.72 1.34 5.61 3.87
P-value 0.0002 0.0596 0.0044 0.0138
† Means in the same column followed by the same letter were not statistically significant at α =0.05 confidence level.
AAES Research Bulletin 963
1 6
Tab
le 8
. M
ean
nu
trie
nt
con
cen
trat
ion
an
d r
atio
s of
sel
ecte
d n
utr
ien
ts o
f ri
ce s
hoo
ts t
reat
ed w
ith
36
% Z
n o
xysu
lfat
e of
dif
fere
nt
gran
ule
siz
e in
Exp
erim
ent
2.
Gra
nu
le
size
Ca
KM
gN
aP
SC
uFe
Mn
Zn
P/Z
nK
/Na
Mg
/Na
Ca/
Na
——
——
——
——
—-(
g kg
–1)—
——
——
——
——
——
——
——
——
——
——
——
-(m
g kg
–1)—
——
——
——
——
——
——
——
No
Zn
1.7
6a
37
.0b
2.1
8c
1.1
2a4
.02
c2
.79a
5.9
5a
13
2a
89
9a
17
.08
a0
.02
4c3
3.5
9b
1.9
8c
1.5
96
b
Po
wd
er2
.07
c3
1.3
a1
.54
a2
.16
b2
.98
b2
.83a
6.4
5ab9
0a
10
36
ab2
3.4
0b
0.0
13a
14
.65
a0
.73
a0
.97
1a
1.5
mm
1.9
0ab3
3.8
ab1
.58ab
1.5
0a2
.78
c2
.77a
7.3
3ab
c1
09
a1
16
9b
c1
7.1
8a
0.0
16
b2
4.1
4ab
1.1
2ab1
.35
3ab
2.0
mm
1.9
5bc
36
.0b
1.7
7b
1.3
6a2
.90ab
3.1
9b
8.7
5bc
99
a1
34
0c
17
.55
a0
.01
7b
28
.39
b1
.38
b1
.51
8b
2.5
mm
1.8
3ab3
4.4
ab1
.65ab
1.4
7a2
.93ab
3.0
8b
8.1
5bc
13
4a
11
81
bc
17
.55
a0
.01
7b
25
.68
ab1
.23ab
1.3
40
ab
LSD
†0
.13
.56
0.2
10
.50
.17
40
.23
71
.84
4.4
11
81
.83
.87
0.0
03
21
1.8
60
.55
0.5
23
4
P-v
alu
e0
.00
40
.03
32
0.0
00
10
.00
70
.00
01
0.0
04
40
.02
68
0.1
87
90
.00
15
0.0
13
80
.00
01
0.0
46
90
.00
40
.15
79
†L
SDs
wer
e ca
lcu
late
d at
α =
0.0
5. M
ean
s in
th
e sa
me
colu
mn
fol
low
ed b
y th
e sa
me
lett
er a
re n
ot s
ign
ific
antl
y di
ffer
ent.
Ca
= ca
lciu
m;
Cu
= c
oppe
r; F
e =
iron
; K
= p
otas
siu
m;
Mg
= m
agn
esiu
m;
Mn
= m
anga
nes
e; N
= s
odiu
m;
P =
ph
osph
oru
s; S
= s
ulf
ur.
Zinc Availability to Rice From Seven Granular Zinc Fertilizers
1 7
significantly greater Zn uptake than plants receiving no Zn or 2.5-mm gran-ules (Table 7). Plants treated with 1.5- and 2-mm granules did not have asignificantly lower uptake than plants treated with the powdered Zn, butthey also were not significantly different from the control.
Even when a gradual increase in Zn uptake could be observed withdecreasing granule size (Table 7), only the powder form produced plantswith Zn concentrations in the sufficient range. This lack of efficiency ofthe granular form can be attributed to the low water solubility of the fertil-izer (Table 1, Fig. 4) and to the distribution of the granules throughout thesoil. Since granules of 1.5 mm weighed less than granules of 2.0 or 2.5 mm,
Figure 5. Relationship between rice plant height (A) or tiller production (B)and total Zn uptake by rice 20 d after flooding in Experiment 2.
AAES Research Bulletin 963
1 8
more smaller granules were used, resulting in a better distribution of theZn throughout the soil, higher surface area of contact of Zn fertilizer withthe soil, and subsequently better Zn uptake. The effect of distribution wasalso evidenced by the large variation in Zn uptake by plants treated withgranular Zn oxysulfate. The standard deviations in Zn uptake for plantstreated with granules of 1.5, 2.0, and 2.5 mm were 0.12, 0.14, and 0.08 mg,respectively, whereas for the no-Zn and powdered Zn treatments the stan-dard deviations were only 0.03 and 0.04 mg, respectively. Wells (1980) andWells et al. (1973) recommended 11.2 kg of Zn ha–1 (10 lb acre–1) for rice,although only 1 to 3 kg of Zn ha–1 (1 to 3 lb acre–1) was actually needed. Theexcess Zn was recommended to overcome the low mobility of Zn in the soiland the distribution problem associated with broadcasting 5 to 6 kg ha–1 ofgranular material.
Effect of Zn Sufficiency on Other Nutrients. The preferential uptakeof divalent cations over monovalent cations by Zn-deficient rice was re-ported by Moore and Patrick (1988). Their observations were corroboratedin this study (Table 8). Plants receiving powdered Zn oxysulfate showedless bronzing and had the highest DMY, Zn concentration, and Zn uptake(Table 7). These plants also had lower potassium-to-sodium, magnesium-to-sodium, and P/Zn ratios and a lower magnesium concentration thanplants treated with granular Zn oxysulfate (Table 8). This observation is ofparticular interest because the correlation coefficients associated with DMYand these ratios and nutrient concentrations are larger than the correla-tion coefficient for the DMY and Zn concentration (Table 9). Katyal andPonnamperuma (1974) also observed that the magnesium concentrationof Zn-deficient plants was always higher than that of healthy plants.
Welch at al. (1982) related Zn deficiency to leakage of low-molecular-weight solutes from the cell membrane of roots of Zn-deficient plants. Theapplication of powdered Zn oxysulfate seemed to have brought about adifferent yet beneficial nutrient balance that resulted in a significant in-crease in DMY. The rice plants showed improved growth with higher tissueconcentration of sodium (Fig. 6), attributable to the addition of Zn. Al-though sodium is considered an essential micronutrient (Brownell, 1979)and some plants show an increase in DMY due to the uptake of sodium(Lehr, 1953), a beneficial effect of sodium on rice has not been documented.Marschner (1971) described the existence of plants that exhibit a positiveresponse to substitution of sodium for potassium in the tissue. The en-hancement in growth is primarily due to cell enlargement rather than anincrease in photosynthetic efficiency. A larger photosynthetic area resultsin increased DMY. In this experiment, when Zn was supplied to the plants,the tissue sodium concentration increased and the potassium concentra-tion decreased (Figs. 6 and 7). This apparent substitution of sodium for
Zinc Availability to Rice From Seven Granular Zinc Fertilizers
1 9
Figure 6. Relationship between rice dry matter production 20 d after floodingand sodium (Na) (A) or potassium (K) (B) uptake by rice in Experiment 2.
potassium was higher for plants receiving powdered Zn oxysulfate. Drymatter yield was negatively correlated (R2 = 0.39, P = 0.0033) to tissue po-tassium concentration (Fig. 6).
Table 9. Correlation coefficients associated with DMY and selected nutrients and ratios ofnutrients in rice shoots in Experiment 2.
Nutrient r P-value
Mg/Na –0.81 0.0001
Na 0.79 0.0001
K/Na –0.77 0.0001
Mg/Zn –0.72 0.0003
Ca/Na –0.72 0.0003
P/Zn –0.70 0.0005
M g –0.65 0.0016
Zn 0.51 0.0205
Ca = calcium; K = Potassium; Mg = magnesium; Na = sodium; P = phosphorus.
AAES Research Bulletin 963
2 0
Figure 7. Relationship between sodium (Na) uptake and potassium (K) uptakeby rice 20 d after flooding in Experiment 2.
Experiment 3
Dry Matter Yield. DMY was significantly different from the DMYs ofthe control pots only for plants receiving 11.5 kg of Zn ha–1 (Table 10). Thiswas in contrast to prior experiments in which significant increases in DMYwere obtained for treatments receiving more Zn (Fig. 3). The relationshipbetween the three different soil test methods and the DMY of the rice shoots
Table 10. Plant Zn concentration, uptake, and DMY of rice shoots grown at different levelsof Zn fertilization in Experiment 3.
Zn Rate Plant Zn Zn Uptake DMY(kg ha–1) (mg kg–1) (mg per pot) (g per pot)
0 12.9a 21a 1.56a
5.6 49.2b 98 b 1.97ab
11.2 55.4c 139c 2.49b
16.8 60.0d 135c 2.25ab
22.4 61.3d 135c 2.21ab
LSD† 3.2 34 0.76
P-value 0.0001 0.0001 0.1094
† Means followed by the same letter were not significantly different at α = 0.05.
Zinc Availability to Rice From Seven Granular Zinc Fertilizers
2 1
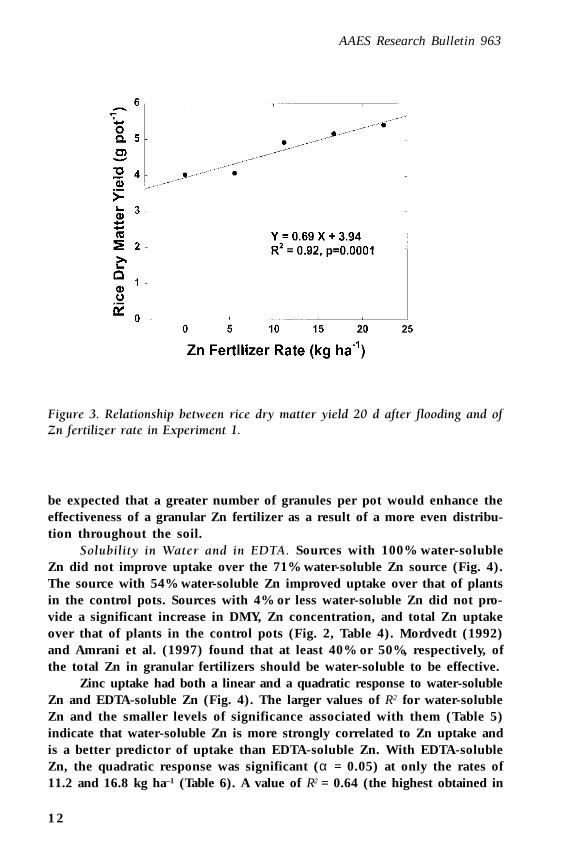
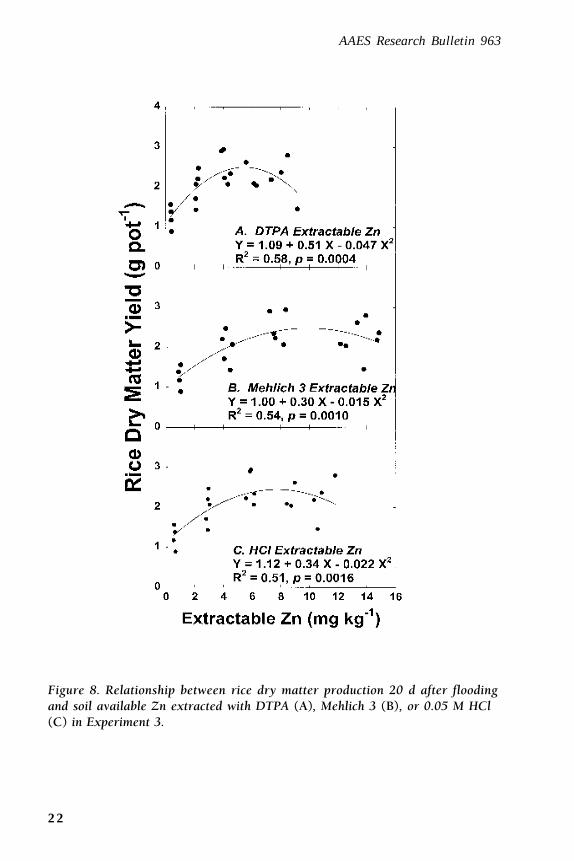
is illustrated in Figure 8. In each case, a significant quadratic response wasobserved. The DTPA extractant, considered the preferred micronutrientextractant (Jones et al., 1982), was slightly better at predicting rice DMY(R2 = 0.58) than the Mehlich 3 (R2 = 0.54) or HCl (R2 = 0.51) extractants.However, all the methods were highly significant.
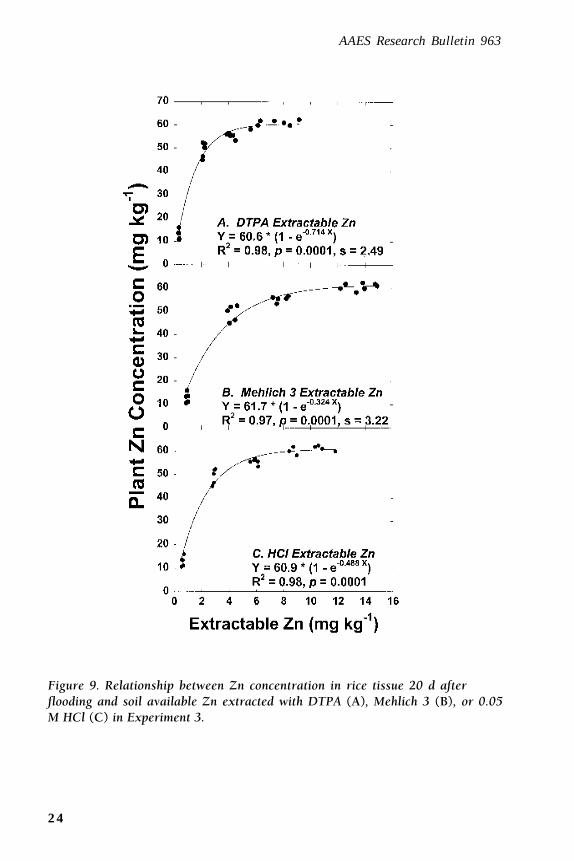
Tissue Zn Concentration. Plants receiving no Zn had an average tis-sue Zn concentration of 12.9 mg kg–1 (Table 10). This concentration wasassociated with soil-extractable Zn values of 0.37, 0.96, and 0.62 mg kg–1 ofDTPA-extractable Zn, Mehlich 3-extractable Zn, and HCl-extractable Zn,respectively (Fig. 9). Also, it falls within the “very likely Zn-deficient range”(10 to 15 mg kg–1) as defined by Tanaka and Yoshida (1970) and is belowthe 15-mg kg–1 critical level suggested by Sedberry et al. (1971). Plants fromthese pots were the only ones showing bronzing. Zinc concentration in-creased significantly with increases in the Zn application rate to 16.8 kgha–1 (Table 10). The Zn concentration in the tissue of plants grown in potstreated with 5.6 kg ha–1 increased sharply over that of plants grown with-out Zn. But a more gradual increase was observed for plants growing athigher Zn rates than for those grown at 5.6 kg ha–1.
Rice Zn concentration increased exponentially with increasing ex-tractable Zn regardless of extraction method (Fig. 9). With use of the equa-tion in Figure 9A and a critical Zn level of 20 mg kg–1, the critical DTPA-extractable Zn level would be predicted to be 0.56 mg kg–1 (1.12 lb acre–1).Mikkelsen and Brandon (1975) proposed 0.5-mg of Zn kg–1 (1 lb acre–1) asthe critical level for California soils. Given the equations in Figures 9A and9B for Mehlich 3 and the HCl methods, the critical levels would be 1.2 and0.82 mg of Zn kg–1 (2.4 and 1.64 lb acre–1), respectively. Ziah et al. (1994)proposed 2.4 mg kg–1 of Mehlich 3-extractable Zn as the critical level forrice soils of Pakistan. Katyal and Ponnamperuma (1974) have proposed1 mg kg–1 for the HCl method.
Total Zn Uptake. Total Zn uptake by plants receiving 5.6 kg ha–1 wassignificantly greater than that of plants receiving no Zn (Table 10). Plantsreceiving 11.2, 16.8, and 22.4 kg ha–1 had greater Zn uptake than plantsreceiving 5.6 kg ha–1. This followed the pattern of the Zn concentrations inthe shoots.
There was a highly significant quadratic response of Zn uptake tosoil-extractable Zn (Fig. 10). The large R2 indicated that a great proportionof the variability in Zn uptake can be ascribed to soil-extractable Zn. Thesecoefficients were 0.82, 0.81, and 0.80 for DTPA, Mehlich 3, and 0.05MHCl, respectively. Thus each of the methods provided good estimates oftotal Zn uptake.
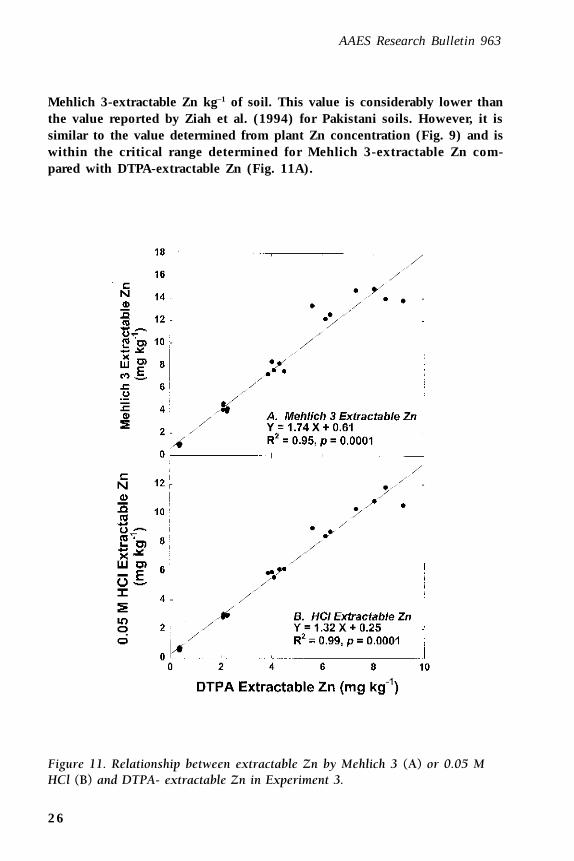
Comparison of Soil Test Procedures. The relationship between Mehlich3-extractable Zn and DTPA-extractable Zn is shown in Figure 11. The R2 for
AAES Research Bulletin 963
2 2
Figure 8. Relationship between rice dry matter production 20 d after floodingand soil available Zn extracted with DTPA (A), Mehlich 3 (B), or 0.05 M HCl(C) in Experiment 3.
Zinc Availability to Rice From Seven Granular Zinc Fertilizers
2 3
the regression analysis was 0.95, and the P-value associated with the modelwas 0.0001. This R2 value is equal to the 0.95 reported by Vocasek andFriedericks (1994) for several soils from the U. S., and greater than the 0.64value reported by Ziah et al. (1994) for calcareous soils of Pakistan. Garcíaet al. (1997) reported an R2 of 0.88 for Argentina soils. The equation deter-mined from the current study was:
The slope and intercept obtained were similar to those reported byVocasek and Friedericks (1994) (Eq. 1). If the equation for the model devel-oped from this study applies, the normally reported critical range for DTPA-extractable Zn for rice soils, 0.5 to 0.8 mg kg–1 (Jones et al., 1982) would beequivalent to 0.92 to 1.47 mg of Mehlich 3-extractable Zn per kg of soil.The value calculated on the basis ofplant Zn concentration (1.2 mg kg–1)also falls within this range (Fig. 9).
The relationship between 0.05M HCl-extractable Zn and DTPA-ex-tractable Zn was highly significant, with an R2 of 0.99 (P-value = 0.0001)(Fig. 11B). This R2 value is similar to the one Katyal and Ponnamperuma(1974) obtained for soils in the Philippines (R2 = 0.93). Using the equationdeveloped for this method in relation to DTPA-extractable Zn, the criticalvalues for HCl-extractable Zn would be 0.68 and 1.09 mg kg–1. The criticalHCl-extractable Zn level for rice suggested by Katyal and Ponnamperuma(1974) was 1.0 mg kg–1, which is within the calculated range. The criticalvalue determined in this study based on tissue Zn concentration, 0.82 mgkg–1, also falls within this range (Table 4). If a quick assessment of soil Zn isnecessary, this would be a very convenient method because of its ease ofuse. However, it does not lend itself to multi-element analysis and routinesoil testing laboratory procedures. Also, it has been shown that free cal-cium carbonate (CaCO3) may reduce the effectiveness of this extractant(Nelson et al., 1959). Therefore, the results of this method should be inter-preted in light of other soil properties, such as pH or titratable alkalinity(Cox, 1987).
Mehlich 3-extractable Zn was very well correlated to HCl-extractableZn (Fig. 12). If a good relationship could be established between Mehlich3-extractable Zn and HCl-extractable Zn, then a comparison could be madebetween the two methods when results of an experiment were reportedusing HCl-extractable Zn. Using the model developed from the data in thisexperiment (Fig. 12), the critical level for HCl-extractable Zn reported byKatyal and Ponnamperuma (1974) would be equivalent to 1.35 mg of
AAES Research Bulletin 963
2 4
Figure 9. Relationship between Zn concentration in rice tissue 20 d afterflooding and soil available Zn extracted with DTPA (A), Mehlich 3 (B), or 0.05M HCl (C) in Experiment 3.
Zinc Availability to Rice From Seven Granular Zinc Fertilizers
2 5
Figure 10. Relationship between total Zn uptake by rice 20 d after floodingand soil available Zn extracted with DTPA (A), Mehlich 3 (B), or 0.05 M HCl(C) in Experiment 3.
AAES Research Bulletin 963
2 6
Figure 11. Relationship between extractable Zn by Mehlich 3 (A) or 0.05 MHCl (B) and DTPA- extractable Zn in Experiment 3.
Mehlich 3-extractable Zn kg–1 of soil. This value is considerably lower thanthe value reported by Ziah et al. (1994) for Pakistani soils. However, it issimilar to the value determined from plant Zn concentration (Fig. 9) and iswithin the critical range determined for Mehlich 3-extractable Zn com-pared with DTPA-extractable Zn (Fig. 11A).
Zinc Availability to Rice From Seven Granular Zinc Fertilizers
2 7
Figure 12. Relationship between Mehlich 3-extractable Zn and 0.05 M HCl-extractable Zn in Experiment 3.
CONCLUSIONS
Granular Zn sources with 54% or more of their total Zn as water-soluble were effective in decreasing bronzing and in increasing the Zn tis-sue concentration, Zn uptake, and DMY of rice when used at a rate of 11.2kg ha–1 or greater. The sources evaluated that would be recommended onthe basis of water solubility include CoZinco Zn sulfate, Ruffin Zn ligno-sulfonate, Frit 12% Zn Chelate, Frit 20% Zn oxysulfate, and Frit 36% Znsulfate. A quadratic relationship was observed between water solubility andZn uptake. With this relationship, the sources with approximately 70% ofthe Zn in water-soluble form (Frit 12% Zn and Ruffin Zn chelate) resultedin the highest Zn uptake. However, granular Zn fertilizers with 4% or lessof the total Zn as water-soluble Zn were not effective in reducing the occur-rence of bronzing or in increasing DMY, Zn tissue concentration, or Znuptake by the rice crop grown immediately following application of thesource. The sources that should not be applied based on water solubil-ity include Frit 36% Zn oxysulfate and Granusol 36% Zn carboxylate.
AAES Research Bulletin 963
2 8
However, all the sources should be applied at a rate of at least 11.2 kg ofZn ha–1.
Uptake of Zn by the rice plant showed linear and quadratic responsesto the percentage of solubility in water and EDTA, respectively. However,there was a stronger correlation between water-soluble Zn and uptake thanbetween EDTA-soluble Zn and uptake. Thus water-soluble Zn would be agood index of plant-available Zn in fertilizer materials.
Zinc oxysulfate increased Zn concentration in the tissue of rice plants,Zn uptake, and DMY as the granule size decreased. In contrast, Zn appliedin granules greater than 1.5 mm were not readily available to the plant.Zinc amendments as granules of Zn oxysulfate applied at 11.2 kg ha–1 andgranule size greater than 1.5 mm had no effect on yields compared with ano-Zn control. If such a fertilizer were to be used for preventing Zn defi-ciency in rice, under the conditions of this study, granules that are 1.5 mmor smaller would be recommended.
Extractable-soil Zn by the methods tested was positively related to Znconcentration in the tissue of the rice plants and to the Zn uptake. Thethree methods were linearly related with each other. The mean tissue Znconcentration of Zn-deficient plants was 12 mg kg–1. This concentrationwas associated with soil values of 0.37, 0.96, and 0.62 mg kg–1 of DTPA-extractable Zn, Mehlich 3-extractable Zn, and HCl-extractable Zn, respec-tively. Based on previously known critical values for DTPA-extractable Znand HCl-extractable Zn and the relationship established between Mehlich3 and the other two methods used in this study, the Mehlich 3-extractableZn critical level for rice grown in conditions similar to this experiment isproposed to be between 0.92 and 1.5 mg kg–1. More research is needed inthis area to evaluate response in various soils and pH levels in both fieldand greenhouse studies.
LITERATURE CITED
Al-Bahrany, A. M. and A. M. Al-Shabaan. 1995. The effect of oxalic andcitric acids on plant absorption of phosphate and other nutrients fromfertilizer added to calcareous soil. Annals Agric. Sci. (Cairo). 40:943-951.
Amrani M., D.G. Westfall, and G.A. Peterson. 1997. Zinc plant availabil-ity as influenced by zinc fertilizer sources and zinc water solubility.Colorado Agric. Exp. Stn. TB97-4.
Association of Official Analytical Chemists.1995. Official methods ofanalysis. 16th ed. Arlington, Va. pp. 2.25-2.26..
Boawn, L.C., F.G. Viets, Jr., and C.L. Crawford. 1957. Plant utilization ofzinc from various types of zinc compounds and fertilizer materials.
Zinc Availability to Rice From Seven Granular Zinc Fertilizers
2 9
Soil Sci. 83:219-227.Brownell, P. F. 1979. Sodium as an essential micronutrient element for
plants and its possible role in metabolism. Adv. Bot. Res. 7: 117-224.Cakmak, I., and H. Marschner. 1986. Mechanism of phosphorus induced
zinc deficiency in cotton. I. Zinc deficiency-enhanced uptake rate ofphosphorus. Physiol. Plant. 68:483-490.
Cox, F.R. 1987. Micronutrient soil tests: correlation and calibration. In:J.R. Brown (ed.) Soil testing: sampling, correlation, calibration, andinterpretation. SSSA Special Publication Number 21. SSSA, Madison,Wis. pp. 97-117.
García, A., F. de Iorio, M. Barros, M. Bargiela, and A. Rendina. 1997.Comparison of soil tests to determine micronutrients status in Argen-tina soils. Commun. Soil Sci. Plant Anal. 28:1777-1792.
Jones, B., Jr. and V.W. Case. 1990. Sampling, handling and analyzingplant tissue samples. In: R.L. Westerman (ed.) Soil testing and plantanalysis. 3rd ed. SSSA, Madison, Wis. pp. 389-427.
Jones, U.S., J.C. Katyal, C.P. Mamaril, and C.S. Park. 1982. Wetland ricenutrient deficiencies other than nitrogen. In: Rice research strategies ofthe future. IRRI. Los Baños. Philippines. pp. 327-378.
Kang, B.T., and E.G. Okoro. 1976. Response of flooded rice grown on aVertisol from northern Nigeria to zinc sources and methods of applica-tion. Plant Soil. 44:15-25.
Katyal, J.C. and F.N. Ponnamperuma. 1974. Zinc deficiency: a widespreadnutritional disorder of rice in Agusan del Norte. Philipp. Agric. 58:79-89.
Lehr, J.J. 1953. Sodium as a plant nutrient. J. Sci. Food Agric. 4:460-468.Lindsay, W.L. and W.A. Norvell. 1978. Development of a DTPA soil test
for zinc, iron, manganese and copper. Soil Sci. Soc. Am. J. 42:421-428.Marschner, H. 1971. Why can sodium replace potassium in plants? Proc.
8th Colloq. Int. Potash Inst. Bern, pp. 50-63.Martens, D.C., and W.L. Lindsay. 1990. Testing soils for copper, iron,
manganese and zinc. In: R.L. Westerman (ed.). Soil testing and plantanalysis. 3rd. ed. SSSA, Madison, Wis. pp. 229-264.
Mehlich, A. 1984. Mehlich 3 soil test extractant: a modification ofMehlich 2 extractant. Commun. Soil Sci. Plant Anal. 15:1409-1416.
Mikkelsen, D.S. and D.M. Brandon. 1975. Zinc deficiency in Californiarice. Calif. Agric. 29(9):8-9.
Moore, P.A., Jr., and W.H. Patrick, Jr. 1988. Effects of zinc deficiencydehydrogenase activity and nutrient uptake in rice. Agron. J. 80:882-885.
Mordvedt, J.J. 1992. Crop response to level of water-soluble Zn in granu-lar Zn fertilizers. Fert. Res. 33:249-255.
Nelson, J.L., L.C. Boawn, and F.G. Viets. 1959. A method for assessingzinc status of soils using acid-extractable zinc and “titratable alkalin-ity” values. Soil Sci. 88:275-283.
Nene, Y.L. 1966. Symptoms, cause and control of Khaira disease ofpaddy. Bull. Indian Phytopathol. Soc. 3:97-101.
Ponnamperuma, F.N., R. Bradfield, and M. Peech. 1955. Physiologicaldisease of rice attributable to iron toxicity. Nature 175:265.
Ponnamperuma F.N., M.T. Clayton, and R.S. Lantin. 1981. Dilute hydro-chloric acid as an extractant for available zinc, copper and boron inrice soils. Plant Soil 61:297-310.
SAS Institute, Inc. 1988. SAS user’s guide: Statistics. 6th ed. SAS Inst. Inc.Cary, N.C.
Sedberry, J.E., Jr., F.J. Peterson, A.L. Nuget, R.M. Engler, and R.H.Brupbocher. 1971. Effect of zinc and other elements on the yield ofrice and nutrient contents of rice plants. LA Agric. Exp. Stn. Bull. 653.7 pp.
Selvarajah, N., V. Pavanasasivam, and K.A. Nandasena. 1982. Evaluationof extractants for Zn and Cu in paddy soils. Plant and Soil. 68:309-320.
Singh H.G., and P.N. Takkar. 1981. Evaluation of efficient soil test meth-ods for Zn and their critical values for salt-affected soils for rice.Commun. Soil Sci. Plant Anal. 12:383-406.
Slaton N., R. Norman, B. Wells, D. Miller, R. Helms, C. Beyrouty, and C.Wilson, Jr. 1994. Efficient use of fertilizer. In: R.S. Helms (ed.). RiceProduction Handbook. Misc. Pub. 192. Arkansas Cooperative Exten-sion Service. Little Rock, Ark. pp. 42-54.
Stevenson, F.J. 1991. Organic matter-micronutrient reactions. In: J.J.Mordvedt (ed.). Micronutrients in agriculture. 2nd ed. SSA, Madison,Wis. pp. 145-186.
Tanaka, A., and S. Yoshida. 1970. Nutritional disorders of the rice plantin Asia. IRRI Tech. Bull. 10. 51 pp.
Tiller, K.G., E. Suwadji, and R.S. Beckwith. 1979. An approach to soiltesting with special reference to the zinc requirement of rice paddy.Commun. Soil Sci. Plant Anal. 10:703-715.
University of Arkansas Cooperative Extension Service . 1998. Soil testrecommendations guide. AGR-9. University of Arkansas CooperativeExtension Service. Little Rock, Ark.
Vocasek, F.F., and J.B. Friedericks. 1994. Soil micronutrient extraction byMehlich-3 compared to DTPA. Commun. Soil Sci. Plant Anal. 25:1583-1593.
Welch, R.M., M.J. Webb, and J.F. Loneragan. 1982. Zinc in membranefunction and its role in phosphorus toxicity. In: A. Scaife (ed.). Proc.9th Plant Nutrition Colloquium, Warwick, England. CommonwealthAgricultural Bureau, Farham Royal, Bucks. pp. 710-715.
Zinc Availability to Rice From Seven Granular Zinc Fertilizers
3 1
Wells, B.R. 1980. Zinc nutrition of rice growing on Arkansas soils. Agric.Exp. Stn. Bull. 848. University of Arkansas, Fayetteville. 16 pp.
Wells, B.R., L.A. Thompson, and P.A. Shockley. 1973. Effects of zinc onchlorosis and yield of rice grown on alkaline soil. Agric. Exp. Stn. Rep.Ser. 208, University of Arkansas, Fayetteville.
Westfall, D.G., W.B. Anderson, and R.J. Hodges. 1971. Iron and zincresponse of chlorotic rice grown on calcareous soils. Agron. J. 63:702-705.
Ziah, M.S., F. Hussain, Rahmatullah, M.B. Tahir, and M.I. Khan. 1994.Suitability of soil test procedures for predicting response of floodedrice to zinc application on calcareous soils. Pakistan J. of Sci. and Id.Res. 37:309-402.