146
Zone Water Agency PFAS Treatment Feasibility Study Technical Memorandum PFAS AND HEXAVALENT CHROMIUM TREATMENT FEASIBILITY STUDY DRAFT | June -.-.
Zone � Water Agency
PFAS Treatment Feasibility Study
Technical Memorandum �
PFAS AND HEXAVALENT CHROMIUM
TREATMENT FEASIBILITY STUDY
DRAFT | June -.-.

Zone � Water Agency
PFAS Treatment Feasibility Study
Technical Memorandum �
PFAS AND HEXAVALENT CHROMIUM
TREATMENT FEASIBILITY STUDY
DRAFT | June -.-.

TM1 | PFAS AND HEXAVALENT CHROMIUM TREATMENT FEASIBILITY STUDY | ZONE 7 WATER AGENCY
DRAFT | JUNE -.-. | i
pw://Carollo/Documents/Client/CA/OCWD/����3A../Deliverables/ProdRPT.�/ProducerRpt‐Anaheim
Contents
Executive Summary 1
Introduction 1
�.� Service Area �
�.- Existing Groundwater Supply -
Regulations and Treatment Objectives 9
-.� Regulatory Overview – PFAS 3
-.- Treatment Considerations and Goals for the Removal of PFAS ��
-.-.� Granular Activated Carbon �-
-.-.- Ion Exchange �;
-.-.; Reverse Osmosis and Nanofiltration �<
-.-.< Blending �=
-.-.= Summary of PFAS Treatment Technologies �=
-.; Regulatory Overview – Hexavalent Chromium �>
-.< Treatment Considerations and Goals for the Removal of Hexavalent Chromium ��
Treatment AlternativeS Screening 19
;.� Pretreatment Requirements �3
;.- Design Criteria -.
;.; Site Layouts -.
;.< Chain of Lakes Wellfield -;
;.<.� Chain of Lakes = -;
;.<.- Chain of Lakes - -;
;.<.; Chain of Lakes � ->
;.<.< Centralized Treatment at Chain of Lakes � ->
;.= Mocho Wellfield -3
;.=.� Mocho � -3
;.=.- Mocho - ;-
;.=.; Mocho ; & Centralized Treatment ;-
;.=.< Mocho <, MDGP, and Centralized Treatment ;-
;.> Stoneridge ;=
;.>.� Stoneridge � ;=
ZONE 7 WATER AGENCY | PFAS AND HEXAVALENT CHROMIUM TREATMENT FEASIBILITY STUDY | TM1
ii | JUNE -.-. | DRAFT
;.� Treatment Technologies Alternatives Summary ;>
Treatment Strategies 39
<.� Response Levels & D. Percent of Response Levels ;3
<.- VT Advisory Level <�
<.; Below Method Reporting Limits <-
Costs to Implementation 45
=.� Design Criteria <>
=.- Permitting <>
=.; Construction Duration <�
=.< O&M Activities <�
=.<.� General Operational Activities <�
=.<.- Maintenance <3
=.<.; Residual Management <3
=.= Cost (Capital, O&M, and Life Cycle) <3
Appendices
Appendix A Estimated Media Throughput
Appendix B Design Criteria
Appendix C Opinions of Probable Cost (AACE Class =)
Tables
Table � Zone � Groundwater Wells ;
Table - Wells Average Water Quality =
Table ; PFAS and Hexavalent Chromium Running Annual Averages (<th Quarter
-.�3) �
Table < Alternative PFAS Treatment Technologies �>
Table = Pre‐treatment Water Quality Conditions �3
Table > General Site Layout Design Criteria -.
Table � Treatment Alternatives Locations -�
Table D Screened Alternatives ;�
Table 3 Estimated PFOS and PFOA Concentrations for Various Blending
Scenarios without RO Treatment <.
Table �. Blending Operational Conditions Summary <�
Table �� Recommended Centralized COL Design Criteria and Estimated Bed Life <>

TM1 | PFAS AND HEXAVALENT CHROMIUM TREATMENT FEASIBILITY STUDY | ZONE 7 WATER AGENCY
iii | JUNE -.-. | DRAFT
Table �- Water Treatment Facility Class <D
Table �; Capital and O&M Cost Assumptions =�
Figures
Figure � Zone � Service Area -
Figure - Zone � Geographic Distribution of Wells ;
Figure ; Products Containing PFAS 3
Figure < PFAS Treatment Technologies ��
Figure = Process Flow Diagram – Activated Carbon �;
Figure > Process Flow Diagram – Ion Exchange �<
Figure � Process Flow Diagram – Reverse Osmosis and Nanofiltration �<
Figure D Process Flow Diagram – Stannous Chloride Reduction (without filtration) ��
Figure 3 COL= – IX for PFAS & SnCl- for Cr> -<
Figure �. COL= – GAC for PFAS & IX for Cr> -<
Figure �� COL- – GAC for PFAS & XI for Cr> -=
Figure �- COL- – IX for PFAS & SnCl- for Cr> -=
Figure �; COL� – IX for PFAS -�
Figure �< COL� – Space available for an RO system to treat PFAS -�
Figure �= COL Centralized Treatment – IX for PFAS & Stannous Chloride for Cr> -D
Figure �> COL Centralized Treatment – IX for PFAS & Cr> -D
Figure �� COL Centralized Treatment – GAC for PFAS & Stannous Chloride for Cr> ;.
Figure �D COL Centralized Treatment – GAC for PFAS & IX for Cr> ;.
Figure �3 Mocho � – IX for PFAS ;�
Figure -. Mocho � – GAC for PFAS ;�
Figure -� Mocho - – IX for PFAS ;;
Figure -- Mocho - – GAC for PFAS ;;
Figure -; Centralized Mocho Wellfield Treatment at Mocho ; – GAC for Mocho �, -,
and ; PFAS ;<
Figure -< Centralized Mocho Wellfield Treatment at Mocho ; – RO for Mocho �, -,
and ; PFAS ;<
Figure -= Mocho < – MGDP site limitations ;=
Figure -> Stoneridge � – GAC for PFAS ;>
Figure -� Preliminary Project Schedule <�
TM1 | PFAS AND HEXAVALENT CHROMIUM TREATMENT FEASIBILITY STUDY | ZONE 7 WATER AGENCY
DRAFT | JUNE -.-. | v
Abbreviations
AFY acre‐feet per year
AF acre‐feet
CA California
Carollo Carollo Engineers, Inc.
COL� Chain of Lakes Well Number �
COL- Chain of Lakes Well Number -
COL= Chain of Lakes Well Number =
Cr; trivalent chromium
Cr> hexavalent chromium
DDW State Water Board's Division of Drinking Water
deg degrees
EBCT empty bed contact time
EPA United States Environmental Protection Agency
ft feet
ft; cubic feet
GAC granular activated carbon
gpm gallons per minute
gpm/sf gallons per minute per square foot
IX ion exchange
kWh kilowatt hour
lb(s) pound(s)
µm micrometers
µg/L parts per billion
MCLs maximum contaminant levels
ppm milligrams per liter
MGDP Mocho Groundwater Demineralization Plant
Mocho � Mocho Well Number �
Mocho - Mocho Well Number -
Mocho ; Mocho Well Number ;
Mocho < Mocho Well Number <
n.a. not applicable
ND non‐detect
NF nanofiltration
ppt nanograms per liter
NLs notification levels
NTU nephelometric turbidity unit
O&M operations and maintenance

ZONE 7 WATER AGENCY | PFAS AND HEXAVALENT CHROMIUM TREATMENT FEASIBILITY STUDY | TM1
vi | JUNE -.-. | DRAFT
PFAS Per‐ and Polyfluoroalkyl Substances
PFBS Perfluorobutane sulfonic acid
PFHxA Perfluorohexanoic acid
PFHxS Perfluorohexane sulfonic acid
PFOA perfluorooctanoic acid
PFOS perfluorooctane sulfonate
PHA provisional health advisory
ppt parts per trillion
psig pounds per square inch gauge
Q< fourth quarter
RAA running annual average
RLs response levels
RO reverse osmosis
SMCL secondary maximum contaminant level
Study PFAS Treatment Planning Study
TDS total dissolved solids
TOC total organic carbon
UCMR; Unregulated Contaminant Monitoring Rule ;
VT Vermont
Zone � Zone � Water Agency
TM1 | PFAS AND HEXAVALENT CHROMIUM TREATMENT FEASIBILITY STUDY | ZONE 7 WATER AGENCY
DRAFT | JUNE -.-. | ES‐�
EXECUTIVE SUMMARY
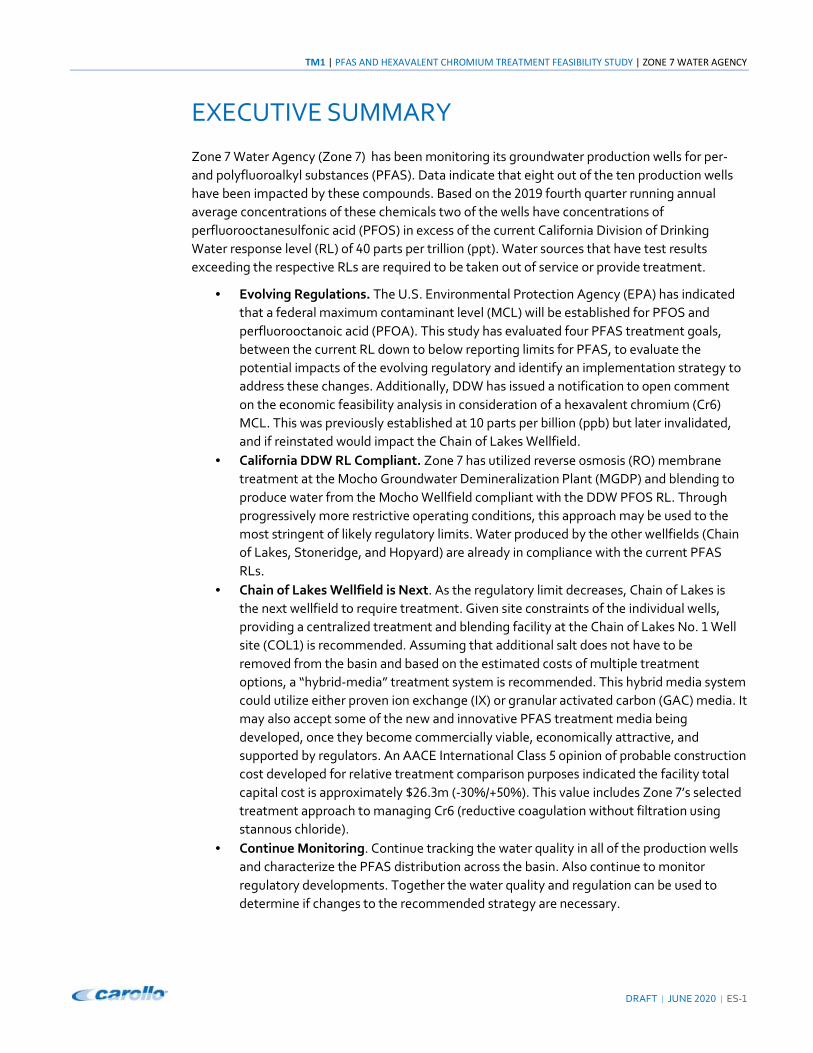
Zone � Water Agency (Zone �) has been monitoring its groundwater production wells for per‐
and polyfluoroalkyl substances (PFAS). Data indicate that eight out of the ten production wells
have been impacted by these compounds. Based on the -.�3 fourth quarter running annual
average concentrations of these chemicals two of the wells have concentrations of
perfluorooctanesulfonic acid (PFOS) in excess of the current California Division of Drinking
Water response level (RL) of <. parts per trillion (ppt). Water sources that have test results
exceeding the respective RLs are required to be taken out of service or provide treatment.
• Evolving Regulations. The U.S. Environmental Protection Agency (EPA) has indicated
that a federal maximum contaminant level (MCL) will be established for PFOS and
perfluorooctanoic acid (PFOA). This study has evaluated four PFAS treatment goals,
between the current RL down to below reporting limits for PFAS, to evaluate the
potential impacts of the evolving regulatory and identify an implementation strategy to
address these changes. Additionally, DDW has issued a notification to open comment
on the economic feasibility analysis in consideration of a hexavalent chromium (Cr>)
MCL. This was previously established at �. parts per billion (ppb) but later invalidated,
and if reinstated would impact the Chain of Lakes Wellfield.
• California DDW RL Compliant. Zone � has utilized reverse osmosis (RO) membrane
treatment at the Mocho Groundwater Demineralization Plant (MGDP) and blending to
produce water from the Mocho Wellfield compliant with the DDW PFOS RL. Through
progressively more restrictive operating conditions, this approach may be used to the
most stringent of likely regulatory limits. Water produced by the other wellfields (Chain
of Lakes, Stoneridge, and Hopyard) are already in compliance with the current PFAS
RLs.
• Chain of Lakes Wellfield is Next. As the regulatory limit decreases, Chain of Lakes is
the next wellfield to require treatment. Given site constraints of the individual wells,
providing a centralized treatment and blending facility at the Chain of Lakes No. � Well
site (COL�) is recommended. Assuming that additional salt does not have to be
removed from the basin and based on the estimated costs of multiple treatment
options, a “hybrid‐media” treatment system is recommended. This hybrid media system
could utilize either proven ion exchange (IX) or granular activated carbon (GAC) media. It
may also accept some of the new and innovative PFAS treatment media being
developed, once they become commercially viable, economically attractive, and
supported by regulators. An AACE International Class = opinion of probable construction
cost developed for relative treatment comparison purposes indicated the facility total
capital cost is approximately M->.;m (‐;.%/+=.%). This value includes Zone �’s selected
treatment approach to managing Cr> (reductive coagulation without filtration using
stannous chloride).
• Continue Monitoring. Continue tracking the water quality in all of the production wells
and characterize the PFAS distribution across the basin. Also continue to monitor
regulatory developments. Together the water quality and regulation can be used to
determine if changes to the recommended strategy are necessary.

TM1 | PFAS AND HEXAVALENT CHROMIUM TREATMENT FEASIBILITY STUDY | ZONE 7 WATER AGENCY
DRAFT | JUNE -.-. | �
Section 1
INTRODUCTION
Zone � Water Agency (Zone �) contracted with Carollo to conduct a PFAS Treatment Feasibility
Study to evaluate treatment options for eight of its ten groundwater wells that are impacted by
PFAS and develop an approach to implementation.
Under California law (Assembly Bill �=>; published August �, -.�3), public water systems may be
ordered to test for per‐ and polyfluoroalkyl substances (PFAS). On February >, -.-., the Division
of Drinking Water (DDW) issued revised drinking water response levels (RLs) of �. parts per
trillion (ppt or ng/L) for perfluorooctanoic acid (PFOA) and and <. ppt for
perfluorooctanesulfonic acid (PFOS). Water sources that have test results exceeding the
respective RLs are required to be taken out of service, provide treatment, or notify customers.
Based on the -.�3 fourth quarter (Q<) running annual average (RAA) values, two of Zone �’s
production wells exceed the PFOS RL. None of the ten groundwater wells reported a PFOA RAA
in excess of its RL. Zone � has utilized reverse osmosis (RO) membrane treatment at the Mocho
Groundwater Demineralization Plant (MGDP) and blending to distribute water that is compliant
(i.e. does not exceed) the RLs.
In addition to PFAS, on March >, -.-., DDW issued a notification to open comment on the
economic feasibility analysis in consideration of a hexavalent chromium (Cr>) maximum
contaminant level (MCL). Zone � has one production well with a hexavalent chromium RAA in
excess of �. ppb, the MCL established in -.�< and later invalidated in -.��.
This Study evaluates blending and treatment alternatives to meet four different PFAS goals for
three wellfields impacted by PFAS, as well as managing hexavalent chromium to one treatment
goal. Based upon discussions with Zone � staff, a conceptual implementation strategy was
developed.
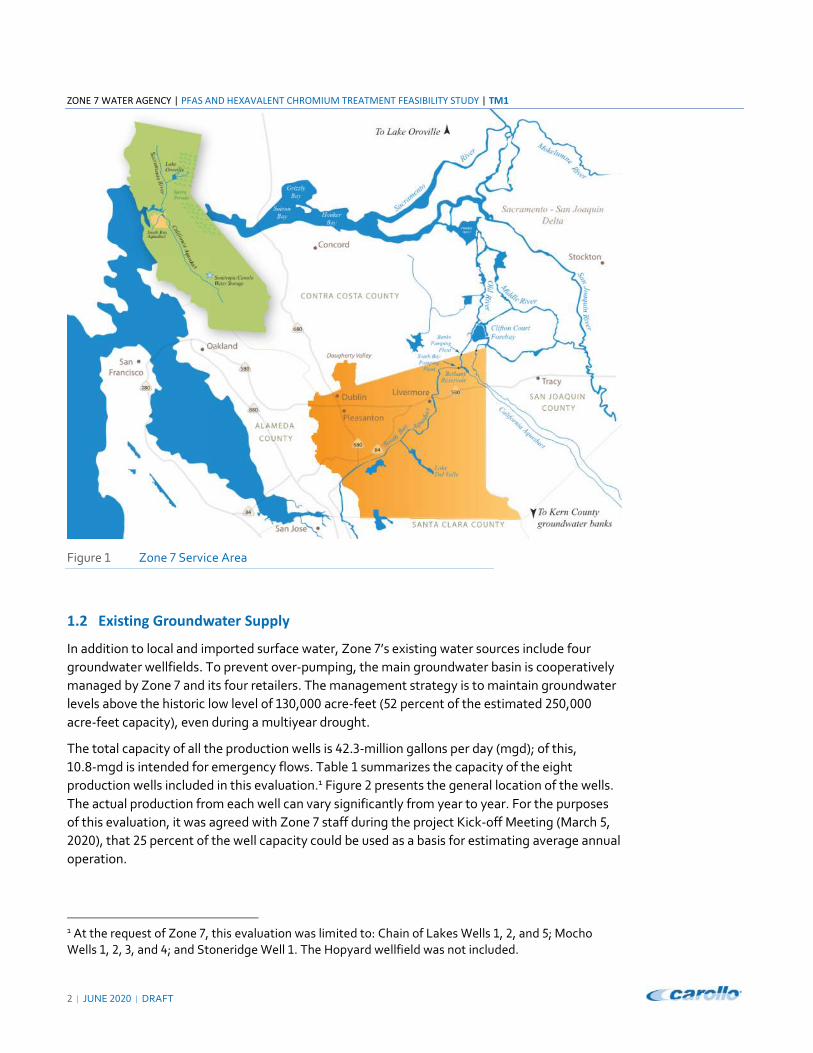
1.1 Service Area
Zone � service area highlighted in Figure �, encompasses an area of approximately <-= square
miles, providing drinking water to four retail water entities, combined serving over ->.,...
residents. The retailers include:
• California Water Service Company‐ Livermore District (Cal Water).
• Dublin San Ramon Services District (DSRSD).
• City of Livermore (Livermore).
• City of Pleasanton (Pleasanton).
ZONE 7 WATER AGENCY | PFAS AND HEXAVALENT CHROMIUM TREATMENT FEASIBILITY STUDY | TM1
- | JUNE -.-. | DRAFT
Figure � Zone � Service Area
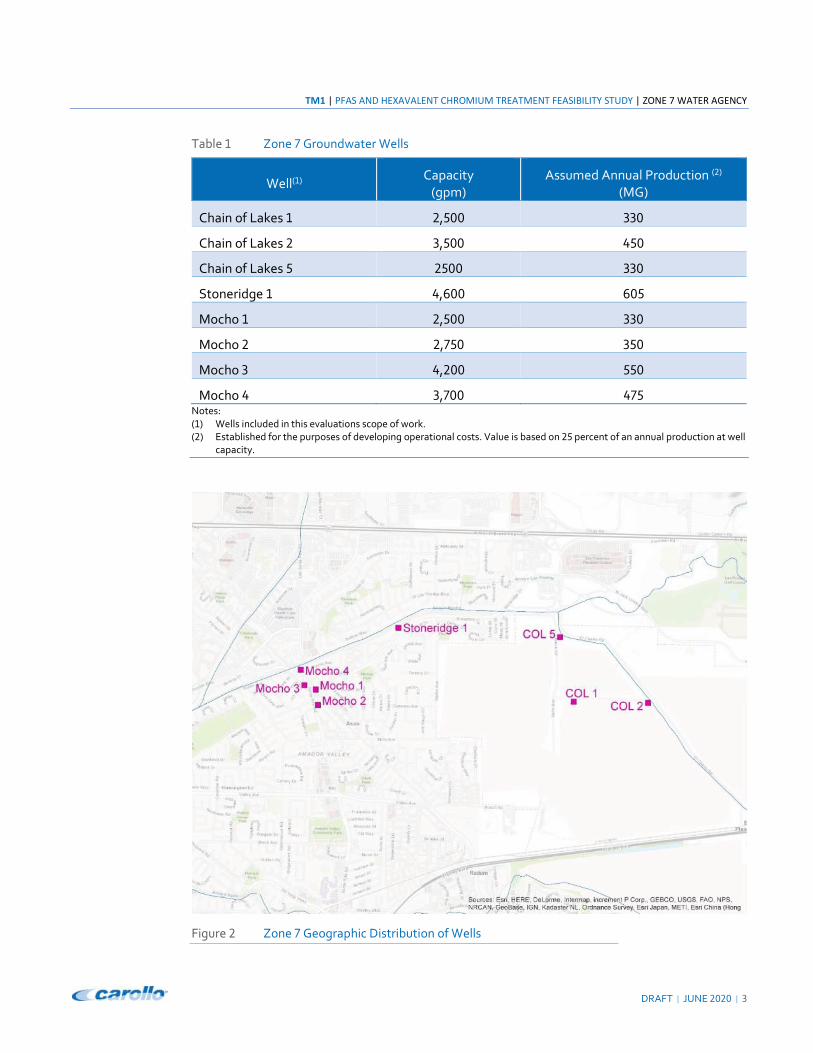
1.2 Existing Groundwater Supply
In addition to local and imported surface water, Zone �’s existing water sources include four
groundwater wellfields. To prevent over‐pumping, the main groundwater basin is cooperatively
managed by Zone � and its four retailers. The management strategy is to maintain groundwater
levels above the historic low level of �;.,... acre‐feet (=- percent of the estimated -=.,...
acre‐feet capacity), even during a multiyear drought.
The total capacity of all the production wells is <-.;‐million gallons per day (mgd); of this,
�..D‐mgd is intended for emergency flows. Table � summarizes the capacity of the eight
production wells included in this evaluation.1 Figure - presents the general location of the wells.
The actual production from each well can vary significantly from year to year. For the purposes
of this evaluation, it was agreed with Zone � staff during the project Kick‐off Meeting (March =,
-.-.), that -= percent of the well capacity could be used as a basis for estimating average annual
operation.
1 At the request of Zone �, this evaluation was limited to: Chain of Lakes Wells �, -, and =; Mocho
Wells �, -, ;, and <; and Stoneridge Well �. The Hopyard wellfield was not included.
TM1 | PFAS AND HEXAVALENT CHROMIUM TREATMENT FEASIBILITY STUDY | ZONE 7 WATER AGENCY
DRAFT | JUNE -.-. | ;
Table � Zone � Groundwater Wells
Well(�) Capacity
(gpm)
Assumed Annual Production (-)
(MG)
Chain of Lakes � -,=.. ;;.
Chain of Lakes - ;,=.. <=.
Chain of Lakes = -=.. ;;.
Stoneridge � <,>.. >.=
Mocho � -,=.. ;;.
Mocho - -,�=. ;=.
Mocho ; <,-.. ==.
Mocho < ;,�.. <�= Notes:
(�) Wells included in this evaluations scope of work.
(-) Established for the purposes of developing operational costs. Value is based on -= percent of an annual production at well
capacity.
Figure - Zone � Geographic Distribution of Wells
ZONE 7 WATER AGENCY | PFAS AND HEXAVALENT CHROMIUM TREATMENT FEASIBILITY STUDY | TM1
< | JUNE -.-. | DRAFT
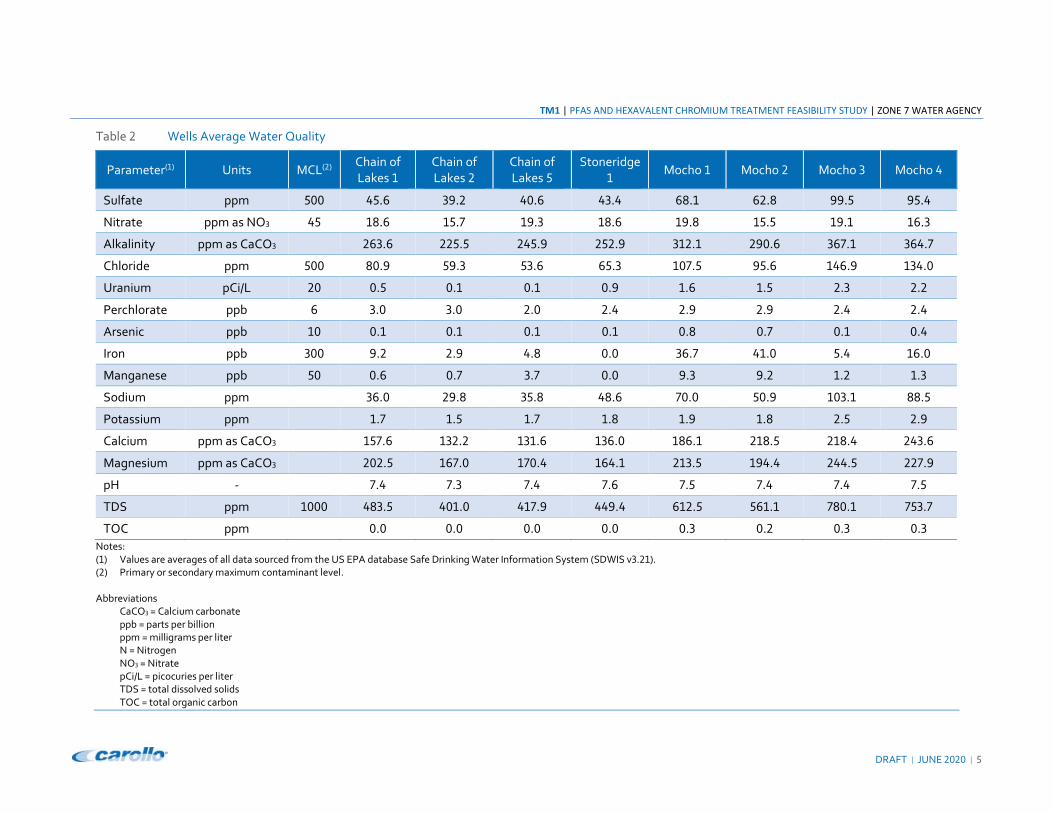
Table - summarizes general water quality parameters for these wells. These values are averages
of all data sourced from the US EPA database Safe Drinking Water Information System (SDWIS
v;.-�).
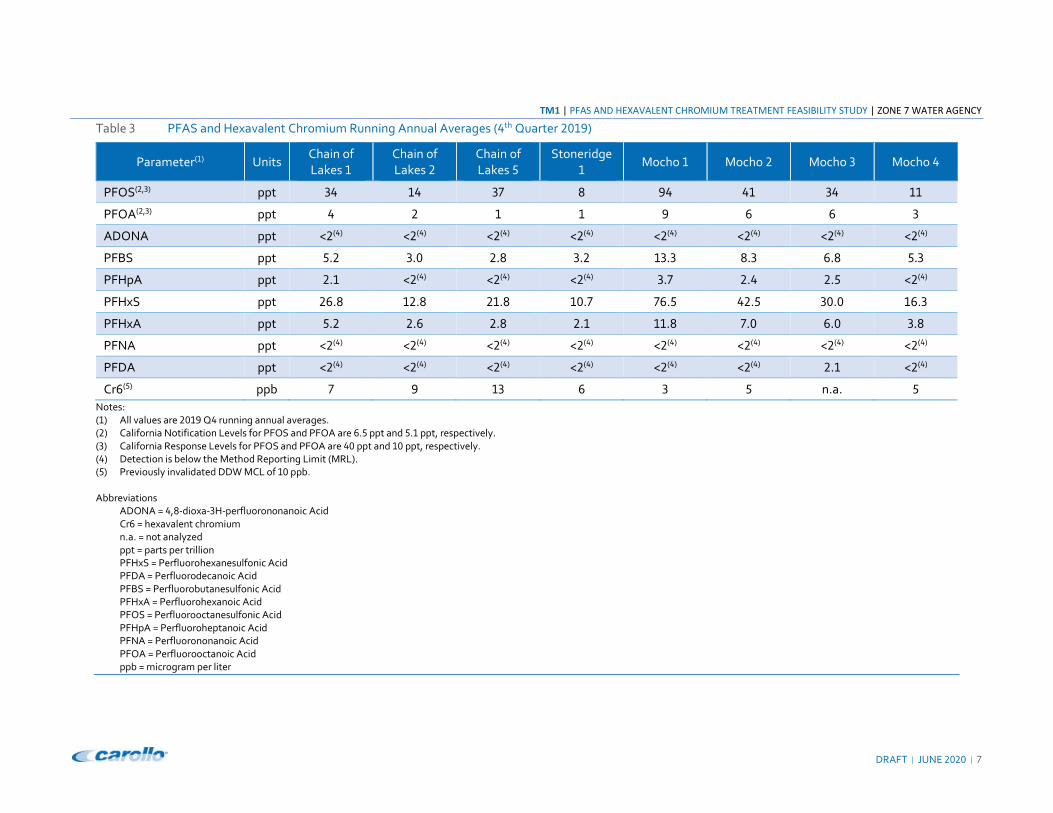
Table ; summarizes the -.�3 fourth quarter RAAs for selected PFAS and Cr>. While there is
additional historical data and variability within these data sets, Zone � indicated that it is the
data presented in this table that should be used for this evaluation, identify the wells that require
treatment to meet the various goals as well as to establish blending scenarios. This was chosen
over utilizing historical maximums or other values that would be considered a more conservative
approach.
These data indicate that all wells have PFAS above one or both notification levels, and two wells
(Mocho � and Mocho -) have PFOS above the response level. In addition to these two
compounds, multiple other PFAS were detected in each well including some of the seven
additional PFAS for which DDW has initiated NL development. Only one well (Chain of Lakes =)
has Cr> above the previously invalidated California �. ppb MCL.
Additional wells may be impacted in the future depending on migration of these contaminants
within the basin, regulatory development, or revised Zone � policies.
TM1 | PFAS AND HEXAVALENT CHROMIUM TREATMENT FEASIBILITY STUDY | ZONE 7 WATER AGENCY
DRAFT | JUNE -.-. | =
Table - Wells Average Water Quality
Parameter(�) Units MCL(-) Chain of
Lakes �
Chain of
Lakes -
Chain of
Lakes =
Stoneridge
� Mocho � Mocho - Mocho ; Mocho <
Sulfate ppm =.. <=.> ;3.- <..> <;.< >D.� >-.D 33.= 3=.<
Nitrate ppm as NO; <= �D.> �=.� �3.; �D.> �3.D �=.= �3.� �>.;
Alkalinity ppm as CaCO; ->;.> --=.= -<=.3 -=-.3 ;�-.� -3..> ;>�.� ;><.�
Chloride ppm =.. D..3 =3.; =;.> >=.; �.�.= 3=.> �<>.3 �;<..
Uranium pCi/L -. ..= ..� ..� ..3 �.> �.= -.; -.-
Perchlorate ppb > ;.. ;.. -.. -.< -.3 -.3 -.< -.<
Arsenic ppb �. ..� ..� ..� ..� ..D ..� ..� ..<
Iron ppb ;.. 3.- -.3 <.D ... ;>.� <�.. =.< �>..
Manganese ppb =. ..> ..� ;.� ... 3.; 3.- �.- �.;
Sodium ppm ;>.. -3.D ;=.D <D.> �... =..3 �.;.� DD.=
Potassium ppm �.� �.= �.� �.D �.3 �.D -.= -.3
Calcium ppm as CaCO; �=�.> �;-.- �;�.> �;>.. �D>.� -�D.= -�D.< -<;.>
Magnesium ppm as CaCO; -.-.= �>�.. ��..< �><.� -�;.= �3<.< -<<.= --�.3
pH ‐ �.< �.; �.< �.> �.= �.< �.< �.=
TDS ppm �... <D;.= <.�.. <��.3 <<3.< >�-.= =>�.� �D..� �=;.�
TOC ppm ... ... ... ... ..; ..- ..; ..;
Notes:
(�) Values are averages of all data sourced from the US EPA database Safe Drinking Water Information System (SDWIS v;.-�).
(-) Primary or secondary maximum contaminant level.
Abbreviations
CaCO; = Calcium carbonate
ppb = parts per billion
ppm = milligrams per liter
N = Nitrogen
NO; = Nitrate
pCi/L = picocuries per liter
TDS = total dissolved solids
TOC = total organic carbon
TM1 | PFAS AND HEXAVALENT CHROMIUM TREATMENT FEASIBILITY STUDY | ZONE 7 WATER AGENCY
DRAFT | JUNE -.-. | �
Table ; PFAS and Hexavalent Chromium Running Annual Averages (<th Quarter -.�3)
Parameter(�) Units Chain of
Lakes �
Chain of
Lakes -
Chain of
Lakes =
Stoneridge
� Mocho � Mocho - Mocho ; Mocho <
PFOS(-,;) ppt ;< �< ;� D 3< <� ;< ��
PFOA(-,;) ppt < - � � 3 > > ;
ADONA ppt <-(<) <-(<) <-(<) <-(<) <-(<) <-(<) <-(<) <-(<)
PFBS ppt =.- ;.. -.D ;.- �;.; D.; >.D =.;
PFHpA ppt -.� <-(<) <-(<) <-(<) ;.� -.< -.= <-(<)
PFHxS ppt ->.D �-.D -�.D �..� �>.= <-.= ;... �>.;
PFHxA ppt =.- -.> -.D -.� ��.D �.. >.. ;.D
PFNA ppt <-(<) <-(<) <-(<) <-(<) <-(<) <-(<) <-(<) <-(<)
PFDA ppt <-(<) <-(<) <-(<) <-(<) <-(<) <-(<) -.� <-(<)
Cr>(=) ppb � 3 �; > ; = n.a. =
Notes:
(�) All values are -.�3 Q< running annual averages.
(-) California Notification Levels for PFOS and PFOA are >.= ppt and =.� ppt, respectively.
(;) California Response Levels for PFOS and PFOA are <. ppt and �. ppt, respectively.
(<) Detection is below the Method Reporting Limit (MRL).
(=) Previously invalidated DDW MCL of �. ppb.
Abbreviations
ADONA = <,D‐dioxa‐;H‐perfluorononanoic Acid
Cr> = hexavalent chromium
n.a. = not analyzed
ppt = parts per trillion
PFHxS = Perfluorohexanesulfonic Acid
PFDA = Perfluorodecanoic Acid
PFBS = Perfluorobutanesulfonic Acid
PFHxA = Perfluorohexanoic Acid
PFOS = Perfluorooctanesulfonic Acid
PFHpA = Perfluoroheptanoic Acid
PFNA = Perfluorononanoic Acid
PFOA = Perfluorooctanoic Acid
ppb = microgram per liter
TM1 | PFAS AND HEXAVALENT CHROMIUM TREATMENT FEASIBILITY STUDY | ZONE 7 WATER AGENCY
DRAFT | JUNE -.-. | 3
Section 2
REGULATIONS AND TREATMENT OBJECTIVES
This section provides an overview of the PFAS and hexavalent chromium regulations as of June
-.-., the selected treatment objectives, and the treatment options considered.
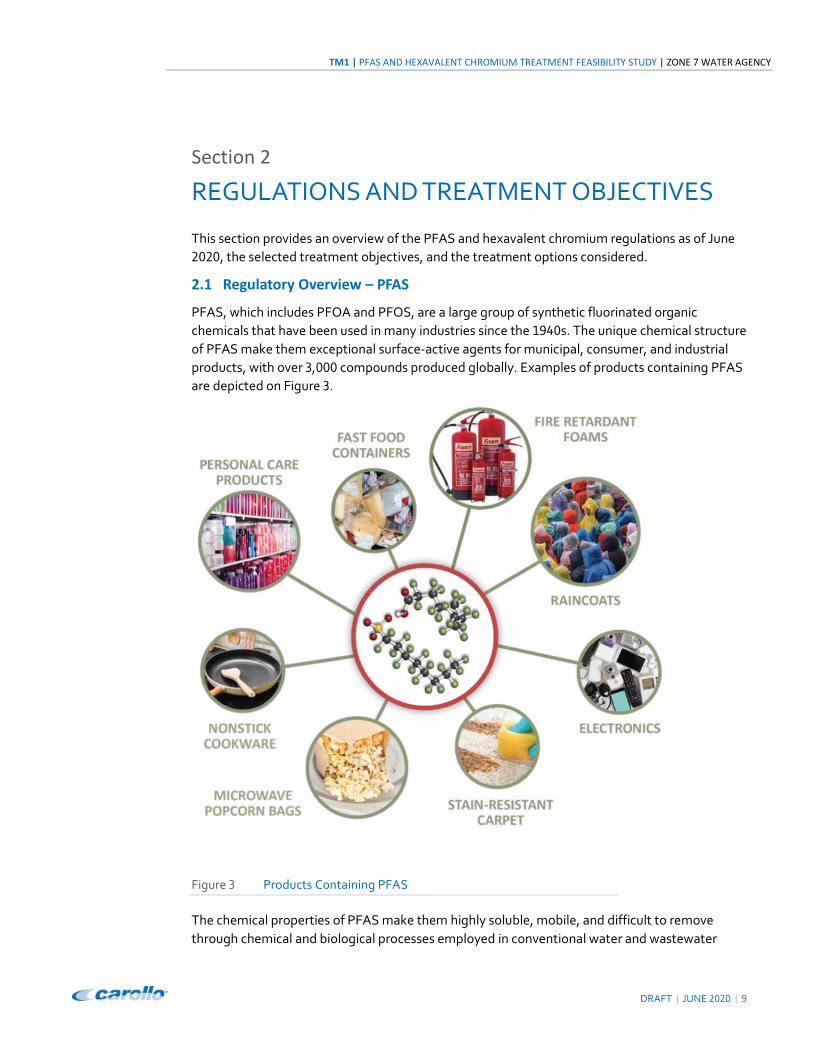
2.1 Regulatory Overview – PFAS
PFAS, which includes PFOA and PFOS, are a large group of synthetic fluorinated organic
chemicals that have been used in many industries since the �3<.s. The unique chemical structure
of PFAS make them exceptional surface‐active agents for municipal, consumer, and industrial
products, with over ;,... compounds produced globally. Examples of products containing PFAS
are depicted on Figure ;.
Figure ; Products Containing PFAS
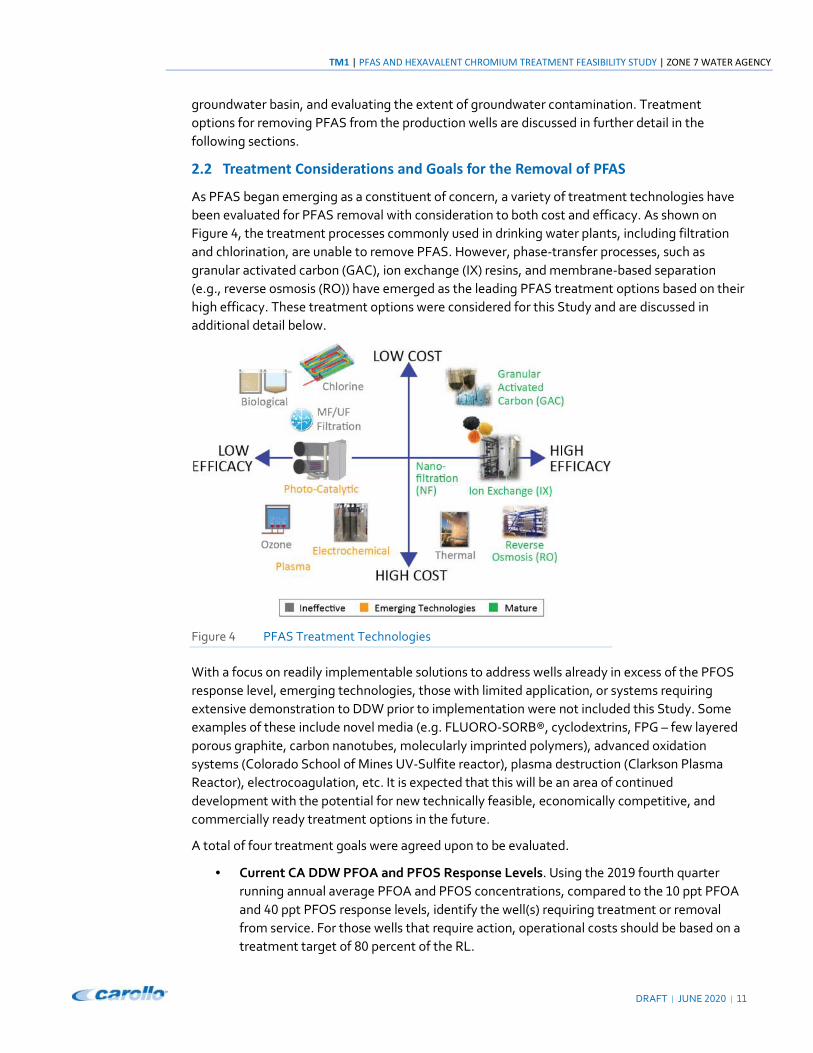
The chemical properties of PFAS make them highly soluble, mobile, and difficult to remove
through chemical and biological processes employed in conventional water and wastewater
ZONE 7 WATER AGENCY | PFAS AND HEXAVALENT CHROMIUM TREATMENT FEASIBILITY STUDY | TM1
�. | JUNE -.-. | DRAFT
treatment. Based on these properties, PFAS have been detected around the globe in
groundwater and drinking water sources.
When released into the environment, PFAS can lead to groundwater contamination and
subsequent public health concerns. The chemical structure of long‐chain PFAS causes
bioaccumulation in both humans and wildlife and is persistent once it enters the environment. At
this time, there is evidence that exposure to PFAS can lead to adverse human health effects.
In -..3, the United States Environmental Protection Agency (EPA) established a provisional
health advisory (PHA) of <.. ppt for PFOA and -.. ppt for PFOS to assess the potential risk from
short‐term exposure through drinking water. The EPA later released a non‐regulatory health
advisory level (HAL) for PFOA and PFOS as a combined concentration of �. ppt in -.�>.
As a result of the social and institutional concerns over chronic exposure to PFAS as well as the
established provisional EPA health advisories, several states have implemented drinking water
regulations or guidelines on PFOA and PFOS. In -.�D California matched the EPA’s combined RL
for PFOA and PFA, and added notification levels of �< and �;, respectively. In -.�3 DDW lowered
the NLs to =.� ppt and >.= ppt, respectively. Earlier this year (February -.-.), DDW replaced the
combined PFOA and PFOS RL, with separate response levels of �. ppt PFOA and <. ppt PFOS.
At the same time, the State initiated the notification level development process for seven
additional PFAS based on its on‐going state‐wide PFAS investigation. The seven additional
chemicals are:
• perfluorohexane sulfonic acid (PFHxS)
• perfluorobutane sulfonic acid (PFBS)
• perfluorohexanoic acid (PFHxA)
• perfluoroheptanoic acid (PFHpA)
• perfluorononanoic acid (PFNA)
• perfluorodecanoic acid (PFDA)
• <,D‐dioxia‐;H‐perflourononanoic acid (ADONA)
On February -., -.-., the EPA announced its proposed decision to develop MCLs for PFOA and
PFOS. Specific concentrations were not identified.
EPA has also initiated the process for listing PFOA and PFOS as regulated hazardous substances
under the Comprehensive Environmental Response, Compensation and Liability Act (CERCLA).
While this does not directly impact the drinking water treatment goals, this has the potential to
significantly impact the management of residuals. Through CERCLA, EPA identifies individuals
or entities responsible for hazardous waste contamination of a listed site and negotiates or
orders the responsible party(ies) to clean up the site or pay others for that effort. If classified as a
hazardous waste, any direct or indirect connection to the compounds at a listed site, Zone �
could be identified as a Potentially Responsible Party (PRP). A single PRP can be held responsible
for the entire cost of cleaning up the site. Even manifesting the residuals to a third‐party prior to
the disposal of the hazardous waste would not relieve Zone � of this potential responsibility. As
such, the certified destruction of PFAS from any treatment residuals is the preferred approach to
residual management.
As both the EPA and the State of California work to establish enforceable standards (i.e.,
maximum contaminant levels and waste classification), Zone � has proceeded with evaluating
treatment options for the production wells, identifying potential PFAS sources in the
TM1 | PFAS AND HEXAVALENT CHROMIUM TREATMENT FEASIBILITY STUDY | ZONE 7 WATER AGENCY
DRAFT | JUNE -.-. | ��
groundwater basin, and evaluating the extent of groundwater contamination. Treatment
options for removing PFAS from the production wells are discussed in further detail in the
following sections.
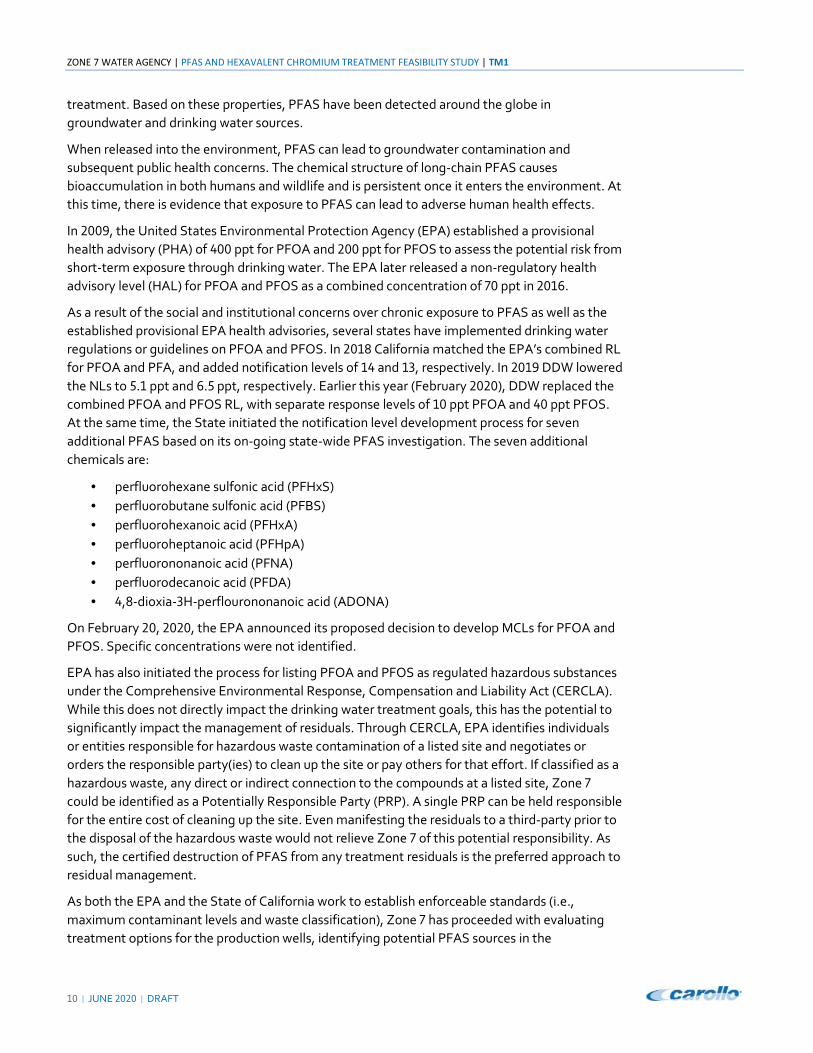
2.2 Treatment Considerations and Goals for the Removal of PFAS
As PFAS began emerging as a constituent of concern, a variety of treatment technologies have
been evaluated for PFAS removal with consideration to both cost and efficacy. As shown on
Figure <, the treatment processes commonly used in drinking water plants, including filtration
and chlorination, are unable to remove PFAS. However, phase‐transfer processes, such as
granular activated carbon (GAC), ion exchange (IX) resins, and membrane‐based separation
(e.g., reverse osmosis (RO)) have emerged as the leading PFAS treatment options based on their
high efficacy. These treatment options were considered for this Study and are discussed in
additional detail below.
Figure < PFAS Treatment Technologies
With a focus on readily implementable solutions to address wells already in excess of the PFOS
response level, emerging technologies, those with limited application, or systems requiring
extensive demonstration to DDW prior to implementation were not included this Study. Some
examples of these include novel media (e.g. FLUORO‐SORB®, cyclodextrins, FPG – few layered
porous graphite, carbon nanotubes, molecularly imprinted polymers), advanced oxidation
systems (Colorado School of Mines UV‐Sulfite reactor), plasma destruction (Clarkson Plasma
Reactor), electrocoagulation, etc. It is expected that this will be an area of continued
development with the potential for new technically feasible, economically competitive, and
commercially ready treatment options in the future.
A total of four treatment goals were agreed upon to be evaluated.
• Current CA DDW PFOA and PFOS Response Levels. Using the -.�3 fourth quarter
running annual average PFOA and PFOS concentrations, compared to the �. ppt PFOA
and <. ppt PFOS response levels, identify the well(s) requiring treatment or removal
from service. For those wells that require action, operational costs should be based on a
treatment target of D. percent of the RL.
ZONE 7 WATER AGENCY | PFAS AND HEXAVALENT CHROMIUM TREATMENT FEASIBILITY STUDY | TM1
�- | JUNE -.-. | DRAFT
• #$ Percent of CA DDW Response Levels. Given potential variability in water quality
results, use the -.�3 fourth quarter running annual average PFOA and PFOS
concentrations with D ppt PFOA and ;- ppt PFOS concentrations, to identify the well(s)
requiring treatment. For those wells that require action, operational costs should be
based on a treatment target of the same concentration. This level of service treatment is
consistent with Zone �’s current goal for water delivered to its retailers’ turnouts to be
less than D. percent of the applicable primary MCL.
• Lowest Current National PFAS Regulatory Limit. As a possible basis for future
regulations, treat to a level that matches the lowest current enforceable limit in the
nation. The lowest set of PFOA and PFOS maximum contaminant concentration is in the
state of New York (�. ppt for each compound). Vermont (VT), however, established an
actionable -. ppt advisory level (interim MCL) for a combined total of five PFAS: PFOA,
PFOS, PFHxS, PFHpA, and PFNA. If a VT public water system’s sum of five is in excess of
-. ppt, the system shall issue a “do not drink” notice until treatment is implemented to
reduce the levels to below the advisory level. As the sum of these five PFAS cannot
exceed -. ppt, and a suite of PFAS compounds are typically detected, this is
operationally more restrictive than individual PFOA and PFOS RLs of �. ppt.
• Below PFAS Reporting Limits. This treatment goal is to produce water that has had
any PFAS reduced to below the reporting limits, as determined by EPA Method =;� and
EPA Method =;�.�.
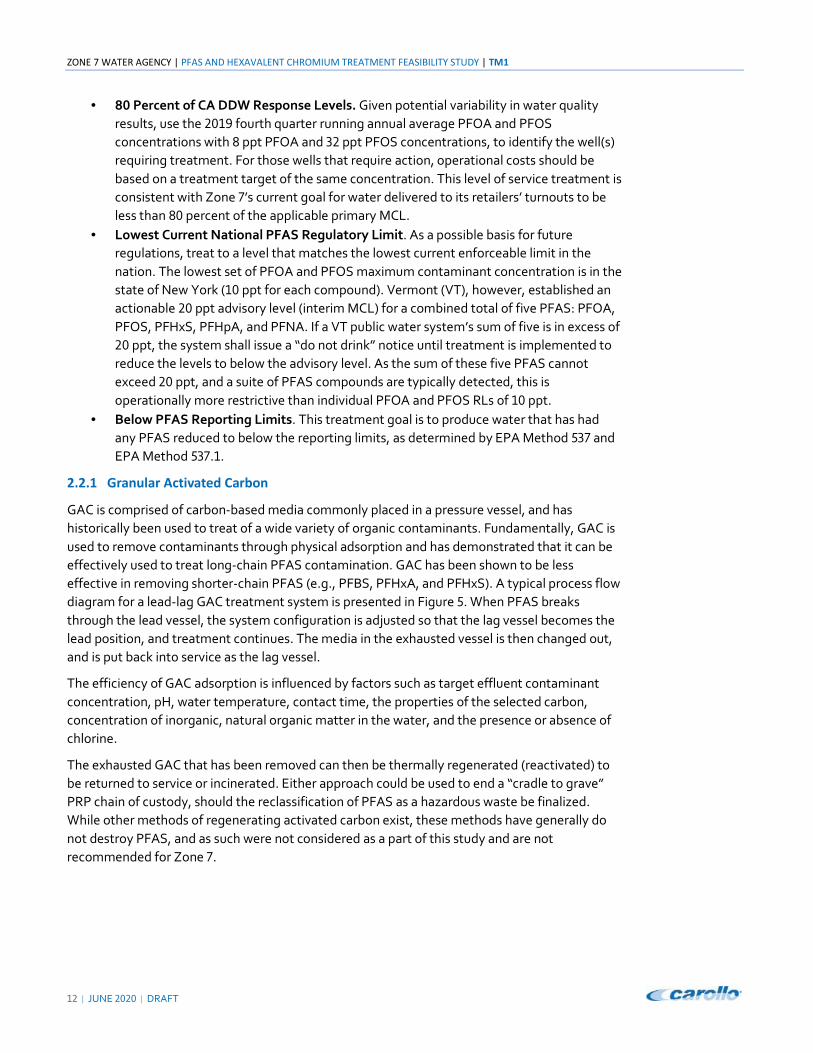
2.2.1 Granular Activated Carbon
GAC is comprised of carbon‐based media commonly placed in a pressure vessel, and has
historically been used to treat of a wide variety of organic contaminants. Fundamentally, GAC is
used to remove contaminants through physical adsorption and has demonstrated that it can be
effectively used to treat long‐chain PFAS contamination. GAC has been shown to be less
effective in removing shorter‐chain PFAS (e.g., PFBS, PFHxA, and PFHxS). A typical process flow
diagram for a lead‐lag GAC treatment system is presented in Figure =. When PFAS breaks
through the lead vessel, the system configuration is adjusted so that the lag vessel becomes the
lead position, and treatment continues. The media in the exhausted vessel is then changed out,
and is put back into service as the lag vessel.
The efficiency of GAC adsorption is influenced by factors such as target effluent contaminant
concentration, pH, water temperature, contact time, the properties of the selected carbon,
concentration of inorganic, natural organic matter in the water, and the presence or absence of
chlorine.
The exhausted GAC that has been removed can then be thermally regenerated (reactivated) to
be returned to service or incinerated. Either approach could be used to end a “cradle to grave”
PRP chain of custody, should the reclassification of PFAS as a hazardous waste be finalized.
While other methods of regenerating activated carbon exist, these methods have generally do
not destroy PFAS, and as such were not considered as a part of this study and are not
recommended for Zone �.
TM1 | PFAS AND HEXAVALENT CHROMIUM TREATMENT FEASIBILITY STUDY | ZONE 7 WATER AGENCY
DRAFT | JUNE -.-. | �;
Figure = Process Flow Diagram – Activated Carbon
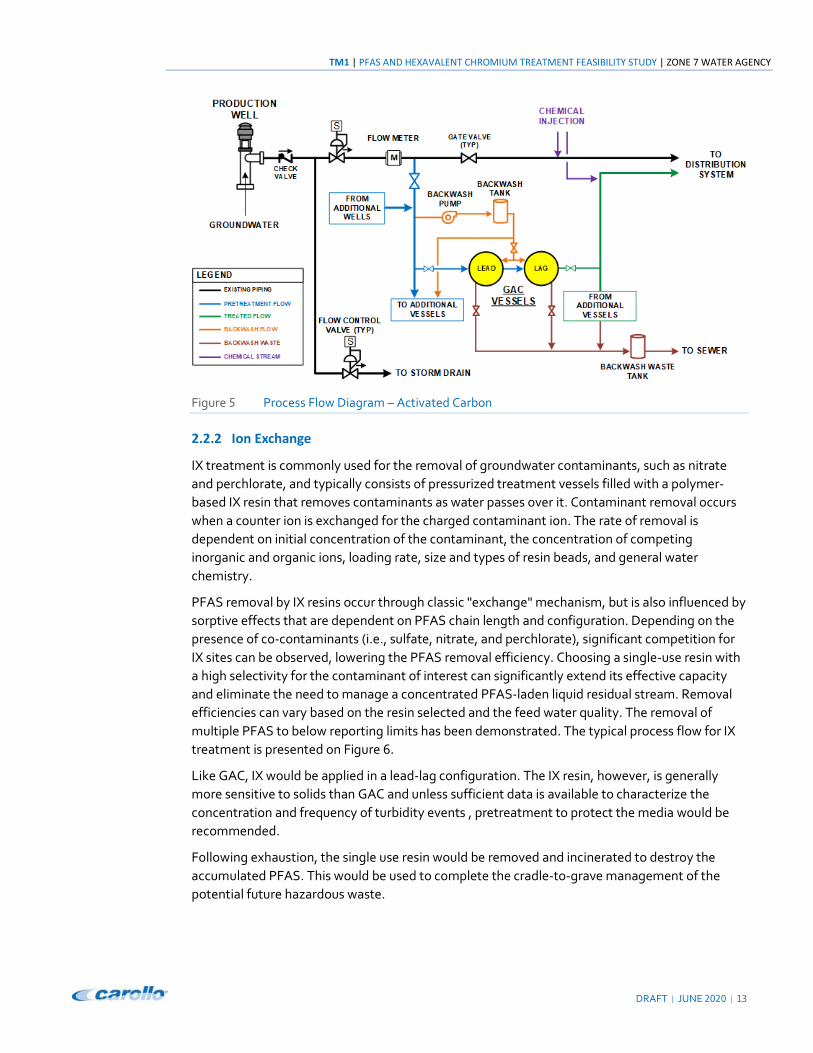
2.2.2 Ion Exchange
IX treatment is commonly used for the removal of groundwater contaminants, such as nitrate
and perchlorate, and typically consists of pressurized treatment vessels filled with a polymer‐
based IX resin that removes contaminants as water passes over it. Contaminant removal occurs
when a counter ion is exchanged for the charged contaminant ion. The rate of removal is
dependent on initial concentration of the contaminant, the concentration of competing
inorganic and organic ions, loading rate, size and types of resin beads, and general water
chemistry.
PFAS removal by IX resins occur through classic "exchange" mechanism, but is also influenced by
sorptive effects that are dependent on PFAS chain length and configuration. Depending on the
presence of co‐contaminants (i.e., sulfate, nitrate, and perchlorate), significant competition for
IX sites can be observed, lowering the PFAS removal efficiency. Choosing a single‐use resin with
a high selectivity for the contaminant of interest can significantly extend its effective capacity
and eliminate the need to manage a concentrated PFAS‐laden liquid residual stream. Removal
efficiencies can vary based on the resin selected and the feed water quality. The removal of
multiple PFAS to below reporting limits has been demonstrated. The typical process flow for IX
treatment is presented on Figure >.
Like GAC, IX would be applied in a lead‐lag configuration. The IX resin, however, is generally
more sensitive to solids than GAC and unless sufficient data is available to characterize the
concentration and frequency of turbidity events , pretreatment to protect the media would be
recommended.
Following exhaustion, the single use resin would be removed and incinerated to destroy the
accumulated PFAS. This would be used to complete the cradle‐to‐grave management of the
potential future hazardous waste.
ZONE 7 WATER AGENCY | PFAS AND HEXAVALENT CHROMIUM TREATMENT FEASIBILITY STUDY | TM1
�< | JUNE -.-. | DRAFT
Figure > Process Flow Diagram – Ion Exchange
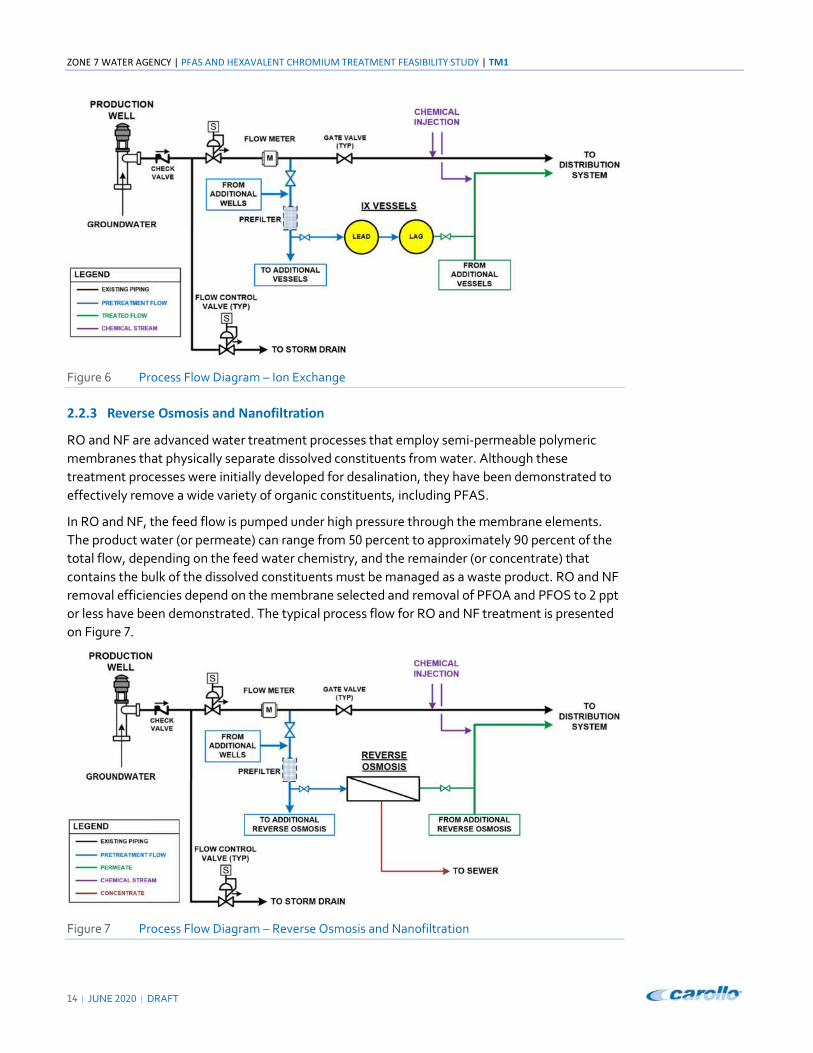
2.2.3 Reverse Osmosis and Nanofiltration
RO and NF are advanced water treatment processes that employ semi‐permeable polymeric
membranes that physically separate dissolved constituents from water. Although these
treatment processes were initially developed for desalination, they have been demonstrated to
effectively remove a wide variety of organic constituents, including PFAS.
In RO and NF, the feed flow is pumped under high pressure through the membrane elements.
The product water (or permeate) can range from =. percent to approximately 3. percent of the
total flow, depending on the feed water chemistry, and the remainder (or concentrate) that
contains the bulk of the dissolved constituents must be managed as a waste product. RO and NF
removal efficiencies depend on the membrane selected and removal of PFOA and PFOS to - ppt
or less have been demonstrated. The typical process flow for RO and NF treatment is presented
on Figure �.
Figure � Process Flow Diagram – Reverse Osmosis and Nanofiltration
TM1 | PFAS AND HEXAVALENT CHROMIUM TREATMENT FEASIBILITY STUDY | ZONE 7 WATER AGENCY
DRAFT | JUNE -.-. | �=
Zone �’s MGDP was initially installed to facilitate salt removal from the basin. Currently, it is also
effectively rejecting PFAS so that the permeate is below reporting levels. Under normal
operation of the MGDP, a portion of the production well water is by‐passed around the RO
membranes. The specific percent by‐pass varies based on the specific wells in operation. The
bypass has generally ranged from �= to >. percent of the total finished water.
This RO concentrate is discharged via the DSRSD system and, ultimately, the Livermore Amador
Valley Water Management Agency (LAVWMA) export pipeline. As the PFAS are not destroyed,
the future is uncertain with regards to the potential impacts should these chemicals be
reclassified as a hazardous waste.
2.2.4 Blending
In addition to the PFAS removal technologies described above, the finished water PFAS
concentration may also be managed through blending of specific wells with waters from
production wells lower in PFAS concentration. The efficacy of this approach depends on the
blending water’s quality and the desired finished water PFAS concentration.
2.2.5 Summary of PFAS Treatment Technologies
The advantages and disadvantages for each of the potential treatment technologies considered
are summarized in Table <. The selected treatment options for each site for the City are
discussed in further detail in the following sections.
ZONE 7 WATER AGENCY | PFAS AND HEXAVALENT CHROMIUM TREATMENT FEASIBILITY STUDY | TM1
�> | JUNE -.-. | DRAFT
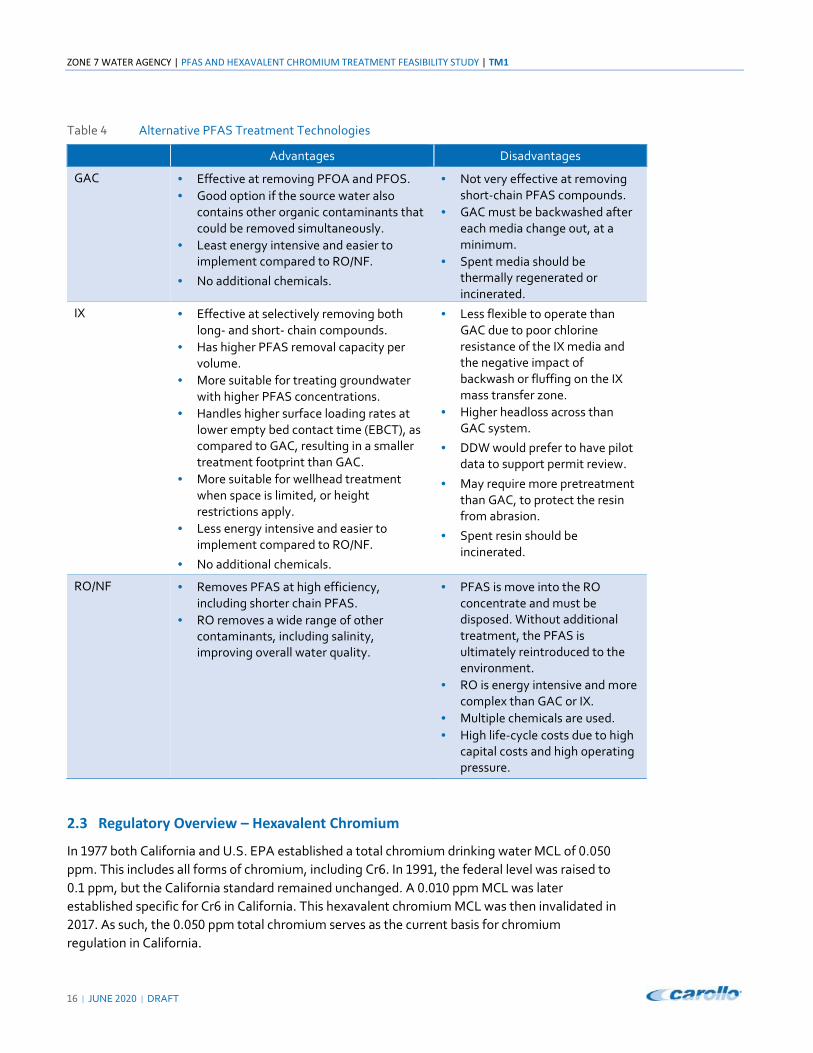
Table < Alternative PFAS Treatment Technologies
Advantages Disadvantages
GAC • Effective at removing PFOA and PFOS.
• Good option if the source water also
contains other organic contaminants that
could be removed simultaneously.
• Least energy intensive and easier to
implement compared to RO/NF.
• No additional chemicals.
• Not very effective at removing
short‐chain PFAS compounds.
• GAC must be backwashed after
each media change out, at a
minimum.
• Spent media should be
thermally regenerated or
incinerated.
IX • Effective at selectively removing both
long‐ and short‐ chain compounds.
• Has higher PFAS removal capacity per
volume.
• More suitable for treating groundwater
with higher PFAS concentrations.
• Handles higher surface loading rates at
lower empty bed contact time (EBCT), as
compared to GAC, resulting in a smaller
treatment footprint than GAC.
• More suitable for wellhead treatment
when space is limited, or height
restrictions apply.
• Less energy intensive and easier to
implement compared to RO/NF.
• No additional chemicals.
• Less flexible to operate than
GAC due to poor chlorine
resistance of the IX media and
the negative impact of
backwash or fluffing on the IX
mass transfer zone.
• Higher headloss across than
GAC system.
• DDW would prefer to have pilot
data to support permit review.
• May require more pretreatment
than GAC, to protect the resin
from abrasion.
• Spent resin should be
incinerated.
RO/NF • Removes PFAS at high efficiency,
including shorter chain PFAS.
• RO removes a wide range of other
contaminants, including salinity,
improving overall water quality.
• PFAS is move into the RO
concentrate and must be
disposed. Without additional
treatment, the PFAS is
ultimately reintroduced to the
environment.
• RO is energy intensive and more
complex than GAC or IX.
• Multiple chemicals are used.
• High life‐cycle costs due to high
capital costs and high operating
pressure.
2.3 Regulatory Overview – Hexavalent Chromium
In �3�� both California and U.S. EPA established a total chromium drinking water MCL of ...=.
ppm. This includes all forms of chromium, including Cr>. In �33�, the federal level was raised to
..� ppm, but the California standard remained unchanged. A ...�. ppm MCL was later
established specific for Cr> in California. This hexavalent chromium MCL was then invalidated in
-.��. As such, the ...=. ppm total chromium serves as the current basis for chromium
regulation in California.
TM1 | PFAS AND HEXAVALENT CHROMIUM TREATMENT FEASIBILITY STUDY | ZONE 7 WATER AGENCY
DRAFT | JUNE -.-. | ��
Earlier this year, the State Water Resources Control Board requested public comments on the
White Paper Discussion on Economic Feasibility Analysis in Consideration of a Hexavalent
Chromium Maximum Contaminant Level (MCL). The public comment period closed May �=,
-.-.. The input and comments received will be considered by the State Water Board in the
future development of the MCL for hexavalent chromium.
2.4 Treatment Considerations and Goals for the Removal of Hexavalent Chromium
Multiple technologies exist to treat hexavalent chromium. These include ion exchange, reverse
osmosis, and reduction coagulation filtration. The treatment options selected by Zone � to be
included in this study included those treatment processes that may already be implemented for
PFAS or reduction coagulation without filtration (by stannous chloride).
Both regenerable and single‐use ion exchange processes can be used to remove hexavalent
chromium, however, only single‐use IX was considered here. Regenerable systems were not
considered due to the production of a brine containing concentrated chromium, the treatment
or disposal of this brine, and increased operational complexity of these systems. The process
flow diagram of a single‐use IX system looks identical to that shown in Figure >. It should be
noted, however, that the resins used for hexavalent chromium removal and PFAS removal are
different. If both contaminants are to be removed by ion exchange, separate systems would
generally need to be installed.
As with IX, the process flow to separate hexavalent chromium using reverse osmosis is the same
as shown in Figure �.
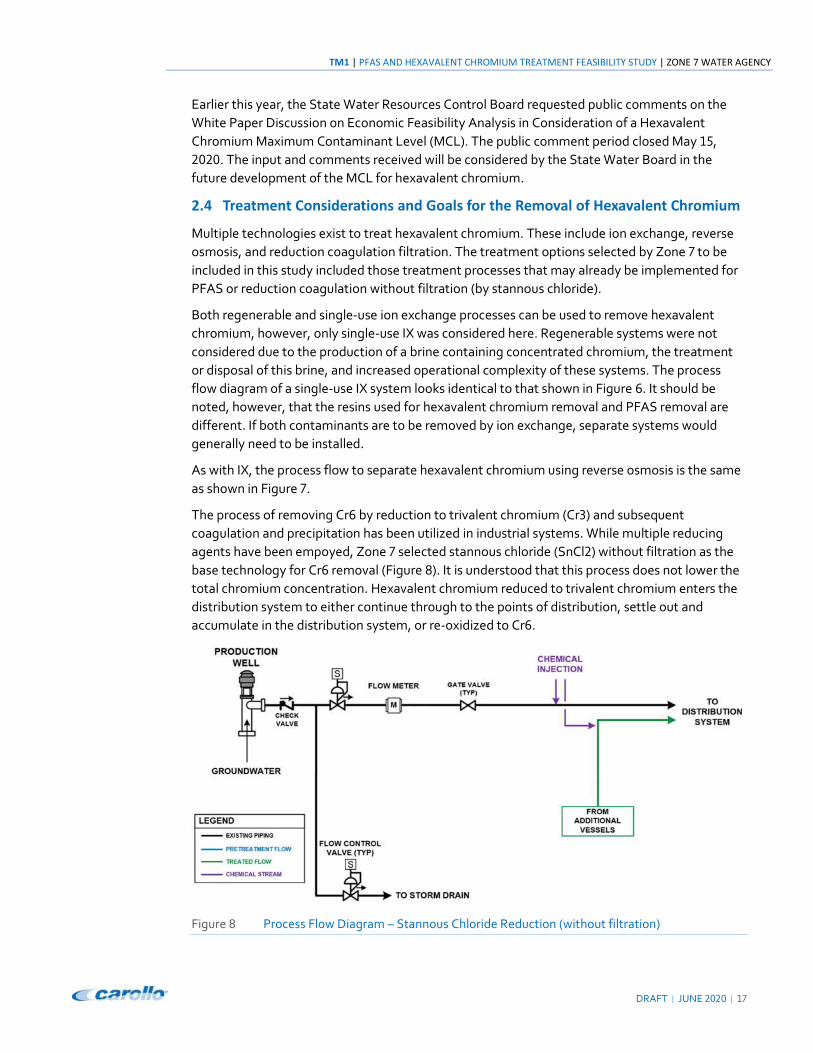
The process of removing Cr> by reduction to trivalent chromium (Cr;) and subsequent
coagulation and precipitation has been utilized in industrial systems. While multiple reducing
agents have been empoyed, Zone � selected stannous chloride (SnCl-) without filtration as the
base technology for Cr> removal (Figure D). It is understood that this process does not lower the
total chromium concentration. Hexavalent chromium reduced to trivalent chromium enters the
distribution system to either continue through to the points of distribution, settle out and
accumulate in the distribution system, or re‐oxidized to Cr>.
Figure D Process Flow Diagram – Stannous Chloride Reduction (without filtration)
ZONE 7 WATER AGENCY | PFAS AND HEXAVALENT CHROMIUM TREATMENT FEASIBILITY STUDY | TM1
�D | JUNE -.-. | DRAFT
A single treatment goal for Cr> was selected by Zone � for evaluation:
• # ppb Cr*. Given former �. ppb MCL, potential variability in water quality results, and
the -.�3 fourth quarter running annual average concentrations, use D ppb to identify the
well(s) requiring treatment. For those wells that are above this trigger, operational costs
should be based on a treatment target of D ppb.
TM1 | PFAS AND HEXAVALENT CHROMIUM TREATMENT FEASIBILITY STUDY | ZONE 7 WATER AGENCY
DRAFT | JUNE -.-. | �3
Section 3
TREATMENT ALTERNATIVES SCREENING
Each of the processes described above were considered where concentrations of PFAS and/or
hexavalent chromium exceed the treatment goals for each identified production well. The
locations requiring treatment to achieve the various goals are summarized in Table �. Due to the
limited space available at many of the sites, the footprint of each technology was considered to
determine if onsite treatment of each technology was reasonably feasible or considered a fatal
flaw. Centralized treatment and/or blending was also considered at a single site for each
wellfield. Costs and aesthetic impacts were not considered for this initial screening.
Due to the constraints with most of the sites, this footprint screening of the treatment
alternatives assumed either no setbacks or the requirements could be waived. Depending on the
ultimate treatment strategy selected by Zone �, the setback requirements or their waivers, the
preliminary design should document the appropriate basis for detailed design.
3.1 Pretreatment Requirements
A preliminary evaluation of water quality was performed to determine if pretreatment was
required ahead of the GAC and IX systems. Pretreatment limits were coordinated with media
vendors and are summarized in Table =. The limits shown are based on general rules of thumb
for considering pretreatment. Water quality data in exceedance of the limit does not necessarily
suggest pretreatment is required, but indicates where pilot testing could be utilized to determine
if pretreatment could benefit the life‐cycle cost of the treatment process.
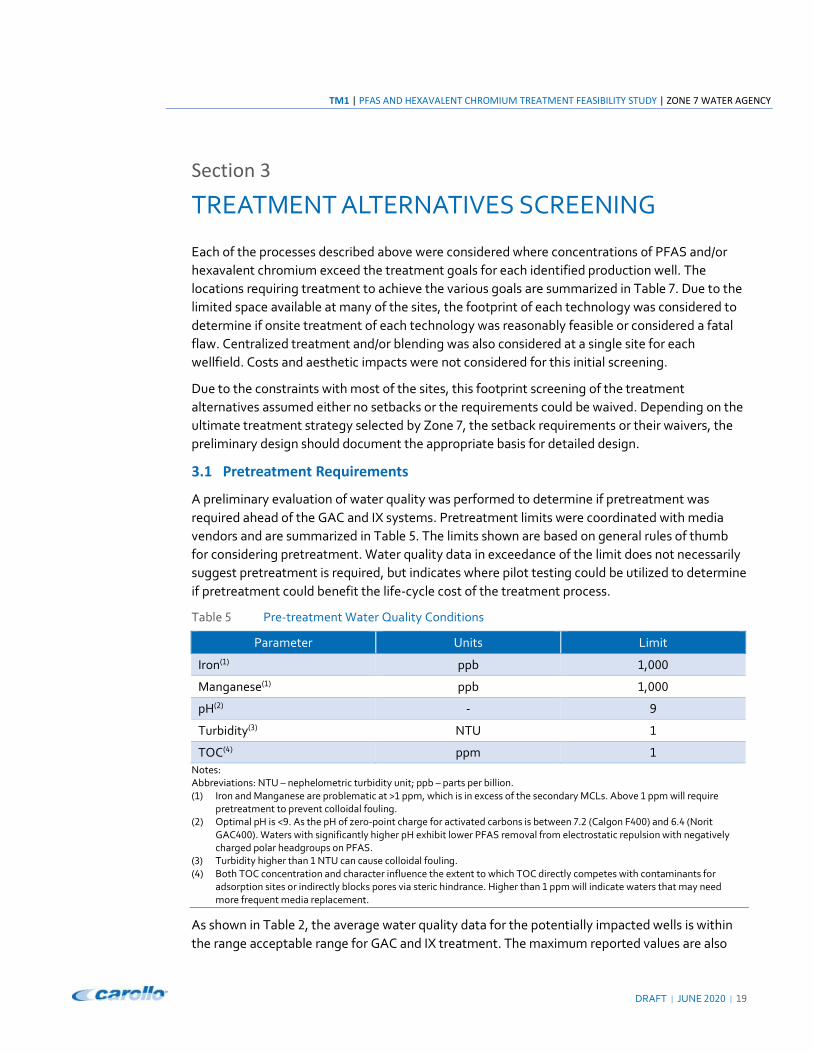
Table = Pre‐treatment Water Quality Conditions
Parameter Units Limit
Iron(�) ppb �,...
Manganese(�) ppb �,...
pH(-) ‐ 3
Turbidity(;) NTU �
TOC(<) ppm �
Notes:
Abbreviations: NTU – nephelometric turbidity unit; ppb – parts per billion.
(�) Iron and Manganese are problematic at >� ppm, which is in excess of the secondary MCLs. Above � ppm will require
pretreatment to prevent colloidal fouling.
(-) Optimal pH is <3. As the pH of zero‐point charge for activated carbons is between �.- (Calgon F<..) and >.< (Norit
GAC<..). Waters with significantly higher pH exhibit lower PFAS removal from electrostatic repulsion with negatively
charged polar headgroups on PFAS.
(;) Turbidity higher than � NTU can cause colloidal fouling.
(<) Both TOC concentration and character influence the extent to which TOC directly competes with contaminants for
adsorption sites or indirectly blocks pores via steric hindrance. Higher than � ppm will indicate waters that may need
more frequent media replacement.
As shown in Table -, the average water quality data for the potentially impacted wells is within
the range acceptable range for GAC and IX treatment. The maximum reported values are also

ZONE 7 WATER AGENCY | PFAS AND HEXAVALENT CHROMIUM TREATMENT FEASIBILITY STUDY | TM1
-. | JUNE -.-. | DRAFT
within the limits for each parameter, except turbidity. All of these wells had reports of quarterly
turbidity values in excess of ..= NTU. Mocho �, Mocho -, and Mocho ; all had turbidities ≥� NTU.
Given a range of estimated bed life, it is recommended that at a minimum, space for pre‐
treatment be included in the site layouts as a means to help protect the treatment system from
these solids.
Additional evaluation of the individual wells turbidities and each well’s pump‐to‐waste protocols,
is recommended during preliminary design to determine which systems should receive
pretreatment.
3.2 Design Criteria
The design criteria used to develop the treatment plant site layouts for GAC and IX systems are
summarized in Table >. Specific design criteria for the recommended alternative are listed in
Section =.
Table > General Site Layout Design Criteria
Description Units GAC IX
Flow per System (- vessels, Lead‐Lag)(�) gpm 3.. �,-=.
Vessel Configuration ‐ Lead‐Lag Lead‐Lag
EBCT per Vessel min �. ;
Vessel Diameter ft �- �-
Notes:
(�) Only �-‐foot diameter vessels were considered for the site layout development.
3.3 Site Layouts
The following sections provide preliminary layouts for the selected treatment alternatives at
each well site. The layouts include vessel locations, large buried pipeline routes, and major
system components. The layouts also show potential equipment needed to support these
systems. For space considerations, pretreatment (desanders and bag filters) before GAC and IX
has been shown. The need for pretreatment should be verified through preliminary and detailed
design.
Zone � has stated that treatment facilities are to be enclosed within a building to both protect
the equipment and serve as a “good neighbor” to the surrounding community. This was
identified after conceptual site layouts had been developed, and as such, have not been
included. Site layouts of the facilities selected by Zone � to be developed for preliminary and
detailed design should be updated to enclose the treatment processes.
For the purposes of the layouts, it was assumed that the kinetics of stannous chloride reduction
are sufficiently fast such that additional contact time within the pipe is not necessary prior to
chlorination and distribution. It is recommended that during the preliminary design phase, tests
be performed to establish the necessary contact time for Zone � wells’ water quality.
TM1 | PFAS AND HEXAVALENT CHROMIUM TREATMENT FEASIBILITY STUDY | ZONE 7 WATER AGENCY
DRAFT | JUNE -.-. | -�
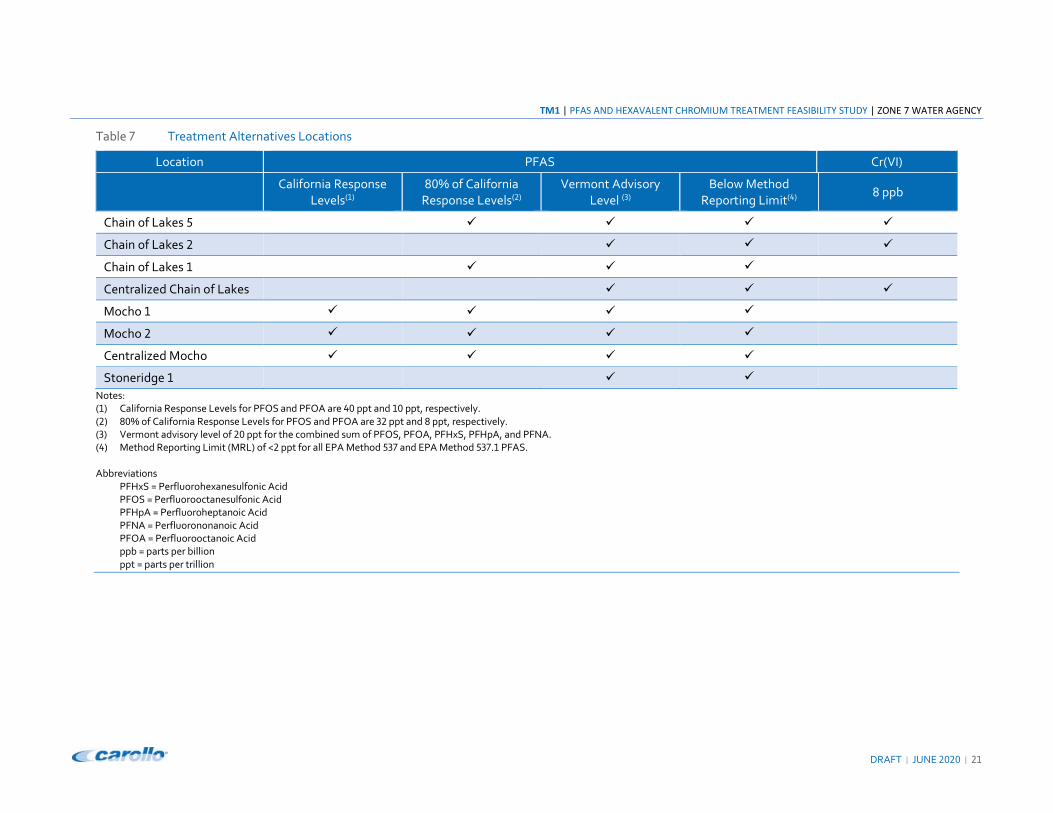
Table � Treatment Alternatives Locations
Location PFAS Cr(VI)
California Response
Levels(�)
D.% of California
Response Levels(-)
Vermont Advisory
Level (;)
Below Method
Reporting Limit(<) D ppb
Chain of Lakes =
Chain of Lakes -
Chain of Lakes �
Centralized Chain of Lakes
Mocho �
Mocho -
Centralized Mocho
Stoneridge �
Notes:
(�) California Response Levels for PFOS and PFOA are <. ppt and �. ppt, respectively.
(-) D.% of California Response Levels for PFOS and PFOA are ;- ppt and D ppt, respectively.
(;) Vermont advisory level of -. ppt for the combined sum of PFOS, PFOA, PFHxS, PFHpA, and PFNA.
(<) Method Reporting Limit (MRL) of <- ppt for all EPA Method =;� and EPA Method =;�.� PFAS.
Abbreviations
PFHxS = Perfluorohexanesulfonic Acid
PFOS = Perfluorooctanesulfonic Acid
PFHpA = Perfluoroheptanoic Acid
PFNA = Perfluorononanoic Acid
PFOA = Perfluorooctanoic Acid
ppb = parts per billion
ppt = parts per trillion
TM1 | PFAS AND HEXAVALENT CHROMIUM TREATMENT FEASIBILITY STUDY | ZONE 7 WATER AGENCY
DRAFT | JUNE -.-. | -;
3.4 Chain of Lakes Wellfield
The screening of each of the alternatives for the Chain of Lakes Wellfield is presented below. For
these alternatives, it was assumed that maintenance fluffing or backwashing of media could be
either returned to the head of the treatment process or discharged to the adjacent lakes as the
ability to connect to a sewer is not in close proximity. This would need to be verified through
preliminary and detailed design.
Confirmations of vertical limitations and other requirements should be confirmed through the
preliminary and detailed design process due the wellfield’s proximity to the Livermore Municipal
Airport and its flight paths.
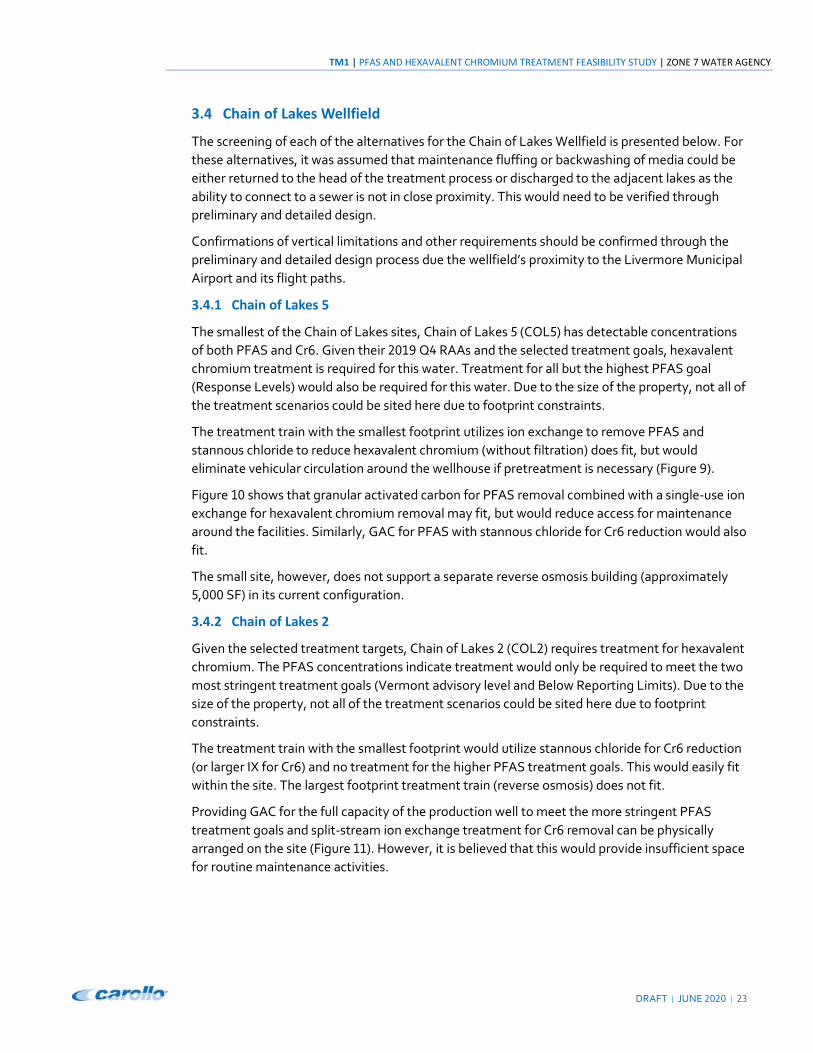
3.4.1 Chain of Lakes 5
The smallest of the Chain of Lakes sites, Chain of Lakes = (COL=) has detectable concentrations
of both PFAS and Cr>. Given their -.�3 Q< RAAs and the selected treatment goals, hexavalent
chromium treatment is required for this water. Treatment for all but the highest PFAS goal
(Response Levels) would also be required for this water. Due to the size of the property, not all of
the treatment scenarios could be sited here due to footprint constraints.
The treatment train with the smallest footprint utilizes ion exchange to remove PFAS and
stannous chloride to reduce hexavalent chromium (without filtration) does fit, but would
eliminate vehicular circulation around the wellhouse if pretreatment is necessary (Figure 3).
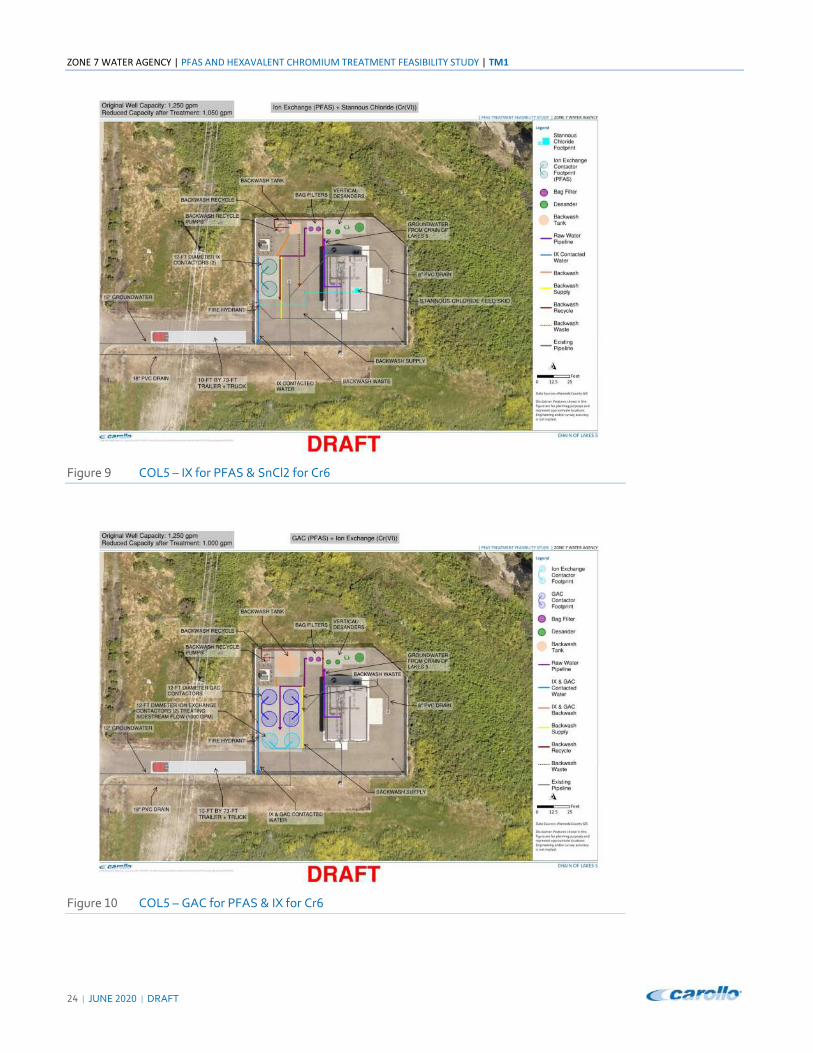
Figure �. shows that granular activated carbon for PFAS removal combined with a single‐use ion
exchange for hexavalent chromium removal may fit, but would reduce access for maintenance
around the facilities. Similarly, GAC for PFAS with stannous chloride for Cr> reduction would also
fit.
The small site, however, does not support a separate reverse osmosis building (approximately
=,... SF) in its current configuration.
3.4.2 Chain of Lakes 2
Given the selected treatment targets, Chain of Lakes - (COL-) requires treatment for hexavalent
chromium. The PFAS concentrations indicate treatment would only be required to meet the two
most stringent treatment goals (Vermont advisory level and Below Reporting Limits). Due to the
size of the property, not all of the treatment scenarios could be sited here due to footprint
constraints.
The treatment train with the smallest footprint would utilize stannous chloride for Cr> reduction
(or larger IX for Cr>) and no treatment for the higher PFAS treatment goals. This would easily fit
within the site. The largest footprint treatment train (reverse osmosis) does not fit.
Providing GAC for the full capacity of the production well to meet the more stringent PFAS
treatment goals and split‐stream ion exchange treatment for Cr> removal can be physically
arranged on the site (Figure ��). However, it is believed that this would provide insufficient space
for routine maintenance activities.
ZONE 7 WATER AGENCY | PFAS AND HEXAVALENT CHROMIUM TREATMENT FEASIBILITY STUDY | TM1
-< | JUNE -.-. | DRAFT
Figure 3 COL= – IX for PFAS & SnCl- for Cr>
Figure �. COL= – GAC for PFAS & IX for Cr>

TM1 | PFAS AND HEXAVALENT CHROMIUM TREATMENT FEASIBILITY STUDY | ZONE 7 WATER AGENCY
DRAFT | JUNE -.-. | -=
Figure �� COL- – GAC for PFAS & XI for Cr>
Figure �- COL- – IX for PFAS & SnCl- for Cr>
ZONE 7 WATER AGENCY | PFAS AND HEXAVALENT CHROMIUM TREATMENT FEASIBILITY STUDY | TM1
-> | JUNE -.-. | DRAFT
Adjusting treatment to rely upon IX for the full capacity of the well to removal PFAS and
stannous chlorine to reduce Cr>, reduces the treatment footprint, but still results in a
constrained site with reduced access to facilities (Figure �-). If no other options were available,
refining this alternative might result in a suitable facility. However, treatment can be centralized
at Chain of Lakes � (COL�), providing additional accessibility and centralized operations and
maintenance activities.
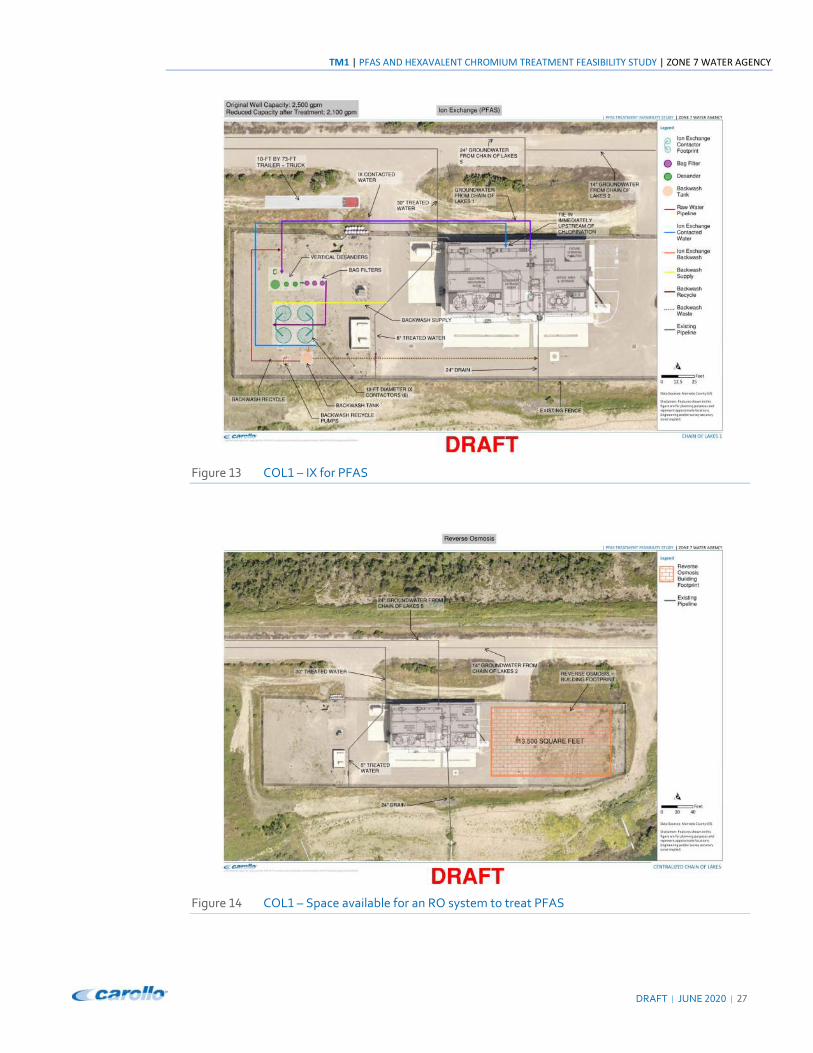
3.4.3 Chain of Lakes 1
The largest of the Chain of Lakes production wells, COL� does not need hexavalent chromium
treatment. The -.�3 Q< RAA concentrations, however, indicates that PFAS treatment is
required to meet three of the four goals.
Either IX or GAC systems for PFAS removal for the full capacity of this production well, easily fit
within this site. Figure �; shows IX with pretreatment.
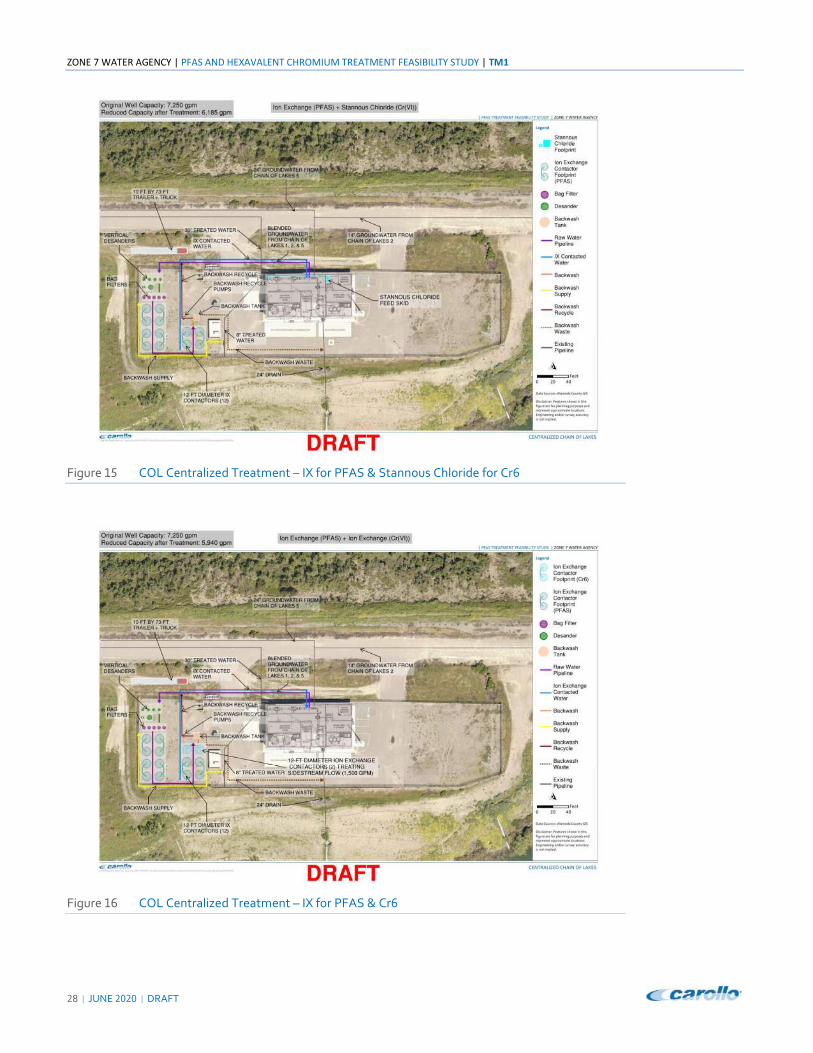
This is the only Chain of Lakes production well site large enough to support RO treatment. To
meet the D. percent of the Response Level goal, a building approximately <,... SF would be
required. As the PFAS treatment goal is lowered, more of the water must be treated through the
membrane system, increasing the membrane area and building footprint. It is estimated that a
building approximately D,=.. SF in size would be required to meet the two lowest PFAS
treatment goals (VT advisory level and Below Reporting Limits). Figure �< shows there is enough
space for buildings of these sizes.
For any reverse osmosis treatment option, the disposal of the RO concentrate must be
addressed. At a raw water flow rate of -,=.. gpm and the -.�3 Q< PFAS RAA concentrations the
RO concentrate flow rate would range from approximately -.‐ to =..‐gpm depending on the
treatment goal. The Livermore Interceptor Pipeline and Clean Water Revival Pipeline are
approximately ;,=.. LF away from COL�. Should this option be considered further, additional
investigation into the feasibility and costs of disposing the RO concentrate is necessary.
Independent of the treatment option selection, attention to the geotechnical conditions should
be provided during preliminary and detailed design. A structural improvement project (Chain of
Lakes � Facilities Stabilization Project) was completed earlier this year to help protect the
existing facilities from on‐going settlement and horizontal migration.
3.4.4 Centralized Treatment at Chain of Lakes 1
In lieu of providing three independent facilities, a centralized treatment facility at COL� that
could treat the full capacity of the three wells was evaluated. Depending on the wells in
operation, the centralized facility would need to provide PFAS treatment for three of the
treatment goals. Based on the -.�3 Q< RAAs, only a portion of the flow would need to be
treated to manage the hexavalent chromium concentration.
A centralized RO facility treating �,-=. gpm of raw water would be between approximately =,...
and �;,=.. SF in area with the building size increasing as the PFAS goal is lowered. The RO
system, could simultaneously address hexavalent chromium. As previously shown in Figure �<,
facilities of this size could fit within the existing fence lines. The resulting RO concentrate flow
generated by these facilities would range from approximately -.. to �,<.. gpm depending on
the selected PFAS treatment goal.
TM1 | PFAS AND HEXAVALENT CHROMIUM TREATMENT FEASIBILITY STUDY | ZONE 7 WATER AGENCY
DRAFT | JUNE -.-. | -�
Figure �; COL� – IX for PFAS
Figure �< COL� – Space available for an RO system to treat PFAS
ZONE 7 WATER AGENCY | PFAS AND HEXAVALENT CHROMIUM TREATMENT FEASIBILITY STUDY | TM1
-D | JUNE -.-. | DRAFT
Figure �= COL Centralized Treatment – IX for PFAS & Stannous Chloride for Cr>
Figure �> COL Centralized Treatment – IX for PFAS & Cr>
TM1 | PFAS AND HEXAVALENT CHROMIUM TREATMENT FEASIBILITY STUDY | ZONE 7 WATER AGENCY
DRAFT | JUNE -.-. | -3
The Livermore Interceptor Pipeline and Clean Water Revival Pipeline are approximately ;,=.. LF
away from COL�. Should this option be considered further, additional investigation into the
feasibility and costs of disposing the RO concentrate is necessary.
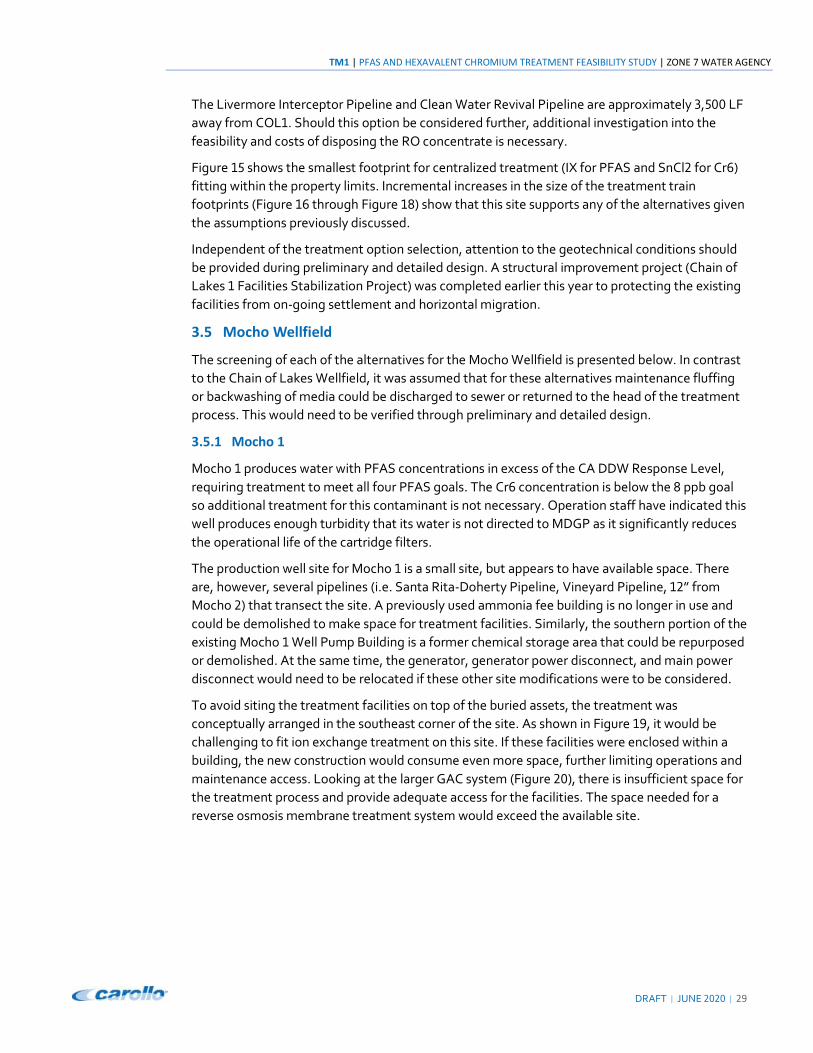
Figure �= shows the smallest footprint for centralized treatment (IX for PFAS and SnCl- for Cr>)
fitting within the property limits. Incremental increases in the size of the treatment train
footprints (Figure �> through Figure �D) show that this site supports any of the alternatives given
the assumptions previously discussed.
Independent of the treatment option selection, attention to the geotechnical conditions should
be provided during preliminary and detailed design. A structural improvement project (Chain of
Lakes � Facilities Stabilization Project) was completed earlier this year to protecting the existing
facilities from on‐going settlement and horizontal migration.
3.5 Mocho Wellfield
The screening of each of the alternatives for the Mocho Wellfield is presented below. In contrast
to the Chain of Lakes Wellfield, it was assumed that for these alternatives maintenance fluffing
or backwashing of media could be discharged to sewer or returned to the head of the treatment
process. This would need to be verified through preliminary and detailed design.
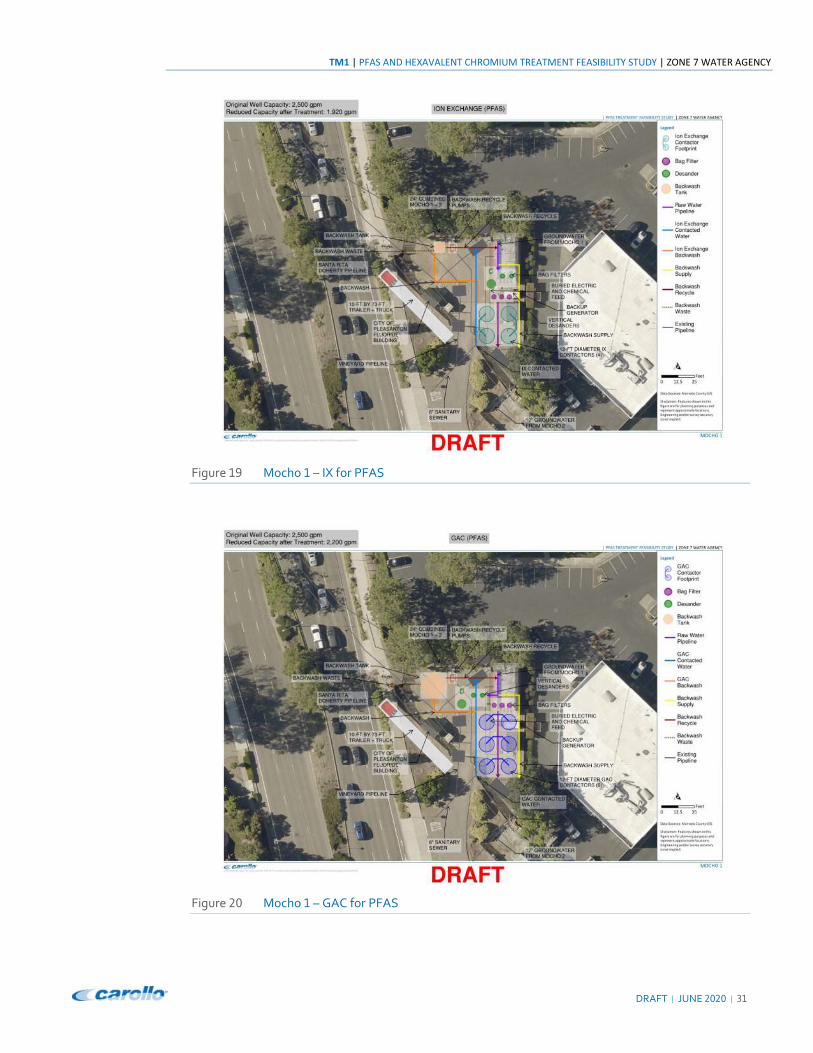
3.5.1 Mocho 1
Mocho � produces water with PFAS concentrations in excess of the CA DDW Response Level,
requiring treatment to meet all four PFAS goals. The Cr> concentration is below the D ppb goal
so additional treatment for this contaminant is not necessary. Operation staff have indicated this
well produces enough turbidity that its water is not directed to MDGP as it significantly reduces
the operational life of the cartridge filters.
The production well site for Mocho � is a small site, but appears to have available space. There
are, however, several pipelines (i.e. Santa Rita‐Doherty Pipeline, Vineyard Pipeline, �-” from
Mocho -) that transect the site. A previously used ammonia fee building is no longer in use and
could be demolished to make space for treatment facilities. Similarly, the southern portion of the
existing Mocho � Well Pump Building is a former chemical storage area that could be repurposed
or demolished. At the same time, the generator, generator power disconnect, and main power
disconnect would need to be relocated if these other site modifications were to be considered.
To avoid siting the treatment facilities on top of the buried assets, the treatment was
conceptually arranged in the southeast corner of the site. As shown in Figure �3, it would be
challenging to fit ion exchange treatment on this site. If these facilities were enclosed within a
building, the new construction would consume even more space, further limiting operations and
maintenance access. Looking at the larger GAC system (Figure -.), there is insufficient space for
the treatment process and provide adequate access for the facilities. The space needed for a
reverse osmosis membrane treatment system would exceed the available site.

ZONE 7 WATER AGENCY | PFAS AND HEXAVALENT CHROMIUM TREATMENT FEASIBILITY STUDY | TM1
;. | JUNE -.-. | DRAFT
Figure �� COL Centralized Treatment – GAC for PFAS & Stannous Chloride for Cr>
Figure �D COL Centralized Treatment – GAC for PFAS & IX for Cr>
TM1 | PFAS AND HEXAVALENT CHROMIUM TREATMENT FEASIBILITY STUDY | ZONE 7 WATER AGENCY
DRAFT | JUNE -.-. | ;�
Figure �3 Mocho � – IX for PFAS
Figure -. Mocho � – GAC for PFAS
ZONE 7 WATER AGENCY | PFAS AND HEXAVALENT CHROMIUM TREATMENT FEASIBILITY STUDY | TM1
;- | JUNE -.-. | DRAFT
3.5.2 Mocho 2
Mocho - -.�3 Q< RAA results indicate that treatment is required to address all four of the PFAS
treatment goals, but no additional Cr> treatment is required.
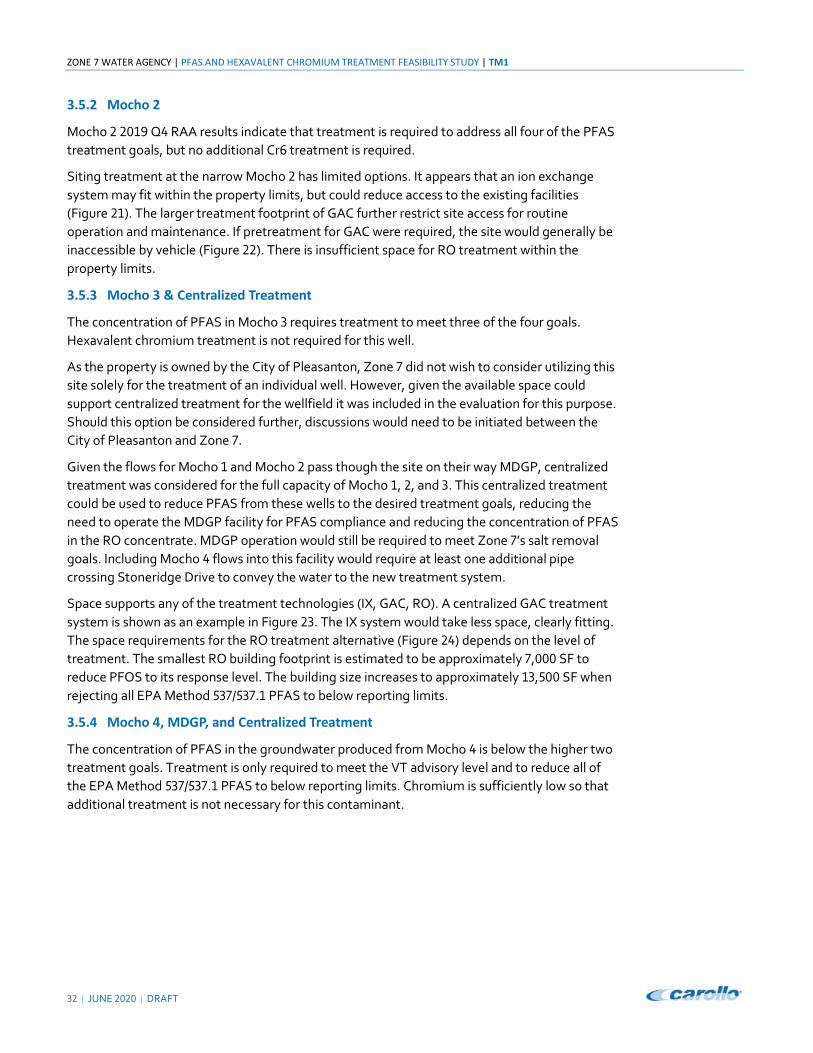
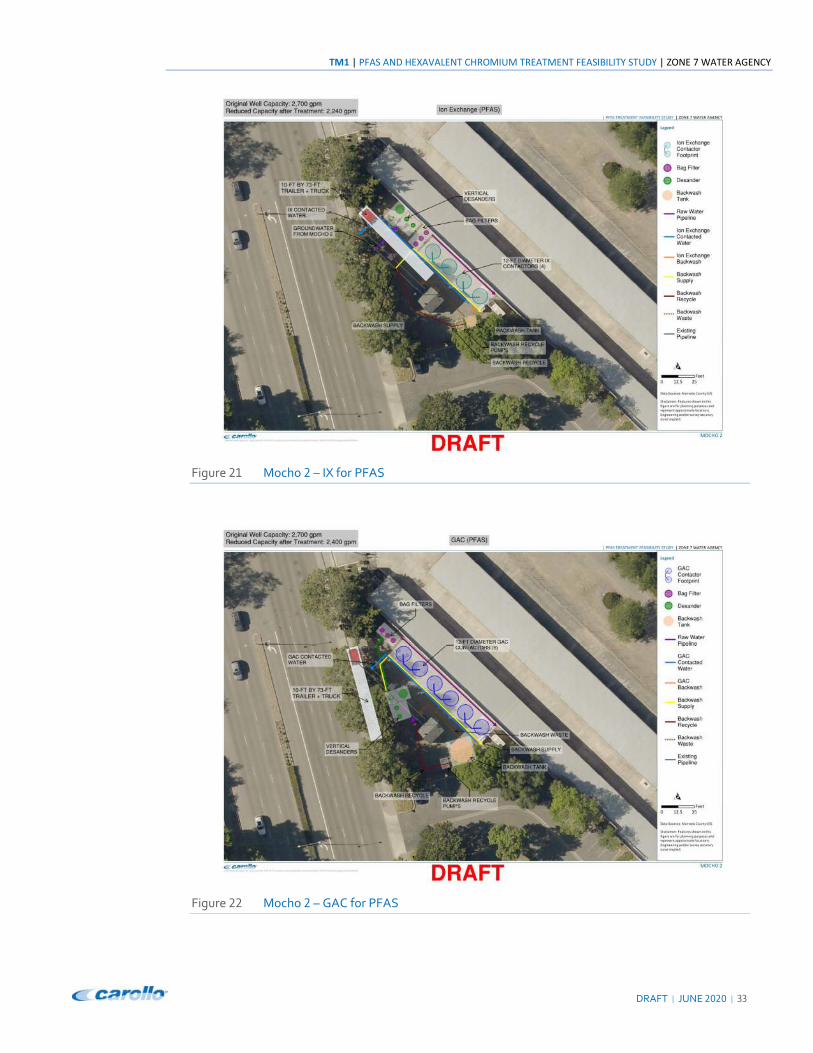
Siting treatment at the narrow Mocho - has limited options. It appears that an ion exchange
system may fit within the property limits, but could reduce access to the existing facilities
(Figure -�). The larger treatment footprint of GAC further restrict site access for routine
operation and maintenance. If pretreatment for GAC were required, the site would generally be
inaccessible by vehicle (Figure --). There is insufficient space for RO treatment within the
property limits.
3.5.3 Mocho 3 & Centralized Treatment
The concentration of PFAS in Mocho ; requires treatment to meet three of the four goals.
Hexavalent chromium treatment is not required for this well.
As the property is owned by the City of Pleasanton, Zone � did not wish to consider utilizing this
site solely for the treatment of an individual well. However, given the available space could
support centralized treatment for the wellfield it was included in the evaluation for this purpose.
Should this option be considered further, discussions would need to be initiated between the
City of Pleasanton and Zone �.
Given the flows for Mocho � and Mocho - pass though the site on their way MDGP, centralized
treatment was considered for the full capacity of Mocho �, -, and ;. This centralized treatment
could be used to reduce PFAS from these wells to the desired treatment goals, reducing the
need to operate the MDGP facility for PFAS compliance and reducing the concentration of PFAS
in the RO concentrate. MDGP operation would still be required to meet Zone �’s salt removal
goals. Including Mocho < flows into this facility would require at least one additional pipe
crossing Stoneridge Drive to convey the water to the new treatment system.
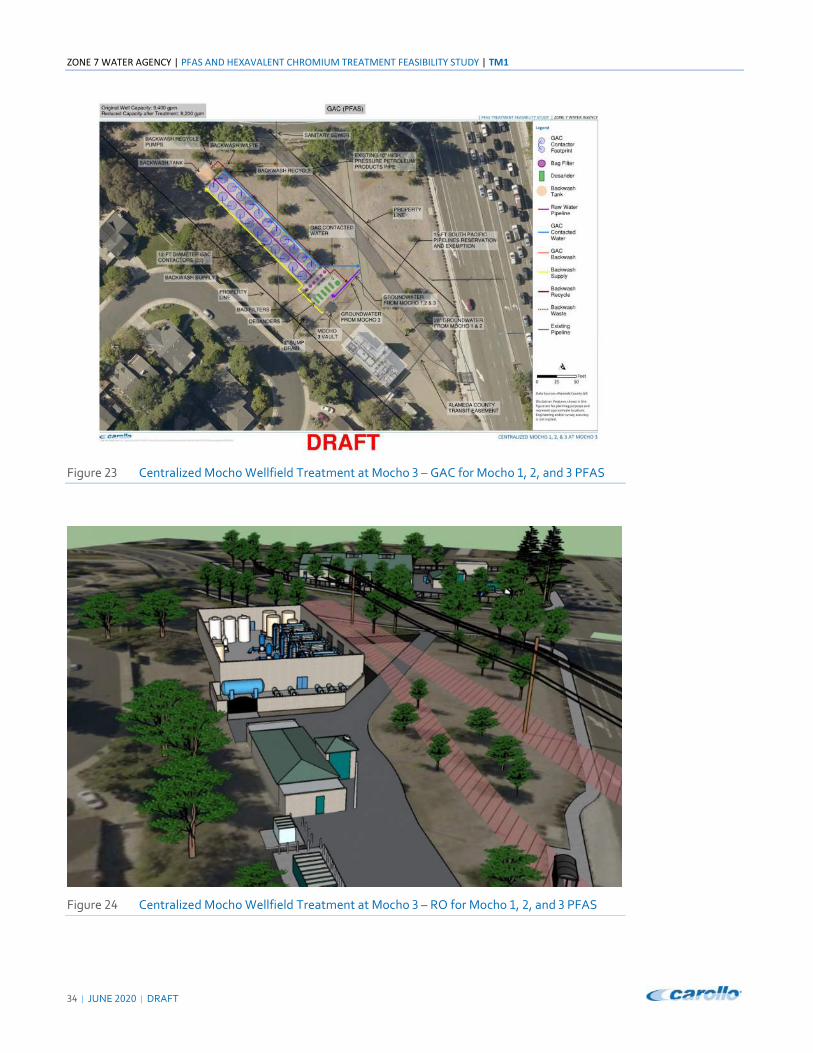
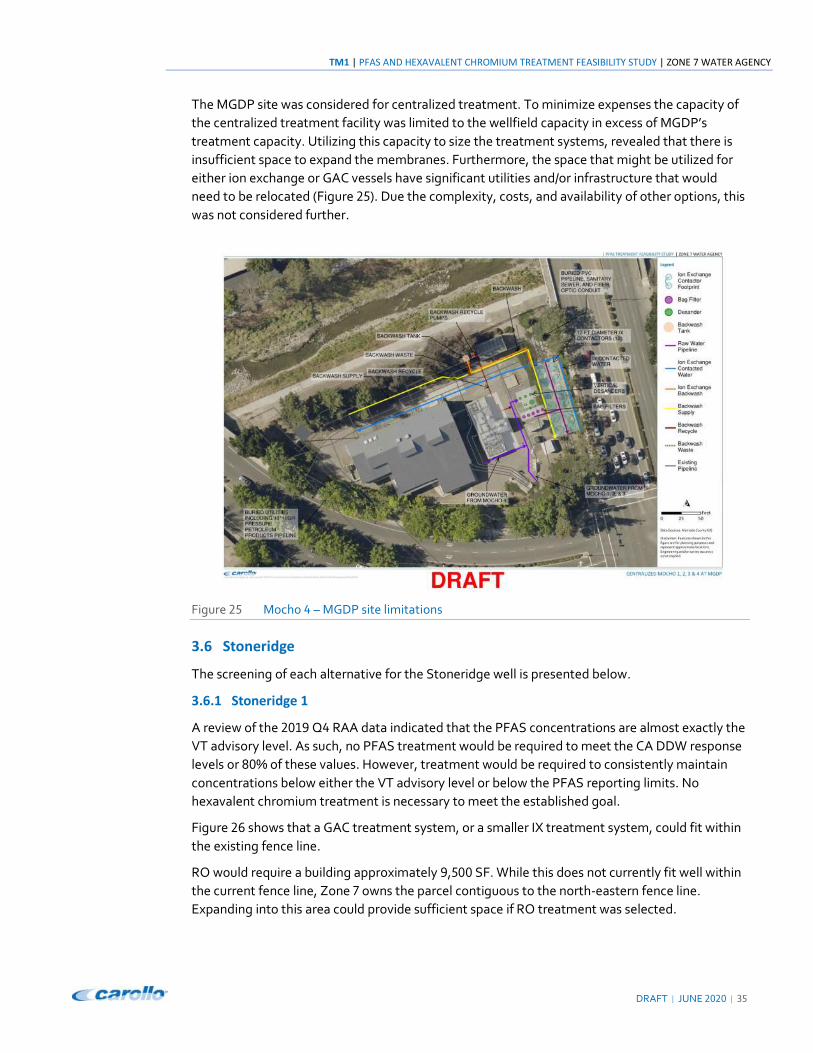
Space supports any of the treatment technologies (IX, GAC, RO). A centralized GAC treatment
system is shown as an example in Figure -;. The IX system would take less space, clearly fitting.
The space requirements for the RO treatment alternative (Figure -<) depends on the level of
treatment. The smallest RO building footprint is estimated to be approximately �,... SF to
reduce PFOS to its response level. The building size increases to approximately �;,=.. SF when
rejecting all EPA Method =;�/=;�.� PFAS to below reporting limits.
3.5.4 Mocho 4, MDGP, and Centralized Treatment
The concentration of PFAS in the groundwater produced from Mocho < is below the higher two
treatment goals. Treatment is only required to meet the VT advisory level and to reduce all of
the EPA Method =;�/=;�.� PFAS to below reporting limits. Chromium is sufficiently low so that
additional treatment is not necessary for this contaminant.
TM1 | PFAS AND HEXAVALENT CHROMIUM TREATMENT FEASIBILITY STUDY | ZONE 7 WATER AGENCY
DRAFT | JUNE -.-. | ;;
Figure -� Mocho - – IX for PFAS
Figure -- Mocho - – GAC for PFAS
ZONE 7 WATER AGENCY | PFAS AND HEXAVALENT CHROMIUM TREATMENT FEASIBILITY STUDY | TM1
;< | JUNE -.-. | DRAFT
Figure -; Centralized Mocho Wellfield Treatment at Mocho ; – GAC for Mocho �, -, and ; PFAS
Figure -< Centralized Mocho Wellfield Treatment at Mocho ; – RO for Mocho �, -, and ; PFAS
TM1 | PFAS AND HEXAVALENT CHROMIUM TREATMENT FEASIBILITY STUDY | ZONE 7 WATER AGENCY
DRAFT | JUNE -.-. | ;=
The MGDP site was considered for centralized treatment. To minimize expenses the capacity of
the centralized treatment facility was limited to the wellfield capacity in excess of MGDP’s
treatment capacity. Utilizing this capacity to size the treatment systems, revealed that there is
insufficient space to expand the membranes. Furthermore, the space that might be utilized for
either ion exchange or GAC vessels have significant utilities and/or infrastructure that would
need to be relocated (Figure -=). Due the complexity, costs, and availability of other options, this
was not considered further.
Figure -= Mocho < – MGDP site limitations
3.6 Stoneridge
The screening of each alternative for the Stoneridge well is presented below.
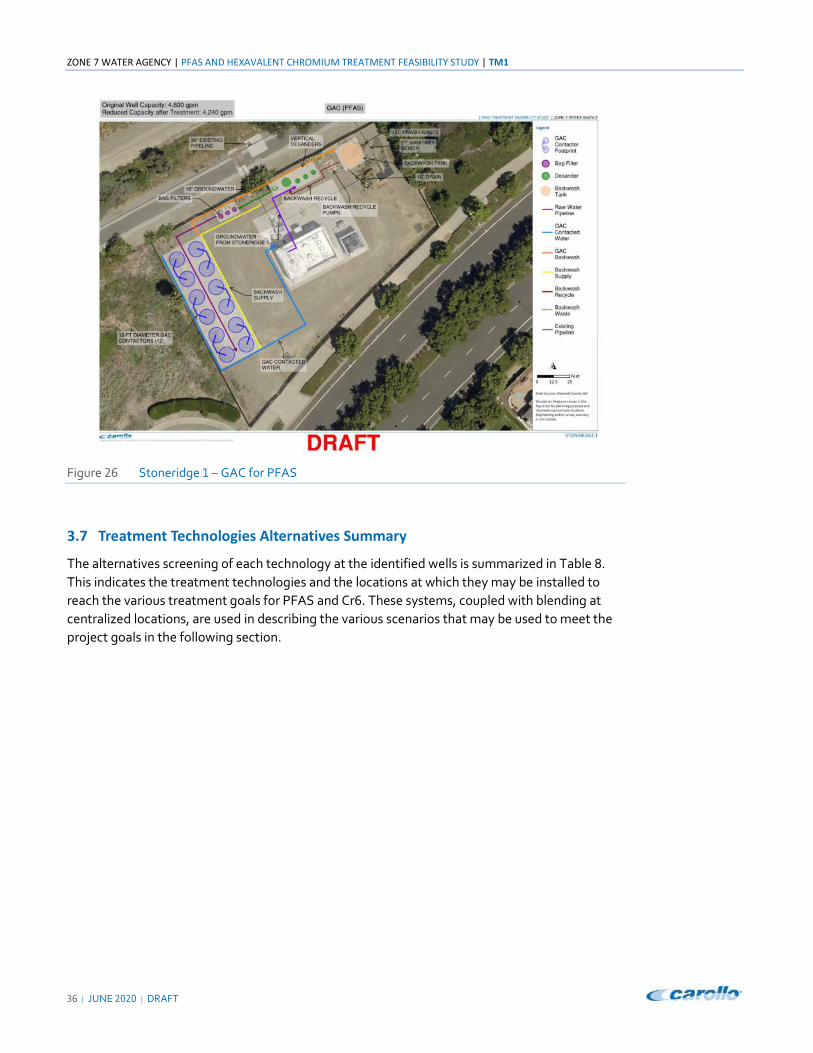
3.6.1 Stoneridge 1
A review of the -.�3 Q< RAA data indicated that the PFAS concentrations are almost exactly the
VT advisory level. As such, no PFAS treatment would be required to meet the CA DDW response
levels or D.% of these values. However, treatment would be required to consistently maintain
concentrations below either the VT advisory level or below the PFAS reporting limits. No
hexavalent chromium treatment is necessary to meet the established goal.
Figure -> shows that a GAC treatment system, or a smaller IX treatment system, could fit within
the existing fence line.
RO would require a building approximately 3,=.. SF. While this does not currently fit well within
the current fence line, Zone � owns the parcel contiguous to the north‐eastern fence line.
Expanding into this area could provide sufficient space if RO treatment was selected.
ZONE 7 WATER AGENCY | PFAS AND HEXAVALENT CHROMIUM TREATMENT FEASIBILITY STUDY | TM1
;> | JUNE -.-. | DRAFT
Figure -> Stoneridge � – GAC for PFAS
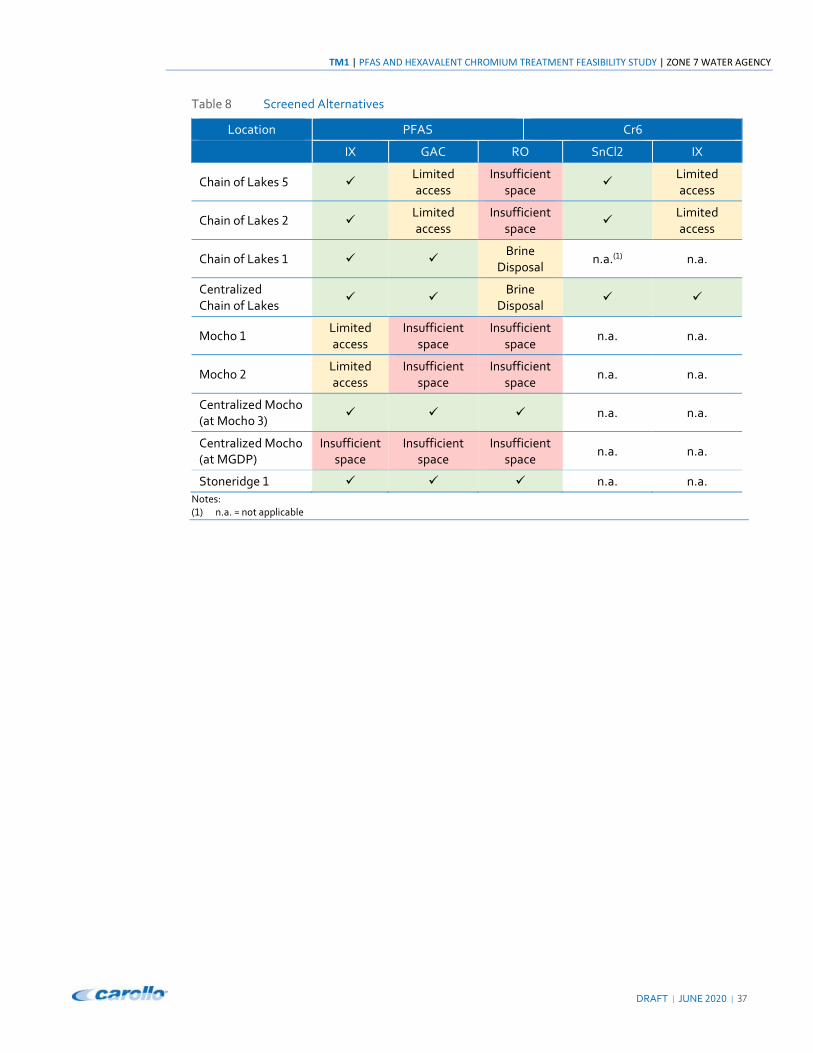
3.7 Treatment Technologies Alternatives Summary
The alternatives screening of each technology at the identified wells is summarized in Table D.
This indicates the treatment technologies and the locations at which they may be installed to
reach the various treatment goals for PFAS and Cr>. These systems, coupled with blending at
centralized locations, are used in describing the various scenarios that may be used to meet the
project goals in the following section.
TM1 | PFAS AND HEXAVALENT CHROMIUM TREATMENT FEASIBILITY STUDY | ZONE 7 WATER AGENCY
DRAFT | JUNE -.-. | ;�
Table D Screened Alternatives
Location PFAS Cr>
IX GAC RO SnCl- IX
Chain of Lakes = Limited
access
Insufficient
space
Limited
access
Chain of Lakes - Limited
access
Insufficient
space
Limited
access
Chain of Lakes � Brine
Disposal n.a.(�) n.a.
Centralized
Chain of Lakes
Brine
Disposal
Mocho � Limited
access
Insufficient
space
Insufficient
space n.a. n.a.
Mocho - Limited
access
Insufficient
space
Insufficient
space n.a. n.a.
Centralized Mocho
(at Mocho ;) n.a. n.a.
Centralized Mocho
(at MGDP)
Insufficient
space
Insufficient
space
Insufficient
space n.a. n.a.
Stoneridge � n.a. n.a.
Notes:
(�) n.a. = not applicable

TM1 | PFAS AND HEXAVALENT CHROMIUM TREATMENT FEASIBILITY STUDY | ZONE 7 WATER AGENCY
DRAFT | JUNE -.-. | ;3
Section 4
TREATMENT STRATEGIES
Based on the conceptual physical site layout alternatives identified as feasible in Section ;,
strategies for the four targeted PFAS treatment goals and one hexavalent chromium goal are
provided in this section.
4.1 Response Levels & 80 Percent of Response Levels
Based on the average values of the four quarterly monitoring results in -.�3, Mocho � and
Mocho - would exceed the <. ppt PFOS response level. All other wells are compliant with this
level. All wells would also meet the �. ppt PFOA response level.
The four wells in the Mocho wellfield may be treated at the Mocho Groundwater
Demineralization Plant, a reverse osmosis membrane treatment system. The capacity of the RO
system allows for three of the four Mocho wells to be treated at the same time. When the plant
is running, both Mocho � and Mocho - may be treated, lowering PFAS to below detection levels
in the RO permeate (filtered water). As previously indicated, elevated turbidities negatively
impact the MGDP O&M requirements. Consequently Mocho � has not been utilized due to
turbidity historically exceeded ..= NTU.
When the treatment plant is not running, the PFOS Response Level can be met by blending the
water from Mocho � and/or Mocho - with water from Mocho ; and Mocho < at the MGDP. When
the RO trains are not in operation the water that enters the plant is blended in the groundwater
bypass pipeline. Mocho � and Mocho - must be run through MGDP (with treatment or through
the groundwater bypass line) for chloramination due to piping configuration. Mocho ; and
Mocho < may be run to MGDP or directly to the distribution system as each well has its own
chemical feed system for chloramination. When Mocho ; is run directly to distribution, it enters
the Santa Rita‐Dougherty Pipeline south of MGDP. When Mocho < is run directly to distribution,
it is routed through the same pipeline as the MGDP effluent. Therefore, when Mocho < is run
directly to distribution, it is still blended with water being run through MGDP (treated or through
the bypass) prior to entering the distribution system (Santa Rita‐Dougherty and/or Mocho
pipelines). Zone � has prioritized operation of the Mocho wells in the following order, Mocho <,
Mocho ;, Mocho -, and lowest in priority Mocho �.
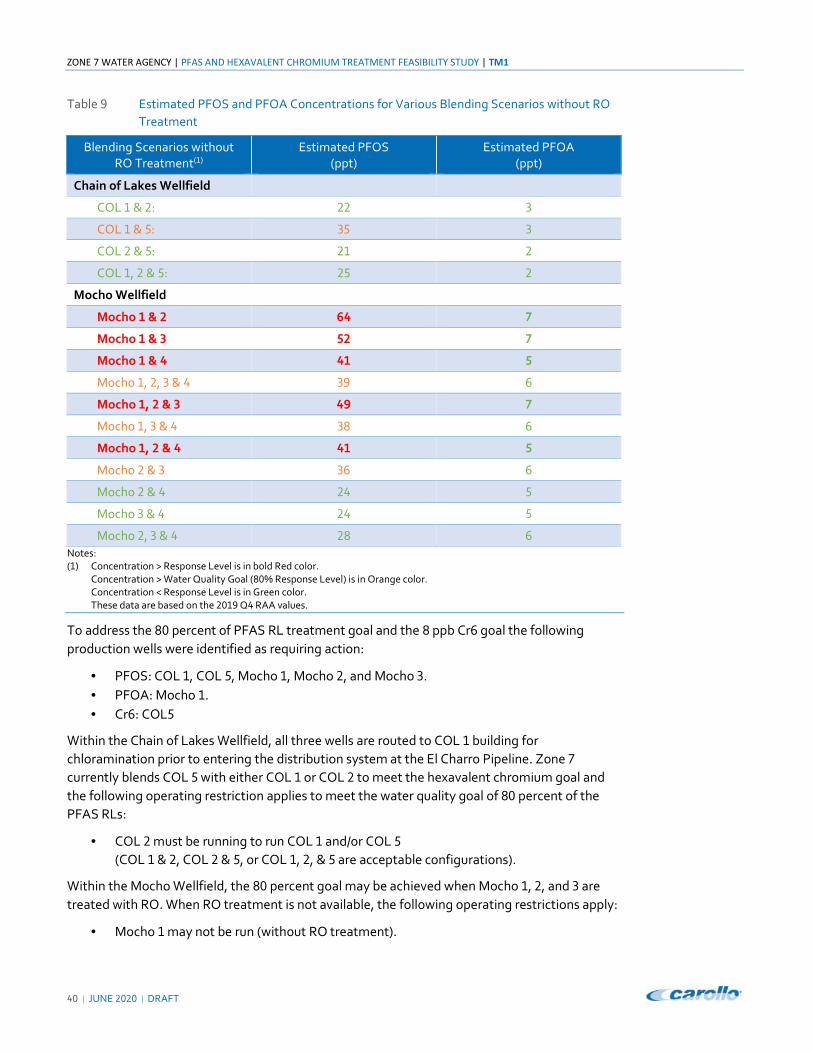
Multiple blending scenarios were evaluated for both the Chain of Lakes and Mocho Wellfields.
Based on the results of this evaluation (Table 3), the following operating restrictions apply when
RO treatment is not used:
�. Mocho ; and Mocho < must be running to run Mocho �.
-. All four wells may be run at the same time. Due to capacity limits in the piping at MGDP,
Mocho �, -, and ; would be treated at MGDP with Mocho < bypassing MGDP to blend
prior to distribution.
;. Mocho - may be run with Mocho ;, with Mocho <, or with Mocho ; and <.
ZONE 7 WATER AGENCY | PFAS AND HEXAVALENT CHROMIUM TREATMENT FEASIBILITY STUDY | TM1
<. | JUNE -.-. | DRAFT
Table 3 Estimated PFOS and PFOA Concentrations for Various Blending Scenarios without RO
Treatment
Blending Scenarios without
RO Treatment(�)
Estimated PFOS
(ppt)
Estimated PFOA
(ppt)
Chain of Lakes Wellfield
COL � & -: -- ;
COL � & =: ;= ;
COL - & =: -� -
COL �, - & =: -= -
Mocho Wellfield
Mocho + & - *. /
Mocho + & 0 1- /
Mocho + & . .+ 1
Mocho �, -, ; & < ;3 >
Mocho +, - & 0 .3 /
Mocho �, ; & < ;D >
Mocho +, - & . .+ 1
Mocho - & ; ;> >
Mocho - & < -< =
Mocho ; & < -< =
Mocho -, ; & < -D >
Notes:
(�) Concentration > Response Level is in bold Red color.
Concentration > Water Quality Goal (D.% Response Level) is in Orange color.
Concentration < Response Level is in Green color.
These data are based on the -.�3 Q< RAA values.
To address the D. percent of PFAS RL treatment goal and the D ppb Cr> goal the following
production wells were identified as requiring action:
• PFOS: COL �, COL =, Mocho �, Mocho -, and Mocho ;.
• PFOA: Mocho �.
• Cr>: COL=
Within the Chain of Lakes Wellfield, all three wells are routed to COL � building for
chloramination prior to entering the distribution system at the El Charro Pipeline. Zone �
currently blends COL = with either COL � or COL - to meet the hexavalent chromium goal and
the following operating restriction applies to meet the water quality goal of D. percent of the
PFAS RLs:
• COL - must be running to run COL � and/or COL =
(COL � & -, COL - & =, or COL �, -, & = are acceptable configurations).
Within the Mocho Wellfield, the D. percent goal may be achieved when Mocho �, -, and ; are
treated with RO. When RO treatment is not available, the following operating restrictions apply:
• Mocho � may not be run (without RO treatment).
TM1 | PFAS AND HEXAVALENT CHROMIUM TREATMENT FEASIBILITY STUDY | ZONE 7 WATER AGENCY
DRAFT | JUNE -.-. | <�
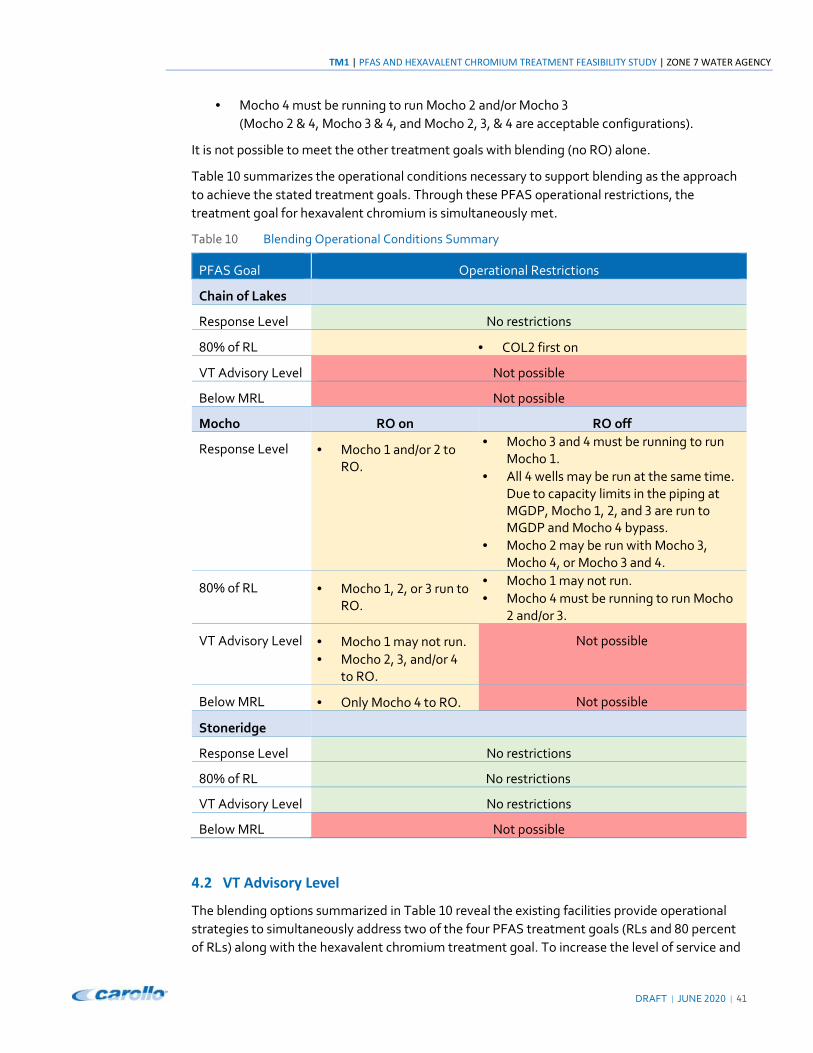
• Mocho < must be running to run Mocho - and/or Mocho ;
(Mocho - & <, Mocho ; & <, and Mocho -, ;, & < are acceptable configurations).
It is not possible to meet the other treatment goals with blending (no RO) alone.
Table �. summarizes the operational conditions necessary to support blending as the approach
to achieve the stated treatment goals. Through these PFAS operational restrictions, the
treatment goal for hexavalent chromium is simultaneously met.
Table �. Blending Operational Conditions Summary
PFAS Goal Operational Restrictions
Chain of Lakes
Response Level No restrictions
D.% of RL • COL- first on
VT Advisory Level Not possible
Below MRL Not possible
Mocho RO on RO off
Response Level • Mocho � and/or - to
RO.
• Mocho ; and < must be running to run
Mocho �.
• All < wells may be run at the same time.
Due to capacity limits in the piping at
MGDP, Mocho �, -, and ; are run to
MGDP and Mocho < bypass.
• Mocho - may be run with Mocho ;,
Mocho <, or Mocho ; and <.
D.% of RL • Mocho �, -, or ; run to
RO.
• Mocho � may not run.
• Mocho < must be running to run Mocho
- and/or ;.
VT Advisory Level • Mocho � may not run.
• Mocho -, ;, and/or <
to RO.
Not possible
Below MRL • Only Mocho < to RO. Not possible
Stoneridge
Response Level No restrictions
D.% of RL No restrictions
VT Advisory Level No restrictions
Below MRL Not possible
4.2 VT Advisory Level
The blending options summarized in Table �. reveal the existing facilities provide operational
strategies to simultaneously address two of the four PFAS treatment goals (RLs and D. percent
of RLs) along with the hexavalent chromium treatment goal. To increase the level of service and
ZONE 7 WATER AGENCY | PFAS AND HEXAVALENT CHROMIUM TREATMENT FEASIBILITY STUDY | TM1
<- | JUNE -.-. | DRAFT
meet the VT Advisory Level at all wellfields, treatment would need to be provided for the Chain
of Lakes Wells. At this level of service, water from all three COL production wells would require
additional treatment. Table D shows that while ion exchange can be used either to treat
individual wells or at a centralized facility, site limitations practically restrict GAC to treatment at
COL�.
To provide a treatment system that could support either GAC or IX, enable future developments
in media technology to be utilized, and maximize wellfield operational flexibility, it is
recommended that PFAS treatment for the Chain of Lakes Wellfield would need to be:
• Located at COL�
• Media vessels should be sized to support the larger GAC bed volume
• External piping should be sized to support higher hydraulic loading rates of ion
exchange.
• Internal elements should support the physical characteristics of either media.
• General arrangement should be developed to support a phased installation of treatment
media pressure vessels, if desired, by Zone �.
• General arrangement should include space planning for pretreatment of the waters to
manage turbidity. This may be eliminated if additional analysis during preliminary
design demonstrates that it is not needed.
Zone � also desires that all treatment system be enclosed within a building.
Based on performance information provided by the media suppliers, it is estimated
approximately ��.,... bed volumes (BVs) of water could be treated by GAC before replacement
to meet this treatment goal. This bed life is anticipated to increase to approximately ;;.,... BV
with the use of a PFAS‐selective ion exchange resin. These bed volumes will vary depending on
the actual operation of the wells. The estimated throughput to reach the treatment goal for each
media at each site is presented in Appendix A.
During preliminary design, bench‐ and or pilot‐scale testing can be used to evaluate
commercially available GAC and IX media, refine operational and maintenance costs, provide
supporting data to DDW as a part of the permit amendment process, support an approved
procurement strategy, and finalize the number of media pressure vessels to be initially installed
(i.e. �- for IX, �D for GAC).
As two of the three wells would also require treatment for hexavalent chromium, it is
recommended that treatment be consolidated to the same centralized COL� site. The
alternatives analysis indicated that COL would support the use of either IX or SnCl- addition to
manage the Cr> concentration.
It is recommended that bench‐ or pilot‐scale testing of SnCl- be performed during preliminary
design to determine the rate of reaction and establish site specific design criteria, characterize
the potential for accumulation of Cr; in the distribution system, and estimate the magnitude of
distribution system Cr; oxidation. The results of this testing may drive a recommendation to one
treatment strategy, or drive a decision to consider an alternative approach.
4.3 Below Method Reporting Limits
The treatment goal to reduce the concentration of PFAS to below the EPA Methods =;� and
=�;.� analytical reporting limits is the most challenging level of service evaluated. Based on the
TM1 | PFAS AND HEXAVALENT CHROMIUM TREATMENT FEASIBILITY STUDY | ZONE 7 WATER AGENCY
DRAFT | JUNE -.-. | <;
blending options summarized in Table �., additional treatment is required for both the Chain of
Lakes and Stoneridge Wellfields. Additional treatment may not be required for the Mocho
Wellfield as long as Zone � continues to accept the operational restrictions outlined in Table �..
The recommended system to provide this additional treatment for the Chain of Lakes Wellfield
is the same as described in Section <.-. The primary difference between these systems is with
the media replacement frequency. For this treatment goal, the GAC throughput was estimated
to be reduced by approximately 3; percent to �-,=.. BV. A reduction of >>% to ��.,... BV was
also estimated for the IX throughput. With the uneven decrease in media capacity, the
economics shift towards IX for this highest level of service (lowest finished treated water
concentrations) for PFAS. However, given the uncertainty associated with the regulations, it is
recommended that a system be designed to accept either media. This way, an MCL‐appropriate
media can be selected once the regulation is in place. To minimize operational and maintenance
complexity for PFAS treatment, it is recommended that a consistent approach to the treatment
equipment be applied across the impacted wellfields were possible. Some variation in the
installed media based on individual well water quality would not be unexpected.
TM1 | PFAS AND HEXAVALENT CHROMIUM TREATMENT FEASIBILITY STUDY | ZONE 7 WATER AGENCY
DRAFT | JUNE -.-. | <=
Section 5
COSTS TO IMPLEMENTATION
Given the treatment strategies described in Section <, the recommended implementation
approach has three phases:
�. Continue Existing Practices for Mocho Wellfield Compliance. Given Zone �’s
willingness to accept operational limitations, continue to utilize MGDP and blending to
manage the Mocho Wellfield PFAS concentrations to compliance concentrations.
-. Prepare Chain of Lakes Wellfield for Lower Compliance Levels. If regulatory PFAS
compliance concentrations continue to decrease or a hexavalent chromium MCL is
established, the Chain of Lakes is likely to be the next wellfield required to provide
treatment based the current water quality conditions. Initiating a preliminary and
detailed design of the treatment system will establish the design criteria for this system.
Based on the opinions of relative probable construction costs to compare the estimated
incremental costs of treatment described below, and opportunities for future
operational flexibility described above, a hybrid media pressure vessel treatment system
is recommended.
;. Track Water Quality and Regulatory Changes. Continue to monitor the PFAS and Cr>
concentrations in the production wells and track the development of the corresponding
regulations. These will determine if refinements to the COL treatment facility are
necessary, or if treatment at Stoneridge should be considered further.
To support the development of the Chain of Lakes facility and evaluate the costs of other
selected alternatives, preliminary Class = level cost estimates were developed to evaluate the
relative cost‐effectiveness of the treatment systems. AACE International defines an
Order‐of‐Magnitude Estimate, deemed appropriate for master plan studies, as an approximate
estimate made without detailed engineering data. It is normally expected that an estimate of
this type would be accurate within plus =. percent to minus ;. percent. As projects proceed into
the preliminary design and design stages, estimates are refined when conditions become known.
The life‐cycle was based on ;. years and included the treatment and infrastructure required.
In addition to the above, it has been assumed that:
• These represent relative to the other treatment alternatives the incremental cost of
treatment. The costs do not include the base operational and maintenance costs of
operating and maintaining the production wells.
• Reduction of individual well production capacity as the result of increased headloss
through the new treatment process(es) has not been included in the costs. It is assumed
that the reduced instantaneous capacity would be recovered by additional operational
run time to achieve the individual annual well production identified in Table �.The
estimated reduction of well production capacity is identified on the corresponding site
layouts in Section ;. Hydraulically, pretreatment is included for both IX and GAC, and
represents a conservative condition if the pretreatment is deemed unnecessary during
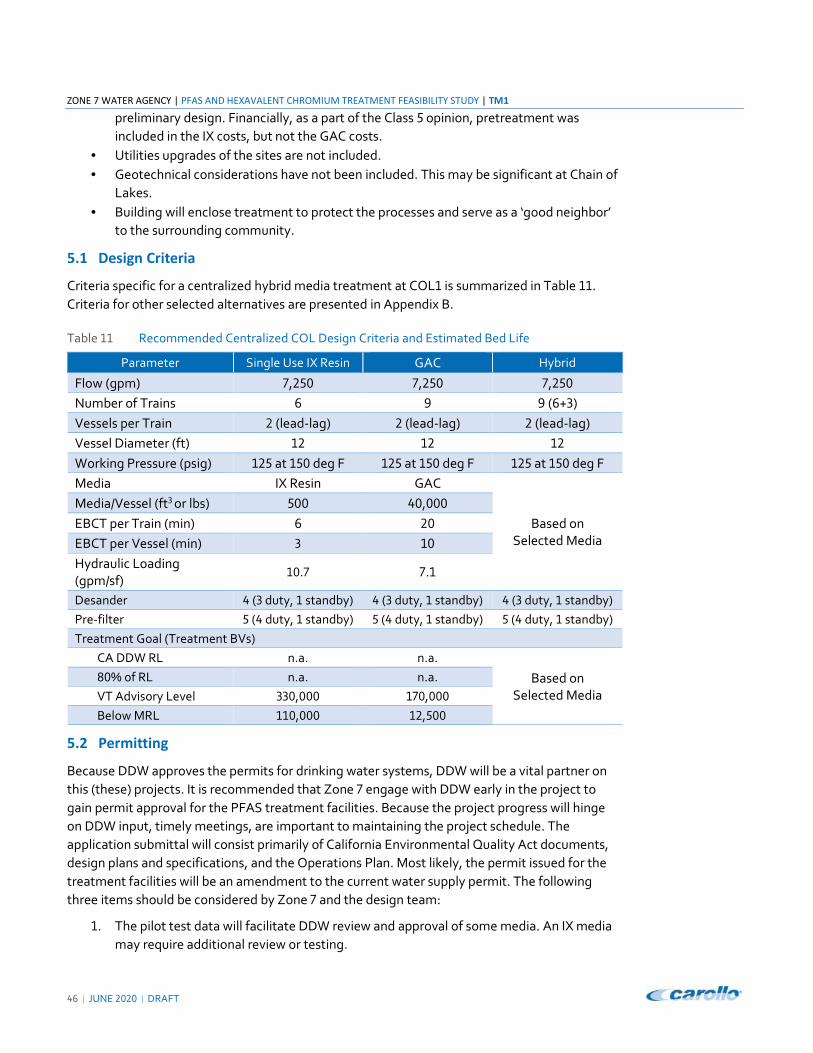
ZONE 7 WATER AGENCY | PFAS AND HEXAVALENT CHROMIUM TREATMENT FEASIBILITY STUDY | TM1
<> | JUNE -.-. | DRAFT
preliminary design. Financially, as a part of the Class = opinion, pretreatment was
included in the IX costs, but not the GAC costs.
• Utilities upgrades of the sites are not included.
• Geotechnical considerations have not been included. This may be significant at Chain of
Lakes.
• Building will enclose treatment to protect the processes and serve as a ‘good neighbor’
to the surrounding community.
5.1 Design Criteria
Criteria specific for a centralized hybrid media treatment at COL� is summarized in Table ��.
Criteria for other selected alternatives are presented in Appendix B.
Table �� Recommended Centralized COL Design Criteria and Estimated Bed Life
Parameter Single Use IX Resin GAC Hybrid
Flow (gpm) �,-=. �,-=. �,-=.
Number of Trains > 3 3 (>+;)
Vessels per Train - (lead‐lag) - (lead‐lag) - (lead‐lag)
Vessel Diameter (ft) �- �- �-
Working Pressure (psig) �-= at �=. deg F �-= at �=. deg F �-= at �=. deg F
Media IX Resin GAC
Based on
Selected Media
Media/Vessel (ft; or lbs) =.. <.,...
EBCT per Train (min) > -.
EBCT per Vessel (min) ; �.
Hydraulic Loading
(gpm/sf) �..� �.�
Desander < (; duty, � standby) < (; duty, � standby) < (; duty, � standby)
Pre‐filter = (< duty, � standby) = (< duty, � standby) = (< duty, � standby)
Treatment Goal (Treatment BVs)
CA DDW RL n.a. n.a.
Based on
Selected Media
D.% of RL n.a. n.a.
VT Advisory Level ;;.,... ��.,...
Below MRL ��.,... �-,=..
5.2 Permitting
Because DDW approves the permits for drinking water systems, DDW will be a vital partner on
this (these) projects. It is recommended that Zone � engage with DDW early in the project to
gain permit approval for the PFAS treatment facilities. Because the project progress will hinge
on DDW input, timely meetings, are important to maintaining the project schedule. The
application submittal will consist primarily of California Environmental Quality Act documents,
design plans and specifications, and the Operations Plan. Most likely, the permit issued for the
treatment facilities will be an amendment to the current water supply permit. The following
three items should be considered by Zone � and the design team:
�. The pilot test data will facilitate DDW review and approval of some media. An IX media
may require additional review or testing.
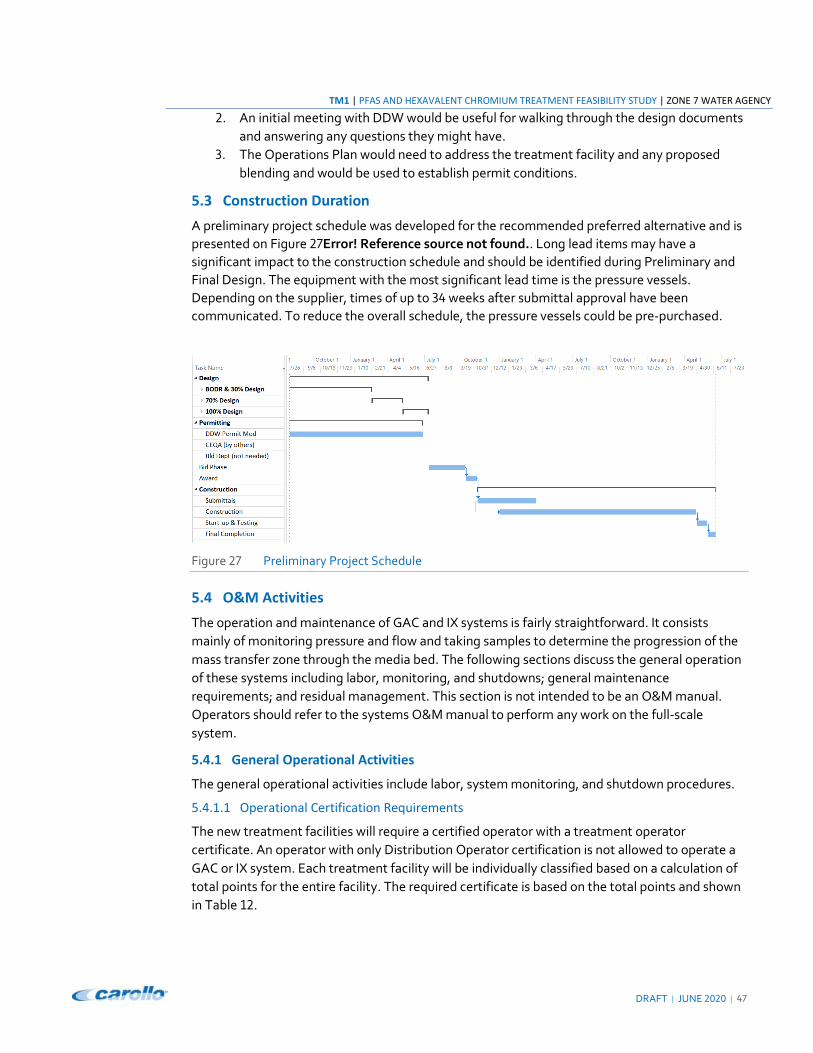
TM1 | PFAS AND HEXAVALENT CHROMIUM TREATMENT FEASIBILITY STUDY | ZONE 7 WATER AGENCY
DRAFT | JUNE -.-. | <�
-. An initial meeting with DDW would be useful for walking through the design documents
and answering any questions they might have.
;. The Operations Plan would need to address the treatment facility and any proposed
blending and would be used to establish permit conditions.
5.3 Construction Duration
A preliminary project schedule was developed for the recommended preferred alternative and is
presented on Figure -�Error! Reference source not found.. Long lead items may have a
significant impact to the construction schedule and should be identified during Preliminary and
Final Design. The equipment with the most significant lead time is the pressure vessels.
Depending on the supplier, times of up to ;< weeks after submittal approval have been
communicated. To reduce the overall schedule, the pressure vessels could be pre‐purchased.
Figure -� Preliminary Project Schedule
5.4 O&M Activities
The operation and maintenance of GAC and IX systems is fairly straightforward. It consists
mainly of monitoring pressure and flow and taking samples to determine the progression of the
mass transfer zone through the media bed. The following sections discuss the general operation
of these systems including labor, monitoring, and shutdowns; general maintenance
requirements; and residual management. This section is not intended to be an O&M manual.
Operators should refer to the systems O&M manual to perform any work on the full‐scale
system.
5.4.1 General Operational Activities
The general operational activities include labor, system monitoring, and shutdown procedures.
5.4.1.1 Operational Certification Requirements
The new treatment facilities will require a certified operator with a treatment operator
certificate. An operator with only Distribution Operator certification is not allowed to operate a
GAC or IX system. Each treatment facility will be individually classified based on a calculation of
total points for the entire facility. The required certificate is based on the total points and shown
in Table �-.
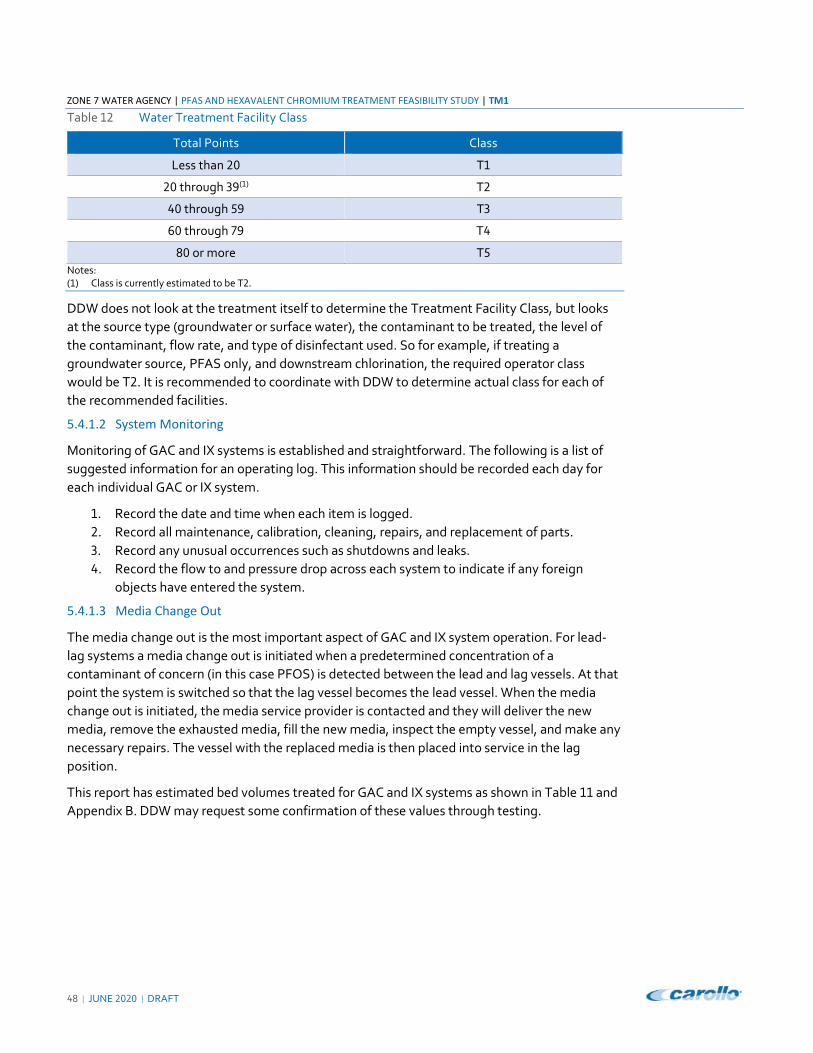
ZONE 7 WATER AGENCY | PFAS AND HEXAVALENT CHROMIUM TREATMENT FEASIBILITY STUDY | TM1
<D | JUNE -.-. | DRAFT
Table �- Water Treatment Facility Class
Total Points Class
Less than -. T�
-. through ;3(�) T-
<. through =3 T;
>. through �3 T<
D. or more T=
Notes:
(�) Class is currently estimated to be T-.
DDW does not look at the treatment itself to determine the Treatment Facility Class, but looks
at the source type (groundwater or surface water), the contaminant to be treated, the level of
the contaminant, flow rate, and type of disinfectant used. So for example, if treating a
groundwater source, PFAS only, and downstream chlorination, the required operator class
would be T-. It is recommended to coordinate with DDW to determine actual class for each of
the recommended facilities.
5.4.1.2 System Monitoring
Monitoring of GAC and IX systems is established and straightforward. The following is a list of
suggested information for an operating log. This information should be recorded each day for
each individual GAC or IX system.
�. Record the date and time when each item is logged.
-. Record all maintenance, calibration, cleaning, repairs, and replacement of parts.
;. Record any unusual occurrences such as shutdowns and leaks.
<. Record the flow to and pressure drop across each system to indicate if any foreign
objects have entered the system.
5.4.1.3 Media Change Out
The media change out is the most important aspect of GAC and IX system operation. For lead‐
lag systems a media change out is initiated when a predetermined concentration of a
contaminant of concern (in this case PFOS) is detected between the lead and lag vessels. At that
point the system is switched so that the lag vessel becomes the lead vessel. When the media
change out is initiated, the media service provider is contacted and they will deliver the new
media, remove the exhausted media, fill the new media, inspect the empty vessel, and make any
necessary repairs. The vessel with the replaced media is then placed into service in the lag
position.
This report has estimated bed volumes treated for GAC and IX systems as shown in Table �� and
Appendix B. DDW may request some confirmation of these values through testing.
TM1 | PFAS AND HEXAVALENT CHROMIUM TREATMENT FEASIBILITY STUDY | ZONE 7 WATER AGENCY
DRAFT | JUNE -.-. | <3
5.4.2 Maintenance
Maintenance of GAC and IX systems can be divided into two categories: minor and major. Minor
maintenance can be performed by operations to provide continuous and effective operation.
This maintenance includes visual check of pressure gauges and rupture disks, adjustments to
valves and regulators, and tightening flanges and connections to eliminate leakage. During
scheduled change‐out services vessel internal parts should be inspected (underdrain screens,
vessel lining, nozzles, etc.) to ensure they are in good working condition. Major maintenance
includes equipment repair or replacement for continued system operation. The need for major
maintenance would result from a major malfunction causing the system to be inoperative.
5.4.3 Residual Management
Residual management is an important aspect for both GAC and IX treatment systems. For GAC
and IX systems the main residual is the spent media generated through the life of the system.
5.4.3.1 GAC Systems
The GAC vessels may be backwashed periodically to remove fines and other particulate that may
accumulate, ideally with non‐chlorinated water. The backwash waste water may be sent directly
to sewer. A backwash waste tank may be required to equalize the flow to the sewer. The need
for a backwash system, waste tank, and potential methods for minimizing biological growth on
the media should be evaluated further during detailed design. At COL� it was assumed that
these periodic backwashes could either be sent to the existing -<‐in line going to the adjacent
lake or to the head of the plant, depending on the nature of the backwash. The ability to
discharge to the lake should be confirmed during preliminary design.
Spent GAC would be hauled offsite. The regeneration process heats the GAC to burn off the
adsorbed contaminants. There has been some discussion whether the temperatures used for
regeneration are consistently sufficient for PFAS destruction. At this time, full incineration of the
spent media would ensure the PFAS compounds are destroyed and limit end‐of‐life liability.
5.4.3.2 IX Systems
The most significant residual produced by IX systems is the spent resin. The resin will have to be
replaced on a periodic basis depending on the target water quality and actual well flowrates. The
spent resin would be hauled to a waste disposal facility for incineration to destroy the PFAS and
limiting end‐of‐life concerns.
5.5 Cost (Capital, O&M, and Life Cycle)
The opinion of probable construction cost presented in this report represents a Class = budgetary
estimate as defined by the AACE International. Bids would be expected to fall within a range of
=. percent over the estimate to ;. percent under the estimate. The opinion of probable
construction costs is based on preliminary quantity take‐offs for GAC and IX systems. The capital
and O&M costs were developed using:
• Equipment quotes for major components.
• Percentage multipliers for electrical, instrumentation, and mechanical portions of the
project based on recently bid projects of similar scope.
A summary of capital and O&M cost assumptions for centralized COL�is shown in Table �;.
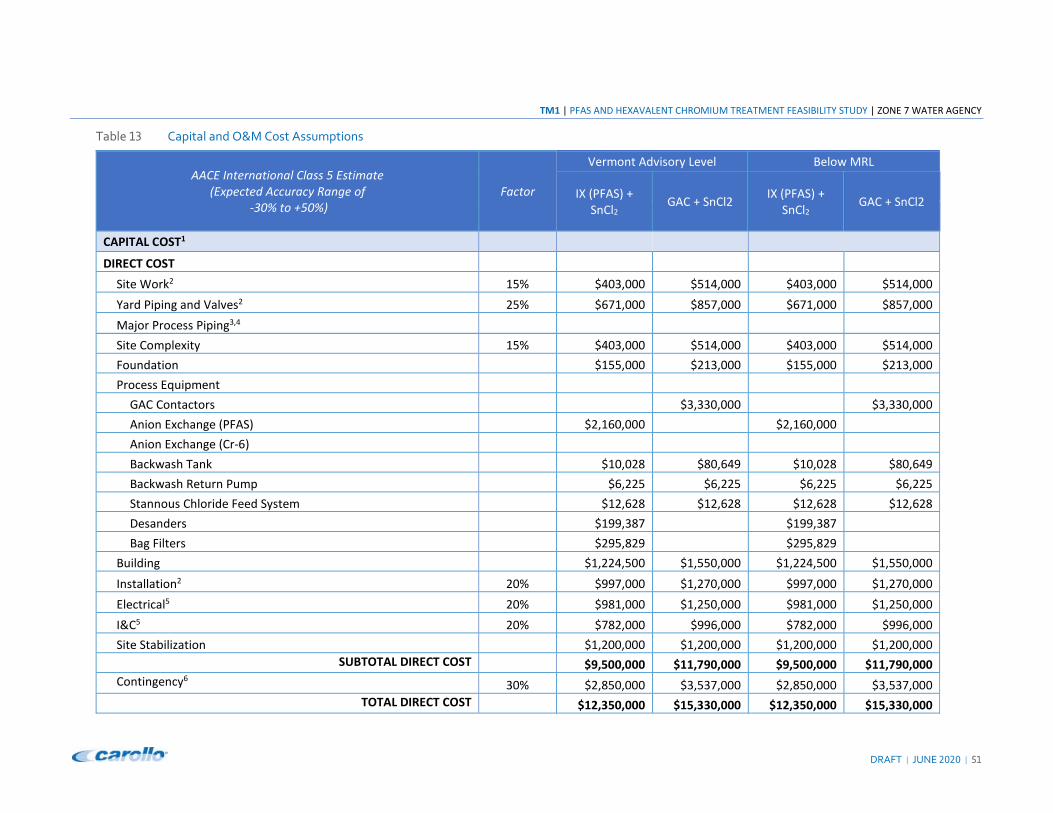
TM1 | PFAS AND HEXAVALENT CHROMIUM TREATMENT FEASIBILITY STUDY | ZONE 7 WATER AGENCY
DRAFT | JUNE -.-. | =�
Table �; Capital and O&M Cost Assumptions
AACE International Class 5 Estimate
(Expected Accuracy Range of
-30% to +50%)
Factor
Vermont Advisory Level Below MRL
IX (PFAS) +
SnCl2 GAC + SnCl2
IX (PFAS) +
SnCl2 GAC + SnCl2
CAPITAL COST1
DIRECT COST
Site Work2 15% $403,000 $514,000 $403,000 $514,000
Yard Piping and Valves2 25% $671,000 $857,000 $671,000 $857,000
Major Process Piping3,4
Site Complexity 15% $403,000 $514,000 $403,000 $514,000
Foundation $155,000 $213,000 $155,000 $213,000
Process Equipment
GAC Contactors $3,330,000 $3,330,000
Anion Exchange (PFAS) $2,160,000 $2,160,000
Anion Exchange (Cr-6)
Backwash Tank $10,028 $80,649 $10,028 $80,649
Backwash Return Pump $6,225 $6,225 $6,225 $6,225
Stannous Chloride Feed System $12,628 $12,628 $12,628 $12,628
Desanders $199,387 $199,387
Bag Filters $295,829 $295,829
Building $1,224,500 $1,550,000 $1,224,500 $1,550,000
Installation2 20% $997,000 $1,270,000 $997,000 $1,270,000
Electrical5 20% $981,000 $1,250,000 $981,000 $1,250,000
I&C5 20% $782,000 $996,000 $782,000 $996,000
Site Stabilization $1,200,000 $1,200,000 $1,200,000 $1,200,000
SUBTOTAL DIRECT COST $9,500,000 $11,790,000 $9,500,000 $11,790,000
Contingency6 30% $2,850,000 $3,537,000 $2,850,000 $3,537,000
TOTAL DIRECT COST $12,350,000 $15,330,000 $12,350,000 $15,330,000
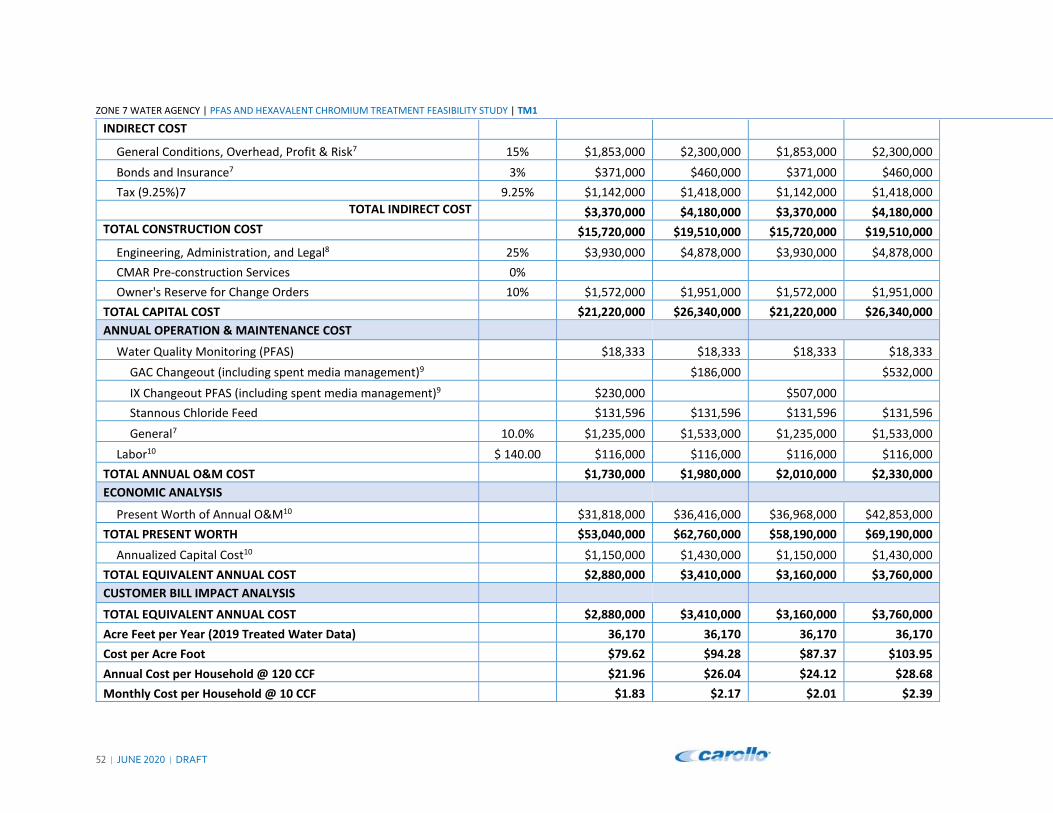
ZONE 7 WATER AGENCY | PFAS AND HEXAVALENT CHROMIUM TREATMENT FEASIBILITY STUDY | TM1
=- | JUNE -.-. | DRAFT
INDIRECT COST
General Conditions, Overhead, Profit & Risk7 15% $1,853,000 $2,300,000 $1,853,000 $2,300,000
Bonds and Insurance7 3% $371,000 $460,000 $371,000 $460,000
Tax (9.25%)7 9.25% $1,142,000 $1,418,000 $1,142,000 $1,418,000
TOTAL INDIRECT COST $3,370,000 $4,180,000 $3,370,000 $4,180,000
TOTAL CONSTRUCTION COST $15,720,000 $19,510,000 $15,720,000 $19,510,000
Engineering, Administration, and Legal8 25% $3,930,000 $4,878,000 $3,930,000 $4,878,000
CMAR Pre-construction Services 0%
Owner's Reserve for Change Orders 10% $1,572,000 $1,951,000 $1,572,000 $1,951,000
TOTAL CAPITAL COST $21,220,000 $26,340,000 $21,220,000 $26,340,000
ANNUAL OPERATION & MAINTENANCE COST
Water Quality Monitoring (PFAS) $18,333 $18,333 $18,333 $18,333
GAC Changeout (including spent media management)9 $186,000 $532,000
IX Changeout PFAS (including spent media management)9 $230,000 $507,000
Stannous Chloride Feed $131,596 $131,596 $131,596 $131,596
General7 10.0% $1,235,000 $1,533,000 $1,235,000 $1,533,000
Labor10 $ 140.00 $116,000 $116,000 $116,000 $116,000
TOTAL ANNUAL O&M COST $1,730,000 $1,980,000 $2,010,000 $2,330,000
ECONOMIC ANALYSIS
Present Worth of Annual O&M10 $31,818,000 $36,416,000 $36,968,000 $42,853,000
TOTAL PRESENT WORTH $53,040,000 $62,760,000 $58,190,000 $69,190,000
Annualized Capital Cost10 $1,150,000 $1,430,000 $1,150,000 $1,430,000
TOTAL EQUIVALENT ANNUAL COST $2,880,000 $3,410,000 $3,160,000 $3,760,000
CUSTOMER BILL IMPACT ANALYSIS
TOTAL EQUIVALENT ANNUAL COST $2,880,000 $3,410,000 $3,160,000 $3,760,000
Acre Feet per Year (2019 Treated Water Data) 36,170 36,170 36,170 36,170
Cost per Acre Foot $79.62 $94.28 $87.37 $103.95
Annual Cost per Household @ 120 CCF $21.96 $26.04 $24.12 $28.68
Monthly Cost per Household @ 10 CCF $1.83 $2.17 $2.01 $2.39
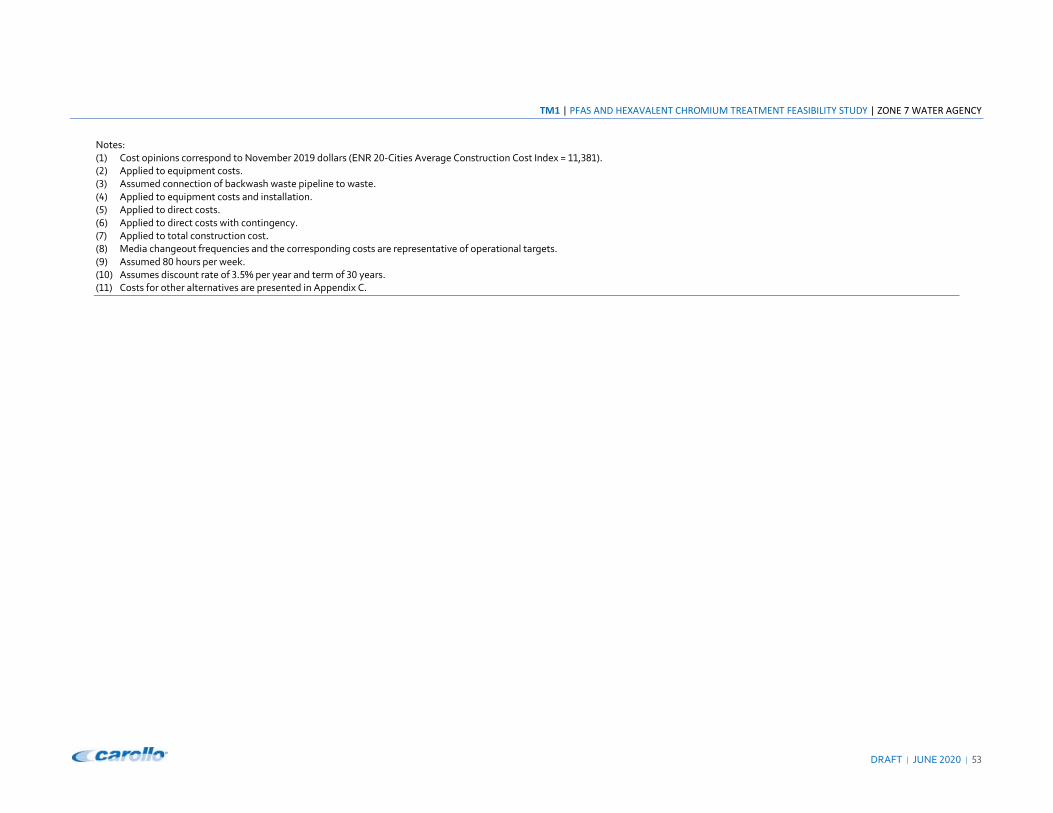
TM1 | PFAS AND HEXAVALENT CHROMIUM TREATMENT FEASIBILITY STUDY | ZONE 7 WATER AGENCY
DRAFT | JUNE -.-. | =;
Notes:
(�) Cost opinions correspond to November -.�3 dollars (ENR -.‐Cities Average Construction Cost Index = ��,;D�).
(-) Applied to equipment costs.
(;) Assumed connection of backwash waste pipeline to waste.
(<) Applied to equipment costs and installation.
(=) Applied to direct costs.
(>) Applied to direct costs with contingency.
(�) Applied to total construction cost.
(D) Media changeout frequencies and the corresponding costs are representative of operational targets.
(3) Assumed D. hours per week.
(�.) Assumes discount rate of ;.=% per year and term of ;. years.
(��) Costs for other alternatives are presented in Appendix C.
TM1 | PFAS AND HEXAVALENT CHROMIUM TREATMENT FEASIBILITY STUDY | ZONE 7 WATER AGENCY
DRAFT | JUNE -.-. | ==
The recommendations above are based on the premise that treatment would be provided to
achieve the water quality goal selected by Zone �. If the cost and schedule impacts are not
desirable or other challenges arise, the impacted wells could be shut down and their production
replaced with other groundwater sources, a new well could be drilled to replace the lost
production, or excess surface water treatment capacity could be utilized. These options could be
considered on a temporary or permanent basis.
TM1 | PFAS AND HEXAVALENT CHROMIUM TREATMENT FEASIBILITY STUDY | ZONE 7 WATER AGENCY
DRAFT | JUNE -.-.
Appendix A
ESTIMATED MEDIA THROUGHPUT
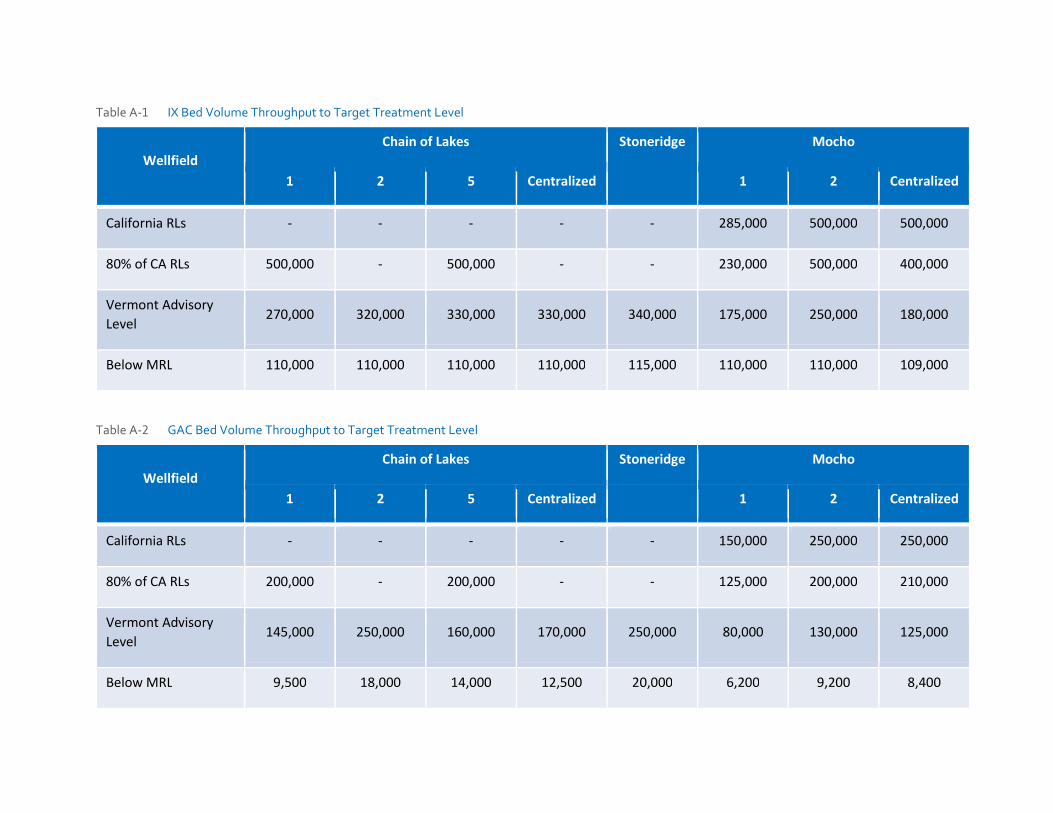
Table A- IX Bed Volume Throughput to Target Treatment Level
Wellfield
Chain of Lakes Stoneridge Mocho
1 2 5 Centralized 1 2 Centralized
California RLs - - - - - 285,000 500,000 500,000
80% of CA RLs 500,000 - 500,000 - - 230,000 500,000 400,000
Vermont Advisory
Level 270,000 320,000 330,000 330,000 340,000 175,000 250,000 180,000
Below MRL 110,000 110,000 110,000 110,000 115,000 110,000 110,000 109,000
Table A-� GAC Bed Volume Throughput to Target Treatment Level
Wellfield
Chain of Lakes Stoneridge Mocho
1 2 5 Centralized 1 2 Centralized
California RLs - - - - - 150,000 250,000 250,000
80% of CA RLs 200,000 - 200,000 - - 125,000 200,000 210,000
Vermont Advisory
Level 145,000 250,000 160,000 170,000 250,000 80,000 130,000 125,000
Below MRL 9,500 18,000 14,000 12,500 20,000 6,200 9,200 8,400

TM1 | PFAS AND HEXAVALENT CHROMIUM TREATMENT FEASIBILITY STUDY | ZONE 7 WATER AGENCY
DRAFT | JUNE -.-.
Appendix B
DESIGN CRITERIA
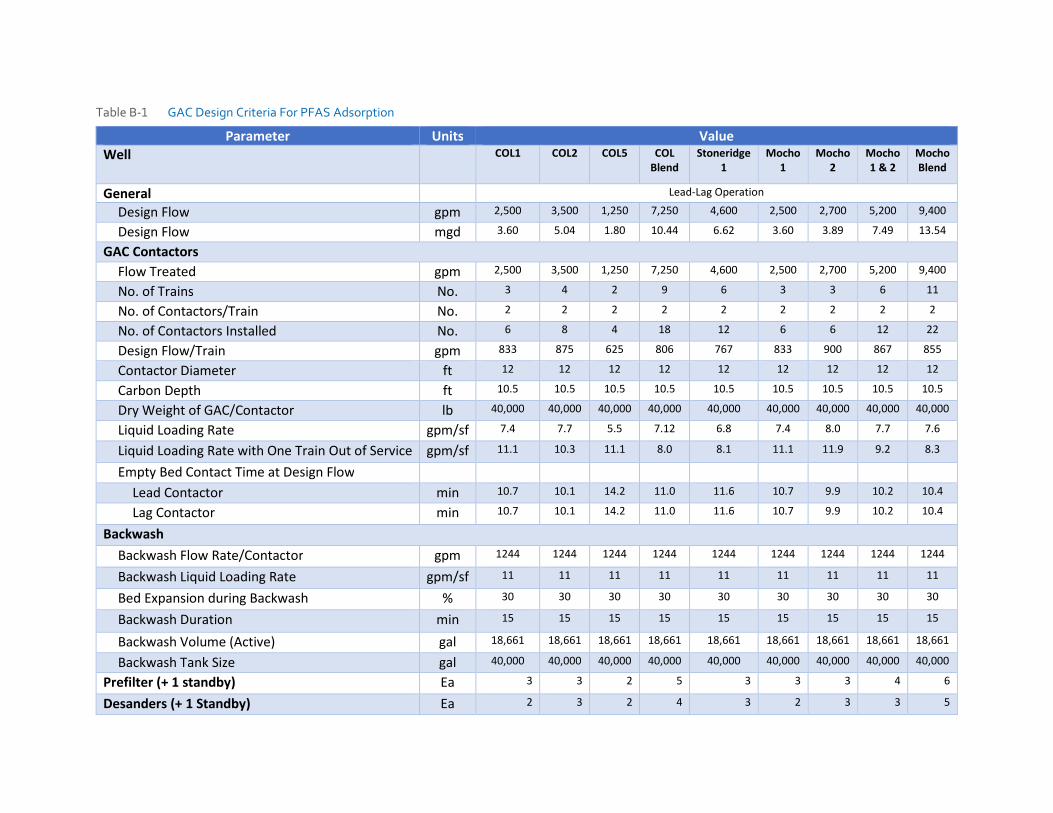
Table B- GAC Design Criteria For PFAS Adsorption
Parameter Units Value
Well COL1 COL2 COL5 COL
Blend
Stoneridge
1
Mocho
1
Mocho
2
Mocho
1 & 2
Mocho
Blend
General Lead-Lag Operation
Design Flow gpm 2,500 3,500 1,250 7,250 4,600 2,500 2,700 5,200 9,400
Design Flow mgd 3.60 5.04 1.80 10.44 6.62 3.60 3.89 7.49 13.54
GAC Contactors
Flow Treated gpm 2,500 3,500 1,250 7,250 4,600 2,500 2,700 5,200 9,400
No. of Trains No. 3 4 2 9 6 3 3 6 11
No. of Contactors/Train No. 2 2 2 2 2 2 2 2 2
No. of Contactors Installed No. 6 8 4 18 12 6 6 12 22
Design Flow/Train gpm 833 875 625 806 767 833 900 867 855
Contactor Diameter ft 12 12 12 12 12 12 12 12 12
Carbon Depth ft 10.5 10.5 10.5 10.5 10.5 10.5 10.5 10.5 10.5
Dry Weight of GAC/Contactor lb 40,000 40,000 40,000 40,000 40,000 40,000 40,000 40,000 40,000
Liquid Loading Rate gpm/sf 7.4 7.7 5.5 7.12 6.8 7.4 8.0 7.7 7.6
Liquid Loading Rate with One Train Out of Service gpm/sf 11.1 10.3 11.1 8.0 8.1 11.1 11.9 9.2 8.3
Empty Bed Contact Time at Design Flow
Lead Contactor min 10.7 10.1 14.2 11.0 11.6 10.7 9.9 10.2 10.4
Lag Contactor min 10.7 10.1 14.2 11.0 11.6 10.7 9.9 10.2 10.4
Backwash
Backwash Flow Rate/Contactor gpm 1244 1244 1244 1244 1244 1244 1244 1244 1244
Backwash Liquid Loading Rate gpm/sf 11 11 11 11 11 11 11 11 11
Bed Expansion during Backwash % 30 30 30 30 30 30 30 30 30
Backwash Duration min 15 15 15 15 15 15 15 15 15
Backwash Volume (Active) gal 18,661 18,661 18,661 18,661 18,661 18,661 18,661 18,661 18,661
Backwash Tank Size gal 40,000 40,000 40,000 40,000 40,000 40,000 40,000 40,000 40,000
Prefilter (+ 1 standby) Ea 3 3 2 5 3 3 3 4 6
Desanders (+ 1 Standby) Ea 2 3 2 4 3 2 3 3 5

Table B-� IX Design Criteria for PFAS Exchange
Parameter Units Value
Well COL1 COL2 COL5 COL
Blend
Stoneridge
1
Mocho
1
Mocho
2
Mocho
1 & 2
Mocho
Blend
General Lead-Lag Operation
Design Flow gpm 2,500 3,500 1,250 7,250 4,600 2,500 2,700 5,200 9,400
Design Flow mgd 3.60 5.04 1.80 10.44 6.62 3.60 3.89 7.49 13.54
GAC Contactors
Flow Treated gpm 2,500 3,500 1,250 7,250 4,600 2,500 2,700 5,200 9,400
No. of Trains No. 2 3 1 6 4 2 2 4 7
No. of Contactors/Train No. 2 2 2 2 2 2 2 2 2
No. of Contactors Installed No. 4 6 2 12 8 4 4 8 14
Design Flow/Train gpm 1250 1167 1250 1208 1150 1250 1350 1300 1343
Contactor Diameter ft 12 12 12 12 12 12 12 12 12
Carbon Depth ft 4.4 4.4 4.4 4.4 4.4 4.4 4.4 4.4 4.4
Dry Weight of GAC/Contactor lb 500 500 500 500 500 500 500 500 500
Liquid Loading Rate gpm/sf 11.1 10.3 11.1 10.7 10.2 11.1 11.9 11.5 11.9
Liquid Loading Rate with One Train Out of Service gpm/sf 22.1 15.5 N/A 12.8 13.6 22.1 23.9 15.3 13.9
Empty Bed Contact Time at Design Flow
Lead Contactor min 3.0 3.2 3.0 3.1 3.3 3.0 2.8 2.9 2.8
Lag Contactor min 3.0 3.2 3.0 3.1 3.3 3.0 2.8 2.9 2.8
Backwash
Backwash Flow Rate/Contactor gpm 226 226 226 226 226 226 226 226 226
Backwash Liquid Loading Rate gpm/sf 2 2 2 2 2 2 2 2 2
Bed Expansion during Backwash % 60 60 60 60 60 60 60 60 60
Backwash Duration min 15 15 15 15 15 15 15 15 15
Backwash Volume (Active) gal 3,393 3,393 3,393 3,393 3,393 3,393 3,393 3,393 3,393
Backwash Tank Size gal 8,000 8,000 8,000 8,000 8,000 8,000 8,000 8,000 8,000
Prefilter (+ 1 standby) Ea 3 3 2 5 3 3 3 4 6
Desanders (+ 1 Standby) Ea 2 3 2 4 3 2 3 3 5
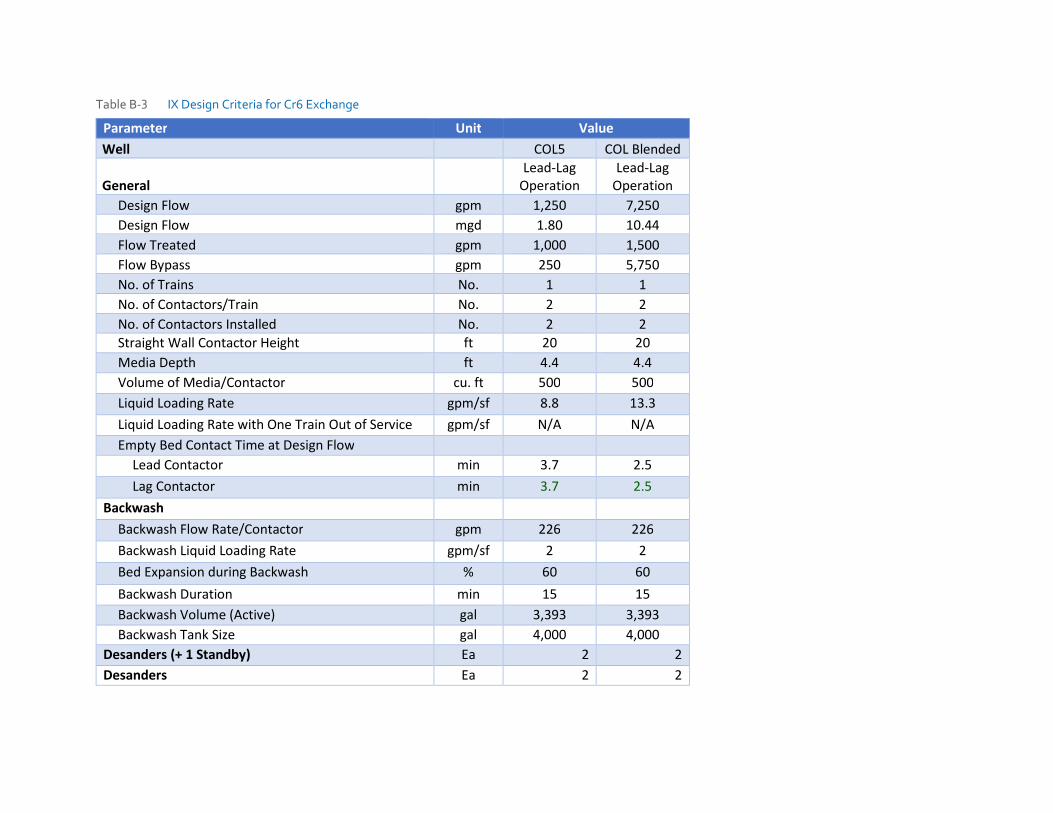
Table B-" IX Design Criteria for Cr# Exchange
Parameter Unit Value
Well COL5 COL Blended
General
Lead-Lag
Operation
Lead-Lag
Operation
Design Flow gpm 1,250 7,250
Design Flow mgd 1.80 10.44
Flow Treated gpm 1,000 1,500
Flow Bypass gpm 250 5,750
No. of Trains No. 1 1
No. of Contactors/Train No. 2 2
No. of Contactors Installed No. 2 2
Straight Wall Contactor Height ft 20 20
Media Depth ft 4.4 4.4
Volume of Media/Contactor cu. ft 500 500
Liquid Loading Rate gpm/sf 8.8 13.3
Liquid Loading Rate with One Train Out of Service gpm/sf N/A N/A
Empty Bed Contact Time at Design Flow
Lead Contactor min 3.7 2.5
Lag Contactor min 3.7 2.5
Backwash
Backwash Flow Rate/Contactor gpm 226 226
Backwash Liquid Loading Rate gpm/sf 2 2
Bed Expansion during Backwash % 60 60
Backwash Duration min 15 15
Backwash Volume (Active) gal 3,393 3,393
Backwash Tank Size gal 4,000 4,000
Desanders (+ 1 Standby) Ea 2 2
Desanders Ea 2 2
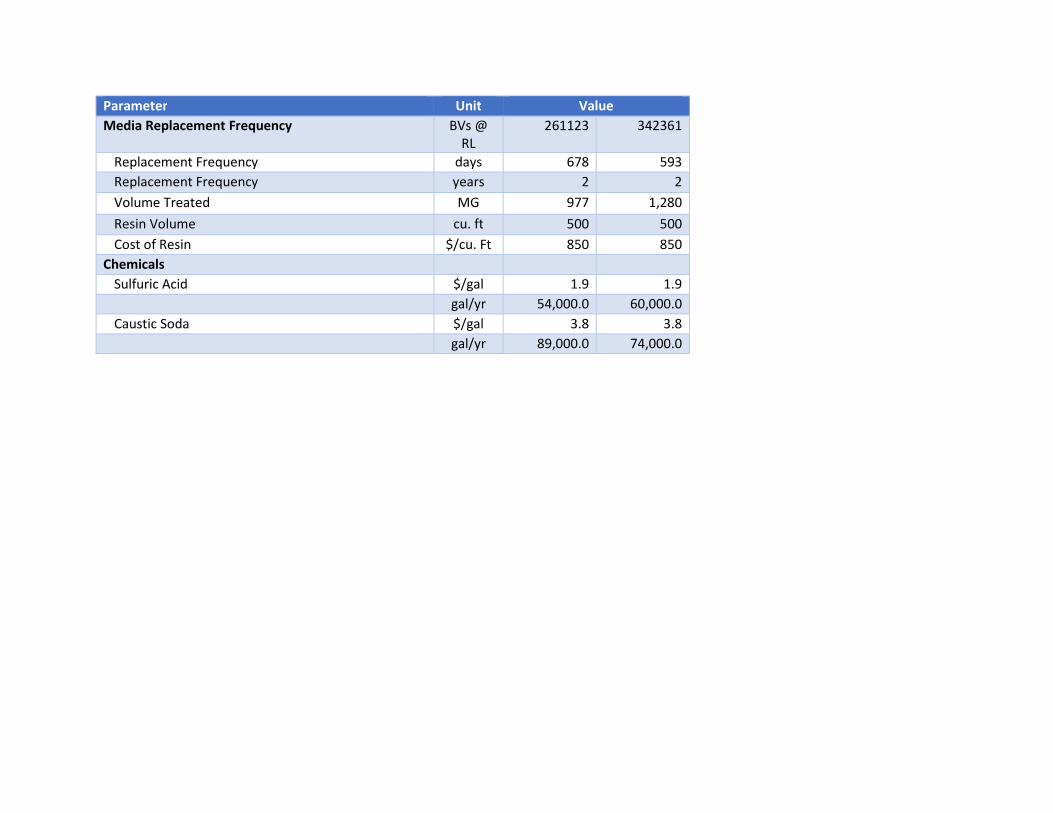
Parameter Unit Value
Media Replacement Frequency BVs @
RL
261123 342361
Replacement Frequency days 678 593
Replacement Frequency years 2 2
Volume Treated MG 977 1,280
Resin Volume cu. ft 500 500
Cost of Resin $/cu. Ft 850 850
Chemicals
Sulfuric Acid $/gal 1.9 1.9
gal/yr 54,000.0 60,000.0
Caustic Soda $/gal 3.8 3.8
gal/yr 89,000.0 74,000.0
TM1 | PFAS AND HEXAVALENT CHROMIUM TREATMENT FEASIBILITY STUDY | ZONE 7 WATER AGENCY
DRAFT | JUNE -.-.
Appendix C
OPINIONS OF PROBABLE COST (AACE CLASS 5)
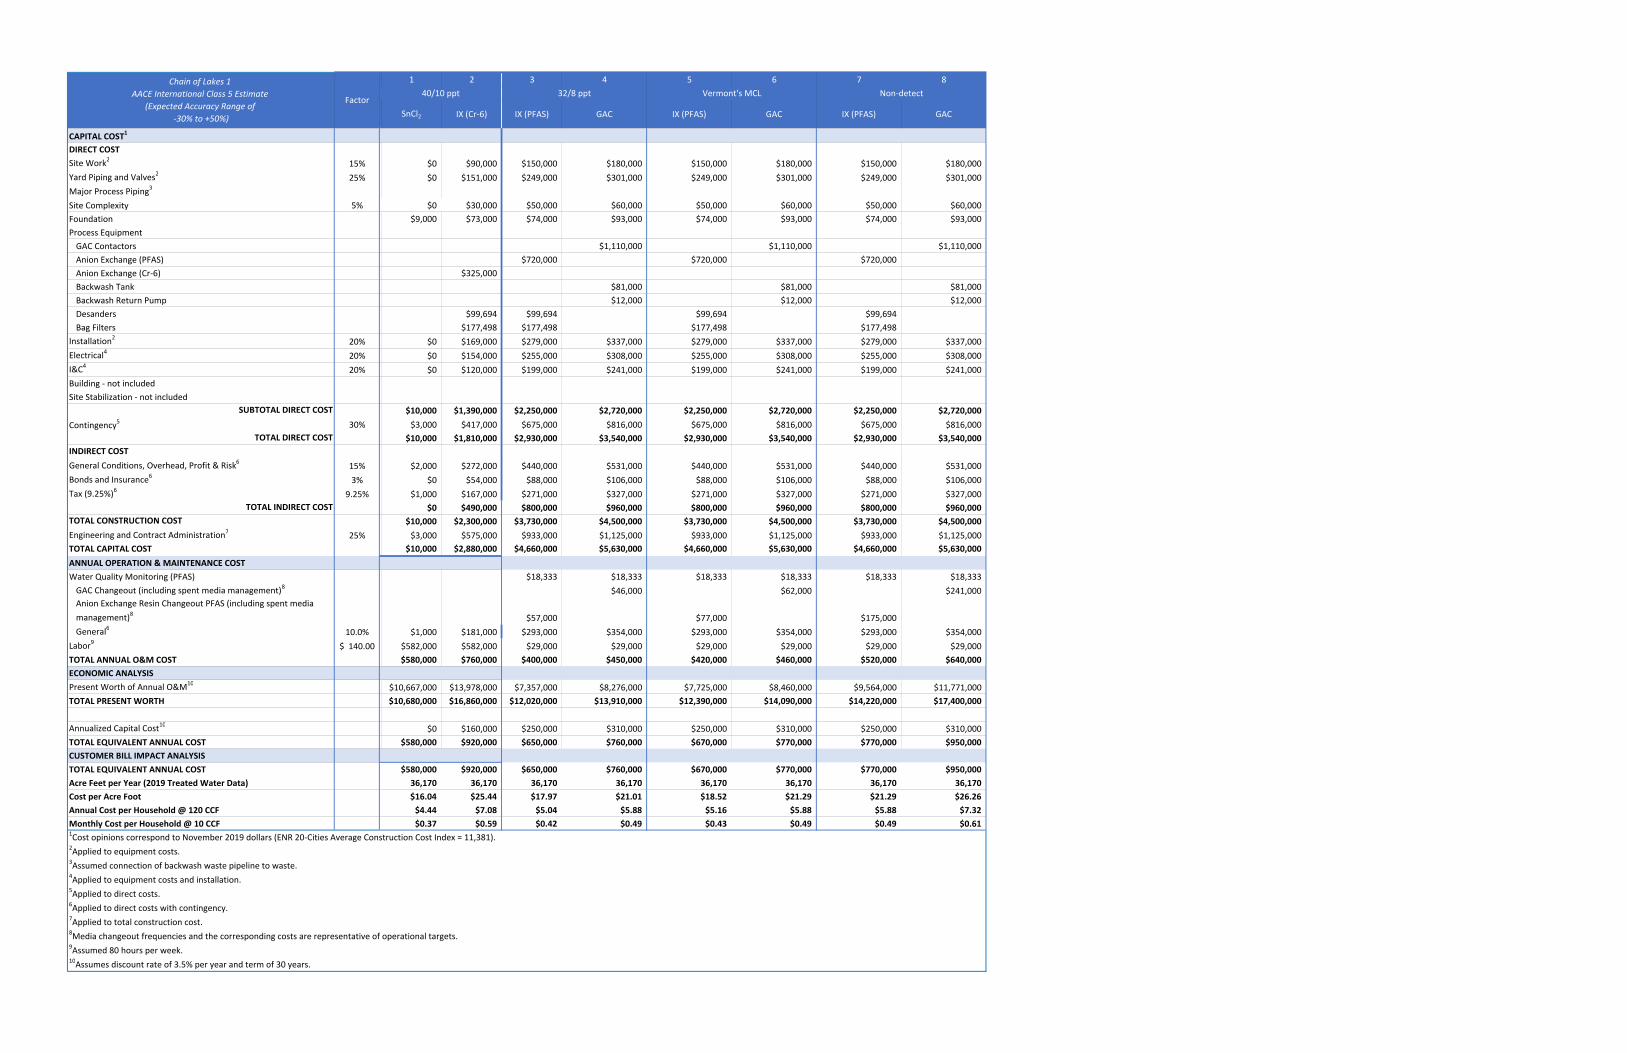
1 2 3 4 5 6 7 8
CAPITAL COST1
DIRECT COST
Site Work2
15% $0 $90,000 $150,000 $180,000 $150,000 $180,000 $150,000 $180,000
Yard Piping and Valves2
25% $0 $151,000 $249,000 $301,000 $249,000 $301,000 $249,000 $301,000
Major Process Piping3
Site Complexity 5% $0 $30,000 $50,000 $60,000 $50,000 $60,000 $50,000 $60,000
Foundation $9,000 $73,000 $74,000 $93,000 $74,000 $93,000 $74,000 $93,000
Process Equipment
GAC Contactors $1,110,000 $1,110,000 $1,110,000
Anion Exchange (PFAS) $720,000 $720,000 $720,000
Anion Exchange (Cr-6) $325,000
Backwash Tank $81,000 $81,000 $81,000
Backwash Return Pump $12,000 $12,000 $12,000
Desanders $99,694 $99,694 $99,694 $99,694
Bag Filters $177,498 $177,498 $177,498 $177,498
Installation2
20% $0 $169,000 $279,000 $337,000 $279,000 $337,000 $279,000 $337,000
Electrical4
20% $0 $154,000 $255,000 $308,000 $255,000 $308,000 $255,000 $308,000
I&C4
20% $0 $120,000 $199,000 $241,000 $199,000 $241,000 $199,000 $241,000
Building - not included
Site Stabilization - not included
SUBTOTAL DIRECT COST $10,000 $1,390,000 $2,250,000 $2,720,000 $2,250,000 $2,720,000 $2,250,000 $2,720,000
Contingency5 30% $3,000 $417,000 $675,000 $816,000 $675,000 $816,000 $675,000 $816,000
TOTAL DIRECT COST $10,000 $1,810,000 $2,930,000 $3,540,000 $2,930,000 $3,540,000 $2,930,000 $3,540,000
INDIRECT COST
General Conditions, Overhead, Profit & Risk6
15% $2,000 $272,000 $440,000 $531,000 $440,000 $531,000 $440,000 $531,000
Bonds and Insurance6
3% $0 $54,000 $88,000 $106,000 $88,000 $106,000 $88,000 $106,000
Tax (9.25%)6
9.25% $1,000 $167,000 $271,000 $327,000 $271,000 $327,000 $271,000 $327,000
TOTAL INDIRECT COST $0 $490,000 $800,000 $960,000 $800,000 $960,000 $800,000 $960,000
TOTAL CONSTRUCTION COST $10,000 $2,300,000 $3,730,000 $4,500,000 $3,730,000 $4,500,000 $3,730,000 $4,500,000
Engineering and Contract Administration7
25% $3,000 $575,000 $933,000 $1,125,000 $933,000 $1,125,000 $933,000 $1,125,000
TOTAL CAPITAL COST $10,000 $2,880,000 $4,660,000 $5,630,000 $4,660,000 $5,630,000 $4,660,000 $5,630,000
ANNUAL OPERATION & MAINTENANCE COST
Water Quality Monitoring (PFAS) $18,333 $18,333 $18,333 $18,333 $18,333 $18,333
GAC Changeout (including spent media management)8
$46,000 $62,000 $241,000
Anion Exchange Resin Changeout PFAS (including spent media
management)8
$57,000 $77,000 $175,000
General6
10.0% $1,000 $181,000 $293,000 $354,000 $293,000 $354,000 $293,000 $354,000
Labor9
140.00$ $582,000 $582,000 $29,000 $29,000 $29,000 $29,000 $29,000 $29,000
TOTAL ANNUAL O&M COST $580,000 $760,000 $400,000 $450,000 $420,000 $460,000 $520,000 $640,000
ECONOMIC ANALYSIS
Present Worth of Annual O&M10
$10,667,000 $13,978,000 $7,357,000 $8,276,000 $7,725,000 $8,460,000 $9,564,000 $11,771,000
TOTAL PRESENT WORTH $10,680,000 $16,860,000 $12,020,000 $13,910,000 $12,390,000 $14,090,000 $14,220,000 $17,400,000
Annualized Capital Cost10
$0 $160,000 $250,000 $310,000 $250,000 $310,000 $250,000 $310,000
TOTAL EQUIVALENT ANNUAL COST $580,000 $920,000 $650,000 $760,000 $670,000 $770,000 $770,000 $950,000
CUSTOMER BILL IMPACT ANALYSIS
TOTAL EQUIVALENT ANNUAL COST $580,000 $920,000 $650,000 $760,000 $670,000 $770,000 $770,000 $950,000
Acre Feet per Year (2019 Treated Water Data) 36,170 36,170 36,170 36,170 36,170 36,170 36,170 36,170
Cost per Acre Foot $16.04 $25.44 $17.97 $21.01 $18.52 $21.29 $21.29 $26.26
Annual Cost per Household @ 120 CCF $4.44 $7.08 $5.04 $5.88 $5.16 $5.88 $5.88 $7.32
Monthly Cost per Household @ 10 CCF $0.37 $0.59 $0.42 $0.49 $0.43 $0.49 $0.49 $0.611Cost opinions correspond to November 2019 dollars (ENR 20-Cities Average Construction Cost Index = 11,381).
2Applied to equipment costs.
3Assumed connection of backwash waste pipeline to waste.
4Applied to equipment costs and installation.
5Applied to direct costs.
6Applied to direct costs with contingency.
7Applied to total construction cost.
8Media changeout frequencies and the corresponding costs are representative of operational targets.
9Assumed 80 hours per week.
10Assumes discount rate of 3.5% per year and term of 30 years.
Chain of Lakes 1
AACE International Class 5 Estimate
(Expected Accuracy Range of
-30% to +50%)
Factor B
l
e
SnCl2 GACIX (Cr-6) IX (PFAS)
40/10 ppt Non-detect
GAC IX (PFAS)
32/8 ppt
IX (PFAS) GAC
Vermont's MCL
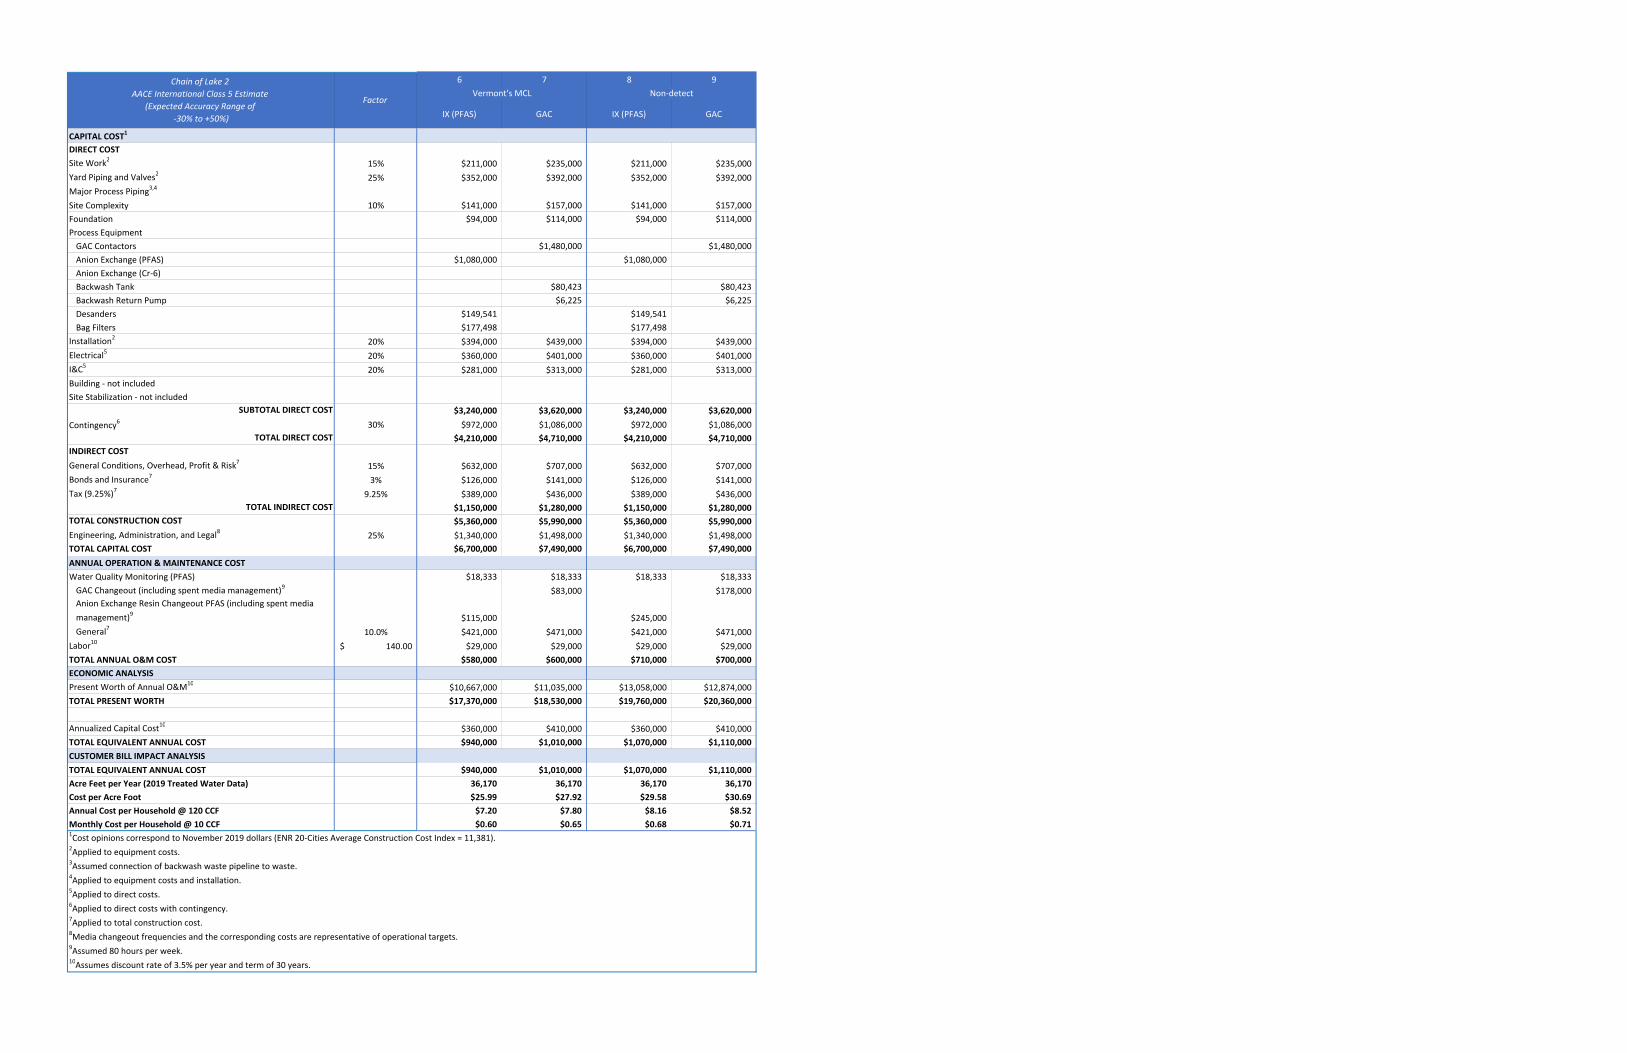
6 7 8 9
CAPITAL COST1
DIRECT COST
Site Work2
15% $211,000 $235,000 $211,000 $235,000
Yard Piping and Valves2
25% $352,000 $392,000 $352,000 $392,000
Major Process Piping3,4
Site Complexity 10% $141,000 $157,000 $141,000 $157,000
Foundation $94,000 $114,000 $94,000 $114,000
Process Equipment
GAC Contactors $1,480,000 $1,480,000
Anion Exchange (PFAS) $1,080,000 $1,080,000
Anion Exchange (Cr-6)
Backwash Tank $80,423 $80,423
Backwash Return Pump $6,225 $6,225
Desanders $149,541 $149,541
Bag Filters $177,498 $177,498
Installation2
20% $394,000 $439,000 $394,000 $439,000
Electrical5
20% $360,000 $401,000 $360,000 $401,000
I&C5
20% $281,000 $313,000 $281,000 $313,000
Building - not included
Site Stabilization - not included
SUBTOTAL DIRECT COST $3,240,000 $3,620,000 $3,240,000 $3,620,000
Contingency6 30% $972,000 $1,086,000 $972,000 $1,086,000
TOTAL DIRECT COST $4,210,000 $4,710,000 $4,210,000 $4,710,000
INDIRECT COST
General Conditions, Overhead, Profit & Risk7
15% $632,000 $707,000 $632,000 $707,000
Bonds and Insurance7
3% $126,000 $141,000 $126,000 $141,000
Tax (9.25%)7
9.25% $389,000 $436,000 $389,000 $436,000
TOTAL INDIRECT COST $1,150,000 $1,280,000 $1,150,000 $1,280,000
TOTAL CONSTRUCTION COST $5,360,000 $5,990,000 $5,360,000 $5,990,000
Engineering, Administration, and Legal8
25% $1,340,000 $1,498,000 $1,340,000 $1,498,000
TOTAL CAPITAL COST $6,700,000 $7,490,000 $6,700,000 $7,490,000
ANNUAL OPERATION & MAINTENANCE COST
Water Quality Monitoring (PFAS) $18,333 $18,333 $18,333 $18,333
GAC Changeout (including spent media management)9
$83,000 $178,000
Anion Exchange Resin Changeout PFAS (including spent media
management)9
$115,000 $245,000
General7
10.0% $421,000 $471,000 $421,000 $471,000
Labor10
140.00$ $29,000 $29,000 $29,000 $29,000
TOTAL ANNUAL O&M COST $580,000 $600,000 $710,000 $700,000
ECONOMIC ANALYSIS
Present Worth of Annual O&M10
$10,667,000 $11,035,000 $13,058,000 $12,874,000
TOTAL PRESENT WORTH $17,370,000 $18,530,000 $19,760,000 $20,360,000
Annualized Capital Cost10
$360,000 $410,000 $360,000 $410,000
TOTAL EQUIVALENT ANNUAL COST $940,000 $1,010,000 $1,070,000 $1,110,000
CUSTOMER BILL IMPACT ANALYSIS
TOTAL EQUIVALENT ANNUAL COST $940,000 $1,010,000 $1,070,000 $1,110,000
Acre Feet per Year (2019 Treated Water Data) 36,170 36,170 36,170 36,170
Cost per Acre Foot $25.99 $27.92 $29.58 $30.69
Annual Cost per Household @ 120 CCF $7.20 $7.80 $8.16 $8.52
Monthly Cost per Household @ 10 CCF $0.60 $0.65 $0.68 $0.711Cost opinions correspond to November 2019 dollars (ENR 20-Cities Average Construction Cost Index = 11,381).
2Applied to equipment costs.
3Assumed connection of backwash waste pipeline to waste.
4Applied to equipment costs and installation.
5Applied to direct costs.
6Applied to direct costs with contingency.
7Applied to total construction cost.
8Media changeout frequencies and the corresponding costs are representative of operational targets.
9Assumed 80 hours per week.
10Assumes discount rate of 3.5% per year and term of 30 years.
Non-detect
Chain of Lake 2
AACE International Class 5 Estimate
(Expected Accuracy Range of
-30% to +50%)
Factor
GACIX (PFAS)IX (PFAS) GAC
Vermont's MCL

3 2 4 5 6 7 8 9 10 11 12 13 14 15
CAPITAL COST1
DIRECT COST
Site Work2
15% $72,000 $2,000 $133,000 $81,000 $203,000 $126,000 $133,000 $81,000 $178,000 $151,000 $133,000 $81,000 $203,000 $126,000
Yard Piping and Valves2
25% $120,000 $3,000 $222,000 $135,000 $339,000 $210,000 $222,000 $135,000 $297,000 $252,000 $222,000 $135,000 $339,000 $210,000
Major Process Piping3,4
Site Complexity 15% $72,000 $133,000 $81,000 $203,000 $126,000 $133,000 $81,000 $178,000 $151,000 $133,000 $81,000 $203,000 $126,000
Foundation $53,000 $73,000 $54,000 $92,000 $74,000 $73,000 $54,000 $92,000 $74,000 $73,000 $54,000 $92,000 $74,000
Process Equipment
GAC Contactors $740,000 $740,000 $740,000 $740,000 $740,000 $740,000
Anion Exchange (PFAS) $360,000 $360,000 $360,000 $360,000 $360,000 $360,000
Anion Exchange (Cr-6) $360,000 $360,000 $360,000 $360,000 $360,000 $360,000 $360,000
Backwash Tank $80,649 $80,649 $80,649 $80,649 $80,649 $80,649
Backwash Return Pump $6,225 $6,225 $6,225 $6,225 $6,225 $6,225
Stannous Chloride Feed System $12,628 $12,628 $12,628 $12,628 $12,628 $12,628 $12,628
Desanders $49,847 $49,847 $49,847 $49,847 $49,847 $49,847 $49,847 $49,847 $49,847
Bag Filters $118,332 $118,332 $118,332 $118,332 $118,332 $118,332 $118,332 $118,332 $118,332 $118,332
Installation2
20% $134,000 $4,000 $249,000 $151,000 $379,000 $235,000 $249,000 $151,000 $332,000 $282,000 $249,000 $151,000 $379,000 $235,000
Electrical5
20% $122,000 $3,000 $227,000 $138,000 $347,000 $215,000 $227,000 $138,000 $304,000 $258,000 $227,000 $138,000 $347,000 $215,000
I&C5
20% $96,000 $3,000 $178,000 $108,000 $271,000 $168,000 $178,000 $108,000 $237,000 $202,000 $178,000 $108,000 $271,000 $168,000
Building - not included
Site Stabilization - not included
SUBTOTAL DIRECT COST $1,150,000 $30,000 $2,100,000 $1,290,000 $3,190,000 $1,990,000 $2,100,000 $1,290,000 $2,800,000 $2,380,000 $2,100,000 $1,290,000 $3,190,000 $1,990,000
Contingency6 30% $345,000 $9,000 $630,000 $387,000 $957,000 $597,000 $630,000 $387,000 $840,000 $714,000 $630,000 $387,000 $957,000 $597,000
TOTAL DIRECT COST $1,500,000 $40,000 $2,730,000 $1,680,000 $4,150,000 $2,590,000 $2,730,000 $1,680,000 $3,640,000 $3,090,000 $2,730,000 $1,680,000 $4,150,000 $2,590,000
INDIRECT COST
General Conditions, Overhead, Profit & Risk7
15% $225,000 $6,000 $410,000 $252,000 $623,000 $389,000 $410,000 $252,000 $546,000 $464,000 $410,000 $252,000 $623,000 $389,000
Bonds and Insurance7
3% $45,000 $1,000 $82,000 $50,000 $125,000 $78,000 $82,000 $50,000 $109,000 $93,000 $82,000 $50,000 $125,000 $78,000
Tax (9.25%)7 9.25% $139,000 $4,000 $253,000 $155,000 $384,000 $240,000 $253,000 $155,000 $337,000 $286,000 $253,000 $155,000 $384,000 $240,000
TOTAL INDIRECT COST $410,000 $10,000 $750,000 $460,000 $1,130,000 $710,000 $750,000 $460,000 $990,000 $840,000 $750,000 $460,000 $1,130,000 $710,000
TOTAL CONSTRUCTION COST $1,910,000 $50,000 $3,480,000 $2,140,000 $5,280,000 $3,300,000 $3,480,000 $2,140,000 $4,630,000 $3,930,000 $3,480,000 $2,140,000 $5,280,000 $3,300,000
Engineering, Administration, and Legal8
25% $478,000 $13,000 $870,000 $535,000 $1,320,000 $825,000 $870,000 $535,000 $1,158,000 $983,000 $870,000 $535,000 $1,320,000 $825,000
TOTAL CAPITAL COST $2,390,000 $60,000 $4,350,000 $2,680,000 $6,600,000 $4,130,000 $4,350,000 $2,680,000 $5,790,000 $4,910,000 $4,350,000 $2,680,000 $6,600,000 $4,130,000
ANNUAL OPERATION & MAINTENANCE COST
Water Quality Monitoring (PFAS) $18,333 $18,333 $18,333 $18,333 $18,333 $18,333 $18,333 $18,333 $18,333 $18,333 $18,333 $18,333
GAC Changeout (including spent media management)9
$31,000 $31,000 $41,000 $41,000 $82,000 $82,000
Anion Exchange Resin Changeout PFAS (including spent media
management)9
$29,000 $29,000 $38,000 $38,000 $57,000 $57,000
Anion Exchange Resin Changeout Cr-6 (including spent media
management)9
$195,470 $195,470 $195,470 $195,470 $195,470 $195,470 $195,470
Stannous Chloride Feed $26,030 $26,030 $26,030 $26,030 $26,030 $26,030 $26,030
General7
10.0% $150,000 $4,000 $273,000 $168,000 $415,000 $259,000 $273,000 $168,000 $364,000 $309,000 $273,000 $168,000 $415,000 $259,000
Labor10
140.00$ $29,000 $116,000 $58,000 $116,000 $58,000 $116,000 $58,000 $116,000 $58,000 $116,000 $58,000 $116,000 $58,000 $116,000
TOTAL ANNUAL O&M COST $370,000 $150,000 $570,000 $360,000 $720,000 $450,000 $580,000 $370,000 $680,000 $510,000 $600,000 $390,000 $770,000 $500,000
ECONOMIC ANALYSIS
Present Worth of Annual O&M10
$6,805,000 $2,759,000 $10,483,000 $6,621,000 $13,242,000 $8,276,000 $10,667,000 $6,805,000 $12,507,000 $9,380,000 $11,035,000 $7,173,000 $14,162,000 $9,196,000
TOTAL PRESENT WORTH $9,200,000 $2,820,000 $14,830,000 $9,300,000 $19,840,000 $12,410,000 $15,020,000 $9,490,000 $18,300,000 $14,290,000 $15,390,000 $9,850,000 $20,760,000 $13,330,000
Annualized Capital Cost10
$130,000 $0 $240,000 $150,000 $360,000 $220,000 $240,000 $150,000 $310,000 $270,000 $240,000 $150,000 $360,000 $220,000
TOTAL EQUIVALENT ANNUAL COST $500,000 $150,000 $810,000 $510,000 $1,080,000 $670,000 $820,000 $520,000 $990,000 $780,000 $840,000 $540,000 $1,130,000 $720,000
CUSTOMER BILL IMPACT ANALYSIS
TOTAL EQUIVALENT ANNUAL COST $500,000 $150,000 $810,000 $510,000 $1,080,000 $670,000 $820,000 $520,000 $990,000 $780,000 $840,000 $540,000 $1,130,000 $720,000
Acre Feet per Year (2019 Treated Water Data) 36,170 36,170 36,170 36,170 36,170 36,170 36,170 36,170 36,170 36,170 36,170 36,170 36,170 36,170
Cost per Acre Foot $13.82 $4.15 $22.39 $14.10 $29.86 $18.52 $22.67 $14.38 $27.37 $21.56 $23.22 $14.93 $31.24 $19.91
Annual Cost per Household @ 120 CCF $3.84 $1.20 $6.24 $3.96 $8.28 $5.16 $6.36 $4.08 $7.56 $6.00 $6.48 $4.20 $8.64 $5.52
Monthly Cost per Household @ 10 CCF $0.32 $0.10 $0.52 $0.33 $0.69 $0.43 $0.53 $0.34 $0.63 $0.50 $0.54 $0.35 $0.72 $0.461Cost opinions correspond to November 2019 dollars (ENR 20-Cities Average Construction Cost Index = 11,381).
2Applied to equipment costs.
3Assumed connection of backwash waste pipeline to waste.
4Applied to equipment costs and installation.
5Applied to direct costs.
6Applied to direct costs with contingency.
7Applied to total construction cost.
8Media changeout frequencies and the corresponding costs are representative of operational targets.
9Assumed 80 hours per week.
10Assumes discount rate of 3.5% per year and term of 30 years.
GAC + IX (Cr-6) GAC + SnCl2
32/8 ppt
IX (PFAS) + IX (Cr-6) IX (PFAS) + SnCl2 GAC + SnCl2
Chain of Lakes 5
AACE International Class 5 Estimate
(Expected Accuracy Range of
-30% to +50%)
Factor40/10 ppt Non-detect
SnCl2IX (Cr-6) IX (PFAS) + IX (Cr-6) IX (PFAS) + SnCl2 GAC + IX (Cr-6)IX (PFAS) + IX (Cr-6) IX (PFAS) + SnCl2 GAC + IX (Cr-6) GAC + SnCl2
Vermont's MCL
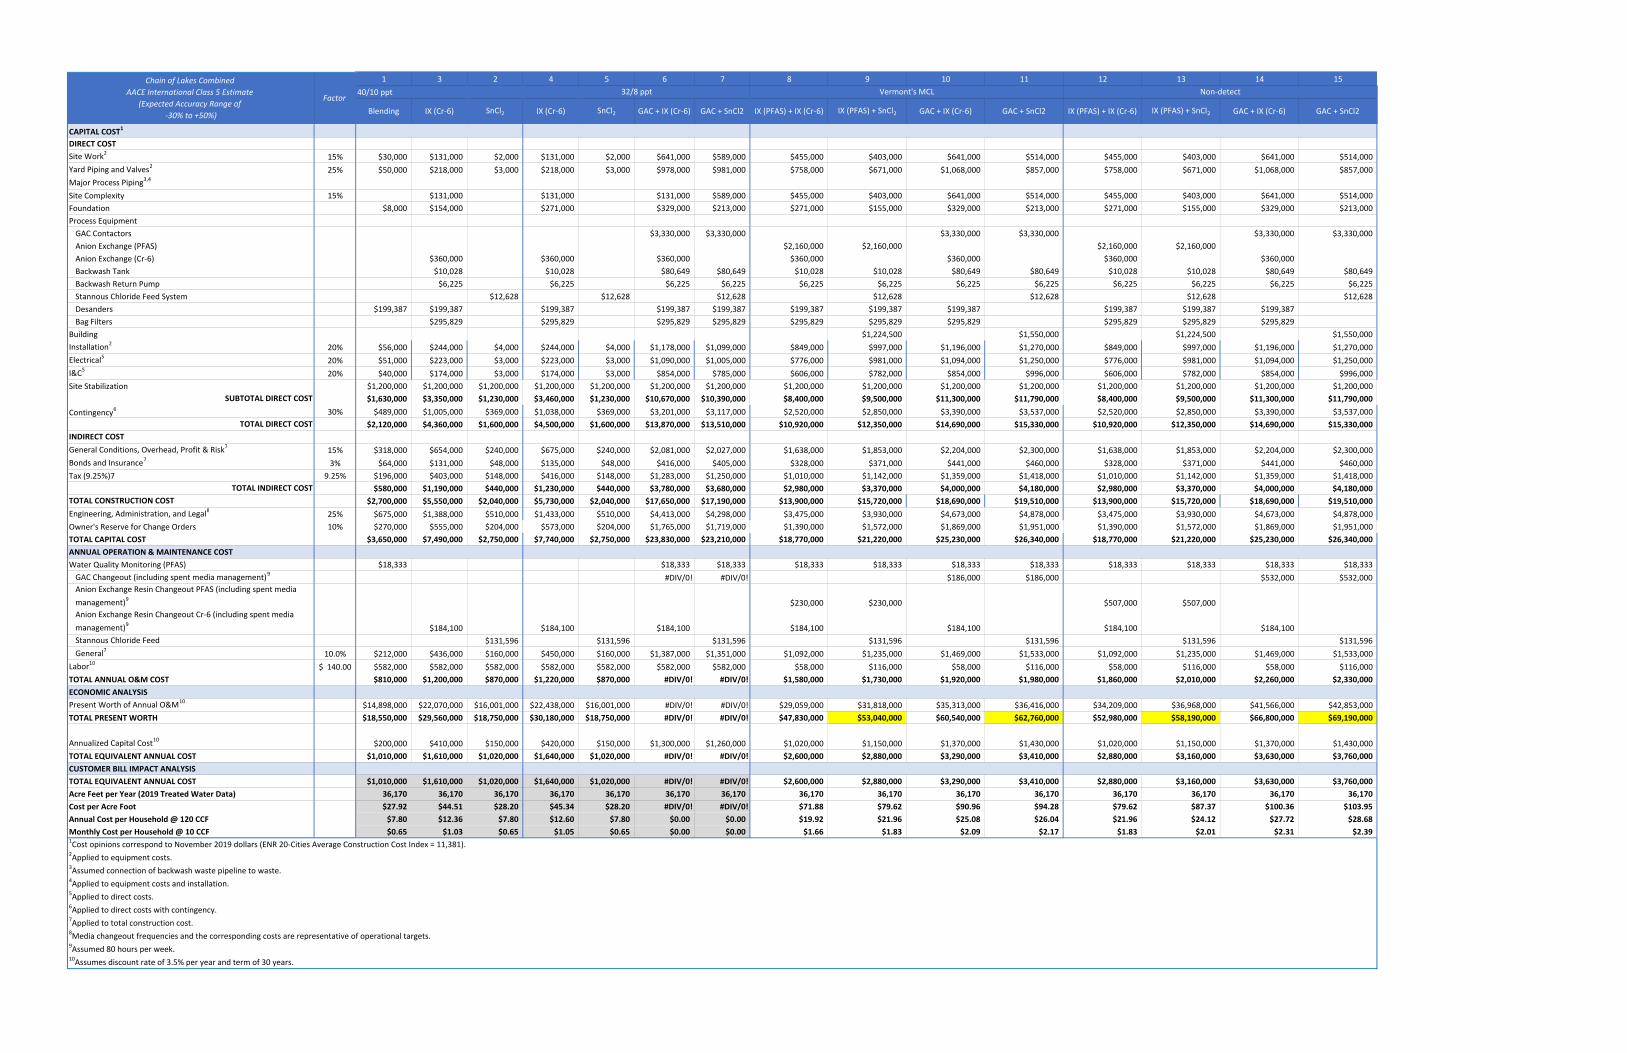
1 3 2 4 5 6 7 8 9 10 11 12 13 14 15
40/10 ppt
CAPITAL COST1
DIRECT COST
Site Work2
15% $30,000 $131,000 $2,000 $131,000 $2,000 $641,000 $589,000 $455,000 $403,000 $641,000 $514,000 $455,000 $403,000 $641,000 $514,000
Yard Piping and Valves2
25% $50,000 $218,000 $3,000 $218,000 $3,000 $978,000 $981,000 $758,000 $671,000 $1,068,000 $857,000 $758,000 $671,000 $1,068,000 $857,000
Major Process Piping3,4
Site Complexity 15% $131,000 $131,000 $131,000 $589,000 $455,000 $403,000 $641,000 $514,000 $455,000 $403,000 $641,000 $514,000
Foundation $8,000 $154,000 $271,000 $329,000 $213,000 $271,000 $155,000 $329,000 $213,000 $271,000 $155,000 $329,000 $213,000
Process Equipment
GAC Contactors $3,330,000 $3,330,000 $3,330,000 $3,330,000 $3,330,000 $3,330,000
Anion Exchange (PFAS) $2,160,000 $2,160,000 $2,160,000 $2,160,000
Anion Exchange (Cr-6) $360,000 $360,000 $360,000 $360,000 $360,000 $360,000 $360,000
Backwash Tank $10,028 $10,028 $80,649 $80,649 $10,028 $10,028 $80,649 $80,649 $10,028 $10,028 $80,649 $80,649
Backwash Return Pump $6,225 $6,225 $6,225 $6,225 $6,225 $6,225 $6,225 $6,225 $6,225 $6,225 $6,225 $6,225
Stannous Chloride Feed System $12,628 $12,628 $12,628 $12,628 $12,628 $12,628 $12,628
Desanders $199,387 $199,387 $199,387 $199,387 $199,387 $199,387 $199,387 $199,387 $199,387 $199,387 $199,387
Bag Filters $295,829 $295,829 $295,829 $295,829 $295,829 $295,829 $295,829 $295,829 $295,829 $295,829
Building $1,224,500 $1,550,000 $1,224,500 $1,550,000
Installation2
20% $56,000 $244,000 $4,000 $244,000 $4,000 $1,178,000 $1,099,000 $849,000 $997,000 $1,196,000 $1,270,000 $849,000 $997,000 $1,196,000 $1,270,000
Electrical5
20% $51,000 $223,000 $3,000 $223,000 $3,000 $1,090,000 $1,005,000 $776,000 $981,000 $1,094,000 $1,250,000 $776,000 $981,000 $1,094,000 $1,250,000
I&C5
20% $40,000 $174,000 $3,000 $174,000 $3,000 $854,000 $785,000 $606,000 $782,000 $854,000 $996,000 $606,000 $782,000 $854,000 $996,000
Site Stabilization $1,200,000 $1,200,000 $1,200,000 $1,200,000 $1,200,000 $1,200,000 $1,200,000 $1,200,000 $1,200,000 $1,200,000 $1,200,000 $1,200,000 $1,200,000 $1,200,000 $1,200,000
SUBTOTAL DIRECT COST $1,630,000 $3,350,000 $1,230,000 $3,460,000 $1,230,000 $10,670,000 $10,390,000 $8,400,000 $9,500,000 $11,300,000 $11,790,000 $8,400,000 $9,500,000 $11,300,000 $11,790,000
Contingency6 30% $489,000 $1,005,000 $369,000 $1,038,000 $369,000 $3,201,000 $3,117,000 $2,520,000 $2,850,000 $3,390,000 $3,537,000 $2,520,000 $2,850,000 $3,390,000 $3,537,000
TOTAL DIRECT COST $2,120,000 $4,360,000 $1,600,000 $4,500,000 $1,600,000 $13,870,000 $13,510,000 $10,920,000 $12,350,000 $14,690,000 $15,330,000 $10,920,000 $12,350,000 $14,690,000 $15,330,000
INDIRECT COST
General Conditions, Overhead, Profit & Risk7
15% $318,000 $654,000 $240,000 $675,000 $240,000 $2,081,000 $2,027,000 $1,638,000 $1,853,000 $2,204,000 $2,300,000 $1,638,000 $1,853,000 $2,204,000 $2,300,000
Bonds and Insurance7
3% $64,000 $131,000 $48,000 $135,000 $48,000 $416,000 $405,000 $328,000 $371,000 $441,000 $460,000 $328,000 $371,000 $441,000 $460,000
Tax (9.25%)7 9.25% $196,000 $403,000 $148,000 $416,000 $148,000 $1,283,000 $1,250,000 $1,010,000 $1,142,000 $1,359,000 $1,418,000 $1,010,000 $1,142,000 $1,359,000 $1,418,000
TOTAL INDIRECT COST $580,000 $1,190,000 $440,000 $1,230,000 $440,000 $3,780,000 $3,680,000 $2,980,000 $3,370,000 $4,000,000 $4,180,000 $2,980,000 $3,370,000 $4,000,000 $4,180,000
TOTAL CONSTRUCTION COST $2,700,000 $5,550,000 $2,040,000 $5,730,000 $2,040,000 $17,650,000 $17,190,000 $13,900,000 $15,720,000 $18,690,000 $19,510,000 $13,900,000 $15,720,000 $18,690,000 $19,510,000
Engineering, Administration, and Legal8
25% $675,000 $1,388,000 $510,000 $1,433,000 $510,000 $4,413,000 $4,298,000 $3,475,000 $3,930,000 $4,673,000 $4,878,000 $3,475,000 $3,930,000 $4,673,000 $4,878,000
Owner's Reserve for Change Orders 10% $270,000 $555,000 $204,000 $573,000 $204,000 $1,765,000 $1,719,000 $1,390,000 $1,572,000 $1,869,000 $1,951,000 $1,390,000 $1,572,000 $1,869,000 $1,951,000
TOTAL CAPITAL COST $3,650,000 $7,490,000 $2,750,000 $7,740,000 $2,750,000 $23,830,000 $23,210,000 $18,770,000 $21,220,000 $25,230,000 $26,340,000 $18,770,000 $21,220,000 $25,230,000 $26,340,000
ANNUAL OPERATION & MAINTENANCE COST
Water Quality Monitoring (PFAS) $18,333 $18,333 $18,333 $18,333 $18,333 $18,333 $18,333 $18,333 $18,333 $18,333 $18,333
GAC Changeout (including spent media management)9
#DIV/0! #DIV/0! $186,000 $186,000 $532,000 $532,000
Anion Exchange Resin Changeout PFAS (including spent media
management)9
$230,000 $230,000 $507,000 $507,000
Anion Exchange Resin Changeout Cr-6 (including spent media
management)9
$184,100 $184,100 $184,100 $184,100 $184,100 $184,100 $184,100
Stannous Chloride Feed $131,596 $131,596 $131,596 $131,596 $131,596 $131,596 $131,596
General7
10.0% $212,000 $436,000 $160,000 $450,000 $160,000 $1,387,000 $1,351,000 $1,092,000 $1,235,000 $1,469,000 $1,533,000 $1,092,000 $1,235,000 $1,469,000 $1,533,000
Labor10
140.00$ $582,000 $582,000 $582,000 $582,000 $582,000 $582,000 $582,000 $58,000 $116,000 $58,000 $116,000 $58,000 $116,000 $58,000 $116,000
TOTAL ANNUAL O&M COST $810,000 $1,200,000 $870,000 $1,220,000 $870,000 #DIV/0! #DIV/0! $1,580,000 $1,730,000 $1,920,000 $1,980,000 $1,860,000 $2,010,000 $2,260,000 $2,330,000
ECONOMIC ANALYSIS
Present Worth of Annual O&M10
$14,898,000 $22,070,000 $16,001,000 $22,438,000 $16,001,000 #DIV/0! #DIV/0! $29,059,000 $31,818,000 $35,313,000 $36,416,000 $34,209,000 $36,968,000 $41,566,000 $42,853,000
TOTAL PRESENT WORTH $18,550,000 $29,560,000 $18,750,000 $30,180,000 $18,750,000 #DIV/0! #DIV/0! $47,830,000 $53,040,000 $60,540,000 $62,760,000 $52,980,000 $58,190,000 $66,800,000 $69,190,000
Annualized Capital Cost10
$200,000 $410,000 $150,000 $420,000 $150,000 $1,300,000 $1,260,000 $1,020,000 $1,150,000 $1,370,000 $1,430,000 $1,020,000 $1,150,000 $1,370,000 $1,430,000
TOTAL EQUIVALENT ANNUAL COST $1,010,000 $1,610,000 $1,020,000 $1,640,000 $1,020,000 #DIV/0! #DIV/0! $2,600,000 $2,880,000 $3,290,000 $3,410,000 $2,880,000 $3,160,000 $3,630,000 $3,760,000
CUSTOMER BILL IMPACT ANALYSIS
TOTAL EQUIVALENT ANNUAL COST $1,010,000 $1,610,000 $1,020,000 $1,640,000 $1,020,000 #DIV/0! #DIV/0! $2,600,000 $2,880,000 $3,290,000 $3,410,000 $2,880,000 $3,160,000 $3,630,000 $3,760,000
Acre Feet per Year (2019 Treated Water Data) 36,170 36,170 36,170 36,170 36,170 36,170 36,170 36,170 36,170 36,170 36,170 36,170 36,170 36,170 36,170
Cost per Acre Foot $27.92 $44.51 $28.20 $45.34 $28.20 #DIV/0! #DIV/0! $71.88 $79.62 $90.96 $94.28 $79.62 $87.37 $100.36 $103.95
Annual Cost per Household @ 120 CCF $7.80 $12.36 $7.80 $12.60 $7.80 $0.00 $0.00 $19.92 $21.96 $25.08 $26.04 $21.96 $24.12 $27.72 $28.68
Monthly Cost per Household @ 10 CCF $0.65 $1.03 $0.65 $1.05 $0.65 $0.00 $0.00 $1.66 $1.83 $2.09 $2.17 $1.83 $2.01 $2.31 $2.391Cost opinions correspond to November 2019 dollars (ENR 20-Cities Average Construction Cost Index = 11,381).
2Applied to equipment costs.
3Assumed connection of backwash waste pipeline to waste.
4Applied to equipment costs and installation.
5Applied to direct costs.
6Applied to direct costs with contingency.
7Applied to total construction cost.
8Media changeout frequencies and the corresponding costs are representative of operational targets.
9Assumed 80 hours per week.
10Assumes discount rate of 3.5% per year and term of 30 years.
IX (PFAS) + IX (Cr-6) IX (PFAS) + SnCl2 GAC + IX (Cr-6) GAC + SnCl2
Chain of Lakes Combined
AACE International Class 5 Estimate
(Expected Accuracy Range of
-30% to +50%)
FactorNon-detect
Blending SnCl2IX (Cr-6) IX (PFAS) + IX (Cr-6) IX (PFAS) + SnCl2 GAC + IX (Cr-6)IX (Cr-6) SnCl2 GAC + IX (Cr-6) GAC + SnCl2
32/8 ppt Vermont's MCL
GAC + SnCl2
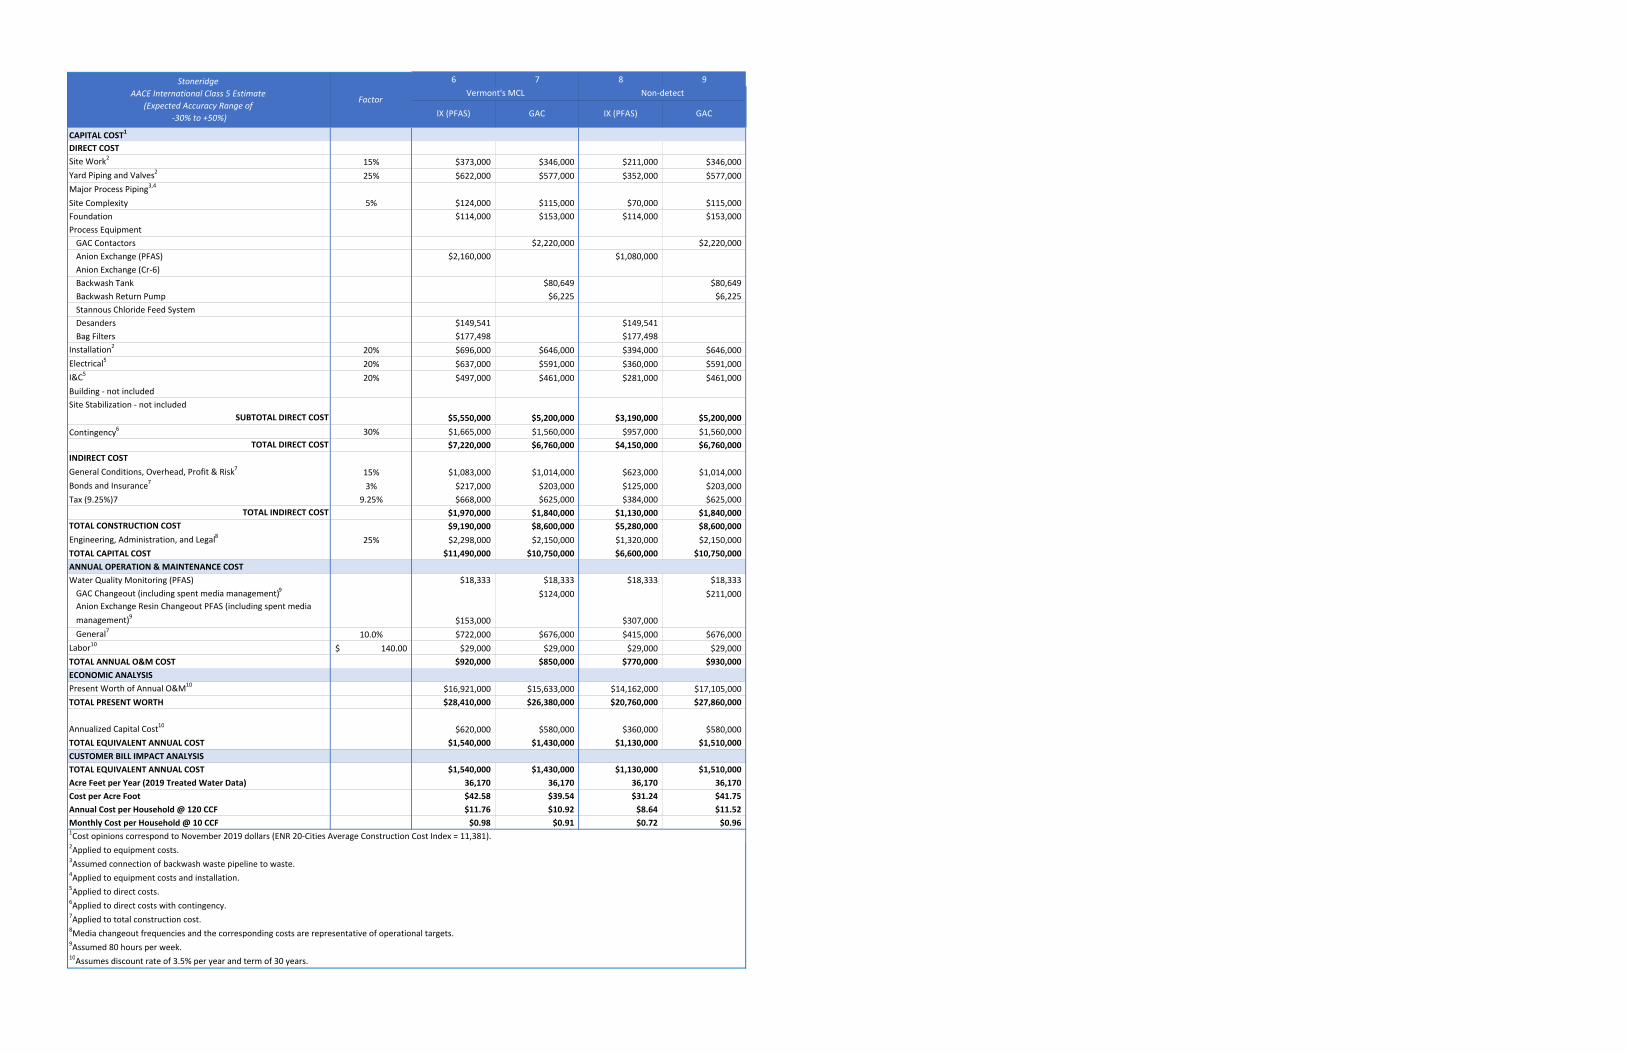
6 7 8 9
CAPITAL COST1
DIRECT COST
Site Work2
15% $373,000 $346,000 $211,000 $346,000
Yard Piping and Valves2
25% $622,000 $577,000 $352,000 $577,000
Major Process Piping3,4
Site Complexity 5% $124,000 $115,000 $70,000 $115,000
Foundation $114,000 $153,000 $114,000 $153,000
Process Equipment
GAC Contactors $2,220,000 $2,220,000
Anion Exchange (PFAS) $2,160,000 $1,080,000
Anion Exchange (Cr-6)
Backwash Tank $80,649 $80,649
Backwash Return Pump $6,225 $6,225
Stannous Chloride Feed System
Desanders $149,541 $149,541
Bag Filters $177,498 $177,498
Installation2
20% $696,000 $646,000 $394,000 $646,000
Electrical5
20% $637,000 $591,000 $360,000 $591,000
I&C5
20% $497,000 $461,000 $281,000 $461,000
Building - not included
Site Stabilization - not included
SUBTOTAL DIRECT COST $5,550,000 $5,200,000 $3,190,000 $5,200,000
Contingency6 30% $1,665,000 $1,560,000 $957,000 $1,560,000
TOTAL DIRECT COST $7,220,000 $6,760,000 $4,150,000 $6,760,000
INDIRECT COST
General Conditions, Overhead, Profit & Risk7
15% $1,083,000 $1,014,000 $623,000 $1,014,000
Bonds and Insurance7
3% $217,000 $203,000 $125,000 $203,000
Tax (9.25%)7 9.25% $668,000 $625,000 $384,000 $625,000
TOTAL INDIRECT COST $1,970,000 $1,840,000 $1,130,000 $1,840,000
TOTAL CONSTRUCTION COST $9,190,000 $8,600,000 $5,280,000 $8,600,000
Engineering, Administration, and Legal8
25% $2,298,000 $2,150,000 $1,320,000 $2,150,000
TOTAL CAPITAL COST $11,490,000 $10,750,000 $6,600,000 $10,750,000
ANNUAL OPERATION & MAINTENANCE COST
Water Quality Monitoring (PFAS) $18,333 $18,333 $18,333 $18,333
GAC Changeout (including spent media management)9
$124,000 $211,000
Anion Exchange Resin Changeout PFAS (including spent media
management)9
$153,000 $307,000
General7
10.0% $722,000 $676,000 $415,000 $676,000
Labor10
140.00$ $29,000 $29,000 $29,000 $29,000
TOTAL ANNUAL O&M COST $920,000 $850,000 $770,000 $930,000
ECONOMIC ANALYSIS
Present Worth of Annual O&M10
$16,921,000 $15,633,000 $14,162,000 $17,105,000
TOTAL PRESENT WORTH $28,410,000 $26,380,000 $20,760,000 $27,860,000
Annualized Capital Cost10
$620,000 $580,000 $360,000 $580,000
TOTAL EQUIVALENT ANNUAL COST $1,540,000 $1,430,000 $1,130,000 $1,510,000
CUSTOMER BILL IMPACT ANALYSIS
TOTAL EQUIVALENT ANNUAL COST $1,540,000 $1,430,000 $1,130,000 $1,510,000
Acre Feet per Year (2019 Treated Water Data) 36,170 36,170 36,170 36,170
Cost per Acre Foot $42.58 $39.54 $31.24 $41.75
Annual Cost per Household @ 120 CCF $11.76 $10.92 $8.64 $11.52
Monthly Cost per Household @ 10 CCF $0.98 $0.91 $0.72 $0.961Cost opinions correspond to November 2019 dollars (ENR 20-Cities Average Construction Cost Index = 11,381).
2Applied to equipment costs.
3Assumed connection of backwash waste pipeline to waste.
4Applied to equipment costs and installation.
5Applied to direct costs.
6Applied to direct costs with contingency.
7Applied to total construction cost.
8Media changeout frequencies and the corresponding costs are representative of operational targets.
9Assumed 80 hours per week.
10Assumes discount rate of 3.5% per year and term of 30 years.
Stoneridge
AACE International Class 5 Estimate
(Expected Accuracy Range of
-30% to +50%)
FactorNon-detect
IX (PFAS)IX (PFAS) GAC
Vermont's MCL
GAC
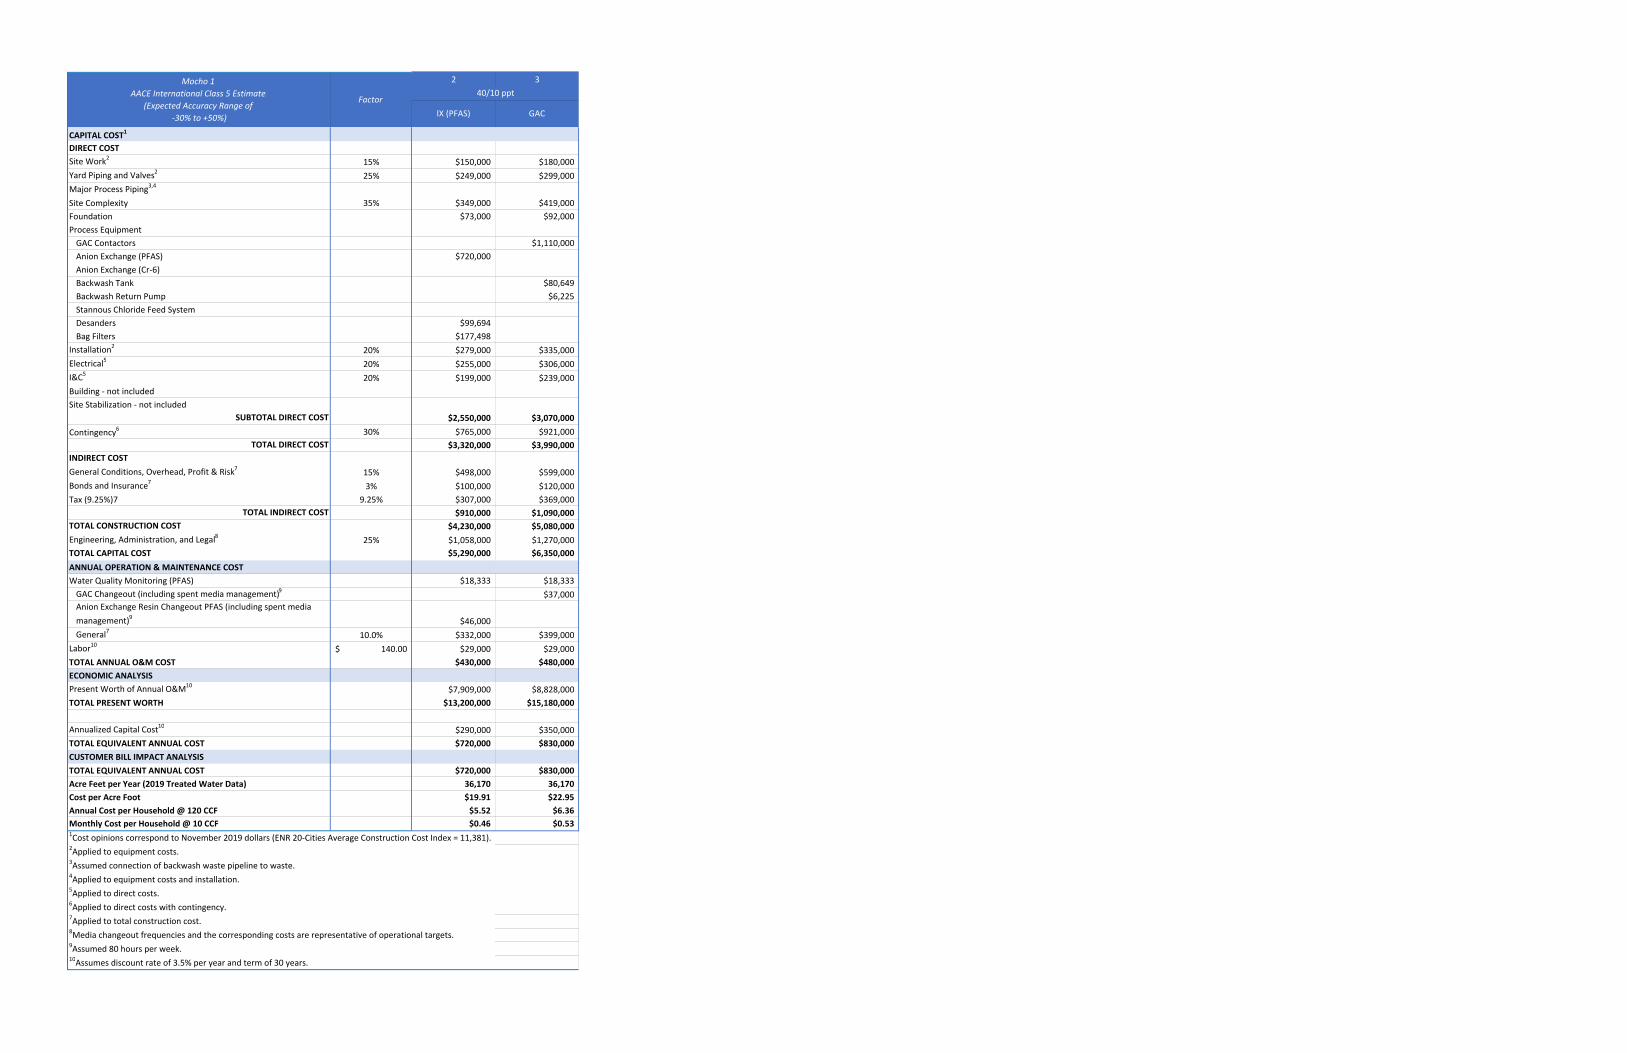
2 3
CAPITAL COST1
DIRECT COST
Site Work2
15% $150,000 $180,000
Yard Piping and Valves2
25% $249,000 $299,000
Major Process Piping3,4
Site Complexity 35% $349,000 $419,000
Foundation $73,000 $92,000
Process Equipment
GAC Contactors $1,110,000
Anion Exchange (PFAS) $720,000
Anion Exchange (Cr-6)
Backwash Tank $80,649
Backwash Return Pump $6,225
Stannous Chloride Feed System
Desanders $99,694
Bag Filters $177,498
Installation2
20% $279,000 $335,000
Electrical5
20% $255,000 $306,000
I&C5
20% $199,000 $239,000
Building - not included
Site Stabilization - not included
SUBTOTAL DIRECT COST $2,550,000 $3,070,000
Contingency6 30% $765,000 $921,000
TOTAL DIRECT COST $3,320,000 $3,990,000
INDIRECT COST
General Conditions, Overhead, Profit & Risk7
15% $498,000 $599,000
Bonds and Insurance7
3% $100,000 $120,000
Tax (9.25%)7 9.25% $307,000 $369,000
TOTAL INDIRECT COST $910,000 $1,090,000
TOTAL CONSTRUCTION COST $4,230,000 $5,080,000
Engineering, Administration, and Legal8
25% $1,058,000 $1,270,000
TOTAL CAPITAL COST $5,290,000 $6,350,000
ANNUAL OPERATION & MAINTENANCE COST
Water Quality Monitoring (PFAS) $18,333 $18,333
GAC Changeout (including spent media management)9
$37,000
Anion Exchange Resin Changeout PFAS (including spent media
management)9
$46,000
General7
10.0% $332,000 $399,000
Labor10
140.00$ $29,000 $29,000
TOTAL ANNUAL O&M COST $430,000 $480,000
ECONOMIC ANALYSIS
Present Worth of Annual O&M10
$7,909,000 $8,828,000
TOTAL PRESENT WORTH $13,200,000 $15,180,000
Annualized Capital Cost10
$290,000 $350,000
TOTAL EQUIVALENT ANNUAL COST $720,000 $830,000
CUSTOMER BILL IMPACT ANALYSIS
TOTAL EQUIVALENT ANNUAL COST $720,000 $830,000
Acre Feet per Year (2019 Treated Water Data) 36,170 36,170
Cost per Acre Foot $19.91 $22.95
Annual Cost per Household @ 120 CCF $5.52 $6.36
Monthly Cost per Household @ 10 CCF $0.46 $0.531Cost opinions correspond to November 2019 dollars (ENR 20-Cities Average Construction Cost Index = 11,381).
2Applied to equipment costs.
3Assumed connection of backwash waste pipeline to waste.
4Applied to equipment costs and installation.
5Applied to direct costs.
6Applied to direct costs with contingency.
7Applied to total construction cost.
8Media changeout frequencies and the corresponding costs are representative of operational targets.
9Assumed 80 hours per week.
10Assumes discount rate of 3.5% per year and term of 30 years.
GAC
Mocho 1
AACE International Class 5 Estimate
(Expected Accuracy Range of
-30% to +50%)
Factor40/10 ppt
IX (PFAS)

2 3
CAPITAL COST1
DIRECT COST
Site Work2
15% $150,000 $180,000
Yard Piping and Valves2
25% $249,000 $299,000
Major Process Piping3,4
Site Complexity 25% $249,000 $299,000
Foundation $73,000 $92,000
Process Equipment
GAC Contactors $1,110,000
Anion Exchange (PFAS) $720,000
Anion Exchange (Cr-6)
Backwash Tank $80,649
Backwash Return Pump $6,225
Stannous Chloride Feed System
Desanders $99,694
Bag Filters $177,498
Installation2
20% $279,000 $335,000
Electrical5
20% $255,000 $306,000
I&C5
20% $199,000 $239,000
Building - not included
Site Stabilization - not included
SUBTOTAL DIRECT COST $2,450,000 $2,950,000
Contingency6 30% $735,000 $885,000
TOTAL DIRECT COST $3,190,000 $3,840,000
INDIRECT COST
General Conditions, Overhead, Profit & Risk7
15% $479,000 $576,000
Bonds and Insurance7
3% $96,000 $115,000
Tax (9.25%)7 9.25% $295,000 $355,000
TOTAL INDIRECT COST $870,000 $1,050,000
TOTAL CONSTRUCTION COST $4,060,000 $4,890,000
Engineering, Administration, and Legal8
25% $1,015,000 $1,223,000
TOTAL CAPITAL COST $5,080,000 $6,110,000
ANNUAL OPERATION & MAINTENANCE COST
Water Quality Monitoring (PFAS) $18,333 $18,333
GAC Changeout (including spent media management)9
$37,000
Anion Exchange Resin Changeout PFAS (including spent media
management)9
$46,000
General7
10.0% $319,000 $384,000
Labor10
140.00$ $29,000 $29,000
TOTAL ANNUAL O&M COST $410,000 $470,000
ECONOMIC ANALYSIS
Present Worth of Annual O&M10
$7,541,000 $8,644,000
TOTAL PRESENT WORTH $12,620,000 $14,750,000
Annualized Capital Cost10
$280,000 $330,000
TOTAL EQUIVALENT ANNUAL COST $690,000 $800,000
CUSTOMER BILL IMPACT ANALYSIS
TOTAL EQUIVALENT ANNUAL COST $690,000 $800,000
Acre Feet per Year (2019 Treated Water Data) 36,170 36,170
Cost per Acre Foot $19.08 $22.12
Annual Cost per Household @ 120 CCF $5.28 $6.12
Monthly Cost per Household @ 10 CCF $0.44 $0.511Cost opinions correspond to November 2019 dollars (ENR 20-Cities Average Construction Cost Index = 11,381).
2Applied to equipment costs.
3Assumed connection of backwash waste pipeline to waste.
4Applied to equipment costs and installation.
5Applied to direct costs.
6Applied to direct costs with contingency.
7Applied to total construction cost.
8Media changeout frequencies and the corresponding costs are representative of operational targets.
9Assumed 80 hours per week.
10Assumes discount rate of 3.5% per year and term of 30 years.
Mocho 2
AACE International Class 5 Estimate
(Expected Accuracy Range of
-30% to +50%)
Factor40/10 ppt
IX (PFAS) GAC

2 3
CAPITAL COST1
DIRECT COST
Site Work2
15% $274,000 $346,000
Yard Piping and Valves2
25% $457,000 $577,000
Major Process Piping3,4
Site Complexity 5% $91,000 $115,000
Foundation $114,000 $92,000
Process Equipment
GAC Contactors $2,220,000
Anion Exchange (PFAS) $1,440,000
Anion Exchange (Cr-6)
Backwash Tank $80,649
Backwash Return Pump $6,225
Stannous Chloride Feed System
Desanders $149,541
Bag Filters $236,664
Installation2
20% $511,000 $646,000
Electrical5
20% $467,000 $591,000
I&C5
20% $365,000 $461,000
Building - not included
Site Stabilization - not included
SUBTOTAL DIRECT COST $4,110,000 $5,130,000
Contingency6 30% $1,233,000 $1,539,000
TOTAL DIRECT COST $5,340,000 $6,670,000
INDIRECT COST
General Conditions, Overhead, Profit & Risk7
15% $801,000 $1,001,000
Bonds and Insurance7
3% $160,000 $200,000
Tax (9.25%)7 9.25% $494,000 $617,000
TOTAL INDIRECT COST $1,460,000 $1,820,000
TOTAL CONSTRUCTION COST $6,800,000 $8,490,000
Engineering, Administration, and Legal8
25% $1,700,000 $2,123,000
TOTAL CAPITAL COST $8,500,000 $10,610,000
ANNUAL OPERATION & MAINTENANCE COST
Water Quality Monitoring (PFAS) $18,333 $18,333
GAC Changeout (including spent media management)9
$74,000
Anion Exchange Resin Changeout PFAS (including spent media
management)9
$92,000
General7
10.0% $534,000 $667,000
Labor10
140.00$ $29,000 $29,000
TOTAL ANNUAL O&M COST $670,000 $790,000
ECONOMIC ANALYSIS
Present Worth of Annual O&M10
$12,323,000 $14,530,000
TOTAL PRESENT WORTH $20,820,000 $25,140,000
Annualized Capital Cost10
$460,000 $580,000
TOTAL EQUIVALENT ANNUAL COST $1,130,000 $1,370,000
CUSTOMER BILL IMPACT ANALYSIS
TOTAL EQUIVALENT ANNUAL COST $1,130,000 $1,370,000
Acre Feet per Year (2019 Treated Water Data) 36,170 36,170
Cost per Acre Foot $31.24 $37.88
Annual Cost per Household @ 120 CCF $8.64 $10.44
Monthly Cost per Household @ 10 CCF $0.72 $0.871Cost opinions correspond to November 2019 dollars (ENR 20-Cities Average Construction Cost Index = 11,381).
2Applied to equipment costs.
3Assumed connection of backwash waste pipeline to waste.
4Applied to equipment costs and installation.
5Applied to direct costs.
6Applied to direct costs with contingency.
7Applied to total construction cost.
8Media changeout frequencies and the corresponding costs are representative of operational targets.
9Assumed 80 hours per week.
10Assumes discount rate of 3.5% per year and term of 30 years.
Mocho 1+2
AACE International Class 5 Estimate
(Expected Accuracy Range of
-30% to +50%)
Factor40/10 ppt
IX (PFAS) GAC
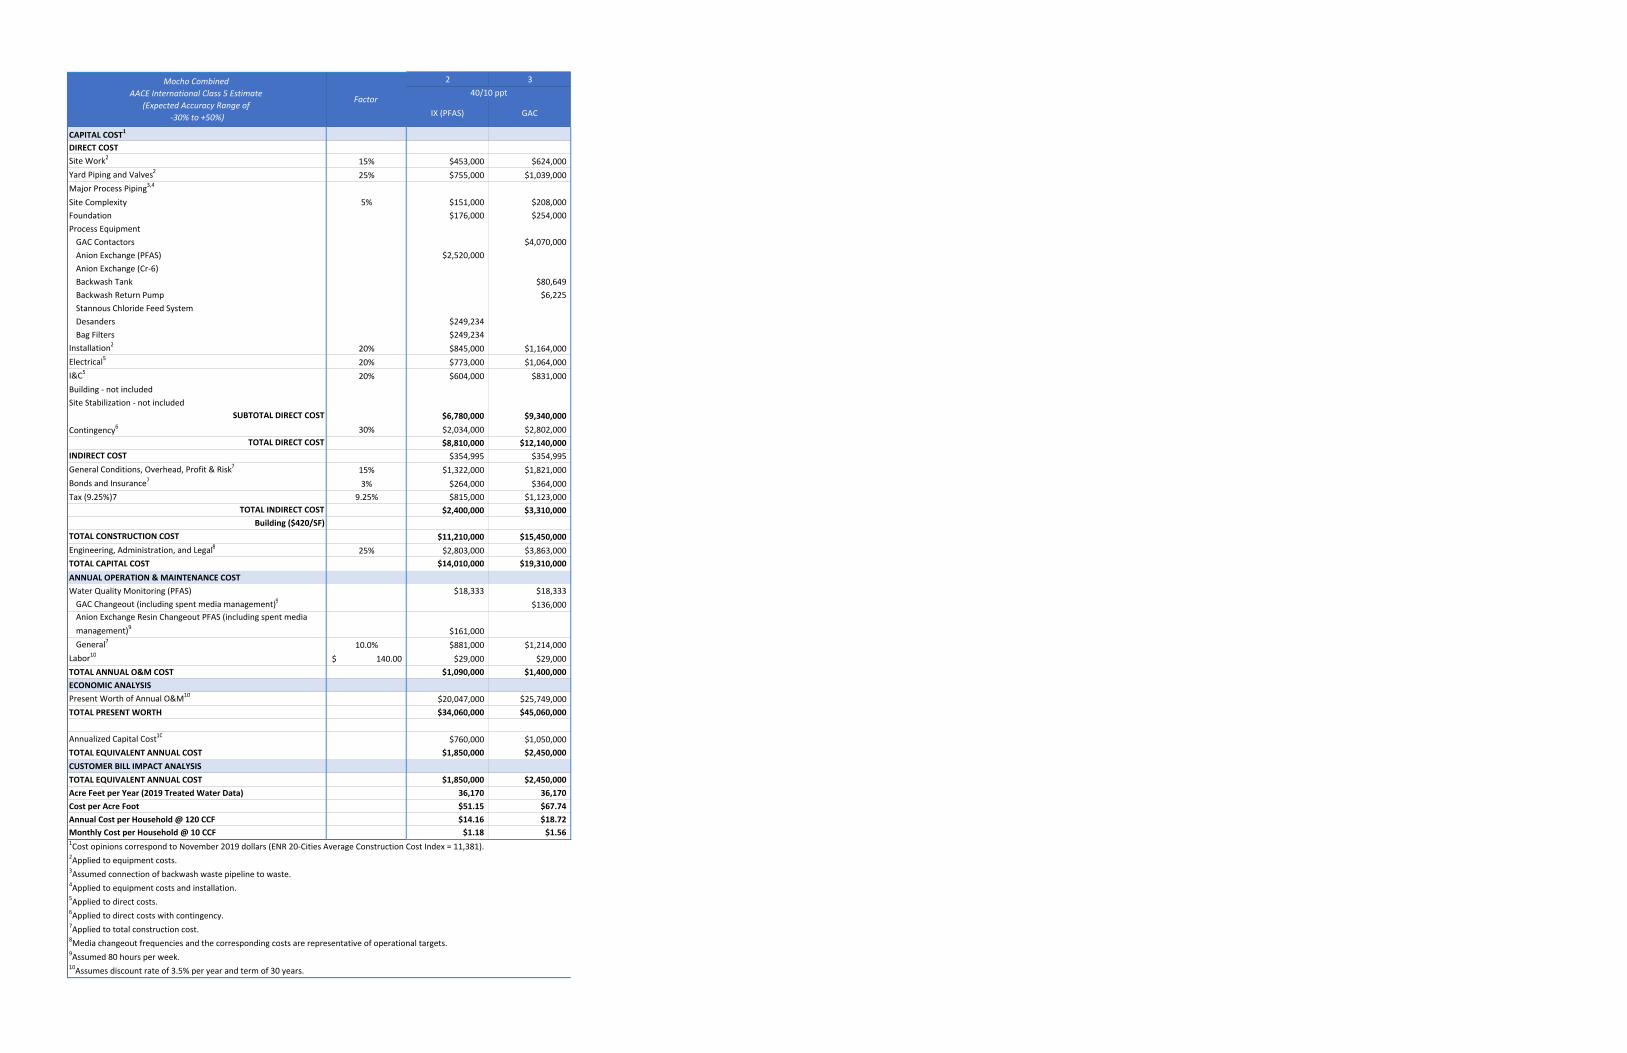
2 3
CAPITAL COST1
DIRECT COST
Site Work2
15% $453,000 $624,000
Yard Piping and Valves2
25% $755,000 $1,039,000
Major Process Piping3,4
Site Complexity 5% $151,000 $208,000
Foundation $176,000 $254,000
Process Equipment
GAC Contactors $4,070,000
Anion Exchange (PFAS) $2,520,000
Anion Exchange (Cr-6)
Backwash Tank $80,649
Backwash Return Pump $6,225
Stannous Chloride Feed System
Desanders $249,234
Bag Filters $249,234
Installation2
20% $845,000 $1,164,000
Electrical5
20% $773,000 $1,064,000
I&C5
20% $604,000 $831,000
Building - not included
Site Stabilization - not included
SUBTOTAL DIRECT COST $6,780,000 $9,340,000
Contingency6 30% $2,034,000 $2,802,000
TOTAL DIRECT COST $8,810,000 $12,140,000
INDIRECT COST $354,995 $354,995
General Conditions, Overhead, Profit & Risk7
15% $1,322,000 $1,821,000
Bonds and Insurance7
3% $264,000 $364,000
Tax (9.25%)7 9.25% $815,000 $1,123,000
TOTAL INDIRECT COST $2,400,000 $3,310,000
Building ($420/SF)
TOTAL CONSTRUCTION COST $11,210,000 $15,450,000
Engineering, Administration, and Legal8
25% $2,803,000 $3,863,000
TOTAL CAPITAL COST $14,010,000 $19,310,000
ANNUAL OPERATION & MAINTENANCE COST
Water Quality Monitoring (PFAS) $18,333 $18,333
GAC Changeout (including spent media management)9
$136,000
Anion Exchange Resin Changeout PFAS (including spent media
management)9
$161,000
General7
10.0% $881,000 $1,214,000
Labor10
140.00$ $29,000 $29,000
TOTAL ANNUAL O&M COST $1,090,000 $1,400,000
ECONOMIC ANALYSIS
Present Worth of Annual O&M10
$20,047,000 $25,749,000
TOTAL PRESENT WORTH $34,060,000 $45,060,000
Annualized Capital Cost10
$760,000 $1,050,000
TOTAL EQUIVALENT ANNUAL COST $1,850,000 $2,450,000
CUSTOMER BILL IMPACT ANALYSIS
TOTAL EQUIVALENT ANNUAL COST $1,850,000 $2,450,000
Acre Feet per Year (2019 Treated Water Data) 36,170 36,170
Cost per Acre Foot $51.15 $67.74
Annual Cost per Household @ 120 CCF $14.16 $18.72
Monthly Cost per Household @ 10 CCF $1.18 $1.561Cost opinions correspond to November 2019 dollars (ENR 20-Cities Average Construction Cost Index = 11,381).
2Applied to equipment costs.
3Assumed connection of backwash waste pipeline to waste.
4Applied to equipment costs and installation.
5Applied to direct costs.
6Applied to direct costs with contingency.
7Applied to total construction cost.
8Media changeout frequencies and the corresponding costs are representative of operational targets.
9Assumed 80 hours per week.
10Assumes discount rate of 3.5% per year and term of 30 years.
Mocho Combined
AACE International Class 5 Estimate
(Expected Accuracy Range of
-30% to +50%)
Factor40/10 ppt
IX (PFAS) GAC

PROJECT: Scenario 1: COL 1
JOB NO.: Zone 7
DATE: 3/4/2020
BY: E.Hull
COMMENTS:
SUMMARY OF COSTSTreatment 1: 40/10 ppt
PFOs/PFOA
Treatment 2: 32/8 ppt
PFOs/PFOA
No Treatment Needed
$21,300,000
4,260,000
$25,560,000
1,798,000
215,000
11,090
351,990
$2,376,080
3.6
4,002
1,001
Unit Capital Cost ($/gpd) $7.15
$7.29$2,375
1. Interest rate based upon FY2006 State Revolving Loan Interest Rates
2. Based upon 91 days of operation per year.
Indirect Costs
CAPITAL COSTS
RO Water Treatment Plant
Engineering & Contingencies (20%)
Total Project Cost
ANNUAL COSTS
Ammortized Annual Cost (3.5% for 20 Years) 1
Operation and Maintenance:
Water Treatment Plant Energy Cost
Chemicals
Unit Cost of Water ($ per 1,000 gallons) 2
Unit Cost of Water ($ per acft) 2
Total Annual Cost
Available Project Yield, MGD
Available Project Yield, AF/yr
Actual Project Yield, AF/yr 2
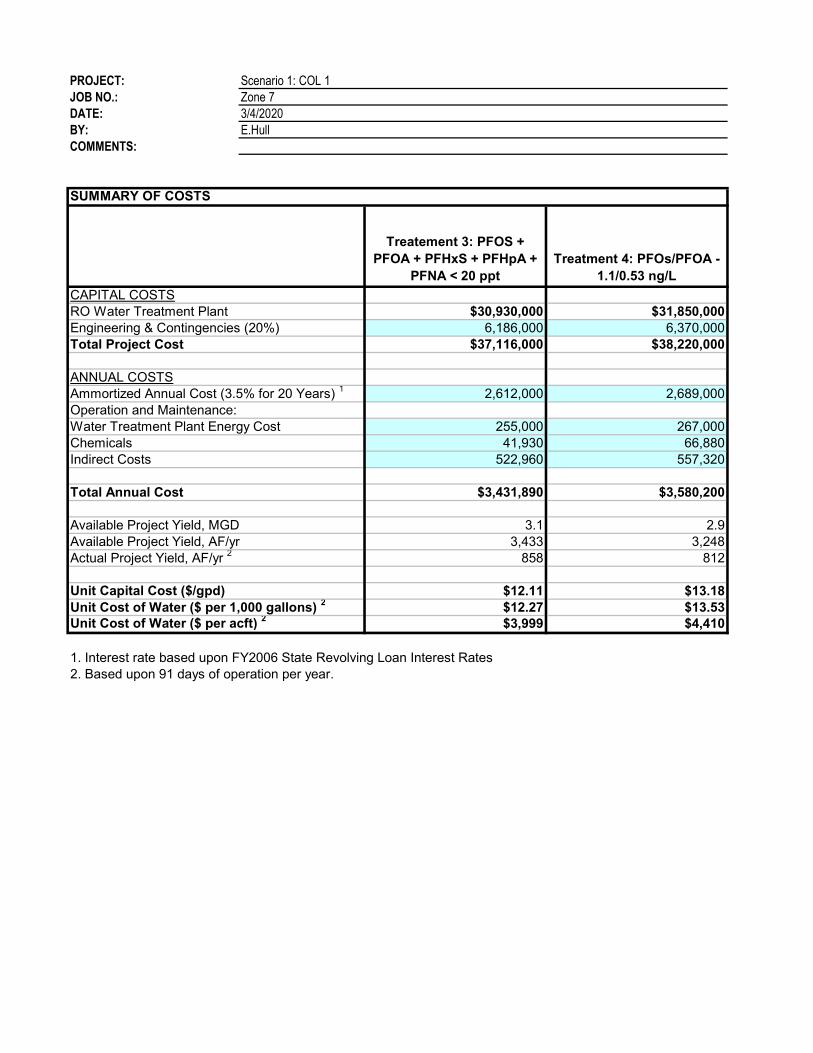
PROJECT: Scenario 1: COL 1JOB NO.: Zone 7DATE: 3/4/2020BY: E.HullCOMMENTS:
SUMMARY OF COSTS
Treatement 3: PFOS + PFOA + PFHxS + PFHpA +
PFNA < 20 pptTreatment 4: PFOs/PFOA -
1.1/0.53 ng/L
$30,930,000 $31,850,0006,186,000 6,370,000
$37,116,000 $38,220,000
2,612,000 2,689,000
255,000 267,00041,930 66,880
522,960 557,320
$3,431,890 $3,580,200
3.1 2.93,433 3,248
858 812
Unit Capital Cost ($/gpd) $12.11 $13.18$12.27 $13.53$3,999 $4,410
1. Interest rate based upon FY2006 State Revolving Loan Interest Rates2. Based upon 91 days of operation per year.
Indirect Costs
CAPITAL COSTSRO Water Treatment PlantEngineering & Contingencies (20%)Total Project Cost
ANNUAL COSTSAmmortized Annual Cost (3.5% for 20 Years) 1
Operation and Maintenance: Water Treatment Plant Energy CostChemicals
Unit Cost of Water ($ per 1,000 gallons) 2
Unit Cost of Water ($ per acft) 2
Total Annual Cost
Available Project Yield, MGDAvailable Project Yield, AF/yrActual Project Yield, AF/yr 2

PROJECT: Scenario 1: COL 1
JOB NO.: Zone 7
DATE: 3/4/2020
BY: E.Hull
COMMENTS:
OPTION A: Treatment 1: 40/10 ppt PFOs/PFOA
CAPITAL COST ESTIMATE
Classification Quantity Units Unit Cost Extended Cost
Land
Raw Water Pipeline 1
Desanders
Building 2
RO Equipment 3
Chemical Storage/Feed System
Scale Inhibitor
Caustic Soda
Calcium Chloride
Ammonia
Sodium Hypochlorite
Degasifiers
High Service Pump Station
High Service Pump Reservoir 4
Yard Piping
Concentrate Pipeline 1
Process Electrical
Standby Power for RO WTP
Process Instrumentation
Site Work 5
Subtotal
Contingency (30%)
TOTAL CONSTRUCTION COSTS 6
Engineering and Contract Administration (20%)
TOTAL PROJECT COST 7
No Treatment Needed
1. Open trench construction, assumes public right of way, and does not include trenchless intersection crossings.
2. Includes general building HVAC, plumbing, and electrical. Unit price based on pre-engineered metal
building type construction. Unit price based on usable square footage.
3. Includes membrane skids, piping, pressure vessels, membranes, CIP system, cartridge filters
and on-skid instrumentation & control.
4. Includes bypass flow rate pumping.
5. Includes demolition, excavation, paving, sidewalks, landscaping and general site improvements.
6. ENR Construction Cost Index (20-City average, January 2020): 11,392
7. This is a class 4 Budget Estimate as defined by the AACEI's Revised Classification (1999) with an expected accuracy
range of + 30 percent or - 15 percent. This cost estimate is based upon the Engineer's perception of current conditions
in the project area and is subject to change as variances in the cost of labor, materials, equipment, services provided
by others or economic conditions occur. Since the Engineer has no control over these factors, he cannot warrant or
guarantee that actual bids will not vary from the costs presented herein. This estimate does, however, reflect the Engineer's
professional opinion of accurate costs at this time.

PROJECT: Scenario 1: COL 1
JOB NO.: Zone 7
DATE: 3/4/2020
BY: E.Hull
COMMENTS:
OPTION B: Treatment 2: 32/8 ppt PFOs/PFOA
CAPITAL COST ESTIMATE
Classification Quantity Units Unit Cost Extended Cost
Land 1
1 LS $ 11,300 $ 11,300
Raw Water Pipeline 2
300 LF $ 269 $ 80,769
Desanders 1 LS $ 150,000 $ 150,000
Building 3
4,000 SF 450$ $ 1,800,000
RO Equipment 4
0.1 MGD 1,000,000$ $ 109,000
Chemical Storage/Feed System
Scale Inhibitor 1 LS 35,000$ $ 35,000
Caustic Soda 1 LS 40,000$ $ 40,000
Calcium Chloride 1 LS 40,000$ $ 40,000
Ammonia 1 LS 35,000$ $ 35,000
Sodium Hypochlorite 1 LS 40,000$ $ 40,000
Degasifiers 1 LS 100,000$ $ 100,000
High Service Pump Station 1 LS 1,750,000$ $ 1,750,000
High Service Pump Reservoir 5
1,000,000 GALLON 2.00$ $ 2,000,000
Yard Piping 1 LS $ 350,000 $ 350,000
Concentrate Pipeline 2
24,900 LF 192$ $ 4,788,462
Process Electrical 1 LS 2,500,000$ $ 2,500,000
Standby Power for RO WTP 1 LS 850,000$ $ 850,000
Process Instrumentation 1 LS 1,400,000$ $ 1,400,000
Site Work 6
1 LS 300,000$ $ 300,000
Subtotal 16,380,000$ Contingency (30%) 4,920,000$
TOTAL CONSTRUCTION COSTS 7
21,300,000$
Engineering and Contract Administration (20%) 4,260,000$
TOTAL PROJECT COST 8
25,560,000$
1. Assessed value of parcel 946-1350-3-10
2. Open trench construction, assumes public right of way, and does not include trenchless intersection crossings.
3. Includes general building HVAC, plumbing, and electrical. Unit price based on pre-engineered metal
building type construction. Unit price based on usable square footage.
4. Includes membrane skids, piping, pressure vessels, membranes, CIP system, cartridge filters
and on-skid instrumentation & control.
5. Includes bypass flow rate pumping.
6. Includes demolition, excavation, paving, sidewalks, landscaping and general site improvements.
7. ENR Construction Cost Index (20-City average, January 2020): 11,392
8. This is a class 4 Budget Estimate as defined by the AACEI's Revised Classification (1999) with an expected accuracy
range of + 30 percent or - 15 percent. This cost estimate is based upon the Engineer's perception of current conditions
in the project area and is subject to change as variances in the cost of labor, materials, equipment, services provided
by others or economic conditions occur. Since the Engineer has no control over these factors, he cannot warrant or
guarantee that actual bids will not vary from the costs presented herein. This estimate does, however, reflect the Engineer's
professional opinion of accurate costs at this time.
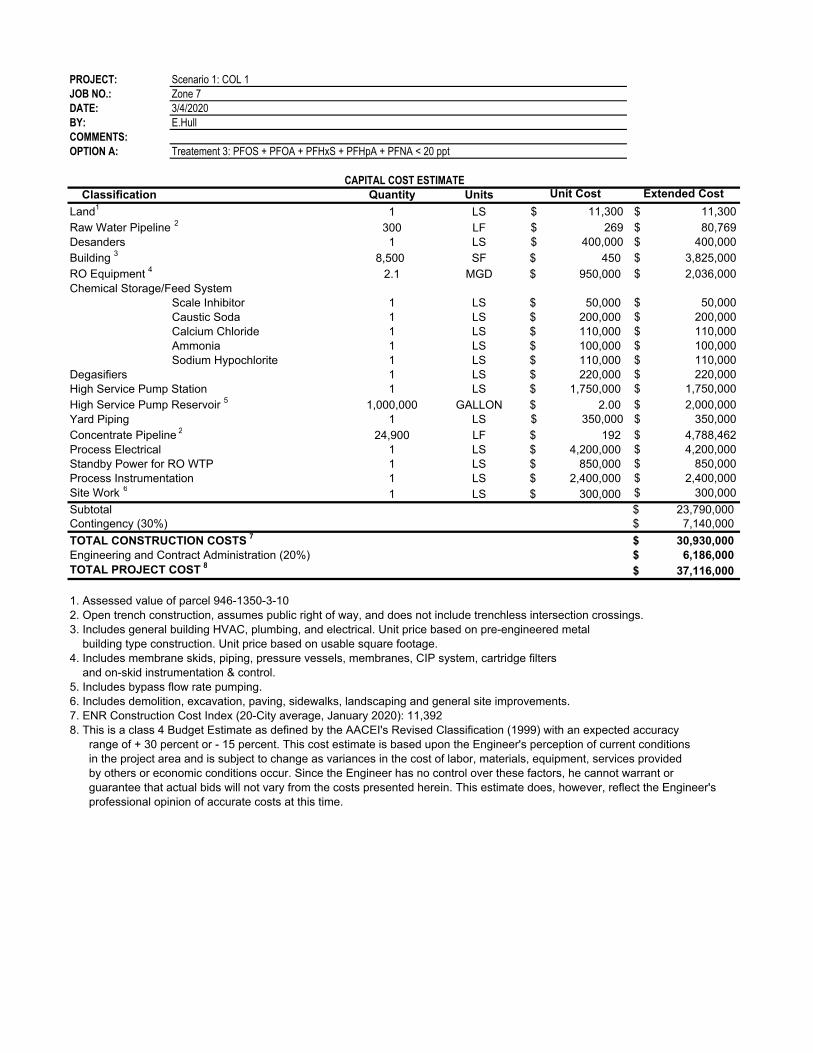
PROJECT: Scenario 1: COL 1
JOB NO.: Zone 7
DATE: 3/4/2020
BY: E.Hull
COMMENTS:
OPTION A: Treatement 3: PFOS + PFOA + PFHxS + PFHpA + PFNA < 20 ppt
CAPITAL COST ESTIMATE
Classification Quantity Units Unit Cost Extended Cost
Land1
1 LS $ 11,300 $ 11,300
Raw Water Pipeline 2
300 LF $ 269 $ 80,769
Desanders 1 LS $ 400,000 $ 400,000
Building 3
8,500 SF 450$ $ 3,825,000
RO Equipment 4
2.1 MGD 950,000$ $ 2,036,000
Chemical Storage/Feed System
Scale Inhibitor 1 LS 50,000$ $ 50,000
Caustic Soda 1 LS 200,000$ $ 200,000
Calcium Chloride 1 LS 110,000$ $ 110,000
Ammonia 1 LS 100,000$ $ 100,000
Sodium Hypochlorite 1 LS 110,000$ $ 110,000
Degasifiers 1 LS 220,000$ $ 220,000
High Service Pump Station 1 LS 1,750,000$ $ 1,750,000
High Service Pump Reservoir 5
1,000,000 GALLON 2.00$ $ 2,000,000
Yard Piping 1 LS $ 350,000 $ 350,000
Concentrate Pipeline 2
24,900 LF 192$ $ 4,788,462
Process Electrical 1 LS 4,200,000$ $ 4,200,000
Standby Power for RO WTP 1 LS 850,000$ $ 850,000
Process Instrumentation 1 LS 2,400,000$ $ 2,400,000
Site Work 6
1 LS 300,000$ $ 300,000
Subtotal 23,790,000$ Contingency (30%) 7,140,000$
TOTAL CONSTRUCTION COSTS 7
30,930,000$
Engineering and Contract Administration (20%) 6,186,000$
TOTAL PROJECT COST 8
37,116,000$
1. Assessed value of parcel 946-1350-3-10
2. Open trench construction, assumes public right of way, and does not include trenchless intersection crossings.
3. Includes general building HVAC, plumbing, and electrical. Unit price based on pre-engineered metal
building type construction. Unit price based on usable square footage.
4. Includes membrane skids, piping, pressure vessels, membranes, CIP system, cartridge filters
and on-skid instrumentation & control.
5. Includes bypass flow rate pumping.
6. Includes demolition, excavation, paving, sidewalks, landscaping and general site improvements.
7. ENR Construction Cost Index (20-City average, January 2020): 11,392
8. This is a class 4 Budget Estimate as defined by the AACEI's Revised Classification (1999) with an expected accuracy
range of + 30 percent or - 15 percent. This cost estimate is based upon the Engineer's perception of current conditions
in the project area and is subject to change as variances in the cost of labor, materials, equipment, services provided
by others or economic conditions occur. Since the Engineer has no control over these factors, he cannot warrant or
guarantee that actual bids will not vary from the costs presented herein. This estimate does, however, reflect the Engineer's
professional opinion of accurate costs at this time.
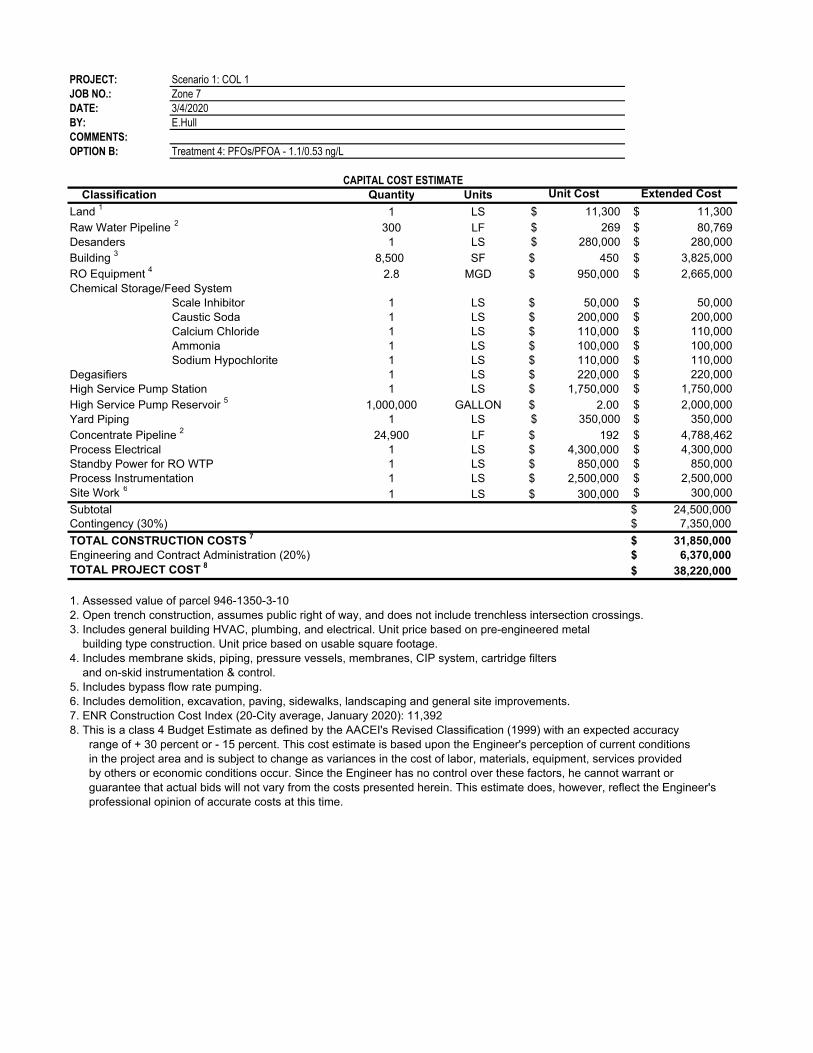
PROJECT: Scenario 1: COL 1
JOB NO.: Zone 7
DATE: 3/4/2020
BY: E.Hull
COMMENTS:
OPTION B: Treatment 4: PFOs/PFOA - 1.1/0.53 ng/L
CAPITAL COST ESTIMATE
Classification Quantity Units Unit Cost Extended Cost
Land 1
1 LS $ 11,300 $ 11,300
Raw Water Pipeline 2
300 LF $ 269 $ 80,769
Desanders 1 LS $ 280,000 $ 280,000
Building 3
8,500 SF 450$ $ 3,825,000
RO Equipment 4
2.8 MGD 950,000$ $ 2,665,000
Chemical Storage/Feed System
Scale Inhibitor 1 LS 50,000$ $ 50,000
Caustic Soda 1 LS 200,000$ $ 200,000
Calcium Chloride 1 LS 110,000$ $ 110,000
Ammonia 1 LS 100,000$ $ 100,000
Sodium Hypochlorite 1 LS 110,000$ $ 110,000
Degasifiers 1 LS 220,000$ $ 220,000
High Service Pump Station 1 LS 1,750,000$ $ 1,750,000
High Service Pump Reservoir 5
1,000,000 GALLON 2.00$ $ 2,000,000
Yard Piping 1 LS $ 350,000 $ 350,000
Concentrate Pipeline 2
24,900 LF 192$ $ 4,788,462
Process Electrical 1 LS 4,300,000$ $ 4,300,000
Standby Power for RO WTP 1 LS 850,000$ $ 850,000
Process Instrumentation 1 LS 2,500,000$ $ 2,500,000
Site Work 6
1 LS 300,000$ $ 300,000
Subtotal 24,500,000$ Contingency (30%) 7,350,000$
TOTAL CONSTRUCTION COSTS 7
31,850,000$
Engineering and Contract Administration (20%) 6,370,000$
TOTAL PROJECT COST 8
38,220,000$
1. Assessed value of parcel 946-1350-3-10
2. Open trench construction, assumes public right of way, and does not include trenchless intersection crossings.
3. Includes general building HVAC, plumbing, and electrical. Unit price based on pre-engineered metal
building type construction. Unit price based on usable square footage.
4. Includes membrane skids, piping, pressure vessels, membranes, CIP system, cartridge filters
and on-skid instrumentation & control.
5. Includes bypass flow rate pumping.
6. Includes demolition, excavation, paving, sidewalks, landscaping and general site improvements.
7. ENR Construction Cost Index (20-City average, January 2020): 11,392
8. This is a class 4 Budget Estimate as defined by the AACEI's Revised Classification (1999) with an expected accuracy
range of + 30 percent or - 15 percent. This cost estimate is based upon the Engineer's perception of current conditions
in the project area and is subject to change as variances in the cost of labor, materials, equipment, services provided
by others or economic conditions occur. Since the Engineer has no control over these factors, he cannot warrant or
guarantee that actual bids will not vary from the costs presented herein. This estimate does, however, reflect the Engineer's
professional opinion of accurate costs at this time.
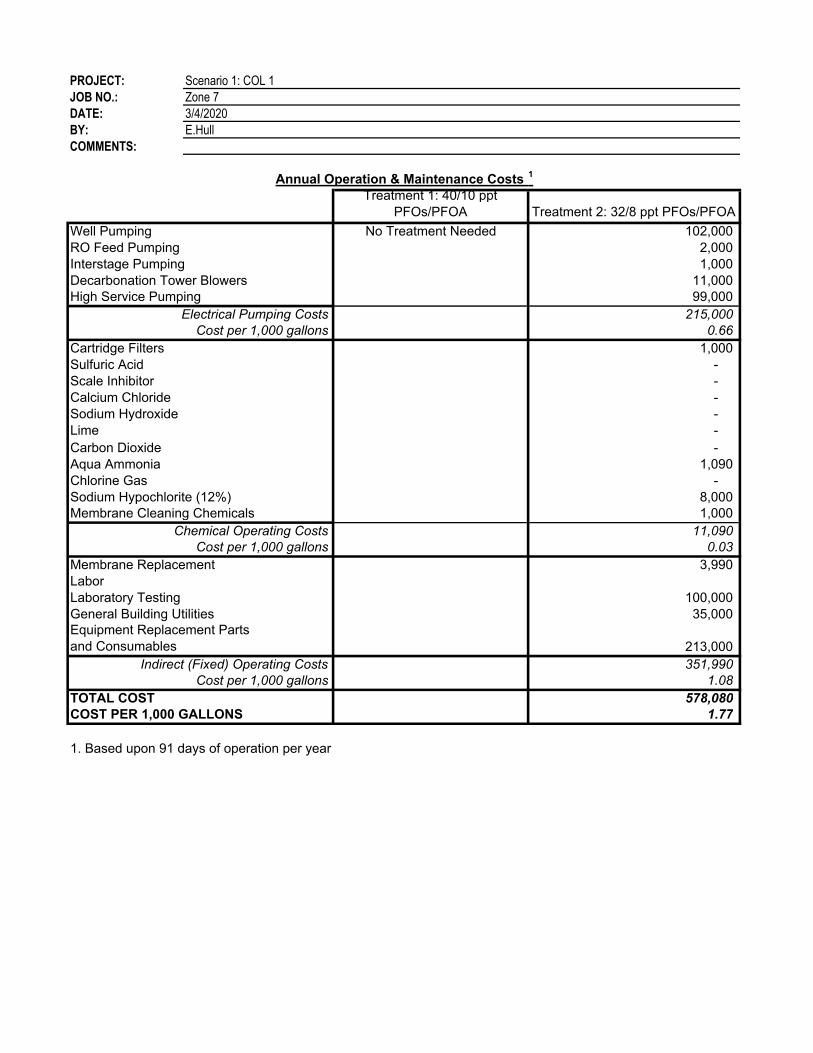
PROJECT: Scenario 1: COL 1
JOB NO.: Zone 7
DATE: 3/4/2020
BY: E.Hull
COMMENTS:
Annual Operation & Maintenance Costs 1
Treatment 1: 40/10 ppt
PFOs/PFOA Treatment 2: 32/8 ppt PFOs/PFOA
Well Pumping No Treatment Needed 102,000
RO Feed Pumping 2,000
Interstage Pumping 1,000
Decarbonation Tower Blowers 11,000
High Service Pumping 99,000
Electrical Pumping Costs 215,000
Cost per 1,000 gallons 0.66
Cartridge Filters 1,000
Sulfuric Acid -
Scale Inhibitor -
Calcium Chloride -
Sodium Hydroxide -
Lime -
Carbon Dioxide -
Aqua Ammonia 1,090
Chlorine Gas -
Sodium Hypochlorite (12%) 8,000
Membrane Cleaning Chemicals 1,000
Chemical Operating Costs 11,090
Cost per 1,000 gallons 0.03
Membrane Replacement 3,990
Labor
Laboratory Testing 100,000
General Building Utilities 35,000
213,000
Indirect (Fixed) Operating Costs 351,990
Cost per 1,000 gallons 1.08
TOTAL COST 578,080
COST PER 1,000 GALLONS 1.77
1. Based upon 91 days of operation per year
Equipment Replacement Parts
and Consumables
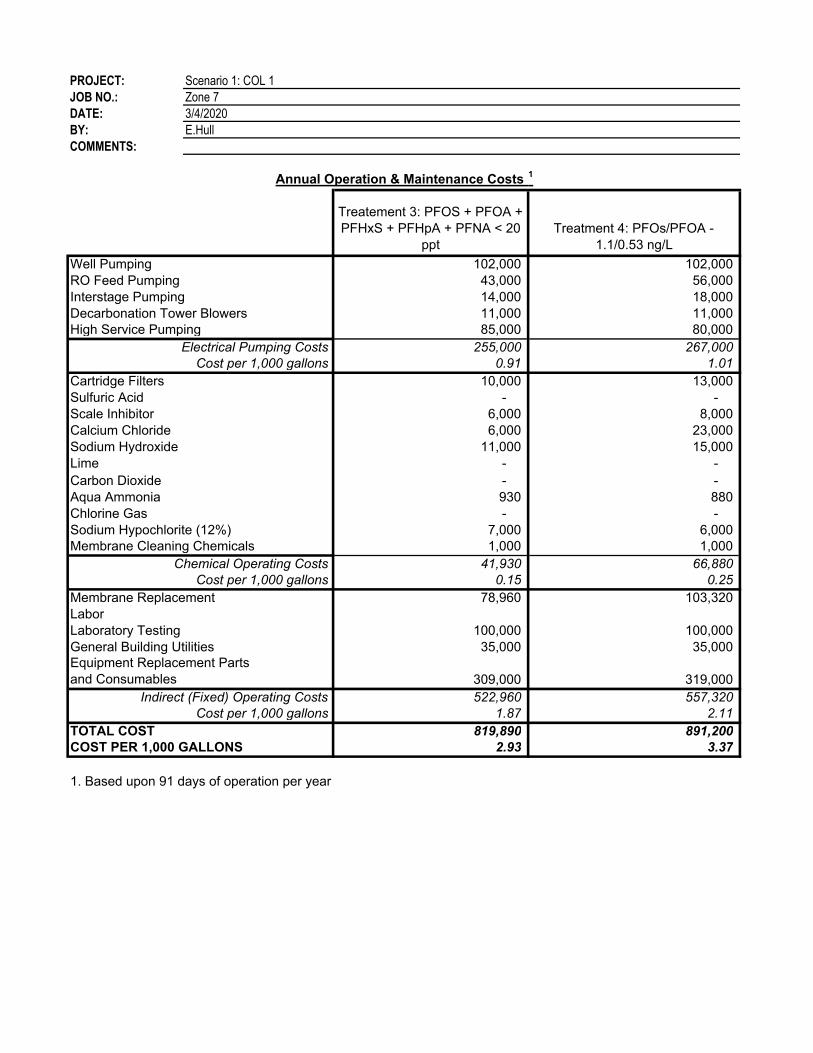
PROJECT: Scenario 1: COL 1
JOB NO.: Zone 7
DATE: 3/4/2020
BY: E.Hull
COMMENTS:
Annual Operation & Maintenance Costs 1
Treatement 3: PFOS + PFOA +
PFHxS + PFHpA + PFNA < 20
ppt
Treatment 4: PFOs/PFOA -
1.1/0.53 ng/L
Well Pumping 102,000 102,000
RO Feed Pumping 43,000 56,000
Interstage Pumping 14,000 18,000
Decarbonation Tower Blowers 11,000 11,000
High Service Pumping 85,000 80,000
Electrical Pumping Costs 255,000 267,000
Cost per 1,000 gallons 0.91 1.01
Cartridge Filters 10,000 13,000
Sulfuric Acid - -
Scale Inhibitor 6,000 8,000
Calcium Chloride 6,000 23,000
Sodium Hydroxide 11,000 15,000
Lime - -
Carbon Dioxide - -
Aqua Ammonia 930 880
Chlorine Gas - -
Sodium Hypochlorite (12%) 7,000 6,000
Membrane Cleaning Chemicals 1,000 1,000
Chemical Operating Costs 41,930 66,880
Cost per 1,000 gallons 0.15 0.25
Membrane Replacement 78,960 103,320
Labor
Laboratory Testing 100,000 100,000
General Building Utilities 35,000 35,000
309,000 319,000
Indirect (Fixed) Operating Costs 522,960 557,320
Cost per 1,000 gallons 1.87 2.11
TOTAL COST 819,890 891,200
COST PER 1,000 GALLONS 2.93 3.37
1. Based upon 91 days of operation per year
Equipment Replacement Parts
and Consumables

PROJECT: Scenario 2: COL 2
JOB NO.: Zone 7
DATE: 3/4/2020
BY: E.Hull
COMMENTS:
SUMMARY OF COSTSTreatment 1: PFOs/PFOA -
40/10 ng/L
Treatment 2: PFOs/PFOA -
32/8 ng/L
No treatment Needed No treatment Needed
Unit Capital Cost ($/gpd)
1. Interest rate based upon FY2006 State Revolving Loan Interest Rates
2. Based upon 91 days of operation per year.
Indirect Costs
CAPITAL COSTS
RO Water Treatment Plant
Engineering & Contingencies (20%)
Total Project Cost
ANNUAL COSTS
Ammortized Annual Cost (3.5% for 20 Years) 1
Operation and Maintenance:
Water Treatment Plant Energy Cost
Chemicals
Unit Cost of Water ($ per 1,000 gallons) 2
Unit Cost of Water ($ per acft) 2
Total Annual Cost
Available Project Yield, MGD
Available Project Yield, AF/yr
Actual Project Yield, AF/yr 2
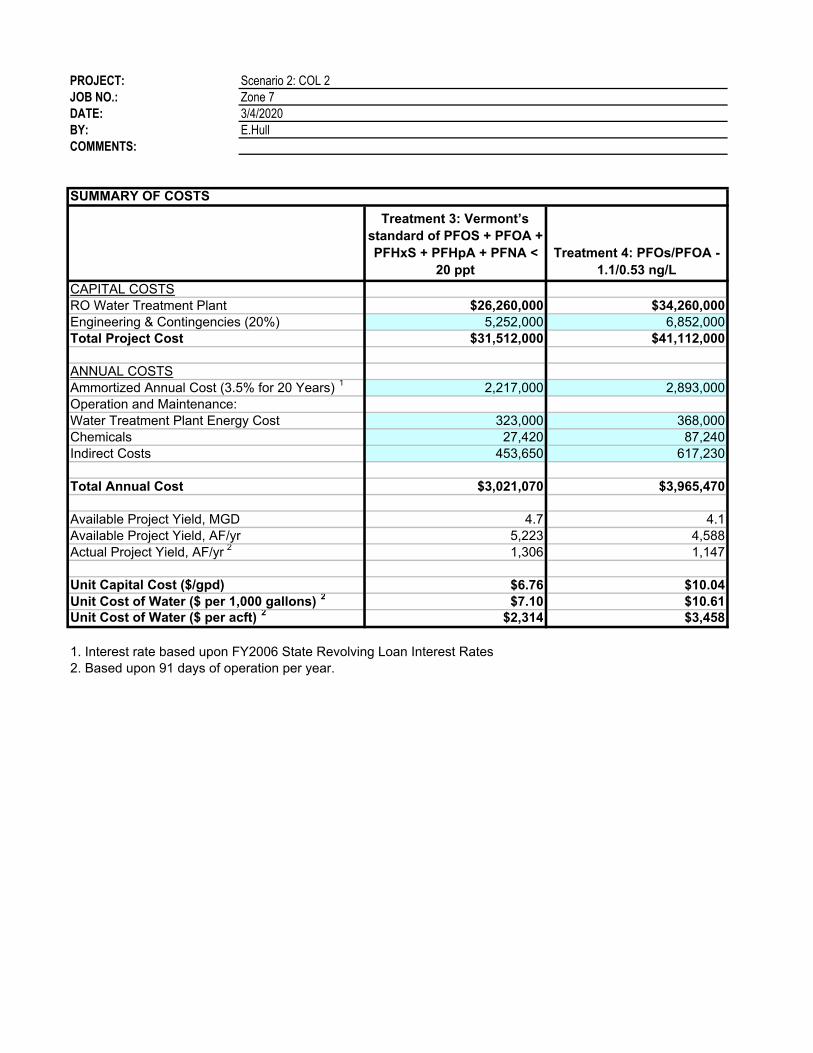
PROJECT: Scenario 2: COL 2
JOB NO.: Zone 7
DATE: 3/4/2020
BY: E.Hull
COMMENTS:
SUMMARY OF COSTS
Treatment 3: Vermont’s
standard of PFOS + PFOA +
PFHxS + PFHpA + PFNA <
20 ppt
Treatment 4: PFOs/PFOA -
1.1/0.53 ng/L
$26,260,000 $34,260,000
5,252,000 6,852,000
$31,512,000 $41,112,000
2,217,000 2,893,000
323,000 368,000
27,420 87,240
453,650 617,230
$3,021,070 $3,965,470
4.7 4.1
5,223 4,588
1,306 1,147
Unit Capital Cost ($/gpd) $6.76 $10.04
$7.10 $10.61$2,314 $3,458
1. Interest rate based upon FY2006 State Revolving Loan Interest Rates
2. Based upon 91 days of operation per year.
Indirect Costs
CAPITAL COSTS
RO Water Treatment Plant
Engineering & Contingencies (20%)
Total Project Cost
ANNUAL COSTS
Ammortized Annual Cost (3.5% for 20 Years) 1
Operation and Maintenance:
Water Treatment Plant Energy Cost
Chemicals
Unit Cost of Water ($ per 1,000 gallons) 2
Unit Cost of Water ($ per acft) 2
Total Annual Cost
Available Project Yield, MGD
Available Project Yield, AF/yr
Actual Project Yield, AF/yr 2
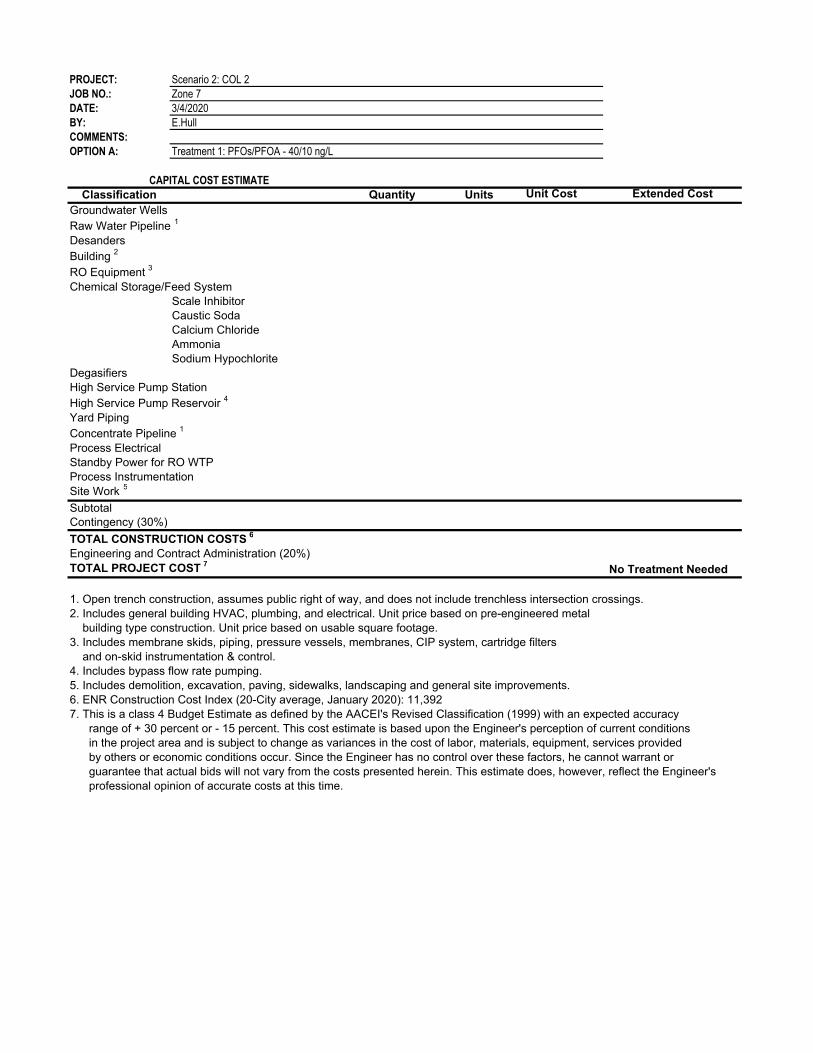
PROJECT: Scenario 2: COL 2
JOB NO.: Zone 7
DATE: 3/4/2020
BY: E.Hull
COMMENTS:
OPTION A: Treatment 1: PFOs/PFOA - 40/10 ng/L
CAPITAL COST ESTIMATE
Classification Quantity Units Unit Cost Extended Cost
Groundwater Wells
Raw Water Pipeline 1
Desanders
Building 2
RO Equipment 3
Chemical Storage/Feed System
Scale Inhibitor
Caustic Soda
Calcium Chloride
Ammonia
Sodium Hypochlorite
Degasifiers
High Service Pump Station
High Service Pump Reservoir 4
Yard Piping
Concentrate Pipeline 1
Process Electrical
Standby Power for RO WTP
Process Instrumentation
Site Work 5
Subtotal
Contingency (30%)
TOTAL CONSTRUCTION COSTS 6
Engineering and Contract Administration (20%)
TOTAL PROJECT COST 7
No Treatment Needed
1. Open trench construction, assumes public right of way, and does not include trenchless intersection crossings.
2. Includes general building HVAC, plumbing, and electrical. Unit price based on pre-engineered metal
building type construction. Unit price based on usable square footage.
3. Includes membrane skids, piping, pressure vessels, membranes, CIP system, cartridge filters
and on-skid instrumentation & control.
4. Includes bypass flow rate pumping.
5. Includes demolition, excavation, paving, sidewalks, landscaping and general site improvements.
6. ENR Construction Cost Index (20-City average, January 2020): 11,392
7. This is a class 4 Budget Estimate as defined by the AACEI's Revised Classification (1999) with an expected accuracy
range of + 30 percent or - 15 percent. This cost estimate is based upon the Engineer's perception of current conditions
in the project area and is subject to change as variances in the cost of labor, materials, equipment, services provided
by others or economic conditions occur. Since the Engineer has no control over these factors, he cannot warrant or
guarantee that actual bids will not vary from the costs presented herein. This estimate does, however, reflect the Engineer's
professional opinion of accurate costs at this time.
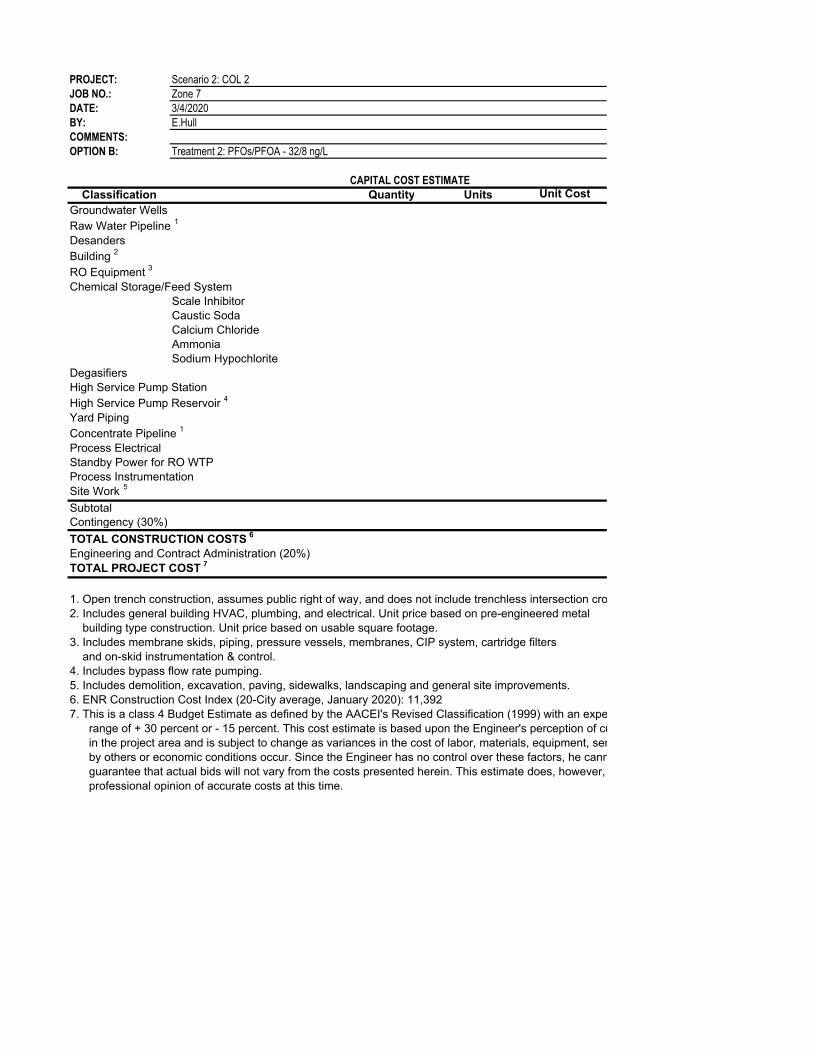
PROJECT: Scenario 2: COL 2
JOB NO.: Zone 7
DATE: 3/4/2020
BY: E.Hull
COMMENTS:
OPTION B: Treatment 2: PFOs/PFOA - 32/8 ng/L
CAPITAL COST ESTIMATE
Classification Quantity Units Unit Cost
Groundwater Wells
Raw Water Pipeline 1
Desanders
Building 2
RO Equipment 3
Chemical Storage/Feed System
Scale Inhibitor
Caustic Soda
Calcium Chloride
Ammonia
Sodium Hypochlorite
Degasifiers
High Service Pump Station
High Service Pump Reservoir 4
Yard Piping
Concentrate Pipeline 1
Process Electrical
Standby Power for RO WTP
Process Instrumentation
Site Work 5
Subtotal
Contingency (30%)
TOTAL CONSTRUCTION COSTS 6
Engineering and Contract Administration (20%)
TOTAL PROJECT COST 7
1. Open trench construction, assumes public right of way, and does not include trenchless intersection crossings.
2. Includes general building HVAC, plumbing, and electrical. Unit price based on pre-engineered metal
building type construction. Unit price based on usable square footage.
3. Includes membrane skids, piping, pressure vessels, membranes, CIP system, cartridge filters
and on-skid instrumentation & control.
4. Includes bypass flow rate pumping.
5. Includes demolition, excavation, paving, sidewalks, landscaping and general site improvements.
6. ENR Construction Cost Index (20-City average, January 2020): 11,392
7. This is a class 4 Budget Estimate as defined by the AACEI's Revised Classification (1999) with an expected accuracy
range of + 30 percent or - 15 percent. This cost estimate is based upon the Engineer's perception of current conditions
in the project area and is subject to change as variances in the cost of labor, materials, equipment, services provided
by others or economic conditions occur. Since the Engineer has no control over these factors, he cannot warrant or
guarantee that actual bids will not vary from the costs presented herein. This estimate does, however, reflect the Engineer's
professional opinion of accurate costs at this time.
Extended Cost
No Treatment Needed
tersection crossings.
) with an expected accuracy
erception of current conditions
quipment, services provided
ctors, he cannot warrant or
oes, however, reflect the Engineer's

PROJECT: Scenario 2: COL 2
JOB NO.: Zone 7
DATE: 3/4/2020
BY: E.Hull
COMMENTS:
OPTION A: Treatment 3: Vermont’s standard of PFOS + PFOA + PFHxS + PFHpA + PFNA < 20 ppt
CAPITAL COST ESTIMATE
Classification Quantity Units Unit Cost Extended Cost
Groundwater Wells $ - $ -
Raw Water Pipeline 1
$ - $ -
Desanders 1 LS $ 250,000 $ 250,000
Building 2
5,000 SF 450$ $ 2,250,000
RO Equipment 3
1.5 MGD 1,000,000$ $ 1,511,000
Chemical Storage/Feed System
Scale Inhibitor 1 LS 45,000$ $ 45,000
Caustic Soda 1 LS 160,000$ $ 160,000
Calcium Chloride 1 LS 90,000$ $ 90,000
Ammonia 1 LS 75,000$ $ 75,000
Sodium Hypochlorite 1 LS 90,000$ $ 90,000
Degasifiers 1 LS 180,000$ $ 180,000
High Service Pump Station 1 LS 1,750,000$ $ 1,750,000
High Service Pump Reservoir 4
1,000,000 GALLON 2.00$ $ 2,000,000
Yard Piping 1 LS $ 350,000 $ 350,000
Concentrate Pipeline 1
27,900 LF 192$ $ 5,365,385
Process Electrical 1 LS 3,200,000$ $ 3,200,000
Standby Power for RO WTP 1 LS 780,000$ $ 780,000
Process Instrumentation 1 LS 1,800,000$ $ 1,800,000
Site Work 5
1 LS 300,000$ $ 300,000
Subtotal 20,200,000$ Contingency (30%) 6,060,000$
TOTAL CONSTRUCTION COSTS 6
26,260,000$
Engineering and Contract Administration (20%) 5,252,000$
TOTAL PROJECT COST 7
31,512,000$
1. Open trench construction, assumes public right of way, and does not include trenchless intersection crossings.
2. Includes general building HVAC, plumbing, and electrical. Unit price based on pre-engineered metal
building type construction. Unit price based on usable square footage.
3. Includes membrane skids, piping, pressure vessels, membranes, CIP system, cartridge filters
and on-skid instrumentation & control.
4. Includes bypass flow rate pumping.
5. Includes demolition, excavation, paving, sidewalks, landscaping and general site improvements.
6. ENR Construction Cost Index (20-City average, January 2020): 11,392
7. This is a class 4 Budget Estimate as defined by the AACEI's Revised Classification (1999) with an expected accuracy
range of + 30 percent or - 15 percent. This cost estimate is based upon the Engineer's perception of current conditions
in the project area and is subject to change as variances in the cost of labor, materials, equipment, services provided
by others or economic conditions occur. Since the Engineer has no control over these factors, he cannot warrant or
guarantee that actual bids will not vary from the costs presented herein. This estimate does, however, reflect the Engineer's
professional opinion of accurate costs at this time.

PROJECT: Scenario 2: COL 2
JOB NO.: Zone 7
DATE: 3/4/2020
BY: E.Hull
COMMENTS:
OPTION B: Treatment 4: PFOs/PFOA - 1.1/0.53 ng/L
CAPITAL COST ESTIMATE
Classification Quantity Units Unit Cost Extended Cost
Groundwater Wells $ - $ -
Raw Water Pipeline 1
$ - $ -
Desanders 1 LS $ 350,000 $ 350,000
Building 2
8,000 SF 450$ $ 3,600,000
RO Equipment 3
3.8 MGD 950,000$ $ 3,592,000
Chemical Storage/Feed System
Scale Inhibitor 1 LS 80,000$ $ 80,000
Caustic Soda 1 LS 250,000$ $ 250,000
Calcium Chloride 1 LS 160,000$ $ 160,000
Ammonia 1 LS 135,000$ $ 135,000
Sodium Hypochlorite 1 LS 160,000$ $ 160,000
Degasifiers 1 LS 250,000$ $ 250,000
High Service Pump Station 1 LS 1,750,000$ $ 1,750,000
High Service Pump Reservoir 4
1,000,000 GALLON 2.00$ $ 2,000,000
Yard Piping 1 LS $ 350,000 $ 350,000
Concentrate Pipeline 1
27,900 LF 192$ $ 5,365,385
Process Electrical 1 LS 4,500,000$ $ 4,500,000
Standby Power for RO WTP 1 LS 1,000,000$ $ 1,000,000
Process Instrumentation 1 LS 2,500,000$ $ 2,500,000
Site Work 5
1 LS 300,000$ $ 300,000
Subtotal 26,350,000$ Contingency (30%) 7,910,000$
TOTAL CONSTRUCTION COSTS 6
34,260,000$
Engineering and Contract Administration (20%) 6,852,000$
TOTAL PROJECT COST 7
41,112,000$
1. Open trench construction, assumes public right of way, and does not include trenchless intersection crossings.
2. Includes general building HVAC, plumbing, and electrical. Unit price based on pre-engineered metal
building type construction. Unit price based on usable square footage.
3. Includes membrane skids, piping, pressure vessels, membranes, CIP system, cartridge filters
and on-skid instrumentation & control.
4. Includes bypass flow rate pumping.
5. Includes demolition, excavation, paving, sidewalks, landscaping and general site improvements.
6. ENR Construction Cost Index (20-City average, January 2020): 11,392
7. This is a class 4 Budget Estimate as defined by the AACEI's Revised Classification (1999) with an expected accuracy
range of + 30 percent or - 15 percent. This cost estimate is based upon the Engineer's perception of current conditions
in the project area and is subject to change as variances in the cost of labor, materials, equipment, services provided
by others or economic conditions occur. Since the Engineer has no control over these factors, he cannot warrant or
guarantee that actual bids will not vary from the costs presented herein. This estimate does, however, reflect the Engineer's
professional opinion of accurate costs at this time.
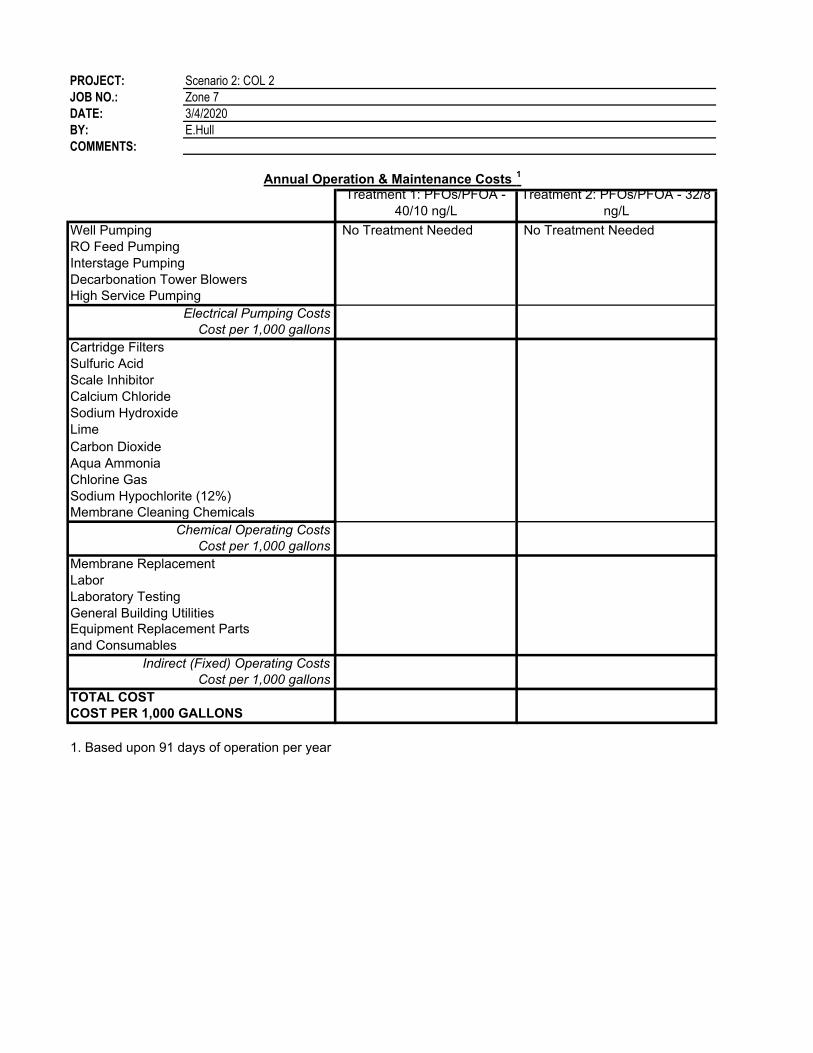
PROJECT: Scenario 2: COL 2
JOB NO.: Zone 7
DATE: 3/4/2020
BY: E.Hull
COMMENTS:
Annual Operation & Maintenance Costs 1
Treatment 1: PFOs/PFOA -
40/10 ng/L
Treatment 2: PFOs/PFOA - 32/8
ng/L
Well Pumping No Treatment Needed No Treatment Needed
RO Feed Pumping
Interstage Pumping
Decarbonation Tower Blowers
High Service Pumping
Electrical Pumping Costs
Cost per 1,000 gallons
Cartridge Filters
Sulfuric Acid
Scale Inhibitor
Calcium Chloride
Sodium Hydroxide
Lime
Carbon Dioxide
Aqua Ammonia
Chlorine Gas
Sodium Hypochlorite (12%)
Membrane Cleaning Chemicals
Chemical Operating Costs
Cost per 1,000 gallons
Membrane Replacement
Labor
Laboratory Testing
General Building Utilities
Indirect (Fixed) Operating Costs
Cost per 1,000 gallons
TOTAL COST
COST PER 1,000 GALLONS
1. Based upon 91 days of operation per year
Equipment Replacement Parts
and Consumables
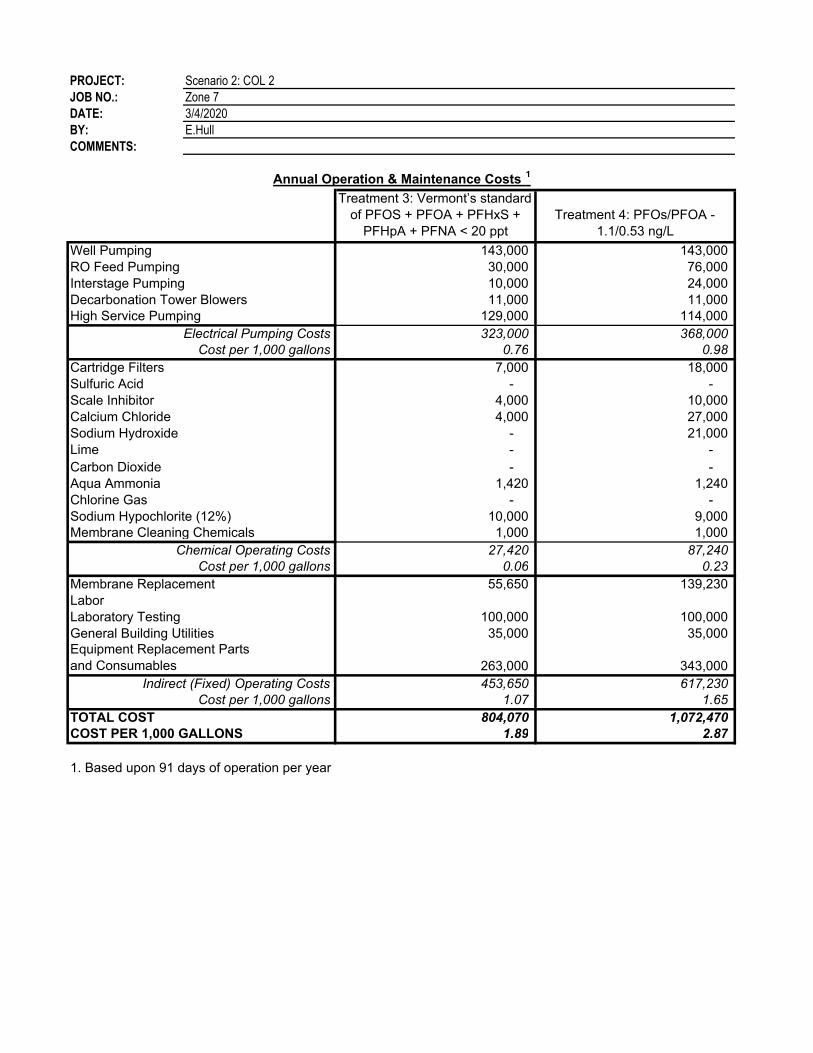
PROJECT: Scenario 2: COL 2
JOB NO.: Zone 7
DATE: 3/4/2020
BY: E.Hull
COMMENTS:
Annual Operation & Maintenance Costs 1
Treatment 3: Vermont’s standard
of PFOS + PFOA + PFHxS +
PFHpA + PFNA < 20 ppt
Treatment 4: PFOs/PFOA -
1.1/0.53 ng/L
Well Pumping 143,000 143,000
RO Feed Pumping 30,000 76,000
Interstage Pumping 10,000 24,000
Decarbonation Tower Blowers 11,000 11,000
High Service Pumping 129,000 114,000
Electrical Pumping Costs 323,000 368,000
Cost per 1,000 gallons 0.76 0.98
Cartridge Filters 7,000 18,000
Sulfuric Acid - -
Scale Inhibitor 4,000 10,000
Calcium Chloride 4,000 27,000
Sodium Hydroxide - 21,000
Lime - -
Carbon Dioxide - -
Aqua Ammonia 1,420 1,240
Chlorine Gas - -
Sodium Hypochlorite (12%) 10,000 9,000
Membrane Cleaning Chemicals 1,000 1,000
Chemical Operating Costs 27,420 87,240
Cost per 1,000 gallons 0.06 0.23
Membrane Replacement 55,650 139,230
Labor
Laboratory Testing 100,000 100,000
General Building Utilities 35,000 35,000
263,000 343,000
Indirect (Fixed) Operating Costs 453,650 617,230
Cost per 1,000 gallons 1.07 1.65
TOTAL COST 804,070 1,072,470
COST PER 1,000 GALLONS 1.89 2.87
1. Based upon 91 days of operation per year
Equipment Replacement Parts
and Consumables

PROJECT: Scenario 3: COL 5
JOB NO.: Zone 7
DATE: 3/4/2020
BY: E.Hull
COMMENTS: These two treatments are governed by the Cr(6) concentration in the water
SUMMARY OF COSTS
Treatment 1: PFOs/PFOA -
40/10 ng/L, and Cr(6) 8 ppb
Treatment 2: PFOs/PFOA -
32/8 ng/L, and Cr(6) 8 ppb
$21,950,000 $21,950,000
4,390,000 4,390,000
$26,340,000 $26,340,000
1,853,000 1,853,000
122,000 122,000
9,510 9,510
374,740 374,740
$2,359,250 $2,359,250
1.7 1.7
1,866 1,866
467 467
Unit Capital Cost ($/gpd) $15.81 $15.81
$15.52 $15.52$5,057 $5,057
1. Interest rate based upon FY2006 State Revolving Loan Interest Rates
2. Based upon 91 days of operation per year.
Unit Cost of Water ($ per 1,000 gallons) 2
Unit Cost of Water ($ per acft) 2
Total Annual Cost
Available Project Yield, MGD
Available Project Yield, AF/yr
Actual Project Yield, AF/yr 2
Indirect Costs
CAPITAL COSTS
RO Water Treatment Plant
Engineering & Contingencies (20%)
Total Project Cost
ANNUAL COSTS
Ammortized Annual Cost (3.5% for 20 Years) 1
Operation and Maintenance:
Water Treatment Plant Energy Cost
Chemicals

PROJECT: Scenario 3: COL 5
JOB NO.: Zone 7
DATE: 3/4/2020
BY: E.Hull
COMMENTS:
SUMMARY OF COSTSTreatment 3: Vermont’s
standard of PFOS + PFOA +
PFHxS + PFHpA + PFNA <
20 ppt and Cr(6) 8ppb
Treatment 4: PFOs/PFOA -
1.1/0.53 ng/L and Cr(6) 8
ppb
$24,220,000 $24,940,000
4,844,000 4,988,000
$29,064,000 $29,928,000
2,045,000 2,106,000
133,000 139,000
26,470 32,440
415,430 435,870
$2,619,900 $2,713,310
1.5 1.4
1,724 1,622
431 406
Unit Capital Cost ($/gpd) $18.89 $20.66
$18.66 $20.53$6,079 $6,690
1. Interest rate based upon FY2006 State Revolving Loan Interest Rates
2. Based upon 91 days of operation per year.
Unit Cost of Water ($ per 1,000 gallons) 2
Unit Cost of Water ($ per acft) 2
Total Annual Cost
Available Project Yield, MGD
Available Project Yield, AF/yr
Actual Project Yield, AF/yr 2
Indirect Costs
CAPITAL COSTS
RO Water Treatment Plant
Engineering & Contingencies (20%)
Total Project Cost
ANNUAL COSTS
Ammortized Annual Cost (3.5% for 20 Years) 1
Operation and Maintenance:
Water Treatment Plant Energy Cost
Chemicals

PROJECT: Scenario 3: COL 5
JOB NO.: Zone 7
DATE: 3/4/2020
BY: E.Hull
COMMENTS: These two treatments are governed by the Cr(6) concentration in the water
OPTION A: Treatment 1: PFOs/PFOA - 40/10 ng/L, and Cr(6) 8 ppb
CAPITAL COST ESTIMATE
Classification Quantity Units Unit Cost Extended Cost
Groundwater Wells $ - $ -
Raw Water Pipeline 1
1200 LF $ 215 $ 258,462
Desanders 1 LS $ 150,000 $ 150,000
Building 2
4,000 SF 450$ $ 1,800,000
RO Equipment 3
0.5 MGD 1,000,000$ $ 537,000
Chemical Storage/Feed System
Scale Inhibitor 1 LS 35,000$ $ 35,000
Caustic Soda 1 LS 100,000$ $ 100,000
Calcium Chloride 1 LS 70,000$ $ 70,000
Ammonia 1 LS 35,000$ $ 35,000
Sodium Hypochlorite 1 LS 70,000$ $ 70,000
Degasifiers 1 LS 180,000$ $ 180,000
High Service Pump Station 1 LS 1,750,000$ $ 1,750,000
High Service Pump Reservoir 4
1,000,000 GALLON 2.00$ $ 2,000,000
Yard Piping 1 LS $ 350,000 $ 350,000
Concentrate Pipeline 1
21,100 LF 192$ $ 4,057,692
Process Electrical 1 LS 2,800,000$ $ 2,800,000
Standby Power for RO WTP 1 LS 780,000$ $ 780,000
Process Instrumentation 1 LS 1,600,000$ $ 1,600,000
Site Work 5
1 LS 300,000$ $ 300,000
Subtotal 16,880,000$ Contingency (30%) 5,070,000$
TOTAL CONSTRUCTION COSTS 6
21,950,000$
Engineering and Contract Administration (20%) 4,390,000$
TOTAL PROJECT COST 7
26,340,000$
1. Open trench construction, assumes public right of way, and does not include trenchless intersection crossings.
2. Includes general building HVAC, plumbing, and electrical. Unit price based on pre-engineered metal
building type construction. Unit price based on usable square footage.
3. Includes membrane skids, piping, pressure vessels, membranes, CIP system, cartridge filters
and on-skid instrumentation & control.
4. Includes bypass flow rate pumping.
5. Includes demolition, excavation, paving, sidewalks, landscaping and general site improvements.
6. ENR Construction Cost Index (20-City average, January 2020): 11,392
7. This is a class 4 Budget Estimate as defined by the AACEI's Revised Classification (1999) with an expected accuracy
range of + 30 percent or - 15 percent. This cost estimate is based upon the Engineer's perception of current conditions
in the project area and is subject to change as variances in the cost of labor, materials, equipment, services provided
by others or economic conditions occur. Since the Engineer has no control over these factors, he cannot warrant or
guarantee that actual bids will not vary from the costs presented herein. This estimate does, however, reflect the Engineer's
professional opinion of accurate costs at this time.
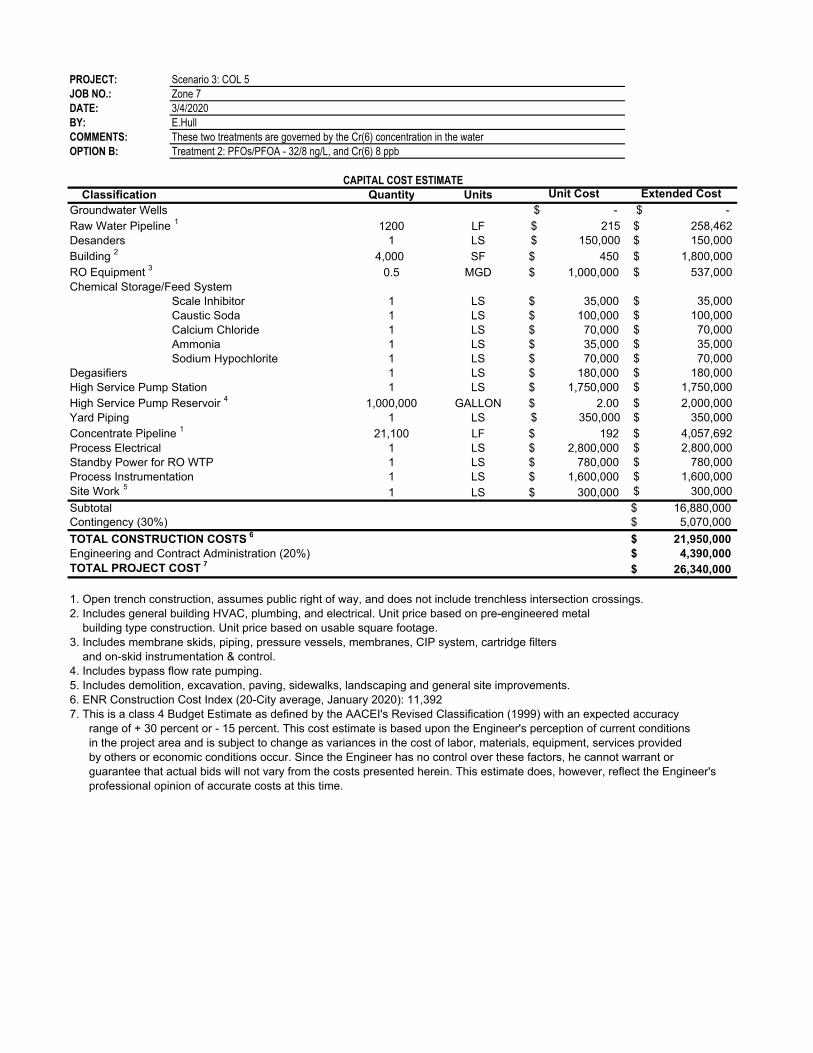
PROJECT: Scenario 3: COL 5
JOB NO.: Zone 7
DATE: 3/4/2020
BY: E.Hull
COMMENTS: These two treatments are governed by the Cr(6) concentration in the water
OPTION B: Treatment 2: PFOs/PFOA - 32/8 ng/L, and Cr(6) 8 ppb
CAPITAL COST ESTIMATE
Classification Quantity Units Unit Cost Extended Cost
Groundwater Wells $ - $ -
Raw Water Pipeline 1
1200 LF $ 215 $ 258,462
Desanders 1 LS $ 150,000 $ 150,000
Building 2
4,000 SF 450$ $ 1,800,000
RO Equipment 3
0.5 MGD 1,000,000$ $ 537,000
Chemical Storage/Feed System
Scale Inhibitor 1 LS 35,000$ $ 35,000
Caustic Soda 1 LS 100,000$ $ 100,000
Calcium Chloride 1 LS 70,000$ $ 70,000
Ammonia 1 LS 35,000$ $ 35,000
Sodium Hypochlorite 1 LS 70,000$ $ 70,000
Degasifiers 1 LS 180,000$ $ 180,000
High Service Pump Station 1 LS 1,750,000$ $ 1,750,000
High Service Pump Reservoir 4
1,000,000 GALLON 2.00$ $ 2,000,000
Yard Piping 1 LS $ 350,000 $ 350,000
Concentrate Pipeline 1
21,100 LF 192$ $ 4,057,692
Process Electrical 1 LS 2,800,000$ $ 2,800,000
Standby Power for RO WTP 1 LS 780,000$ $ 780,000
Process Instrumentation 1 LS 1,600,000$ $ 1,600,000
Site Work 5
1 LS 300,000$ $ 300,000
Subtotal 16,880,000$ Contingency (30%) 5,070,000$
TOTAL CONSTRUCTION COSTS 6
21,950,000$
Engineering and Contract Administration (20%) 4,390,000$
TOTAL PROJECT COST 7
26,340,000$
1. Open trench construction, assumes public right of way, and does not include trenchless intersection crossings.
2. Includes general building HVAC, plumbing, and electrical. Unit price based on pre-engineered metal
building type construction. Unit price based on usable square footage.
3. Includes membrane skids, piping, pressure vessels, membranes, CIP system, cartridge filters
and on-skid instrumentation & control.
4. Includes bypass flow rate pumping.
5. Includes demolition, excavation, paving, sidewalks, landscaping and general site improvements.
6. ENR Construction Cost Index (20-City average, January 2020): 11,392
7. This is a class 4 Budget Estimate as defined by the AACEI's Revised Classification (1999) with an expected accuracy
range of + 30 percent or - 15 percent. This cost estimate is based upon the Engineer's perception of current conditions
in the project area and is subject to change as variances in the cost of labor, materials, equipment, services provided
by others or economic conditions occur. Since the Engineer has no control over these factors, he cannot warrant or
guarantee that actual bids will not vary from the costs presented herein. This estimate does, however, reflect the Engineer's
professional opinion of accurate costs at this time.

PROJECT: Scenario 3: COL 5
JOB NO.: Zone 7
DATE: 3/4/2020
BY: E.Hull
COMMENTS:
OPTION A: Treatment 3: Vermont’s standard of PFOS + PFOA + PFHxS + PFHpA + PFNA < 20 ppt and Cr(6) 8ppb
CAPITAL COST ESTIMATE
Classification Quantity Units Unit Cost Extended Cost
Groundwater Wells $ - $ -
Raw Water Pipeline 1
1200 LF $ 215 $ 258,462
Desanders 1 LS $ 250,000 $ 250,000
Building 2
5,000 SF 450$ $ 2,250,000
RO Equipment 3
1.0 MGD 950,000$ $ 993,000
Chemical Storage/Feed System
Scale Inhibitor 1 LS 45,000$ $ 45,000
Caustic Soda 1 LS 160,000$ $ 160,000
Calcium Chloride 1 LS 90,000$ $ 90,000
Ammonia 1 LS 75,000$ $ 75,000
Sodium Hypochlorite 1 LS 90,000$ $ 90,000
Degasifiers 1 LS 180,000$ $ 180,000
High Service Pump Station 1 LS 1,750,000$ $ 1,750,000
High Service Pump Reservoir 4
1,000,000 GALLON 2.00$ $ 2,000,000
Yard Piping 1 LS $ 350,000 $ 350,000
Concentrate Pipeline 1
21,100 LF 192$ $ 4,057,692
Process Electrical 1 LS 3,200,000$ $ 3,200,000
Standby Power for RO WTP 1 LS 780,000$ $ 780,000
Process Instrumentation 1 LS 1,800,000$ $ 1,800,000
Site Work 5
1 LS 300,000$ $ 300,000
Subtotal 18,630,000$ Contingency (30%) 5,590,000$
TOTAL CONSTRUCTION COSTS 6
24,220,000$
Engineering and Contract Administration (20%) 4,844,000$
TOTAL PROJECT COST 7
29,064,000$
1. Open trench construction, assumes public right of way, and does not include trenchless intersection crossings.
2. Includes general building HVAC, plumbing, and electrical. Unit price based on pre-engineered metal
building type construction. Unit price based on usable square footage.
3. Includes membrane skids, piping, pressure vessels, membranes, CIP system, cartridge filters
and on-skid instrumentation & control.
4. Includes bypass flow rate pumping.
5. Includes demolition, excavation, paving, sidewalks, landscaping and general site improvements.
6. ENR Construction Cost Index (20-City average, January 2020): 11,392
7. This is a class 4 Budget Estimate as defined by the AACEI's Revised Classification (1999) with an expected accuracy
range of + 30 percent or - 15 percent. This cost estimate is based upon the Engineer's perception of current conditions
in the project area and is subject to change as variances in the cost of labor, materials, equipment, services provided
by others or economic conditions occur. Since the Engineer has no control over these factors, he cannot warrant or
guarantee that actual bids will not vary from the costs presented herein. This estimate does, however, reflect the Engineer's
professional opinion of accurate costs at this time.
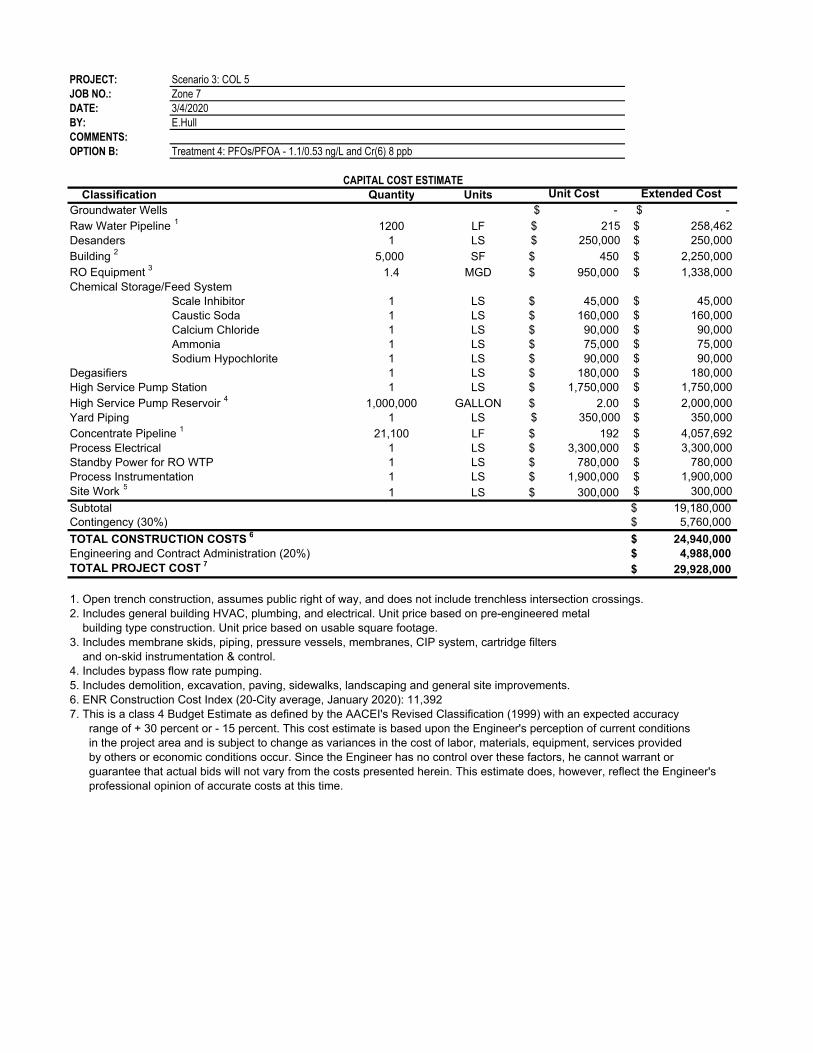
PROJECT: Scenario 3: COL 5
JOB NO.: Zone 7
DATE: 3/4/2020
BY: E.Hull
COMMENTS:
OPTION B: Treatment 4: PFOs/PFOA - 1.1/0.53 ng/L and Cr(6) 8 ppb
CAPITAL COST ESTIMATE
Classification Quantity Units Unit Cost Extended Cost
Groundwater Wells $ - $ -
Raw Water Pipeline 1
1200 LF $ 215 $ 258,462
Desanders 1 LS $ 250,000 $ 250,000
Building 2
5,000 SF 450$ $ 2,250,000
RO Equipment 3
1.4 MGD 950,000$ $ 1,338,000
Chemical Storage/Feed System
Scale Inhibitor 1 LS 45,000$ $ 45,000
Caustic Soda 1 LS 160,000$ $ 160,000
Calcium Chloride 1 LS 90,000$ $ 90,000
Ammonia 1 LS 75,000$ $ 75,000
Sodium Hypochlorite 1 LS 90,000$ $ 90,000
Degasifiers 1 LS 180,000$ $ 180,000
High Service Pump Station 1 LS 1,750,000$ $ 1,750,000
High Service Pump Reservoir 4
1,000,000 GALLON 2.00$ $ 2,000,000
Yard Piping 1 LS $ 350,000 $ 350,000
Concentrate Pipeline 1
21,100 LF 192$ $ 4,057,692
Process Electrical 1 LS 3,300,000$ $ 3,300,000
Standby Power for RO WTP 1 LS 780,000$ $ 780,000
Process Instrumentation 1 LS 1,900,000$ $ 1,900,000
Site Work 5
1 LS 300,000$ $ 300,000
Subtotal 19,180,000$ Contingency (30%) 5,760,000$
TOTAL CONSTRUCTION COSTS 6
24,940,000$
Engineering and Contract Administration (20%) 4,988,000$
TOTAL PROJECT COST 7
29,928,000$
1. Open trench construction, assumes public right of way, and does not include trenchless intersection crossings.
2. Includes general building HVAC, plumbing, and electrical. Unit price based on pre-engineered metal
building type construction. Unit price based on usable square footage.
3. Includes membrane skids, piping, pressure vessels, membranes, CIP system, cartridge filters
and on-skid instrumentation & control.
4. Includes bypass flow rate pumping.
5. Includes demolition, excavation, paving, sidewalks, landscaping and general site improvements.
6. ENR Construction Cost Index (20-City average, January 2020): 11,392
7. This is a class 4 Budget Estimate as defined by the AACEI's Revised Classification (1999) with an expected accuracy
range of + 30 percent or - 15 percent. This cost estimate is based upon the Engineer's perception of current conditions
in the project area and is subject to change as variances in the cost of labor, materials, equipment, services provided
by others or economic conditions occur. Since the Engineer has no control over these factors, he cannot warrant or
guarantee that actual bids will not vary from the costs presented herein. This estimate does, however, reflect the Engineer's
professional opinion of accurate costs at this time.
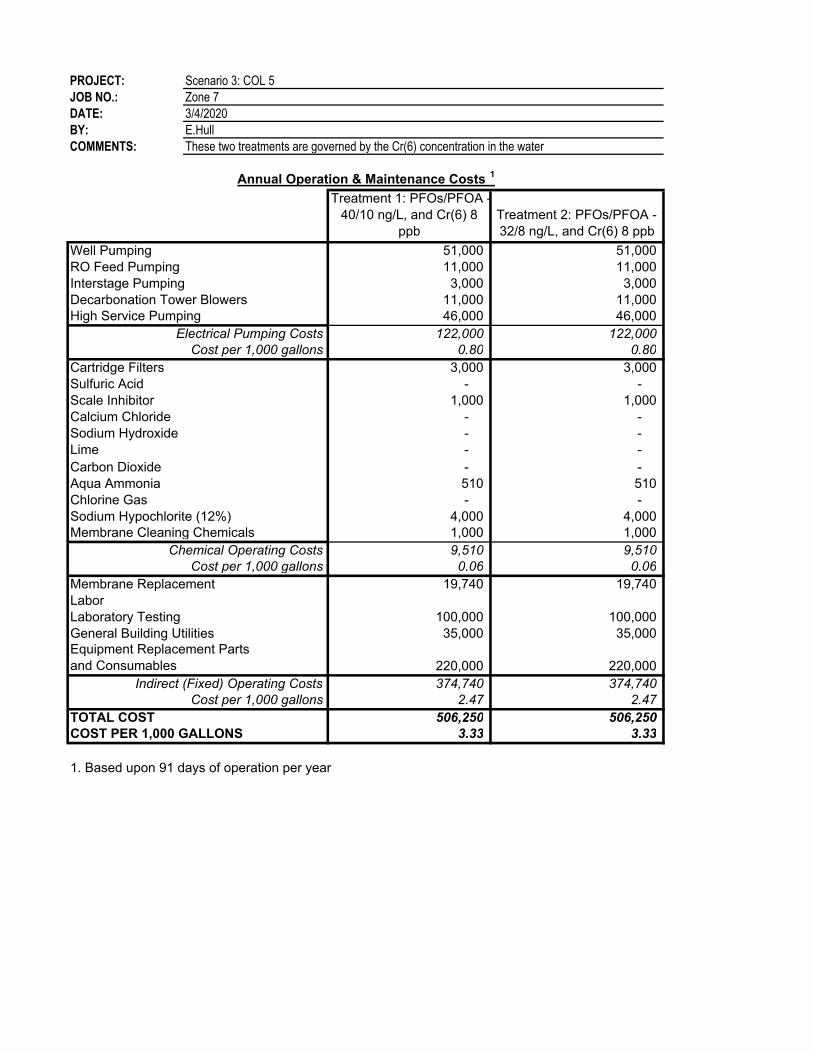
PROJECT: Scenario 3: COL 5
JOB NO.: Zone 7
DATE: 3/4/2020
BY: E.Hull
COMMENTS: These two treatments are governed by the Cr(6) concentration in the water
Annual Operation & Maintenance Costs 1
Treatment 1: PFOs/PFOA -
40/10 ng/L, and Cr(6) 8
ppb
Treatment 2: PFOs/PFOA -
32/8 ng/L, and Cr(6) 8 ppb
Well Pumping 51,000 51,000
RO Feed Pumping 11,000 11,000
Interstage Pumping 3,000 3,000
Decarbonation Tower Blowers 11,000 11,000
High Service Pumping 46,000 46,000
Electrical Pumping Costs 122,000 122,000
Cost per 1,000 gallons 0.80 0.80
Cartridge Filters 3,000 3,000
Sulfuric Acid - -
Scale Inhibitor 1,000 1,000
Calcium Chloride - -
Sodium Hydroxide - -
Lime - -
Carbon Dioxide - -
Aqua Ammonia 510 510
Chlorine Gas - -
Sodium Hypochlorite (12%) 4,000 4,000
Membrane Cleaning Chemicals 1,000 1,000
Chemical Operating Costs 9,510 9,510
Cost per 1,000 gallons 0.06 0.06
Membrane Replacement 19,740 19,740
Labor
Laboratory Testing 100,000 100,000
General Building Utilities 35,000 35,000
220,000 220,000
Indirect (Fixed) Operating Costs 374,740 374,740
Cost per 1,000 gallons 2.47 2.47
TOTAL COST 506,250 506,250
COST PER 1,000 GALLONS 3.33 3.33
1. Based upon 91 days of operation per year
Equipment Replacement Parts
and Consumables
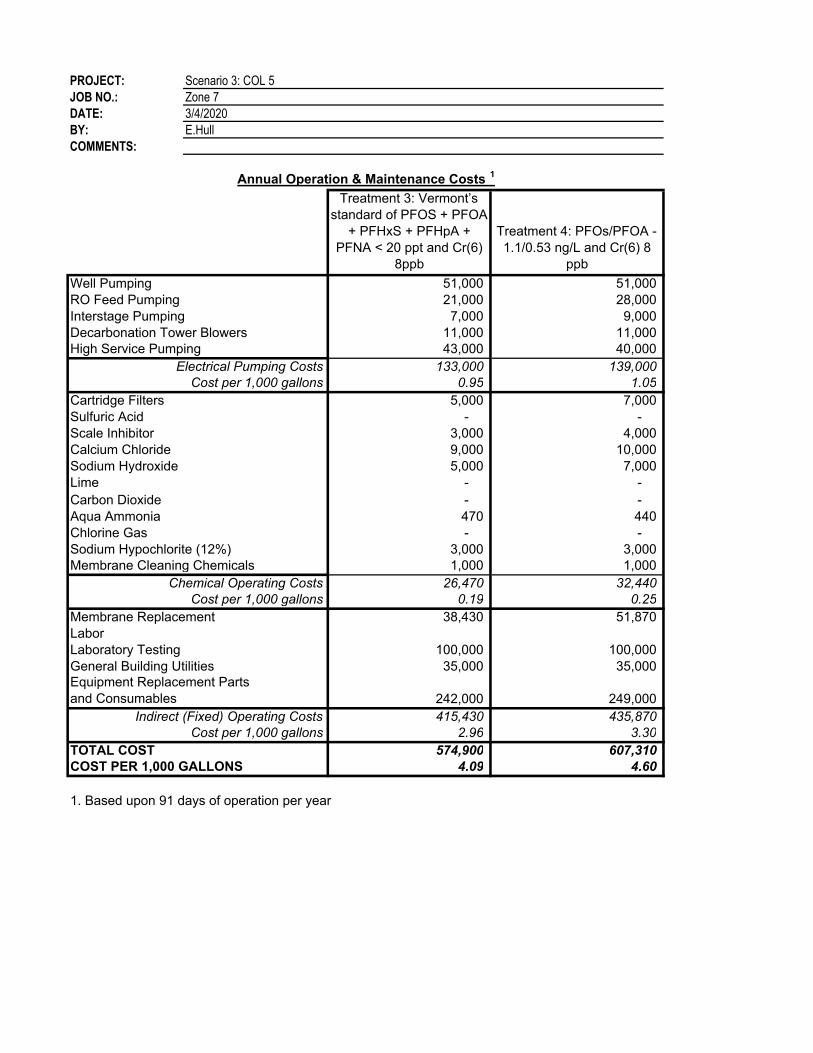
PROJECT: Scenario 3: COL 5
JOB NO.: Zone 7
DATE: 3/4/2020
BY: E.Hull
COMMENTS:
Annual Operation & Maintenance Costs 1
Treatment 3: Vermont’s
standard of PFOS + PFOA
+ PFHxS + PFHpA +
PFNA < 20 ppt and Cr(6)
8ppb
Treatment 4: PFOs/PFOA -
1.1/0.53 ng/L and Cr(6) 8
ppb
Well Pumping 51,000 51,000
RO Feed Pumping 21,000 28,000
Interstage Pumping 7,000 9,000
Decarbonation Tower Blowers 11,000 11,000
High Service Pumping 43,000 40,000
Electrical Pumping Costs 133,000 139,000
Cost per 1,000 gallons 0.95 1.05
Cartridge Filters 5,000 7,000
Sulfuric Acid - -
Scale Inhibitor 3,000 4,000
Calcium Chloride 9,000 10,000
Sodium Hydroxide 5,000 7,000
Lime - -
Carbon Dioxide - -
Aqua Ammonia 470 440
Chlorine Gas - -
Sodium Hypochlorite (12%) 3,000 3,000
Membrane Cleaning Chemicals 1,000 1,000
Chemical Operating Costs 26,470 32,440
Cost per 1,000 gallons 0.19 0.25
Membrane Replacement 38,430 51,870
Labor
Laboratory Testing 100,000 100,000
General Building Utilities 35,000 35,000
242,000 249,000
Indirect (Fixed) Operating Costs 415,430 435,870
Cost per 1,000 gallons 2.96 3.30
TOTAL COST 574,900 607,310
COST PER 1,000 GALLONS 4.09 4.60
1. Based upon 91 days of operation per year
Equipment Replacement Parts
and Consumables
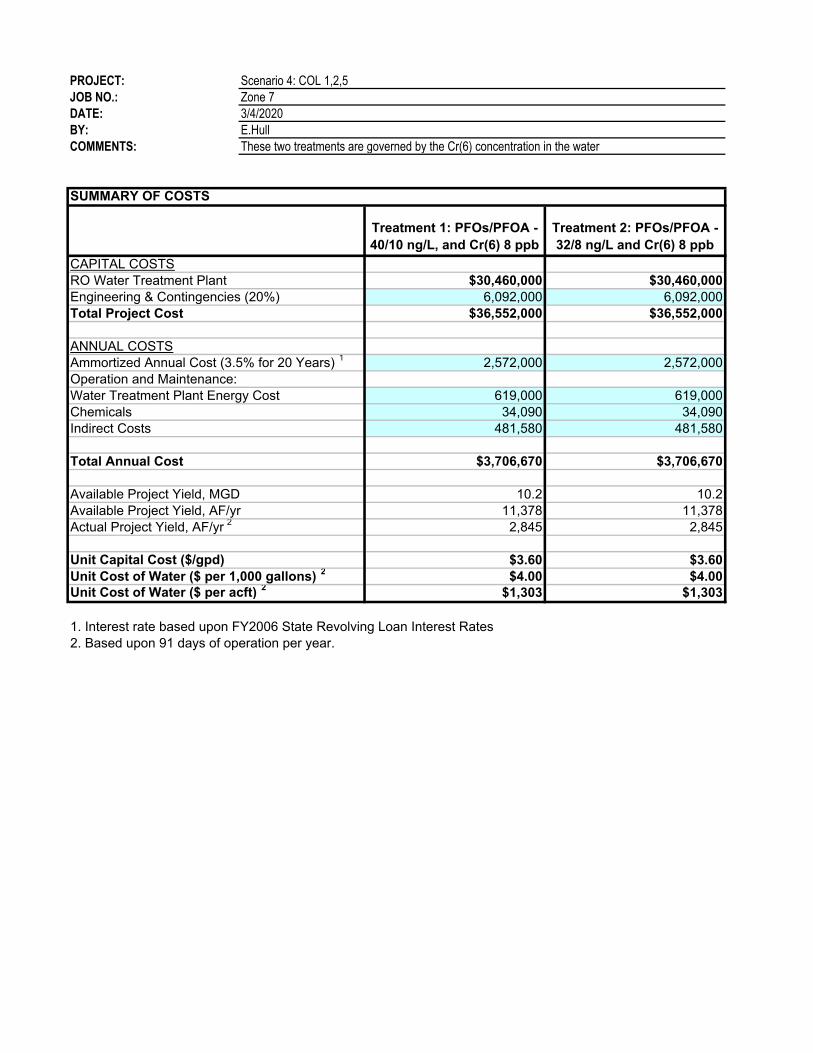
PROJECT: Scenario 4: COL 1,2,5
JOB NO.: Zone 7
DATE: 3/4/2020
BY: E.Hull
COMMENTS: These two treatments are governed by the Cr(6) concentration in the water
SUMMARY OF COSTS
Treatment 1: PFOs/PFOA -
40/10 ng/L, and Cr(6) 8 ppb
Treatment 2: PFOs/PFOA -
32/8 ng/L and Cr(6) 8 ppb
$30,460,000 $30,460,000
6,092,000 6,092,000
$36,552,000 $36,552,000
2,572,000 2,572,000
619,000 619,000
34,090 34,090
481,580 481,580
$3,706,670 $3,706,670
10.2 10.2
11,378 11,378
2,845 2,845
Unit Capital Cost ($/gpd) $3.60 $3.60
$4.00 $4.00$1,303 $1,303
1. Interest rate based upon FY2006 State Revolving Loan Interest Rates
2. Based upon 91 days of operation per year.
Indirect Costs
CAPITAL COSTS
RO Water Treatment Plant
Engineering & Contingencies (20%)
Total Project Cost
ANNUAL COSTS
Ammortized Annual Cost (3.5% for 20 Years) 1
Operation and Maintenance:
Water Treatment Plant Energy Cost
Chemicals
Unit Cost of Water ($ per 1,000 gallons) 2
Unit Cost of Water ($ per acft) 2
Total Annual Cost
Available Project Yield, MGD
Available Project Yield, AF/yr
Actual Project Yield, AF/yr 2

PROJECT: Scenario 4: COL 1,2,5
JOB NO.: Zone 7
DATE: 3/4/2020
BY: E.Hull
COMMENTS:
SUMMARY OF COSTSTreatment 3: Vermont’s
standard of PFOS + PFOA +
PFHxS + PFHpA + PFNA <
20 ppt and Cr(6) 8 ppb
Treatment 4: PFOs/PFOA -
1.1/0.53 ng/L and Cr(6) 8
ppb
$44,750,000 $56,070,000
8,950,000 11,214,000
$53,700,000 $67,284,000
3,778,000 4,734,000
703,000 755,000
117,760 183,560
782,290 993,570
$5,381,050 $6,666,130
9.1 8.4
10,180 9,433
2,545 2,358
Unit Capital Cost ($/gpd) $5.91 $7.99
$6.49 $8.67$2,114 $2,827
1. Interest rate based upon FY2006 State Revolving Loan Interest Rates
2. Based upon 91 days of operation per year.
Indirect Costs
CAPITAL COSTS
RO Water Treatment Plant
Engineering & Contingencies (20%)
Total Project Cost
ANNUAL COSTS
Ammortized Annual Cost (3.5% for 20 Years) 1
Operation and Maintenance:
Water Treatment Plant Energy Cost
Chemicals
Unit Cost of Water ($ per 1,000 gallons) 2
Unit Cost of Water ($ per acft) 2
Total Annual Cost
Available Project Yield, MGD
Available Project Yield, AF/yr
Actual Project Yield, AF/yr 2
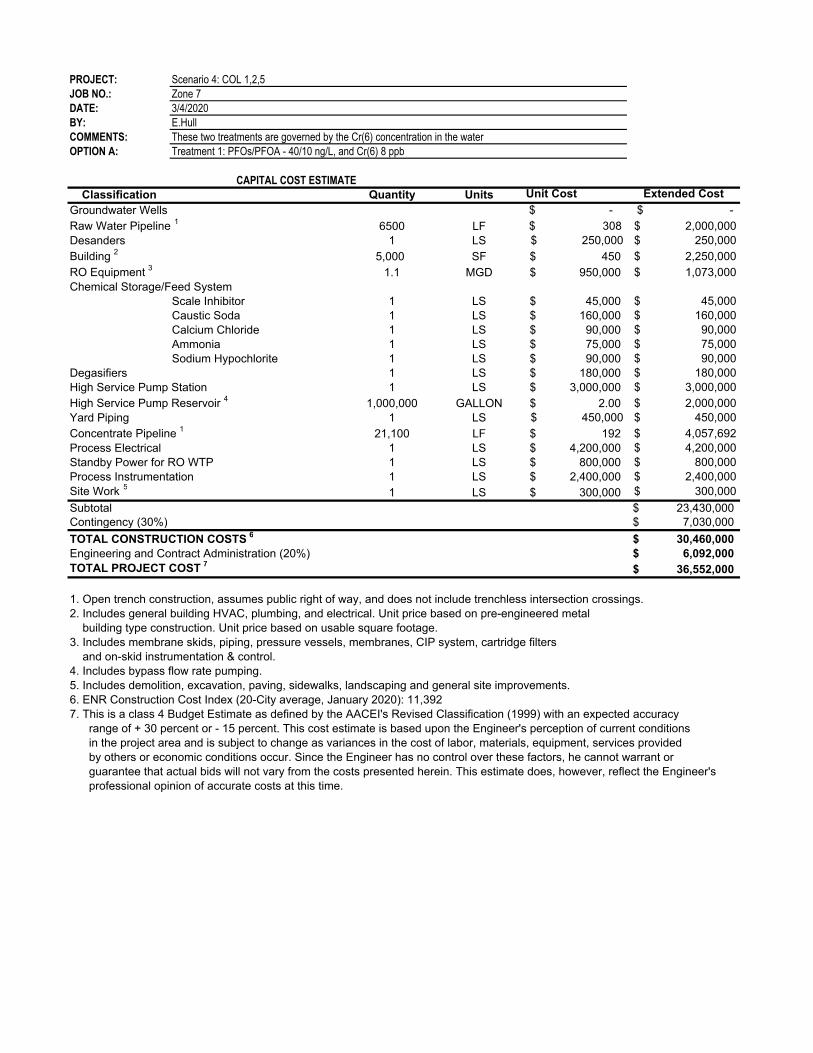
PROJECT: Scenario 4: COL 1,2,5
JOB NO.: Zone 7
DATE: 3/4/2020
BY: E.Hull
COMMENTS: These two treatments are governed by the Cr(6) concentration in the water
OPTION A: Treatment 1: PFOs/PFOA - 40/10 ng/L, and Cr(6) 8 ppb
CAPITAL COST ESTIMATE
Classification Quantity Units Unit Cost Extended Cost
Groundwater Wells $ - $ -
Raw Water Pipeline 1
6500 LF $ 308 $ 2,000,000
Desanders 1 LS $ 250,000 $ 250,000
Building 2
5,000 SF 450$ $ 2,250,000
RO Equipment 3
1.1 MGD 950,000$ $ 1,073,000
Chemical Storage/Feed System
Scale Inhibitor 1 LS 45,000$ $ 45,000
Caustic Soda 1 LS 160,000$ $ 160,000
Calcium Chloride 1 LS 90,000$ $ 90,000
Ammonia 1 LS 75,000$ $ 75,000
Sodium Hypochlorite 1 LS 90,000$ $ 90,000
Degasifiers 1 LS 180,000$ $ 180,000
High Service Pump Station 1 LS 3,000,000$ $ 3,000,000
High Service Pump Reservoir 4
1,000,000 GALLON 2.00$ $ 2,000,000
Yard Piping 1 LS $ 450,000 $ 450,000
Concentrate Pipeline 1
21,100 LF 192$ $ 4,057,692
Process Electrical 1 LS 4,200,000$ $ 4,200,000
Standby Power for RO WTP 1 LS 800,000$ $ 800,000
Process Instrumentation 1 LS 2,400,000$ $ 2,400,000
Site Work 5
1 LS 300,000$ $ 300,000
Subtotal 23,430,000$ Contingency (30%) 7,030,000$
TOTAL CONSTRUCTION COSTS 6
30,460,000$
Engineering and Contract Administration (20%) 6,092,000$
TOTAL PROJECT COST 7
36,552,000$
1. Open trench construction, assumes public right of way, and does not include trenchless intersection crossings.
2. Includes general building HVAC, plumbing, and electrical. Unit price based on pre-engineered metal
building type construction. Unit price based on usable square footage.
3. Includes membrane skids, piping, pressure vessels, membranes, CIP system, cartridge filters
and on-skid instrumentation & control.
4. Includes bypass flow rate pumping.
5. Includes demolition, excavation, paving, sidewalks, landscaping and general site improvements.
6. ENR Construction Cost Index (20-City average, January 2020): 11,392
7. This is a class 4 Budget Estimate as defined by the AACEI's Revised Classification (1999) with an expected accuracy
range of + 30 percent or - 15 percent. This cost estimate is based upon the Engineer's perception of current conditions
in the project area and is subject to change as variances in the cost of labor, materials, equipment, services provided
by others or economic conditions occur. Since the Engineer has no control over these factors, he cannot warrant or
guarantee that actual bids will not vary from the costs presented herein. This estimate does, however, reflect the Engineer's
professional opinion of accurate costs at this time.
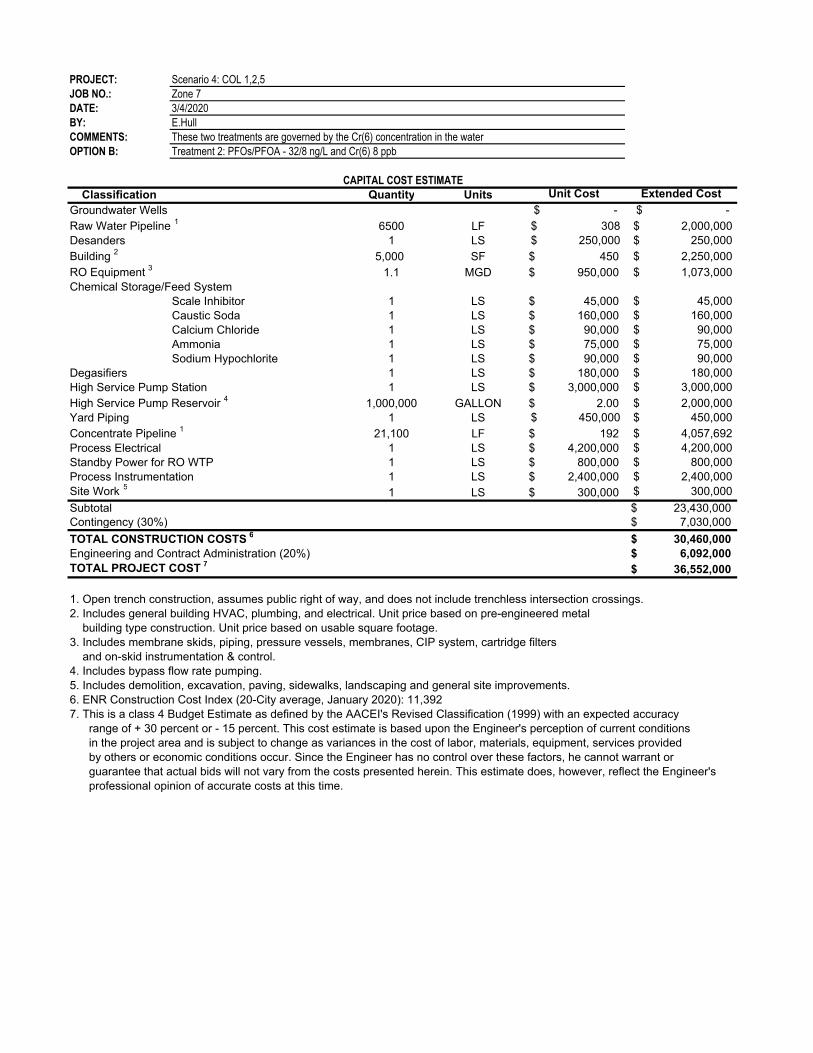
PROJECT: Scenario 4: COL 1,2,5
JOB NO.: Zone 7
DATE: 3/4/2020
BY: E.Hull
COMMENTS: These two treatments are governed by the Cr(6) concentration in the water
OPTION B: Treatment 2: PFOs/PFOA - 32/8 ng/L and Cr(6) 8 ppb
CAPITAL COST ESTIMATE
Classification Quantity Units Unit Cost Extended Cost
Groundwater Wells $ - $ -
Raw Water Pipeline 1
6500 LF $ 308 $ 2,000,000
Desanders 1 LS $ 250,000 $ 250,000
Building 2
5,000 SF 450$ $ 2,250,000
RO Equipment 3
1.1 MGD 950,000$ $ 1,073,000
Chemical Storage/Feed System
Scale Inhibitor 1 LS 45,000$ $ 45,000
Caustic Soda 1 LS 160,000$ $ 160,000
Calcium Chloride 1 LS 90,000$ $ 90,000
Ammonia 1 LS 75,000$ $ 75,000
Sodium Hypochlorite 1 LS 90,000$ $ 90,000
Degasifiers 1 LS 180,000$ $ 180,000
High Service Pump Station 1 LS 3,000,000$ $ 3,000,000
High Service Pump Reservoir 4
1,000,000 GALLON 2.00$ $ 2,000,000
Yard Piping 1 LS $ 450,000 $ 450,000
Concentrate Pipeline 1
21,100 LF 192$ $ 4,057,692
Process Electrical 1 LS 4,200,000$ $ 4,200,000
Standby Power for RO WTP 1 LS 800,000$ $ 800,000
Process Instrumentation 1 LS 2,400,000$ $ 2,400,000
Site Work 5
1 LS 300,000$ $ 300,000
Subtotal 23,430,000$ Contingency (30%) 7,030,000$
TOTAL CONSTRUCTION COSTS 6
30,460,000$
Engineering and Contract Administration (20%) 6,092,000$
TOTAL PROJECT COST 7
36,552,000$
1. Open trench construction, assumes public right of way, and does not include trenchless intersection crossings.
2. Includes general building HVAC, plumbing, and electrical. Unit price based on pre-engineered metal
building type construction. Unit price based on usable square footage.
3. Includes membrane skids, piping, pressure vessels, membranes, CIP system, cartridge filters
and on-skid instrumentation & control.
4. Includes bypass flow rate pumping.
5. Includes demolition, excavation, paving, sidewalks, landscaping and general site improvements.
6. ENR Construction Cost Index (20-City average, January 2020): 11,392
7. This is a class 4 Budget Estimate as defined by the AACEI's Revised Classification (1999) with an expected accuracy
range of + 30 percent or - 15 percent. This cost estimate is based upon the Engineer's perception of current conditions
in the project area and is subject to change as variances in the cost of labor, materials, equipment, services provided
by others or economic conditions occur. Since the Engineer has no control over these factors, he cannot warrant or
guarantee that actual bids will not vary from the costs presented herein. This estimate does, however, reflect the Engineer's
professional opinion of accurate costs at this time.

PROJECT: Scenario 4: COL 1,2,5
JOB NO.: Zone 7
DATE: 3/4/2020
BY: E.Hull
COMMENTS:
OPTION A: Treatment 3: Vermont’s standard of PFOS + PFOA + PFHxS + PFHpA + PFNA < 20 ppt and Cr(6) 8 ppb
CAPITAL COST ESTIMATE
Classification Quantity Units Unit Cost Extended Cost
Groundwater Wells $ - $ -
Raw Water Pipeline 1
6500 LF $ 308 $ 2,000,000
Desanders 1 LS $ 350,000 $ 350,000
Building 2
9,500 SF 450$ $ 4,275,000
RO Equipment 3
5.4 MGD 950,000$ $ 5,142,000
Chemical Storage/Feed System
Scale Inhibitor 1 LS 80,000$ $ 80,000
Caustic Soda 1 LS 280,000$ $ 280,000
Calcium Chloride 1 LS 180,000$ $ 180,000
Ammonia 1 LS 140,000$ $ 140,000
Sodium Hypochlorite 1 LS 180,000$ $ 180,000
Degasifiers 1 LS 280,000$ $ 280,000
High Service Pump Station 1 LS 3,000,000$ $ 3,000,000
High Service Pump Reservoir 4
1,000,000 GALLON 2.00$ $ 2,000,000
Yard Piping 1 LS $ 450,000 $ 450,000
Concentrate Pipeline 1
21,100 LF 192$ $ 4,057,692
Process Electrical 1 LS 6,700,000$ $ 6,700,000
Standby Power for RO WTP 1 LS 1,200,000$ $ 1,200,000
Process Instrumentation 1 LS 3,800,000$ $ 3,800,000
Site Work 5
1 LS 300,000$ $ 300,000
Subtotal 34,420,000$ Contingency (30%) 10,330,000$
TOTAL CONSTRUCTION COSTS 6
44,750,000$
Engineering and Contract Administration (20%) 8,950,000$
TOTAL PROJECT COST 7
53,700,000$
1. Open trench construction, assumes public right of way, and does not include trenchless intersection crossings.
2. Includes general building HVAC, plumbing, and electrical. Unit price based on pre-engineered metal
building type construction. Unit price based on usable square footage.
3. Includes membrane skids, piping, pressure vessels, membranes, CIP system, cartridge filters
and on-skid instrumentation & control.
4. Includes bypass flow rate pumping.
5. Includes demolition, excavation, paving, sidewalks, landscaping and general site improvements.
6. ENR Construction Cost Index (20-City average, January 2020): 11,392
7. This is a class 4 Budget Estimate as defined by the AACEI's Revised Classification (1999) with an expected accuracy
range of + 30 percent or - 15 percent. This cost estimate is based upon the Engineer's perception of current conditions
in the project area and is subject to change as variances in the cost of labor, materials, equipment, services provided
by others or economic conditions occur. Since the Engineer has no control over these factors, he cannot warrant or
guarantee that actual bids will not vary from the costs presented herein. This estimate does, however, reflect the Engineer's
professional opinion of accurate costs at this time.
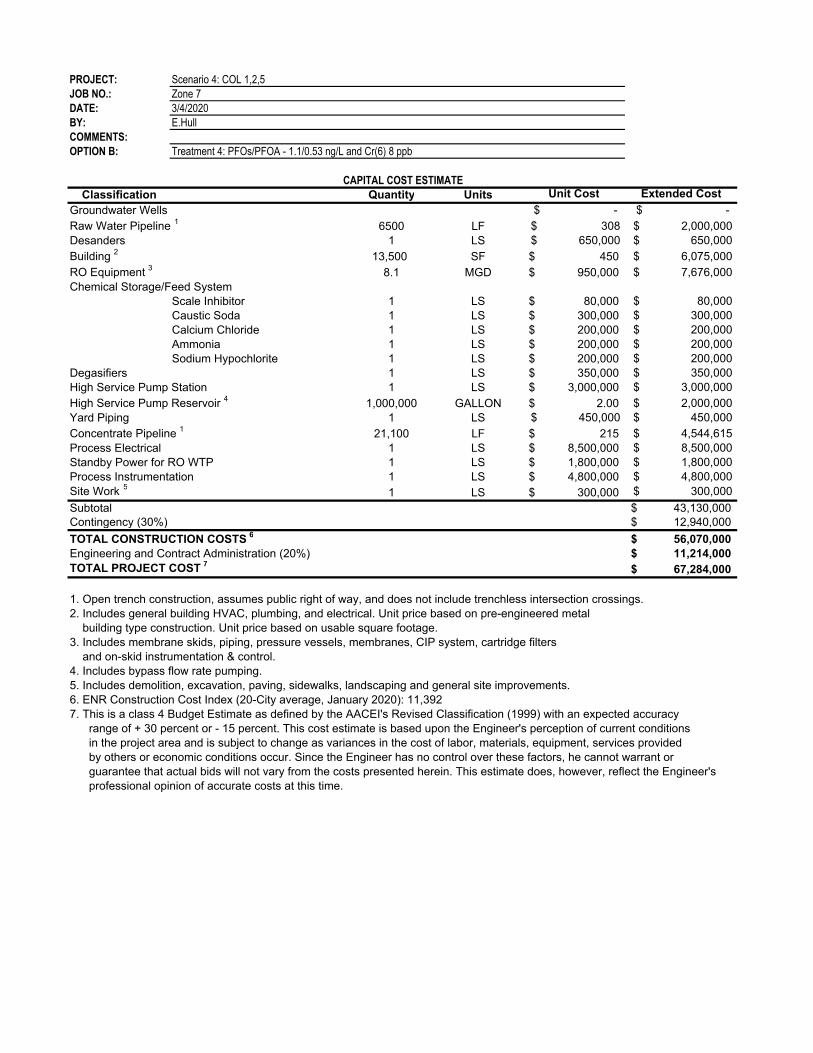
PROJECT: Scenario 4: COL 1,2,5
JOB NO.: Zone 7
DATE: 3/4/2020
BY: E.Hull
COMMENTS:
OPTION B: Treatment 4: PFOs/PFOA - 1.1/0.53 ng/L and Cr(6) 8 ppb
CAPITAL COST ESTIMATE
Classification Quantity Units Unit Cost Extended Cost
Groundwater Wells $ - $ -
Raw Water Pipeline 1
6500 LF $ 308 $ 2,000,000
Desanders 1 LS $ 650,000 $ 650,000
Building 2
13,500 SF 450$ $ 6,075,000
RO Equipment 3
8.1 MGD 950,000$ $ 7,676,000
Chemical Storage/Feed System
Scale Inhibitor 1 LS 80,000$ $ 80,000
Caustic Soda 1 LS 300,000$ $ 300,000
Calcium Chloride 1 LS 200,000$ $ 200,000
Ammonia 1 LS 200,000$ $ 200,000
Sodium Hypochlorite 1 LS 200,000$ $ 200,000
Degasifiers 1 LS 350,000$ $ 350,000
High Service Pump Station 1 LS 3,000,000$ $ 3,000,000
High Service Pump Reservoir 4
1,000,000 GALLON 2.00$ $ 2,000,000
Yard Piping 1 LS $ 450,000 $ 450,000
Concentrate Pipeline 1
21,100 LF 215$ $ 4,544,615
Process Electrical 1 LS 8,500,000$ $ 8,500,000
Standby Power for RO WTP 1 LS 1,800,000$ $ 1,800,000
Process Instrumentation 1 LS 4,800,000$ $ 4,800,000
Site Work 5
1 LS 300,000$ $ 300,000
Subtotal 43,130,000$ Contingency (30%) 12,940,000$
TOTAL CONSTRUCTION COSTS 6
56,070,000$
Engineering and Contract Administration (20%) 11,214,000$
TOTAL PROJECT COST 7
67,284,000$
1. Open trench construction, assumes public right of way, and does not include trenchless intersection crossings.
2. Includes general building HVAC, plumbing, and electrical. Unit price based on pre-engineered metal
building type construction. Unit price based on usable square footage.
3. Includes membrane skids, piping, pressure vessels, membranes, CIP system, cartridge filters
and on-skid instrumentation & control.
4. Includes bypass flow rate pumping.
5. Includes demolition, excavation, paving, sidewalks, landscaping and general site improvements.
6. ENR Construction Cost Index (20-City average, January 2020): 11,392
7. This is a class 4 Budget Estimate as defined by the AACEI's Revised Classification (1999) with an expected accuracy
range of + 30 percent or - 15 percent. This cost estimate is based upon the Engineer's perception of current conditions
in the project area and is subject to change as variances in the cost of labor, materials, equipment, services provided
by others or economic conditions occur. Since the Engineer has no control over these factors, he cannot warrant or
guarantee that actual bids will not vary from the costs presented herein. This estimate does, however, reflect the Engineer's
professional opinion of accurate costs at this time.

PROJECT: Scenario 4: COL 1,2,5
JOB NO.: Zone 7
DATE: 3/4/2020
BY: E.Hull
COMMENTS: These two treatments are governed by the Cr(6) concentration in the water
Annual Operation & Maintenance Costs 1
40/10 ng/L, and Cr(6) 8
ppb
Treatment 2: PFOs/PFOA -
32/8 ng/L and Cr(6) 8 ppb
Well Pumping 296,000 296,000
RO Feed Pumping 23,000 23,000
Interstage Pumping 7,000 7,000
Decarbonation Tower Blowers 11,000 11,000
High Service Pumping 282,000 282,000
Electrical Pumping Costs 619,000 619,000
Cost per 1,000 gallons 0.67 0.67
Cartridge Filters 5,000 5,000
Sulfuric Acid - -
Scale Inhibitor 3,000 3,000
Calcium Chloride - -
Sodium Hydroxide - -
Lime - -
Carbon Dioxide - -
Aqua Ammonia 3,090 3,090
Chlorine Gas - -
Sodium Hypochlorite (12%) 22,000 22,000
Membrane Cleaning Chemicals 1,000 1,000
Chemical Operating Costs 34,090 34,090
Cost per 1,000 gallons 0.04 0.04
Membrane Replacement 41,580 41,580
Labor
Laboratory Testing 100,000 100,000
General Building Utilities 35,000 35,000
305,000 305,000
Indirect (Fixed) Operating Costs 481,580 481,580
Cost per 1,000 gallons 0.52 0.52
TOTAL COST 1,134,670 1,134,670
COST PER 1,000 GALLONS 1.22 1.22
1. Based upon 91 days of operation per year
Equipment Replacement Parts
and Consumables
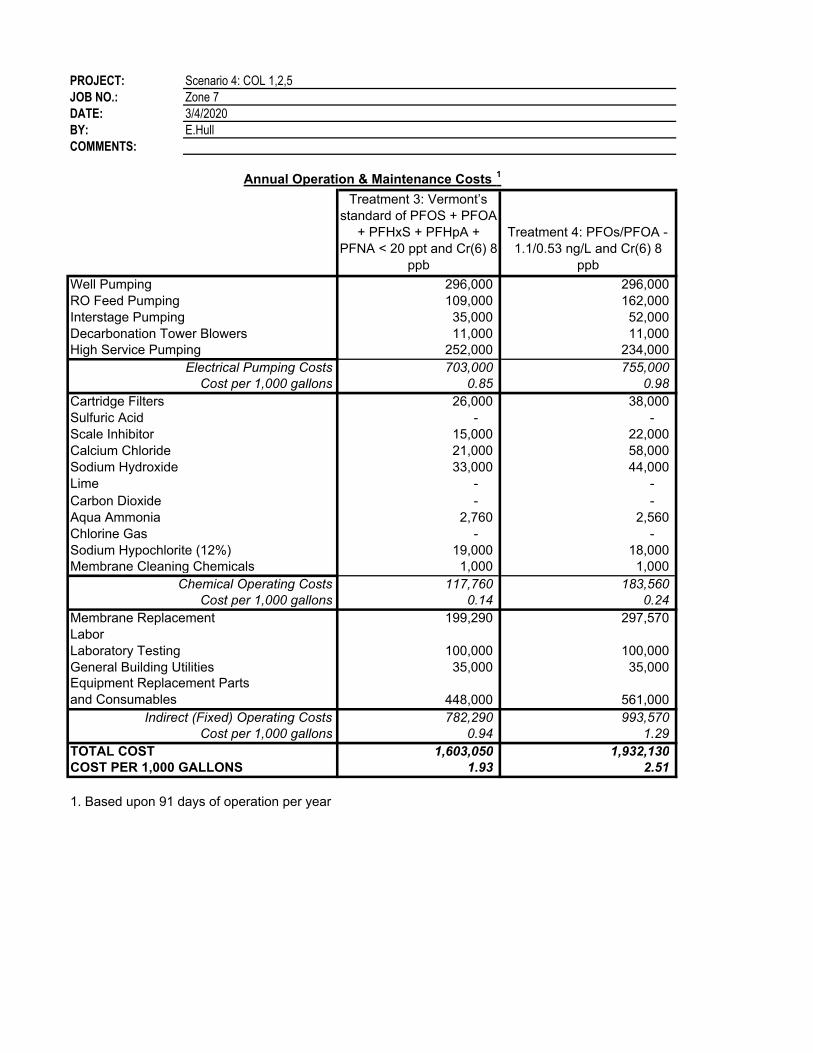
PROJECT: Scenario 4: COL 1,2,5
JOB NO.: Zone 7
DATE: 3/4/2020
BY: E.Hull
COMMENTS:
Annual Operation & Maintenance Costs 1
Treatment 3: Vermont’s
standard of PFOS + PFOA
+ PFHxS + PFHpA +
PFNA < 20 ppt and Cr(6) 8
ppb
Treatment 4: PFOs/PFOA -
1.1/0.53 ng/L and Cr(6) 8
ppb
Well Pumping 296,000 296,000
RO Feed Pumping 109,000 162,000
Interstage Pumping 35,000 52,000
Decarbonation Tower Blowers 11,000 11,000
High Service Pumping 252,000 234,000
Electrical Pumping Costs 703,000 755,000
Cost per 1,000 gallons 0.85 0.98
Cartridge Filters 26,000 38,000
Sulfuric Acid - -
Scale Inhibitor 15,000 22,000
Calcium Chloride 21,000 58,000
Sodium Hydroxide 33,000 44,000
Lime - -
Carbon Dioxide - -
Aqua Ammonia 2,760 2,560
Chlorine Gas - -
Sodium Hypochlorite (12%) 19,000 18,000
Membrane Cleaning Chemicals 1,000 1,000
Chemical Operating Costs 117,760 183,560
Cost per 1,000 gallons 0.14 0.24
Membrane Replacement 199,290 297,570
Labor
Laboratory Testing 100,000 100,000
General Building Utilities 35,000 35,000
448,000 561,000
Indirect (Fixed) Operating Costs 782,290 993,570
Cost per 1,000 gallons 0.94 1.29
TOTAL COST 1,603,050 1,932,130
COST PER 1,000 GALLONS 1.93 2.51
1. Based upon 91 days of operation per year
Equipment Replacement Parts
and Consumables
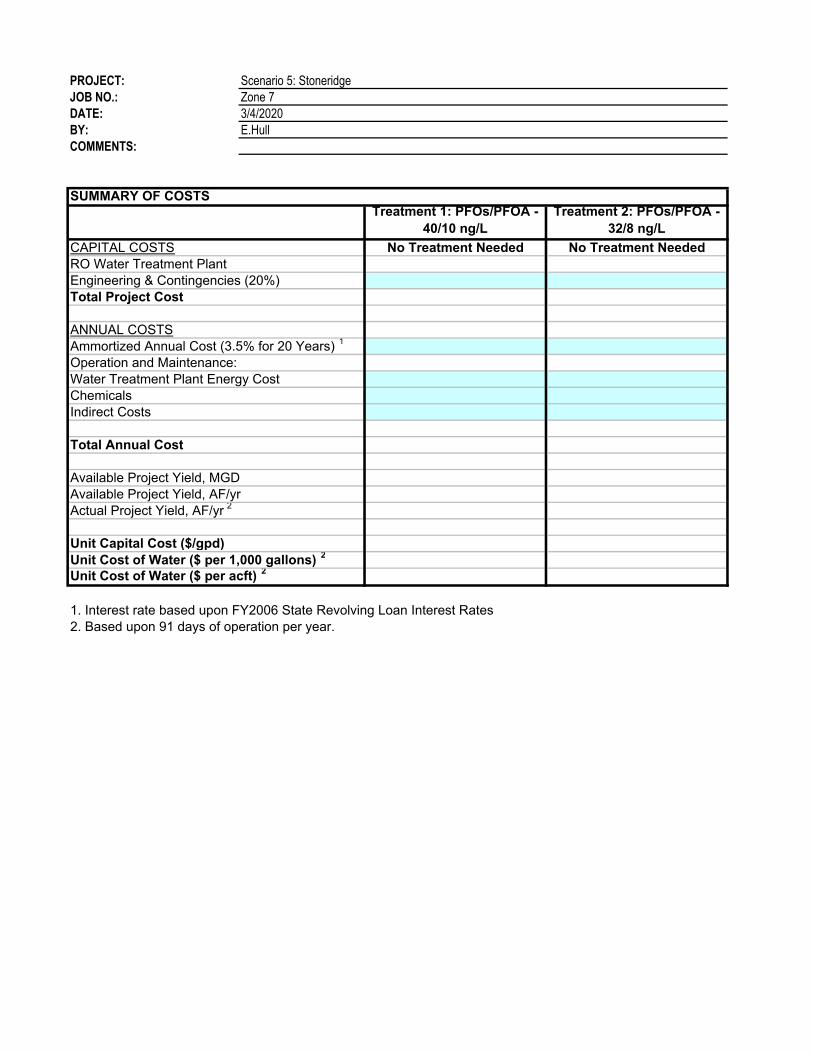
PROJECT: Scenario 5: Stoneridge
JOB NO.: Zone 7
DATE: 3/4/2020
BY: E.Hull
COMMENTS:
SUMMARY OF COSTSTreatment 1: PFOs/PFOA -
40/10 ng/L
Treatment 2: PFOs/PFOA -
32/8 ng/L
No Treatment Needed No Treatment Needed
Unit Capital Cost ($/gpd)
1. Interest rate based upon FY2006 State Revolving Loan Interest Rates
2. Based upon 91 days of operation per year.
Unit Cost of Water ($ per 1,000 gallons) 2
Unit Cost of Water ($ per acft) 2
Total Annual Cost
Available Project Yield, MGD
Available Project Yield, AF/yr
Actual Project Yield, AF/yr 2
Indirect Costs
CAPITAL COSTS
RO Water Treatment Plant
Engineering & Contingencies (20%)
Total Project Cost
ANNUAL COSTS
Ammortized Annual Cost (3.5% for 20 Years) 1
Operation and Maintenance:
Water Treatment Plant Energy Cost
Chemicals
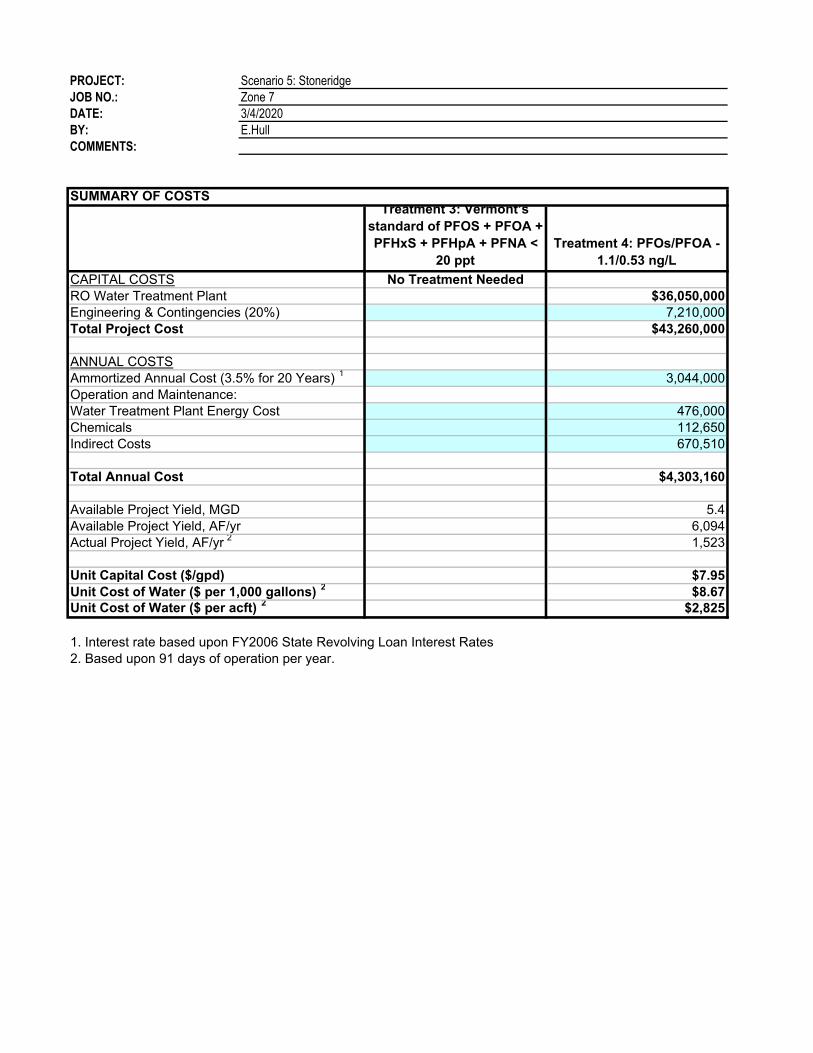
PROJECT: Scenario 5: Stoneridge
JOB NO.: Zone 7
DATE: 3/4/2020
BY: E.Hull
COMMENTS:
SUMMARY OF COSTSTreatment 3: Vermont’s
standard of PFOS + PFOA +
PFHxS + PFHpA + PFNA <
20 ppt
Treatment 4: PFOs/PFOA -
1.1/0.53 ng/L
No Treatment Needed
$36,050,000
7,210,000
$43,260,000
3,044,000
476,000
112,650
670,510
$4,303,160
5.4
6,094
1,523
Unit Capital Cost ($/gpd) $7.95
$8.67$2,825
1. Interest rate based upon FY2006 State Revolving Loan Interest Rates
2. Based upon 91 days of operation per year.
Indirect Costs
CAPITAL COSTS
RO Water Treatment Plant
Engineering & Contingencies (20%)
Total Project Cost
ANNUAL COSTS
Ammortized Annual Cost (3.5% for 20 Years) 1
Operation and Maintenance:
Water Treatment Plant Energy Cost
Chemicals
Unit Cost of Water ($ per 1,000 gallons) 2
Unit Cost of Water ($ per acft) 2
Total Annual Cost
Available Project Yield, MGD
Available Project Yield, AF/yr
Actual Project Yield, AF/yr 2
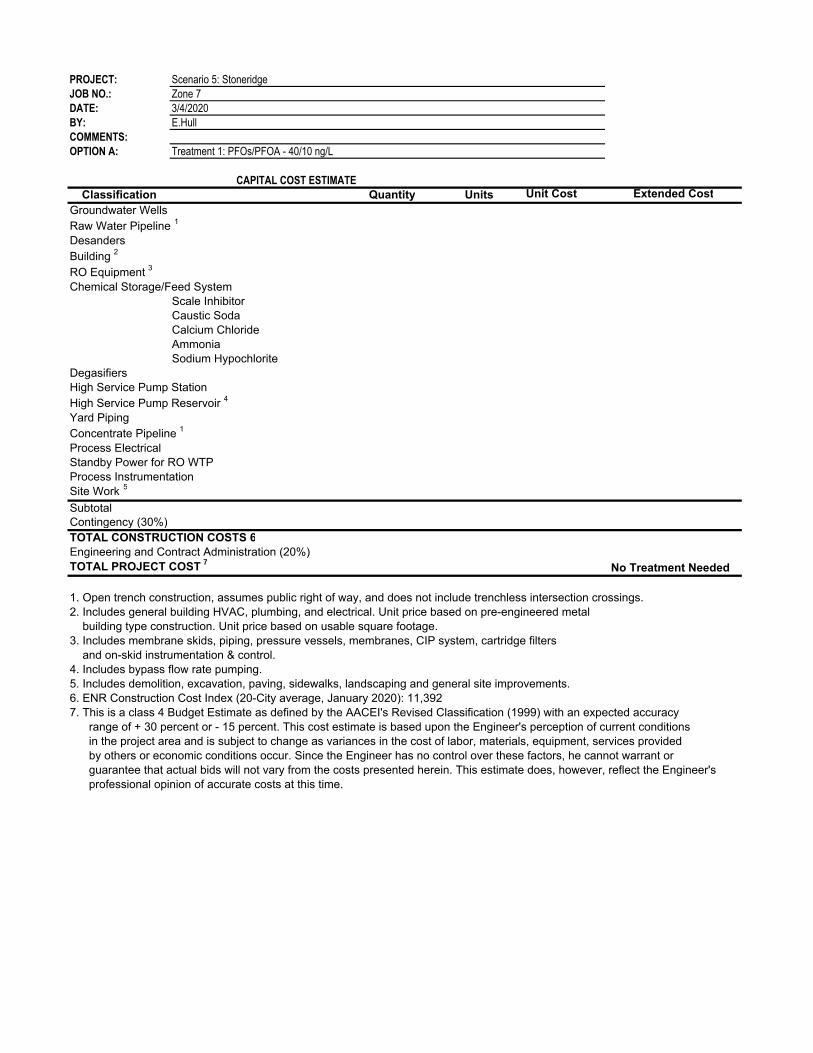
PROJECT: Scenario 5: Stoneridge
JOB NO.: Zone 7
DATE: 3/4/2020
BY: E.Hull
COMMENTS:
OPTION A: Treatment 1: PFOs/PFOA - 40/10 ng/L
CAPITAL COST ESTIMATE
Classification Quantity Units Unit Cost Extended Cost
Groundwater Wells
Raw Water Pipeline 1
Desanders
Building 2
RO Equipment 3
Chemical Storage/Feed System
Scale Inhibitor
Caustic Soda
Calcium Chloride
Ammonia
Sodium Hypochlorite
Degasifiers
High Service Pump Station
High Service Pump Reservoir 4
Yard Piping
Concentrate Pipeline 1
Process Electrical
Standby Power for RO WTP
Process Instrumentation
Site Work 5
Subtotal
Contingency (30%)
TOTAL CONSTRUCTION COSTS 6
Engineering and Contract Administration (20%)
TOTAL PROJECT COST 7
No Treatment Needed
1. Open trench construction, assumes public right of way, and does not include trenchless intersection crossings.
2. Includes general building HVAC, plumbing, and electrical. Unit price based on pre-engineered metal
building type construction. Unit price based on usable square footage.
3. Includes membrane skids, piping, pressure vessels, membranes, CIP system, cartridge filters
and on-skid instrumentation & control.
4. Includes bypass flow rate pumping.
5. Includes demolition, excavation, paving, sidewalks, landscaping and general site improvements.
6. ENR Construction Cost Index (20-City average, January 2020): 11,392
7. This is a class 4 Budget Estimate as defined by the AACEI's Revised Classification (1999) with an expected accuracy
range of + 30 percent or - 15 percent. This cost estimate is based upon the Engineer's perception of current conditions
in the project area and is subject to change as variances in the cost of labor, materials, equipment, services provided
by others or economic conditions occur. Since the Engineer has no control over these factors, he cannot warrant or
guarantee that actual bids will not vary from the costs presented herein. This estimate does, however, reflect the Engineer's
professional opinion of accurate costs at this time.
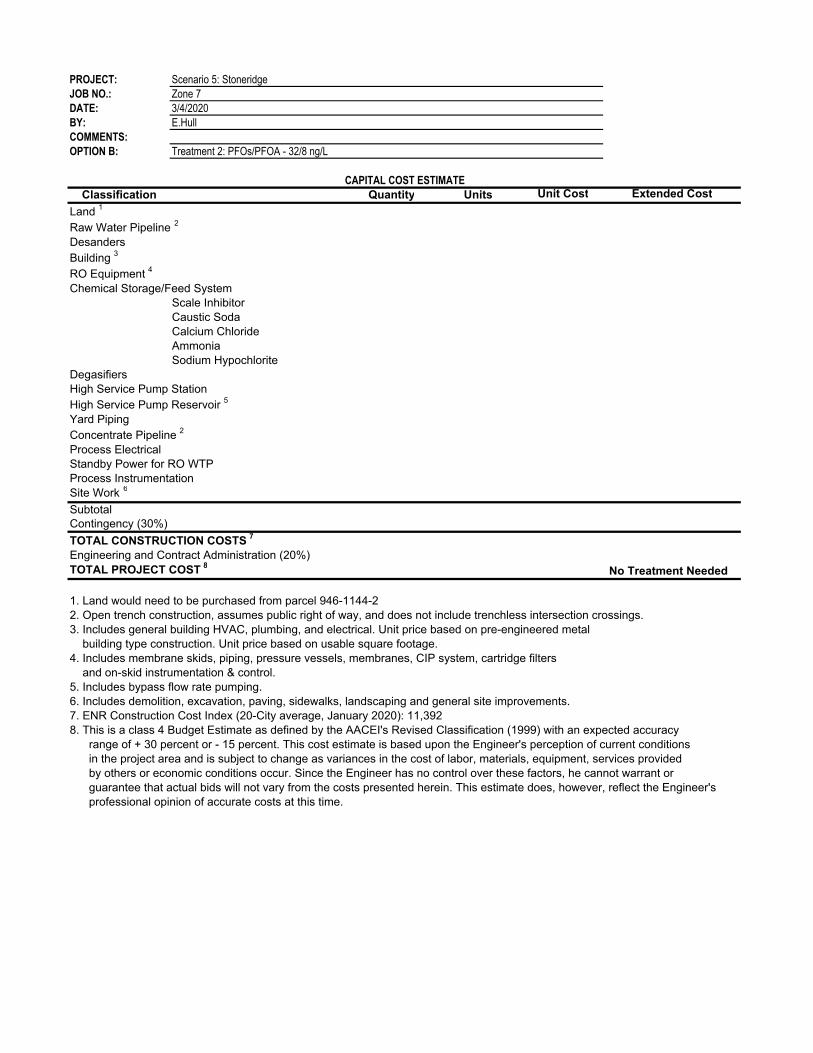
PROJECT: Scenario 5: Stoneridge
JOB NO.: Zone 7
DATE: 3/4/2020
BY: E.Hull
COMMENTS:
OPTION B: Treatment 2: PFOs/PFOA - 32/8 ng/L
CAPITAL COST ESTIMATE
Classification Quantity Units Unit Cost Extended Cost
Land 1
Raw Water Pipeline 2
Desanders
Building 3
RO Equipment 4
Chemical Storage/Feed System
Scale Inhibitor
Caustic Soda
Calcium Chloride
Ammonia
Sodium Hypochlorite
Degasifiers
High Service Pump Station
High Service Pump Reservoir 5
Yard Piping
Concentrate Pipeline 2
Process Electrical
Standby Power for RO WTP
Process Instrumentation
Site Work 6
Subtotal
Contingency (30%)
TOTAL CONSTRUCTION COSTS 7
Engineering and Contract Administration (20%)
TOTAL PROJECT COST 8
No Treatment Needed
1. Land would need to be purchased from parcel 946-1144-2
2. Open trench construction, assumes public right of way, and does not include trenchless intersection crossings.
3. Includes general building HVAC, plumbing, and electrical. Unit price based on pre-engineered metal
building type construction. Unit price based on usable square footage.
4. Includes membrane skids, piping, pressure vessels, membranes, CIP system, cartridge filters
and on-skid instrumentation & control.
5. Includes bypass flow rate pumping.
6. Includes demolition, excavation, paving, sidewalks, landscaping and general site improvements.
7. ENR Construction Cost Index (20-City average, January 2020): 11,392
8. This is a class 4 Budget Estimate as defined by the AACEI's Revised Classification (1999) with an expected accuracy
range of + 30 percent or - 15 percent. This cost estimate is based upon the Engineer's perception of current conditions
in the project area and is subject to change as variances in the cost of labor, materials, equipment, services provided
by others or economic conditions occur. Since the Engineer has no control over these factors, he cannot warrant or
guarantee that actual bids will not vary from the costs presented herein. This estimate does, however, reflect the Engineer's
professional opinion of accurate costs at this time.
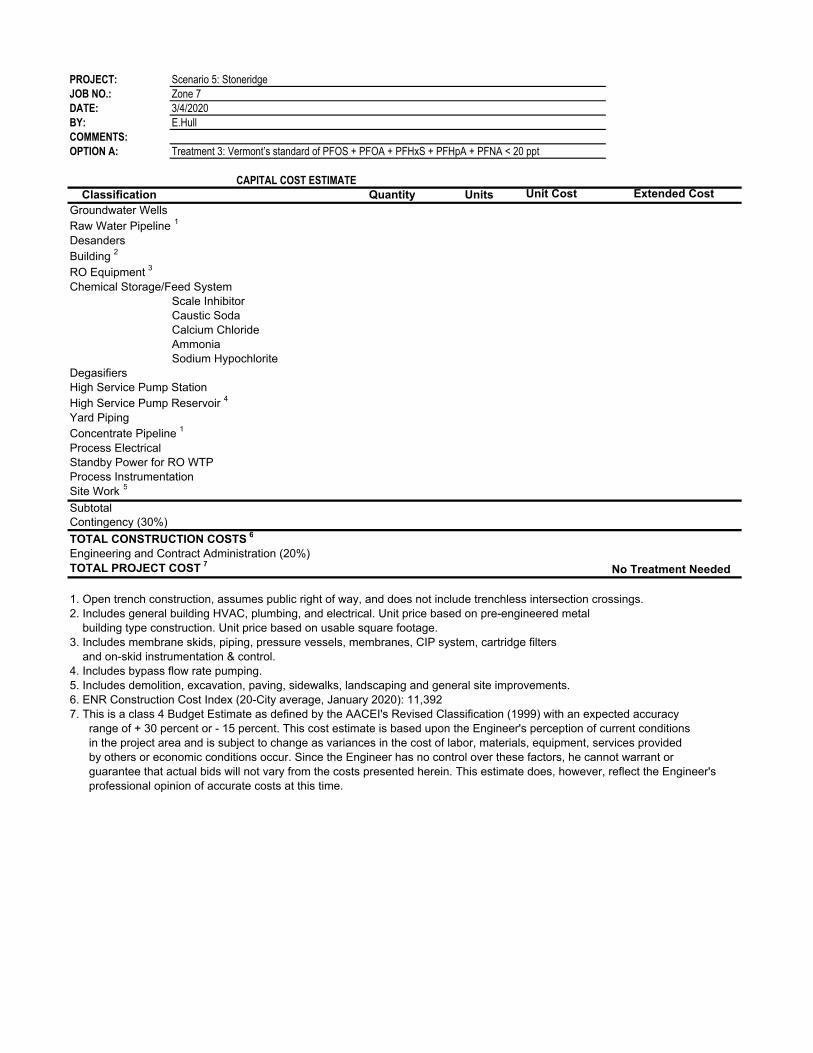
PROJECT: Scenario 5: Stoneridge
JOB NO.: Zone 7
DATE: 3/4/2020
BY: E.Hull
COMMENTS:
OPTION A: Treatment 3: Vermont’s standard of PFOS + PFOA + PFHxS + PFHpA + PFNA < 20 ppt
CAPITAL COST ESTIMATE
Classification Quantity Units Unit Cost Extended Cost
Groundwater Wells
Raw Water Pipeline 1
Desanders
Building 2
RO Equipment 3
Chemical Storage/Feed System
Scale Inhibitor
Caustic Soda
Calcium Chloride
Ammonia
Sodium Hypochlorite
Degasifiers
High Service Pump Station
High Service Pump Reservoir 4
Yard Piping
Concentrate Pipeline 1
Process Electrical
Standby Power for RO WTP
Process Instrumentation
Site Work 5
Subtotal
Contingency (30%)
TOTAL CONSTRUCTION COSTS 6
Engineering and Contract Administration (20%)
TOTAL PROJECT COST 7
No Treatment Needed
1. Open trench construction, assumes public right of way, and does not include trenchless intersection crossings.
2. Includes general building HVAC, plumbing, and electrical. Unit price based on pre-engineered metal
building type construction. Unit price based on usable square footage.
3. Includes membrane skids, piping, pressure vessels, membranes, CIP system, cartridge filters
and on-skid instrumentation & control.
4. Includes bypass flow rate pumping.
5. Includes demolition, excavation, paving, sidewalks, landscaping and general site improvements.
6. ENR Construction Cost Index (20-City average, January 2020): 11,392
7. This is a class 4 Budget Estimate as defined by the AACEI's Revised Classification (1999) with an expected accuracy
range of + 30 percent or - 15 percent. This cost estimate is based upon the Engineer's perception of current conditions
in the project area and is subject to change as variances in the cost of labor, materials, equipment, services provided
by others or economic conditions occur. Since the Engineer has no control over these factors, he cannot warrant or
guarantee that actual bids will not vary from the costs presented herein. This estimate does, however, reflect the Engineer's
professional opinion of accurate costs at this time.
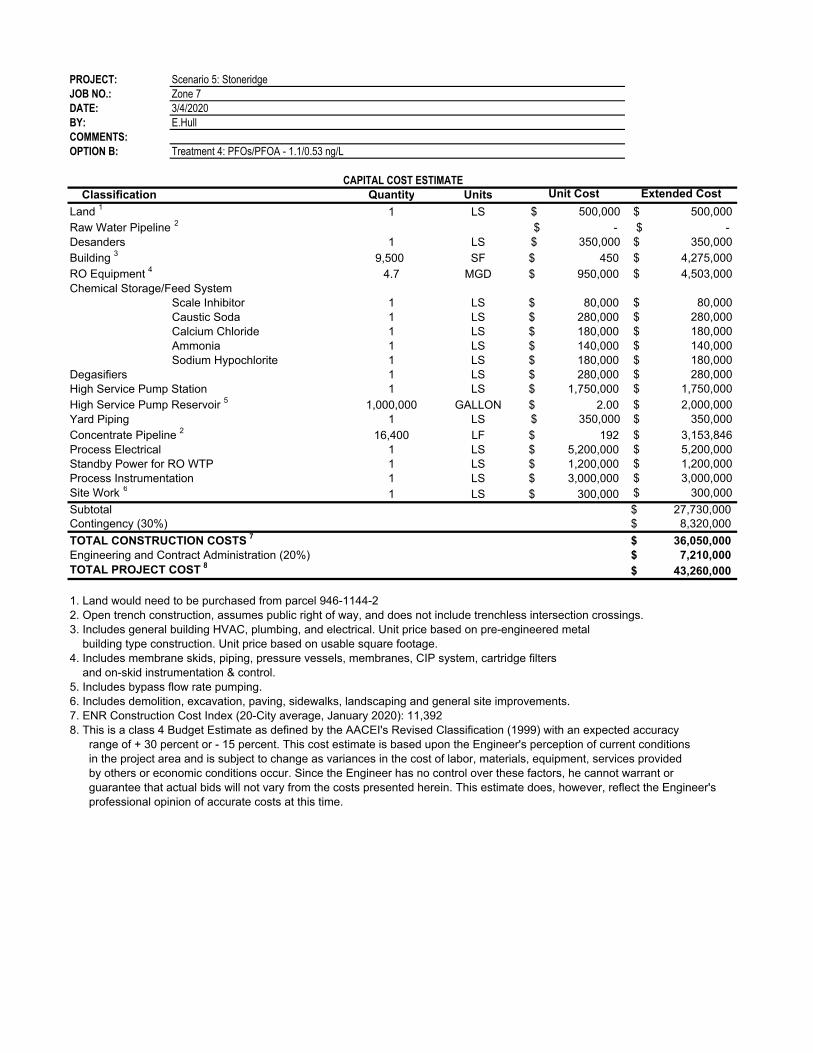
PROJECT: Scenario 5: Stoneridge
JOB NO.: Zone 7
DATE: 3/4/2020
BY: E.Hull
COMMENTS:
OPTION B: Treatment 4: PFOs/PFOA - 1.1/0.53 ng/L
CAPITAL COST ESTIMATE
Classification Quantity Units Unit Cost Extended Cost
Land 1
1 LS $ 500,000 $ 500,000
Raw Water Pipeline 2
$ - $ -
Desanders 1 LS $ 350,000 $ 350,000
Building 3
9,500 SF 450$ $ 4,275,000
RO Equipment 4
4.7 MGD 950,000$ $ 4,503,000
Chemical Storage/Feed System
Scale Inhibitor 1 LS 80,000$ $ 80,000
Caustic Soda 1 LS 280,000$ $ 280,000
Calcium Chloride 1 LS 180,000$ $ 180,000
Ammonia 1 LS 140,000$ $ 140,000
Sodium Hypochlorite 1 LS 180,000$ $ 180,000
Degasifiers 1 LS 280,000$ $ 280,000
High Service Pump Station 1 LS 1,750,000$ $ 1,750,000
High Service Pump Reservoir 5
1,000,000 GALLON 2.00$ $ 2,000,000
Yard Piping 1 LS $ 350,000 $ 350,000
Concentrate Pipeline 2
16,400 LF 192$ $ 3,153,846
Process Electrical 1 LS 5,200,000$ $ 5,200,000
Standby Power for RO WTP 1 LS 1,200,000$ $ 1,200,000
Process Instrumentation 1 LS 3,000,000$ $ 3,000,000
Site Work 6
1 LS 300,000$ $ 300,000
Subtotal 27,730,000$ Contingency (30%) 8,320,000$
TOTAL CONSTRUCTION COSTS 7
36,050,000$
Engineering and Contract Administration (20%) 7,210,000$
TOTAL PROJECT COST 8
43,260,000$
1. Land would need to be purchased from parcel 946-1144-2
2. Open trench construction, assumes public right of way, and does not include trenchless intersection crossings.
3. Includes general building HVAC, plumbing, and electrical. Unit price based on pre-engineered metal
building type construction. Unit price based on usable square footage.
4. Includes membrane skids, piping, pressure vessels, membranes, CIP system, cartridge filters
and on-skid instrumentation & control.
5. Includes bypass flow rate pumping.
6. Includes demolition, excavation, paving, sidewalks, landscaping and general site improvements.
7. ENR Construction Cost Index (20-City average, January 2020): 11,392
8. This is a class 4 Budget Estimate as defined by the AACEI's Revised Classification (1999) with an expected accuracy
range of + 30 percent or - 15 percent. This cost estimate is based upon the Engineer's perception of current conditions
in the project area and is subject to change as variances in the cost of labor, materials, equipment, services provided
by others or economic conditions occur. Since the Engineer has no control over these factors, he cannot warrant or
guarantee that actual bids will not vary from the costs presented herein. This estimate does, however, reflect the Engineer's
professional opinion of accurate costs at this time.

PROJECT: Scenario 5: Stoneridge
JOB NO.: Zone 7
DATE: 3/4/2020
BY: E.Hull
COMMENTS:
Annual Operation & Maintenance Costs 1
Treatment 1: PFOs/PFOA -
40/10 ng/L
Treatment 2: PFOs/PFOA -
32/8 ng/L
Well Pumping No Treatement Needed No Treatment Needed
RO Feed Pumping
Interstage Pumping
Decarbonation Tower Blowers
High Service Pumping
Electrical Pumping Costs
Cost per 1,000 gallons
Cartridge Filters
Sulfuric Acid
Scale Inhibitor
Calcium Chloride
Sodium Hydroxide
Lime
Carbon Dioxide
Aqua Ammonia
Chlorine Gas
Sodium Hypochlorite (12%)
Membrane Cleaning Chemicals
Chemical Operating Costs
Cost per 1,000 gallons
Membrane Replacement
Labor
Laboratory Testing
General Building Utilities
Indirect (Fixed) Operating Costs
Cost per 1,000 gallons
TOTAL COST
COST PER 1,000 GALLONS
1. Based upon 91 days of operation per year
Equipment Replacement Parts
and Consumables
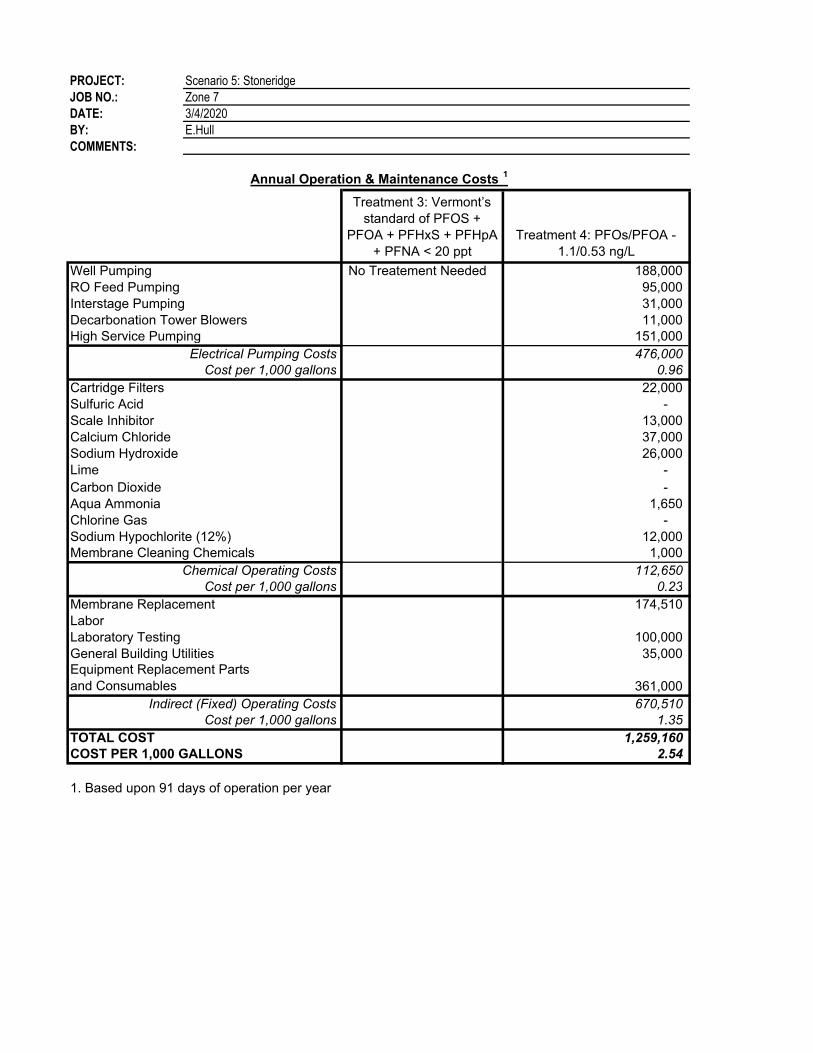
PROJECT: Scenario 5: Stoneridge
JOB NO.: Zone 7
DATE: 3/4/2020
BY: E.Hull
COMMENTS:
Annual Operation & Maintenance Costs 1
Treatment 3: Vermont’s
standard of PFOS +
PFOA + PFHxS + PFHpA
+ PFNA < 20 ppt
Treatment 4: PFOs/PFOA -
1.1/0.53 ng/L
Well Pumping No Treatement Needed 188,000
RO Feed Pumping 95,000
Interstage Pumping 31,000
Decarbonation Tower Blowers 11,000
High Service Pumping 151,000
Electrical Pumping Costs 476,000
Cost per 1,000 gallons 0.96
Cartridge Filters 22,000
Sulfuric Acid -
Scale Inhibitor 13,000
Calcium Chloride 37,000
Sodium Hydroxide 26,000
Lime -
Carbon Dioxide -
Aqua Ammonia 1,650
Chlorine Gas -
Sodium Hypochlorite (12%) 12,000
Membrane Cleaning Chemicals 1,000
Chemical Operating Costs 112,650
Cost per 1,000 gallons 0.23
Membrane Replacement 174,510
Labor
Laboratory Testing 100,000
General Building Utilities 35,000
361,000
Indirect (Fixed) Operating Costs 670,510
Cost per 1,000 gallons 1.35
TOTAL COST 1,259,160
COST PER 1,000 GALLONS 2.54
1. Based upon 91 days of operation per year
Equipment Replacement Parts
and Consumables

PROJECT: Scenario 6: Mocho 1
JOB NO.: Zone 7
DATE: 3/4/2020
BY: E.Hull
COMMENTS:
SUMMARY OF COSTSTreatment 1: PFOs/PFOA -
40/10 ng/L
Treatment 2: PFOs/PFOA -
32/8 ng/L
$23,590,000 $25,930,000
4,718,000 5,186,000
$28,308,000 $31,116,000
1,992,000 2,189,000
247,000 252,000
32,960 39,940
434,630 466,870
$2,706,590 $2,947,810
3.2 3.1
3,549 3,479
887 870
Unit Capital Cost ($/gpd) $8.94 $10.02
$9.36 $10.40$3,051 $3,389
1. Interest rate based upon FY2006 State Revolving Loan Interest Rates
2. Based upon 91 days of operation per year.
Indirect Costs
CAPITAL COSTS
RO Water Treatment Plant
Engineering & Contingencies (20%)
Total Project Cost
ANNUAL COSTS
Ammortized Annual Cost (3.5% for 20 Years) 1
Operation and Maintenance:
Water Treatment Plant Energy Cost
Chemicals
Unit Cost of Water ($ per 1,000 gallons) 2
Unit Cost of Water ($ per acft) 2
Total Annual Cost
Available Project Yield, MGD
Available Project Yield, AF/yr
Actual Project Yield, AF/yr 2
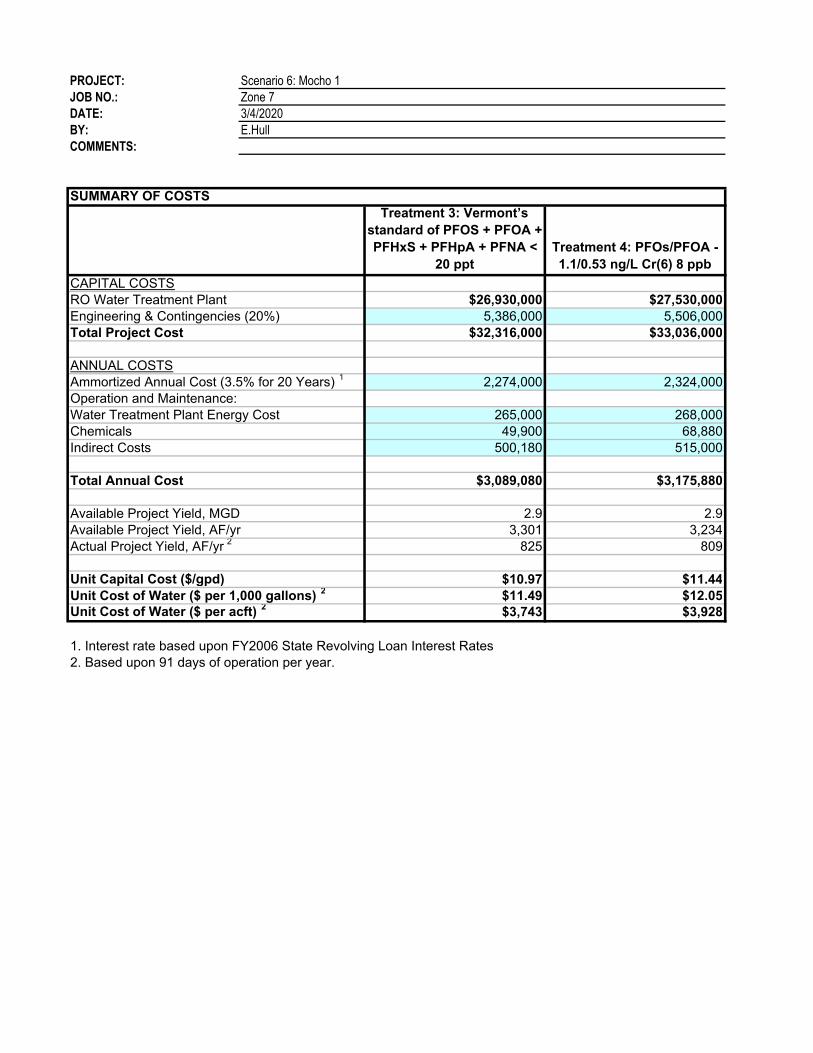
PROJECT: Scenario 6: Mocho 1
JOB NO.: Zone 7
DATE: 3/4/2020
BY: E.Hull
COMMENTS:
SUMMARY OF COSTS
Treatment 3: Vermont’s
standard of PFOS + PFOA +
PFHxS + PFHpA + PFNA <
20 ppt
Treatment 4: PFOs/PFOA -
1.1/0.53 ng/L Cr(6) 8 ppb
$26,930,000 $27,530,000
5,386,000 5,506,000
$32,316,000 $33,036,000
2,274,000 2,324,000
265,000 268,000
49,900 68,880
500,180 515,000
$3,089,080 $3,175,880
2.9 2.9
3,301 3,234
825 809
Unit Capital Cost ($/gpd) $10.97 $11.44
$11.49 $12.05$3,743 $3,928
1. Interest rate based upon FY2006 State Revolving Loan Interest Rates
2. Based upon 91 days of operation per year.
Indirect Costs
CAPITAL COSTS
RO Water Treatment Plant
Engineering & Contingencies (20%)
Total Project Cost
ANNUAL COSTS
Ammortized Annual Cost (3.5% for 20 Years) 1
Operation and Maintenance:
Water Treatment Plant Energy Cost
Chemicals
Unit Cost of Water ($ per 1,000 gallons) 2
Unit Cost of Water ($ per acft) 2
Total Annual Cost
Available Project Yield, MGD
Available Project Yield, AF/yr
Actual Project Yield, AF/yr 2

PROJECT: Scenario 6: Mocho 1
JOB NO.: Zone 7
DATE: 3/4/2020
BY: E.Hull
COMMENTS:
OPTION A: Treatment 1: PFOs/PFOA - 40/10 ng/L
CAPITAL COST ESTIMATE
Classification Quantity Units Unit Cost Extended Cost
Groundwater Wells $ - $ -
Raw Water Pipeline 1
600 LF $ 269 $ 161,538
Desanders 1 LS $ 250,000 $ 250,000
Building 2
5,000 SF 450$ $ 2,250,000
RO Equipment 3
1.7 MGD 950,000$ $ 1,643,000
Chemical Storage/Feed System
Scale Inhibitor 1 LS 45,000$ $ 45,000
Caustic Soda 1 LS 180,000$ $ 180,000
Calcium Chloride 1 LS 100,000$ $ 100,000
Ammonia 1 LS 85,000$ $ 85,000
Sodium Hypochlorite 1 LS 100,000$ $ 100,000
Degasifiers 1 LS 200,000$ $ 200,000
High Service Pump Station 1 LS 1,750,000$ $ 1,750,000
High Service Pump Reservoir 4
1,000,000 GALLON 2.00$ $ 2,000,000
Yard Piping 1 LS $ 350,000 $ 350,000
Concentrate Pipeline 1
12,600 LF 192$ $ 2,423,077
Process Electrical 1 LS 3,500,000$ $ 3,500,000
Standby Power for RO WTP 1 LS 800,000$ $ 800,000
Process Instrumentation 1 LS 2,000,000$ $ 2,000,000
Site Work 5
1 LS 300,000$ $ 300,000
Subtotal 18,140,000$ Contingency (30%) 5,450,000$
TOTAL CONSTRUCTION COSTS 6
23,590,000$
Engineering and Contract Administration (20%) 4,718,000$
TOTAL PROJECT COST 7
28,308,000$
1. Open trench construction, assumes public right of way, and does not include trenchless intersection crossings.
2. Includes general building HVAC, plumbing, and electrical. Unit price based on pre-engineered metal
building type construction. Unit price based on usable square footage.
3. Includes membrane skids, piping, pressure vessels, membranes, CIP system, cartridge filters
and on-skid instrumentation & control.
4. Includes bypass flow rate pumping.
5. Includes demolition, excavation, paving, sidewalks, landscaping and general site improvements.
6. ENR Construction Cost Index (20-City average, January 2020): 11,392
7. This is a class 4 Budget Estimate as defined by the AACEI's Revised Classification (1999) with an expected accuracy
range of + 30 percent or - 15 percent. This cost estimate is based upon the Engineer's perception of current conditions
in the project area and is subject to change as variances in the cost of labor, materials, equipment, services provided
by others or economic conditions occur. Since the Engineer has no control over these factors, he cannot warrant or
guarantee that actual bids will not vary from the costs presented herein. This estimate does, however, reflect the Engineer's
professional opinion of accurate costs at this time.

PROJECT: Scenario 6: Mocho 1
JOB NO.: Zone 7
DATE: 3/4/2020
BY: E.Hull
COMMENTS:
OPTION B: Treatment 2: PFOs/PFOA - 32/8 ng/L
CAPITAL COST ESTIMATE
Classification Quantity Units Unit Cost Extended Cost
Groundwater Wells $ - $ -
Raw Water Pipeline 1
600 LF $ 269 $ 161,538
Desanders 1 LS $ 280,000 $ 280,000
Building 2
7,000 SF 450$ $ 3,150,000
RO Equipment 3
2.0 MGD 950,000$ $ 1,879,000
Chemical Storage/Feed System
Scale Inhibitor 1 LS 50,000$ $ 50,000
Caustic Soda 1 LS 200,000$ $ 200,000
Calcium Chloride 1 LS 110,000$ $ 110,000
Ammonia 1 LS 100,000$ $ 100,000
Sodium Hypochlorite 1 LS 110,000$ $ 110,000
Degasifiers 1 LS 220,000$ $ 220,000
High Service Pump Station 1 LS 1,750,000$ $ 1,750,000
High Service Pump Reservoir 4
1,000,000 GALLON 2.00$ $ 2,000,000
Yard Piping 1 LS $ 350,000 $ 350,000
Concentrate Pipeline 1
12,600 LF 192$ $ 2,423,077
Process Electrical 1 LS 3,800,000$ $ 3,800,000
Standby Power for RO WTP 1 LS 850,000$ $ 850,000
Process Instrumentation 1 LS 2,200,000$ $ 2,200,000
Site Work 5
1 LS 300,000$ $ 300,000
Subtotal 19,940,000$ Contingency (30%) 5,990,000$
TOTAL CONSTRUCTION COSTS 6
25,930,000$
Engineering and Contract Administration (20%) 5,186,000$
TOTAL PROJECT COST 7
31,116,000$
1. Open trench construction, assumes public right of way, and does not include trenchless intersection crossings.
2. Includes general building HVAC, plumbing, and electrical. Unit price based on pre-engineered metal
building type construction. Unit price based on usable square footage.
3. Includes membrane skids, piping, pressure vessels, membranes, CIP system, cartridge filters
and on-skid instrumentation & control.
4. Includes bypass flow rate pumping.
5. Includes demolition, excavation, paving, sidewalks, landscaping and general site improvements.
6. ENR Construction Cost Index (20-City average, January 2020): 11,392
7. This is a class 4 Budget Estimate as defined by the AACEI's Revised Classification (1999) with an expected accuracy
range of + 30 percent or - 15 percent. This cost estimate is based upon the Engineer's perception of current conditions
in the project area and is subject to change as variances in the cost of labor, materials, equipment, services provided
by others or economic conditions occur. Since the Engineer has no control over these factors, he cannot warrant or
guarantee that actual bids will not vary from the costs presented herein. This estimate does, however, reflect the Engineer's
professional opinion of accurate costs at this time.
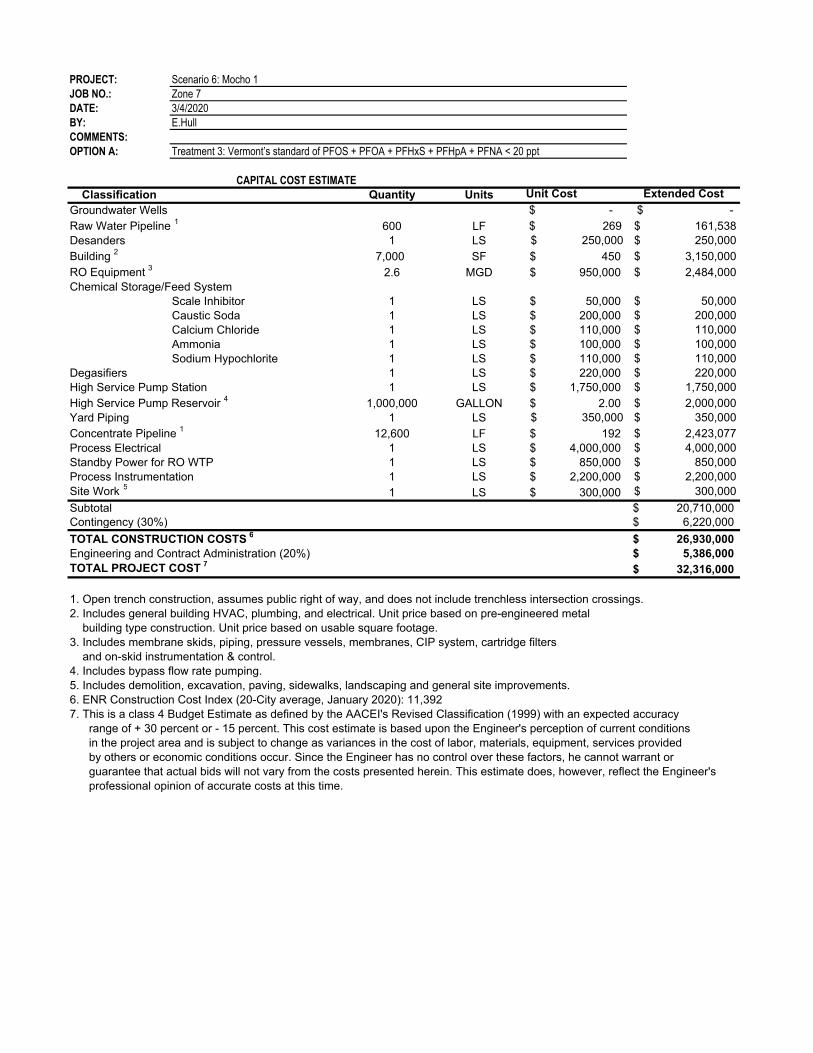
PROJECT: Scenario 6: Mocho 1
JOB NO.: Zone 7
DATE: 3/4/2020
BY: E.Hull
COMMENTS:
OPTION A: Treatment 3: Vermont’s standard of PFOS + PFOA + PFHxS + PFHpA + PFNA < 20 ppt
CAPITAL COST ESTIMATE
Classification Quantity Units Unit Cost Extended Cost
Groundwater Wells $ - $ -
Raw Water Pipeline 1
600 LF $ 269 $ 161,538
Desanders 1 LS $ 250,000 $ 250,000
Building 2
7,000 SF 450$ $ 3,150,000
RO Equipment 3
2.6 MGD 950,000$ $ 2,484,000
Chemical Storage/Feed System
Scale Inhibitor 1 LS 50,000$ $ 50,000
Caustic Soda 1 LS 200,000$ $ 200,000
Calcium Chloride 1 LS 110,000$ $ 110,000
Ammonia 1 LS 100,000$ $ 100,000
Sodium Hypochlorite 1 LS 110,000$ $ 110,000
Degasifiers 1 LS 220,000$ $ 220,000
High Service Pump Station 1 LS 1,750,000$ $ 1,750,000
High Service Pump Reservoir 4
1,000,000 GALLON 2.00$ $ 2,000,000
Yard Piping 1 LS $ 350,000 $ 350,000
Concentrate Pipeline 1
12,600 LF 192$ $ 2,423,077
Process Electrical 1 LS 4,000,000$ $ 4,000,000
Standby Power for RO WTP 1 LS 850,000$ $ 850,000
Process Instrumentation 1 LS 2,200,000$ $ 2,200,000
Site Work 5
1 LS 300,000$ $ 300,000
Subtotal 20,710,000$ Contingency (30%) 6,220,000$
TOTAL CONSTRUCTION COSTS 6
26,930,000$
Engineering and Contract Administration (20%) 5,386,000$
TOTAL PROJECT COST 7
32,316,000$
1. Open trench construction, assumes public right of way, and does not include trenchless intersection crossings.
2. Includes general building HVAC, plumbing, and electrical. Unit price based on pre-engineered metal
building type construction. Unit price based on usable square footage.
3. Includes membrane skids, piping, pressure vessels, membranes, CIP system, cartridge filters
and on-skid instrumentation & control.
4. Includes bypass flow rate pumping.
5. Includes demolition, excavation, paving, sidewalks, landscaping and general site improvements.
6. ENR Construction Cost Index (20-City average, January 2020): 11,392
7. This is a class 4 Budget Estimate as defined by the AACEI's Revised Classification (1999) with an expected accuracy
range of + 30 percent or - 15 percent. This cost estimate is based upon the Engineer's perception of current conditions
in the project area and is subject to change as variances in the cost of labor, materials, equipment, services provided
by others or economic conditions occur. Since the Engineer has no control over these factors, he cannot warrant or
guarantee that actual bids will not vary from the costs presented herein. This estimate does, however, reflect the Engineer's
professional opinion of accurate costs at this time.

PROJECT: Scenario 6: Mocho 1
JOB NO.: Zone 7
DATE: 3/4/2020
BY: E.Hull
COMMENTS:
OPTION B: Treatment 4: PFOs/PFOA - 1.1/0.53 ng/L Cr(6) 8 ppb
CAPITAL COST ESTIMATE
Classification Quantity Units Unit Cost Extended Cost
Groundwater Wells $ - $ -
Raw Water Pipeline 1
600 LF $ 269 $ 161,538
Desanders 1 LS $ 280,000 $ 280,000
Building 2
7,000 SF 450$ $ 3,150,000
RO Equipment 3
2.9 MGD 950,000$ $ 2,711,000
Chemical Storage/Feed System
Scale Inhibitor 1 LS 50,000$ $ 50,000
Caustic Soda 1 LS 200,000$ $ 200,000
Calcium Chloride 1 LS 110,000$ $ 110,000
Ammonia 1 LS 100,000$ $ 100,000
Sodium Hypochlorite 1 LS 110,000$ $ 110,000
Degasifiers 1 LS 220,000$ $ 220,000
High Service Pump Station 1 LS 1,750,000$ $ 1,750,000
High Service Pump Reservoir 4
1,000,000 GALLON 2.00$ $ 2,000,000
Yard Piping 1 LS $ 350,000 $ 350,000
Concentrate Pipeline 1
12,600 LF 192$ $ 2,423,077
Process Electrical 1 LS 4,100,000$ $ 4,100,000
Standby Power for RO WTP 1 LS 850,000$ $ 850,000
Process Instrumentation 1 LS 2,300,000$ $ 2,300,000
Site Work 5
1 LS 300,000$ $ 300,000
Subtotal 21,170,000$ Contingency (30%) 6,360,000$
TOTAL CONSTRUCTION COSTS 6
27,530,000$
Engineering and Contract Administration (20%) 5,506,000$
TOTAL PROJECT COST 7
33,036,000$
1. Open trench construction, assumes public right of way, and does not include trenchless intersection crossings.
2. Includes general building HVAC, plumbing, and electrical. Unit price based on pre-engineered metal
building type construction. Unit price based on usable square footage.
3. Includes membrane skids, piping, pressure vessels, membranes, CIP system, cartridge filters
and on-skid instrumentation & control.
4. Includes bypass flow rate pumping.
5. Includes demolition, excavation, paving, sidewalks, landscaping and general site improvements.
6. ENR Construction Cost Index (20-City average, January 2020): 11,392
7. This is a class 4 Budget Estimate as defined by the AACEI's Revised Classification (1999) with an expected accuracy
range of + 30 percent or - 15 percent. This cost estimate is based upon the Engineer's perception of current conditions
in the project area and is subject to change as variances in the cost of labor, materials, equipment, services provided
by others or economic conditions occur. Since the Engineer has no control over these factors, he cannot warrant or
guarantee that actual bids will not vary from the costs presented herein. This estimate does, however, reflect the Engineer's
professional opinion of accurate costs at this time.
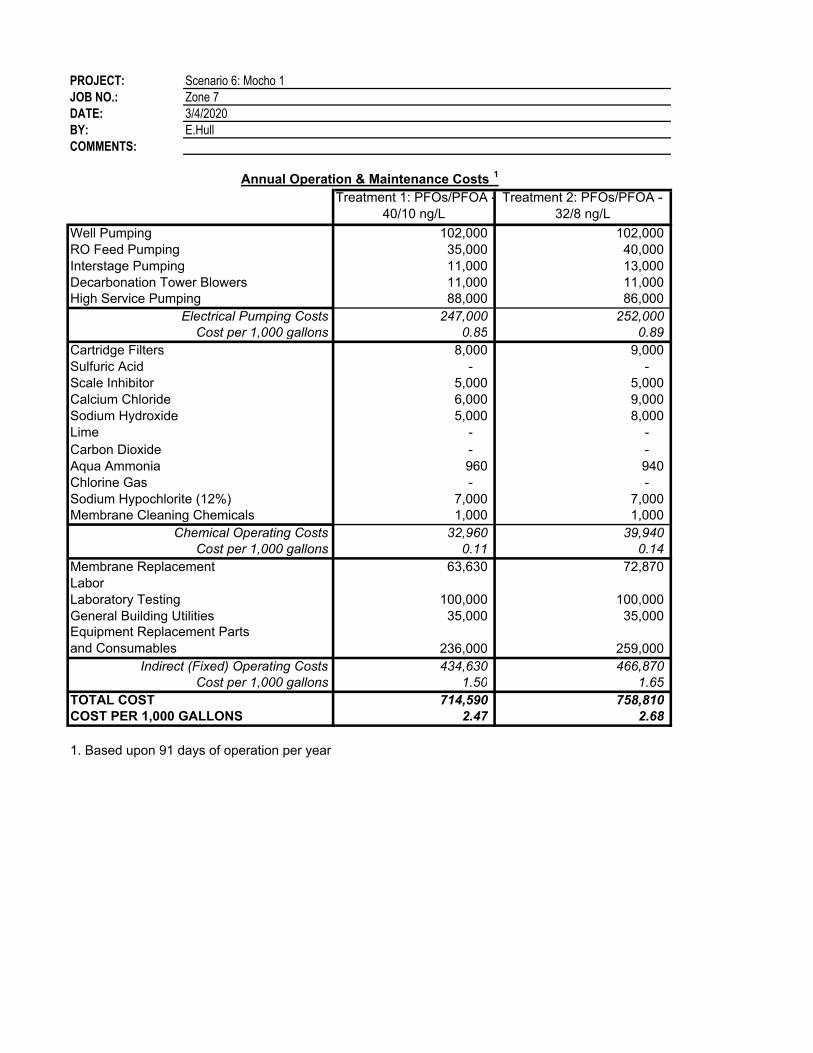
PROJECT: Scenario 6: Mocho 1
JOB NO.: Zone 7
DATE: 3/4/2020
BY: E.Hull
COMMENTS:
Annual Operation & Maintenance Costs 1
Treatment 1: PFOs/PFOA -
40/10 ng/L
Treatment 2: PFOs/PFOA -
32/8 ng/L
Well Pumping 102,000 102,000
RO Feed Pumping 35,000 40,000
Interstage Pumping 11,000 13,000
Decarbonation Tower Blowers 11,000 11,000
High Service Pumping 88,000 86,000
Electrical Pumping Costs 247,000 252,000
Cost per 1,000 gallons 0.85 0.89
Cartridge Filters 8,000 9,000
Sulfuric Acid - -
Scale Inhibitor 5,000 5,000
Calcium Chloride 6,000 9,000
Sodium Hydroxide 5,000 8,000
Lime - -
Carbon Dioxide - -
Aqua Ammonia 960 940
Chlorine Gas - -
Sodium Hypochlorite (12%) 7,000 7,000
Membrane Cleaning Chemicals 1,000 1,000
Chemical Operating Costs 32,960 39,940
Cost per 1,000 gallons 0.11 0.14
Membrane Replacement 63,630 72,870
Labor
Laboratory Testing 100,000 100,000
General Building Utilities 35,000 35,000
236,000 259,000
Indirect (Fixed) Operating Costs 434,630 466,870
Cost per 1,000 gallons 1.50 1.65
TOTAL COST 714,590 758,810
COST PER 1,000 GALLONS 2.47 2.68
1. Based upon 91 days of operation per year
Equipment Replacement Parts
and Consumables
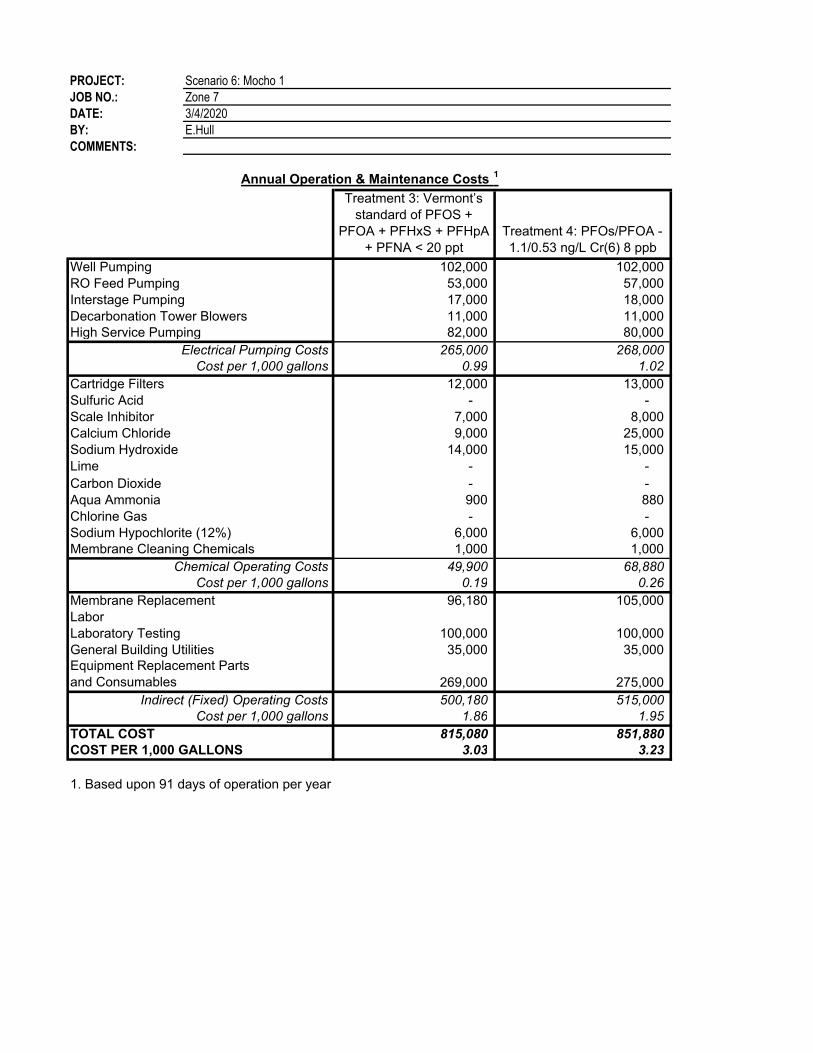
PROJECT: Scenario 6: Mocho 1
JOB NO.: Zone 7
DATE: 3/4/2020
BY: E.Hull
COMMENTS:
Annual Operation & Maintenance Costs 1
Treatment 3: Vermont’s
standard of PFOS +
PFOA + PFHxS + PFHpA
+ PFNA < 20 ppt
Treatment 4: PFOs/PFOA -
1.1/0.53 ng/L Cr(6) 8 ppb
Well Pumping 102,000 102,000
RO Feed Pumping 53,000 57,000
Interstage Pumping 17,000 18,000
Decarbonation Tower Blowers 11,000 11,000
High Service Pumping 82,000 80,000
Electrical Pumping Costs 265,000 268,000
Cost per 1,000 gallons 0.99 1.02
Cartridge Filters 12,000 13,000
Sulfuric Acid - -
Scale Inhibitor 7,000 8,000
Calcium Chloride 9,000 25,000
Sodium Hydroxide 14,000 15,000
Lime - -
Carbon Dioxide - -
Aqua Ammonia 900 880
Chlorine Gas - -
Sodium Hypochlorite (12%) 6,000 6,000
Membrane Cleaning Chemicals 1,000 1,000
Chemical Operating Costs 49,900 68,880
Cost per 1,000 gallons 0.19 0.26
Membrane Replacement 96,180 105,000
Labor
Laboratory Testing 100,000 100,000
General Building Utilities 35,000 35,000
269,000 275,000
Indirect (Fixed) Operating Costs 500,180 515,000
Cost per 1,000 gallons 1.86 1.95
TOTAL COST 815,080 851,880
COST PER 1,000 GALLONS 3.03 3.23
1. Based upon 91 days of operation per year
Equipment Replacement Parts
and Consumables
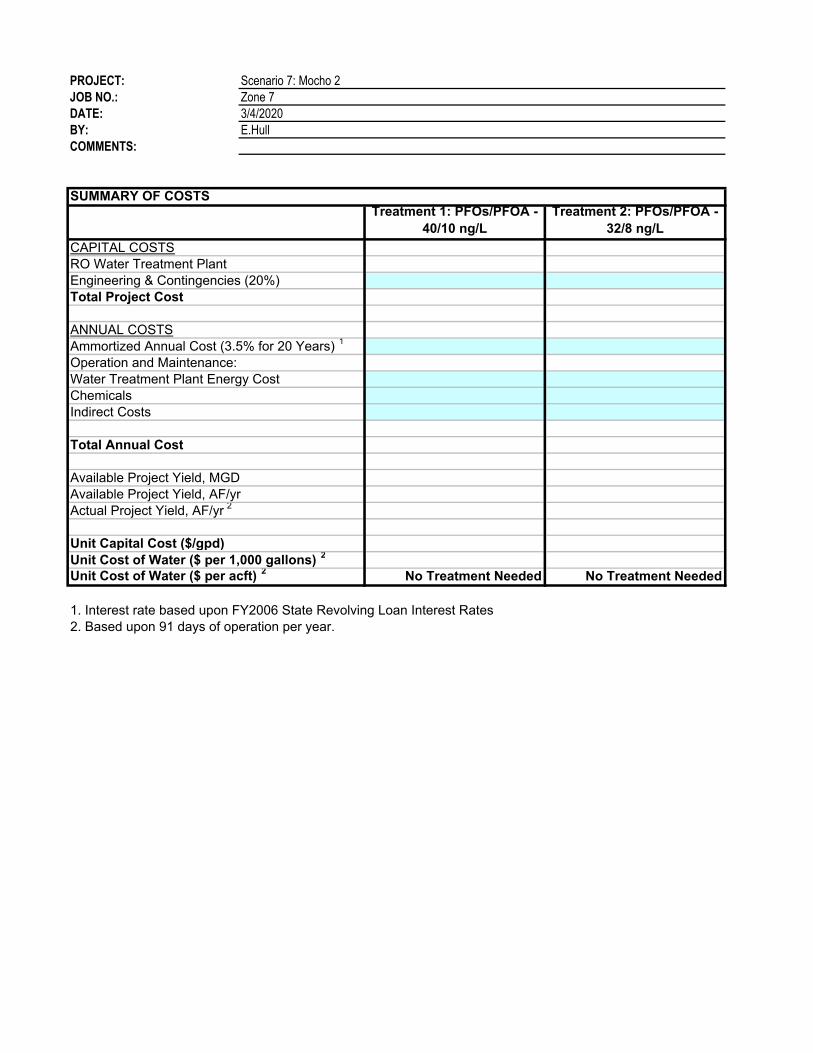
PROJECT: Scenario 7: Mocho 2
JOB NO.: Zone 7
DATE: 3/4/2020
BY: E.Hull
COMMENTS:
SUMMARY OF COSTSTreatment 1: PFOs/PFOA -
40/10 ng/L
Treatment 2: PFOs/PFOA -
32/8 ng/L
Unit Capital Cost ($/gpd)
No Treatment Needed No Treatment Needed
1. Interest rate based upon FY2006 State Revolving Loan Interest Rates
2. Based upon 91 days of operation per year.
Unit Cost of Water ($ per 1,000 gallons) 2
Unit Cost of Water ($ per acft) 2
Total Annual Cost
Available Project Yield, MGD
Available Project Yield, AF/yr
Actual Project Yield, AF/yr 2
Indirect Costs
CAPITAL COSTS
RO Water Treatment Plant
Engineering & Contingencies (20%)
Total Project Cost
ANNUAL COSTS
Ammortized Annual Cost (3.5% for 20 Years) 1
Operation and Maintenance:
Water Treatment Plant Energy Cost
Chemicals
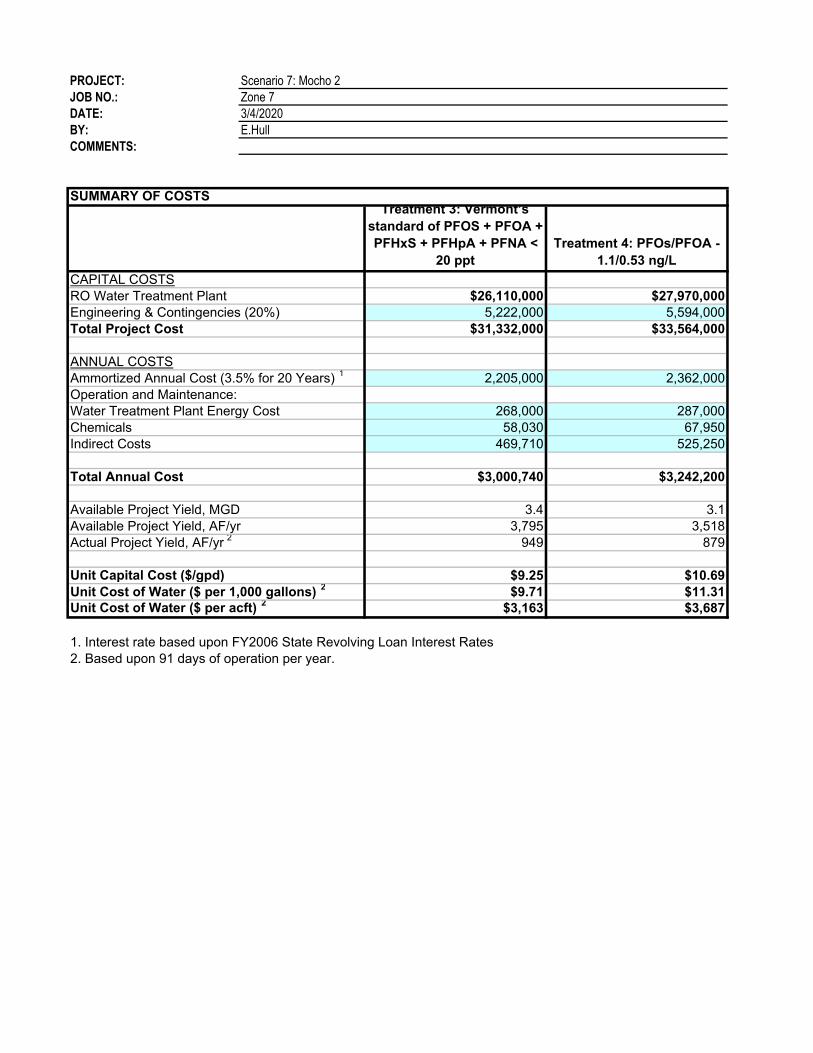
PROJECT: Scenario 7: Mocho 2
JOB NO.: Zone 7
DATE: 3/4/2020
BY: E.Hull
COMMENTS:
SUMMARY OF COSTSTreatment 3: Vermont’s
standard of PFOS + PFOA +
PFHxS + PFHpA + PFNA <
20 ppt
Treatment 4: PFOs/PFOA -
1.1/0.53 ng/L
$26,110,000 $27,970,000
5,222,000 5,594,000
$31,332,000 $33,564,000
2,205,000 2,362,000
268,000 287,000
58,030 67,950
469,710 525,250
$3,000,740 $3,242,200
3.4 3.1
3,795 3,518
949 879
Unit Capital Cost ($/gpd) $9.25 $10.69
$9.71 $11.31$3,163 $3,687
1. Interest rate based upon FY2006 State Revolving Loan Interest Rates
2. Based upon 91 days of operation per year.
Unit Cost of Water ($ per 1,000 gallons) 2
Unit Cost of Water ($ per acft) 2
Total Annual Cost
Available Project Yield, MGD
Available Project Yield, AF/yr
Actual Project Yield, AF/yr 2
Indirect Costs
CAPITAL COSTS
RO Water Treatment Plant
Engineering & Contingencies (20%)
Total Project Cost
ANNUAL COSTS
Ammortized Annual Cost (3.5% for 20 Years) 1
Operation and Maintenance:
Water Treatment Plant Energy Cost
Chemicals
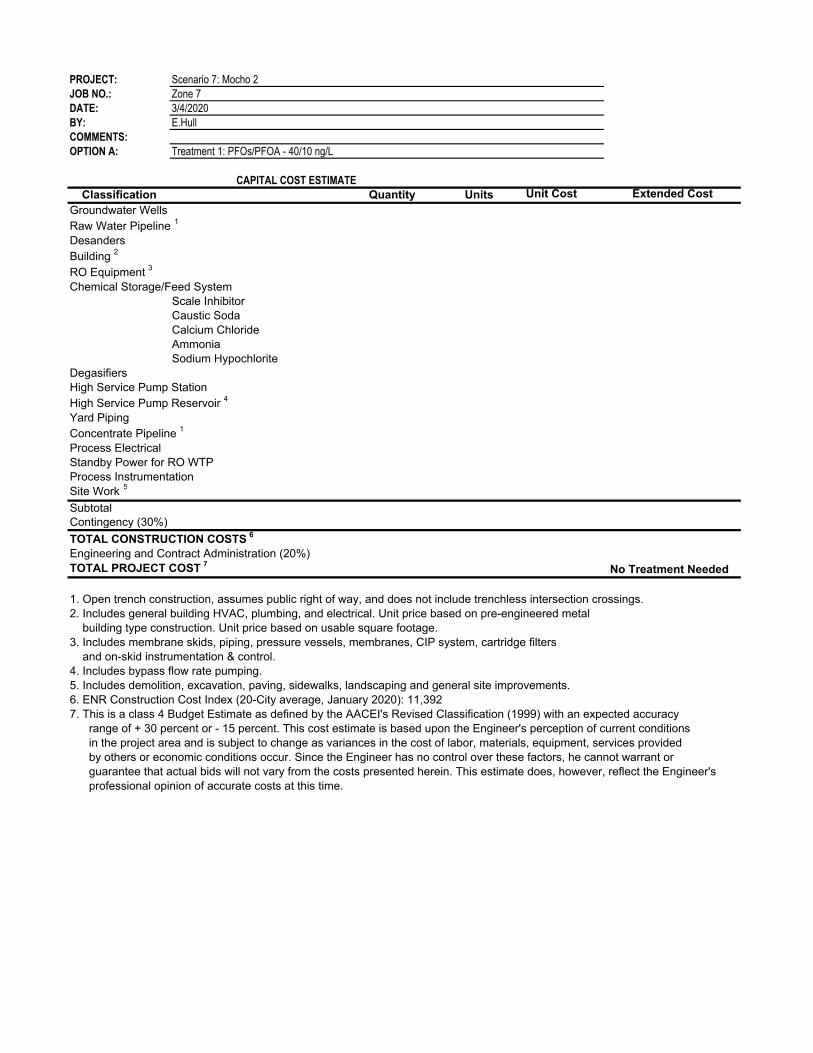
PROJECT: Scenario 7: Mocho 2
JOB NO.: Zone 7
DATE: 3/4/2020
BY: E.Hull
COMMENTS:
OPTION A: Treatment 1: PFOs/PFOA - 40/10 ng/L
CAPITAL COST ESTIMATE
Classification Quantity Units Unit Cost Extended Cost
Groundwater Wells
Raw Water Pipeline 1
Desanders
Building 2
RO Equipment 3
Chemical Storage/Feed System
Scale Inhibitor
Caustic Soda
Calcium Chloride
Ammonia
Sodium Hypochlorite
Degasifiers
High Service Pump Station
High Service Pump Reservoir 4
Yard Piping
Concentrate Pipeline 1
Process Electrical
Standby Power for RO WTP
Process Instrumentation
Site Work 5
Subtotal
Contingency (30%)
TOTAL CONSTRUCTION COSTS 6
Engineering and Contract Administration (20%)
TOTAL PROJECT COST 7
No Treatment Needed
1. Open trench construction, assumes public right of way, and does not include trenchless intersection crossings.
2. Includes general building HVAC, plumbing, and electrical. Unit price based on pre-engineered metal
building type construction. Unit price based on usable square footage.
3. Includes membrane skids, piping, pressure vessels, membranes, CIP system, cartridge filters
and on-skid instrumentation & control.
4. Includes bypass flow rate pumping.
5. Includes demolition, excavation, paving, sidewalks, landscaping and general site improvements.
6. ENR Construction Cost Index (20-City average, January 2020): 11,392
7. This is a class 4 Budget Estimate as defined by the AACEI's Revised Classification (1999) with an expected accuracy
range of + 30 percent or - 15 percent. This cost estimate is based upon the Engineer's perception of current conditions
in the project area and is subject to change as variances in the cost of labor, materials, equipment, services provided
by others or economic conditions occur. Since the Engineer has no control over these factors, he cannot warrant or
guarantee that actual bids will not vary from the costs presented herein. This estimate does, however, reflect the Engineer's
professional opinion of accurate costs at this time.
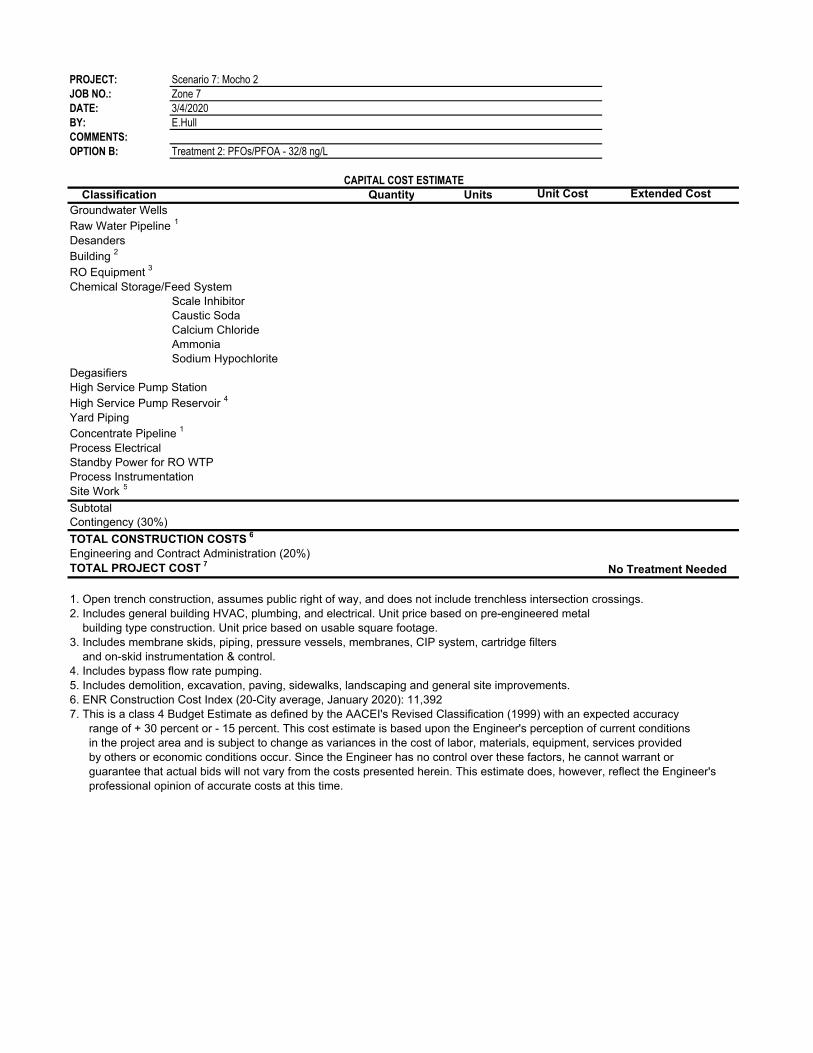
PROJECT: Scenario 7: Mocho 2
JOB NO.: Zone 7
DATE: 3/4/2020
BY: E.Hull
COMMENTS:
OPTION B: Treatment 2: PFOs/PFOA - 32/8 ng/L
CAPITAL COST ESTIMATE
Classification Quantity Units Unit Cost Extended Cost
Groundwater Wells
Raw Water Pipeline 1
Desanders
Building 2
RO Equipment 3
Chemical Storage/Feed System
Scale Inhibitor
Caustic Soda
Calcium Chloride
Ammonia
Sodium Hypochlorite
Degasifiers
High Service Pump Station
High Service Pump Reservoir 4
Yard Piping
Concentrate Pipeline 1
Process Electrical
Standby Power for RO WTP
Process Instrumentation
Site Work 5
Subtotal
Contingency (30%)
TOTAL CONSTRUCTION COSTS 6
Engineering and Contract Administration (20%)
TOTAL PROJECT COST 7
No Treatment Needed
1. Open trench construction, assumes public right of way, and does not include trenchless intersection crossings.
2. Includes general building HVAC, plumbing, and electrical. Unit price based on pre-engineered metal
building type construction. Unit price based on usable square footage.
3. Includes membrane skids, piping, pressure vessels, membranes, CIP system, cartridge filters
and on-skid instrumentation & control.
4. Includes bypass flow rate pumping.
5. Includes demolition, excavation, paving, sidewalks, landscaping and general site improvements.
6. ENR Construction Cost Index (20-City average, January 2020): 11,392
7. This is a class 4 Budget Estimate as defined by the AACEI's Revised Classification (1999) with an expected accuracy
range of + 30 percent or - 15 percent. This cost estimate is based upon the Engineer's perception of current conditions
in the project area and is subject to change as variances in the cost of labor, materials, equipment, services provided
by others or economic conditions occur. Since the Engineer has no control over these factors, he cannot warrant or
guarantee that actual bids will not vary from the costs presented herein. This estimate does, however, reflect the Engineer's
professional opinion of accurate costs at this time.

PROJECT: Scenario 7: Mocho 2
JOB NO.: Zone 7
DATE: 3/4/2020
BY: E.Hull
COMMENTS:
OPTION A: Treatment 3: Vermont’s standard of PFOS + PFOA + PFHxS + PFHpA + PFNA < 20 ppt
CAPITAL COST ESTIMATE
Classification Quantity Units Unit Cost Extended Cost
Groundwater Wells $ - $ -
Raw Water Pipeline 1
800 LF $ 269 $ 215,385
Desanders 1 LS $ 250,000 $ 250,000
Building 2
7,000 SF 450$ $ 3,150,000
RO Equipment 3
2.0 MGD 950,000$ $ 1,901,000
Chemical Storage/Feed System
Scale Inhibitor 1 LS 50,000$ $ 50,000
Caustic Soda 1 LS 200,000$ $ 200,000
Calcium Chloride 1 LS 110,000$ $ 110,000
Ammonia 1 LS 100,000$ $ 100,000
Sodium Hypochlorite 1 LS 110,000$ $ 110,000
Degasifiers 1 LS 220,000$ $ 220,000
High Service Pump Station 1 LS 1,750,000$ $ 1,750,000
High Service Pump Reservoir 4
1,000,000 GALLON 2.00$ $ 2,000,000
Yard Piping 1 LS $ 350,000 $ 350,000
Concentrate Pipeline 1
12,600 LF 192$ $ 2,423,077
Process Electrical 1 LS 3,900,000$ $ 3,900,000
Standby Power for RO WTP 1 LS 850,000$ $ 850,000
Process Instrumentation 1 LS 2,200,000$ $ 2,200,000
Site Work 5
1 LS 300,000$ $ 300,000
Subtotal 20,080,000$ Contingency (30%) 6,030,000$
TOTAL CONSTRUCTION COSTS 6
26,110,000$
Engineering and Contract Administration (20%) 5,222,000$
TOTAL PROJECT COST 7
31,332,000$
1. Open trench construction, assumes public right of way, and does not include trenchless intersection crossings.
2. Includes general building HVAC, plumbing, and electrical. Unit price based on pre-engineered metal
building type construction. Unit price based on usable square footage.
3. Includes membrane skids, piping, pressure vessels, membranes, CIP system, cartridge filters
and on-skid instrumentation & control.
4. Includes bypass flow rate pumping.
5. Includes demolition, excavation, paving, sidewalks, landscaping and general site improvements.
6. ENR Construction Cost Index (20-City average, January 2020): 11,392
7. This is a class 4 Budget Estimate as defined by the AACEI's Revised Classification (1999) with an expected accuracy
range of + 30 percent or - 15 percent. This cost estimate is based upon the Engineer's perception of current conditions
in the project area and is subject to change as variances in the cost of labor, materials, equipment, services provided
by others or economic conditions occur. Since the Engineer has no control over these factors, he cannot warrant or
guarantee that actual bids will not vary from the costs presented herein. This estimate does, however, reflect the Engineer's
professional opinion of accurate costs at this time.

PROJECT: Scenario 7: Mocho 2
JOB NO.: Zone 7
DATE: 3/4/2020
BY: E.Hull
COMMENTS:
OPTION B: Treatment 4: PFOs/PFOA - 1.1/0.53 ng/L
CAPITAL COST ESTIMATE
Classification Quantity Units Unit Cost Extended Cost
Groundwater Wells $ - $ -
Raw Water Pipeline 1
800 LF $ 269 $ 215,385
Desanders 1 LS $ 280,000 $ 280,000
Building 2
7,000 SF 450$ $ 3,150,000
RO Equipment 3
3.0 MGD 950,000$ $ 2,843,000
Chemical Storage/Feed System
Scale Inhibitor 1 LS 50,000$ $ 50,000
Caustic Soda 1 LS 200,000$ $ 200,000
Calcium Chloride 1 LS 110,000$ $ 110,000
Ammonia 1 LS 100,000$ $ 100,000
Sodium Hypochlorite 1 LS 110,000$ $ 110,000
Degasifiers 1 LS 220,000$ $ 220,000
High Service Pump Station 1 LS 1,750,000$ $ 1,750,000
High Service Pump Reservoir 4
1,000,000 GALLON 2.00$ $ 2,000,000
Yard Piping 1 LS $ 350,000 $ 350,000
Concentrate Pipeline 1
12,600 LF 192$ $ 2,423,077
Process Electrical 1 LS 4,200,000$ $ 4,200,000
Standby Power for RO WTP 1 LS 900,000$ $ 900,000
Process Instrumentation 1 LS 2,300,000$ $ 2,300,000
Site Work 5
1 LS 300,000$ $ 300,000
Subtotal 21,510,000$ Contingency (30%) 6,460,000$
TOTAL CONSTRUCTION COSTS 6
27,970,000$
Engineering and Contract Administration (20%) 5,594,000$
TOTAL PROJECT COST 7
33,564,000$
1. Open trench construction, assumes public right of way, and does not include trenchless intersection crossings.
2. Includes general building HVAC, plumbing, and electrical. Unit price based on pre-engineered metal
building type construction. Unit price based on usable square footage.
3. Includes membrane skids, piping, pressure vessels, membranes, CIP system, cartridge filters
and on-skid instrumentation & control.
4. Includes bypass flow rate pumping.
5. Includes demolition, excavation, paving, sidewalks, landscaping and general site improvements.
6. ENR Construction Cost Index (20-City average, January 2020): 11,392
7. This is a class 4 Budget Estimate as defined by the AACEI's Revised Classification (1999) with an expected accuracy
range of + 30 percent or - 15 percent. This cost estimate is based upon the Engineer's perception of current conditions
in the project area and is subject to change as variances in the cost of labor, materials, equipment, services provided
by others or economic conditions occur. Since the Engineer has no control over these factors, he cannot warrant or
guarantee that actual bids will not vary from the costs presented herein. This estimate does, however, reflect the Engineer's
professional opinion of accurate costs at this time.
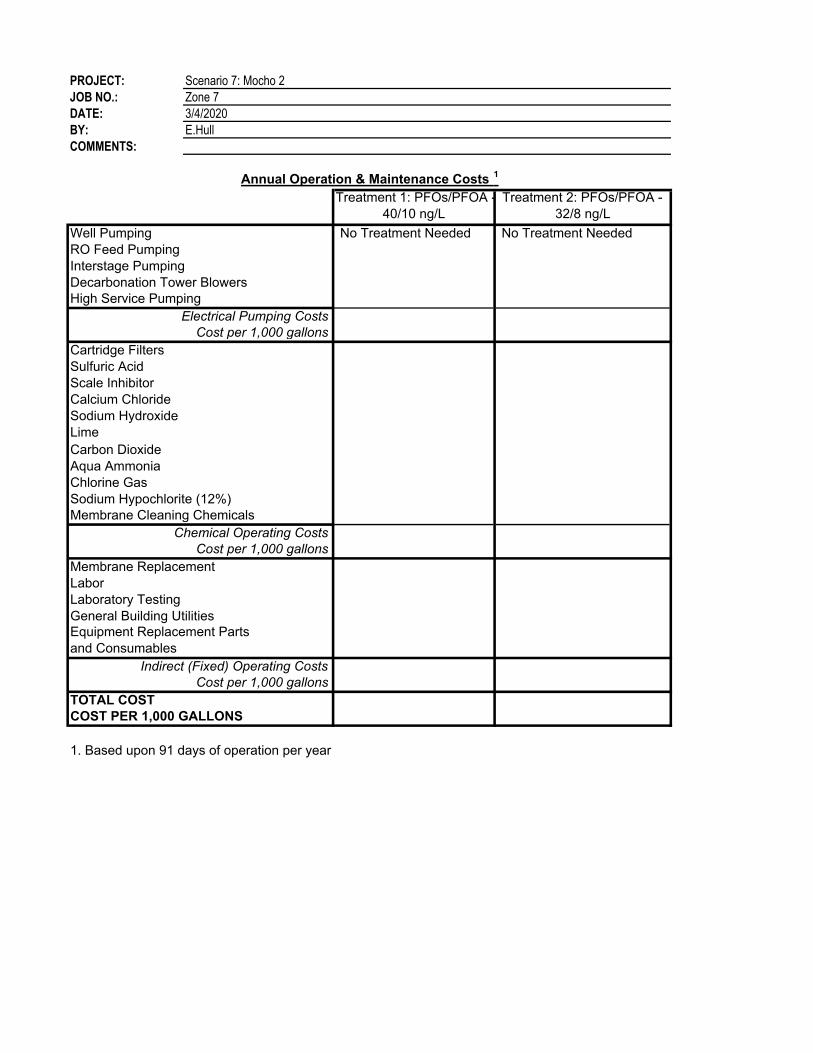
PROJECT: Scenario 7: Mocho 2
JOB NO.: Zone 7
DATE: 3/4/2020
BY: E.Hull
COMMENTS:
Annual Operation & Maintenance Costs 1
Treatment 1: PFOs/PFOA -
40/10 ng/L
Treatment 2: PFOs/PFOA -
32/8 ng/L
Well Pumping No Treatment Needed No Treatment Needed
RO Feed Pumping
Interstage Pumping
Decarbonation Tower Blowers
High Service Pumping
Electrical Pumping Costs
Cost per 1,000 gallons
Cartridge Filters
Sulfuric Acid
Scale Inhibitor
Calcium Chloride
Sodium Hydroxide
Lime
Carbon Dioxide
Aqua Ammonia
Chlorine Gas
Sodium Hypochlorite (12%)
Membrane Cleaning Chemicals
Chemical Operating Costs
Cost per 1,000 gallons
Membrane Replacement
Labor
Laboratory Testing
General Building Utilities
Indirect (Fixed) Operating Costs
Cost per 1,000 gallons
TOTAL COST
COST PER 1,000 GALLONS
1. Based upon 91 days of operation per year
Equipment Replacement Parts
and Consumables
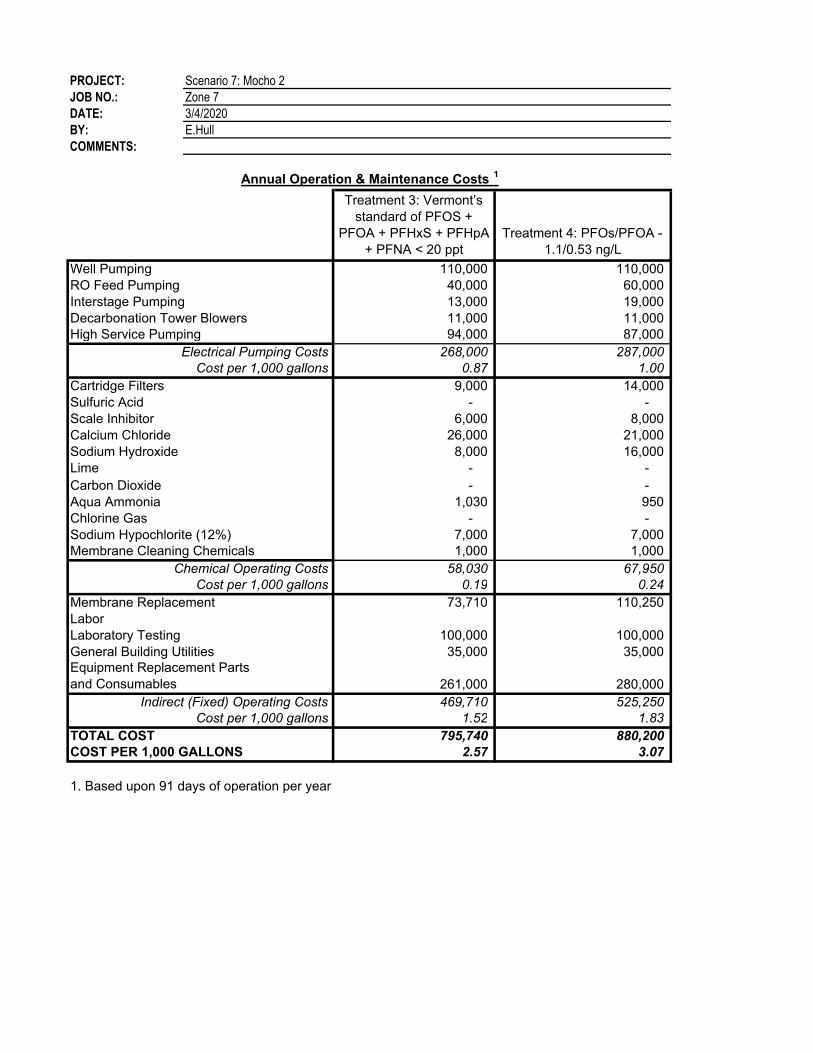
PROJECT: Scenario 7: Mocho 2
JOB NO.: Zone 7
DATE: 3/4/2020
BY: E.Hull
COMMENTS:
Annual Operation & Maintenance Costs 1
Treatment 3: Vermont’s
standard of PFOS +
PFOA + PFHxS + PFHpA
+ PFNA < 20 ppt
Treatment 4: PFOs/PFOA -
1.1/0.53 ng/L
Well Pumping 110,000 110,000
RO Feed Pumping 40,000 60,000
Interstage Pumping 13,000 19,000
Decarbonation Tower Blowers 11,000 11,000
High Service Pumping 94,000 87,000
Electrical Pumping Costs 268,000 287,000
Cost per 1,000 gallons 0.87 1.00
Cartridge Filters 9,000 14,000
Sulfuric Acid - -
Scale Inhibitor 6,000 8,000
Calcium Chloride 26,000 21,000
Sodium Hydroxide 8,000 16,000
Lime - -
Carbon Dioxide - -
Aqua Ammonia 1,030 950
Chlorine Gas - -
Sodium Hypochlorite (12%) 7,000 7,000
Membrane Cleaning Chemicals 1,000 1,000
Chemical Operating Costs 58,030 67,950
Cost per 1,000 gallons 0.19 0.24
Membrane Replacement 73,710 110,250
Labor
Laboratory Testing 100,000 100,000
General Building Utilities 35,000 35,000
261,000 280,000
Indirect (Fixed) Operating Costs 469,710 525,250
Cost per 1,000 gallons 1.52 1.83
TOTAL COST 795,740 880,200
COST PER 1,000 GALLONS 2.57 3.07
1. Based upon 91 days of operation per year
Equipment Replacement Parts
and Consumables
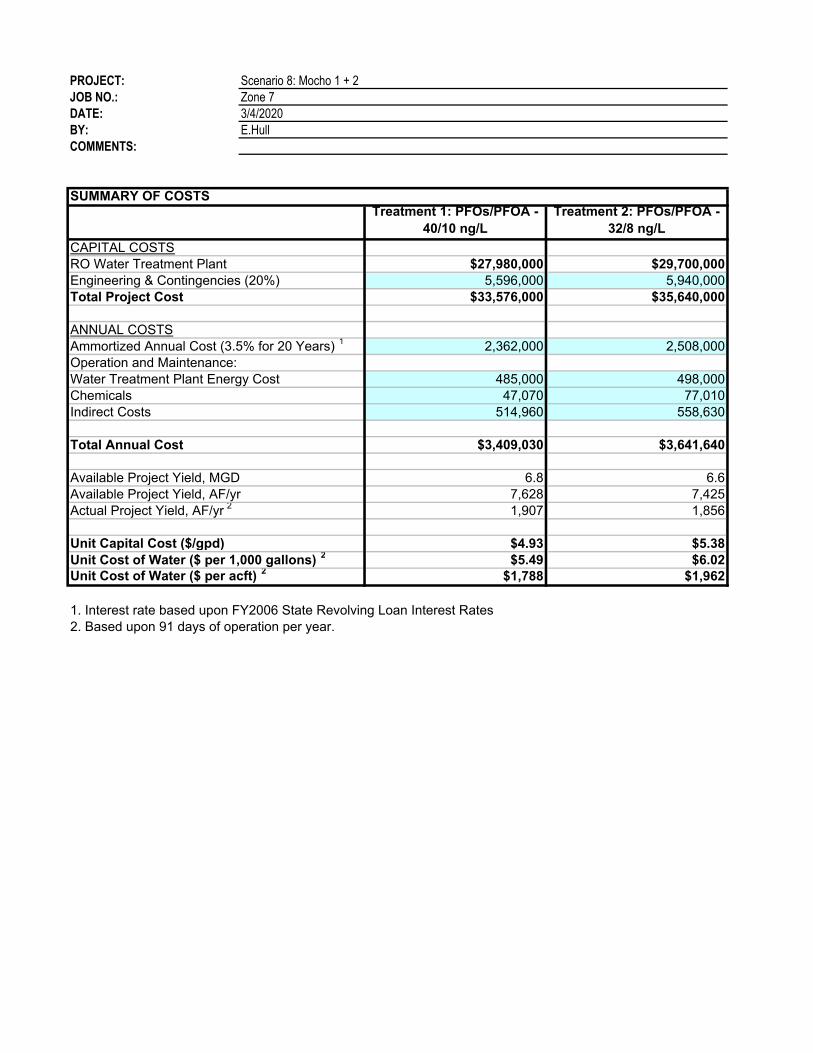
PROJECT: Scenario 8: Mocho 1 + 2
JOB NO.: Zone 7
DATE: 3/4/2020
BY: E.Hull
COMMENTS:
SUMMARY OF COSTSTreatment 1: PFOs/PFOA -
40/10 ng/L
Treatment 2: PFOs/PFOA -
32/8 ng/L
$27,980,000 $29,700,000
5,596,000 5,940,000
$33,576,000 $35,640,000
2,362,000 2,508,000
485,000 498,000
47,070 77,010
514,960 558,630
$3,409,030 $3,641,640
6.8 6.6
7,628 7,425
1,907 1,856
Unit Capital Cost ($/gpd) $4.93 $5.38
$5.49 $6.02$1,788 $1,962
1. Interest rate based upon FY2006 State Revolving Loan Interest Rates
2. Based upon 91 days of operation per year.
Unit Cost of Water ($ per 1,000 gallons) 2
Unit Cost of Water ($ per acft) 2
Total Annual Cost
Available Project Yield, MGD
Available Project Yield, AF/yr
Actual Project Yield, AF/yr 2
Indirect Costs
CAPITAL COSTS
RO Water Treatment Plant
Engineering & Contingencies (20%)
Total Project Cost
ANNUAL COSTS
Ammortized Annual Cost (3.5% for 20 Years) 1
Operation and Maintenance:
Water Treatment Plant Energy Cost
Chemicals

PROJECT: Scenario 8: Mocho 1+2
JOB NO.: Zone 7
DATE: 3/4/2020
BY: E.Hull
COMMENTS:
SUMMARY OF COSTS
Treatment 3: Vermont’s
standard of PFOS +
PFOA + PFHxS + PFHpA
+ PFNA < 20 ppt
Treatment 4:
PFOs/PFOA - 1.1/0.53
ng/L
$36,400,000 $37,740,000
7,280,000 7,548,000
$43,680,000 $45,288,000
3,073,000 3,187,000
533,000 547,000
117,880 141,830
692,200 729,770
$4,416,080 $4,605,600
6.2 6.0
6,919 6,732
1,730 1,683
Unit Capital Cost ($/gpd) $7.07 $7.54
$7.84 $8.40$2,553 $2,736
1. Interest rate based upon FY2006 State Revolving Loan Interest Rates
2. Based upon 91 days of operation per year.
Indirect Costs
CAPITAL COSTS
RO Water Treatment Plant
Engineering & Contingencies (20%)
Total Project Cost
ANNUAL COSTS
Ammortized Annual Cost (3.5% for 20 Years) 1
Operation and Maintenance:
Water Treatment Plant Energy Cost
Chemicals
Unit Cost of Water ($ per 1,000 gallons) 2
Unit Cost of Water ($ per acft) 2
Total Annual Cost
Available Project Yield, MGD
Available Project Yield, AF/yr
Actual Project Yield, AF/yr 2

PROJECT: Scenario 8: Mocho 1 + 2
JOB NO.: Zone 7
DATE: 3/4/2020
BY: E.Hull
COMMENTS:
OPTION A: Treatment 1: PFOs/PFOA - 40/10 ng/L
CAPITAL COST ESTIMATE
Classification Quantity Units Unit Cost Extended Cost
Groundwater Wells $ - $ -
Raw Water Pipeline 1
800 LF $ 308 $ 246,154
Desanders 1 LS $ 250,000 $ 250,000
Building 2
7,000 SF 450$ $ 3,150,000
RO Equipment 3
2.7 MGD 950,000$ $ 2,580,000
Chemical Storage/Feed System
Scale Inhibitor 1 LS 50,000$ $ 50,000
Caustic Soda 1 LS 200,000$ $ 200,000
Calcium Chloride 1 LS 110,000$ $ 110,000
Ammonia 1 LS 100,000$ $ 100,000
Sodium Hypochlorite 1 LS 110,000$ $ 110,000
Degasifiers 1 LS 220,000$ $ 220,000
High Service Pump Station 1 LS 2,000,000$ $ 2,000,000
High Service Pump Reservoir 4
1,000,000 GALLON 2.00$ $ 2,000,000
Yard Piping 1 LS $ 375,000 $ 375,000
Concentrate Pipeline 1
12,600 LF 192$ $ 2,423,077
Process Electrical 1 LS 4,200,000$ $ 4,200,000
Standby Power for RO WTP 1 LS 900,000$ $ 900,000
Process Instrumentation 1 LS 2,300,000$ $ 2,300,000
Site Work 5
1 LS 300,000$ $ 300,000
Subtotal 21,520,000$ Contingency (30%) 6,460,000$
TOTAL CONSTRUCTION COSTS 6
27,980,000$
Engineering and Contract Administration (20%) 5,596,000$
TOTAL PROJECT COST 7
33,576,000$
1. Open trench construction, assumes public right of way, and does not include trenchless intersection crossings.
2. Includes general building HVAC, plumbing, and electrical. Unit price based on pre-engineered metal
building type construction. Unit price based on usable square footage.
3. Includes membrane skids, piping, pressure vessels, membranes, CIP system, cartridge filters
and on-skid instrumentation & control.
4. Includes bypass flow rate pumping.
5. Includes demolition, excavation, paving, sidewalks, landscaping and general site improvements.
6. ENR Construction Cost Index (20-City average, January 2020): 11,392
7. This is a class 4 Budget Estimate as defined by the AACEI's Revised Classification (1999) with an expected accuracy
range of + 30 percent or - 15 percent. This cost estimate is based upon the Engineer's perception of current conditions
in the project area and is subject to change as variances in the cost of labor, materials, equipment, services provided
by others or economic conditions occur. Since the Engineer has no control over these factors, he cannot warrant or
guarantee that actual bids will not vary from the costs presented herein. This estimate does, however, reflect the Engineer's
professional opinion of accurate costs at this time.

PROJECT: Scenario 8: Mocho 1 + 2
JOB NO.: Zone 7
DATE: 3/4/2020
BY: E.Hull
COMMENTS:
OPTION B: Treatment 2: PFOs/PFOA - 32/8 ng/L
CAPITAL COST ESTIMATE
Classification Quantity Units Unit Cost Extended Cost
Groundwater Wells $ - $ -
Raw Water Pipeline 1
800 LF $ 308 $ 246,154
Desanders 1 LS $ 280,000 $ 280,000
Building 2
7,000 SF 450$ $ 3,150,000
RO Equipment 3
3.4 MGD 950,000$ $ 3,269,000
Chemical Storage/Feed System
Scale Inhibitor 1 LS 50,000$ $ 50,000
Caustic Soda 1 LS 200,000$ $ 200,000
Calcium Chloride 1 LS 110,000$ $ 110,000
Ammonia 1 LS 100,000$ $ 100,000
Sodium Hypochlorite 1 LS 110,000$ $ 110,000
Degasifiers 1 LS 220,000$ $ 220,000
High Service Pump Station 1 LS 2,000,000$ $ 2,000,000
High Service Pump Reservoir 4
1,000,000 GALLON 2.00$ $ 2,000,000
Yard Piping 1 LS $ 375,000 $ 375,000
Concentrate Pipeline 1
12,600 LF 192$ $ 2,423,077
Process Electrical 1 LS 4,500,000$ $ 4,500,000
Standby Power for RO WTP 1 LS 900,000$ $ 900,000
Process Instrumentation 1 LS 2,600,000$ $ 2,600,000
Site Work 5
1 LS 300,000$ $ 300,000
Subtotal 22,840,000$ Contingency (30%) 6,860,000$
TOTAL CONSTRUCTION COSTS 6
29,700,000$
Engineering and Contract Administration (20%) 5,940,000$
TOTAL PROJECT COST 7
35,640,000$
1. Open trench construction, assumes public right of way, and does not include trenchless intersection crossings.
2. Includes general building HVAC, plumbing, and electrical. Unit price based on pre-engineered metal
building type construction. Unit price based on usable square footage.
3. Includes membrane skids, piping, pressure vessels, membranes, CIP system, cartridge filters
and on-skid instrumentation & control.
4. Includes bypass flow rate pumping.
5. Includes demolition, excavation, paving, sidewalks, landscaping and general site improvements.
6. ENR Construction Cost Index (20-City average, January 2020): 11,392
7. This is a class 4 Budget Estimate as defined by the AACEI's Revised Classification (1999) with an expected accuracy
range of + 30 percent or - 15 percent. This cost estimate is based upon the Engineer's perception of current conditions
in the project area and is subject to change as variances in the cost of labor, materials, equipment, services provided
by others or economic conditions occur. Since the Engineer has no control over these factors, he cannot warrant or
guarantee that actual bids will not vary from the costs presented herein. This estimate does, however, reflect the Engineer's
professional opinion of accurate costs at this time.

PROJECT: Scenario 8: Mocho 1+2
JOB NO.: Zone 7
DATE: 3/4/2020
BY: E.Hull
COMMENTS:
OPTION A: Treatment 3: Vermont’s standard of PFOS + PFOA + PFHxS + PFHpA + PFNA < 20 ppt
CAPITAL COST ESTIMATE
Classification Quantity Units Unit Cost Extended Cost
Groundwater Wells $ - $ -
Raw Water Pipeline 1
800 LF $ 308 $ 246,154
Desanders 1 LS $ 350,000 $ 350,000
Building 2
9,500 SF 450$ $ 4,275,000
RO Equipment 3
5.2 MGD 950,000$ $ 4,987,000
Chemical Storage/Feed System
Scale Inhibitor 1 LS 80,000$ $ 80,000
Caustic Soda 1 LS 280,000$ $ 280,000
Calcium Chloride 1 LS 180,000$ $ 180,000
Ammonia 1 LS 140,000$ $ 140,000
Sodium Hypochlorite 1 LS 180,000$ $ 180,000
Degasifiers 1 LS 280,000$ $ 280,000
High Service Pump Station 1 LS 2,000,000$ $ 2,000,000
High Service Pump Reservoir 4
1,000,000 GALLON 2.00$ $ 2,000,000
Yard Piping 1 LS $ 375,000 $ 375,000
Concentrate Pipeline 1
12,600 LF 192$ $ 2,423,077
Process Electrical 1 LS 5,500,000$ $ 5,500,000
Standby Power for RO WTP 1 LS 1,200,000$ $ 1,200,000
Process Instrumentation 1 LS 3,200,000$ $ 3,200,000
Site Work 5
1 LS 300,000$ $ 300,000
Subtotal 28,000,000$ Contingency (30%) 8,400,000$
TOTAL CONSTRUCTION COSTS 6
36,400,000$
Engineering and Contract Administration (20%) 7,280,000$
TOTAL PROJECT COST 7
43,680,000$
1. Open trench construction, assumes public right of way, and does not include trenchless intersection crossings.
2. Includes general building HVAC, plumbing, and electrical. Unit price based on pre-engineered metal
building type construction. Unit price based on usable square footage.
3. Includes membrane skids, piping, pressure vessels, membranes, CIP system, cartridge filters
and on-skid instrumentation & control.
4. Includes bypass flow rate pumping.
5. Includes demolition, excavation, paving, sidewalks, landscaping and general site improvements.
6. ENR Construction Cost Index (20-City average, January 2020): 11,392
7. This is a class 4 Budget Estimate as defined by the AACEI's Revised Classification (1999) with an expected accuracy
range of + 30 percent or - 15 percent. This cost estimate is based upon the Engineer's perception of current conditions
in the project area and is subject to change as variances in the cost of labor, materials, equipment, services provided
by others or economic conditions occur. Since the Engineer has no control over these factors, he cannot warrant or
guarantee that actual bids will not vary from the costs presented herein. This estimate does, however, reflect the Engineer's
professional opinion of accurate costs at this time.
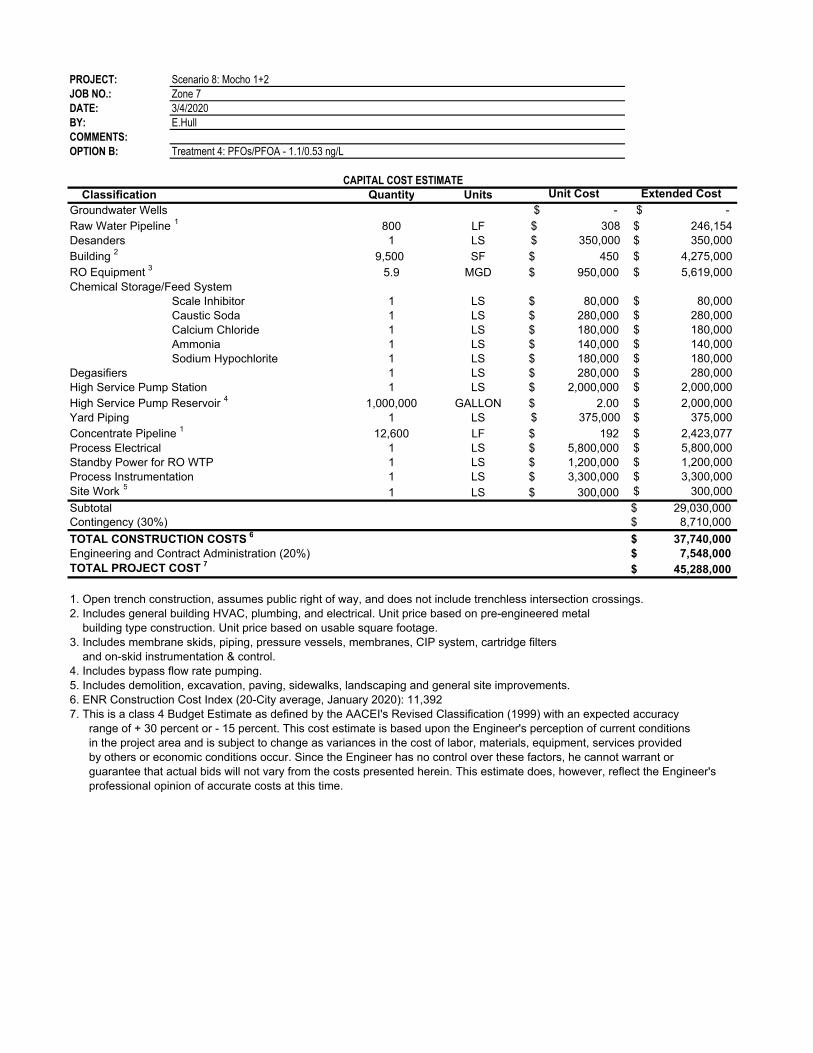
PROJECT: Scenario 8: Mocho 1+2
JOB NO.: Zone 7
DATE: 3/4/2020
BY: E.Hull
COMMENTS:
OPTION B: Treatment 4: PFOs/PFOA - 1.1/0.53 ng/L
CAPITAL COST ESTIMATE
Classification Quantity Units Unit Cost Extended Cost
Groundwater Wells $ - $ -
Raw Water Pipeline 1
800 LF $ 308 $ 246,154
Desanders 1 LS $ 350,000 $ 350,000
Building 2
9,500 SF 450$ $ 4,275,000
RO Equipment 3
5.9 MGD 950,000$ $ 5,619,000
Chemical Storage/Feed System
Scale Inhibitor 1 LS 80,000$ $ 80,000
Caustic Soda 1 LS 280,000$ $ 280,000
Calcium Chloride 1 LS 180,000$ $ 180,000
Ammonia 1 LS 140,000$ $ 140,000
Sodium Hypochlorite 1 LS 180,000$ $ 180,000
Degasifiers 1 LS 280,000$ $ 280,000
High Service Pump Station 1 LS 2,000,000$ $ 2,000,000
High Service Pump Reservoir 4
1,000,000 GALLON 2.00$ $ 2,000,000
Yard Piping 1 LS $ 375,000 $ 375,000
Concentrate Pipeline 1
12,600 LF 192$ $ 2,423,077
Process Electrical 1 LS 5,800,000$ $ 5,800,000
Standby Power for RO WTP 1 LS 1,200,000$ $ 1,200,000
Process Instrumentation 1 LS 3,300,000$ $ 3,300,000
Site Work 5
1 LS 300,000$ $ 300,000
Subtotal 29,030,000$ Contingency (30%) 8,710,000$
TOTAL CONSTRUCTION COSTS 6
37,740,000$
Engineering and Contract Administration (20%) 7,548,000$
TOTAL PROJECT COST 7
45,288,000$
1. Open trench construction, assumes public right of way, and does not include trenchless intersection crossings.
2. Includes general building HVAC, plumbing, and electrical. Unit price based on pre-engineered metal
building type construction. Unit price based on usable square footage.
3. Includes membrane skids, piping, pressure vessels, membranes, CIP system, cartridge filters
and on-skid instrumentation & control.
4. Includes bypass flow rate pumping.
5. Includes demolition, excavation, paving, sidewalks, landscaping and general site improvements.
6. ENR Construction Cost Index (20-City average, January 2020): 11,392
7. This is a class 4 Budget Estimate as defined by the AACEI's Revised Classification (1999) with an expected accuracy
range of + 30 percent or - 15 percent. This cost estimate is based upon the Engineer's perception of current conditions
in the project area and is subject to change as variances in the cost of labor, materials, equipment, services provided
by others or economic conditions occur. Since the Engineer has no control over these factors, he cannot warrant or
guarantee that actual bids will not vary from the costs presented herein. This estimate does, however, reflect the Engineer's
professional opinion of accurate costs at this time.
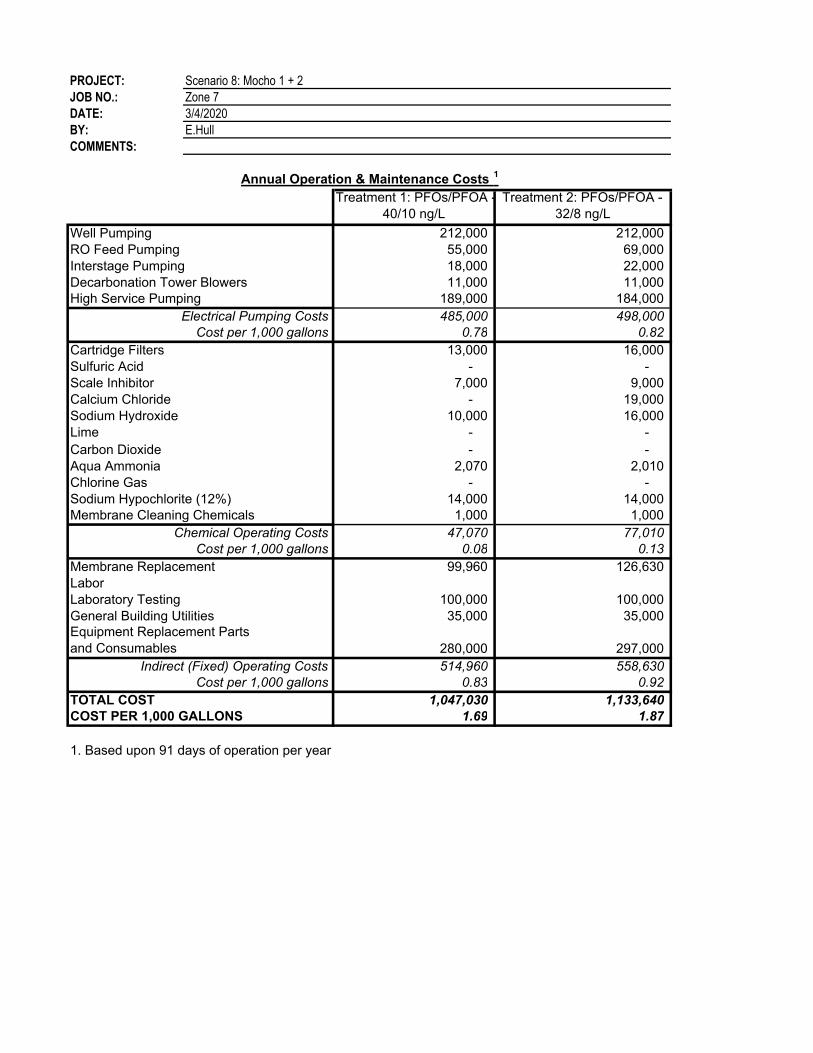
PROJECT: Scenario 8: Mocho 1 + 2
JOB NO.: Zone 7
DATE: 3/4/2020
BY: E.Hull
COMMENTS:
Annual Operation & Maintenance Costs 1
Treatment 1: PFOs/PFOA -
40/10 ng/L
Treatment 2: PFOs/PFOA -
32/8 ng/L
Well Pumping 212,000 212,000
RO Feed Pumping 55,000 69,000
Interstage Pumping 18,000 22,000
Decarbonation Tower Blowers 11,000 11,000
High Service Pumping 189,000 184,000
Electrical Pumping Costs 485,000 498,000
Cost per 1,000 gallons 0.78 0.82
Cartridge Filters 13,000 16,000
Sulfuric Acid - -
Scale Inhibitor 7,000 9,000
Calcium Chloride - 19,000
Sodium Hydroxide 10,000 16,000
Lime - -
Carbon Dioxide - -
Aqua Ammonia 2,070 2,010
Chlorine Gas - -
Sodium Hypochlorite (12%) 14,000 14,000
Membrane Cleaning Chemicals 1,000 1,000
Chemical Operating Costs 47,070 77,010
Cost per 1,000 gallons 0.08 0.13
Membrane Replacement 99,960 126,630
Labor
Laboratory Testing 100,000 100,000
General Building Utilities 35,000 35,000
280,000 297,000
Indirect (Fixed) Operating Costs 514,960 558,630
Cost per 1,000 gallons 0.83 0.92
TOTAL COST 1,047,030 1,133,640
COST PER 1,000 GALLONS 1.69 1.87
1. Based upon 91 days of operation per year
Equipment Replacement Parts
and Consumables
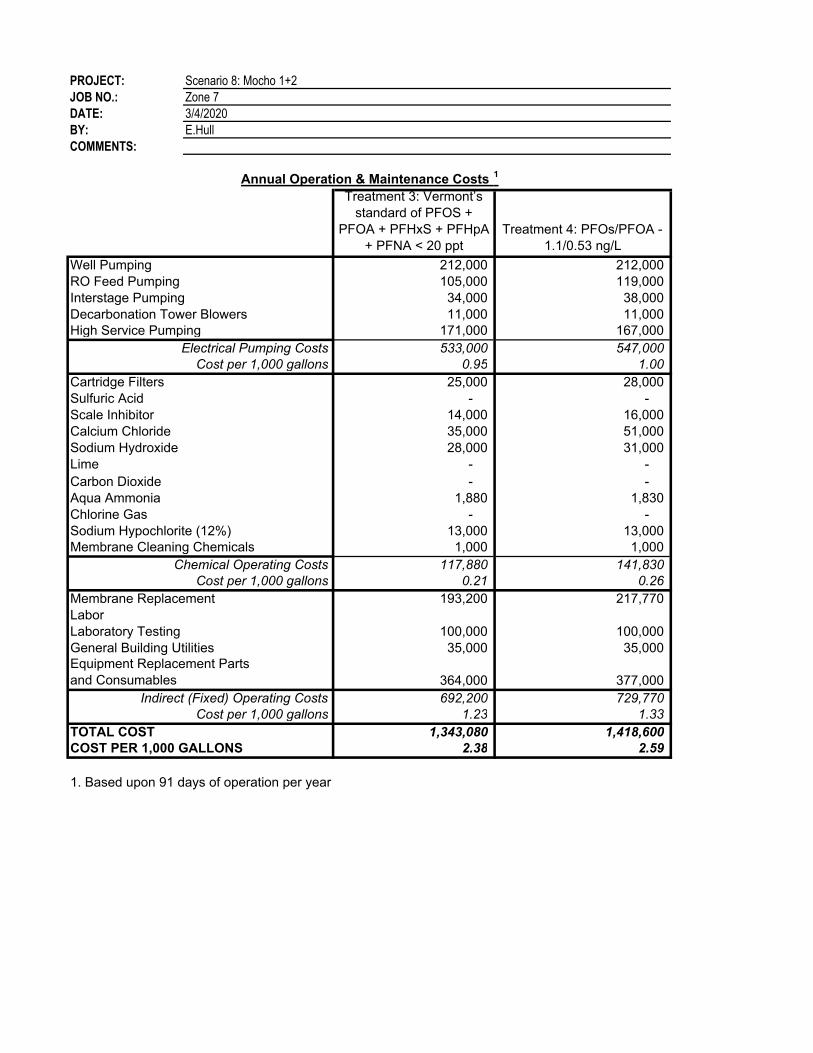
PROJECT: Scenario 8: Mocho 1+2
JOB NO.: Zone 7
DATE: 3/4/2020
BY: E.Hull
COMMENTS:
Annual Operation & Maintenance Costs 1
Treatment 3: Vermont’s
standard of PFOS +
PFOA + PFHxS + PFHpA
+ PFNA < 20 ppt
Treatment 4: PFOs/PFOA -
1.1/0.53 ng/L
Well Pumping 212,000 212,000
RO Feed Pumping 105,000 119,000
Interstage Pumping 34,000 38,000
Decarbonation Tower Blowers 11,000 11,000
High Service Pumping 171,000 167,000
Electrical Pumping Costs 533,000 547,000
Cost per 1,000 gallons 0.95 1.00
Cartridge Filters 25,000 28,000
Sulfuric Acid - -
Scale Inhibitor 14,000 16,000
Calcium Chloride 35,000 51,000
Sodium Hydroxide 28,000 31,000
Lime - -
Carbon Dioxide - -
Aqua Ammonia 1,880 1,830
Chlorine Gas - -
Sodium Hypochlorite (12%) 13,000 13,000
Membrane Cleaning Chemicals 1,000 1,000
Chemical Operating Costs 117,880 141,830
Cost per 1,000 gallons 0.21 0.26
Membrane Replacement 193,200 217,770
Labor
Laboratory Testing 100,000 100,000
General Building Utilities 35,000 35,000
364,000 377,000
Indirect (Fixed) Operating Costs 692,200 729,770
Cost per 1,000 gallons 1.23 1.33
TOTAL COST 1,343,080 1,418,600
COST PER 1,000 GALLONS 2.38 2.59
1. Based upon 91 days of operation per year
Equipment Replacement Parts
and Consumables

PROJECT: Scenario 9: Mocho 1 + 2 + 3
JOB NO.: Zone 7
DATE: 3/4/2020
BY: E.Hull
COMMENTS:
SUMMARY OF COSTSTreatment 1: PFOs/PFOA -
40/10 ng/L
Treatment 2: PFOs/PFOA -
32/8 ng/L
$30,050,000 $40,550,000
6,010,000 8,110,000
$36,060,000 $48,660,000
2,537,000 3,424,000
828,000 863,000
53,890 76,750
544,780 715,930
$3,963,670 $5,079,680
12.8 12.3
14,335 13,832
3,584 3,458
Unit Capital Cost ($/gpd) $2.82 $3.94
$3.39 $4.51$1,106 $1,469
1. Interest rate based upon FY2006 State Revolving Loan Interest Rates
2. Based upon 91 days of operation per year.
Indirect Costs
CAPITAL COSTS
RO Water Treatment Plant
Engineering & Contingencies (20%)
Total Project Cost
ANNUAL COSTS
Ammortized Annual Cost (3.5% for 20 Years) 1
Operation and Maintenance:
Water Treatment Plant Energy Cost
Chemicals
Unit Cost of Water ($ per 1,000 gallons) 2
Unit Cost of Water ($ per acft) 2
Total Annual Cost
Available Project Yield, MGD
Available Project Yield, AF/yr
Actual Project Yield, AF/yr 2
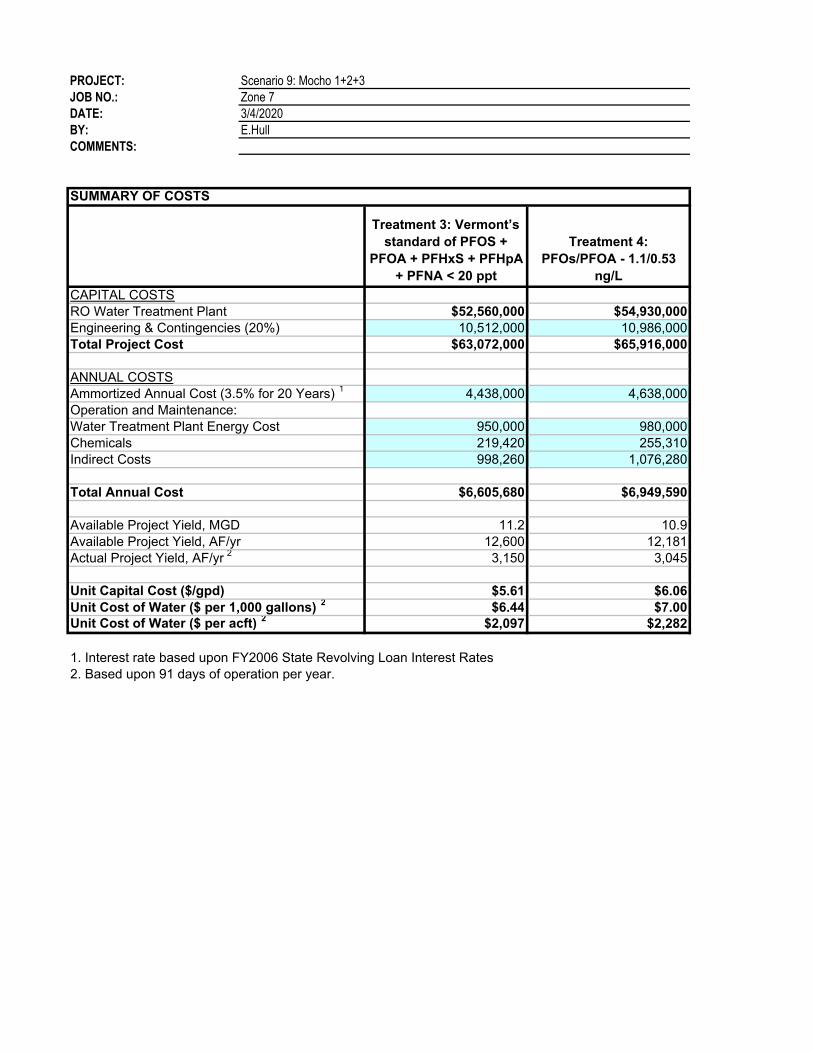
PROJECT: Scenario 9: Mocho 1+2+3
JOB NO.: Zone 7
DATE: 3/4/2020
BY: E.Hull
COMMENTS:
SUMMARY OF COSTS
Treatment 3: Vermont’s
standard of PFOS +
PFOA + PFHxS + PFHpA
+ PFNA < 20 ppt
Treatment 4:
PFOs/PFOA - 1.1/0.53
ng/L
$52,560,000 $54,930,000
10,512,000 10,986,000
$63,072,000 $65,916,000
4,438,000 4,638,000
950,000 980,000
219,420 255,310
998,260 1,076,280
$6,605,680 $6,949,590
11.2 10.9
12,600 12,181
3,150 3,045
Unit Capital Cost ($/gpd) $5.61 $6.06
$6.44 $7.00$2,097 $2,282
1. Interest rate based upon FY2006 State Revolving Loan Interest Rates
2. Based upon 91 days of operation per year.
Unit Cost of Water ($ per 1,000 gallons) 2
Unit Cost of Water ($ per acft) 2
Total Annual Cost
Available Project Yield, MGD
Available Project Yield, AF/yr
Actual Project Yield, AF/yr 2
Indirect Costs
CAPITAL COSTS
RO Water Treatment Plant
Engineering & Contingencies (20%)
Total Project Cost
ANNUAL COSTS
Ammortized Annual Cost (3.5% for 20 Years) 1
Operation and Maintenance:
Water Treatment Plant Energy Cost
Chemicals

PROJECT: Scenario 9: Mocho 1 + 2 + 3
JOB NO.: Zone 7
DATE: 3/4/2020
BY: E.Hull
COMMENTS:
OPTION A: Treatment 1: PFOs/PFOA - 40/10 ng/L
CAPITAL COST ESTIMATE
Classification Quantity Units Unit Cost Extended Cost
Groundwater Wells $ - $ -
Raw Water Pipeline 1
800 LF $ 385 $ 307,692
Desanders 1 LS $ 280,000 $ 280,000
Building 2
7,000 SF 450$ $ 3,150,000
RO Equipment 3
3.0 MGD 950,000$ $ 2,808,000
Chemical Storage/Feed System
Scale Inhibitor 1 LS 50,000$ $ 50,000
Caustic Soda 1 LS 200,000$ $ 200,000
Calcium Chloride 1 LS 110,000$ $ 110,000
Ammonia 1 LS 100,000$ $ 100,000
Sodium Hypochlorite 1 LS 110,000$ $ 110,000
Degasifiers 1 LS 220,000$ $ 220,000
High Service Pump Station 1 LS 2,500,000$ $ 2,500,000
High Service Pump Reservoir 4
1,000,000 GALLON 2.00$ $ 2,000,000
Yard Piping 1 LS $ 400,000 $ 400,000
Concentrate Pipeline 1
12,600 LF 192$ $ 2,423,077
Process Electrical 1 LS 4,600,000$ $ 4,600,000
Standby Power for RO WTP 1 LS 950,000$ $ 950,000
Process Instrumentation 1 LS 2,600,000$ $ 2,600,000
Site Work 5
1 LS 300,000$ $ 300,000
Subtotal 23,110,000$ Contingency (30%) 6,940,000$
TOTAL CONSTRUCTION COSTS 6
30,050,000$
Engineering and Contract Administration (20%) 6,010,000$
TOTAL PROJECT COST 7
36,060,000$
1. Open trench construction, assumes public right of way, and does not include trenchless intersection crossings.
2. Includes general building HVAC, plumbing, and electrical. Unit price based on pre-engineered metal
building type construction. Unit price based on usable square footage.
3. Includes membrane skids, piping, pressure vessels, membranes, CIP system, cartridge filters
and on-skid instrumentation & control.
4. Includes bypass flow rate pumping.
5. Includes demolition, excavation, paving, sidewalks, landscaping and general site improvements.
6. ENR Construction Cost Index (20-City average, January 2020): 11,392
7. This is a class 4 Budget Estimate as defined by the AACEI's Revised Classification (1999) with an expected accuracy
range of + 30 percent or - 15 percent. This cost estimate is based upon the Engineer's perception of current conditions
in the project area and is subject to change as variances in the cost of labor, materials, equipment, services provided
by others or economic conditions occur. Since the Engineer has no control over these factors, he cannot warrant or
guarantee that actual bids will not vary from the costs presented herein. This estimate does, however, reflect the Engineer's
professional opinion of accurate costs at this time.
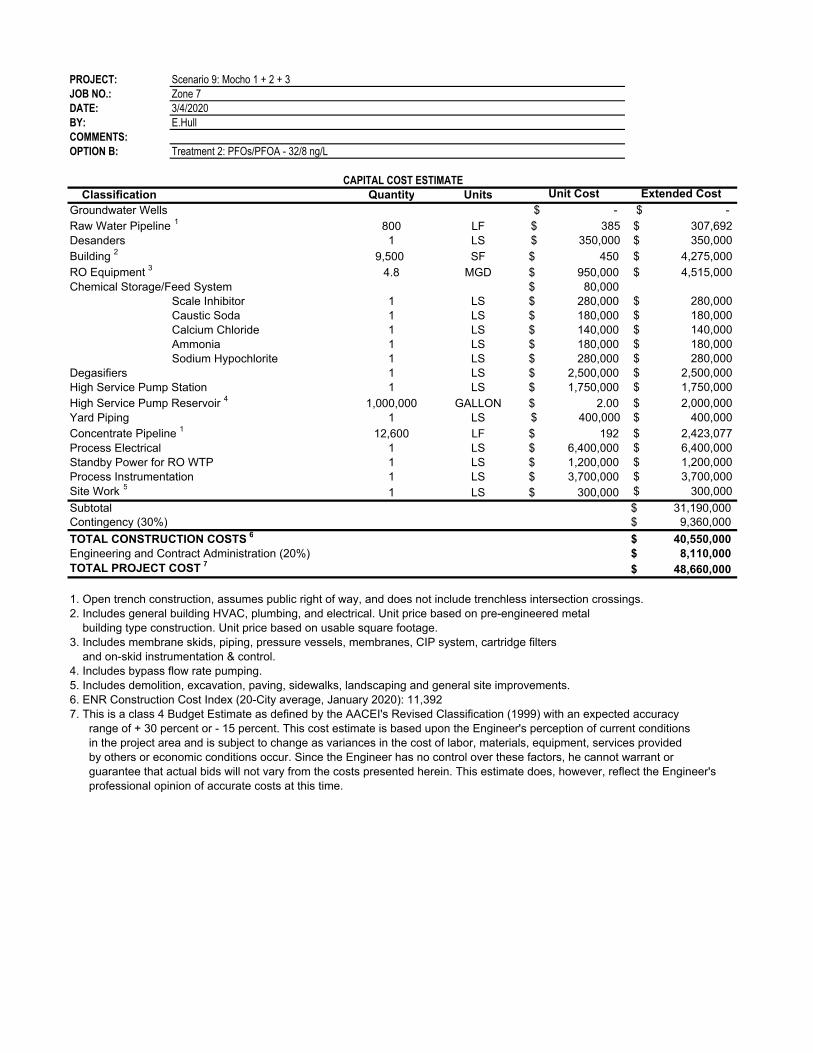
PROJECT: Scenario 9: Mocho 1 + 2 + 3
JOB NO.: Zone 7
DATE: 3/4/2020
BY: E.Hull
COMMENTS:
OPTION B: Treatment 2: PFOs/PFOA - 32/8 ng/L
CAPITAL COST ESTIMATE
Classification Quantity Units Unit Cost Extended Cost
Groundwater Wells $ - $ -
Raw Water Pipeline 1
800 LF $ 385 $ 307,692
Desanders 1 LS $ 350,000 $ 350,000
Building 2
9,500 SF 450$ $ 4,275,000
RO Equipment 3
4.8 MGD 950,000$ $ 4,515,000
Chemical Storage/Feed System 80,000$
Scale Inhibitor 1 LS 280,000$ $ 280,000
Caustic Soda 1 LS 180,000$ $ 180,000
Calcium Chloride 1 LS 140,000$ $ 140,000
Ammonia 1 LS 180,000$ $ 180,000
Sodium Hypochlorite 1 LS 280,000$ $ 280,000
Degasifiers 1 LS 2,500,000$ $ 2,500,000
High Service Pump Station 1 LS 1,750,000$ $ 1,750,000
High Service Pump Reservoir 4
1,000,000 GALLON 2.00$ $ 2,000,000
Yard Piping 1 LS $ 400,000 $ 400,000
Concentrate Pipeline 1
12,600 LF 192$ $ 2,423,077
Process Electrical 1 LS 6,400,000$ $ 6,400,000
Standby Power for RO WTP 1 LS 1,200,000$ $ 1,200,000
Process Instrumentation 1 LS 3,700,000$ $ 3,700,000
Site Work 5
1 LS 300,000$ $ 300,000
Subtotal 31,190,000$ Contingency (30%) 9,360,000$
TOTAL CONSTRUCTION COSTS 6
40,550,000$
Engineering and Contract Administration (20%) 8,110,000$
TOTAL PROJECT COST 7
48,660,000$
1. Open trench construction, assumes public right of way, and does not include trenchless intersection crossings.
2. Includes general building HVAC, plumbing, and electrical. Unit price based on pre-engineered metal
building type construction. Unit price based on usable square footage.
3. Includes membrane skids, piping, pressure vessels, membranes, CIP system, cartridge filters
and on-skid instrumentation & control.
4. Includes bypass flow rate pumping.
5. Includes demolition, excavation, paving, sidewalks, landscaping and general site improvements.
6. ENR Construction Cost Index (20-City average, January 2020): 11,392
7. This is a class 4 Budget Estimate as defined by the AACEI's Revised Classification (1999) with an expected accuracy
range of + 30 percent or - 15 percent. This cost estimate is based upon the Engineer's perception of current conditions
in the project area and is subject to change as variances in the cost of labor, materials, equipment, services provided
by others or economic conditions occur. Since the Engineer has no control over these factors, he cannot warrant or
guarantee that actual bids will not vary from the costs presented herein. This estimate does, however, reflect the Engineer's
professional opinion of accurate costs at this time.

PROJECT: Scenario 9: Mocho 1+2+3
JOB NO.: Zone 7
DATE: 3/4/2020
BY: E.Hull
COMMENTS:
OPTION A: Treatment 3: Vermont’s standard of PFOS + PFOA + PFHxS + PFHpA + PFNA < 20 ppt
CAPITAL COST ESTIMATE
Classification Quantity Units Unit Cost Extended Cost
Groundwater Wells $ - $ -
Raw Water Pipeline 1
800 LF $ 385 $ 307,692
Desanders 1 LS $ 650,000 $ 650,000
Building 2
13,500 SF 450$ $ 6,075,000
RO Equipment 3
9.2 MGD 950,000$ $ 8,700,000
Chemical Storage/Feed System
Scale Inhibitor 1 LS 80,000$ $ 80,000
Caustic Soda 1 LS 300,000$ $ 300,000
Calcium Chloride 1 LS 200,000$ $ 200,000
Ammonia 1 LS 200,000$ $ 200,000
Sodium Hypochlorite 1 LS 200,000$ $ 200,000
Degasifiers 1 LS 350,000$ $ 350,000
High Service Pump Station 1 LS 2,800,000$ $ 2,800,000
High Service Pump Reservoir 4
1,000,000 GALLON 2.00$ $ 2,000,000
Yard Piping 1 LS $ 450,000 $ 450,000
Concentrate Pipeline 1
12,600 LF 231$ $ 2,907,692
Process Electrical 1 LS 8,300,000$ $ 8,300,000
Standby Power for RO WTP 1 LS 1,800,000$ $ 1,800,000
Process Instrumentation 1 LS 4,800,000$ $ 4,800,000
Site Work 5
1 LS 300,000$ $ 300,000
Subtotal 40,430,000$ Contingency (30%) 12,130,000$
TOTAL CONSTRUCTION COSTS 6
52,560,000$
Engineering and Contract Administration (20%) 10,512,000$
TOTAL PROJECT COST 7
63,072,000$
1. Open trench construction, assumes public right of way, and does not include trenchless intersection crossings.
2. Includes general building HVAC, plumbing, and electrical. Unit price based on pre-engineered metal
building type construction. Unit price based on usable square footage.
3. Includes membrane skids, piping, pressure vessels, membranes, CIP system, cartridge filters
and on-skid instrumentation & control.
4. Includes bypass flow rate pumping.
5. Includes demolition, excavation, paving, sidewalks, landscaping and general site improvements.
6. ENR Construction Cost Index (20-City average, January 2020): 11,392
7. This is a class 4 Budget Estimate as defined by the AACEI's Revised Classification (1999) with an expected accuracy
range of + 30 percent or - 15 percent. This cost estimate is based upon the Engineer's perception of current conditions
in the project area and is subject to change as variances in the cost of labor, materials, equipment, services provided
by others or economic conditions occur. Since the Engineer has no control over these factors, he cannot warrant or
guarantee that actual bids will not vary from the costs presented herein. This estimate does, however, reflect the Engineer's
professional opinion of accurate costs at this time.
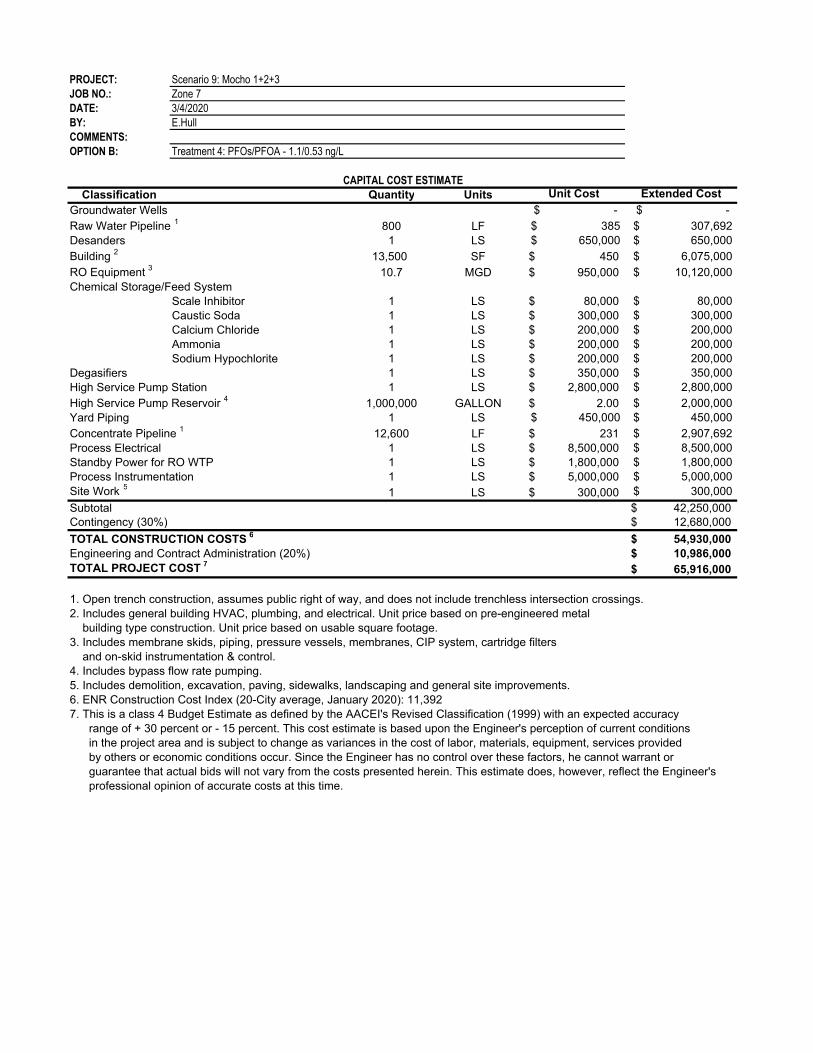
PROJECT: Scenario 9: Mocho 1+2+3
JOB NO.: Zone 7
DATE: 3/4/2020
BY: E.Hull
COMMENTS:
OPTION B: Treatment 4: PFOs/PFOA - 1.1/0.53 ng/L
CAPITAL COST ESTIMATE
Classification Quantity Units Unit Cost Extended Cost
Groundwater Wells $ - $ -
Raw Water Pipeline 1
800 LF $ 385 $ 307,692
Desanders 1 LS $ 650,000 $ 650,000
Building 2
13,500 SF 450$ $ 6,075,000
RO Equipment 3
10.7 MGD 950,000$ $ 10,120,000
Chemical Storage/Feed System
Scale Inhibitor 1 LS 80,000$ $ 80,000
Caustic Soda 1 LS 300,000$ $ 300,000
Calcium Chloride 1 LS 200,000$ $ 200,000
Ammonia 1 LS 200,000$ $ 200,000
Sodium Hypochlorite 1 LS 200,000$ $ 200,000
Degasifiers 1 LS 350,000$ $ 350,000
High Service Pump Station 1 LS 2,800,000$ $ 2,800,000
High Service Pump Reservoir 4
1,000,000 GALLON 2.00$ $ 2,000,000
Yard Piping 1 LS $ 450,000 $ 450,000
Concentrate Pipeline 1
12,600 LF 231$ $ 2,907,692
Process Electrical 1 LS 8,500,000$ $ 8,500,000
Standby Power for RO WTP 1 LS 1,800,000$ $ 1,800,000
Process Instrumentation 1 LS 5,000,000$ $ 5,000,000
Site Work 5
1 LS 300,000$ $ 300,000
Subtotal 42,250,000$ Contingency (30%) 12,680,000$
TOTAL CONSTRUCTION COSTS 6
54,930,000$
Engineering and Contract Administration (20%) 10,986,000$
TOTAL PROJECT COST 7
65,916,000$
1. Open trench construction, assumes public right of way, and does not include trenchless intersection crossings.
2. Includes general building HVAC, plumbing, and electrical. Unit price based on pre-engineered metal
building type construction. Unit price based on usable square footage.
3. Includes membrane skids, piping, pressure vessels, membranes, CIP system, cartridge filters
and on-skid instrumentation & control.
4. Includes bypass flow rate pumping.
5. Includes demolition, excavation, paving, sidewalks, landscaping and general site improvements.
6. ENR Construction Cost Index (20-City average, January 2020): 11,392
7. This is a class 4 Budget Estimate as defined by the AACEI's Revised Classification (1999) with an expected accuracy
range of + 30 percent or - 15 percent. This cost estimate is based upon the Engineer's perception of current conditions
in the project area and is subject to change as variances in the cost of labor, materials, equipment, services provided
by others or economic conditions occur. Since the Engineer has no control over these factors, he cannot warrant or
guarantee that actual bids will not vary from the costs presented herein. This estimate does, however, reflect the Engineer's
professional opinion of accurate costs at this time.

PROJECT: Scenario 9: Mocho 1 + 2 + 3
JOB NO.: Zone 7
DATE: 3/4/2020
BY: E.Hull
COMMENTS:
Annual Operation & Maintenance Costs 1
Treatment 1: PFOs/PFOA -
40/10 ng/L
Treatment 2: PFOs/PFOA -
32/8 ng/L
Well Pumping 384,000 384,000
RO Feed Pumping 59,000 95,000
Interstage Pumping 19,000 31,000
Decarbonation Tower Blowers 11,000 11,000
High Service Pumping 355,000 342,000
Electrical Pumping Costs 828,000 863,000
Cost per 1,000 gallons 0.71 0.77
Cartridge Filters 14,000 22,000
Sulfuric Acid - -
Scale Inhibitor 8,000 13,000
Calcium Chloride - 7,000
Sodium Hydroxide - 4,000
Lime - -
Carbon Dioxide - -
Aqua Ammonia 3,890 3,750
Chlorine Gas - -
Sodium Hypochlorite (12%) 27,000 26,000
Membrane Cleaning Chemicals 1,000 1,000
Chemical Operating Costs 53,890 76,750
Cost per 1,000 gallons 0.05 0.07
Membrane Replacement 108,780 174,930
Labor
Laboratory Testing 100,000 100,000
General Building Utilities 35,000 35,000
301,000 406,000
Indirect (Fixed) Operating Costs 544,780 715,930
Cost per 1,000 gallons 0.47 0.64
TOTAL COST 1,426,670 1,655,680
COST PER 1,000 GALLONS 1.22 1.47
1. Based upon 91 days of operation per year
Equipment Replacement Parts
and Consumables
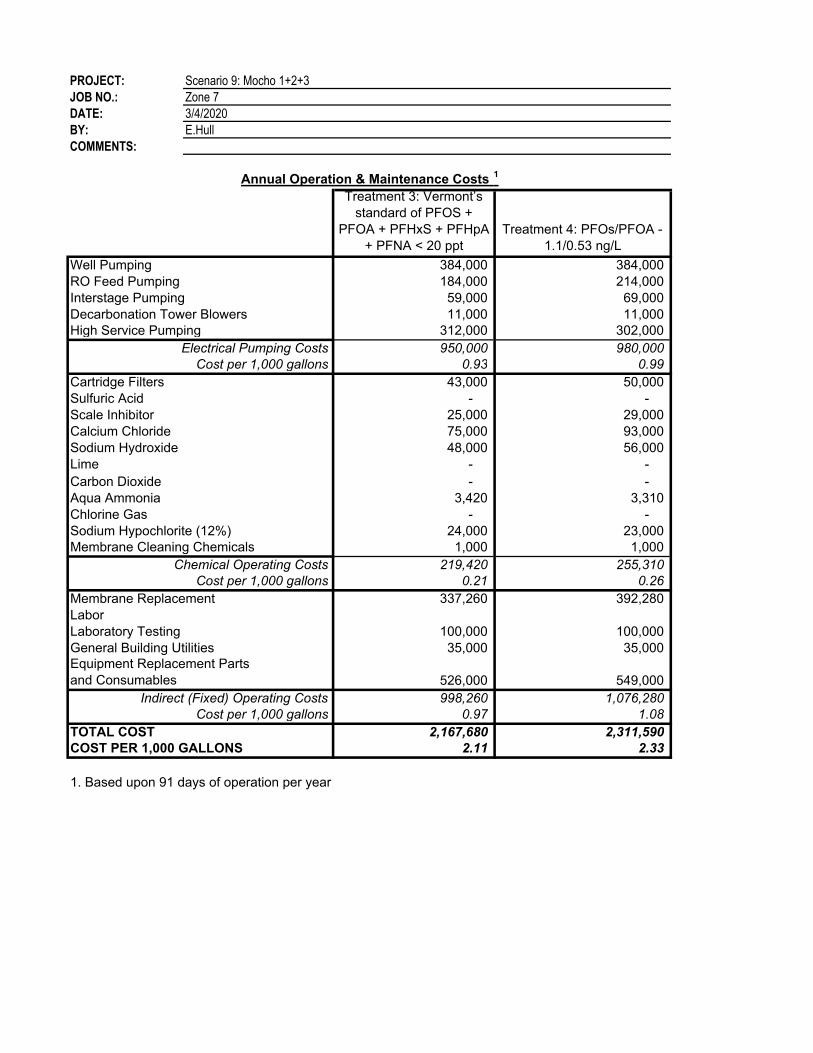
PROJECT: Scenario 9: Mocho 1+2+3
JOB NO.: Zone 7
DATE: 3/4/2020
BY: E.Hull
COMMENTS:
Annual Operation & Maintenance Costs 1
Treatment 3: Vermont’s
standard of PFOS +
PFOA + PFHxS + PFHpA
+ PFNA < 20 ppt
Treatment 4: PFOs/PFOA -
1.1/0.53 ng/L
Well Pumping 384,000 384,000
RO Feed Pumping 184,000 214,000
Interstage Pumping 59,000 69,000
Decarbonation Tower Blowers 11,000 11,000
High Service Pumping 312,000 302,000
Electrical Pumping Costs 950,000 980,000
Cost per 1,000 gallons 0.93 0.99
Cartridge Filters 43,000 50,000
Sulfuric Acid - -
Scale Inhibitor 25,000 29,000
Calcium Chloride 75,000 93,000
Sodium Hydroxide 48,000 56,000
Lime - -
Carbon Dioxide - -
Aqua Ammonia 3,420 3,310
Chlorine Gas - -
Sodium Hypochlorite (12%) 24,000 23,000
Membrane Cleaning Chemicals 1,000 1,000
Chemical Operating Costs 219,420 255,310
Cost per 1,000 gallons 0.21 0.26
Membrane Replacement 337,260 392,280
Labor
Laboratory Testing 100,000 100,000
General Building Utilities 35,000 35,000
526,000 549,000
Indirect (Fixed) Operating Costs 998,260 1,076,280
Cost per 1,000 gallons 0.97 1.08
TOTAL COST 2,167,680 2,311,590
COST PER 1,000 GALLONS 2.11 2.33
1. Based upon 91 days of operation per year
Equipment Replacement Parts
and Consumables


