Human Capital Mobility and Strategic Foundations for Economic Development of Society A dissertation presented by Zoran Crncevic to The Faculty of Economics in partial fulfillment of the requirements for the degree of Master of Science in the subject of Economics University of Banja Luka Bosnia and Herzegovina January 2012
Transcript
Human Capital Mobility and Strategic Foundations
for Economic Development of Society
A dissertation presented by Zoran Crncevic
to
The Faculty of Economics
in partial fulfillment of the requirements for the degree of
Master of Science in the subject of
Economics
University of Banja Luka Bosnia and Herzegovina
January 2012
ii
Dissertation advisor: Professor Jovo Ateljevic, PhD
Human Capital Mobility and Strategic Foundations
for Economic Development of Society
ABSTRACT
This dissertation explores the economic and societal factors within the living and
working environment which influence the choice of residence of knowledge and creative
workers currently living and working in Banja Luka, Bosnia and Herzegovina (BiH).
Economic development based on creativity and knowledge is the leading growth
strategy for both developed and developing economies. Human capital has become a sought
after resource. In recent decades a handful of metropolitan areas have experienced growth of
their knowledge and creative industries while many other cities have suffered a deterioration
of their pool of knowledge and skills. The majority of the world population, most key
patents and the most prominent scientists are concentrated in a limited number of
metropolitan regions.
Despite a growing amount of research into this phenomenon in developed economies,
a detailed review of the literature revealed that there is a lack of empirical research dealing
with human capital and its mobility in transitional countries. Our research reports on a
comprehensive survey of 420 creative and knowledge-equipped people in Banja Luka, and
four interviews with CEOs of SMEs working in knowledge and creative sectors. This study
iii
suggests that ties with family and friends are the most important factor when choosing a
place of residence and that culture, amenities, social diversity, and environmental quality are
less important in this regard. The results have also been compared with findings of similar
surveys conducted across the developed part of the EU. We have found that less than a
quarter of the respondents are almost definitely or very likely to leave the country to larger
EU cities – fewer than previously believed.
Keywords: human capital mobility, urban, knowledge economy, creative industry,
innovation, knowledge networks.
iv
TABLE OF CONTENTS
ABSTRACT ........................................................................................................................ II LIST OF TABLES ............................................................................................................. V
ACKNOWLEDGEMENTS .............................................................................................. VI 1. INTRODUCTION .......................................................................................................... 1 2. LITERATURE REVIEW ............................................................................................. 10
2.1. The Knowledge and Creative industries ........................................................... 12 2.2. Environmental factors of human capital accumulation .................................... 17 2.3. South East Europe ............................................................................................ 26 2.4. Conclusion ........................................................................................................ 33
3. METHODOLOGY ....................................................................................................... 34 3.1. Hypotheses ....................................................................................................... 35 3.2. Variables ........................................................................................................... 37 3.3. Research methods and techniques .................................................................... 40 3.4. Focus group ...................................................................................................... 42 3.5. Survey ............................................................................................................... 43 3.6. The interview phase .......................................................................................... 52 3.7. Validity and Reliability .................................................................................... 54 3.8. Geographic location of the research ................................................................. 56
4.2.1. Demographics .................................................................................... 69 4.2.2. Living in Banja Luka ......................................................................... 73 4.2.3. Demographics and likelihood of moving away ................................. 78 4.2.4. City features and likelihood of moving away .................................... 82 4.2.5. Basic employment features of the sample ......................................... 98 4.2.6. Work related factors and likelihood of moving away ..................... 101 4.2.7. Work related factors and likelihood of changing the place of work 105
4.3. Factor analysis and binary logistic regression ................................................ 112 4.4. Results of interviews with entrepreneurs ....................................................... 117
5. DISCUSSIONS ........................................................................................................... 128 6. CONCLUSIONS......................................................................................................... 144 BIBLIOGRAPHY: .......................................................................................................... 147 APPENDIX I - EQUATIONS ........................................................................................ 156 APPENDIX II – INTERVIEW TRANSCRIPTS ........................................................... 157 APPENDIX III – QUESTIONNAIRE ............................................................................ 174
v
LIST OF TABLES
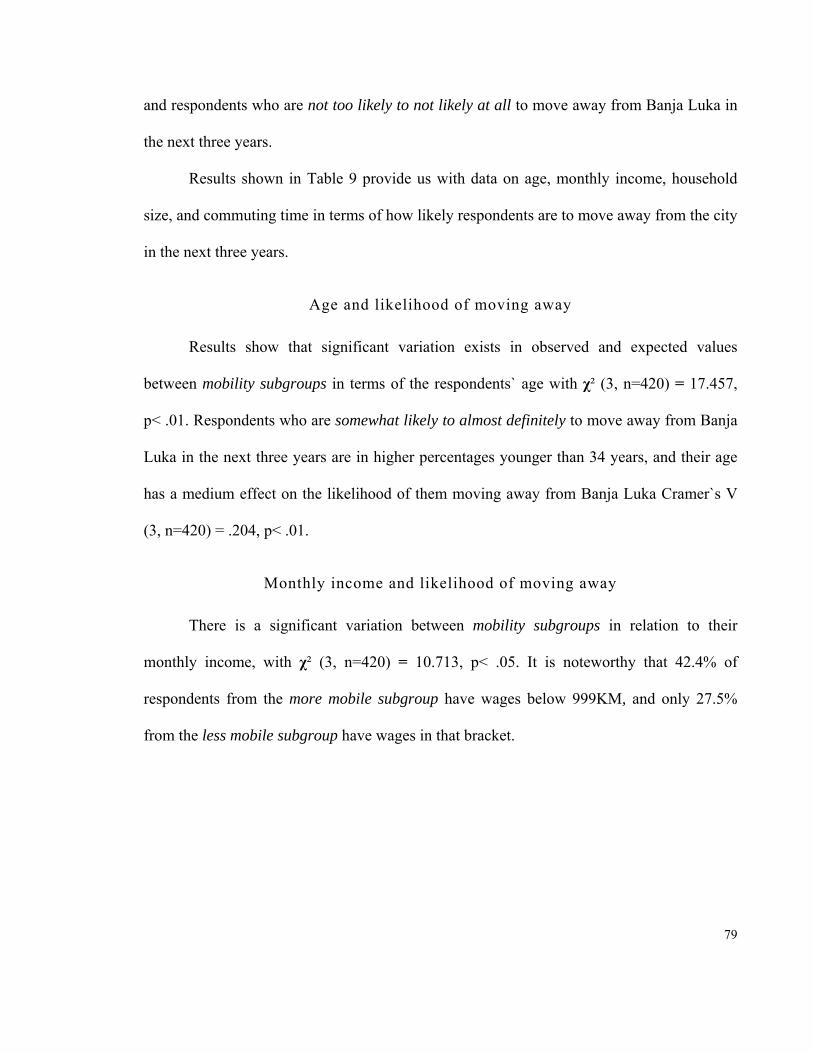
Table 1: Qualifications of employed and unemployed workers in Banja Luka 46Table 2: Sample frame 47Table 3: How likely are you to move away from the city in the next 3 years? 51Table 4: How long do you plan to stay in current company/organization? 51Table 5: Demographic data 70Table 6: Household structure and size, time lived in the city, and previous residence 74Table 7: Local area of current residential address 75Table 8: Four most important reasons for living in Banja Luka 77Table 9: Age, monthly income, household size, commuting time and likelihood of
moving away 80Table 10: Social activities and likelihood of moving away from Banja Luka 83Table 11: Satisfaction with leisure amenities and likelihood of moving away 86Table 12: Satisfaction with public services and likelihood of moving away 88Table 13: Satisfaction with environmental aspects and likelihood of moving away 90Table 14: Issues of concern and likelihood of moving away 93Table 15: Cost of living and likelihood of moving away 96Table 16: Tolerance and likelihood of moving away 98Table 17: Status, category, and employment sector 99Table 18: Status, sector and category of employment and likelihood of moving away 102Table 19: Employment satisfaction and likelihood of moving away 104Table 20: Age, monthly wages, workweek hours, having second job and likelihood of
changing the place of work in the next 3 years 106Table 21: Sector, category, and status of employment and likelihood of changing the
place of work 107Table 22: The main reasons for changing the place of work 108Table 23: Employment satisfaction and likelihood of leaving the company 110Table 24: Bartlett's Test 114Table 25: Communalities 115Table 26: Total Variance Explained 116Table 27: Rotated Component Matrix 117Table 28: Variables 118
vi
ACKNOWLEDGEMENTS
First of all, I want to thank my mentor Professor Jovo Ateljevic, PhD, Faculty of
Economics, University of Banja Luka. I don’t know if this thesis would ever see the light of
day, if it wasn’t for his infinite patience and support.
I want to thank my wife Jelena, who helped me with the analysis of my data, and
cared for our daughter Marina all the hours of evenings, weekends, and holidays that I have
spent working on this thesis. As for Marina, she inspires and cheers us all.
I have received precious help from long term friends Vladimir Arnaut, Richard
Hensby, and Srdjan Dusanic. They might not know how much it mattered.
Darko Milunovic, MA, Faculty of Economics, University of Banja Luka provided me
with invaluable help and comments regarding my data, methodology, and analysis.
I would also like to thank the Head of the Study, Professor Dr. Nikola Vukmirovic,
Faculty of Economics, University of Banja Luka, who supported my interest in
entrepreneurship, creativity and innovation.
Not a customary acknowledgement these days, but all this would never have
happened without God's providence.
All errors are my own.
1
1. INTRODUCTION
This dissertation is a contribution to understanding the impact of environmental
factors on the decision of place of residency and work by knowledge and creative workers in
the context of the development of the knowledge and creative economy in the city of Banja
Luka, Bosnia and Herzegovina.
Companies working in the knowledge and creative industries are more than ever
valued not according to their balance sheets, but to the value of their brand, their pool of
talent, patents, and the knowledge they possess or develop. In an open global economy,
intellectual capital (W. Miller 1999) has increasingly become a sought after resource for
economic and business development. Commercial value of products and services such as
high-tech manufacturing, software, financial services, consulting, video games, arts, the film
industry, interior design and literature, together with entertainment and communication
systems are increasingly related to intangibles1, above all to the knowledge and creativity
utilized in their production. The knowledge economy encompasses “production and services
based on knowledge-intensive activities that contribute to an accelerated pace of technical
and scientific advance, as well as rapid obsolescence” (Powell & Snellman 2004, p.199).
Global market competition has made policymakers aware that growth and prosperity is
made possible by acquiring the best and brightest talent there is. Human capital has become
the key economic resource, since business infrastructure and investment capital are
1 Intangibles – most commonly refer to legal intangibles (patents, copyrights, trademarks), but also to the brand perception, pool of talent company possesses, relations with customers and suppliers, organization processes.
2
accessible elsewhere, and knowledge and creativity are becoming the only competitive
advantages in the long run.
Development of the Internet and related technologies boosted demand for innovative
ideas, creative solutions, and distinctive products with exhilarating sensory attributes.
Information and Communication Technologies (hereafter, “ICT”) revolutionized methods of
knowledge sharing and the creation of new knowledge. Firstly, ICT provided an
infrastructure for knowledge-sharing networks among scholars, R&D2 departments and
practitioners, and secondly, ICT processes an immense amount of information organized in
data storage, which are capable of providing research and analysis (David & Foray 2003).
Sharing of knowledge that can be codified, recorded, or visually articulated turned the
Internet into a massive knowledge accumulating platform. However, innovation is still very
much a process determined by the personal interaction and physical proximity of the people
involved. Transfer of skills and creation of new knowledge depend on a cognition which
stretches beyond experiences that can be sent via a communication infrastructure. People
depend on personal contacts and physical proximity to other people to disseminate and
develop ideas (Polanyi 1966; Z. Acs & Varga 2004; Jensen et al. 2007). Some knowledge is
easier to codify and transfer, such as software code, or written narrative, while other learning
processes are virtually inseparable from physical interaction, such as learning how to paint,
play a violin, dance, or conduct a laboratory experiment. The diversity of knowledge, skills,
available materials, equipment, crafts and skills accumulated in one geographical location
determines the breadth and depth of potential for the creation of new knowledge.
2 R&D - Research and development
3
Historically, cities with varied and complementing industries founded on a
diversified knowledge base have been at the core of economic growth (Jacobs 1970). Places
that manage to attract human capital on a larger scale have always been rare. Glaeser &
Redlick (2008, p.18) argue that there is “an increasing tendency of high human capital
people to move to high human capital places”. Perception of the living environment impacts
on urban growth, argue Glaeser & Redlick (2008), establishing a 53% correlation between
the perceived happiness of people and population growth. In recent decades, a handful of
metropolitan areas have experienced growth in the knowledge and creative industries, while
many other cities have experienced depletion of their stock of human capital. In this way,
development of the knowledge and creative economy increases the gap between rich and
poor, not only on the global, but equally on the local level, and even between regions within
the same national state (Weiming 2000). The majority of the highly educated world
population, the majority of patents, and the majority of the most prominent scientists are
concentrated in several metropolitan regions (Florida 2005). The World Economic Forum
Report (2011) highlights the need for a modern economy for an educated workforce, stating
that highly educated workers originating from other countries make up 2% of the European
labor market, 4,5% of the workforce in the United States, 8% in Australia, and 10% in
Canada. The report states that companies and countries, as a part of their development
strategies, continually struggle to attract the best and the brightest innovative and creative
people, with countries like China and Brazil likely to face a long-term problem of labor
shortages, especially among highly educated professionals and entrepreneurs. The EU has
recognized the strategic importance of new knowledge for its sustainable growth, and
consequentially the budget for strengthening research and technological potential, in terms
4
of keeping domestic and attracting global scientific research personnel, amounts to 50
billion Euros for the period from 2007 to 20133.
Demand for relevant knowledge being high, workers in knowledge and creative
companies are in a position to demand a superior working environment, higher pay and
better career prospects. Companies working in knowledge and creative sectors cluster their
activities in a handful of urban regions (Porter 1998; Florida 2005), prime examples
nowadays being Oulu in Finland, Austin in Texas, or Silicon Valley in California. Creative
and buoyant urban environments boost the innovation and exchange of ideas, although not
all cities manage to enhance their innovative milieu and expand creative and knowledge
communities. Areas that attract human capital from around the world provide for the
creation of local learning networks. This ‘free’ talent, available in networks that extend
beyond the workplace, provides companies with a pool of knowledge necessary for their
innovative activities (Saxenian 1994).
Companies and countries are increasingly advertising the quality of the work and
living environment to lure top talent. Talented people are attracted to a work environment
open to varied approaches, collaboration, and the creation of innovative ideas and new
knowledge workers of non-conforming personal beliefs, original ideas and diverse lifestyles,
move to cities which are safe and welcoming to newcomers (Florida 2002). Creating an
entertainment component to city living has become a part of long term strategic planning
(Clark 2003b), but besides amenities, qualities of urban environment that relate to safety,
3 European Union, "EU 7th Framework Programme for Research" (PDF document), downloaded from the European Commission website, http://ec.europa.eu/research/fp7/pdf/fp7-inbrief_en.pdf , accessed April 24, 2011.
5
social security, public services, tolerance and openness seem to be very important to
globally mobile human capital. This brings issues of tolerance and openness to the fore of
research in economics.
Contrary to the findings of Florida (2002) that technology, talent and tolerance are
the key factors of human capital mobility, results of the ACRE research (Musterd et al.
2010) found that human capital in the EU is more likely to stay in the place of birth or study,
regardless of other factors, in what the authors of the ACRE study assign to the lower
general population mobility in Europe. As a part of the ACRE research, Dainov & Nachev
(2008) found that companies in Sofia, Bulgaria, are struggling to acquire and keep highly
qualified staff. Anecdotal evidence suggests that companies in cities in Bosnia and
Herzegovina are meeting similar obstacles. Towns and even larger cities in SEE4, are in
danger of losing their pool of talent which tends to migrate to more prosperous centers.
Evidence of shrinking village and small town populations, with simultaneous population
growth of bigger cities in SEE, show that human capital in the last 30 years moved from
provincial to capital cities and university centers, and further away to developed economies
in pursuit of opportunities in more affluent regions of the world (Katseli et al. 2006).
Statistical data for the period 2007 – 20105 shows that people in the Republic of Srpska, as a
part of Bosnia and Herzegovina, are migrating to larger cities and nearby towns, most
notably to Banja Luka and the smaller surrounding towns. According to the Global
Competitiveness Report (2010), based on the availability index of scientists and engineers,
Bosnia and Herzegovina, as a typical country in transition, is located in 115th place out of
4 SEE ‐ Southeast Europe 5 Republika Srpska Institute of Statistics. Demographic Statistics Statistical Bulletin 2010 No.14, p. 117-118. http://www.rzs.rs.ba/Publikacije/Demografija/Demografski_bilten_14.pdf. accessed September, 12th 2011.
6
139 countries covered by the report. It is also one of the highest-ranked countries by the
number of educated and talented people leaving the country. In the context of the Western
Balkan countries, limited data suggests that over one fifth of the tertiary educated population
from, for example, BiH, Croatia, and FYR Macedonia are immigrants in the OECD
countries only (R. Lucas & Martin 2010), and that still more highly educated people from
these countries have settled in the USA, Canada and Australasia.
The research gap
Available studies conducted in developed countries address issues of human capital
mobility in the context of the living and working environment, while countries in transition
are being poorly represented in the literature about the knowledge economy and human
capital mobility. We found that there is a gap in research in terms of how likely knowledge
and creative workers in transitional economies are to move away from their place of
residence or place of work, in relation to the societal and economic factors of their living
and working environment. Reviewed literature does not address differences between
knowledge and creative workers who are more or less likely to move away from their
current place of residence, or leave their place of work, in terms of their perception of the
working and living environment. Also, there is a gap in the literature covering countries in
transition, regarding the question of whether proximity to family and friends impacts on
knowledge and creative workers` decisions when choosing a place of residence, despite the
lower wages and poorer educational and career prospects in transitional economies. The
value of our research is in analyzing the relationship between human capital mobility and
the societal and economic factors of the living and working environment in Banja Luka.
7
Research focus
The focus of our research is the relationship between economic and societal factors
and human capital mobility in Banja Luka.
We test whether results from developed countries which show that knowledge and
creative workers have a preference for cities rich in amenities and leisure facilities, with an
abundance of work prospects, numerous opportunities for personal and professional
development, and a tolerant and safe working and living environment, are equally relevant
for countries in transition. To examine the findings of the ACRE research (Musterd et al.
2010) that knowledge and creative workers in the EU are more likely to stay in their place of
birth or study, we analyze how proximity to family and friends impacts on choice of
residence.
Overall Research Aim and Individual Research Objectives
Our overall research aim is to contribute to understanding the strategic impact of
factors within the work and living environment on growth of the knowledge and creative
economy in the context of human capital mobility in countries in transition.
In the course of addressing individual research objectives, we explore the strategic
relationship between human capital accumulation and the societal and economic factors of
the working and living environment, in terms of mobility of employees in the creative and
knowledge economy in countries in transition. Also, the research will contribute to
understanding how traditional social networks (proximity to family, friends, hometown,
place of study, etc.) impact on the decision of knowledge and creative workers in countries
in transition when choosing a place of residence. As an empirical framework we use
8
employees in the creative and knowledge economy in Banja Luka, Bosnia and Herzegovina,
as typical of a city in countries in transition, and in context of the region of Southeast
Europe.
The main research question is that of determining the impact of economic and
societal factors of the living and working environment in terms of choice of residence and
place of work of knowledge and creative workers in Banja Luka, as being a typical urban
centre in SEE.
The quantitative part of the study answers sub-questions:
1. What is the significance of traditional social networks in regard to proximity of family
and friends in the choice of residence?
2. What is the significance of city features on the likelihood of moving away from the city?
3. What is the importance of economic factors on the likelihood of moving away?
4. What is the significance of amount of wages on likelihood of changing the place of work?
5. What is the importance of employment factors on the likelihood of changing the place of
work?
6. What is the importance of employment factors on the likelihood of moving away from
the city?
Qualitative approach allows knowledge and creative entrepreneurs to articulate their
thoughts and ideas in their own terms about the following issues:
1. What is the importance of human capital for the competitiveness of companies in Banja
Luka?
2. What is the role of traditional social networks for business start-ups?
3. What is the significance of city features for the business?
9
Structure of the dissertation
The paper is structured as follows. After the introductory section, a comprehensive
review of the literature gives us insight into the development of theoretical and practical
understanding of the creative and knowledge economy, dissemination and generation of
knowledge, sources of innovation, human capital mobility, and factors that impact on the
mobility of knowledge and creative workers. Section three (Methodology) describes
methodology and the sample used for our research. Survey and interview results are
presented in Section four, followed by the discussion in Section five and conclusion in
Section six.
10
2. LITERATURE REVIEW
Theoretical context of our research is rather broad as a number of topics are
associated with the research problem, and these include: the knowledge economy, creative
industry, innovation and entrepreneurship, the business/living environment and human
capital mobility. The following discussion will focus on: knowledge dissemination,
generation of knowledge, sources of innovation, human capital mobility and factors that
impact on the mobility of knowledge and creative workers.
Debate about the knowledge and creative industries has intensified in the past two
decades (Hartley 2005; Marcus 2005; Musterd et al. 2010; UNCTAD & UNDP 2008;
Florida 2002). Knowledge and creative industries significantly contribute to economic
growth, generating value by applying new knowledge to products, services and
organizational processes. Profit comes from the innovation of an entrepreneur who produces
a commodity with lower costs than the competition, selling it for the prevailing market
price, and keeping the “Entrepreneur`s Profit” (Schumpeter 1939, p.103). Our ancestors,
advocates Jacobs (1970), grew their economies by improving work processes and adding
new types of work. They innovated and grew not so much by specializing, but by
diversifying. Jacobs (1970, p.49) concludes that “economies that do not add new kinds of
goods and services, but continue only to repeat old work, do not expand much nor do they,
by definition, develop”. Economies grow when people find ways to use natural, man-made,
and human resources more sparingly or in new ways, improving old, or creating new
products and services when they add new value to existing assets (Schumpeter 1939; Jacobs
1970; Florida 2002; Romer 2007).
11
With development of the knowledge and creative industries the economic paradigm
has shifted from tangible resources such as land, labor or capital to the intangibles. In this
context, Romer (1990) argues that population size is not the key prerequisite for economic
growth, since potential for new product development depends on knowledge and human
capital. Although coming into the fore of the research in economics only recently, the idea
that knowledge has a big impact on economic development is not new. Weber argued (2005,
p.xxxvii) that utilization of technical possibilities, funded on “natural sciences based on
mathematics and exact and rational experiment” had a strong influence on the development
of capitalism. Breaking apart from the neoclassical economic theory of diminishing returns,
in his study of data from 1909 to 1949, Solow (1957) found that 7/8 of the rise in
productivity is due to technological change, and only 1/8 of the growth was due to increased
capital per man hour. In this sense, neoclassical theory becomes a special case of
endogenous growth theory with the margin of innovation converging to zero (Aghion &
Howitt 2007). Building on the model of Solow, Lucas (1988) incorporated human capital,
identified as the production skill of a worker and its accumulation over time, marking human
capital as the main source of rising productivity, both of labor and physical capital.
Primarily, technological change comes as a method by which we manipulate raw materials,
becoming more sophisticated and getting more products from fewer resources (Romer
1990), meaning that “the old total or marginal cost curve is destroyed and a new one put in
its place each time there is an innovation” (Schumpeter 1939, p.85). Leaving behind old
ways of production depends on the rate of advancement of new, more resource-effective or
improved products and services. This process depends on the ability of people to
disseminate and create new knowledge.
12
2.1. The Knowledge and Creative industries
Our focus on industries based on knowledge and creativity is driven by the
assumption that new knowledge is the key factor of economic development. The
demarcation line between the creative and knowledge industries has not been clearly drawn,
although there are several classifications in circulation. Throsby (2001) pointed to
differences between cultural and utilitarian industries, stating that cultural industries involve
some aspects of creativity, convey certain messages or meaning, and imply some form of
patent or copyright protection. According to this view, classical arts, design, and
multimedia, in general, classify as cultural industries, while scientific research, although
being creative and having a potential of being a property, would generally belong to the
functional end, focusing on practicality “rather than at the communication of symbolic
meaning” (Throsby 2001, p.4). According to UNCTAD6 & UNDP7 report (2008, pp.11–16),
concept of creative industries is new, evolving and based on their dynamics, without a single
definition for the creative economy, and with no consensus about activities that summarize
the sector. According to the report, these industries “constitute a set of knowledge-based
activities”, using “creativity and intellectual capital as primary inputs”, not necessarily
limited to the arts but rich in creative content, being on the crossroads “among the artisan,
services and industrial sectors”. For Gottschalk (2004), knowledge workers are classified
according to the skills and type of work they perform: lawyers in a law firm, engineers in
engineering firm, medical doctors in a hospital, product developers in manufacturing
company, professors in a business school, and planning staff in a government agency.
6 United Nations Conference on Trade and Development 7 United Nations Development Programme
13
Researchers for the ACRE project (Musterd & Murie 2010f; Musterd et al. 2010) adopted a
sector approach, classifying arts, media, entertainment, advertising, architecture, art and
antiques, computer games, crafts, design, designer fashion, film and video, music,
performing arts, publishing, computer software, and TV and radio production into the
creative sector, while jobs “heavily reliant on professional knowledge”, such as legal,
accountancy, business management consultancy, advertising, and R&D professions are
classified into the sector of knowledge-intensive business services. According to Florida
(2002), creative class is a class of people who “share a common creative ethos that values
creativity and individuality, whether they are artists or engineers, musicians or computer
scientists, writers or entrepreneurs”. Glaeser (2004) argues that Florida`s creative class
classification is not distinctively different from that of the human capital (Becker 1962;
Mincer 1981; R. E. J. Lucas 1988; Romer 1990; Jones 2004; Benhabib & Spiegel 2005; R.
E. J. Lucas 2009). What both groups have in common is an advance rate in which they
accumulate and share new knowledge in their everyday contacts, they are “a class of
educated people, thousands, now many millions of people who spend entire careers
exchanging ideas, solving work related problems, generating new knowledge” (R. E. J.
Lucas 2009, p.1).
We agree that a region’s creative and knowledge occupations cannot be “read off its
industrial structure” (Barbour & Markusen 2007, p.4). For our research we adopted a view
that creative industries, as an agglomeration of a very large number of complementing
professions, cover jobs such as: marketing and PR, advertising, architecture, trade with
media/publishing/web portals, video, film, photography, music production, and radio, while
14
knowledge-based occupations are: legal and financial intermediaries and consulting
services, science, R&D, engineering, university faculties, and so on.
Human capital, innovation and knowledge
Present research on human capital and economic growth is closely associated with a
number of topics, including the generation of new knowledge, creativity and innovation.
Lucas (1988) defines human capital as a general skill level, while Mincer (1981) recognizes
human capital as capacities gained through education, training and experience. Human
capital does not only represent available knowledge embodied in people, or shared between
them, but also includes creation of new, economically relevant knowledge (Mincer 1981).
"Doing things differently in the realm of economic life” is considered by Schumpeter (1939,
p.80) to be an innovation. Creating something new, whether in a physical form or in a form
of mental imagery, is regarded by Vygotsky (2004) to be an act of creativity or imagination,
intrinsic to all human beings as their ability to process past knowledge and recombine it into
innovations. New knowledge is created at the boundaries of the old (Gottschalk 2004).
Innovation is built up on works of innovator`s predecessors, because “creation is a historical,
cumulative process where every succeeding manifestation was determined by the preceding
one.” (Vygotsky 2004, p.30). Innovation creates new value, regardless of whether it creates
new products, new markets or organizational structures (Schumpeter 1939). Creativity is a
process that precedes and fertilizes innovation. Economically relevant knowledge is
idiosyncratic to innovative people, as their ability to recombine existing resources creating
new products or services. Knowledge is not a duplicate of reality, according to Piaget (1971,
pp.9–16), it is a system of transformational structures which processes experience, giving it
15
a more or less adequate set of “possible isomorphic models among which experience can
enable us to choose”.
Development of creative insight is determined by the process of social filtering
between individual's conscious knowledge, and subconscious processes that are responsible
for recombination of accumulated knowledge and different ideas (Csikszentmihalyi &
Sawyer 1995). In the context of a workplace environment, Amabile (1998) argues that
creativity of an individual depends on three components: expertise (knowledge), creative-
thinking skills, and motivation. Diversity of knowledge boosts up creativity, even when its
domains are not closely related, such as science vs. art, or finance vs. literature. Rich and
varied experiences add to a more potent imagination of an individual (Vygotsky 2004;
Simonton 1999). Creativity takes on different forms; it is “associated with a mind that
exhibits a variety of interests and knowledge” (Simonton 1999, p.207). Different forms of
creativity are interconnected, “not only do they share a common thought processes; they
reinforce each other through cross-fertilization and mutual stimulation” (Florida 2002, p.33).
Presence of creative stimulus is the key not only for development of great works of art and
scientific breakthroughs, but also for everyday incremental innovations which are crucial for
the rise in productivity of both human and physical capital. Novelty ideas could come from
convergence of random and varied stimuli, sometimes through collaboration of people from
exceptionally different domains (Csikszentmihalyi & Sawyer 1995; Nooteboom 2000).
New knowledge is created through interactions with others. Transfer of knowledge
between people is made possible if divergence of their cognitive processes, labeled cognitive
distance by Nooteboom (2000), is not too extreme. This means that it would probably take
longer for a Spanish painter and a Chinese nuclear physicist to create something together
16
than for an Aboriginal didgeridoo player and Norwegian opera singer. If knowledge is only
varied, but lacks common attributes, internal communication in the group could be
damaged; otherwise, diversity of knowledge supports innovative processes and the ability of
an organization to absorb new knowledge to its absorptive capacity (Cohen & Levinthal
1990). Therefore, the amount of information that circulates around doesn`t predict the
ability of an enterprise to innovate. Transfer of knowledge depends on the quality of human
capital and a shared learning network (Fagerberg et al. 2010). It also depends on the quality
of knowledge that is being transferred. Knowledge that is easier to articulate and record in
the form of a script, audio or video recording is easier to transfer through space and time,
while knowledge that requires personal contact to be transferred is more difficult to share or
copy. Polanyi argued that “we can know more than we can tell”, meaning that “tacit thought
forms an indispensable part of all knowledge” (Polanyi 1966, p.20). Tacit knowledge could
be a mental process by which we recombine something we already know, such as
organizational, communicational or learning skills, or it could represent a skill that can only
be learned by practice; for example, how to operate a crane, draw a picture or provide a
medical diagnosis using a stethoscope. Also, knowledge that maintains functionality of
social networks is mainly tacit knowledge, such as “skilful human behavior (quarreling,
flirting, telling stories...) that may lose their social and economic functionality were they
transformed into codes” (J. Johnson & L. Lundvall 2001, p.7). Tacit and codified knowledge
are complementary and mutually dependent (Gottschalk 2004). Dissemination of codified
knowledge depends on acquired tacit knowledge, which exists in a form of practical
knowledge or knowledge that is still not completely developed (Z. Acs & Varga 2004;
Jensen et al. 2007).
17
Besides being tacit or codified, some knowledge is inherently idiosyncratic,
determined by individual experience, specific skills, insights and access to information, so a
rich pool of existing knowledge does not automatically increase levels of economically
relevant knowledge (Z. J. Acs et al. 2003; Z. J. Acs et al. 2005). Knowledge of particular
entrepreneurial opportunities is available only to those who acquire it through specific
individual circumstances, related to their work and living arrangements (Z. J. Acs et al.
2003). Human capital is person-specific and represents a rival, excludable economic good
(Romer 1990; Jones 2004). Individual knowledge and skills cannot be duplicated, while
innovation can be replicated with or without added costs.
2.2. Environmental factors of human capital accumulation
Contemporary research on economic development underlines the importance of
human capital for growth in the knowledge and creative industries. The following chapter
will focus on factors of a working and living environment that most significantly impact on
human capital mobility.
Creative and knowledge workers: artists, scientists, writers, designers, architects, and
others who became successful by utilizing their creativity and knowledge, bring prosperity
to places where they work and live. Entrepreneurs depend on close friends (strong ties) and
casual acquaintances (weak ties) to acquire information, capital and knowledge; although an
impact of friendship and family ties on local entrepreneurial potential has not been
thoroughly researched (Greve & Salaff 2003). In this respect, social networks work as the
entrepreneurs` distribution, knowledge and support networks. Innovative communities
18
provide people with a trial and error testing ground, so they can find the best way to exploit
an invention or choose a more efficient technological combination (Schumpeter 2003).
Entrepreneurs are often educated above average, and a higher concentration of
university graduates may lead to higher number of enterprises (Glaeser et al. 2009).
Agglomerating to certain places, knowledge and creative workers not only increase their
productivity by reducing transport costs and being closer to natural resources and clients, but
also boost access to the ideas of their peers (Glaeser 2007). People introduce information,
personal contacts, specific experiences and personal insights from the outside world into
their work teams (Nooteboom 2000). Industries based on innovations utilize these
knowledge networks which spread outside the boundaries of the workplace (David B
Audretsch 1998; David B. Audretsch & Maryann P. Feldman 2004).
Places with an abundance of business, educational, cultural and self-actualizing
prospects are more likely to attract creative and knowledge workers than places where those
opportunities are scarce. Available research recognizes that knowledge and creative
industries agglomerate in a handful of cities, while other regions are experiencing depletion
of human capital (Florida 2005). However, Glaeser and Redlick (2008) argue that in
declining areas, with a net outbound human capital migration, people are probably more
likely to return to schooling in order to raise their chances to migrate, adding in that way to
the accumulation of human capital in the area. Authors also found that declining areas might
not experience decline in social capital, keeping networks between family and friends
strong.
19
Work environment
Literature on human resources management and psychology of motivation is broad
and varied, and within the scope of this work, in this chapter we focus on a segment of
human capital mobility in regard to the quality of a workplace.
The quality of work environment is the key factor in attracting younger creative
workers, who are more likely to move to companies which offer flexibility, job security,
decent pay, reasonable working hours, talented work colleagues and a dynamic work
community (Florida 2002). Vibrant places provide the setting for spontaneous interaction
between people and the development of creative communities, which become conduits for
new knowledge and innovative ideas. Environment is a catalyst for innovative processes, a
source of knowledge, enthusiasm and creative inspiration (Porter 1990). Quality of the
workplace environment determines the creative potential of knowledge and creative workers
and determines their ability to innovate (Amabile 1998; Amabile, Conti, Coon, Lazenby &
Herron 1996a). Social setting impacts on the creation and accumulation of knowledge,
creative-thinking skills and motivation. Challenge, organizational encouragement, work
group supports and supervisory encouragement may work favorably towards creativity and
innovation within an organization, while strategic misconceptions could discourage people
to be creative at work (Amabile, Conti, Coon, Lazenby & Herron 1996a). Regarding the
workplace environment and motivation, De Long and Fahey (2000) argue that there are four
ways in which organizational culture determines how knowledge is created, shared, and
used: culture shapes assumptions about which knowledge is important, culture embodies all
the unspoken norms or rules about how knowledge is to be distributed between the
20
organization and the individuals in it, culture creates the context of social interaction, and
culture shapes ways in which new knowledge is created and adopted. Mutual trust and
support, a diverse and a rich knowledge base, and tolerance towards new approaches foster
innovation and creativity of work teams. Nahapiet et al. (2005) argue that the collective
pursuit to excellence, rather than self-interest would mean larger innovative capacity of the
organization, higher knowledge share and individual satisfaction with the group. Otherwise,
competition at all costs, and focus on short-term rewards could be damaging for group
creativity.
Knowledge and skill equipped people are aware that they are competing on the global
market, and that they have to excel professionally, constantly updating their knowledge and
creative skills in order to keep jobs and maintain their standard of living. Florida (2002)
found that nine out of ten factors that make workplaces attractive are intrinsic: challenge and
responsibility of the work, flexibility of job and work environment, job security and work
environment without high levels of chaos, appropriate base pay and benefits, chances for
professional development, recognition among peers from the field, stimulating work
environment, exciting work substance, supporting and nourishing organizational culture, and
location and community. Knowledge and creative workers react to pay incentives in
choosing a place of work, but it seems other factors, such as access to new ideas and
knowledge, stimulating work culture and inspiring environment could play an important role
in human capital mobility. Clusters of the knowledge and creative industries enable local
talent to overcome “the inward focus, inertia, inflexibility... increase information flow, the
likelihood of new approaches, and new entry from spin-offs, downstream, upstream, and
related industries” (Porter 1990, p.151). Concentration of knowledge and creative workers, a
21
supporting workplace environment and attractive job opportunities are magnet for human
capital.
Living environment
Literature concerning the relationship between the quality of the living environment
and economic development has grown in scope recently. In this chapter we focus on the
segment dealing with factors of urban living in the context of human capital mobility.
Initial human capital is a strong indicator of the future city growth (Glaeser & Saiz
2003; Glaeser 2007). Cities with diverse work and lifestyle opportunities have been the
environment for the development of creative networks. Richness and diversity of social
networks and vicinity of people support knowledge spillovers, argue Audretsch and
Feldman (2004), since intensive social networking lowers marginal costs for transfer of tacit
knowledge. Cities with an abundance of business, educational, cultural and self-actualizing
prospects are more likely to attract creative and knowledge workers than places where those
opportunities are scarce. Adequate macroeconomic, political and legal frameworks
constitute a necessary, but not entire condition for successful exploitation of local firms’
structures and advantages of entrepreneurial micro-environment (Porter 2000). A successful
city is a nucleus of an atom (R. E. J. Lucas 1988) that attracts increasing labor inflows.
Throughout history, cities played a developmental role as regional craft, finance and
knowledge centers. Success of empires has always been closely linked to the rise of their
most important urban centers, argues Jacobs (1993), while their decline is followed by
economic and social decay. Mass-manufacturing centers of the developed world, such as
Detroit, Pittsburg, Manchester, and Liverpool experienced loss of human capital and the
22
deterioration of their economies. Likewise, it happened in mass-production regions of
countries in transition. On the other hand, cities that survived the decline of mass-production
did not have highly specialized manufacturing, but varied and complementing industries
founded on the diversified knowledge base (Jacobs 1970; M. P Feldman & D. B Audretsch
1999).
For a better chance of success, knowledge entrepreneurs prefer to settle in
entrepreneurial areas with higher levels of skills and affordable basic services (Glaeser et al.
2010). Creative and knowledge workers seek places with positive energy, artistic vibe and
hordes of like-minded people to mingle with. Glaeser et al. (2010) found a strong correlation
between the amenity index and level of employment in metropolitan areas, arguing that high
amenity places attract human capital with college degrees; therefore, industries that employ
them are also clustering in those cities. Also, people are willing to pay a higher price for
living closer to the city center (Glaeser 2007), because city centers are usually those places
where people roam around, stop and talk with strangers, introduce each other to new
acquaintances, and exchange new ideas in passing. This experience in communication,
gained in leisurely, unpretentious conversations help knowledge and creative workers to
share and generate new knowledge, and test their theories or viewpoints. Cities rich in
amenities offer a social context for initial contact and friendship in a variety of situations; in
art, sport, music events and venues, in clubs, art classes, lectures, bars, street performances,
opera houses, libraries or galleries. Florida argues that the creative class is drawn to places
with a flavor of strong local culture:
23
“The culture is “street-level” because it tends to cluster along certain streets lined with a multitude of small venues. These may include coffee shops, restaurants and bars, some of which offer performance or exhibits along with the food and drink; art galleries; bookstores and other stores; small to mid-size theaters for film or live performance or both; and various hybrid spaces–like a bookstore/tearoom/little theater or gallery/studio/live music space – often in storefronts or old buildings converted from other purposes. The scene may spill out onto the sidewalks, with dining tables, musicians, vendors, panhandlers, performers and plenty of passersby at all hours of the day and night ... It is not just one scene but many: a music scene, an art scene, a film scene, outdoor recreation scene, nightlife scene, and so on – all reinforcing one another.” (Florida 2002, p.183)
It is easier for people to approach other people in crowded streets, than in cities
where amenities are few and far between, or in neighborhoods poisoned with crime and
mistrust. Jacobs (1993, p.47) argued that “sight of people attracts still other people”, making
areas more attractive and safe. An urban planner William Whyte (2001), researching
circulation of people in downtown New York, was amazed to find that people follow certain
patterns of gathering in more crowded places, not avoiding, but looking for crowds, busy
streets and eventful plazas. Clark (2003b) considers some places to be cooler than other, in
relation to how young and mobile people perceive the quality and range of its amenities. The
level of coolness is determined by the number and importance of local entrepreneurs,
inventors, scientists, artists, musicians, sportsmen/women, and also on the aesthetics of the
built environment, sport and cultural events, festivals, etc. Glaeser et al (2004) argue that
there are four key city amenities: the range of available goods and services, aesthetic
features of the city, quality and range of public services, and the quality and speed of
transport and availability of jobs. Authors found that the number of local restaurants, live
performance theaters, attractive city dwellers, city architecture, superior schools, low crime
24
levels, good local weather, well-organized transport connections, and availability of jobs are
local factors that impact on future city growth.
High amenity places propel entrepreneurship and predict growth in cities (Glaeser et
al. 2004). However, amenities that serve the local community and facilitate knowledge
spillovers shouldn`t be confused with tourist amenities, although they often coincide. Funky,
but pricey, tourist attractions and urban renewal projects often cause a rise in housing costs
and price out key city staff such as teachers, nurses or police officers, as has been happening
in London, UK, since the nineteen eighties. On the city level, Florida (2005) noticed that
rising inequality, higher costs of housing, and social stratification posed a great threat to
future economic growth, preventing human capital with lower incomes to realize fully their
creative potential, focusing instead on mere survival. Higher fixed costs are also
discouraging entrepreneurship in metropolitan areas (Glaeser et al. 2010). If expenses are
too big, people are more likely to trade off their present chic and funky city lifestyle for less
glamorous places where it is easier to afford a decent standard of living with lower fixed
costs. City as an entertainment machine (Clark 2003b; Clark et al. 2003), and creative city
(Florida 2002) is a place of prosperous knowledge and creative economy and/or a place with
rising costs of living, struggling entrepreneurs and declining human capital. Glaeser (2003)
proposes that cities could lure human capital by providing good basic services, amenities
and high-quality public schools, ensuring in that way sustainable growth, because high skill
cities are more likely to succeed in reinventing themselves and overcoming economic crises.
Research undertaken in the EU found that there is no single city characteristic that is
important to creative-knowledge workers (Musterd & Murie 2010f; Musterd et al. 2010).
Policy makers, researchers and city planners must adopt a multi-factor approach, looking
25
into the history of a place, quality and diversity of social and business networks, transport
and communication infrastructure and quality and cost of housing. According to Musterd &
Murie (2010d) there are soft and hard conditions that determine how city dwellers grade
their city environment. Soft conditions (Musterd & Murie 2010d, p.25) include “urban
‘amenities’, such as the quality of life, urban atmospheres, housing market situations, levels
of tolerance, openness and the diversity of the population”, while hard conditions relate to
factors that are traditionally regarded as “playing the major role in explaining the
development of firms in urban regions: availability of capital and of labor with adequate
skills, proper institutional context, tax regimes, up-to-date infrastructure and accessibility”
(Musterd & Murie 2010a, p.7).
Contrary to the description by Musterd and Murie, we consider proximity of family
and friends, and other soft factors that support social networks, as societal factors. Our
economic factors are related to local hard factors which depend on the financial and political
decisions of the state and local authorities.
Proximity to friends or family most often determines where European creative-
knowledge workers settle or move to (Musterd & Murie 2010f) , what differs from Florida`s
(2002) findings, which argue that tolerance, openness and diversity are key factors in
choosing a place of residence for the creative and knowledge workers. This discrepancy
between Europe and USA could appear to be due to higher human capital mobility in the
USA, where knowledge and creative workers are less reliant on friendship and family
networks and more on easier integration into local community and professional and business
networks. This makes issues of tolerance, openness and diversity the key factors in attracting
and keeping entrepreneurial human capital (Florida 2002). Furthermore, the existence of
26
national boundaries, differences in citizenship rights and responsibilities, stronger
interventionist traditions and the welfare state are also likely to affect European human
capital mobility (Musterd & Murie 2010e, p.238).
Overall, it is apparent that human capital in developed countries is attracted to cities
with a superior quality of amenities, with diverse and rich social networks and a higher
number of new business ventures. It seems that pre-existing social networks are more
important in the EU than in the USA.
2.3. South East Europe
In this chapter we review available literature on human capital conditions and the
development of the knowledge and creative industries in SEE.
Countries in the SEE and CEE8 regions went through a long period of a socialist
planned economy, followed by a period of transition to the market economy. The Czech
Republic, Slovenia and Poland went through the transitional period more successfully, while
others, such as Romania, Bulgaria and most of the ex-SFRY9 republics are struggling to
consolidate their economies. The SEE countries have higher unemployment rates than the
EU average, ranging from more than 10% in Croatia to nearly 40% in Macedonia.
Unemployment rates in the SEE countries are particularly high for young people, with 60%
in FYR Macedonia and Bosnia and Herzegovina and 50% in Serbia (R. Lucas & Martin
8 CEE ‐ Central and Eastern Europe – countries of the former communist block 9 SFRY – The Socialist Federal Republic of Yugoslavia
27
2010). In relation to their GDP - per capita (purchasing power parity), CEFTA10 countries
are still far behind the EU countries, apart from Croatia, which is the closest to the EU
average of USD32.400, with GDP - per capita of USD 17.700.
Development of knowledge and creative sectors in the CEE countries has been
limited in scope and depth. More potential for development has been in the software
industry, owing to lower barriers to entry, the available human capital base and easier
knowledge transfer due to higher proportions of codified knowledge (Radošević 2006).
Radošević et al. (2008) found that barriers to growth that software - producing entrepreneurs
experience in Central and Eastern Europe are primarily related to a limited domestic market
(78%), lack of public support (75%) and high costs of labor (71%). These authors interpret
high costs of labor as poor access to skills and knowledge. The research established that the
main sources of knowledge for entrepreneurs are in-house knowledge, customers and
suppliers, followed by fairs, exhibitions, patents, journals, and research organizations. The
Internet was mentioned by 85% of entrepreneurs as an additional source of knowledge, and
knowledge of domestic markets and networks are their biggest competitive advantages
(Radošević 2006). Also, links with foreign partners are considered more important than
links with local partners, while poor marketing, lack of programmers and designers, and
limited expertise in specific areas are seen as the biggest obstacles.
Knowledge-based entrepreneurs in the CEE countries are highly educated: 31% have
a BA or the equivalent, 44% a master’s degree and 19% a PhD, with only 4% of the CEO's
completing only secondary education (Radošević et al. 2008). Local entrepreneurs own 80%
10 CEFTA (Central European Free Trade Agreement) is agreement between non-EU countries in Central and The South East Europe. Member states are: Albania, Bosnia and Herzegovina, Croatia, Kosovo, FYR Macedonia, Montenegro, and Serbia. CEFTA countries have a combined population of 28 million people.
28
of software companies in the CEE region, with a share of foreign ownership ranging from
15% in the Czech Republic to 28% in Bulgaria, while no foreign ownership is recorded in
this sector in Serbia (Radošević 2006). Growth in the number of employees in the CEE
sector for the 1999 - 2003 period increased by 37% in Bulgaria to more than 200% in the
case of Romania and 11% in Czech Republic (Radošević 2006). How ICT entrepreneurs in
the CEE region perceive their workplace appears to be very important, since the sector
recorded high mobility of employees, with a particularly high turnover in Romania (69%
leaving and 101% joining other firms), somewhat lower in Serbia, and the lowest in
Slovenia (11% leaving and 33% joining other firms).
Creative industries in SEE are mainly concentrated in the countries` capitals, with
high labor intensity and job insecurity for creative workers (Primorac 2006). Working
conditions are varied and it is much harder for creative than knowledge enterprises and
workers to maintain a sustainable level of paid work and annual income. Creative workers
are more likely to do project or contract work, with long working hours and unreliable
income. It is questionable whether “the freedom, self-actualization and self-governance”
related to the creative lifestyle could outmatch the negative factors of these jobs (Musterd &
Murie 2010c, p.342).
With insufficient funding from public institutions and lack of interest from private
companies, traditional arts and crafts are being constantly underfunded, while more
commercial creative sectors, especially design, architecture, pop music and the film industry
are often sponsored by privately owned companies with little or no concern for the greater
artistic or conceptual value. Fragmented markets, different languages and remaining
29
political tensions are obstacles for larger market penetration, diminishing returns on
investments, and with that, chances of survival for new creative business ventures.
Human capital in South East Europe
Literature on human capital mobility in SEE is rare and limited in breadth and depth
of research. The following discussion will focus on human capital mobility in terms of the
socio economic factors of the living and working environment in the region.
The SEE countries are facing high emigration rates to developed countries, especially
to the EU. Horvat (2004) argues that social as well as political factors play an important role
in outbound migration from the SEE countries. Since WWII, people from the countryside
and provincial towns have migrated to larger cities and metropolitan areas in their home
countries. Migration processes in Bosnia and Herzegovina, Croatia and Serbia, from the
periphery to urban centers and abroad, were exacerbated during the breakup of the former
Yugoslavia and by the 1991-1999 civil wars. Larger cities in SEE, the university towns,
regional urban centers and capitals have attracted younger and educated workers from the
region. There has also been strong trend of migration abroad. Anecdotal evidence suggests
that high numbers of people with tertiary education want to leave their home countries. The
situation is especially alarming in Albania where half the lecturers and researches from
universities left the country during the last twenty years (Horvat 2004; R. Lucas & Martin
2010). In regard to mobility of human capital, high unemployment rates could further propel
outbound migration to more developed EU metropolitan areas as soon as administrative
barriers are lifted. Currently there are still many obstacles to migration from SEE to other
parts of Europe/EU. Some of them are acknowledged by the Commission of the European
30
Communities (2007), mainly relating to legal and administrative obstacles, availability and
costs of housing, employment of spouses and partners, portability of pensions, linguistic
barriers, and issues on the acceptance of qualifications.
In Bosnia and Herzegovina, research confirmed that around 70% of young people
want to leave the country, mostly for economic or political reasons (United Nations WPAY
– Youth UNIT 2005). In the age of the Internet and globalization, knowledgeable and
skilled people are more likely to search for professional opportunities outside locally
available employment opportunities and often nepotistic state structures. Transparency
International (2010) reports much higher levels of corruption in SEE than in developed
countries, while sociological research emphasizes weaknesses of local governance:
“In order to sharpen the debate, it could be said that most talent leaves a country because they belong to a parallel, invisible and unwanted intellectual elite whose perception of governance is based on meritocracy. On the other hand, the present social elite in their domicile countries have emerged from the turbulence of transition often tainted with corruption and a wild, non-ethical capitalism which created an ‘oligarchic’ concept of state management that cannot be attractive. Under such circumstances, the reasons for emigration are primarily ethical. In this context, the brain drain phenomenon could be interpreted as avoidance of direct social conflict and some kind of silent revolution by those who want to be valued according to their merits and not ‘managerial’ capabilities that can be perceived as the base for implementing false-transition.” (Bozoki 2002, p.14)
High unemployment rates, bureaucratic obstacles, non-functioning legal systems, and
political instability disrupt accumulation of human capital and strategic development of the
knowledge and creative economy in the SEE countries. Knowledge and creative workers
from SEE are emigrating in pursuit of a better working and living environment. Over one
fifth of the tertiary educated population from Bosnia and Herzegovina, Croatia, and FYR
Macedonia are immigrants in the OECD countries (R. Lucas & Martin 2010, p.66), and still
31
more highly educated people from these countries have settled in the USA, Canada and
Australasia.
The ACRE research segment from Sofia, Bulgaria, reveals that policy makers are still
ignorant of soft environmental factors, since they are finding it impossible to tackle even
traditional, hard factors of urban development (Dainov 2008). Sofia, as the only
metropolitan area in the country, attracts creative knowledge workers regardless of their
satisfaction with the city because it is the only place in the country where they can find the
employment they want, argues Dainov (2008). Contrary to cities from more developed
countries of the EU, Dainov (2008) found that human capital in Sofia is more content with
soft factors, improvements based on efforts of individuals, while hard factors, such as
infrastructure, transportation, access to social and educational centers, security, events and
happenings which depend on the city authorities, are not satisfying. For entrepreneurs in the
ICT sector, the most important factor is that Sofia is the capital city, and as such it became
an agglomeration for skills, administrative authorities, ministries and agencies, and the
center of the regional market (Dainov & Nachev 2008). For the ICT sector in Sofia, hard
location factors (ease of access, levels of rent, parking facilities, access to major
thoroughfares) are most important “virtually to the exclusion of all other considerations”
(Dainov & Nachev 2008, p.50). Interviewed managers reported that quality of life could be
of great importance sometimes, because it “influences their personnel and the quality of
their performance and keeps them from being head-hunted and moving to another company
or city“ (Dainov & Nachev 2008, p.31).
32
The estimated unemployment rate was 43.1% in 201011, for the total working
population of Bosnia and Herzegovina, and the average net salary in the Republic of Srpska
in July 201112 was 811KM (EUR415). Migration data for the period 2007 – 201013 show
that people are migrating to larger cities and nearby towns within the Republic of Srpska, as
a part of Bosnia and Herzegovina, and most notably to Banja Luka and surrounding smaller
towns. We assume that migrations from the Republic of Srpska to the Federation of Bosnia
and Herzegovina, and vice versa, are still minor occurrences, due to the recent ethnic
conflict and post-war tensions. Research commissioned by the Ministry of Internal Affairs
of the Republic of Srpska14, on a sample of 1.296 primary school and 670 high school
students, found out that nearly 76% of primary and 87% of high school students have a
Facebook profile. According to the GfK survey, conducted in BiH in August 200915,
university students are the group that most of all (at least occasionally) use the Internet
(84%), followed by full-time employees, with about half of them using the service, while
about 60% of category managers, entrepreneurs, professionals, high school pupils and
students use the Internet on a daily basis.
11 CIA - The World Factbook, 2010, https://www.cia.gov/library/publications/the-world-factbook/geos/bk.html. Accessed: September 2011 12 Republika Srpska Institute of Statistics. July 2011 Monthly Report, http://www.rzs.rs.ba/Saopstenja/Rad/2011/Rad_Jul_2011.pdf . Accessed: September, 12th 2011. 13 Republika Srpska Institute of Statistics. Demographic Statistics Statistical Bulletin 2010 No.14, p. 117-118. http://www.rzs.rs.ba/Publikacije/Demografija/Demografski_bilten_14.pdf. Accessed: September, 12th 2011. 14 Source: “Nezavisne” newspapers, BiH, http://www.nezavisne.com/novosti/bih/Djecu-vreba-opasnost-s-Interneta-68409.html. Accessed: 17.09.2010. 15 „The GfK Group“ BiH: „A growing number of Internet users in BiH“: http://www.gfk.ba/public_relations/press/press/004443/index.ba.html. Accessed: 02.01.2011.
33
2.4. Conclusion
Literature on human capital mobility has not adequately addressed migration patterns
in SEE. Overall, available studies address issues of human capital mobility in developed
countries in context of the living and working environment, while countries in transition are
poorly represented in the literature on knowledge economy and human capital mobility. We
found that there is a gap in research in terms of how likely knowledge and creative workers
in transitional economies are to move away from their place of residence or place of work in
relation to societal and economic factors of their living and working environment. The
existing research does not address differences between knowledge and creative workers who
are more likely, or less likely, to move away from their present place of residence and work
in terms of their perception of the environment. Also, there is a gap in the literature covering
countries in transition, regarding the question of whether proximity to family and friends
influence knowledge and creative workers` decisions when choosing a place of residence,
despite lower wages and the poorer educational and career prospects of transitional
economies. In the context of the Western Balkan countries, limited data suggests that over
one fifth of the tertiary educated population are immigrants in the OECD countries only, and
still more highly educated people from these countries have settled in the USA, Canada and
Australasia.
34
3. METHODOLOGY
Research methodology is a complete set of research techniques and practices; it
“involves the systematic procedures by which the researcher starts from the initial
identification of the problem to its final conclusions” (Singh 2006, p.79). “Research
methodology is a way to systematically solve the research problem” (Kothari 2004, p.8).
In our methodology, systematically means that we employ quantitative and
qualitative methods, one step at a time, to improve validity and reliability of our research
data. Quantitative methods were used to test hypotheses derived from the literature, with a
number of possible predetermined answers (Patton 2001). The resulting data was processed
by statistical software SPSS v.17 and SPSS v.19. In-depth interviews are used for the
analysis of the importance of environmental factors for creative and knowledge SMEs in
Banja Luka. Qualitative methods provide us with a view from the inside out (Flick et al.
2004). We use NVivo v.9 for interview data analysis and interpretation.
Researchers could pose three types of intellectual puzzles: developmental puzzle
(how and why did x or y develop?), mechanical puzzle (how does x or y work?), or causal
puzzle (what influence does x have on y, or what causes x or y) (Mason 1996). Due to lack
of relevant quantitative and qualitative research data for countries in transition, we use the
literature to address the developmental puzzle: how knowledge impacts growth, and why
environmental factors play a crucial role in human capital mobility. We do not have an
ambition to capture objective reality (Denzin & Lincoln 2005) of human capital mobility in
transition countries, nor to provide definite answers on how to strategically manage human
capital in countries in transition. However, the qualitative results we obtain are “inductive,
35
emerging, and shaped by the researcher's experience” (Creswell 2006, p.19). Despite a small
interview sample of entrepreneurs in knowledge and creative sectors, we believe that the
qualitative phase of the research has a capacity to describe an “essence of shared
experiences” (Patton 2001, p.106), giving us in-depth analysis of the processes that are
unfolding in the strategic management level.
Researchers have worked for several companies in marketing and finance sectors in
Banja Luka. Since researchers have “strong personal experience and intense interest” in the
phenomenon under study, the research process itself has strong elements of heuristics, as a
form of phenomenological inquiry, “that bring to the fore the personal experience and
insights of the researcher” (Patton 2001, p.107). Reflexivity of our perspective may shape
the research process (Creswell & D. L. Miller 2000; Patton 2001), and form methodological
bias if not addressed through reflexive inquiry and cross-checking of research findings.
To avoid serious discrepancies between our results and objective reality we use
quantitative analysis as a basis for the research, and qualitative research as a counter-balance
to address rigidity and limitations of the quantitative method. Triangulation is used to cross-
check results, since “surveys became more meaningful when interpreted in light of critical
qualitative information” (Jick 1979, p.608).
3.1. Hypotheses
Hypothesis is a research prediction of the relationship between variables, which is
tested through statistical analysis. (Creswell 2002, p.109). It is the “re-formalization of a
36
research question (grounded in theory and/or literature) to form a precise declarative
statement including a prediction of the outcome” (Somekh & Lewin 2004, p.223).
We use hypotheses testing to determine whether arguments from reviewed literature
hold true for knowledge and creative workers in economies in transition. Data collection
procedures and the sample distribution determine which statistical tools are used to test
relationships between variables.
Main hypothesis
The main hypothesis is that economic factors are more important than societal in
terms of choice of residence and work, and mobility of knowledge and creative workers in
countries in transition.
The main hypothesis is developed and tested through additional hypotheses.
Additional hypotheses
H1: Proximity to family and friends significantly impacts the choice of place of residence,
H2: City features do not significantly impact human capital mobility,
H3: Cost of living significantly influences the decision to change residence,
H4: Salary significantly affects the expectation for leaving the place of work,
H5: The employment satisfaction factors significantly affect the decision of moving away
from the city,
H6: The employment satisfaction factors significantly influence the decision to change the
place of work.
37
3.2. Variables
In order to address differences between knowledge and creative workers who are
more and less likely to move away from their present place of residence or place of work, in
respect of their perception of the working and living environment, we have two dependent
variables. The first one determines how likely respondents are to move away from Banja
Luka in the next 3 years, and the second relates to how long respondents plan to stay in the
current company/organization.
Respondents were answering the following questions:
How likely are you to move away from Banja Luka in the next 3 years? (Possible
answers: almost certainly, very likely, somewhat likely, not very likely, not likely
at all), and
How long do you plan to stay in current company/organization? (Possible
answers: less than 1 year, between 1 and 3 years, more than 3 but less than 5
years, between 5 and 10 years, more than 10 years, I do not know).
Independent variables for the quantitative part of the research are divided into four
groups:
1. Reasons for living in Banja Luka
2. Economic and societal factors of the living environment
3. Work related factors
4. Demographics – background data.
38
Reasons for living in Banja Luka
The first group of variables is dealing with the length of time respondents live in
Banja Luka, the structure of the household, and reasons why respondents live in Banja Luka.
Respondents answered the following questions:
How long have you lived in Banja Luka?
Have you moved to Banja Luka and where have you lived before moving to your
current address?
Rank the four most important reasons why you are currently living in Banja Luka.
Which categories best describe the household where you currently live?
In addition to the ACRE questionnaire, we added a living with parents category to
our survey, and this proved to be appropriate.
Economic and societal factors of the living environment
This section of the questionnaire deals with the respondents’ living environment.
Variables relate to the respondents` leisure and social activities, satisfaction with amenities
and services provided in the city, and cost of living in Banja Luka.
Respondents answered the following questions:
How often do you practice the following activities (leisure and social activities)?
What is the most relevant to you and your household (partner or you finding a job
in the city)?
How satisfied are you with the following leisure amenities that are offered in
Banja Luka?
39
How satisfied are you with the following public services and facilities in Banja
Luka?
How would you rate the following environmental aspects of Banja Luka?
How much are you concerned about the following aspects of life in Banja Luka?
Cost of living in Banja Luka?
How long on average does it take you to get to work?
To what extent do you agree with statements regarding tolerance?
Work related factors
This part of the questionnaire deals with aspects of job and work related factors.
Variables relate to job status, employer category, profession, contractual status at the current
job, and various aspects of the working environment.
Respondents answered the following questions:
What is your current status?
What is your profession?
Who is your employer/where do you work?
What is the contractual status of your current job: are you are employed or
self-employed?
Including you, how many people are employed at the place where you usually
work or have worked?
How many hours per week do you usually work at your main job?
Do you have a second job?
How satisfied are you with different aspects of your work?
40
If you expect to leave the company / organization in the following year, rank two
most important reasons.
Demographics – background data
The last set of variables provided us with background information about respondents.
Variables relate to the respondents’ gender, number of people living in the dwelling unit, the
highest level of education, monthly income, and age.
Respondents were answering the following questions:
Please indicate your gender.
Specify the total number, including yourself, of people living in your
apartment/house.
Name of the local area which your current residential address belongs to.
What is your highest achieved level of formal education / training?
Please, state the amount of your net average monthly income expressed in Bosnia
and Herzegovina Convertible Mark (BAM, KM).
Please, select the range that best describes your age.
3.3. Research methods and techniques
Research methods and techniques are methods researchers use in the process of a
study (Kothari 2004); methods used to collect data, statistical techniques to establish
relationships between variables, and methods used to evaluate results of research. Available
literature usually discusses one of the two approaches to empirical research, either
41
qualitative or quantitative. The quantitative study explains relations through statistical
analysis and the qualitative method completes in-depth analysis of the phenomenon
(Creswell 1999; Creswell 2002). We follow an opinion of Glaeser (2007), who claims that
an overwhelming focus on quantitative tools of economics leaves economics poorly
equipped to make sense of cities. While he was studying different countries with their
specific development trajectories and growth determinants, Lucas (1988, p.13) noted that
economic growth depends not on one or several specific, but a multitude of “economic and
cultural peculiarities” which cannot be easily observed in cause-effect relations without
quantifiable economic studies. “Economic analysis cherishes the illusion that one good
reason should be enough, but the determinants of complex processes are invariably plural
and interrelated. Monocausal explanations will not work” (Landes 2000, p.3).
The research process will be conducted in three phases. For the start of our research
we used focus group method to test validity and adjusted a questionnaire we borrowed from
the ACRE16 research. The focus group filtered the most important factors of the
respondents` living and work environment.
In the second phase, we used the questionnaire to collect data on four aspects of
working and living conditions, as well as demographics.
During the third and final phase of the research we use four in-depth interviews to
gain deep and complex all round views of people who own or manage companies in the
creative and knowledge sector.
16 http://www.acre.socsci.uva.nl/
42
3.4. Focus group
We used focus group interviews to test the questionnaire. The questionnaire used for
this research was borrowed from the EU research ACRE17. The focus group provides social
research context where participants can question their own “views in the context of the
views of others” (Patton 2001, p.386).
For the focus group we have chosen 11 people from the creative and knowledge
economy. Out of eleven people contacted, nine accepted our invitation. We deliberately
choose people with varied educational, professional and life backgrounds.
We had three female and six male participants. Several members of the group knew
each other prior to interview while others were acquainted on the day. Three of them came
to the city during the war while in their twenties, and one moved to Banja Luka because of
their job.
Members of the focus group:
1. Economist, Director of a corporate banking unit, male
2. PR manager in microcredit organization, female
3. Computer Programmer; database developer, working for a foreign company,
male
4. Programmer; system administrator for the local bank, female
5. Architect, senior architect in The Bureau for Civil engineering, also working as a
freelance architect, male
6. Actress for The National Theater, female
17 ACRE - Accommodating Creative Knowledge – Competitiveness of European Metropolitan Regions within the Enlarged Union, http://acre.socsci.uva.nl/
43
7. Graphic designer, working for the national mail company, also working as a
freelance designer, male
8. Director of a 3D design and animation studio, working for international clients,
male
9. Owner of a small company designing and supplying fitted kitchens and furniture,
male.
10. Moderator for the focus group was a docent at the Faculty of Philosophy,
Department of Psychology, at the University of Banja Luka, male.
The focus group was held on Saturday, 9th of October 2010, in a meeting room of the
City Development Agency Banja Luka (CIDEA).
3.5. Survey
The survey technique was used for testing the hypotheses with a set of predetermined
variables. Responses of knowledge and creative workers provide a measure of variables
relating to their living and working environment. “A "survey" is a systematic method for
gathering information from (a sample of) entities for the purposes of constructing
quantitative descriptors of the attributes of the larger population of which the entities are
members” (Groves et al. 2004, p.2).
There are three issues important for the quantitative part of the research. Firstly, it is
the questionnaire's design. We satisfied this concern by using the questionnaire which was
developed for the ACRE research, and testing it in the focus group interview. The
44
questionnaire was then sent to a group of 25 respondents, who completed it on-line. They
gave their comments on the clarity of the questions and technical issues.
The second issue that we considered to be very important was the sampling method,
and the third was the statistical tools and methods we use to analyze data.
The survey sample
We determined the survey sample in accordance with the methodology and addressed
the following concerns, that Fowler (1984) argues are the five key issues related to
sampling:
1. Determining the sample frame,
2. The choice whether or not to use a probability sample,
3. The size of the sample,
4. The sample design and data collection method,
5. The rate of response,
Determining the sample frame
“The sample frame” is the collection of units from the total population “with a
chance to be selected”, using the chosen selection method (Fowler J. 1984, p.19). The
sample frame for our research comprises knowledge and creative workers living and
working in Banja Luka, as a typical city in SEE.
Florida (2002) researched mobility of mainly younger workers and recent college
graduates. This is not applicable in our case, since there is significant participation of
managers, university staff, professional researches and consultants in the knowledge and
45
creative economy in SEE who are more than 35 years old. The ACRE research project,
which was undertaken in 13 EU cities in 2007 on a sample of 2.646 respondents, had, for the
main target group, workers under 35 years old, and generally with less than 10 years of
professional experience in the creative and knowledge industry. Only in Amsterdam,
Barcelona and Milan did the sample have more workers who were older than 35 years and
with more than 10 years of professional experience (Musterd & Murie 2010b).
Our sample frame includes all employees working in the knowledge or creative
sector according to the classification presented in the review of the literature. Knowledge
and creative entrepreneurs are difficult to sample since they are difficult to identify. Their
population is usually very small and proprietary databases are either incomplete or non-
existent because of the populations` dynamics (Neergaard 2008).
To determine the sample frame size we approached The Institute of Statistics of the
Republic of Srpska and The Employment Bureau. Both of these institutions could not
provide us with the data we requested. Without the appropriate statistical data and contacts,
knowledge and creative workers turned to become a hard to reach population. As a result we
were unable to determine the sample frame in a timely and cost-effective way.
The population was not hidden, in a sense set by Heckathorn (1997), since it is not
involved in stigmatized or illegal behavior, but traditional survey methods such as household
surveys would not provide adequate results. Our financial means were not sufficient to pay
for incentives to respondents for filling in the questionnaire (a primary reward), or for
recruiting others into the research (a secondary reward) (Heckathorn 1997). However, we
relied on social approval of friends and peers as a method to boost our response rate, and it
worked well.
46
The total sample frame in our research represents the total number of employed and
unemployed workers in Banja Luka with the appropriate educational level. Total numbers
are shown in Table 1 and table 2.
Table 1: Qualifications of employed and unemployed workers in Banja Luka18
We determined the sample frame as a sum of employed and unemployed workers
with the minimum of 3 years of high school education or above. The total sample frame is
45,396 people or 68.1 % of the total number of employed and unemployed workers in Banja
Luka. So, with caution, taking data from Table 1, the sample frame is determined as shown
in Table 2.
18 Source: Feasibility study for the Technological Business Park Banja Luka. p.38, Table 3.3. Used with permission from CIDEA - City Development Agency, Banja Luka. (Wim Systems Varaždin 2010)
47
Table 2: Sample frame
Level of education 2009
Number of employed Number of unemployed Phd 470 0 MA, MSc 530 5 University degree 10,126 1,173 University's non-degree 3,546 406 High school 4 years 21,419 5,090 High school 3 years 2,289 342 Total 38,380 7,016
The choice whether or not to use a probability sample
We could not determine the sample frame for knowledge and creative workers in
Banja Luka. Also, we could not acquire the list of companies and workers from the
knowledge and creative sector. Therefore, we decided to settle with the non-probability,
snowball sampling method.
We made every effort to reach as wide a population as possible, but there is a large
element of self-selection in the data collection process. We reduced selection bias by
expanding the sample size. The sample we obtained represents solid ground for the
statistical analysis. However, since we are not using probability sampling, we face two
sources of bias. The first one is our choice of initial subjects, and second is the volunteerism
in responding (Heckathorn 2002). Therefore, we are not able to determine how credible our
statistics are for the characteristics of the population as a whole (Fowler J. 1984).
The size of the sample
Although, we do not use probability sampling, we calculate the approximate sample
size by the typical statistical formula. This gives us an overall clue as to how big a sample
should be if we were to employ a probability sampling procedure. By using Equation 1 from
Appendix I on the population of 45,396, we calculated a sample size of 381 people.
48
Our sample should include only workers from the knowledge and creative sectors.
Therefore, we used elementary variable and open question fields in the questionnaire to
eliminate unwanted responses:
1. "What is your profession?" – This is a drop-down list of creative and knowledge
occupations to choose from, with an option `other`,
2. “Enter your current occupation / current job (If you are unemployed enter your
previous occupation)” – this is an open question for a written answer,
3. “Please briefly describe the content of your work / predominant occupations.” –
this is an open question for a written answer.
We checked all responses during the data collection process and deleted 42 responses
which did not belong to the required sample of the knowledge and creative workers.
The sample design and data collection method
Knowledge and creative workers in Banja Luka are a population that is hard to reach.
We decided to use the Internet and the web platform Survey Monkey19 as a way to distribute
the questionnaire. There is inconclusive evidence that internet sampling could lead to
overrepresentation of males and a wider age range (Hewson et al. 2002). However, we
supposed that creative and knowledge workers in Banja Luka are equally concerned about
their living and working environment, regardless of gender and age. We were concerned that
respondents could belong to a group of people who are overrepresented on the Net, “the
lonely, the deluded, the obsessive” (O`Dochartaigh 2001, p.18) and decided not to use
public web portals and mass media to advertise our research in order to avoid this bias.
19 http://www.surveymonkey.com/
49
Instead, we used email and social networks to contact respondents. Our initial group had 100
contacts. Several of them are long-term friends, and others are acquaintances from work,
university, school, and leisure activities. Also, it is considered that older people are less
likely to use the Internet, and that people under the age of 30 who grew up with the web and
ICT, are more likely to be overrepresented on the Internet (Sapsford & Jupp 2006). The
sample frame predominantly consists of people in Banja Luka under the age of 35, and
people in managerial or other decision-making positions, who are found to be well
represented on the Internet.
People we contacted directly or through friends` networks were very responsive. This
surprised us. The most active propagators were female friends who are holding managerial
positions in web-based media houses. We collected data from the population employed in
the knowledge and creative sector and decision makers in these sectors in Banja Luka who
are 20 years or older. We did not have an upper age limit.
The rate of response
The survey has 58 questions,16 of which are questions that consist of a group of
variables and/or responses. The average completion time for respondents in the test group
was 20 minutes. Considering that the questionnaire is time consuming we expected
difficulties in motivating people to complete the survey. Fortunately this was not the case.
The link was sent three times to the initial list of contacts, asking them to complete the
questionnaire (if they hadn’t already done so) and forward the link to their list of friends and
acquaintances. We believed that the sense of obligation of friends and acquaintances would
50
increase the response rate. This turned out to be true. People were very willing to take part in
the research, partly due to social approval of their peers.
We assume that all the people who received the link via email or from internet social
tools (Facebook, Skype, and Twitter) opened the questionnaire web page. Every single visit
to the page was recorded as a single IP address. Some people reported starting the survey at
work and finishing it at home. This would show as two people visiting the questionnaire
page from two different IP addresses.
Until May 7th 2011, the total number of people who followed the link from unique IP
addresses was 684, and of those 464 people completed the questionnaire. The response rate
was 67.8%. We deleted 42 responses that did not fulfill our specific requirements regarding
occupation. Therefore, the final response rate is 642 responses with 420 completed
questionnaires - making the final response rate 65.42%. Although some people accessed the
web page twice, from different IP addresses, we regard this response rate as fairly good.
Data Analysis
To evaluate the relationship between variables by using the data acquired with the
questionnaire, we used a non parametric Chi-square test and factor analysis included in the
SPSS software package, version 17 and 19. The Chi-square test was chosen because
collected data is non-numerical, consisting of, to a large degree, nominal and ordinal data,
and distribution of data on population does not fit the normal distribution parameters
(Gravetter & Wallnau 2007).
To get the necessary cell count for the Chi-square test, using results from Table 3, we
grouped respondents who answered somewhat likely, very likely and almost definitely to
51
move away from Banja Luka in the next three years into the first group, and respondents
who are `not too likely to not likely at all` to move away from Banja Luka in the next three
years into the second group. We use the term `mobility subgroups` to describe these two
groups.
Table 3: How likely are you to move away from the city in the next 3 years? How likely are you to move away from the city in the next 3 years?
Response Percent
Response Count
Almost definitely 7.4% 31 Very likely 13.6% 57 Somewhat likely 22.9% 96 Not very likely 43.6% 183 Not likely at all 12.6% 53
answered question 420 skipped question 0
To get an appropriate cell count for the Chi-square test, we use results from Table 4
to divide respondents into two employee’s subgroups, in response to how long they expect to
remain at their place of work.
Table 4: How long do you plan to stay in current company/organization? How long do you plan to stay in current company/organization?
Response Percent
Response Count
less than 1 year 6.6% 23 between 1 and 3 years 21.9% 76 more than 3 but less than 5 years 11.5% 40 between 5 and 10 years 7.2% 25 more than 10 years 9.5% 33 I do not know 43.2% 150
answered question 347 skipped question 73
Respondents who expect to leave the company in less than 3 years belong to the first
employees` subgroup, and respondents who expect to stay in the company more than 3 years
belong to the second employees` subgroup.
52
We used factor analysis and binary logistic regression in addition to the Chi-square
test in order to determine which factors, be they economic or cultural/societal in terms of
issues of concern, would most significantly impact on the respondent's decision to move
away from Banja Luka in the next three years.
To use binary logistic regression we modified the dependent variable from Table 3:
"How likely are you to move away from the city in the next 3 years?”, by reducing 5 options
(almost definitely, very likely, somewhat likely, not too likely, and not at all likely) to 2
options (1 and 0), where option “1”= “YES” and represents answers “almost definitely” and
“very likely”, while option “0”= “NO” and represents answers “somewhat likely”, not too
likely”, and “not at all likely”. This allows the calculation of equations expressing the
relationship between the binary outcome and impact of different factors.
After conversion, our dependent variable (likelihood of moving away from the city in
the next 3 years, Table 3) is dichotomous. We use binary logistic regression analysis for
expressing the relationship between the binary outcome and impact of several factors as
predictors (seven linear combinations that we get after the factor analysis). In this way, we
are able to predict whether the probability of the dependent variable is the function of
independent variables. Likelihood of moving away from the city is calculated by the
Equation 2 (Appendix I).
3.6. The interview phase
We used semi-structured interviews in the qualitative phase. Quantitative research is
used to obtain a general overview of the sample characteristic, while we pursue interview
53
methods in order to “elucidate and explain complexity” of entrepreneurship (Neergaard
2008, p.256) in Banja Luka, as a typical city in SEE. Interviewing assumes that perspectives
of others, which are elucidative in terms of the research inquiry, could be made explicit
(Patton 2001). Impact of interviewer's perspective is also significant. Since we are not
neutral collectors of information about social phenomenon, through qualitative research
methods we generate, rather than collect data (Mason 1996). Personal involvement and
knowledge of the field not only leads to a bias, but allows researchers to more successfully
carry out the interview process. According to Patton (2001), there are four main reasons for
using standardized open-ended interview that we were using:
1. the interview structure could be repeated elsewhere,
2. it is easier to minimize variations in approach among different interviewers,
3. the interview process is done more time-efficiently,
4. responses are easier to find and analyze.
We followed the ACRE interview strategy, modifying it to the local perspective, and
asked knowledge and creative entrepreneurs to address the following issues in their own
terms:
1. What is the importance of human capital for the competitiveness of the company?
2. What is the role of traditional social networks for the company?
3. What is the significance of city features for the company?
Guidelines for the interview included the following topics:
History and business of the company,
Interviewee's role in the company,
Clients and location of the company,
54
Cooperation with other organizations / companies,
Links with educational institutions, municipal and state agencies and institutions,
Issues of finding and hiring personnel (contract, temporary, permanent, freelance),
of life, leisure activities, culture, sub-culture),
Future prospects and possibility of moving away from Banja Luka.
Interviews with managers from the creative and knowledge sector clarify the
importance of economic factors in the living and working environment on the mobility of
human capital and their impact on the development of the knowledge and creative economy.
3.7. Validity and Reliability
There are usually two approaches to issues of validity and reliability. The first one is
quantitative, focused on internal and external validity (generalization), while the other,
qualitative method of research, is primarily concerned with internal validity (Mouton &
Marais 1988). Newman and Benz (1998) argue that validity cannot exist without reliability,
because “validity estimates the extent to which the test or set of data or design actually
measures, reflects or produces what it is supposed to measure, reflect, or produce” (Newman
& Benz 1998, p.32).
Internal validity supports the claim that “a study has generated accurate and valid
findings of the specific phenomena which have been studied” (Mouton & Marais 1988,
p.50). After determining internal validity, a further step is to determine external validity, or
55
how well research findings apply to the wider population. We use triangulation, as a process
of validation, whereby “researchers search for convergence among multiple and different
sources of information to form themes or categories in a study” (Creswell & D. L. Miller
2000, p.126). Research instruments are borrowed from the ACRE research project and tested
with focus group interviews and trial groups of respondents. Data from the ACRE research
project and the rest of the literature is compared and contrasted with our own qualitative and
quantitative data.
We confronted several issues that could lead to a bias. We contacted and visited
relevant institutions and authorities, specifically The Institute of Statistics of the Republic of
Srpska and The Employment Bureau, but were unable to get relevant data to determine the
sample frame. Therefore, the sample frame was not determined, and probabilistic sampling
could not be applied. Like the ACRE research project, we used a snowball sampling method
to select respondents for the questionnaire. Respondents answered the questionnaire in a
large proportion voluntarily. We reminded our initial group three times to send the link to
their contacts.
Our selection method on the Internet implies a large degree of volunteer sampling.
We cannot claim population validity, but our sample is fairly large to minimize this bias, and
the number of completed questionnaires is compared with the number of visits to the web
site (Sapsford & Jupp 2006). We also introduced variables whose sole purpose is to exclude
respondents who do not correspond to the sample frame. In addition to our procedures to
reduce bias and support validity and reliability, repeated research in SEE countries could
add to the analysis in this respect.
56
3.8. Geographic location of the research20
Due to our financial and time constraints, sampling of the population employed in the
creative and knowledge economy is limited on respondents who live in Banja Luka.
Banja Luka is a typical city in a transitional country in SEE. The city is located in
north-western Bosnia and Herzegovina, in a valley at an altitude of 163 meters, and at the
junction between the Dinaric Mountains in the south and Pannonian Basin in the north.
Through the city flows the river Vrbas with three smaller tributaries. Banja Luka has a
moderate continental climate with cold winters and warm summers from the prevailing
influence of the Pannonian basin. The city area covers 1.232 km2, which represents 4.9% of
the territory of Republic of Srpska, or 2,4% of the territory of Bosnia and Herzegovina. Out
of the total area, 53% is agricultural land, while 39% of the area is covered by forests. Banja
Luka is the capital, administrative and economic center of the Republic of Srpska, and one
of two political entities in Bosnia and Herzegovina. There are 20 other municipalities in
Banja Luka region.
20 Information source: Feasibility study for the Technological Business Park Banja Luka. Used with permission from CIDEA - City Development Agency, Banja Luka. (Wim Systems Varaždin 2010)
57
Picture21: Regional location of the city of Banja Luka
The last census in Bosnia and Herzegovina was in 1991, and this poses a serious
problem for establishing all statistical indicators. Bosnia and Herzegovina has been seriously
affected by the civil war that took place in the former Yugoslavia from 1991-1995. A large
number of former residents of Banja Luka left the city in that period, and an even larger
number of newcomers settled in the city during the war and post-war period.
According to the data of the last census, Banja Luka had a population of 195,692.
Republic of Srpska Institute of Statistics made an assessment in 2008, indicating the total
number as 223,641 inhabitants. According to an assessment from 2005, women represent
51.3% of the city total population. The average estimated population density in 2008 was
181 people per km2.
21 Feasibility study for the Technological Business Park Banja Luka. p.33, Used with permission from CIDEA - City Development Agency, Banja Luka. (Wim Systems Varaždin 2010)
58
Before the war, Banja Luka played the role of the regional economic, educational,
and cultural center. The city was a hub of electronic, chemical and mechanical industry, and
the seat of several of big-business systems. In terms of development, the city was well above
other cities in the former Bosnia and Herzegovina but carried the burden of an
underdeveloped regional environment. The city exceeded the industrial framework of the
former Bosnia and Herzegovina. It was one of the main centers in the former Yugoslavia,
with distinctive electronic, chemical and mechanical industries. Industrial development was
facilitated by knowledge exports and licensing arrangements. Local companies were training
personnel from the less developed countries. Large systems dominated the industry, and
individual production units had on average 550 workers per unit.
After the war, the industrial infrastructure of the city was severely depleted in
comparison with the last two decades of the 20th century. Many plants closed, and their
products disappeared from the market. On the other hand some production processes relying
on lower technology outputs designed for local needs, have survived, although the number
of manufacturing jobs has been significantly reduced. Today the power sector, which
includes transmission and distribution of electricity, produces a larger gross value than the
total manufacturing industry. In terms of exports today the only export products from the
pre-war period are paper and paper products.
According to the City Administration of Banja Luka, the largest number of
enterprises in 2008 belonged to the manufacturing industries (821 firms), followed by
wholesale and retail (622 companies), transport, storage and communications (653
companies) and agriculture, hunting and forestry (599 companies). Together, they comprise
59
65.3% of active enterprises in the city. However, these indicators are not relevant in terms of
micro, small and medium companies.
Banja Luka is a university city with over 30,000 students at one state and several
private universities. This brings in a significant and continuous influx of young and skilled
people and provides significant income for the city.
In August 2011, property prices in Banja Luka varied from 2,400KM per square
meter for apartments in the city center, to 1,600KM per square meter for properties in areas
more than 3km away from the central city square. The estimated unemployment rate of the
total working population of Bosnia and Herzegovina in 201022 was 43.1%.
22 CIA - The World Factbook, 2010, https://www.cia.gov/library/publications/the-world-factbook/geos/bk.html. Accessed: September 2011
60
4. RESULTS
We start the analysis of collected data with the results of focus group interviews,
followed by quantitative analysis of the survey data, and end with qualitative analysis of in-
depth interviews. The structure of quantitative results loosely follows the organization of the
questionnaire. We analyze key data from the survey in regard to:
1. Demographic characteristics of respondents,
2. Living in Banja Luka,
3. Economic and social aspects of city life,
4. Job and work environment.
Results of the quantitative data are accompanied by tables. Analysis of the
quantitative results start with descriptive analysis, followed by statistical methods of
enquiry.
4.1. Focus group results
Focus group interviews followed the structure of the ACRE questionnaire which is
divided in four parts:
1. Living in Banja Luka,
2. Satisfaction with the job and work environment,
3. Satisfaction with the neighborhood and dwelling,
4. Demographics – background data.
We used focus group interviews to check the validity of the questions for knowledge
and creative workers in Banja Luka, and whether people understood how to correctly answer
61
them. The second issue was especially important since the questionnaire was distributed via
the Internet, without an option for respondents to have technical help via a toll-free phone
line or internet messaging. Focus group participants gave their comments on a translated
version of the original ACRE questionnaire for Dublin23.
Living in Banja Luka
We found that the way to answer question A3) from the original questionnaire:
“Please rank the 4 most important reasons why you currently live in Banja Luka (1 being the
most important and 4 the least important – please choose only four reasons)” was not clear
enough to several of our interviewees. When asked if it was clear that a total of four answers
are needed for the entire question, several respondents answered that it was not clear.
“No, it is not clear. Only in the first column personal connection, job, location...we need four.”
“The first column serves more to you, where, in fact...to which group the answer belongs to.”
For the question A5) from the original questionnaire: “How often are you involved in
any of the following activities?” we had a suggestion to insert a column with the answer
“none of the above”. It was brought to our attention that the scale (every day, at least once a
week, less often, never, and don’t know) does not correspond to the usual frequency of visits
to the theater, with a proposal to introduce an option “once a month”.
23 ACRE ‐ Accommodating Creative Knowledge – Competitiveness of the European Metropolitan Regions within the Enlarged Union. Questionnaire Survey. http://acre.socsci.uva.nl/results/documents/WP5_questionnaireDublin.pdf. Accessed: September, 18th 2011.
62
“Once a month I missed too, because it was somehow foolish to write ... rarely”
“The reality is that you visit them (amenities) more or less often.”
“No one goes to the theater every day, except those who work there.”
“Same for the museum...”
Regarding the question A6), “How satisfied you are with the following leisure
activities offered in Banja Luka?” participants questioned whether the “Quality of shopping
areas” belongs to standard leisure activities. It was suggested that a question regarding spas,
fitness centers, libraries, should be included in the questionnaire.
In response to the question A7), “How satisfied you are with the following public
services offered in Banja Luka?”, there was a suggestion to separate the regular police force
from the community police force, which is in charge of maintenance of public order, traffic
control, protection of environment, cultural property, streets, public buildings and the
preservation of city property.
For the question A8), “How would you rate the following environmental aspects of
Banja Luka?”, there was a question as to whether to have the river Vrbas, which runs
through the city, mentioned there.
“I do not know whether the river is important to add here...river banks?”
Regarding the question A9), “How worried are you are about the following issues in
Banja Luka”, participants briefly discussed the list of issues mentioned in the questionnaire,
and suggested more of them.
63
“All that bothers residents of the city is important.”
“Maybe there should also be option “other” (to write down).”
“Illegal construction, as an issue important for Banja Luka,... I think we should...”
“How frustrating these posters are, advertising...large posters that go on the wall, I do not know...it's so beginning to take place in Banja Luka that it is scary... For me, personally, it is a disgrace.”
“Medical services...”
“But it could be in A9, as someone said, traffic culture, uncivilized...”
On the subject of tolerance, A16-A20, we first explained in more detail the purpose
of this part of the questionnaire. Participants concurred that the issue of visible minorities is
not particularly relevant to Banja Luka, for example, members of the Roma population are
not a visible minority in that respect, since they are not easily differentiated from other
groups.
“Question is whether these issues are generally relevant to Banja Luka?”
“Those are ethnic minorities, it means.”
“We don't have minorities, we are...”
“We have minorities, but...the problem is that we have no animosity towards minorities, but towards the majorities...”
“They have separate questions for gay and lesbian population.”
64
“We can put homosexuals...it is the burning issue right now, over here, in Belgrade...”
In response to the question “To what extent do you agree with the statement that
Banja Luka is a place with tensions between people of high income and low income
levels?”, we were suggested to change it into “tensions between rich and poor”.
“I think this is more a question between rich and poor... I guess it is more related to that.”
“It crossed my mind, whether in the questionnaire to include those who can endanger...Jehovah's Witnesses, beggars...they are also minorities”
Satisfaction with the job and work environment
It was agreed to have the option “unemployed” in question B2), “What is your
current employment status?”
In B3, “What is your contract status in your current job?”, it was suggested that the
formulation should be changed from “On an unlimited permanent contract” to “Contract for
an indefinite period”.
“Over here, it is more likely called Contract for an indefinite period...”
For the question B5), “Including yourself, about how many people are employed at
the place where you usually work/worked?”, it was suggested to add an option of “only
employee”.
“I think that there should be an option for only one employee, it is important...”
65
In response to the question B9), “How satisfied are you with the following aspects of
your job?” it was suggested we have “Respect for workers' rights” in the questionnaire.
“Maybe respect for workers' rights...for example, I worked for a TV company in direction, working 8 hours a day, but you should be doing 5 hours maximum, behind monitors...”
“I recently heard `the great` case...when the girl revealed that she is pregnant to her boss, he fired her.”
“Respect for workers' rights...holidays, working hours...”
With regard to profession and occupation, discussion was short, mainly related to
music and video production.
“Video, film and photography go together, but music not entirely...“
Satisfaction with the neighborhood and dwelling
Regarding the question C1), “Would you consider the area in which you live to be...”
it was suggested we ask respondents where they live, and not to rely on their perception of
the distance from their dwelling to the city center.
“Very often someone says from Banja Luka, and it turns out...”
“Very often they do not know whether it is center or...”
Regarding the specific questions about issues dealing with neighborhood, participants
discussed whether we need them, since they are the same as questions in the first part, which
deal with those issues on the city level.
66
“C3 and A8 are the same, just take and copy...parking, garbage”
“Very often people will respond the same, if dissatisfied with their (neighborhood), what they care about the center...”
“Instead of the neighborhood to put area...”
Participants discussed events important for the neighborhood mentioned in the
question C3), “How satisfied are you with the following aspects of life in your
neighborhood/area?”
“It is great when something is happening in the neighborhood interesting to me... scheduled...”
“Honestly, more and more, we are turning into a society where you don't care what happens in the neighborhood, because you only sleep and stay there, and you look for events where they take place.”
Regarding question C5), “How important were the following factors in your decision
to move to your current residence?“, participants agreed that distance and the time to get
work are both important.
“It is presumed here... this is very important that if someone had a choice... (there should be an option)...I could not choose”
Issues of new building developments were also raised, in terms of infrastructure,
illegal construction, parking spaces.
“I do not know how important it is, development of city estates, construction, and...specifically in my neighborhood ... they are building two huge buildings without parking lots...my estate is currently pretty, and I am happy at the moment
67
and all, but in 2-3 years it will be...to insert in section C where all that development is going to.”
Demographics – background data
In response to monthly income, question D6); “Please indicate the range that best
describes your monthly income after taxes (Euros).”, respondents argued that “after tax”
could mislead respondents.
“After tax makes sense in the West, because they are constantly watching, monitoring taxes in their countries...it does not matter over here because employers pay net salary, and everyone calls it salary...it is enough net monthly income”
The question is raised about differences between degrees gained in pre-Bologna
process, and later, in terms of numbers of years of study for a degree.
“Some people complete their primary studies, but they are not called graduated...Some of them will graduate after three, other after five years...”
68
4.2. Survey results
We start our quantitative research by determining two groups of respondents in terms
how likely are they to move away from their present place of residence or place of work, in
terms of their perception of the working and living environment. For this purpose we used
two dependent variables, the first one determining how likely respondents are to move away
from Banja Luka in the next 3 years, and the second one to establish how long respondents
plan to stay in the current company/organization.
Respondents answered the following questions:
How likely are you to move away from Banja Luka in the next 3 years? (Possible
answers: almost certainly, very likely, somewhat likely, not very likely, not likely
at all)
How long do you plan to stay in current company/organization? (Possible
answers: less than 1 year, between 1 and 3 years, more than 3 but less than 5
years, between 5 and 10 years, more than 10 years, I do not know)
Likelihood of moving away from Banja Luka
To determine how likely respondents are to move away we asked them to answer the
following question:
How likely are you to move away from Banja Luka in the next 3 years?
Results in table 3 show that 44% of respondents are almost definitely, very likely and
somewhat likely to move away from Banja Luka in the next 3 years. 56% of respondents
choose not very likely and not likely at all.
69
Likelihood of leaving the place of work
To determine likelihood of respondents leaving their place of work we asked them to
answer the following question:
How long do you plan to stay in current company/organization?
Results in table 4 show that 28.5% of respondents are planning to leave the company
in the next three years. It is worth noting that 43.2% of respondents choose answer I do not
know, and 73 out of 420 respondents skipped the question. Only 6.6% of respondents choose
the answer less than 1 year, and 21.9% selected between 1 and 3 years.
4.2.1. Demographics
Variables relating to demographic characteristics of the sample give us data on net
monthly salary/income, age, gender, the highest level of education, period of time lived in
Banja Luka, and the place of residence prior to current address. Besides demographic data,
results in Table 5, also show us data on the significant differences between gender groups in
7.000 < 0.00% 0 no answer 0.70% 3 don't know/ don't want to
answer 12.40% 52
Gender percentage Total count Male 46.9% 197
Female 53.1% 223 Level of education of respondents
High school 3 years 0.50% 2 High school 4 years 2.40% 10 Completed one or more years of university degree 15.20% 64 Completed degree - 3 years 12.40% 52 Completed degree - 4 years 41.70% 175 Completed degree - 5 years 12.60% 53 Specialist postgraduate course 2.40% 10 Master of Science or Magister (Mg, Ma, Mag, MSc) 9.80% 41 Doctorate (e.g. a Doctor of Philosophy (Ph.D.)) 3.10% 13
Overall, our total sample is very close to being evenly distributed between female
and male knowledge and creative workers. Results coincide with the participation of gender
groups in the city wide population (in 2005, women represented 51.3% of the total city
population). Results also show that female respondents are better represented in the creative
economy, although we cannot claim that this difference is statistically significant for our
sample.
Age
Results show that 67% of the sample falls within 25-34 age group, 27.6% of
respondents belong to 35-44 group, and fewer than 10% of respondents are less than 24
years old. Only 4.2% of respondents are older than 44. Chart 1 displays age distribution of
the sample, illustrating positive skewness:
Chart 1: Age distribution
72
Highest achieved level of formal education
Although our selection criteria was primarily focused on occupation, and not on
highest achieved level of formal education, it is worth mentioning that 66.7% of respondents
completed a degree, and 15.3% of respondents completed postgraduate studies. Respondents
who completed one or more years of university education comprise 15.2% of the sample,
and 2.9% of respondents finished high school.
Monthly income
Results show that 12.9% of respondents receive net monthly income of less than
BAM 500, and 21.2% of respondents have monthly income from BAM 500 to BAM 999.
It draws our attention to the fact that 41.7% of respondents receive net monthly
salary/income between BAM 1,000 and 1,999 (EUR 500 – EUR 1,000), 8.3% of
respondents have monthly income between BAM 2,000 and BAM 2,999, 1.9% have income
between BAM 3,000 and BAM 3,999, and only 1.7% of respondents have monthly income
above BAM 4,000 (2,050 EUR). Chart 2 displays the income distribution of the sample:
Chart 2: Income distribution for net monthly income
73
Data in Table 5 illustrates income differences between gender groups. Statistically,
the obtained Chi-square value χ² (4, n 420) = 9.459, P 0.051 is just under the critical table-
value of χ² (4, ) = 9.49, P 0.05 (Gravetter & Wallnau 2007, p.711). In our sample, females
earn more than males in lower income levels, up to BAM 2,000, while males earn more in
higher income levels, over BAM 2,000. Results show that 52.1% women have monthly
income between BAM 1,000 and BAM 1,999.
4.2.2. Living in Banja Luka
Variables represented in Table 6 deal with responses to structure and size of
households, length of time lived in the city and neighborhood, and previous residence, while
Table 7 provides data on the city area where respondents live. Table 8 shows results
regarding the most important reasons why respondents are living in Banja Luka.
Length of time lived in Banja Luka and neighborhood
Results in Table 6 show that 86% of respondents have lived in Banja Luka for 10
years or longer, 9.3% have lived in Banja Luka between 5 and 10 years, 2.9% between 2 and
5 years, and only 1.9% of respondents have lived in Banja Luka less than 2 years.
Data also show that 21.4% of respondents have been living on the same address all
their life, an additional 29% of respondents have lived at a different address in Banja Luka,
and 32.4% have lived in another place in Bosnia and Herzegovina.
It is worth mentioning that 50% of all respondents have spent their entire life in
Banja Luka, that only 16.9% of people had a place of residence outside BiH, and only 0.2%
respondents have lived outside Europe.
74
Table 6: Household structure and size, time lived in the city, and previous residence
Household structure Response Percent
Response Count
One person 12.40% 52 Living with parents 25.70% 108 Husband and wife /cohabiting couple 17.90% 75 Husband and wife (or cohabiting couple) with children 26.00% 109 Lone Father / mother and children 2.40% 10 Husband and wife (or cohabiting couple) and other persons 1.00% 4 Husband and wife (or cohabiting couple) and children and others 2.10% 9 Lone Father / mother and children and others 1.40% 6 Two family units 1.40% 6 Non-family household containing relatives or non-relatives (friends) 6.00% 25 Other 3.80% 16
Number of people living in the apartment/house (household size) Response Percent
Response Count
1 11.90% 50 2 26.40% 111 3 28.80% 121 4 24.50% 103 5 5.00% 21 6 or more 3.30% 14 Length of time lived in Banja Luka Place of residence prior to current address
< one year 0.2% 1 Never moved 21.4% 90
1 to 2 yrs 1.7% 7 In the city, but different address
29.0% 122
2 to5 yrs 2.9% 12 Another city in BiH 32.4% 136 5 to 10 yrs 9.3% 39 Outside BiH 16.9% 71 >10 years 86.0% 361 Outside Evrope 0.2% 1
Household structure
Results for the household structure show that 17.9% of households consist of a
husband and a wife (cohabiting couple), and another 26% are husband and wife (or
cohabiting couple) with children. Therefore, 43.9% of respondents live as cohabiting
couples with or without children, and single people living on their own represent 12.4% of
the sample. It is notable that respondents in our sample who live with their parents make up
25.7% of our sample, and those who live with their friends or relatives are a minority of 6%.
Single parents make up 1.4% of the sample.
75
Results show that households are relatively modest in size, with only 8.3% of
respondents living in households comprising 5 or more members. 11.9% of respondents live
on their own, and 26.4% live in households of two people, leaving 38.3% of respondents
living alone or with one other person. There are 28.8% of respondents who live in
households of 3 people, and 24.5% living in households of 4.
Local area of current residential address
Results in Table 7 show that 77% of respondents choose to live in the central part of
the city, less than 2 km from the city center. The highest proportion of respondents, 16.7%,
live in the city center, and 16.4% of respondents live in Stračevica.
Table 7: Local area of current residential address Answer Options Response
Percent Response Count
Ada 1.0% 4 Borik I 7.4% 31 Borik II 5.0% 21 Bulevar 1.4% 6 Centar I 6.9% 29 Centar II 9.8% 41 Česma 1.4% 6 Debeljaci 0.5% 2 Drakulić 0.5% 2 Kočićev vijenac 6.4% 27 Kuljani 0.5% 2 Lauš I 1.7% 7 Lauš II 0.5% 2 Lazarevo I 2.1% 9 Lazarevo II 3.3% 14 Nova Varoš 5.2% 22 Obilićevo I 9.8% 41 Obilićevo II 2.6% 11 Paprikovac 4.0% 17 Petrićevac 2.1% 9 Pobrđe 0.2% 1 Priječani 0.2% 1 Rosulje 5.7% 24 Šargovac 1.0% 4 Srpske Toplice 0.5% 2 Starčevica 16.4% 69 Verići 0.2% 1 Vrbanja 0.5% 2 Zalužani 2.1% 9 Other: 1.0% 4
answered question 420
76
Reasons for living in Banja Luka
Ranking the four most important reasons for living in Banja Luka, respondents gave
the highest importance to personal connections. In the questionnaire, reasons were ranked
from 1 to 4, the reason marked with number 1 being the most important, and the reason 4 the
least important. We converted the values for our calculations, giving value 4 to the previous
value 1, value 3 to the previous value 2, and so on.
According to results in Table 8, the highest score has a variable the family lives here,
25.57% of the total sum of scores, 14.8% is the score for born here, 12.68% for proximity of
friends, and 11.6% for studied here.
Apart from links to family and friends, the relatively high response rate of 7.71% of
the total sum of scores was given to size of the city. Employment related reasons for settling
in Banja Luka cumulatively represent 14.28% of the total score, and individually: moved
here because of my job represents 4.38% of the total sum of scores, good employment
opportunities 4.23%, higher wages 2.99%, and moved here because of my partner’s job
represents 2.68% of the total sum of scores.
City-related economic reasons together represent 3.94% of the total score,
comprising good transport links 0.64%, housing quality 2.45%, housing affordability 0.62%,
and housing availability 0.23%.
Variables related to safety, openness and tolerance of the city cumulatively represent
4.03%, with 1.45% of the total sum of scores for openness and tolerance. Individually:
openness to different types of people (in terms of race, ethnicity) represents 0.67%, open
minded and tolerant 0.57%, and tolerant to gay/ LGBT represents 0.21% of the total sum.
77
Table 8: Four most important reasons for living in Banja Luka Reason N Range Min.
value*Max.
value**Sum of
scores
Mean Std. Error
Std. Deviation
σ
Sum of scores /
Total sum x 100
Family lives here 296 3 1 4 992 3.35 0,05 0.86 25.57%
tolerant to gay/ LGBT 6 1 1 2 8 1.33 0.21 0.52 0.21%Language (able to communicate with foreigners)
0 0.00%
Overall friendliness of city 0 0.00%Diversity of leisure and entertainment facilities
0 0.00%
Cultural diversity 0 0.00%Diversity of the built environment
0 0.00%
Presence of good universities
0 0.00%
Presence of good schools 0 0.00%
Total SUM 3,879 100.00%* 1 - the least important (minimal value on the scale 1 to 4), ** 4 – the most important (maximal value on the scale 1 to 4), N Number of respondents who choose a given variable on a scale 1 to 4
78
Cumulatively, 64.65% of the total sum of scores belongs to: respondents having
family in Banja Luka, being born in the city, proximity to friends and studied in Banja Luka:
as is graphically illustrated in Chart 3.
Chart 3: The most important reasons for living in Banja Luka
4.2.3. Demographics and likelihood of moving away
Results in this section provide us with basic demographic characteristics of the
sample in relation of how likely respondents are to move away in the next three years.
We use the term mobility subgroups to describe groups of respondents who are
somewhat likely to almost definitely to move away from Banja Luka in the next three years,
79
and respondents who are not too likely to not likely at all to move away from Banja Luka in
the next three years.
Results shown in Table 9 provide us with data on age, monthly income, household
size, and commuting time in terms of how likely respondents are to move away from the city
in the next three years.
Age and likelihood of moving away
Results show that significant variation exists in observed and expected values
between mobility subgroups in terms of the respondents` age with χ² (3, n=420) = 17.457,
p< .01. Respondents who are somewhat likely to almost definitely to move away from Banja
Luka in the next three years are in higher percentages younger than 34 years, and their age
has a medium effect on the likelihood of them moving away from Banja Luka Cramer`s V
(3, n=420) = .204, p< .01.
Monthly income and likelihood of moving away
There is a significant variation between mobility subgroups in relation to their
monthly income, with χ² (3, n=420) = 10.713, p< .05. It is noteworthy that 42.4% of
respondents from the more mobile subgroup have wages below 999KM, and only 27.5%
from the less mobile subgroup have wages in that bracket.
80
Table 9: Age, monthly income, household size, commuting time and likelihood of moving away Age
Likelihood of moving from Banja Luka in the next three years?
Less than 24
25-34 35-44 More than 45
χ²
Somewhat likely to almost definitely 10.9% 65.8% 21.7% 1.6%
17.457** Cramer`s V 0.204
Not too likely to not likely at all 5.5% 54.7% 32.2% 7.6%
Total 7.9% 59.5% 27.6% 5.0%
df = 3. N = 420, **p < 0,01
Monthly income
Likelihood of moving from Banja Luka in the next three years?
Less than 999KM
1000- 1999 KM
1999 - 2999 KM
more than
3000KM χ²
Somewhat likely to almost definitely 42.4% 37.5% 7.6% 12.5% 10.713*
Not too likely to not likely at all 27.5% 44.9% 8.9% 18.6% Total 34.0% 41.7% 8.3% 16.0% df = 3, N = 420, *p < 0,05 Household size
Likelihood of moving from Banja Luka in the next three years?
One person
Living with
parents
Nuclear or
single parent family
extended family
Non-family
household (relatives, friends,
flatmates)
χ²
Somewhat likely to almost definitely
16.5% 29.0% 38.1% 7.4% 9.1% 15.14** Cramer`s V
0.194 Not too likely to not likely at all
10.1% 25.0% 55.7% 5.3% 3.9%
Total 12.9% 26.7% 48.0% 6.2% 6.2%
df = 4, N = 420, **p<0.01
Commuting time - going to work
Likelihood of moving from Banja Luka in the next three years?
I work from home
Less than 15 min
More than 30
min χ²
Somewhat likely to almost definitely 12.0% 73.4% 14.7% 8.446*
Not too likely to not likely at all 5.5% 84.3% 10.2% df=2, N=420, *p<0.05
81
Household size and likelihood of moving away
Results show that the size of the respondent's household significantly affects the
likelihood of respondents moving from Banja Luka in the next three years; χ² (4, n=420) =
15.14, p< .01.
Figures reveal that 55.7% of respondents who are not too likely to not likely at all to
move away from the city, live in nuclear or single parent families. Data show that 16.5% of
respondents from the more mobile subgroup live on their own (10.1% from the less mobile
subgroup), 29% live with their parents (25% from the less mobile subgroup), and 16.5%
live in extended families or with their friends or relatives (12.4% from the less mobile
subgroup).
Household size has a medium effect on the likelihood of respondents moving away
from Banja Luka: Cramer`s V (4, n=420) = 0.194, p< .01.
Commuting time and likelihood of moving away
Since Banja Luka is not a geographically dispersed city and most of our respondents
live less than 4 kilometers from the city center we aggregated answers 15-29 min, 30-44
min, 45-59 min, 60- 90 min, and more than 90 min into a single response: more than 30 min.
Results show that 73.4% of respondents from the more mobile, and 84.3% from the less
mobile subgroup commute less than 15 minutes from home to work. However, there are
significant differences between mobility subgroups in regard to commuting time χ² (2,
n=420) = 8.446, p< .05. The more mobile subgroup is more likely to work from home, or to
travel longer to their work.
82
4.2.4. City features and likelihood of moving away
This chapter provides an overview of the features of the city in relation to the sample
breakdown in two mobility subgroups: respondents who are somewhat likely to almost
definitely to move away from Banja Luka in the next three years, and respondents who are
not too likely to not likely at all to move away from Banja Luka in the next three years. We
consider those respondents who are somewhat likely to almost definitely to move away from
Banja Luka to belong to more mobile group and respondents who are not too likely to not
likely at all to move away from Banja Luka to belong to the less mobile subgroup.
We use the Chi-square test in order to assess whether results for given variables
significantly vary from the expected values, under the presumption of their independence.
Social activities and likelihood of moving away
Results in Table 10 show that the most popular social activities for more than half of
all respondents, at least once a week, for both mobility subgroups are: going out to the
pub/bar, visiting coffee shops (during the day), walking around city center, going to city
parks and visiting friends. Very popular in both groups is spending time with friends, and
this is practiced at least once a week by 64.1% of respondents from the more mobile
subgroup, and 66.9% from the less mobile subgroup.
Without statistically significant differences, results show that 74.5% of respondents
from the more mobile, and 69.5% from the less mobile subgroup are going to a movie,
theater and/or concert at least once a month, while 63.1% of respondents from the more
mobile subgroup, and 69.5% of the less mobile subgroup visit restaurants once a month.
83
Table 10: Social activities and likelihood of moving away from Banja Luka Likelihood of moving from Banja Luka in the next three years?
Almost never
At least once a year
At least once a month
At least once a week
Every day
χ²
Going out to the pub/bar Somewhat likely to almost definitely 3.3% 8.2% 34.2% 51.1% 3.3%
4.224 Not too likely to not likely at all 5.9% 11.4% 36.0% 44.5% 2.1%
Visiting coffee shops, during the daySomewhat likely to almost definitely 2.7% .5% 16.3% 52.7% 27.7%
2.754 Not too likely to not likely at all 3.0% 2.1% 13.1% 51.7% 30.1%
Eating outSomewhat likely to almost definitely 11.4% 25.5% 48.4% 14.7% .0%
4.638 Not too likely to not likely at all 6.4% 24.2% 51.7% 17.4% .4%
Going to movie, theatre and/or concertsSomewhat likely to almost definitely 6.5% 19.0% 58.7% 15.8% .0%
2.249 Not too likely to not likely at all 5.9% 24.6% 56.8% 12.7% .0%
Going to museum and/or art gallerySomewhat likely to almost definitely 23.9% 37.0% 32.6% 6.5% .0%
13.813**Not too likely to not likely at all 27.1% 50.0% 19.9% 3.0% .0%
Walking around city centreSomewhat likely to almost definitely 3.8% 6.0% 21.7% 45.1% 23.4%
8.946 Not too likely to not likely at all 2.1% 3.0% 14.4% 49.6% 30.9%
Excursions in parks or peripheral green areasSomewhat likely to almost definitely 4.9% 16.8% 40.8% 35.9% 1.6%
3.461 Not too likely to not likely at all 2.5% 17.8% 37.3% 39.0% 3.4%
Going to a night clubSomewhat likely to almost definitely 16.8% 23.4% 45.7% 14.1% .0%
8.707* Not too likely to not likely at all 28.4% 23.7% 36.0% 11.9% .0%
Going to sport eventsSomewhat likely to almost definitely 41.8% 33.7% 17.9% 6.5% .0%
7.423 Not too likely to not likely at all 29.2% 42.8% 20.3% 7.6% .0%
Going to city parksSomewhat likely to almost definitely 5.4% 12.5% 37.5% 37.5% 7.1%
2.473 Not too likely to not likely at all 6.4% 9.3% 33.5% 43.2% 7.6%
Going to a festival (when happening in the city) Somewhat likely to almost definitely 13.0% 36.4% 18.5% 15.2% 16.8%
11.174* Not too likely to not likely at all 11.0% 40.3% 20.8% 20.8% 7.2%
Visiting friendsSomewhat likely to almost definitely .0% 3.8% 32.1% 55.4% 8.7%
3.742 Not too likely to not likely at all 1.3% 2.1% 29.7% 57.2% 9.7%
Participating in Resident’s associationsSomewhat likely to almost definitely 50.0% 20.7% 10.3% 9.8% 9.2%
3.265 Not too likely to not likely at all 55.1% 19.5% 12.3% 6.4% 6.8%
Participating in Religious activitiesSomewhat likely to almost definitely 64.7% 24.5% 8.7% 2.2% 10.241* Not too likely to not likely at all 51.7% 27.5% 14.4% 6.4%
Participating in community workSomewhat likely to almost definitely 67.4% 22.8% 5.4% 2.7% 1.6%
11.338* Not too likely to not likely at all 55.1% 24.6% 14.4% 4.2% 1.7%
Participating in political activities (trade union, political party, etc) Somewhat likely to almost definitely 87.5% 8.2% 2.7% .0% 1.6% 6.700 Not too likely to not likely at all 87.7% 5.5% 2.1% 3.0% 1.7%
(df=4, N = 420), p< .05, ** p< .01
84
Respondents from both mobility subgroups almost equally, with little over 78%,
make excursions in parks or peripheral green areas at least once a month.
The Chi-square test shows significant variations between mobility subgroups for
observed and expected scores for variables: going to a museum and/or art gallery χ² (4,
n=420) = 13.813, p< .01, going to a night club χ² (4, n=420) = 8.707, p< .05, going to a
festival (when happening in the city) χ² (4, n=420) = 11.174, p< .05, participating in
religious activities χ² (4, n=420) = 10.241, p< .05, and participating in community work χ²
(4, n=420) = 11.338, p< .05. Respondents from the more mobile subgroups more often go to
a museum and/or art gallery, go to a night club and go to a festival (when happening in the
city), while respondents from the less mobile subgroup more often participate in religious
activities and in resident’s associations.
It draws our attention to the fact that nearly 90% of respondents from both mobility
subgroups never participate in political activities, and over 50% of all respondents almost
never participate in religious activities or community work.
Leisure amenities and likelihood of moving away
In the distributed questionnaire there were 13 independent variables relating to
satisfaction with leisure amenities offered in Banja Luka, with a scale of five choices: very
satisfied, satisfied, neither, dissatisfied, and very dissatisfied. For our analysis, we
aggregated scores of five into three choices: very satisfied to satisfied, neither, dissatisfied to
very dissatisfied. In that way we were able to use Chi-square to test the significance of the
relationship between the mobility of respondents and their satisfaction with leisure
amenities.
85
Results in Table 11 show that more than 50% of all respondents are very satisfied or
satisfied with the quality of public spaces (plazas, parks, etc), the quality and range of
restaurants, quality of bars and cafés, and quality of cinemas. Highest scores of very
satisfied to satisfied respondents are variable: with quality of cinemas, 63.0% of respondents
are from the more mobile, and 74.2% from the less mobile subgroup, while for the variable
quality of bars and cafés 46.7% of respondents from the more mobile, and 62.3% from the
less mobile subgroup are very satisfied to satisfied.
The largest percentage of dissatisfaction is recorded for the city architecture/relevant
monuments, with 60.3% respondents from the more mobile subgroup, and 39.8% of
respondents from the less mobile subgroup being dissatisfied to very dissatisfied.
Statistically confirmed differences between two mobility subgroups are identified for
observed and expected values for variables: quality of public spaces (plazas, parkas, etc) χ²
(2, n=420) = 12.621, p< .01, quality and range of art galleries/ museums χ² (2, n=420) =
9.096, p< .01, quality of bars and cafés χ² (2, n=420) = 10.295, p< .01, quality of cinemas χ²
(2, n=420) = 6.716, p< .05, quality of shopping areas χ² (2, n=420) = 10.108, p< .01,
architecture of city/relevant monuments χ² (2, n=420) = 17.437, p< .01, and quality and
range of fitness centers χ² (2, n=420) = 7.028, p< .05, with the more mobile subgroup being
in larger percentages dissatisfied to very dissatisfied.
86
Table 11: Satisfaction with leisure amenities and likelihood of moving away Likelihood of moving from Banja Luka in the next three years?
Dissatisfied to very
dissatisfied
Neither Very Satisfied to
satisfied
χ²
Quality of Public spaces (plazas, parkas, etc)
Somewhat likely to almost definitely 33.7% 25.5% 40.8% 12.621**
Not too likely to not likely at all 18.6% 29.2% 52.1%
Quality of sport facilities Somewhat likely to almost definitely 32.6% 48.4% 19.0%
3.705 Not too likely to not likely at all 24.2% 55.1% 20.8%
The quality and range of festival events and cultural activities Somewhat likely to almost definitely 31.5% 41.8% 26.6%
2.441 Not too likely to not likely at all 26.3% 40.7% 33.1%
The quality and range of art galleries / museums Somewhat likely to almost definitely 42.9% 39.1% 17.9%
9.096** Not too likely to not likely at all 28.8% 49.6% 21.6%
Quality and range of libraries Somewhat likely to almost definitely 29.3% 41.3% 29.3%
2.933 Not too likely to not likely at all 22.0% 45.8% 32.2%
Quality and range of restaurants Somewhat likely to almost definitely 12.5% 35.3% 52.2%
2.697 Not too likely to not likely at all 10.6% 29.2% 60.2%
Quality of bars and cafés Somewhat likely to almost definitely 20.1% 33.2% 46.7%
10.295** Not too likely to not likely at all 13.1% 24.6% 62.3%
Quality of cinemas Somewhat likely to almost definitely 14.1% 22.8% 63.0%
6.716* Not too likely to not likely at all 8.1% 17.8% 74.2%
Quality of shopping areas Somewhat likely to almost definitely 39.1% 32.6% 28.3%
10.108** Not too likely to not likely at all 29.7% 27.1% 43.2%
Architecture of city/relevant monuments Somewhat likely to almost definitely 60.3% 25.5% 14.1%
17.437** Not too likely to not likely at all 39.8% 37.7% 22.5%
Number of associations/ organizations for social activities Somewhat likely to almost definitely 42.4% 41.3% 16.3%
5.567 Not too likely to not likely at all 31.8% 51.7% 16.5%
Quality and range of fitness centers Somewhat likely to almost definitely 15.8% 47.8% 36.4%
7.028* Not too likely to not likely at all 8.1% 47.5% 44.5%
Quality and range of saunas, spa and wellness centres Somewhat likely to almost definitely 28.3% 54.3% 17.4%
5.172 Not too likely to not likely at all 24.2% 49.2% 26.7%
df = 2, N = 420, *p < .05, **p < .01
87
Public services and likelihood of moving away
When it comes to public services, results in Table 12 show that the highest
percentages of respondents, 85.9% from the more mobile, and 80.1% from the less mobile
subgroup, are dissatisfied to very dissatisfied with the number of bicycle lanes, while 82.6%
of respondents from the first, and 72.5% from the second subgroup are dissatisfied to very
dissatisfied with the quality of tourist attractions. High percentages of dissatisfied to very
dissatisfied responses are also recorded for social security (69.6% for the more, and 53.4%
for the less mobile subgroup), quality of health services (65.8%, and 50.8%), quality of the
university education (60.9%, and 45.3%), safety on the streets (56.0%, and 50.4%), police
services (57.6%, and 43.2%), the quality of the high school and elementary school education
(50.5%, and 39.4%), and municipal police services (46.7%, and 39.4%).
Statistical significance is confirmed by the Chi-square test for differences between
the more mobile subgroup and the less mobile subgroup regarding quality of the public
p< .01, number of bicycle lanes χ² (2, n=420) = 6.268, p< .05, quality of tourist attractions χ²
(2, n=420) = 7.216, p< .05, social security χ² (2, n=420) = 11.500, p< .01, quality of health
services χ² (2, n=420) = 9.969, p< .01, quality of university education χ² (2, n=420) =
15.219, p< .01, and quality of high school and elementary school education χ² (2, n=420) =
15.020, p< .01, with the more mobile subgroup being significantly more dissatisfied to very
dissatisfied with the public services offered in the city, than the less mobile subgroup.
88
Table 12: Satisfaction with public services and likelihood of moving away Likelihood of moving from Banja Luka in the next three years?
Dissatisfied to very dissatisfied
Neither Very Satisfied to satisfied
χ²
Quality of public transportation system Somewhat likely to almost definitely 34.2% 32.6% 33.2%
6.650* Not too likely to not likely at all 22.9% 37.7% 39.4%
Transport within the City – all types Somewhat likely to almost definitely 39.1% 32.6% 28.3%
4.118 Not too likely to not likely at all 30.9% 32.6% 36.4%
Connectivity between city & periphery Somewhat likely to almost definitely 33.2% 39.1% 27.7%
3.907 Not too likely to not likely at all 24.6% 42.4% 33.1%
Safety on the streets Somewhat likely to almost definitely 56.0% 19.0% 25.0%
4.998 Not too likely to not likely at all 50.4% 28.4% 21.2%
Police services Somewhat likely to almost definitely 57.6% 31.5% 10.9%
8.969** Not too likely to not likely at all 43.2% 39.8% 16.9%
Municipal police services Somewhat likely to almost definitely 46.7% 35.3% 17.9%
2.454 Not too likely to not likely at all 39.4% 38.6% 22.0%
Number of bicycle lanes Somewhat likely to almost definitely 85.9% 8.7% 5.4%
6.268* Not too likely to not likely at all 80.1% 16.5% 3.4%
Quality of tourist attractions Somewhat likely to almost definitely 82.6% 14.7% 2.7%
7.216* Not too likely to not likely at all 72.5% 20.3% 7.2%
Social security Somewhat likely to almost definitely 69.6% 23.9% 6.5%
11.500** Not too likely to not likely at all 53.4% 35.2% 11.4%
Quality of health services Somewhat likely to almost definitely 65.8% 27.2% 7.1%
9.969** Not too likely to not likely at all 50.8% 36.4% 12.7%
Quality of the university education Somewhat likely to almost definitely 60.9% 26.1% 13.0%
14.219** Not too likely to not likely at all 45.3% 28.0% 26.7%
Quality of the high school and elementary school education Somewhat likely to almost definitely 50.5% 33.2% 16.3%
14.020** Not too likely to not likely at all 39.4% 28.4% 32.2%
df= 2, N=420 *p<.05, **p<. 01
89
Environmental aspects and likelihood of moving away
Results in Table 13 show that the highest percentage of respondents, 75.5% from the
more mobile, and 75.4% from the less mobile subgroup, are dissatisfied to very dissatisfied
with the of use of bicycles as a means of transport, while 64.7% respondents from the first,
and 67.4% from the second subgroup are dissatisfied to very dissatisfied with tidiness and
cleanliness of rivers and river banks.
With regard to environmental aspects of the city, high percentages of dissatisfied to
very dissatisfied respondents are also recorded for the recycling collection services (65.8%
for the more, and 59.7% for the less mobile subgroup), traffic congestion (64.1% and
65.7%,), availability of parking space (59.2%, and 62.7%), quality of children’s playgrounds
(56.5%, and 56.8%), pavement condition of city streets and sidewalks (47.8%, and 44.9%),
and air pollution (47.3%, and 38.1%).
Statistically significant difference between mobility subgroups is recorded only for
tidiness and cleanliness of rivers and river banks, where the less mobile subgroup is more
dissatisfied with a state of riverbanks and cleanliness of rivers, χ² (2, n=420) = 5.841, p< .05.
90
Table 13: Satisfaction with environmental aspects and likelihood of moving away Likelihood of moving from Banja Luka in the next three years? Dissatisfied to
very dissatisfied Neither
Very Satisfied to satisfied
χ²
Pavement condition of city streets and sidewalks Somewhat likely to almost definitely 47.8% 22.8% 29.3%
.575 Not too likely to not likely at all 44.9% 25.8% 29.2%
Condition/cleanliness of city streets and sidewalks Somewhat likely to almost definitely 12.0% 15.8% 72.3%
.794 Not too likely to not likely at all 11.9% 19.1% 69.1%
Recycling collection services Somewhat likely to almost definitely 65.8% 20.7% 13.6%
2.170 Not too likely to not likely at all 59.7% 26.7% 13.6%
Quality of drinking water Somewhat likely to almost definitely 19.0% 26.1% 54.9%
5.317 Not too likely to not likely at all 13.1% 21.2% 65.7%
Garbage/waste collection Somewhat likely to almost definitely 8.7% 16.8% 74.5%
1.019 Not too likely to not likely at all 7.2% 20.3% 72.5%
Cleanliness of facilities in city parks Somewhat likely to almost definitely 6.0% 14.1% 79.9%
3.711 Not too likely to not likely at all 9.7% 18.2% 72.0%
Care of trees and city parks Somewhat likely to almost definitely 25.5% 22.8% 51.6%
5.711 Not too likely to not likely at all 16.1% 25.8% 58.1%
Traffic congestion Somewhat likely to almost definitely 64.1% 25.5% 10.3%
.112 Not too likely to not likely at all 65.7% 24.6% 9.7%
Availability of parking space Somewhat likely to almost definitely 59.2% 23.4% 17.4%
.780 Not too likely to not likely at all 62.7% 19.9% 17.4%
Levels of use of bicycles as a means of transport Somewhat likely to almost definitely 75.5% 16.3% 8.2%
3.569 Not too likely to not likely at all 75.4% 20.3% 4.2%
Levels of noise in the city Somewhat likely to almost definitely 35.9% 42.4% 21.7%
.197 Not too likely to not likely at all 37.7% 41.9% 20.3%
Air pollution Somewhat likely to almost definitely 47.3% 34.2% 18.5%
5.427 Not too likely to not likely at all 38.1% 45.3% 16.5%
Quality of children playgrounds Somewhat likely to almost definitely 56.5% 33.7% 9.8%
.585 Not too likely to not likely at all 56.8% 31.4% 11.9%
Tidiness and cleanliness of rivers and river banks Somewhat likely to almost definitely 64.7% 19.0% 16.3% 5.841* Not too likely to not likely at all 67.4% 23.7% 8.9% df= 2, N=420, *p<0.05
91
Issues of concern and likelihood of moving away
In the distributed questionnaire there were 26 independent variables relating to issues
of concern about societal and economic factors of the living environment, with a scale of
five choices: not worried at all, not worried, not particularly worried, somewhat worried, and
very worried. For our analysis, in order to use the Chi-square test to determine significance
in the relationship between mobility of respondents and their concern with the societal and
economic factors of the living environment, we aggregated answers from five to three
choices: not worried at all to not worried, not particularly worried, and somewhat worried to
very worried.
Generally speaking, results in Table 14 show that respondents from both mobility
subgroups are very much concerned about most of the issues regarding living in the city.
The highest rate was the somewhat worried to very worried category respondents gave to
availability of jobs, 94.6% from the more mobile, and 94.1% from the less mobile subgroup,
while 84.8% respondents from the first, and 77.5% from the second subgroup are somewhat
worried to very worried with the quality of university education.
Results demonstrate that, regarding issues of concern, high percentages of somewhat
worried to very worried respondents are also recorded for the quality of medical services
(85.9% for the more, and 77.1% for the less mobile subgroup), behavior of traffic
participants (81.5% for the more, and 78.4% for the less mobile subgroup), drug problems
(81% and 76,3%), aggressive/anti-social behavior (80.4%, and 76.3%), lack of bicycle lanes
(81.5%, and 72.9%), the quality of secondary and elementary education (78.3%, and
69.1%), lack of sidewalks (76.1%, and 69.9%), homelessness (70.1%, and 61.0%), illegal
92
construction (77.7%, and 55.9%), availability of recreation for children (67.4%, and 58.9%),
the quality of kindergartens (62.5%, and 61.0%), and air pollution (60.3%, and 57.2%).
Statistical significance is confirmed by the Chi-square test for differences between
the more mobile subgroup and the less mobile subgroup for issues of concern regarding:
illegal construction χ² (2, n=420) = 21.920, p< .01, availability of affordable housing χ² (2,
n=420) = 15.655, p< .01, availability of recreation for seniors χ² (2, n=420) = 11.039, p<
,01, availability of recreation for teenagers χ² (2, n=420) = 9.465, p< .01, appearance of
building facades and shop windows χ² (2, n=420) = 9.087, p< .01, lack of sidewalks χ² (2,
n=420) = 8.116, p< .05, maintenance of trees and green areas χ² (2, n=420) = 7.858, p< .05,
amount of graffiti χ² (2, n=420) = 7.227, p< .05, quality of medical services χ² (2, n=420) =
6.069, p< .05, with the more mobile subgroup being significantly more somewhat worried to
very worried, than the less mobile subgroup.
93
Table 14: Issues of concern and likelihood of moving away
Likelihood of moving from Banja Luka in the next three years?
Not worried at all to Not
worried
Not particularly
worried
Somewhat worried to
Very worried
χ²
Amount of crime in the city Somewhat likely to almost definitely 4.3% 17.4% 78.3%
.194 Not too likely to not likely at all 4.2% 19.1% 76.7%
Safety Somewhat likely to almost definitely 7.1% 19.6% 73.4%
4.335 Not too likely to not likely at all 8.5% 27.5% 64.0%
Availability of Recreation for teenagers Somewhat likely to almost definitely 9.8% 17.9% 72.3% 9.465** Not too likely to not likely at all 10.6% 30.5% 58.9%
Availability of Affordable Housing Somewhat likely to almost definitely 10.3% 14.7% 75.0%
15.655** Not too likely to not likely at all 12.3% 30.1% 57.6%
Availability of recreation for seniors Somewhat likely to almost definitely 8.7% 20.1% 71.2%
11.039** Not too likely to not likely at all 11.9% 32.6% 55.5%
Availability of jobs Somewhat likely to almost definitely 1.6% 3.8% 94.6%
.454 Not too likely to not likely at all 2.5% 3.4% 94.1%
Quality of university education Somewhat likely to almost definitely 5.4% 9.8% 84.8%
3.718 Not too likely to not likely at all 6.8% 15.7% 77.5%
Quality of secondary and elementary education Somewhat likely to almost definitely 7.1% 14.7% 78.3%
5.196 Not too likely to not likely at all 12.7% 18.2% 69.1%
Quality of kindergartens Somewhat likely to almost definitely 13.0% 24.5% 62.5%
.435 Not too likely to not likely at all 11.9% 27.1% 61.0%
Availability of public transportation Somewhat likely to almost definitely 17.9% 37.0% 45.1%
5.638 Not too likely to not likely at all 24.6% 41.1% 34.3%
Availability of recreation for children Somewhat likely to almost definitely 9.8% 22.8% 67.4%
5.113 Not too likely to not likely at all 16.9% 24.2% 58.9%
Amount of graffiti Somewhat likely to almost definitely 41.8% 32.1% 26.1%
7.227* Not too likely to not likely at all 33.1% 44.9% 22.0%
94
Table 14 (continued)
Drug problems Somewhat likely to almost definitely 8.2% 10.9% 81.0%
2.769 Not too likely to not likely at all 7.2% 16.5% 76.3%
Homelessness Somewhat likely to almost definitely 10.3% 19.6% 70.1%
3.767 Not too likely to not likely at all 13.1% 25.8% 61.0%
Aggressive/anti-social behaviour Somewhat likely to almost definitely 6.5% 13.0% 80.4%
1.486 Not too likely to not likely at all 6.4% 17.4% 76.3%
Prostitution on streets Somewhat likely to almost definitely 23.4% 38.0% 38.6%
.491 Not too likely to not likely at all 26.3% 37.3% 36.4%
Behavior of traffic participants Somewhat likely to almost definitely 5.4% 13.0% 81.5%
.987 Not too likely to not likely at all 5.1% 16.5% 78.4%
Air pollution Somewhat likely to almost definitely 12.0% 27.7% 60.3%
1.601 Not too likely to not likely at all 9.7% 33.1% 57.2%
Maintenance of trees and green areas Somewhat likely to almost definitely 23.4% 29.9% 46.7%
7.858* Not too likely to not likely at all 27.1% 39.4% 33.5%
Demonstrations in the streets Somewhat likely to almost definitely 40.8% 41.3% 17.9%
1.143 Not too likely to not likely at all 44.5% 41.1% 14.4%
Illegal construction Somewhat likely to almost definitely 6.5% 15.8% 77.7% 21.920**
Cramer’s
V =0.228 Not too likely to not likely at all 14.8% 29.2% 55.9%
Lack of bicycle lanes Somewhat likely to almost definitely 6.5% 12.0% 81.5%
4.809 Not too likely to not likely at all 7.6% 19.5% 72.9%
Lack of sidewalks Somewhat likely to almost definitely 4.3% 19.6% 76.1%
8.116* Not too likely to not likely at all 12.3% 17.8% 69.9%
Quality of medical services Somewhat likely to almost definitely 4.3% 9.8% 85.9%
6.069* Not too likely to not likely at all 4.7% 18.2% 77.1%
Presence of smugglers, dealers Somewhat likely to almost definitely 18.5% 31.5% 50.0%
4.964 Not too likely to not likely at all 16.9% 41.9% 41.1%
Appearance of building facades and shop windows Somewhat likely to almost definitely 9.2% 25.5% 65.2%
9.087** Not too likely to not likely at all 15.3% 33.9% 50.8% df= 2, N=420, *p< .05, **p< .01
95
Cost of living and likelihood of moving away
In the distributed questionnaire there were 6 independent variables relating to cost of
living in Banja Luka with a scale of five choices: very expensive, expensive, average, cheap,
and very cheap. For our analysis, we aggregated scores of five choices into three: cheap to
very cheap, average, and very expensive to expensive.
Results in Table 15 show that the overall perception of all respondents is that Banja
Luka is either a very expensive or expensive city for all basic facilities and services listed. It
is remarkable that for the variable general cost of living not a single respondent from either
mobility subgroup choose the option cheap to very cheap.
The highest proportion of respondents, 97.3% from the more mobile, and 92.4% from
the less mobile subgroup, perceives housing cost (mortgage, rent) to be very expensive to
expensive, while 94% of respondents from the first, and 82.2% from the second mobility
subgroup perceives general cost of living to be very expensive to expensive.
Regarding costs of living in the city, other costs are also perceived to be very
expensive to expensive: cost of food and beverages (basic consumables)(86.4% for the
more, and 75% for the less mobile subgroup), cost of basic services related to the house
(water, electricity) (84.2%, and 78%), cost of leisure activities (63%, and 53.8%), cost of
education and training (59.8, and 47%), and transportation costs (54.3%, and 36.9%).
96
Table 15: Cost of living and likelihood of moving away Likelihood of moving from Banja Luka in the next three years?
Cheap to very
cheap
Average Very expensive
to expensive
χ²
Housing cost (mortgage, rent)
Somewhat likely to almost definitely 0% 2.7% 97.3%
Not too likely to not likely at all .4% 7.2% 92.4%
Cost of basic services related to the house (water, electricity) Somewhat likely to almost definitely .5% 15.2% 84.2%
Not too likely to not likely at all 3.0% 19.1% 78.0%
Cost of leisure activities Somewhat likely to almost definitely 1.6% 35.3% 63.0%
4.954 Not too likely to not likely at all 4.2% 41.9% 53.8%
Costs of education and training Somewhat likely to almost definitely 6.0% 34.2% 59.8%
6.862* Not too likely to not likely at all 8.9% 44.1% 47.0%
Transportation costs Somewhat likely to almost definitely 2.7% 42.9% 54.3%
12.956**
Not too likely to not likely at all 4.7% 58.5% 36.9%
Cost of food and beverages (basic consumables) Somewhat likely to almost definitely .5% 13.0% 86.4%
Not too likely to not likely at all .8% 24.2% 75.0%
General Cost of Living Somewhat likely to almost definitely 0% 6.0% 94.0%
13.096**
Not too likely to not likely at all 0% 17.8% 82.2%
df= 2, N=420, *p<.05, **p<.01
Results show that the more mobile subgroup perceives certain costs of living higher
than the less mobile subgroup. Statistical significance is confirmed for variables: costs of
education and training χ² (2, n=420) = 6.862, p< .05, transportation costs χ² (2, n=520) =
12.956, p< .01, and general cost of living χ² (2, n=420) = 13.096, p< .01, with the more
mobile subgroup perceiving those costs very expensive to expensive in larger percentages.
The most striking result is that not one respondent from the more mobile subgroup
perceives housing costs as being cheap or very cheap, and that 94% of respondents who are
97
somewhat likely to almost definitely to move away from Banja Luka considering them as
being very expensive to expensive.
Tolerance and likelihood of moving away
In the distributed questionnaire there were 5 independent variables relating to issues
of tolerance, with a scale of five choices: strongly agree, agree, neither, agree, and strongly
disagree. For our analysis, we aggregated scores of five choices into three: strongly
disagree/disagree, neither, and agree/strongly agree.
The results for the total sample, Table 16, show that 67.4% of respondents from the
more mobile subgroup, and 61.4% from the less mobile subgroup, strongly disagree to
disagree that the city accepts the gay population, and 55.4% from the more, and 54.7 from
the less mobile subgroup of respondents strongly disagree to disagree that the city accepts
the minority religious and ideological groups.
There is a significant difference in responses between members of the more and less
mobile subgroups for three variables: agreeing that city is welcoming place to people from
other countries, agreeing that the city accepts all ethnic groups, and agreeing that the city
accepts the differences between rich and poor. Respondents whose answers were somewhat
likely to almost definitely to move away from Banja Luka in the next three years also
significantly more disagree and strongly disagree in respect to statements of tolerance of the
city.
98
Table 16: Tolerance and likelihood of moving away Agreeing with statements
regarding issues of tolerance
Likelihood of moving from Banja Luka in the next three years?
Strongly Disagree/ Disagree
Neither Agree/ Strongly
Agree
χ²
Agreeing that city is welcoming place to people from other countries
Somewhat likely to almost definitely 19.0% 20.7% 60.3% 11.658**Not too likely to not likely at all 8.1% 20.3% 71.6%
Agreeing that the city accepts all ethnic groups
Somewhat likely to almost definitely 37.0% 29.3% 33.7% 8.981** Not too likely to not likely at all 23.7% 33.1% 43.2%
Agreeing that the city accepts the gay population
Somewhat likely to almost definitely 67.4% 26.6% 6.0% 1.603 Not too likely to not likely at all 61.4% 31.8% 6.8%
Agreeing that the city accepts the minority religious and ideological groups
Somewhat likely to almost definitely 55.4% 32.6% 12.0% 1.986 Not too likely to not likely at all 54.7% 28.8% 16.5%
Agreeing that the city accepts the differences between rich and poor
Somewhat likely to almost definitely 51.1% 28.8% 20.1% 11.971**Not too likely to not likely at all 34.3% 38.1% 27.5%
df = 2, N= 420, *p< 0,05, **p< 0,01
4.2.5. Basic employment features of the sample
Results in Table 17 show basic characteristics of our sample in response to their
status, category, and employment sector. Because of high levels of unemployment in BiH,
we introduced a status unemployed creative and knowledge workers, i.e. respondents who
are temporary out of work, but have experience in one of these sectors.
99
Table 17: Status, employer`s category, and employment sector Employment status Response
Government / state-owned company 36.2% 136 Privately owned company 32.7% 123 NGO (non-governmental organizations) 12.8% 48 Owner/ partner in the company 2.9% 11 Freelance / contract work 8.5% 32 Student 6.9% 26
answered question 376 skipped question 44
Employment sector
Answer Options Response Percent
Response Count
creative workers
Marketing and PR, advertising 7.9% 33 Architecture 3.3% 14 Art galleries, dealers in arts and antiques 0.5% 2 Arts: music, fine art, literature, theatre 4.5% 19 Design, applied arts 4.8% 20 Creative crafts 0.7% 3 Newspapers, printed media / publishing, books, web 6.4% 27 Video, film, photography 1.0% 4 Music production 0.7% 3 TV and radio 2.1% 9 ICT (Information and communication tech.) - software 4.3% 18 TOTAL CREATIVE 152
knowledge workers
ICT (Information and communication tech.) - hardware 0.5% 2 Financial intermediaries 10.5% 44 Legal and other business services 10.0% 42 Management, consulting 15.5% 65 New product development 0.7% 3 Engineering, new technologies, processes, R&D 15.5% 65 College, university and HE teaching professionals 11.2% 47 TOTAL KNOWLEDGE 268
Data demonstrates that their category of employment significantly impacts the
mobility of our respondents, χ² (5, n=420) = 13.503, p< .05. Results show that 43% of
respondents from the less mobile subgroup, and 26.5% of respondents from the more mobile
subgroup work for state-owned companies/ government, 34.8% of respondents from the
more mobile, and 31.2% from the less mobile work for private companies, 16.1% from the
first, and 10.4% from the second work in the NGO sector, 2.6% of respondents from the
103
more mobile and 3.2% from the less mobile subgroup are owners/co-owners of companies,
11.6% of respondents from the more mobile group, and 5.9% from the less mobile
subgroup do freelance/contract work. There are also 8.4% of respondents in the more
mobile, and 5.9% in the less mobile subgroup who are students.
Employment satisfaction and likelihood of moving away
In the distributed questionnaire there were 15 independent variables relating to job
satisfaction, with answers on a scale of five: very satisfied, satisfied, neither, dissatisfied,
and very dissatisfied. For our analysis, we reduced the number of variables to 12, and
aggregated scores of five into three choices: very satisfied to satisfied, neither, dissatisfied to
very dissatisfied. We use the Chi-square to test the significance of differences between
observed and expected response values for each variable.
Results from Table 19 show that the highest percentage of respondents from both
mobility subgroups are almost equally (25.7% from the more, and 24.0% from the less
mobile subgroup) dissatisfied to very dissatisfied with training they receive. Results also
show that most of respondents (70.9% from the more, and 73.9% from the less mobile
subgroup) are very satisfied to satisfied with the friendliness of the work environment,
69,3% from the more, and 75.5% from the less mobile subgroup are very satisfied to
satisfied with the facilities in the workplace, as well as with the intellectually stimulating
aspect of their job (64.3% from the first, and 69.1% from the second mobility subgroup),
the amount of holiday time/paid leave (59.7%, and 74.0%), the sense of achievement they
get from their work (56.7%, and 64.7%), the scope for using their own initiative (58.2%, and
61.0%), the amount of influence they have over their job (56.7%, and 64.7%), the training
104
they receive (51.4%, and 42.6%), the amount of pay they receive (46.8%, and 53.9%), the
ability to meet and network with professionals from the same field (61.0%, and 57.8%), the
ability to balance their professional and personal (family, friends) life (54.6%, and 64.7%),
job security (43.6%, and 60.5%)
Table 19: Employment satisfaction and likelihood of moving away
How satisfied are you with the following aspects of your job?
Likelihood of moving from Banja Luka in the next three years?
Dissatisfied to very
dissatisfied
Neither Satisfied to very
satisfied
χ²
The sense of achievement you get from your work Somewhat likely to almost definitely 20.6% 22.7% 56.7%
9.779** Not too likely to not likely at all 8.8% 26.5% 64.7%
The scope for using your own initiative Somewhat likely to almost definitely 24.1% 17.7% 58.2%
11.061** Not too likely to not likely at all 11.7% 27.3% 61.0%
The amount of influence you have over your job Somewhat likely to almost definitely 20.6% 22.7% 56.7%
9.779** Not too likely to not likely at all 8.8% 26.5% 64.7%
The facilities in the workplace Somewhat likely to almost definitely 15.0% 15.7% 69.3%
3.232 Not too likely to not likely at all 8.8% 15.7% 75.5%
The intellectually stimulating aspect of your job Somewhat likely to almost definitely 15.0% 20.7% 64.3%
3.757 Not too likely to not likely at all 8.3% 22.5% 69.1%
The friendliness of the work environment Somewhat likely to almost definitely 14.9% 14.2% 70.9%
3.946 Not too likely to not likely at all 8.4% 17.7% 73.9%
The training you receive Somewhat likely to almost definitely 25.7% 22.9% 51.4%
4.616 Not too likely to not likely at all 24.0% 33.3% 42.6%
The amount of pay you receive Somewhat likely to almost definitely 30.5% 22.7% 46.8%
5.412 Not too likely to not likely at all 19.6% 26.5% 53.9%
The amount of holiday time/paid leave Somewhat likely to almost definitely 19.4% 20.9% 59.7% 9.069**
Not too likely to not likely at all 9.8% 16.2% 74.0% Job security
Somewhat likely to almost definitely 30.7% 25.7% 43.6% 12.657**
Not too likely to not likely at all 16.0% 23.5% 60.5% The ability to balance your professional and personal (family, friends) life
Somewhat likely to almost definitely 26.2% 19.1% 54.6% 7.858* Not too likely to not likely at all 14.2% 21.1% 64.7%
Ability to meet and network with professionals from the same field Somewhat likely to almost definitely 19.9% 19.1% 61.0%
8.695* Not too likely to not likely at all 11.3% 30.9% 57.8% df = 2, N = 345, * p < .05, ** p < .01
105
However, despite high scores for job satisfaction for both mobility subgroups, results
show that significant variations exist for mobility subgroups in regard to variables: job
security χ² (2, n=345) = 12.657, p< .01, the scope for using their own initiative χ² (2, n=345)
= 11.061, p< .01, the sense of achievement they get from their work χ² (2, n=345) = 9.779,
p< .01, the amount of influence they have over the job χ² (2, n=345) = 9.779, p< .01, the
amount of holiday time/paid leave χ² (2, n=345) = 9.069, p< .01, the ability to meet and
network with professionals from the same field χ² (2, n=345) = 8.695, p< .05, and ability to
balance their professional and personal (family, friends) life χ² (2, n=345) = 7.858, p< .05.
4.2.7. Work related factors and likelihood of changing the place of work
Results in this section evaluate differences between two employees’ subgroups in
regard to employment-related variables: those respondents who expect to leave the
company/organization in less than 3 years, and respondents who expect to stay in the
company/organization for more than 3 years,
Age, monthly wages, workweek hours, having a second job
Results in Table 20 show that the age of respondents does not significantly affect
variations between observed and expected values in terms of the likelihood of leaving the
company/organization in the next 3 years.
Wages for respondents who expect to stay less than 3 years in the
company/organization and those who expect to stay in the company for more than 3 years do
106
not vary significantly. It is notable that even for wages lower than 999KM results between
employee’s subgroups do not vary much (29.3% and 28.2%).
Results show that no significant difference is confirmed between employee’s
subgroups in relation to a number of workweek hours. Also, differences between
employee’s subgroups for having a second job are not significant.
Table 20: Age, monthly wages, workweek hours, having second job and likelihood of changing the place of work in the next 3 years
Age How long do you expect to remain in the company?
Less than 24
25-34 35-44 More than 45
χ²
Less than 3 years 5.1% 62.6% 26.3% 6.1% 100.0%
2.917 More than 3 years 3.2% 55.6% 35.1% 6.0% 100.0%
Total 3.7% 57.6% 32.6% 6.1% 100.0%
df = 3, N = 347, p not significant
Monthly wages How long do you expect to remain in the company?
Less than 999 KM
1.000 – 1.999KM
2.000 – 2.999 KM
More than
3.000 KM
χ²
Less than 3 years 29.3% 45.5% 10.1% 15.2% 0.549
More than 3 years 28.2% 49.6% 9.3% 12.9% Total 28.5% 48.4% 9.5% 13.5% df = 3, N = 347, p not significant
Workweek hours How long do you expect to remain in the company?
Less than 20 hours
per week
21 - 30
31 - 42
43 - 55
More than 55
hours per week
Varies from week
to week
χ²
Less than 3 years 2.0% 11.2% 43.9% 26.5% 10.2% 6.1% 5.60
More than 3 years 6.4% 8.1% 45.3% 25.8% 5.9% 8.5% Total 5.1% 9.0% 44.9% 26.0% 7.2% 7.8% N= 334, df = 1, p not significant Having a second job How long do you expect to remain in the company?
With second
job
Without second
job
χ²
Less than 3 years 36.4% 63.6% 1.80
More than 3 years 29.0% 71.0% Total 31.1% 68.9% N= 344, df = 1, p not significant
107
Sector, category of employer, and status of employment
Results in Table 21 show that a higher percentage of respondents in creative jobs are
expecting to remain in the company for less than 3 years, and confirmed by the Chi-square
test χ² (1, n=347) = 3.674, p< .05.
Table 21: Sector, category, and status of employment and likelihood of changing the place of work Employment sector
How long do you expect to remain in the company?
creative jobs
knowledge jobs
χ²
Less than 3 years 44.4% 55.6% 3.674*
More than 3 years 33.5% 66.5% Total 36.6% 63.4% df = 1, N = 347, *p < .05 Employer`s category How long do you expect to remain in the company?
Government / state-owned
company
Privately owned
company
NGO (non-governmental organizations)
Freelance / contract
work
χ²
Less than 3 years 24.7% 47.4% 20.6% 7.2% 17.219**
More than 3 years 47.8% 32.6% 11.3% 8.3% Total 41.0% 37.0% 14.1% 8.0% df = 3, N = 327, **p< .01
Employment status
How long do you expect to remain in the company?
Employed Self-employed/ freelance
χ²
Less than 3 years 88.8% 11.2% 0.031
More than 3 years 89.4% 10.6% Total 89.2% 10.8% df = 1, N= 344, p not significant
With regard to category of employer, in the distributed questionnaire we had
governmental organizations), owner/ partner in the company, freelance/contract work, and
student. We kept only four categories (government / state-owned company, privately owned
company, NGO (non-governmental organizations), and freelance/contract work) in order to
use the Chi-square test. Results show significant variation in respondents expectation of how
long they expect to remain in the company, χ² (1, n=327) = 17.219, p< .01 in terms of
108
category of employer, where less mobile employees more often have the state as an
employer, while more mobile workers are more often freelancers or work for privately
owned companies. In respect to status of employment, differences between employee’s
subgroups for observed and expected values are not confirmed by the Chi-square test.
The main reasons for changing the place of work
Results in Table 22 show the answers of respondents who expect to remain in the
company for less than 1 year. Respondents chose 2 answers among 8 available, where
reasons were ranked 1 and 2, with number 1 being more important, and reason 2 less
important. We converted values for our calculations, giving value 2 to the previous value 1,
value 1 to the previous value 2.
Table 22: The main reasons for changing the place of work If you expect to leave the company/organization in the next year what are the main 2 reasons in order of priority?
To seek a more interesting job 85 1 1 2 131 1.54 .054 .501 .251 25.10
To seek better conditions
70 1 1 2 105 1.50 .060 .504 .254 20.11
To seek a less stressful job 49 1 1 2 68 1.39 .070 .492 .242 13.03
My work contract will be over 0
I am moving out of Banja Luka
0
I am leaving the country
0
* 1 - less important (minimal value on the scale 1 to 2), ** 2 – more important (maximal value on the scale 1 to 2), N Number of respondents who choose a given variable on a scale 1 to 2
109
Results show that to seek better pay is the highest ranked reason why respondents
expect to change the place of work in the next year, with 41.76% of the total sum of scores.
Environmental and intrinsic aspects of work: to seek a more interesting job, to seek better
conditions, and to seek a less stressful job are a significant factor for respondents who
expect to leave the company in the next year, adding up to 58.24% of the total sum of
scores.
Employment satisfaction and likelihood of leaving the company
In the distributed questionnaire, there were 15 independent variables relating to job
satisfaction, with answers on a scale of five: very satisfied, satisfied, neither, dissatisfied,
and very dissatisfied. In Table 23, we aggregated scores of five into three choices: very
satisfied to satisfied, neither, dissatisfied to very dissatisfied. We used the Chi-square test to
check the significance of variation between expected and observed values between
employee’s subgroups for 15 economic and social variables.
Results show that most respondents (74.7% from the more, and 72.4% from the less
mobile employees’ subgroups) are very satisfied to satisfied with the quality of the working
environment (appearance, air-conditioning, toilets), 69.7% from the more, and 74.1% from
the less mobile employees’ subgroup are very satisfied to satisfied with the friendliness of
the working environment, as well as with the facilities in the workplace (67.7% from the
first, and 67.1% from the second employees’ subgroup), respect for the rights of employees
(vacation, sick leave, overtime, etc.) (60.6%, and 73.8%), the amount of holiday time/paid
leave (61.2%, and 71.2%), the amount of influence they have over their job (57.6%, and
63.1%), and the sense of achievement they get from their work (57.6%, and 63.1%).
110
Table 23: Employment satisfaction and likelihood of leaving the company How long do you
expect to remain in the company?
Dissatisfied to very
dissatisfied
Neither satisfied or dissatisfied
Satisfied to very
satisfied
χ² N
The sense of achievement you get from your work Less than 3 years 22.2% 20.2% 57.6%
8.901** 343 More than 3 years 10.2% 26.6% 63.1%
The scope for using your own initiative Less than 3 years 22.2% 22.2% 55.6%
3.172 343 More than 3 years 14.3% 23.8% 61.9%
The amount of influence you have over your job Less than 3 years 22.2% 20.2% 57.6%
8.901** 343 More than 3 years 10.2% 26.6% 63.1% The quality of the working environment (appearance, air-conditioning, toilets)
Less than 3 years 12.1% 13.1% 74.7% 0.803 342
More than 3 years 10.7% 16.9% 72.4% The facilities in the workplace
Less than 3 years 13.1% 19.2% 67.7% 1.169 342
More than 3 years 9.9% 23.0% 67.1% The intellectually stimulating aspect of your job
Less than 3 years 30.3% 17.2% 52.5% 17.262** Cramer's V = 0.223
342 More than 3 years 11.9% 26.3% 61.7%
The friendliness of the working environment Less than 3 years 17.2% 13.1% 69.7%
5.545 342 More than 3 years 8.6% 17.3% 74.1%
The training you receive Less than 3 years 30.3% 29.3% 40.4%
2.883 342 More than 3 years 22.2% 29.2% 48.6%
The amount of pay you receive Less than 3 years 28.3% 21.2% 50.5%
2.129 343 More than 3 years 21.7% 26.6% 51.6%
The amount of holiday time/paid leave Less than 3 years 20.4% 18.4% 61.2%
5.898 341 More than 3 years 10.7% 18.1% 71.2%
Your job security Less than 3 years 31.6% 26.5% 41.8%
9.735** 338 More than 3 years 17.9% 23.8% 58.3%
The ability to balance your professional and personal (family, friends) life Less than 3 years 30.3% 21.2% 48.5%
12.323** 343 More than 3 years 14.8% 19.7% 65.6%
Ability to meet and network with professionals from your same field Less than 3 years 20.2% 24.2% 55.6%
3.451 343 More than 3 years 12.3% 27.0% 60.7%
Respect for the rights of employees (vacation, sick leave, overtime, etc.) Less than 3 years 24.2% 15.2% 60.6%
15.122** 343 More than 3 years 8.6% 17.6% 73.8%
Overall satisfaction with the job Less than 3 years 21.2% 26.3% 52.5%
17.124** 342 More than 3 years 7.0% 21.8% 71.2% df=4, N varies, **p<0.001
111
Regarding the scope for using their own initiative, 55.6% respondents from the more,
and 61.9% from the less mobile employees’ subgroup consider to be very satisfied to
satisfied, 55.6% from the more, and 60.7% from the less mobile employees’ subgroup are
very satisfied to satisfied with the ability to meet and network with professionals from the
same field, the intellectually stimulating aspect of the job (52.5%, and 61.7%), the amount
of pay they receive (50.5%, and 51.6%), the ability to balance their professional and
personal (family, friends) life (48.5%, and 65.6%), the job security (41.8%, and 58.3%), the
training they receive (40.4%, and 48.6%). Regarding the overall satisfaction with the job,
52.5% of respondents from the more, and 71.2% from the less mobile employees’ subgroup
are, overall, very satisfied to satisfied with their job.
However, despite high scores for job satisfaction for both mobility subgroups in the
very satisfied to satisfied domain, results of the Chi-square test show that significant
variation exists between employees’ subgroups in regard to overall satisfaction with the job,
χ² (4, n=342) = 17.124, p< .01, and for the variables: the intellectually stimulating aspect of
the job, χ² (4, n=342) = 17.262, p< .01, and Cramer's V = 0.223, respect for the rights of
employees (vacation, sick leave, overtime, etc.) χ² (4, n=343) = 15.122, p< ,01, the ability to
balance their professional and personal (family, friends) life χ² (4, n=343) = 12.323, p< .01,
job security χ² (2, n=338) = 9.735, p< .01, the amount of influence they have over the job χ²
(4, n=343) = 8.901, p< .01, and the sense of achievement they get from their work χ² (4,
n=343) = 8.901, p< .01.
Other employment factors: the scope for using your own initiative, the quality of the
working environment (appearance, air-conditioning, toilets), the facilities in the workplace,
the friendliness of the working environment, the training you receive, the amount of pay you
112
receive, the amount of holiday time/paid leave, and ability to meet and network with
professionals from the same field, are not significant in the context of how long respondents
expect to remain in the company.
4.3. Factor analysis and binary logistic regression
We divided issues of concern listed in Table 14 (Issues of concern and likelihood of
moving away) into two groups of factors, cultural/societal factors, which represent social
milieu of the city, and economic factors, which are more directly influenced by the amount
of public funding. We use factor analysis and binary regression analysis in order to
determine which factors, economic or cultural/societal, in terms of issues of concern shown
in the table, most significantly impact the respondent`s decision to move away from Banja
Luka in the next three years.
Binary logistic regression analysis is used for one categorical dependent variable, and
seven continuous independent variables - predictors (seven linear combinations that we get
after the factor analysis). In this way, we are able to predict whether the probability of the
dependent variable is the function of independent variables.
113
Cultural/Societal Factors:
1. Amount of crime in the city
2. Safety
3. Amount of graffiti
4. Drug problems
5. Homelessness
6. Aggressive/anti-social behavior
7. Prostitution on streets
8. Behavior of traffic participants
9. Air pollution
10. Demonstrations in the streets
11. Illegal construction
12. Presence of smugglers, dealers
13. Appearance of building facades and
shop windows
Economic factors:
1. Availability of jobs
2. Availability of recreation for teenagers
3. Availability of affordable housing
4. Availability of recreation for seniors
5. Quality of university education
6. Quality of secondary and elementary
education
7. Quality of kindergartens
8. Availability of public transportation
9. Availability of recreation for children
10. Maintenance of trees and green areas
11. Lack of bicycle lanes
12. Lack of sidewalks
13. Quality of medical services
Results in Table 24 show that Bartlett's Test for the null hypothesis (correlations
between variables equal to zero) is significant for given variables, therefore we proceed
to extract factors which encompass independent variables.
Table 24: Bartlett's Test Bartlett's Test
Bartlett's Test of Sphericity Approx. Chi-
Square
4058.725
df 325
Sig. .000
114
Table 25 displays communalities matrix data, with the amount of variability
explained by the specific factors of the original variables (column Extraction).
Table 25: Communalities
Communalities
Initial Extraction
Amount of crime in the city 1,000 .807
Safety 1.000 .819
Availability of recreation for teenagers 1.000 .703
Availability of affordable Housing 1.000 .569
Availability of recreation for seniors 1.000 .704
Availability of jobs 1.000 .596
Quality of university education 1.000 .743
Quality of secondary and elementary education
1.000 .763
Quality of kindergartens 1.000 .598
Availability of public transportation 1.000 .446
Availability of recreation for children 1.000 .652
Amount of graffiti 1.000 .525
Drug problems 1.000 .574
Homelessness 1.000 .613
Aggressive/anti-social behavior 1.000 .565
Prostitution on streets 1.000 .690
Behavior of traffic participants 1.000 .565
Air pollution 1.000 .512
Maintenance of trees and green areas 1.000 .453
Demonstrations in the streets 1.000 .605
Illegal construction 1.000 .601
Lack of bicycle lanes 1.000 .675
Lack of sidewalks 1.000 .712
Quality of medical services 1.000 .487
Presence of smugglers, dealers 1.000 .579
Appearance of building facades and shop windows
1.000 .612
Extraction Method: Principal Component Analysis.
Results in Table 26 show components 1 to 7 that can be considered for future
analysis. The first three columns (Initial Eigenvalues are data for all factors, and in the
other three (Extraction Sums of Squared loadings) are data for those factors that meet the
115
criteria to be retained. The first factor explains almost 28% of the total variability of all
26 original variables, the other 9%, and so on. Important information is that all seven
factors explain about 62% of the total variability.
Table 26: Total Variance Explained Total Variance Explained
Comp-onent
Initial Eigenvalues Extraction Sums of Squared Loadings
Seven factors shown in Table 27 correlate to specific independent variables.
Therefore, we find that individual factors are mostly correlated with:
Factor 1 (Fac1_antisocial) with: drug problems, homelessness, prostitution on streets
Factor 2 (Fac2_recreation): availability of recreation for teenagers, availability of recreation for seniors
Factor 3 (Fac3_education): quality of university education, quality of secondary and elementary education
116
Factor 4 (Fac4_cycling&walking ): lack of bicycle lanes, lack of sidewalks Factor 5 (Fac5_revolt): amount of graffiti, demonstrations in the streets Factor 6 (Fac6_safety): amount of crime in the city, safety Factor 7 (Fac7_architecture): illegal construction, appearance of building facades
of life, activities leisure, culture, sub-culture)
9. Plans for the future
We interviewed entrepreneurs from small companies with fewer than 10
employees, since those companies are not under state patronage or running exclusively
on the state funded projects. Also, all these companies are working in the knowledge and
creative industry, not as an additional business activity, but as their primary objective.
Interviewee`s role in the company
All interviewees are owners and CEOs of their companies, and beside their
management role they are actively involved in day to day business activities.
“My role in the company, I am the director, and besides fulfilling those legal duties and jobs of a director, of a private company, of a LTD company in our country, I, in principle, coordinate all those things, from bookkeeping, legal affairs, strategic decisions, agreements and negotiations of a future existence, i.e. financial existence of the company.”
The company working in the cultural sector is facing a problem of retaining its
human capital base. It is said that after cultural workers reach certain age, when they
think of starting a family, getting their first property, etc., they start thinking of moving
from the creative, to some other, more profitable, industries.
119
“I am the director of the company...and at the moment I am the single owner...that is...I would call it a one man show, although it is not like that.. I think when you come to an age, for example, the beginning of thirties, or even earlier, and when you really start to deal with existential issues, at that time you leave this job. It's the only real reason why this is happening...But generally, that existential moment that occurs as a light bulb, starts to dissipate a moment of enthusiasm which had hitherto functioned and dominated, and they leave the sphere of cultural workers and become employees of the state administration, other private companies, or establish their other jobs where the money, wages at the end, are more solid.”
History and business of the company
All the companies in question are less than five years old. This is not unusual for
knowledge and creative companies, considering that those industries are quite new in the
SEE region, especially in countries of the ex-SFRY. These companies have mostly
started as an initiative of several people focused on a common objective.
“(The company) was established about one and a half years ago. Although, we are relatively young company, all the people, our team which has got together, got together from the project... was initially created as a company which will be technical support, in a sense of creation of texts, multimedia content for portal, e-portal, internet portal.”
“Characteristics of our company is that we are registered for research in technical and technological sciences, the goal ... was to transform one patent, one good idea into industrial product ...and at the end, from a small idea, a small family who was dealing with innovation, myself... to make a company.”
Those companies are still trying to position themselves on the market, and focus
their activities on several major projects. Entrepreneurs we interviewed employ less than
ten people, whereas one company, from the creative sector, is formally a one-man band,
employing temporary staff and freelancers on a project basis.
120
“At one point, when we founded the company...three of us founded the company...but in the meantime, people, very realistically and rationally, found another job and funded a ....that has a real income and that, when you draw the line at the end of the day, can feed their families...they got out of the company...“
Clients and business locations
All companies involved in the interviews are working for domestic and foreign
clients from private and state sectors, and state and private funds.
“Well, we have three types of clients. The first type are foreign, those are all commercial, mainly we work for foreign, 60% of the company business is for foreign clients, via the Internet, second type is local, commercial part, which we do sporadically, depending from projects. The third part is local, but of a non-commercial nature.”
“...the donor was (name of the country) government, which means, they were our direct client. Considering that the implementer was...nongovernmental organization, so some of the money was coming from that side.”
One of those companies, working in the art sector, also works for individual artists
who require a place where they can cooperate with others and generate new ideas.
“When I say clients, my clients are...they, essentially, find the company as a place where they can generate, where they can execute their ideas, and it is so, so it is envisaged.”
Cooperation with other organizations / companies
Interviewed entrepreneurs prefer working with local partners, organizations, and
freelancers if they can meet their business demands. The reasons for this are diverse, such
as convenience, local patriotism, etc., and interviewees state that they wish to form
business and support clusters within the local community.
121
“Art demands outsourcing of many other people...and I can name many of them, who are the company, but they are not on the paper undersigned... They are all from Banja Luka, there are few of them from Laktaši... we are trying to make a team with whom we are going to grow and to identify ourselves... the team that works within the company, or with the company, or besides the company, someone who is from Banja Luka, because it is common early days, some common point...but the bottom line is that it is most comfortable to work with people who are local... we build our own capacities...local network.”
“(Freelancers) are mainly from here, very rarely from abroad, very rarely via the Internet. Because, mainly, those things that need to be done can be completed here, and I try, if there are two same or similar to give an advantage to someone here, it is rare that we look for someone over the Internet.”
Interviewees are actively working on the expansion of their B2B24 network, trying
to educate and encourage people to join them in their line of work.
“I want to infect as many people as possible with animation, and I want to transfer that knowledge to them, because if they develop, I develop with them.”
“We had, with many companies from (the center), who are tenants of (the centre), we had before, and have now, cooperation, we work on joint projects, what is one of benefits of (the centre), networking, outsourcing. “
Links with institutions, agencies and institutions
According to the interviewees, links with educational institutions, municipal and
state agencies and institutions are usually good, but not very supportive in terms of their
requirements for human capital.
“Regarding that academic part of the environment, I am not happy with the Academy of Arts, I have a small problem with that, the problem is, it seems that they approach their work as something that is there no matter what happened, and there is now a kind of casualness...”
24 B2B – business to business
122
Apart from lack of funding and subsidies for companies working in the knowledge
and creative industries, a lack of cooperation with the state and municipality is not
considered to be an obstacle.
“That is, it is little complicated, we have a Ministry, .., which has a budget line for development of ... What is unstable in all this is that there are discretionary rights of the Minister,..., who give very large amounts of money for some other projects...”
“We have a cooperation with the Ministry of science and technology in several segments, and we are pleased with that, but we are not pleased with that the Ministry does not have adequate budgets, adequate programs, does not have adequate...with a small budget that they have they help a little, that little is nothing long-term, temporary it means something.
Rigid legislation and administrative rules represent obstacles for the development
of the knowledge economy in Banja Luka, especially in terms of procedures required for
raising financial capital for new business ventures.
“Surely, they (obstacles) exist, in comparison to the West, developed countries. It is obvious, that they are on that level of development, and we are on this level of development, and that there are some reasons for that, to be honest. Through this business, and by working with the administration, I have found many obstacles, many problems.”
Acquiring human capital
When it comes to the education and training of employees/hired people, the
interviewees are unanimous that they lack the human capital to develop their companies
in the required direction. Regarding the questions of finding and hiring people (contract,
temporary, permanent, freelance), interviewees state that well educated and trained
employees in sectors of IT and creative industries are particularly hard to hire. It is said
123
that universities and academic institutions are lacking in their role to enable the
accumulation of knowledge and skills in the disciplines required for the development of
the knowledge and creative economy in Banja Luka
“First of all, people from the university don`t come as really educated, really people who could straight go to work, people who can quickly become competent at work. We train them, big part of the time, up to half a year, and then they become capable to work on something... But, the quality of teaching, lectures, I had a chance...to see tests from that department. I think, assistant professors who teach that should not teach in that way, with such a low level of knowledge...”
“At the Academy (of Arts) they do not have the department that we need... but at the moment all people that work here are self learners, they learned via the Internet, tutorials... and it is very hard to get human resources, good human resources...”
“We were acquiring human resources by giving scholarships. In that process, while working for us, and having a stipend, gaining knowledge, and in that way they were doing a favor to themselves and us, as a company.”
Education and training
According to interviewees, graduates lack the required knowledge and skills that
are necessary for them to be able to work in specific fields. After hiring a number of
people with basic skills the interviewees are still having to teach and train them in the
required skills and knowledge. However, they do give an opportunity to students to come
and work for them, while still at the college.
“...when we talk about real knowledge, real experience, there comes the problem, because it is difficult to find someone who is, in small companies like ours, always, multidisciplinarity is something that is always looked for...IT human resources, creative human resources are completely in deficit.”
124
“We are seven and a half, because we have one student. Laughs. We are seven...There are many people who would try something, we give an opportunity to all of them, we train as well, sporadically, there is no regular training or something, but it is still new sector of industry, so it will eventually appear. It is hard to get human resources...”
“At the moment, we have two students from (name of the Faculty), department of design and multimedia, and one student form (name of the Faculty) who is in training, in the software, IT department. So, we have that communication with students, new generations constantly. At any time we have one, two, or three students who are here on a practice.”
administration, quality of life, activities leisure, culture, sub-culture), interviewees
responded differently regarding their need for certain facilities within the urban
environment and available infrastructure. Good internet connection is mentioned as the
most important infrastructure by three out of four interviewees. Size and architecture of
the city does not seem to be important to the interviewees, while they note the advantages
of Banja Luka being the capital of the Republic of Srpska.
For a company focused on R&D, a lack of flight connections to major global
centers could pose a problem in the future.
“When we were choosing location, the most important thing...the Internet link ...”
“...Banja Luka is the centre of Republic of Srpska, the capital, and regarding hotels it is excellent. We do not have ultra-luxury hotels; I think that no one is expecting that. The infrastructure is solid, well connected, location of (the centre) is direct with..., there are really, really, no problems, because, as I said, our main communication is via the Internet, via Skype conference, emails, brochures, sales, etc...”
125
In the future period, the flight connection will be a problem. You have to travel to Belgrade, Sarajevo, Zagreb. The airport in Banjaluka, which, unfortunately, does not have the capacity to have some more serious airlines, would be much needed to us.... Banja Luka - Gradiska motorway would...mean a lot to us...”
Two of the interviewees whose companies are doing most of their work via the
Internet are less disapproving of the city environment, in terms of amenities and urban
culture, while two entrepreneurs from companies whose work is in fields of art and R&D
are more concerned with available amenities and cultural milieu, since they are more
dependent on employees, clients, and partners who need to stay in Banja Luka for a
shorter or longer period of time. Also, culture is mentioned as a key issue in attracting
expert workforce to the city.
“If you want to invite an expert to come to work for you. Is he going to come to the city where his child cannot play tennis, swim at the swimming pool, where there is no cultural amenities, where there is no gym, where there is no quality gym, where there is no that sort of, not to number?”
“When we talk about cultural events, I presume that the question is how we feel in the cultural milieu of Banja Luka, as a city, and what we have to offer, many people come from other places... and how they feel here. Somewhere, I am always unhappy with the way the city treats this issue...There is a shortage, definitely, that it is not well defined... it is the general concept of a society in which we live, and we as a society, as individuals, we do not recognize the importance of this, and we do not give back to ... what it gives to us.”
Being a part of the community and local network, through work and leisure
activities, is important for the interviewees and their work colleagues. Also, it is
recognized that the quality of local transport connections and proximity to the city center
matters to the knowledge and creative entrepreneurs.
126
“Of course, it is convenient if people can arrive by bus, or something. And then, after that, to be close to the center was important, simply to do some things more practically... Our present location...is the best. We are in the center of the town in five-ten minutes; by foot...Only thing why it is important is because we like to follow on cultural events...it is only that we want to feel as a part of the community and surroundings we like to be somewhere close. In this way, it often happens, OK, we have finished, we are getting there, let`s go to the Theater, let`s go here or there, let`s go to bowling...”
Plans for the future
The interviewees see Banja Luka as a satisfactory environment for their present
business needs, while they find ICT infrastructure important for development of their
companies.
“Depends on how you look at it. Of course, if we were in New York, we would have more work, and we would be paid better, but we would have better competition as well. Thanks to modern technologies, we do not have to be at the place of the work ... We are specific, we only depend on the good Internet, and nothing else.”
The interviewees are acknowledging factors that pose a threat for their future
development. Salaries paid to employees and housing costs are mentioned to be the most
important. To attract human capital, these companies are competing with the state and
other sectors that are paying bigger salaries and offer higher job security.
“I say to you, as long as the private sector does not overtake the state sector (in salaries), we will have a lag in technical development, in technological development, in knowledge, and, therefore, economic power will decline, and the best human resources will migrate abroad, because abroad salaries are abnormally higher than in the state sector...”
“That is the only chance, otherwise, they either are already working and have good wages, or they work for the State where they have some security, so the only way is to train people before they come to work with us.”
127
“At one point, when we founded the company...three of us founded the company...but in the meantime, people, very realistically and rationally, found another job and funded a ....that has a real income and that, when you draw the line at the end of the day, can feed their families...they got out of the company, and at the moment I am the single owner...”
Costs related to buying an apartment are mentioned to be the decisive factor for
younger cultural workers who even give up their careers in creative sectors in order to
have better prospects to buy their first property, and achieve security for their families.
“I think in this case it is not like that, rent for the apartment, money needed to finance the family, one or two holidays per year, a car, and what else is considered as usual lifestyle, a mobile phone, represent a limitation in doing this work, and that is definitely the reason why people are leaving and cease doing it anymore...People want to buy an apartment, to them, it is as an idea... I understand those people who want to have that kind of security, to invest in that flat, so it works as usual...the flat is the most important... that is the experience of people from my circle.”
128
5. DISCUSSIONS
In this chapter, we give an overview of our results, and compare it and contrast
with the literature.
Awareness that human capital has the key impact on the economic development is
not new (Weber 2005; Schumpeter 1939; Jacobs 1970). However, ways in which
accumulation of human capital affects productivity, in the context of new knowledge,
was not the focus of research in economics until recently (R. E. J. Lucas 1988; Romer
1989). We believe that economic research needs to incorporate other approaches,
especially those from sociology, psychology and history (Glaeser 2007; R. E. J. Lucas
1988). So far, reasons why human capital migrates from place to place are being
researched from behind, after the occurrence has happened and using historical data, in
what is an approach that lacks validity and purpose in the fast changing environment.
Regarding individual perception of satisfaction and mobility, Glaeser & Redlick
(2008) found a 53% positive correlation between perceived happiness and future urban
growth. Florida (2002) argues that the key factors of human capital mobility are:
technology (concentration and size of the high tech industries), talent (concentration of
highly educated people), and tolerance (tolerance to ethnic, racial, sexual, and other
minorities), while the ACRE research (Musterd et al. 2010) found that human capital in
the EU is more likely to stay in cities closer to family and friends, regardless of other
factors. We used quantitative and qualitative methods to test established theories and
available research findings. Our principal aim was to answer the main research question
relating to the strategic impact of economic and societal factors of the living and working
environment in terms of the choice of residence and place of work for knowledge and
129
creative workers in Banja Luka. We accomplished this by testing hypotheses, in order to
determine whether arguments from reviewed literature hold true for knowledge and
creative workers living and working in Banja Luka.
Results of factor analysis and binary logistic regression show that issues which are
more directly influenced by the amount of public funding, such as lack of bicycle lanes
and lack of sidewalks, as well as factors related to social milieu, such as the amount of
crime in the city, safety, illegal construction, and appearance of building facades and
shop windows are the most important factors of concern to the knowledge and creative
workers surveyed in Banja Luka.
H1) We find that the proximity to family and friends significantly influences
respondents` choice of place of residence. Our findings show that: the proximity to
family and friends, being born in the city, and studied in Banja Luka represent 64.65% of
the total sum of responses, and only 14.28% of responses are job-related. Our findings for
knowledge and creative workers in Banja Luka diverge from arguments that amenities
are the main factor for creative and knowledge workers when deciding on their place of
residence (Florida 2002; Clark 2003a).
In line with that, it is notable that 86% of respondents live in Banja Luka for 10
years or longer, and that 25.7% of respondents still live with their parents. Also, it seems
that, in general, knowledge and creative workers in Europe are generally more likely to
settle in the city where they were born or where they studied, in the near vicinity of their
family and friends, even when faced with lack of professional opportunities (Musterd &
Murie 2010f; Dainov 2008). This diverges from the findings of Florida (2002), who
claims that technology, talent, and tolerance are the three most important environmental
130
factors for the creative class to settle in a city. This discrepancy between knowledge and
creative workers in Europe and the USA could be related to generally higher mobility of
the population in the USA. Since knowledge and creative workers in the USA change
their place of residence more often, they move to places with lower barriers to entry and
tolerant cities open to newcomers (Florida 2002).
H2) We reject the hypothesis that the city features do not significantly impact
human capital mobility.
In common with the previous argument, our findings support the argument that
knowledge and creative workers have a preference for places with a large variety of
amenities and leisure facilities, with an abundance of work prospects, numerous
opportunities for personal and professional development, and a tolerant and safe working
and living environment (Clark et al. 2003; Florida 2002; Florida 2005; Glaeser et al.
2009; Glaeser et al. 2010). We find valid, the arguments of Glaeser et al. (2004) that four
key city amenities for human capital are: range of available goods and services, aesthetic
features of the city, quality and range of public services, and the quality and speed of
transport in terms of accessibility to services and jobs.
Social activities
Since income in countries in transition is usually not sufficient to support more
expensive hobbies or membership in exclusive social clubs, hanging out with friends
takes in lower cost activities, such as visiting coffee shops and pubs/bars, spending time
in the city center and parks, and visiting each other’s homes. Our findings support the
argument of Jacobs (1993) and Florida (2002) that people are attracted to colorful places
buzzing with life, local streets and eventful plazas (Whyte 2001), rich in street-level
131
culture and small scale events, places where kids run around, and cafe goers enjoy small
talk and socializing with no previously made arrangements.
Our results show that respondents who are more likely to leave the city tend to
spend less time with their friends, what supports the argument of Glaeser & Redlick
(2008) that people who are considering moving away tend to decrease their investments
in social capital. However, they are significantly more frequent visitors to museums and
art galleries χ² (4, n=420) = 13.813, p< .01, night clubs χ² (4, n=420) = 8.707, p< .05, and
festivals χ² (4, n=420) = 11.174, p< .05. They are, however, less likely to participate in
religious activities χ² (4, n=420) = 10.241, p< .05, and community work χ² (4, n=420) =
11.338, p< .05. We also found that the vast majority, nearly 90% of our respondents, do
not participate in political activities.
Environmental aspects
Surveyed creative and knowledge workers in Banja Luka are not satisfied with the
quality of the environment. Our findings show that 75% of respondents are dissatisfied
with levels of the use of bicycles as a means of transport, while around 65% of
respondents are dissatisfied with the tidiness and cleanliness of rivers and river banks.
Regarding environmental aspects of the city, more than half of all respondents are
dissatisfied with the state of recycling collection services, traffic congestion, availability
of parking space, and the quality of children playgrounds.
Creative and knowledge workers who are more likely to leave the city are
significantly more displeased with the tidiness and cleanliness of rivers and river banks χ²
(2, n=420) = 5.841, p< .05.
132
Leisure amenities
Our results show that city amenities significantly impact on the mobility of
surveyed knowledge and creative workers in Banja Luka, despite the fact that more than
50% of all respondents are satisfied with plazas, parks, city restaurants, bars, cafés, and
cinemas. The most significant dissatisfaction of respondents is recorded for the city
architecture and monuments χ² (2, n=420) = 17.437, p< .01, in line with the argument of
Glaeser et al. (2004) that aesthetic features of the city are one of the key amenities.
Satisfaction with leisure amenities impacts on the likelihood of departure by creative and
knowledge workers from Banja Luka. The key city amenities, especially the quality of
public spaces (plazas, parkas, etc) χ² (2, n=420) = 12.621, p< .01, quality and range of art
galleries/ museums χ² (2, n=420) = 9.096, p< .01, quality of bars and cafés χ² (2, n=420)
= 10.295, p< .01, quality of cinemas χ² (2, n=420) = 6.716, p< .05, quality of shopping
areas χ² (2, n=420)= 10.108, p< .01, architecture of city/relevant monuments χ² (2,
n=420) = 17.437, p< .01, and quality and range of fitness centers χ² (2, n=420) = 7.028,
p< .05, are significantly more disappointing to those who are more likely to leave the
city.
Public services
Our results positively corresponds with arguments of Glaeser et al. (2004) that one
of the key amenities for human capital is the quality and range of public services. We
also find the argument of Clark (2003) and Florida (2002) that creative cities are
increasingly becoming tourist places for their own citizens to be germane to the
knowledge and creative communities in Banja Luka. Knowledge and creative workers
who are more likely to leave the city are significantly more dissatisfied with the quality
133
of university education χ² (2, n=420) = 15.219, p< .01, high school and elementary school
Interviewed entrepreneurs from Banja Luka emphasized the importance of human capital
for the development of their businesses. At the same time, they argued that the lack of
adequate human resources pose the biggest problem for their current and future business
activities.
Well educated and trained employees in sectors of IT and creative industries are
particularly hard to hire. Interviewees state that universities are not playing a sufficient
role in the accumulation of knowledge and skills in disciplines required for the
development of the knowledge and creative economy in Banja Luka. One interviewee
summoned it up:
“First of all, people from the university don`t come as really educated, really people who could straight go to work, people who can quickly become competent at work. We train them, big part of the time, up to half a year, and then they become capable to work on something... But, the quality of teaching, lectures, I had a chance...to see tests from that department. I think, assistant professors who teach that should not teach in that way, with such a low level of knowledge...”
To solve that issue, all interviewees are attempting to create local support
networks of skilled people, who would become a pool of knowledge and skill for the
development of their business sector. To achieve that, they are working on the expansion
of their local B2B network, trying to encourage others to join them in their line of work.
Interviewees prefer to work with local partners, organizations, and freelancers if they can
meet their business demands. In that respect our findings confirm arguments of Greve &
Salaff (2003) that entrepreneurial human capital maintains social networks as their
distribution, knowledge and support networks.
142
Similar to the situation in other transitional countries institutional frameworks do
not sufficiently support development of the knowledge and creative economy (Bozoki
2002; Dainov & Nachev 2008), and lack of funding and subsidies is considered to be a
major obstacle for long term growth of the knowledge and creative economy in Banja
Luka, especially business activities that depend on R&D and new technologies. The big
problem for emerging companies working in the knowledge and creative sector in Banja
Luka is that they have to compete with the State to attract quality human resources, which
is probably typical for countries in transition and countries with oversized bureaucratic
apparatus.
“I say to you, as long as the private sector does not overtake the state sector (in salaries), we will have a lag in technical development, in technological development, in knowledge, and, therefore, economic power will decline, and the best human resources will migrate abroad, because abroad salaries are abnormally higher than in the state sector...”
Our qualitative data supports the findings of the quantitative part of our research,
and reviewed literature in terms that locational economic and societal factors greatly
impact the development of the knowledge and creative economy (Jacobs 1970; Florida
2002; Clark et al. 2003; Glaeser 2007; Glaeser et al. 2010). Interviewed entrepreneurs
emphasized the Internet infrastructure as the main communication channel for their
companies, and this is in line with findings of Radošević (2006).
Regarding other locational factors, interviewees responded differently depending
on their business activities. Entrepreneurs whose business depends solely on good
internet networks are less disapproving of the city environment, in terms of amenities and
urban culture, while others, who require expert workforce or partners to come to work in
143
Banja Luka, emphasize the importance of sport and cultural amenities to fulfill the needs
of city newcomers.
In accordance with our quantitative results, interviewees stated proximity to the
city centre as important for their business, not solely in terms of proximity to their clients,
banks, and other necessary facilities, but also in regard to being closer to cultural events
and city life.
Those interviewed are unanimous that local networks are crucial for the
development of their businesses, and this supports the argument of Florida (2002) that
people are attracted to local venues where people have an opportunity to meet and create
friendship-business networks.
The threat for companies working in creative industries in Banja Luka lies in the
fact that those jobs are not very financially awarding, therefore, people tend to move to
other industries when they start planning families and buying their first home, usually
when they reach their thirties.
“At one point, when we founded the company...three of us founded the company...but in the meantime, people, very realistically and rationally, found another job and funded a ....that has a real income and that, when you draw the line at the end of the day, can feed their families...they got out of the company...“
In the sense of living costs, this supports our quantitative findings and the
arguments of Florida (2005) and Glaeser et al. (2010) that lack of affordable housing and
higher fixed costs have a negative impact on entrepreneurship in urban areas.
144
6. CONCLUSIONS
Our research journey started with the recognition that the growth of the knowledge
and creative economy represents the main strategy for the development of competitive
advantage in the global market for developed as well as transitional countries. Reviewed
literary sources led us to the conclusion that an economy based on intellectual capital
thrives on locally available human capital, since transfer and creation of new knowledge
that cannot be codified depends on physical proximity of knowledge and skill equipped
people. However, existing literature relating to the development of the knowledge and
creative economy largely relates to developed countries, while sources on countries in
transition are scarce. To the best of our knowledge there has not been research which
would elucidate the strategic impact of accumulation and mobility of human capital in
Bosnia and Herzegovina on future economic development.
Our main intention for this thesis is to contribute to the understanding of the
impact of environmental factors on the choice of place of residence and work by
knowledge and creative workers in the context of the development of knowledge and
creative sectors in the city of Banja Luka, Bosnia and Herzegovina. In the course of our
research, we found that proximity to family and friends has the biggest impact on the
decision of surveyed knowledge and creative workers to settle in the city. Our results
support the stance that perception of quality of life, in relation to the place where
knowledge and creative workers live and work, is an important issue for strategic
planning for countries in transition, especially those faced with prolonged and increasing
emigration to metropolitan areas in developed countries. Collected data confirmed that
sampled knowledge and creative workers have a preference for places with a large
145
variety of amenities and leisure facilities, with abundance of work prospects, numerous
opportunities for personal and professional development, and tolerant and a safe working
and living environment. In this respect we analysed research questions related to the
impact of economic and societal factors of the living and working environment on human
capital mobility in the context of Banja Luka, as being a typical city in the SEE region.
Amenities that offer socializing opportunities are popular with surveyed
knowledge and creative workers. Quantitative and qualitative data confirm arguments
that diverse and vibrant social environments attract human capital and support knowledge
spillovers (David B. Audretsch & Maryann P. Feldman 2004). Our findings further
support the argument that knowledge and creative workers are drawn to places with rich
local, street level culture, since art venues, bars, clubs, cafes, museums, or galleries offer
context for initial contact and friendship in a variety of situations. We have also found
that institutional support for entrepreneurial startups in Banja Luka is frequently not
adequate and that knowledge and creative entrepreneurs depend on their social networks
to get ahead in their profession and business.
Considering the most popular socializing activities, our results show that Banja
Luka is a café culture city; cafes being the most popular daily meeting place. Also, most
of the creative and knowledge jobs are located in the city centre. Although property
prices and rents drop sharply further away from the center, it seems that our respondents
rather live with their parents than further away from the center on their own. It seems that
sharing a dwelling with friends is still culturally undesirable for knowledge and creative
workers in Banja Luka, unlike in Dublin (Murphy et al. 2008).
146
As a general conclusion, we support the findings reviewed from available
literature that, besides good public services, leisure amenities, and developed
infrastructure, an abundance of talented people, modern technologies and a tolerant and
open society are factors that predispose future growth of Banja Luka. Our results show
that the characteristics of the city are vital for attracting and maintaining human capital
(Florida 2002; Glaeser & Redlick 2008). Therefore, in the context of Banja Luka,
attention has to be given to mobility of human capital, especially young and highly
educated people. In the context of the country, Bosnia and Herzegovina has slim chances
to compete on the EU and worldwide markets if it fails to strategically develop its human
capital base. Previous research shows that nearly 2/3 of young people want to leave
Bosnia and Herzegovina, although “only” 1/5 of our respondents are almost definitely or
very likely to leave the country. Outbound migration of the best and brightest would
considerably increase once the SEE countries join the EU and further deplete the current
inadequate pool of knowledge.
147
BIBLIOGRAPHY:
Acs, Z. & Varga, A., 2004. Entrepreneurship, Agglomeration and Technological Change, Available at: http://www.econbiz.de/archiv1/2009/67323_entrepreneurship_agglomeration.pdf [Accessed February 22, 2011].
Acs, Z.J. et al., 2005. Growth and Entrepreneurship: An Empirical Assessment, Max Planck Institute of Economics, Entrepreneurship, Growth and Public Policy Group. Available at: http://ideas.repec.org/p/esi/egpdis/2005-32.html [Accessed February 27, 2011].
Acs, Z.J. et al., 2003. The Missing Link, Max Planck Institute of Economics, Entrepreneurship, Growth and Public Policy Group. Available at: http://www.druid.dk/conferences/summer2003/papers/ACS_AUDRETSCH_BREUNERHJELM_CALRSSON.pdf [Accessed February 27, 2011].
Aghion, P. & Howitt, P., 2007. Capital, innovation, and growth accounting. Oxford Review of Economic Policy, 23(1), pp.79-93.
Amabile, T.M. et al., 1996a. Assessing the Work Environment for Creativity. The Academy of Management Journal, 39(5), pp.1154-1184.
Amabile, T.M. et al., 1996b. Assessing the Work Environment for Creativity. The Academy of Management Journal, 39(5), pp.1154-1184.
Amabile, T.M., 1998. How to kill creativity: Keep doing what you’re doing. Or, if you want to spark innovation, rethink how you motivate, reward, and assign work to people. Harvard Business Review, pp.77-87.
Audretsch, David B, 1998. Agglomeration and the Location of Innovative Activity, C.E.P.R. Discussion Papers. Available at: http://ideas.repec.org/p/cpr/ceprdp/1974.html [Accessed January 20, 2011].
Audretsch, David B. & Feldman, Maryann P., 2004. Knowledge spillovers and the geography of innovation. In Handbook of Regional and Urban Economics. Elsevier, pp. 2713-2739. Available at: http://ideas.repec.org/h/eee/regchp/4-61.html [Accessed February 26, 2011].
Barbour, E. & Markusen, A., 2007. Regional Occupational and Industrial Structure: Does One Imply the Other? International Regional Science Review, 30(1), pp.72 -90.
Becker, G.S., 1962. Investment in Human Capital: A Theoretical Analysis. The Journal of Political Economy, 70(5), pp.9-49.
Benhabib, J. & Spiegel, M.M., 2005. Human capital and technology diffusion. Handbook of Economic Growth, 1, pp.935–966.
148
Bozoki, A., 2002. Theoretical Interpretations of Elite Change in East Central Europe. quoted in: Horvat, V., 2004. Brain Drain: threat to successful transition in South East Europe. Southeast European Politics, 5(1), pp.76–93.
Clark, T.N. et al., 2003. Amenities Drive Urban Growth: A New Paradigm And Policy Linkages. In T. N. Clark, ed. The City as an Entertainment Machine, Volume 9. JAI Press(NY).
Clark, T.N., 2003a. The City as an Entertainment Machine, 1st ed., JAI Press(NY).
Clark, T.N., 2003b. Urban amenities: lakes, opera, and juice bars: do they drive development? In The City as an Entertainment Machine, Volume 9. JAI Press(NY).
Cohen, W.M. & Levinthal, D.A., 1990. Absorptive capacity: a new perspective on learning and innovation. Administrative science quarterly, 35(1).
Commission of the European Communities, 2007. Communication from the Commission to the Council, the European Parliament, the European Economic and Social Committee and the Committee of the Regions of 6 December 2007 - Mobility, an instrument for more and better jobs: The European Job Mobility Action Plan (2007-2010) [COM(2007) 773 final - Not published in the Official Journal], Brussels. Available at: http://europa.eu/legislation_summaries/education_training_youth/lifelong_learning/c11805_en.htm [Accessed March 9, 2011].
Creswell, J.W., 1999. Mixed-Method Research: Introduction and Application. In G. J. Cizek, ed. Handbook of Educational Policy. Academic Press, pp. 455-472.
Creswell, J.W., 2006. Qualitative Inquiry and Research Design: Choosing among Five Approaches 2nd ed., Sage Publications, Inc.
Creswell, J.W., 2002. Research Design: Qualitative, Quantitative, and Mixed Methods Approaches 2nd ed., Sage Publications, Inc.
Creswell, J.W. & Miller, D.L., 2000. Determining Validity in Qualitative Inquiry. Theory into Practice, 39(3), pp.124-130.
Csikszentmihalyi, M. & Sawyer, K., 1995. Creative Insight: The Social Dimension of a Solitary Moment. In R. J. Sternberg & J. E. Davidson, eds. The Nature of Insight. Cambridge, MA, USA: The MIT Press.
Dainov, E., 2008. The creative & knowledge class in Sofia. Understanding the attractiveness of the metropolitan region for creative knowledge workers. ACRE report WP5.10., Amsterdam, The Netherlands: Amsterdam: AMIDSt. Available at: http://acre.socsci.uva.nl/results/documents/wp5.10_sofia.pdf [Accessed March 12, 2011].
149
Dainov, E. & Nachev, I., 2008. The creative & knowledge class in Sofia. The managers’ view. ACRE report WP6.10., Amsterdam, The Netherlands: Amsterdam: AMIDSt. Available at: http://acre.socsci.uva.nl/results/documents/wp6.10_Sofia-FINAL.pdf [Accessed March 12, 2003].
David, P.A. & Foray, D., 2003. Economic fundamentals of the knowledge society. Policy Futures in Education, 1(1), pp.20–49.
Denzin, N.K. & Lincoln, Y.S., 2005. The discipline and practice of qualitative research. In N. K. Denzin & Y. S. Lincoln, eds. The SAGE Handbook of Qualitative Research. Sage Publications, Inc.
Fagerberg, J., Srholec, M. & Verspagen, B., 2010. The Role of Innovation in Development. Review of Economics and Institutions, 1(2).
Feldman, M. P & Audretsch, D. B, 1999. Innovation in cities: Science-based diversity, specialization and localized competition. European Economic Review, 43(2), pp.409–429.
Flick, U., Kardoff, E. von & Steinke, I., 2004. What is Qualitative Research? An Introduction to the Field. In U. Flick, E. von Kardoff, & I. Steinke, eds. A Companion to Qualitative Research. Sage Publications Ltd.
Florida, R., 2005. The Flight of the Creative Class: The New Global Competition for Talent 1ST ed., Harper Business.
Florida, R., 2002. The Rise of the Creative Class: And How It’s Transforming Work, Leisure, Community and Everyday Life 1st ed., Basic Books.
Fowler J., F., 1984. Survey Research Methods, Sage Publications. Research Methods Series.
Glaeser, E.L., 2004. Book Review of Richard Florida’s “The Rise of the Creative Class,” Available at: http://www.economics.harvard.edu/faculty/glaeser/files/Review_Florida.pdf.
Glaeser, E.L., 2007. The economic approach to cities. Harvard University and NBER Preliminary Draft. Available at: http://www.economics.harvard.edu/faculty/glaeser/files/kayden4.pdf [Accessed February 21, 2011].
Glaeser, E.L., Kerr, W.R. & Ponzetto, G.A.., 2010. Clusters of entrepreneurship. Journal of Urban Economics, 67(1), pp.150–168.
Glaeser, E.L., Kolko, J. & Saiz, A., 2004. Consumers and Cities. In T. N. Clark, ed. The City as an Entertainment Machine, Volume 9. JAI Press(NY).
150
Glaeser, E.L. & Redlick, C., 2008. Social Capital and Urban Growth. NBER Working Paper. Available at: http://www.economics.harvard.edu/faculty/glaeser/files/Social_Capital.pdf [Accessed January 10, 2011].
Glaeser, E.L., Rosenthal, S.S. & Strange, W.C., 2009. Urban Economics and Entrepreneurship. NBER Working Paper. Available at: http://www.nber.org/papers/w15536 [Accessed February 10, 2011].
Glaeser, E.L. & Saiz, A., 2003. The rise of the skilled city. Harvard Institute of Economic Research Discussion Paper. Available at: http://ideas.repec.org/p/fip/fedpwp/04-2.html [Accessed February 24, 2011].
Gottschalk, P., 2004. Strategic Knowledge Management Technology, Idea Group Publishing.
Gravetter, F.J. & Wallnau, L.B., 2007. Statistics for the Behavioral Sciences 7th ed., Wadsworth Publishing.
Greve, A. & Salaff, J.W., 2003. Social networks and entrepreneurship. Entrepreneurship, Theory & Practice, 28(1), pp.1-22.
Groves, R.M. et al., 2004. Survey Methodology 1st ed., Wiley-Interscience.
Heckathorn, D.D., 2002. Respondent-Driven Sampling II: Deriving Valid Population Estimates from Chain-Referral Samples of Hidden Populations. Social Problems, 49(1), pp.11-34.
Heckathorn, D.D., 1997. Respondent-Driven Sampling: A New Approach to the Study of Hidden Populations. Social Problems, 44(2), pp.174-199.
Hewson, C. et al., 2002. Internet Research Methods: A Practical Guide for the Social and Behavioural Sciences, Sage Publications Ltd.
Horvat, V., 2004. Brain Drain: threat to successful transition in South East Europe. Southeast European Politics, 5(1), pp.76–93.
Jacobs, J., 1993. The Death and Life of Great American Cities Modern Library ed., New York, USA: Random House, Inc.
Jacobs, J., 1970. The Economy of Cities, Vintage.
Jensen, M.B. et al., 2007. Forms of knowledge and modes of innovation. Research Policy, 36(5), pp.680–693.
151
Jick, T.D., 1979. Mixing Qualitative and Quantitative Methods: Triangulation in Action. Administrative Science Quarterly, 24(4), pp.602-611.
Johnson, J. & Lundvall, L., 2001. Why all this fuss about codified and tacit knowledge? DRUID Winter Conference January 18-20 2001 Aalborg University. Available at: http://www.druid.dk/conferences/winter2001/paper-winter/Paper/johnson_lundvall.pdf [Accessed December 15, 2010].
Jones, C.I., 2004. Growth and ideas. NBER working paper.
Katseli, L.T., Lucas, R.E.B. & Theodora Xenogiani, 2006. Policies for Migration and Development: A European Perspective, OECD Publishing. Available at: http://ideas.repec.org/p/oec/devaab/30-en.html [Accessed August 23, 2011].
Kothari, C.R., 2004. Research Methodology: Methods & Techniques; 2nd Edition, New Age International Pvt. Ltd.
Landes, D., 2000. Culture Makes Almost All the Difference. In L. E. Harrison & S. P. Huntington, eds. Culture Matters: How Values Shape Human Progress. New York, USA: Basic Books.
Long, D.W.D. & Fahey, L., 2000. Diagnosing Cultural Barriers to Knowledge Management. The Academy of Management Executive (1993-2005), 14(4), pp.113-127.
Lucas, R. & Martin, P., 2010. Labor Mobility in Southeast Europe. In Enhancing Regional Trade Integration in Southeast Europe. Washington, D.C., U.S.A.: World Bank Publications, pp. 53-94.
Lucas, R.E.J., 2009. Ideas and growth. Economica, 76(301), pp.1–19.
Lucas, R.E.J., 1988. On the Mechanics of Economic Development. Journal of Monetary Economics 22 (1988) 3-42.
Marcus, C., 2005. Future of Creative Industries: Implications for Research Policy. Available at: http://ec.europa.eu/research/social-sciences/pdf/future-of-creative-industries_en.pdf [Accessed February 6, 2011].
Miller, W., 1999. Building the ultimate resource. Management Review, 88(1), pp.42-45.
Mincer, J., 1981. Human Capital and Economic Growth. SSRN eLibrary. Available at: http://papers.ssrn.com/sol3/papers.cfm?abstract_id=256899 [Accessed February 10, 2011].
Mouton, J. & Marais, H.C., 1988. Basic concepts in the methodology of the social sciences, HSRC Press.
152
Murphy, E., Redmond, D. & McKnight, D., 2008. The creative knowledge economy in Dublin: Understanding the attractiveness of the metropolitan region for creative knowledge workers, Amsterdam: AMIDSt, University of Amsterdam. Available at: http://acre.socsci.uva.nl/results/documents/wp5.13_dublin.pdf [Accessed December 10, 2010].
Musterd, S. et al. eds., 2010. Making Creative-Knowledge Cities: A Guide for Policy Makers, Amsterdam: Amsterdam Institute for Social Science Research (AISSR), University of Amsterdam. Available at: http://acre.socsci.uva.nl/documents/Creative-KnowledgeCities-v3-lowres.pdf [Accessed March 3, 2011].
Musterd, S. & Murie, A., 2010a. Making Competitive Cities: Debates and Challenges. In S. Musterd & A. Murie, eds. Making Competitive Cities. Blackwell Publishing Ltd.
Musterd, S. & Murie, A., 2010b. Making Competitive Cities: Debates and Challenges. In S. Musterd & A. Murie, eds. Making Competitive Cities. Blackwell Publishing Ltd, pp. 193-207.
Musterd, S. & Murie, A., 2010c. Synthesis: Re-making the Competitive City. In S. Musterd & A. Murie, eds. Making Competitive Cities. John Wiley and Sons, pp. 329-350.
Musterd, S. & Murie, A., 2010d. The Idea of the Creative or Knowledge-Based City. In S. Musterd & A. Murie, eds. Making Competitive Cities. Blackwell Publishing Ltd, pp. 17-32.
Musterd, S. & Murie, A., 2010e. What Policies Should Cities Adopt? In S. Musterd & A. Murie, eds. Making Competitive Cities. Blackwell Publishing Ltd, pp. 235-243.
Musterd, S. & Murie, A. eds., 2010f. Making Competitive Cities, Blackwell Publishing Ltd.
Nahapiet, J., Gratton, L. & Rocha, H.O., 2005. Knowledge and relationships: when cooperation is the norm. European Management Review, 2(1), pp.3–14.
Neergaard, H., 2008. Sampling in entrepreneurial setting. In H. Neergaard & J. P. Ulhoi, eds. Handbook of Qualitative Research Methods in Entrepreneurship. Edward Elgar Publishing.
Newman, I. & Benz, C.R., 1998. Qualitative-Quantitative Research Methodology: Exploring the Interactive Continuum 1st ed., Southern Illinois University Press.
Nooteboom, B., 2000. Learning by Interaction: Absorptive Capacity, Cognitive Distance and Governance. Journal of Management and Governance, 4(1), pp.69-92.
153
O`Dochartaigh, N., 2001. The Internet Research Handbook: A Practical Guide for Students and Researchers in the Social Sciences, quoted in: Sapsford, R & Jupp, V 2006, Data Collection and Analysis 2nd ed., Sage Publications Ltd. 1st ed., Sage Publications Ltd.
Patton, M.Q., 2001. Qualitative Research & Evaluation Methods 3rd ed., Sage Publications, Inc.
Piaget, J., 1971. Genetic Epistemology, New York, USA: The Norton Library.
Polanyi, M., 1966. The Tacit Dimension, New York: Doubleday.
Porter, M.E., 2000. Attitudes, Values, Beliefs, and the Microeconomics of Prosperity. In L. E. Harrison & S. P. Huntington, eds. Culture Matters: How Values Shape Human Progress. New York, USA: Basic Books.
Porter, M.E., 1998. Clusters and the New Economics of Competition. Harvard Business Review. Available at: http://hbr.org/product/clusters-and-the-new-economics-of-competition/an/98609-PDF-ENG [Accessed April 6, 2011].
Porter, M.E., 1990. The Competitive Advantage of Nations 1st ed., London and Basingstoke: The Macmillan Press.
Powell, W.W. & Snellman, K., 2004. The Knowledge Economy. Annual Review of Sociology, 30(1), pp.199-220.
Primorac, J., 2006. The position of cultural workers in creative industries: The south-eastern European perspective. Available at: http://www.encatc.org/cpraward/publications/Jaka%20Primovic%202005.pdf [Accessed January 12, 2011].
Radošević, S., 2006. Growth, integration and spillovers in the Central and East European software industry. Centre for the Study of Economic and Social Change in Europe Economics Working Paper.
Radošević, S., Savic, M. & Woodward, R., 2008. Knowledge-based entrepreneurship in Central and Eastern Europe: myth and reality.
Romer, P.M., 2007. Economic Growth D. R. Henderson, ed. The Concise Encyclopedia of Economics, 14(1), pp.57–77.
Romer, P.M., 1990. Endogenous technological change. Journal of political Economy, 98(5), pp.71–102.
Romer, P.M., 1989. Human Capital and Growth: Theory and Evidence. SSRN eLibrary. Available at: http://papers.ssrn.com/sol3/papers.cfm?abstract_id=227284 [Accessed February 10, 2011].
154
Sapsford, R. & Jupp, V., 2006. Data Collection and Analysis 2nd ed., Sage Publications Ltd.
Saxenian, A., 1994. Regional advantage: culture and competition in Silicon Valley and Route 128, Harvard University Press.
Schumpeter, J.A., 1939. Business Cycles: A Theoretical, Historical and Statistical Analysis Of The Capitalist Process. Abridged with an introduction, by Rendigs Fels., MCGRAW HILL.
Schumpeter, J.A., 2003. Capitalism, Socialism and Democracy, London, New York: Routledge.
Simonton, D.K., 1999. Origins of Genius: Darwinian Perspectives on Creativity First ed., New York, USA: Oxford University Press.
Singh, Y.K., 2006. Fundamental Of Research Methodology And Statistics, New Age International.
Solow, R.M., 1957. Technical Change and the Aggregate Production Function. The Review of Economics and Statistics, 39(3), pp.312-320.
Somekh, P.B. & Lewin, D.C., 2004. Research Methods in the Social Sciences 1st ed., Sage Publications Ltd.
The World Economic Forum, 2011. Global Talent Risk – Seven Responses, Switzerland. Available at: http://www3.weforum.org/docs/PS_WEF_GlobalTalentRisk_Report_2011.pdf [Accessed April 11, 2011].
The World Economic Forum, 2010. World Economic Forum Global Competitiveness Report 2010-2011, Available at: http://www.weforum.org/issues/global-competitiveness/index.html [Accessed June 14, 2011].
Throsby, D., 2001. Economics and Culture 1st ed., Cambridge University Press.
Transparency International, 2010. The 2010 Corruption Perceptions Index, Available at: http://www.transparency.org/policy_research/surveys_indices/cpi/2010/results [Accessed March 2, 2011].
UNCTAD & UNDP, 2008. Creative Economy Report 2008, Available at: http://www.unctad.org/en/docs/ditc20082cer_en.pdf [Accessed February 6, 2011].
United Nations WPAY – Youth UNIT, 2005. World Programme of Action for Youth (WPAY) - Independent evaluation of the national youth policy in Bosnia-Herzegovina, Available at: http://www.un.org/esa/socdev/unyin/documents/wpaysubmissions/bosnia.pdf [Accessed October 3, 2010].
155
Vygotsky, L.S., 2004. Imagination and creativity in childhood. Journal of Russian and East European Psychology, 42(1), pp.7–97.
Weber, M., 2005. The Protestant Ethic and the Spirit of Capitalism, Taylor & Francis e-Library.
Weiming, T., 2000. Multiple Modernities: A Preliminary Inquiry into the Implications of East Asian Modernity. In L. E. Harrison & S. P. Huntington, eds. Culture Matters: How Values Shape Human Progress. New York, USA: Basic Books, pp. 257-266.
Whyte, W.H., 2001. The Social Life of Small Urban Spaces, Project for Public Spaces Inc.
Wim Systems Varaždin, 2010. Studija izvodljivosti tehnološkog biznis parka Banja Luka, Banja Luka: CIDEA - City Development Agency.
156
APPENDIX I - EQUATIONS
Equation 1
n0 n = ------------------------- = 381 people
(n0 - 1) 1+ ---------------
N
z2 * p * q for: n0 = -------------------
Me2
N – size of the population = 45.396 z - 1.96 p - 0.5 q - 0.5 Me - 0.05 (5%)
Equation 2
Greater the odds of an event, the greater the probability that the event occurs,
where,
In the case of multiple predictors, as in our example, the equation for p is:
bi – a measure of association between the predictors and the equation (log (odds)) for the occurrence of an event that interests us.
bi > 0 – positive association bi = 0 – no association bi < 0 – negative association
p
podds
1
p
p
1logoddslog
......xbxbb
......xbxbb
22110
22110
e1
ep
157
APPENDIX II – INTERVIEW TRANSCRIPTS
Interview 1
We, as a company, at the moment...I am the director of the company...unfortunately, a part of the team who initially founded the company couldn’t endure it...that problem...not them but the surroundings... they could not find enough of the interest zone to do that. At one point, when we founded the company...three of us founded the company...but in the meantime, people, very realistically and rationally, found another job and funded a ....that has a real income and that, when you draw the line at the end of the day, can feed their families...they got out of the company, and at the moment I am the single owner...that is...I would call it a one man show, although it is not like that...I am the only one who is going to bad and gets up thinking about the company, like about something which needs to be developed, but besides me there are, and... Art demands outsourcing of many other people...and I can name many of them, who are the company, but they are not on the paper undersigned..., above all (names of the people)... people who are creative and technical part of the team are somehow the company...it is that kind of power...
They are all from Banja Luka, there are few of them from Laktaši...I am willing to say, that I am in that sense local-patriotically orientated, although I think that there is one problem that we are a small community, undefined, and that there is a gap between Zagreb, Sarajevo and Belgrade as environments that produce serious...in continuity, in serious numbers,...their approach and their experience is larger than ours, therefore, we are trying to make a team with whom we are going to grow and to identify ourselves... the team that works within the company, or with the company, or besides the company, someone who is from Banja Luka, because it is common early days, some common point...
The (industry) is, otherwise, full of creative people who have a bit of egoism, thinking of themselves greater than the reality is, or not, I cannot assess that, but when you talk with someone from Banja Luka..., we all know each other, we know what are our abilities, we know what are our advantages and minuses, and then that cooperation is simpler. It often happens that we, when it comes to... a half of the team was from Serbia... it was good, I cannot complain...but the bottom line is that it is most comfortable to work with people who are local...I think that is it, sometimes we explore but simply we build our own capacities, we as a company and them, as individuals who work with us, so that is the route of least resistance...local network.
Regarding that academic part of the environment, I am not happy with the Academy of Arts, I have a small problem with that, the problem is, it seems that they approach their work as something that is there no matter what happened, and there is now a kind of casualness. On the other hand, when you enter the Academy of Arts you wish to orientate in a business sense, and those people who are potentially ... or have become, and are the products of the Academy...I cannot call them clients, I think it is too hard in this work I am doing, are our most frequent consumers. People from the Academy, students from the Academy, and those who graduated are the people that I most often work with, on the one hand, and on the other hand the Academy as an institution and the quality part
158
of the Academy is not derived from the concept of the Academy, but the enthusiasm of these people that there are, essentially, and love of ... that is often higher than love that students of law have towards law. Somehow they put it into the context of those existential matters, while here we have; they put in an additional effort to be good in what they do. When talking about the Academy, it is interesting for us, because it's a place where ideas are generated and people created who are of good quality. But I think; one unnamed colleague who is now becoming well known, once said: The Academy is great because we all meet each other over there, we have a name, a place where we work, where we have some interests, but as a place where we learn and discover, where we acquire knowledge of things that we are supposed to do, it's not the case.
When we talk about business-oriented, about entrepreneurship in general, there is a company with a product and service, and then it (the company) offers it to its customers, clients are people who buy bread at the store, we do not know their names. When we talk about the actual case, in the context of (our company) these are people who are present in the company, in a way that is different from how they are perceived when they send express mail, I don`t know, via FedEx. We are much closer to each other and spend much more time (together), on top of what we call work, than they do in other industries...When I say clients, my clients are... ( professionals of different skills I work with )...I see that from that side...they, essentially, find the company as a place where they can generate, where they can execute their ideas, and it is so, so it is envisaged. When talking about the Academy, an institution as such, I have no relation with them. This is the place to educate people, and somehow, my zone of interest, the only zone of interest is that they are educated as good as possible, because I do not make an influence on their educational process, I couldn`t, it is too hard, too closed...I want from there to come out as good as possible, ..., because it creates, when talking about clients, people who come to the company and realize their ideas
We have, right here in ... we managed to define, and we have two types of clients. One type of our clients is funds, who give us money to realize our... sometimes those are the private and sometimes state funds, more often state funds. We essentially apply for these funds by making a project, idea, which is realized later. On the other hand, we have clients who are consumers of our final products. The audience ... and that is essentially what is considered the general social class which ... there are many of them, that is not so narrowly specific... When we talk about the funds, those are Ministry of Education and Culture, City of Banja Luka... These are places that have money and finances to fund projects such as... and those are people who are specialized in ..., those who make decisions; those are mostly competitions that are resolved with three, five, people who make decisions, and within that they, it seems to me, in the best possible way recognize what is the quality of ... that is another type of the clientele.
As for private funds, for now, besides some not clearly defined relationships, we didn`t have a lot of contact. For example, we are just planning to see what the Electro power sector can do, as one who, by law, is required to give 10% of their profits to cultural and sport activities... In any case, we are looking for openings with some private investors, which are extremely few, at least in part to finance our projects.
That is, it is little complicated, we have a Ministry, we have the Ministry of Education and Culture of the Republic of Srpska, which has a budget line for development of ..., and it defines how much money will be invested in development of ...
159
What is unstable in all this is that there are discretionary rights of the Minister, the Prime Minister, and others, who give very large amounts of money for some other projects, which are non-budget oriented, and these are from some other, now I do not know how to call them, funds, so to speak, that bag from which they take the money from, where it is located. In terms of a part defined by the budget, this is something that we apply for. What's the catch is that the last year in December the budget was approved in which the budget item was zero, and they started to shut it down, it is very problematic. On the other hand, our experience says that we, some discretionary rights, in a conversation with the Minister, if we get to convince him, he will find some money with which they would finance it. So do the events, since they are also under the same... When we talk about Sarajevo, there is the Foundation for ... of the City of Sarajevo, I think it is called like that, and they have, and now I am not exactly sure, for example, ... thousands of Euros, which is twice a year, through the competition, distributed to ... projects which are proposed. The city of Banja Luka also has a small fund, it is small, around ... thousands Marks... in other cities ... there are budget lines for culture... those funds are small... considering how much it costs, it's not the happiest situation... And if we are talking about a leader in the region, Serbia is something like that; that concept, the enthusiasm, the way the ... makers come up with finance is more successful in the Serbian milieu, than on the other side (Croatia). In our case, it is the state fund, and that`s what we are talking about, and it seems to me, in fact I am sure, that we will have to turn to other funds that come from the city of Banja Luka, Republic of Srpska, Bosnia and Herzegovina, which are not taxpayers` money. We cannot call it a fund; we can call it, as I said, partially from the Electro power sector, which has some money, or the Telecom, something like that to realize a project. They are not easy (on money). We call this first part the soft money. It is the money that might not be hard to get, but is relatively friendly to authors, and those revisions are not big, we are trying quite easily, although, those are never sufficient to realize ..., we quite easily manipulate between all this, unlike these others which are, firstly, very controlled, if ... bank gives you the money, than it is important...
As for this first one, when you have a good eye, and when you have a good concept... As for Banja Luka, and regarding climate I think we haven`t had some big problems for now, and generally, I think that architecture of Banja Luka, it is not specific for something, and just, somehow, for me it is difficult to draw some, if we talk about beautiful, or universally beautiful, when we talk about the architecture... if you have an idea, if you have something that is the context of the... you will find it very easy to locate it in space. I think, around Banja Luka there are very nice exteriors, which may be interesting, I think in Banja Luka, there are interiors which are not problematic for... , I think this is not a limiting factor. What is the limiting factor for us is that we do not have infrastructure that can operate... there are very few places where we can plug in our (equipment)... but I still consider that this is not something that is the decisive... we find answers to that...
When we talk about cultural events, I presume that the question is how we feel in the cultural milieu of Banja Luka, as a city, and what we have to offer, many people come from other places... and how they feel here. Somewhere, I am always unhappy with the way the city treats this issue, and since I am a cultural worker I try to analyze things that surround me, and to see what the real offer is. I think that the city, as such, is very
160
limited. I do not know whether it is the lack of ideas or people do not want to deal with that, because it does not have a financial benefit. Somehow, we always return to that issue that we must live on something, or it is, as we said at the beginning, environment without ideas. I do not believe in this scenario, I don`t believe it is without ideas. I believe that people do not deal with the culture because it is, perhaps, because everything is directed towards the financial part, making money, and the culture is not the place where you can do that, when selling pirate discs in the street you can earn more than when you organize ...When you draw the line, that problem, or lack of culture, seems to me to reside there. There is a shortage, definitely, that it is not well defined. Yesterday, I heard information that ... is ceasing to exist. It is devastating. When you have an idea which has been recognized in the region... I personally get emails from some people from the region, who say that if I could talk to the people (organizers), like I'd love to be part of... it is great reference for me, and then at some point the environment has no understanding, really environment is the correct address, ... as someone who is business oriented, they draw the line and said there was no reason for us to do that. And goes out one brand, the brand is not just profit of the ... it is the general concept of a society in which we live, and we as a society, as individuals, we do not recognize the importance of this, and we do not give back to ... what it gives to us. I think, almost as a rule, that things happen in a similar way with other cultural activities, and except for some boxing matches that are being sold to us as culture, because there comes a singer and sings, we will be reduced to a minimum.
I think when you come to an age, for example, the beginning of thirties, or even earlier, and when you really start to deal with existential issues, at that time you leave this job. It's the only real reason why this is happening. It is not a thought: I can contribute in other sectors much better, and I will make along the way, as a byproduct, a lot more money or I'll buy an apartment, it is simply a feeling that you cannot dictate this work, and that is reality. My example is that I live with my parents, I am in thirties, I drive my father`s old car, when he doesn`t need it, for someone who is in thirties, speaks a foreign language, has a degree, and has... (several very large and smaller projects)... behind, in some developed countries, I wouldn`t, maybe, own a flat, but I would certainly have my own car and 25 days on the coast. But generally, that existential moment that occurs as a light bulb, starts to dissipate a moment of enthusiasm which had hitherto functioned and dominated, and they leave the sphere of cultural workers and become employees of the state administration, other private companies, or establish their other jobs where the money, wages at the end, are more solid. I do not see that there is a justification like, or not justification but the reason, for example: I realized, I'm not creative enough, I lost power in that, Everything I said I said, I no longer have reason to do, and some other descriptions. Maybe in some other countries it works in a different way, so someone says, until being 25, 35 plays the guitar in a band and earns well, to become a dentist afterwards. I think in this case it is not like that, rent for the apartment, money needed to finance the family, one or two holidays per year, a car, and what else is considered as usual lifestyle, a mobile phone, represent a limitation in doing this work, and that is definitely the reason why people are leaving and cease doing it anymore.
People want to buy an apartment, to them, it is as an ideal, I want to own my own apartment, and are even capable of neglecting those other needs to buy flat. Flat is purchased from the loan... you put housing problem to the fore. I have no need for
161
something like that, since I believe that renting a flat is something completely rational, but I understand those people who want to have that kind of security, to invest in that flat, so it works as usual...the flat is the most important... that is the experience of people from my circle.
Banja Luka, if we talk about relationships, should not strive to be a big city. It has 250, 300 thousand people, I don`t know, and it should be a medium sized city like it is, and to make the most of it. That is a serious problem. When we talk about relations between the two environments we have a serious inferiority complex. And Belgrade has inferiority complex... that story I was somewhere, I saw something, represents an advantage in this hermetic environment, although there are people who go, and return more stupid than they were before. But, generally, the need to go somewhere, not to define things in their own backyard, becomes a problem.
I have a few thoughts in my head. Not for the company. I wouldn`t go to Macedonia to establish a company, although they have a good fund, a good center for..., but I could be an individual who could work. i think for doing this work you do not have to have a company, but to be.... is in fact individual knowledge and skill, therefore, if I was going from here, although so far there is no such thing, I would go on invitation, and would probably not worked as a company but as... (name). I, like most others in this town, do not know how things work out there..., such knowledge is a challenge for me and the burden...that period of going somewhere, getting to know the place, starting something similar that I have here...
I very rarely think about some of the negative connotations of the work that I am doing. When I say the market is unstable or funds are small, it is only the issue which needs to be resolved, not something that should be abandoned. Within that, I have to define, I think I will in the future work on projects and now...generally, there are authors... who have the quality to do that. In the future, we will turn to them. We will try to, in the system, give importance to our existence, to tell them that it is necessary, that we were players in the regional, European market, to allocate some money to finance all that. We will also begin to turn to some funds that are not national, not taxpayers' funds, and to find there some additional funding. I think when it comes to big issues, shut down or not to shut down, I think, in any case, survival, or life of the company is very certain, and I hope that major turbulence will not happen, and that we will achieve our goals.
Interview 2
My role in the company, I am the director, and besides fulfilling those legal duties and jobs of a director, of a private company, of a ltd company in our country, I, in principle, coordinate all those things, from bookkeeping, legal affairs, strategic decisions, agreements and negotiations of a future existence, i.e. financial existence of the company.
Characteristics of our company is that we are registered for research in technical and technological sciences, the goal of our establishing was to transform one patent, one good idea into industrial product in order to sell it as a finished product, as an integral part of some applications, and as a license to manufacture products, and at the end, from a small idea, a small family who was dealing with innovation, myself, my ..., to make a company.
162
Of course, we all had felt that it was going to happen tomorrow, in a couple of days, or couple of months. With time, by seeing how companies are created, how enterprises are developed, how a product is released to the market, what are the problems, what are the problems of a technical nature, what are external problems, we saw, and we were told from other companies, that process it takes5 to 10 years, depending on a country, product, market, and many other internal and external factor.
We actually invented a new principle of energy production from renewable-energy sources, and that is the innovative (product), which is the basis for that application. Since the beginning, we managed to make the first (product) for powering ..., in the world. Together with our partner companies, we would never be able to do it on our own. We made, together with the partners, ..., (product) , and generally, thanks to this advanced system, any ... Any company can ...
There is the exact economic projection, which we proved, in effect, that for (client), it is cheaper; there is an investment repayment period of two to three years if they do that, and it is a lot better for the environment, and now we are making our way in that segment of the market
We are finding new obstacles. Those are lobbying groups for diesel generators, aim of CEOs to have good current financial results, to avoid capital costs, regardless of the significantly higher operating costs, for him, it is important to have good balance sheets, etc., etc.. Therefore, there are some of these, so to speak, tricks, which we are facing now, and that we are aware of, which is, maybe, our advantage, and in the future period we are planning to solve all this, and push it through. Today, we have several companies interested in buying us... somewhere else to continue to work to fund us, to sign partnership agreements, and so on.
In all these negotiations that I am doing, of course, you have to be careful, like in any other job, and, of course, all those negotiators from all sides want to extract the maximum benefit, for themselves and for their company, and me, during the last five six years during which I am doing this job, I am learning myself, gaining tremendous knowledge, tremendous experience, I travel around the world, I fight, survive in this country. Nobody sane could think that it is possible in this country, or in countries in this region, to develop a company that will be equivalent to global companies. Because, if it was possible, they would exist by now. We do not consider ourselves to be the smartest, the most capable, and the richest ones. We are the people who work hard. We face problems, we solve them by thinking in the technical way, lots of work, effort.
We finance our operations by barely surviving. We are not adequately paid, simply, other companies, around the world who are doing this work like us, and we, when we compare with them; the investments, the wages, the balance sheets, the equipment; there is a significant difference, and it is a miracle that we reached this level, and what will happen in the future I don`t know, we will reach the certain level when we decide whether to stay here and continue in this way or worse, or to move to another more developed country, which will offer us a better human resources, better financing, better work conditions, better living conditions, better conditions for professional development, better equipment, etc. There are many factors that may influence our decision, but so far we managed to stay here, to survive, to work, to compete with other companies worldwide, to go to (name of the city) to get some award ..., to reach the finals in ...
163
Our clients now are (companies from specific sector), someone who is a ...who wants to buy a power system, or an individual, a private house which wants to have an independent power supply. Our products and all other products around the world are abnormally expensive in comparison with the electrical energy which is being sold. The price of electrical energy will go up. Of course, likewise, the fuel price which will go up. Of course, in order to save fuel, to save the energy, to reach the environmental awareness...the price has to go up...Our systems like all our competitor`s systems are unrealistically expensive in comparison with what they provide, they entail an investment of 10 to 20 years, depending on the application, and there is a huge competition because you have the product, everything, before its time. And simply, it is not profitable to buy it in advance, there are other countries where it is profitable, but again, there are lobbies in those countries, but again, I say, it was difficult to push the pilot project through. It was difficult to make the first commercial product, and then the second one, and they all say they would start ordering in series when we reach five, ten. That is a normal process, and that we are aware of, and which is very difficult to deal with from this country.
We were acquiring human resources by giving scholarships. In that process, while working for us, and having a stipend, gaining knowledge, and in that way they were doing a favor to themselves and us, as a company. Since we don`t have a serial production, we do not have the ability to employ dozens of people who would only work in R&D, that is impossible for even the biggest companies that do some profitable jobs, let alone for us. In principle, most of these people are our associates, but we have one huge problem, and it is that for us, the private sector, the main competitor in a run for human resources is the state. When you have the situation that, when you offer, as a private company, a realistic opportunity to employ someone, and when the state offers to employ someone, 99,9% of them will choose to work for the state sector, because one have bigger salary, more secure salary, fewer duties, fewer responsibilities, less work, etc., etc. More security to survive, to stay, and in the private sector, tomorrow, the company can go bust, tomorrow the company can fire you, tomorrow some earthquake could happen. With us, it is proven that in the state sector, from a municipality to the highest levels of power, people have a certain security, so no one normal could blame them. Of course, they have, in companies like mine, like ours, and in other companies they have tremendous, building companies, people who are of that profession, electrical, mechanical, there are companies over here where they can gain tremendous knowledge, and where they can take advantage of this knowledge later and apply to work for global companies, but people do not see themselves in those companies at the moment, in the last two years. People see their long-term future, starting a family, etc., safety. They see it in the state sector. I say to you, as long as the private sector does not overtake the state sector, we will have a lag in technical development, in technological development, in knowledge, and, therefore, economic power will decline, and the best human resources will migrate abroad, because abroad salaries are abnormally higher than in the state sector, of course for people who are in new technologies.
We are creating new technology. In fact, we created new technology. In companies like ours in the West, simply, people would fight to work, there would be no competition, but at the moment we are not in a position to pay them more than the state sector. Furthermore, therefore, we do not have a possibility to do that, to grow our team, let alone to compete.
164
We have a cooperation with the Ministry of science and technology in several segments, and we are pleased with that, but we are not pleased with that the Ministry does not have adequate budgets, adequate programs, does not have adequate..., with a small budget that they have they help a little, that little is nothing long-term, temporary it means something. Ministry of science and technology, or someone like that, responsible of that segment of the economy and new technologies has to have a much larger budget, and based on that budget a lot more concrete plans and systems of control.
We need a lot of different materials, services, people from different segments of knowledge and technique...and if Banja Luka has that to offer, and in most cases it has, we finish our problem. Of course, we pay that a little more, then if we were in some other bigger city, etc., but that link has functioned excellent so far.
From the date of incorporation (year) the Internet hasn`t been a barrier. We had significant problems during first three years. The emergence of a number of operators, better quality service...nowadays we function superb, and the Internet is the main infrastructure that we need. In the future period, the flight connection will be a problem. You have to travel to Belgrade, Sarajevo, and Zagreb. The airport in Banja Luka, which, unfortunately, does not have the capacity to have some more serious airlines, would be much needed to us, but simply, in our plans, if we decide to stay and survive here, we cannot count on that. Banja Luka - Gradiska motorway would, in that sense of travel, would mean a lot to us, but when we will be able to count on that. Any infrastructure development, for us, businessmen, especially for us who depend on Europe and the world, etc., means a lot.
Surely, they exist, in comparison to the West, developed countries. It is obvious, that they are on that level of development, and we are on this level of development, and that there are some reasons for that, to be honest. Through this business, and by working with the administration, I have found many obstacles, many problems. For example, if a company wanted to be listed on the stock exchange, it is very different over here in comparison to the USA. That is why they are where they are, and we are here where we are. Nobody can tell me that our regulations regarding the stock market, estimates, IPOs, better than theirs. We do not have anything in that segment, almost nothing, apart of... If it wasn`t for the privatization funds, we wouldn`t have any trading on the stock market. With them, different things happen on the stock exchange. From my point of view, it is completely different, and with us those things need to be, as soon as possible, adjusted, liberalized...
It is harder, in principle, when someone evaluates your company. Over here, they require for evaluation to be done on the basis of what you have already invested, on the basis of your market share, while in the USA, for example I`ve made Facebook. Who can estimate for me, well, at this moment maybe yes, but when that company was being established, Google, or thousands and thousands of software companies, thousands and thousands of some consulting companies, they had that opportunity, they made that sort of estimate on the basis of their business plan, on the basis of something, and it is not possible over here. Of course we are more limited in every segment, including that one, then them. And, I think we should learn from them, not them from us, but well, we shall see.
A lot. If you want to invite an expert to come to work for you. Is he going to come to the city where his child cannot play tennis, swim at the swimming pool, where there is
165
no cultural amenities, where there is no gym, where there is no quality gym, where there is no that sort of, not to number. I can number at least 50 things which determine the quality of life of someone who is on the European and the global level, isn`t it? We are pushing to make a company which will be a competition to the European and the world...In those companies should, or must work people of a certain caliber. To bring or gain people of that caliber you have to bring them into the environment where they will have a certain quality of life. In places where his car will be stolen, where he will be robbed, burnt, etc., people won`t come. Over here, thanks God, there is fewer, and fewer things like that, but that sort of cultural infrastructure, sport infrastructure, I think, let’s say, behind Belgrade, we lag 100 years. And, it is one of the main problems, whether there will be a company ever to be born over here. If it is possible that Adobe, someone who invented first programs of company Adobe could function over here. You know that company like Adobe, Google, allow to their employees to come to work with their dogs, to have gyms, witnesses, finesses, to have 100 types of meals in one moment, etc. Simply, to make from the workplace, for that expert, for someone who creates new value, the quality, that he wants to come to work, to want to stay here to want to a part of his time and his knowledge give to his company. Over here you don`t have that, and I don`t know if it is ever going to be. But, if someone makes that, it will be the work, and without that there is no development. I don`t know if I answered the question correctly, but it is my honest opinion. It is not encouraging, but it is realistic.
Have a look. Of course, if you had a carnival over here, like in Rio, it would be great for employees, for people. If you had Oktoberfest, like in Munich, it would be fantastic, if you had Exit, that is a cultural centre, if you had Gucha, Beerfest in Belgrade, I don`t know, if you had columns of majorettes , days of culture, which are inspirational for real. Over here, maybe I do not have time, I am not the real address for that question, but I don`t notice something like that. I notice, unfortunately, that cultural events of this region are fairs. I cannot say that it bothers me, but it simply, it is not the time for fairs, and I don`t see myself, and I don`t see anyone, who would, you know, that to attract someone, and to mean something to someone. It is OK, and I value and respect that, a huge number of people who work and live to go to a fair, and to do that fair, etc., but with us there is nothing like that. Things are happening, of course, with bigger population, etc., in Kastel some bands are coming, different things are happening, which positively, but I don`t see that we have something what is, and cultural event is when you say, in certain month, and certain date, you have this and that. And everyone knows that, not only from Banja Luka, but everyone from the region, and everyone are looking how to go there. And over here, we don`t have that. I think some (name of the festival) had been started, but as far as my information goes, that is the project that will not be realized again. Therefore, literally, we don`t have any advantage, and simply, nothing is being done, and the main culprits for nothing being done are people. And, people who made Exit, they were going, searching, improving themselves, searching, I say again, our main driver are human resources. I say, why would someone come from Belgrade over here, his child, I don`t know, training tennis at the Djokovic's Academy, and now he is supposed to come to Banja Luka, someone training swimming is supposed to come...not to speak of Trebinje, and Bileca, all that part which is as it is. So, those are some personal things. Could that be improved, how could that is improved? It is possible, but many painful
166
things. I don`t know. In a sense, not to do some things which are being done. Money that is available, and that will be available, to be redirected in some other direction, in some...
Over here, in Balkan countries, I am watching, an agreement is being made between the government and some representatives of some interest groups. As soon as, I don`t know, some organization has come and made an agreement with the government they have come for their interest, not the public interest, I mean interest of all people in that group or organization. In principle, by me, a decision, which is satisfactory for all is not a good decision. How can a decision be good if it is satisfactory for all? It is impossible. Decisions have to be made, which are strategic, and that have long-term effect, and not the short term effect. And, as long as those decision are not made, and I am not seeing them, not over here, nor in Serbia, nor in Croatia, nor Federation, then it will remain the same like it is. Nothing can fall from the sky. We cannot discover the oil now, and say it is Norway now. Because, if we found it, it wouldn`t be Norway. In fact, a lot of things have to be disrupted, and the main problem is the consciousness of the people.
Interview 3
The history is not very long. The company exists for a little more than three years. Production activities are moving pictures and modern technologies, meaning video materials, movies, adverts, music videos, and experiments with some modern technologies, for example, mapping interaction in relation to some cameras, analysis of movement, etc., and implementation of all that into moving pictures. When I say moving pictures, I cannot say only advertising and movies, when we are doing some experimental things, it is all connected to production of video pictures, predominantly through animation
We are seven and a half, because we have one student. Laughs. We are seven. I am the owner, founder, director, and the chief animator.
Well, we have three types of clients. The first type are foreign, those are all commercial, mainly we work for foreign, 60% of the company business is for foreign clients, via the Internet, second type is local, commercial part, which we do sporadically, depending from projects. The third part is local, but of a non-commercial nature. We always try to have something happening in the house, bigger or smaller project, which we do with some other organization, individual, or something for our own soul.
Do you think the location in the narrow or broad sense? Do you think the address in Banja Luka or Banja Luka? Depends on how you look at it. Of course, if we were in New York, we would have more work, and we would be paid better, but we would have better competition as well. Thanks to modern technologies, we do not have to be in the place of the work, so if you ask me, I would like to go to countryside, and work from there...Regarding location, it is important in a sense that it is harder to reach bigger clients from a smaller community. Foreign clients that we work for are small over there, very small. We know that we are worth more and that we produce better quality, but simply we cannot reach a bigger, serious company just like that. It will take longer. I think that we haven`t been around for long, and our connections with foreign clients are limited to a series of accidental contacts and recommendations with individuals, and not that we have made something globally phenomenal so everybody is looking for us. We
167
dig with the hands and feet to get some work. We are not complaining, we have enough work, we are not earning big time, and we don`t have some big profits at the end of the year, but we have enough to pay salaries. Our client from Ireland, that we have for two years, it is an average furniture chain. Over there it is an average company, over here it would be minor.
It depends, it depends, if it is a huge project, and everybody cannot accomplish everything, than we complement one another. We have good relations and cooperation with everyone and it only depends from a project to project. It is very specific. it is not, like, some, I think on that companies that work in economics or law, or something that is interpreted in the same way that something. It is a question of a creative work, where, I don`t know, if it is shared among several companies, it is shared on different segments of work. For some events, some will be dedicated to graphic design, others will be dedicated to production of materials, and everything, and there are cases like that. Often, the next job that we are working on; there is a clear division, because it is a huge event so it is divided. We also cooperate with others. This is relatively small community, we cooperate in a sense that we are borrowing or lend equipment one from the others. Some have audio studio, some have a little bit more lighting, some have a little bit more computers, like us, and then we complement each other, shift work to others, etc.
Unfortunately, not that much. Because, we, specifically, work on video, animation, which is very expensive, and painstaking toy, and if institutions need some video materials, they would rather search for someone with a camera, rather than for someone with a computer. So, we do not cooperate (with institutions) that much, we are hired only for some specific cases, when they need some animation, advert or something, but it is rare. But some general, long term cooperation we do not have with any institutions, state.
At the Academy (of Arts) they do not have the department that we need. We need Animation, and there are talks that there could be something in a few years, but at the moment all people that work here are self learners, they learned via the Internet, tutorials. It is only me who focused through the school, online, which was in San Francisco, Emerwille. Well, I am the only one who directed himself. There is no school like that over here, and it is very hard to get human resources, good human resources. There are many people who would try something, we give an opportunity to all of them, we train as well, sporadically, there is no regular training or something, but it is still new sector of industry, so it will eventually appear. It is hard to get human resources. There is only few of us in Banja Luka, Republika Srpska, BiH. You can count people who are seriously doing that on fingers of two hands, let alone to have 100 people so you can choose that. There is no chance. There is even a joke. In our company we are all male. I say call a girl who is competent in the field, we will give her a job immediately, just for the balance. But there is none. Girls are less interested in that.
It can depend (on the size of the city) but not necessarily. Specifically, Czech Republic, not to talk only about computer animation. Regarding human resources yes, (we are limited in Banja Luka), but not because Banja Luka is small, but because it does not have tradition. That is why I mentioned Czech Republic, over there animation is very developed, and Czech Republic is much smaller (than the USA), like, I would dare to say that, for some quality of animation, it can stand shoulder to shoulder with big global centers, with the USA, I don`t know. Only, they produce fewer movies. The catch is that
168
they are doing animation for 50, 100 years , they invest in that, they have great people, human resources, they train each other, and they have tradition, and by that they are have a lot of new animators.
We are specific; we only depend on the good Internet, and nothing else. Of course, it is convenient if people can arrive by bus, or something. When we were choosing location, the most important thing was if we can connect the Internet link which is good enough. Since, some providers have abnormal conditions to give us such a good Internet, and others have great conditions, but they do not cover all parts of the town. And, then, primarily, that was the reason for having powerful Internet over here. And then, after that, to be close to the center was important, simply to do some things more practically, and if there was parking, and if there is a bus connection. Our present location, since we moved three times, is the best. We are in the center of the town in five-ten minutes, by foot, we always have a parking, and the Internet is very good.
(Being close to the center) is not important for the work, but more to go to different meetings, it is for work as well, but it is not necessary that much. But, since, we are more, like, the creatives, we are not the bankers, to have fancy cars, or something, we are more on foot, or we use bicycle, so relatively it is important that we are not in, like, Shargovac. Although, if we had better, the best conditions in Shargovac. If we had an opportunity to build a studio where we would feel very good, we would solve that probably. We would only look for a bus nearby or something like that.
Considering that it is about sitting at the computer for a long time, it is important to have an option for some physical activities. In our previous space, we could put table tennis, and we used a lot, because it helps us a lot to shake a little bit after sitting at the computer. Now, because of circumstances, thanks to the crisis, moving, we crammed in the smallest possible space, and then we go outside for some recreation, individually or together. In general we are always searching for some additional physical activity because of computer. Other thing is connected to comfort., which, especially the creatives need, they need separate offices, common area, spaces of different use so we can relax and express creatively, and problem with locations closer to the center, they are more expensive, and it is less and less space. If we went somewhere outside, or if we had money, earnings, for bigger studio, we would gladly go into something like that. It is generally, a tendency; with people who work in animation globally they would rather sacrifice some other things for comfort of the studio. I don`t know, Pixar, was going outside the city, and went to some location where they were able to make, practically, their studio, their little studio...
Airy space, a possibility for some physical activity, table tennis, billiard, darts, to be placed in that space. Outside space, a little garden to relax... or some near forest for a walk, and a possibility to put some sofas, and beds so someone can relax. And some standard things.
Only thing why it is important is because we like to follow on cultural events, and it is why. Otherwise, the center, as a center is not important at all. Not completely, but less important. Some moments that we had at the beginning, to we had to go to the bank, we solved that by internet banking, having bookkeeper is also solved. The aim of all those things, something that is comfort for me personally, is that I am less bothered with paperwork, stupidities so we can focus on work. To go back on the question of the center, it is not important that much for us; it is only that we want to feel as a part of the
169
community and surroundings we like to be somewhere close. If we were now in Trn or Laktashi, more rarely we would, now we learn that there is a concert or theatre performance, it would be more difficult, we would have to plan in advance. In this way, it often happens, OK, we have finished, we are getting there, let`s go to the Theatre, let`s go here or there, let`s go to bowling, and so on. It is much easier to make that decision. But, we could be comfortable in some suburban area, only if it is well connected by transport...
All our people are full time employees in the studio, and if there are some additional requests we hire freelancers. If something additional needs to be done, what we don`t know how or cannot. (Freelancers) are mainly from here, very rarely from abroad, very rarely via the Internet. Because, mainly, those things that need to be done can be completed here, and I try, if there are two same or similar to give an advantage to someone here, it is rare that we look for someone over the Internet. Generally, I don`t know how much you know about that, I started to teach animation ..., although, it is huge time burden. Financial benefit more or less, it sounds ridiculous, I am not there for money, seriously. I want to infect as many people as possible with animation, and I want to transfer that knowledge to them, because if they develop, I develop with them. My wish is, for example in five years, for this to be serious studio. Nowadays, what we have now is a toy, below 10 people. Serious studio of 30-40 people which will work serious, projects, big. We can come to grips with such things, but we need a lot of time. Animation is rather painstaking work. Whatever is found from such things, I give it to people around me. Firstly, when it happens to some draftsman or modeler that, to get interested, to try each other how we work together, and eventually, for him to get further jobs so we can cooperate. Firstly, it is for the desire to create better picture over here for work. It is not the question about money, if it is more expensive or cheaper, because our projects are still low budgets, than, abroad we cannot afford, when we search over the net, some top artists or workers. So, there is no big difference in price.
Well, firstly, (we are interested in) film, because we are dealing with that mostly, animation. But, in our cinemas, there are not many things like that, they have only blockbusters, so over the Internet, mainly, we access some more interesting works, and more broad selection. We are also interested in Theatre, also, fine art exhibitions, especially some installations which are hybrids of different things, and, of course, film and musical festivals, and so on. Mainly, considering our structure is varied, if you get us together over here, to tell you what we are about, I think we cover all cultural events.
We plan to stay (in Banja Luka). We plan to, in another 5 years or even earlier, to make feature animated movie, which would be more demanding project, and everything we are doing now, we are doing in that direction to gain, to pass those first steps that every company has to pass, to gain that financial stability, so 60% of the company does that commercial part, and 40% of the company does that sort of non commercial part, and to start that some movie. And the most important, the strongest, long term plan is that we want...from the beginning the story was started that we are equal. I am only the first one among equals, who started the story; any one of us could have done it. Of course, with that some responsibilities and privileges come with that, but, I don`t consider myself better or more worthy. I want that atmosphere to be created, generally, because in that case it will be easier and nicer for everyone to work over here, or anywhere. There are people who left, and I always wanted and helped them to go further...
170
There is one more thing important... it is very important. I wish if we, during a month, one day, or more serious amount of classes, days, dedicated to that part. At the moment, we only sporadically educate ourselves in certain direction. For example, we need something for a certain project, and then we go through those tutorials, or we get that knowledge from somewhere, or we ask someone, or what do I know. It would be much better if we could to afford something that we cannot at the moment, and that is to send individual people to some specialization, or Online, what most of the schools regarding animation do, where they specialize Online in certain segment. Unfortunately, still we cannot do that, because ... at the moment we can only survive, to earn enough for living. The aim in the future is to move that balance, to get bigger projects, because, by the quality and by the comparison with someone abroad...we are three times cheaper, and we offer the same quality. So, we don`t need to be three times cheaper, we can be twice cheaper, and we will be better off immediately, because we will have more left over at the end of the year for specialization, to work less commercially, and more what we like, and that is the aim in the future.
Most of them (people who left the company) went abroad for better salary. Not most of them, but all of them. Only one of them got fired, because he was very foolish. All others, we are in great relations, they are all abroad. In Slovenia, Dubai, etc., some similar exotic destinations where they have got two or three times bigger salaries.
Interview 4
(The company) was established about one and a half years ago. Although, we are relatively young company, all the people, our team which has got together, got together from the project (name of the project). The project was donated by the (name of the country) government for the purpose of improving healthcare in Bosnia and Herzegovina. The project was conceptualized as an inter-entity project, where Federation and Republic of Srpska got involved, and (the company) was initially created as a company which will be technical support, in a sense of creation of texts, multimedia content for portal, e-portal, internet portal (name of the portal). It is not the main activity of the company. The company is promoted as a content provider, someone who produces or integrates contents, whether it is textual content or ... or multimedia content, animation, etc., etc. The company promotes itself as a general content provider. With a progress of the project, we profiled ourselves as a content provider for the sector of education. When I say that, I mean, electronic courses, digital courses that we developed for the project, plus, mainly in the field of medicine, linked to education, and for electronic courses for the (name) center...That divided us, on one side we have e-education, and on the other side we have copyrighting, original work. And, we can say that the company does those two things. As I said, we were established one and a half years ago. We came over here, the beginning was marked with entering the center, and we passed all the procedure. Application, commission, marketing plan. We established the team of some, between 9 and 12 people, depending on some needs. That was the team of some 9 to 12 people, plus external associates, I am talking here about the people who are on the pay list of the company, plus some 5 to 10 external associates, who have worked over here according to the needs. Regardless, whether it was people working in IT, designers , or experts from
171
some area, that we were covering at that moment; management, business, medicine, and so on..
My role in the company is general executive director, considering that I am the owner of the company. At the moment, my role is, like in the past one and a half year, is executive, general director, and although those things will change together with needs, with expansion of the company. Expansion of the company means that new positions will appear, probably my role will be less important, and some new positions will appear.
What is specific for (the company), I said that we started from the project, and around 80% of the company was involved in that project, implementation of the quality of healthcare in BiH, the donor was (name of the country) government, which means, they were our direct client, most of the funding was coming directly on our account in regard to that project. This means that was our biggest client at that time. Considering that the implementer was (name of the NGO), nongovernmental organization, so some of the money was coming from that side. With the completion of the project, at the end of August, that cooperation with (name of the country) ended and (name of the NGO), however, what good came out of that is that contacts had been already established, so we can say now that we managed to, some of our products, two main products, two main services, we managed to sell in (name of the country) market, by using those contacts. (Name of the NGO) remained our client, not on that project. And now, by finishing that project we expanded our sale capacities, and, we gained some bigger clients, Ministry of (name of the ministry), (name of the university) university, (name of the centre) centre, (name) centre, we have that partnership relation. Our aim now is to develop sale capacities over here, and abroad, regarding... Correctly, (abroad) those are private companies. In our case those are medical institutions, clinics that we work with. We work with them on the subject of e-learning in the subject of medicine. Considering, it is our main business activity.
With our clients we try to establish client-partner relations. Our clients are automatically our partners, because we try to find some way of joint action towards some third parties. I would also add University in Banja Luka, as the biggest university in RS, with whom we have had excellent cooperation, and whom we donated some things, we donated web site, hosting, etc., to create, of course, better conditions, better...work, and nowadays we cooperate with them, with university or university (name of the center) center, which is a part of the university, a sovereign part.
We, our product, the company that was doing, from which we transferred the product, our platform for e-learning, is being used in (name of the city). After publication of the latest version of the platform we will try to establish the same contact with the university in (name of the city), but regarding the cooperation, it is mostly (name of the university), and University (name for the center) center Banja Luka.
All the people who are employed here, came over here after we published job adverts on posao.ba, Mali Oglasi, etc., etc. We did not have cooperation with the University regarding recruiting human resources. Also, the University didn`t have its database of students, so we could say... They also came for the interview, very little percentage of them are graduates, most of them were professionals who were capable immediately to join the project to earn. We have a continuous program, constant (job) add for young students. At the moment, we have two students from (name of the Faculty), department of design and multimedia, and one student from (name of the
172
Faculty) who is in training, in the software, IT department. So, we have that communication with students, new generations constantly. At any time we have one, two, or three students who are here on a practice.
Thanks to conditions that we have in (the center), except the networking with other companies, I`ve forgotten to mention them, I don`t know why. I will add. We had, with many companies from (the center), who are tenants of (the centre), we had before, and have now, cooperation, we work on joint projects, what is one of benefits of (the centre), networking, outsourcing. On the other hand, (the center) has rich program of educational courses, that we send to our employees, depending on needs, who is capable of what, so we use (the center) for education of the employees.
(The center) has an excellent infrastructure, regarding the Internet, considering it is in the centre of the town, I would say (the centre) has excellent conditions. So, we are, in relation to other companies at an advantage. The Internet means a lot to us, it really means a lot, I would say more than 50% of all communication happens over the Internet, and there is no problem with that. (The center) location is excellent, the infrastructure is excellent, everything is renovated, quite new. Regarding the infrastructure, we don`t have any problems, I think we are at an advantage, we have conditions that are rare in Banja Luka, I do not know what the situation is beyond.
When we look at the projects we do, the only part, only events that we cover with our work are events connected with the healthcare, regardless of whether these are the days of diabetes, AIDS, etc., etc., together with the Ministry, we follow those. Regarding other events, we follow them in the context of, like sport activities, because of the healthcare. For other events, we follow them, if there is a need to introduce ourselves as a media. So, we follow events on Media Fest, days of diabetes, in that respect.
Most of our communication and most of our work is done, for example in this room, via conference, with (name of the country). Banja Luka is the centre of Republic of Srpska, the capital, and regarding hotels it is excellent. We do not have ultra-luxury hotels; I think that no one is expecting that. The infrastructure is solid, well connected, location of (the centre) is direct with..., there are really, really, no problems, because, as I said, our main communication is via the Internet, via Skype conference, emails, brochures, sales, etc., etc. Even with some internal, local clients bad infrastructure is a smaller problem than bad Internet..
Look, when it comes, I always divide that according to activities, when it comes to journalists, editorials, there is a huge number of journalists, graduated journalists, but when we talk about real knowledge, real experience, there comes the problem, because it is difficult to find someone who is, in small companies like ours always, multidisciplinarity is something that is always looked for. For journalist to be somewhat technically educated, and to have insight into the subject that he is writing about at the moment. it is really the problem, but situation in there is even good, in comparison with the situation with creative and IT part. First of all, people from the university don`t come as really educated, really people who could straight go to work, people who can quickly become competent at work. We train them, big part of the time, up to half a year, and then they become capable to work on something. That`s why we decided now, since a year ago, not to wait, but to bring students to the practice, to train, to get that sense of work, to work on real project, and eventually to filter those people to employ them full time. That is the only chance, otherwise, they either are already working and have good
173
wages, or they work for the State where they have some security, so the only way is to train people before they come to work with us.
IT human resources, creative human resources are completely in deficit. Completely in deficit. I said, copyrighting, editorial, those are things that you can find, even economics is well covered, marketing, sale, all that is on some solid level. You can find an expert for an acceptable price. IT sector, software, design,...design, animation , multimedia. First of all, there is no faculty which is really educat..., legally speaking, there is a faculty for...Art Academy, and there is Communicology for multimedia Internet. But, the quality of teaching, lectures, I had a chance, now I talk to much, to see tests from that department. I think, assistant professors who teach that should not teach in that way, with such a low level of knowledge, but I think in all that the problem is that there is no something you call demanding client over here. Demanding client makes good programmer, designer, good expert. If the client doesn`t know what to look for, that level of the quality will be average.
(The company), we did strategic plan, overview of all, overview of our business activities, we have made strategic plan, short-term for one year, and long-term for 3-4 years. (The company) will continue to promote content providing and generally e-learning, whether it is education of the older or university education, that is the rout we are taking. Something that we will change, expand, is the way we distribute all that, whether it is IPTV, mobile telephones, only the way of distribution will change, but (the company) will continue to be a company for production of content, integration and support of e-learning.
174
APPENDIX III – QUESTIONNAIRE
Do you find the city of Banja Luka attractive?
Numerous studies have documented the massive departure of young and educated people from Bosnia and Herzegovina. Since the success and future of the city depends on the Banja Luka smart and educated, the purpose of this questionnaire is to examine the factors that make highly educated people to choose to stay or move to Banja Luka, issues that worry them and what they are dissatisfied with. Questions in the questionnaire relate to life in the city, places to hang out, recreation and entertainment, pleasure, workplace and place of residence. The research results will be used for work on the subject of mobility and migration of highly educated people. Please answer the questionnaire if you:
have continued education after high school,
are permanent or temporary resident in the area of Banja Luka,
It should take 20 minutes to complete the questionnaire. Thank you for your time and effort. NOTES:
All questions marked with * must be answered to advance to the next page of the
questionnaire.
All information is strictly confidential and will only be used for this survey!
Questions and suggestions can be sent by email to: bl.istrazivanje (at) gmail.com.
175
SECTION A – LIVING IN BANJA LUKA:
A1) How long have you lived in Banja Luka (select only one response by placing √ ): Less than 1 year Between 1 and 2 years Between 2 and 5 years Between 5 and 10 years More than 10 years
A2) Where did you live prior to moving to your current address? (select only one response by placing √ ) : Never moved/Always lived in same place In Banja Luka but other neighborhood Another city in Republika Srpska Another city in BiH Outside BiH Outside Europe
A3) Please rank the 4 most important reasons why you currently live in Banja Luka (1 being the most important and 4 the least important – please choose only four reasons) Born in Banja Luka Family lives in Banja Luka Studied in Banja Luka Proximity to friends Moved to Banja Luka because of my job Moved to Banja Luka because of my partner’s job Good employment opportunities Higher wages Size of the city Weather/climate Good transport links Proximity to natural environment (sea, mountains, countryside) Housing affordability Housing availability Housing quality Safe for children Openness to different types of people (in terms of race, ethnicity) The citizens of Banja Luka are open-minded and tolerant Gay/lesbian friendly Language (able to communicate with foreigners) Overall friendliness of city Diversity of leisure and entertainment facilities Cultural diversity Diversity of the built environment Presence of good universities Presence of good schools Other reasons (please specify)
A4) Which of the following most applies to you and your household? (select √ only one answer) I wanted to live in Banja Luka and so I found employment here My partner wanted to live in Banja Luka, so we found employment here I live in Banja Luka because I found employment here I live in Banja Luka because my partner found employment here Not applicable
176
The following questions are about your experiences of Banja Luka as a city and how satisfied you are with aspects of living in Banja Luka. A5) How often are you involved in any of the following activities? (rate with a √ each activity) :
Almost never
At least once a year
At least once a month
At least once a week
Every day
Going out to the pub/bar Visiting coffee shops, during the day Eating out Going to movie, theatre and/or concerts Going to museum and/or art gallery Walking around city centre Excursions in parks or peripheral green areas Going to a night club Going to sport events Going to city parks Going to a festival (when happening in the city) Visiting friends Participating in resident’s associations Participating in religious activities Participating in community work Participating in political activities (trade union, political party, etc)
Others (please specify)
A6) How satisfied you are with the following leisure activities offered in Banja Luka (evaluate each activity with one √):
Very satisfied
Satisfied Neither Dissatisfied Very
dissatisfied
Quality of public spaces (plazas, parkas, etc) Quality of sport facilities The quality and range of festival events and cultural activities
The quality and range of art galleries / museums Quality and range of libraries Quality and range of restaurants Quality of bars and cafés Quality of cinemas Quality of shopping areas Architecture of city/relevant monuments Number of associations/ organizations for social activities
Quality and range of fitness centers Quality and range of saunas, spa and wellness centers
Other (please specify)
177
A7) How satisfied you are with the following public services offered in Banja Luka (evaluate each activity with one √):
Very satisfied
Satisfied Neither Dissatisfied Very
dissatisfied
Quality of public transportation system Transport within the city – all types Connectivity between city & periphery Safety on city streets Police services Municipal police services Number of bicycle lanes Quality of tourist attractions Social security Quality of health services Quality of the university education Quality of the high school and elementary school education
A8) How would you rate the following environmental aspects of Banja Luka (evaluate the environmental aspects with one √ for all items):
Very satisfied
Satisfied Neither Dissatisfied Very
dissatisfied
Pavement condition of city streets and sidewalks Condition/cleanliness of city streets and sidewalks Recycling collection services Quality of drinking water Garbage/waste collection Cleanliness of facilities in city parks Care of trees and city parks Traffic congestion Availability of parking space Levels of use of bicycles as a means of transport Levels of noise in the city Air pollution Quality of children playgrounds Tidiness and cleanliness of rivers and river banks Other (please specify)
178
A9) How worried are you are about the following issues in Banja Luka? (evaluate the level of concern with one √ for all items)
Very worried
Somewhat worried
Not particularly
worried
Not worried
Not worried at all
Amount of crime in the city Safety Availability of recreation for teenagers Availability of affordable housing Availability of recreation for seniors Availability of jobs Quality of university education Quality of secondary and elementary education
Quality of kindergartens Availability of public transportation Availability of recreation for children Amount of graffiti Drug problems Homelessness Aggressive/anti-social behavior Prostitution on streets Behavior of traffic participants Air pollution Maintenance of trees and green areas Demonstrations in the streets Illegal construction Lack of bicycle lanes Lack of sidewalks Quality of medical services Presence of smugglers, dealers Appearance of building facades and shop windows
Other (please specify)
A10) The cost of living in Banja Luka (evaluate all the costs with one √) Very
expensive Expensive Average Cheap Very cheap
Housing cost (mortgage, rent) Cost of basic services related to the house (water, electricity)
Cost of leisure activities Costs of education and training Transportation costs Cost of food and beverages General cost of Living
179
A11) Which is the main mode of transport you and other household members normally use to get to work/college/school or in your/their free time? (Please tick one box for each household member)
Kinship (dropdown list)
Mode of transport
(dropdown list)
yourself member 1: member 2: member 3: member 4: member 5:
A12) On average, how often do you and other household members use public transport facilities?
Kinship (dropdown list)
How often (dropdown list)
yourself member 1: member 2: member 3: member 4: member 5: A13) On average, how long does it take you to travel to work? (√ tick one answer) I work from home Less than 15 min 15-29 min 30-44 min 45-59 min 60- 90 min More than 90 mins A14) Generally, how far do you travel to get to work? (√ tick one answer): I work from home No fixed place Under 1 kilometre 1-4 kilometres 5-9 kilometres 10-14 kilometres 15-29 kilometres 30 or more kilometres Don’t know A15) How many cars does your household own? (√ tick one answer) None 1 car 2 cars 3 cars or more
180
The following questions are about how tolerant you think Banja Luka is as a city.
A16) To what extent do you agree with the statement that Banja Luka (√ tick one answer): Strongly agree Agree Neither Disagree
Strongly disagree
is welcoming place to people from other countries
accepts all ethnic groups accepts the gay population/LGBT accepts the minority religious and ideological groups (Jehovah's Witnesses, Rotarians, Masons, etc.)
accepts the differences between rich and poor (people with large and low income levels)
We want to ask you about your overall satisfaction with Banja Luka as a city
A17) Do you think that the quality of life in Banja Luka has gotten better, stayed the same or gotten worse in the last five years? (√ tick one answer) Improved Stayed the same Gotten worse Don’t know Please say why:
A18) If you have lived elsewhere for 1 year or more (not as a tourist), how would you rate Banja Luka as a place to live, compared to other places you have already lived in? (√ tick one answer): Not applicable (I have not lived in another city) The best place in which to live A much better place in which to live A slightly better place in which to live A slightly worse place in which to live A much worse place in which to live The worst place in which to live
A19)If you have lived elsewhere for 1 year or more (not as a tourist), please write down where.
City Country
A20) Typically, where do you spend your weekends? (√ tick one answer) At home In Banja Luka (but not at home) Out of Banja Luka but in Republika Srpska/BiH Out of Banja Luka / but in Europe Don’t know ne znam
181
A21) All things considered, how satisfied are with your life in Banja Luka? Please mark with √ on a scale of 1 to 10, where 1 means very dissatisfied and 10 means very satisfied. Very dissatisfied
Very satisfied
1 2 3 4 5 6 7 8 9 10
A22) What is the likelihood of you moving away from Banja Luka in the next 3 years?? (√ tick one answer)
Mark one with √
Where? Why?
Almost Definitely Very likely Somewhat likely Not too likely Not at all likely
SECTION B. SATISFACTION WITH JOB AND WORK ENVIRONMENT:
The questions that follow are related to your job and where you work and about how satisfied you are with various aspects of your working life. (Select a response by placing a tick √ in the appropriate box) B1) What is your current employment status? (√ tick one answer)
Current status Employed Self employed / freelance Unemployed
B2) What is your current profession/occupation? Marketing and PR, advertising Architecture Art galleries, dealers in arts and antiques Arts: music, fine art, literature, theatre Design, applied arts Creative crafts Newspapers, printed media / publishing, books, web Video, film, photography Music production TV and radio ICT (Information and communication tech.) - software ICT (Information and communication tech.) - hardware Financial intermediaries Legal and other business services Management, consulting New product development Engineering, new technologies, processes, R&D College, university and HE teaching professionals Other (please specify)
182
If you are not employed skip the rest of section B and go to section C B3) Who is your employer / where do you work? Government / state-owned company Privately owned company NGO (non-governmental organizations) Owner/co-owner of a private company Freelance / contract work Student
B4) What is your contract status in your current job? (√ tick one answer) On an unlimited permanent contract On a contract for a specific project On a fixed term contract of less than 12 months On a fixed term contract of 12 months or more On a temporary employment agency contract On apprenticeship or other training scheme Without a written contract Don’t know B5) What is your current occupation? B6) Please describe in a few sentences what your current job entails:
B7) Including yourself, about how many people are employed at the place where you usually work/worked? (√ tick one answer) Only employee Under 10 10 to 49 50-99 100-249 250-499 500-999 1000 – 1999 2000 or more (Don’t know)
B8) How long have you been in your company or organization altogether? Years: Months:
B9) How many people, if any, work under your supervision? Enter number
B10) How many hours do you usually work per week in your main job? (√ tick one answer) Less than 20 hours per week 21 - 30 31 - 42 43 - 55 More than 55 hours per week Varies over week Don`t know
183
B11) Do you have additional job? Yes No
B12) How many hours do you usually work per week in your additional job (√ tick one answer)? Less than 20 hours per week 21 - 30 31 - 42 43 - 55 More than 55 hours per week Varies over week Don`t know
B13) How satisfied are you with the following aspects of your job? (√ tick one answer)
Very satisfied
Satisfied Neither Dissatisfied Very
dissatisfied The sense of achievement you get from your work The scope for using your own initiative The amount of influence you have over your job The quality of the working environment (appearance, air-conditioning, toilets)
The facilities in the workplace The intellectually stimulating aspect of your job The friendliness of the work environment The training you receive The amount of pay you receive The amount of holiday time/paid leave Job security The ability to balance your professional and personal (family, friends) life
Ability to meet and network with professionals from the same field
Respect for the rights of employees (vacation, sick leave, overtime, etc.)
Overall satisfaction with the job
B14) How long do you expect to remain in this company/organisation? (√ tick one answer) Less than 6 months Less than 1 year Between 1 and 3 years More than 3 but less than 5 years Between 5 and 10 years More than 10 years Don’t know B15) If you expect to leave the company/organization in the next year what are the main 2 reasons in order of priority? (mark with number 1 more important, and with number 2 less important reason – choose only 2 reasons from 8) To seek a more interesting job To seek better pay To seek a less stressful job To seek better conditions My work contract will be over I am moving out of Banja Luka I am leaving the country Other reasons
184
SECTION C SATISFACTION WITH YOUR NEIGHBOURHOOD AND DWELLING:
Next are some questions about how satisfied you are with the neighborhood that you live in and about the dwelling that you live in. Select a response by carefully placing a tick √ in the appropriate box. C1) Where do you live (√ tick one answer)? City centre Rest of the core city (just beyond city centre) Rest of the city, including the outskirts Village or small town in area of Banja Luka Medium or large town in area of Banja Luka Don’t know
C2) How long have you lived in this neighborhood/area? (√ tick one answer)? Less than 1 year Between 1 and 5 years Between 5 and 10 years More than 10 years
C3) How satisfied are you with the following aspects of life in your neighborhood/area? (tick one √ for each aspect)
Very satisfied
Satisfied Neither Dissatisfied Very
dissatisfied
Nearness to employment Personal safety The level of traffic noise The level of pollution The provision of childcare facilities The provision of healthcare facilities The level of social interaction between neighbors Appearance of the neighborhood Access to commercial facilities (food, chemist, etc) Access to public spaces (parks, etc) Access to public transport Overall quality of life in the neighborhood Cultural and sports facilities in the neighborhood Parking places in the neighborhood
C4) Has living in this neighborhood/area generally lived up to your expectations? (√ tick one answer) Yes No
185
C5) How important were the following factors in your decision to move to your current residence? (Tick one √ for each factor)
Very important
Important Neither Not
important Completely unimportant
Distance from home to work Time length of travel to work I didn’t have a choice Cost of dwelling Size of dwelling Availability of private open space (e.g. balcony, gardens)
Proximity to family/friends Closeness to services/facilities Proximity to public transport Proximity to major roads/highways Nearness to pubs/nightclubs Closeness to city centre Proximity to universities Proximity to good quality schools Availability of kindergartens Availability of leisure facilities The quality of the surrounding neighborhood Closeness to public open space (e.g. parks, playgrounds
The neighborhood atmosphere
C6) How satisfied are you with the following aspects of your dwelling? (tick one √ for each factor) Very satisfied Satisfied Neither Dissatisfied
Very dissatisfied
The overall size of dwelling Storage space inside The size of the kitchen The size of the bedrooms Outlook from the dwelling The security of the dwelling Provision of open (garden) space Physical quality of your dwelling Parking space The level of noise from neighbors (if in apartment building) The quality of management/maintenance of building
Other (specify) C7) Which of the following best describes your accommodation? (√ tick one answer) Own without mortgage (i.e. without any loans) Own with mortgage Tenant, paying rent to private landlord Tenant, paying rent in social/voluntary/municipal housing Accommodation is provided rent free (living with parents, relatives, friends, etc.) Other I don’t know
186
C8) If you are renting, what percentage of your monthly income (after tax) is your rental payment? (√ tick one answer) 0-10% 11-20% 21-30% 31-40% 41-50% 51-60% More than 60%
C9) If you are purchasing, what percentage of your monthly income (after tax) is your mortgage payment? (√ tick one answer) 0-10% 11-20% 21-30% 31-40% 41-50% 51-60% More than 60%
C10) All things considered is your monthly rent/mortgage (√ tick one answer) Very easy to afford Easy to afford Just about affordable Not easy to afford Very difficult to afford
SEKCIJA D – DEMOGRAFSKE KARAKTERISTIKE:
This is the last section of the questionnaire on some important background information on you and your household. D1) Please indicate your gender. Male Female
D2) Which of these categories best describes the household you currently live in? (√ tick one answer) One person I live with my parents Husband and wife /cohabiting couple Husband and wife (or cohabiting couple) with children Lone father / mother and children Husband and wife (or cohabiting couple) and other persons Husband and wife (or cohabiting couple) and children and others Single father / mother and children and others Two family units Non-family household containing related persons (brother or sisters) or non-related persons (friends, flatmates), but not in a marriage or partners Other (specify)
187
D3) Indicate the total number including yourself, of individuals living in your dwelling unit. (√ tick one answer): 1 2 3 4 5 6 or more
D4) Indicate local area where your current residential address belongs to: (√ tick one answer) Ada Dragočaj Lazarevo II Priječani Agino Selo Drakulić Ljubačevo Rekavice I Bistrica Goleši Mišin Han Rekavice II Bočac Gornja Piskavica Motike Rosulje Borik I Karanovac Nova Varoš Saračica Borik II Kmećani Obilićevo I Šargovac Borkovići Kočićev vijenac Obilićevo II Šimići Bronzani Majdan Kola Paprikovac Srpske Toplice Bulevar Krmine Pavići Starčevica Centar I Krupa na Vrbasu Petrićevac Stratinska Centar II Kuljani Piskavica Stričići Česma Lauš I Pobrđe Verići Debeljaci Lauš II Potkozarje Vrbanja Donja Kola Lazarevo I Prijakovci Zalužani I don`t know Other (specify)
D5) What is your highest level of education received? (√ tick one answer) High school 3 years High school 4 years Completed one or more years of college 3-years university degree 4-years university degree 5-years university degree Completed postgraduate specialist study MA, MSc Phd
D6) If you have a primary degree, in what year did you graduate? Specify year of graduation (enter the year with 4 digits, eg. 2002)
D7) Specify the primary study area (eg. economics, electrical engineering, etc.). The primary study area
D8) Where did you acquire your highest achieved level of education? Enter city Enter institution
D9) Please indicate the range that best describes your monthly income after taxes in KM (BAM). (select only one answer by placing √ ): below 500 500 - 999 1.000-1.999
188
2.000 - 2.999 3.000 – 3.999 4.000 – 4.999 5.000 – 5.999 6.000 – 6.999 7.000 – 7.999 8.000 – 8.999 9.000 – 9.999 10.000 or more Do not know / do not want to answer
D10) Please indicate the range that best describes your age (select only one response by placing √ ): Less than 24 25-34 35-44 45-54 55-64 65-78 78-84 85 years and more Do not want to answer
D11) What is your nationality (select only one response by placing √ ): Bosniaks Montenegrins Croats Roma Serbs Ukrainians Undecided Do not know / do not want to answer
This completes the questionnaire. Once again, thank you for your time and cooperation.