ORGANIZER SCIENTIFIC-TECHNICAL UNION of MECHANICAL ENGINEERING “INDUSTRY 4.0“ 13-16. DECEMBER 2017, BOROVETS, BULGARIA INDUSTRY 4.0 INDUSTRY 4.0 INTERNATIONAL SCIENTIFIC CONFERENCE PROCEEDINGS VOLUME 2 BUSINESS & “INDUSTRY 4.0” SOCIETY & „INDUSTRY 4.0” ISSN (Print) - 2535-0153 ISSN (Online) - 2535-0161
Transcript
ORGANIZERSCIENTIFIC-TECHNICAL UNION of MECHANICAL ENGINEERING “INDUSTRY 4.0“
ORGANIZERSCIENTIFIC-TECHNICAL UNION of MECHANICAL ENGINEERING BULGARIA
13-16. DECEMBER 2017, BOROVETS, BULGARIAINDUSTRY 4.0
INTERNATIONAL EDITORIAL BOARD EDITORS IN CHIEF: Prof. D.Sc. Georgi Popov, DHC, Technical University of Sofia, BG
Prof. Dr. Dr. Jivka Ovtcharova, DHC, Karlsruhe Institute of Technology, GE
Members: Acad. Igor Bychkov Institute for System Dynamics and Control Theory SB RAS RU Cor. member Alexey Beliy National Academy of Sciences of Belarus BY Cor. member Svetozar Margenov Bulgarian Academy of Science BG Prof. Alexander Afanasyev Institute for Information Transmission Problems RU Prof. Alexander Guts Omsk State University RU Prof. Andrzej Golabczak Technical University of Lodz PL Prof. Andrey Firsov Saint-Petersburg Polytechnic University RU Prof. Bobek Shuklev Ss. Cyril and Methodius University of Skopje MK Prof. Boris Gordon Tallinn University of Technology EE Prof. Branko Sirok University of Ljubljana SI Prof. Claudio Melchiorri University of Bologna IT Prof. Cveta Martinovska Goce Delchev University, Stip MK Prof. Dale Dzemydiene Mykolas Romeris University, Vilnius LT Prof. Dimitar Yonchev Free Bulgarian University, Sofia BG Prof. Dimitrios Vlachos Aristotle University of Thessaloniki GR Prof. Galina Nikolcheva Technical University of Sofia BG Prof. Gerard Lyons National University of Ireland, Galway IE Prof. Henrik Carlsen Technical University of Denmark DK Prof. Idilia Bachkova University of Chemical Technology and Metallurgy BG Prof. Idit Avrahami Ariel Univerity IL Prof. Iurii Bazhal National University of Kyiv-Mohyla Academy UA Prof. Jürgen Köbler University of Offenburg DE Prof. Jiri Maryska Technical University of Liberec CZ Prof. Katia Vutova Institute of electronics, Bulgarian Academy of Sciences BG Prof. Lappalainen Kauko University of Oulo FI Dr. Liviu Jalba SEEC Manufuture Program RO Prof. Luigi del Re Johannes Kepler University, Linz AT Prof. Majid Zamani Technical University of Munich DE Prof. Martin Eigner Technical University of Kaiserslautern DE Prof. Michael Valasek Czech Technical University in Prague CZ Prof. Milija Suknovic University of Belgrade RS Prof. Miodrag Dashic University of Belgrade RS Prof. Mladen Velev Technical University of Sofia BG Prof. Murat Alanyali TOBB University of Economics and Technology TR Prof. Nina Bijedic Dzemal Bijedic University of Mostar BA Prof. Ninoslav Marina University of Information Science and Technology - Ohrid MK Prof. Olga Zaborovskaia State Inst. of Econom., Finance, Law and Technologies RU Prof. Pavel Kovach University of Novi Sad RS Prof. Petar Kolev University of Transport Sofia BG Prof. Peter Korondi Budapest University of Technology and Economics HU Prof. Peter Sincak Technical University of Košice SK Prof. Petra Bittrich Berlin University of Applied Sciences GE Prof. Predrag Dasic High Technical Mechanical School, Trstenik RS Prof. Radu Dogaru University Politehnica of Bucharest RO Prof. Raicho Ilarionov Technical University of Gabrovo BG Prof. Raul Turmanidze Georgian Technical University GE Prof. René Beigang Technical University of Kaiserslautern DE Prof. Rozeta Miho Polytechnic University of Tirana AL Prof. Sasho Guergov Technical University of Sofia BG Prof. Seniye Ümit Oktay Firat Marmara University, Istambul TR Prof. Sreten Savicevic University of Montenegro ME Prof. Stefan Stefanov Technical University of Sofia BG Prof. Svetan Ratchev University of Nottingham UK Prof. Sveto Svetkovski St. Cyril and St. Methodius University of Skopje MK Prof. Tomislav Šarić University of Osijek HR Prof. Vasile Cartofeanu Technical University of Moldova MD Prof. Vidosav Majstorovic Technical University of Belgrade RS Prof. Vjaceslavs Bobrovs Riga Technical University LV Prof. Inocentiu Maniu Politehnica University of Timisoara RO Dipl.-Kfm. Michael Grethler Karlsruhe Institute of Technology DE
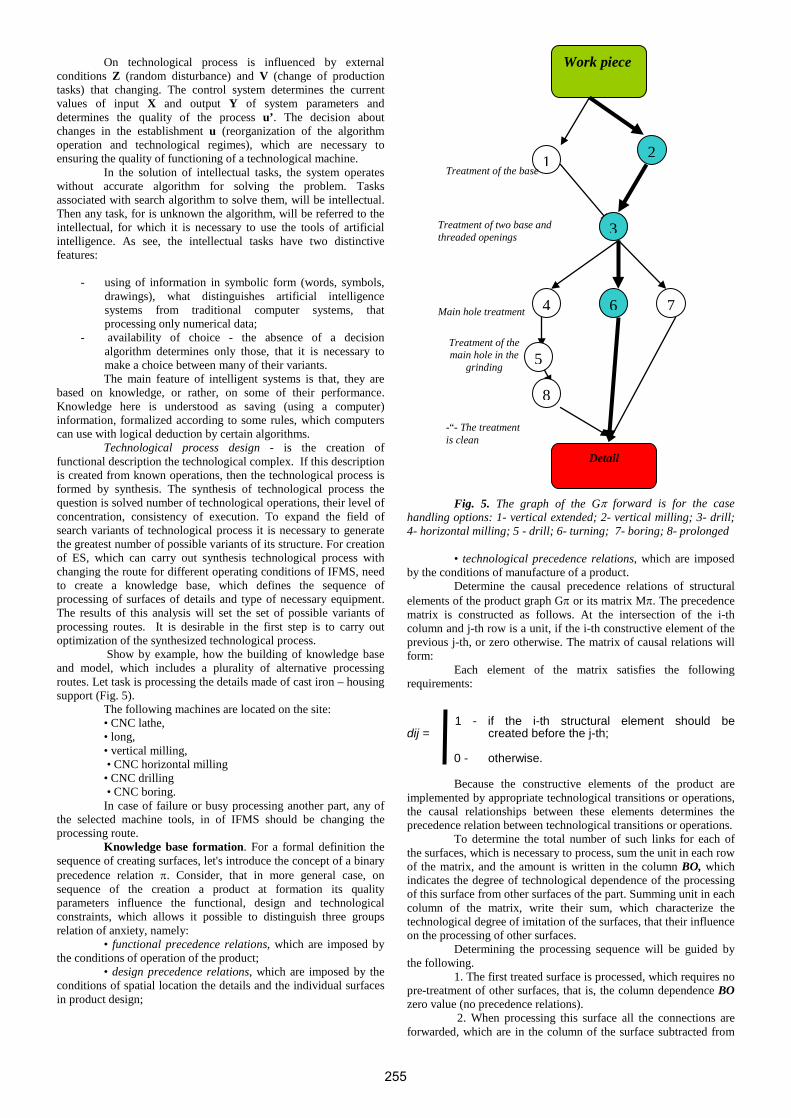
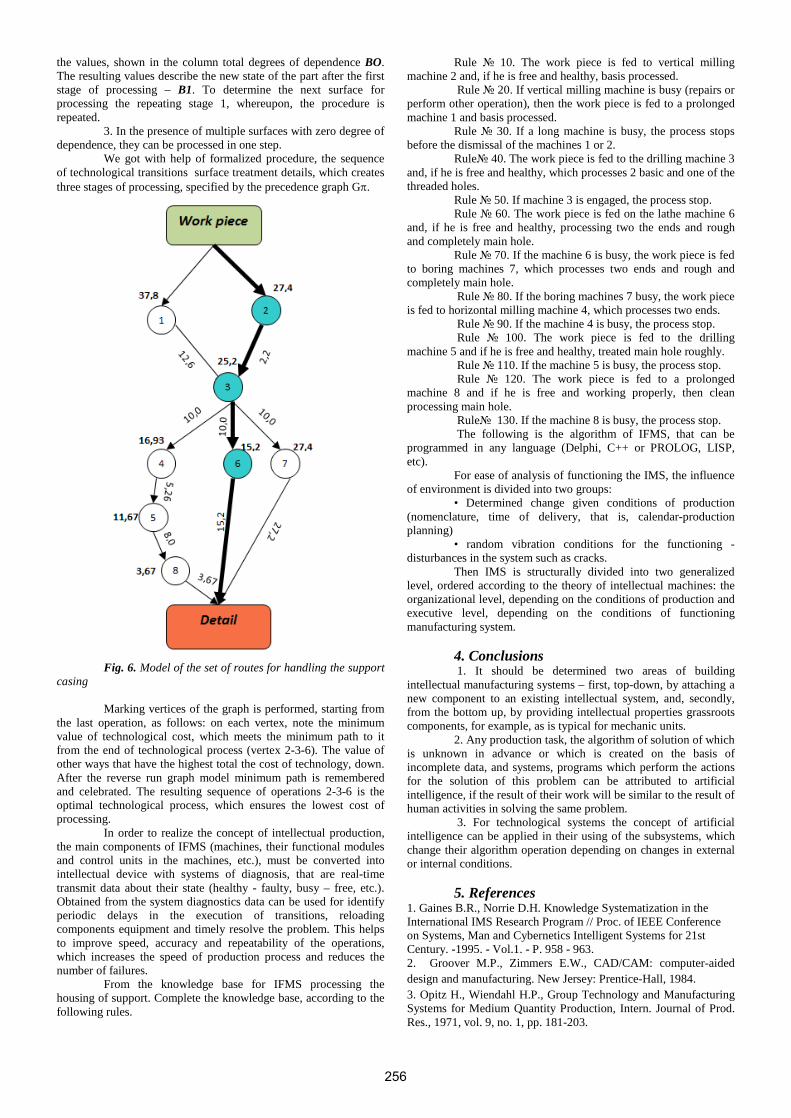
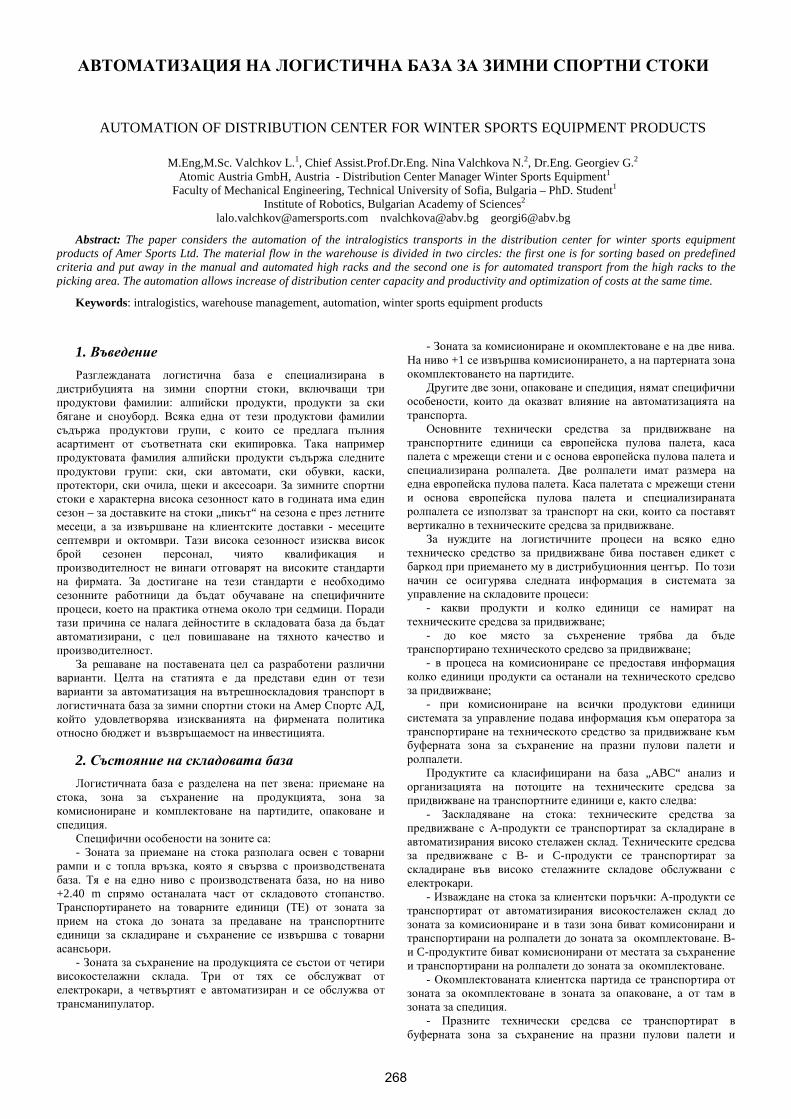
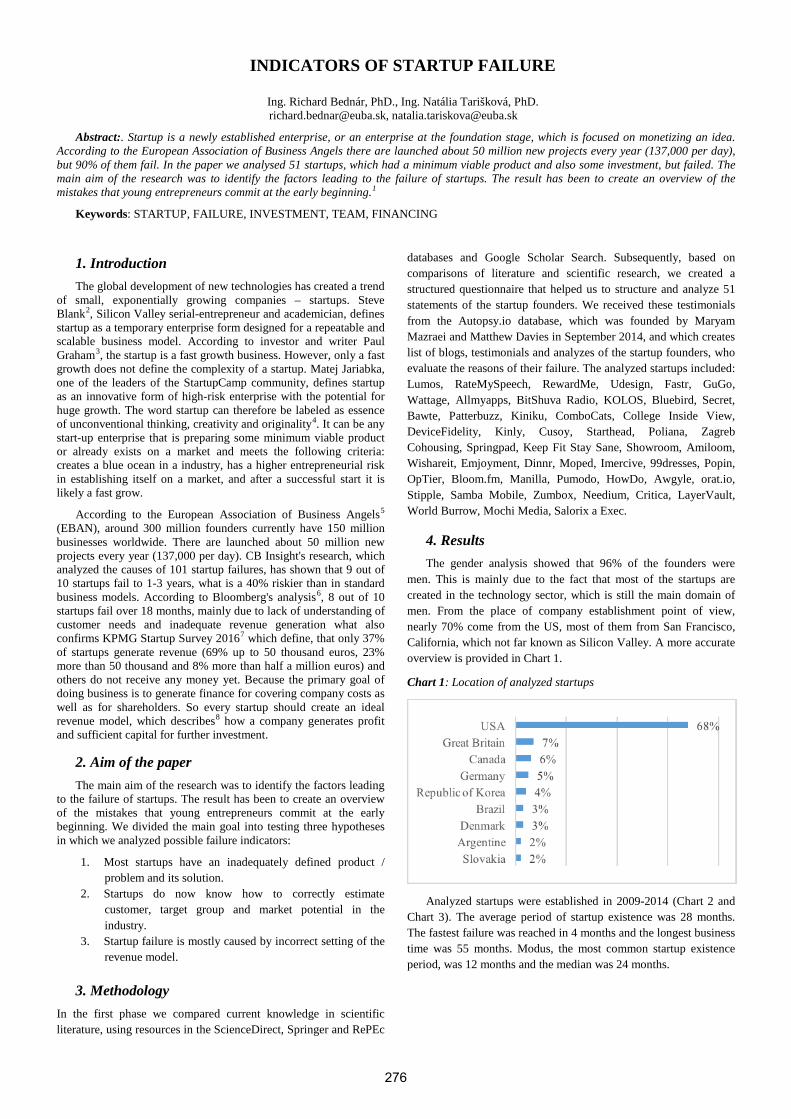
C O N T E N T S INDUSTRY 4.0 and TURKISH NATIONAL INNOVATION SYSTEM: CHALLENGES and PROSPECTS Erkan Erdil, Şeyda Ertekin ............................................................................................................................................................................... 209 COLLABORATION AND EVOLUTION SCENARIOS FORDIGITAL PRODUCTS, NETWOKS, ENTERPRISES AND DIGITIZATION OF THE EUROPEAN INDUSTRY .Haidegger Géza, PhD, senior CIM research fellow ........................................................................................................................................ 213 SOCIAL ASPECTS OF THE DEVELOPMENT OF THE CONCEPT "INDUSTRY 4:0": RISKS AND PROSPECTS FOR THE TRANSFORMATION OF HUMAN RESOURCES Prof. dr. Zaborovskaia O. ................................................................................................................................................................................. 220 ON THE WAY FROM INDUSTRY 4.0 TO INDUSTRY 5.0: FROM DIGITAL MANUFACTURING TO DIGITAL SOCIETY Dr.Sc. P.O. Skobelev, Dr.Sc. S.Yu. Borovik .................................................................................................................................................... 225 SUGGESTED INDICATORS TO MEASURE THE IMPACT OF INDUSTRY 4.0 ON TOTAL QUALITY MANAGEMENT Sami S. A. Sader, Professor István Husti, Miklós Daróczi .............................................................................................................................. 230 WHAT DOES INDUSTRY 4.0 MEAN FOR SUSTAINABLE DEVELOPMENT? MSc Tsvetkova, R. ........................................................................................................................................................................................... 234 THE ROLE OF PROJECT MANAGEMENT FOR SUCCESSFUL PERFORMANCE AND SUSTAINABLE BUSINESS GROWTH Rosaliya Kasamska, PhD Student .................................................................................................................................................................... 238 GEOENERGETIC ASPECTS OF THE TERRITORIAL DISPUTE BETWEEN THE REPUBLIC OF SLOVENIA AND THE REPUBLIC OF CROATIA Dimitrov M. PhD Student ................................................................................................................................................................................. 242 SCIENTIFIC-METHODOLOGICAL PROVISIONS OF FORMATION OF A VIRTUAL SEGMENT OF THE INFORMATION MARKET Doctor of Economic Sciences, Professor, Zhavoronkova G., PhD (Economics), Associate Professor, Zhavoronkov V. PhD (Economics), Associate Professor Melnyk L. .......................................................................................................................................... 247 THE POSSIBLE IMPLICATIONS OF TAX REFORM IN RUSSIA Prof. Dr. Elena Yrevna Sidorova ...................................................................................................................................................................... 251 PRINCIPLES OF DESIGNING AND DEVELOPING INTELLIGENT MANUFACTURING SYSTEMS OF PACKAGING Prof. dr. Palchevskyi B., PhD. Krestyanpol О., PhD. Krestyanpol L. ............................................................................................................. 253 MANAGEMENT OF THE VALUE ADDED MADE BY THE ENTITY USING SIMULATION MODELING Prof. Dr. Sc. Eng. Rozhkov I., Phd. Student Econ. Trofimova N., Prof. Dr. Sc. Econ . Larionova I., Prof. Phd. Econ . Kostyukhin Y. ....... 258 INTEGRATING OPEN DATA INTO COMPANIES’ BUSINESS MODELS FOR FOSTERING DIGITAL TRANSFORMATION Antonova A., Yordanova S. .............................................................................................................................................................................. 260 БАЛАНСИРАНА КАРТА ЗА ОЦЕНКА В УПРЯВЛЕНИЕТО НА СКЛАДОВОТО СТОПАНСТВО ЗА ЗИМНИ СПОРТНИ СТОКИ M.Eng,M.Sc. Valchkov L. ................................................................................................................................................................................ 264 АВТОМАТИЗАЦИЯ НА ЛОГИСТИЧНА БАЗА ЗА ЗИМНИ СПОРТНИ СТОКИ M.Eng,M.Sc. Valchkov L., Chief Assist.Prof.Dr.Eng. Nina Valchkova N., Dr.Eng. Georgiev G. ................................................................. 268 PARTICIPATORY SYSTEMS – A PARADIGM SHIFT TO ANSWER THE CHALLENGES OF AN INTEGRATED WORLD M.Sc. Jánoky L. V. PhD. Ekler P. .................................................................................................................................................................... 272 INDICATORS OF STARTUP FAILURE Ing. Richard Bednár, PhD., Ing. Natália Tarišková, PhD. ................................................................................................................................ 276 CHARACTERISTICS OF RADIATION AND SOURCES OF RADIATION AS A RESULT OF HUMAN ACTIVITY Ass. Professor, Ph.D, eng. Dolchinkov N. T. ................................................................................................................................................... 279
INDUSTRY 4.0 and TURKISH NATIONAL INNOVATION SYSTEM: CHALLENGES and PROSPECTS
Erkan Erdil1 and Şeyda Ertekin2,3
1Department of Economics, Middle East Technical University, and Research Center for Science Technology and Policies (METU-TEKPOL), Universiteler Mahallesi, Dumlupinar Bulvari No:1, 06800, Cankaya-Ankara/ Turkey. [email protected] 2 Department of Computer Engineering, Middle East Technical University, and METU-BİLTİR Research Center Digital Transformation & Industry 4.0 Platform, Universiteler Mahallesi, Dumlupinar Bulvari No:1, 06800, Cankaya-Ankara/ Turkey. [email protected] 3 MIT Sloan School of Management, Massachusetts Institute of Technology, 30 Memorial Drive, Cambridge MA 02142 USA. [email protected]
Abstract: This study discusses the structure of Turkish National Innovation System (NIS) and challenges faced in the last decade in the context of the digital transformation. As a developing country and a member of G-20, how these challenges of Turkish NIS are mitigated and further be dealt with. It comprises lessons and provides cases for various similar NISs. In order to evaluate and provide policy recommendations for accelerating the transformation of Turkish economy, it benefits from systems approach as a basic academic framework. It is found that Turkey faces four key structural challenges calling for urgent response for their targets of 2023 (hundredth year of the Republic), namely productivity, growth, employment and investment. Implementing a relatively simple rule compatible with the peculiarities of the system and focusing on the diversity of policy mix, the study proposes ways to mitigate these structural challenges towards digital transformation.
Keywords: INDUSTRY 4.0, DIGITAL TRANSFORMATION, NATIONAL INNOVATION SYSTEMS, STI POLICY, STRUCTURAL CHALLENGES, TURKEY
1. Introduction The unavoidable introduction of technological changes in the
life of modern homo sapiens not only alters the humanity itself yet transforms societies and socio-economic structure in a drastic manner. The recent discussions on the so-called industry 4.0 or digital transformation seems to have such a capacity. It is main peculiarity is on the production, consumption and marketing of the goods and services. However, what is deep inside is the restructuring of human-human and human-machine interactions in a wider context. In this paper, we aim to provide a brief examination on policy impacts of the possible reorganization in the context of an emerging economy.
In fact, digital transformation strategy should be rooted at micro level firm strategy. However, the governments must consider the wider impacts at meso and even at macro levels. The policies and specific public strategies have to enhance the applicability of micro strategies especially in emerging countries like Turkey. As noted by OECD (2005) with a special appendix, one of the major shortcomings of developing countries in terms of innovative activities is the existence of problems in the innovation landscape especially weak innovation systems as compared to developed world. Another connected issue is the capacity and capability of qualified personnel needed for the digital transformation. As evident from the data1, the emerging economies have also problems with the education systems. These problems necessitate strategic public intervention for the realization of digital transformation; otherwise the results for some of the developing countries may be detrimental and traumatic.
2. Turkish NIS in Perspective The last decade has witnessed a shift from horizontal focus to
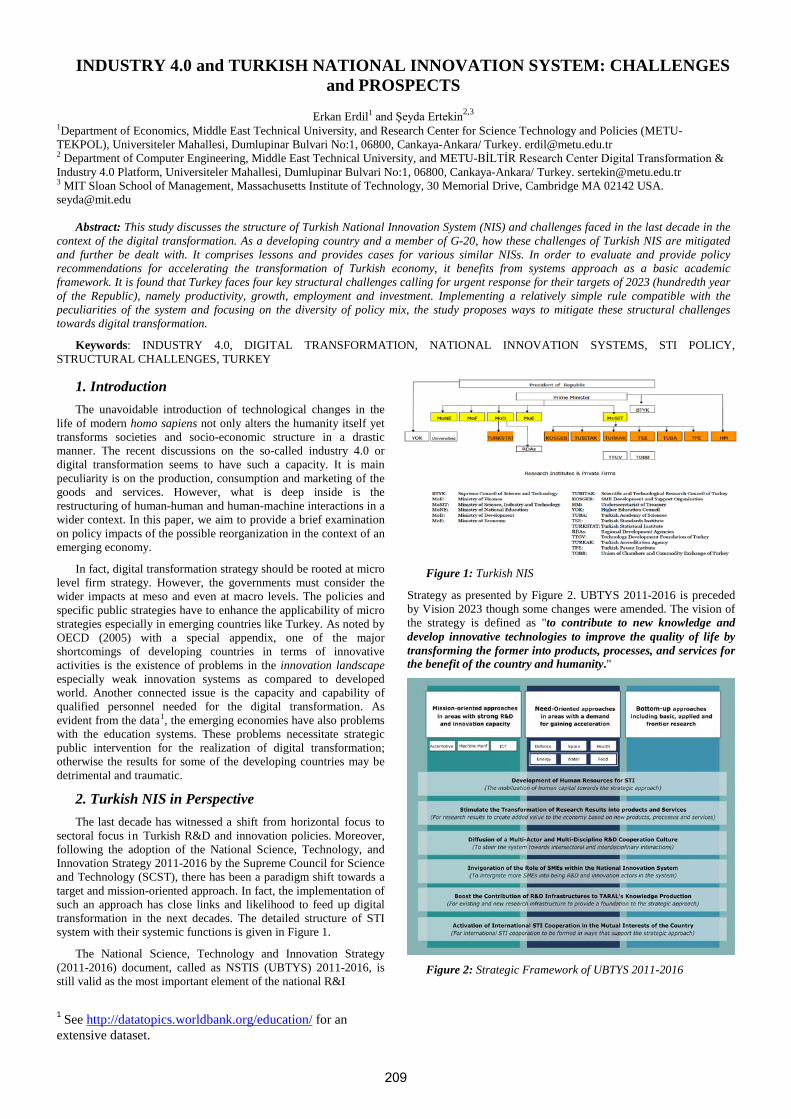
sectoral focus in Turkish R&D and innovation policies. Moreover, following the adoption of the National Science, Technology, and Innovation Strategy 2011-2016 by the Supreme Council for Science and Technology (SCST), there has been a paradigm shift towards a target and mission-oriented approach. In fact, the implementation of such an approach has close links and likelihood to feed up digital transformation in the next decades. The detailed structure of STI system with their systemic functions is given in Figure 1.
The National Science, Technology and Innovation Strategy (2011-2016) document, called as NSTIS (UBTYS) 2011-2016, is still valid as the most important element of the national R&I
1 See http://datatopics.worldbank.org/education/ for an extensive dataset.
Figure 1: Turkish NIS
Strategy as presented by Figure 2. UBTYS 2011-2016 is preceded by Vision 2023 though some changes were amended. The vision of the strategy is defined as "to contribute to new knowledge and develop innovative technologies to improve the quality of life by transforming the former into products, processes, and services for the benefit of the country and humanity."
3. An Empirical and Policy-Oriented Snapshot on Digital Transformation
This section will focus on the possible repercussions of digital transformation at various levels, namely micro, meso and macro levels, in a policy context. METU-Digital Transformation/Industry 4.0 Platform notes that2
The world has recently witnessed the new concept of “Digital Transformation” which is also known as "4th Industrial Revolution" and "Industry 4.0". Digital Transformation aims to support human capabilities through cyber-physical systems, smart factories, communication among machines and humans, and data-driven decision support systems. Digital transformation requires human capital development by providing collaborative learning networks to build multi-disciplinary communities of practice.
The new product lifecycles are not only related with the personalized customer demand and extends the existing issues of product development, order, production and distribution of a product to final customer but also its recycling as well with the connected services. However, such a systematic relation will, indeed, needs the establishment of real-time availability of all information concerning each phase of manufacturing, marketing and even recycling. This means the dynamic accessibility to the data that necessitates interconnection data-generating agents such as persons, firms, items, and various systems. Therefore, such an interconnection ends up with a value-creating networks that generates a dynamic optimization in terms of use of resources, cost, and accessibility.
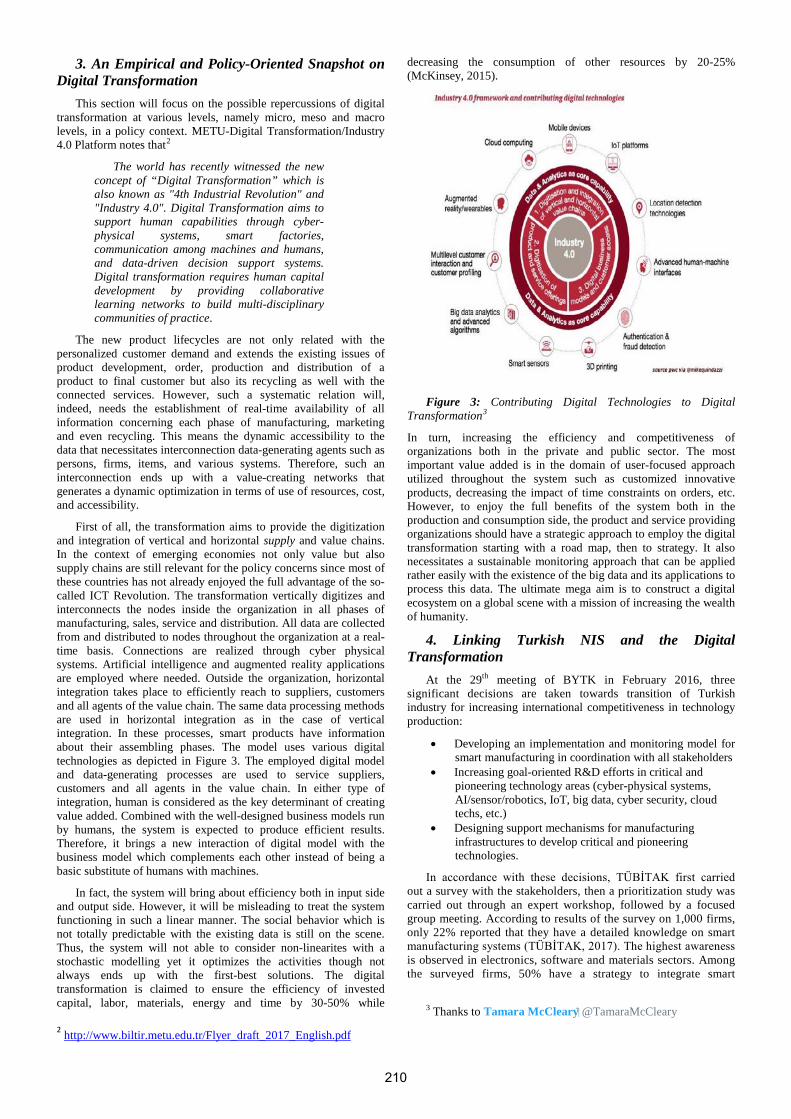
First of all, the transformation aims to provide the digitization and integration of vertical and horizontal supply and value chains. In the context of emerging economies not only value but also supply chains are still relevant for the policy concerns since most of these countries has not already enjoyed the full advantage of the so-called ICT Revolution. The transformation vertically digitizes and interconnects the nodes inside the organization in all phases of manufacturing, sales, service and distribution. All data are collected from and distributed to nodes throughout the organization at a real-time basis. Connections are realized through cyber physical systems. Artificial intelligence and augmented reality applications are employed where needed. Outside the organization, horizontal integration takes place to efficiently reach to suppliers, customers and all agents of the value chain. The same data processing methods are used in horizontal integration as in the case of vertical integration. In these processes, smart products have information about their assembling phases. The model uses various digital technologies as depicted in Figure 3. The employed digital model and data-generating processes are used to service suppliers, customers and all agents in the value chain. In either type of integration, human is considered as the key determinant of creating value added. Combined with the well-designed business models run by humans, the system is expected to produce efficient results. Therefore, it brings a new interaction of digital model with the business model which complements each other instead of being a basic substitute of humans with machines.
In fact, the system will bring about efficiency both in input side and output side. However, it will be misleading to treat the system functioning in such a linear manner. The social behavior which is not totally predictable with the existing data is still on the scene. Thus, the system will not able to consider non-linearites with a stochastic modelling yet it optimizes the activities though not always ends up with the first-best solutions. The digital transformation is claimed to ensure the efficiency of invested capital, labor, materials, energy and time by 30-50% while
decreasing the consumption of other resources by 20-25% (McKinsey, 2015).
Figure 3: Contributing Digital Technologies to Digital Transformation3
In turn, increasing the efficiency and competitiveness of organizations both in the private and public sector. The most important value added is in the domain of user-focused approach utilized throughout the system such as customized innovative products, decreasing the impact of time constraints on orders, etc. However, to enjoy the full benefits of the system both in the production and consumption side, the product and service providing organizations should have a strategic approach to employ the digital transformation starting with a road map, then to strategy. It also necessitates a sustainable monitoring approach that can be applied rather easily with the existence of the big data and its applications to process this data. The ultimate mega aim is to construct a digital ecosystem on a global scene with a mission of increasing the wealth of humanity.
4. Linking Turkish NIS and the Digital Transformation
At the 29th meeting of BYTK in February 2016, three significant decisions are taken towards transition of Turkish industry for increasing international competitiveness in technology production:
• Developing an implementation and monitoring model for smart manufacturing in coordination with all stakeholders
• Increasing goal-oriented R&D efforts in critical and pioneering technology areas (cyber-physical systems, AI/sensor/robotics, IoT, big data, cyber security, cloud techs, etc.)
• Designing support mechanisms for manufacturing infrastructures to develop critical and pioneering technologies.
In accordance with these decisions, TÜBİTAK first carried out a survey with the stakeholders, then a prioritization study was carried out through an expert workshop, followed by a focused group meeting. According to results of the survey on 1,000 firms, only 22% reported that they have a detailed knowledge on smart manufacturing systems (TÜBİTAK, 2017). The highest awareness is observed in electronics, software and materials sectors. Among the surveyed firms, 50% have a strategy to integrate smart
manufacturing systems in their production processes (TÜBİTAK, 2017). Regarding the level of digital maturity, the Turkish industry is between the 2nd and 3rd industrial revolution and the most mature sectors are the materials sector (rubbers & plastics), computers, electronics and optical devices as well as the automotive and white goods sector. Three technologies that will provide the most added value according to Turkish firms, are automation & control systems, advanced robotic systems as well as additive manufacturing. The expectation is that these technologies will find their ways mostly in the machinery & equipment sector, the computers, electronics and optical devices sector as well as the automotive and white goods sector. In the prioritization phase, 3 technology groups, 8 critical technologies, 10 strategical targets and 29 products were determined. The technology groups, strategic targets and underlying technologies are as follows:
1. Digitalization, with a focus on big data & cloud computing, virtualization and cyber security. The following targets are being defined:
• Secure, private cloud service platform: develop secure, private, intelligent and scalable cloud service platforms for end devices, algorithms and applications.
• Big data analytics: collect, process, correlate, analyse, report and use in decision support systems. Cyber security solutions: develop cyber security solutions Industry 4.0 applications.
• Modelling and simulation: development of modelling and simulation technologies
2. Connectivity, with a focus on the Internet of Things (IoT) and sensor technologies. The following targets are being defined:
• Industrial IoT platform: Establishment of digital platform of industrial IoT with interoperability, increased security and reliability, and development of software and hardware for industrial endpoint equipment.
• M2X software and equipment: development of data storage technologies suitable for data emerging with reliable and innovative M2X (Machine-Machine, Human-Machine, Machine-Infrastructure) software and / or hardware that will increase the quality and productivity during the product life cycle.
• Innovative sensors: development of industrial, physical, chemical, biological, optical, micro-nano sensors; intelligent actors; industrial, wireless, digital sensor networks; artificial vision, image processing, innovative sensor applications and heavy conditions resistant sensors.
3. Future factories, with a focus on additive manufacturing, advanced robotic systems and automation & control systems.
• Robotic, automation, equipment, software and management systems: developing intelligent production robots, equipment and software / management systems that can compete in the international markets in terms of technology and cost, also accessible by SMEs.
• Supplementary manufacturing materials, equipment and software: development of raw materials, production equipment and necessary
software and automation systems used in additive manufacturing.
• Intelligent factory systems: development of intelligent factory systems and components and middleware software technologies.
TÜBİTAK’s national call for research proposals topics for 2016 and 2017 already reflect a focus on advanced manufacturing technologies as well as the Internet of Things. Specific focus is on:
• Additive Manufacturing:
• Multilayer additive manufacturing
• Rapid prototyping and 3D printing technologies
• CAD/CAM, simulation & modelling software
• Robotics and mechatronics
• Flexible manufacturing
• Internet of Things
• Sensors and sensing systems • Virtualization • M2M communication • Cloud computing
According to TÜSİAD (2016), the expected impacts of the digital transformation on Turkish economy are as follows:
• Productivity gains of 4 to 7 percent on an annual basis. • Despite the predicted low skilled job loss, 5 percent
absolute increase in employment is expected. • Higher-skilled labor force structure is expected to
prepare a stronger know-how base for Turkey.
Additional total manufacturing based growth of up to 3 percent per year, meaning 1 percent growth effect on Turkish GDP. Turkish producers are required to invest about 3 to 5 billion Euro per year over the next ten years.
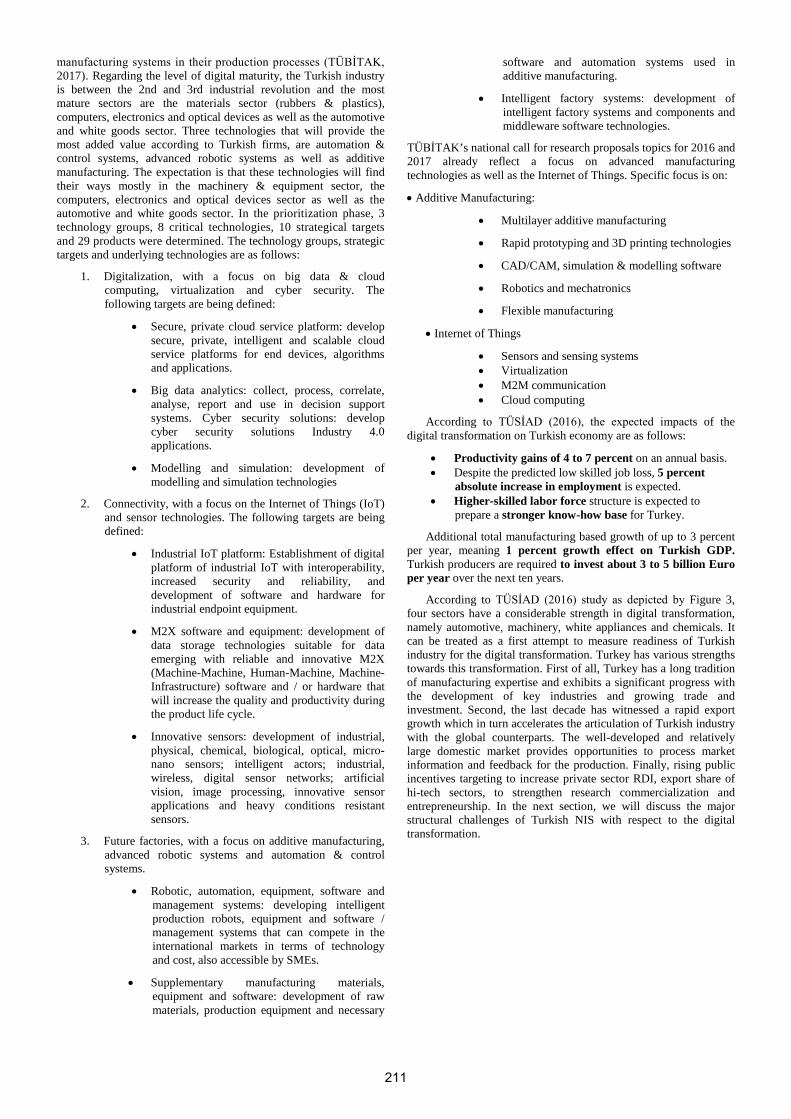
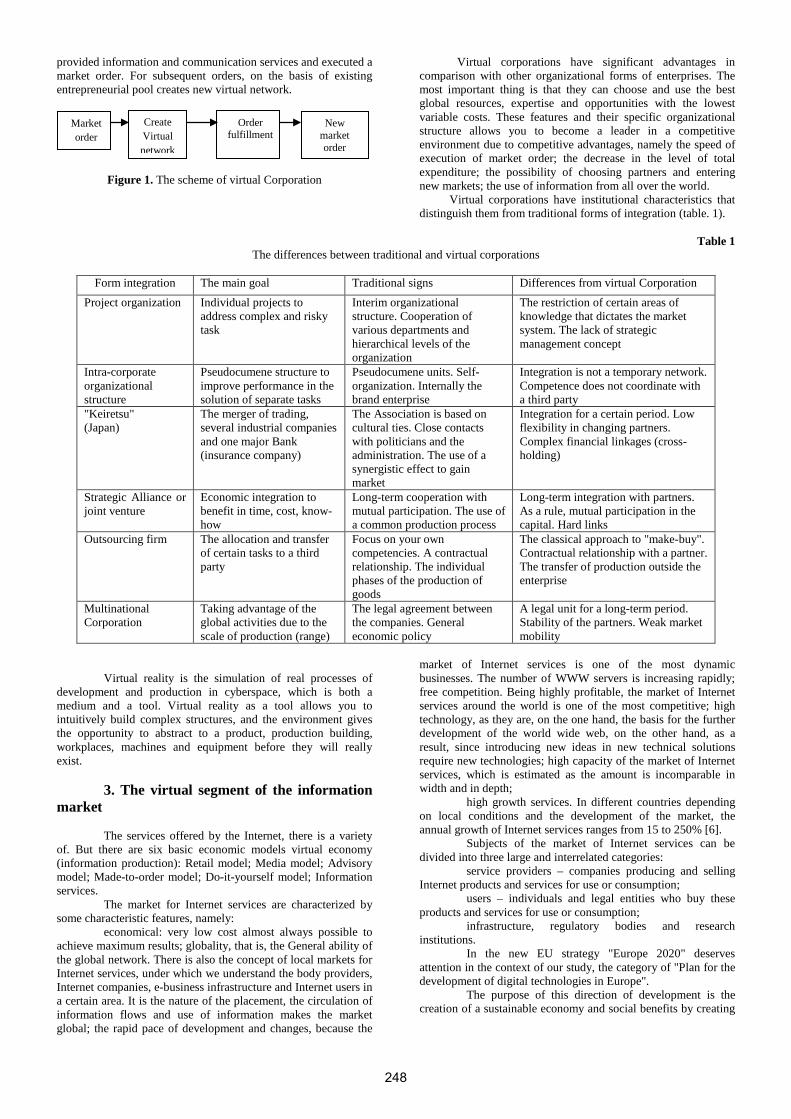
According to TÜSİAD (2016) study as depicted by Figure 3, four sectors have a considerable strength in digital transformation, namely automotive, machinery, white appliances and chemicals. It can be treated as a first attempt to measure readiness of Turkish industry for the digital transformation. Turkey has various strengths towards this transformation. First of all, Turkey has a long tradition of manufacturing expertise and exhibits a significant progress with the development of key industries and growing trade and investment. Second, the last decade has witnessed a rapid export growth which in turn accelerates the articulation of Turkish industry with the global counterparts. The well-developed and relatively large domestic market provides opportunities to process market information and feedback for the production. Finally, rising public incentives targeting to increase private sector RDI, export share of hi-tech sectors, to strengthen research commercialization and entrepreneurship. In the next section, we will discuss the major structural challenges of Turkish NIS with respect to the digital transformation.
211
Figure 3: The Levers and Sectors for the Digital
Transformation in Turkish Industry
5. Structural Challenges of the National R&I System
According to the European Innovation Scoreboard 2017 Turkey is a Moderate Innovator4. Innovation performance has been improving at a slow but steady rate between 2008 and 2014, and for 2015 and 2016 a sharp increase can be observed. Turkey is catching up to the EU; its relative performance has improved from 38% in 2008 to 39% in 2014 and then jumped to 51% in 2015 and approximately 60% in 2016 turning the country from a Modest into a Moderate Innovator. Therefore, its performance relative to the EU has increased strongly. However, it suffers some challenges as presented in Table 1.
Table 1: Structural Challenges of National R&I System
Challenge Main Conclusion
Promoting research commercialisation from universities
The enrichment of the policy mix with a variety of measures (financial, non-financial, etc.) will help to address this challenge
Increasing the number of innovative high-growth start-ups
The underdeveloped venture capital and business angels markets, as well as the limited number and variety of policy measures for start-up creation, are crucial barriers.
Increasing R&D and innovation capabilities of the private sector
The low levels of absorptive capacity of the business sector, particularly which of MSMEs, is a barrier to increase R&D and innovation performance.
Focusing on strategic approach on access to finance
The impact of existing strategies should be evaluated and the policy mix should evolve based upon these evaluations.
Increasing availability and quality of research personnel
Further efforts and diversified measures are needed to develop human resources in a way that the absorptive capacity of companies is enhanced, and the quantity and quality of researchers are increased.
4 European Innovation Scoreboard 2017 https://www.rvo.nl/sites/default/files/2017/06/European_Innovation_Scoreboard_2017.pdf
6. Concluding Remarks In Turkey, there exist various instruments to tackle structural
challenges towards the digital transformation summarized in Table 1. The most significant shortcoming of all these measures being the inexistence of evaluation studies on these support programmes. Although the establishment of evaluation office at MoSIT is a step forward, another concern is an urgent need to develop an evaluation culture and establish an effective mechanism for systematic evaluation of the public R&D funding system, policies and policy measures on the basis of internationally recognised criteria. Therefore, without an attempt of systematic impact assessment and evaluation studies, it is not possible to evaluate the consequences of the current funding system. Turkey is a support schemes’ heaven in some sense yet it has not been evaluated whether these schemes result in optimal outcomes or if sub-optimal ones are obtained. Therefore, how to deal with the difficulties are not clear. For instance, although various interfaces like technology parks, incubators, TTO’s etc. were created to speed up the innovative activities of firms and to enhance university-industry interactions, there is no real strategy pertaining to knowledge transfer among university and industry. There is an urgent need to create favourable conditions to foster a growing and robust venture capital market, especially for early stage investments. Moreover, the rules and procedures and streamline processes for starting up, running and terminating a business should be improved for the effectiveness of entrepreneurship incentives. The rules for starting up and running a business are not simple nor designed from an SME perspective. Heavy bureaucracy in applications and red tape are still observed. Although the legal framework seems to be transparent and up-to-date, clientelism is a fact at some instances (Luca, 2016 and Ocakli, 2016). Another measure to be introduced is the development of efficient standard-setting system supporting innovative products and services.
In sum, Turkey is a heaven for policy documents, strategies and mechanisms yet it suffers a lot in terms of implementation. Besides the structural challenges mentioned above, there is a need for higher skilled labor force but the frequent changes in national education system seems to be a barrier for such an attempt. Another risk the premature deindustrialization especially connected with SMEs. The low export share of hi-tech products and also seem to be a barrier for an accelerating transformation. All these structural challenges can be mitigated with a holistic approach with the contribution of all stakeholders in the ecosystem including public sector, large corporations and SMEs and knowledge generators. All the stakeholders in the ecosystem need to prepare road maps in accordance with their business models for the digital transformation by explicitly specifying the required policy tools at different levels, namely micro, meso and macro levels. These business models should consider the resolutions for the problems involved in horizontal and vertical supply and value chains. On the other hand, public sector should outline an action plan especially for the infrastructural problems such as skill requirements, ICT infrastructure, SMEs capabilities, etc. Otherwise, the digital transformation process becomes a threat on the road towards the deindustrialization of the country rather than being an opportunity.
References Luca, D., 2016, Boon or bane for development? Turkey’s central
state bureaucracy and the effective management of public investment, Environment and Planning C: Politics and Space, 35, 939-57.
McKinsey, 2015. Industry 4.0 How to Navigate Digitization of the Manufacturing Sector.
Ocakli, F., 2016, Political entrepreneurs, clientelism, and civil society: supply-side politics in Turkey, Democratization, 23, 723-746.
PWC, 2016. Industry 4.0: Building the Digital Enterprise. TÜBİTAK, 2017. Yeni Sanayi Devrimi Akıllı Üretim Sistemleri
Teknoloji Yol Haritası, Ankara: TÜBİTAK. TÜSİAD, 2016. Türkiye’nin Küresel Rekabetçiliği için bir
Gereklilik olarak Snayi 4.0, Gelişmekte olan Ekonomi Perspektifi, İstanbul: TÜSİAD.
Abstract: From the mid 70-es, when the microelectronic devices could be integrated into industrial product and production equipment, the cooperation among European countries entered into a new era. The author’s personal carrier has touched several areas of automation and networking technology aspects throughout this progress domain. Cooperation and international networking for industrial research and development has evolved along the development of ICT technologies that finally led to the advent of cyber-physical systems, IIoT and many related technologies as BigData, Cloud-computing, Analytics integrated with Artificial Intelligence, DeepLearning, remote and tele-operations, AR&VRetc. This paper gives selected samples form the vast initiatives presently accessible for those, who take up actions along the Industry4.0 global arena, as EU FPs, EUREKA, ManuFuture ETP,etc..
Keywords: ESPRIT, MAP-TOP, standardization, User groups, EUREKA, Technology Platforms, INDUSTRY4.0,
1. Introduction
International cooperation on high-tech topics had not been performed at large scale before the middle of the last century. Each country had its secrets to save its know-how for preparing for war-fare. The history of factory automation based on electronics and computer technology had started around 4 or 5 decades ago, basically when the solid state components replaced the magnetic-mechanical switches within machine control circuits. Nowadays, when we deal with cyber-physical products and production systems [1] we declare the present as the birth and outbreak of the 4th Industrial Revolution, - the 1st being the emergence of the steam-power; the 2nd being accepted as the introduction of the mass-production technology, the 3rd industrial revolution was along the introduction of computer (and IT) technology at the shop floors. [2]. Among the European countries international R&D cooperation had started after the Rome Treaty, that took place just 60 years ago by the cooperation agreement among the 6 largest European countries. Another 20 years had passed, before the EUREKA initiative appeared, directly to advance the technology-R&D cooperation among a dozen of countries. By now around 30+ countries have signed partnership in EUREKA, and also the EU has launched till now 8 Framework Programs to foster the benefits of sharing experiences in international scientific cooperation actions.
This paper highlights the key milestones of the evolution of ICT shop-floor communication technologies, ICT in manufacturing, ICT for manufacturing together with the industrial user groups, “human-networking” models along the decades.
The term networking has two areas worth to differentiate: (1) when telecommunication channels get more advanced than just point-to-point interconnection; (2) when groups and communities share and jointly discuss, evaluate, generate harmonized opinions, prepare standards, debate, vote or agree on joint initiatives, regulations, etc.
In this paper the author reflects to gained experiences in several networking scenarios, covering industrial networking topics throughout the 4 past decades, in both aspect..
Sections of this paper will recall the General Motors’ MAP initiatives, [3] the global networking efforts to gain applicable international standards, international CIM pilots, emergence of the European international EUREKA initiative, the Technology Platforms within the EU, the national TP-levels, the INDUSTRY 4.0 German, -EU, -GLOBAL networking.
While 4 decades ago the targeted industrial communication application field consisted of connecting a couple of controllers (PLCs, CNCs, Process Controllers, Robot-controllers, shop-floor
terminals), by now, with the advent of IoT (Internet-of-Things) and IIoT (Industrial IoT), the task is not just a multiplication factor (quantity) issue, but quality-complexity issue too.
The paper referss to the vast area of IoT, highlighting the relative small sub-domain of INDUSTRY 4.0 being addressed for the manufacturing and robotics applications. [4]
Due to its very timely issue, the paper highlights the present-day’s industrial communication requirements within the automotive industry. The need for vehicle-to-vehicle (V2V) and vehicle-to-infrastructure (V2X) communication solutions is a prerequisite for the autonomous driving era already being asked for. The paper ends with commenting on the real needs, and services to be applicable, finally will show the plans of the Hungarian test field for the autonomously driven vehicles.
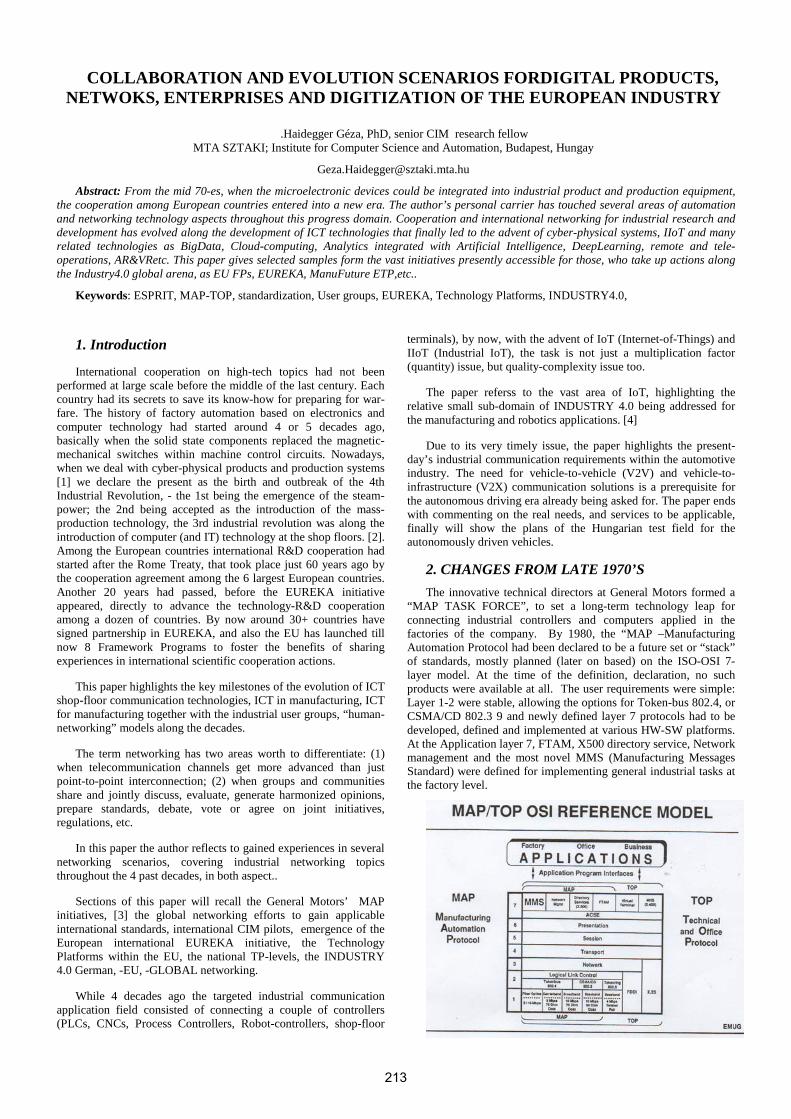
2. CHANGES FROM LATE 1970’S The innovative technical directors at General Motors formed a
“MAP TASK FORCE”, to set a long-term technology leap for connecting industrial controllers and computers applied in the factories of the company. By 1980, the “MAP –Manufacturing Automation Protocol had been declared to be a future set or “stack” of standards, mostly planned (later on based) on the ISO-OSI 7-layer model. At the time of the definition, declaration, no such products were available at all. The user requirements were simple: Layer 1-2 were stable, allowing the options for Token-bus 802.4, or CSMA/CD 802.3 9 and newly defined layer 7 protocols had to be developed, defined and implemented at various HW-SW platforms. At the Application layer 7, FTAM, X500 directory service, Network management and the most novel MMS (Manufacturing Messages Standard) were defined for implementing general industrial tasks at the factory level.
213
Fig.1. MAP/TOP Reference Model
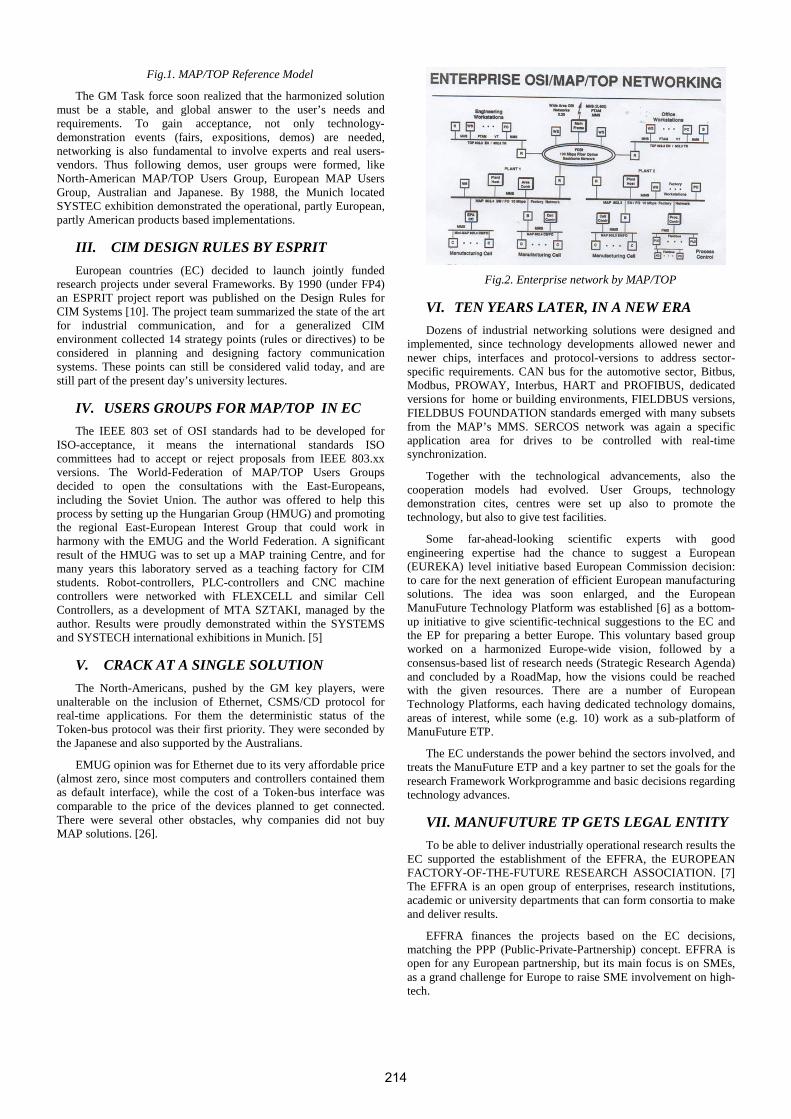
The GM Task force soon realized that the harmonized solution must be a stable, and global answer to the user’s needs and requirements. To gain acceptance, not only technology-demonstration events (fairs, expositions, demos) are needed, networking is also fundamental to involve experts and real users-vendors. Thus following demos, user groups were formed, like North-American MAP/TOP Users Group, European MAP Users Group, Australian and Japanese. By 1988, the Munich located SYSTEC exhibition demonstrated the operational, partly European, partly American products based implementations.
III. CIM DESIGN RULES BY ESPRIT European countries (EC) decided to launch jointly funded
research projects under several Frameworks. By 1990 (under FP4) an ESPRIT project report was published on the Design Rules for CIM Systems [10]. The project team summarized the state of the art for industrial communication, and for a generalized CIM environment collected 14 strategy points (rules or directives) to be considered in planning and designing factory communication systems. These points can still be considered valid today, and are still part of the present day’s university lectures.
IV. USERS GROUPS FOR MAP/TOP IN EC The IEEE 803 set of OSI standards had to be developed for
ISO-acceptance, it means the international standards ISO committees had to accept or reject proposals from IEEE 803.xx versions. The World-Federation of MAP/TOP Users Groups decided to open the consultations with the East-Europeans, including the Soviet Union. The author was offered to help this process by setting up the Hungarian Group (HMUG) and promoting the regional East-European Interest Group that could work in harmony with the EMUG and the World Federation. A significant result of the HMUG was to set up a MAP training Centre, and for many years this laboratory served as a teaching factory for CIM students. Robot-controllers, PLC-controllers and CNC machine controllers were networked with FLEXCELL and similar Cell Controllers, as a development of MTA SZTAKI, managed by the author. Results were proudly demonstrated within the SYSTEMS and SYSTECH international exhibitions in Munich. [5]
V. CRACK AT A SINGLE SOLUTION The North-Americans, pushed by the GM key players, were
unalterable on the inclusion of Ethernet, CSMS/CD protocol for real-time applications. For them the deterministic status of the Token-bus protocol was their first priority. They were seconded by the Japanese and also supported by the Australians.
EMUG opinion was for Ethernet due to its very affordable price (almost zero, since most computers and controllers contained them as default interface), while the cost of a Token-bus interface was comparable to the price of the devices planned to get connected. There were several other obstacles, why companies did not buy MAP solutions. [26].
Fig.2. Enterprise network by MAP/TOP
VI. TEN YEARS LATER, IN A NEW ERA Dozens of industrial networking solutions were designed and
implemented, since technology developments allowed newer and newer chips, interfaces and protocol-versions to address sector-specific requirements. CAN bus for the automotive sector, Bitbus, Modbus, PROWAY, Interbus, HART and PROFIBUS, dedicated versions for home or building environments, FIELDBUS versions, FIELDBUS FOUNDATION standards emerged with many subsets from the MAP’s MMS. SERCOS network was again a specific application area for drives to be controlled with real-time synchronization.
Together with the technological advancements, also the cooperation models had evolved. User Groups, technology demonstration cites, centres were set up also to promote the technology, but also to give test facilities.
Some far-ahead-looking scientific experts with good engineering expertise had the chance to suggest a European (EUREKA) level initiative based European Commission decision: to care for the next generation of efficient European manufacturing solutions. The idea was soon enlarged, and the European ManuFuture Technology Platform was established [6] as a bottom-up initiative to give scientific-technical suggestions to the EC and the EP for preparing a better Europe. This voluntary based group worked on a harmonized Europe-wide vision, followed by a consensus-based list of research needs (Strategic Research Agenda) and concluded by a RoadMap, how the visions could be reached with the given resources. There are a number of European Technology Platforms, each having dedicated technology domains, areas of interest, while some (e.g. 10) work as a sub-platform of ManuFuture ETP.
The EC understands the power behind the sectors involved, and treats the ManuFuture ETP and a key partner to set the goals for the research Framework Workprogramme and basic decisions regarding technology advances.
VII. MANUFUTURE TP GETS LEGAL ENTITY To be able to deliver industrially operational research results the
EC supported the establishment of the EFFRA, the EUROPEAN FACTORY-OF-THE-FUTURE RESEARCH ASSOCIATION. [7] The EFFRA is an open group of enterprises, research institutions, academic or university departments that can form consortia to make and deliver results.
EFFRA finances the projects based on the EC decisions, matching the PPP (Public-Private-Partnership) concept. EFFRA is open for any European partnership, but its main focus is on SMEs, as a grand challenge for Europe to raise SME involvement on high-tech.
214
The ManuFuture ETP with the business power of EFFRA has been working on the also high-priority European Grand-Challenge: the digitization of the industry.
In the EU countries each government had committed itself to a harmonized and nationally supported, pushed action: besides raising digitization at all governmental and other sectors agreed to give special focus to the digitization of the industry.
The German Prime Minister Angela Merkel, when received a briefing on the possible positive aspects of the connected, digitalized industry, suggested and actively supported that Germany should be the forerunner in it. Other countries and regions also had and have similar ideas, but the German version was the very first phrase for the 4th Industrial Revolution: INDUSTRIE 4.0. [8]
All around Europe and by now also in all other regions, INDUSTRY 4.0 is the strong symbol of harmonized, standards-based efforts to use interconnected IT solutions in the industry. In the USA the terms Connected Industry or networked industry are rather applied.
VIII. HELPING INDUSTRIAL FIRMS To push the firms for faster digitization of the industry, several
EU-level and national level governmental initiatives were established. Most efforts followed the German actions performed by the German INDUSTRIE4.0 Platform, together with the VDMA,VDI, and the Government. Readiness level definitions and measurements technology had been developed All around Europe and by now also in all other regions, INDUSTRY 4.0 is the strong symbol of harmonized, standards-based efforts to use interconnected IT solutions in the industry. In the USA the terms Connected Industry or networked industry are rather applied. Also an EUREKA INTRO4.0 German-Hungarian RTD project had been initiated for the support of SMEs to take up the speed. Large and multinational companies, like Bosch, Rexroth, pwc, RockwellAutomation, etc, directly target industrial firms to evaluate their readiness and resources for the fast implementation of Industry4.0 solutions.
IX. NETWORKING FOR INDUSTRY4.0 As the German initiative got governmental support and push,
other nations within the EU decided to set up national task force
groups. Hungary also declared its commitment at the level of Secretary of State to push the digitization of our industry at a very steep, fast scenario. The National Technology Platform IPAR4.0 had been initialized already in Spring 2016, and 7 working groups had been formed to care for strategy, education, pilot implementations, test sites, standards, and legal entity development. More and more companies are eager to join and learn on advancements, benefits, chances of the platform.[9] A mayor topic is the readiness level of SME-s.
Networking at international level is also important. EU Commissioner had pointed out the need for national-level projects with national government commitments in each and every EU member-state. The Commission intends to generate EU-wide joint harmonized actions in this specific area of interconnected digitization. The explicit aim is to set European industry to be a forerunner in the digitization of the economy.
X. THE STATUS OF TELECOM STANDARDS At ISO level, TC-299 has recently sent invitation for initiating
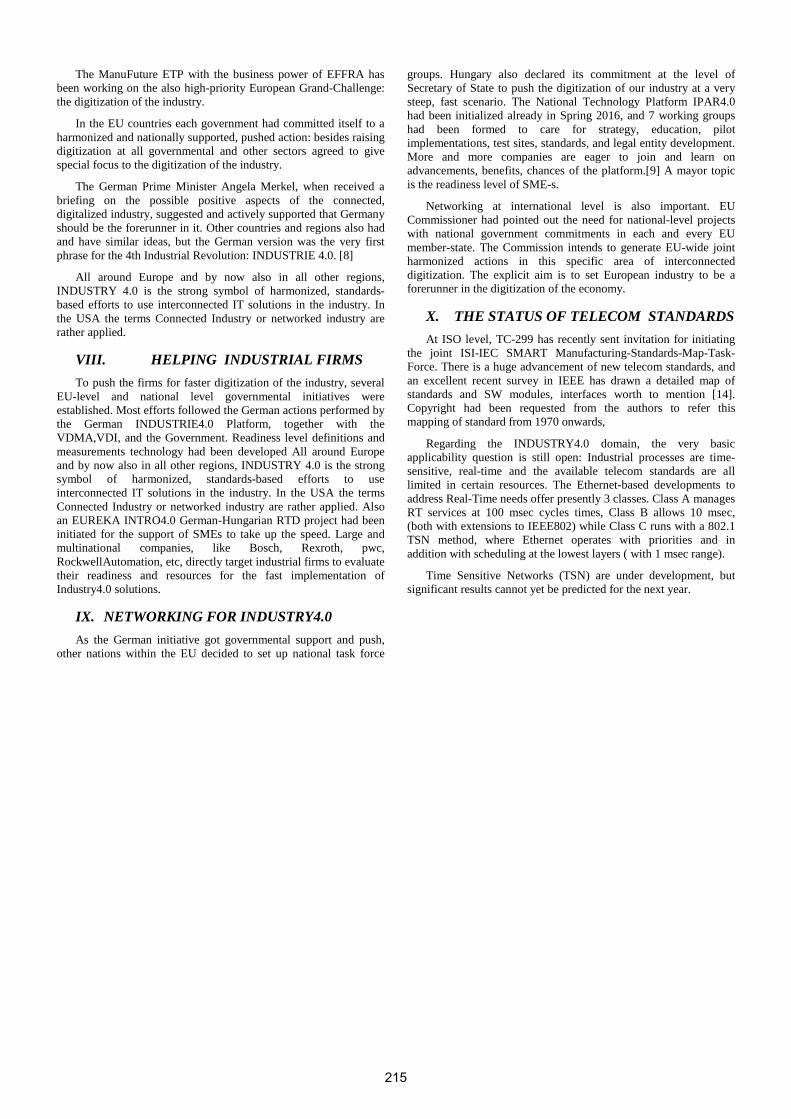
the joint ISI-IEC SMART Manufacturing-Standards-Map-Task-Force. There is a huge advancement of new telecom standards, and an excellent recent survey in IEEE has drawn a detailed map of standards and SW modules, interfaces worth to mention [14]. Copyright had been requested from the authors to refer this mapping of standard from 1970 onwards,
Regarding the INDUSTRY4.0 domain, the very basic applicability question is still open: Industrial processes are time-sensitive, real-time and the available telecom standards are all limited in certain resources. The Ethernet-based developments to address Real-Time needs offer presently 3 classes. Class A manages RT services at 100 msec cycles times, Class B allows 10 msec, (both with extensions to IEEE802) while Class C runs with a 802.1 TSN method, where Ethernet operates with priorities and in addition with scheduling at the lowest layers ( with 1 msec range).
Time Sensitive Networks (TSN) are under development, but significant results cannot yet be predicted for the next year.
215
a
Fig. 4. Milestones in telecom standards [14], (Requested courtesy diagram from the authors)
.
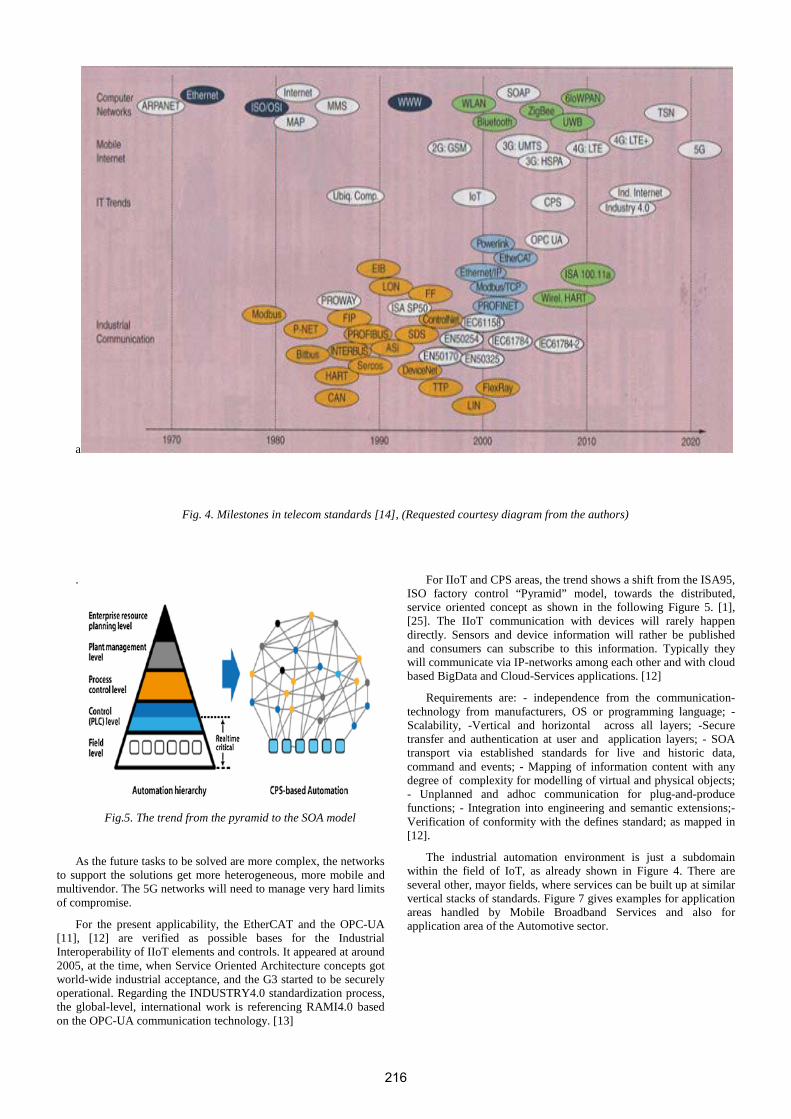
Fig.5. The trend from the pyramid to the SOA model
As the future tasks to be solved are more complex, the networks to support the solutions get more heterogeneous, more mobile and multivendor. The 5G networks will need to manage very hard limits of compromise.
For the present applicability, the EtherCAT and the OPC-UA [11], [12] are verified as possible bases for the Industrial Interoperability of IIoT elements and controls. It appeared at around 2005, at the time, when Service Oriented Architecture concepts got world-wide industrial acceptance, and the G3 started to be securely operational. Regarding the INDUSTRY4.0 standardization process, the global-level, international work is referencing RAMI4.0 based on the OPC-UA communication technology. [13]
For IIoT and CPS areas, the trend shows a shift from the ISA95, ISO factory control “Pyramid” model, towards the distributed, service oriented concept as shown in the following Figure 5. [1], [25]. The IIoT communication with devices will rarely happen directly. Sensors and device information will rather be published and consumers can subscribe to this information. Typically they will communicate via IP-networks among each other and with cloud based BigData and Cloud-Services applications. [12]
Requirements are: - independence from the communication-technology from manufacturers, OS or programming language; - Scalability, -Vertical and horizontal across all layers; -Secure transfer and authentication at user and application layers; - SOA transport via established standards for live and historic data, command and events; - Mapping of information content with any degree of complexity for modelling of virtual and physical objects; - Unplanned and adhoc communication for plug-and-produce functions; - Integration into engineering and semantic extensions;-Verification of conformity with the defines standard; as mapped in [12].
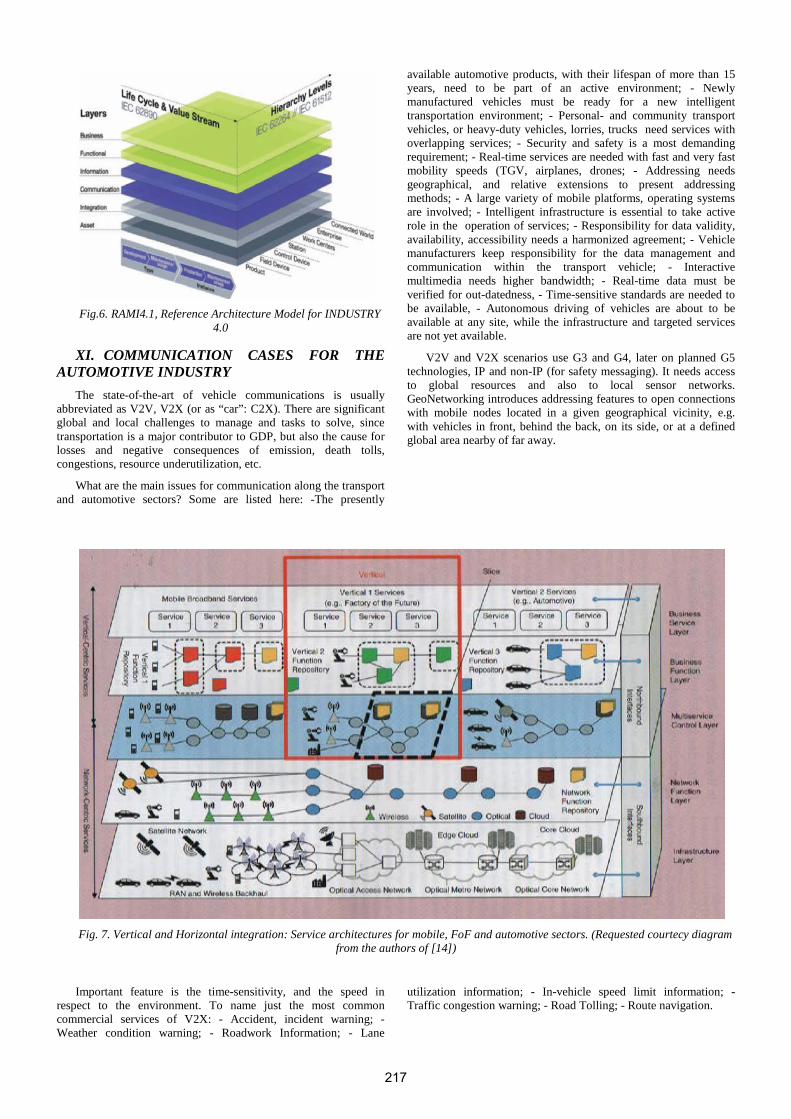
The industrial automation environment is just a subdomain within the field of IoT, as already shown in Figure 4. There are several other, mayor fields, where services can be built up at similar vertical stacks of standards. Figure 7 gives examples for application areas handled by Mobile Broadband Services and also for application area of the Automotive sector.
216
Fig.6. RAMI4.1, Reference Architecture Model for INDUSTRY
4.0
XI. COMMUNICATION CASES FOR THE AUTOMOTIVE INDUSTRY
The state-of-the-art of vehicle communications is usually abbreviated as V2V, V2X (or as “car”: C2X). There are significant global and local challenges to manage and tasks to solve, since transportation is a major contributor to GDP, but also the cause for losses and negative consequences of emission, death tolls, congestions, resource underutilization, etc.
What are the main issues for communication along the transport and automotive sectors? Some are listed here: -The presently
available automotive products, with their lifespan of more than 15 years, need to be part of an active environment; - Newly manufactured vehicles must be ready for a new intelligent transportation environment; - Personal- and community transport vehicles, or heavy-duty vehicles, lorries, trucks need services with overlapping services; - Security and safety is a most demanding requirement; - Real-time services are needed with fast and very fast mobility speeds (TGV, airplanes, drones; - Addressing needs geographical, and relative extensions to present addressing methods; - A large variety of mobile platforms, operating systems are involved; - Intelligent infrastructure is essential to take active role in the operation of services; - Responsibility for data validity, availability, accessibility needs a harmonized agreement; - Vehicle manufacturers keep responsibility for the data management and communication within the transport vehicle; - Interactive multimedia needs higher bandwidth; - Real-time data must be verified for out-datedness, - Time-sensitive standards are needed to be available, - Autonomous driving of vehicles are about to be available at any site, while the infrastructure and targeted services are not yet available.
V2V and V2X scenarios use G3 and G4, later on planned G5 technologies, IP and non-IP (for safety messaging). It needs access to global resources and also to local sensor networks. GeoNetworking introduces addressing features to open connections with mobile nodes located in a given geographical vicinity, e.g. with vehicles in front, behind the back, on its side, or at a defined global area nearby of far away.
Fig. 7. Vertical and Horizontal integration: Service architectures for mobile, FoF and automotive sectors. (Requested courtecy diagram
from the authors of [14])
Important feature is the time-sensitivity, and the speed in respect to the environment. To name just the most common commercial services of V2X: - Accident, incident warning; - Weather condition warning; - Roadwork Information; - Lane
A different series of services are reflecting traffic efficiency and road safety services: - Lane departure prevention and lane change assistance; - Road quality warning; - Obstruction detection; - Collision avoidance; - Radar view and neighbor supervision; - Safety margins; - Local danger alerts; - Road side safety information display; - Enhanced driver awareness. [15] These are supporting services to assist the drivers or modules to advance autonomous driving and are under development at MTA SZTAKI, Budapest, Hungary.
XII. DEMONSTRATORS, TESTING THE USE-CASE SCENARIOS FOR INDUSTRY (CPS) AND FOR THE AUTOMITIVE SECTORS
As it can be seen many countries and also within the EU’s Horizon 2020 projects pilots and joint demonstrator sites are financed to spread the best practice examples, and to promote harmonized solutions, e.g. for software and hardware solutions, service oriented architecture based implementations, etc. For the Cyber-physical Manufacturing Systems an example of CPPS is detailed in the simplified architecture of the Smart Factory demonstrator at MTA SZTAKI, Budapest, Hungary.[16] Within the Hungarian IPAR4.0 National Technology Platform, the 7 Working Groups are getting to be active after being set up last Spring. Nation-wide “open factory-night” event was launched to allow citizens to visit factories with demonstration use-cases. The mobile-phone application by SZTAKI has helped to select the most interesting factory-examples, and helped to navigate the user to reach the demo sites.
Fig. 8. SMART FACTORY pilot at MTA SZTAKI [16]
The Strategic-planning Working Group has submitted a 150+ page detailed Strategy [27] to the Ministry of National Economy. Five main pillars are giving the backbone for the strategy: Digitization and business development, - Production and Logistics, - I4.0 Labor market development, - R&D&I, -I4.0 ecosystem. For each pillar, 3 dimensions were defined –as Technology, Society and Business. Within such a matrix, tasks had been listed, and for each block, priorities had been selected
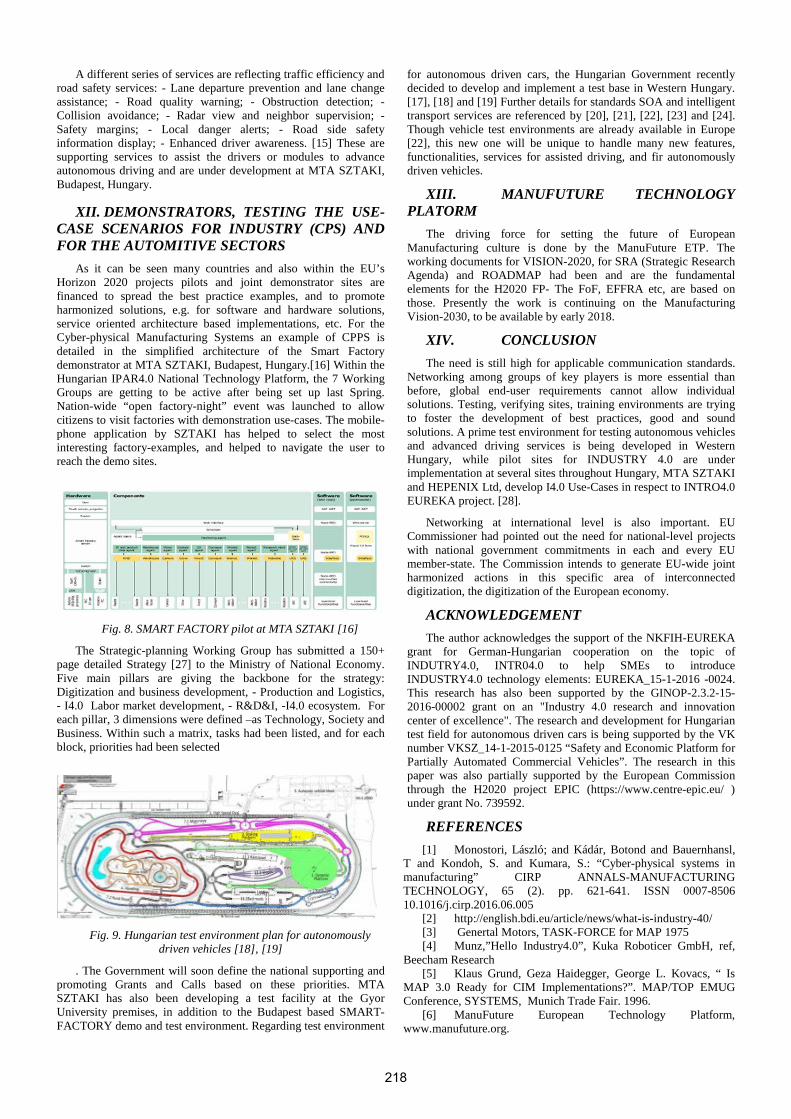
Fig. 9. Hungarian test environment plan for autonomously
driven vehicles [18], [19]
. The Government will soon define the national supporting and promoting Grants and Calls based on these priorities. MTA SZTAKI has also been developing a test facility at the Gyor University premises, in addition to the Budapest based SMART-FACTORY demo and test environment. Regarding test environment
for autonomous driven cars, the Hungarian Government recently decided to develop and implement a test base in Western Hungary. [17], [18] and [19] Further details for standards SOA and intelligent transport services are referenced by [20], [21], [22], [23] and [24]. Though vehicle test environments are already available in Europe [22], this new one will be unique to handle many new features, functionalities, services for assisted driving, and fir autonomously driven vehicles.
XIII. MANUFUTURE TECHNOLOGY PLATORM
The driving force for setting the future of European Manufacturing culture is done by the ManuFuture ETP. The working documents for VISION-2020, for SRA (Strategic Research Agenda) and ROADMAP had been and are the fundamental elements for the H2020 FP- The FoF, EFFRA etc, are based on those. Presently the work is continuing on the Manufacturing Vision-2030, to be available by early 2018.
XIV. CONCLUSION The need is still high for applicable communication standards.
Networking among groups of key players is more essential than before, global end-user requirements cannot allow individual solutions. Testing, verifying sites, training environments are trying to foster the development of best practices, good and sound solutions. A prime test environment for testing autonomous vehicles and advanced driving services is being developed in Western Hungary, while pilot sites for INDUSTRY 4.0 are under implementation at several sites throughout Hungary, MTA SZTAKI and HEPENIX Ltd, develop I4.0 Use-Cases in respect to INTRO4.0 EUREKA project. [28].
Networking at international level is also important. EU Commissioner had pointed out the need for national-level projects with national government commitments in each and every EU member-state. The Commission intends to generate EU-wide joint harmonized actions in this specific area of interconnected digitization, the digitization of the European economy.
ACKNOWLEDGEMENT
The author acknowledges the support of the NKFIH-EUREKA grant for German-Hungarian cooperation on the topic of INDUTRY4.0, INTR04.0 to help SMEs to introduce INDUSTRY4.0 technology elements: EUREKA_15-1-2016 -0024. This research has also been supported by the GINOP-2.3.2-15-2016-00002 grant on an "Industry 4.0 research and innovation center of excellence". The research and development for Hungarian test field for autonomous driven cars is being supported by the VK number VKSZ_14-1-2015-0125 “Safety and Economic Platform for Partially Automated Commercial Vehicles”. The research in this paper was also partially supported by the European Commission through the H2020 project EPIC (https://www.centre-epic.eu/ ) under grant No. 739592.
REFERENCES
[1] Monostori, László; and Kádár, Botond and Bauernhansl, T and Kondoh, S. and Kumara, S.: “Cyber-physical systems in manufacturing” CIRP ANNALS-MANUFACTURING TECHNOLOGY, 65 (2). pp. 621-641. ISSN 0007-8506 10.1016/j.cirp.2016.06.005
[2] http://english.bdi.eu/article/news/what-is-industry-40/ [3] Genertal Motors, TASK-FORCE for MAP 1975 [4] Munz,”Hello Industry4.0”, Kuka Roboticer GmbH, ref,
Beecham Research [5] Klaus Grund, Geza Haidegger, George L. Kovacs, “ Is
[14] Martin Wollschlaeger,Thilo Sauter, Jürgen Jasperneite : “The Future of Industrial Communication”, IEEE Indsutrial Electronics Magazine, March 2017. pp.17-27.ISSN1932-4529.
[15] Péter Gáspár, Tamás Szirányi, Levente Hajder, Alexandros Soumelidis, Zoltán Fazekas, Csaba Benedek: “Adding Autonomous Features to a Production Electric Car”, ERCIM News 109, April 2017, pp 29-30.
[16] Kemeny, Beregia, Erdos, Nacsa, The MTA SZTAKI Smart Factory: platform for research and project-oriented skill development in higher education; 6th CLF - 6th CIRP Conference on Learning Factories, Procedia CIRP 54 (2016 ) 53 – 58.
[17] András Edelmayer: “Vehicle and M2M communications, IV, Vehicle communications –From technology to systems application”, MTA SZTAKI lecture notes, 2017.
[18] Zsolt Szalay, Domonkos Esztergár-Kiss, Tamás Tettamanti (BME), Péter Gáspár, István Varga (SZTAKI):” RECAR: Hungarian Research Centre for Autonomous Road Vehicles is on the Way. ERCIM News 109, April 2017, pp 27-28.
[19] Laszlo Palkovics, “Testbed for autonomous cars in Hungary”. Press conference by Secretary of State, Budapest, January 2017.
[20] Bernhard Thies, CENELEC President “Digital Transformation Industry 4.0 ; NGM Industry 4.0 Thematic Day, Budapest
[21] David Jackson, ALTRAN: “Autonomous Driving: How to overcome the 5 main technology challenges?”, www.Altran.com
[22] Dekra, “In safe hands from the start”, Type approval and product tests by DEKRA. www.dekra.com
[24] MESA International, “SOA in Manufacturing- Guidebook”. White paper 27. A MESA International, IBM Corporation and Capgemini co-branded white paper, 05.21.08. www.mesa.org
[25] Armando W.Colombo et al: “Industrial CPS”, IEEE Industrial Magazine March 2017. pp. 6-16 ISSN1932-4529.
[26] Indiai Geza Haidegger, Evolution of technology and users’ requirements of factory communication systems from the 3rd to the 4th Industrial Revolution, IEEE TEL-NET 20017 Conference on Networking, ISBN 978-1-5090-6710-7 Xplore, Record #40836.
[27] Laszló Monostori –Géza Haidegger, INDUSTRY4.0 giving new opportunities for innovative cooperation, ManuFuture 2017 Conference, Moving up the value chain, 24-25- October 2017, Tallin, Estonia.
[28] József Tóth, Éva Hegedűs, Géza Haidegger,:Imre Paniti, Rihard Beregi: Developing Industry4.0 Use-Cases for helping SME’s digitization processes.. GTE, 2018. Gépészeti Szakmakultúra, konferencia.
219
SOCIAL ASPECTS OF THE DEVELOPMENT OF THE CONCEPT "INDUSTRY 4:0": RISKS AND PROSPECTS FOR THE TRANSFORMATION OF HUMAN
RESOURCES
Prof. dr. Zaborovskaia O. State Institute of Economics, Finance, Law and Technology, Russia
Abstract: The formation and development of the concept "Industry 4: 0" is associated with significant changes in the structure and characteristics of human resources. It concerns the problems of the new structure of employment, the transformation of the educational system, the deepening of regional disparities. At the same time, the actions developed within the concept, including various programs, don't pay due attention to possible social risks and measures to reduce them.
Keywords: HUMAN RESOURCES, CONCEPT OF "INDUSTRY 4:0", SOCIAL RISKS
1. Introduction The objective tendencies of social development at present are
linked with the "INDUSTRY 4:0" concept, which proposes a pivotal change in the manufacturing process of products and services as well as in the work force. It is no longer about innovation, but about essential transformations at the base of production, which change the traditional representations of the laws of economy, economic behavior, and educational and scientific systems.
The components of the "INDUSTRY 4:0" concept have relatively recently become the subject of active interest among the scientific community and practitioners; however, we can observe the phenomena and involvement processes of all spheres of social life transforming into something new.
If we analyze the publications, opinions, reports, and facts relating to this concept, then we can say that most of the attention is drawn to the technical aspects and emerging opportunities, the changes in production methods and in the methods and areas of interaction between producers and consumers, the economic resources, analysis of the technical prerequisites for realizing a new wave of innovation, the formation of new types of cities, and more.
At the same time, changes in production methods and economic activity cannot not lead to social transformations, the depth of which can perhaps be compared to the first industrial revolution. These transformations are certainly not always considered to be positive. The realization of the "INDUSTRY 4:0" concept relies on the objective preconditions, with its development focusing on achievements in technology, including informational. However, it is necessary to analyze the possible social consequences for society and identify the social risks in order to find mechanisms to reduce them. This has to do with problems of the new employment structure, transformation of educational system, and deepening of regional disparities.
The objective of the theoretical research is to look at possible changes in human resources and emerging soical risks connected with the "INDUSTRY 4:0" concept being realized.
2. Overview of the formation of prerequisites for the "INDUSTRY 4:0" concept in relation to social risks.
The works dedicated to the "INDUSTRY 4:0" concept highlight the development of Internet of Things (IoT) which suggests significant changes in the activities of enterprises [1, 2, 3]. In traditional markets, enterprises represent a relatively autonomous socio-economic system in which business processes are organized in a particular way, and resources are consumed and transformed influence from the personnel. IoT suggests that various
participants in the market are joined in order to satisfy consumer demands and be flexible in responding to consumers' requests by using a single platform based on cloud services.
This changes the interactions within the enterprise and the role of the personnel. For traditional enterprises, it is the personnel who is a management resource, influencing the main kinds of resources, while an exchange of information takes place among people. The IoT system of management directly affects actuating devices in enterprises, and here the information and means of processing it are already a basic resource. In this sense, a number of processes in the future will be fully automated (according to specialists, examples of possible fields would be transport infastructure and transport logistics). Accordingly, this will cause a reduction of personnel employed in similar fields as well as a change of the professional demands of those who remain.
The commercial Internet of Things, based on the principles of digital economy, makes it possible to combine resources (not only manufacturing and transportational but human as well) into "software-controlled", virtual resource pools, forming a shared economy in the industrial sphere, whereby the user is not provided with the devices themselves, but with the functions of the devices (the results of their being used), formed by joining and realizing cross cutting business processes and production processes.
Modern enterprises are now changing to a much larger degree under the influence of management technology, rather than production technology.
The consulting group J’son & Partners Consulting [4] notes the important tendencies of the modern economy that are related to the growth of IoT and to organizational and technological changes, such as:
- growth of access to data on the nature of equipment and product use (related to the growth of number of embedded devices) forms the possibility for new business models and services to develop;
- the economy's growth potential is ensured by the producers and internet-service providers themselves, who come to traditional spheres and transform them using cloud technology (taxi service, reservation of accommodation, etc);
- using new technology in the production chain and virtualizing the production functions create the possibility of producing a single product or a small series while taking into account the individual preferences of the consumer, thereby earning the manufacturer a profit;
- opportunities for sharing production infrastructure, thereby increasing the accessibility of resources for small businesses and widening the potential offers of various services.
Aside from the tendencies mentioned, the consulting group noted another one which directly impacts human resources:
220
"the functioning of various branches of economy will become continuously more complicated under the influence of technological development and will increasingly by carried out due to automatic decision making by machines themselves based on analyzing a large amount of data from connected devices, which will lead to a gradual reduction of the personnel's role, including qualified personnel. Quality professional education, including in engineering, as well as special educational programs for workers, and training will be required." [5] Therefore, the number of work places, including ones with qualification requirements, are expected to decrease in the future, thus forming a risk of unemployment.
When looking at the role of the service industry in a postindustrial economy, the majority of researchers noticed its role was in providing jobs and dampening the effect of reduction in the work force on industrial enterprises (for example, due to automation). However, when realizing the "INDUSTRY 4:0" concept, this dampening of social risks will not work. Moreover, the service industry itself will be at risk.
Russia is also under the influence of the new tendencies and processes related to the new technology paradigm. This is connected not only with the development of various local markets, but also with the formation of government programs.
We will hightlight a number of points noted in literature and from internet sources.
The Internet of Things is actively developing in the transport sector. This includes not just remote monitoring systems. Nowadays, smart phones are very popular among users (around 50% of all mobile devices), and this has acted as a catalyst for the development of such services as Uber and YandeksTaksi, while systems for monitoring road congestions on maps have been constructed [5].
The same tendencies exist in freight transport (logistics); the start ups GoCargo and iCanDrive are based on IoT. Specialists name such producers of remote vehicle tracking devices as Omnicom, "AutoGRAF Satellite Vehicle Tracking and Control System", GalileoSky, "Fort", Naviset, "Incotex", "Shtrih-TahoRUS", "Granit Navigator", M2M Cyber and others.
According to predictions, it will be the transport sector leading the new economy.
The company Ovum believes that transportation will significantly surpass the other economic sectors on income from the market of the Internet of Things [6] .
This growth will be driven by the cost reduction of special equipment as well as the reduction of costs relating to implementing innovative solutions.
Accordingly, the employment structure in the transport sector will change (and is already changing).
According to the opinion of Machina Research and the company Nokia [7], income from the global market of the industrial Internet of Things will reach 484 billion euros by 2025, and the main sectors will become transportation, manufacturing, utilities, health care, and smart house application.
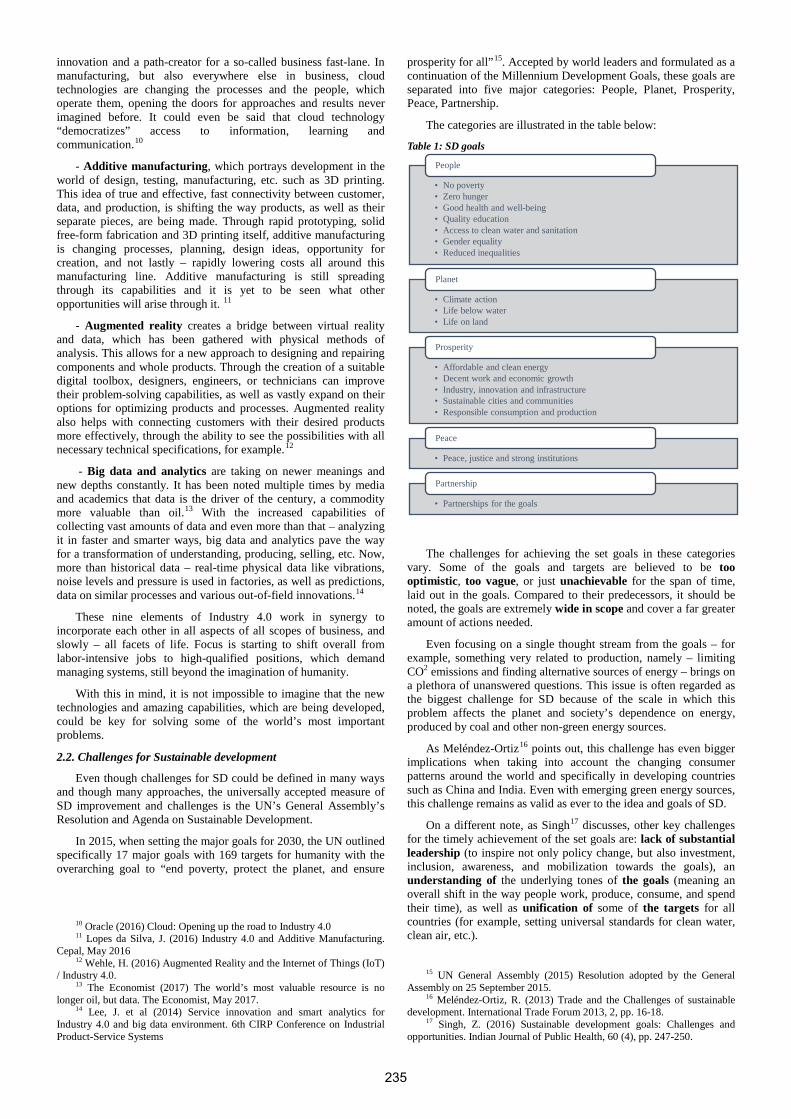
German scientists are considering ideas of a cyber platform, which would combine three types of networks: internet of people, internet of things, and internet of services (academy Acatech). It is noted that the development of "INDUSTRY 4:0" changes all social relationships, therefore problems in improving technology, technics, and production relations should be studied and solved by considering socio-cultural and demographic factors [8].
The consulting company IDC presented a new annual report, Russia Internet of Things Market 2017-2021, according to which expenses for the internet of things will reach over $9 billion in Russia by 2021 (for comparison, data on this company show 2016
expenses at $3.48 billion). Investments in equipment, software, services, and communications, which are involved in creating solutions for the internet of things in Russia, will grow on average 22% annually. Other factors highlighted for their contribution to these dynamics are: the interest and support from the government, the active digital transformation of companies, and the creation of partner systems for solution providers [9].
The "Digital Economy" program was adopted in Russia in July of 2017. The adoption of the program was due to a number of reasons, including Russia lagging behind in readiness for a digital economy, as noted in the program's text. It is pointed out that, according to a World Economic Forum's Global Information Technologies report, "The Russian Federation holds the 41st place in readiness for a digital economy at a significant distance from ten leading countries: Singapore, Finland, Sweden, Norway, the United States, the Netherlands, Switzerland, Great Britain, Luxembourg, and Japan. In terms of economic and innovative results for using digital economy, the Russian Federation comes 38th, lagging far behind leading countries like Finland, Switzerland, Sweden, Israel, Singapore, the Netherlands, the United States, Norway, Luxembourg, and Germany" [10].
World Economic Forum's Global Information Technologies report 2016 says «The Russian Federation remains in 41st place this year, as in 2015. The country places in the top third of the rankings for Readiness, Usage, and Impact, yet continues to be held back by a weak and deteriorating regulatory environment. As mobile and fixed Internet tariffs are very low and dropping further (10th place overall on affordability), individual usage continues to rise in almost every dimension, leaving Russia in 40th place in this category. However, the data suggest that infrastructure build-out is not keeping up with demand as Russia sees its availability of Internet bandwidth per user falling. Although Russia is close to the median in terms of business use overall, online sales to consumers (as opposed to other firms) are particularly strong (35th place). The positive impact of ICTs is felt both in the economic and the social dimensions, as reflected in rankings in the top third for both impact pillars» [11].
The goals of the program are: "to create a digital economy ecosystem in which digital data are a key factor in production in all spheres of social and economical activity and where effective cooperation is provided including across borders, in business, in the scientific and educational community, in government, and among citizens; to create the necessary and adequate conditions of an institutional and infrastructural nature, to eliminate existing obstacles and limits on creating and/or developing high-tech businesses..., to prevent new obstacles and limits from arising; to increase competition on the global market both in individual sectors as well as in the economy as a whole."
Three levels of digital economy are highlighted that in close cooperation affect the lives of citizens and society as a whole: economic markets and sectors; platforms and technology; an atmosphere which "creates conditions for developing platforms and technology and for the effective cooperation of subjects of the economic markets and sectors (spheres of activity), and which also covers regulation, information infrastructure, personnel, and information safety."
It is pointed out that the Program focuses on the two lower levels of digital economy, the directions being: forming a suitable environment (particularly personnel and education, and forming research skills); forming the basic infrastructure elements for digital technology (informational infrastructure, information safety) [10].
Thus, it is possible to acknowledge the influence digital technology has "on the lives of citizens and society as a whole." The health sector can be named as one of the branches of economy primarily affected by the transformations. Also presented in the course of the program are social aspects relating to changes in the system of education and personnel training. The following aims are
221
considered: "create key conditions for training the personnel of digital economy; improve the education system, which should provide a digital economy with competent personnel; labor market, which should be based on the demands of the digital economy; create a system of motivation to develop the necessary competencies and for personnel to take part in the development of the digital economy of Russia." Changes in the activities of educational organizations on all levels are envisaged on the "road map" of the program and propose the development of "digital competencies" and the formation of "a personal development trajectory.
The influence on human resources and society is considered in terms of its challenges and threats: "the problem of ensuring human rights in the digital world, including in the identification and preservation of digital user data, as well as the problem of ensuring the citizens' trust of the digital environment; the threats to individuals, business, and government, which are related to the tendencies of building complex hierarchical information and telecommunication systems that widely use virtualization, remote (cloud) data storage, as well as various communication technologies and terminals." [10].
However, possible social problems and risks are practically not given any attention in this government document (risks for the labor market, for the education system), as a result of which there are not even any indicators of the need to develop measures to mitigate possible negative phenomena.
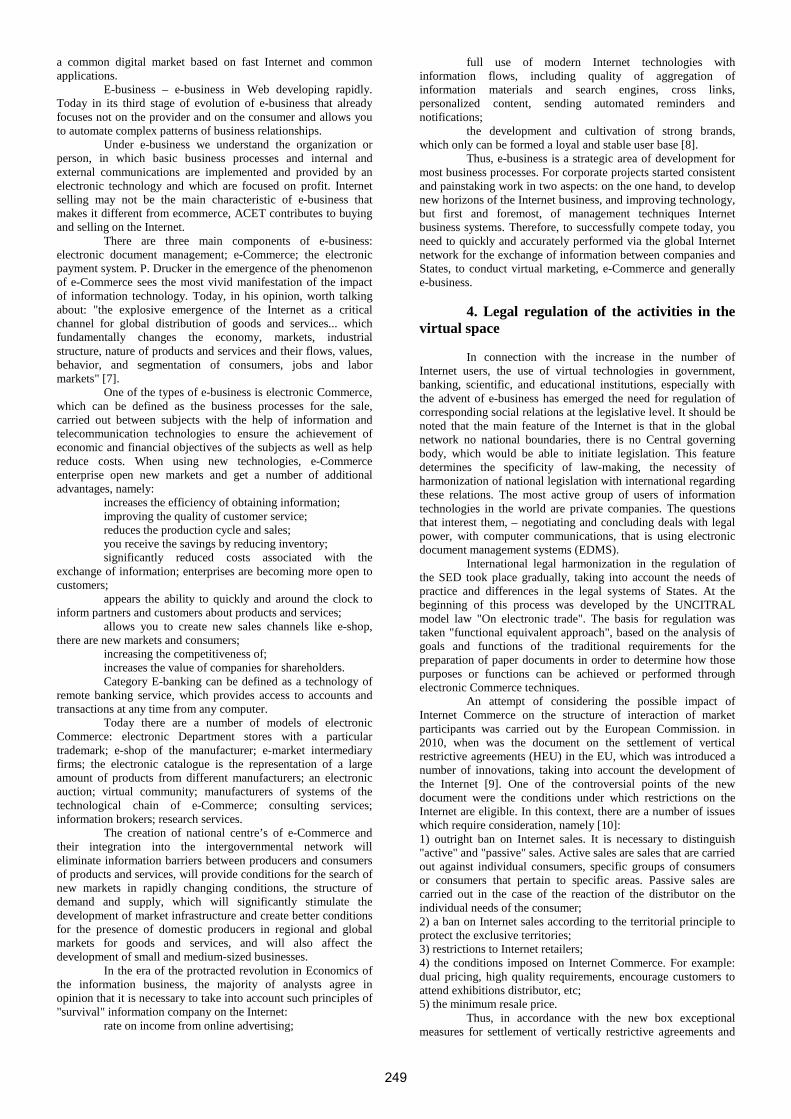
One important problem, which is not only technical but social as well, is the ensurance of protection against unsanctioned access to user data. A lack of adequate protection can lead to threats to social safety increasing.
According to data from the company Avast, a research of smart devices in Russia showed that almost 24% of these devices were not protected against cyber attacks (for example, "nanny cams"), unsecured printers (27%), routers (almost 70%); this could lead to a violation of privacy and an increase in crimes. Unsecured devices can be used for connecting to other devices, for example, connected to a smart house, and can be used to control their function and can even cause harm [4]. Children can fall under this threat. The potential risks of using the My Friend Cayla dolls (an interactive toy that can hold a conversation with a child by using special devices hooked up to smart phones and tablets, as well as voice recognition technology), turned out to be so great, that the FBI (USA) were forced to warn the parents about the dangers of the innovative toy. Audio files recorded by the toy were collected by the corporation Nuance Communication, and a private database was made up of 30 million voice samples. In February of 2017, the federal network agency of Germany recognized the doll as covert spyware and obliged parents to get rid of the toy [12]. Even if the manufacturers of similar toys use the collected information to improve their performance, breaking into databases and leaking information is still possible (mass media provides the example of theft of data from a database which was collected by the manufacturer of the smart plush toys CloudPets) [13].
The recommendations given by the company Avast are to change passwords and software. However, a significant amount of users have little knowledge of the technical details and subtleties of devices. Accordingly, educating users is necessary in order to ensure an acceptable level of social safety.
It seems social risks relating to changes in the demands of the labor market and employment structure are much higher. According to company research from World Skills Russia and The Boston Consulting group (BCG), by 2025 the most in-demand workers in Russia will be those from the so-called "knowledge" category, who are capable of analytical work, improvising, independent solutions, and working in uncertain situations. As of now, approximately 17% of workers perform creative or analytical tasks (in European countries - 29-45%), around 50% are employed in predominantly routine work. 35% of workers are employed in
positions that do not require special training (the most common professions are: driver (7%), salesperson (6.8%), security guard (2%)). It is suggested that around 10 million people may be unemployed in Russia [14].
Personnel of low qualifications are at the most risk of losing their jobs (janitors, assistants, drivers, salespeople). Also at risk are workers who perform algorithmic work and technical work according to instructions (administrators in the service industry, workers of individual specialties, and workers from the service industry), as they can easily be replaced by machines, robots, and computer technology (according to Citibank's estimates, there will be around 57% of such professions in the next 10-15 years). The work of the mentioned groups is characterized by routines, standard tasks, decision making based on instructions, and physical labor.
It is worth noting that Russia is noticeably behind advanced countries when it comes to the level of robotics (1 commercial robot for every 10 thousand in 2017), therefore, problems of changes in employment will arise somewhat later than in other countries. However, active steps in the development of a digital economy can move this period noticeably closer. Workers who are let go due to this will be defined by quite low qualifications, while new work places for them may simply not be found. This could cause a growth in marginalized groups of society, a higher crime rate, and a lower quality and standard of living.
The international service provider Orange Business Services together with iKS-Consulting conducted a study of six Russian industry leaders of the enterprise market of the internet of things (IoT) - transport, finance, agriculture, retail, construction (smart building), and industry (August 2017). According to the analysts' estimates, traditional automation systems in the leading industries are used on average by a third of enterprises (CRM-, ERP- and SCM-systems, as well as automatic control systems; the M2M solutions, which appeared on the threshold of the transition to the internet of things, stand out separately) [15].
Researchers believe that the biggest growth in the implementation of the IoT-solutions is expected in retailing by 2020. In 2017, there were 1.4 million connected IoT devices in this sector; around 4 million are expected by 2020. Furthermore, this sector has seen a high level of implementation of CRM systems (23%) and SCM systems (12%), and a high level of competition which encourages the development of high technology, for example tracking goods using radio frequency tags (RFID), monitoring shoppers' movements using mobile devices based on technology that tracks the movement of buyers on store floors and using face recognition systems. This will change the requirements for personnel employed in retailing in the future. If today's trade sector successfully absorbs workers who have been let go, then the situation may change in the future.
S. Yezyk, general director of "Center 2m" notes that the transport sector is showing interest in IoT solutions, and the number of participants in information exchange is increasing. Thus, a "connected" car can provide information to insurance and leasing companies and the municipality, and processing this data makes it possible to predict malfunctions and recommend methods to fix them. [16].
In the Russian IoT market, pilot projects are being developed and introduced, technology is being tested, and completed industry solutions are being replicated. This allows us to conclude that the potential social risks will keep growing.
Incentives and barriers in the path of IoT development in Russia have been analyzed in the research from PwC [17]. In particular, the researchers noticed a limit on the side of consumer demand, namely the low income level. Thus, according to official statistics, the poverty level (population with an average income lower than the subsistence level) on average makes up about 13% of Russia (the subsistence level being 10,329 rub. – around 150 euro). This must also be taken into account, since there is a risk of
222
excluding a large portion of the population from the consumption of modern technology, and this can lower their standard of living even more. On the other hand, this portion of the population often performs unskilled work and could lose it with the launch of an industrial revolution, and effective demand will decrease even more. In other words, consumers will not have the means to buy smart things.
At the same time, the Russian consumer market of smart things has a particular specificity (for example, purchasing expensive mobile devices on credit, saving for months to buy a desired gadget, etc.). Thus, the proportion of iPhones in the smart phone market in Russia continues to grow and makes up more than 10% of sales in natural numbers.
Specialists have named the following as other social factors constraining the development of IoT: lack of specialists (inconsistency of the education system with future tasks), and inadequate knowledge and skills in working with smart devices.
It is worth noting the significant social effect that IoT technology can have for the health sector where micro and nanosensors will help improve the quality and accuracy of diagnostics.
IoT technology will have a multiplicative effect on the economy sectors due to an increase in workforce productivity and a reduction in costs. Accordingly, unemployment will increase. At the same time, not all those who will have lost their jobs will be able to learn the necessary professions, since changing from routine activities to creative ones is very difficult, especially for those with a long work history.
3. Solution of the examined problem When considering the tendencies in the development of a new
economy and the potential risks that may arise, it is necessary to provide social dampers and preventive measures to reduce risks.
A solution to part of the social problems can be linked to global changes in taxation principles, creating special social funds formed at the expense of super profits of companies (leaders of the new industrial revolution) or with taxation on robots. This idea was already put forward during an interview on the American internet portal Quartz by the founder of the Microsoft corporation, Bill Gates, who thought that due to the ubiquitous replacement of human labor by machines and robots, the work of the latter should also be taxed. He believes that employees pay taxes into a social insurance fund and personal income tax, so if the job of a worker has been replaced by a robot, this amount of taxes should be left. The created monetary funds could be used to pay social obligations for the elderly, unemployed, and large families. This would only be possible with state coercion, as employers will not make such deductions voluntarily. However, the European Parliament rejected the initiative to tax robot labor; according to the head of the European sector on digital economy Andrus Ansip, taxing the results of progress will lead to the technological lag of the European Union [18].
The problem of social risks in a new economy is recognized by the International Bar Association (IBA). According to research conducted by the association, around a third of people could lose their jobs due to the use of new technology. Therefore, it is necessary to change the labor legislation and new approaches to the right to work, since existing laws will not be capable of protecting people against the new reality. Gerlind Wisskirchen, IBA GEI Vice Chair for Multinationals and coordinator of the report, commented: «Certainly, technological revolution is not new, but in past times it has been gradual. What is new about the present revolution is the alacrity with which change is occurring, and the broadness of impact being brought about by AI and robotics. Jobs at all levels in society presently undertaken by humans are at risk of being reassigned to robots or AI, and the legislation once in place to
protect the rights of human workers may be no longer be fit for its purpose, in some cases» [19].
In the opinion of the association, governments must think about which jobs will be left to people and which jobs can be given to robots. It is worth providing job quotas for people. They also suggest introducing the special label "Made by human". Mechanical labor is not the only area shrouded by the threat. Lawyers also support the idea of a robot tax.
We should also highlight the problem of social adaptation to a digital economy, particularly, as concerns the need for continuous professional development and the development of new skills in the digital field. Experience in implementing internet technologies in the activities of various social organizations in Russia shows a high level of momentum, especially in provincial regions. One frequently noticed situation is where an interactive space is created formally (to meet law requirements, standards, etc.), but fails to work in reality. This can be concluded, for example, by analyzing the websites of many provincial houses of culture, primary schools in towns, passport offices, etc., even though the introduced technology is fairly simple. Thereby, a regional inequality between the central and provincial regions is formed.
Overcoming the risks of social security in connection with the use of innovative devices contributes to the growth of digital literacy among the population. This problem is consistently included in the Russian government program of digital economy.
The development of a new industrial revolution leads to a new social stratification. Expanding access to data and new solutions helps eliminate barriers for business and this provides new opportunities for a portion of the population. For those who are unable to adapt to the new challenges, a reduced salary, higher chance of unemployment, a lack of benefits, and a loss of economic status will become their new reality. At the same time, the funds for reducing social risks using traditional methods (taxes, insurance premiums) will be scarce.
The increasing inequality between various countries and regions can be cited as a global social risk. For those governments which are developing the IoT concept, the result is a strengthening of their position in the global system of division of labor and, as a result, the growth in the amount of quality jobs and the general growth of quality of life in these countries. Reducing the demand for low-skilled workers leads to a change in migratory behavior; however, those who have already come to a country, will probably create new social problems (employment, benefits, etc.). Poor countries practically lose the chance of a normal existence, since they will not even be able to supply human resources in the future. Therefore, it is necessary to think about global funds for social assistance, since the risks of social security will increase in this case.
4. Results and discussion The examined social risks certainly do not cover all the
possible negative social consequences and emerging issues. Experts also point out issues of work hours and issues of responsibility for decisions. The question arises, where does the responsibility of a human, robot, and automated decision making system start and stop? This is already relevant for such sectors like transport, where driverless vehicles are becoming more widespread. Another problem is the social responsibility for the work of technically complex systems (cost of error).
5. Conclusion The development of the "INDUSTRY 4:0" concept carries with
it great technical opportunities, including the growth of all economic indicators and improvement of the quality of consumption.
223
At the same time, the social consequences of a new industrial revolution are ambiguous, and a whole range of emerging social risks can be highlighted.
The most significant social risks are:
- social risks of realizing the newest technological solutions: social safety of device users, protection from criminal actions;
- social risks of deep changes in the labor market: inconsistency of labor legislation with ongoing changes, risk of unemployment and deepening inequality, risk of reduced income;
- social risks of inconsistency of activities of educational institutions (including teachers) with the demands of the new labor market;
- social risks of lack of financial resources for helping the unemployed, for retraining, etc. (including as a result of reduction of tax revenue on personal income and contributions to social insurance funds);
- social risks of a new regional inequality forming, due to international competition, including the fact that human resources of some countries will be unclaimed in the new economy; the same competition could appear within a country as well, between regions and between the central and provincial areas;
- risks of social exclusion of people who are unable to master digital competencies and provide flexibility in professional activities.
Possible courses of action to reduce the potential social risks are:
- global change of taxation principles relating to the creation of special social funds formed at the expense of super profits of companies (the leaders of the new industrial revolution) or with taxation of robots;
- significant changes in international and national labor legislation focused on protecting human labor against robot labor (a job quota, special labels on products, etc.);
- development of measures aimed at social adaptation to a digital economy, increasing digital literacy.
6. References 1. The European Commission. https://ec.europa.eu/digital-
3. Microsoft . https://www.microsoft.com/en-us/internet-of-things/
4. J’son & Partners Consulting. http://www.json.ru/ 5. Industrial Internet of Things. World experience and
prospects for development in Russia. J’son & Partners Consulting. Ноябрь 2016. http://json.tv/ict_telecom_analytics_view/industrialnyy-promyshlennyy-internet-veschey-mirovoy-opyt-i-perspektivy-razvitiya-v-rossii-otsenka-vliyaniya-na-kachestvo-jizni-grajdan-i-ekonomicheskoe-razvitie-strany-20161128041733
6. Ovum. https://ovum.informa.com/ 7. Machina Research. https://machinaresearch.com 8. Deutsche Akademie der Technikwissenschaften.
http://www.acatech.de/uk/home-uk/work-and-results.html 9. Russia Internet of Things Market 2017-2021.
http://idcrussia.com/ru/about-idc/press-center/65015-press-release 10. The program “Digital Economy of the Russian
11. World Economic Forum's Global Information Technologies report 2016. http://reports.weforum.org/global-information-technology-report-2016/economies/#indexId=NRI&economy=RUS
12. BBC news. http://www.bbc.com/news/world-europe-39002142
13. CloudPets stuffed toys leak details of half a million users. The Guardian. https://www.theguardian.com/technology/2017/feb/28/cloudpets-data-breach-leaks-details-of-500000-children-and-adults
14. Россия 2025: от кадров к талантам. World Skills Russia & The Boston Consulting group. http://image-src.bcg.com/Images/Skills_Outline_web_tcm27-175469.pdf
15. The research study by Orange Business Services and iKS-Consulting shows a stable average yearly growth of the Russian Internet of Russia by 12% before 2020. https://www.orange-business.com/ru/press/issledovanie-orange-business-services-i-iks-consulting-pokazyvaet-stabilnyy-srednegodovoy-rost
16. The Internet of Things, IoT, M2M market of Russia. TADVISER. State. Business. IT. http://www.tadviser.ru
17. The Internet of Things (IoT) in Russia. PwC. https://www.pwc.ru/ru/publications/IoT.html
19. Law requires reshaping as AI and robotics alter employment, states new IBA report. International Bar Association. https://www.ibanet.org/Article/NewDetail.aspx?ArticleUid=012A3473-007F-4519-827C-7DA56D7E3509
Abstract: Nowadays the world is surviving the fourth industrial revolution named Industry 4.0, which combines physical world of real things with their “virtual twins”. The man with his intellect, creativity and will lies beyond this ideology. Now the image of a new paradigm of Industry 5.0 could be seen. It involves the penetration of Artificial Intelligence in man’s common life, their “cooperation” with the aim of enhancing the man capacity and the return of the man at the “Centre of the Universe”. The paper outlines modern technologies – from IoT up to emergent intelligence, being developed in organizations where authors work. The convergence of these technologies, according to our minds, will provide the transformation from Industry 4.0 to Industry 5.0.
Keywords: PARADIGM OF SOCIETY 5.0, RETURN OF THE MAN, EMERGENT INTELLIGENCE, EVERGETICS, ONTOLOGY AND KNOWLEDGE BASE, MULTI-AGENT SYSTEMS, INTERNET OF EVERYTHING
1 Introduction The breakthrough in new information technologies ensured the
world to stand on the threshold of the 4-th industrial revolution, named «Industry 4.0».
During the implementation of concepts of "Industry 4.0" the technologies of design and production of difficult technical products cardinally changed. The view of a role of computers in control of the enterprises and, first of all, regarding to methods and means of industrial automation of the plants and factories which passed the way from use of sensors and automation of technological processes – to integration and visualization of data and intellectual support of decision-making by users, changes, too.
It is known that the term “Industry 4.0” was first publicly introduced in 2011 by a group of representatives of Germany business, political and scientific community. It was defined as means to achieve a competitiveness of the industry through the reinforced integration of "cyberphysical systems" (CPS) into productions [1]. At the same time, if 3-4 years ago the concept of "Industry 4.0" was viewed by many people as the next advertizing course, then now the interest in it has developed into real investments and results. According to researches of PwC the annual volume of investment into digital technologies within "Industry 4.0" will exceed 900 billion US dollars by 2020 [2].
It is necessary to note that still now the term "Industry 4.0" remains rather foggy and dim. The words of one of a production site manager with automotive manufacturer "Audi" could serve as a confirmation of this. He told that: “Even though Industrie 4.0 is one of the most frequently discussed topics these days, I could not explain to my son what it really means” [3].
In [4, 5] Industry 4.0 is determined as «an umbrella term used to describe a group of connected technological advances that provide a foundation for increased digitisation of the business environment». It is consistent with the definition of Industry 4.0 made by McKinsey as “the next phase in the digitization of the manufacturing sector, driven by four disruptions: the astonishing rise in data volumes, computational power, and connectivity, especially new low-power wide-area networks; the emergence of analytics and business-intelligence capabilities; new forms of human-machine interaction such as touch interfaces and augmented-reality systems; and improvements in transferring digital instructions to the physical world, such as advanced robotics and 3-D printing” [6].
There are usually identified four key components (CPS, Internet of Things (IoT), Internet of Services, and Smart Factory) and 6 major technologies (the Industrial Internet of Things (IIoT) and CPS, additive production (3D - the printing), BigData, an artificial intelligence (AI), Collaborative Robots (CoBot) and the virtual reality) to develop Industry 4.0 [3]. At the same time the main attention concentrates around technical aspects of their implementation. And the man, with his mental, creative and will
abilities, lies beyond this ideology [7]. The only thing that is given a deal regarding human resources is possible changes of labor market caused by the Industry 4.0 [8-10].
Such situation is unsatisfactory and it finds reflection in a number of the articles devoted to the Industry 4.0. In particular, in [11] it is marked that «the world of work in Industry 4.0 will still be inconceivable without human beings» The author of [12] asks the fundamental issues «How can people and society benefit from Industry 4.0?»
Moreover, in spite of the fact that Industry 4.0 is only at the initial stage of the development and the main achievements can be expected not earlier than 2020-2025 [10], the image of a new paradigm of Industry 5.0 could be seen. It involves the penetration of Artificial Intelligence in man’s common life, their “cooperation” with the aim of enhancing the man capacity and the return of the man at the “Centre of the Universe”.
In this regard, probably, the more exact term instead of Industry 5.0 is “Society 5.0” (SuperSmart Society) that was offered in 2016 by Japan's most important business federation, Keidanren and being strongly promoted by Council for Science, Technology and Innovation; Cabinet Office, Government of Japan. [13]. Unlike the concept of Industry 4.0, Society 5.0 is not restricted only to a manufacturing sector, but it solves social problems with the help of integration of physical and virtual spaces. In fact, Society 5.0 is the society where the advanced IT technologies, IoT, robots, an artificial intelligence, augmented reality (AR) are actively used in people common life, in the industry, health care and other spheres of activity not for the progress, but for the benefit and convenience of each person [14].
The paper outlines modern technologies – from IoT up to emergent intelligence, being developed in organizations where authors work. The convergence of these technologies, according to our minds, will provide the transformation from Industry 4.0 to Society 5.0.
2 On the way to Society 5.0: directions and prospects
This fig. 1 depicts the conventional "pyramid of sciences and technologies" which convergence, in our opinion, can provide the transition to Society 5.0. Distribution of layers in a pyramid to its top comes from the bottom in process of abstraction from the world of real objects (may be with some elements of AI), to concepts of Society 5.0, which can include the Evergetics – a new theory of intersubjective management processes in everyday life, and emergent artificial intelligence.
2.1 New types of distributed computers and “Swarm of Robots”
These technologies are the hardware base for creation of the intellectual self-organized systems of different types.
225
Fig. 1 Convergence of sciences and technologies in Society 5.0
The distributed computer networks have complex topological network design and provide multithreaded parallel and asynchronous computings.
"Swarms of robots" represent the self-organized groups of robots. And here we do not refer to the anthropomorphous robots only, but to the distributed smart technical systems. The intelligent gas-turbine engines with smart blades can be an example of this technology. In such engines each blade "agrees with neighbors" about its position (how it should be turned) in an air-gas path to provide optimum conditions of working medium (gas) flow and to prevent emergency state of the power plant [15].
These technologies also include the self-organized groups of small spacecrafts (nano- and piko- satellites) which, like the swarm of bees, can be multifunctional and flexibly configured in order to solve a particular problem, reliable and stable in the most different situations during the Earth observation, objects research in open space, telecommunication problem solving and other various tasks [16-18].
Another example is the "swarm" of pilotless tractors and other farm vehicles which are "… speaking with each other …" and are "… in constant communication among themselves, collaborating with each other" [19, 20], etc.
2.2 Internet of Things and People
IoT (including industrial IoT (IIoT)) is intensively developing technology that complement traditional and usual to us Internet of people, and is an automation basis in Industry 4.0 and Society 5.0.
As it is given in official Recommendation ITU-Y.2060 - Overview of the Internet of Things, IoT is a global infrastructure for the information society, enabling advanced services by interconnecting (physical and virtual) things based on existing and evolving interoperable information and communication technologies [21]. At the same time, generally, the "thing" means an «object of the physical world (physical things) or the information world (virtual things), which is capable of being identified and integrated into communication networks» [21].
In 2013 Cisco offered the term “Internet of Everything” (IoE), which is considered to be wider than IoT. Cisco determines IoE as ”the networked connection of people, data, process and things. The IoE is made up of many technology transitions, including the Internet of Things” [22].
It is obvious that implementation of IoT (IIoT, IoE) requires development of a number of perspective technologies, including sensor (intellectual sensors, smart dust, …), telecommunication (RFID, NFC, Wi-Fi, 6LoWPAN, ...), etc. It will allow the "intelligence" to be encapsulated in a "thing" at a stage of its production. At the same time in Society 5.0 (as, however, and in Industry 4.0) IoT (IoE) should not be a technology for the sake of technology. Its opportunities should be directed to the benefit of the person, to improvement of quality of his life.
2.3 Multi-Agent systems and technologies
Implementation of IoT (IIoT) technologies assumes transfer of computation to the virtual world ("cloud") where each "virtual" twin
of objects of the real world acts according to the selected algorithm and rules. For communication of the real and virtual worlds intellectual agents are used. They can perceive information from the real world, make decisions and coordinate them with other objects or users in real time. At the same time real objects can independently work or be parts of more difficult objects (household things, the flexible production line, group of drones, etc.)
The multi-agent system in [23] is defined as a network of weakly connected solvers of private problems (agents) which exist in the general environment and interact among themselves for achievement of these or those purposes of system. Interaction can be carried out by agents in a direct path – by message exchange, or indirectly, when some agents consider the presence of other agents through changes in the external environment with which they interact.
Multi-agent systems and technologies can be applied to the solution of extremely difficult tasks (for example, planning and optimization of resources and knowledge acquisition of the class of Big Data and Small Data), and to creation of digital ecosystems ("the systems of systems") of the services capable to cooperate and compete among themselves, allowing the transformation of simple IoT in smart Internet of people and things (The Internet of agents).
2.4 Ontology and Knowledge Bases
Ontology is a knowledge representation system about data domains [24-26]. As it is marked in [27], the ontology "is often understood as "the specification of conceptualization" … or even as a synonym of "a conceptual domain model" (more precisely, a set of the coexisting conceptual models)…" In the same source [27] it is said that "in the simplest case ontology is defined as "some general dictionary of the concepts used as construction bricks in information handling systems". Usually it describes hierarchy of the concepts connected among themselves by the categorizing relations" [27].
Ontological approach was widely adopted in the multi-agent systems, where ontologies actually are those knowledge bases of intellectual agents which contain both knowledge of specific data domain, and knowledge, belonging to methods of the decision-making [28]. On the basis of ontologies, agents have an opportunity to make search in knowledge bases and apply them to message exchange (for example, in the modern versions of languages of agents communication (ACL, etc.)) [23]
At the same time, according to [24], in case of integration of ontology and multi-agent system it is possible to select three qualitatively different from each other approaches:
− each agent stores the ontology containing knowledge and concepts available only to it;
− the ontology is unified for all agents and is stored on a centralized basis (as a rule, on the special agent);
− the ontology is partially unified, and partially – is distributed.
In [24] is also marked that application of ontologies in the multi-agent systems will provide standardization of knowledge representation, will simplify information exchange between agents and also "will allow in case of impossibility of communication between agents, which is often found in real projects, to recover or predict with some accuracy a behavior of other agent on the basis of the known parts of his ontology".
2.5 Theory of Complex Adaptive Systems
The theory of complex adaptive systems appeared in the 90s. One of the most famous researchers in this area is J. Holland [29]. The kernel of J. Holland’s theory is that irregular shapes of live systems arise from the adaptive behavior of simple one, and the adaptive behavior can be reduced to the sequences of micro-interactions with the environment of which consists a dynamics of more complex structures (for example, an anthill, a swarm of bees, flock of birds, etc.) [30].
The complex adaptive system according to J. Holland [29] has properties of aggregation (hierarchy of elements when simple elements of lower level form elements of higher level – aggregates),
226
nonlinearities, flows of resources (constant exchange with the environment and maintenance of internal level of conversion of the arriving resources), diversity (absence of an equilibrium status). J. Holland refers tagging (the marking providing visibility and identification of system from the outside), internal models (allow system to trace and predict the environment’s dynamics) and building blocks (structural elements of system) to mechanisms of the adaptive systems’ organization. At the same time J. Holland believes that these properties belong to any complex system.
Thus, it can be regarded that the theory of complex adaptive systems is a base of the multi-agent systems. It establishes a connection between multi-agent systems and non-linear thermodynamics when the solution of any complex task is reached during self-organization and is treated as "stable disbalance" (a temporal consensus).
2.6 Emergent Intelligence
Emergent intelligence (intellectual resonance, swarm intelligence) is a phenomenon of unexpected properties whereby larger entities arise through interactions among smaller or simpler entities such that the larger entities exhibit properties the smaller/simpler entities do not exhibit [31].
In [32] emergence is determined as «global behavior of a complex system emerges from the interaction of agents and, in turn, constrains agent behavior». At the same time it is noted that «emergent behavior is unpredictable but not random; it generally follows discernible patterns (a new order)».
The key feature of emergent intelligence consists of dynamics and unpredictability of decision-making process by means of a large number of interactions (hundreds and thousands) which cannot almost be traced. Therefore the emergence property is often connected with multi-agent technologies which realize interactions of rather simple "smart elements" (agents) during their self-organization for the solution of a specific objective.
2.7 Evergetics
Evergetics is the emerging postnonclassical science of intersubjective management processes in the society. "Evergetics" in Greek (Eυεργέτης) means “benefactor” and already in its title there is an orientation for "good actions" in management processes (decision-making). It distinguishes evergetics from classical management science and cybernetics, invariant to any values [33, 34]. At the same time D.A. Novikov ranks evergetics in his navigator on cybernetics as cybernetics of the third order for interacting subjects of control [35].
In [36] the author of evergetics professor V. Vittikh defined it as «…the science of management processes organization in a developing society, each member of which is interested in augmenting his cultural heritage he is producing, which entails a raise of cultural potential of the society as a whole and, as a consequence, an increase in the proportion of moral and ethical managerial decisions and corresponding to them benevolent actions in public life». On the V. Vittikh’s opinion «this interdisciplinary science must rely on both humanities and social sciences, as well as on the Control theory, Informatics and on some other disciplines related to the category of the exact sciences. Such multi-disciplinary nature is due to the fact that the man in Evergetics is considered, on the one hand, as a subject, armed with methods and means to research situations and to make decisions how to settle them, and on the other hand, as the object of education, training, world outlook formation and skill to communicate with other people, etc.» [36]. At the same time V. Vittikh's evergetics does not reject traditional "system" approach to the control of socio-technical systems at all, but adds and expands its opportunities. [37].
The theory of intersubjective management processes [38] in which each active person can prove as the non-uniform "actor" realizing himself, "dipped" in some problem situation and ready to participate in its settlement together with other actors [39], is the cornerstone of evergetics. If you have a large number of actors the solution of any task is very laborious procedure and here the multi-agent systems, which provide a real-time (at the situation
development) decision-making, can be used. At the same time the decision is made on the basis of the consensus which is based on mutual beliefs, compromises, concessions, etc. It creates a barrier to manifestations of violence, the evil, aggression and other defects because in processes of negotiations and decision-making people switch on value factors which cannot remove, but "smooth" these negative phenomena [40].
All mentioned above allows to assert with confidence that evergetics as a science about management processes in socio-technical systems, is aimed on use of knowledge, will and energy of people, disclosure of their talents for the benefit and convenience of each person. It completely corresponds to the concept of Society 5.0. Therefore in fig. 1 evergetics is placed on top of "a pyramid of sciences and technologies" in Society 5.0 on which a man leans.
3 Scientific and technical backlogs: eligibility and development
The key sciences and technologies that make possible a transition to Society 5.0 and that were briefly introduced in section 2, are and will be in researchers’ and IT-developers’ focus in the nearest and distant future. The organizations represented by authors are not an exception. We have all necessary competence and experience in development of similar systems, being pioneers in many of the directions sited above. At the same time, in the considered context, our main interests and achievements are concentrated on the development of multi-agent systems, ontological data analysis and evergetics.
Multi-agent systems and technologies are being developed in Samara more than 25 years (since 1990) [41]. Initially there was directivity on the development of new methods and tools for solving of complex problems based on the principles of self-organization and evolution (the fact that "the emergent intelligence" is called). In particular, successful examples of development of the multi-agent systems were connected to models of networks of needs and opportunities (NO-networks) and method of the conjugate interactions for resource management in real time. This approach was developed in V. Vittikh and P. Skobelev's works [42, 43].
According to this approach the NO-networks are created. There can be marked agents (roles) of the needs and opportunities, by determination representing entities with opposite interests which work within virtual "market" of system and can both compete and cooperate with each other [41]. At the same time the role of needs bears in itself knowledge of the "future", and an opportunity role – knowledge of the “past”. Such approach allows to view the different processes of the solving of complex multicriteria tasks of resource management of any nature (static or moving, separated, renewable, etc.) absolutely from the new side. In this case they are considered as a process of self-organization with detection and the conflict resolution between agents by negotiations with concessions for achievement of consent (consensus) by them [40].
The methods and multi-agent systems realized on their basis were used for the solution of a wide range of tasks – from clustering and understanding of texts up to dynamic resource management of the space, transport systems and the industrial enterprises [44-51]. Their industrial implementation proves efficiency of the developed approach and defines perspectives for the solution of a wide range of complex tasks within the concept of Industry 4.0 and further Society 5.0.
As it was already noticed, the organization of knowledge system about data domain and methods of knowledge deployment in the multi-agent systems is carried out on the basis of ontologies which allow to describe the heterogeneous, multicoupling and incomplete knowledge that can contain incorrect information and be connected not only hierarchical, but also by network structures, etc. [26]. Pioneer works in the field of ontological data analysis were made by S. Smirnov [25, 52-54]. He made an essential contribution to the solution of one of the significant problems in this area: the automation of formation of ontologies of data domains on the basis of measurements [55]. The technique of detection of conceptual structure (the formal ontology of experimentally researched data
227
domain) offered by S.V. Smirnov is based on the analysis of the formal concepts [54]. He generalized the standard object-and-features data model and used for its processing the multiple-valued vectorial logic.
It is also necessary to mark that the formal ontologies can be a theoretical and technological framework for implementation of the bases concepts of created theory of intersubjective management processes – evergetics [56] (it was described in detail in item 2.7). In particular, for identification of a sense of a problem situation for the actor it is possible to use a method of ontological data analysis. The basis of this method is theoretically well reasonable analysis of the formal concepts. And the communicative semantic model of a problem situation, that is necessary for all actors, can be received as a union of actors’ subjective ontologies.
4 Conclusion The provided review shows that the growing popularity of
digital economy and uncountable number of practical applications have created a strong basis for development of Industry 4.0 technologies already now and in the long term can serve as the launch pad for creation of Society 5.0. And the evergetics which returns "ordinary" people from everyday life to the world of intellectual systems and gives the chance to use personal intellectual resources of each person and to do the habitat attractive to people, "area of an attraction", but not a zone of their temporary residence, can form a theoretical basis for this "future society".
References [1] Kagermann H., Lukas W., Wahlster W. Industrie 4.0: Mit
dem Internet der Dinge auf dem Weg zur 4. Industriellen Revolution. VDI nachrichten, Nr.13, 2011.
[2] Industry 4.0: Building the digital enterprise. http://www.pwc.com/ee/et/publications/pub/Industry%204.0.pdf
[3] Hermann M., Pentek T., Otto B. Design Principles for Industrie 4.0 Scenarios: A Literature Review. Working Paper No. 01. 2015. http://www.snom.mb.tu-dortmund.de/cms/de/ forschung/Arbeitsberichte/Design-Principles-for-Industrie-4_0-Scenarios.pdf
[4] Davies R Industry 4.0. Digitalisation for productivity and growth, Briefing for the European Parliament (PE 568.337) September 2015. European Parliamentary Research Service
[5] Kagermann H Change Through Digitization—Value Creation in the Age of Industry 4.0. In: Albach H, Meffert H, Pinkwart A, Reichwald R (eds) Management of Permanent Change. Springer Fachmedien, Wiesbaden, pp 23–45
[6] Industry 4.0 is more than just a flashy catchphrase. A confluence of trends and technologies promises to reshape the way things are made. June, 2015. https://www.mckinsey.com/business-functions/operations/our-insights/manufacturings-next-act
[7] Rada M. INDUSTRY 5.0 definition. https://www.linkedin.com/pulse/industrial-upcycling-definition-michael-rada/
[8] Gehrke L., Kühn A.T., Rule D., Moore P., Bellmann C., Siemes S., Dawood D., Singh L., Kulik J., Standley M. A Discussion of Qualifications and Skills in the Factory of the Future: A German and American Perspective. April 2015. https://www.researchgate.net/publication/279201790
[9] Hecklaua F., Galeitzkea M, Flachsa S., Kohlb H. Holistic approach for human resource management in Industry 4.0 Procedia CIRP 54 ( 2016 ) pp.1–6
[10] Lorenz M., Rüßmann M., Strack R., Lueth K., Bolle M. Man and Machine in Industry 4.0. How Will Technology Transform the Industrial Workforce Through 2025? https://www.bcg.com/publications/2015/technology-business-transformation-engineered-products-infrastructure-man-machine-industry-4.aspx
[11] German standardization roadmap Industry 4.0. Version 2. https://www.din.de/blob/65354/f5252239daa596d8c4d1f24b40e4486d/roadmap-i4-0-e-data.pdf
[12] Buhr D. Social Innovation Policy for Industry 4.0. Publisher: Division for Social and Economic Policies, Friedrich-Ebert-Stiftung. 2017. 24 pp. http://library.fes.de/pdf-files/wiso/11479.pdf
[13] Nirmala J. Super Smart Society: Society 5.0. RoboticsTomorrow, 2016 https://www.roboticstomorrow.com/ article/2016/09/super-smart-society-society-50/8739
[14] Society 5.0: Japan's digitization http://www.cebit.de/en/ news-trends/news/society-5-0-japans-digitization-779
[15] Morgan G., Rzevski G., Wiese P. Multi-Agent Control of Variable Geometry Axial Turbo Compressors. Journal of Systems and Control Engineering, issue I3 vol. 218 (2004), pp. 157-171.
[16] Schilling K. Networked Distributed Pico-Satellite Systems for Earth Observation and Telecommunication Applications // Airspace Guidance, Navigation and Flight Control Systems Workshop (IFAC 2009), June 30–July 02, 2009. — Samara, Russia. http://www.federalspace.ru/main.php?id=402 4.
[17] De Florio S. Performances Optimization of Remote Sensing Satellite Constellations: a Heuristic Method // Proc. of 5th Intern. Workshop on Planning and Scheduling for Space (IWPSS 2006), October 22–25, 2006. — Space Telescope Science Institute Baltimore, USA. http://www.stsci.edu/largefiles/iwpss/ 20069151043Paper.pdf
[18] Sologub A.V., Skobelev P.O., Simonova E.V., Tsarev A.V., Stepanov M.E., Zhilyaev A.A. The intellectual system of distributed control of group operations of a cluster of small spacecrafts in tasks of remote sensing of Earth // Information and control systems. No.1. 2013. pp. 16-24
[19] Daniels J. Future of farming: Driverless tractors, ag robots https://www.cnbc.com/2016/09/16/future-of-farming-driverless-tractors-ag-robots.html
[20] Remarks By Prime Minister Abe at 14th Annual Meeting of the STS Forum October 1, 2017 https://japan.kantei.go.jp/97_abe/statement/201709/_00012.html
[21] Y.2060: Overview of the Internet of things http://www.itu.int/rec/T-REC-Y.2060-201206-I
[23] Gorodetsky V.I., Buhvalov O.L., Skobelev P.O., Mayorov I.V. The current state and perspectives of industrial applications of multi-agent systems // Big systems control. No.6. -2017. –pp.94–157
[24] Naydanov D.G., Shein R.E. Ontologies in the multi-agent systems // Proc. of the XII All-Russian Conference on Control Problems (June 16–19, 2014, Moscow). Institute of Control Sciences - 2014. pp. 9044-9049.
[25] Smirnov S.V. Ontologies as semantic models // Ontologiya proyektirovaniya [Ontology of Designing]. -No2 (8). – 2013. pp.12-19.
[26] Matushin M. M., Vaku r i na T. G., Kotelya V.V., Skobelev P. O., Lakhin O. I., Kozhevnikov S. S., Simonova E. V., Noskova A. I. Methods and Software for Creation of Ontologies for Visualizing Connected Information Objects of Random Nature in Complex Information-Analytical Systems // Information and control systems. –No.2. -2014. –pp. 9-17
[27] Tarasov V.B.. From the multi-agent systems to the intellectual organizations: Philosophy, psychology, informatics -Moscow.: Editorial URSS. -2002. 352 p.
[28] Andreev V.V., Batischev S.V., Ivkushkin K.V., Iskvarina T.V., Skobelev P.O. Work benches for development of the multi-agent systems of industrial scale // Proc. of the VI international conference “Complex systems: control and modeling problems”. Samara. -2004. -pp.233-240.
[29] Holland J.H. Hidden Order: How Adaptation Builds Complexity. Readings (MA): Addison-Wesley Publishing Company, 1995. P.38.
[30] Galkin D.V. About some epistemological bases of artificial life // Bulletin of NGU. Series: Philosophy. Vol. 10. Issue 2. – 2012. –pp.43-51.
[31] Granichin O., Kiyaev V. Control on the base of multi-agent systems // Information technologies in business management.
[32] Rzevski G. Self-organization in social systems // «Ontology of Designing» scientific journal, 4(14). -2014. pp.8-17
[33] Vittikh V.A. Problemy evergetiki [Problems of Evergetics] // Problemy upravleniya. –2014. –No.4 -pp. 69-71.
[34] Vittikh V.A. Concept of intersubjectivity in evergetics // Ontologiya proyektirovaniya [Ontology of Designing]. -2014. –No.4 (14). – pp.90–97.
[35] Novikov D.A. Cybernetics: Navigator. Cybernetics history, the current state, development perspectives. – Moscow: LENAND, 2016. – 160 p.
[36] Vittikh, V.A. Evolution of Ideas on Management Processes in the Society: From Cybernetics to Evergetics // Group Decision and Negotiation. September 2015, Volume 24, Issue 5, pp. 825–832 https://doi.org/10.1007/s10726-014-9414-6
[37] Vittikh, V.A. Complementarity of system and common approaches to settlement of problem situations in everyday life // Proc. of the XIX international conference “Complex systems: control and modeling problems”. Samara: Ofort -2017. -pp.4-11.
[38] Vittikh VA (2014) Introduction in the theory of intersubjective management. Group Decision and Negotiation. January 2015, Volume 24, Issue 1, pp 67–95. https://doi.org/10.1007/s10726-014-9380-z
[39] Vittikh V.A. Heterogeneous Actor and Everyday Life as Key Concepts of Evergetics. - Group Decision and Negotiation, volume 24, issue 6, November 2015, p. 949-956. https://doi.org/10.1007/s10726-014-9423-5
[40] Vittikh V.A., Moiseeva T.V., Skobelev P.O. Priniatiye resheniy na osnove konsensusa s primeneniyem multiagentnykh tekhnologiy [Decision Making by Consensus with Application of Multi-Agent Technology] // Ontologiya proyektirovaniya [Ontology of Designing]. -2013. – No.2. – P.20–25.
[41] Skobelev P.O. Multi-agent technologies in industrial applications: to the 20 anniversary of the Samara school of multi-agent systems // Mechatronics, Automation, Control. –2010, No12 pp.33-46
[42] Vittikh V.A., Skobelev P.O. Multiagentny models of interaction for creation of networks of needs and opportunities in open systems // Automatic and telemechanics. –2003. –No1. –pp. 177-185.
[43] Vittikh V.A., Skobelev P.O. Method of coupled interactions for real-time management of resource allocation // Optoelectronics, Instrumentation and Data Processing, Vol. 45, Issue 2. pp 154–160.
[44] UK Рatent Aррlication No. 304995 -Data Mining. Authors G. Rzevski, I. Minakov, Р. Skobelev.
[45] UK Рatent Aррlication No. 305634 -Automated Text Analysis. Authors: G. Rzevski, I. Minakov, Р. Skobelev.
[46] Skobelev P.O., Travin V.S., Zhilyaev A.A., Simonova E.V. Application of multi-agent technology in the scheduling system of swarm of earth remote sensing satellites // Procedia Computer Science 12th. Сер. "12th International Symposium Intelligent Systems, INTELS 2016" 2017. pp. 396-402.
[47] Rzevski G., Soloviev V., Skobelev P., Lakhin O. Complex adaptive logistics for the international space station // International Journal of Design and Nature and Ecodynamics. 2016. vol. 11. No3. pp. 459-472.
[48] Belousov A.A., Stepanov M.E., Goryachev A.A., Skobelev P.O. A multi-agent method for adaptive real-time train scheduling with conflict limitations // International Journal of Design and Nature and Ecodynamics. 2016. Vol. 11. No. 2. pp. 116-126.
[49] Rzevski G., Lakhin O., Knezevic J., Skobelev P., Borgest N. Managing aircraft lifecycle complexity // International Journal of Design and Nature and Ecodynamics. 2016. Vol. 11. No2. pp. 77-87.
[50] Tsarev A., Skobelev P. Multi-agent supply scheduling system prototype for energy production and distribution // Lecture Notes in Computer Science. 2016. Т. 9662. С. 290-293.
[51] Tugaev M.Yu., Rechkalov A.V., Skobelev P.O. Control of machine-building corporation in real time // Proc. of the XII All-Russian Conference on Control Problems (June 16–19, 2014, Moscow). Institute of Control Sciences - 2014. pp. 9030-9043.
[52] Sminov S.V. Ontological relativity and technology of computer simulation of complex systems // News of the Samara scientific center of RAS. 2000. Vol. 2. No.1. pp. 66-71.
[53] Sminov S.V. Ontological analysis of data domains of simulation // News of the Samara scientific center of RAS. 2001. Vol. 3. No.1. pp. 62-70.
[54] Sminov S.V. Ontological simulation in situation-dependent control // Ontologiya proyektirovaniya [Ontology of Designing]. -2012. –No.2(4). –pp.16–24.
[55] Samoylov D.E., Semenova V.A., Smirnov S.V. The analysis of incomplete data in tasks of creation of the formal Ontologiya proyektirovaniya [Ontology of Designing]. -2016. –vol. 6. No.№3(21). - 2016 –pp.317-339.DOI: 10.18287/2223-9537-2016-6-3-317-339
[56] Vittikh V.A. Situation-dependent control from view of post-nonclassical science // Ontologiya proyektirovaniya [Ontology of Designing]. -2012. –No.2(4). -pp. 7-15.
Abstract: The development of “Smart Factories”, featured by the arrival of “Internet of Things”, “Cyber-Physical Systems”, “Cloud Computing”, “Big Data” etc., became widely deployed at the industrialized economies. Several researches highlighted the impact of utilizing such technologies (so-called Industry 4.0) on the industry; i.e. enhancement of products’ quality, manufacturing processes, and customers’ satisfaction. However, very few researchers focused on determining the impact of Industry 4.0 on enhancing the practice of Total Quality Management (TQM). This paper identified the set of qualitative and quantitative measures that can be used to determine the impact of implementing Industry 4.0 technologies at any industrial firm from a TQM perspective. The paper explored the TQM principles, identified qualitative and quantitative measures to be assessed, and suggested the means of data gathering sources and analysis techniques, hence, it would be possible in further research to determine the quantitative impact of Industry 4.0 on TQM
Keywords: Total Quality Management, Quality Assurance, Industry 4.0, Big-data
1. Introduction The tremendous development in every technological field
reached an outstanding position in the recent decade, communication and networking technologies are quietly advanced, evolution of broadband and wi-fi connections, Internet of Things, Big Data, artificial intelligence and Cloud Computing, paced up an intelligent era symbolled by “Cyber-Physical Systems”, which accordingly paved the way for further revolutions in several fields, hence, the industrial fields.
Industry 4.0, interpreted by several literatures as the “fourth industrial revolution”, appeared firstly in 2011, and publicly announced in 2013 during the Hanover fair in Germany as the next industrial vision (Qin, Liu, & Grosvenor, 2016; Scheer, 2013; Zezulka, Marcon, Vesely, & Sajdl, 2016). Industry 4.0 came because of the increasing demand for innovative solutions in production and logistics, producers are focusing on creating greater value for customers, who are becoming more aware and demanding more advanced, reliable, personalized and high-quality products (Witkowski, 2017). Industrial businesses are seeking more competitive position through acquiring flexible production lines, zero inventory, efficient resources allocation, high responsiveness to market demand, lower logistics and labor costs, and to acquire more competitive advantages above other competitors (Rennung, Luminosu, & Draghici, 2016; Wang, He, & Xu, 2017).
The impact of utilizing technological solutions on the quality of industrial production was mentioned in several researches. Modern technologies assisted several quality approaches such as quality control and quality assurance techniques. Real-time quality monitoring and failure prediction models were developed by the help of new sensing technologies and big data analysis (Jiang, Jia, Wang, & Zheng, 2014).
The aim of this paper is to identify a set of qualitative and quantitative measures that can be used to determine the impact of implementing Industry 4.0 technologies at any industrial or business firm from a TQM perspective. The first section of this paper explores Industry 4.0 competences, and its impact on industrial advancement. The second section reviews the TQM principles, identify qualitative and quantitative measures to be used as assessment measures for good TQM practices. Accordingly, the discussion section will suggest the meeting point between Industry 4.0 and TQM, hence, determine the quantitative and qualitative indicators to assess the impact of Industry 4.0 on TQM.
2. Industry 4.0 The evolution of industrialized economies passed through three
previous industrial revolutions; mechanization, electrification and
information (Zhou, Liu, & Zhou, 2016). Mechanization represent the first industrial revolution, initiated in the 18th century and symbolled by the utilization of mechanical production using water and steam power. The emergence of electricity at the beginnings of 20th century revolutionized the industry for a second time; electricity enabled industrial automation using electrical conveyors and assembly lines, this facilitated mass production in order to respond to the accelerating population growth after second world war. The third industrial revolution was symbolized by the further usage of mechanical automation, using programming (programmable logic controllers) and mechanical robotic arms. (Blanchet & Rinn, 2015; Keller, Rosenberg, Brettel, & Friederichsen, 2014; Qin et al., 2016; Zezulka et al., 2016; Zhou et al., 2016)
The fourth industrial revolution (Industry 4.0) came as further evolution for the three previous revolutions, it came as a result of the advancement occurred in information and communication technologies (ICT), and the integration of this sector with industrial technologies, establishing the so called: “Cyber-Physical Systems”, introducing the “Intelligent Factory” (Zhou et al., 2016), where machines, products, human became able to interact to each other and act autonomously.
There is no single definition for Industry 4.0, several definitions were introduced by several scholars. In his literature review (Lu, 2017) highlighted three definitions for Industry 4.0. Firstly, Consortium II Fact Sheet, defined Industry 4.0 as “the integration of physical machinery systems with networked sensors and software used to predict, control and plan for better business and societal outcomes.” Others defined Industry 4.0 as “a new level of value chain organization and management across the lifecycle of products.”. A third opinion defined Industry 4.0 as “a collective term for technologies and concepts of value chain organization.” Industry 4.0 is characterized by the integration occurred based on the Cyber-Physical Systems, Wi-Fi connectivity, Smart robots and machines, big-data, and smart factory to build an intelligent manufacturing system, emphasizing consistent digitization and linking of all productive units in an economy (Blanchet & Rinn, 2015). A core aspect of Industry 4.0 is the continuous connection between human, machines, and products during the production process (Albers et al., 2016).
Industry 4.0 is characterized by three key features; Interconnection, integration, and big data (Wang et al., 2017). Interconnection is the core feature of Industry 4.0, it means that all kinds of machines doing various jobs are interconnected together, forming an intelligent digitized value chain, where the product can hold readable information that can be understood by machines, thus, the machines can process the product, and when it is needed, it can
230
re-adjust, diagnose, and repair production tactics until achieving an optimal situation (Zhou et al., 2016).
Integration is the ability of Industry 4.0 to perform vertical, horizontal and end-to-end integration. Vertical Integration, refers to the networked smart business units; e.g.: smart factory, smart logistics, smart marketing, and services (Mrugalska & Wyrwicka, 2017), where manufacturing units are coordinating and communicating smoothly. Horizontal Integration over the value chain, refers to the forward to backward (customer to supplier) integration. Horizontal Integration enabled the manufacturing environment to become collaborative during the stages from development to production, resulting more efficient, reliable and effective manufacturing. End-to-End integration is the total integration of the entire process, performing a decentralized system where all participating entities have real time access to information and control is distributed to the production floor instantly (Keller et al., 2014).
The rapid development of internet and networking, produced huge amount of information which needed innovative methods and tools to handle (Blanchet & Rinn, 2015). Big Data and cloud computing granted the ability to conduct quick and efficient management for the constantly growing databases. Big Data consists of four dimensions: Volume, Variety, Velocity, and Value. These so called (4Vs) refers to the characteristics which allow Big Data to analyze data at a more advanced level than traditional tools (Witkowski, 2017).
The above described features, enabled the Industry 4.0 to provide solutions for different fields in the industry, advanced monitoring and analysis techniques, process and functional optimization, decision supporting at different organizational levels, moving from centralized to decentralized model of management, and upgraded the management approach from the traditional popular model to a modern one at several sides. This advancement came synchronized with the recent global trends in business, where the world is becoming more connected; global business models are expanding, and customers are more open to online shopping, demanding innovative products, with more personalized specifications. Moreover, new emerging economies are coming as key players at the global industrial stage, leading industrialized economies are experiencing key challenges, such as aging communities, the open competition with Asian economies of scale. All these challenges became the foundations of adopting Industry 4.0 technologies (Blanchet & Rinn, 2015; Federal Ministry of Education and Research-Germany, 2014).
To sum up, Industry 4.0 aims to obtain a flexible and automatic adaption of value chain, to offer the ability to customize products and maintain mass production at the same time, and to facilitate communication among all production elements; products, machines, human and resources. Furthermore, it aims to optimize production and to provide advanced level of interaction and coordination between different resources.
3. Total Quality Management (TQM) Quality is defined as “the conformance of a product to customer
requirements”, this implies that all tasks and activities made during the production fulfill the specifications translated from the requirements of the customer. Quality is a continuous approach aims to satisfy customers, it is not limited to screening out defective products, but also to reduce defects completely through building up enough knowledge about processes and functions (Kanji, 1990).
Total Quality Management (TQM) is a managerial approach that leads an organization to achieve a world-class position by insuring that its products and services satisfies customers, meeting their requirements and expectations (Yusof & Aspinwall, 2000). The Term “Total Quality Management – TQM” was first suggested and leaded by the American scientist Deming, who traveled from the United States of America to Japan to help the Japanese industrial firms to recover from the World War II. During his work,
he implemented the statistical quality control and process control, as tools to trace production errors and to identify the source of products’ defects (Kanji, 1990). Later, he met with Juran, who was stressing to focus on customers’ satisfaction through producing fit-to-use products that fulfills the customers’ needs. Shortly, both Deming and Juran successfully caught the attention of market all over the world, their innovative ideas increased the production rates in Japan, and contributed very strongly to the Japanese well-known successful industrial miracle (Kanji, 1990).
Since then, the philosophy of TQM has been enhanced and expanded, several TQM approaches were suggested to guide the good implementation of TQM at organizations. The goal was to benefit business stakeholders, where everyone at the organization as well as the business processes are cooperating to produce value-for-money products and services, that fulfils and positively exceeds customers’ expectations (Dale, 2015). Researchers found strong evidences that TQM has improved the organizational effectiveness, flexibility, competitiveness, excellence, creating positive attitude, and a source of creating continuous improvement culture at the organization (Anu P. Anil & Satish, 2016).
Generally, the successful implementation of any managerial practice is measured by several success factors and the well implementation of several practices (Mrugalska & Wyrwicka, 2017). Based on several literatures, there are several approaches to achieve TQM, the most popular practice to attain TQM principles are those identified in (ISO 9001: 2015) model, which highlights the following practices to be the most effective for application: Customer focus, Leadership, engagement of people, process approach, improvement, evidence-based decision making, and relationship management (International Organization for Standardization, 2015).
Other practices were identified in different literature, such as; top management commitment, Continuous improvement, supplier quality management, employees’ involvement and empowerment, education and training, strategic management, utilizing statistical quality control and quality assurance techniques, developing the quality culture among the organization, benchmarking, process and product management (Anu P. Anil & Satish, 2016). However, it should be emphasized that these practices are finally aiming to support the competitive advantage of the organization by producing high quality products or services and enhancing customer satisfaction.
4. Influencing Total Quality Management by Industry 4.0
The features of Industry 4.0 provided a solid rock for supporting business excellence; interconnectivity provided the ability of businesses to perform more efficiently by utilizing networking technologies, sensors and actuators. The whole value chain of production became interconnected, machines are connected to each other as well as to products and labor. Production processes can re-adjust itself to the optimal production scenario even when an urgent change occurs, early maintenance alerts are better to predict, logistics, warehousing, resources are allocated efficiently and effectively.
Integration of all business units, customers, and business partners (horizontal, vertical, and end-to-end integration) reformed the business model from linear to networked form, where all business units are connected to each other, and flow of work is running smoothly and efficiently.
In terms of Quality Assurance, the utilization of Industry 4.0 will upgrade the employees’ role from routine activities, to higher level of control and regulation for the manufacturing process, based on situation and context sensitive targets. The employees focus will be on creating innovative and value-added activities, which will be reflected to improve the quality assurance practices (Henning, Wolfgang, & Johannes, 2013). Moreover, Industry 4.0 will provide
231
a real-time process monitoring to ensure that quality specifications are met during processing. Real time quality control will also enhance the quality control activities and will provide an early alarm for changes in products’ quality. Internet connectivity will also provide the ability to track the product even after sale and gather information about its performance during operation. (Lee, Kao, & Yang, 2014)
Industry 4.0 can influence the best practices of implementing Total Quality Management principles. As mentioned before, TQM practices are known to be like the ISO 9001:2015 model, which are: customer focus, leadership, engagement of people, process approach, improvement, evidence-based decision making, and relationship management (International Organization for Standardization, 2015). Industry 4.0 will be able to serve the successful implementation of these principles as following:
• Customer Focus: Industry 4.0 will enable organizations to improve their customers’ satisfaction through improving their products and services, fulfilling and innovate new products that exceed customers’ requirements and expectations. Industry 4.0 will enable industries to provide customized products at a regular time, away from the complexity of changing mass production systems. Moreover, Industry 4.0 will provide businesses with early forecasting about consumption behavior and trends, thus, providing a competitive advantage for the business by providing proper products at the proper time.
• Leadership: Evidences showed that Industry 4.0 had a significant impact on information flow over the production line, integrating the business processes and supporting the ERP systems to optimize manufacturing management (Lee et al., 2014). Industry 4.0 will provide transparent production processes, thus, aligning resources such as labor and machines to demand will be efficient and optimized.
• Engagement of people: Industry 4.0 will support the communication and collaboration of all players inside the organization, it will stimulate innovation, encourage individual contributions. Data provided by Industry 4.0 outcomes will help people at their functional positions to use this data to avoid risks and suggest solutions, hence, be more initiative.
• Process approach: Industry 4.0 will support the transparency of business and production processes in the organization, it will help to optimize processes, improve efficiency and resources allocation. Industry 4.0 will provide the possibility to simulate processes in a virtual environment, adjust and modify virtually before real implementation on the floor, this will enhance processes to achieve optimum situation (Husti, Daroczi, & Kovacs, 2017). Moreover, Industry 4.0 will facilitate tracing production bottleneck, defects’ sources, and minimize production cost. Additionally, it will improve the supply chain responsiveness, through total integration from market demand back to suppliers (Wang et al., 2017). Industry 4.0 will provide accurate information about processes (time, risks, resources, critical constraints) thus, it will help the planning level of key-processes to maintain continuity and efficiency.
• Improvement: Industry 4.0 will provide a basis for continuous improvements at the product, process and the business level for an organization. Totally connected production and supply chain will improve performance and responsiveness of the system. Experiments showed the ability of products (automobile industry as an example) to send information to the producing companies about operating problems, thus, enhancing future products to overcome such problems.
• Evidence-based decision making: Industry 4.0 and the new IT solutions such as big data, afforded a great capacity to improve the decision-making process in real time (Husti et al., 2017). Machines are self-learned, connected to each other forming a collaborative community, collecting and analyzing data, providing ability to make independent decisions. Experiments show that
Industry 4.0 techniques can send earlier prognostics about machine health, reducing downtime and afford maintenance on time.
• Relationship management: total integration and effective communication between all stakeholders of an organization became one of the benefits of Industry 4.0. Suppliers are connected with production systems, understanding the organization needs, and responsive to markets demand more than ever before.
Accordingly, the impact of Industry 4.0 on the successful implementation of TQM will be measured by identifying a set of indicators that represent each of the TQM principles identified earlier in this paper. The following list of indicators are identified based on the TQM principles and the measurement means based on Industry 4.0 technologies. Table 1 summarizes the sets of indicators assigned to each of the TQM principles:
Table 1: Set of indicators used for measuring Industry 4.0 impact on Total Quality Management. TQM Principles Indicators for
• Internet of Things, Wi-Fi and Big-Data will be utilized as data gathering and analyzing tools.
Leadership • Unity of purpose among the organization,
• Aligned strategies, policies, processes and resources,
• Effective communication between all administrative levels.
• Effective allocation of different resources (operational effectiveness)
• Increased revenues due to optimized allocation of resources
• Realtime resources monitoring and automatic regulation and reallocation.
• System monitoring dashboards, ERP systems
Engagement of people
• Increase motivation of people,
• Increasing innovative ideas,
• Enhanced people satisfaction,
• Self-evaluation and self-improvement culture.
• Number of innovative ideas or initiatives created or taken by employees
• Increased value (%) of employees’ satisfaction
• Increased revenues due to less human related failures
• Number of problems solved by employees
• Human Resources smart systems
• Statistics and data gathered during production
Process approach • Identify key processes and points of improvements,
• Optimized performance and effective process management,
• Manage processes, and interrelations, as well as dependencies.
• Number of process re-design activities made because of data analysis and enhancement decisions
• Production lead time
• Suppliers’ responsiveness to new supply orders
• In-process real time quality control activities (percentage of defects)
• Decreased percentage of processing downtime
• ERP system (integrated with customers and suppliers)
• Sensors and actuators within production process
• Process related big-data analysis
• Internet of things (machines data)
• Maintenance management system
Improvement • Responsive systems to customer requirements,
• Enhanced ability to react to development of processes, products and market needs,
• Support drivers for
• Enhanced percentage of response time (production lead time)
• The range of customization options that can be
• ERP system and CRM system
• Big-data themes • Customers feedback
232
innovation. fulfilled by the business without affecting the productivity normal rates
• Number of newly developed products and time needed to introduce it to markets
Evidence-based decision making
• Clear and agreed decision-making process,
• Data availability and clarity,
• Effective past decisions,
• Analyze and evaluate data using suitable methods and tools.
• Increased revenues due to recently take decisions
• Number of reporting and automatic recommendations learned by or from the smart production system
• Ease of data mining and friendly presentation of results and recommendations
• Big-Data analysis • ERP system
Relationship management
• Stakeholders are identified and suitable communication tools to each are known,
• Stakeholders are satisfied, and their feedback is considered,
• Suppliers are responding to materials requests on time and at the required quality,
• Supply chain is stable and no downtime due to lack supply.
• Number of received to processes communications from stakeholders.
• Rate of satisfaction for stakeholders is improving continuously
• Improved suppliers’ responsiveness rate
• Percentage of downtime due to lack of supply is in its minimum value
• ERP system (integrated with customers and suppliers)
• Sensors and actuators within production process
• Process related big-data analysis
• Internet of things (machines data)
5. Conclusion and further research topics Industry 4.0 positively influenced the successful
implementation of Total Quality Control, technologies and approaches utilized by Industry 4.0 improved the quality assurance and quality control experience. Communication and big-data sources improved better understanding and enhanced responsiveness for customers’ requirements, hence, improved their satisfaction. Smart factory, smart product, and smart machines, are new terms referring to high connectivity and integration of smart technologies in the value chain, this resulted more dynamic production processes that are able to adjust according to optimum real-time requirements.
There are several researches that mentioned the positive impact on quality, but these researches highlighted this impact briefly and in qualitative manner. However, it is important to conduct further applied research to translate the indicators suggested by this paper into active and real-time measures. It is important also to reflect the changes occurred and the capabilities offered by Industry 4.0 on the quality management models. Hence, developing a new quality management model which should be based on Industry 4.0 technologies, considering that quality requirements in the ongoing present and coming future is different and advanced
St??rmlinger, T. (2016). Procedure for Defining the System of Objectives in the Initial Phase of an Industry 4.0 Project Focusing on Intelligent Quality Control Systems. Procedia CIRP, 52, 262–267. https://doi.org/10.1016/j.procir.2016.07.067
Anu P. Anil, & Satish, K. P. (2016). Investigating the Relationship Between TQM Practices and Firm’s Performance: A Conceptual Framework for Indian Organizations. Procedia Technology, 24, 554–561. https://doi.org/10.1016/j.protcy.2016.05.103
Blanchet, M., & Rinn, T. (2015). Industry 4.0: The new industrial revolution, How Europe will succeed. Roland Berger Strategy Consultants. Retrieved from http://www.iberglobal.com/files/Roland_Berger_Industry.pdf
Dale, B. (2015). Total Quality Management. Wiley Encyclopedia of
Federal Ministry of Education and Research. (2014). The new High-Tech Strategy Innovations for Germany. Federal Ministry of Education and Research (BMBf), 1–58.
Henning, K., Wolfgang, W., & Johannes, H. (2013). Recommendations for implementing the strategic initiative INDUSTRIE 4.0. Final report of the Industrie 4.0 WG. https://doi.org/10.13140/RG.2.1.1205.8966
Husti, I., Daroczi, M., & Kovacs, I. (2017). Message from “Industry 4.0” to agriculture. In Towards Sustainable Agriculture and Biosystems Engineering (pp. 63–77). Universiteas-Győr Nonprofit Ltd.
International Organization for Standardization. (2015). ISO 9001_2015.pdf. International Organization for Standardization. Retrieved from https://www.iso.org/news/2015/09/Ref2002.html
Jiang, P., Jia, F., Wang, Y., & Zheng, M. (2014). Real-time quality monitoring and predicting model based on error propagation networks for multistage machining processes. Journal of Intelligent Manufacturing, 25(3), 521–538. https://doi.org/10.1007/s10845-012-0703-0
Kanji, G. K. (1990). Total quality management: the second industrial revolution. Total Quality Management, 1(1), 3–12. https://doi.org/10.1080/09544129000000001
Keller, M., Rosenberg, M., Brettel, M., & Friederichsen, N. (2014). How Virtualization, Decentrazliation and Network Building Change the Manufacturing Landscape: An Industry 4.0 Perspective. International Journal of Mechanical, Aerospace, Industrial, Mechatronic and Manufacturing Engineering, 8(1), 37–44. https://doi.org/scholar.waset.org/1999.8/9997144
Lee, J., Kao, H. A., & Yang, S. (2014). Service innovation and smart analytics for Industry 4.0 and big data environment. Procedia CIRP, 16, 3–8. https://doi.org/10.1016/j.procir.2014.02.001
Lu, Y. (2017). Industry 4.0: A survey on technologies, applications and open research issues. Journal of Industrial Information Integration, 6, p. 1–10. https://doi.org/10.1016/j.jii.2017.04.005
Mrugalska, B., & Wyrwicka, M. K. (2017). Towards Lean Production in Industry 4.0. Procedia Engineering, 182, 466–473. https://doi.org/10.1016/j.proeng.2017.03.135
Qin, J., Liu, Y., & Grosvenor, R. (2016). A Categorical Framework of Manufacturing for Industry 4.0 and beyond. Procedia CIRP, 52, 173–178. https://doi.org/10.1016/j.procir.2016.08.005
Rennung, F., Luminosu, C. T., & Draghici, A. (2016). Service Provision in the Framework of Industry 4.0. Procedia - Social and Behavioral Sciences, 221, 372–377. https://doi.org/10.1016/j.sbspro.2016.05.127
Scheer, A. W. (2013). Industrie 4.0. Germany Trade and Invest. https://doi.org/10.1007/978-3-642-36917-9
Wang, L., He, J., & Xu, S. (2017). The Application of Industry 4.0 in Customized Furniture Manufacturing Industry. In MATEC Web of Conferences (Vol. 100, p. 3022). https://doi.org/10.1051/matecconf/201710003022
Witkowski, K. (2017). Internet of Things, Big Data, Industry 4.0 – Innovative Solutions in Logistics and Supply Chains Management. Procedia Engineering, 182, 763–769. https://doi.org/10.1016/j.proeng.2017.03.197
Yusof, S. M., & Aspinwall, E. (2000). Total quality management implementation frameworks: Comparison and review. Total Quality Management, 11(3), 281–294. https://doi.org/10.1080/0954412006801
Zezulka, F., Marcon, P., Vesely, I., & Sajdl, O. (2016). Industry 4.0 – An Introduction in the phenomenon. IFAC-PapersOnLine, 49(25), 8–12. https://doi.org/10.1016/j.ifacol.2016.12.002
Zhou, K., Liu, T., & Zhou, L. (2016). Industry 4.0: Towards future industrial opportunities and challenges. 2015 12th International Conference on Fuzzy Systems and Knowledge Discovery, FSKD 2015, 2147–2152. https://doi.org/10.1109/FSKD.2015.7382284
233
WHAT DOES INDUSTRY 4.0 MEAN FOR SUSTAINABLE DEVELOPMENT?
MSc Tsvetkova, R. Law and Internet Foundation, Sofia, Bulgaria
Abstract: Sustainable development is an integral part of economic development in all countries, even when attention is driven away from it. The balance between the need of humanity to produce and the desire to not destroy the planet in the process is constantly questioned and shaken. With the disruptive new models that Industry 4.0 has shown to the world, and with the constantly expanding opportunities for technologies, production, and improvement of the way businesses function, the question of sustainability stands. How will the new business models affect sustainable development, and will they manage to put humanity’s future in the spotlight? This paper explores the opportunities to sustainable development, introduced by Industry 4.0.
Keywords: SUSTAINABLE DEVELOPMENT, INDUSTRY 4.0, BUSINESS MODELS
1. Introduction Industry 4.0 – the fourth industrial revolution, is changing how
the world of business functions. Baldassari and Roux1 summarize that this new revolution of not only production, but also way of creation and design of products, processes and organizations, has come to existence because of the inclusion of various new actors into the way society and business function: artificial intelligence, machine learning, the combination of potential of hardware, software, and humans.
As this rapid transformation of businesses is creating a new atmosphere – one with more efficient manufacturing methods2, collaborative industrial networks and optimized supply-chain processes3 to start off, one with a new outlook on design and execution of production – there should also follow the question of how sustainable development fits into the unfamiliar and unique environment.
Sustainable development (SD) – the idea of living, working and developing as a society, while preserving the planet at least in its current condition, is one that more and more businesses and individuals consider as crucial. In this new setting, with abundant opportunities arising for businesses, the question of sustainable development remains.
Тhis paper aims to showcase the threats, which should be tackled and the questions answered for SD to work, as well as the opportunities, which Industry 4.0 presents for SD.
2. Sustainable development in Industry 4.0 In order to understand how sustainable development can fit in
the framework of Industry 4.0 the paper will compare the defining elements of Industry 4.0 with the challenges SD is currently facing. In finding the meeting points of the two, the best-case developments can be uncovered. The comparative analysis below is based on research in various countries and conclusions drawn in the last 5 years.
2.1. Elements of Industry 4.0
According to the Boston Consulting Group’s 2015 report4 on Industry 4.0, there are specifically nine technological advances, which have created the fourth revolution: autonomous robots, simulation, horizontal and vertical system integration, the industrial Internet of Things, cybersecurity, the cloud, additive manufacturing,
1 Baldassari, P. and Roux, J. D. (2017) Industry 4.0: Preparing for the Future of Work. People & Strategy. Summer2017, 40(3), pp. 20-23
2 Kocsi, B. and Oláh, J. (2017) Potential Connections Of Unique Manufacturing And Industry 4.0. LogForum, 2017, 13(4), pp. 389-400.
3 Ivanov, D. et al (2016) A dynamic model and an algorithm for short-term supply chain scheduling in the smart factory industry 4.0. International Journal of Production Research, Jan2016, 54(2), pp. 386-402.
4 Rüßmann, M. et al (2015) Industry 4.0: The Future of Productivity and Growth in Manufacturing Industries. The Boston Consulting Group.
augmented reality, and big data and analytics. Below, all these elements are more thoroughly discussed to give a better idea of how they could be used later in solving the challenges of SD.
- Robotics (which includes autonomous robots, as well as expert systems, digital assistants) is a constantly growing market all over the world5. Because of the vast capabilities in storing information, together with the possibility of using that information in increasingly intelligent ways (thanks to AI), improved human-computer interactions, as well as a stronger presence from the digital to the physical world (for example 3D printing), robotics are gaining traction in all fields and with countless applications – from manufacturing, to services, to personal development and beyond.
- Modeling and simulation technologies are a key factor for the development of Industry 4.0. They are crucial for the modern design, piloting and support of new products.6 The new possibilities of virtual prototyping, as well as automation in manufacturing industries, increase efficiency and improve the quality of production.
- Horizontal and vertical system integration portray an integration between different value chains and between functional layers in an organization.7 This integration allows for a greater understanding of all processes, as well as improved synergies in and between organizations.
- The Industrial Internet of Things is the increased connectivity of technology in the worlds of manufacturing, agriculture, mining, transportation, healthcare, etc. The integration and connectivity within those fields creates an entirely new relationship between humans and computers, and lays the groundwork for a completely different way of work with innovative job positions for all sectors – namely, decrease of jobs, which are unsafe and have low skill qualification needs, while more energy would be needed in engineering, data management and analysis, etc. 8
- Cybersecurity in Industry 4.0 more than ever before comes to the forefront of businesses. Novel issues arise constantly, putting at risk not only brands but design, creation, continuous manufacturing of products. A wholly innovative approach is needed to deal with cybersecurity in Industry 4.0 – one that involves not only the basis of security and reactivity, but vigilant resilience, a proactive effort to keep security at the only acceptable level in Industry 4.0 – impeccable.9
- Cloud technologies are not only a way to integrate services and cut costs in IT expenses – they are an enabler of disruptive
5 Violino, B. (2016) Robotics and Industry 4.0: Reshaping the way things are made. ZdNet.com
6 Lopez, J. (2017) Industry 4.0 and the Internet of Simulations. IoTOne. 7 Rathfelder, C. and Lanting, C. (2014) Smart Systems Integration in
Industry 4.0. EPOSS General Assembly Annual Forum 2014. 8 World Economic Forum (2015) Industrial Internet of Things:
Unleashing the Potential of Connected Products and Services. 9 Deloitte University Press (2017) Industry 4.0 and Cybersecurity.
234
innovation and a path-creator for a so-called business fast-lane. In manufacturing, but also everywhere else in business, cloud technologies are changing the processes and the people, which operate them, opening the doors for approaches and results never imagined before. It could even be said that cloud technology “democratizes” access to information, learning and communication.10
- Additive manufacturing, which portrays development in the world of design, testing, manufacturing, etc. such as 3D printing. This idea of true and effective, fast connectivity between customer, data, and production, is shifting the way products, as well as their separate pieces, are being made. Through rapid prototyping, solid free-form fabrication and 3D printing itself, additive manufacturing is changing processes, planning, design ideas, opportunity for creation, and not lastly – rapidly lowering costs all around this manufacturing line. Additive manufacturing is still spreading through its capabilities and it is yet to be seen what other opportunities will arise through it. 11
- Augmented reality creates a bridge between virtual reality and data, which has been gathered with physical methods of analysis. This allows for a new approach to designing and repairing components and whole products. Through the creation of a suitable digital toolbox, designers, engineers, or technicians can improve their problem-solving capabilities, as well as vastly expand on their options for optimizing products and processes. Augmented reality also helps with connecting customers with their desired products more effectively, through the ability to see the possibilities with all necessary technical specifications, for example.12
- Big data and analytics are taking on newer meanings and new depths constantly. It has been noted multiple times by media and academics that data is the driver of the century, a commodity more valuable than oil.13 With the increased capabilities of collecting vast amounts of data and even more than that – analyzing it in faster and smarter ways, big data and analytics pave the way for a transformation of understanding, producing, selling, etc. Now, more than historical data – real-time physical data like vibrations, noise levels and pressure is used in factories, as well as predictions, data on similar processes and various out-of-field innovations.14
These nine elements of Industry 4.0 work in synergy to incorporate each other in all aspects of all scopes of business, and slowly – all facets of life. Focus is starting to shift overall from labor-intensive jobs to high-qualified positions, which demand managing systems, still beyond the imagination of humanity.
With this in mind, it is not impossible to imagine that the new technologies and amazing capabilities, which are being developed, could be key for solving some of the world’s most important problems.
2.2. Challenges for Sustainable development
Even though challenges for SD could be defined in many ways and though many approaches, the universally accepted measure of SD improvement and challenges is the UN’s General Assembly’s Resolution and Agenda on Sustainable Development.
In 2015, when setting the major goals for 2030, the UN outlined specifically 17 major goals with 169 targets for humanity with the overarching goal to “end poverty, protect the planet, and ensure
10 Oracle (2016) Cloud: Opening up the road to Industry 4.0 11 Lopes da Silva, J. (2016) Industry 4.0 and Additive Manufacturing.
Cepal, May 2016 12 Wehle, H. (2016) Augmented Reality and the Internet of Things (IoT)
/ Industry 4.0. 13 The Economist (2017) The world’s most valuable resource is no
longer oil, but data. The Economist, May 2017. 14 Lee, J. et al (2014) Service innovation and smart analytics for
Industry 4.0 and big data environment. 6th CIRP Conference on Industrial Product-Service Systems
prosperity for all”15. Accepted by world leaders and formulated as a continuation of the Millennium Development Goals, these goals are separated into five major categories: People, Planet, Prosperity, Peace, Partnership.
The categories are illustrated in the table below:
Table 1: SD goals
The challenges for achieving the set goals in these categories vary. Some of the goals and targets are believed to be too optimistic, too vague, or just unachievable for the span of time, laid out in the goals. Compared to their predecessors, it should be noted, the goals are extremely wide in scope and cover a far greater amount of actions needed.
Even focusing on a single thought stream from the goals – for example, something very related to production, namely – limiting CO2 emissions and finding alternative sources of energy – brings on a plethora of unanswered questions. This issue is often regarded as the biggest challenge for SD because of the scale in which this problem affects the planet and society’s dependence on energy, produced by coal and other non-green energy sources.
As Meléndez-Ortiz16 points out, this challenge has even bigger implications when taking into account the changing consumer patterns around the world and specifically in developing countries such as China and India. Even with emerging green energy sources, this challenge remains as valid as ever to the idea and goals of SD.
On a different note, as Singh17 discusses, other key challenges for the timely achievement of the set goals are: lack of substantial leadership (to inspire not only policy change, but also investment, inclusion, awareness, and mobilization towards the goals), an understanding of the underlying tones of the goals (meaning an overall shift in the way people work, produce, consume, and spend their time), as well as unification of some of the targets for all countries (for example, setting universal standards for clean water, clean air, etc.).
15 UN General Assembly (2015) Resolution adopted by the General Assembly on 25 September 2015.
16 Meléndez-Ortiz, R. (2013) Trade and the Challenges of sustainable development. International Trade Forum 2013, 2, pp. 16-18.
17 Singh, Z. (2016) Sustainable development goals: Challenges and opportunities. Indian Journal of Public Health, 60 (4), pp. 247-250.
• No poverty• Zero hunger• Good health and well-being• Quality education • Access to clean water and sanitation• Gender equality • Reduced inequalities
People
• Climate action • Life below water • Life on land
Planet
• Affordable and clean energy • Decent work and economic growth • Industry, innovation and infrastructure• Sustainable cities and communities• Responsible consumption and production
Prosperity
• Peace, justice and strong institutions
Peace
• Partnerships for the goals
Partnership
235
According to Lucci18, some of the major challenges in the way of achieving the SD goals are lack of access to information of governments, low quality of prioritizing of the existing goals, as well as lack of capacity of governments to face the scale of the SD goals. As the cited article discusses, governments find many difficulties in fighting for the achievement of the goals because of lack of structured and abundant data globally, but also inside their own borders – how cities truly function, what the life is in the less-developed parts, etc. Without that data, as well as without the needed capacity of governments to even plan correctly the needs of their citizens for getting closer to the targets, the goals cannot be achieved.
The challenges for the achievement of the 2030 SD goals seem many and some of them – unsurmountable. However, another way to see the goals is as ambitious, and – fundamentally – as created with the goal to lead the planet and all its inhabitants to a better reality and better future. In the following sections, this paper will explore the intersections between the opportunities, provided by the development of Industry 4.0 and the challenges to SD, identified here. Through this, the paper aims to showcase how Industry 4.0 can assist the achievement of the SD goals.
2.3. Intersection of Elements of Industry 4.0 and Challenges of SD
As was already discussed, the developments, related to the emergence of Industry 4.0 can be related to the challenges of SD in an effort to solve the latter.
In the following table, the proposed solutions to challenges of sustainable development will be presented, in order to be later discussed in depth.
Table 2: Practical solutions for SD challenges
SD Challenge Possible Practical Industry 4.0 Solution
Phrasing of goals: vagueness, overly
optimistic targets, etc.
Robotics Modeling and simulation
technologies (virtual prototyping)
Scope of goals Robotics
Augmented reality Big data and analytics
Lack of leadership Lack of understanding of
the goals Robotics
Virtual prototyping
Lack of unified standards System integration Cloud technologies
Big data and analytics
Lack of access to information
Big data and analytics System integration Cloud technologies Augmented reality
18 Lucci, P. (2015) Five challenges the sustainable development goals present to city leaders. CityMetric
Low quality prioritizing Virtual prototyping Big data and analytics
Lack of governmental capacity
Robotics System integration Cloud technologies Augmented reality
As Industry 4.0 exemplifies interconnectivity, it stands to reason that more than one of its elements would constitute a possible solution, many times in synergy with others.
Robotics appears with either virtual prototyping or augmented reality as complementary elements. While the computational powers of robotics can create many options, virtual prototyping in this context can play out the created scenarios for easier decision-making. Augmented reality, on the other hand, will create a much clearer picture not only of the current state of the art, but will shine a light on the depth of the created possibilities – clear out the scope of the goals for policy-makers, for example, or demand fewer human resources for governments to handle the planning and execution of those plans.
Big data and analytics adds to this with the unlimited opportunities for gathering and analyzing data. This availability, if applied correctly, can be the key to solving some of the challenges even as a stand-alone tool: namely the lack of access to information, and the lack of unified standards. Big data and the powerful analytical capabilities, inherent in Industry 4.0, together with virtual prototyping can also create an easy-to-use way for policy makers to prioritize the SD goals according to the state their country is currently in, as well as to better understand the situation they are facing.
System integration can be the source of amazing synergies to help expand the capacities of governments, but also to combine information from many different fractions, which should be more integrated, but still are not. This will bring unification of standards – naturally – but also more transparency and greater availability of information across the border.
Finally, cloud technologies – they, of course, lower costs and provide wider accessibility, while making many processes, related to improving capacity, easier, faster, and significantly more effective. In that way, cloud technologies create staggering opportunities for the effective and efficient achievement of the SD goals – by providing wide and affordable availability of solutions for unification, awareness raising, spreading of information, processing, etc.
The penetration of Industry 4.0 is still ongoing and more and more of these processes and opportunities are still not completely available to governments for the achievement of the SD goals, which stand before all nations. Moreover, finding a solution for the lack of substantial leadership and motivation for investment, awareness, etc. is possibly one of the few challenges in front of SD, which have to be tackled not by advancements of technology, but by people themselves.
However, there already are examples of solutions, related to the innovations of Industry 4.0, which help along with making societies better, saving lives, creating efficiencies, interconnectivity, and ultimately - sustainable development.
Below, some of those examples are discussed as good practices before reaching the conclusions of the paper.
3. The future of Sustainable development The future of SD has already started to unfold through the
opportunities, which Industry 4.0 is providing.
236
For example, machine learning (AI) and an algorithm which collects and analyses data have identified a sex trafficking ring, thanks to the work of Rebecca Portnoff19. Through the combination of tracking transactions of bitcoin and using machine learning, Portnoff achieved results, which are undoubtedly resonant with the SD goals, as a part of her PhD thesis. The full potential of the software – but also of the ideas, which lie in the basis of this discovery, are yet to be discovered.
Another example of Industry 4.0 already assisting in the efforts to improve human lives and health is the AI, which together with augmented reality diagnoses patients with heart disease and gives them an estimate about their future condition20. This, the AI achieves with the help and based on aggregate data from many patients, historical data for the specific patient, as well as current data being collected on the vitals of the patient. Based on the diagnosis and the in-depth analysis, doctors can prescribe better treatment and improve the chances of patients to live. This technology may also be translatable to a wider scope of health irregularities, not only for heart conditions.
Not to be missed is also the developing notion and action of predictive policing – the assistance of big data and analysis to law enforcement, which prevents crime.21 When implemented, big data can generate possible crime centres in the future, which can enable police to act before any harm has been done. This, as the cited article discusses, lowers restitutions and crime rates, and keeps communities calmer and safer. Further, predictive policing – in softwares such as PredPol or HunchLab, use various metrics and differing approaches to reach the same goal, and this means that there is still wide field for evolution. As of late, predictive policing is starting to be used internally, with bigger integration. instead of like a third-party software – like it has so far.22 This suggests not only its advancements, but also developments of new features, such as software tactics suggestions and further Industry 4.0 upgrades.
As for government use of the benefits of Industry 4.0 – steps are being undertaken to get most governments ready for the cloud space23, for example. Though this step, many more could be taken to immerse government in the vast possibilities of the new revolution. The current manifestation of this process is based on considerations on one of the less mentioned in this article elements of Industry 4.0 – cybersecurity. As governments are very aware of the potential risks of cloud computing, many measures are being considered and undertaken as part of a complete transfer.
Overall, there is no denying that Industry 4.0 is the future for many, if not all areas of life, including sustainable development. The many doors, connecting the increasing capabilities of technology and the innovative nature of humans can bring about countless opportunities for growth and success in achieving humanity’s set goals. More than that – the future has already started and is evolving rapidly, involving more parts of life and showing more signs of consideration of the future to come.
4. Conclusions This paper explored the connection of future prospects, created
by the needs and challenges of sustainable development and the available opportunities, presented by Industry 4.0. Through comparing the two sides, the paper drew the attention to:
19 Portnoff, R. et al (2017) Tools for Automated Analysis of Cybercriminal Markets. Proceedings of the 26th International Conference on World Wide Web, pp. 657-666
20 Furness, D. (2017) Artificial intelligence can now predict heart failure, and that may save lives. Digital trends, Computing.
21 Phillips, A. (2017) Big Data Law Enforcement and the Rise of Predictive Policing. InsideBigData, Analytics.
22 Shapiro, A. (2017) Reform predictive policing. Nature.com Comment.
23 Melhem, S. and Kim, S. (2016) Flying to the Cloud: Governments Seek Gains from Cloud Computing. Connections note, The World Bank.
1) The importance of achieving the sustainable development goals;
2) The unexplored opportunities, presented by the existence of the Fourth Industrial Revolution.
As was discussed, there are many prospects, which are already being explored in this direction. However, what should be kept in mind is the number of targets of the 2030 SD goals, as well as the needed time period to test and integrate many of the possible solutions. These considerations show the pressing imperative of connecting Industry 4.0 and sustainable development.
237
THE ROLE OF PROJECT MANAGEMENT FOR SUCCESSFUL PERFORMANCE AND SUSTAINABLE BUSINESS GROWTH
Rosaliya Kasamska, PhD Student
University of Finance, Business and Entrepreneurship, Bulgaria
Abstract: Today’s business environment is highly dynamic, unstable, and characterised by many unpredictable challenges. This paper provides a review of the role of project management for improvement of performance, as well as for establishment and implementation of strategies for sustainable growth. Project management is considered as an effective approach for efficient planning, risk management, provision of informed decision-making about the company resources, monitoring, and measurement of performance results. On the basis of these advantages, the paper will also present practical recommendations for integration of project management at the levels of business strategy, structure, and processes.
Keywords: PROJECT MANAGEMENT, BUSINESS PERFORMANCE, SUSTAINABLE GROWTH
1. Introduction Today’s business environment is highly dynamic, unstable, and
characterised by many unpredictable challenges. To gain a competitive advantage, organisations have shifted their focus towards elaboration and implementation of strategies for successful project management, which turns out to be a necessary condition for sustainability and long-term results in the context of organisational development.
Principles of project management are becoming very popular in traditional management of business organisations, providing foundations for high performance and sustainable growth. Project management is applicable in every business process management framework, which ensures additional value, competitiveness, and progressive growth; “in fact, the only way organisations can change, implement a strategy, innovate, or gain competitive advantage is through projects.” (Shenhar and Dvir, 2007)
This paper provides a review of the role of project management for improvement of performance, as well as for establishment and implementation of strategies for sustainable growth. Project management is an established framework for efficient planning, risk management, provision of informed decision-making about the company resources, monitoring, and measurement of performance results. On the basis of these advantages, the paper will also present practical recommendations for integration of project management at the levels of business strategy, structure, and processes.
2. Conceptual framework Within the conceptual framework of project management and
its principles, a variety of definitions need to be clarified, specifically definitions concerning the correlation between project management and its integration as a good practice for successful performance of business organisations.
The PMBOK gives the classical definition for project management as “application of knowledge, skills, tools and techniques to project activities to achieve project requirements. Project management is accomplished through the application and integration of the project management processes of initiating, planning, executing, monitoring and controlling, and closing” (Project Management Institute, 2000). According to Larry Richman project management is a “set of principles, methods, and techniques that people use to effectively plan and control project work. It establishes a sound basis for effective planning, scheduling, resourcing, decision-making, controlling, and re-planning.” Another definition suggests that “the purpose of project management is to predict as many of the dangers and problems as possible and to plan, organise and control activities … This process should start before any resource is committed and must continue until all work is finished.” (Lock, 2007).
These definitions specify project management as a process related to application of certain tools and methods for achievement of predefined goals. (Koleva and Kasamska, 2017) In comparison with the general management, which “did prove in many cases to be inadequate, with the result that time and cost targets were allowed to slip”, project management applies strategic principles that can increase the performance of business organisations, ensuring a competitive privilege and more organised structure of business processes management (Woodward, 1997).
On the other hand, business performance is “traditionally a topic that leaders of large companies pay a good deal of attention to, because it gives vital information about the state of the company, its success, development and future outlook” (Vasan, 2015) Usually performance is a subject of measurement, monitoring, and further analysis in order to ensure an appropriate results-oriented business strategy. Business performance measurement (BPM) in the context of organisational management is defined as “set of metrics used to quantify both the efficiency and effectiveness of actions” (Neely, 1995). Mike Biere defines BPM as a “process of providing accurate information for defining, measuring, and adjusting key areas of the business to keep all elements of an organisation in sync and provide a clear understanding of the things they are measured upon, responsible for, and any changes in the business” (Biere, 2011). All measurement and monitoring processes of business performance is implemented with the aim of guaranteeing continuous development and sustainable results within the organisation, as well as in the interaction with its main customers and competitors.
In recent years, business organisations are “obsessed” with achieving a sustainable competitive advantage and securing a position within an industry that turns them into leaders on the market (Rajagopal, 2016). Sustainability in results, performance, and growth is essential, especially in the current highly unstable business conditions of globalisation and competition. When organisations strive for sustainable growth, they need a different kind of management, decision-making, monitoring, and risk management. Andrew Lester defines this as growth management, which “requires individuals to work with a different style to running day to day operations … those who buy into the concept and processes early on will help lead the organisation in delivering sustainable growth” (Lester, 2009). Sustainable growth requires an innovative perspective in management, necessary for a variety of operations – from initiation to implementation, from planning to execution, from reaching growth to ensuring sustainable success.
After clarifying the main definitions, the current paper will focus on applying the principles of project management as the necessary different styles of business processes management, providing high business performance, sustainable growth, as well as long-term competitive advantage.
238
3. Project management principles for improved performance and sustainable business growth
The concept of project management lies in differentiation of several successive phases, interrelated with structured processes and principles.
According to the project management framework, the main project phases are defined as initiation, planning, execution, and closure (Figure 1). Each of them is characterised by its own specifics that can be applied in traditional management with the aim for improvement of performance, as well as for establishment and implementation of strategies for sustainable growth.
Figure 1. Phases of the Project Life Cycle
2.1. Project Initiation
Initiation is the process of “formally conceiving, approving, and launching a new project … The time and thought invested during initiation lays the groundwork for all the work that follows” (Wiegers, 2007). During this phase a specific problem or opportunity is identified, then the possible solutions, objectives, and scope are determined. Other processes that occur are related to documentation of costs and budget, appointment of a professional team, and distribution of responsibilities.
There are several key project management principles in the initiation phase that could be further used by organisations for improving of their business performance and reaching of sustainable growth as a competitive advantage.
One of the main processes during this stage is needs assessment, which usually refers to the “collection of data bearing on the need for services, products, or information” (Soriano, 2013). Needs assessment is used mainly in Customer Relationship Management (CRM), especially when the organisation is new for the market or it releases a new product or service. The information from the needs assessment is synthesised, analysed, and transformed into customer requirements. Sheila Kessler summarises several tools that could be used to gather customers’ needs:
Figure 2. Tools for Needs Assessment, Source:
Customer Satisfaction Toolkit for ISO 9001:2000 (Kessler, 2003)
Another essential process of the initiation stage is analysis of the stakeholders. Effective stakeholders management requires continuous interactions in two main directions – on the one side, within the business organisation, on the other side, with the external actors that would be impacted both positively or negatively by the implemented actions. Mapping of the main stakeholders, their needs, opportunities, and challenges defines all the future interactions with key actors for the company – customers, partners, competitors. When implementing a new business strategy, releasing a new product, or making a structural change in the business processes, the first step is stakeholder analysis to find out whether there are powerful stakeholders who will want the action success or be able to hinder it (Eskerod and Jepsen, 2013).
Appointment of a team and distribution of responsibilities are also a significant part of the initiation activities. When aiming towards improvement of performance and sustainable growth, business organisations need to take into account some factors, including “team size, composition, governance, identity, interactions, and a common team mindset” (Cobb, 2012). A general principle of team management is building and sharing a common mission and vision. Successful business performance is nearly impossible without a “clear sense of direction, and both the mission and vision provide that direction” (Lewis, 1998).
On the other hand, distribution of roles and responsibilities is often implemented on the basis of specific expertise, professional experience, and proven competences in the respective field. According to The Project Management Question and Answer Book, the role structure of the team defines the content and distribution of differentiated roles. “The knowledge and ability to use the structure of roles within the team is a strong and efficient instrument of human resource management in the project team” (Newell and Grashina, 2004).
The presented project management principles of the initiation phase – needs assessment, analysis of stakeholders, appointment of a team and distribution of team roles, could be used for improvement of business performance and sustainable growth. The main idea is integration of project management at the levels of business strategy, structure, and processes.
2.2. Project Planning
The second phase of the project life cycle is planning that is used to “ensure that the activities performed during the execution phase of the project are properly sequenced, resourced, executed and controlled” (Westland, 2006).
239
Planning as a business process is extremely important for implementation of both day-to-day operations and long-term strategies. It gives more details and a clear structure for the issues raised during the initiation phase, placing them in a timeframe. Planning gives a detailed analysis of the scope, the activities needed for reaching of the desirable results. Further, the activities are broken-down into specific tasks that could be further monitored and measured, linking them to specific intermediate results and control points. This is a process which provides a logical arrangement of the activities required to accomplish the general objective. Jack Gido suggests development of a network diagram for structuring the activities during the planning stage: “First the project objectives must be determined, then a list is made of all activities necessary to accomplish the project objectives, and finally these activities must be arranged in the form of a network diagram according to certain network principles and rules.” (Gido, 1985)
Another benefit of the planning process that could be applied for improvement of business performance is the appropriate allocation of resources – physical, intellectual, financial, human. For each task of the planning phase the necessary resources and timeframe need to be determined to ensure effective implementation and control of the further execution. When doing this, the critical path activities should be taken into account, as “giving to activities of less significance illustrates poor judgement” (Kliem, Ludin and Robertson, 1997).
A distinctive process for planning is risk management. It starts at this stage, but is further monitored and implemented during the execution phase. The purpose of risk management is “identifying potential risks, analysing risks to determine those that have the greatest probability of occurring, identifying the risks that have the greatest impact on the project if they should occur, and defining plans that help mitigate or lessen the risk’s impact or avoid the risks while making the most of opportunity” (Heldman, 2005). A process of risk management that is critical for business performance and sustainable growth is risk impact assessment, which encompasses evaluation of the risk probability and consequences, including cost, schedule, scope, quality, technical performance, as well as capability or functionality impacts. Risks are assessed and prioritised according to their potential implications for having an effect on achieving the preliminary defined objectives and expected results.
The planning phase is crucial for defining strategies for improvement of performance and sustainable growth within business organisations. It results is a structure with well-formulated tasks, allocation of resources, and risk management strategies, which provide the necessary basis for future implementation and control of these strategies.
2.3. Project Execution
The execution stage is realisation of every aspect that needs to be implemented for reaching a higher performance and sustainable growth. To ensure all activities are executed in correspondence with the predefined plan, monitoring and control processes are performed. Their purpose is to “track all major project variables – cost, time, scope, and quality of deliverables” (Gudda, 2011). Tracking the implementation of predefined actions offers the benefit of knowing the status according to preliminary determined both quantitative and qualitative indicators. On the basis of these metrics, via monitoring and control tools and techniques measuring of the variables is implemented, analysing comparatively the planned and actual executed activities.
The key process at this stage is identification of need for corrective actions, which is necessary when differences between ‘planned’ and ‘implemented’ is discovered. In case a deviation occurs, a measure for adjustment is triggered, which ensures effective implementation in compliance with the planned baseline metrics.
Figure 3. Monitoring and Control Processes, Source:
Project Control (Pico, 2013)
Another project management principle that could be applied for improvement of business performance is quality management. This process is applicable for all kinds of businesses, as “it is not possible to produce a desired quality and maintain it consistently over a length of period unless adequate control is exercised at every stage” (Jain, 2001). The start of the quality management process involves setting of quality targets, which are consolidated within the business organisation, corresponding to its strategic goals and desired performance indicators. Then assurance and further monitoring are undertaken to measure and report the actual quality. The benefit of this process is meeting the organisation's requirements, which ensures compliance with its strategic goals and regulations in the most cost- and resource-efficient manner, creating opportunities for expansion, sustainable growth, profit, and improvement of business performance.
2.3. Project Closure
The last project life cycle phase is closure. Its purpose is mainly related to review of the project completion and its overall success. “Success is determined by how well it performed against the defined objectives and conformed to the management processes outlined in the planning phase” (Method123, 2003)
One of the main processes that is used for improvement of performance in the context of organisational management is evaluation. It is a final review assessment of efficacy of the business to include organisational support, policies, procedures, practices, techniques, guidelines, action plans, funding patterns, and human and non-human resource utilisation. Evaluation is carried out on several levels: internal level (project and organisation), content level (subject area), external level (impact, exploitation, sustainability) (Kasamska, 2017).
Another process during the project closure stage is reporting. Communication is a key element in improvement of business performance and sustainable growth. This communication is guaranteed by reports and documents distributed within the business organisation to provide information about the project, its implemented activities, as well as achieved outputs and outcomes. Reporting is not used in the project closure phase only as a means of evaluation and validation, but also as a monitoring tool. “In this case, reporting provides tracking, identifies potential risks that contribute to the project risk management strategy, as well as facilitates cost management, showing full visibility of the budget and expenditures” (Koleva and Kasamska, 2017)
Project evaluation and reporting are distinctive processes for the last project life cycle stage – the project closure. Both of them are widely used by organisations for fostering of business performance.
240
3. Conclusion
This paper provided a review of the role of project management for improvement of performance, as well as for establishment and implementation of strategies for sustainable growth. The presented research also focused on applying the principles and processes of the main project life cycle phases. Practical recommendations for their integration were defined and could be summarised as follows:
Figure 4. Recommendations Based on
Project Management Processes
REFERENCES:
Biere, M., The New Era of Enterprise Business Intelligence: Using Analytics to Achieve a Global Competitive Advantage. New York, USA. International Business Machines Corporation, pp.6-115
Cobb, A.T., 2012. Leading Project Teams: The Basics of Project Management and Team Leadership. USA. Sage Publications, Inc., p.9
Eskerod, P., Jepsen, A.L., 2013. Project Stakeholder Management. Farnham, Great Britain. Gower Publishing Company
Gido, J., 1985. An Introduction to Project Planning. New York, USA. Industrial Press. p.4
Gudda, P., 2011. A Guide to Project Monitoring & Evaluation. AuthorHouse, p. 6.
Heldman, K., 2005. Project Manager's Spotlight on Risk Management. San Francisco. John Wiley & Sons
Jain, P.L., 2001. Quality Control and Total Quality Management. New Delhi. Tata McGraw-Hill Publishing, p.3
Kasamska, R., 2017. Shaping Successful Strategic Partnerships. VUZF Review: Online Journal for Economics. Volume 3, p.30
Kessler, Sh., 2003. Customer Satisfaction Toolkit for ISO 9001:2000. USA. American Society for Quality, p.38
Kliem, Ludin and Robertson, 1997. Project Management Methodology. A Practical Guide for the Next Millennium, p.129
Koleva, D., Kasamska, R., 2017. Establishment of successful strategies for project communications management. Sofia, Bulgaria. Electronic Scientific Journal www.rhetoric.bg
Lester, A., 2009. Growth Management: Two Hats Are Better Than One. Hampshire, Great Britain. Palgrave Macmillan, p.45
Neely, A.D., Gregory, M.J. and Platts, K., 1995. Performance measurement system design: a literature review and research agenda. International Journal of Operations & Production Management. Vol. 15 No. 4. MCB UP Ltd, pp. 80-116
Newell, M.W., Grashina, M.N., 2004. The Project Management Question and Answer Book. USA. American Management Association.
Pico, W.J.D., 2013. Project Control. New Jersey. John Wiley & Sons, Inc.
Project Management Institute, 2000. A Guide to the Project Management Body of Knowledge (PMBOK Guide). Pennsylvania, pp. 6-354
Rajagopal, 2016. Sustainable Growth in Global Markets: Strategic Choices and Managerial Implications. Boston, USA. Palgrave Macmillan, p.6
Richman, L., 2002. Project Management Step-by-Step, American Management Association. New York, USA, p.4
Shenhar, A.J., Dvir, D., 2007. Reinventing Project Management: The Diamond Approach to Successful Growth and Innovation. Boston, Massachusetts. Harvard Business School Press. p.3
Soriano, F.I., 2013. Conducting Needs Assessments: A Multidisciplinary Approach. California, USA. Sage Publications, Inc., p.xiv
Vasan, Dr. M., 2015. Corporate Social Responsibility. New Delhi. EduPedia Publications Pvt Ltd., p.77
Westland, J., 2006. The Project Management Life Cycle. Kogan Page, UK, pp. 4-14
Wiegers, K., 2007. Practical Project Initiation: A Handbook with Tools. Washington, USA. Microsoft Press
Woodward, J. F., 1997. Construction project management. New York: Thomas Telford Publishing, p.28
Abstract: The report analyzes the territorial dispute between the Republic of Slovenia and the Republic of Croatia in the context of the development of the main energy projects in Eastern Europe. An emphasis is placed on the Final Award of the Permanent Court of Arbitration regarding the maritime border between the two countries in the Piran Bay and especially on the decision for establishment of a "Junction Area", allowing physical connection between the territorial sea of Slovenia with international waters, through the territorial sea of Croatia and the influence of this decision on the opportunities for implementation of energy projects in the region. Additionally, the importance of the North-South Gas Corridor is presented as well as how it relates to the Baltic Pipe project and the Southern Gas Corridor. The report highlights the competition between some of the energy projects in the region. As a result, it is revealed that behind the territorial dispute between Slovenia and Croatia, falsely perceived as an insignificant, lay the confronting interests of USA, Germany and the Russian Federation, further transferred to the regional level, including through the interests of powerful energy corporations as ExxonMobil, Gazprom and OMV, turning the local dispute into a geopolitical vortex.
Keywords: ENERGY SECURITY, INTERMARIUM, LNG, PIRAN BAY, NORTH-SOUTH GAS CORRIDOR, BERLIN PLUS
1. Introduction The lack of significant amounts of energy resources in Europe
is generating a constant strive of the countries on the continent toward finding a resolution of this crucial problem for their security, stemming from the need of energy at competitive prices. The total production of primary energy in Europe has fallen from 904.2 million tons of oil equivalent in 2005 to 766.6 Mtoe in 20151. At the same time the Russian Federation remains the main source of solid fuels, crude oil and natural gas for the European Union2. This shared challenge is forcing the member states to seek a common approach aimed at dealing with this vulnerability.
Despite this, very often the European Union energy policies are falling victim to the national interests of member states or the rivalry between the major geopolitical actors. This creates an extremely complex situation in which the local energy priorities are interwoven with the global objectives pursued by the most powerful states in the world. As a result, the economic logic of energy supplies is subordinated to the geopolitical interests of parties, external for the European continent.
In this situation the European countries are faced with the dilemma whether to seek reliability of energy supplies at the expense of dependency or to pursue diversification, hiding the risk of higher prices or even complete termination of supply. Within this context the current article explores the implications of the territorial dispute between the Republic of Slovenia and the Republic of Croatia for the European energy security.
The methodology used in this research is based upon the critical thinking framework developed by Linda Elder and Richard Paul3. The main question raised before the current article is "Why the Federal Republic of Germany is supporting the Republic of Slovenia in its territorial dispute with the Republic of Croatia?". The reasons behind this formulation of the main research question as well as the origin and the characteristics of the territorial dispute between the two countries, are presented in the next section of the article.
2. The territorial dispute between the Republic of Slovenia and the Republic of Croatia in the wider context of the Three Seas Initiative
The dissolution of Yugoslavia arose the problem of determining the border between the Republic of Slovenia and the Republic of Croatia, especially in its maritime sector and the Piran Bay. On the 4th of November 2009 both countries signed an Arbitration Agreement, facilitated by the European Commission, according to
which Slovenia lifts its "reservations as regards opening and closing of negotiation chapters (between EU and Croatia) where the obstacle is related to the dispute" and that the Permanent Court of Arbitration will determine "the course of the maritime and land boundary between the two states"4.
As a result, the Republic of Croatia joined the European Union in 2013, but the resolution of the dispute has remained an unachievable goal. Furthermore, in 2015 the Croatian media revealed telephonic conversations between Dr. Jernej Sekolec, the arbitrator appointed by Slovenia and Ms. Simona Drenik, agent of Slovenia, linked to the deliberations of the Tribunal5. This led to the withdrawal of the Croatian side from the Arbitral process, which it described as "tainted" and "gravely damaged", while at the same time Slovenia confirmed that "the Tribunal should continue to fulfill its mandate"6.
On the 29th of June 2017 the Permanent Court of Arbitration issued its Final Award on the territorial dispute between Slovenia and Croatia. The Ministry of Foreign and European Affairs of Croatia announced that "the arbitral award does not in any way bind Croatia and Croatia shall not implement it"7. On the other side, the prime minister of Slovenia declared that his country will implement the arbitration ruling and expects Croatia to do the same8. The understanding of the aforementioned positions as well as the actions of the external for the region actors requires taking into consideration the details of the Final Award, rendered by the Permanent Court of Arbitration.
The Final Award determines9:
1. The geodetic lines of the land border between the two states, mainly in the disputed areas around river Mura and the Istrian peninsula.
2. The geographic coordinates of the so-called closing line (dividing internal waters from territorial sea) of the Piran Bay. The internal waters are distinguished by the territorial sea according to the status of the Bay – the Tribunal finds that "it had the status of internal waters prior to the dissolution of the SFRY and determines that it retained that status after the independence of Croatia and Slovenia".
3. The geographic coordinates of the maritime boundary between Croatia and Slovenia.
4. The geographic location and the usage regime of the so-called "Junction Area". It represents a corridor that connects the Slovenian territorial sea with the area that is beyond the 12 NM territorial sea limits of Croatia and Italy (the "High Sea") (Fig. 1). Furthermore, the Tribunal determines that in the Junction Area a special regime of usage shall be applied,
242
including mainly "freedom of (transport) communication to all ships and aircraft, civil and military, of all flags or States of registration, equally and without discrimination on grounds of nationality, for the purposes of access to and from Slovenia, including its territorial sea and its airspace".
Fig. 1 Geographic location and limits of the Junction Area.
This Junction Area allows the Republic of Slovenia to establish a physical connection between its territorial sea and international waters. The significance of this decision is related to and stems from the local and regional energy projects. Therefore, firstly, the research requires clarification of the position of Croatia on the energy map of Eastern Europe.
In Croatia the transit gas pipelines are maintained and operated by the company "Plinacro". The end-user natural gas transmission system, on the other side, is being controlled by 36 distribution companies. The largest importer of natural gas in Croatia is the private company "Prvo plinarsko društvo" - PPD. It is a subsidiary of the consortium "Energia naturalis" (ENNA), which also operates in the neighboring Hungary, Slovenia, Bosnia and Herzegovina, and Serbia. PPD delivers to the Croatian market around 800 million cubic meters of natural gas per year from Gazprom, representing 75% of the total imports of natural gas in the country.
The main supply route is through Hungary via the interconnector Varosfeld (HUN) - Dravaszerdahely (HUN) - Donji Miholjac (CRO) - Slobodnica (CRO). Another supply route passes through Slovenia via the interconnector Rogatec (SLO) - Zabok (CRO) - Zagreb (neighborhood Lučko), by which natural gas from Western Europe is being delivered (small quantities from Norway) and again Russian gas, from "Nord Stream". In addition, the country has a gas storage facility with capacity of 533 million m3, positioned in Central Croatia (village Okoli). It is maintained and operated by the state company "Podzemno skladište plina".
An alternative to the Russian natural gas is the planned terminal for liquified natural gas on the island of Krk (port Omišalj). The EU and the USA are looking at this project for a LNG terminal as an opportunity to decrease the dependency of Croatia on Russian natural gas, and therefore strongly support its implementation. It is expected that most of the natural gas imported through this terminal will be delivered by USA and after the process of regasification, transited to Serbia, Hungary and Austria along the existing interconnectors.
The interests of Russia and Germany in relation to Croatia overlap in their desire to block all opportunities aimed at providing an alternative energy supply routes for Europe, in order to ensure the profitability of "Nord Stream" and its planned expansion, which guarantees the leading role of Gazprom on the European natural gas market and establishes Germany as the main European energy hub. Also in this direction should be understood the insistence of the US Congress to extend the sanctions against the Russian Federation, which will mainly affect the European energy companies, involved in the construction of "Nord Stream 2". In this regard, the initiative of USA and Poland to forge a new Intermarium, an alliance of the central and eastern European countries, can be seen as a tool, by which to counter the opportunity for unification of the German and Russian interests in the region.
Intermarium in the form of the Three Seas Initiative, a reincarnation of the Międzymorze proposed by Józef Piłsudski nearly a century ago, held its first summit on 25th August 2016 in Dubrovnik, Croatia. It was attended by the heads of states of Croatia, Hungary, Poland, Bulgaria, Lithuania and Slovenia, and ministers from Austria, Czech Republic, Estonia, Latvia, Romania and Slovakia. The common between these countries is that they are all dependent (to a varying degree, but above 50%) on the imports of energy resources from the Russian Federation.
The second summit of the Three Seas Initiative, held on 6th and 7th July 2017 in Warsaw, Poland, was attended by the President of the United States of America. Donald Trump underlined the US readiness to export LNG to Eastern Europe and that "USA will never use energy to coerce your nations, and we cannot allow others to do so"10. The third summit of the Initiative will be held in 2018 in Bucharest, Romania. The Three Seas Initiative has two major objectives: 1. Development of the LNG terminals in Poland and Croatia and connecting them by the North-South Gas Corridor, and 2. Construction of the North-South highway "Via Carpathia", extending from Lithuania to Greece.
If we look at the Final Award of the Arbitral Tribunal in the territorial dispute between Zagreb and Ljubljana through the prism of Intermarium, we can say that it serves the interest of Germany and Russia, which with their support for Slovenia gain access to a "warm" sea (by guaranteeing access to and from the Slovenian port of Koper to international waters). The decision of the Permanent Court of Arbitration is decreasing the importance of the competitive Croatian ports, thus, indirectly, the feasibility of energy projects from south to Central Europe through Croatia (including the project for LNG terminal on the island of Krk), is being restricted.
The interests of Moscow coincide with the Germany’s strive for expansion of its influence in Slovenia, as such development might decrease the US and British pressure in the region and thwart the Polish plan for establishment of "Three Seas" buffer zone. On the other side, the plan of Poland collides with the German strategic concept for development of the region along the west-east axis, implemented through the EU Strategy for the Danube Region. At the same time Germany seeks to include the non-integrated countries from the Western Balkans into regional integration processes. Such a project is the supported by the Serbian President, Aleksandar Vučić, initiative for Balkan Customs Union, which is part of the German plan for the region "Berlin plus".
The United States are against the formation of pro-Russian or pro-German centers of influence in the countries of the former SFR Yugoslavia, and especially in Serbia. For this reason, the regional integration initiatives of Washington gravitate around the establishment of Adriatic partnerships on the periphery, with leading countries Albania, Montenegro and Croatia, where the Russian and German influence is much weaker.
Furthermore, in the context of the Three Seas Initiative, it is interesting to explore why Hungary temporarily (from 21.7.2017 to 28.9.2017) expressed the position that the BRUA project should not be realized in its originally envisaged form (cutting off the access of this pipeline to CEGH Baumgarten, Austria). Firstly, this behavior
243
of the Hungarian state might had been directed to the satisfaction of the Russian energy interests in the region with a view to achieve a better position in the forthcoming negotiations with Gazprom in 2021. This fact transforms Hungary into an unpredictable partner from the US viewpoint. Turning BRUA into BRU would have deprived this pipeline of the possibility to transfer natural gas from CEGS Baumgarten to Southeast Europe. As a result, this infrastructure would have lost one of its main functions and could have even been used to transfer Russian natural gas from Greece, supplied via Turkish stream.
Also by this move Hungary might have pursued a violation of the interests of the companies developing the gas fields in Romania (ExxonMobil and OMV). The potential removal of the connection between this source of natural gas and the CEGS Baumgarten turns the investment in the Neptun gas field far less profitable. Additionally, by such an attempt the Hungarian political leadership might have considered the possibility to limit the potential markets for the Romanian natural gas and thus to ensure for itself better conditions for its purchase in the future. Overall, Hungary wanted to show its capabilities to influence the energy configuration in the region, but its main interest is and will continue to be an increase of the significance of the Central Eastern European Gas Exchange (CEEGEX) trading hub.
3. Importance of the North-South Gas Corridor for the energy security of Eastern Europe
The North-South Gas Corridor is the leading project of the Three Seas Initiative, due to its potential to counter the Russian influence in Eastern Europe, which is closely related to the supply of energy resources. This project relies on the overall development of energy infrastructure in the region. In the south, of particular importance is the construction of the LNG terminal on the island of Krk, which initial capacity will be limited by the capacity of the gas transmission system of Croatia - 2.6 bcm of natural gas per year11. After 2020 the capacity of the terminal can be upgraded up to 7 bcm of natural gas per year12.
This in turn requires improvement of the interconnectors between the participating countries – Croatia, Hungary, Slovakia, Czech Republic and Poland (Fig. 2). The current interconnector between Croatia and Hungary (built in 2011) with capacity of 7 bcm of natural gas per year, enables gas supplies only from Hungary to Croatia. By March 2019, the Croatian side will build the infrastructure, necessary to allow reverse flow capability between the two countries13. The interconnector between Hungary and Slovakia (built in 2014) also requires further improvement. Its annual capacity of 4.5 bcm does not meet the ambitions of the North-South Gas Corridor project, especially considering the lower transmission capacity in the Hungarian-Slovak direction14.
Fig. 2 Route of the North-South Gas Corridor (blue dotted line)15
Slovakia on the other side is highly concerned with the possible ending of Russian gas supplies to Ukraine as this will deprive her of the revenues from pipeline charges for the natural gas transited to the Czech Republic, Austria and Germany16. As a result, Bratislava is highly interested in the development of the North-South Gas Corridor, not only due to its dependency on Russian natural gas but also because this project will allow the country to avoid being isolated by the future major energy infrastructure in the region. The interconnector between Slovakia and the Czech Republic (Lanžhot) has reverse flow capability and capacity of around 27 bcm of natural gas per year17. In addition, interconnector between Slovakia and Poland should be constructed by 2021 with technical capacity of 4.7 bcm/y in the direction from Poland to Slovakia and of 5.7 bcm/y in the direction from Slovakia to Poland18. The interconnection between the Czech Republic and Poland is intended to have a capacity of 5 bcm/y (possibility of increase to 10 bcm/y) in both directions but its completion date remains unclear (2019-2022) due to Poland’s concerns that "Nord Stream 2" will render this infrastructure unviable19.
In the end, whether or not the Czech Republic will be partially "bypassed" by the North-South Gas Corridor, this infrastructure should connect its northern side with the LNG terminal in Świnoujście, Poland, getting access to 5 bcm/y of natural gas (the capacity of the terminal will be expanded to 7.5 bcm/y by 2020). There is a possibility for connecting the North-South Gas Corridor with the proposed floating LNG terminal in Gdansk Bay, which capacity will be between 4.1 and 8.1 bcm/y. The floating LNG terminal in Klaipeda, Lithuania, probably will remain unconnected to this energy infrastructure, due to its focus on the Baltic States market. As a result, the North-South Gas Corridor will have initial access to 7.6 bcm/y of LNG imports with realistic increase to 14.5 bcm/y and maximum increase up to 22.6 bcm/y.
The current capacities for LNG imports are insufficient to affect profoundly the energy security of the countries, participating in the NSGC. Therefore, this project is highly dependent on the implementation of two other energy infrastructures - the Baltic Pipe and the Ionian-Adriatic pipeline, the last in turn, relying on the construction of the Southern Gas Corridor. The Baltic Pipe (expected completion in 2023) will have capacity of 3 bcm/y to Denmark and Sweden, and 10 bcm/y of natural gas to Poland. IAP (expected completion not earlier than 2020), on the other side, must be able to deliver 5 bcm/y to Croatia but it should be taken into consideration that the future of the whole Southern Gas Corridor remains unclear. Despite the recent political and financial support for this project it is very probable that it might share the destiny of "Nabucco" pipeline.
Consequently, by 2023 the NSGC, optimistically, will have access to 15 bcm/y of natural gas supplied by pipelines. Such scenario underlines the importance of this project, as a total of 29.5 bcm/y of natural gas flowing along the participating states, with the possibility of export to other eastern European countries holds the potential to gravely threaten the Russian interests in the region.
4. Hypotheses, answering the main research question
Since the Final Award of the Permanent Court of Arbitration, regarding the dispute between Slovenia and Croatia, was issued, the German Embassy in Croatia, the German Foreign Minister and even the German Chancellor expressed the position that the ruling of the Tribunal must be respected and implemented, thus indirectly supporting the Slovenian side. The analysis made in the previous sections of the article allows us to return to the main research question: Why the Federal Republic of Germany is supporting the Republic of Slovenia in its territorial dispute with the Republic of Croatia?
244
First, the decision of the Arbitral Tribunal imposes an undeniable connection between the territorial sea of Slovenia and international waters, thus preserving the opportunity for construction of LNG terminal in the country. This entirely correlates with the German interests in the region as the implementation of such a project, or simply the possibility for this action, has the potential to weaken the importance of the North-South Gas Corridor. The construction of a competitive LNG terminal in Slovenia may be used by Germany as a tool for undercutting the price of the LNG exported by the United States to the region.
As a result, this will render the deliveries from USA economically unviable and will drive them out of the market. It is very unlikely for the US companies to subordinate their own interests to the priorities of the government and will rather continue to target markets with the highest gas prices (the European is not one of them). Therefore, such a chain of events might be seen as desirable by the German state, especially considering that a direct competition between the Russian natural gas, imported by "Nord Stream" and the US LNG, is avoided, and instead a narrative closer to the market logic is being presented.
There had been an idea for the construction of a LNG terminal in the Northern Adriatic since 2004. The project for such an energy infrastructure in Trieste (Zaule) had been rejected in 2013 after protests from the Republic of Slovenia. In the light of the aforementioned interests of Germany, the construction of a LNG terminal in a state as Italy, able to withstand to a greater degree external political and economic pressure, is not as valuable as positioning this infrastructure in a much smaller state as Slovenia. The last scenario gives more freedom to Berlin to use such a terminal as a tool to achieve its own interests of blocking the US LNG deliveries to Europe. The possible reason for adherence to the outlined behavior is preservation of the competitive advantage, being derived by the "special energy relations" between Germany and the Russian Federation. These special relations are expressed in some of the lowest prices of Russian natural gas for the German market, as in 2013 in only five countries this energy resource was cheaper (Belarus, Armenia, Great Britain, Moldova and Netherlands) (Fig. 3). Three of them are subjected to significant Russian influence, one is a prospective market for "Nord Stream 2" and the last is still a major natural gas producer.
Fig. 3 Average natural gas price paid to Gazprom by country in 2013 (in Euro per 1000 m3)20
Second, Germany wants to prevent the US becoming an actor in the European energy market, as this may initiate a chain of events ending with a drop of Russian natural gas prices for the Eastern European countries and thereby indirectly undermining the German foreign trade interests. There is a clear opposition between, on one hand, Germany and Austria, and the US and Poland, on the other, with regard to the construction of the "Nord Stream 2" project. For Germany, this project, despite it leads to almost complete dependence on Russian natural gas (hypothetically it can reach 100%), is the most advantageous option, because Gazprom offers lower prices that the other competitors, and the concessions to
Berlin derive not only from the market logic, but also from the geopolitical interests of the Russian state. In order to avoid complete isolation, Moscow is forced to seek ways by which to maintain and improve its relations with the German political leadership.
In addition, Germany is Gazprom's main market in Europe, which in turn gives rise to an opposite dependency for the Russian side as well. Furthermore, account should be taken of the fact that the Russian Federation is dependent on German supplies of high-tech products. As a result, Russia is not able to use natural gas deliveries to Germany as a means of influence in the way it does with Poland, Bulgaria, Lithuania, Latvia and Estonia. US LNG supplies to the Eastern European countries also limit the possibility for Germany to resell natural gas to these markets. If "Nord Stream 2" is built, Germany will have a surplus of at least 30 bcm/y of natural gas (without considering the deliveries through Yamal and Transgas). This surplus may be diverted toward the countries participating in the North-South Gas Corridor project (attention in this respect deserves the route OPAL-Gazelle-Stork II), as long as the access of this infrastructure to natural gas sources is successfully blocked.
The NSGC alone is useless if it does not connect to Norway from the north via the Baltic Pipe, Azerbaijan to the south through the Southern Gas Corridor and the Ionian-Adriatic pipeline, and without building the floating LNG terminal "Adria" on the island of Krk, and an increase to both its capacity and the capacity of the gas transmission system of Croatia. Expansion of the capacity of the LNG terminal in Świnoujście is also a prerequisite for further increase of the significance of the NSGC. In the moderately optimistic case, along the NSGC will flow around 30 bcm/y of natural gas. It is in the interest of Germany that this does not happen.
Third, the development of such a large-scale energy infrastructure as the NSGC and all of its accompanying projects, which bypasses Germany and Austria and is not linked to the Central European Gas Hub in Baumgarten, is at best viewed by Berlin and Vienna as unbeneficial. The natural gas flowing through the Southern Gas Corridor can reach Baumgarten via Italy and the TAG pipeline, or Germany and France via Switzerland and the Transitgas pipeline. Initially, the natural gas flowing through the Trans-Adriatic pipeline at best would be around 10 bcm/y (as long as no quantities are being diverted through the Ionian-Adriatic pipeline), and at a later stage 20 bcm/y. But such capacity cannot be used, as the Trans-Anatolian natural gas pipeline will start operation (2018) at a capacity of 16 bcm/y, which might be expanded up to 22 bcm/y by 2023 and 31 bcm/y by 2026.
Even if the latter figure is accepted, 6 bcm/y of natural gas would be used by Turkey, further 4.4 bcm/y might be diverted through the BRUA pipeline and if another 5 bcm/y are being directed to the Ionian-Adriatic pipeline, then no more than 15.6 bcm/y of natural gas will reach Italy. In the initial stage of operation of TANAP and TAP, the quantities of natural gas reaching Italy would not exceed 4 bcm/y (considering that BRUA's initial capacity of 1.75 bcm/y and IAP are operational). Therefore, Germany may perceive IAP and BRUA projects as diverting quantities that otherwise would have reached its territory or CEGH Baumgarten. In this situation, Germany might seek to block the implementation of the IAP project and to reduce the NSGC to construction of bi-directional interconnectors, without providing real access to alternative natural gas sources.
Furthermore, Germany may attempt to hinder IAP and BRUA projects in order to support Russia's interests related to the construction of "Turkish Stream" to full capacity and the accompanying Eastring and Tesla pipelines. In return, the Russian state may (continue to) offer more favorable prices for the natural gas sold to Germany. Berlin earns double from this - ensuring Russia's benevolence in the supply of energy resources (including crude oil, 34% of the crude oil imported to Germany in 2016 is
245
from the Russian Federation), and preserving the access to the Southern Gas Corridor capacity via Italy. In this respect, account should be taken of the fact that Italy's gas transmission system is already loaded with the task to transport along the south-north axis large quantities of natural gas from the Trans-Mediterranean pipeline and Green stream. Hence, its ability to transfer larger quantities from the Southern Gas Corridor may be questioned.
And lastly, by creating difficulties to the realization of the North-South Gas Corridor, Germany may seek blockage of the Polish state intentions to build a gas hub on its territory.
5. Conclusion The study successfully outlined hypotheses, answering the main
research question raised before the current article. They may form different combinations to explain the actually observed situation, but more importantly, in the course of the work it was revealed that behind the territorial dispute between Slovenia and Croatia lay the interests of the major geopolitical actors, that further interweave with the aspirations of powerful energy corporations. As a result, emerges a situation in which Friedrich Naumann's "Mitteleuropa" is opposed to Józef Piłsudski's "Intermarium", and the intersection between political and economic more often becomes expressed by the energy issues, whose geopolitical dimensions remain the most accurate indicator of the strategic priorities pursued by the most powerful states in the world. The examined local dispute is just a small piece of the greater geopolitical puzzle stemming from the struggle for configuring the Eurasian space.
1 Eurostat (2017). Energy Production and Imports. [online] Available at http://ec.europa.eu/eurostat/statistics-explained/index.php/Energy_production_and_imports [Accessed 3.11.2017]
2 Ibid. 3 Elder L., R. Paul. Analytic Thinking. Tomales. Foundation for
Critical Thinking Press. 2010. 4 Government of the Republic of Slovenia, Government of the
Republic of Croatia (2009). Arbitration Agreement between the Government of the Republic of Slovenia and the Government of the Republic of Croatia. [online] Available at http://www.assidmer.net/doc/Arbitration_Agreement_Croatia_Slovenia.pdf [Accessed 3.11.2017]
5 Permanent Court of Arbitration (2015). PCA Press Release: Arbitration between the Republic of Croatia and the Republic of Slovenia-28.7.2015. [online] Available at https://pcacases.com/web/sendAttach/1313 [Accessed 3.11.2017]
6 Ibid. 7 Ministry of Foreign and European Affairs of the Republic of
Croatia (2017). PM Plenkovic: Arbitral award does not in any way bind Croatia and Croatia shall not implement it. [online] Available at http://www.mvep.hr/en/info-servis/press-releases/,28223.html [Accessed 3.11.2017]
8 Government of the Republic of Slovenia (2017). Cerar: Slovenia will implement the arbitration ruling. It expects Croatia to do the same. [online] Available at http://www.vlada.si/en/media_room/government_press_releases/press_release/article/cerar_slovenia_will_implement_the_arbitration_ruling_it_expects_croatia_to_do_the_same_60298/?tx_ttnews%5BbackPID%5D=25&cHash=d9077d055011e08054be5cb52ca5738c [Accessed 3.11.2017]
9 Permanent Court of Arbitration (2017). Final Award in the Matter of an Arbitration Under the Arbitration Agreement Between the Government of the Republic of Croatia and the Government of the Republic of Slovenia, Signed on 4 November 2009. [online]
Available at https://pcacases.com/web/sendAttach/2172 [Accessed 4.11.2017]
10 The White House (2017). Remarks by President Trump at the Three Seas Initiative Summit. [online] Available at https://www.whitehouse.gov/the-press-office/2017/07/06/remarks-president-trump-three-seas-initiative-summit-july-6-2017 [Accessed 4.11.2017]
11 LNG Hrvatska (2017). LNG Terminal Krk in Croatia, p. 5. [online] Available at http://lng.hr/upload_data/editor/files/LNG%20terminal%20Krk_presentation_Open%20Season.pdf [Accessed 5.11.2017]
12 Ibid. 13 Sadecki A. (2017). Reverse-flow capability for Hungarian-
Croatian gas pipeline interconnector – breaking the deadlock. [online] Available at https://www.osw.waw.pl/en/publikacje/analyses/2017-06-28/reverse-flow-capability-hungarian-croatian-gas-pipeline [Accessed 5.11.2017]
14 Hydrocarbons technology (2017). Slovak-Hungarian Gas Interconnector, Slovakia. [online] Available at https://www.hydrocarbons-technology.com/projects/slovak-hungarian-gas-interconnector-slovakia/ [Accessed 5.11.2017]
15 CEEP (2017). North-South Gas Corridor: Poland and Croatia join efforts. [online] Available at https://www.ceep.be/north-south-gas-corridor-poland-croatia-join-efforts/ [Accessed 5.11.2017]
16 Český rozhlas (2016). Czech Republic seeks to ease some Slovak worries over gas pipelines. [online] Available at http://www.czech.cz/en/Business/Czech-Republic-seeks-to-ease-some-Slovak-worries-o [Accessed 5.11.2017]
17 Siers M. (2014). Czech to Slovakia natural gas flows increase after Lanzhot capacity expansion. [online] Available at https://www.icis.com/resources/news/2014/09/23/9823215/czech-to-slovakia-natural-gas-flows-increase-after-lanzhot-capacity-expansion/ [Accessed 5.11.2017]
18 Eustream (2017). Project of common interest (PCI) No. 6.2.1: Poland – Slovakia Interconnection. [online] Available at http://www.eustream.sk/en_transmission-system/en_pl-sk-interconnector/en_project-of-common-interest-pci [Accessed 5.11.2017]
19 Kalan D. (2017). Czech NS2 support ‘tough luck’ for Poland – Bartuška. Available at http://www.baltic-course.com/eng/energy/?doc=129933 [Accessed 5.11.2017]
20 Hinchey N., A. Mikulska. LNG Versus Russian Gas In Central And Eastern Europe: Playing Poker On A Continental Scale. [online] Available at https://www.forbes.com/sites/thebakersinstitute/2017/08/24/lng-versus-russian-gas-in-central-and-eastern-europe-playing-poker-on-a-continental-scale/#8ec28e22c3a9 [Accessed 10.11.2017]
SCIENTIFIC-METHODOLOGICAL PROVISIONS OF FORMATION OF A VIRTUAL SEGMENT OF THE INFORMATION MARKET
НАУЧНО-МЕТОДОЛОГИЧЕСКИЕ ПОЛОЖЕНИЯ ФОРМИРОВАНИЯ ВИРТУАЛЬНОГО СЕГМЕНТА ИНФОРМАЦИОННОГО РИНКА
Doctor of Economic Sciences, Professor, Zhavoronkova G., PhD (Economics), Associate Professor, Zhavoronkov V.
National Aviation University, Kyiv, Ukraine. PhD (Economics), Associate Professor Melnyk L.,
National University of horticulture, Uman, Ukraine. [email protected]
Abstract: Gradually in the world formed a unified information space. There is something that is called "global virtualization". Author determines virtuality as a phenomenon, which represents the ability to generate creative reality. Virtual market is a market of goods and services that exists on the basis of telecommunication and information capabilities of the global Internet, basic elements of which are: free market access for all comers; equal rights and voluntary participation of all participants; the possible influence of participants on what is happening in the market. Under e-business, we understand the organization or person, in which basic business processes and internal and external communications are made and provided by electronic technology. Today it is not established neither theoretical nor methodological principles of virtual corporations as well as sufficient experience in their creation. The attention of practitioners devoted to the peculiarities of the creation of enterprises with the virtual principles of the organization. The study of trends in the development of the Internet and the possibilities of its application in economic activity also revealed that along with the structural and quantitative changes in this sphere occur the social and economic impacts of telecommunications development. KEYWORDS: INFORMATION MARKET, VIRTUAL SEGMENT, GLOBALIZATION, VIRTUAL, MARKET, CORPORATION
1. Introduction
Modern feature of the development of civilization in the XXI century, undoubtedly, the globalization of companies. Informational globalization is a unique phenomenon in the modern economic and social life all sta. Its essence is determined by the information dependence of agents in this environment mediated by new technologies, flow of information, the formation of an increasing number of sources and channels of information. Information globalization has significantly contributed to progressive changes in the economy and society as a whole.
Thus, the process of globalization is accompanied by the avalanche spreading information flows, so gradually in the world formed a unified information space. There is something that is called "global virtualization". So today in the world of Informatization, the term "virtual" is the key. Already talking about the emergence of virtual companies or an Internet civilization.
Information nature of the present stage of civilization evolution determines the situation when no country without an effective entry into the world information space can't successfully compete in the sectors of high and medium technology not only on external but also on the domestic market. Today it is not enough to link the development of the information society only with the solution of problems transmission, access, processing and storage of information or information products. Strategic planning processes of producing information in the form of new knowledge and the mass production of information technologies, which determine the modern condition of the productive apparatus and social-economic development of the country.
In contrast to the actual reality, which reflects the integrity, stability and completeness, virtual reality is a source of difference and diversity. Thus, virtuality is considered a phenomenon that is immanent in the very structure of being, represents the ability to generate creative reality. At the same time in different subsystems of society are "parallel worlds", in which operate the virtual analogues of real mechanisms of reproduction of society: economic cycles, political action, legal discourse of laws, the actions themselves on the Internet and the like. The process of replacement by using information computer technologies of real space as a locus of social reproduction of the virtual space, Bühl A. virtual calls [1].
2. Scientific definition and composition
space virtualization From a scientific point of view, the space of virtualization
include: virtual market, the virtual Corporation (enterprise), and virtual reality.
Virtual market is a market of goods and services that exists on the basis of telecommunication and information capabilities of the global Internet, basic elements of which are: free market access for all comers; the possible influence of participants on what is happening in the market; equal to the degree of awareness of the participants. Virtual market operates continuously in real time, covers the whole world and enables a variety of virtual operations.
The virtual environment opens for business new opportunities in the economic sphere, including through electronic Commerce. Occurs as the creation of new enterprises, focused only on e-Commerce and traditional businesses use electronic Commerce in their practice.
The virtual Corporation is a temporary form of voluntary integration of multiple, usually independent partners (companies, institutions, individuals), which is due to the system optimization advantages of production provides the advantage of customers. In a different interpretation under the virtual Corporation refers to marginesie flexible enterprise, which is temporarily created and the main purpose is to obtain benefits through the expansion of the range of goods and services [2]. In other works a virtual enterprise to define such terms – "world enterprises" [3], "infinite enterprise" [4] and the "extended enterprise" [5].
The virtual Corporation, like other companies operating in the market are General purpose, namely, profit and competitive advantage in the market. Feature of achieving this goal is that the virtual enterprise in its activity oriented to the whole market, all the competitive environment and not become attached to his particular segment, and work on the scheme (Fig. 1). A prerequisite for the creation of a virtual Corporation is the receipt of a market order. For the order creates a virtual network, which through its core competencies provides the virtual enterprise with the necessary resources and determine their capabilities (personnel, raw materials, management structure, financial and other resources, know-how, expertise and rights in a particular industry). With the help of electronic means are
247
provided information and communication services and executed a market order. For subsequent orders, on the basis of existing entrepreneurial pool creates new virtual network.
Figure 1. The scheme of virtual Corporation
Virtual corporations have significant advantages in comparison with other organizational forms of enterprises. The most important thing is that they can choose and use the best global resources, expertise and opportunities with the lowest variable costs. These features and their specific organizational structure allows you to become a leader in a competitive environment due to competitive advantages, namely the speed of execution of market order; the decrease in the level of total expenditure; the possibility of choosing partners and entering new markets; the use of information from all over the world. Virtual corporations have institutional characteristics that distinguish them from traditional forms of integration (table. 1).
Table 1
The differences between traditional and virtual corporations
Form integration The main goal Traditional signs Differences from virtual Corporation Project organization Individual projects to
address complex and risky task
Interim organizational structure. Cooperation of various departments and hierarchical levels of the organization
The restriction of certain areas of knowledge that dictates the market system. The lack of strategic management concept
Intra-corporate organizational structure
Pseudocumene structure to improve performance in the solution of separate tasks
Pseudocumene units. Self-organization. Internally the brand enterprise
Integration is not a temporary network. Competence does not coordinate with a third party
"Keiretsu" (Japan)
The merger of trading, several industrial companies and one major Bank (insurance company)
The Association is based on cultural ties. Close contacts with politicians and the administration. The use of a synergistic effect to gain market
Integration for a certain period. Low flexibility in changing partners. Complex financial linkages (cross-holding)
Strategic Alliance or joint venture
Economic integration to benefit in time, cost, know-how
Long-term cooperation with mutual participation. The use of a common production process
Long-term integration with partners. As a rule, mutual participation in the capital. Hard links
Outsourcing firm The allocation and transfer of certain tasks to a third party
Focus on your own competencies. A contractual relationship. The individual phases of the production of goods
The classical approach to "make-buy". Contractual relationship with a partner. The transfer of production outside the enterprise
Multinational Corporation
Taking advantage of the global activities due to the scale of production (range)
The legal agreement between the companies. General economic policy
A legal unit for a long-term period. Stability of the partners. Weak market mobility
Virtual reality is the simulation of real processes of development and production in cyberspace, which is both a medium and a tool. Virtual reality as a tool allows you to intuitively build complex structures, and the environment gives the opportunity to abstract to a product, production building, workplaces, machines and equipment before they will really exist.
3. The virtual segment of the information market
The services offered by the Internet, there is a variety of. But there are six basic economic models virtual economy (information production): Retail model; Media model; Advisory model; Made-to-order model; Do-it-yourself model; Information services.
The market for Internet services are characterized by some characteristic features, namely:
economical: very low cost almost always possible to achieve maximum results; globality, that is, the General ability of the global network. There is also the concept of local markets for Internet services, under which we understand the body providers, Internet companies, e-business infrastructure and Internet users in a certain area. It is the nature of the placement, the circulation of information flows and use of information makes the market global; the rapid pace of development and changes, because the
market of Internet services is one of the most dynamic businesses. The number of WWW servers is increasing rapidly; free competition. Being highly profitable, the market of Internet services around the world is one of the most competitive; high technology, as they are, on the one hand, the basis for the further development of the world wide web, on the other hand, as a result, since introducing new ideas in new technical solutions require new technologies; high capacity of the market of Internet services, which is estimated as the amount is incomparable in width and in depth;
high growth services. In different countries depending on local conditions and the development of the market, the annual growth of Internet services ranges from 15 to 250% [6].
Subjects of the market of Internet services can be divided into three large and interrelated categories:
service providers – companies producing and selling Internet products and services for use or consumption;
users – individuals and legal entities who buy these products and services for use or consumption;
infrastructure, regulatory bodies and research institutions.
In the new EU strategy "Europe 2020" deserves attention in the context of our study, the category of "Plan for the development of digital technologies in Europe".
The purpose of this direction of development is the creation of a sustainable economy and social benefits by creating
Create Virtual network
Order fulfillment
Market order
New market order
248
a common digital market based on fast Internet and common applications.
E-business – e-business in Web developing rapidly. Today in its third stage of evolution of e-business that already focuses not on the provider and on the consumer and allows you to automate complex patterns of business relationships.
Under e-business we understand the organization or person, in which basic business processes and internal and external communications are implemented and provided by an electronic technology and which are focused on profit. Internet selling may not be the main characteristic of e-business that makes it different from ecommerce, ACET contributes to buying and selling on the Internet.
There are three main components of e-business: electronic document management; e-Commerce; the electronic payment system. P. Drucker in the emergence of the phenomenon of e-Commerce sees the most vivid manifestation of the impact of information technology. Today, in his opinion, worth talking about: "the explosive emergence of the Internet as a critical channel for global distribution of goods and services... which fundamentally changes the economy, markets, industrial structure, nature of products and services and their flows, values, behavior, and segmentation of consumers, jobs and labor markets" [7].
One of the types of e-business is electronic Commerce, which can be defined as the business processes for the sale, carried out between subjects with the help of information and telecommunication technologies to ensure the achievement of economic and financial objectives of the subjects as well as help reduce costs. When using new technologies, e-Commerce enterprise open new markets and get a number of additional advantages, namely:
increases the efficiency of obtaining information; improving the quality of customer service; reduces the production cycle and sales; you receive the savings by reducing inventory; significantly reduced costs associated with the
exchange of information; enterprises are becoming more open to customers;
appears the ability to quickly and around the clock to inform partners and customers about products and services;
allows you to create new sales channels like e-shop, there are new markets and consumers;
increasing the competitiveness of; increases the value of companies for shareholders. Category E-banking can be defined as a technology of
remote banking service, which provides access to accounts and transactions at any time from any computer.
Today there are a number of models of electronic Commerce: electronic Department stores with a particular trademark; e-shop of the manufacturer; e-market intermediary firms; the electronic catalogue is the representation of a large amount of products from different manufacturers; an electronic auction; virtual community; manufacturers of systems of the technological chain of e-Commerce; consulting services; information brokers; research services.
The creation of national centre’s of e-Commerce and their integration into the intergovernmental network will eliminate information barriers between producers and consumers of products and services, will provide conditions for the search of new markets in rapidly changing conditions, the structure of demand and supply, which will significantly stimulate the development of market infrastructure and create better conditions for the presence of domestic producers in regional and global markets for goods and services, and will also affect the development of small and medium-sized businesses.
In the era of the protracted revolution in Economics of the information business, the majority of analysts agree in opinion that it is necessary to take into account such principles of "survival" information company on the Internet:
rate on income from online advertising;
full use of modern Internet technologies with information flows, including quality of aggregation of information materials and search engines, cross links, personalized content, sending automated reminders and notifications;
the development and cultivation of strong brands, which only can be formed a loyal and stable user base [8].
Thus, e-business is a strategic area of development for most business processes. For corporate projects started consistent and painstaking work in two aspects: on the one hand, to develop new horizons of the Internet business, and improving technology, but first and foremost, of management techniques Internet business systems. Therefore, to successfully compete today, you need to quickly and accurately performed via the global Internet network for the exchange of information between companies and States, to conduct virtual marketing, e-Commerce and generally e-business.
4. Legal regulation of the activities in the
virtual space In connection with the increase in the number of
Internet users, the use of virtual technologies in government, banking, scientific, and educational institutions, especially with the advent of e-business has emerged the need for regulation of corresponding social relations at the legislative level. It should be noted that the main feature of the Internet is that in the global network no national boundaries, there is no Central governing body, which would be able to initiate legislation. This feature determines the specificity of law-making, the necessity of harmonization of national legislation with international regarding these relations. The most active group of users of information technologies in the world are private companies. The questions that interest them, – negotiating and concluding deals with legal power, with computer communications, that is using electronic document management systems (EDMS).
International legal harmonization in the regulation of the SED took place gradually, taking into account the needs of practice and differences in the legal systems of States. At the beginning of this process was developed by the UNCITRAL model law "On electronic trade". The basis for regulation was taken "functional equivalent approach", based on the analysis of goals and functions of the traditional requirements for the preparation of paper documents in order to determine how those purposes or functions can be achieved or performed through electronic Commerce techniques.
An attempt of considering the possible impact of Internet Commerce on the structure of interaction of market participants was carried out by the European Commission. in 2010, when was the document on the settlement of vertical restrictive agreements (HEU) in the EU, which was introduced a number of innovations, taking into account the development of the Internet [9]. One of the controversial points of the new document were the conditions under which restrictions on the Internet are eligible. In this context, there are a number of issues which require consideration, namely [10]: 1) outright ban on Internet sales. It is necessary to distinguish "active" and "passive" sales. Active sales are sales that are carried out against individual consumers, specific groups of consumers or consumers that pertain to specific areas. Passive sales are carried out in the case of the reaction of the distributor on the individual needs of the consumer; 2) a ban on Internet sales according to the territorial principle to protect the exclusive territories; 3) restrictions to Internet retailers; 4) the conditions imposed on Internet Commerce. For example: dual pricing, high quality requirements, encourage customers to attend exhibitions distributor, etc; 5) the minimum resale price.
Thus, in accordance with the new box exceptional measures for settlement of vertically restrictive agreements and
249
"Principles of leadership", the European Commission attempted to strike a balance between market participants, allowing consumers to effectively use Internet Commerce, and at the same time allowing suppliers to determine the optimal model of distribution and selection of distributors. From time to time the European Commission will provide additional clarification to the new rules, and the rules themselves will remain in force until 2022. However, the activity of subjects of information relations in the global computer network Internet requires further improvement of legal regulation. Relevant laws and regulations should take into account the achievements of international organizations in this field and, in particular, the EU.
5. Conclusions So, the Internet is evolving and requires further
consideration, research and legal clearance. Already the work on the Internet has become a context of production for many companies: it is the streamlining of programs, reference websites, catalogs, specialized and popular magazines, directions for significant information flows. There is no doubt that the network becomes an independent branch of the economy. At the same time, it is important to realize that the conditions for the formation of self-sufficient Internet economies that cannot influence the government. In the modern Internet companies its true global environment activities, their global competition. The last "offline" to strict national regulation, and the only way to avoid losses is the liberalization of info-communications. And it should be remembered that today no one country has the necessary resources to single-handedly do to capitalize on the global Internet.
Accelerated innovative development of information and computer technologies will allow to create new jobs and increase the level and quality of life of the population; align interregional disproportions; to ensure sustainable economic growth; to enter the international markets of information; to integrate into international organizations; to increase the flow of foreign investments; to accelerate economic reforms in Ukraine; to build the information society.
Today it is not established neither theoretical nor methodological principles of virtual corporations as well as sufficient experience in their creation. The attention of practitioners devoted to the peculiarities of the creation of enterprises with the virtual principles of the organization. In our opinion, the virtual enterprise must be established in domestic conditions as they can significantly affect the level of investment attractiveness of Ukraine.
The study of trends in the development of the Internet and the possibilities of its application in economic activity also revealed that along with the structural and quantitative changes in this sphere occur the social and economic impacts of telecommunications development, as a significant gap in this area can lead to the outflow of the most qualified personnel to other countries. However, all the advantages of the virtual market can and should be used by firms to improve their business relationships.
6. References
1. Bühl A. Die virtuelle Gesellschaft des 21. Jahrhunderts: sozialer Wandel im digitalen Zeitalter. Wiesbaden: Westdeutscher Verlag, 2000.
2. Khrushch N.A. Features create and manage virtual enterprises / Khrushch N. A. Donchenko T. V. // Bulletin of RSTU. Economy. – Rivne, 2002. – Vol. 2(15). – P. 406-411.
3. Wytrich, A. G. Virtualization as a possible way of development / Wytrich, A. G., Andres F. // Problems of theory and management practice. – 1999. – No. 5. – http://www.ptpu.ru.
4. Paturel R. creating a network of organizations of a new type / Paturel R. // Problems of the theory and practice of management. – 1997. – No. 3.
5. Tarasov V. Causes and characteristics of businesses of a new type / Tarasov V. // Problems of the theory and practice of management. – 1998. – No. 1.
6. Veretelnikova Y. O. the Internet Market In Ukraine – black box with many unknowns / Veretelnikova Y. O. // Marketing in Ukraine, 2001. – No. 3. – P. 6-9.
7. Drucker P. Beyond the Information Revolution / Drucker P. // The Atlantic Monthly, 1999. – V. 284. – № 4.
8. Mitilino S. E-business-incubators, or how to organize your own shopping site / Mitilino S. // Computer network /ITS, 2000. – No. 22.
9. Commission Regulation (EU) №330/2010 on the application of Article 101(3) of the Treaty on the Functioning of the European Union to categories of vertical agreements and concerted practices: [Electronic resource]: Electronic access: http://ec.europa.eu/competition/antitrust/legislation/guidelines _vertical_en.pdf
10. Shalashova M. E. E-Commerce in the EU: new forms of regulation of vertical restraints agreements and their impact on e-Commerce /Shalashova M. E. // Scientific works of DonNTU. Series: economic. Vol. 40-1. – Donetsk: DonNTU, 2011. – P. 206-212.
Prof. Dr. Elena Yrevna Sidorova, National University of Science and Technology MISiS [email protected]
Abstract: The upcoming three-year period is marked for Russian tax system as a period of crucial reforms and restructuring. Computational-analytical method was used as the main one. Possible fiscal consequences for the country economy were calculated on the basis of three options of the proposed changes in tax rates. The study was conducted on the example of four taxes: value added tax, corporate income tax, personal income tax and insurance premiums. Based on the calculations the possible consequences of changes in tax rates are determined taking into account possible changes in consumer behavior, systems approach to the investigation of the tax system, and the appearance of the feedback loop effect. Keywords: tax reform, tax, system approach, consumer behavior, feedback loop effect. KEYWORDS: TAX REFORM, TAX SYSTEM APPROACH, CONSUMER BEHAVIOR, THE EFFECT OF THE FEEDBACK LOOP.
1. Introduction The upcoming three-year period is marked for the Russian
tax system as a period of crucial reforms and restructuring. . By 2019 the national tax reform of value-added tax (hereinafter VAT) and insurance premiums is expected to be completed. Three options of the proposed changes in tax rates will be considered in this article, as well as possible fiscal consequences for the country economy will be calculated.
Option 1. Compulsory payments to the social insurance system at the rate of 22% with levying from the entire payroll (cancellation of "thresholds") with an increase of the VAT rate to 20% and abolition of preferential rates in the 10% (hereinafter “option 1”);
Option 2. Aggregate payments to the social insurance system at a rate of 21% with levying from the entirepayroll (cancellation of "thresholds") with VAT 21% and cancellation of preferential rates in the 10% change (hereinafter “option 2”);
Option 3. Aggregate payments to the social insurance system at a rate of 21% with levying from the entirepayroll (cancellation of "thresholds") with VAT 20%, while maintaining preferential rates, applying of a trade fee in all regions and raising the personal income tax up to 15% (hereinafter “option 3”).
Purpose of the article: to assess the fiscal effect of these three options for tax reform conducted until 2019.
2. Results and Discussion From the standpoint of the need for a theoretical
justification for the chosen forecasting methodology, the authors of this study used the following starting points.
1. When choosing the industries for the study, the size of employees’ wages was taken into account.
2. The organizations of the researched industries are not payers of the trade fee, in this connection this fiscal payment was excluded from the calculation of the effectiveness of the third option of the tax reform.
3. During the calculations, the analyzed indicators were indexed for the inflation rate planned for 2017 - 4%.
4. Evaluation of tax reform options effectiveness wasestimated by the computational-analyticalmethod, actively used in conditions of multi-optional planned events and insufficient verifiability of the information base.
Thus, according to option 1, due tothe payments to the Pension Fund of Russia (PFR), Social Insurance Fund (SIF), Federal Compulsory Medical Insurance Fund (FCMIF), the total volume of falling out revenues of the six selected industries will account 19.27 billion euro, due to the corporate income tax- 3.86 billion euro; While the volume of additional revenues from the value-added tax, taking into account the changes proposed in option 1, will amount 55.56 billion euro.
Consequently, the total amount of budget losses will amount up to 17.56 billion euro or 16.4% of the tax revenues for the sectors selected.
The conducted calculations of the option 2 demonstrated that the total volume of falling out revenues for the studied economy industriesas a result of the changes in the tariffs of insurance premiums ofPFR, SIF, FCMIFwould be 21.68 billion euro, corporate income tax - 4.34 billion euro; while the volume of
additional revenues from the value-added tax would amount up to 7.15 billion euro. Thus, the total amount of budget losses would account 18.87 billion euro or 17.6% of the tax revenue for the industriesselected.
The assessment of the cumulative economic effect of option 3 allowed to determine that:
− The amount of the falling out income for the six industries analyzed due to the payments to PFR, SIF, FCMIFwill be 21.68 billion euro;
− The drop in income from corporate income tax, formed because of the increase in the costs accepted for calculating this tax in the form of insurance premiums, will beup to 4.34 billion euro;
− The volume of additional revenues from the value-added tax will account 0.934 billion euro;
− The volume of additional income from the income tax will be 6.022 billion euro.
Consequently, the total budget loss of option 3 will account 19.06 million euro or 17.75% of the tax revenue for the industries selected. The conducted calculations showed that option 2 would lead to the biggest loss of the budget.
The general trend of changes in tax rates leads to the conclusion: prevalence of indirect taxation ultimately increases the tax burden on the end user. During the first phase of implementation the increase of indirect taxeshas a positive impact on producers, releasing free cash flows necessary for production development, making the country economy more attractive for investors.
During tax reforms, two rules of the systems management theory must be remembered:
1. Taxes and taxation is a system, the essence of which is in the fact that it can sustain itself and function as a single unit, as a result, of its parts interaction;
2. There is the effect of the feedback loop, which can be both positive and negative.
In the context of the three options, itmight be concluded that it is balancing feedback. The mechanism of balancing feedback adjusts the difference between the actual and the desired state of the system. After two years of the test application,the revenues will be the same as if the tax rates are not changed at all. It will just change the source of tax payments: after implementation of the tax reform, tax burden will increase for the end user or the population of the countrybut the main goal –economic development – will not be achieved, whilethe way ofpeople’s thinking will be different.
The behavior of Russian end user can be classified as traditional, and the behavior of the taxpayer - can be classified as optimizing. Due to the income reduction (an increase of personal income tax rate by 2%) and an increase of prices (the application of a trade charge and the increase of VAT up to 20-21%), there will appear a common habit of increased money saving.It will lead to further growth of market competition and difficulties in sales markets. Negative consequences will also be connected with low efficiency of marketing tools applied by Russian producers, in compare with Western companies, as well as due to the short-term period of habit formation (3 months). Moreover, after 8-10 months the habits are transformed into a routine (used by R. Nelson and S. Winter) - established practice, the established order of activities.
It should be noticed, that the practice of transferring the tax burden from production to consumption is a general trend for over the past 10-15 years. However, in contrast to Russia, the tax
251
maneuver includes VAT and corporate income taxes, but not the insurance premiums, which are the main pension systems worldwide. For instance, corporate income tax rate is constantly decreasing in Switzerland during last years. Typical rates of corporate income tax in different cantons (regions) of Switzerland varies from 8 to 10.5%1, that makes it highly competitive in compare with other European countries. In many OECD countries, personal and corporate tax rates are reduced, while the taxation base and the contributions to social security system are increased. At the same time, there was a general tendency to VAT rates increase since 2006, and it allowed obtaining certain positive effects. However, all OECD countries, excluding Australia and New Zealand, levied compulsory social insurance contributions on labor incomes in which there is a general upward trend2.
3. Conclusion According to the above written it can be concluded:
changes in tax rates will influence 97.7% of the working population in the country and it will change their behavior model. The new behavior model will reduce the capacity of the market, reducing the consumption of domestic products of low quality and high price, replacing them with cheaper foreign counterparts. These changes will eventually lead to deprivation of Russian companies of a significant number of its customers.
Moreover the temporary effect of VAT rate increase (the first option of the budget revenue growth 5.56 billion euro, the second - 7.15 billion euro, the third – 0.934 billion euro) will be fully or partially lost due to lower level of consumption and market contraction.
Thus, we believe that the transfer of the tax burden from production to consumption is premature, unjustified, and ineffective. Still the process is inevitable, so the change in tax rates should be gradual. For instance, an increase or decrease of interest rates by 1-2%, choice of one or two taxes a year as the object of changes, andsuch changes should be held every two years in order to determine the effect of the feedback loop from the accepted changes and adjust further action.
1 INTERNATIONAL CORPORATE TAX: Investment in Switzerland, KPMG, Edition 2012. – pp. 77.
2 Å. Johansson, C.Heady, J. Arnold, B. Brys and L. Vartia TAX AND ECONOMIC GROWTH // ECONOMICS DEPARTMENT WORKING PAPER, NO.620, ECO/WKP(2008)28, - 85 рр.
4. References 1. Improvement the methods of tax regulation
mechanism effectiveness assessment in the Russian Federation In Russian) // EКОНОМIЧНИЙ ЧАСОПИС-XXI № 11-12, 2015 С.47-51.
2. Weber M. Selected works. - Moscow: Progress, 1990.
3. Sidorova E. J., Conniston D. V. The Economic substance of tax regulation // Economy and society, No. 1, 2014.
4. Hodgson J. Habits, rules and economic behavior // Issues of Economics. - 2000. - No. 1.
5. International corporate tax: Investment in Switzerland, KPMG, Edition 2012. – pp. 77.
6. Å. Johansson, C.Heady, J. Arnold, B. Brys and L. Vartia Tax and econonmic growth // Economics departament working paper, NO.620, ECO/WKP(2008)28, - 85 рр.
252
PRINCIPLES OF DESIGNING AND DEVELOPING INTELLIGENT MANUFACTURING SYSTEMS OF PACKAGING
Prof. dr. Palchevskyi B., PhD. Krestyanpol О., PhD. Krestyanpol L.
Annotation: Manufacturing facilities employing the elements of intellectual technologies can be encountered in various industries.
The given paper provides examples of intelligent devices of manufacturing packaging systems. It shows how to maintain operational performance in case of unforeseen changes in the properties of an intelligent manufacturing system by changing the operation algorithm, changing the program behavior or searching for optimal or effective solutions and states during operation.
1. Introduction The development and use of advanced information
technologies at all levels of manufacturing management allows you to go to the intellectual of the technological equipment. Any manufacture task, for which there is an unknown algorithm for its solution, can be attributed to the intellectual. To solve this problem it is necessary to create an appropriate knowledge base and apply mean of artificial intellectual [1, 2, 4, 7].
Summarizing the arguments of many researchers [3,6,7], it can be argued that the manufacturing system becomes intellectual, if decision tasks of manufacturing, it operates without having an exact algorithm for solving the problem. It adapts for work in external conditions varying with time, based on the appropriate knowledge base that allow you to create the adaptation algorithm.
2. Prerequisites and approaches for the task
The development and use of advanced information technologies at all levels of manufacturing management allows you to go to the intellectual of the technological equipment. Any manufacture task, for which there is an unknown algorithm for its solution, can be attributed to the intellectual. To solve this problem it is necessary to create an appropriate knowledge base and apply mean of artificial intellectual. Summarizing the arguments of many researchers, it can be argued that the manufacturing system becomes intellectual, if decision tasks of manufacturing, it operates without having an exact algorithm for solving the problem. It adapts for work in external conditions varying with time, based on the appropriate knowledge base that allow you to create the adaptation algorithm. For this automatic control systems (ACS) must be suitable for working with knowledge bases, that is to become intellectual ACS (Fig. 1).
3. Тhe features of the intelligent production
systems It follows that intellectual manufacturing system can be
divided into two modules - "mechanical" and "intelligent". As rule, under the mechanical module refers to flexible
manufacturing system that implements the physical actions on product and has potential capabilities to adapt when changing function conditions.
Intellectual module of intellectual manufacturing system should include knowledge base and provide adjustments of program functioning when changing external conditions. It allows you to modify, based on the use of artificial intelligence as parameters of
the functioning of intellectual manufacturing systems, and their structure.
Combining mechanical and intelligent modules provides getting intellectual flexible manufacturing system (IFMS).
First intellectual ACS, what combining the methods of traditional systems of automatic control and knowledge engineering, became expert systems (ES). The simplest intellectual ACS can, for example, consist of a conventional ACS and base of productive rules.
Fig. 1. The scheme of interaction of flows in
М – material flow, Е – energetic flow, І1 – information for management, І2 – information for organizing the functioning of the
IFMS, B- product Since the formation of management program must take
into account possible manufacturing situations, the intellectual subsystem ACS must compensate for the change external conditions by making some changes in the management algorithm to achieve the optimal parameters of the functioning of the IFMS. It's evident, that such ACS must first of all, evaluate the external conditions in order to make the necessary changes in the algorithm of functioning. Therefore, intellectual ACS implements three management functions.
1. Identification of the manufacturing system, which consists in obtaining an estimate of the instantaneous quality of the process of its functioning by defining some indicator, which can be compared with its specified value.
2. Decision making, which is the search direction changing the functioning program of IFMS in the direction of improving the quality of the production process by changing its structure or modes.
3. Setup, which involves a physical or mechanical change of algorithm the functioning of IFMS.
Functional interaction of processes in of IFMS is shown in Fig.2.
IFMS
I1
I2
E
M
В
253
For implement these processes the structure of IFMS
includes the executive subsystem, the subsystem of automatic control and intellectual (creative) subsystem (Fig.3).
The executive subsystem of IFMS implements a physical
process that needs to be automated. The automatic control subsystem creates at its output
the control commands of IFMS and signals IGUS and visualization signals depending on the results of reporting on the physical process and the results are consistent with the specified instructions.
Intellectual subsystem provides the formation algorithm of functioning depending on the influence of external (for example, changing a production task, the use of other semi-finished products, etc.) or internal (for example, failure of some mechanisms) factors.
For example, the intelligent flexible manufacturing module (IFMS) on the basis of CNC machine includes an executive part actually the machine and its basic mechanisms with drives soft ware management system and intelligent subsystem.
The executive system of the CNC machine implements technological operation from the conversion the work piece in the processed detail with the commands given control system. Thanks to reporting of executive system (instrument position, moving speed, the resulting size after processing, etc) the control system monitors the technological elementary operations. In addition to exchange of commands and reports system performance, the control system communicates with external systems (user, operator, etc.), receiving instructions and reporting back for help with a light or sound means. For this, in the structure of the machine is provided,
for example, an expert system condition diagnosis of the machine and adjust the cutting conditions depending on the sensor readings
efforts and cutting power. Since the formation of management program be aware
account of possible production situation, then the intelligent subsystem ACS must compensate for changing external conditions by making of certain changes in control algorithm to achieve optimal performance characteristics of IMS. Apparently, such ACS must, first of all, to evaluate the external conditions in order to make the necessary changes in the algorithm of functioning. Intelligent functional diagram of ACS is shown in Fig.4.
Fig. 4. The functions of the intellectual control system of IFMS
Reports
Management process Physical processes of IFMS
Instructions
Commands
Process of synthesizing algorithms
Perturbation Збурення
Fig. 2. Processes of IFMS
Management program
Control unit
Intellectual machines Instructions
Fig. 3. Structure of IFMS
254
On technological process is influenced by external conditions Z (random disturbance) and V (change of production tasks) that changing. The control system determines the current values of input X and output Y of system parameters and determines the quality of the process u’. The decision about changes in the establishment u (reorganization of the algorithm operation and technological regimes), which are necessary to ensuring the quality of functioning of a technological machine.
In the solution of intellectual tasks, the system operates without accurate algorithm for solving the problem. Tasks associated with search algorithm to solve them, will be intellectual. Then any task, for is unknown the algorithm, will be referred to the intellectual, for which it is necessary to use the tools of artificial intelligence. As see, the intellectual tasks have two distinctive features:
- using of information in symbolic form (words, symbols,
drawings), what distinguishes artificial intelligence systems from traditional computer systems, that processing only numerical data;
- availability of choice - the absence of a decision algorithm determines only those, that it is necessary to make a choice between many of their variants. The main feature of intelligent systems is that, they are
based on knowledge, or rather, on some of their performance. Knowledge here is understood as saving (using a computer) information, formalized according to some rules, which computers can use with logical deduction by certain algorithms.
Technological process design - is the creation of functional description the technological complex. If this description is created from known operations, then the technological process is formed by synthesis. The synthesis of technological process the question is solved number of technological operations, their level of concentration, consistency of execution. To expand the field of search variants of technological process it is necessary to generate the greatest number of possible variants of its structure. For creation of ES, which can carry out synthesis technological process with changing the route for different operating conditions of IFMS, need to create a knowledge base, which defines the sequence of processing of surfaces of details and type of necessary equipment. The results of this analysis will set the set of possible variants of processing routes. It is desirable in the first step is to carry out optimization of the synthesized technological process.
Show by example, how the building of knowledge base and model, which includes a plurality of alternative processing routes. Let task is processing the details made of cast iron – housing support (Fig. 5).
The following machines are located on the site: • CNC lathe, • long, • vertical milling, • CNC horizontal milling • CNC drilling • CNC boring. In case of failure or busy processing another part, any of
the selected machine tools, in of IFMS should be changing the processing route.
Knowledge base formation. For a formal definition the sequence of creating surfaces, let's introduce the concept of a binary precedence relation π. Consider, that in more general case, on sequence of the creation a product at formation its quality parameters influence the functional, design and technological constraints, which allows it possible to distinguish three groups relation of anxiety, namely:
• functional precedence relations, which are imposed by the conditions of operation of the product;
• design precedence relations, which are imposed by the conditions of spatial location the details and the individual surfaces in product design;
Fig. 5. The graph of the Gπ forward is for the case handling options: 1- vertical extended; 2- vertical milling; 3- drill; 4- horizontal milling; 5 - drill; 6- turning; 7- boring; 8- prolonged
• technological precedence relations, which are imposed
by the conditions of manufacture of a product. Determine the causal precedence relations of structural
elements of the product graph Gπ or its matrix Mπ. The precedence matrix is constructed as follows. At the intersection of the i-th column and j-th row is a unit, if the i-th constructive element of the previous j-th, or zero otherwise. The matrix of causal relations will form:
Each element of the matrix satisfies the following requirements:
1 - if the i-th structural element should be
dij = created before the j-th; 0 - otherwise. Because the constructive elements of the product are
implemented by appropriate technological transitions or operations, the causal relationships between these elements determines the precedence relation between technological transitions or operations.
To determine the total number of such links for each of the surfaces, which is necessary to process, sum the unit in each row of the matrix, and the amount is written in the column BO, which indicates the degree of technological dependence of the processing of this surface from other surfaces of the part. Summing unit in each column of the matrix, write their sum, which characterize the technological degree of imitation of the surfaces, that their influence on the processing of other surfaces.
Determining the processing sequence will be guided by the following.
1. The first treated surface is processed, which requires no pre-treatment of other surfaces, that is, the column dependence BO zero value (no precedence relations).
2. When processing this surface all the connections are forwarded, which are in the column of the surface subtracted from
Work piece
Detail
7 6 4
5
8
3
1 2 Treatment of the base
Treatment of two base and threaded openings
Main hole treatment
Treatment of the main hole in the
grinding
-“- The treatment is clean
255
the values, shown in the column total degrees of dependence BO. The resulting values describe the new state of the part after the first stage of processing – B1. To determine the next surface for processing the repeating stage 1, whereupon, the procedure is repeated.
3. In the presence of multiple surfaces with zero degree of dependence, they can be processed in one step.
We got with help of formalized procedure, the sequence of technological transitions surface treatment details, which creates three stages of processing, specified by the precedence graph Gπ.
Fig. 6. Model of the set of routes for handling the support
casing Marking vertices of the graph is performed, starting from
the last operation, as follows: on each vertex, note the minimum value of technological cost, which meets the minimum path to it from the end of technological process (vertex 2-3-6). The value of other ways that have the highest total the cost of technology, down. After the reverse run graph model minimum path is remembered and celebrated. The resulting sequence of operations 2-3-6 is the optimal technological process, which ensures the lowest cost of processing.
In order to realize the concept of intellectual production, the main components of IFMS (machines, their functional modules and control units in the machines, etc.), must be converted into intellectual device with systems of diagnosis, that are real-time transmit data about their state (healthy - faulty, busy – free, etc.). Obtained from the system diagnostics data can be used for identify periodic delays in the execution of transitions, reloading components equipment and timely resolve the problem. This helps to improve speed, accuracy and repeatability of the operations, which increases the speed of production process and reduces the number of failures.
From the knowledge base for IFMS processing the housing of support. Complete the knowledge base, according to the following rules.
Rule № 10. The work piece is fed to vertical milling machine 2 and, if he is free and healthy, basis processed.
Rule № 20. If vertical milling machine is busy (repairs or perform other operation), then the work piece is fed to a prolonged machine 1 and basis processed.
Rule № 30. If a long machine is busy, the process stops before the dismissal of the machines 1 or 2.
Rule№ 40. The work piece is fed to the drilling machine 3 and, if he is free and healthy, which processes 2 basic and one of the threaded holes.
Rule № 50. If machine 3 is engaged, the process stop. Rule № 60. The work piece is fed on the lathe machine 6
and, if he is free and healthy, processing two the ends and rough and completely main hole.
Rule № 70. If the machine 6 is busy, the work piece is fed to boring machines 7, which processes two ends and rough and completely main hole.
Rule № 80. If the boring machines 7 busy, the work piece is fed to horizontal milling machine 4, which processes two ends.
Rule № 90. If the machine 4 is busy, the process stop. Rule № 100. The work piece is fed to the drilling
machine 5 and if he is free and healthy, treated main hole roughly. Rule № 110. If the machine 5 is busy, the process stop. Rule № 120. The work piece is fed to a prolonged
machine 8 and if he is free and working properly, then clean processing main hole.
Rule№ 130. If the machine 8 is busy, the process stop. The following is the algorithm of IFMS, that can be
programmed in any language (Delphi, C++ or PROLOG, LISP, etc).
For ease of analysis of functioning the IMS, the influence of environment is divided into two groups:
• Determined change given conditions of production (nomenclature, time of delivery, that is, calendar-production planning)
• random vibration conditions for the functioning - disturbances in the system such as cracks.
Then IMS is structurally divided into two generalized level, ordered according to the theory of intellectual machines: the organizational level, depending on the conditions of production and executive level, depending on the conditions of functioning manufacturing system.
4. Conclusions 1. It should be determined two areas of building
intellectual manufacturing systems – first, top-down, by attaching a new component to an existing intellectual system, and, secondly, from the bottom up, by providing intellectual properties grassroots components, for example, as is typical for mechanic units.
2. Any production task, the algorithm of solution of which is unknown in advance or which is created on the basis of incomplete data, and systems, programs which perform the actions for the solution of this problem can be attributed to artificial intelligence, if the result of their work will be similar to the result of human activities in solving the same problem.
3. For technological systems the concept of artificial intelligence can be applied in their using of the subsystems, which change their algorithm operation depending on changes in external or internal conditions.
5. References
1. Gaines B.R., Norrie D.H. Knowledge Systematization in the International IMS Research Program // Proc. of IEEE Conference on Systems, Man and Cybernetics Intelligent Systems for 21st Century. -1995. - Vol.1. - P. 958 - 963. 2. Groover M.P., Zimmers E.W., CAD/CAM: computer-aided design and manufacturing. New Jersey: Prentice-Hall, 1984. 3. Opitz H., Wiendahl H.P., Group Technology and Manufacturing Systems for Medium Quantity Production, Intern. Journal of Prod. Res., 1971, vol. 9, no. 1, pp. 181-203.
256
4. Palchevsky B., Swic А., Krestianpol H., Computer integrated designing of flexible manufacturing systems, Lublin University of Technology, Lublin 2015. 5. Gola A., Świć A., Kramar V., A multiple-criteria approach to machine-tool selection for focused flexible manufacturing systems, Management & Production Engineering Review, 2011, vol. 2, no. 4, 21 – 32. 6. Waterman D. A Guide to Expert Systems: Translated from English .- M .: Mir, 1989.- 388 p. 7. Computer integrated planning, modelling end management / l.Yampolskyi, P.Melniczuk etc, .- Zhytomyr: ZhDTU, 2010.-786 p.
257
MANAGEMENT OF THE VALUE ADDED MADE BY THE ENTITY USING SIMULATION MODELING
УПРАВЛЕНИЕ ДОБАВЛЕННОЙ СТОИМОСТЬЮ, ПРОИЗВОДИМОЙ ПРЕДПРИЯТИЕМ, С
ПРИМЕНЕНИЕМ ИМИТАЦИОННОГО МОДЕЛИРОВАНИЯ
Prof. Dr. Sc. Eng. Rozhkov I., Phd. Student Econ. Trofimova N., Prof. Dr. Sc. Econ . Larionova I., Prof. Phd. Econ . Kostyukhin Y. National university of science and technology MISiS, Moscow, Russia
Abstract: The main issues are considered in this topic: choice of corrective actions; monitoring of values of key indicators and corrective actions; assessment with use of a simulation modeling of an expectation of values of key indicators and the operating influences during the specified periods; determination by means of simulation modeling of change of sizes of corrective actions for transition from "crisis" by the "successful" periods of work of the entity. KEYWORDS: SIMULATION MODEL; VALUE ADDED; THE SLIDING VARIATION COEFFICIENT; ESTIMATING VECTOR
1. Introduction
The research is directed to implementation of automated control systems for economy of the entity. Three stages of the solution of this task are allocated. The first stage – forming and the forecast of the integrated indicator characterizing an economic condition of system. The second stage – creation of the estimative vector allowing to divide in dynamics an array of initial information into two parts relating to the satisfactory and pre-crisis periods of work of the entity. And the final stage – stay using imitating modeling of the ranges of rational values of financial ratios.
2. Discussion of a problem
In the existing management systems for assessment of an
economic situation only the integrated indicator which in principle can be considered in dynamics is calculated. Whether on value of an integrated indicator it is possible to estimate there is an economic situation in the entity in pre-crisis or satisfactory condition. But at the same time the method of determination of the corrective actions allowing to transfer the entity from pre-crisis to satisfactory condition isn't specified. For the solution of this problem in this work, the estimative vector allowing to divide pre-crisis and crisis conditions of the entity is entered, and values of corrective actions are determined by the found characteristics of distributions for satisfactory condition of the entity.
3. Diagnostics of an economic condition of the
enterprise with use of a value added
Тhe value added of products made by it is considered a key indicator of a financial and economic condition of the entity. The value added is a source of economic growth and income formation of owners and employees of the entity and also state. For owners optimization of value added is expressed in a possibility to solve problems of development of the entity.
By determination the value added of 𝑆𝑆𝑉𝑉𝑉𝑉 is estimated based on the ratio of [1]:
𝑆𝑆𝑉𝑉𝑉𝑉 = 𝑁𝑁𝑁𝑁 −𝑀𝑀, (1)
where 𝑁𝑁𝑁𝑁 – the cost of products made by the entity; 𝑀𝑀 – market value of the materials and services spent in case of production.
By simple transformations the formula (1) can be given to the following type:
𝑆𝑆𝑉𝑉𝑉𝑉 = 𝐸𝐸𝐸𝐸𝐸𝐸 + 𝑆𝑆𝑆𝑆𝑆𝑆 + 𝐷𝐷𝑉𝑉 + 𝐸𝐸𝑉𝑉𝑇𝑇, (2) where 𝐸𝐸𝐸𝐸𝐸𝐸 – sales profit; 𝑆𝑆𝑆𝑆𝑆𝑆 – a compensation phot; 𝐷𝐷𝑉𝑉 – depreciation; 𝐸𝐸𝑉𝑉𝑇𝑇 – the amount of the taxes paid from cost value.
From the given constituting 𝑆𝑆𝑉𝑉𝑉𝑉 its distribution is clear: - the employee – the salary and other expenses on
compensation;
- to the state – the income tax and assignments on social needs;
- to the persons which provided the equity – dividends, including according to the shares belonging to subsidiary companies;
- remain at the disposal of the company – depreciation and retained earnings.
Essential importance of an indicator of 𝑆𝑆𝑉𝑉𝑉𝑉 for the specified categories determining this cost follows from told. And for all of them maximization of an indicator of 𝑆𝑆𝑉𝑉𝑉𝑉/𝑀𝑀 is desirable.
We will return to a formula (1). From this formula we receive:
𝑆𝑆𝑉𝑉𝑉𝑉𝑀𝑀
= 𝑁𝑁𝑁𝑁𝑀𝑀− 1 (3)
The equivalence of tasks of maximization of indicators of 𝑆𝑆𝑉𝑉𝑉𝑉/𝑀𝑀 and 𝑁𝑁𝑁𝑁/𝑀𝑀 follows from a ratio (3) [2]. It is established that there is very high correlation of an indicator of 𝑁𝑁𝑁𝑁/𝑀𝑀 with coefficient of turnover of current assets (𝐾𝐾𝐶𝐶𝑉𝑉𝐸𝐸 ) and current liquidity (𝐾𝐾𝐶𝐶𝑁𝑁):
𝐾𝐾𝐶𝐶𝑉𝑉𝐸𝐸 = 𝑁𝑁𝑁𝑁𝑆𝑆𝐶𝐶𝑉𝑉
and 𝐾𝐾𝐶𝐶𝑁𝑁 = 𝑆𝑆𝐶𝐶𝑉𝑉𝐾𝐾𝑡𝑡+𝑁𝑁𝑃𝑃
, and also with indicators π1, π2, π4 – the characteristics determining the strategy of management of current assets of the entity [3]:
𝜋𝜋1 =𝑆𝑆𝐶𝐶𝑉𝑉𝑁𝑁𝑁𝑁 ,
𝜋𝜋2 = 𝐸𝐸−𝐼𝐼𝑆𝑆−𝐾𝐾𝐸𝐸
𝑆𝑆𝐶𝐶𝑉𝑉= 𝐾𝐾𝑡𝑡+𝑁𝑁𝑝𝑝
𝑆𝑆𝐶𝐶𝑉𝑉, ,
𝜋𝜋4 =𝐾𝐾𝐸𝐸𝐸𝐸 ,
where 𝑆𝑆𝐶𝐶𝑉𝑉 – amount of current assets; 𝐸𝐸 – a balance sheet total; 𝐾𝐾𝑡𝑡 – short-term loans; 𝑁𝑁𝑝𝑝 – an accounts payable; 𝐾𝐾𝐸𝐸 – long-term loans; 𝐼𝐼𝑆𝑆 – own means.
In works as [2, 4, 5] methods of nonlinear programming a number of tasks of optimization both an indicator of /𝑀𝑀 , and some corrective actions, in particular 𝐾𝐾𝐶𝐶𝑉𝑉𝐸𝐸 indicator is solved. But the given approach to optimization of value added and finding of rational values of its corrective actions can be used in any one-time researches because of need of accounting of change of key indicators of the entity.
In automated control systems for economy of the entity the stay task in dynamics of rational values of the corrective actions providing maximization, for example, of a value added indicator needs to be solved using imitating modeling. The general scheme of this procedure is as follows. After the choice of the main economic indicator pass to finding of the vector determining its financial and statistical ratios, a so-called "estimative vector" 𝑦𝑦 = 𝑦𝑦1,𝑦𝑦2, … ,𝑦𝑦𝑛𝑛 . In particular, for relative value added of 𝑆𝑆𝑉𝑉𝑉𝑉/𝑀𝑀 the financial ratios provided above are chosen as components of an estimative vector: 𝐾𝐾𝐶𝐶𝑉𝑉𝐸𝐸 = 𝑦𝑦1, 𝐾𝐾𝐶𝐶𝑁𝑁 = 𝑦𝑦2, and also indicator 𝜋𝜋4 = 𝑦𝑦4. From statistical coefficients the sliding variation coefficient (𝑀𝑀𝑆𝑆𝐷𝐷) is used:
258
𝑦𝑦3 = 𝑀𝑀𝑆𝑆𝐷𝐷 = 𝜎𝜎𝑀𝑀𝑥𝑥
, where σ – the moving standard deviation of size of relative value added (𝑆𝑆𝑉𝑉𝑉𝑉/𝑀𝑀); 𝑀𝑀𝑥𝑥 – expected value.
Further length of an estimative vector is determined: ‖𝑦𝑦‖ = �𝑦𝑦1
2 + 𝑦𝑦22 + ⋯+ 𝑦𝑦𝑛𝑛2 .
Coordinates of a vector are units and zero, that is 𝑦𝑦𝑖𝑖 ∈ {1; 0} . Number 1 corresponds to a satisfactory situation, and number zero – unsatisfactory. The sizes 𝑦𝑦𝑖𝑖 are determined from the following system of ratios:
𝑦𝑦1 = 0 in case of 𝐾𝐾𝐶𝐶𝑉𝑉𝐸𝐸 ≤ 𝐾𝐾𝐶𝐶𝑉𝑉𝐸𝐸𝑁𝑁𝑁𝑁𝑁𝑁𝑀𝑀 and 𝑦𝑦1 = 1 otherwise; 𝑦𝑦2 = 0 in case of 𝐾𝐾𝐶𝐶𝑁𝑁 ≤ 𝐾𝐾𝐶𝐶𝑁𝑁𝑁𝑁𝑁𝑁𝑁𝑁𝑀𝑀 and 𝑦𝑦2 = 1 otherwise; 𝑦𝑦3 = 0 in case of 𝑀𝑀𝑆𝑆𝐷𝐷 > 0,3 and 𝑦𝑦3 = 1 otherwise; 𝑦𝑦4 = 0 in case of 𝜋𝜋4 < 𝜋𝜋4
𝑁𝑁𝑁𝑁𝑁𝑁𝑀𝑀 and 𝑦𝑦4 = 1 in case of dissatisfaction of this condition.
Standard measure values are established by the entities. The given standard values often accept when calculating risk of the entity. As standard value 𝜋𝜋4 it is possible to accept its average for the considered period.
The estimative vector allows to determine to what massif information obtained in every quarter belongs: to work of the entity in a pre-crisis or "satisfactory" situation. In the presence of four indicators if all of them are equal standard, the economic situation is assessed by number 2. If all four indicators don't correspond standard, the economic situation is assessed by number 0.
In work [6] as an expert way it is established that the pre-crisis situation steps in case of a deviation of length of an estimative vector from maximum on 30% and more. If the situation takes place three quarters in a row and longer, then it is considered crisis.
The final stage of calculations is finding of rational values of the specified financial ratios of 𝐾𝐾𝐶𝐶𝑉𝑉𝐸𝐸 , 𝐾𝐾𝐶𝐶𝑁𝑁 and 𝜋𝜋4 by imitating modeling. As a result of the performed procedures the used massif of basic data is divided into 2 parts: the specified massifs of satisfactory work of the entities and pre-crisis and crisis conditions. The left borders of the found differential distributions of satisfactory work of the entities are also the minimum values of required corrective actions. Parameters of distributions are estimated when using a packet of the application programs "Oracle Crystal Ball".
The given algorithm is implemented for several types of distributions: normal, logarithmic normal, logistic and also Beta. As critical values of corrective actions the maximum values of the left borders of their distribution for satisfactory condition of the entity are chosen.
4. Summary As a result of the executed research the following results are received: 1. As the most important characteristic of an economic condition of the entity the value added of products made by it is chosen. 2. The general technique of quantitative assessment of an economic situation in the entity using the new operational characteristic – lengths of an estimative vector is offered. The technique includes the following main stages: – determination of set of the financial ratios and their standard rates characterizing an economic situation in the entity; – consideration of the estimated coordinates of the vector in which the relevant financial ratio is replaced by the unit if it meet the specified standards and zero otherwise; – calculation of length of a vector; – separation of the array of information into two parts – satisfactory and unsatisfactory conditions of the entity. 3. The research of the found data arrays relating to satisfactory and pre-crisis conditions of the entity with use of a packet of application programs "Oracle Crystal Ball, allows to establish the minimum values of rational corrective actions taking into account the left border of distribution of financial ratios for satisfactory conditions of the entities..
5. References [1] Samuelson P. Economy. T.1. – M.: MGP "ALGON", VNIISI, 1992 [2] Rozhkov I.M., Larionova I.A., Zhaglovskaya A.V. Diagnostics and optimization of a financial and economic condition of the entity: studies. benefit. – M.: Prod. house of MISIS, 2014 [3] Larionova I.A., Rozhkov I.M., Scriabin O. O., Markov S. V. Diagnostics and optimization of strategy of management of current assets//Metallurgist.– No. 5, 2007 [4] Larionova I.A. Optimization of current assets of the metallurgical entity: monograph. – M.: house of MISIS, 2010 [5] Larionova I.A., Rozhkov I.M., Scriabin O.O., Trofimova N.A., Zaytsev I.M. Optimization of relative amounts and structure of resources//Steel. 2016. No. 11 [6] Rozhkov I. M., Trofimova N.A., Larionova I. A., Kostyukhin Yu. Yu., Brykova P. O. Enhancement of a coefficient evaluation method of an economic situation in the entity//Steel. 2017. No. 6
259
INTEGRATING OPEN DATA INTO COMPANIES’ BUSINESS MODELS FOR FOSTERING DIGITAL TRANSFORMATION
Antonova A.1, Yordanova S.2, Sofia University, Bulgaria1
University of National and World Economy, Bulgaria2
Abstract: Horizontal and vertical integration of companies within the value networks plays a substantial role for faster and wider implementation of Industry 4.0 and adoption of new digital business models. The policy for open data encourages companies to integrate more data flows coming from public sources into their operations. Thus, digital transformation of companies needs to reconsider the available public and open data flows and to improve their business models. The present paper aims to present and analyze how companies can integrate Open data in digital transformation process and new business models` adoption. The main elements of digital business models within Industry 4.0 and smart factories is introduced and discussed. Open data models and standards are analyzed and assessed as a source for value creation within companies. Finally, the paper identifies and discuss the main approaches for companies to implement open data into their business models.
Keywords: OPEN DATA, BUSINESS MODELS, INDUSTRY 4.0;
1. Introduction Open Data (OD) and Open Government Data (OGD) became
part of large national and international policy initiatives targeting to enforce public authorities to provide open access into public data. Open data became part of government efforts to promote transparency, participation, efficiency and effectiveness in the public sector [Huijboom, Van den Broek, 2011]. Open data policies have been established with the purpose to bring new economic opportunities through encouraging innovations, fostering digitalization, developing advanced products and services and providing further benefits for individuals, organizations and civil society as a whole. As discussed in the report of Carrara et al. (2015), the open data re-use can lead to many political and social benefits as well as to direct and indirect economic gains in the form of new revenues, value-adding activities, costs savings and jobs. Following the general Open data trend, different public, NGOs and private organizations and international bodies, deliver open cross-disciplinary datasets, available for further re-use, naming as for example: www.kaggle.com; google cloud platform (https://cloud.google.com/public-datasets/), open data network (https://www.opendatanetwork.com/) and many others.
However, the public statistics show that the free access to open data is not automatically leading to data use and re-use especially in business context [Welle Donker & van Loenen, 2017]. Even more, unanswered questions remain about the micro-economic and macro-economic effects from Open data re-use and further distribution of the Open Data economic gains [Davis&Perini, 2016]. Moreover, the development of new products and services out of public data and the emergence of new business models prove to be challenging tasks for all stakeholders, including business and public organizations, start-ups and non-for-profits. Even in the most advanced business case scenarios, it becomes clear that further efforts should be made to integrate open data into value-adding business models, business processes and services.
The emerging Industry 4.0 technology paradigm imposes new economy models based on “smart manufacturing” and “smart factories”. Organized around big data, connected technologies such as complex cyber-physical systems, Internet of Things, 3D printing, cloud computing, artificial intelligence and robotics have the potential to disrupt value creation along different industries. Big data and advanced data analytics become the key ingredient of the new business models and business processes. However, Sommer (2015) warns, that new Industry 4.0 revolution can change the structure of the business landscape, leaving small companies incapable to survive the digital transformation, unable to adapt to the new-coming business realms. As a result, a question arises: Can
thus open data enhance the digital transformation of the SME companies?
The present research aims to outline the opportunities of companies and especially SMEs to integrate open data into their digital transformation process. By exploring the main elements of data-driven value creation process and data-based digital business models, a framework is proposed for value-adding activities of both open data providers and intermediaries within an open data ecosystem.
The paper is structured in four sections. The first section presents the main concepts of open data and the elements of the digital business models transformation within Industry 4.0 and smart factories. In the second section, the data-value driven models for value creation, the data-driven business models and open data value creation is explored. The next section outlines open data models and standards, further making assessment of Open data development in Bulgaria. Finally, the paper identifies and discusses the main difficulties and barriers for companies to implement open data analysis into their business models and there is proposed and discussed a new open data business model, fostering value creation within companies.
2. Open data, Industry 4.0 and company digital transformation
Open data is commonly defined as data, that can be freely used, re-used and redistributed by anyone – subject only at most, to the requirement to attribute and share-alike [Open Data Handbook, Open Knowledge International, 2015]. In order to be reusable, the open data should respond on two main conditions: to be legally open, or released under an open license, legally permitting its re-use and redistribution and to be technically open, or available in an open and machine-readable format, as a complete dataset and preferably for a free download (Open Data EU portal, https://data.europa.eu/).
The open data portals represent a critical data infrastructure as they connect data holders with data users, who in turn can re-use it into products and services that citizens and businesses can benefit from. The main European Open data hub is the European data portal (https://www.europeandataportal.eu/), launched in November 2014 with the aim to facilitate both data publishing and data re-use across different EU countries. The European data portal harvest the metadata of Public Sector Information (PSI) available on public data and geospatial portals across European countries and currently provide access to about 788,671 datasets. Furthermore, the
European data portal provides a wide number of services such as Open data e-learning and training, research publications, public surveys, Open Data barometers, policy recommendations and others. This way, European data portal becomes the main reference center for European open data initiatives. On European scale many other specialized open data portals, such as: INSPIRE (spatial data sets and spatial data services), Copernicus (land, marine, atmosphere, climate change, emergency management and security), GEOSS (Global Earth Observation System of Systems) have been launched. During the next years it is expected the European Open Science Cloud (EOSC initiative) to be launched. All these portals and initiatives come to show that further public datasets will be available for businesses, increasing their potential and capacity to monetize data resources into innovative products and services.
Industry 4.0 and smart factories designate a new trend toward existing industry digital transformation with extended smart and connected technologies. Almada-Lobo (2016) defines Industry 4.0 manufacturing transformation based on Cyber-Physical Systems (CPS) and Cyber Physical Production Systems (CPPS) toward mass customized, decentralized, vertically integrated, connected and mobile, cloud computing and advanced data analysis approach. Saldivar et al., (2015) further summarize that Industry 4.0 leads to a paradigm shift from centralized to decentralized manufacturing based on customer-triggered autonomous processes of cyber-physical systems. Recognizing the economic potential of Industry 4.0, a number of policy strategies have been implemented both on European and on national level [Digitizing European Industry EC portal].
Adoption of Big data or advanced data analysis will play a crucial role in the digital transformation process. As outlined in the whitepaper of Fraunhofer’ Institute [Otto et al., 2016], data has changed its economic role in industry from “data as a process outcome” on “data as a process enabler” to become „data as product enabler” and finally transforming to “data as a product”. This is confirmed as well by [Ylijoki & Porras, 2016], stressing on that big data will have disruptive effects on firms, ecosystems and businesses, leading to emergence of new business models and value-creation mechanisms. The accumulation and integration of big data, coming from different sources is seen as a must for developing adaptive, smart, customer-oriented business models and processes. Therefore further approaches have to be developed enabling companies to integrate both data from internal processes as ERP/CRM/SCM systems, IoT sources and private clouds with industry data, social media, open government data and open public data, scientific data, partner’s/ suppliers/competitor’s/ecosystem data and others. Thus, the role of big data and data analysis for companies changed substantially during the stages of digital transformation, leading to further impact on industries and economy as a whole.
Making an overview of the successful digital transformation processes of old and big companies, Sebastian et al., (2017) identified three main elements. The first one is the adoption of digital strategy and technology-inspired value proposition. The main digital strategies can be either customer engagement (adopting technologies for increasing loyalty and trust) or development of digitized solutions (integrating combination of new products, services and data). The second element is to develop an operational backbone and the third element is to create digital service platform, enabling rapid innovation and responsiveness to new market opportunities.
In conclusion, the digital transformation is a complex issue, consisting of different aspects such as adoption of new digital strategy (digital transformation vision), framework (operational backbone), ecosystem approach, adoption of open environment for experiments.
3. Data value chain, Business models, Data ecosystem
The main data value-driven models are based on business analytics or data analytics methodologies, aimed to analyze, predict and control processes in business and industry [Coleman, 2016]. The main three subcategories of business analytics are: descriptive analytics (summarize, condense and aggregate data from complex data sets, using graphics and aggregated statistical metrics); predictive analytics (enable forecasts of future effects based on historical data, comprising statistical learning, machine learning, data mining and knowledge discovery from databases), and prescriptive analytics (transforming the results of descriptive analytics and predictive analytics into business decisions, based on optimization theory and operations research and quantitative tools) [Coleman, 2016]. It should be pointed out as well that a substantial pre-condition for any data based models and analytics is the good data quality [Baesens et al., 2014]. For these reasons, the data-value chain should include careful procedures and oversights to ensure high data quality through all data steps: (1) initial collection, (2) storage and updating, (3) retrieval, and (4) processing and preparation for analysis.
Investigating both research and practitioners’ literature on open data business models, Zeleti et al., (2016) identified 15 business models: Premium, Freemium, Open Source, Infrastructural Razor and Blades, Demand-Oriented Platform, Supply-Oriented Platform, Free as Branded, Advertising, White-Label Development Cost Avoidance, Sponsorship, Dual Licensing, Support and Services, Charging for Changes, Increasing Quality through Participation, and Supporting Primary Business. In summary, Zeleti et al., (2016) conclude that the main open data business models are Freemium, Premium, Cost Saving, Indirect Benefit and Parts of Tools. The main value proposition out of the open data can be Usefulness, Process Improvement, Performance and Customer Loyalty. Roman et al. (2017) analyze that databased business models depend on data suppliers, (from simple data supplier to service provider), data sources (whether the data is internal or external) and what is done with the data (ranging from providing data for reuse, analyzing and aggregating existing data or even providing services). The revenue model for the different strategies are mostly subscription based but can also entail “freemium”, pay-per-use or advertising. The more complex business models are also harder to execute, prompting open collaboration and co-creation [Roman, Liu, Nyberg, 2017]. Further, the authors determine that when an individual or organization is comfortable with data commercialization models they start to release more data and try to move on to more complex business models. Toots et al., (2017) find out that open data-driven service creation should be a process of value co-production, invoking collaboration between different stakeholders such as public administration, citizens and businesses. The authors propose to use open data for the co-production of new public services, or services leading to new pubic value, and their framework relies on the use of agile development practices in the creation of data-driven services.
The European data portal (EDP) Report 1 (2016) defines the following data-value chain processes and the main types of business users as follows:
• Data creation/Enablers: organizations, facilitating the supply or use of Open Data;
• Data aggregation/Aggregators: organizations that collect and aggregate open and proprietary data;
• Data analysis/Developers: organizations that design, build and sell web-mobile-apps based on data analysis;
• Data-based products and services/Data enricher: organizations that use Open data to enhance their products and services.
261
In the report of EDP (2016) among EU countries the data enrichers are among the most popular open data re-users (49,73%), and most of them work to improve company performance. Data aggregators (29,29%) works in new digital business blocks, and developers (18, 26%) are focused in customer touch points and new digital businesses. In the report from 2017, the EDP specifies further business cases for open data use and reuse and identifies more specific business models among open data end users. All four types of business models exploit open data in different ways to create value, for themselves, for their clients or for society. Thus, according to the EDP report (2017), the main revenue sources for OD businesses are: selling services (42%), selling products and services (21%) and selling products (10%). Most of the organizations, exploiting open data as resource are start-ups, and most of them are active in the information and communication sector. In this report, businesses can specify their activity as 1) Enhancing products, 2) Enhancing services, 3) Process optimization, 4) Data as a service, 5) Information as a service, 6) Answers as a service, 7) Development of web or mobile applications; or several of these. Thus the most popular Open data use is for internal process optimization, on the second place come organizations who facilitate access to and services on (aggregated) open data for others, on third place are organizations who offer (data analytical) products and services based on Open Data and finally come organizations who do not add financial value but create societal value. The main revenue streams are mainly coming from subscription fees, advertising, licensing, and consulting fees, lead generations and analytics fees (EDP, 2017). Confirming that, the statistics from 2016 (EDP, 2016) shows that open data in EU contribute mainly to performance management (internal, cost-savings), new digital businesses, developing new customer touch-points, improve customer understanding, company process digitization, top-line growth, digitally modified business and others. Open data re-use mainly helps companies to understand better the customer experience: for example, adapting marketing campaigns by geographic regions, making specific customer segmentations according to demographics, improve customer self-services and digital touch points and others. As most public administrations in general generate data about the environment, the legal system and the public safety, yet most of the data re-users are interested in the following sectors: government & public sector, economy & finance, transport and more particularly business registries and company data. The organizations re-using the Open Data work mainly in the IT sector, the public sector, financial and insurance services, as well in health, education & research, transportation, energy & utilities, culture & tourism and real estates.
3.1. Open data ecosystem
Open data can be provided both from public authorities and government structures or by third-level providers (as for example open scientific data, industry-specific data and others). Therefore, open data ecosystem can include both public and private providers, end-users and intermediary organizations. Based on the Open Data Consumer’s Checklist (Open Data Institute), a model of value-adding activities of both open data publisher and open data intermediary is proposed and presented on table 1.
Table 1: The role of the Data provider and Data intermediary for Open data value creation.
Data Provider Data Intermediary
Access Provide access Ensure data availability
Data format/enrich data use by API/
Ownership and licenses
Guarantee data origin Anonymize private data Appropriate license
Appropriate licenses for data re-use
Form
Provide data in machine-reading form, Quality meta-data Initial data processing
Summary, aggregated form, syntactic and semantic transformations; compatibility with
the other sets
Quality Current and frequently updated datasets; Long-term commitment
Ensure data accuracy Enrich data context Handle/recover missing data
Support
Data set documentation Meta-data analysis Support Reporting for errors
Supporting end-user Ensure feed-back; Good dataset documentation
Open data ecosystem can include different stakeholders, such as business organizations, public organizations, start-ups, universities, open spaces, public innovation labs, living labs, third level partners and others. In the whitepaper of Fraunhofer institute, Otto et al, (2016) highlight the role of Industrial data spaces that combine both industry (private) data, club data, and open data and promote the development of public connector that will orchestrate the data flows. The role of the public connector represents a third-level provider who can become as well a boundary organization that supports university-industry partnerships, involve various stakeholders, students, NGOs and public society organizations, organizes and hosts various events such as hackathons and competitions. In order that an Open data ecosystem is sustainable, the main success factors are publisher’ sustainability, governance, financing models, appropriate technical architecture and the use of metrics.
3.2. Open Data technical requirements and formats
The Open data technical requirements and standards aim to ensure its further re-use in machine-readable format. Open datasets can differ between: low frequency use datasets (<5%), mid frequency use datasets (5%-10%), high frequency use datasets (>10%).The high frequency domains are in line with the high priority domains identified by the European Commission: such as geospatial data, earth observation and environmental data, transport data, statistical data and selected company data. Some other technical data can be identified as well:
• Common open datasets structures: tabular, hierarchical and network data structures.
• Data types can vary, including specific examples of data types such as legislative, statistical and geographic data that can require special treatment.
• Common Open Data formats and standards are CSV, JSON, GeoJSON, KML, XML and RDF Turtle.
• The most popular machine-readable data formats are: CSV, XLM or XLS;
• Interoperability of Open Data portals and metadata is ensured by standards such as DCAT-AP.
3.3. Barriers for Open Data implementation
Among the main barriers, still hindering wider Open Data re-use as driver of Digital Transformation can be identified [Coleman, 2016, EDP, 2016]:
• Lack of awareness for OD initiatives; • Lack of knowledge and skills to use OD; • No clear governance and lack of responsible person
within an organization, as a company data manager; • Data quality: lack of capacity to combine open data with
internal data; • Lack of capacity for internal data management; • Lack of appropriate data license. • Big data architectures clearly represents an apparent
barrier for SMEs, both from a financial and cultural point of view [Coleman, 2016].
4. Open data in Bulgaria Bulgaria ranks among the EU trend setters for its Open data
adoption, as identified in Open data maturity report (EDP, 2017). The open data portal in Bulgaria is launched in November 2014
262
following the Directive 2013/37/EU of the European Parliament and European Council, amending Directive 2003/98/EC on the re-use of public sector information text with EEA relevance. The adoption of the new amendments of the EU Directive induced the amendments in the Bulgarian Law for public information access, along with other changes in the legal framework. With decision of the Council of Ministers in 2015 is approved a list with 119 datasets, and additional 149 data sets have to be made publicly available till the end of 2017. Currently 6983 datasets are available on the Bulgarian OD portal https://opendata.government.bg/ from 490 registered public data providers.
The Open data initiative in Bulgaria started in 2014 by a working group under the Council of Ministers’ administration [Gerunov, 2015]. On Bulgarian OD portal, datasets are freely available for commercial and non-commercial use. The Open data project is developed on the open-source CKAN platform (https://ckan.org/), supported by Open Knowledge Foundation. Citizens and data-users have additional possibility to send feedback, to request public data, to specify public data that should be available in machine-readable data and other.
Among the main barriers for Open Data re-use in Bulgaria, the EDPa (2017) report identified two main issues: the lack of awareness and technical barriers, such as the low quality of data sets and low synchronization of information in the databases. Technical obstacles exist to automatically upload and update data with administrations that maintain and collect the information. Data users in Bulgaria still perceive the quality of Open Data to be low [EDPa, 2017]. The low quality refers to both the data itself as well as the accompanying metadata, and the lack of standardization users to develop permanent solutions to re-use Open Data in their processes.
Conclusions The present research provides an overview of the main
mechanisms for open data value creation. Among the main recommendations for companies are to start their digital transformation by developing open data projects, focused on performance management, developing customer touch points or starting new databased digital business. As the availability of open data will increase both in Bulgaria, in EU and internationally, defining now a company open data value strategy can become a trigger for further digital transformation. Open data strategies can help companies to improve customer experiences, to facilitate adoption of Cyber-physical systems and to enhance data-driven decisions, providing complex models for data re-use from different sectors and application areas.
Acknowledgement The authors would like to acknowledge the support by the
Interreg DIGITRANS: Digital transformation in the Danube region - http://www.interreg-danube.eu/approved-projects/digitrans.
References Almada-Lobo, F. (2016). The Industry 4.0 revolution and the future of manufacturing execution systems (MES). Journal of Innovation Management, 3(4), 16-21. Baesens, B., Bapna, R., Marsden, J. R., Vanthienen, J., & Zhao, J. L. (2014). Transformational issues of big data and analytics in networked business. MIS quarterly, 38(2), 629-631. Carrara, W., Chan, W. S., Fische, S., & Steenbergen, E. V. (2015). Creating Value through Open Data: Study on the Impact of Re-use of Public Data Resources. European Commission. Country Factsheet for Bulgaria, European Data Portal, https://www.europeandataportal.eu/sites/default/files/country-factsheet_bulgaria.pdf Davies, T., & Perini, F. (2016). Researching the emerging impacts of open data: revisiting the ODDC conceptual framework. The Journal of Community Informatics, 12(2).
Dawes, S. S., Vidiasova, L., & Parkhimovich, O. (2016). Planning and designing open government data programs: An ecosystem approach. Government Information Quarterly, 33(1), 15-27. Digitizing European Industry EC portal, https://ec.europa.eu/digital-single-market/en/policies/digitising-european-industry EDP, 2016, Analytical Report 1: Digital Transformation and Open Data, available on https://www.europeandataportal.eu EDP, 2016, Open Data Goldbook for Data Holders and Data Managers, available on https://www.europeandataportal.eu/sites/default/files/goldbook.pdf EDP, 2017, Open Data Maturity in Europe, available on https://www.capgemini.com/wp-content/uploads/2017/11/report-open-data-maturity-in-europe-2017.pdf EDPa, 2017, Analytical Report 5: Open Data Barriers, available on https://www.europeandataportal.eu European Commission. 2011. “Open Data: An Engine for Innovation, Growth and Transparent Governance.” Brussels. http://eur-lex.europa.eu/LexUriServ/LexUriServ.do?uri=COM:2011:0882:FIN:EN:PDF. Gerunov, A., 2015, Open Data: Policy and Implementation in Bulgaria. Big Data, Knowledge and Control Systems Engineering, 1-11. Huijboom, N., & Van den Broek, T. (2011). Open data: an international comparison of strategies. European journal of ePractice, 12(1), 4-16. Open Data Handbook, Open Knowledge International, 2015, http://opendatahandbook.org/en/what-is-open-data/index.html Open Data Institute, Open Data Consumer Checklist, https://theodi.org/guides/the-open-data-consumers-checklist Otto, B., Juerjens, J., Schon J., Auer S., Menz N., Wenzel S., Cirullis J., (2016), Industrial Data Spaces, Fraunhofer Institute whitepaper available on: https://www.fraunhofer.de/content/dam/zv/en/fields-of-research/industrial-data-space/whitepaper-industrial-data-space-eng.pdf Roman, M., Liu, J., & Nyberg, T. UNIVERSITY-INDUSTRY COLLABORATION THROUGH BIG DATA AND OPEN SCIENCE. ICEIRD conference proceedings, 31 Aug–1 Sept 2017, 371. Saldivar, A. A. F., Li, Y., Chen, W. N., Zhan, Z. H., Zhang, J., & Chen, L. Y. (2015, September). Industry 4.0 with cyber-physical integration: A design and manufacture perspective. In Automation and computing (icac), 2015 21st international conference on (pp. 1-6). IEEE. Sebastian, I. M., Ross, J. W., Beath, C., Mocker, M., Moloney, K. G., & Fonstad, N. O. (2017). How Big Old Companies Navigate Digital Transformation. MIS Quarterly Executive. Sommer, L. (2015). Industrial revolution-industry 4.0: Are German manufacturing SMEs the first victims of this revolution? Journal of Industrial Engineering and Management, 8(5), 1512. Toots, M., McBride, K., Kalvet, T., Krimmer, R., Tambouris, E., Panopoulou, E., ... & Tarabanis, K. (2017, September). A Framework for Data-Driven Public Service Co-Production. In International Conference on Electronic Government (pp. 264-275). Springer, Cham. Welle Donker, F., & van Loenen, B. (2017). How to assess the success of the open data ecosystem? International Journal of Digital Earth, 10(3), 284-306. Ylijoki, O., & Porras, J. (2016). Perspectives to definition of big data: a mapping study and discussion. Journal of Innovation Management, 4(1), 69-91. Zeleti, F. A., Ojo, A., & Curry, E. (2016). Exploring the economic value of open government data. Government Information Quarterly, 33(3), 535-551.
Abstract: The paper considers the concept development of balanced scorecard for the distribution logistics. The main criteria for evaluation of the warehouse processes are examined. The paper presents the implementation of balanced scorecard as a tool for logistics processes and costs monitoring and management decisions in the Amer Sports Ltd Winter Sports Equipment distribution center.
1. Въведение Способността да се измерва ефективността на процесите
може да се разглежда като важна предпоставка за тяхното подобряване, а през последните години компаниите са увеличили възможностите на своите системи за оценка на резултатите (PMSs performance measurement systems) [4]. Измерването на резултатите (PM) в контекста на веригата за доставки става все по-важно. Причината е очевидна: фирмите започват да търсят начини за подобряване на оперативната ефективност чрез по-добро интегриране на операциите на последователни ешалони и отделни функции в веригата на добавена стойност [9].
Един от основните елементи във веригата на доставките е дистрибуционната логистика. Дистрибуционнатта логистика може да бъде представена като свързващо звено между производството и пазарите на предприятието. Тя обхваща всички складови и транспортни стъпки на стоките до клиента [10]. Нейната основна задача е да осигури необходимия продукт в точното време на правилното място в необходимото количество и желано качество и в същото време да намери оптималния баланс между дефинираното качество на доставката, което си е поставило предприятието или е изискано от клиента, и разходите свързани с изпълнението на доставката. Задачата на диструбуционната логистика може да бъде обобщена като оптимално обслужване на избрани диструционни канали [14].
Едни от основните проблеми за решаване в дистрибуционната логистика са [13]:
• избор на място за изграждане на дистрибуционен център;
• складиране и съхранение на продукцията; • изпълнение на поръчката; • комисиониране и опаковане; • товарене и обезопасяване на товара; • транспортиране. 1.1. Описание на задача за решаване в дистрибуционната логистика за зимни спортни стоки в Амер Спортс АД. Обект на разглеждане са зимните спортни продукти на
Амер Спортс АД. Компанията е създадена през 1950 г. и има дълга история в производството и пласмента на потребителски стоки. В края на 80-те години на XX-ти век компанията решава да се специализира изцяло в индустрията за спортни стоки. Първата спортна фирма бива придобита през 1989 г., а в
следващите 26 години са закупени още 10 други спортни фирми.
Към момента на изследването в портфолиото на Амер Спортс са следните компании: Arc’teryx, Armada skis, Atomic, DeMarini, ENVE Composites, Louisville Slugger, Mavic, Precor, Salomon, Suunto и Wilson.
Холдинговата структура е организирана в бизнес звена с хармонизирани финансови репорти и интегрирани бизнес процеси. Разглежданите зимни спортни стоки са продуктите на фирма Atomic, както и всички продукти свързани със зимни спортове на фирма Salomon
През 2010 год. компанията взима решение за прилагане на централизирана дистрибуционна политика за всички зимни спортни стоки. Продуктите, складирани дотогава в две складови бази в Австрия и Франция, биват консолидирани в съществуващата складова база в провинция Залцбург, Австрия и по този начин последната се превръща в централен дистрибуционен център. От този дистрибуционен център се извършват директни доставки до клиентите в цяла Европа, а също така до значителна част от клиентите в САЩ, Канада, Русия и Япония. Характерна за зимния спортен бизнес е високата сезонност в силна зависимост от метериологичните условия и снежната покривка, които на свой ред определят потребителското търсене. В спортната индустрия е характерно съществуването на два вида клиентски поръчки – основни и допълнителни. Основните поръчки се правят от клиента 4-6 месеца преди желаната дата за доставка, а допълнителните поръчки по време на сезона. Поради високата несигурност на потреблението, очакваното време за изпълнение на допълнителните поръчки е в рамките на 48 до 72 часа. Това време се измерва от времето на подаване на поръчката в системата до доставката при клиента. Удовлетворяването на това клиентско изискване предполага много високи нива на ефективност на логистичните процеси, тъй като времето за изпълнените на поръчката (приемане, обработка и проверка на поръчката), комисиониране, опаковане и транспорт е максимално 72 часа за цяла Европа. Важно е да се отбележи, че конкурентите на Амер Спортс АД в областта на зимните спортни стоки имат различна дистрибуционни стратегии,а също така разполагат и с регионални дистрибуционни центрове за дадени региони в Европа (напр. за Южна или Северна Европа). Това, наред с високите клиентски очаквания и наличието на централизираната дистрибуционна стратегия на Амер Спортс АД, придава още по-високо значение на дистрибуционната логистиката за запазване конкуретността на компанията.
Трудността при консолидирането на зимните спортни стоки в дистрибуционния център в Австрия се състоеше в
264
едновременното изпълнение на гореспоменатите вътрешно фирмени и клиентски изисквания:
• внедряване на зимните спортни стоки на фирма Salomon
• извършване на директни доставки за клиентите в САЩ и Канада
• намаляваане на времето за изпълнение на доставките в Европа.
Всички тези промени в изискванията към дистрибуционната логистика предизвикват съществени промени в процесите, разходите и необходимата квалификация на служителите в складовото стопанство. С цел по-добър мониторинг на процесите и разходите и подобряване на информацията за взимане на управленски решения, мениджмънта на логистиката взе решение за внедряване на балансирана карта от показатели за оценка на резултатите в складовото стопанство.
Целта на статията е да представи ключовите аспекти при разработването и използването на балансираната карта за оценка на резултатите като инструмент за стимулиране на промените в организацията.
Задачите, които си поставя авторът, са следните:
• Да се разгледат същността, характеристиките и елементите на балансираната карта за оценка на резултатите
• Да се разгледат известни методи за контролинг в логистиката
• да се разгледа и анализира прилагането на балансираната карта за оценка на резултатите в дистрибуционната логистика
• Ще бъде разгледано и анализирано приложението на балансираната карта за оценка на резултатите в складовото стопанство за зимни спортни стоки на Амер Спортс АД
2. Концепция на балансираната карта за оценка на резултатите
В края на 80-те години много учени изразяват загриженост от традиционните мерки за ефективност, насочени единствено към финансовите показатели. Научните изследователи критикуват тези мерки, тъй като според тях те насърчават мениджърите да се съсредоточат върху краткосрочните финансови резултати, като същевременно пренебрегват дългосрочните перспективи [6]. В началото на 90-те години на ХХ век Каплан и Нортън разработват балансирана система от финансови и нефинансови индикатори, като структурират резултатите от дейността в четири направления (перспективи).Тази балансирана система от показатели запазва финансовите показатели като основни показатели за оценка на успеха на компанията, но ги допълва с показатели от три допълнителни перспективи (клиент, вътрешен процес и обучение и развитие). Целта на тези допилнителни направления (переспективи) е създаването на дългосрочна стойност на акционерите (shareholder value) [8]. По своята същност балансираната карта за оценка на резултатите (Balanced Scorecard – BSC) представлява комплексна програма за промяна, посредством която е възможно да се изменя практически всеки аспект на организацията. Самото наименование (score) акцентира върху необходимостта от аранжиране с оглед осигуряването на равновесие между важните параметри на дейността на организацията в процеса на управление на промените в нея. Едни от първите приложения на балансираната карта са насочени към обогатяване на средствата за отчетност в качеството им на управленски „панели от индикатори” (dashboard). [1].
Широко разпространено е схващането за оценка на резултатите като инструмент за контрол и за оценка на
извършените дейности. Оценката на резултатите чрез балансирана карта трябва да се използва по различен начин – да изразява стратегията на организацията, да разпространява стратегията и да подпомагат свързването на индивидуалните, фирмените и междуведомствените инициативи и дейности с цел постигане на общи цели. Използвана по този начин, балансираната карта за оценка на резултатите трябва да се разглежда като инструмент за комуникация, информация и развитие, а не като система за контролинг (оценяване). Четирите направления (переспективи) на картата за оценка позволяват баланс между краткосрочните и дългосрочните цели на организацията, между обективните и субективните резултати, както и между желаните резултати и факторите оказващи въздействие върху тях. Макар многочислеността и разновидността на показатели да изглеждат объркващо, една добре конструирана карта от показатели съдържа единство във своята целенасоченост, тъй като всички показатели целят постигането на интегрирана стратегия [7].
Фигура 1: Балансирана карта за оценка на резултатите според
Каплан и Нортън [1]
3. Контролинг в логистиката и адаптиране на балансираната карта за оценка на резултатите
Високата комлекстност на логистичните системи и нарасналите производствени и клиентски изисквания към тях засилват нуждата от целенасочено планиране, управление, контрол и координация на различните отрасли в логистиката [12]. С тези задачи се занимава контролинга в логистиката, чиято цел е [11]:
• постоянния контрол на икономическата ефективност (разходи, производителност и др.) чрез сравняване на планираните и действителните показатели;
• набавяне, обработка и предоставяне на информация за взимане на управленски решения.
Чрез изграждането на една изчерпателна система за отчитане на разходите и производителността и една система от показатели за оценка на резултатите, се стреми възможно най- силната и актулана обработка на логистичните дейности [13]. С внедряването на логистична система от показатели за оценка се цели решаването на следните проблеми [5]:
• оптимално решаване на противоречиви цели; • еднозначно (ясно) дефиниране на цели за логистиката
и нейните подотрасли; • ранно разпознаване на отклонения, възможности и
рискове;
265
• систематично търсене на проблемните места и причините за тях;
• развитие на потенциала за рационализация; • точно дефинирано оценяване на резултатите; • оценяване на служителите според резултатите; • непрекъсната помощ при изпълнение на рутинни
логистични задачи.
Препоръчително е управлението чрез показатели за оценка на резултатите да се извършва чрез балансирана карта за оценка пригодена към изискванията и нуждите на логистиката. На таблица 1 е показано адаптирането на балансираната карта за оценка за нуждите на логистиката.
Направления на балансираната карта за оценки
Стратегическа задача
Показатели
Финанси Намаляване на разходите
- Разходи за попълване на единица количество - Административни разходи за обработка на поръчка - Разходи за доставка за единица количество - Разходи за логистика спрямо прихода
Намаляване на капитала обвързан с текущите активи
- Размер на текущите активи за продукт в края на месеца - Складови запаси - Обращаемост
Потребители Повишаване на клиентската удовлетвореност
- Индекс на удовлетвореност - Дял на оплаквнията
Повишаване на пазарния дял в определен пазарен сегмент
- Пазарен дял в пазарния сегмент
Повишаване на рентабилността на клиентите
- Логистични разходи за клиент
Повишаване на гъвкавостта на доставките
- Продължителност на периода за фиксиране на поръчката за продажба
Процеси Намаляване на отклоненията спрямо договорения капацитет за доставки
- Точност на извършване на доставката - Процент налични непоръчани продукти - Брой рекламации
Повишаване на надежността на доставките
- Надежност на доставките
Намаляване времето за изпълнение на поръчките
- Средно време за изпълнение на поръчката - Средно време за обработка на рекламация
Повишаване прозрачността на разходите
- Дял на логистичните процесите с отчетни разходни параметри съспоставен с общия брой логистични процеси
Повишаване прозрачността на производителността
- Дял на логистичните процесите със систематично събиране на данните за производителност съспоставен с общия брой логистични
процеси
Повишаване на възможността за даване на информация на клиента
- Дял на възможността за даване на информация при първия контакт с клиента
Обучение и развитие
Развитие на иновативни услуги за клиента
- Дял на логистичните услуги въведени не по-късно от 2 години
Насърчаване на мисленето на служителите относно процесите
- Дял на служителите с опит в различните подзвена на логистиката
Повишаване на удевлетвореността на служителите
- Индекс на удовлетвореност - Отпуск по болест - Процент на текучество
Таблица 1: Извеждане на показатели за логистиката на база балансирана карта за оценка [3]
За нуждите на складовото стопанство е предложено четирите направления на балансираната карта за оценка и стратегическите задачи за решаване да бъдат подпомогнати със средства от логистичния контролинг. Вследствие на това, една балансирана карта за оценка на складовото стопанство трябва да съдържа следните четири направления: структура, разходи, производителност и качество [2]. Показателите в четирите направления трябва да предоставят следната информация [13]:
• направление структура - производствения капацитет и структура, брой на служителите и техническите средства, както и разходите за разглеждания период;
• направление разходи – определяне логистичните дейности и свързаните с тях разходи;
• направление производителност - производителност на служителите и на техническите средства;
• направление качество – оценяване на нивото на осъществяване на поставените цели.
4. Внедряване на балансирана карта за оценка на резултатите в складовото стопанство на Амер Спортс АД
С цел подобряване на мониторинга на процесите в складовото стопанство, идентифициране на потенциалните проблеми и възможности за подобрение, бе взето решение да се внедри балансираната карта за оценка като инструмент за увравление и комуникация в дистрибуционния център за зимни спортни стоки на Амер Спортс АД. Таблица 2 представя структурната рамка на внедрената балансирана карта за оценка с част от изпозваните показатели.
Таблица 2: Структурна рамка на балансиранта карта за оценка в дистрибуционния център за зимни спортни стоки на Амер Спортс АД
266
Разработената балансирана карта за оценка съдържа не само четирите адаптирани за нуждата на логистиката направления, но и изведените стратегически задачи, разгледани в предния раздел. В допълнение към това направленията и стратегическите задачи се прилагат не върху складовото стопанство като цяло, а във всяко едно негово звено. Операциите в разглеждания дистрибуционен център са разделени в следните звена: приемане на стока, съхранение на продукцията, комплектоване на партидата, монтаж и сервиз, опаковане, спедиция и транспорт. Прилагайки подходът на балансираната карта за оценка на най-ниското структурно ниво, се цели осигуряването на изчерпателна информация за процесите и свързаните с тях дейности.
Внедряването на тази концепция се извърши чрез изграждането на база данни и разработването на „панели от индикатори” (dashboard). По този начин се цели удовлетворяването на следните задачи:
• осигураване на логистични данни за детайлни анализи; • осигряване на управленски инструмент за следене
дейностите, разходите и отклоненията; • осигуряване на комуникационен инструмент насочен
към служителите на логистиката и тези на компанията.
На фиг. 2 е показана снимка на панели от индикатори, на внедрената балансирана карта за оценки, където:
• натовареността и комлексността на дейностите (workload/camplexity) следи всяко едно от звената в складовото стопанство (Приемане на стоката (Inbound), Комлектоване на партидите (Picking), Монтаж и Сервиз (Service), Опаковане (Packing) и Спедиция (Outbound);
• Съхранение в склада (Inventory); • Структура на платените работните часово (Working Hour
Structure) – производителни, непроизводителни, болнични за всяко едно звено;
• Производителност (Productivity); • Структура на разходите (Cost Structure) – фиксирани и
променливи разходи; • Безопастност на труда (Safety); • Транспорт и удевлетвореност на клиента (Logistics
Service).
Панелът от индикатори представя детайлирана информация на месечна основа и предлага възможност за сравнение между различни календарни години. По този начин се стреми не само компактно предоставяне на информацията, но и лесен сравнителен анализ за настъпилите промени. Поради специфичната сезонност на зимните спортни стоки в рамките само на един сезон в годината, предоставянето на данните на месечна и годишна база е достатъчна за практическите нужди и гореспоменатите цели на управлението на дистрибуционния център.
Фигура 2: Снимка на внедрената балансирана карта за оценка на
резултатите в дистрибуционния център за симни спортни стоки на Амер Спортс АД.
С внедряването на балансираната карта за оценки са постигнати следните резултати:
• повишена прозрачност на промените в логистичните процеси вследствие на фирмени решения за производство или пласмент на продукцията;
• висока прозрачността на производителността; • увеличена прозрачност на разходите във всяко едно
звено на складовото стопанство; • подобряване на вътрешнофримената комуникация; • повишено внимание върху удовлетвореността на
клиентите; • подобряване на анализа за обучение и развитие на
служителите; • усъвършенстване на информацията за взимане на
управленски решения.
5. Заключение 1. Описани са ролята и изискванията на складовото
стопанство в дистрибуционната логистика на Амер Спотс АД.
2. Представени са същността, характеристиките и елементите на балансираната карта за оценка на резултатите.
3. Определени са изискванията на контролинга в логистиката.
4. Анализирано е прилагането на балансираната карта за оценка на резултатите в логистика.
5. Разгледано и анализирано е приложението на балансираната карта за оценка на резултатите в складовото стопанство за зимни спортни стоки на Амер Спортс АД.
Разглежданото приложение на балансираната карта за оценка на резултатите в складовото стопанство е специфично за нуждите на логистиката на зимни спортни стоки. Въпреки това, преложената концепция може да бъде лесно адаптирана за нуждите на всяко едно складово стопанство във всеки един индустриален отрасъл.
Литература: 1. Кузманова, M., Балансираната карта за оценка на резултатите –
гъвкав инструмент за стимулиране на промените в организацията, Икономически алтернативи, брой 6, 2007.
2. Augustin H., Lean Warehousing, HUSS-Verlag, München, 2010. 3. Engelke, M., Rausch, A., Supply Chain Management mit Hilfe von
5. Grochla, E., Fieten R., Puhlmann M., Erfolgsorientierte Materialwirtschaft durch Kennzahlen. Leitfaden zur Steuerung und Analyse der Materialwirtschaft, Baden-Baden, 1983.
6. Hoque, Z., 20 years of studies on the balanced scorecard: Trends, accomplishments, gaps and opportunities for future research, The British Accounting Review 46 (2014) 33–59.
7. Kaplan, R. S., & Norton, D. P., The balanced scorecard: Translating strategy into action. Boston, MA: Harvard Business Press, 1996.
8. Kaplan R.S., Conceptual Foundations of the Balanced Scorecard, Handbooks of Management Accounting Research, Volume 3, 2009, Pages 1253-1269.
9. Lohman C., Fortuin L., Wouters M., Designing a performance measurement system: A case study, European Journal of Operational Research 156 (2004) 267–286.
10. Pfohl, H.-C.: Marketing – Logistik; Mainz, 1972. 11. Reichmann, Th., Controlling mit Kennzahlen, München 1985. 12. Reichmann, Th., Logistik-Verfahren nach dem besten Kosten-
Leistung-Verhältnis wählen, in: Handelsblatt, Nr.141, 28 Juli 1987, S. 15.
13. Schulte, C. Logistik, Wege zur Optimierung der Supply Chain. Verlag Franz Vahlen München, 2013.
14. Traumann, P.: Marketing – Logistik in der Praxis, Main 1976.
267
АВТОМАТИЗАЦИЯ НА ЛОГИСТИЧНА БАЗА ЗА ЗИМНИ СПОРТНИ СТОКИ
AUTOMATION OF DISTRIBUTION CENTER FOR WINTER SPORTS EQUIPMENT PRODUCTS
M.Eng,M.Sc. Valchkov L.1, Chief Assist.Prof.Dr.Eng. Nina Valchkova N.2, Dr.Eng. Georgiev G.2 Atomic Austria GmbH, Austria - Distribution Center Manager Winter Sports Equipment1
Faculty of Mechanical Engineering, Technical University of Sofia, Bulgaria – PhD. Student1
Abstract: The paper considers the automation of the intralogistics transports in the distribution center for winter sports equipment products of Amer Sports Ltd. The material flow in the warehouse is divided in two circles: the first one is for sorting based on predefined criteria and put away in the manual and automated high racks and the second one is for automated transport from the high racks to the picking area. The automation allows increase of distribution center capacity and productivity and optimization of costs at the same time.
1. Въведение Разглежданата логистична база е специализирана в
дистрибуцията на зимни спортни стоки, включващи три продуктови фамилии: алпийски продукти, продукти за ски бягане и сноуборд. Всяка една от тези продуктови фамилии съдържa продуктови групи, с които се предлага пълния асартимент от съответната ски екипировка. Така например продуктовата фамилия алпийски продукти съдържа следните продуктови групи: ски, ски автомати, ски обувки, каски, протектори, ски очила, щеки и аксесоари. За зимните спортни стоки е характерна висока сезонност като в годината има един сезон – за доставките на стоки „пикът“ на сезона е през летните месеци, а за извършване на клиентските доставки - месеците септември и октомври. Тази висока сезонност изисква висок брой сезонен персонал, чиято квалификация и производителност не винаги отговарят на високите стандарти на фирмата. За достигане на тези стандарти е необходимо сезонните работници да бъдат обучаване на специфичните процеси, което на практика отнема около три седмици. Поради тази причина се налага дейностите в складовата база да бъдат автоматизирани, с цел повишаване на тяхното качество и производителност.
За решаване на поставената цел са разработени различни варианти. Целта на статията е да представи един от тези варианти за автоматизация на вътрешноскладовия транспорт в логистичната база за зимни спортни стоки на Амер Спортс АД, който удовлетворява изискванията на фирмената политика относно бюджет и възвръщаемост на инвестицията.
2. Състояние на складовата база Логистичната база е разделена на пет звена: приемане на
стока, зона за съхранение на продукцията, зона за комисиониране и комплектоване на партидите, опаковане и спедиция.
Специфични особености на зоните са: - Зоната за приемане на стока разполага освен с товарни
рампи и с топла връзка, която я свързва с производствената база. Тя е на едно ниво с производствената база, но на ниво +2.40 m спрямо останалата част от складовото стопанство. Транспортирането на товарните единици (ТЕ) от зоната за прием на стока до зоната за предаване на транспортните единици за складиране и съхранение се извършва с товарни асансьори.
- Зоната за съхранение на продукцията се състои от четири високостелажни склада. Три от тях се обслужват от електрокари, а четвъртият е автоматизиран и се обслужва от трансманипулатор.
- Зоната за комисиониране и окомплектоване е на две нива. На ниво +1 се извършва комисионирането, а на партерната зона окомплектоването на партидите.
Другите две зони, опаковане и спедиция, нямат специфични особености, които да оказват влияние на автоматизацията на транспорта.
Основните технически средства за придвижване на транспортните единици са европейска пулова палета, каса палета с мрежещи стени и с основа европейска пулова палета и специализирана ролпалета. Две ролпалети имат размера на една европейска пулова палета. Каса палетата с мрежещи стени и основа европейска пулова палета и специализираната ролпалета се използват за транспорт на ски, които са поставят вертикално в техническите средсва за придвижване.
За нуждите на логистичните процеси на всяко едно техническо средство за придвижване бива поставен едикет с баркод при приемането му в дистрибуционния център. По този начин се осигурява следната информация в системата за управление на складовите процеси:
- какви продукти и колко единици се намират на техническите средсва за придвижване;
- до кое място за съхренение трябва да бъде транспортирано техническото средсво за придвижване;
- в процеса на комисиониране се предоставя информация колко единици продукти са останали на техническото средсво за придвижване;
- при комисиониране на всички продуктови единици системата за управление подава информация към оператора за транспортиране на техническото средство за придвижване към буферната зона за съхранение на празни пулови палети и ролпалети.
Продуктите са класифицирани на база „АBC“ анализ и организацията на потоците на техническите средсва за придвижване на транспортните единици е, както следва:
- Заскладяване на стока: техническите средства за предвижване с А-продукти се транспортират за складиране в автоматизирания високо стелажен склад. Техническите средсва за предвижване с B- и C-продукти се транспортират за складиране във високо стелажните складове обслужвани с електрокари.
- Изваждане на стока за клиентски поръчки: А-продукти се транспортират от автоматизирания високостелажен склад до зоната за комисиониране и в тази зона биват комисонирани и транспортирани на ролпалети до зоната за окомплектоване. B- и C-продуктите биват комисионирани от местата за съхранение и транспортирани на ролпалети до зоната за окомплектоване.
- Окомплектованата клиентска партида се транспортира от зоната за окомплектоване в зоната за опаковане, а от там в зоната за спедиция.
- Празните технически средсва се транспортират в буферната зона за съхранение на празни пулови палети и
268
ролпалети, находяща се в зоната за окомплектоване. От там ролпалетите се транспортират в зоната за приемане на стока, където се предават на производството, а пуловите палети в зона за съхранение извън сградата на складовото стопанство.
От описанието на процеса е видно, че съществуващата организация на потоците е ясно дефинирана и всяка една операция е управлявана от информационната система за управление на складовото стопанство. Въпреки това, поради специфичните особености на складовото стопанство, процесите изискват сравнително висок персонален ресурс.
3. Избор на транспортьор При избора на типа транспортьор сме се съобразили със
специфичните особености на техническите средсва за придвижване на транспортните единици, а именно: европейска пулова палета, каса палета с мрежещи стени и основа европейска пулова палета и специализирана ролпалета. Поради наличието на колела на ролпалетата, не може да се използват ролкови транспортьори [1,2]. Най-практичното решение е използването на верижни транспортьори. Голямото разнообразие от конструктивни решения на верижни транспортьори позволява да се намери решение за използването на този тип транспортьори при автоматизацията на вътрешноскладовия транспорт в логистичната база за зимни спортни стоки на Амер Спортс АД.
За теглителен елемент при тях се използват вериги, които напълно удовлетворяват изискванията от разновидности на различните товари, както и технологичните изисквания към съоръжението. Характерно за верижните транспортьори е напречното транспортиране на пуловите палети. При тежки товари обичайната скоростта на придвижване е 0,2 m/s, а при по-леки товари – 0,1 m/s [3].
Верижните транспортьори са едни от най-широко разпространените машини за непрекъснат транспорт [1]. Характерно за верижните транспортьори е, че при тях теглещият орган (верига) не може да пробуксува и предаването на двигателната сила е винаги осигурено. Затова процеса на автоматизацията на верижните транспортьори е надежден, стига да се провежда изискуемият периодичен контрол и обслужване относно изправността на отделните ставни елементи на веригата.
3. Автоматизация на складовата база На фиг.1 е представено разположението на зоните в
складовото стопанство: приемане на стока (1), зона за съхранение на продукцията (2), зона за комисиониране и комплектоване на партидите (3) и опаковане (4). Зоната за спедиция не е показана на фиг.1, тъй като тя не е предвидена да бъде обслужвана от транспортьора.
Фиг. 1 Зоните в логистичната база на Амер Спортс АД, които
обслужва транспортьорът.
За да бъде удовлетворено изискването за висока производителност, са проектирани две успоредни транспортни линии. Едната се използва за транспорт на пълните палети и ролпалети, а другата връща обратно в зоната за приемане на стока празни ролпалети за повторното им използване. И двата верижни транспортьори имат дължина 6000 mm, широчина 900 mm и скорост - 0,3 m/s. Всеки транспортьор е с по три броя вериги, тъй като специализираните ролпалети са с два пъти по-малки габарити от европейската пулова палета. Двупосочният верижен транспортьор е проектиран с четири отделни секции, всяка с дължина от 1500 mm. Всяка секция е снабдена със сензор, който забранява движението в случай на натоварване на предходната секция, но работата на следващата секция продължава. По този начин всяка една от секциите на верижния транспортьор може да се използва като буфер. Транспортьорът се конструира на носеща профилна конструкция при височина 3 метра от земята, защото зоната за приемане на стока, както бе отбелязано по-горе, е на ниво +2.40 m спрямо складовата база. Страничните вериги се използват за водене на товара, а за гарантиране безопасната работа на персонала в складовата база е инсталирана защитна ограда.
Фиг.2 Поставяне на товара върху верижния транспортьор. На фиг.2 е показан вертикалният асансьор, върху който
товарът (европейска пулова палета или две ролпалети с допустима товароносимост на всяка до 600 kg) се полагат с електрокар. Натоварването се проследява от интегрирана сензорна система за оценка на качеството на позициониране на палетите. След като завърши настройката на товара, операторът натиска бутон и асансьорът премества товара до верижния транспортьор. Асансьорът има хоризонтален транспортьор, който придвижва товара върху веригата на основния транспортьор. Всеки от асансьорите има ход на височина от 0.6 m и може да прави по 142 повдигания в час. Активирането на зелената сигнална лампа показва, че товарът е поставен на транспортьора и е "готов за употреба", след което асансьорът се спуска към стартовата позиция.
3
1
2 4
269
Фиг.3 Връщане на една празна ролпалета. На фиг.3 е илюстрирано връщането на празна ролпалета към производствената база. Събирането и връщането на специализираните ролпалети от зонота на опаковане следва да осигури ритмичност на процеса на автоматизиране в другите три зони - за приемане на стока, зоната за съхранение на продукцията и зоната за комисиониране и окомплектоване.
Тъй като верижният транспортьор е проектиран в близост до стената на складовото помещение, с което се осигурява безопасна работа на персонала в зоните за комисиониране и опаковане, се налага да се използва ротационна станция за обръщане на 90 градуса (фиг.4). Благодарение на ротацията, европалетата винаги се движи напречно на веригите на транспортьора.
Фиг.4 Ротационна станция на 90 градуса.
Доставянето на продукцията в зоната за комисиониране и опаковане и процеса на връщане на празните палети и ролпалети са показани на фиг.5. Верижният транспортьор разположен до стената обслужва връщащите се ролпалети, които посредством асансьор, аналогичен на този за зареждане, се повдигат до транспортната линия движеща се към зоната за приемане на стока. Голяма портална врата между зоните за комисиониране и опаковане осигурява събирането на празните ролпалети от зоната за опаковане и поставянето им на платформата на асансьора на транспортьора с цел връщането им към зоната за приемане на стока.
Фиг.5 Асансьор на транспортьора,
връщащ празните ролпалети. Напречното прехвърляне между главния транспортьор и
асансьорът се изпълнява съвместно с устройството за кръстосано прехвърляне (фиг.6). То включва превозвач, който работи с верига или синхронен ремък и позволяващ евро палетите и ролпалетите да се преместват между паралелните транспортьори напречно на посоката на движение. По този начин се осигурява танспортирането на продуктите необходими за клиентските поръчки към зоната за комисиониране (ниво +1) и зоната за окомплектоване (партерно ниво).
Фиг.6 Кръстосана предавателна станция.
Между устройството за кръстосано прехвърляне и асансьора в зоната за опаковане има буферна зона, която позволява стоката да изчака разтоварването без да се налага спиране от страна на основния транспортьор.
Така стоката поставена на основния транспортьор продължава към зоната за съхранение, която се състои от четири високостелажни складове. Както бе уточнено по-горе, три от тях се обслужват от електрокари, а четвъртият е автоматизиран и се обслужва от трансманипулатор.
Фиг.7 Буферна зона и асансьор в зоната за съхранение.
Всеки участък от транспортната система завършва с асансьор, който се спуска до пода за ръчно зареждане или поставяне на пода. Пред всеки асансьор в транспортната система е проектиран позиционен буфер (фиг.7).
Асансьорът разположен в близост до входа на автоматичната складова система в допълнение към вертикалния транспорт осигурява хоризонталното подаване към и от входа на автоматизираната складова система.
Транспортната система обслужваща заскладяването на готовата продукция има двойна функция:
- транспортиране на пълните палети и ролпалети от зоната за приемане до високостелажните складове
- транспортиране на пълните палети и ролпалети от зоната за съхранение до зоната за комисиониране.
Транспортната система е разделена на два участъка. До кръстосаната предавателна станция палетите и ролпалетите се транспортират в една посока (от зоната за приемане на стока към зоната за съхранение), а от кръстосаната предавателна станция до зоната за съхранение и в двете посоки. Палетите и ролпалетите, които трябва да се транспортират от зоната за съхранение до зоната за комисиониране биват транспортирани с приоритет, с цел осигуряване на непрекъснатостта на изпълнение на клиентските поръчки. Процесът на извеждане на техническите средства за придвижване на транспортните единици от автоматизирания високостелажен склад е напълно автоматизиран. По този начин първата част на транспортната система се явява и буферна зона за приходящата продукция.
Системата за управление е базирана на контролер тип Modicon M340 PLC от фирмата Schneider с командни устройства за функцията "Distributed IO". Използва се като комуникационна магистрала мрежа MODBUS. За конвертиране на сигналите към мрежата MODBUS се използват
270
преобразуватели на сигнали към Ethernet протокол. Работата на транспортьора спира, когато в съседната секция товарът се задържи. Командите се генерират на основата на получавани сигнали от фотосензори за присъствие на товар. Отделно във всеки кръстопът има четци за баркод. Навигацията за текущото натоварване се извършва чрез изпращане на цифров сигнал от съответния четец на баркод към контролера PLC, след което постъпва сигнал в персонален компютър за визуализиране в реално време на функциите на транспортната система.
Целта на транспортирането на съответен товар е зададена в началото на линията и контролът се изпълнява на кръстовищата, оборудвани с четци за баркодове. Глобалните задачи свързани с посоката на движение се задават от същата компютърна станция. При поискване от страна на оператор се реализира графична визуализация на местоположението за конкретен товарен превоз.
Автоматизацията на вътрешно-складовия транспорт изисква допълнително осигуряването на по-добър баланс на тежестта на техническите средства за придвижване на транспортните единици в сравнение с обслужване от електрокари. Това изискване е особено критично за ролпалетите, тъй като тяхната основа е по-малка от тази на пуловата палета, а товарът върху тях достига височина до 2.20 m. Важно е да се отбележи, че равномерното разпределение на продуктовите единици трябва да се извършва от производствения център още преди предаването им в логистичната база. Тази особеност допълнително изисква висока вътрешноведомствена координация.
4.Заключение В статията е представено едно от решенията за
автоматизация на вътрешноскладовия транспорт в логистичната база за зимни спортни стоки на Амер Спортс АД. При направения анализ се предлага решение за използване на верижен транспортьор, който осигурява надеждно и нискостойностно транспортиране на основните технически средсва за предвижване на транспортните единици от зона за приемане на стоката до зона за съхранение, както и от зона за съхранение до зона за комисиониране. Това ще доведе до повишаване на производителността, намаляване на разходите за персонал и намаляване на броя електрокари в логистичната база. Същевременно автоматизацията на вътрешноскладовия транспорт в логистичната база поставя по-високи изисквания към квалификацията на служителите. Изчислената възвращаемост на инвестицията е 2,7 години, което доказва нейната целесъобразност.
Литература 1. Дивизиев, В., И.Коларов, М.Проданов, П.Караиванов,
Подемно-тронспортни машини и системи, Издателство Техника, София, 1993
2. Спасов В., Инженерна логистика – Подемно-транспортни машини, процеси и системи, Издателство Техника, София, 2012
3. ten Hompel, M., Schmid, T., Nagel, L. Materialflusssysteme. Springer-Verlag, Berlin, Heidelberg 2007
271
PARTICIPATORY SYSTEMS – A PARADIGM SHIFT TO ANSWER THE CHALLENGES OF AN INTEGRATED WORLD
M.Sc. Jánoky L. V.1 PhD. Ekler P.1
Department of Automation and Applied Informatics – Budapest University of Technology and Economics, Hungary 1
Abstract: The increasing integration of technology and everyday life creates a new set of challenges in multiple fields. The fully connected world, in which virtual and physical layers interact seamlessly is a goal envisioned and pursued by many, yet there are some major obstacles in the way of achieving it. One of the fundamental differences between previous systems and the envisioned solution, from information technology point of view, is the diffusion of the roles of service providers and consumers. Traditional solutions, with fixed roles and abstracted physical layers can be too rigid to address the arising challenges. In order for these systems to work, they have to be vastly more scalable and account the physical layer too in the system architecture. In this paper, we investigate and show some examples and notable works on a possible solution to these problems, the field of participatory systems. In a participatory system, the roles of client and service providers are diffused, clients are working together as an integral part of the system, pooling their resources and providing services among themselves.
Keywords: PARTICIPATORY SYSTENS, VOLUNTEER COMPUTING, SOFTWARE SYSTEM ARCHITECTURE, IoT
1. Introduction The concept of participatory systems has a long history in
computing. The considerable amount of unused computational resources, residing in the hardware of the client has inspired many to search for ways to utilize it. One of the natural consequences of this idea led to the emergence of volunteer computing systems, like BOINC [1]. These systems used the computational resources of their clients, like ordinary desktop PCs to pursue specific goals, primarily scientific ones. Uses of these systems included tasks like protein folding, radio signal analysis and the search for Mersenne primes. These systems are usually unique, dedicated to a single problem and have a limited lifetime, bound to the solving of that specific task. Although they serve different purposes, they often have a common technological basis, for example the aforementioned BOINC platform provides the technological background for several different projects.
Another approach to utilize the resources of clients is to use participatory methods to augment the capabilities of a 'live' system. This approach could be taken even further, clients could become the sole providers of a service, which would offer significant advantages. Even with the limited approach, the inclusion of clients actively participating in the system would achieve a certain amount of self-scaling. The more clients joining and participating, the greater the capabilities of the system becomes. An architecture designed according to these principles would solve many of the greatest technological challenges in a fully connected world, for example the sheer scale of these systems.
The goal of this paper is twofold, in the first part we provide an overview about the state of the field of participatory systems by showing a possible classification method based on our previous work [2], providing examples for each class. Then, in the second part, we focus on open problems in the world of IoT and integrated solutions, where participatory methods could prove to be advantageous. Finally, we outline some research directions for participatory systems, worth pursuing to achieve these goals.
The structure of this paper is dictated by these two goals, after this introductory section, we delve into the overview and classifications of participatory systems in the second section. Here we show the classification methods and examples for each class. In the third section, we discuss the open problems and use-cases where participatory methods could be of use. Finally, we wrap the discussion in the last part, where we reiterate the topics covered and outline some future directions.
2. Classification and examples of participatory systems
Definition: A Participatory System is a system which provides services to its clients with active participation on their part. In a
system like this, clients are working as an integral part of the whole providing services themselves, among themselves.
Strictly to the definition a great deal of typical information systems could be classified as participatory, in essence one could say that the quality of the activity requirement from clients is the determining factor. In order to narrow the number of possible candidates we establish some classification parameters. For each of these parameters, we show some examples to demonstrate how different solutions behave.
The first consideration for classification is from the perspective of clients, the second we investigate is from the direction of the goals followed by the system. Finally, we will look at the systems from a technological a technical standpoint.
2.1 Clients
When looking at the classification problem from the perspective of clients, we intend to determine the effects of the characteristics of participating client on the system. We could ask questions like; Are participating clients a mandatory part for the operation of the system or they just enhance the system capabilities? Are there multiple roles of clients, or every client can be considered the same? When referring to client participation, do we mean the client machine or the actual person sitting behind the desk? In the following, these questions are investigated.
2.1.1 Client Driven and Client Enhanced systems
A participatory system can be either client driven or client enhanced. A client driven system requires the active participation of its clients to provide service, a client enhanced system can serve non-participating clients in itself, while adding new clients improves the system's capabilities.
A good example for a client driven system would be a completely distributed peer-to-peer file sharing system. As a concrete example one could look at the tracker-less version of the BitTorrent protocol. In this example, every client is equal in the system, their goals are the same and without their participation the system would be purposeless.
For a client enhanced system, we could take the example of a peer-to-peer streaming solution, where clients share the data among themselves [3]. In these systems, usually there is a primary source of content (e.g. a centralized server) and clients who want to access this data. By having the clients share the data they receive, the load on the centralized server can be reduced significantly. This approach has already been adopted by the industry in the form of peer assisted content delivery networks, for example Peermesh [4], Peer5 [5] or Swarmify [6].
272
2.1.2 Homogenous and Heterogeneous client roles
Another classification point would be the characteristics of client roles, there are homogenous and heterogeneous systems when looking at these roles.
In the first case, clients are a homogeneous group from the perspective of their roles filled in the system. Each client interacts with the system the same way, consumes its services and actively participates in providing them to others.
In case of a heterogeneous system, there are more than one group of clients. E.g. one group may participate in service provision, while others could only consume the said service.
Volunteer computing systems, for example the previously described BOINC bases solutions, like SETI@Home [7] or Folding@Home [8] are heterogeneous systems. In these cases, there are two groups of clients. One of them is the group of participating clients, who willingly dedicate their computational resources to achieve a greater computational capability for the system. The other group is the group of end users, who provide the tasks for clients to solve and use the results for their own purposes.
For a homogeneous system example, we could look at the previously described file sharing system. In a system like that, every client has similar purpose and each of them participates to achieve it.
2.1.3 Interactive and Non-interactive systems
An important consideration for classification is whether the actual human client must participate or not. This interactivity is usually determined by the main purpose of the system, e.g. if the service is request oriented, it often includes interaction.
When the participation requires active human interaction, we talk about an interactive system. This interaction could mean a simple acknowledgement or could be a more challenging task. Often the purpose of these systems is to solve human intelligence problems, which usually have no known perfect algorithmic solution. Examples usually involves exploiting the pattern recognition strength of the human brain and could include tasks like media categorization and tagging, visual processing of satellite imagery [9] or text digitization.
On the other hand, a non-interactive system does not require the active participation of the human client to work, neither it requires their knowledge or their consent. Usually these systems work in the background to improve the service level of a system, like the previously mentioned peer-to-peer content delivery platforms, but there are also some less reputable real-world examples.
Strictly to the definition, one could say that bot-nets and cryptojackers [10] (browser based crypto currency miners hidden from the user) are some real-world examples for non-interactive systems.
2.2 Goals
Another possible point of examination are the goals of the system; they play a key role in determining the characteristics.
The key questions one could ask regarding the goals could be stated as the following; Is the end goal of the system a one-time event, or is it an ongoing purpose, like providing a service? Does the system rely on purposefully participating clients, or just opportunistically uses their resources to further its goals?
2.2.1 One-off and Continuous services
One could also examine the end goal of the system, whether it’s a one-time task that can be completed, or it’s a continuous task, integral to the system.
In the first case, if the goal can be fulfilled, we talk about a one-off system. In this case, participants are solving parts of the task, or
different tasks possibly leading to the desired solution. If this solution is reached, the system’s life-cycle ends.
A great example for a one-off solution would be the BOINC based volunteer computing system set to solve the minimum sudoku problem [11]. In this case, the question was the following: what is the smallest number of clues (filled numbers) that a Sudoku puzzle can have? The answer that was proved by the system was 17.
The other option, continuous services are more common, both the previously discussed peer-to-peer content delivery systems and the radio signal analysis done by SETI@Home are ongoing, continuous services, aimed at different clients.
2.2.2 Opportunity driven and Purpose driven systems
From the perspective of initiative, one could distinguish opportunity driven and purpose driven systems, the main difference being the context in which they use their client’s resources.
Opportunity driven systems profit from the participation of its clients whose original goal is the consumption of the provided service. On the other hand, purpose driven systems assume its clients are willingly participating to reach the end goal itself.
Volunteer systems, by their nature are always purpose driven, this behaviour is the more common of the two classes. Examples in this case would include grid computing and CPU cycle scavenging systems, like project Bayanihan [12].
As an opportunity driven system a good example would be the case of reCAPTCHA project [13]. In this system, the clients are consuming a primary service, the security gateway intended to protect a resource from autonomous requests, while in the meantime the participants help with the digitization of written text or images.
It’s also feasible to employ primarily purpose driven use-cases, like the running of massively parallel computations in an opportunity driven fashion, which would improve the proliferation of such systems, as described in our previous work [14].
2.3 Technology
From a technological standpoint, we consider the resources contributed by the clients to the system as the prime point of discussion. Client technological characteristics have a determining effect on both system architecture and capabilities. In essence the question on could ask here would sound like this; what does the client contribute?
2.3.1 Computational systems
In a computational system clients are pooling their resources to create a larger, more potent system in terms of computational power. These systems are best employed when working on embarrassingly parallel problems, e.g. running simulations, solving cryptographic problems, or running certain machine learning algorithms.
It is a proven fact by previous works in the field - some discussed earlier, that the capabilities of these solutions are significant. In 2007, the computational capacity of the Folding@Home project superseded the world’s largest supercomputer's performance [15] at the time, and continued for four years.
In most of these computational systems, the original problem is partitioned to smaller tasks, which are assigned to the clients and executed in parallel. When finished, the client uploads the result to a central server which aggregates them.
For reliable results, this mandates the presence of additional security measures, such as redundant calculations to avoid malicious clients providing false solutions. As a consequence, the central component’s complexity and required capacity could be impacted negatively.
273
2.3.2 Distribution systems
Distribution systems focus on providing data as a service to all of its clients. In a participatory way, this is usually achieved with direct client to client (peer-to-peer) connections. Usually in this case, each client can request data either from the central server or other clients. In theory, the more clients the system has, the greater the ratio of clients distributing the data among themselves, hence less load on the central component.
An example for a participatory distribution system would be the previously mentioned peer-to-peer streaming solution. In this case the goal of the system is to provide each client with an acceptable level of service (i.e. enough data in a timely manner), while minimizing the impact of growing client traffic on the central component.
A more interesting class of distribution systems are information sharing systems, where the information is bound to the clients themselves. This may either be caused by the information originating from the clients themselves, for example if it’s based on a geographical location. An information distribution system’s aim is to provide the relevant information to the interested parties (i.e. clients interested in a geographical area receive information from other clients located there). Good real-world examples here would include community driven navigation software, such as Waze [16].
2.3.3 Sensing systems
A sensing system is another special kind of participatory system, where clients are building up larger sensor networks, usually aimed at collecting data from a geographical area.
The field of participatory sensing [17] or crowdsensing [18] deals with these kinds of systems and they are already being adopted by the industry.
While by strict definition we consider all sensing systems participatory, we should make a distinction between sensory networks made up of relatively intelligent, participating clients, such as smartphones and simple distributed sensor networks.
3. Potential uses of participatory methods The basic concept of a system and its interaction with the users
in integrated world is close to what we described as a participatory system. In this case integration means the closing of the gap between physical and virtual layers, making the system boundaries less clear, involving the clients in the actual process is a goal.
Participatory methods are becoming more important in this environment, as this level of integration provides new challenges. Methodologies used in purely virtual or lightly integrated systems can become insufficient at this scale.
In this section, we identify some key aspects and scenarios, where participatory methods offer potential advantages over previously employed practices.
One of the inspirations for grouping the problems in this section was the work of John A. Stankovic's on "Research Directions for the Internet of Things” [19].
3.1 Scaling
Maybe the largest problem with the concept of a fully interconnected world is its scale. The traditional client-server architectures used currently in most information systems are simply unable to scale beyond a point. An alarming indicator of how insufficient the current infrastructure is, is the 2016 Dyn DDoS attack [20], which was the largest of its kind at the time of writing. The relevant aspect of this attack is that it was performed using a botnet made from mostly IoT devices [21]. Experts predict the use of these devices to rise exponentially in the near future, it’s easy to imagine the strain they would impose on current infrastructure.
Answering to the scalability problem with a general solution is not possible. Each individual use-case and system requirement influences the overall system characteristics, sometimes drastically. What we can do however is come up with some guidelines and key considerations on how to improve scalability, many of them includes the usage of participatory methods.
As opposed to previous large-scale systems, when thinking world scale, it is not enough to provide the large horizontal scaling capability of a system. It’s also imperative to be able to provide the actual computational capacity. While its certainly possible physically to simply build more datacentres, it may be economically more feasible to look for other alternatives as the number of clients drastically increase.
Participatory systems could help a great deal in this regard, by utilizing clients to enhance system capabilities, these systems could become self-scaling. By using the clients as service providers themselves, an increase in their number would also mean a larger capacity in the system for serving the said clients. This approach naturally has some limiting factors regarding where it can be used, but the general characteristics of these systems make them a suitable candidate for such solutions.
Novel approaches would be required for some cases where using traditional methods on a smaller scale would be trivial. This task is not insurmountable however, as it was already demonstrated several times throughout history. As recent example, one could look at is the millennium old concept of currency. Currency was re-imagined and recreated in a distributed, yet secure way with the emergence of cryptocurrencies like BitCoin [22]. The task of account keeping and monetary transaction management is one of the source of the original motivation behind the theory of centralized information systems with proper safeguards for consistency and security. Both of these concepts are usually considered the antithesis of peer-to-peer and distributed systems, yet a novel approach with proper theoretical background and innovative implementation could solve it in a satisfactory way.
3.2 Architecture and environment
Heavily related to the scaling, a key difference between the new integrated systems and their predecessors would be the architecture they employ. Previously architecture could be easily separated to virtual and physical components, and each could be evaluated separately. In an integrated system, the components are much harder to separate by this measure.
A key difference however, where participatory methods also come into play is the emergence of a new separating factor; geography. By integrating the virtual and physical world its largely unavoidable to introduce this new factor to the system. It’s necessary for these systems to account for the geographical locations of their clients, as it became a primary client attribute with the close integration.
The geographical aspect however has some fortunate consequences in solving the problems. Similarly to the concept of light cone in general relativity, one could determine the possible dimensions in space and time which would affect the given client when serving a request. This could be used to break up the larger system into smaller chunks, based on client geo-location.
Combining this with the usage of participatory methods, one could turn a centralized, world scale system into a collection of collaborating geographically close clients. For example, a public transportation navigation system could use information shared directly between clients travelling at different locations, without the need for maintaining a centralized service for providing it.
One of the consequences of this approach is that the system would have to be scaled according to the client density instead of the total client number.
274
Ultimately the base concept of these systems could be summed up as the following; Instead of collecting information to a central place and serving it, each information source serves it themselves. Clients in these systems turn to information’s source, what is not a centralized role in this case. As information is usually bound to the geographical location this makes a natural grouping of clients.
4. Overview and future directions In this section, we outline some possible directions worth
pursuing in the field of participatory systems and wrap the conversation with an overview of the paper.
4.1 Research directions
One interesting directions to examine would include the modelling of information flow based on geographical locations and its effect on the system. Its worth investigating how clients could discover each other and get the relevant, geo-bound data from the most relevant source.
Another interesting direction would be the investigation of the effects of different client behaviours and characteristics on different participatory systems and possibly set QoS metrics.
4.2 Overview
In the paper we introduced the term of participatory systems, described the brief history of the field and presented some of the more significant related works. We have shown a classification method for these systems, providing examples and possible use-cases for each examined class. We have identified three main classification factors: roles of the participating clients, characteristics of the goals of the system, and technological archetypes.
After that we have shown two major areas in the concept of the fully integrated world where participatory methods could be advantageous; scaling and geographically aware architectures. We discussed the possibility in employing participatory methods to build unprecedented scale systems and compared it to traditional solutions.
We have also examined the effect of client geographical considerations in case of the system architecture. We determined that when the information source is geography based (e.g. depends on the location of the client) we could use participatory methods for the clients to share this information with each other. This would result in a much more scalable system, where the information flow is decentralized.
Finally, we have proposed research direction worth pursuing in the future.
5. Acknowledgments Supported by the ÚNKP-17-4-IV New National Excellence Program of the Ministry of Human Capacities
References 1. D. P. Anderson, “BOINC: a system for public-resource
computing and storage,” in Fifth IEEE/ACM International Workshop on Grid Computing, 2004, pp. 4–10.
2. L. V. Jánoky, “Participatory Systems and Their Potential for IoT Applications” in Proceedings of the Automation and Applied Computer Science Workshop 2017, 2017, pp 103-114.
3. J. Braun, P. Ekler, and F. Fitzek, “Network coding enhanced browser based Peer-to-Peer streaming,” in Systems, Man, and Cybernetics (SMC), 2016 IEEE International Conference on, 2016, pp. 2104–2109.
4. “PeerMesh World First Peer Powered GIS.” [Online]. Available: http://peermesh.io/. [Accessed: 14-Nov-2017].
5. C. Z. 1 T. Aviv and Israel, “Peer5,” Peer5. [Online]. Available: https://www.peer5.com/. [Accessed: 14-Nov-2017].
6. “Swarmify | Video Made Effortless.” [Online]. Available: https://swarmify.com/. [Accessed: 14-Nov-2017].
7. D. P. Anderson, J. Cobb, E. Korpela, M. Lebofsky, and D. Werthimer, “SETI@Home: An Experiment in Public-resource Computing,” Commun. ACM, vol. 45, no. 11, pp. 56–61, Nov. 2002.
8. S. M. Larson, C. D. Snow, M. Shirts, and V. S. Pande, “Folding@Home and Genome@Home: Using distributed computing to tackle previously intractable problems in computational biology,” arXiv:0901.0866 [physics, q-bio], Jan. 2009.
9. C. Fishwick, “Tomnod-the online search party looking for Malaysian Airlines flight MH370,” The Guardian, vol. 14, p. 37, 2014.
10. “Your Browser Could Be Mining Cryptocurrency For a Stranger,” WIRED. [Online]. Available: https://www.wired.com/story/cryptojacking-cryptocurrency-mining-browser/. [Accessed: 14-Nov-2017].
11. G. McGuire, B. Tugemann, and G. Civario, “There is no 16-Clue Sudoku: Solving the Sudoku Minimum Number of Clues Problem,” CoRR, vol. abs/1201.0749, 2012.
12. L. F. Sarmenta and S. Hirano, “Bayanihan: Building and studying web-based volunteer computing systems using Java,” Future Generation Computer Systems, vol. 15, no. 5, pp. 675–686, 1999.
13. L. von Ahn, B. Maurer, C. McMillen, D. Abraham, and M. Blum, “reCAPTCHA: Human-Based Character Recognition via Web Security Measures,” Science, vol. 321, no. 5895, pp. 1465–1468, Sep. 2008.
14. L. V. Jánoky and P. Ekler, “The analysis of participatory computing in dynamic web environments,” in 2017 IEEE 15th International Symposium on Applied Machine Intelligence and Informatics (SAMI), 2017, pp. 000067–000072.
15. V. Pande, “Crossing the petaflop barrier,” Folding@home. [Online]. Available: http://folding.typepad.com/news/2007/09/crossing-the-pe.html. [Accessed: 30-Apr-2017].
16. W. Mobile, “Waze,” Retrieved January, vol. 3, p. 2013, 2012.
17. J. A. Burke et al., “Participatory sensing,” Center for Embedded Network Sensing, May 2006.
18. R. K. Ganti, F. Ye, and H. Lei, “Mobile crowdsensing: current state and future challenges,” IEEE Communications Magazine, vol. 49, no. 11, pp. 32–39, Nov. 2011.
19. J. A. Stankovic, “Research Directions for the Internet of Things,” IEEE Internet of Things Journal, vol. 1, no. 1, pp. 3–9, Feb. 2014.
20. N. Woolf, “DDoS attack that disrupted internet was largest of its kind in history, experts say,” The Guardian, 26-Oct-2016.
21. J. Biggs, “Hackers release source code for a powerful DDoS app called Mirai,” TechCrunch.
22. S. Nakamoto, “Bitcoin: A peer-to-peer electronic cash system,” 2008.
Abstract:. Startup is a newly established enterprise, or an enterprise at the foundation stage, which is focused on monetizing an idea. According to the European Association of Business Angels there are launched about 50 million new projects every year (137,000 per day), but 90% of them fail. In the paper we analysed 51 startups, which had a minimum viable product and also some investment, but failed. The main aim of the research was to identify the factors leading to the failure of startups. The result has been to create an overview of the mistakes that young entrepreneurs commit at the early beginning.1
1. Introduction The global development of new technologies has created a trend
of small, exponentially growing companies – startups. Steve Blank2, Silicon Valley serial-entrepreneur and academician, defines startup as a temporary enterprise form designed for a repeatable and scalable business model. According to investor and writer Paul Graham3, the startup is a fast growth business. However, only a fast growth does not define the complexity of a startup. Matej Jariabka, one of the leaders of the StartupCamp community, defines startup as an innovative form of high-risk enterprise with the potential for huge growth. The word startup can therefore be labeled as essence of unconventional thinking, creativity and originality4. It can be any start-up enterprise that is preparing some minimum viable product or already exists on a market and meets the following criteria: creates a blue ocean in a industry, has a higher entrepreneurial risk in establishing itself on a market, and after a successful start it is likely a fast grow.
According to the European Association of Business Angels5 (EBAN), around 300 million founders currently have 150 million businesses worldwide. There are launched about 50 million new projects every year (137,000 per day). CB Insight's research, which analyzed the causes of 101 startup failures, has shown that 9 out of 10 startups fail to 1-3 years, what is a 40% riskier than in standard business models. According to Bloomberg's analysis6, 8 out of 10 startups fail over 18 months, mainly due to lack of understanding of customer needs and inadequate revenue generation what also confirms KPMG Startup Survey 20167 which define, that only 37% of startups generate revenue (69% up to 50 thousand euros, 23% more than 50 thousand and 8% more than half a million euros) and others do not receive any money yet. Because the primary goal of doing business is to generate finance for covering company costs as well as for shareholders. So every startup should create an ideal revenue model, which describes8 how a company generates profit and sufficient capital for further investment.
2. Aim of the paper The main aim of the research was to identify the factors leading
to the failure of startups. The result has been to create an overview of the mistakes that young entrepreneurs commit at the early beginning. We divided the main goal into testing three hypotheses in which we analyzed possible failure indicators:
1. Most startups have an inadequately defined product / problem and its solution.
2. Startups do now know how to correctly estimate customer, target group and market potential in the industry.
3. Startup failure is mostly caused by incorrect setting of the revenue model.
3. Methodology In the first phase we compared current knowledge in scientific literature, using resources in the ScienceDirect, Springer and RePEc
databases and Google Scholar Search. Subsequently, based on comparisons of literature and scientific research, we created a structured questionnaire that helped us to structure and analyze 51 statements of the startup founders. We received these testimonials from the Autopsy.io database, which was founded by Maryam Mazraei and Matthew Davies in September 2014, and which creates list of blogs, testimonials and analyzes of the startup founders, who evaluate the reasons of their failure. The analyzed startups included: Lumos, RateMySpeech, RewardMe, Udesign, Fastr, GuGo, Wattage, Allmyapps, BitShuva Radio, KOLOS, Bluebird, Secret, Bawte, Patterbuzz, Kiniku, ComboCats, College Inside View, DeviceFidelity, Kinly, Cusoy, Starthead, Poliana, Zagreb Cohousing, Springpad, Keep Fit Stay Sane, Showroom, Amiloom, Wishareit, Emjoyment, Dinnr, Moped, Imercive, 99dresses, Popin, OpTier, Bloom.fm, Manilla, Pumodo, HowDo, Awgyle, orat.io, Stipple, Samba Mobile, Zumbox, Needium, Critica, LayerVault, World Burrow, Mochi Media, Salorix a Exec.
4. Results The gender analysis showed that 96% of the founders were
men. This is mainly due to the fact that most of the startups are created in the technology sector, which is still the main domain of men. From the place of company establishment point of view, nearly 70% come from the US, most of them from San Francisco, California, which not far known as Silicon Valley. A more accurate overview is provided in Chart 1.
Chart 1: Location of analyzed startups
Analyzed startups were established in 2009-2014 (Chart 2 and Chart 3). The average period of startup existence was 28 months. The fastest failure was reached in 4 months and the longest business time was 55 months. Modus, the most common startup existence period, was 12 months and the median was 24 months.
276
Chart 2: Year of establishment
Chart 3: Year of failure
Startups have created their business models most often in the area of social applications (42%) and in softwares aimed to simplify people's lives (28%). The least represented startup sectors included robotics, payment systems, gastronomy and artificial intelligence (Chart 4)
Chart 4: Sectors of analyzed startups
An important indicator of a startup business failure was the amount and type of investment (Table 1). The number 84% of the analyzed startups received an investment, mostly in the amount of 10-100 k Euros and 1-10 mil. €. Only 16% of them did not receive any investment. It follows that the specimen was under the control of investors and other third parties and startup had to have some MVP. Revenues and profits of 80% startups were not published, so we did not analyze them further.
Table 1: Amount and type of investments
Startup statistics in the literature show that approximately 90% of startups are convicted to an absolute failure and their further fate is extinction. More about 5% are in a situation when all the activities are not enough to meet the need of the market. In our research, we have analyzed startups from around the world. Based on the analysis, we identified 13 different factors, which, according to the founders themselves, caused the failure of their startup. A detailed overview is provided in Chart 5.
Chart 5: Reasons of startup failure
The 5 most serious problems include the following: I. Lack of money for further development (34%) One of the key factors behind the startup success is finding enough financial resources to develop an idea, especially in phase when the startup does not generate revenue. Because of this reason, startups must look for financial resources from the external environment - family, friends, banks, venture capital, development capital, state support, or crowdfunding. Branislav Zagorsek identified also the positive impact of the higher cost strategy on the pay-as-you-go acquisition9. In more than 1/3 of analyzed startups, it was shown that the companies had not defined sufficiently the amount of funds needed for the launch and for the investment time
Investor types
up to 10k €
10 - 100k €
100k - 1 mil. €
1 - 10 mil. €
more than 10 mil. €
∑
3F (family, fools, friends)
2% 2% 2% - - 6%
business angels 6% 2% 6% 4% - 18%
investors - 24% 2% 22% 6% 54%
banks 4% 6% - - 2% 12%
other 8% - - - - 8% no investment - - - - - 16%
277
schedule. At the same time, they were unable to reach the sales stage and thus obtain additional financial resources from customers. The lack of money led to nect problem: reimbursement of capital expenditures, financing of expansion, covering operating costs for staff, offices, infrastructure, etc. and covering other costs. II. No need for a product / service in the market (28%)
The second biggest problem was the lack of customer interested for the startup solution. The founders defined this problem as a lack of real market testing. Many of them met with customers and asked about their problems, analyzed possible solutions. Preliminary analyzes seemed promising. However, when they came out with the product on the market they found out that people, despite the fact that they had previously said they were interested, did not really want to buy it. The founders called these product “Vitamins” (it's nice to have t) even though they thought they are going to sell Aspirin (must have it). The founders said that also the timing of product launch was probably not right - either customers or the market was not ready yet, or they came out with the product too late. In both cases, the result was the same.
III. No investors (16%)
It seems, that finance is the biggest problem, because it take first and third place in our results. In this case, it is more about problems with investors. Founders defined the main issues:
- the startup has hurt its investors several times and failed to fulfill the required goals in the basic series, thereby losing confidence,
- the startup did not produce any evidence to increase its potential to convince the investor of its exponential growth potential (pre-contract with buyers, a large number of applications downloads, sales, success in the crowdfunding campaign, etc.),
- lack of logic of the business model from the investor perspective,
- insufficient investor awareness of all issues, - time has shown that there is no understanding between the
startup team and the investor.
IV. Cost Issues (16%)
One of the main problems was the cost calculations. In these cases, founders did not make accurate finance planning that included both direct and overhead expenses. Incorrectly defined costs have resulted in incorrect price formation and therefore the market price could not cover costs at all. There were more reasons, why founders failed their budgeting:
- acted under the pressure of their investor and defined only preliminary costs,
- did not know which material they will finally use, - could not define all cost items (material costs, labor costs,
investments to technology, etc.),
V. Not the right team (14%)
Most investors evaluate a quality of the team, experience, creativity and cooperation as one of the key factors of success. In most cases, startups need to change their business model several times, and it can only be done by a high-quality team. The most common issues that the startup analyzes were:
- not the right mix of people: in many cases incompatible people and too strong personalities created many conflicts
/ wrong people , who appeared at first as professionals and then turned out to be incompetent,
- bad team leadership: incorrect team manager caused a feeling of unfair distribution of work and not fair financial reward / in other cases the founders themselves reflect that they were not able to lead their team.
5. Conclusion The main goal of founding a startup is to discover new
marketplaces and create high added value products. At the beginning, startups are low-cost projects mostly created by programmers and designers who want to create something unique and earn a lot. However, in more than 90% of cases, they fail. Three of five main problem deal with finance - either incorrect product pricing, poor cost estimates or lack of capital for further development. The second key issue is the lack of market need – result of inadequate product testing on the real market. The fifth biggest problem is the poor team that cannot solve the problems and cannot develop theright MVP or business model.
1 The paper is a result of research in scientist project VEGA 1/0609/16 2 Čo je a čo nie je startup? Nekonečný boj o konečnú definíciu. [online]. [cit. 2013-09-13]. http://blog.helios.eu/sk/2013/04/08/co-je-a-co-nie-je-startup-nekonecny-boj-o-konecnu-definiciu 3 Čo je a čo nie je startup? Nekonečný boj o konečnú definíciu. [online]. [cit. 2013-09-13]. http://blog.helios.eu/sk/2013/04/08/co-je-a-co-nie-je-startup-nekonecny-boj-o-konecnu-definiciu/ 4 LJUDVIGOVÁ, I.: Výskum vertikálneho a tímového vodcovstva v slovenských startupoch. In Manažment podnikania a vecí verejných : vedecko-odborný časopis [elektronický zdroj]. - Bratislava : Slovenská akadémia manažmentu, 2017. ISSN 2453-8167, 2017, p. 1-10 online. 5 Early stage investing explained. [online]. [cit. 2016-09-13]. http://www.eban.org/about-angel-investment/early-stage-investing-explained/ 6 WAGNER, T. W.: Five Reasons 8 Out Of 10 Business Fail. [online]. [cit. 2016-11-03]. http://www.forbes.com/sites/ericwagner/2013/09/12/five-reasons-8-out-of-10-businesses-fail/#5e1536415e3c 7 Prieskum Startup Ecosystem Survey 2016. [online]. [cit. 2016-11-03]. https://home.kpmg.com/sk/sk/home/insights/2016/06/startup-ecosystem-survey-slovakia-2016.html 8 Revenue model. [online]. [cit. 2016-11-03]. https://en.wikipedia.org/wiki/Revenue_model 9 ZAGORŠEK, B.: Využitie stratégie na dosiahnutie väčšieho úspechu startupov. In Podnikateľské modely a podnikateľské stratégie startupov II. Bratislava : Vydavateľstvo EKONÓM, 2016. ISBN 978-80-225-4328-6. S. 162-169.
Abstract: The main features of the radiation environment in the surrounding environment are presented. Over the last 5 years no values
other than the natural ones have been observed, with the lowest values in Veliko Tarnovo. The main characteristics of the radiation in operation in nuclear power plants and the major accidents resulting from the operation of the NPP in the development of humanity are shown. Radiation as a result of the uranium mining and uranium processing industry in Bulgaria is also under consideration. It also shows the actions of radiation as a result of other people's activities.
1. Common feature Detection of radioactivity is one of the greatest discoveries of
mankind. Only a few weeks after the X-rays were discovered (in 1896), French physicist Henri Becquerel, having studied the phosphorescent properties of various substances, started an experiment with potassium uranium sulphate. The experience was that, after exposure to daylight, the mineral, well wrapped in light-tight black paper, had been checked for some time whether it was phosphoresciated [1]. The silhouette of the mineral emerged under the influence of strong radiation with great penetrating ability on the photomulsion. Thus, the presence of new urinary bears called Becquerel was found, and the phenomenon was called by Maria Curie radioactivity [2].
This discovery is rapidly entering medicine and the first X-ray machines that have led to a revolution in medicine have been created. Subsequently, advanced and upgraded X-rays from the latest generations increase the repetitive accuracy of diagnostic activity and allow the rescue of hundreds of lives.
At the same time, it is found that radioactive beams are also a serious environmental pollutant with an extremely strong impact on the vital and physiological activity of organisms, ranging from stimulation to killing.
It is well known that all of our plans are designed to prevent the natural and anthropogenic, terrestrial and spacecraft from irradiating beams, ie. in the field of the natural and manufac tured radioactive waste. Ionizing rays accompany the life of the planet in various issues at all stages of the phenomenon [3].
Prez godinite After switching Vtorata svetovna voyna poradi razvitieto na atomnata promishlenost and osobeno usilenoto izpitvane na yadrenoto orazhie iznikva with golyama ostrota vaprosat charter radioaktivnoto zamarsyavane na planetata.Sled atomen blast in vazduha produktite na atomnoto delene zamarsyavat atmosferata, sushata, vodite, rasteniyata, zhivotnite, hranitelnite products and others.
The importance of the problems arising from the radioactive contamination requires the emergence of new sciences that integrate and investigate various aspects of contaminants with radio-nuclides, emerging and developing new scientific disciplines and approaches. Their radio frequencies are aimed at studying the efficacy of migrating radioactive substances into the biosphere and the effects of ionizing radiation on living organisms. The study is considered to be a specific issue for the surface area of the country, which provides life for the living and living world and plays an extraordinary role in the future of the world. [4]
It is only natural radioekologiyata na pochvata depend from the razvitieto na biofizikata, biohimiyata and fizikata na pochvata, but as her predmet is the study of zakonomernostite na vzaimodeystvie
na produktite na delene na urana and plutoniya with pochvata, tyahnata sorbtsiya, desorbtsiya, migration, a well and influenced by the food chain of animals - animals - humans [5].
1.1. Classification The natural gamma background is a physical feature of the
environment and is the gamma ray field in which all living organisms on Earth are found. Sources of this ionizing radiation are secondary cosmic radiation and natural radionuclides found in atmospheric air, soil, water, food, and the human body [6]. The measured magnitude is gamma background dose power and is specific for each point, region, region.
Gamma radiation dose data for the country is obtained in real time from 27 permanent monitoring stations of the National Automated System for Continuous Radiation Control (NASCRGP), administered by the Executive Environment Agency (EEA).
The automated system provides operational information in case of accidental increase of the radiation background, both in case of nuclear accident on the territory of our country and in cross-border transmission of radioactive contamination. The system provides with real-time data the Emergency Center of the Nuclear Regulatory Agency and the General Directorate for Fire Safety and Protection of the Population Directorate at the Ministry of Interior (MoI), which provides the opportunity in case of a radiation accident, to implement timely appropriate measures to protect the population and the environment.
Over the last 5 years no values other than the natural ones characteristic of the respective point have been observed [7]. The lowest average annual dose rate for 2016 is determined at the local monitoring station Veliko Tarnovo -59 nGy / h and the highest peak at Orelyak peak - 133 nGy / h [8]. In Fig.1.1. the average annual values of the radiation gamma background for the period 2012 ÷ 2014 are presented in all 27 permanent monitoring stations in the country, including the monitoring station of "Permanent repository for radioactive waste" - Novi Han, owned by the Radioactive Waste . The station in Novi Han is fully integrated into NASCRGF.
It is known that natural radionuclides: uranium, radium, thorium and the products of their decay, as well as the radioactive isotopes of potassium, rubidium, etc., have a wide spread in the earth's crust. Due to their specific physicochemical properties, they have a specific presence in the composition of the individual components of the environment: lithosphere (rocks, soils), hydrosphere (underground, river, lake and sea waters), atmospheric air, flora and fauna. Their ionizing radiation, along with secondary cosmic radiation, forms the natural gamma-background background, which inevitably affects all living organisms.
Fig. 1.1. Annual average values of the background gamma
background in Bulgaria [9] As a result of the human activity, the environmental elements
with natural and technogenic radionuclides and their spatial redistribution are further enriched. These anthropogenic sources of radioactivity determine the technogenic component of the radiation background. The following should be addressed:
• Waste water and weighed rock in the mining of heavy and rare metals;
• gas-aerosol discharges from the nuclear power and thermal energy objects;
• sludge and ash from solid fuel stations; • mineral fertilizers derived from certain phosphorites; • building materials other products [8]. The National Radiological Monitoring System aims at early
detection of deviations from the radiation parameter values in the main environmental components and provision of available radiological information to detect both the natural and the nuclear accidental radiological status. Particular attention is paid to areas with potential radioactive contamination, such as Kozloduy NPP.
Fig. 1.2. Radiation characteristics of the environment [9] As a result of the human activity, the environmental elements
with natural and technogenic radionuclides and their spatial redistribution are further enriched. These anthropogenic sources of
radioactivity determine the technogenic component of the radiation background. The following should be addressed:
• Waste water and weighed rock in the mining of heavy and rare metals;
• gas-aerosol discharges from the nuclear power and thermal energy objects;
• sludge and ash from solid fuel stations; • mineral fertilizers derived from certain phosphorites; • building materials other products [8]. The National Radiological Monitoring System aims at early
detection of deviations from the radiation parameter values in the main environmental components and provision of available radiological information to detect both the natural and the nuclear accidental radiological status. Particular attention is paid to areas with potential radioactive contamination, such as Kozloduy NPP.
In the use of nuclear technology in the national economy, medicine, research and others, too, a small amount of radioactive substances fall into the environment. Gaseous waste in small quantities is discharged into the atmosphere by nuclear fuel reactors and plants, from which they fall into the soil and through the path of food chains reach plants, animals and humans.
Let us not forget that the stimulatory and lethal doses of radiation for the different types of organisms are very different. Studies have shown that some plant species have a fairly high dose of radiation, and under the conditions of increased radiation, the populations of some insect pests, for example aphids, are rapidly growing and causing great damage to agriculture.
Under normal operating conditions of nuclear installations and appliances, too small quantities of radioactive substances are released in the rivers. Compared to radioactive contamination and exposure to nuclear explosions, especially in the atmosphere, these sources of pollution are usually insignificant. Nevertheless, the large number of isotopic laboratories increases the risk of radioactive contamination in the event of non-compliance with the rules on waste handling and storage. We also have such an example for our country when, in an inconsiderable work in June 2011, in one of the companies working with radioactive elements, several workers received a higher radiation dose than the eligible one and were sent to treatment in France.
2. Radiation characterization
2.1. Radiation characterization of NPP operation In nuclear power plants, nuclear reactors, all radioactive
substances are in closed systems and can only be thrown out in an emergency. In water cooled reactors, water is activated and contaminated with radioactive substances, but prior to discharge, it is subjected to complex purification and is passed through columns of ionites to contain the radioactive pollutants. Irrespective of the most stringent safety measures in the operation of nuclear reactors through valves, pumps, etc., sometimes leakage of contaminated water and air is allowed. It is quite natural that emergency situations are the most dangerous in terms of radioactive contamination [10].
Serious levels of radioactive contamination are allowed in reactor failures of nuclear power plants, although all known precautions against accidents are taken in the design and construction of nuclear reactors. The failures that have occurred in reactors in England, the United States, Ukraine and Japan undoubtedly show the great danger to mankind when the atom drops out of human control.
Statistics show that in case of reactor failures at nuclear power plants, despite all the known precautionary measures taken in the design and construction of nuclear reactors, radioactive contamination reaches enormous scale. The consequences of the major accidents in the nuclear power plant are similar to the consequences of the explosion of atomic bombs and, on their scale, are close to geological disasters.
In modern nuclear reactors with a high degree of safety, all radioactive substances are in closed systems and can be ejected out only in emergencies [11]. In water cooled reactors, water is
280
activated and contaminated with radioactive substances, but prior to discharge, it is subjected to complex purification and is passed through columns of ionites to contain the radioactive pollutants. Irrespective of the most stringent safety measures in the operation of nuclear reactors through valves, pumps and others, it is sometimes possible to leak out contaminated water and air that directly or indirectly through rainfall reaches the soil. The most dangerous for radioactive contamination are the emergency situations.
This is the example of the Wynskeeil accident in England. On 8th of October 1957 in reactor No. 1 the temperature rose sharply, the operators failed to control the process. The grid melts and the fuel starts to run out and burn. The chimney of the reactor begins to mimic radioactive smoke and pollute the environment. Workers from the plant receive a 150-fold higher dose of radiation above the permissible, and the area nearby - more than ten times higher. The radioactive clouds hang over North England, Scotland and part of northern Europe. On the 4th day after the accident, the fire was extinguished. Fortunately, during the accident, there are no deaths. Contamination of the pastures, and hence the cow's milk with radioactive iodine, is responsible for throwing huge amounts of milk into the ocean. Radiological Protection Council data show that in the 30-year period in England 33 people died and died as a result of exposure.
As in most such cases, the UK authorities for political reasons do not reveal the causes and nature of the Wynskeeel accident. This was done only after 30 years.
The accident at Three Mile Island - USA, which took place on March 29, 1979, was also huge. Despite the significant damage to the reactor core, the integrity of its protective shell was not impaired, and the radioactive discharge and pollution of the atmosphere and inside the emergency station proves to be very small. The temperature of the accident in different parts of the upper half of the core reaches 2800 ° C. The transfer and deposition of fission products in the TM -2 sheath are limited by inert gases and only very small quantities of the product fall into the atmosphere, although more than 20% iodine and more than 50% cesium have been ejected initially. Subsequently, these radioisotopes are found in the lower layers of the atmosphere. After thorough analysis of the causes and extent of the accident, valuable lessons have been learned about the construction and technical safety of the reactors.
The biggest accident at the NPP is in Chernobyl, Ukraine. On April 26, 1986, the Chernobyl NPP's 4th bloc collapsed, causing severe consequences for the country, its neighbors and almost all European countries.
The Fukushima I nuclear accident in Japan is a radiation incident of the highest seventh grade on the international scale for nuclear events.
The power plant owned by the Tokyo Electric Company (TEPCO) has 6 power units with water-jet reactors and is the world's largest nuclear power plant.
It was triggered by the earthquake and the tsunami that followed in early March 2011. The Japanese official authorities said it was a localized accident, but it subsequently turned out that as a result of the weekend accident on the US west coast they measured an increased level of radioactive background. In May 2011, even in the southern hemisphere of the Earth, there are radioactive isotopes and an increased background background that is the result of the Fukushima NPP disaster.
On July 5, 2012, the Japanese and world media reported that a report by the special parliamentary committee said that "The Fukushima-1 accident was not a natural but a technogenic disaster. The nuclear power plant was not prepared for either a strong earthquake or a tsunami. " The Commission blames the operator, the TEPKO company, and the government's nuclear services.
In the earthquake, blocks 1 - 3 are self-extinguished, and the back-up power generators that supply the electronic control system and water pumps to cool the fuel rods are included. This is necessary because after stopping the chain reaction, the fuel rods continue to emit a large amount of heat due to the natural radioactive decay.
The power plant is protected by a breakwater with a height designed to contain a tidal wave up to 5.7 meters high, but the tsunami that hits the shore about 40 minutes later is about 14-15 meters high. Wave floods the plant, damages the power and electronics in the units and interrupts the external power supply to the plant. The earthquake disruptions prevent rapid external intervention in the affected area.
This conclusion differs from the conclusion of the TEPKO's internal investigation at the end of 2011 that the main cause of the accident was the tsunami wave whose height of 15 meters exceeded the forecasts of seismologists.
Some of the most catastrophic nuclear incidents are those we have never heard of. When we think of a nuclear disaster, we usually think of Chernobyl and Fukushima or Hiroshima and Nagasaki.
No matter how devastating they may be, during the Cold War the warring powers are conducting nuclear experiments, the results of which were the same, if not worse, consequences of the nuclear incidents and detonations that dominate the history books.
Between 1946 and 1958, the US carried out 23 nuclear tests on the remote Pacific Bokini Atoll. Among these attempts is Castle Bravo, which the United States carried out in 1954, and is the most powerful nuclear device the country has ever detonated. It is 1000 times more powerful than the bombs placed over Hiroshima and Nagasaki, and causes radioactive particles to reach as far as Australia, India and Japan.
After Castle Bravo, the inhabitants of neighboring atolls had to be evacuated, but that was not enough to be safe. After detonations, atol residents reported an increase in cancer and infant with disabilities. Forced emigration is a critical moment in US nuclear tests, although it is debatable how much Americans have been concerned about the local population. Residents of the Bikini atoll are sent to neighboring atolls, but they are not adapted to such a large population and people are starving.
Moreover, despite the assurance that the locals will be able to return to their homes after military attempts, these attempts make the atoll unfit for habitation. Pollution of water and soil makes fishing and farming impossible there. To date, radiation levels there are too high for safe habitation.
In December 1950, President Truman established New County, a Nevada site for the sole purpose of conducting nuclear trials. Ultimately, US governments are testing a total of 928 nuclear bombs, mostly underground, although many people report seeing clouds in the shape of a sponge from overground tests in the Las Vegas area.
Field workers called a particularly heavy bomb "Dirty Harry" because of the huge number of nuclear particle deposits after her detonation. Residents reported that the explosion made the sky "beautifully red" and left a "metallic taste in the air." Another explosion called Sedan has left an incredibly large crater and has infected more US residents than any other experience in the history of the country.
Today the polygon is open to visitors, but some things remain secret because visitors can not wear cameras and mobile phones, perhaps because there are still trials there.
In October 1961, the USSR detonated King's Bomb - the most powerful man-made explosive device in human history. It is detonated on Cape Suoyi on the North Island, off the coast of Northwestern Russia. The mushroom cloud was huge - seven times taller than Mount Everest. "King Bomb" was three times more powerful than Castle Bravo and 1570 times more powerful than the bombs placed over Japan by the Americans.
Although the USSR is trying to modify the bomb so that radioactive deposits do not have such an enormous impact on the environment, it destroys all buildings in the North and interrupts radio communications for an hour.
France conducted nuclear attempts at two atolls in French Polynesia from 1966 to 1996 despite the protests by the Polynesian Territorial Assembly. The first test bomb sucks all of the water from the atoll lagoon and the atoll itself starts to "die dead fish," says
281
Greenpeace. The bomb scatters radioactive particles to Peru and New Zealand.
2.2. Characteristics of uranium mining Many specialists believe that the liquidation of uranium mining
in Bulgaria in 1991. was carried out hastily, as a result of which in a number of areas there were no complete technical solutions for this activity [12].
The monitoring of the environmental status of the MOEW in the vicinity of former uranium mines includes the field radiometric measurements and laboratory analysis of soils, waste products in tailing ponds and landfills, bottom sludge, underground and surface run-off. Radiological parameters of soils, bottom sludge and waste materials are assessed by analyzing samples from the EEA for the control of potential pollutants [13]. The water samples are analyzed radiochemically with respect to the indicators laid down in BDS 2823 "Drinking Water" - total beta radioactivity, uranium content and radium content [14].
With the entry into force of Decree of the Council of Ministers № 74 / 27.03.1998 on eradication of the consequences of the mining and processing of uranium raw materials, Ecoinengineering -RM EOOD is responsible for organizing and controlling the activities related to the technical liquidation, the technical and biological reclamation, water management and the conduct of complex environmental monitoring of environmental components. Despite the existence of a legal basis, monitoring networks are not built and operated at all sites, as recommended by the Chairman of the Energy Committee "Instruction for Organization of System for Monitoring, Design, Construction and Operation of Environmental Surveillance Networks Influenced by uranium industry regions "[15].
Under the Phare Program "Complex Program for Cleaning and Monitoring of the Areas Affected by Uranium Production and Processing in Buhovo", in March 1999 a Local System for Basic Environmental Monitoring in the Buhovo - Yana Region (LBMM) . The system consists of two monitoring containers located in Buhovo and Yana, two reception centers - in Rare Metals EOOD, Buhovo and in the EEA - MOEW, as well as a information board for continuous informing the public, installed at the Buhovo cultural home .
LMPMM aims to continuously monitor environmental performance before rehabilitation activities, over time and long-term after completion of restoration work in the area. The monitoring containers are equipped with measuring equipment for continuous control of total dust, radiological parameters: gamma radiation dose rate, radon concentration in ground air, meteor parameters: wind direction and wind speed, temperature and humidity of the ground air, atmospheric pressure and rainfall [16].
The results obtained and their comparison with the applicable normative documents give grounds for some general assessments and conclusions.
• in the settlements located close to the former uranium production areas studied and the adjacent agricultural areas, the concentration of natural radionuclides in the soil and the level of the radiation background are not altered.
• Following the liquidation of uranium mines, access to some of them is not sufficiently limited.
• Places where the radiation background is several times higher than the natural background should be restricted by population access, despite the minor radiation risk.
• Liquidation procedures should be completed in the "Grazovitsa" loading ramp and the soil should be deactivated on a limited area [17].
A concrete wall should be erected around the embankment of uranium ore at the Rivers of Nevi, in the village of Dobralak, avoiding scattering and inappropriate use of the ore.
The results of the surveys were also provided to the relevant municipalities in order to inform the local public and to limit the phenomena of radio-phobia or frivolity by the people in the mentioned areas. Besides, the assessments carried out more broadly
will contribute to the conduct of an adequate economic policy in the surveyed regions.
The problem with the content of uranium and alpha particles in the drinking water of Haskovo, Parvomay and Velingrad from April 2017 was highlighted here. Then increased uranium content was found in four wells of the nine supplying cities of Haskovo. Survey data from September 2016, but only in the public domain came out this year. Specific values for the overriding meanings have not yet come out officially, but there is a number of over-norms mentioned. Similar data are available for other settlements. In immediate proximity to these settlements there were uranium mines, which are no longer functioning but not preserved according to the requirements of the Bulgarian and international legislation. Money for mine closure has been absorbed, and work has not been done to the best of its quality. So rainwater and underground rivers flow through the former mines safely and extract radioactive isotopes and particles.
Regardless of the reasons for the increased content of uranium, it is inadmissible to silence the truth in pursuit of purely economic or political ends and thus to put people from different regions of the country at risk for their lives.
2.3.Characterisation of radiation from other activities
Air crews and passengers traveling on high-flying airplanes, i. at high heights, can also receive increased cosmic exposure. Its intensity depends on the duration of the flight, the solar activity, the latitude, etc.
Often electronic and luminous devices, research apparatus, watches, toys and others contain radium - 226, strontium - 90, tritium, etc., which contribute to the increase in the human radioactive dose. In modern life and production, many of the apparatuses, machines, utensils, and articles of use contain radioactive materials and imitate radiation in their use.
For example, uranium is used in dentistry as a glaze of ceramics, this element as well as fertilizer add firmness to materials used in dentistry. Radioactive materials have entered the industry and bust at a violent pace after the Second World War.
The peaceful atom enters the medical procedures, especially in well-developed countries, where the population is significantly more exposed to radioactive exposure. Research laboratories and some industries emit radioactive waste, which can be a source of pollution if the purity and safety guidelines for handling such substances are not strictly observed [18].
Already at the beginning of the 20th century, under the influence of information on the stimulating action of radioactive radiation on plant development, the interest in radioactivity increased and various preparations and fertilizers containing radioactive elements were placed on the market. Interestingly, even after the end of World War II and the atomic bombing over Hiroshima and Nagasaki, the interest in radioactive substances such as fertilizers has also increased and increased in some countries such as the United States, Canada, Denmark where a large number of vascular and Polish experiments to test the effect of radioactive substances on field, vegetable and other crops.
Many scientists and specialists have convincingly demonstrated as a result of numerous vascular and field trials that increasing crop yields can be achieved by developing new agro-technical methods and technologies and applying many other substances, fertilizers and activities instead of use radioactive substances that hinder the risk of increasing the radioactive background of the soil and the environment [19].
It has been shown that certain quantities of radioactive substances are introduced into soil with mineral fertilizers that may pose a risk to human health. According to agrochemists and fertilizer specialists, the potassium element - 40 (0.012% of the permanent isotopic composition of natural potassium in whatever minerals, salts, substances) is always introduced into the soil - is not a threat to the living organisms.
282
Phosphorous fertilizers are also known as uranium and radium, but as traces of only theoretical significance as dangerous components. It has been found that the amounts of uranium and radium in phosphorites from different sources are different. Grounds for concern are the results of checks on the accumulation of uranium and radium in greenhouse soils where mineral fertilizers are applied at very high levels. It was found that in these soils, compared to neighboring normally fertilized fields, the uranium content increased by 75% and the radius by 10-70%, for a 5-10 year intensive use of greenhouses. The uranium and radium content of superphosphate and phosphorus is 10 and 50 times higher than soil content. According to the calculations for the introduction of optimal doses of phosphorous fertilizers, there is no practical danger of reaching uranium and radium limit values in the near future, but adherence to optimal fertilization standards with phosphorous fertilizers is mandatory. The results of the agrochemical and biochemical studies did not show an increase in the concentration of uranium, radium and thorium in the country's greenhouse soils.
From the point of view of environmental and food security, it is necessary to periodically monitor the radiation status of intensively fertilized soils with phosphorus [20].
Fertilizers and agrochemistry specialists argue that there is a real danger of using phosphors in the construction or chemical melioration of salted soils with the radioactive elements contained therein. The analyzes show that phosphorus does not differ significantly in the content of radioactive elements from the soil into which it is introduced. Batch phosphogies with higher radioactivity are encountered, but it is always lower than the superphosphate radioactivity. According to some hypotheses, the technological operations for the production of phosphorous fertilizers in which the phosphogypsum is a waste do not include the phosphorus-containing radioactive elements and, regardless of the fact, this product is administered at a dose of 20-30 tonnes per hectare of phosphogypsum at Soil melioration This product is not capable of enriching soils with radioactive elements. However, during meliorative activities, specialists should refrain from very high doses of phosphogypsum, although they may be introduced into the soil once, as some of its properties may deteriorate.
3.Conclusions:
1. The formation of radioactive contamination and its behavior is of interest for both preventive measures and after a nuclear or nuclear accident at the NPP.
2. Radioactive contamination in a radiological or nuclear accident will be determined by a wide range of factors that determine the contamination of tropospheric air, soil, water, plants and the overall environment.
3. Optimized control of radioactive contamination following an accident contributes to the proper organization of evacuation rescue operations as well as to the decontamination of contaminated areas and food products.
4.Literature: 1. Dolchinkov N. T. , N. B. Nichev, Characteristics of
radiation, Revista academiei fortelor terestre „Nicolae Bãlcescu“, Sibiu,Rumania, no.2(82)/2016, ISSN 2247-840X, ISSN-L = 1582-6384;
2. Долчинков Н, Радиационната безопасност в България, Научна конференция „Радиационната безопасност в съвременния свят“ НВУ „В. Левски“- гр. В. Търново – 11 ноември 2016;
3. Куклев Ю.И., Физическая екология-Москва, Высшая школа, 2003, 308-319 с.
4. Харалампиев М., Долчинков Н., Контролът на радиоактивното замърсяване – важен фактор за ядрената сигурност на България, НВУ „Васил Левски“, Велико Търново, юли 2014;
5. Алексеев С. В., Пивоваров Ю. П.,Янушанец О. И. Экология человека, Икар, Москва, 2002;
6. Кулев И., Р. Златанова, П. Костадинов, М. Димитров, Г. Генчев, П. Пеев, Колко опасни за населението са течните радиоактивни изхвърляния от АЕЦ „Козлодуй“?, БалБок, София, 2002;
7. Национален доклад за състоянието и опазването на околната среда в Р България през 2013 г. на ИАОС;
8. Тримесечен бюлетин за състоянието на околната среда за периода октомври – декември 2016 г. на ИАОС;
9. Национален доклад за състоянието и опазването на околната среда в Р България през 2014 г. на ИАОС;
10. Бончев Цв., Цанков Л. и др. Справочник на радионуклидите, характерни за АЕЦ. Тита консулт. София 1997;
11. Тачев Г., Бончев Цв., Ангелов В., Пенчев Н. Защита на населението при авария в АЕЦ „Козлодуй“, БалБок. София;
12. Божков, И. 2007. Уранови находища в България - състояние и перспективи за добив. - Сп. Минно дело и геология, 3, 8-11;
13. Изследване на естествения и техногенен радиационен статус на районите в поречието на река Горна Арда, Отчет на тема Ф-633/1996г., фонд „Научни изследвания“, МОНТ;
14. Антонов А., Г.Белев, В.Жучко и др., Прецизен полупроводников спектрометър при ядрено-физична лаборатория „МИКРОТРОН“ при ПУ „П.Хилендарски“, Доклади на БЯД, т.2, бр. 1, юли 1997;
15. Диков Д., Божков И. Уранови находища в България - състояние и потенциал. Списание на българското геологическо дружество, год. 75, кн. 1–3, 2014, с. 131–137;
16. ПМС № № 3/ 15.01.2014г. за разпределение на средствата по програми за техническа ликвидация и консервация на обекти от миннодобивния отрасъл за 2014;
17. Сренц А., Христов Хр., Недева П., Балабанов Н. Радиоекологични последици от уранодобива в Пловдивска и Смолянска области. Булатом. София 2006;
18. Маринченко А. В., Безопасность жизнедеятельности, ИТК „Дашков и К“, Москва, 2015;
19. Пивоваров Ю.П.,Радиационная екология, Москва, Академия, 2004,18-25 с;
20. Пивоваров Ю., Михалев В. Радиационная экология. Академа. Москва 2004.