21
2015 Economic and Financial Review MINISTRY OF FINANCE NEVIS ISLAND ADMINISTRATION
| Date post: | 12-Jan-2023 |
| Category: |
Documents |
| Upload: | khangminh22 |
| View: | 0 times |
| Download: | 0 times |
2015
Economic and Financial
Review
MINISTRY OF FINANCE
NEVIS ISLAND ADMINISTRATION
1
OVERVIEW
This report provides an update on the fiscal performance of the NIA and the economic performance
of the major sectors in Nevis for the period January to December 2015. The year has proven to be
an exceptional one, with an overall improvement in the performances of the various sectors.
Similarly, the fiscal performance of the government was one with increased revenue collection
and a slight reduction in the expenditure outlay.
FISCAL AND DEBT
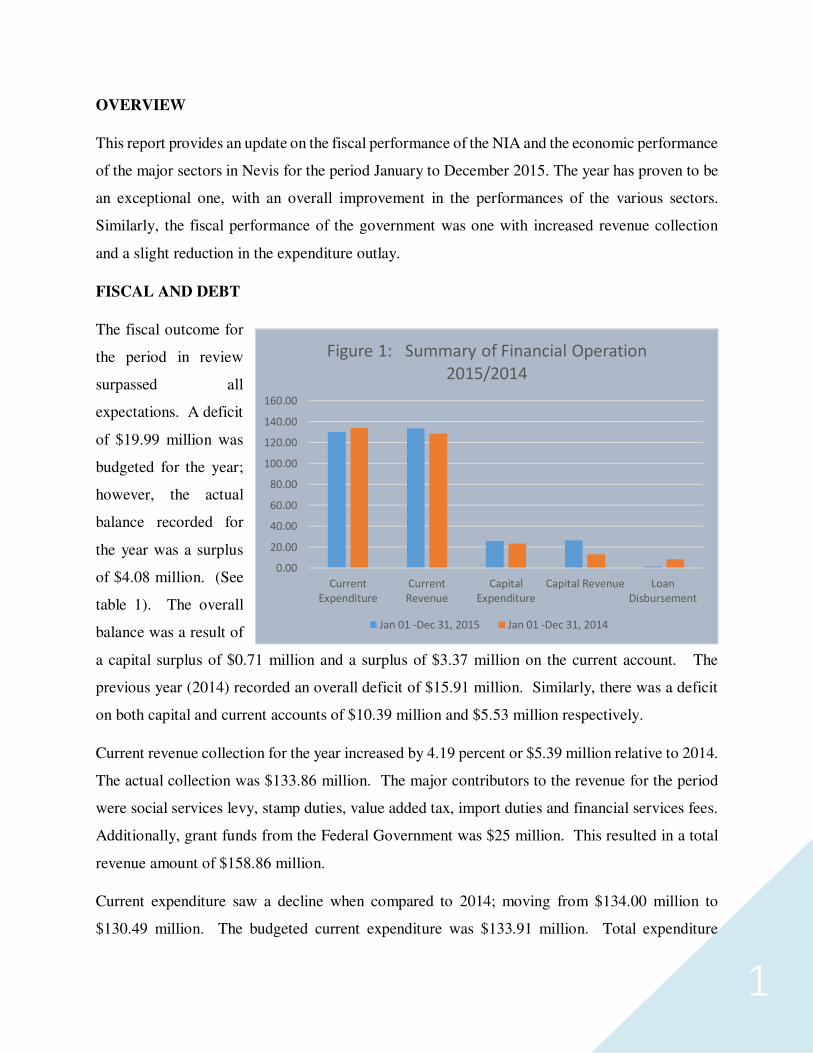
The fiscal outcome for
the period in review
surpassed all
expectations. A deficit
of $19.99 million was
budgeted for the year;
however, the actual
balance recorded for
the year was a surplus
of $4.08 million. (See
table 1). The overall
balance was a result of
a capital surplus of $0.71 million and a surplus of $3.37 million on the current account. The
previous year (2014) recorded an overall deficit of $15.91 million. Similarly, there was a deficit
on both capital and current accounts of $10.39 million and $5.53 million respectively.
Current revenue collection for the year increased by 4.19 percent or $5.39 million relative to 2014.
The actual collection was $133.86 million. The major contributors to the revenue for the period
were social services levy, stamp duties, value added tax, import duties and financial services fees.
Additionally, grant funds from the Federal Government was $25 million. This resulted in a total
revenue amount of $158.86 million.
Current expenditure saw a decline when compared to 2014; moving from $134.00 million to
$130.49 million. The budgeted current expenditure was $133.91 million. Total expenditure
0.00
20.00
40.00
60.00
80.00
100.00
120.00
140.00
160.00
Current
Expenditure
Current
Revenue
Capital
Expenditure
Capital Revenue Loan
Disbursement
Figure 1: Summary of Financial Operation
2015/2014
Jan 01 -Dec 31, 2015 Jan 01 -Dec 31, 2014
2
(current and capital expenditure) declined from one year to the next; moving from $157.54 million
to $156.42 million in 2015. The various categories under current expenditure had minimal
variances from one period to the next. (See table 3)
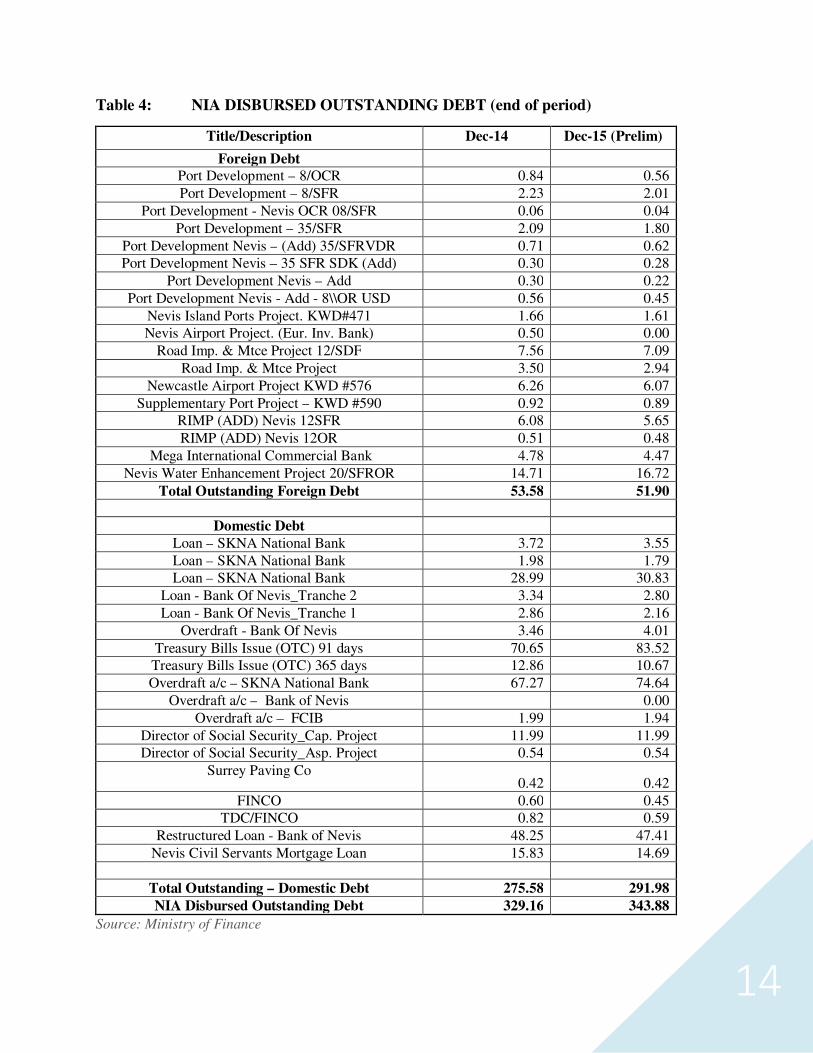
In 2015, the major debt activities that took place were the finalization of the restructuring with the
Kuwait Fund and National Bank. Additionally, disbursements for the Nevis Water Enhancement
Project continued and a final payment was made to the European Investment Bank loan.
At the end of December 2015, the NIA’s debt increased to $343 million from $329 million in
December 2014. The domestic portion of the debt increased by 6 percent; moving from $275
million in 2014 to $291 million in 2015. The increase in domestic debt was due to the increase in
the 91 day Treasury bills and capitalised interest at National Bank, resulting from non-payment of
the loans. External debt decreased by 0.03 percent over the similar period, moving from $53
million to $51 million.
CAPITAL PROJECTS
During the fiscal year 2015, the upgrades of police services was a major undertaking within the
Premier’s Ministry. The project commanded $0.16 million or 73.22 percent of the monies
expended by the ministry. Similarly, vehicle payments and maintenance claimed the majority of
funds under the Ministry of Finance. These payments were computed at $0.45 million 32.21
percent of the Ministry’s expended sum. Conversely, statistical surveys claimed the least, securing
$0.02 million or 1.65 million. In total, $1.40 million was expended by the ministry for the year in
review.
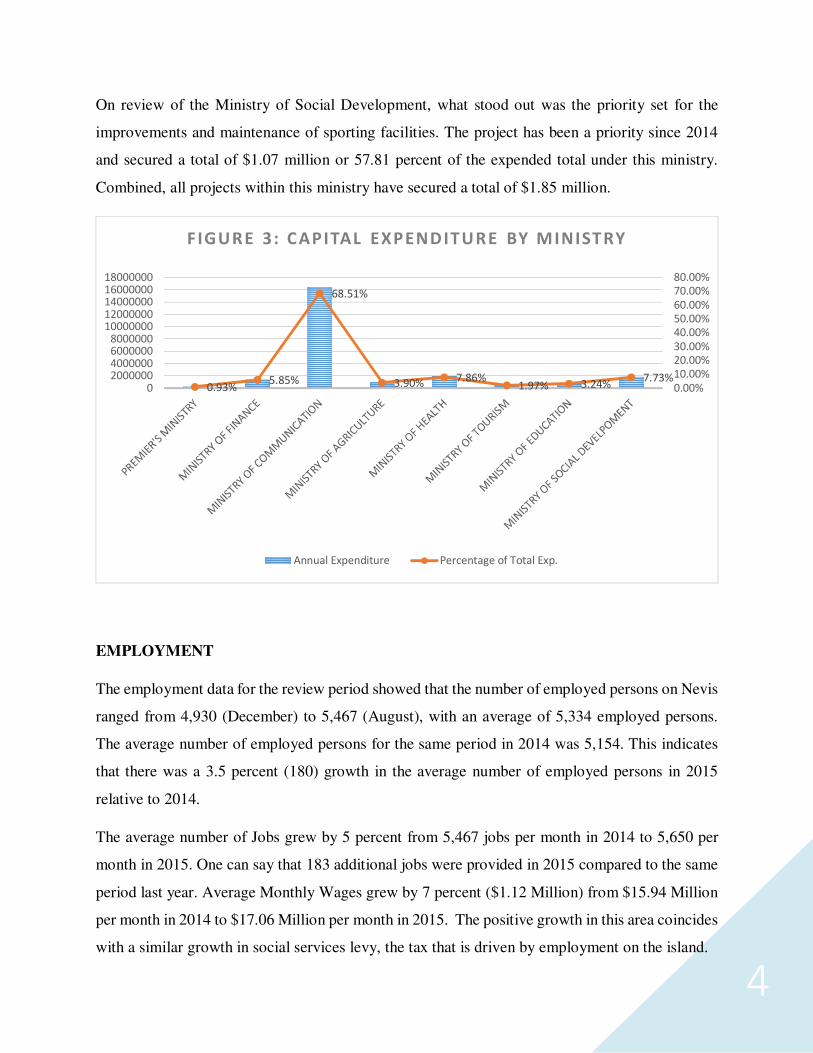
The Ministry of Communications, a critical ministry for development, has managed to not only
secure the majority of all the ministries for the year in review, but also for the fiscal year that
preceded. The ministry has managed to secure $9.55 million in 2014; 64.27 percent of the period’s
total expenditure. This amount grew to $16.36 million or 68.51 percent in 2015. The venture that
commanded the bulk of the funds was the Major Road Projects, the project secured $4.00 million
or 24.46 percent of the annual actuals.
The Ministry of Agriculture and Tourism, two of the more critical sectors on the island, expended
$1.40 million for the year in review. Tourism, the main economic driver and leading sector,
3
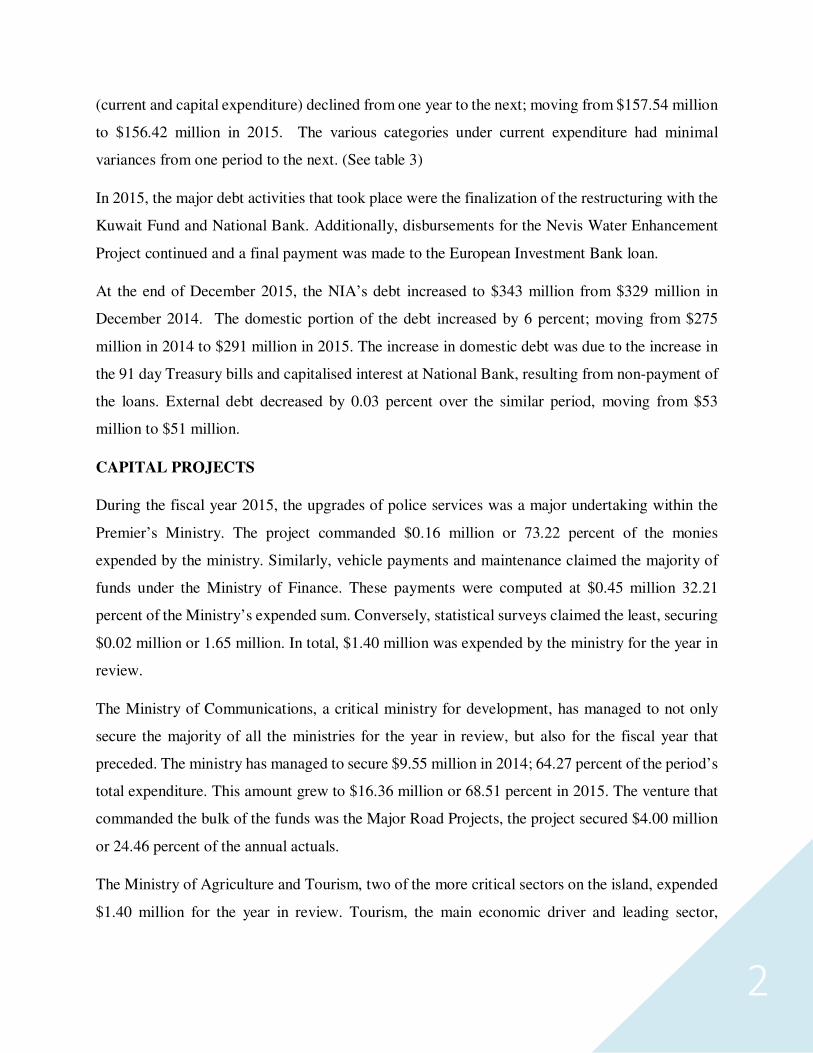
expended a marginal $0.47 million. The project that secured the majority of the funds was the
development and upgrades made to the Heritage Site.
Agriculture, the sector that has the ability to reduce the import bill, was apportioned $0.93 million
for the year in review. Within the sector, the expansion of the veterinary clinic received funding
in the amount of $0.50 million. Other ventures funded include the procurement of Agricultural
equipment and the funding of the Agricultural Diversification Trust.
Figure 2 displays an outlay of projects for both the Ministry of Agriculture and the Ministry of Tourism.
The circular chart represents the Ministry of Agriculture and its rectangular counterpart represents the
Ministry of Tourism.
Invested in the areas of Education and Health, critical sectors for social development, was $2.65
million. The Ministry of Education secured $0.77 million and the Ministry of Health received
$1.88 million. In the area of education, the majority of the funds were geared toward the Expansion
of the Joycelyn Liburd Primary School. This project received $0.55 million and funds were
apportioned to the construction of a school cafeteria. Likewise, the Nevis Environment Work
program procured the majority of the monies expended under the Ministry of Health. The project
received a sum of $0.70 million or 37.25 percent of the annual expenditure.
386934.13, 28%
44142.94, 3%
500000, 36% 425623.33, 30%
45917.69, 3%
471541.02,
33%
Project Classification by Ministry
Agriculture Diversification Thrust
Procurement of Agriculture
Equipment (New)
Expansion of the veterinary clinic
Upgrading and Development Of
Heritage Site
Development of Media Services
4
On review of the Ministry of Social Development, what stood out was the priority set for the
improvements and maintenance of sporting facilities. The project has been a priority since 2014
and secured a total of $1.07 million or 57.81 percent of the expended total under this ministry.
Combined, all projects within this ministry have secured a total of $1.85 million.
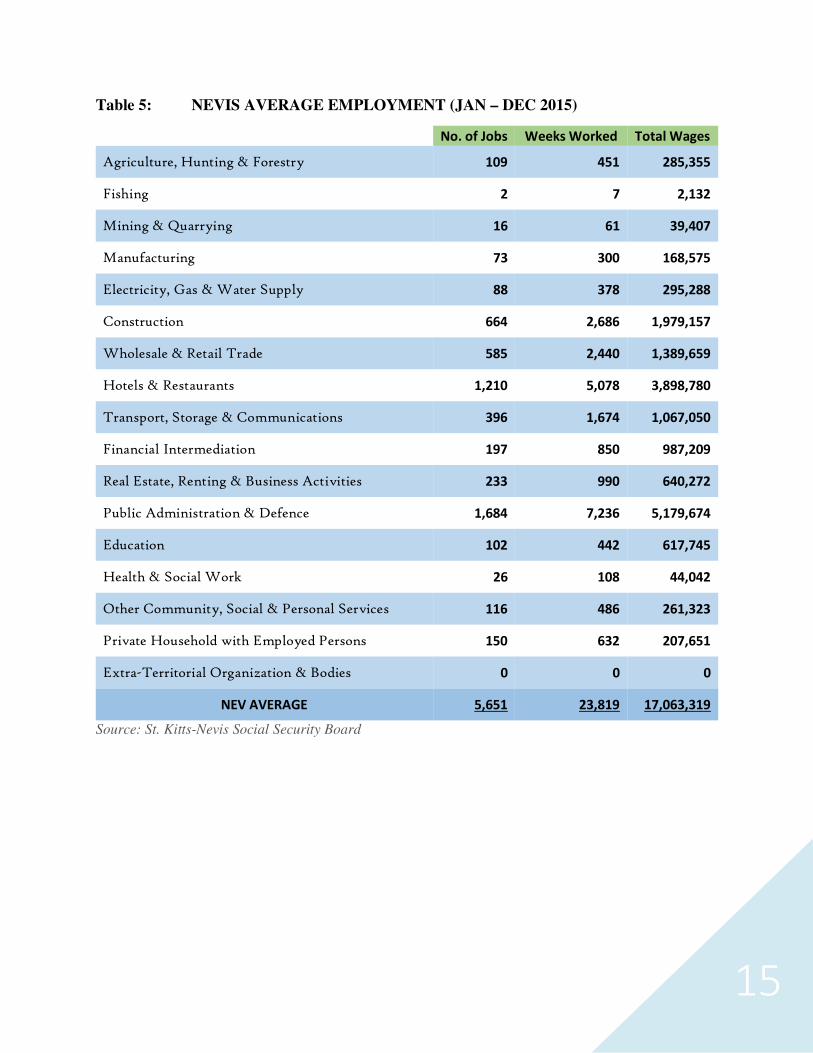
EMPLOYMENT
The employment data for the review period showed that the number of employed persons on Nevis
ranged from 4,930 (December) to 5,467 (August), with an average of 5,334 employed persons.
The average number of employed persons for the same period in 2014 was 5,154. This indicates
that there was a 3.5 percent (180) growth in the average number of employed persons in 2015
relative to 2014.
The average number of Jobs grew by 5 percent from 5,467 jobs per month in 2014 to 5,650 per
month in 2015. One can say that 183 additional jobs were provided in 2015 compared to the same
period last year. Average Monthly Wages grew by 7 percent ($1.12 Million) from $15.94 Million
per month in 2014 to $17.06 Million per month in 2015. The positive growth in this area coincides
with a similar growth in social services levy, the tax that is driven by employment on the island.
0.93%5.85%
68.51%
3.90% 7.86%1.97% 3.24%
7.73%0.00%
10.00%
20.00%
30.00%
40.00%
50.00%
60.00%
70.00%
80.00%
02000000400000060000008000000
1000000012000000140000001600000018000000
F IGURE 3: CAPITAL EXPENDITURE BY MINISTRY
Annual Expenditure Percentage of Total Exp.
5
TOURISM
The annual tourism preliminary statistics display a pattern of growth, subsequent to 2014 when
analysing the data collected from the Vance Amory International Airport (VAIA) as well as
visitors arriving via the Robert Llewellyn Bradshaw (RLB) International Airport destined to Nevis.
During the period, a total of 36,221 visitors (excluding residents) visited the shores of Nevis via
air, a 10.49 percent increase relative to the fiscal year 2014. Conversely, the quantity of cruise and
yacht arrivals fell in 2015, declining from 11,022 to 9984 or 9.42 percent. Combined, the visitor
arrivals via air and sea grew by 1.07 percent for the period under review.
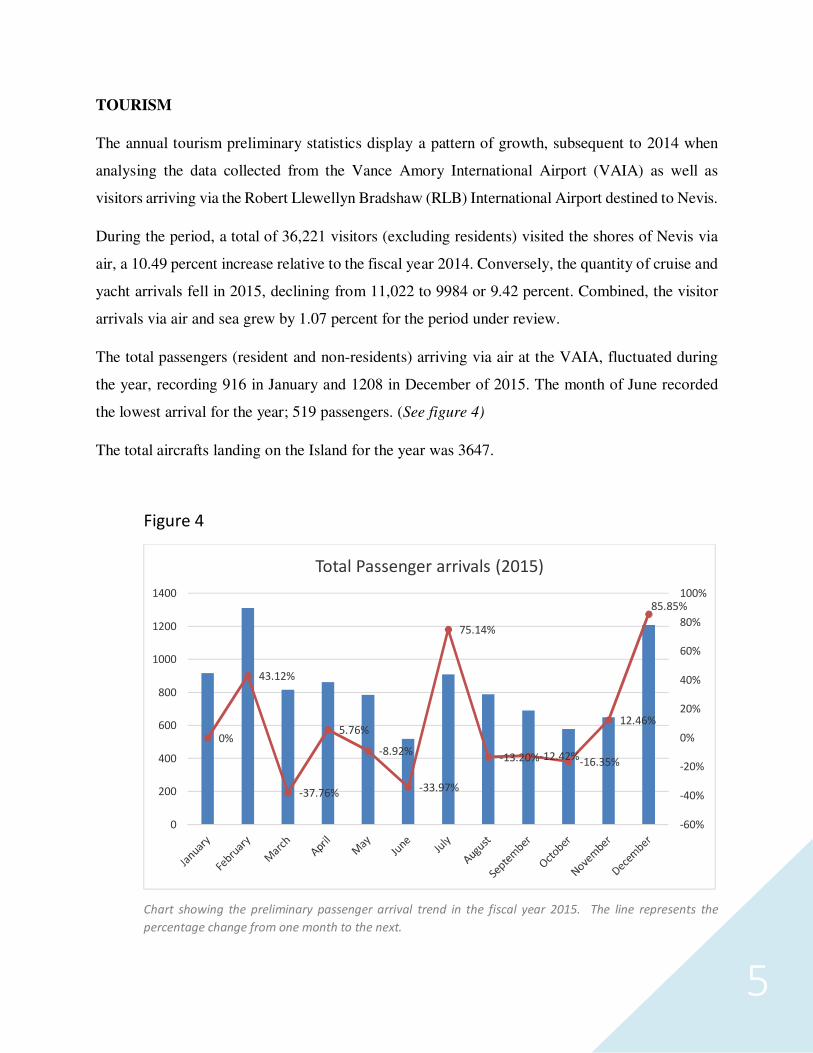
The total passengers (resident and non-residents) arriving via air at the VAIA, fluctuated during
the year, recording 916 in January and 1208 in December of 2015. The month of June recorded
the lowest arrival for the year; 519 passengers. (See figure 4)
The total aircrafts landing on the Island for the year was 3647.
Figure 4
Chart showing the preliminary passenger arrival trend in the fiscal year 2015. The line represents the
percentage change from one month to the next.
0%
43.12%
-37.76%
5.76%
-8.92%
-33.97%
75.14%
-13.20%-12.42%-16.35%
12.46%
85.85%
-60%
-40%
-20%
0%
20%
40%
60%
80%
100%
0
200
400
600
800
1000
1200
1400
Total Passenger arrivals (2015)
6
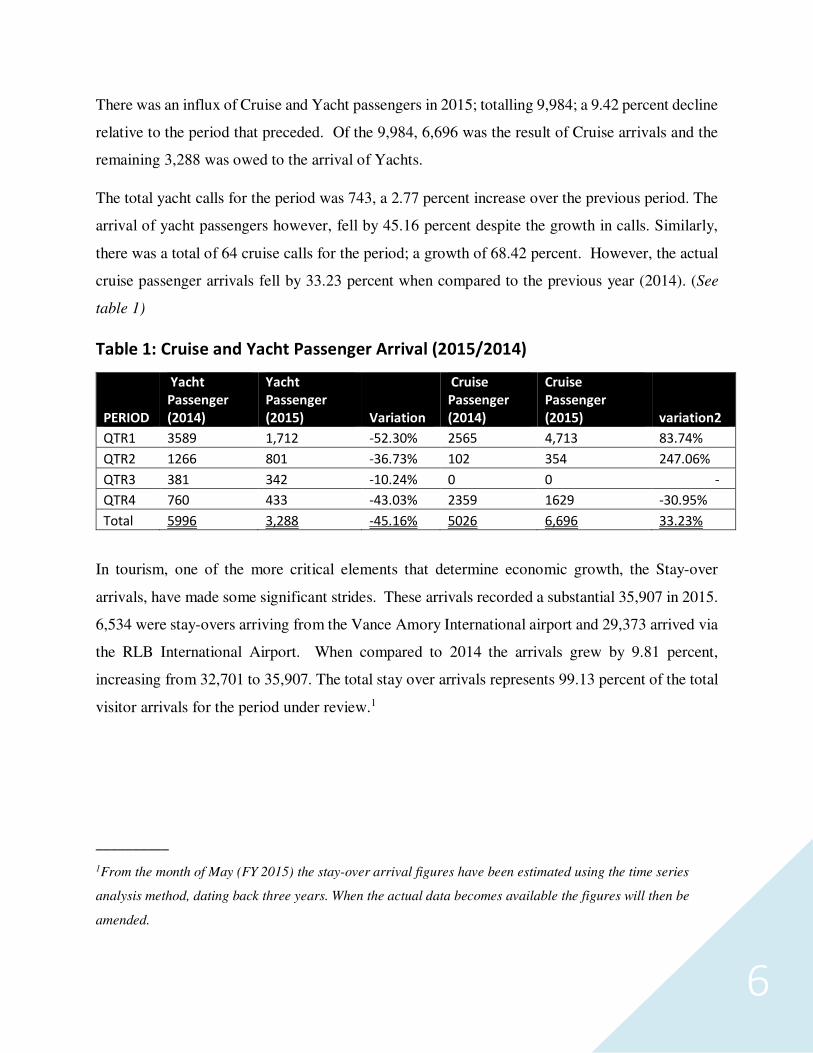
There was an influx of Cruise and Yacht passengers in 2015; totalling 9,984; a 9.42 percent decline
relative to the period that preceded. Of the 9,984, 6,696 was the result of Cruise arrivals and the
remaining 3,288 was owed to the arrival of Yachts.
The total yacht calls for the period was 743, a 2.77 percent increase over the previous period. The
arrival of yacht passengers however, fell by 45.16 percent despite the growth in calls. Similarly,
there was a total of 64 cruise calls for the period; a growth of 68.42 percent. However, the actual
cruise passenger arrivals fell by 33.23 percent when compared to the previous year (2014). (See
table 1)
Table 1: Cruise and Yacht Passenger Arrival (2015/2014)
PERIOD
Yacht
Passenger
(2014)
Yacht
Passenger
(2015) Variation
Cruise
Passenger
(2014)
Cruise
Passenger
(2015) variation2
QTR1 3589 1,712 -52.30% 2565 4,713 83.74%
QTR2 1266 801 -36.73% 102 354 247.06%
QTR3 381 342 -10.24% 0 0 -
QTR4 760 433 -43.03% 2359 1629 -30.95%
Total 5996 3,288 -45.16% 5026 6,696 33.23%
In tourism, one of the more critical elements that determine economic growth, the Stay-over
arrivals, have made some significant strides. These arrivals recorded a substantial 35,907 in 2015.
6,534 were stay-overs arriving from the Vance Amory International airport and 29,373 arrived via
the RLB International Airport. When compared to 2014 the arrivals grew by 9.81 percent,
increasing from 32,701 to 35,907. The total stay over arrivals represents 99.13 percent of the total
visitor arrivals for the period under review.1
__________
1From the month of May (FY 2015) the stay-over arrival figures have been estimated using the time series
analysis method, dating back three years. When the actual data becomes available the figures will then be
amended.
7
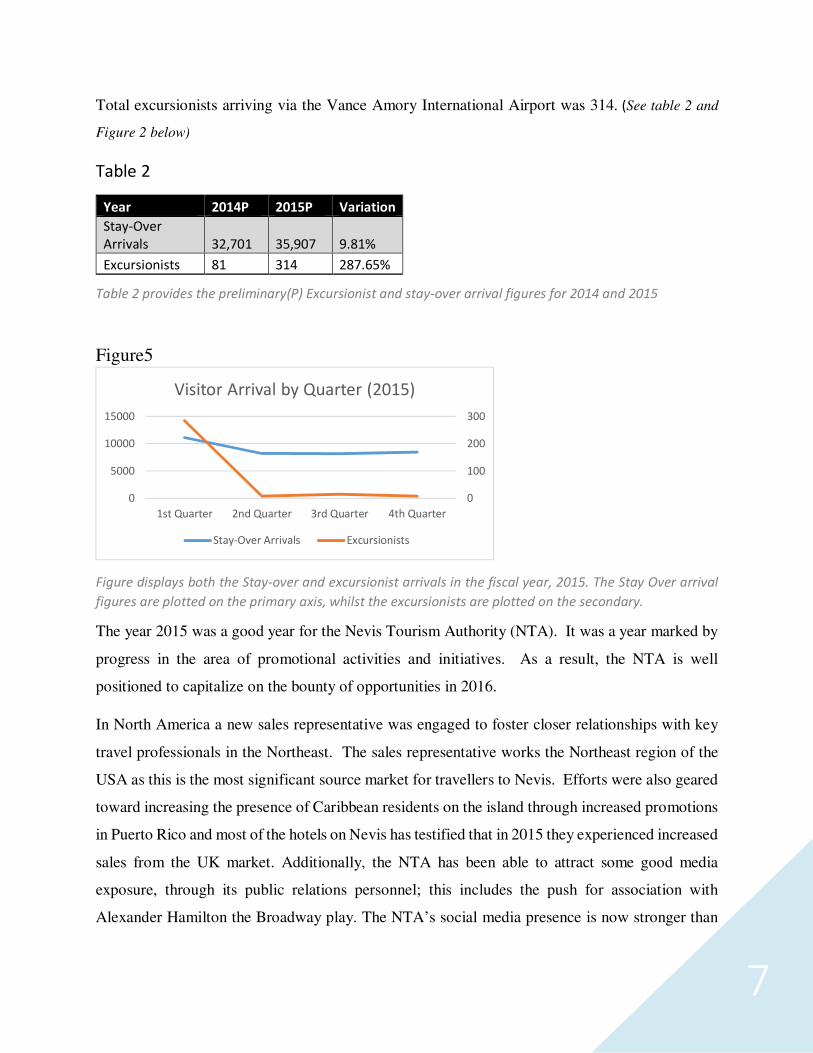
Total excursionists arriving via the Vance Amory International Airport was 314. (See table 2 and
Figure 2 below)
Table 2
Table 2 provides the preliminary(P) Excursionist and stay-over arrival figures for 2014 and 2015
Figure5
Figure displays both the Stay-over and excursionist arrivals in the fiscal year, 2015. The Stay Over arrival
figures are plotted on the primary axis, whilst the excursionists are plotted on the secondary.
The year 2015 was a good year for the Nevis Tourism Authority (NTA). It was a year marked by
progress in the area of promotional activities and initiatives. As a result, the NTA is well
positioned to capitalize on the bounty of opportunities in 2016.
In North America a new sales representative was engaged to foster closer relationships with key
travel professionals in the Northeast. The sales representative works the Northeast region of the
USA as this is the most significant source market for travellers to Nevis. Efforts were also geared
toward increasing the presence of Caribbean residents on the island through increased promotions
in Puerto Rico and most of the hotels on Nevis has testified that in 2015 they experienced increased
sales from the UK market. Additionally, the NTA has been able to attract some good media
exposure, through its public relations personnel; this includes the push for association with
Alexander Hamilton the Broadway play. The NTA’s social media presence is now stronger than
0
100
200
300
0
5000
10000
15000
1st Quarter 2nd Quarter 3rd Quarter 4th Quarter
Visitor Arrival by Quarter (2015)
Stay-Over Arrivals Excursionists
Year 2014P 2015P Variation
Stay-Over
Arrivals 32,701 35,907 9.81%
Excursionists 81 314 287.65%
8
ever before. Facebook, Instagram and Twitter are utilized with good results and steady growth in
followers.
Nevis is blessed with a host of events which are perfect to attract travellers and the NTA supports
them regularly. These include the Blues Festival, the Nevis to St. Kitts Cross Chanel Swim, the
Nevis Mango and Food Festival, Culturama, the Nevis Marathon and Running Festival, and the
Nevis Triathlon. We launched the Nevis Romance Symposium in October of 2015 as an annual
event to solidify Nevis’ relationship with travel professionals who focus on selling romance.
There is a significant improvement in the relationship between the Authority and the various
airlines. Seaborne continues to fly its scheduled route from Puerto Rico. Cape Air experienced
some unexpected operational issues and had to suspend its service but through the services of
Caribbean Helicopters we re-established our link with Antigua and will soon extend that
connection to other islands through LIAT. Winair now has daily service between Nevis and St.
Martin. There is also now relationships with international airlines, including British Airways and
Delta Airlines; both of which the NTA had the opportunity to meet with in the fall.
The combination of these new relationships, initiatives, and heightened productivity from the team
locally and internationally has placed our tourism product in a more lucrative position in
comparison to 2014.
FINANCIAL SERVICES
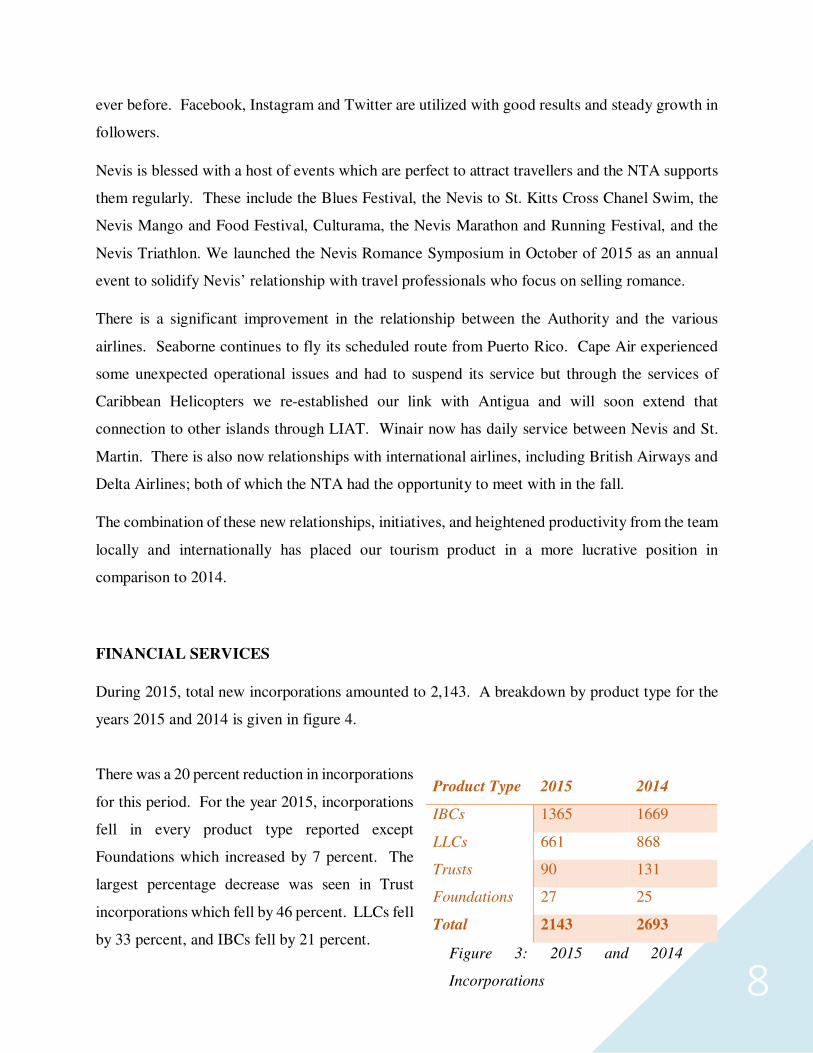
During 2015, total new incorporations amounted to 2,143. A breakdown by product type for the
years 2015 and 2014 is given in figure 4.
There was a 20 percent reduction in incorporations
for this period. For the year 2015, incorporations
fell in every product type reported except
Foundations which increased by 7 percent. The
largest percentage decrease was seen in Trust
incorporations which fell by 46 percent. LLCs fell
by 33 percent, and IBCs fell by 21 percent.
Product Type 2015 2014
IBCs 1365 1669
LLCs 661 868
Trusts 90 131
Foundations 27 25
Total 2143 2693
Figure 3: 2015 and 2014
Incorporations
9
Conversely, total revenue generated by the Department for the year increased by 8 percent. During
2014, the Department generated $12.8 million, while $13.9 million was generated in 2015. This
was mainly due to increases in renewal fees and late payment penalties; 9 and 12 percent
respectively.
There was an 11 percent increase in entities dissolved over that of 2014. There has also been a 27
percent increase in entities that were struck. Conversely, there was a 20 percent decline in entities
reinstated. All of these factors affect the total number of active entities registered. As of January
6th 2016, there were seventeen thousand six hundred and seventy-five (17,675) active entities on
the register.
AGRICULTURE
Throughout the year in review, the Ministry of Agriculture continued to keep a keen “eye on
agriculture” and embarked on a number of activities which promoted agriculture on a wider scale.
Below is a list of activities crafted by the Department of Agriculture to ensure that production and
productivity increased; thus, resulting in enhanced quality and quantity in agricultural products on
the island:
� January 2015 – The Ministry held an event to assure farmers that the NIA will share the
burden of the increased cost of animal feed by suppliers.
� March 2015 - Annual Agriculture Open Day: This was geared towards strengthening the
drive towards food security on the island. Deservingly, a number of persons involved in
the Agriculture Industry were honored for their contribution to the development of the
sector.
� May 2015- Third Annual Agriculture Awareness Month: The month of May was marked
as the busiest month for the Ministry. There were different areas of activities ranging from
crop and livestock production to greenhouse technology and fishing. This ensured the
continued diversification of the agricultural landscape of Nevis. To culminate the month,
the Ministry of Agriculture launched its website, www.nevisagriculture.com. The launch
10
of this website underscored the thrust of the Ministry and Department of Agriculture
towards ensuring that food safety and security continue to be the major pillars in the success
of this important industry.
� December 2015 – “The Way Forward for Breadfruit and Breadnut” Workshop: the
breadfruit and breadnut crops were selected by the Food and Agriculture Organization
(FAO) and the Ministry Agriculture to help improve food security on the island. The
project is a long term project which is deemed viable once implemented effectively and is
expected to provide food for the next 50 years.
Boosting production has continued to be the primary focus for the Ministry of Agriculture. The
necessary resources, equipment and new technology are made available for all farmers and
stakeholders involved.
Despite the challenges that agriculture faced during the period in review, the level of optimism is
high due to the rekindled interest in farming and the involvement of the younger generation to the
development of the industry. The future for agriculture looks bright and the Ministry of
Agriculture is positive that agriculture could be restored to being the “breadbasket” of the
Federation as in former days.
CONCLUSION
A brief assessment of the various ministries reveal fiscal prudence in the execution of capital
projects for the fiscal year, 2015. The financial assistance given by the Federal Government was
beneficial in ensuring the continuity and commencement of these projects. Additionally, the
Ministry of Finance continue to encourage all ministries and departments to prioritize and curtail
spending. This is crucial in ensuring that the road ahead is one of sustainability and growth.
11
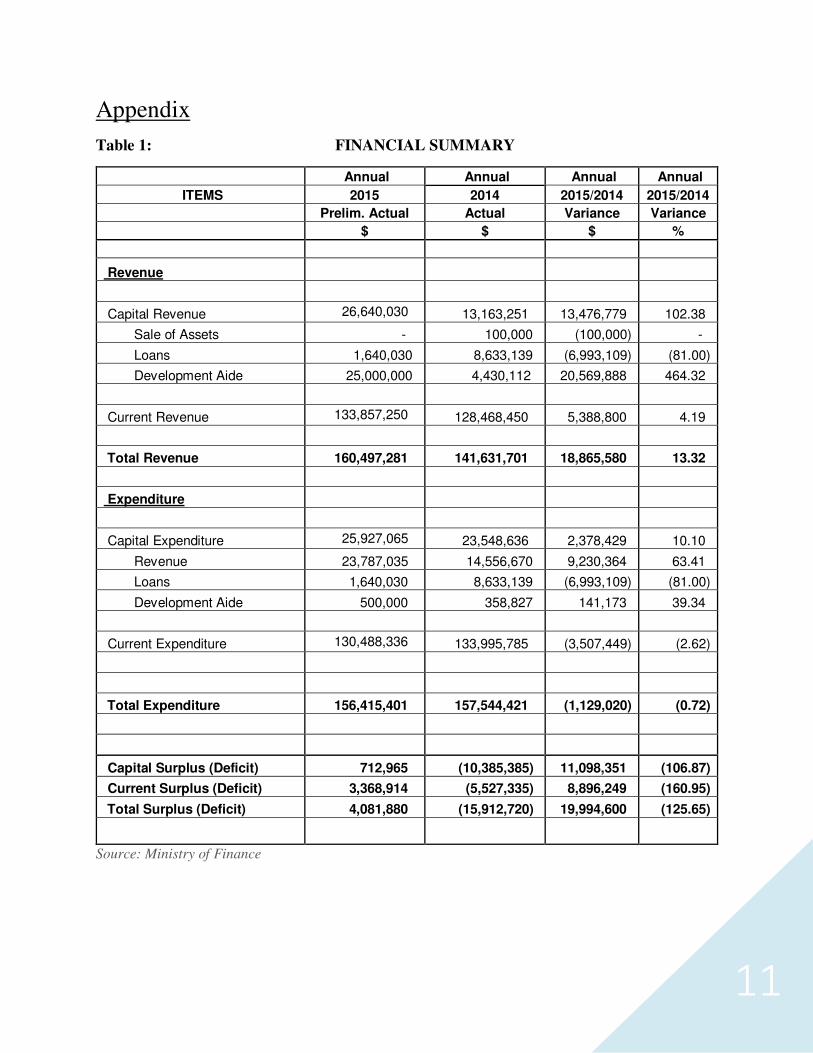
Appendix
Table 1: FINANCIAL SUMMARY
Annual Annual Annual Annual
ITEMS 2015 2014 2015/2014 2015/2014
Prelim. Actual Actual Variance Variance
$ $ $ %
Revenue
Capital Revenue 26,640,030 13,163,251 13,476,779 102.38
Sale of Assets - 100,000 (100,000) -
Loans 1,640,030 8,633,139 (6,993,109) (81.00)
Development Aide 25,000,000 4,430,112 20,569,888 464.32
Current Revenue 133,857,250 128,468,450 5,388,800 4.19
Total Revenue 160,497,281 141,631,701 18,865,580 13.32
Expenditure
Capital Expenditure 25,927,065 23,548,636 2,378,429 10.10
Revenue 23,787,035 14,556,670 9,230,364 63.41
Loans 1,640,030 8,633,139 (6,993,109) (81.00)
Development Aide 500,000 358,827 141,173 39.34
Current Expenditure 130,488,336 133,995,785 (3,507,449) (2.62)
Total Expenditure 156,415,401 157,544,421 (1,129,020) (0.72)
Capital Surplus (Deficit) 712,965 (10,385,385) 11,098,351 (106.87)
Current Surplus (Deficit) 3,368,914 (5,527,335) 8,896,249 (160.95)
Total Surplus (Deficit) 4,081,880 (15,912,720) 19,994,600 (125.65)
Source: Ministry of Finance
12
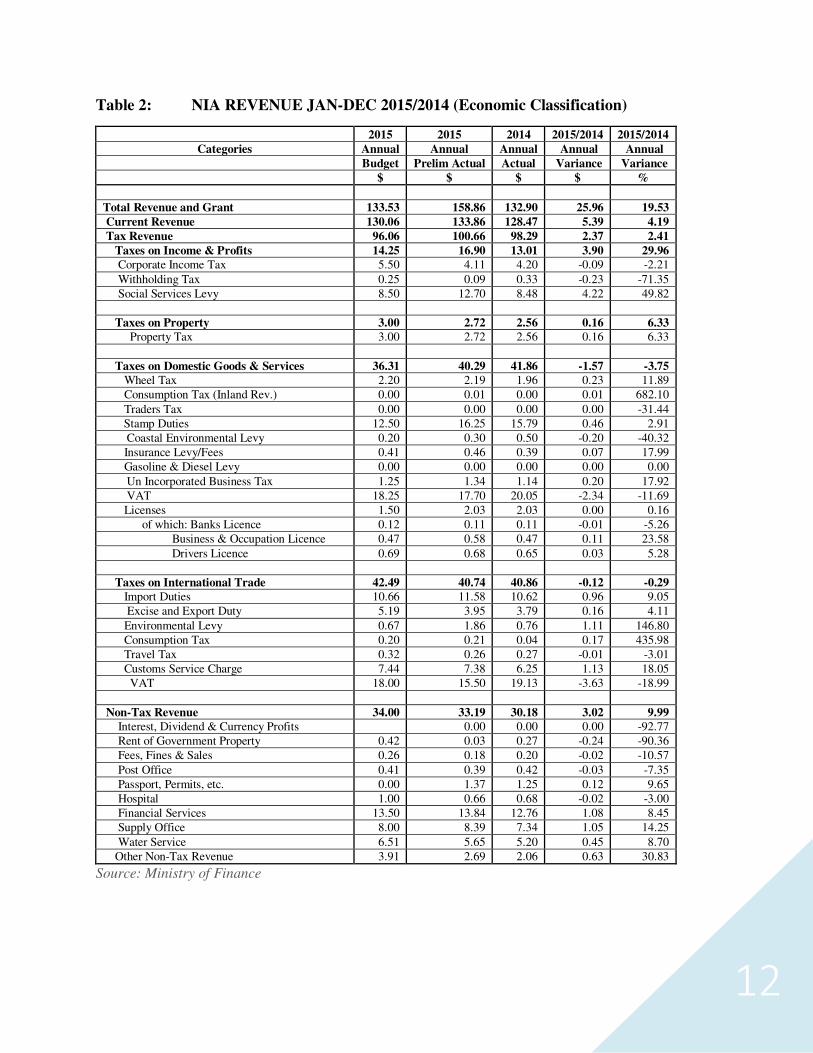
Table 2: NIA REVENUE JAN-DEC 2015/2014 (Economic Classification)
2015 2015 2014 2015/2014 2015/2014 Categories Annual Annual Annual Annual Annual
Budget Prelim Actual Actual Variance Variance $ $ $ $ %
Total Revenue and Grant 133.53 158.86 132.90 25.96 19.53 Current Revenue 130.06 133.86 128.47 5.39 4.19 Tax Revenue 96.06 100.66 98.29 2.37 2.41 Taxes on Income & Profits 14.25 16.90 13.01 3.90 29.96 Corporate Income Tax 5.50 4.11 4.20 -0.09 -2.21
Withholding Tax 0.25 0.09 0.33 -0.23 -71.35
Social Services Levy 8.50 12.70 8.48 4.22 49.82
Taxes on Property 3.00 2.72 2.56 0.16 6.33 Property Tax 3.00 2.72 2.56 0.16 6.33
Taxes on Domestic Goods & Services 36.31 40.29 41.86 -1.57 -3.75 Wheel Tax 2.20 2.19 1.96 0.23 11.89
Consumption Tax (Inland Rev.) 0.00 0.01 0.00 0.01 682.10
Traders Tax 0.00 0.00 0.00 0.00 -31.44
Stamp Duties 12.50 16.25 15.79 0.46 2.91
Coastal Environmental Levy 0.20 0.30 0.50 -0.20 -40.32
Insurance Levy/Fees 0.41 0.46 0.39 0.07 17.99
Gasoline & Diesel Levy 0.00 0.00 0.00 0.00 0.00
Un Incorporated Business Tax 1.25 1.34 1.14 0.20 17.92
VAT 18.25 17.70 20.05 -2.34 -11.69
Licenses 1.50 2.03 2.03 0.00 0.16
of which: Banks Licence 0.12 0.11 0.11 -0.01 -5.26
Business & Occupation Licence 0.47 0.58 0.47 0.11 23.58
Drivers Licence 0.69 0.68 0.65 0.03 5.28
Taxes on International Trade 42.49 40.74 40.86 -0.12 -0.29 Import Duties 10.66 11.58 10.62 0.96 9.05
Excise and Export Duty 5.19 3.95 3.79 0.16 4.11
Environmental Levy 0.67 1.86 0.76 1.11 146.80
Consumption Tax 0.20 0.21 0.04 0.17 435.98
Travel Tax 0.32 0.26 0.27 -0.01 -3.01
Customs Service Charge 7.44 7.38 6.25 1.13 18.05
VAT 18.00 15.50 19.13 -3.63 -18.99
Non-Tax Revenue 34.00 33.19 30.18 3.02 9.99 Interest, Dividend & Currency Profits 0.00 0.00 0.00 -92.77
Rent of Government Property 0.42 0.03 0.27 -0.24 -90.36
Fees, Fines & Sales 0.26 0.18 0.20 -0.02 -10.57
Post Office 0.41 0.39 0.42 -0.03 -7.35
Passport, Permits, etc. 0.00 1.37 1.25 0.12 9.65
Hospital 1.00 0.66 0.68 -0.02 -3.00
Financial Services 13.50 13.84 12.76 1.08 8.45
Supply Office 8.00 8.39 7.34 1.05 14.25
Water Service 6.51 5.65 5.20 0.45 8.70
Other Non-Tax Revenue 3.91 2.69 2.06 0.63 30.83
Source: Ministry of Finance
13
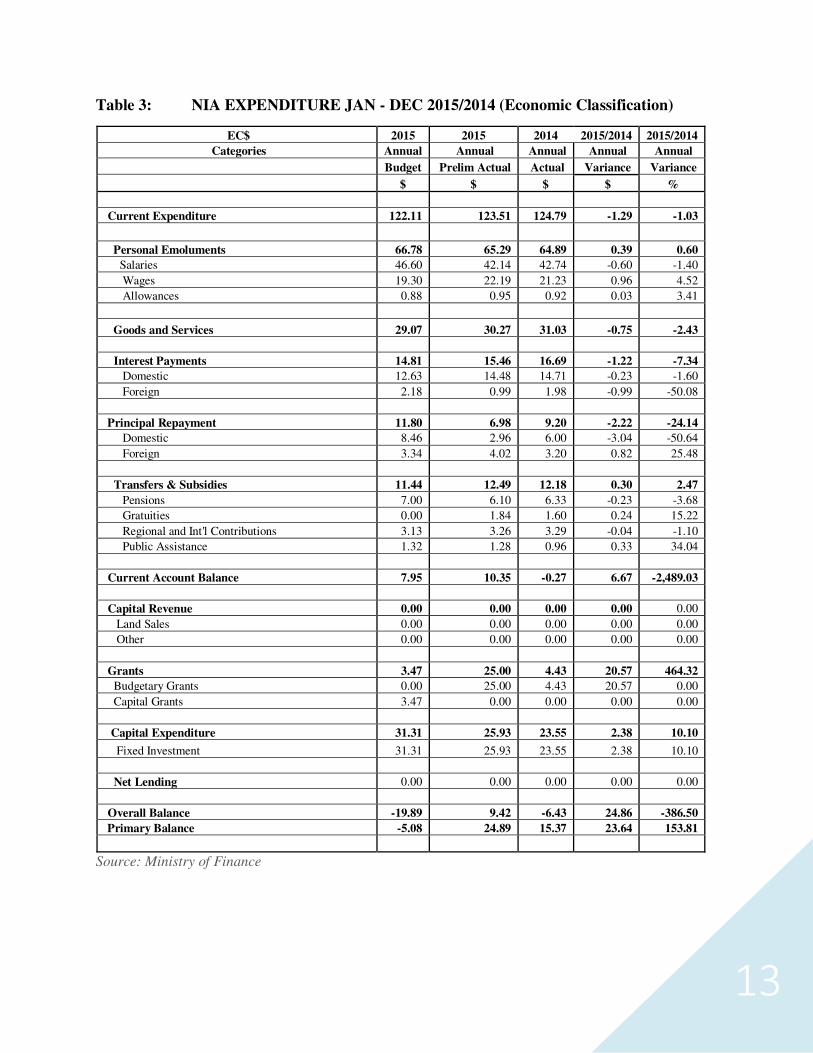
Table 3: NIA EXPENDITURE JAN - DEC 2015/2014 (Economic Classification)
EC$ 2015 2015 2014 2015/2014 2015/2014
Categories Annual Annual Annual Annual Annual
Budget Prelim Actual Actual Variance Variance
$ $ $ $ %
Current Expenditure 122.11 123.51 124.79 -1.29 -1.03
Personal Emoluments 66.78 65.29 64.89 0.39 0.60
Salaries 46.60 42.14 42.74 -0.60 -1.40
Wages 19.30 22.19 21.23 0.96 4.52
Allowances 0.88 0.95 0.92 0.03 3.41
Goods and Services 29.07 30.27 31.03 -0.75 -2.43
Interest Payments 14.81 15.46 16.69 -1.22 -7.34
Domestic 12.63 14.48 14.71 -0.23 -1.60
Foreign 2.18 0.99 1.98 -0.99 -50.08
Principal Repayment 11.80 6.98 9.20 -2.22 -24.14
Domestic 8.46 2.96 6.00 -3.04 -50.64
Foreign 3.34 4.02 3.20 0.82 25.48
Transfers & Subsidies 11.44 12.49 12.18 0.30 2.47
Pensions 7.00 6.10 6.33 -0.23 -3.68
Gratuities 0.00 1.84 1.60 0.24 15.22
Regional and Int'l Contributions 3.13 3.26 3.29 -0.04 -1.10
Public Assistance 1.32 1.28 0.96 0.33 34.04
Current Account Balance 7.95 10.35 -0.27 6.67 -2,489.03
Capital Revenue 0.00 0.00 0.00 0.00 0.00
Land Sales 0.00 0.00 0.00 0.00 0.00
Other 0.00 0.00 0.00 0.00 0.00
Grants 3.47 25.00 4.43 20.57 464.32
Budgetary Grants 0.00 25.00 4.43 20.57 0.00
Capital Grants 3.47 0.00 0.00 0.00 0.00
Capital Expenditure 31.31 25.93 23.55 2.38 10.10
Fixed Investment 31.31 25.93 23.55 2.38 10.10
Net Lending 0.00 0.00 0.00 0.00 0.00
Overall Balance -19.89 9.42 -6.43 24.86 -386.50
Primary Balance -5.08 24.89 15.37 23.64 153.81
Source: Ministry of Finance
14
Table 4: NIA DISBURSED OUTSTANDING DEBT (end of period)
Title/Description Dec-14 Dec-15 (Prelim)
Foreign Debt Port Development – 8/OCR 0.84 0.56
Port Development – 8/SFR 2.23 2.01
Port Development - Nevis OCR 08/SFR 0.06 0.04
Port Development – 35/SFR 2.09 1.80
Port Development Nevis – (Add) 35/SFRVDR 0.71 0.62 Port Development Nevis – 35 SFR SDK (Add) 0.30 0.28
Port Development Nevis – Add 0.30 0.22
Port Development Nevis - Add - 8\\OR USD 0.56 0.45
Nevis Island Ports Project. KWD#471 1.66 1.61 Nevis Airport Project. (Eur. Inv. Bank) 0.50 0.00
Road Imp. & Mtce Project 12/SDF 7.56 7.09
Road Imp. & Mtce Project 3.50 2.94
Newcastle Airport Project KWD #576 6.26 6.07
Supplementary Port Project – KWD #590 0.92 0.89 RIMP (ADD) Nevis 12SFR 6.08 5.65
RIMP (ADD) Nevis 12OR 0.51 0.48
Mega International Commercial Bank 4.78 4.47
Nevis Water Enhancement Project 20/SFROR 14.71 16.72
Total Outstanding Foreign Debt 53.58 51.90
Domestic Debt
Loan – SKNA National Bank 3.72 3.55
Loan – SKNA National Bank 1.98 1.79 Loan – SKNA National Bank 28.99 30.83
Loan - Bank Of Nevis_Tranche 2 3.34 2.80
Loan - Bank Of Nevis_Tranche 1 2.86 2.16
Overdraft - Bank Of Nevis 3.46 4.01
Treasury Bills Issue (OTC) 91 days 70.65 83.52 Treasury Bills Issue (OTC) 365 days 12.86 10.67
Overdraft a/c – SKNA National Bank 67.27 74.64
Overdraft a/c – Bank of Nevis 0.00
Overdraft a/c – FCIB 1.99 1.94
Director of Social Security_Cap. Project 11.99 11.99 Director of Social Security_Asp. Project 0.54 0.54
Surrey Paving Co 0.42 0.42
FINCO 0.60 0.45 TDC/FINCO 0.82 0.59
Restructured Loan - Bank of Nevis 48.25 47.41
Nevis Civil Servants Mortgage Loan 15.83 14.69
Total Outstanding – Domestic Debt 275.58 291.98
NIA Disbursed Outstanding Debt 329.16 343.88
Source: Ministry of Finance
15
Table 5: NEVIS AVERAGE EMPLOYMENT (JAN – DEC 2015)
No. of Jobs Weeks Worked Total Wages
Agriculture, Hunting & Forestry 109 451 285,355
Fishing 2 7 2,132
Mining & Quarrying 16 61 39,407
Manufacturing 73 300 168,575
Electricity, Gas & Water Supply 88 378 295,288
Construction 664 2,686 1,979,157
Wholesale & Retail Trade 585 2,440 1,389,659
Hotels & Restaurants 1,210 5,078 3,898,780
Transport, Storage & Communications 396 1,674 1,067,050
Financial Intermediation 197 850 987,209
Real Estate, Renting & Business Activities 233 990 640,272
Public Administration & Defence 1,684 7,236 5,179,674
Education 102 442 617,745
Health & Social Work 26 108 44,042
Other Community, Social & Personal Services 116 486 261,323
Private Household with Employed Persons 150 632 207,651
Extra-Territorial Organization & Bodies 0 0 0
NEV AVERAGE 5,651 23,819 17,063,319
Source: St. Kitts-Nevis Social Security Board
16
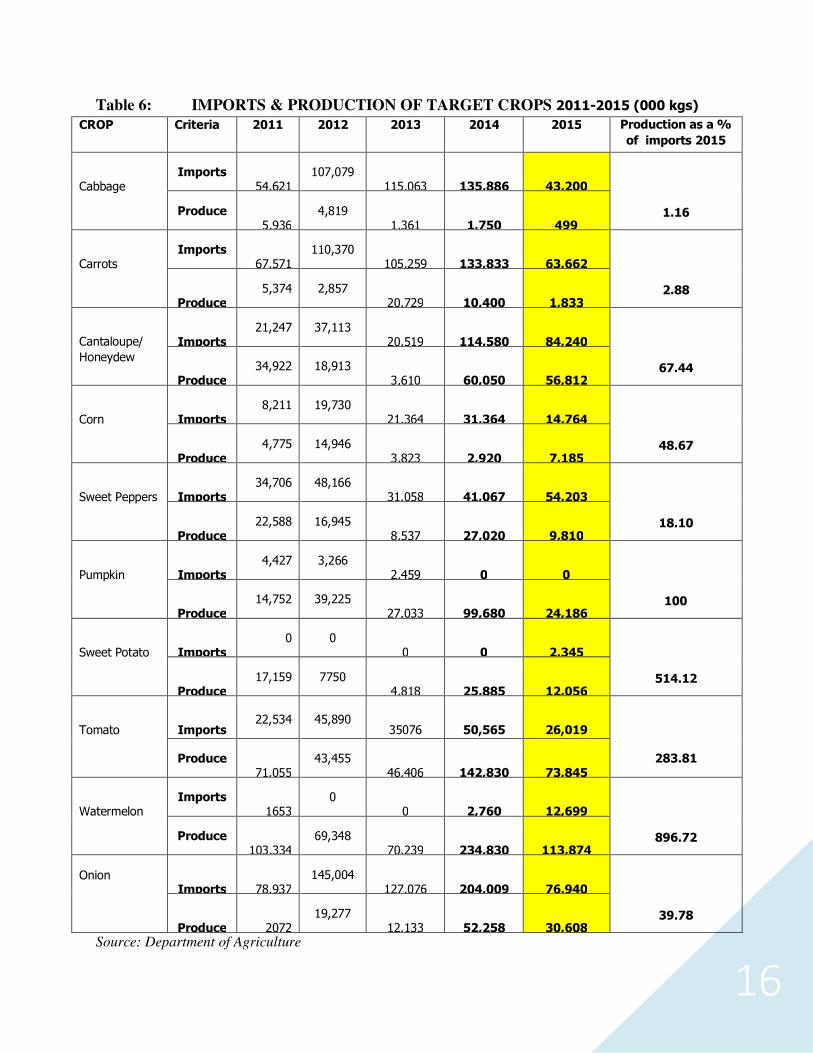
Table 6: IMPORTS & PRODUCTION OF TARGET CROPS 2011-2015 (000 kgs)
Source: Department of Agriculture
CROP Criteria
2011
2012
2013
2014
2015
Production as a %
of imports 2015
Cabbage Imports
54,621 107,079
115,063
135,886
43,200
1.16 Produce
5,936 4,819
1,361
1,750
499
Carrots Imports
67,571 110,370
105,259
133,833
63,662
2.88
Produce 5,374 2,857
20,729
10,400
1,833
Cantaloupe/
Honeydew
Imports 21,247 37,113
20,519
114,580
84,240
67.44
Produce 34,922 18,913
3,610
60,050
56,812
Corn
Imports 8,211 19,730
21,364
31,364
14,764
48.67
Produce 4,775 14,946
3,823
2,920
7,185
Sweet Peppers
Imports 34,706 48,166
31,058
41,067
54,203
18.10
Produce 22,588 16,945
8,537
27,020
9,810
Pumpkin
Imports 4,427 3,266
2,459
0
0
100
Produce 14,752 39,225
27,033
99,680
24,186
Sweet Potato
Imports 0 0
0
0
2,345
514.12
Produce 17,159 7750
4,818
25,885
12,056
Tomato
Imports 22,534 45,890
35076
50,565
26,019
283.81 Produce
71,055 43,455
46,406
142,830
73,845
Watermelon Imports
1653 0
0
2,760
12,699
896.72 Produce
103,334 69,348
70,239
234,830
113,874
Onion
Imports
78,937 145,004
127,076
204,009
76,940
39.78
Produce
2072 19,277
12,133
52,258
30,608
17
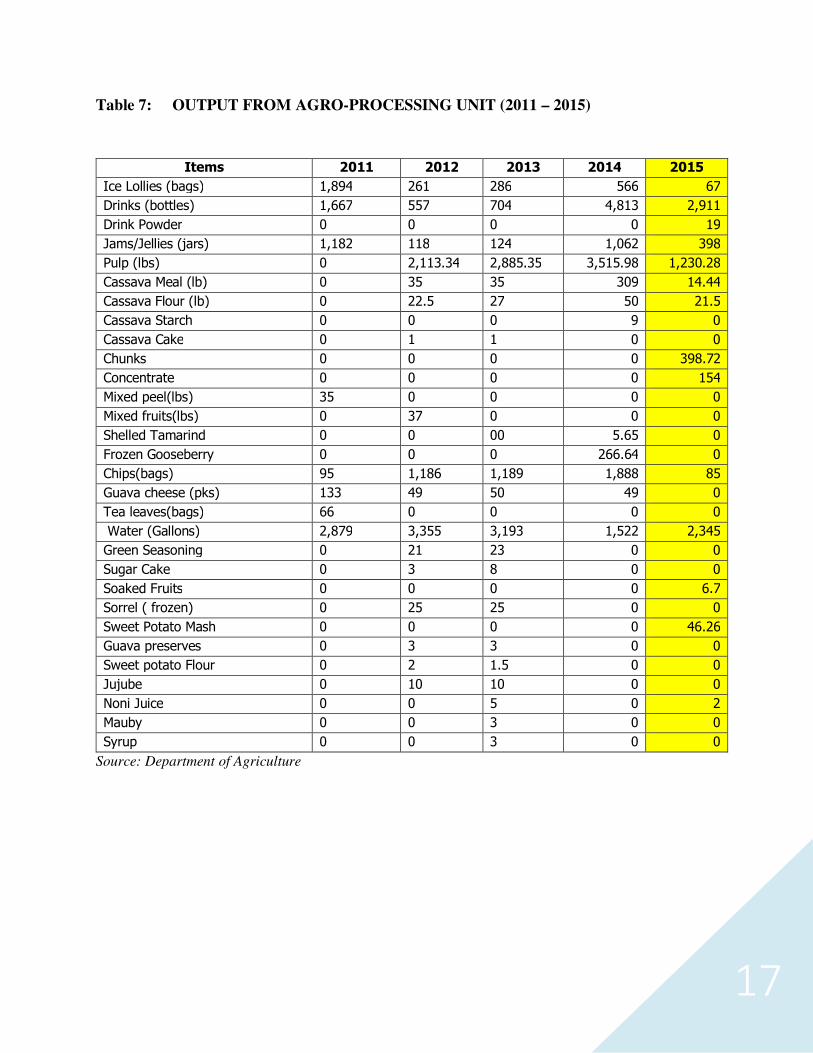
Table 7: OUTPUT FROM AGRO-PROCESSING UNIT (2011 – 2015)
Items 2011 2012 2013 2014 2015
Ice Lollies (bags) 1,894 261 286 566 67
Drinks (bottles) 1,667 557 704 4,813 2,911
Drink Powder 0 0 0 0 19
Jams/Jellies (jars) 1,182 118 124 1,062 398
Pulp (lbs) 0 2,113.34 2,885.35 3,515.98 1,230.28
Cassava Meal (lb) 0 35 35 309 14.44
Cassava Flour (lb) 0 22.5 27 50 21.5
Cassava Starch 0 0 0 9 0
Cassava Cake 0 1 1 0 0
Chunks 0 0 0 0 398.72
Concentrate 0 0 0 0 154
Mixed peel(lbs) 35 0 0 0 0
Mixed fruits(lbs) 0 37 0 0 0
Shelled Tamarind 0 0 00 5.65 0
Frozen Gooseberry 0 0 0 266.64 0
Chips(bags) 95 1,186 1,189 1,888 85
Guava cheese (pks) 133 49 50 49 0
Tea leaves(bags) 66 0 0 0 0
Water (Gallons) 2,879 3,355 3,193 1,522 2,345
Green Seasoning 0 21 23 0 0
Sugar Cake 0 3 8 0 0
Soaked Fruits 0 0 0 0 6.7
Sorrel ( frozen) 0 25 25 0 0
Sweet Potato Mash 0 0 0 0 46.26
Guava preserves 0 3 3 0 0
Sweet potato Flour 0 2 1.5 0 0
Jujube 0 10 10 0 0
Noni Juice 0 0 5 0 2
Mauby 0 0 3 0 0
Syrup 0 0 3 0 0
Source: Department of Agriculture
18
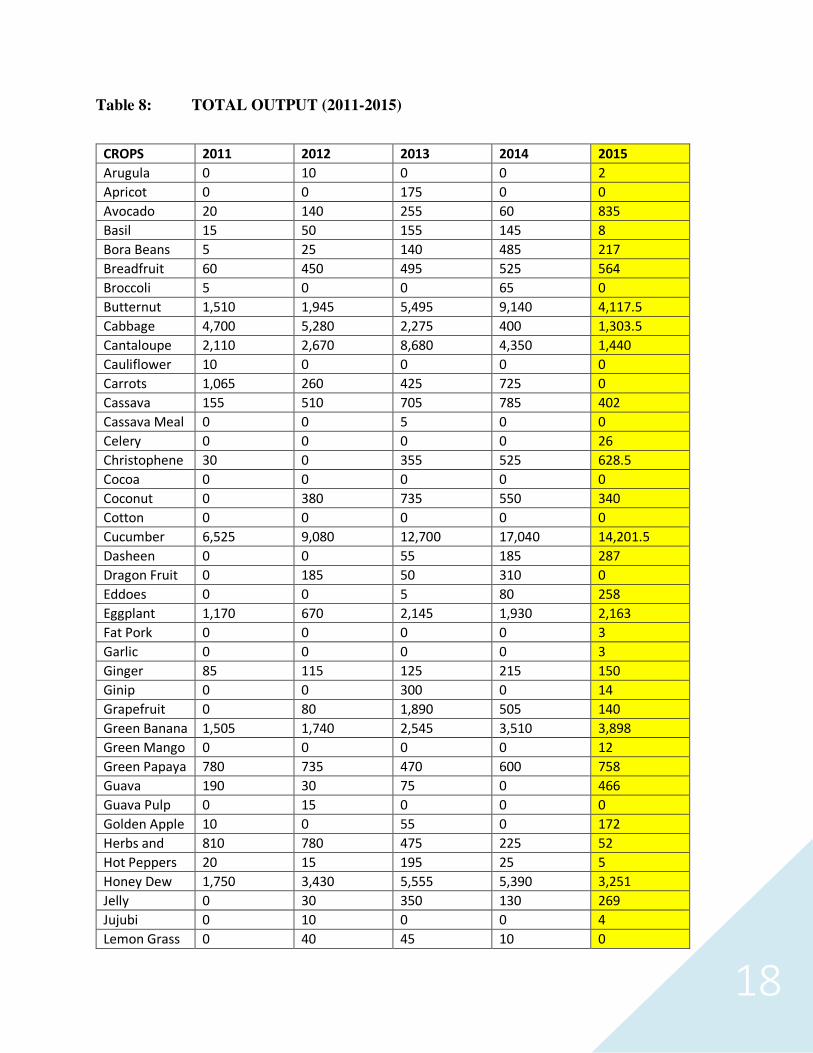
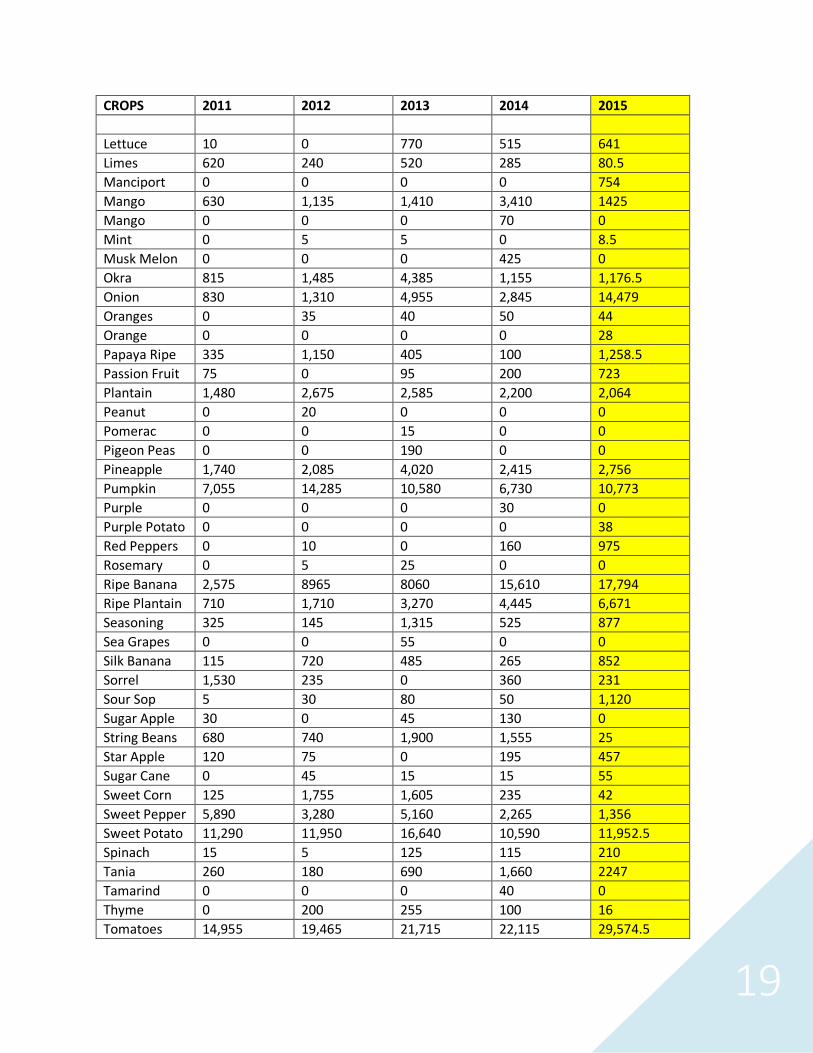
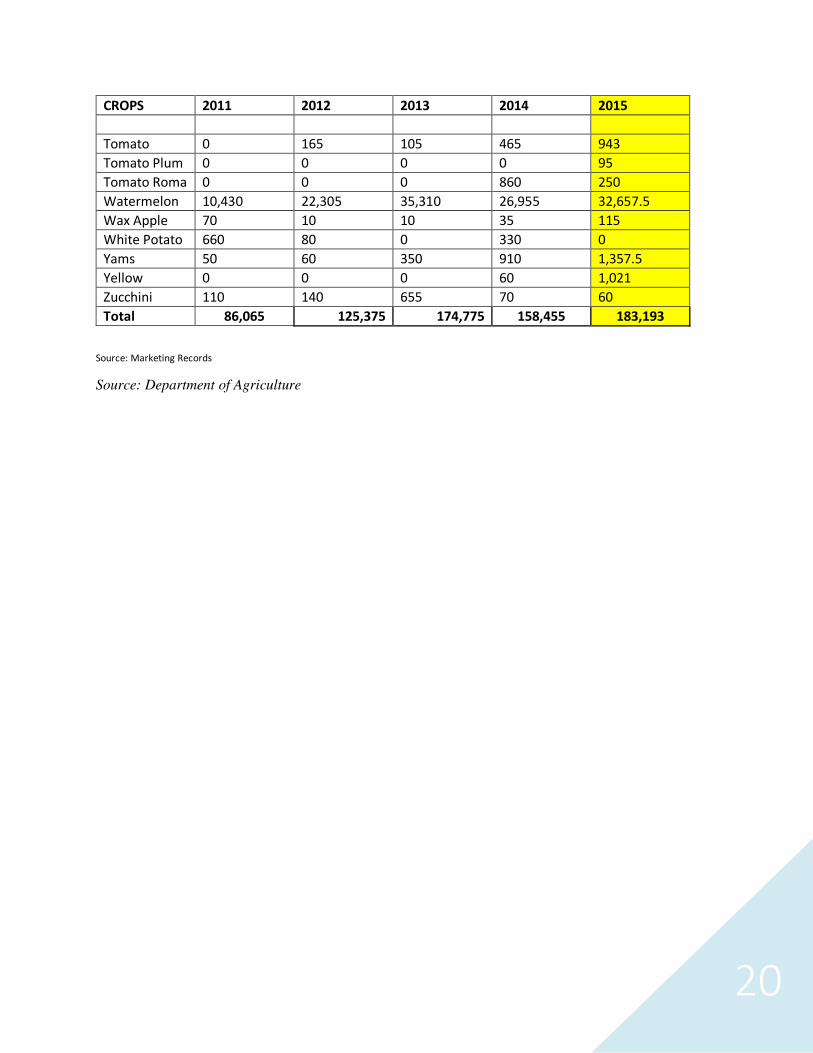
Table 8: TOTAL OUTPUT (2011-2015)
CROPS 2011 2012 2013 2014 2015
Arugula 0 10 0 0 2
Apricot 0 0 175 0 0
Avocado 20 140 255 60 835
Basil 15 50 155 145 8
Bora Beans 5 25 140 485 217
Breadfruit 60 450 495 525 564
Broccoli 5 0 0 65 0
Butternut 1,510 1,945 5,495 9,140 4,117.5
Cabbage 4,700 5,280 2,275 400 1,303.5
Cantaloupe 2,110 2,670 8,680 4,350 1,440
Cauliflower 10 0 0 0 0
Carrots 1,065 260 425 725 0
Cassava 155 510 705 785 402
Cassava Meal 0 0 5 0 0
Celery 0 0 0 0 26
Christophene 30 0 355 525 628.5
Cocoa 0 0 0 0 0
Coconut 0 380 735 550 340
Cotton 0 0 0 0 0
Cucumber 6,525 9,080 12,700 17,040 14,201.5
Dasheen 0 0 55 185 287
Dragon Fruit 0 185 50 310 0
Eddoes 0 0 5 80 258
Eggplant 1,170 670 2,145 1,930 2,163
Fat Pork 0 0 0 0 3
Garlic 0 0 0 0 3
Ginger 85 115 125 215 150
Ginip 0 0 300 0 14
Grapefruit 0 80 1,890 505 140
Green Banana 1,505 1,740 2,545 3,510 3,898
Green Mango 0 0 0 0 12
Green Papaya 780 735 470 600 758
Guava 190 30 75 0 466
Guava Pulp 0 15 0 0 0
Golden Apple 10 0 55 0 172
Herbs and 810 780 475 225 52
Hot Peppers 20 15 195 25 5
Honey Dew 1,750 3,430 5,555 5,390 3,251
Jelly 0 30 350 130 269
Jujubi 0 10 0 0 4
Lemon Grass 0 40 45 10 0
19
CROPS 2011 2012 2013 2014 2015
Lettuce 10 0 770 515 641
Limes 620 240 520 285 80.5
Manciport 0 0 0 0 754
Mango 630 1,135 1,410 3,410 1425
Mango 0 0 0 70 0
Mint 0 5 5 0 8.5
Musk Melon 0 0 0 425 0
Okra 815 1,485 4,385 1,155 1,176.5
Onion 830 1,310 4,955 2,845 14,479
Oranges 0 35 40 50 44
Orange 0 0 0 0 28
Papaya Ripe 335 1,150 405 100 1,258.5
Passion Fruit 75 0 95 200 723
Plantain 1,480 2,675 2,585 2,200 2,064
Peanut 0 20 0 0 0
Pomerac 0 0 15 0 0
Pigeon Peas 0 0 190 0 0
Pineapple 1,740 2,085 4,020 2,415 2,756
Pumpkin 7,055 14,285 10,580 6,730 10,773
Purple 0 0 0 30 0
Purple Potato 0 0 0 0 38
Red Peppers 0 10 0 160 975
Rosemary 0 5 25 0 0
Ripe Banana 2,575 8965 8060 15,610 17,794
Ripe Plantain 710 1,710 3,270 4,445 6,671
Seasoning 325 145 1,315 525 877
Sea Grapes 0 0 55 0 0
Silk Banana 115 720 485 265 852
Sorrel 1,530 235 0 360 231
Sour Sop 5 30 80 50 1,120
Sugar Apple 30 0 45 130 0
String Beans 680 740 1,900 1,555 25
Star Apple 120 75 0 195 457
Sugar Cane 0 45 15 15 55
Sweet Corn 125 1,755 1,605 235 42
Sweet Pepper 5,890 3,280 5,160 2,265 1,356
Sweet Potato 11,290 11,950 16,640 10,590 11,952.5
Spinach 15 5 125 115 210
Tania 260 180 690 1,660 2247
Tamarind 0 0 0 40 0
Thyme 0 200 255 100 16
Tomatoes 14,955 19,465 21,715 22,115 29,574.5
20
Source: Marketing Records
Source: Department of Agriculture
CROPS 2011 2012 2013 2014 2015
Tomato 0 165 105 465 943
Tomato Plum 0 0 0 0 95
Tomato Roma 0 0 0 860 250
Watermelon 10,430 22,305 35,310 26,955 32,657.5
Wax Apple 70 10 10 35 115
White Potato 660 80 0 330 0
Yams 50 60 350 910 1,357.5
Yellow 0 0 0 60 1,021
Zucchini 110 140 655 70 60
Total 86,065 125,375 174,775 158,455 183,193


