Page 1
1
Hunt County Appraisal District
2018 Mass Appraisal Report
INTRODUCTION
Scope of Responsibility
The Hunt County Appraisal District has prepared and published this report to provide our citizens and
taxpayers with a better understanding of the district's responsibilities and activities. This report has
several parts: a general introduction and then several sections describing the appraisal effort by the
appraisal district.
The Hunt County Appraisal District (CAD) is a political subdivision of the State of Texas created
effective January 1, 1980. The provisions of the Texas Property Tax Code govern the legal, statutory,
and administrative requirements of the appraisal district. An 8 member board of directors, appointed
by the taxing units within the boundaries of Hunt County, constitutes the district’s governing body.
The chief appraiser, appointed by the board of directors, is the chief administrator and chief executive
officer of the appraisal district.
The appraisal district is responsible for local property tax appraisal and exemption administration for
34 jurisdictions or taxing units in the county. Each taxing unit, such as the county, a city, school
district, municipal utility district, etc., sets its own tax rate to generate revenue to pay for such things
as police and fire protection, public schools, road and street maintenance, courts, water and sewer
systems, and other public services. Appraisals established by the appraisal district allocate the year's
tax burden on the basis of each taxable property's January 1st market value. We also determine
eligibility for various types of property tax exemptions such as those for homeowners, the elderly,
disabled veterans, and charitable and religious organizations.
Except as otherwise provided by the Property Tax Code, the fee simple interest of all taxable property
is appraised at its “market value” as of January 1st. Under the tax code, “market value” means the
price at which a property would transfer for cash or its equivalent under prevailing market conditions if:
exposed for sale in the open market with a reasonable time for the seller to find a purchaser;
both the seller and the buyer know of all the uses and purposes to which the property is
adapted and for which it is capable of being used and of the enforceable restrictions on its use,
and;
both the seller and buyer seek to maximize their gains and neither is in a position to take
advantage of the exigencies of the other.
The Property Tax Code defines special appraisal provisions for the valuation of residential homestead
property (Sec. 23.23), productivity (Sec. 23.41), real property inventory (Sec. 23.12), dealer inventory
(Sec. 23.121, 23.124, 23.1241 and 23.127), nominal (Sec. 23.18) or restricted use properties (Sec.
23.83) and allocation of interstate property (Sec. 23.03). The owner of business personal property
Page 2
Hunt County Appraisal District
2018 Mass Appraisal Report
2
inventory may elect to have the inventory appraised at its market value as of September 1st of the
year preceding the tax year to which the appraisal applies by filing an application with the chief
appraiser requesting that the inventory be appraised as of September 1st.
The Texas Property Tax Code, under Sec. 25.18, requires each appraisal office to implement a plan
to update appraised values for real property at least once every three years. The district’s current
policy is to conduct a general reappraisal of all property every year. Appraised values are reviewed
annually and are subject to change for purposes of equalization. The full scope of work performed
can be viewed in the Hunt County Appraisal District’s 2017 – 2018 Two Year Reappraisal Plan which
was approved by the Hunt County Appraisal District’s Board of Directors.
The appraised value of real estate is calculated using specific information about each property. Using
computer-assisted mass appraisal programs, and recognized appraisal methods and techniques, we
compare that information with the data for similar properties, and with recent market data. The district
follows the standards of the International Association of Assessing Officers (IAAO) regarding its
appraisal practices and procedures, and subscribes to the standards promulgated by the Appraisal
Foundation known as the Uniform Standards of Professional Appraisal Practice (USPAP) to the extent
they are applicable. In cases where the appraisal district contracts for professional valuation services,
the contract that is entered into by each appraisal firm requires adherence to similar professional
standards.
Personnel Resources
The Office of the Chief Appraiser is primarily responsible for overall planning, organizing, staffing,
coordinating, and controlling of district operations. The Administration Department’s function is to
plan, organize, direct and control the business support functions related to human resources, budget,
finance, records management, purchasing, fixed assets, facilities and postal services. The Appraisal
Department is responsible for the valuation of all real and personal property accounts. The property
types appraised include commercial, residential, business personal, and industrial. The district’s
appraisers are subject to the provisions of the Property Taxation Professional Certification Act and
must be duly registered with The Texas Department of Licensing and Regulation. Support functions
including records maintenance, information and assistance to property owners, and hearings support
are coordinated by the Support Services Department.
The appraisal district staff consists of 21 employees with the following classifications:
_3_- Official/Administrator (Executive level administration)
_2_ - Professional (Supervisory and Management)
_10_ - Technicians (Appraisers, program appraisers and network support)
_6_ - Administrative Support (professional, customer service, clerical and other)
Data
The district is responsible for establishing and maintaining approximately 68,188 real and personal
property accounts covering 882 square miles within Hunt County. This data includes property
characteristic including ownership and exemption information. The data specific to each parcel would
include, but not be limited to legal descriptions, addresses, parcel identifiers, photos and building
Page 3
Hunt County Appraisal District
2018 Mass Appraisal Report
3
sketches. Property characteristic data on new construction is updated through an annual field effort;
existing property data is maintained through a field review that is prioritized by last field inspection
date. Sales are routinely validated during a separate field effort; however, numerous sales are
validated as part of the new construction and data review field activities. General trends in
employment, interest rates, new construction trends, and cost and market data are acquired through
various sources, including internally generated questionnaires to buyer and seller, university research
centers, and market data centers and vendors.
The district has a geographic information system (GIS) that maintains cadastral maps and various
layers of data, including zip code, facet and aerial photography. The district’s website makes a broad
range of information available for public access, including detailed information on the appraisal
process, property characteristics data, certified values, protests and appeal procedures, property
maps, and a tax calendar. Downloadable files of related tax information and district forms, including
exemption applications and business personal property renditions are also available.
Information Systems
The Information Systems Department maintains the district’s data processing facility, software
applications, Internet website, and geographical information system. The district operates under a
hierarchical non-relational database. The mainframe hardware/system software is 1 Dell
Server/PACSSERVER-Win 2008 Server OS; which hosts our LAN, Internet, and document imaging;
an ESRI ARC Map 10.2 Standard Version operates the geographic information system; and the user
base is served by 23 Dell OptiPlex 3010 Computers, and 10 Apple IPads, which are on a combination
of Win Vista OS and Window 7 OS.
SHARED APPRAISAL DISTRICT BOUNDARIES
The district established procedures whereby ownership and property data information are routinely
exchanged. Appraisers from adjacent appraisal districts discuss data collection and valuation issues
to minimize the possibility of differences in property characteristics, legal descriptions, and other
administrative data.
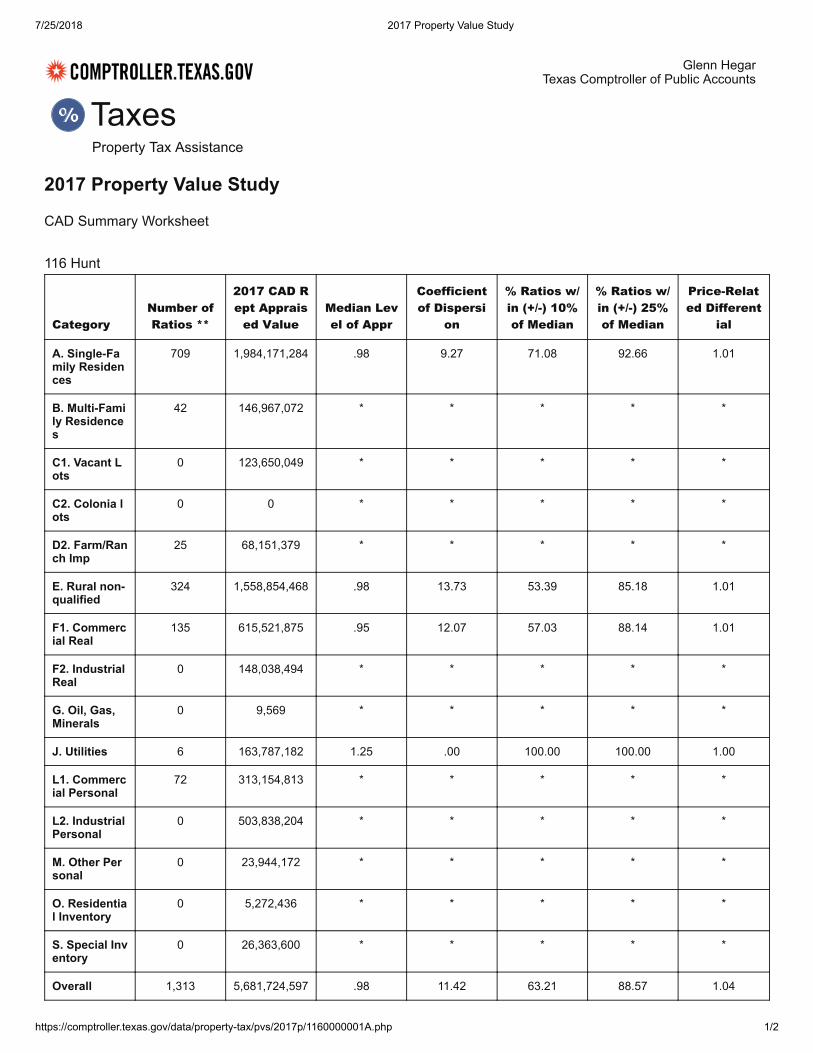
INDEPENDENT PERFORMANCE TEST
According to Chapter 5 of the TPTC, “At least once every two years, the Comptroller shall conduct a
study in each appraisal district to determine the degree of uniformity of and the median level of
appraisals by the appraisal district within each major category of property. The comptroller shall
publish a report of the findings of the study, including in the report the median levels of appraisal for
each major category of property, the coefficient of dispersion around the median level of appraisal for
each major category of property and any other standard statistical measures that the comptroller
considers appropriate.” There are 17 independent school districts in Hunt CAD for which appraisal
rolls are annually developed. The preliminary results of this study are released in January in the year
following the year of appraisement. The final results of this study are certified to the Education
Commissioner of the Texas Education Agency (TEA) in the following July of each year for the year of
appraisement. This outside (third party) ratio study provides additional assistance to the CAD in
determining areas of market activity or changing market conditions.
Page 4
Hunt County Appraisal District
2018 Mass Appraisal Report
4
In addition to this there is an additional study performed at least every two years referred to as the
“MAPS” review. Section 5.102 refers to this review as “At least once every two years, the comptroller
shall review the governance of each appraisal district, taxpayer assistance provided, and the
operating and appraisal standards, procedures, and methodology used by each appraisal district, to
determine compliance with generally accepted standards, procedures, and methodology.
Page 5
Hunt County Appraisal District
2018 Mass Appraisal Report
5
Appraisal Activities
INTRODUCTION
Appraisal Responsibilities
The field appraisal staff is responsible for collecting and maintaining property characteristic data for
classification, valuation, and other purposes. Accurate valuation of real and personal property by any
method requires a physical description of personal property, and land and building characteristics.
This appraisal activity is responsible for administering, planning and coordinating all activities
involving data collection and maintenance of all commercial, residential and personal property types
which are located within the boundaries of Hunt County. The data collection effort involves the field
inspection of real and personal property accounts, as well as data entry of all data collected into the
existing information system. The goal is to field inspect half of the residential and all personal
properties in Hunt County every year, and all of the commercial properties every year. Meeting this
goal is dependent on budgetary constraints.
Appraisal Resources
Personnel - The appraisal activities consists of 10 appraisers and 6 technical personnel.
Data - The data used by field appraisers includes the existing property characteristic
information contained in a CAMA (Computer Mass Appraisal System) from the
district’s computer system. The data can be printed on a property record card (PRD),
personal property data sheets or accessed on an IPad or other personal portable
device. Other data used includes maps, sales data, fire and damage reports, building
permits, photos and actual cost information.
PRELIMINARY ANALYSIS
Data Collection/Validation
Data collection of real property involves maintaining data characteristics of the property on PACS
(Property Appraisal and Collections System), which is a computer mass appraisal system. The
information contained in PACS includes site characteristics, such as land size and topography, and
improvement data, such as square foot of living area, year built, quality of construction, and condition.
Field appraisers use listing manuals that establish uniform procedures for the correct listing of real
property. All properties are coded according to these manuals and the approaches to value are
structured and calibrated based on this coding system. The field appraisers use these manuals
during their initial training and as a guide in the field inspection of properties. Data collection for
personal property involves maintaining information on PACS (Property Appraisal and Collections
System). The type of information contained in PACS includes personal property such as business
inventory, furniture and fixtures, machinery and equipment, cost and location. The field appraisers
conducting on-site inspections use a personal property manual during their initial training and as a
guide to correctly list all personal property that is taxable.
The listing procedures that are utilized by the field appraisers are incorporated into the appropriate
Appraiser Manual and are available in the district offices. If a property owner/agent wants a copy of
Page 6
Hunt County Appraisal District
2018 Mass Appraisal Report
6
an appraisal manual, customer service will handle this request. Appraisers periodically update the
listing procedural manuals with input from the valuation group.
Sources of Data
The sources of data collection are through the new construction field effort, data review/relist field
effort, data mailers, hearings, sales validation field effort, commercial sales verification, newspapers
and publications, and property owner correspondence via the Internet. A principal source of data
comes from building permits received from taxing jurisdictions that require property owners to take out
a building permit. Where available, permits are received electronically and loaded to our Building
Permit System (BPS). Otherwise, paper permits are received and matched manually with the
property’s account number for data entry.
Data review of entire neighborhoods is generally a good source for data collection. Appraisers drive
entire neighborhoods to review the accuracy of our data and identify properties that have to be
relisted. The sales validation effort in real property pertains to the collection of data of properties that
have sold. In residential, the sales validation effort involves on-site inspection by field appraisers,
letters from buyers and sellers, and other third party sources to verify the accuracy of the property
characteristics data and confirmation of the sales price. In commercial, the commercial appraisers
are responsible for contacting both grantee, grantor and other third party sources to confirm sales
prices and to verify pertinent data.
Property owners are one of the best sources for identifying incorrect data that generates a field check.
Frequently, the property owner provides sufficient enough data to allow correction of records without
having to send an appraiser on-site. As the district has increased the amount of information available
on the Internet, property owner’s requests to correct data inconsistencies have also increased. For
the property owner without access to the Internet, letters are often submitted notifying the district of
inaccurate data. Properties identified in this manner are added to a work file and inspected at our
earliest opportunity.
Data Collection Procedures
Field data collection requires organization, planning and supervision of the field effort. Data collection
procedures have been established for residential, commercial, and personal property. The appraisers
are assigned throughout Hunt County to conduct field inspections. Appraisers conduct field
inspections and record information either on a property record card (PRD), a personal property data
sheet or into a portable electronic device, such as an IPad, that will be downloaded into PACS.
The quality of the data used is extremely important in establishing accurate values of taxable property.
While production standards are established and upheld for the various field activities, quality of data is
emphasized as the goal and responsibility of each appraiser. New appraisers are trained in the
specifics of data collection set forth in the listing manual as “rules” to follow. Experienced appraisers
are routinely re-trained in listing procedures prior to major field projects such as new construction,
sales validation or data review. A quality assurance process exists through supervisory review of the
work being performed by the field appraisers. Quality assurance supervision is charged with the
responsibility of ensuring that appraisers follow listing procedures, identify training issues and provide
uniform training throughout the field appraisal staff.
Page 7
Hunt County Appraisal District
2018 Mass Appraisal Report
7
Data Maintenance
The field appraiser is responsible for the data entry of his/her fieldwork directly into the computer file.
This responsibility includes not only data entry directly entered by the appraiser, but also quality
assurance for that entered by the clerical staff.
INDIVIDUAL VALUE REVIEW PROCEDURES
Field Review
The date of last inspection, extent of that inspection, and the CAD appraiser responsible are listed on
the CAMA record. If a property owner or jurisdiction dispute the district’s records concerning this data
during a hearing, via a telephone call or correspondence received, CAMA may be altered based on
the evidence provided. Typically, a field inspection is requested to verify this evidence for the current
year’s valuation or for the next year’s valuation. Every year a field review of certain areas or
neighborhoods in the jurisdiction is done during the data review/re-list field effort.
PERFORMANCE TEST
The valuation appraisers are responsible for conducting ratio studies and comparative analysis.
(Refer to the individual valuation process summary reports).
Field appraisers, in many cases may conduct field inspections to insure the ratios produced are
accurate and the appraised values utilized are based on accurate property data characteristics.
Page 8
Hunt County Appraisal District
2018 Mass Appraisal Report
8
Residential Valuation Process
INTRODUCTION
Scope of Responsibility
The Residential Valuation appraisers are responsible for developing equal uniform market values for
residential improved and vacant property. There are approximately 35,541 residential improved
parcels and 11,177 vacant residential properties in Hunt County.
Appraisal Resources
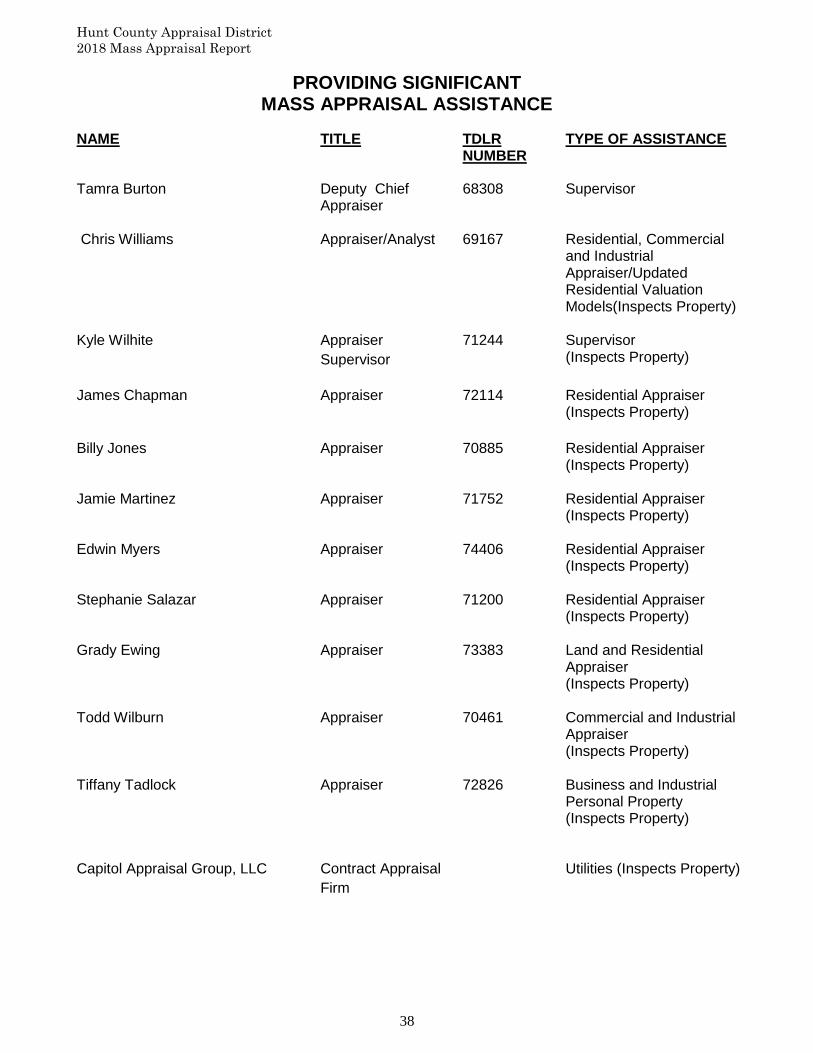
Personnel - The Residential Valuation appraisal staff consists of 7 appraisers. The following
appraisers are responsible for determining residential values:
James Chapman Grady Ewing Billy Jones Jamie Martinez Edwin Myers Stephanie Salazar Chris Williams
Data - A common set of data characteristics for each residential dwelling in Hunt County is
collected in the field and data entered to the computer. The property characteristic data drives
the computer-assisted mass appraisal (CAMA) approach to valuation.
VALUATION APPROACH (Model Specification)
Area Analysis
Data on regional economic forces such as demographic patterns, regional locational factors,
employment and income patterns, general trends in real property prices and rents, interest rate
trends, availability of vacant land, and construction trends and costs are collected from private
vendors and public sources and provide the field appraiser a current economic outlook on the real
estate market. Information is gleaned from real estate publications and sources such as continuing
education in the form of IAAO and other TDLR approved classes.
Neighborhood and Market Analysis
Neighborhood analysis involves the examination of how physical, economic, governmental and social
forces and other influences affect property values. The effects of these forces are also used to
identify, classify, and stratify comparable properties into smaller, manageable subsets of the universe
of properties known as neighborhoods. Residential valuation and neighborhood analysis is conducted
on each of the political entities known as Independent School Districts (ISD).
The first step in neighborhood analysis is the identification of a group of properties that share certain
common traits. A "neighborhood" for analysis purposes is defined as the largest geographic or
demographic grouping of properties where the property’s physical, economic, governmental and
social forces are generally similar and uniform. Geographic stratification accommodates the local
Page 9
Hunt County Appraisal District
2018 Mass Appraisal Report
9
supply and demand factors that vary across a jurisdiction. Once a neighborhood has been identified,
the next step is to define its boundaries. This process is known as "delineation". Some factors used
in neighborhood delineation include location, sales price range, lot size, age of dwelling, quality of
construction and condition of dwellings, square footage of living area, and story height. Delineation
can involve the physical drawing of neighborhood boundary lines on a map, but it can also involve
statistical separation or stratification based on attribute analysis. Part of neighborhood analysis is the
consideration of discernible patterns of growth that influence a neighborhood’s individual market. Few
neighborhoods are fixed in character. Each neighborhood may be characterized as being in a stage
of growth, stability or decline. The growth period is a time of development and construction. As new
neighborhoods in a community are developed, they compete with existing neighborhoods. An added
supply of new homes tends to induce population shift from older homes to newer homes. In the
period of stability, or equilibrium, the forces of supply and demand are about equal. Generally, in the
stage of equilibrium, older neighborhoods can be more desirable due to their stability of residential
character and proximity to the workplace and other community facilities. The period of decline reflects
diminishing demand or desirability. During decline, general property use may change from residential
to a mix of residential and commercial uses. Declining neighborhoods may also experience renewal,
reorganization, rebuilding, or restoration, which promotes increased demand and economic
desirability.
Neighborhood identification and delineation is the cornerstone of the residential valuation system at
the district. All the residential analysis work done in association with the residential valuation process
is neighborhood specific. Neighborhoods are field inspected and delineated based on observable
aspects of homogeneity. Neighborhood delineation is periodically reviewed to determine if further
neighborhood delineation is warranted. Whereas neighborhoods involve similar properties in the
same location, a neighborhood group is simply defined as similar neighborhoods in similar locations.
Each residential neighborhood is assigned to a neighborhood group based on observable aspects of
homogeneity between neighborhoods. Neighborhood grouping is highly beneficial in cost-derived
areas of limited or no sales, or use in direct sales comparison analysis. Neighborhood groups, or
clustered neighborhoods, increase the available market data by linking comparable properties outside
a given neighborhood. Sales ratio analysis, discussed below, is performed on a neighborhood basis,
and in soft sale areas on a neighborhood group basis.
Highest and Best Use Analysis
The highest and best use of property is the reasonable and probable use that supports the highest
present value as of the date of the appraisal. The highest and best use must be physically possible,
legal, financially feasible, and productive to its maximum. The highest and best use of residential
property is normally its current use. This is due in part to the fact that residential development, in
many areas, through use of deed restrictions and zoning, precludes other land uses. Residential
valuation undertakes reassessment of highest and best use in transition areas and areas of mixed
residential and commercial use. In transition areas with ongoing gentrification, the appraiser reviews
the existing residential property use and makes a determination regarding highest and best use.
Once the conclusion is made that the highest and best use remains residential, further highest and
best use analysis is done to decide the type of residential use on a neighborhood basis. As an
example, it may be determined in a transition area that older, non-remodeled homes are economic
Page 10
Hunt County Appraisal District
2018 Mass Appraisal Report
10
misimprovements, and the highest and best use of such property is the construction of new dwellings.
In areas of mixed residential and commercial use, the appraiser reviews properties in these areas on
a periodic basis to determine if changes in the real estate market require reassessment of the highest
and best use of a select population of properties. According to Section 23.10 c2 of the Texas
Property Tax Code “The market value of a residence homestead shall be determined solely on the
basis of the property’s value as a residence homestead, regardless of whether the residential use of
the property by the owner is considered to be the highest and best value of the property. A valuation
under this limitation might have a significant effect of the valuation.
VALUATION AND STATISTICAL ANALYSIS (Model Calibration)
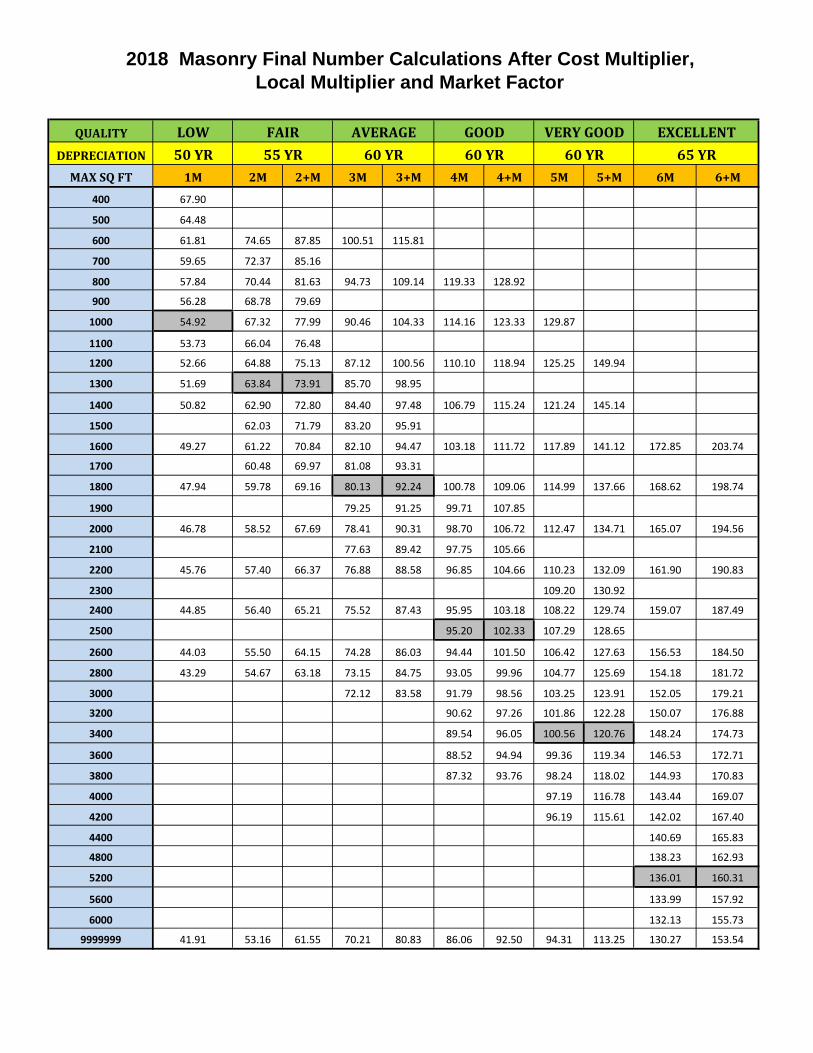
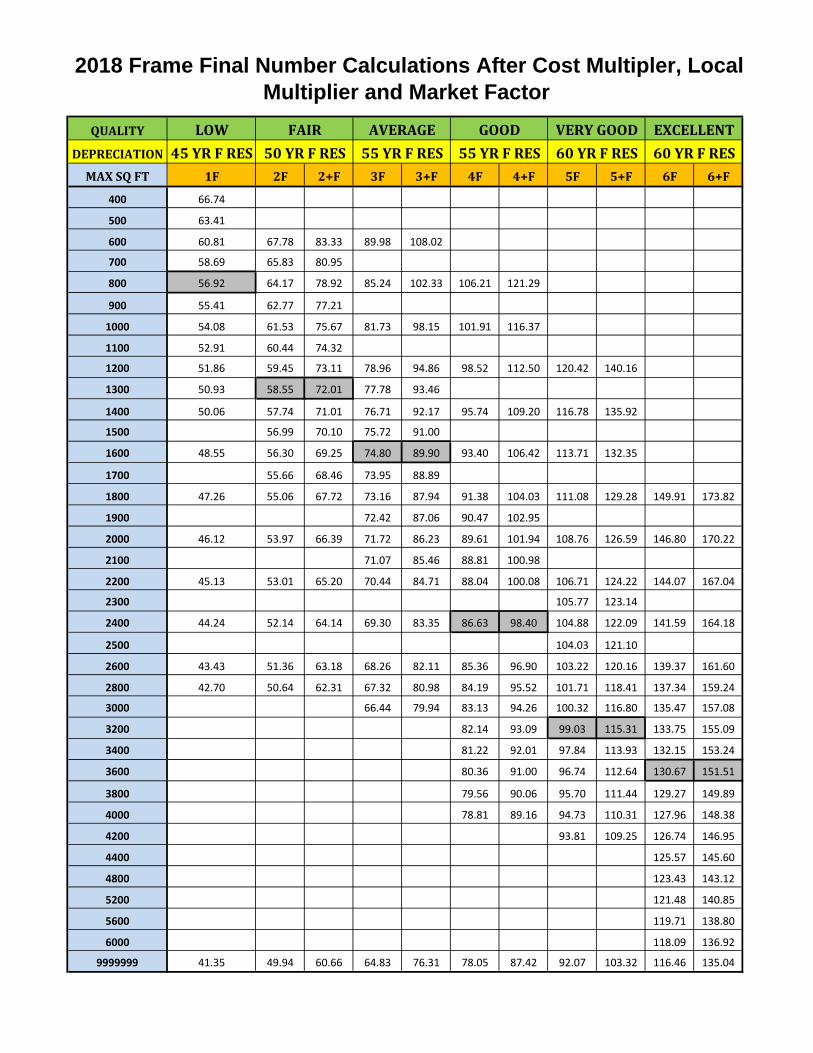
Cost Schedules
All residential parcels in the district are valued from identical cost schedules using a comparative unit
method. The district’s residential cost schedules, originally adopted from a National Costing Service,
have been customized to fit Hunt County’s local residential building and labor market. The cost
schedules are reviewed regularly as a result of recent state legislation requiring that the appraisal
district “clearly state the reason for any variation between generally accepted cost data and locally
produced cost data if the data vary by more than 10%; and make available to the property owner on
request all applicable market data that demonstrate the difference between the replacement cost of
the improvements to the property and the depreciated value of the improvements.” Sales analysis
indicated that local market modifiers lowering the schedules greater than 10% of the Marshall Swift
indicated values for residential property were appropriate to adjust the schedules to the present
market. Copies of these resulting ratio reports are available if requested by a taxpayer.
Sales Information
A sales file for the storage of “snapshot” sales data at the time of sale is maintained. Residential
vacant land sales, along with commercial improved and vacant land sales are maintained in a
separate sales information system. Residential improved and vacant sales are collected from a
variety of sources, including: district questionnaires sent to buyer and seller, field discovery, protest
hearings, Board of Realtor’s MLS, various sale vendors, builders, and realtors. A system of type,
source, validity and verification codes was established to define salient facts related to a property’s
purchase or transfer. School district or neighborhood sales reports are generated as an analysis tool
for the appraiser in the development of value estimates.
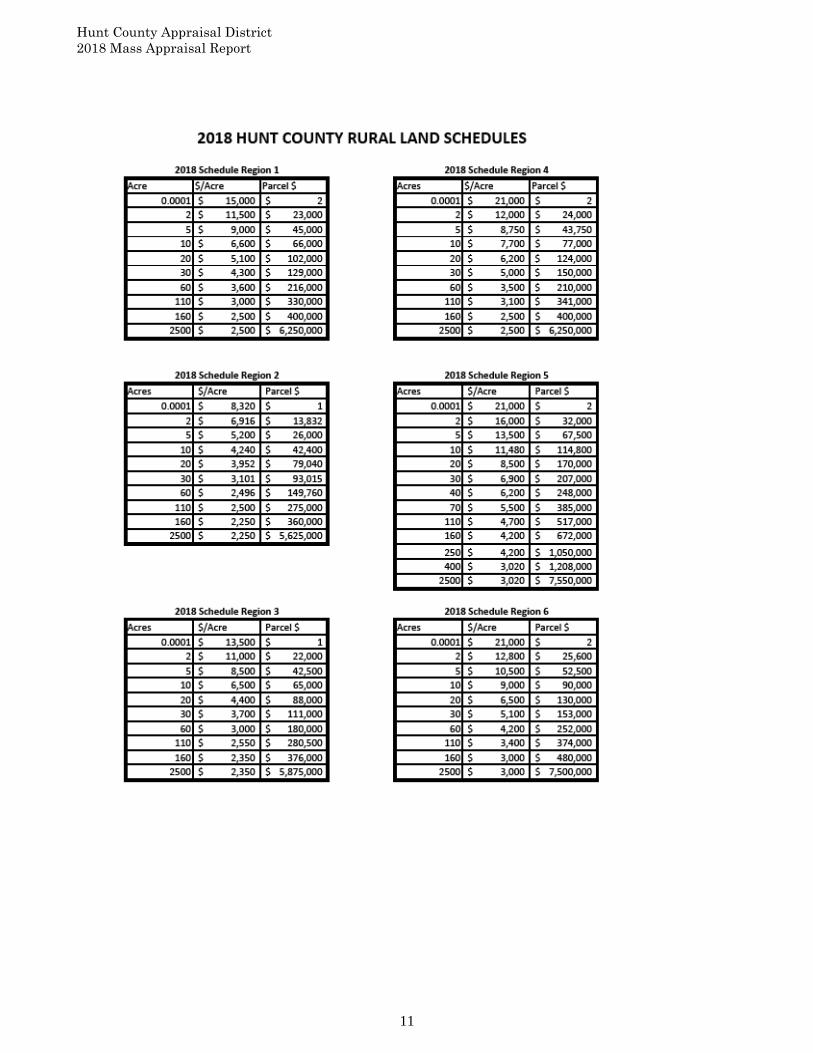
Land Analysis
Land analysis is conducted by the land appraiser. The appraiser analyzes collected sale data and
stores this data within computerized tables. Methods such as abstraction and allocation are used to
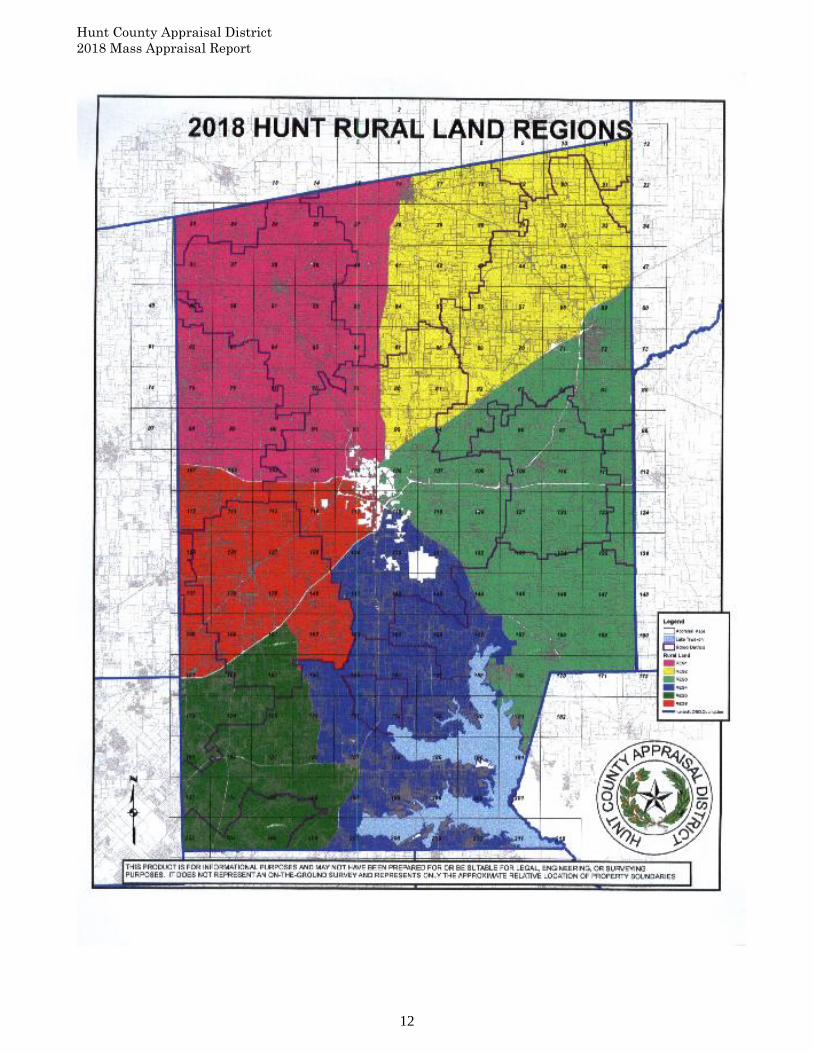
determine contributory values for improved sales. The appraiser analyzes the market data to develop
market areas. Data is selected and used to develop unit price land schedules which are assigned to
each market area. These land schedules are designed to represent market influence and generally
exhibit economy to scale. Computerized land tables store the land information required to
consistently value individual parcels within market areas. Adjustments for specific land influences are
used when necessary, to adjust parcels outside the market area’s norm for such factors as view,
shape, size, topography, and any other prevalent characteristics.
Page 11
Hunt County Appraisal District
2018 Mass Appraisal Report
11
Page 12
Hunt County Appraisal District
2018 Mass Appraisal Report
12
Page 13
Hunt County Appraisal District
2018 Mass Appraisal Report
13
Statistical Analysis
The residential valuation appraisers perform statistical analysis annually to evaluate whether values
are equitable and consistent with the market. Ratio studies are conducted on each of the
approximately 22 residential classes in the district and then broken down into stratification of
neighborhoods to judge the two primary aspects of mass appraisal accuracy--level and uniformity of
value. Appraisal statistics of central tendency and dispersion generated from sales ratios are
available for each class and appropriate neighborhoods. These may be further stratified by year built,
size of living area and other indicators of the market. These summary statistics including, but not
limited to, the weighted mean, median, standard deviation, coefficient of variation, and coefficient of
dispersion, provide the appraisers a tool by which to determine both the level and uniformity of
appraised value on a stratified neighborhood basis. The level of appraised values is determined by
the weighted mean for individual properties within a neighborhood, and a comparison of neighborhood
weighted means reflect the general level of appraised value between comparable neighborhoods.
Review of the standard deviation, coefficient of variation, and coefficient of dispersion discerns
appraisal uniformity within and between stratified neighborhoods.
Every neighborhood is reviewed annually by the appraiser through the sales ratio analysis process.
The first phase involves neighborhood ratio studies that compare the recent sales prices of
neighborhood properties to the appraised values of these sold properties. This set of ratio studies
affords the appraiser an excellent means of judging the present level of appraised value and
uniformity of the sales. The appraiser, based on the sales ratio statistics and designated parameters
for valuation update, makes a preliminary decision as to whether the value level in a neighborhood
needs to be updated in an upcoming reappraisal, or whether the level of market value in a
neighborhood is at an acceptable level.
Market Adjustment or Trending Factors
Neighborhood, or market adjustment, factors are developed from appraisal statistics provided from
ratio studies and are used to ensure that estimated values are consistent with the market. The
district’s primary approach to the valuation of residential properties uses a hybrid cost-sales
comparison approach. This type of approach accounts for neighborhood market influences not
specified in the cost model.
The following equation denotes the hybrid model used:
MV = [LMA (LV)] + [IMA (RCN – D)]
whereas, the market value equals the land market adjustment factor times the land value plus the
improvement market adjustment factor times replacement cost new less depreciation. As the cost
approach separately estimates both land and building values and uses depreciated replacement
costs, which reflect only the supply side of the market, it is expected that adjustments to the cost
values are needed to bring the level of appraisal to an acceptable standard. Market, or location
adjustments are applied uniformly within neighborhoods to account for locational variances between
market areas or across a jurisdiction. While efforts are made to gather rental information, due to the
predominance of owner occupied residential property, little weight is applied to the “Income
Approach”. The hybrid model used combines both the Cost and Market approaches in a manner that
will best indicate the market value of single family residences.
Page 14
Hunt County Appraisal District
2018 Mass Appraisal Report
14
If a neighborhood is to be updated, the appraiser uses a cost ratio study that compares recent sales
prices of properties appropriately adjusted for the effects of time within a delineated neighborhood
with the properties’ actual cost value. The calculated ratio derived from the sum of the sold
properties’ cost value divided by the sum of the sales prices indicates the neighborhood level of value
based on the unadjusted cost value for the sold properties. This cost-to-sale ratio is compared to the
appraisal-to-sale ratio to determine the market adjustment factor for each neighborhood. This market
adjustment factor is needed to trend the values obtained through the cost approach closer to the
actual market evidenced by recent sales prices within a given neighborhood. The sales used to
determine the market adjustment factor will reflect the market influences and conditions only for the
specified neighborhood, thus producing more representative and supportable values. The market
adjustment factor calculated for each update neighborhood is applied uniformly to all properties within
a neighborhood. Once the market-trend factors are applied, a second set of ratio studies is generated
that compares recent sale prices with the proposed appraised values for these sold properties. From
this set of ratio studies, the appraiser judges the appraisal level and uniformity in both update and
non-update neighborhoods, and finally, for the school district as a whole.
TREATMENT OF RESIDENCE HOMESTEADS
Beginning in 1998, the State of Texas implemented a constitutional classification scheme concerning
the appraisal of residential property that receives a residence homestead exemption. Under the new
law, beginning in the second year a property receives a homestead exemption, increases in the value
of that property are "capped." The value for tax purposes (appraised value) of a qualified residence
homestead will be the LESSER of:
the market value of the appraised value of the property for the most recent tax year that the market value was determined by the appraisal office: or
the sum of:
(A) 10 percent of the appraised value of the property for the preceding tax year;
(B) The appraised value of the property for the preceding tax year; and
(C) The market value of all new improvements to the property.
Values of capped properties must be recomputed annually. If a capped property sells, the cap
automatically expires as of January 1st of the following year. In that following year, that home is
reappraised at its market value to bring its appraisal into uniformity with other properties. An
analogous provision applies to new homes. While a developer owns them, unoccupied residences
are appraised as part of an inventory using the district’s land value and the developer’s construction
costs as of the valuation date. However, in the year following sale, they are reappraised at market
value.
Page 15
Hunt County Appraisal District
2018 Mass Appraisal Report
15
INDIVIDUAL VALUE REVIEW PROCEDURES
Field Review
The appraiser identifies individual properties in critical need of field review through sales ratio
analysis, information gained through the equalization process, and from information from owners of
specific properties as well as other taxpayers’ concerns. These properties are coded for recheck for
the following year with a code 01/01/ (next appraisal year). During the year when time permits,
properties are coded 01/02/current year for additional rechecks.
Properties picked up during the year in early stages of construction are also coded for inspection at
the end of the year to determine the percentage complete for the January 1 valuation date as
prescribed by the Property Tax Code. During these rechecks, the appraiser frequently field reviews
subjective data items such as quality of construction, condition, and physical, functional and economic
obsolescence, factors contributing significantly to the market value of the property. After preliminary
estimates of value have been determined in targeted areas, the appraiser takes valuation documents
to the field to test the computer-assisted values against his own appraisal judgment.
PERFORMANCE TESTS
Sales Ratio Studies
The district’s ratio studies were designed and prepared, to the maximum extent possible, under the
guidelines set forth in the International Association of Assessing Officers current “Standard on Ratio
Studies”. The ratio studies are calculated in order to evaluate the relationship between the appraisals
and the sales prices as of the assessment date of January 1 and used to estimate the general level of
appraisal and the uniformity of appraisal.
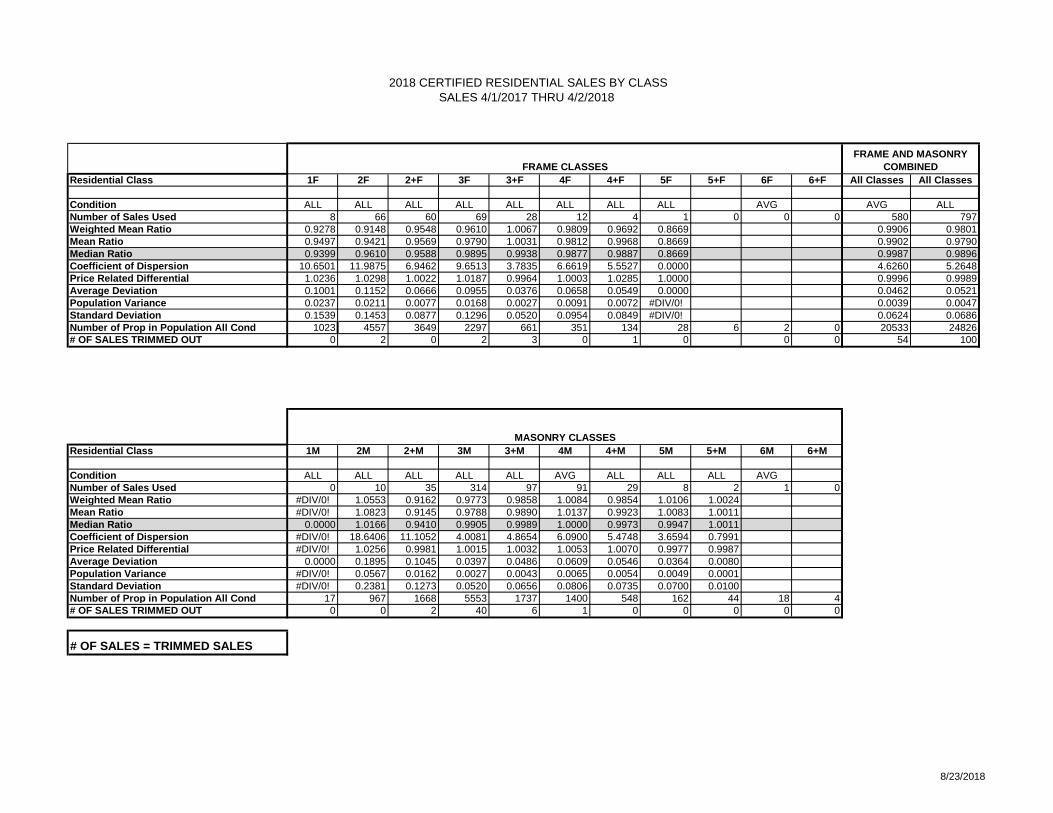
Beginning with the 2017 Tax Year, the residential appraisal schedules has gone into a two-step
process for review and development. For 2017 and the subsequent years during the fall the actual
Residential classes will be reviewed. Sales Ratios derived from the previous year’s certified numbers
will be used along with verified sales gathered after the notices were mailed and local market
modifiers will be developed to adjust the Marshall Swift costing tables to the Hunt County Residential
Market. Ratios were performed for a period of January 1, 2016 thru October 12, 2017. The costing
tables for Frame and Masonry Residential Property for the 2017 & 2018 Tax Year was developed and
placed in the district’s Residential Appraisal Manual.
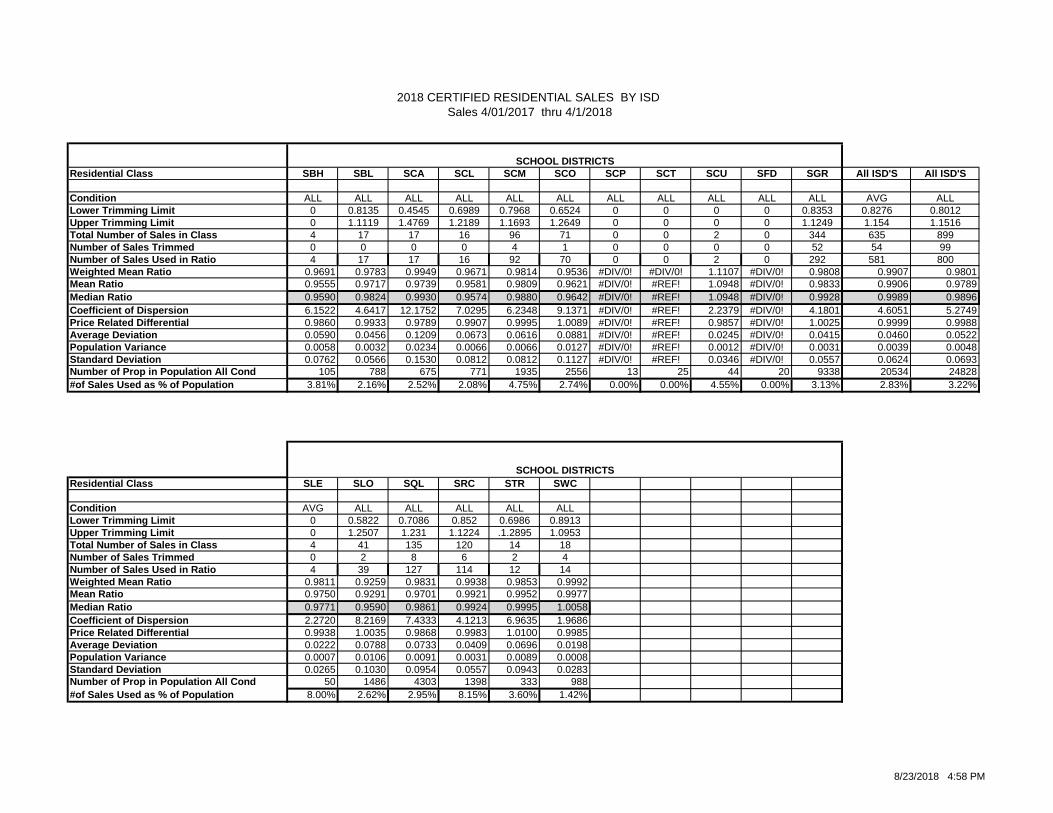
During the spring of the Tax Year, just before the notices go out, Ratio reports were developed on the
Neighborhood level. The period of sales that were used were from April 1, 2017 thru April 2, 2018.
These were analyzed and adjustments were made to assure fair and equitable appraisal of all
residential properties in a uniform manner.
All sales were used and screened to ensure, to the extent possible, that only valid indicators of market
value were included. Examples of sales that were excluded included sales involving atypical
financing, sales between relatives or corporate affiliates, estate sales, or sales under duress.
Foreclosures are reviewed as to determine the condition of the improvements. Further information
from the taxpayer may indicate that the foreclosure sales price is indicative of the market for a similar
property in the same condition. If there is an area which has a significant number of foreclosures and
it appears to set the tone for the market for that neighborhood, these prices are considered in the final
Page 16
Hunt County Appraisal District
2018 Mass Appraisal Report
16
market values for that neighborhood. This would be the case where foreclosures represent 50
percent or more of the sales and there are a significant number of sales for that neighborhood. Since
Texas does not have mandatory sales disclosure, Hunt County Appraisal District does not have
access to all property transactions, which limits the sales used to those acquired through a
commercial vendor or submitted voluntarily by the property owners.
The median ratio for each residential class along with the ratio for the total residential sales file is an
indicator of the level of appraisal for the population of single family residences. The median is the
preferred measure of central tendency because it gives equal weight to each ratio and is less affected
by extreme ratios. The Coefficient of Dispersion (COD) is a measure of variability and generally the
smaller the measure of variability, the better the uniformity. Trimming the sales for outliers is
performed in a manner consistent with the appendix of the “Standard on Ratio Studies”.
Management Review Process
Once the proposed value estimates are finalized, the appraiser reviewed the sales ratios by
neighborhood and presents pertinent valuation data, such as, history of hearing protest, sale-to-parcel
ratio, and level of appraisal to the Chief Appraiser for final review and approval. This review includes
comparison of level of value between related neighborhoods within and across jurisdiction lines. The
primary objective of this review is to ensure that the proposed values have met preset appraisal
guidelines appropriate for the tax year in question.
Page 17
Hunt County Appraisal District
2018 Mass Appraisal Report
17
Commercial Valuation Process
INTRODUCTION
Appraisal Responsibility
This mass appraisal assignment includes all of the commercially classed real property which falls
within the responsibility of the commercial valuation appraisers of the Hunt County Appraisal District
and located within the boundaries of this taxing jurisdiction. The attached appraisal roll displays and
identifies each parcel of real property individually. Commercial appraisers appraise the fee simple
interest of properties according to statute. However, the effect of easements, restrictions,
encumbrances, leases, contracts or special assessments are considered on an individual basis, as is
the appraisement of any nonexempt taxable fractional interests in real property (i.e. Certain multi-
family housing projects). Fractional interests or partial holdings of real property are appraised in fee
simple for the whole property and divided programmatically based on their prorated interests.
Appraisal Resources
The improved real property appraisal responsibilities are categorized according to major
property types of multi-family or apartment, office, retail, warehouse and special use (i.e.
hotels, hospitals and, nursing homes). 2 appraisers are assigned to improved commercial
property types. They each appraise both the land and improvements of the properties they
are responsible for.
Data - The data used by the commercial appraiser includes verified sales of vacant land and
improved properties and the pertinent data obtained from each (sales price levels,
capitalization rates, income multipliers, equity dividend rates, marketing period, etc.). Other
data used by the appraiser includes actual income and expense data (typically obtained
through the hearings process), actual contract rental data, leasing information (commissions,
tenant finish, length of terms, etc.), and actual construction cost data. In addition to the actual
data obtained from specific properties, market data publications are also reviewed to provide
additional support for market trends.
PRELIMINARY ANALYSIS
Pilot Study
Pilot studies are utilized to test new or existing procedures or valuation modifications in a limited area
(a sample of properties) of the district and are also considered whenever substantial changes are
made. These studies, which are inclusive of ratio studies, reveal whether a new system is producing
accurate and reliable values or whether procedural modifications are required. The appraiser
implements this methodology when developing both the cost approach and income approach models.
Survey of Similar Jurisdictions: Hunt CAD coordinates its discovery and valuation activities with
adjoining Appraisal Districts. Numerous field trips, interviews and data exchanges with adjacent
Page 18
Hunt County Appraisal District
2018 Mass Appraisal Report
18
appraisal districts have been conducted to ensure compliance with state statues. In addition, Hunt
CAD administration and personnel interact with other assessment officials through professional trade
organizations including the International Association of Assessing Officers, Texas Association of
Appraisal Districts and its subchapter Texas Metropolitan Association of Appraisal Districts and the
Texas Association of Assessing Officers.
VALUATION APPROACH (Model Specification)
Area Analysis
Data on regional economic forces such as demographic patterns, regional locational factors,
employment and income patterns, general trends in real property prices and rents, interest rate
trends, availability of vacant land, and construction trends and costs are collected from private
vendors and public sources; for example, continuing education in the form of International Association
of Assessing Officers (IAAO), Texas Association of Assessing Officers (TAAO), Texas Association of
Appraisal Districts (TAAD) and Texas Department of Licensing and Regulation (TDLR) approved
courses.
Neighborhood Analysis
The neighborhood is comprised of the land area and commercially classed properties located within
the boundaries of this taxing jurisdiction. This area consists of a wide variety of property types
including residential, commercial and industrial. Neighborhood analysis involves the examination of
how physical, economic, governmental and social forces and other influences affect property values.
The effects of these forces are also used to identify, classify, and organize comparable properties into
smaller, manageable subsets of the universe of properties known as neighborhoods. In the mass
appraisal of commercial properties these subsets of a universe of properties are generally referred to
as market areas or economic areas.
Economic areas are defined by each of the improved property use types (apartment, office, retail,
warehouse and special use) based upon an analysis of similar economic or market forces. These
include but are not limited similarities of rental rates, classification of projects (known as building class
by area commercial market experts), date of construction, overall market activity or other pertinent
influences. Economic area identification and delineation by each major property use type is the
benchmark of the commercial valuation system. All income model valuation (income approach to
value estimates) is economic area specific. Economic areas are periodically reviewed to determine if
redelineation is required. The geographic boundaries as well as, income, occupancy and expense
levels and capitalization rates by age within each economic area for all commercial use types and its
corresponding income model may be found in the Commercial Valuation Manual.
Highest and Best Use Analysis
The highest and best use is the most reasonable and probable use that generates the highest present
value of the real estate as of the date of valuation. The highest and best use of any given property
must be physically possible, legally permissible, financially feasible, and maximally productive. For
improved properties, highest and best use is evaluated as improved and as if the site were still
vacant. This assists in determining if the existing improvements have a transitional use, interim use,
nonconforming use, multiple uses, speculative use, excess land, or a different optimum use if the site
Page 19
Hunt County Appraisal District
2018 Mass Appraisal Report
19
were vacant. For vacant tracts of land within this jurisdiction, the highest and best use is considered
speculative based on the surrounding land uses. Improved properties reflect a wide variety of highest
and best uses which include, but are not limited to: office, retail, apartment, warehouse, light
industrial, special purpose, or interim uses. In many instances, the property's current use is the same
as its highest and best use. This analysis insures that an accurate estimate of market value
(sometimes referred to as value in exchange) is derived.
On the other hand, value in use represents the value of a property to a specific user for a specific
purpose. This is significantly different than market value, which approximates market price under the
following assumptions: (i) no coercion of undue influence over the buyer or seller in an attempt to
force the purchase or sale, (ii) well-informed buyers and sellers acting in their own best interests, (iii) a
reasonable time for the transaction to take place, and (iv) payment in cash or its equivalent.
Market Analysis
A market analysis relates directly to market forces affecting supply and demand. This study involves
the relationships between social, economic, environmental, governmental, and site conditions.
Current market activity including sales of commercial properties, new construction, new leases, lease
rates, absorption rates, vacancies, allowable expenses (inclusive of replacement reserves), expense
ratio trends, capitalization rate studies are analyzed.
DATA COLLECTION / VALIDATION
Data Collection Manuals
The primary manual pertinent to data collection and documentation is the Commercial/Industrial
Appraisal Manual. This manual is continually updated, providing a uniform system of itemizing the
multitude of components comprising improved properties. All properties located in Hunt CAD’s
inventory are coded according to this manual and the approaches to value are structured and
calibrated based on this coding system. The most recent revision of the Commercial/Industrial
manual was 2016.
Sources of Data
In terms of commercial sales data, Hunt CAD receives a copy of the deeds recorded in Hunt County
that convey commercially classed properties. The deeds involving a change in commercial ownership
are entered into the sales information system and researched in an attempt to obtain the pertinent
sale information. Other sources of sale data include the hearings process and local, regional and
national real estate and financial publications.
For those properties involved in a transfer of commercial ownership, a sale file is produced which
begins the research and verification process. The initial step in sales verification involves a computer-
generated questionnaire, which is mailed to both parties in the transaction (Grantor and Grantee). If a
questionnaire is not returned within thirty days a second questionnaire is mailed. If a questionnaire is
answered and returned, the documented responses are recorded into the computerized sales
database system. If no information is provided, verification is then attempted via phone calls to both
parties. If the sales information is still not obtained, other sources are contacted such as the brokers
involved in the sale, property managers or commercial vendors. In other instances sales verification
is obtained from local appraisers or others that may have the desired information. Finally, closing
Page 20
Hunt County Appraisal District
2018 Mass Appraisal Report
20
statements are often provided during the hearings process. The actual closing statement is the most
reliable and preferred method of sales verification.
VALUATION ANALYSIS (Model Calibration)
Model calibration involves the process of periodically adjusting the mass appraisal formulas, tables
and schedules to reflect current local market conditions. Once the models have undergone the
specification process, adjustments can be made to reflect new construction procedures, materials
and/or costs, which can vary from year to year. The basic structure of a mass appraisal model can be
valid over an extended period of time, with trending factors utilized for updating the data to the current
market conditions. However, at some point, if the adjustment process becomes too involved, the
model calibration technique can mandate new model specifications or a revised model structure.
Cost Schedules
The cost approach to value is applied to all improved real property utilizing the comparative unit
method. This methodology involves the utilization of national cost data reporting services as well as
actual cost information on comparable properties whenever possible. Cost models are typically
developed based on the Marshall Swift Valuation Service. Cost models include the derivation of
replacement cost new (RCN) of all improvements. These include comparative base rates, per unit
adjustments and lump sum adjustments. This approach also employs the sales comparison approach
in the valuation of the underlying land value. Time and location modifiers are necessary to adjust cost
data to reflect conditions in a specific market and changes in costs over a period of time. Because a
national cost service is used as a basis for the cost models, locational modifiers are necessary to
adjust these base costs specifically for Hunt County. These modifiers are provided by the national
cost services.
Depreciation schedules are developed based on what is typical for each property type at that specific
age. Depreciation schedules have been implemented for what is typical of each major class of
commercial property by economic life categories. Schedules have been developed for improvements
with 15, 20, 30, 40, 50 and 60 year expected life. These schedules are then tested to ensure they are
reflective of current market conditions. The actual and effective ages of improvements are noted in
CAMA. Effective age estimates are based on the utility of the improvements relative to where the
improvement lies on the scale of its total economic life and its competitive position in the marketplace.
Market adjustment factors such as external and/or functional obsolescence can be applied if
warranted. A depreciation calculation override can be used if the condition or effective age of a
property varies from the norm by appropriately noting the physical condition and functional utility
ratings on the property data characteristics. These adjustments are typically applied to a specific
property type or location and can be developed via ratio studies or other market analyses. Accuracy
in the development of the cost schedules, condition ratings and depreciation schedules will usually
minimize the necessity of this type of an adjustment factor.
Income Models
The income approach to value is applied to those real properties which are typically viewed by market
participants as “income producing”, and for which the income methodology is considered a leading
value indicator. The first step in the income approach pertains to the estimation of market rent on a
Page 21
Hunt County Appraisal District
2018 Mass Appraisal Report
21
per unit basis. This is derived primarily from actual rent data furnished by property owners and from
local market study publications. This per unit rental rate multiplied by the number of units results in
the estimate of potential gross rent.
A vacancy and collection loss allowance is the next item to consider in the income approach. The
projected vacancy and collection loss allowance is established from actual data furnished by property
owners and on local market publications. This allowance accounts for periodic fluctuations in
occupancy, both above and below an estimated stabilized level. The market derived stabilized
vacancy and collection loss allowance is subtracted from the potential gross rent estimate to yield an
effective gross rent.
Next a secondary income or service income is calculated as a percentage of stabilized effective gross
rent. Secondary income represents parking income, escalations, reimbursements, and other
miscellaneous income generated by the operations of real property. The secondary income estimate
is derived from actual data collected and available market information. The secondary income
estimate is then added to effective gross rent to arrive at an effective gross income.
Allowable expenses and expense ratio estimates are based on a study of the local market, with the
assumption of prudent management. An allowance for non-recoverable expenses such as leasing
costs and tenant improvements are included in the expenses. A non-recoverable expense represents
costs that the owner pays to lease rental space. Different expense ratios are developed for different
types of commercial property based on use. For instance, retail properties are most frequently leased
on a triple-net basis, whereby the tenant is responsible for his pro-rata share of taxes, insurance and
common area maintenance. In comparison, a general office building is most often leased on a base
year expense stop. This lease type stipulates that the owner is responsible for all expenses incurred
during the first year of the lease. However, any amount in excess of the total per unit expenditure in
the first year is the responsibility of the tenant. Under this scenario, if the total operating expense in
year one (1) equates to $8.00 per square foot, any increase in expense over $8.00 per square foot
throughout the remainder of the lease term would be the responsibility of the tenant. As a result,
expense ratios are implemented based on the type of commercial property.
Another form of allowable expense is the replacement of short-lived items (such as roof or floor
coverings, air conditioning or major mechanical equipment or appliances) requiring expenditures of
large lump sums. When these capital expenditures are analyzed for consistency and adjusted, they
may be applied on an annualized basis as stabilized expenses. When performed according to local
market practices by commercial property type, these expenses when annualized are known as
replacement reserves.
Subtracting the allowable expenses (inclusive of non-recoverable expenses and replacement
reserves) from the effective gross income yields an estimate of net operating income.
Rates and multipliers are used to convert income into an estimate of market value. These include
income multipliers, overall capitalization rates, and discount rates. Each of these is used in specific
applications. Rates and multipliers also vary between property types, as well as by location, quality,
condition, design, age, and other factors. Therefore, application of the various rates and multipliers
must be based on a thorough analysis of the market. These procedures are documented in the
Commercial Appraisal Manual. The last time this manual was updated was in 2016.
Page 22
Hunt County Appraisal District
2018 Mass Appraisal Report
22
Capitalization analysis is used in the income approach models. This methodology involves the
capitalization of net operating income as an indication of market value for a specific property.
Capitalization rates, both overall (going-in) cap rates for the direct capitalization method and terminal
cap rates for discounted cash flow analyses, can be derived from the market. Sales of improved
properties from which actual income and expense data are obtained provide a very good indication of
what a specific market participant is requiring from an investment at a specific point in time. In
addition, overall capitalization rates can be derived from the built-up method (band-of-investment).
This method relates to satisfying the market return requirements of both the debt and equity positions
of a real estate investment. This information is obtained from real estate and financial publications.
Rent loss concessions are made on specific properties with vacancy problems. A rent loss
concession accounts for the impact of lost rental income while the building is moving toward stabilized
occupancy. The rent loss is calculated by multiplying the rental rate by the percent difference of the
property’s stabilized occupancy and its actual occupancy. Build out allowances (for first generation
space or retrofit/second generation space as appropriate) and leasing expenses are added to the rent
loss estimate. The total adjusted loss from these real property operations is discounted using an
acceptable risk rate. The discounted value (inclusive of rent loss due to extraordinary vacancy, build
out allowances and leasing commissions) becomes the rent loss concession and is deducted from the
value indication of the property at stabilized occupancy. A variation of this technique allows that for
every year that the property’s actual occupancy is less than stabilized occupancy a rent loss
deduction may be estimated.
The model for the income approach is:
Potential Gross Rent -Vacancy and Collections
Effective Gross Rent + Other Income
Effective Gross Income -Allowed Expenses
Net Operating Income /Capitalization Rate
Market Value
Sales Comparison (Market) Approach
Although all three of the approaches to value are based on market data, the Sales Comparison
Approach is most frequently referred to as the Market Approach. This approach is utilized not only for
estimating land value but also in comparing sales of similarly improved properties to each parcel on
the appraisal roll. As previously discussed in the Data Collection / Validation section of this report,
pertinent data from actual sales of properties, both vacant and improved, is pursued throughout the
year in order to obtain relevant information which can be used in all aspects of valuation. Sales of
similarly improved properties can provide a basis for the depreciation schedules in the Cost Approach,
rates and multipliers used in the Income Approach, and as a direct comparison in the Sales
Page 23
Hunt County Appraisal District
2018 Mass Appraisal Report
23
Comparison Approach. Improved sales are also used in ratio studies, which afford the appraiser an
excellent means of judging the present level and uniformity of the appraised values.
Final Valuation Schedules
Based on the market data analysis and review discussed previously in the cost, income and sales
approaches, the cost and income models are calibrated and finalized. The calibration results are
keyed to the schedules and models on the mainframe CAMA system for utilization on all commercial
properties in the district. The schedules and models are summarized in the Commercial Manual.
This manual is provided to appraisers and is made available to the public in an easy to understand
format.
Statistical and Capitalization Analysis
Statistical analysis of final values is an essential component of quality control. This methodology
represents a comparison of the final value against the standard and provides a concise measurement
of the appraisal performance. Statistical comparisons of many different standards are used including
sales of similar properties, the previous year’s appraised value, audit trails, value change analysis and
sales ratio analysis.
Appraisal statistics of central tendency and dispersion generated from sales ratios are available for
each property type. These summary statistics including, but not limited to, the weighted mean,
standard deviation and coefficient of variation, provide the appraisers an analytical tool by which to
determine both the level and uniformity of appraised value of a particular property type. The level of
appraised values can be determined by the weighted mean for individual properties within a specific
type, and a comparison of weighted means can reflect the general level of appraised value. Review
of the standard deviation and the coefficient of variation can discern appraisal uniformity within a
specific property type.
The appraisers review every commercial property type annually through the sales ratio analysis
process. The first phase involves ratio studies that compare the recent sales prices of properties to
the appraised values of the sold properties. This set of ratio studies affords the appraiser an excellent
means of judging the present level of appraised value and uniformity of the appraised values. The
appraiser, based on the sales ratio statistics and designated parameters for valuation update, makes
a preliminary decision as to whether the value level of a particular property type needs to be updated
in an upcoming reappraisal, or whether the level of market value is at an acceptable level.
Potential gross rent estimates, occupancy levels, secondary income, allowable expenses (inclusive of
non-recoverables and replacement reserves), net operating income and capitalization rate and
multipliers are continuously reviewed utilizing frequency distribution methods or other statistical
procedures or measures. Income model conclusions are compared to actual information obtained on
individual commercial properties during the hearings process as well as information from published
sources and area vendors.
INDIVIDUAL VALUE REVIEW PROCEDURES
Field Review
The date of last inspection, extent of that inspection, and the Hunt CAD appraiser responsible are
listed in the CAMA system. If a property owner disputes the District's records concerning this data in
Page 24
Hunt County Appraisal District
2018 Mass Appraisal Report
24
a protest hearing, CAMA may be altered based on the credibility of the evidence provided. Typically,
a new field check is then requested to verify this evidence for the current year's valuation or for the
next year's valuation. In addition, if a building permit is filed for a particular property indicating a
change in characteristics, that property is added to a work file. Finally, even though every property
cannot be inspected each year, each appraiser typically designates certain segments of their area of
responsibility to conduct field checks.
Commercial appraisers are somewhat limited in the time available to field review all commercial
properties of a specific use type. However, a major effort is made by appraisers to field review as
many properties as possible or economic areas experiencing large numbers of remodels, renovations,
or retrofits, changes in occupancy levels or rental rates, new leasing activity, new construction, or
wide variations in sale prices. Additionally, the appraisers frequently field review subjective data items
such as building class, quality of construction (known as cost modifiers), condition, and physical,
functional and economic obsolescence factors contributing significantly to the market value of the
property. In some cases field reviews are warranted when sharp changes in occupancy or rental rate
levels occur between building classes or between economic areas. With preliminary estimates of
value in these targeted areas, the appraisers test computer assisted values against their own
appraisal judgment. While in the field, the appraisers physically inspect sold and unsold properties for
comparability and consistency of values.
Office Review
Office reviews are completed on properties not subject to field inspections and are performed in
compliance with the guidelines contained in the Commercial Manual. The Commercial Appraisal
Manual outlines the application of the three approaches to value (including Discounted Cash Flow -
DCF). This manual is rigorously maintained and updated frequently. The last update of the
Commercial Manual was in 2016.
Office reviews are typically limited by the data presented in final value reports. These reports
summarize the pertinent data of each property as well as comparing the previous values (two year
value history) to the proposed value conclusions of the various approaches to value. These reports
show proposed percentage value changes, income model attributes or overrides, economic factor
(cost overrides) and special factors affecting the property valuation such as new construction status,
prior year litigation and a three years sales history (USPAP property history requirement for non-
residential property). The appraiser may review methodology for appropriateness to ascertain that it
was completed in accordance with USPAP or more stringent statutory and district policies. This
review is performed after preliminary ratio statistics have been applied. If the ratio statistics are
generally acceptable overall the review process is focused primarily on locating skewed results on an
individual basis. Previous values resulting from protest hearings are individually reviewed to
determine if the value remains appropriate for the current year based on market conditions. Each
appraiser's review is limited to properties in their area of responsibility by property type (improved) or
geographic area (commercial vacant land).
Once the appraiser is satisfied with the level and uniformity of value for each commercial property
within their area of responsibility, the estimates of value go to noticing. Each parcel is subjected to
the value parameters appropriate for its use type. If one of the parcel’s component values, land value,
Page 25
Hunt County Appraisal District
2018 Mass Appraisal Report
25
improvement value or total value exceeds the permissible change in value range it "fails the value
edits". In this case, the parcel does not shift to noticing, but it is placed on a rework list. Therefore,
although the value estimates are determined in a computerized mass appraisal environment, value
edits and rework lists enable an individual parcel review of value anomalies before the estimate of
value is released for noticing.
PERFORMANCE TESTS
The primary tool used to measure mass appraisal performance is the ratio study. A ratio study
compares appraised values to market values. In a ratio study, market values (value in exchange) are
typically represented by sales prices (i.e. A sales ratio study). Independent, expert appraisals may
also be used to represent market values in a ratio study (i.e. An appraisal ratio study). If there are
not enough sales to provide necessary representativeness, independent appraisals can be used as
indicators for market value. This can be particularly useful for commercial, warehouse or industrial
real property for which sales are limited. In addition, appraisal ratio studies can be used for properties
statutorily not appraised at market value, but reflect the use-value requirement. An example of this
are multi-family housing projects subject to subsidized rent provisions or other governmental
guarantees as provided by legislative statutes (affordable housing) or agricultural lands to be
appraised on the basis of productivity or use value.
Hunt CAD has adopted the policies of the IAAO STANDARD ON RATIO STUDIES, circa 2013
regarding its ratio study standards and practices. Ratio studies generally have seven basic steps: (1)
definition of purpose, scope and objectives, (2) design, (3) stratification, (4) collection and preparation
of data, (5) matching of appraisal and market data, (6) statistical analysis, and (7) evaluation and use
of the results.
Sales Ratio Studies
Sales ratio studies are an integral part of establishing equitable and accurate market value estimates,
and ultimately assessments for this taxing jurisdiction. The primary uses of sale ratio studies include
the determination of a need for general reappraisal; prioritizing selected groups of properties types for
reappraisal; identification of potential problems with appraisal procedures; assist in market analyses;
and, to calibrate models used to derive appraised values during valuation or reappraisal cycles.
However, these studies cannot be used to judge the accuracy of an individual property appraised
value. The Hunt County Appraisal Review Board may make individual value adjustments based on
unequal appraisal (ratio) protest evidence submitted on a case-by-case basis during the hearing
process.
Overall sales ratios are generated by use type semi-annually (or more often in specific areas) to allow
appraisers to review general market trends in their area of responsibility. The appraisers utilize
desktop applications such as MS EXCEL programs to evaluate subsets of data by economic area or a
specific and unique data item. On the desktop, this may be customized and performed by building
class and age basis. In many cases, field checks may be conducted to insure the ratios produced are
accurate and the appraised values utilized are based on accurate property data characteristics.
These ratio studies aid the appraisers by providing an indication of market activity by economic area
or changing market conditions (appreciation or depreciation). A copy of the district’s latest ratio study
is attached.
Page 26
Hunt County Appraisal District
2018 Mass Appraisal Report
26
Comparative Appraisal Analysis
The commercial appraiser performs an average unit value comparison in addition to a traditional ratio
study. These studies are performed on commercially classed properties by property use type (such
as apartment, office, retail and warehouse usage or special use). The objective to this evaluation is to
determine appraisal performance of sold and unsold properties. Appraiser’s average unit prices of
sales and average unit appraised values of the same parcels and the comparison of average value
changes of sold and unsold properties. These studies are conducted on substrata such as building
class and on properties located within various economic areas. In this way, overall appraisal
performance is evaluated geographically, by specific property type to discern whether sold parcels
have been selectively appraised. When sold parcels and unsold parcels are appraised equally, the
average unit values are similar. These horizontal equity studies are performed prior to annual
noticing.
Page 27
Hunt County Appraisal District
2018 Mass Appraisal Report
27
Industrial Valuation Process
INTRODUCTION
Appraisal Responsibility
The Industrial Appraisers and/or Contract Appraisers of the Hunt County Appraisal District are
responsible for developing fair, uniform market values for improved industrial real properties and
industrial vacant land as well as the utilities in Hunt County. There are approximately 78 parcels of
improved industrial real property in Hunt County. Capital Appraisal Group values approximately 539
utilities and 6 minerals.
Appraisal Resources
Personnel - The industrial section consists of 2 appraisers. In addition, Hunt CAD contracts
with Capitol Appraisal Group, LLC to value utilities for which the district does not have the
available personnel or resources.
Data - The industrial appraisers and contract appraisal staff inspect their assigned properties
to obtain information about buildings, site improvements, process and shop equipment, and
various items of personal property. In addition, appraisal personnel use information provided
by property owners concerning the cost to purchase, install, and construct items of real and
personal property. The individual characteristics of the property being appraised are the
primary factors that drive the appraised value.
VALUATION APPROACH (MODEL SPECIFICATION)
Area Analysis
The scope of market forces affecting industrial products and the capital goods used in the production
process tends to extend beyond regional considerations. The effects of information and
transportation technology are such that most industrial market forces are measured globally. One
exception to this general concept is the market for industrial land. The pricing of land tends to be
closely tied to possible alternative uses in the area. For this reason, appraisers assigned to land
valuation analyze market forces for specific areas and adjust land value schedules appropriately.
Neighborhood Analysis
Neighborhood analysis of the type of properties valued by the industrial appraiser is not meaningful.
Industrial properties do not have the type of generic “sameness” that is appropriate for neighborhood
models.
Page 28
Hunt County Appraisal District
2018 Mass Appraisal Report
28
Highest and Best Use Analysis
The highest and best use of real or personal property is the most reasonable and probable use of the
property on the date of appraisal that is physically and financially feasible, legal, and that derives
maximum production from the property. Usually, the current use of the property is the highest and
best use of that property. Industrial facilities are most commonly located in areas that support
industrial use. In areas where mixed use does occur, the highest and best use of the property is
examined by the appraiser to estimate the effect of this factor.
Market Analysis
Market analysis is the basis for finalizing value estimates on properties for which the industrial
appraiser has responsibility. Even though many industrial properties are unique in nature, the market
for this type property is analyzed to see how the values of similar or similar as possible properties are
affected by market forces. Industrial properties, such as machine shops, have many similar facilities
that can be compared to the subject property in terms of type and size of equipment, type of property
fabricated or serviced at the subject facility, and other factors. Those similarities help the appraiser
estimate the value of the subject property. However, some facilities, such as specialty chemical
plants, are so unique in nature that the appraiser must use the closest available plant in terms of
output quantity, type of product manufactured, and other factors to estimate the value of the subject
property. Many industrial properties use the same type of building and, depending on the type of
business, may use the same type of manufacturing or service equipment. However, the manner in
which the entire business operation is put together makes that particular facility unique. The district
uses information from similar businesses to examine the real and personal property values at a
particular business, but the individual characteristics of the business being reviewed determine the
value estimation. Many of the buildings encountered at industrial facilities are generic in construction,
such as pre-engineered metal buildings. The cost per square foot to construct these type structures
can be used to estimate values at facilities that have similarly constructed buildings. However, the
building as constructed will have differences that must be taken into account when estimating the final
value of the property being reviewed.
Due to the fact that most of the industrial properties are highly specialized and owner occupied, the
Income Approach is considered inappropriate in most cases and receives little weight in the valuation.
DATA COLLECTION/VALIDATION
Data Collection Manuals
An extended range of variations may exist within the same class of industrial property, and there are a
multitude of property types within the industrial category. For this reason, effective data collection
procedures would be very difficult to organize in a single comprehensive manual. The district has
adopted the Marshall & Swift Commercial Estimator Cost guide and its occupancy codes to
standardize data and its collection for buildings assigned to the industrial appraisal staff.
Industrial personal property also consists of many different classes of assets with a wide range of
variation within each class. The district has adopted the convention of listing assets and estimating
effective age of assets in the field. The field listing is then compared with information furnished by
property owners during the final valuation review.
Page 29
Hunt County Appraisal District
2018 Mass Appraisal Report
29
Sources of Data
The original real and personal property data used by Hunt CAD was supplied by the Hunt County Tax
Assessor. Since that time, the district and contract appraisal personnel have updated that information
based on field review. As new facilities are built, the appraisal personnel collect all the real and
personal property data necessary to value the property initially and thereafter update the information
when the property is again visited. The district receives building permit information from the cities and
from the county when a facility is being built outside an incorporated city. Other sources of data
include publications such as the Texas Register regarding waste control permits, various refining and
chemical industry magazine articles, and Texas Industrial Expansion articles on new construction.
Data Collection Procedures
The district appraisal personnel annually or periodically visit assigned plants. The frequency of the
visit is determined by the nature of the business conducted at each facility. For example, refineries
and chemical plants are continually changing or adding to processes to extract greater efficiencies or
make new products, but machine shops may not add or remove equipment over a period two or more
years.
The appraisers take with them the historical data on the buildings and site improvements at the facility
being visited. Changes to the existing structures are noted and that information is used for value
estimation purposes. If cost information for the real or personal property is supplied later, the field
data can be compared to that information to judge the accuracy of the information.
New district appraisers are trained by accompanying appraisers who have performed field visit and
appraisal functions for a number of years. Each district appraiser is responsible for the completeness
and correctness of their valuation work, but a new appraiser is encouraged to seek the advice of and
review by experienced appraisal staff if that person is not sure of their value estimation results.
VALUATION ANALYSIS (MODEL CALIBRATION)
Final Valuation Schedules
The schedules used by the district are those integrated into Marshall & Swift Commercial Estimator
Valuation System for real property improvements. The real property valuation schedules are updated
annually through the use of update disks supplied by Marshall & Swift. The valuation schedule
incorporated into the district’s records is updated annually using a calculated index factor compiled
from data in Chemical Engineering Magazine. Depreciation schedules are also calibrated using the
Consumer Price Index developed by the US Bureau of Labor Statistics.
INDIVIDUAL VALUE REVIEW PROCEDURES
Field Review
The district’s personnel periodically review their assigned industrial real accounts annually. The
results of prior year hearings and indication of building permits being issued are another source of
required field visits. Many times during hearings, issues are presented that cause a value adjustment.
Page 30
Hunt County Appraisal District
2018 Mass Appraisal Report
30
Those issues must be field checked to see if these influences will be on going and warrant permanent
value adjustment or are transitory and a permanent adjustment is not warranted. This information
needs to be recorded so the appraiser will be better able to estimate the property value. Building
permits must be field checked to see what effect these have on existing structures. Any new
construction is noted and the information necessary to value the structure is recorded. Additionally,
any structure demolition is noted so the improvement value can be adjusted accordingly.
Part of the field review includes noting any land characteristics that would affect the land value. The
district values all land for the properties over which it has responsibility, including those properties
assigned to contract appraisal firms. The contract appraisal firms must advise the district of any
characteristics that would affect the value of the land associated with that assigned facility.
PERFORMANCE TESTS
Sales Ratio Studies
Ratio studies are an important tool to examine how close appraised values are to market values. The
ratio study may use available sales data or may use independent, expert appraisals. Typically, there
are not enough sales of industrial properties to show representativeness of that class of property in a
ratio study. Ratio studies of industrial properties usually have to rely on independent appraisals as an
indicator of market values.
Comparative Appraisal Analysis
This type of analysis is usually not done on industrial properties due to the unique nature of the
property and also because of time and budget constraints regarding available appraisal staff. Only in
an instance where a jurisdiction would file a jurisdiction challenge with the Appraisal Review Board
would the district perform such an analysis.
If a jurisdiction challenge is received by Hunt CAD on an industrial category of properties, the
appraisers assigned to those accounts will research the appraisal roll to see what other similar
properties exist. The real property values can be compared on an average value per square foot of
structure basis, but the differences from one facility to another must be carefully compared because it
is unlikely that two different facilities are going to build like improvements and use them in similar
ways.
Page 31
Hunt County Appraisal District
2018 Mass Appraisal Report
31
Business Personal Property Valuation Process
INTRODUCTION
Appraisal Responsibility
There are four different personal property types appraised by the district’s personal property section:
Commercial and Industrial Personal Property accounts; Leased Assets; Vehicles; and Multi-Location
Assets. There are approximately 2370 business personal property accounts in Hunt County.
Appraisal Resources
Personnel - The personal property staff consists of 1 appraiser and 1 support staff.
Data - A common set of data characteristics for each personal property account in Hunt
County is collected in the field and data entered to the district’s computer. The property
characteristic data drives the computer-assisted personal property appraisal (CAPPA) system.
The field data is collected by the personal property appraiser.
VALUATION APPROACH (Model Specification)
SIC Code Analysis
Four digit numeric codes, called Standard Industrial Classification (SIC) codes that were developed by
the federal government. These classifications are used by Hunt CAD as a way to classify personal
property by business type. Hunt CAD has further stratified these accounts by using an additional
Business Personal Property Class Code of four digits that is the first four digits of the Geo ID to group
business types that have similar personal property characteristics.
SIC code and Class Code identification and delineation is the cornerstone of the personal property
valuation system at the district. All of the personal property analysis work done in association with the
personal property valuation process is SIC code and Class code specific. SIC codes are delineated
based on observable aspects of homogeneity. SIC code and Class Code delineation is periodically
reviewed to determine if additional delineation is warranted.
Highest and Best Use Analysis
The highest and best use of property is the reasonable and probable use that supports the highest
present value as of the date of the appraisal. The highest and best use must be physically possible,
legally permissible, financially feasible, and maximally productive. The highest and best use of
personal property is normally its current use.
DATA COLLECTION/VALIDATION
Data Collection Procedures
Personal property data collection procedures are published and distributed to all appraisers involved
in the appraisal and valuation of personal property. The appraisal procedures are reviewed and
revised to meet the changing requirements of field data collection. The most recent revision of the
personal property data collection procedures was in 2018 and these were incorporated in the
Personal Property Appraisal Manual.
Page 32
Hunt County Appraisal District
2018 Mass Appraisal Report
32
Sources of Data
Business Personal Property
The district’s property characteristic data was originally received from Hunt County, and various
school district records in 1980, and where absent, collected through a massive field data collection
effort coordinated by the district over a period of time. When revaluation activities permit, district
appraisers collect new data via an annual field drive-out. This project results in the discovery of new
businesses not revealed through other sources. Various discovery publications such as state sales
tax listings and local occupancy permits are also used to discover personal property. Tax assessors,
city and local newspapers, and the public often provide the district information regarding new personal
property and other useful facts related to property valuation.
Vehicles
An outside vendor, Just Texas, provides Hunt CAD with a listing of commercially registered vehicles
within Hunt County. The vendor develops this listing from the Texas Department of Transportation
(DOT) Title and Registration Division records. They use NADA values as a guide along with other
resourced values. Other sources of data include property owner renditions and field inspections.
Leased and Multi-Location Assets
The primary source of leased and multi-location assets is property owner renditions of property.
Other sources of data include field inspections.
Special Inventory
Special Inventory (which includes motor vehicles, boats, manufactured houses and heavy equipment
at the retail level of trade) is discovered and valued in conjunction with monthly tax statements and
annual declaration forms filed by the owner. Copies of the monthly statements and annual
declarations are maintained by Hunt CAD. Alternative discovery methods may sometimes be used
as with standard BPP accounts described earlier in this report.
The discovery and valuation of certain utility and pipeline accounts is contracted out to third party
appraisal firms. Uniform Standards of Professional Appraisal Practices or USPAP certification and
reappraisal plan information on these properties are maintained at the contractors individual offices.
A list of our third party vendors is available upon request.
VALUATION AND STATISTICAL ANALYSIS (model calibration)
Cost Schedules
Cost schedules are developed by SIC code by district personal property valuation appraisers. The
cost schedules are developed by analyzing cost data from property owner renditions, hearings, state
schedules, and published cost guides. The cost schedules are reviewed as necessary to conform to
changing market conditions. The schedules are typically in a price per square foot format, being
adjusted for quality and density.
Page 33
Hunt County Appraisal District
2018 Mass Appraisal Report
33
Statistical Analysis
Summary statistics including, but not limited to, the median, weighted mean, and standard deviation
provide the appraisers an analytical tool by which to determine both the level and uniformity of
appraised value by SIC code. Review of the standard deviation can discern appraisal uniformity
within SIC codes.
Depreciation Schedule and Trending Factors:
Business Personal Property
Hunt CAD’s primary approach to the valuation of business personal property is the cost approach.
Because we are not valuating the Going Business Concern the Income Approach is not considered
relevant. Due to the lack of sales of a business continuing its operations from owner to owner and the
difficulty in separating the sales price of the going concern, real property and personal property parts
of the sale, the Sales Market Approach receives little weight. The replacement cost new (RCN) is
either developed from property owner reported historical cost or from Hunt CAD developed valuation
models. The trending factors used by Hunt CAD to develop RCN are based on published valuation
guides. The percent good depreciation factors used by Hunt CAD are also based on published
valuation guides. The Business Personal Property Model is:
MARKET VALUE ESTIMATE = HISTORICAL COST X PERCENT GOOD FACTOR
This mass appraisal depreciation schedule is used to ensure that estimated values are uniform and
consistent within the market.
Computer Assisted Personal Property Appraisal (CAPPA)
The CAPPA valuation process has two main objectives: 1) Analyze and adjust existing SIC models.
2) Develop new models for business classifications not previously integrated into CAPPA. The
delineated sample is reviewed for accuracy of SIC code, square footage, field data, and original cost
information. Models are created and refined using actual original cost data to derive a typical
replacement cost new (RCN) per square foot for a specific category of assets. The RCN per square
foot is depreciated by the estimated age using the depreciation table adopted for the tax year.
The data sampling process is conducted in the following order: 1) Prioritizing Standard Industrial
Classification (SIC) codes for model analysis. 2) Compiling the data and developing the reports. 3)
Field checking the selected samples. The models are built and adjusted using internally developed
software. The models are then tested against the previous year's data. The typical RCN per square
foot (or applicable unit) is determined by a statistical analysis of the available data.
CAPPA model values are used in the general business personal property valuation program to
estimate the value of new accounts for which no property owner's rendition is filed. Model values are
also used to establish tolerance parameters for testing the valuation of property for which prior data
years' data exist or for which current year rendered information is available. The calculated current
year value or the prior year's value is compared to the indicated model value by the valuation
program. If the value being tested is within an established acceptable percentage tolerance range of
the model value, the account passes that range check and moves to the next valuation step. If the
account fails the tolerance range check, it is flagged for individual review. Allowable tolerance ranges
may be adjusted from year to year depending on the analysis of the results of the prior year.
Page 34
Hunt County Appraisal District
2018 Mass Appraisal Report
34
Vehicles
Value estimates for vehicles are provided by an outside vendor and are based on NADA published
book values as well as other sources. Vehicles that are not valued by the vendor are valued by an
appraiser using PVF schedules or published guides.
Leased and Multi-Location Assets
Leased and multi-location assets are valued using the valuation model mentioned above. If the asset
to be valued in this category is a vehicle, then NADA published book values are used. Assets that are
not valued by the vendor are valued by an appraiser using PVF schedules or published guides.
INDIVIDUAL VALUE REVIEW PROCEDURES
Office Review
Business Personal Property
A district valuation computer program exists in a mainframe environment that identifies accounts in
need of review based on a variety of conditions. Property owner renditions, accounts with field or
other data changes, accounts with prior hearings, new accounts, and SIC cost table changes are all
considered. The accounts are processed by the valuation program and pass or fail preset tolerance
parameters by comparing appraised values to prior year and model values. Accounts that fail the
tolerance parameters are reviewed by the appraisers.
Vehicles
A vehicle master file is received on tape from an outside vendor and vehicles in the district’s system
from the prior year are programmatically matched to current DOT records. The vehicles remaining
after the matching process are sorted by owner name and the owners are then prioritized by the
number of vehicles owned. These vehicles are then matched to existing accounts and new accounts
are created as needed. Vehicles that are not valued by the vendor are valued by an appraiser using
depreciation schedules or published guides.
Leased and Multi-Location Assets
Leasing and multi-location accounts that have a high volume of vehicles or other assets are loaded
programmatically if reported by the property owner electronically. Electronic renditions, usually on
diskette, often require reformatting before they can be loaded to the account. Accounts that render by
hard copy are either data entered by CAD or sent to an outside data entry vendor.
After matching and data entry, reports are generated and reviewed by an appraiser. Once proofed,
the report is then mailed to the property owner for review. Corrections are made and the account is
noticed after supervisor approval.
The commercial and business aircraft accounts are simultaneously valued/reviewed with rendered
data and third party market value data. Hunt CAD’s perpetual account tracking system ensures
special inventory dealers without a current declaration on file are contacted to advise them of their
legal filing requirements and to provide Hunt CAD with the most current valuation/review data
available.
Page 35
Hunt County Appraisal District
2018 Mass Appraisal Report
35
PERFORMANCE TESTS
Ratio Studies
At least once every two years, the Property Tax Division of the state comptroller’s office conducts a
property value study (PVS). The PVS is a ratio study used to gauge appraisal district performance.
Results from the PVS play a part in school funding. Rather than a sales ratio study, the personal
property PVS is a ratio study using state cost and depreciation schedules to develop comparative
personal property values. These values are then compared to Hunt CAD’s personal property values
and ratios are formed.
Internal Testing
Hunt CAD can test new or revised cost and depreciation schedules by running the valuation program
in a test mode prior to the valuation cycle. This can give appraisers a chance to make additional
refinements to the schedules if necessary.
Page 36
Hunt County Appraisal District
2018 Mass Appraisal Report
36
LIMITING CONDITIONS
The appraised value estimates provided by the district are subject to the following conditions:
1. The appraisals were prepared exclusively for ad valorem tax purposes.
2. The property characteristic data upon which the appraisals are based is assumed to be
correct. Exterior inspections of the property appraised were performed as staff resources and
time allowed.
3. Validation of sales transactions was attempted through questionnaires to buyer and seller,
telephone survey and field review. In the absence of such confirmation, residential sales data
obtained from vendors was considered reliable.
4. I have attached a list of staff providing significant mass appraisal assistance to the person
signing this certification.
5. Attached are the district’s latest ratio study results.
Page 37
Hunt County Appraisal District
2018 Mass Appraisal Report
37
Certification Statement:
"I, Brent South, Chief Appraiser for the Hunt County Appraisal District, certify that, to the best of my
knowledge and belief:
• The statements of fact contained in this report are true and correct.
• The reported analyses, opinion, and conclusions are limited only by the reported assumptions
and limiting conditions, and are my personal, impartial, and unbiased professional analyses,
opinions and conclusions.
• I have no (unless previously disclosed to Hunt CAD) present or prospective interest in the
property that is the subject of this report, and I have no (unless previously disclosed to Hunt
CAD) personal interest with respect to the parties involved.
• I have performed no (unless previously disclosed to Hunt CAD) services, as an appraiser or in
any other capacity, regarding the property that is the subject of this report within the three-year
period immediately preceding acceptance of this assignment.
• I have no bias with respect to any property that is the subject of this report or to the parties
involved with this assignment.
• My engagement in this assignment was not contingent upon developing or reporting
predetermined results.
• My compensation for completing this assignment is not contingent upon the reporting of a
predetermined value or direction in value that favors the cause of the client, the amount of the
value opinion, the attainment of a stipulated result, or the occurrence of a subsequent event
directly related to the intended use of this appraisal.
• My analyses, opinions and conclusions were developed, and this report has been prepared, in
conformity with the Uniform Standards of Professional Appraisal Practice.
• I have made a personal inspection of a portion of the properties that are the subject of this report.
• The attached list contains the Hunt County Appraisal District Appraisers and Contract
Appraisers who provided significant mass appraisal assistance in appraising the property that is
the subject of this report.
___________________________
Brent South
Chief Appraiser
Page 38
Hunt County Appraisal District
2018 Mass Appraisal Report
38
PROVIDING SIGNIFICANT MASS APPRAISAL ASSISTANCE
NAME TITLE TDLR NUMBER
TYPE OF ASSISTANCE
Tamra Burton Deputy Chief Appraiser
68308 Supervisor
Chris Williams Appraiser/Analyst 69167 Residential, Commercial and Industrial Appraiser/Updated Residential Valuation Models(Inspects Property)
Kyle Wilhite Appraiser
Supervisor
71244 Supervisor (Inspects Property)
James Chapman Appraiser 72114 Residential Appraiser (Inspects Property)
Billy Jones Appraiser 70885 Residential Appraiser (Inspects Property)
Jamie Martinez Appraiser 71752 Residential Appraiser (Inspects Property)
Edwin Myers Appraiser 74406 Residential Appraiser (Inspects Property)
Stephanie Salazar Appraiser
71200 Residential Appraiser (Inspects Property)
Grady Ewing Appraiser 73383 Land and Residential Appraiser (Inspects Property)
Todd Wilburn Appraiser 70461 Commercial and Industrial Appraiser (Inspects Property)
Tiffany Tadlock Appraiser 72826 Business and Industrial Personal Property (Inspects Property)
Capitol Appraisal Group, LLC Contract Appraisal
Firm
Utilities (Inspects Property)
Page 39
HUNT County As of Certification2018 CERTIFIED TOTALSCAD - APPRAISAL DISTRICT
Grand TotalsProperty Count: 68,188 4:59:45PM8/28/2018
Land ValueHomesite: 499,758,897Non Homesite: 832,125,582Ag Market: 1,484,473,860Timber Market: 2,816,358,339Total Land (+)0
Improvement Value
Homesite: 3,196,904,194Non Homesite: 2,617,872,435 Total Improvements (+) 5,814,776,629
Non Real ValueCount
Personal Property: 3,190 1,352,851,944Mineral Property: 4 33,220Autos: 0 0 Total Non Real (+) 1,352,885,164
Market Value = 9,984,020,132ExemptAg Non Exempt
1,483,695,030 778,830Total Productivity Market:Ag Use: 38,748,170 20,490 1,444,946,860(-)Productivity LossTimber Use: 0 0 =Appraised Value 8,539,073,272Productivity Loss: 758,3401,444,946,860
123,146,535(-)Homestead Cap
=Assessed Value 8,415,926,737
(-)Total Exemptions Amount(Breakdown on Next Page)
2,168,303,337
=Net Taxable 6,247,623,400
APPROXIMATE TOTAL LEVY = NET TAXABLE * (TAX RATE / 100)0.00 = 6,247,623,400 * (0.000000 / 100)
Tax Increment Finance Value: 0Tax Increment Finance Levy: 0.00
Page 1 of 204CAD/395100 True Automation, Inc.
Page 40
HUNT County As of Certification2018 CERTIFIED TOTALSCAD - APPRAISAL DISTRICT
Exemption Breakdown
StateLocalExemption Count Total
8/28/2018 5:00:18PMProperty Count: 68,188 Grand Totals
AB 9 0 0 0CHODO (Partial) 1 1,267,740 0 1,267,740DV1 119 0 766,759 766,759DV1S 3 0 15,000 15,000DV2 95 0 717,544 717,544DV3 116 0 1,165,690 1,165,690DV4 574 0 5,016,756 5,016,756DV4S 84 0 664,664 664,664DVHS 319 0 45,881,115 45,881,115DVHSS 52 0 5,212,685 5,212,685EX-XG 11 0 1,770,280 1,770,280EX-XI 4 0 452,730 452,730EX-XI (Prorated) 1 0 74,521 74,521EX-XJ 7 0 3,849,730 3,849,730EX-XL 2 0 209,920 209,920EX-XL (Prorated) 1 0 18,552 18,552EX-XN 29 0 9,056,210 9,056,210EX-XR 123 0 32,959,147 32,959,147EX-XR (Prorated) 1 0 1,580 1,580EX-XU 15 0 2,225,630 2,225,630EX-XU (Prorated) 1 0 5,639 5,639EX-XV 2,477 0 2,049,586,052 2,049,586,052EX-XV (Prorated) 116 0 980,846 980,846EX366 34 0 10,430 10,430FR 20 0 0 0FRSS 2 0 305,477 305,477LVE 5 4,215,800 0 4,215,800PC 30 1,776,430 0 1,776,430SO 4 96,410 0 96,410
Totals 7,356,380 2,160,946,957 2,168,303,337
Page 2 of 204CAD/395100 True Automation, Inc.
Page 41
HUNT County As of Certification2018 CERTIFIED TOTALSCAD - APPRAISAL DISTRICT
Grand TotalsProperty Count: 68,188 8/28/2018 5:00:18PM
State Category Breakdown
State Code Description Count Market ValueAcres New Value Market
A SINGLE FAMILY RESIDENCE 22,371 $102,846,416 $2,300,027,166B MULTIFAMILY RESIDENCE 351 $2,347,530 $173,041,048C1 VACANT LOTS AND LAND TRACTS 9,842 $0 $122,280,750D1 QUALIFIED AG LAND 13,861 $0 $1,483,695,030409,072.9054D2 NON-QUALIFIED LAND 4,577 $1,829,860 $72,311,495E FARM OR RANCH IMPROVEMENT 16,575 $50,839,050 $1,784,447,79560,854.3031F1 COMMERCIAL REAL PROPERTY 2,056 $29,681,090 $693,423,961F2 INDUSTRIAL REAL PROPERTY 96 $2,680,530 $147,431,598G1 OIL AND GAS 4 $0 $33,220J1 WATER SYSTEMS 15 $0 $606,060J2 GAS DISTRIBUTION SYSTEM 29 $0 $16,166,780J3 ELECTRIC COMPANY (INCLUDING CO-OP 71 $0 $55,934,920J4 TELEPHONE COMPANY (INCLUDING CO- 194 $0 $26,362,990J5 RAILROAD 166 $0 $13,982,030J6 PIPELAND COMPANY 191 $0 $50,751,070J7 CABLE TELEVISION COMPANY 51 $0 $6,877,010J8 OTHER TYPE OF UTILITY 1 $0 $2,390L1 COMMERCIAL PERSONAL PROPERTY 2,360 $977,900 $316,255,309L2 INDUSTRIAL PERSONAL PROPERTY 64 $0 $524,296,146M1 TANGIBLE OTHER PERSONAL, MOBILE H 1,558 $4,389,900 $40,748,850O RESIDENTIAL INVENTORY 1,952 $1,551,370 $22,618,167S SPECIAL INVENTORY TAX 109 $0 $25,731,050X TOTALLY EXEMPT PROPERTY 2,828 $2,601,154 $2,106,995,297
Totals 469,927.2085 $199,744,800 $9,984,020,132
Page 3 of 204CAD/395100 True Automation, Inc.
Page 42
HUNT County As of Certification2018 CERTIFIED TOTALSCAD - APPRAISAL DISTRICT
Property Count: 68,188 8/28/2018 5:00:18PMEffective Rate Assumption
New Value
TOTAL NEW VALUE MARKET: $199,744,800TOTAL NEW VALUE TAXABLE: $194,634,939
New Exemptions
Exemption Description CountEX-XL 11.231 Organizations Providing Economic Deve 1 2017 Market Value $48,370EX-XN 11.252 Motor vehicles leased for personal use 4 2017 Market Value $429,880EX-XR 11.30 Nonprofit water or wastewater corporati 1 2017 Market Value $0EX-XV Other Exemptions (including public property, r 54 2017 Market Value $744,460EX366 HB366 Exempt 12 2017 Market Value $11,430
ABSOLUTE EXEMPTIONS VALUE LOSS $1,234,140
Exemption Description Count Exemption Amount$81,00012Disabled Veterans 10% - 29%DV1$86,47112Disabled Veterans 30% - 49%DV2
$112,00011Disabled Veterans 50% - 69%DV3$368,13737Disabled Veterans 70% - 100%DV4$60,0005Disabled Veterans Surviving Spouse 70% - 100DV4S
$3,785,82626Disabled Veteran HomesteadDVHS$598,1553Disabled Veteran Homestead Surviving SpouseDVHSS$125,9011First Responder Surviving SpouseFRSS
107PARTIAL EXEMPTIONS VALUE LOSS $5,217,490NEW EXEMPTIONS VALUE LOSS $6,451,630
Increased Exemptions
Increased Exemption_AmountCountDescriptionExemption
INCREASED EXEMPTIONS VALUE LOSS
TOTAL EXEMPTIONS VALUE LOSS $6,451,630
New Ag / Timber Exemptions
2017 Market Value Count: 144$7,208,3722018 Ag/Timber Use $168,020
$7,040,352NEW AG / TIMBER VALUE LOSS
New Annexations
New Deannexations
Average Homestead Value
Category A and E
Count of HS Residences Average TaxableAverage HS ExemptionAverage Market
20,184 $126,887$5,876$132,763Category A Only
Count of HS Residences Average TaxableAverage HS ExemptionAverage Market
11,754 $125,458$5,468$130,926
Page 5 of 204CAD/395100 True Automation, Inc.
Page 43
HUNT County As of Certification2018 CERTIFIED TOTALSCCA - CAMPBELL, CITY
Grand TotalsProperty Count: 615 4:59:45PM8/28/2018
Land ValueHomesite: 1,949,940Non Homesite: 1,820,750Ag Market: 1,119,640Timber Market: 4,890,330Total Land (+)0
Improvement Value
Homesite: 11,792,410Non Homesite: 13,766,850 Total Improvements (+) 25,559,260
Non Real ValueCount
Personal Property: 64 5,998,480Mineral Property: 0 0Autos: 0 0 Total Non Real (+) 5,998,480
Market Value = 36,448,070ExemptAg Non Exempt
1,119,640 0Total Productivity Market:Ag Use: 19,010 0 1,100,630(-)Productivity LossTimber Use: 0 0 =Appraised Value 35,347,440Productivity Loss: 01,100,630
134,070(-)Homestead Cap
=Assessed Value 35,213,370
(-)Total Exemptions Amount(Breakdown on Next Page)
11,091,555
=Net Taxable 24,121,815
Freeze Assessed Taxable Actual Tax Ceiling Count
4,896,887 4,333,048 5,715.59 6,229.13 72OV65Total 4,896,887 4,333,048 6,229.13 Freeze Taxable (-)5,715.59 72 4,333,048Tax Rate 0.163653
= 19,788,767Freeze Adjusted Taxable
APPROXIMATE LEVY = (FREEZE ADJUSTED TAXABLE * (TAX RATE / 100)) + ACTUAL TAX38,100.50 = 19,788,767 * (0.163653 / 100) + 5,715.59
Tax Increment Finance Value: 0Tax Increment Finance Levy: 0.00
Page 7 of 204CCA/395101 True Automation, Inc.
Page 44
HUNT County As of Certification2018 CERTIFIED TOTALSCCA - CAMPBELL, CITY
Exemption Breakdown
StateLocalExemption Count Total
8/28/2018 5:00:18PMProperty Count: 615 Grand Totals
DP 5 0 0 0DV2 1 0 7,500 7,500DV4 4 0 48,000 48,000DV4S 1 0 0 0DVHS 3 0 303,564 303,564DVHSS 1 0 106,410 106,410EX-XR 3 0 711,310 711,310EX-XV 34 0 9,230,590 9,230,590EX366 10 0 1,880 1,880HS 147 682,301 0 682,301OV65 75 0 0 0
Totals 682,301 10,409,254 11,091,555
Page 8 of 204CCA/395101 True Automation, Inc.
Page 45
HUNT County As of Certification2018 CERTIFIED TOTALSCCA - CAMPBELL, CITY
Grand TotalsProperty Count: 615 8/28/2018 5:00:18PM
State Category Breakdown
State Code Description Count Market ValueAcres New Value Market
A SINGLE FAMILY RESIDENCE 106 $71,980 $4,185,170B MULTIFAMILY RESIDENCE 1 $0 $86,750C1 VACANT LOTS AND LAND TRACTS 69 $0 $449,560D1 QUALIFIED AG LAND 86 $0 $1,119,640224.4622D2 NON-QUALIFIED LAND 16 $0 $86,790E FARM OR RANCH IMPROVEMENT 235 $149,680 $11,906,130257.3301F1 COMMERCIAL REAL PROPERTY 16 $0 $1,555,020F2 INDUSTRIAL REAL PROPERTY 1 $179,820 $1,384,880J2 GAS DISTRIBUTION SYSTEM 3 $0 $347,370J3 ELECTRIC COMPANY (INCLUDING CO-OP 2 $0 $945,130J4 TELEPHONE COMPANY (INCLUDING CO- 4 $0 $418,510J5 RAILROAD 9 $0 $1,040,110J6 PIPELAND COMPANY 3 $0 $125,100J7 CABLE TELEVISION COMPANY 3 $0 $41,530L1 COMMERCIAL PERSONAL PROPERTY 36 $0 $1,708,610L2 INDUSTRIAL PERSONAL PROPERTY 1 $0 $853,640M1 TANGIBLE OTHER PERSONAL, MOBILE H 14 $0 $188,820S SPECIAL INVENTORY TAX 2 $0 $61,530X TOTALLY EXEMPT PROPERTY 47 $0 $9,943,780
Totals 481.7923 $401,480 $36,448,070
Page 9 of 204CCA/395101 True Automation, Inc.
Page 46
HUNT County As of Certification2018 CERTIFIED TOTALSCCA - CAMPBELL, CITY
Property Count: 615 8/28/2018 5:00:18PMEffective Rate Assumption
New Value
TOTAL NEW VALUE MARKET: $401,480TOTAL NEW VALUE TAXABLE: $401,480
New Exemptions
Exemption Description CountEX366 HB366 Exempt 1 2017 Market Value $760
ABSOLUTE EXEMPTIONS VALUE LOSS $760
Exemption Description Count Exemption Amount$80,9541Disabled Veteran HomesteadDVHS$15,0004HomesteadHS
$02Over 65OV657PARTIAL EXEMPTIONS VALUE LOSS $95,954
NEW EXEMPTIONS VALUE LOSS $96,714
Increased Exemptions
Increased Exemption_AmountCountDescriptionExemption
INCREASED EXEMPTIONS VALUE LOSS
TOTAL EXEMPTIONS VALUE LOSS $96,714
New Ag / Timber Exemptions
2017 Market Value Count: 1$8,5202018 Ag/Timber Use $120
$8,400NEW AG / TIMBER VALUE LOSS
New Annexations
New Deannexations
Average Homestead Value
Category A and E
Count of HS Residences Average TaxableAverage HS ExemptionAverage Market
143 $64,892$5,560$70,452Category A Only
Count of HS Residences Average TaxableAverage HS ExemptionAverage Market
35 $53,791$5,515$59,306
Page 11 of 204CCA/395101 True Automation, Inc.
Page 47
HUNT County As of Certification2018 CERTIFIED TOTALSCCL - CELESTE, CITY
Grand TotalsProperty Count: 637 4:59:45PM8/28/2018
Land ValueHomesite: 1,681,710Non Homesite: 2,067,030Ag Market: 1,745,830Timber Market: 5,494,570Total Land (+)0
Improvement Value
Homesite: 14,938,833Non Homesite: 20,125,248 Total Improvements (+) 35,064,081
Non Real ValueCount
Personal Property: 62 3,914,890Mineral Property: 0 0Autos: 0 0 Total Non Real (+) 3,914,890
Market Value = 44,473,541ExemptAg Non Exempt
1,745,830 0Total Productivity Market:Ag Use: 57,150 0 1,688,680(-)Productivity LossTimber Use: 0 0 =Appraised Value 42,784,861Productivity Loss: 01,688,680
801,907(-)Homestead Cap
=Assessed Value 41,982,954
(-)Total Exemptions Amount(Breakdown on Next Page)
17,256,167
=Net Taxable 24,726,787
Freeze Assessed Taxable Actual Tax Ceiling Count
262,108 262,108 1,366.65 1,371.58 8DP4,014,382 3,260,775 14,056.20 15,047.99 61OV65
Total 4,276,490 3,522,883 16,419.57 Freeze Taxable (-)15,422.85 69 3,522,883Tax Rate 0.738944
= 21,203,904Freeze Adjusted Taxable
APPROXIMATE LEVY = (FREEZE ADJUSTED TAXABLE * (TAX RATE / 100)) + ACTUAL TAX172,107.83 = 21,203,904 * (0.738944 / 100) + 15,422.85
Tax Increment Finance Value: 0Tax Increment Finance Levy: 0.00
Page 13 of 204CCL/395102 True Automation, Inc.
Page 48
HUNT County As of Certification2018 CERTIFIED TOTALSCCL - CELESTE, CITY
Exemption Breakdown
StateLocalExemption Count Total
8/28/2018 5:00:18PMProperty Count: 637 Grand Totals
DP 9 0 0 0DV1 1 0 5,000 5,000DV3 1 0 10,000 10,000DV4 5 0 60,000 60,000DV4S 4 0 12,000 12,000DVHS 1 0 58,366 58,366DVHSS 3 0 92,741 92,741EX-XG 1 0 42,550 42,550EX-XN 1 0 25,650 25,650EX-XR 1 0 170,210 170,210EX-XV 83 0 16,214,070 16,214,070EX366 13 0 3,030 3,030FR 1 0 0 0OV65 61 562,500 0 562,500OV65S 3 0 0 0PC 2 50 0 50
Totals 562,550 16,693,617 17,256,167
Page 14 of 204CCL/395102 True Automation, Inc.
Page 49
HUNT County As of Certification2018 CERTIFIED TOTALSCCL - CELESTE, CITY
Grand TotalsProperty Count: 637 8/28/2018 5:00:18PM
State Category Breakdown
State Code Description Count Market ValueAcres New Value Market
A SINGLE FAMILY RESIDENCE 300 $227,110 $15,865,351B MULTIFAMILY RESIDENCE 1 $0 $100,000C1 VACANT LOTS AND LAND TRACTS 60 $0 $308,100D1 QUALIFIED AG LAND 65 $0 $1,745,830448.8155D2 NON-QUALIFIED LAND 14 $0 $155,440E FARM OR RANCH IMPROVEMENT 40 $0 $3,048,25044.1596F1 COMMERCIAL REAL PROPERTY 34 $0 $2,899,600J2 GAS DISTRIBUTION SYSTEM 1 $0 $494,090J3 ELECTRIC COMPANY (INCLUDING CO-OP 1 $0 $647,330J4 TELEPHONE COMPANY (INCLUDING CO- 3 $0 $117,460J5 RAILROAD 5 $0 $30,380J6 PIPELAND COMPANY 5 $0 $511,590J7 CABLE TELEVISION COMPANY 2 $0 $25,410L1 COMMERCIAL PERSONAL PROPERTY 33 $0 $2,061,680M1 TANGIBLE OTHER PERSONAL, MOBILE H 1 $0 $7,520X TOTALLY EXEMPT PROPERTY 99 $199,240 $16,455,510
Totals 492.9751 $426,350 $44,473,541
Page 15 of 204CCL/395102 True Automation, Inc.
Page 50
HUNT County As of Certification2018 CERTIFIED TOTALSCCL - CELESTE, CITY
Property Count: 637 8/28/2018 5:00:18PMEffective Rate Assumption
New Value
TOTAL NEW VALUE MARKET: $426,350TOTAL NEW VALUE TAXABLE: $227,110
New Exemptions
Exemption Description CountEX-XV Other Exemptions (including public property, r 1 2017 Market Value $0EX366 HB366 Exempt 1 2017 Market Value $0
ABSOLUTE EXEMPTIONS VALUE LOSS $0
Exemption Description Count Exemption Amount$01DisabilityDP
$10,0001Over 65OV652PARTIAL EXEMPTIONS VALUE LOSS $10,000
NEW EXEMPTIONS VALUE LOSS $10,000
Increased Exemptions
Increased Exemption_AmountCountDescriptionExemption
INCREASED EXEMPTIONS VALUE LOSS
TOTAL EXEMPTIONS VALUE LOSS $10,000
New Ag / Timber Exemptions
New Annexations
New Deannexations
Average Homestead Value
Category A and E
Count of HS Residences Average TaxableAverage HS ExemptionAverage Market
158 $62,692$5,075$67,767Category A Only
Count of HS Residences Average TaxableAverage HS ExemptionAverage Market
134 $59,108$3,869$62,977
Lower Value UsedCount of Protested Properties Total Market Value Total Value Used
Page 17 of 204CCL/395102 True Automation, Inc.
Page 51
HUNT County As of Certification2018 CERTIFIED TOTALSCCM - CADDO MILLS, CITY
Grand TotalsProperty Count: 1,447 4:59:45PM8/28/2018
Land ValueHomesite: 6,759,094Non Homesite: 10,348,090Ag Market: 4,011,900Timber Market: 21,119,084Total Land (+)0
Improvement Value
Homesite: 56,638,154Non Homesite: 66,102,641 Total Improvements (+) 122,740,795
Non Real ValueCount
Personal Property: 155 62,355,554Mineral Property: 0 0Autos: 0 0 Total Non Real (+) 62,355,554
Market Value = 206,215,433ExemptAg Non Exempt
4,011,900 0Total Productivity Market:Ag Use: 83,850 0 3,928,050(-)Productivity LossTimber Use: 0 0 =Appraised Value 202,287,383Productivity Loss: 03,928,050
1,336,100(-)Homestead Cap
=Assessed Value 200,951,283
(-)Total Exemptions Amount(Breakdown on Next Page)
59,306,364
=Net Taxable 141,644,919
APPROXIMATE TOTAL LEVY = NET TAXABLE * (TAX RATE / 100)1,034,007.91 = 141,644,919 * (0.730000 / 100)
Tax Increment Finance Value: 0Tax Increment Finance Levy: 0.00
Page 18 of 204CCM/395103 True Automation, Inc.
Page 52
HUNT County As of Certification2018 CERTIFIED TOTALSCCM - CADDO MILLS, CITY
Exemption Breakdown
StateLocalExemption Count Total
8/28/2018 5:00:18PMProperty Count: 1,447 Grand Totals
DP 10 0 0 0DV2 1 0 7,500 7,500DV3 6 0 60,000 60,000DV4 8 0 96,000 96,000DV4S 1 0 12,000 12,000DVHS 1 0 298,797 298,797DVHSS 1 0 65,197 65,197EX-XG 1 0 166,700 166,700EX-XN 4 0 235,070 235,070EX-XR 2 0 97,360 97,360EX-XV 44 0 55,459,890 55,459,890EX366 12 0 3,050 3,050LVE 1 14,120 0 14,120OV65 118 1,150,000 0 1,150,000PC 4 1,640,680 0 1,640,680
Totals 2,804,800 56,501,564 59,306,364
Page 19 of 204CCM/395103 True Automation, Inc.
Page 53
HUNT County As of Certification2018 CERTIFIED TOTALSCCM - CADDO MILLS, CITY
Grand TotalsProperty Count: 1,447 8/28/2018 5:00:18PM
State Category Breakdown
State Code Description Count Market ValueAcres New Value Market
A SINGLE FAMILY RESIDENCE 373 $1,434,000 $49,497,975B MULTIFAMILY RESIDENCE 5 $0 $1,367,720C1 VACANT LOTS AND LAND TRACTS 45 $0 $553,900D1 QUALIFIED AG LAND 58 $0 $4,011,900768.6444D2 NON-QUALIFIED LAND 10 $60,080 $98,640E FARM OR RANCH IMPROVEMENT 190 $257,090 $15,239,029181.5556F1 COMMERCIAL REAL PROPERTY 72 $22,300 $12,577,285F2 INDUSTRIAL REAL PROPERTY 10 $389,100 $3,131,270J2 GAS DISTRIBUTION SYSTEM 2 $0 $914,430J3 ELECTRIC COMPANY (INCLUDING CO-OP 3 $0 $1,671,140J4 TELEPHONE COMPANY (INCLUDING CO- 3 $0 $720,550J5 RAILROAD 11 $0 $3,440J6 PIPELAND COMPANY 10 $0 $7,800,300J7 CABLE TELEVISION COMPANY 3 $0 $40,270L1 COMMERCIAL PERSONAL PROPERTY 106 $0 $6,374,170L2 INDUSTRIAL PERSONAL PROPERTY 13 $0 $44,153,534M1 TANGIBLE OTHER PERSONAL, MOBILE H 2 $0 $54,850O RESIDENTIAL INVENTORY 501 $0 $1,472,300S SPECIAL INVENTORY TAX 4 $0 $556,540X TOTALLY EXEMPT PROPERTY 64 $0 $55,976,190
Totals 950.2000 $2,162,570 $206,215,433
Page 20 of 204CCM/395103 True Automation, Inc.
Page 54
HUNT County As of Certification2018 CERTIFIED TOTALSCCM - CADDO MILLS, CITY
Property Count: 1,447 8/28/2018 5:00:18PMEffective Rate Assumption
New Value
TOTAL NEW VALUE MARKET: $2,162,570TOTAL NEW VALUE TAXABLE: $2,162,570
New Exemptions
Exemption Description CountEX-XN 11.252 Motor vehicles leased for personal use 1 2017 Market Value $0EX366 HB366 Exempt 2 2017 Market Value $1,340
ABSOLUTE EXEMPTIONS VALUE LOSS $1,340
Exemption Description Count Exemption Amount$10,0001Disabled Veterans 50% - 69%DV3$40,0004Over 65OV65
5PARTIAL EXEMPTIONS VALUE LOSS $50,000NEW EXEMPTIONS VALUE LOSS $51,340
Increased Exemptions
Increased Exemption_AmountCountDescriptionExemption
INCREASED EXEMPTIONS VALUE LOSS
TOTAL EXEMPTIONS VALUE LOSS $51,340
New Ag / Timber Exemptions
New Annexations
Count Market Value Taxable Value
1 $470,590 $470,590
New Deannexations
Average Homestead Value
Category A and E
Count of HS Residences Average TaxableAverage HS ExemptionAverage Market
295 $144,849$4,471$149,320Category A Only
Count of HS Residences Average TaxableAverage HS ExemptionAverage Market
223 $157,261$3,342$160,603
Page 22 of 204CCM/395103 True Automation, Inc.
Page 55
HUNT County As of Certification2018 CERTIFIED TOTALSCCO - COMMERCE, CITY
Grand TotalsProperty Count: 3,438 4:59:45PM8/28/2018
Land ValueHomesite: 14,664,614Non Homesite: 37,351,506Ag Market: 4,303,100Timber Market: 56,319,220Total Land (+)0
Improvement Value
Homesite: 102,010,403Non Homesite: 652,056,906 Total Improvements (+) 754,067,309
Non Real ValueCount
Personal Property: 358 329,653,438Mineral Property: 0 0Autos: 0 0 Total Non Real (+) 329,653,438
Market Value = 1,140,039,967ExemptAg Non Exempt
4,303,100 0Total Productivity Market:Ag Use: 98,670 0 4,204,430(-)Productivity LossTimber Use: 0 0 =Appraised Value 1,135,835,537Productivity Loss: 04,204,430
1,257,514(-)Homestead Cap
=Assessed Value 1,134,578,023
(-)Total Exemptions Amount(Breakdown on Next Page)
809,333,538
=Net Taxable 325,244,485
APPROXIMATE TOTAL LEVY = NET TAXABLE * (TAX RATE / 100)2,667,004.78 = 325,244,485 * (0.820000 / 100)
Tax Increment Finance Value: 0Tax Increment Finance Levy: 0.00
Page 24 of 204CCO/395104 True Automation, Inc.
Page 56
HUNT County As of Certification2018 CERTIFIED TOTALSCCO - COMMERCE, CITY
Exemption Breakdown
StateLocalExemption Count Total
8/28/2018 5:00:18PMProperty Count: 3,438 Grand Totals
AB 3 6,132,380 0 6,132,380CHODO (Partial) 1 1,267,740 0 1,267,740DP 38 0 0 0DV1 1 0 5,000 5,000DV2 4 0 34,500 34,500DV3 3 0 30,000 30,000DV4 15 0 144,210 144,210DV4S 5 0 36,000 36,000DVHS 7 0 843,900 843,900DVHSS 3 0 337,400 337,400EX-XG 2 0 190,330 190,330EX-XI 1 0 4,830 4,830EX-XJ 1 0 70,000 70,000EX-XL 1 0 81,760 81,760EX-XN 6 0 440,150 440,150EX-XR 6 0 12,950 12,950EX-XV 310 0 791,009,575 791,009,575EX-XV (Prorated) 14 0 97,375 97,375EX366 18 0 3,520 3,520FR 6 4,490,811 0 4,490,811LVE 2 675,400 0 675,400OV65 327 1,877,270 0 1,877,270OV65S 3 12,000 0 12,000PC 4 1,536,437 0 1,536,437
Totals 15,992,038 793,341,500 809,333,538
Page 25 of 204CCO/395104 True Automation, Inc.
Page 57
HUNT County As of Certification2018 CERTIFIED TOTALSCCO - COMMERCE, CITY
Grand TotalsProperty Count: 3,438 8/28/2018 5:00:18PM
State Category Breakdown
State Code Description Count Market ValueAcres New Value Market
A SINGLE FAMILY RESIDENCE 1,620 $1,277,900 $117,802,842B MULTIFAMILY RESIDENCE 142 $105,150 $40,777,232C1 VACANT LOTS AND LAND TRACTS 529 $0 $4,913,619D1 QUALIFIED AG LAND 68 $0 $4,303,1001,253.4278D2 NON-QUALIFIED LAND 19 $34,130 $188,630E FARM OR RANCH IMPROVEMENT 151 $69,050 $9,959,530503.3782F1 COMMERCIAL REAL PROPERTY 221 $652,370 $56,530,885F2 INDUSTRIAL REAL PROPERTY 15 $1,864,300 $24,870,516J2 GAS DISTRIBUTION SYSTEM 2 $0 $2,656,110J3 ELECTRIC COMPANY (INCLUDING CO-OP 5 $0 $7,046,770J4 TELEPHONE COMPANY (INCLUDING CO- 8 $0 $1,101,770J5 RAILROAD 3 $0 $66,820J6 PIPELAND COMPANY 10 $0 $6,669,340J7 CABLE TELEVISION COMPANY 5 $0 $1,324,120L1 COMMERCIAL PERSONAL PROPERTY 285 $0 $22,273,843L2 INDUSTRIAL PERSONAL PROPERTY 15 $0 $41,965,090M1 TANGIBLE OTHER PERSONAL, MOBILE H 53 $168,160 $746,560O RESIDENTIAL INVENTORY 14 $0 $242,240S SPECIAL INVENTORY TAX 6 $0 $2,747,320X TOTALLY EXEMPT PROPERTY 362 $28,110 $793,853,630
Totals 1,756.8060 $4,199,170 $1,140,039,967
Page 26 of 204CCO/395104 True Automation, Inc.
Page 58
HUNT County As of Certification2018 CERTIFIED TOTALSCCO - COMMERCE, CITY
Property Count: 3,438 8/28/2018 5:00:18PMEffective Rate Assumption
New Value
TOTAL NEW VALUE MARKET: $4,199,170TOTAL NEW VALUE TAXABLE: $4,170,060
New Exemptions
Exemption Description CountEX-XL 11.231 Organizations Providing Economic Deve 1 2017 Market Value $48,370EX-XN 11.252 Motor vehicles leased for personal use 1 2017 Market Value $0EX-XV Other Exemptions (including public property, r 11 2017 Market Value $138,180EX366 HB366 Exempt 2 2017 Market Value $0
ABSOLUTE EXEMPTIONS VALUE LOSS $186,550
Exemption Description Count Exemption Amount$01DisabilityDP
$5,0001Disabled Veterans 10% - 29%DV1$2101Disabled Veterans 70% - 100%DV4
$232,3401Disabled Veteran HomesteadDVHS$48,49610Over 65OV65
14PARTIAL EXEMPTIONS VALUE LOSS $286,046NEW EXEMPTIONS VALUE LOSS $472,596
Increased Exemptions
Increased Exemption_AmountCountDescriptionExemption
INCREASED EXEMPTIONS VALUE LOSS
TOTAL EXEMPTIONS VALUE LOSS $472,596
New Ag / Timber Exemptions
New Annexations
New Deannexations
Average Homestead Value
Category A and E
Count of HS Residences Average TaxableAverage HS ExemptionAverage Market
799 $90,594$1,508$92,102Category A Only
Count of HS Residences Average TaxableAverage HS ExemptionAverage Market
750 $90,041$1,383$91,424
Page 28 of 204CCO/395104 True Automation, Inc.
Page 59
HUNT County As of Certification2018 CERTIFIED TOTALSCGR - GREENVILLE, CITY
Grand TotalsProperty Count: 13,935 4:59:45PM8/28/2018
Land ValueHomesite: 87,260,396Non Homesite: 264,687,862Ag Market: 50,272,301Timber Market: 402,220,559Total Land (+)0
Improvement Value
Homesite: 695,170,880Non Homesite: 1,221,428,385 Total Improvements (+) 1,916,599,265
Non Real ValueCount
Personal Property: 1,275 649,631,563Mineral Property: 0 0Autos: 0 0 Total Non Real (+) 649,631,563
Market Value = 2,968,451,387ExemptAg Non Exempt
50,272,301 0Total Productivity Market:Ag Use: 894,795 0 49,377,506(-)Productivity LossTimber Use: 0 0 =Appraised Value 2,919,073,881Productivity Loss: 049,377,506
23,285,322(-)Homestead Cap
=Assessed Value 2,895,788,559
(-)Total Exemptions Amount(Breakdown on Next Page)
916,519,163
=Net Taxable 1,979,269,396
APPROXIMATE TOTAL LEVY = NET TAXABLE * (TAX RATE / 100)13,637,166.14 = 1,979,269,396 * (0.689000 / 100)
Tax Increment LossTif Zone Code
TIRZ1 71,158,493
Tax Increment Finance Value: 71,158,493Tax Increment Finance Levy: 490,282.02
Page 30 of 204CGR/395105 True Automation, Inc.
Page 60
HUNT County As of Certification2018 CERTIFIED TOTALSCGR - GREENVILLE, CITY
Exemption Breakdown
StateLocalExemption Count Total
8/28/2018 5:00:18PMProperty Count: 13,935 Grand Totals
AB 4 17,669,782 0 17,669,782DP 186 1,744,522 0 1,744,522DV1 21 0 140,000 140,000DV1S 1 0 5,000 5,000DV2 18 0 139,500 139,500DV3 24 0 246,000 246,000DV4 121 0 1,093,520 1,093,520DV4S 18 0 192,000 192,000DVHS 49 0 7,578,878 7,578,878DVHSS 6 0 1,010,639 1,010,639EX-XG 3 0 981,890 981,890EX-XI (Prorated) 1 0 74,521 74,521EX-XJ 2 0 3,328,620 3,328,620EX-XL 1 0 128,160 128,160EX-XN 13 0 2,857,420 2,857,420EX-XU 7 0 1,247,460 1,247,460EX-XV 918 0 796,178,176 796,178,176EX-XV (Prorated) 36 0 269,570 269,570EX366 19 0 4,570 4,570FR 11 60,578,179 0 60,578,179LVE 3 1,932,310 0 1,932,310OV65 1,702 16,326,592 0 16,326,592OV65S 10 80,000 0 80,000PC 7 2,697,530 0 2,697,530SO 1 14,324 0 14,324
Totals 101,043,239 815,475,924 916,519,163
Page 31 of 204CGR/395105 True Automation, Inc.
Page 61
HUNT County As of Certification2018 CERTIFIED TOTALSCGR - GREENVILLE, CITY
Grand TotalsProperty Count: 13,935 8/28/2018 5:00:18PM
State Category Breakdown
State Code Description Count Market ValueAcres New Value Market
A SINGLE FAMILY RESIDENCE 7,684 $23,713,456 $778,363,967B MULTIFAMILY RESIDENCE 158 $2,062,440 $122,790,569C1 VACANT LOTS AND LAND TRACTS 2,179 $0 $41,602,871D1 QUALIFIED AG LAND 352 $0 $50,272,3017,785.6591D2 NON-QUALIFIED LAND 37 $0 $368,902E FARM OR RANCH IMPROVEMENT 371 $5,950 $34,973,8851,467.1900F1 COMMERCIAL REAL PROPERTY 834 $20,294,240 $424,840,958F2 INDUSTRIAL REAL PROPERTY 39 $67,420 $100,968,130J2 GAS DISTRIBUTION SYSTEM 5 $0 $9,863,320J3 ELECTRIC COMPANY (INCLUDING CO-OP 3 $0 $1,947,340J4 TELEPHONE COMPANY (INCLUDING CO- 41 $0 $6,504,470J5 RAILROAD 45 $0 $2,544,920J6 PIPELAND COMPANY 13 $0 $8,271,830J7 CABLE TELEVISION COMPANY 5 $0 $4,379,700L1 COMMERCIAL PERSONAL PROPERTY 1,092 $977,900 $170,267,395L2 INDUSTRIAL PERSONAL PROPERTY 21 $0 $382,645,372M1 TANGIBLE OTHER PERSONAL, MOBILE H 61 $138,920 $818,100O RESIDENTIAL INVENTORY 149 $0 $549,800S SPECIAL INVENTORY TAX 25 $0 $19,474,860X TOTALLY EXEMPT PROPERTY 1,003 $2,270,814 $807,002,697
Totals 9,252.8491 $49,531,140 $2,968,451,387
Page 32 of 204CGR/395105 True Automation, Inc.
Page 62
HUNT County As of Certification2018 CERTIFIED TOTALSCGR - GREENVILLE, CITY
Property Count: 13,935 8/28/2018 5:00:18PMEffective Rate Assumption
New Value
TOTAL NEW VALUE MARKET: $49,531,140TOTAL NEW VALUE TAXABLE: $46,890,490
New Exemptions
Exemption Description CountEX-XN 11.252 Motor vehicles leased for personal use 1 2017 Market Value $104,610EX-XV Other Exemptions (including public property, r 9 2017 Market Value $75,730EX366 HB366 Exempt 4 2017 Market Value $1,730
ABSOLUTE EXEMPTIONS VALUE LOSS $182,070
Exemption Description Count Exemption Amount$70,0007DisabilityDP$39,0005Disabled Veterans 10% - 29%DV1$30,0004Disabled Veterans 30% - 49%DV2$42,0004Disabled Veterans 50% - 69%DV3
$108,00010Disabled Veterans 70% - 100%DV4$24,0002Disabled Veterans Surviving Spouse 70% - 100DV4S$24,8791Disabled Veteran HomesteadDVHS
$206,1101Disabled Veteran Homestead Surviving SpouseDVHSS$438,71449Over 65OV65
83PARTIAL EXEMPTIONS VALUE LOSS $982,703NEW EXEMPTIONS VALUE LOSS $1,164,773
Increased Exemptions
Increased Exemption_AmountCountDescriptionExemption
INCREASED EXEMPTIONS VALUE LOSS
TOTAL EXEMPTIONS VALUE LOSS $1,164,773
New Ag / Timber Exemptions
2017 Market Value Count: 6$826,1452018 Ag/Timber Use $34,390
$791,755NEW AG / TIMBER VALUE LOSS
New Annexations
New Deannexations
Average Homestead Value
Category A and E
Count of HS Residences Average TaxableAverage HS ExemptionAverage Market
4,312 $114,811$5,371$120,182Category A Only
Count of HS Residences Average TaxableAverage HS ExemptionAverage Market
4,169 $115,413$5,407$120,820
Page 34 of 204CGR/395105 True Automation, Inc.
Page 63
HUNT County As of Certification2018 CERTIFIED TOTALSCHC - HAWK COVE, CITY
Grand TotalsProperty Count: 1,036 4:59:45PM8/28/2018
Land ValueHomesite: 1,442,030Non Homesite: 2,761,440Ag Market: 0Timber Market: 4,203,470Total Land (+)0
Improvement Value
Homesite: 5,057,950Non Homesite: 835,771 Total Improvements (+) 5,893,721
Non Real ValueCount
Personal Property: 14 937,720Mineral Property: 0 0Autos: 0 0 Total Non Real (+) 937,720
Market Value = 11,034,911ExemptAg Non Exempt
0 0Total Productivity Market:Ag Use: 0 0 0(-)Productivity LossTimber Use: 0 0 =Appraised Value 11,034,911Productivity Loss: 00
625,840(-)Homestead Cap
=Assessed Value 10,409,071
(-)Total Exemptions Amount(Breakdown on Next Page)
793,879
=Net Taxable 9,615,192
APPROXIMATE TOTAL LEVY = NET TAXABLE * (TAX RATE / 100)136,513.13 = 9,615,192 * (1.419765 / 100)
Tax Increment Finance Value: 0Tax Increment Finance Levy: 0.00
Page 36 of 204CHC/395106 True Automation, Inc.
Page 64
HUNT County As of Certification2018 CERTIFIED TOTALSCHC - HAWK COVE, CITY
Exemption Breakdown
StateLocalExemption Count Total
8/28/2018 5:00:18PMProperty Count: 1,036 Grand Totals
DP 35 0 0 0DV3 2 0 14,690 14,690DV4 4 0 31,194 31,194DVHS 2 0 65,362 65,362EX-XN 1 0 33,500 33,500EX-XR 2 0 351,160 351,160EX-XV 52 0 277,330 277,330EX-XV (Prorated) 29 0 20,243 20,243EX366 1 0 400 400
Totals 0 793,879 793,879
Page 37 of 204CHC/395106 True Automation, Inc.
Page 65
HUNT County As of Certification2018 CERTIFIED TOTALSCHC - HAWK COVE, CITY
Grand TotalsProperty Count: 1,036 8/28/2018 5:00:18PM
State Category Breakdown
State Code Description Count Market ValueAcres New Value Market
A SINGLE FAMILY RESIDENCE 325 $177,720 $7,267,080C1 VACANT LOTS AND LAND TRACTS 650 $0 $2,088,117E FARM OR RANCH IMPROVEMENT 1 $0 $76,8302.4494F1 COMMERCIAL REAL PROPERTY 1 $0 $280,000J3 ELECTRIC COMPANY (INCLUDING CO-OP 1 $0 $458,430L1 COMMERCIAL PERSONAL PROPERTY 10 $0 $97,790M1 TANGIBLE OTHER PERSONAL, MOBILE H 2 $108,360 $84,031X TOTALLY EXEMPT PROPERTY 85 $7,950 $682,633
Totals 2.4494 $294,030 $11,034,911
Page 38 of 204CHC/395106 True Automation, Inc.
Page 66
HUNT County As of Certification2018 CERTIFIED TOTALSCHC - HAWK COVE, CITY
Property Count: 1,036 8/28/2018 5:00:18PMEffective Rate Assumption
New Value
TOTAL NEW VALUE MARKET: $294,030TOTAL NEW VALUE TAXABLE: $258,951
New Exemptions
Exemption Description CountEX-XV Other Exemptions (including public property, r 10 2017 Market Value $27,430
ABSOLUTE EXEMPTIONS VALUE LOSS $27,430
Exemption Description Count Exemption Amount
PARTIAL EXEMPTIONS VALUE LOSSNEW EXEMPTIONS VALUE LOSS $27,430
Increased Exemptions
Increased Exemption_AmountCountDescriptionExemption
INCREASED EXEMPTIONS VALUE LOSS
TOTAL EXEMPTIONS VALUE LOSS $27,430
New Ag / Timber Exemptions
New Annexations
New Deannexations
Average Homestead Value
Category A and E
Count of HS Residences Average TaxableAverage HS ExemptionAverage Market
116 $26,249$5,395$31,644Category A Only
Count of HS Residences Average TaxableAverage HS ExemptionAverage Market
116 $26,249$5,395$31,644
Lower Value UsedCount of Protested Properties Total Market Value Total Value Used
Page 40 of 204CHC/395106 True Automation, Inc.
Page 67
HUNT County As of Certification2018 CERTIFIED TOTALSCJO - JOSEPHINE, CITY
Grand TotalsProperty Count: 26 4:59:45PM8/28/2018
Land ValueHomesite: 223,120Non Homesite: 86,820Ag Market: 12,790Timber Market: 322,730Total Land (+)0
Improvement Value
Homesite: 2,067,010Non Homesite: 21,840 Total Improvements (+) 2,088,850
Non Real ValueCount
Personal Property: 7 21,670Mineral Property: 0 0Autos: 0 0 Total Non Real (+) 21,670
Market Value = 2,433,250ExemptAg Non Exempt
12,790 0Total Productivity Market:Ag Use: 180 0 12,610(-)Productivity LossTimber Use: 0 0 =Appraised Value 2,420,640Productivity Loss: 012,610
40,613(-)Homestead Cap
=Assessed Value 2,380,027
(-)Total Exemptions Amount(Breakdown on Next Page)
433,630
=Net Taxable 1,946,397
Freeze Assessed Taxable Actual Tax Ceiling Count
407,441 204,243 96.14 96.14 2OV65Total 407,441 204,243 96.14 Freeze Taxable (-)96.14 2 204,243Tax Rate 0.540000
= 1,742,154Freeze Adjusted Taxable
APPROXIMATE LEVY = (FREEZE ADJUSTED TAXABLE * (TAX RATE / 100)) + ACTUAL TAX9,503.77 = 1,742,154 * (0.540000 / 100) + 96.14
Tax Increment Finance Value: 0Tax Increment Finance Levy: 0.00
Page 41 of 204CJO/508788 True Automation, Inc.
Page 68
HUNT County As of Certification2018 CERTIFIED TOTALSCJO - JOSEPHINE, CITY
Exemption Breakdown
StateLocalExemption Count Total
8/28/2018 5:00:18PMProperty Count: 26 Grand Totals
DV1 1 0 12,000 12,000DV4 2 0 12,000 12,000DVHS 2 0 368,540 368,540EX-XN 1 0 19,700 19,700EX366 5 0 1,390 1,390OV65 4 20,000 0 20,000
Totals 20,000 413,630 433,630
Page 42 of 204CJO/508788 True Automation, Inc.
Page 69
HUNT County As of Certification2018 CERTIFIED TOTALSCJO - JOSEPHINE, CITY
Grand TotalsProperty Count: 26 8/28/2018 5:00:18PM
State Category Breakdown
State Code Description Count Market ValueAcres New Value Market
A SINGLE FAMILY RESIDENCE 10 $0 $1,842,670C1 VACANT LOTS AND LAND TRACTS 1 $0 $17,220D1 QUALIFIED AG LAND 2 $0 $12,7901.6100E FARM OR RANCH IMPROVEMENT 6 $16,860 $538,90012.6060L1 COMMERCIAL PERSONAL PROPERTY 1 $0 $580X TOTALLY EXEMPT PROPERTY 6 $0 $21,090
Totals 14.2160 $16,860 $2,433,250
Page 43 of 204CJO/508788 True Automation, Inc.
Page 70
HUNT County As of Certification2018 CERTIFIED TOTALSCJO - JOSEPHINE, CITY
Property Count: 26 8/28/2018 5:00:18PMEffective Rate Assumption
New Value
TOTAL NEW VALUE MARKET: $16,860TOTAL NEW VALUE TAXABLE: $0
New Exemptions
Exemption Description CountEX366 HB366 Exempt 2 2017 Market Value $760
ABSOLUTE EXEMPTIONS VALUE LOSS $760
Exemption Description Count Exemption Amount
PARTIAL EXEMPTIONS VALUE LOSSNEW EXEMPTIONS VALUE LOSS $760
Increased Exemptions
Increased Exemption_AmountCountDescriptionExemption
INCREASED EXEMPTIONS VALUE LOSS
TOTAL EXEMPTIONS VALUE LOSS $760
New Ag / Timber Exemptions
New Annexations
New Deannexations
Average Homestead Value
Category A and E
Count of HS Residences Average TaxableAverage HS ExemptionAverage Market
11 $169,470$3,692$173,162Category A Only
Count of HS Residences Average TaxableAverage HS ExemptionAverage Market
8 $176,835$2,673$179,508
Lower Value UsedCount of Protested Properties Total Market Value Total Value Used
Page 45 of 204CJO/508788 True Automation, Inc.
Page 71
HUNT County As of Certification2018 CERTIFIED TOTALSCLO - LONE OAK, CITY
Grand TotalsProperty Count: 559 4:59:45PM8/28/2018
Land ValueHomesite: 2,275,590Non Homesite: 3,118,780Ag Market: 949,510Timber Market: 6,343,880Total Land (+)0
Improvement Value
Homesite: 13,778,836Non Homesite: 25,342,714 Total Improvements (+) 39,121,550
Non Real ValueCount
Personal Property: 65 2,894,128Mineral Property: 0 0Autos: 0 0 Total Non Real (+) 2,894,128
Market Value = 48,359,558ExemptAg Non Exempt
949,510 0Total Productivity Market:Ag Use: 17,160 0 932,350(-)Productivity LossTimber Use: 0 0 =Appraised Value 47,427,208Productivity Loss: 0932,350
489,097(-)Homestead Cap
=Assessed Value 46,938,111
(-)Total Exemptions Amount(Breakdown on Next Page)
22,850,816
=Net Taxable 24,087,295
APPROXIMATE TOTAL LEVY = NET TAXABLE * (TAX RATE / 100)132,538.90 = 24,087,295 * (0.550244 / 100)
Tax Increment Finance Value: 0Tax Increment Finance Levy: 0.00
Page 46 of 204CLO/395108 True Automation, Inc.
Page 72
HUNT County As of Certification2018 CERTIFIED TOTALSCLO - LONE OAK, CITY
Exemption Breakdown
StateLocalExemption Count Total
8/28/2018 5:00:18PMProperty Count: 559 Grand Totals
DP 11 0 0 0DV3 2 0 20,000 20,000DV4 5 0 48,000 48,000DVHS 1 0 50,896 50,896EX-XG 2 0 56,940 56,940EX-XN 1 0 13,000 13,000EX-XV 48 0 22,176,170 22,176,170EX366 10 0 1,600 1,600OV65 52 484,210 0 484,210
Totals 484,210 22,366,606 22,850,816
Page 47 of 204CLO/395108 True Automation, Inc.
Page 73
HUNT County As of Certification2018 CERTIFIED TOTALSCLO - LONE OAK, CITY
Grand TotalsProperty Count: 559 8/28/2018 5:00:18PM
State Category Breakdown
State Code Description Count Market ValueAcres New Value Market
A SINGLE FAMILY RESIDENCE 253 $312,800 $14,801,320B MULTIFAMILY RESIDENCE 2 $0 $275,650C1 VACANT LOTS AND LAND TRACTS 77 $0 $756,300D1 QUALIFIED AG LAND 23 $0 $949,510176.3052D2 NON-QUALIFIED LAND 5 $0 $117,924E FARM OR RANCH IMPROVEMENT 32 $18,620 $1,983,15679.4000F1 COMMERCIAL REAL PROPERTY 39 $285,740 $3,722,690J2 GAS DISTRIBUTION SYSTEM 1 $0 $201,340J3 ELECTRIC COMPANY (INCLUDING CO-OP 1 $0 $573,700J4 TELEPHONE COMPANY (INCLUDING CO- 7 $0 $752,440J6 PIPELAND COMPANY 1 $0 $152,340L1 COMMERCIAL PERSONAL PROPERTY 42 $0 $1,176,398L2 INDUSTRIAL PERSONAL PROPERTY 1 $0 $19,100M1 TANGIBLE OTHER PERSONAL, MOBILE H 14 $37,170 $332,050O RESIDENTIAL INVENTORY 23 $0 $297,930S SPECIAL INVENTORY TAX 1 $0 $0X TOTALLY EXEMPT PROPERTY 61 $0 $22,247,710
Totals 255.7052 $654,330 $48,359,558
Page 48 of 204CLO/395108 True Automation, Inc.
Page 74
HUNT County As of Certification2018 CERTIFIED TOTALSCLO - LONE OAK, CITY
Property Count: 559 8/28/2018 5:00:18PMEffective Rate Assumption
New Value
TOTAL NEW VALUE MARKET: $654,330TOTAL NEW VALUE TAXABLE: $541,200
New Exemptions
Exemption Description CountEX-XV Other Exemptions (including public property, r 1 2017 Market Value $23,490EX366 HB366 Exempt 2 2017 Market Value $860
ABSOLUTE EXEMPTIONS VALUE LOSS $24,350
Exemption Description Count Exemption Amount$01DisabilityDP
$12,0001Disabled Veterans 70% - 100%DV42PARTIAL EXEMPTIONS VALUE LOSS $12,000
NEW EXEMPTIONS VALUE LOSS $36,350
Increased Exemptions
Increased Exemption_AmountCountDescriptionExemption
INCREASED EXEMPTIONS VALUE LOSS
TOTAL EXEMPTIONS VALUE LOSS $36,350
New Ag / Timber Exemptions
New Annexations
New Deannexations
Average Homestead Value
Category A and E
Count of HS Residences Average TaxableAverage HS ExemptionAverage Market
133 $74,790$3,487$78,277Category A Only
Count of HS Residences Average TaxableAverage HS ExemptionAverage Market
120 $73,406$3,582$76,988
Lower Value UsedCount of Protested Properties Total Market Value Total Value Used
Page 50 of 204CLO/395108 True Automation, Inc.
Page 75
HUNT County As of Certification2018 CERTIFIED TOTALSCQL - QUINLAN, CITY
Grand TotalsProperty Count: 1,182 4:59:45PM8/28/2018
Land ValueHomesite: 5,013,256Non Homesite: 23,701,169Ag Market: 1,332,970Timber Market: 30,047,395Total Land (+)0
Improvement Value
Homesite: 31,127,798Non Homesite: 60,045,157 Total Improvements (+) 91,172,955
Non Real ValueCount
Personal Property: 236 20,196,026Mineral Property: 0 0Autos: 0 0 Total Non Real (+) 20,196,026
Market Value = 141,416,376ExemptAg Non Exempt
1,332,970 0Total Productivity Market:Ag Use: 10,050 0 1,322,920(-)Productivity LossTimber Use: 0 0 =Appraised Value 140,093,456Productivity Loss: 01,322,920
1,242,579(-)Homestead Cap
=Assessed Value 138,850,877
(-)Total Exemptions Amount(Breakdown on Next Page)
39,341,831
=Net Taxable 99,509,046
APPROXIMATE TOTAL LEVY = NET TAXABLE * (TAX RATE / 100)557,250.66 = 99,509,046 * (0.560000 / 100)
Tax Increment Finance Value: 0Tax Increment Finance Levy: 0.00
Page 51 of 204CQL/395109 True Automation, Inc.
Page 76
HUNT County As of Certification2018 CERTIFIED TOTALSCQL - QUINLAN, CITY
Exemption Breakdown
StateLocalExemption Count Total
8/28/2018 5:00:18PMProperty Count: 1,182 Grand Totals
DP 17 0 0 0DV1 1 0 5,000 5,000DV2 1 0 7,500 7,500DV3 1 0 12,000 12,000DV4 7 0 47,573 47,573DV4S 3 0 0 0DVHS 4 0 534,325 534,325DVHSS 3 0 212,748 212,748EX-XG 1 0 288,710 288,710EX-XN 5 0 274,450 274,450EX-XR 1 0 57,000 57,000EX-XV 69 0 37,360,580 37,360,580EX366 16 0 3,828 3,828OV65 121 538,117 0 538,117
Totals 538,117 38,803,714 39,341,831
Page 52 of 204CQL/395109 True Automation, Inc.
Page 77
HUNT County As of Certification2018 CERTIFIED TOTALSCQL - QUINLAN, CITY
Grand TotalsProperty Count: 1,182 8/28/2018 5:00:18PM
State Category Breakdown
State Code Description Count Market ValueAcres New Value Market
A SINGLE FAMILY RESIDENCE 471 $1,101,610 $32,996,346B MULTIFAMILY RESIDENCE 11 $0 $2,420,584C1 VACANT LOTS AND LAND TRACTS 130 $0 $3,177,960D1 QUALIFIED AG LAND 39 $0 $1,332,970121.3970D2 NON-QUALIFIED LAND 1 $0 $6,710E FARM OR RANCH IMPROVEMENT 67 $14,650 $4,181,14087.1318F1 COMMERCIAL REAL PROPERTY 122 $512,370 $38,915,720J2 GAS DISTRIBUTION SYSTEM 1 $0 $345,800J3 ELECTRIC COMPANY (INCLUDING CO-OP 3 $0 $758,630J4 TELEPHONE COMPANY (INCLUDING CO- 7 $0 $965,830J6 PIPELAND COMPANY 4 $0 $3,180,130J7 CABLE TELEVISION COMPANY 2 $0 $12,820L1 COMMERCIAL PERSONAL PROPERTY 192 $0 $14,605,518M1 TANGIBLE OTHER PERSONAL, MOBILE H 11 $0 $133,860O RESIDENTIAL INVENTORY 52 $0 $320,980S SPECIAL INVENTORY TAX 4 $0 $76,810X TOTALLY EXEMPT PROPERTY 92 $0 $37,984,568
Totals 208.5288 $1,628,630 $141,416,376
Page 53 of 204CQL/395109 True Automation, Inc.
Page 78
HUNT County As of Certification2018 CERTIFIED TOTALSCQL - QUINLAN, CITY
Property Count: 1,182 8/28/2018 5:00:18PMEffective Rate Assumption
New Value
TOTAL NEW VALUE MARKET: $1,628,630TOTAL NEW VALUE TAXABLE: $1,628,630
New Exemptions
Exemption Description CountEX366 HB366 Exempt 2 2017 Market Value $0
ABSOLUTE EXEMPTIONS VALUE LOSS $0
Exemption Description Count Exemption Amount$01DisabilityDP
$12,0001Disabled Veterans 70% - 100%DV4$2,6782Over 65OV65
4PARTIAL EXEMPTIONS VALUE LOSS $14,678NEW EXEMPTIONS VALUE LOSS $14,678
Increased Exemptions
Increased Exemption_AmountCountDescriptionExemption
INCREASED EXEMPTIONS VALUE LOSS
TOTAL EXEMPTIONS VALUE LOSS $14,678
New Ag / Timber Exemptions
New Annexations
New Deannexations
Average Homestead Value
Category A and E
Count of HS Residences Average TaxableAverage HS ExemptionAverage Market
270 $83,374$4,523$87,897Category A Only
Count of HS Residences Average TaxableAverage HS ExemptionAverage Market
245 $84,331$4,582$88,913
Lower Value UsedCount of Protested Properties Total Market Value Total Value Used
Page 55 of 204CQL/395109 True Automation, Inc.
Page 79
HUNT County As of Certification2018 CERTIFIED TOTALSCRC - ROYSE CITY, CITY
Grand TotalsProperty Count: 941 4:59:45PM8/28/2018
Land ValueHomesite: 11,858,440Non Homesite: 31,026,294Ag Market: 23,711,290Timber Market: 66,596,024Total Land (+)0
Improvement Value
Homesite: 36,452,110Non Homesite: 47,609,201 Total Improvements (+) 84,061,311
Non Real ValueCount
Personal Property: 63 2,538,450Mineral Property: 0 0Autos: 0 0 Total Non Real (+) 2,538,450
Market Value = 153,195,785ExemptAg Non Exempt
23,711,290 0Total Productivity Market:Ag Use: 238,220 0 23,473,070(-)Productivity LossTimber Use: 0 0 =Appraised Value 129,722,715Productivity Loss: 023,473,070
1,205,708(-)Homestead Cap
=Assessed Value 128,517,007
(-)Total Exemptions Amount(Breakdown on Next Page)
46,141,288
=Net Taxable 82,375,719
Freeze Assessed Taxable Actual Tax Ceiling Count
2,164,391 1,838,685 9,843.33 11,038.19 17OV65Total 2,164,391 1,838,685 11,038.19 Freeze Taxable (-)9,843.33 17 1,838,685Tax Rate 0.621500
= 80,537,034Freeze Adjusted Taxable
APPROXIMATE LEVY = (FREEZE ADJUSTED TAXABLE * (TAX RATE / 100)) + ACTUAL TAX510,381.00 = 80,537,034 * (0.621500 / 100) + 9,843.33
Tax Increment Finance Value: 0Tax Increment Finance Levy: 0.00
Page 56 of 204CRC/395110 True Automation, Inc.
Page 80
HUNT County As of Certification2018 CERTIFIED TOTALSCRC - ROYSE CITY, CITY
Exemption Breakdown
StateLocalExemption Count Total
8/28/2018 5:00:18PMProperty Count: 941 Grand Totals
DP 1 5,000 0 5,000DV3 4 0 37,000 37,000DV4 6 0 48,000 48,000DVHS 4 0 646,572 646,572EX-XN 1 0 29,640 29,640EX-XR 2 0 1,251,630 1,251,630EX-XV 8 0 43,801,900 43,801,900EX366 6 0 970 970FRSS 1 0 179,576 179,576OV65 28 141,000 0 141,000
Totals 146,000 45,995,288 46,141,288
Page 57 of 204CRC/395110 True Automation, Inc.
Page 81
HUNT County As of Certification2018 CERTIFIED TOTALSCRC - ROYSE CITY, CITY
Grand TotalsProperty Count: 941 8/28/2018 5:00:18PM
State Category Breakdown
State Code Description Count Market ValueAcres New Value Market
A SINGLE FAMILY RESIDENCE 253 $8,818,100 $37,670,870C1 VACANT LOTS AND LAND TRACTS 55 $0 $2,931,860D1 QUALIFIED AG LAND 106 $0 $23,711,2901,709.2050D2 NON-QUALIFIED LAND 16 $0 $111,164E FARM OR RANCH IMPROVEMENT 104 $11,280 $17,697,078548.7403F1 COMMERCIAL REAL PROPERTY 19 $200,050 $8,819,300J3 ELECTRIC COMPANY (INCLUDING CO-OP 1 $0 $96,330J5 RAILROAD 1 $0 $10J6 PIPELAND COMPANY 2 $0 $296,140L1 COMMERCIAL PERSONAL PROPERTY 44 $0 $1,427,570M1 TANGIBLE OTHER PERSONAL, MOBILE H 26 $9,830 $413,070O RESIDENTIAL INVENTORY 372 $1,121,000 $14,379,163S SPECIAL INVENTORY TAX 7 $0 $557,800X TOTALLY EXEMPT PROPERTY 17 $0 $45,084,140
Totals 2,257.9453 $10,160,260 $153,195,785
Page 58 of 204CRC/395110 True Automation, Inc.
Page 82
HUNT County As of Certification2018 CERTIFIED TOTALSCRC - ROYSE CITY, CITY
Property Count: 941 8/28/2018 5:00:18PMEffective Rate Assumption
New Value
TOTAL NEW VALUE MARKET: $10,160,260TOTAL NEW VALUE TAXABLE: $10,160,260
New Exemptions
Exemption Description Count
ABSOLUTE EXEMPTIONS VALUE LOSS
Exemption Description Count Exemption Amount$10,0001Disabled Veterans 50% - 69%DV3$36,0003Disabled Veterans 70% - 100%DV4$6,0001Over 65OV65
5PARTIAL EXEMPTIONS VALUE LOSS $52,000NEW EXEMPTIONS VALUE LOSS $52,000
Increased Exemptions
Increased Exemption_AmountCountDescriptionExemption
INCREASED EXEMPTIONS VALUE LOSS
TOTAL EXEMPTIONS VALUE LOSS $52,000
New Ag / Timber Exemptions
New Annexations
Count Market Value Taxable Value
76 $12,345,492 $9,470,257
New Deannexations
Average Homestead Value
Category A and E
Count of HS Residences Average TaxableAverage HS ExemptionAverage Market
171 $162,956$6,892$169,848Category A Only
Count of HS Residences Average TaxableAverage HS ExemptionAverage Market
125 $177,366$6,096$183,462
Page 60 of 204CRC/395110 True Automation, Inc.
Page 83
HUNT County As of Certification2018 CERTIFIED TOTALSCUV - UNION VALLEY, CITY
Grand TotalsProperty Count: 230 4:59:45PM8/28/2018
Land ValueHomesite: 4,037,410Non Homesite: 2,926,120Ag Market: 4,202,140Timber Market: 11,165,670Total Land (+)0
Improvement Value
Homesite: 25,156,938Non Homesite: 3,741,594 Total Improvements (+) 28,898,532
Non Real ValueCount
Personal Property: 25 710,420Mineral Property: 0 0Autos: 0 0 Total Non Real (+) 710,420
Market Value = 40,774,622ExemptAg Non Exempt
4,202,140 0Total Productivity Market:Ag Use: 45,920 0 4,156,220(-)Productivity LossTimber Use: 0 0 =Appraised Value 36,618,402Productivity Loss: 04,156,220
622,422(-)Homestead Cap
=Assessed Value 35,995,980
(-)Total Exemptions Amount(Breakdown on Next Page)
3,462,964
=Net Taxable 32,533,016
APPROXIMATE TOTAL LEVY = NET TAXABLE * (TAX RATE / 100)0.00 = 32,533,016 * (0.000000 / 100)
Tax Increment Finance Value: 0Tax Increment Finance Levy: 0.00
Page 62 of 204CUV/508803 True Automation, Inc.
Page 84
HUNT County As of Certification2018 CERTIFIED TOTALSCUV - UNION VALLEY, CITY
Exemption Breakdown
StateLocalExemption Count Total
8/28/2018 5:00:18PMProperty Count: 230 Grand Totals
DP 3 99,960 0 99,960DV1 1 0 12,000 12,000DV2 1 0 7,500 7,500DV3 1 0 10,000 10,000DV4 1 0 12,000 12,000EX-XN 1 0 37,940 37,940EX-XR 1 0 1,970 1,970EX-XV 4 0 1,174,170 1,174,170EX366 5 0 1,010 1,010OV65 49 2,106,414 0 2,106,414
Totals 2,206,374 1,256,590 3,462,964
Page 63 of 204CUV/508803 True Automation, Inc.
Page 85
HUNT County As of Certification2018 CERTIFIED TOTALSCUV - UNION VALLEY, CITY
Grand TotalsProperty Count: 230 8/28/2018 5:00:18PM
State Category Breakdown
State Code Description Count Market ValueAcres New Value Market
A SINGLE FAMILY RESIDENCE 63 $444,000 $16,457,260C1 VACANT LOTS AND LAND TRACTS 7 $0 $203,470D1 QUALIFIED AG LAND 46 $0 $4,202,140550.1048D2 NON-QUALIFIED LAND 19 $0 $784,843E FARM OR RANCH IMPROVEMENT 104 $60,350 $15,470,877346.8985F1 COMMERCIAL REAL PROPERTY 7 $0 $1,708,272J4 TELEPHONE COMPANY (INCLUDING CO- 2 $0 $95,540L1 COMMERCIAL PERSONAL PROPERTY 16 $0 $574,990M1 TANGIBLE OTHER PERSONAL, MOBILE H 1 $0 $54,370O RESIDENTIAL INVENTORY 1 $0 $6,830S SPECIAL INVENTORY TAX 1 $0 $940X TOTALLY EXEMPT PROPERTY 11 $0 $1,215,090
Totals 897.0033 $504,350 $40,774,622
Page 64 of 204CUV/508803 True Automation, Inc.
Page 86
HUNT County As of Certification2018 CERTIFIED TOTALSCUV - UNION VALLEY, CITY
Property Count: 230 8/28/2018 5:00:18PMEffective Rate Assumption
New Value
TOTAL NEW VALUE MARKET: $504,350TOTAL NEW VALUE TAXABLE: $504,350
New Exemptions
Exemption Description Count
ABSOLUTE EXEMPTIONS VALUE LOSS
Exemption Description Count Exemption Amount$100,0002Over 65OV65
2PARTIAL EXEMPTIONS VALUE LOSS $100,000NEW EXEMPTIONS VALUE LOSS $100,000
Increased Exemptions
Increased Exemption_AmountCountDescriptionExemption
INCREASED EXEMPTIONS VALUE LOSS
TOTAL EXEMPTIONS VALUE LOSS $100,000
New Ag / Timber Exemptions
New Annexations
New Deannexations
Average Homestead Value
Category A and E
Count of HS Residences Average TaxableAverage HS ExemptionAverage Market
110 $228,579$5,658$234,237Category A Only
Count of HS Residences Average TaxableAverage HS ExemptionAverage Market
56 $261,468$4,628$266,096
Lower Value UsedCount of Protested Properties Total Market Value Total Value Used
Page 66 of 204CUV/508803 True Automation, Inc.
Page 87
HUNT County As of Certification2018 CERTIFIED TOTALSCWC - WOLFE CITY, CITY
Grand TotalsProperty Count: 958 4:59:45PM8/28/2018
Land ValueHomesite: 3,775,507Non Homesite: 2,775,390Ag Market: 583,480Timber Market: 7,134,377Total Land (+)0
Improvement Value
Homesite: 25,390,784Non Homesite: 15,494,410 Total Improvements (+) 40,885,194
Non Real ValueCount
Personal Property: 77 6,778,920Mineral Property: 0 0Autos: 0 0 Total Non Real (+) 6,778,920
Market Value = 54,798,491ExemptAg Non Exempt
583,480 0Total Productivity Market:Ag Use: 9,140 0 574,340(-)Productivity LossTimber Use: 0 0 =Appraised Value 54,224,151Productivity Loss: 0574,340
151,819(-)Homestead Cap
=Assessed Value 54,072,332
(-)Total Exemptions Amount(Breakdown on Next Page)
11,125,183
=Net Taxable 42,947,149
APPROXIMATE TOTAL LEVY = NET TAXABLE * (TAX RATE / 100)255,325.52 = 42,947,149 * (0.594511 / 100)
Tax Increment Finance Value: 0Tax Increment Finance Levy: 0.00
Page 67 of 204CWC/395111 True Automation, Inc.
Page 88
HUNT County As of Certification2018 CERTIFIED TOTALSCWC - WOLFE CITY, CITY
Exemption Breakdown
StateLocalExemption Count Total
8/28/2018 5:00:18PMProperty Count: 958 Grand Totals
DP 13 0 0 0DV3 1 0 10,000 10,000DV4 6 0 60,000 60,000DV4S 1 0 12,000 12,000DVHS 3 0 229,452 229,452EX-XG 1 0 43,160 43,160EX-XN 6 0 218,860 218,860EX-XV 54 0 8,111,830 8,111,830EX-XV (Prorated) 3 0 25,001 25,001EX366 8 0 1,580 1,580HS 271 1,283,602 0 1,283,602LVE 1 31,820 0 31,820OV65 117 1,087,878 0 1,087,878OV65S 1 10,000 0 10,000
Totals 2,413,300 8,711,883 11,125,183
Page 68 of 204CWC/395111 True Automation, Inc.
Page 89
HUNT County As of Certification2018 CERTIFIED TOTALSCWC - WOLFE CITY, CITY
Grand TotalsProperty Count: 958 8/28/2018 5:00:18PM
State Category Breakdown
State Code Description Count Market ValueAcres New Value Market
A SINGLE FAMILY RESIDENCE 573 $10,550 $28,656,970B MULTIFAMILY RESIDENCE 16 $0 $2,599,664C1 VACANT LOTS AND LAND TRACTS 138 $0 $826,300D1 QUALIFIED AG LAND 19 $0 $583,480135.9454D2 NON-QUALIFIED LAND 3 $0 $18,600E FARM OR RANCH IMPROVEMENT 23 $0 $1,139,80752.4038F1 COMMERCIAL REAL PROPERTY 53 $0 $4,756,269F2 INDUSTRIAL REAL PROPERTY 5 $0 $927,170J2 GAS DISTRIBUTION SYSTEM 1 $0 $642,390J3 ELECTRIC COMPANY (INCLUDING CO-OP 3 $0 $988,900J4 TELEPHONE COMPANY (INCLUDING CO- 2 $0 $262,330J6 PIPELAND COMPANY 1 $0 $119,440J7 CABLE TELEVISION COMPANY 2 $0 $23,550L1 COMMERCIAL PERSONAL PROPERTY 52 $0 $1,196,900L2 INDUSTRIAL PERSONAL PROPERTY 4 $0 $3,397,210M1 TANGIBLE OTHER PERSONAL, MOBILE H 14 $0 $227,260S SPECIAL INVENTORY TAX 2 $0 $0X TOTALLY EXEMPT PROPERTY 73 $0 $8,432,251
Totals 188.3492 $10,550 $54,798,491
Page 69 of 204CWC/395111 True Automation, Inc.
Page 90
HUNT County As of Certification2018 CERTIFIED TOTALSCWC - WOLFE CITY, CITY
Property Count: 958 8/28/2018 5:00:18PMEffective Rate Assumption
New Value
TOTAL NEW VALUE MARKET: $10,550TOTAL NEW VALUE TAXABLE: $10,550
New Exemptions
Exemption Description CountEX-XV Other Exemptions (including public property, r 1 2017 Market Value $3,770
ABSOLUTE EXEMPTIONS VALUE LOSS $3,770
Exemption Description Count Exemption Amount$10,0001Disabled Veterans 50% - 69%DV3$28,1021Disabled Veteran HomesteadDVHS$20,9466HomesteadHS$17,5943Over 65OV65
11PARTIAL EXEMPTIONS VALUE LOSS $76,642NEW EXEMPTIONS VALUE LOSS $80,412
Increased Exemptions
Increased Exemption_AmountCountDescriptionExemption
INCREASED EXEMPTIONS VALUE LOSS
TOTAL EXEMPTIONS VALUE LOSS $80,412
New Ag / Timber Exemptions
New Annexations
New Deannexations
Average Homestead Value
Category A and E
Count of HS Residences Average TaxableAverage HS ExemptionAverage Market
269 $60,691$5,288$65,979Category A Only
Count of HS Residences Average TaxableAverage HS ExemptionAverage Market
264 $60,384$5,293$65,677
Page 71 of 204CWC/395111 True Automation, Inc.
Page 91
HUNT County As of Certification2018 CERTIFIED TOTALSCWT - WEST TAWAKONI CITY
Grand TotalsProperty Count: 1,767 4:59:45PM8/28/2018
Land ValueHomesite: 8,639,270Non Homesite: 12,339,588Ag Market: 2,135,340Timber Market: 23,114,198Total Land (+)0
Improvement Value
Homesite: 42,428,781Non Homesite: 14,384,717 Total Improvements (+) 56,813,498
Non Real ValueCount
Personal Property: 68 2,226,297Mineral Property: 0 0Autos: 0 0 Total Non Real (+) 2,226,297
Market Value = 82,153,993ExemptAg Non Exempt
2,135,340 0Total Productivity Market:Ag Use: 28,130 0 2,107,210(-)Productivity LossTimber Use: 0 0 =Appraised Value 80,046,783Productivity Loss: 02,107,210
2,305,938(-)Homestead Cap
=Assessed Value 77,740,845
(-)Total Exemptions Amount(Breakdown on Next Page)
6,204,263
=Net Taxable 71,536,582
APPROXIMATE TOTAL LEVY = NET TAXABLE * (TAX RATE / 100)436,245.82 = 71,536,582 * (0.609822 / 100)
Tax Increment Finance Value: 0Tax Increment Finance Levy: 0.00
Page 73 of 204CWT/395112 True Automation, Inc.
Page 92
HUNT County As of Certification2018 CERTIFIED TOTALSCWT - WEST TAWAKONI CITY
Exemption Breakdown
StateLocalExemption Count Total
8/28/2018 5:00:18PMProperty Count: 1,767 Grand Totals
DP 54 0 0 0DV2 3 0 19,500 19,500DV3 3 0 25,000 25,000DV4 13 0 125,200 125,200DV4S 2 0 15,550 15,550DVHS 8 0 437,063 437,063DVHSS 2 0 58,762 58,762EX-XI 2 0 315,420 315,420EX-XL (Prorated) 1 0 18,552 18,552EX-XN 2 0 47,790 47,790EX-XU 4 0 855,760 855,760EX-XV 41 0 4,225,530 4,225,530EX-XV (Prorated) 2 0 10,426 10,426EX366 8 0 2,130 2,130LVE 1 47,580 0 47,580
Totals 47,580 6,156,683 6,204,263
Page 74 of 204CWT/395112 True Automation, Inc.
Page 93
HUNT County As of Certification2018 CERTIFIED TOTALSCWT - WEST TAWAKONI CITY
Grand TotalsProperty Count: 1,767 8/28/2018 5:00:18PM
State Category Breakdown
State Code Description Count Market ValueAcres New Value Market
A SINGLE FAMILY RESIDENCE 788 $597,000 $49,024,146B MULTIFAMILY RESIDENCE 1 $0 $284,860C1 VACANT LOTS AND LAND TRACTS 431 $0 $3,931,330D1 QUALIFIED AG LAND 31 $0 $2,135,340372.9922D2 NON-QUALIFIED LAND 9 $0 $59,090E FARM OR RANCH IMPROVEMENT 138 $139,080 $6,880,808302.2412F1 COMMERCIAL REAL PROPERTY 72 $351,710 $8,911,754J4 TELEPHONE COMPANY (INCLUDING CO- 2 $0 $115,630L1 COMMERCIAL PERSONAL PROPERTY 54 $0 $1,773,887M1 TANGIBLE OTHER PERSONAL, MOBILE H 117 $260,130 $2,025,350O RESIDENTIAL INVENTORY 132 $0 $1,212,830S SPECIAL INVENTORY TAX 3 $0 $275,780X TOTALLY EXEMPT PROPERTY 61 $0 $5,523,188
Totals 675.2334 $1,347,920 $82,153,993
Page 75 of 204CWT/395112 True Automation, Inc.
Page 94
HUNT County As of Certification2018 CERTIFIED TOTALSCWT - WEST TAWAKONI CITY
Property Count: 1,767 8/28/2018 5:00:18PMEffective Rate Assumption
New Value
TOTAL NEW VALUE MARKET: $1,347,920TOTAL NEW VALUE TAXABLE: $1,342,720
New Exemptions
Exemption Description CountEX-XV Other Exemptions (including public property, r 2 2017 Market Value $44,850
ABSOLUTE EXEMPTIONS VALUE LOSS $44,850
Exemption Description Count Exemption Amount$11,4712Disabled Veterans 30% - 49%DV2
2PARTIAL EXEMPTIONS VALUE LOSS $11,471NEW EXEMPTIONS VALUE LOSS $56,321
Increased Exemptions
Increased Exemption_AmountCountDescriptionExemption
INCREASED EXEMPTIONS VALUE LOSS
TOTAL EXEMPTIONS VALUE LOSS $56,321
New Ag / Timber Exemptions
New Annexations
New Deannexations
Average Homestead Value
Category A and E
Count of HS Residences Average TaxableAverage HS ExemptionAverage Market
418 $68,244$4,763$73,007Category A Only
Count of HS Residences Average TaxableAverage HS ExemptionAverage Market
376 $69,814$4,548$74,362
Lower Value UsedCount of Protested Properties Total Market Value Total Value Used
Page 77 of 204CWT/395112 True Automation, Inc.
Page 95
HUNT County As of Certification2018 CERTIFIED TOTALSGHT - HUNT COUNTY
Grand TotalsProperty Count: 68,160 4:59:45PM8/28/2018
Land ValueHomesite: 499,758,897Non Homesite: 822,880,092Ag Market: 1,484,473,860Timber Market: 2,807,112,849Total Land (+)0
Improvement Value
Homesite: 3,196,904,194Non Homesite: 2,617,941,327 Total Improvements (+) 5,814,845,521
Non Real ValueCount
Personal Property: 3,189 1,352,737,014Mineral Property: 4 33,220Autos: 0 0 Total Non Real (+) 1,352,770,234
Market Value = 9,974,728,604ExemptAg Non Exempt
1,483,695,030 778,830Total Productivity Market:Ag Use: 38,748,170 20,490 1,444,946,860(-)Productivity LossTimber Use: 0 0 =Appraised Value 8,529,781,744Productivity Loss: 758,3401,444,946,860
123,146,535(-)Homestead Cap
=Assessed Value 8,406,635,209
(-)Total Exemptions Amount(Breakdown on Next Page)
2,339,828,223
=Net Taxable 6,066,806,986
APPROXIMATE TOTAL LEVY = NET TAXABLE * (TAX RATE / 100)31,090,505.09 = 6,066,806,986 * (0.512469 / 100)
Tax Increment LossTif Zone Code
TIRZ1 70,865,431
Tax Increment Finance Value: 70,865,431Tax Increment Finance Levy: 363,163.37
Page 78 of 204GHT/395128 True Automation, Inc.
Page 96
HUNT County As of Certification2018 CERTIFIED TOTALSGHT - HUNT COUNTY
Exemption Breakdown
StateLocalExemption Count Total
8/28/2018 5:00:18PMProperty Count: 68,160 Grand Totals
AB 9 30,187,217 0 30,187,217CHODO (Partial) 1 1,267,740 0 1,267,740DP 1,055 0 0 0DV1 119 0 766,759 766,759DV1S 3 0 15,000 15,000DV2 95 0 717,544 717,544DV3 116 0 1,160,690 1,160,690DV4 574 0 5,015,459 5,015,459DV4S 84 0 664,664 664,664DVHS 319 0 45,813,609 45,813,609DVHSS 52 0 5,205,233 5,205,233EX-XG 11 0 1,770,280 1,770,280EX-XI 4 0 452,730 452,730EX-XI (Prorated) 1 0 74,521 74,521EX-XJ 7 0 3,849,730 3,849,730EX-XL 2 0 209,920 209,920EX-XL (Prorated) 1 0 18,552 18,552EX-XN 29 0 9,056,210 9,056,210EX-XR 123 0 32,959,147 32,959,147EX-XR (Prorated) 1 0 1,580 1,580EX-XU 15 0 2,225,630 2,225,630EX-XU (Prorated) 1 0 5,639 5,639EX-XV 2,477 0 2,049,586,052 2,049,586,052EX-XV (Prorated) 116 0 980,846 980,846EX366 34 0 10,430 10,430FR 20 0 0 0FRSS 2 0 305,477 305,477LVE 6 4,218,175 0 4,218,175OV65 7,847 136,279,488 0 136,279,488OV65S 44 660,000 0 660,000PC 48 6,239,167 0 6,239,167SO 5 110,734 0 110,734
Totals 178,962,521 2,160,865,702 2,339,828,223
Page 79 of 204GHT/395128 True Automation, Inc.
Page 97
HUNT County As of Certification2018 CERTIFIED TOTALSGHT - HUNT COUNTY
Grand TotalsProperty Count: 68,160 8/28/2018 5:00:18PM
State Category Breakdown
State Code Description Count Market ValueAcres New Value Market
A SINGLE FAMILY RESIDENCE 22,371 $102,846,416 $2,300,027,166B MULTIFAMILY RESIDENCE 351 $2,347,530 $173,041,048C1 VACANT LOTS AND LAND TRACTS 9,838 $0 $122,225,090D1 QUALIFIED AG LAND 13,861 $0 $1,483,695,030409,072.9054D2 NON-QUALIFIED LAND 4,576 $1,829,860 $72,281,895E FARM OR RANCH IMPROVEMENT 16,551 $50,768,890 $1,775,207,66560,145.1138F1 COMMERCIAL REAL PROPERTY 2,057 $29,681,090 $693,476,861F2 INDUSTRIAL REAL PROPERTY 96 $2,680,530 $147,431,598G1 OIL AND GAS 4 $0 $33,220J1 WATER SYSTEMS 15 $0 $606,060J2 GAS DISTRIBUTION SYSTEM 29 $0 $16,166,780J3 ELECTRIC COMPANY (INCLUDING CO-OP 71 $0 $55,934,920J4 TELEPHONE COMPANY (INCLUDING CO- 194 $0 $26,362,990J5 RAILROAD 166 $0 $13,982,030J6 PIPELAND COMPANY 190 $0 $50,636,140J7 CABLE TELEVISION COMPANY 51 $0 $6,877,010J8 OTHER TYPE OF UTILITY 1 $0 $2,390L1 COMMERCIAL PERSONAL PROPERTY 2,360 $977,900 $316,252,934L2 INDUSTRIAL PERSONAL PROPERTY 64 $0 $524,296,146M1 TANGIBLE OTHER PERSONAL, MOBILE H 1,559 $4,389,900 $40,844,742O RESIDENTIAL INVENTORY 1,952 $1,551,370 $22,618,167S SPECIAL INVENTORY TAX 109 $0 $25,731,050X TOTALLY EXEMPT PROPERTY 2,829 $2,601,154 $2,106,997,672
Totals 469,218.0192 $199,674,640 $9,974,728,604
Page 80 of 204GHT/395128 True Automation, Inc.
Page 98
HUNT County As of Certification2018 CERTIFIED TOTALSGHT - HUNT COUNTY
Property Count: 68,160 8/28/2018 5:00:18PMEffective Rate Assumption
New Value
TOTAL NEW VALUE MARKET: $199,674,640TOTAL NEW VALUE TAXABLE: $194,213,284
New Exemptions
Exemption Description CountEX-XL 11.231 Organizations Providing Economic Deve 1 2017 Market Value $48,370EX-XN 11.252 Motor vehicles leased for personal use 4 2017 Market Value $429,880EX-XR 11.30 Nonprofit water or wastewater corporati 1 2017 Market Value $0EX-XV Other Exemptions (including public property, r 54 2017 Market Value $744,460EX366 HB366 Exempt 12 2017 Market Value $11,430
ABSOLUTE EXEMPTIONS VALUE LOSS $1,234,140
Exemption Description Count Exemption Amount$039DisabilityDP
$81,00012Disabled Veterans 10% - 29%DV1$86,47112Disabled Veterans 30% - 49%DV2
$112,00011Disabled Veterans 50% - 69%DV3$368,13737Disabled Veterans 70% - 100%DV4$60,0005Disabled Veterans Surviving Spouse 70% - 100DV4S
$3,725,71726Disabled Veteran HomesteadDVHS$598,1553Disabled Veteran Homestead Surviving SpouseDVHSS$125,9011First Responder Surviving SpouseFRSS
$4,443,214279Over 65OV65$01OV65 Surviving SpouseOV65S
426PARTIAL EXEMPTIONS VALUE LOSS $9,600,595NEW EXEMPTIONS VALUE LOSS $10,834,735
Increased Exemptions
Increased Exemption_AmountCountDescriptionExemption
INCREASED EXEMPTIONS VALUE LOSS
TOTAL EXEMPTIONS VALUE LOSS $10,834,735
New Ag / Timber Exemptions
2017 Market Value Count: 144$7,208,3722018 Ag/Timber Use $168,020
$7,040,352NEW AG / TIMBER VALUE LOSS
New Annexations
New Deannexations
Page 82 of 204GHT/395128 True Automation, Inc.
Page 99
HUNT County As of Certification2018 CERTIFIED TOTALSGHT - HUNT COUNTY
Average Homestead Value
Category A and E
Count of HS Residences Average TaxableAverage HS ExemptionAverage Market
20,184 $126,887$5,876$132,763Category A Only
Count of HS Residences Average TaxableAverage HS ExemptionAverage Market
11,754 $125,458$5,468$130,926
Lower Value UsedCount of Protested Properties Total Market Value Total Value Used
Page 83 of 204GHT/395128 True Automation, Inc.
Page 100
HUNT County As of Certification2018 CERTIFIED TOTALSHHO - HUNT MEMORIAL HD
Grand TotalsProperty Count: 68,157 4:59:45PM8/28/2018
Land ValueHomesite: 499,758,897Non Homesite: 822,880,092Ag Market: 1,484,473,860Timber Market: 2,807,112,849Total Land (+)0
Improvement Value
Homesite: 3,196,824,194Non Homesite: 2,618,018,167 Total Improvements (+) 5,814,842,361
Non Real ValueCount
Personal Property: 3,185 1,352,737,014Mineral Property: 4 33,220Autos: 0 0 Total Non Real (+) 1,352,770,234
Market Value = 9,974,725,444ExemptAg Non Exempt
1,483,695,030 778,830Total Productivity Market:Ag Use: 38,748,170 20,490 1,444,946,860(-)Productivity LossTimber Use: 0 0 =Appraised Value 8,529,778,584Productivity Loss: 758,3401,444,946,860
123,146,535(-)Homestead Cap
=Assessed Value 8,406,632,049
(-)Total Exemptions Amount(Breakdown on Next Page)
2,395,115,057
=Net Taxable 6,011,516,992
APPROXIMATE TOTAL LEVY = NET TAXABLE * (TAX RATE / 100)14,522,622.75 = 6,011,516,992 * (0.241580 / 100)
Tax Increment LossTif Zone Code
TIRZ1 70,883,961
Tax Increment Finance Value: 70,883,961Tax Increment Finance Levy: 171,241.47
Page 84 of 204HHO/395131 True Automation, Inc.
Page 101
HUNT County As of Certification2018 CERTIFIED TOTALSHHO - HUNT MEMORIAL HD
Exemption Breakdown
StateLocalExemption Count Total
8/28/2018 5:00:18PMProperty Count: 68,157 Grand Totals
AB 9 0 0 0CHODO (Partial) 1 1,267,740 0 1,267,740DP 1,055 0 0 0DV1 119 0 766,759 766,759DV1S 3 0 15,000 15,000DV2 95 0 717,544 717,544DV3 116 0 1,160,690 1,160,690DV4 574 0 5,015,459 5,015,459DV4S 84 0 664,664 664,664DVHS 319 0 45,813,609 45,813,609DVHSS 52 0 5,205,233 5,205,233EX-XG 11 0 1,770,280 1,770,280EX-XI 4 0 452,730 452,730EX-XI (Prorated) 1 0 74,521 74,521EX-XJ 7 0 3,849,730 3,849,730EX-XL 2 0 209,920 209,920EX-XL (Prorated) 1 0 18,552 18,552EX-XN 29 0 9,056,210 9,056,210EX-XR 123 0 32,959,147 32,959,147EX-XR (Prorated) 1 0 1,580 1,580EX-XU 15 0 2,225,630 2,225,630EX-XU (Prorated) 1 0 5,639 5,639EX-XV 2,477 0 2,049,586,052 2,049,586,052EX-XV (Prorated) 116 0 980,846 980,846EX366 34 0 10,430 10,430FR 20 85,474,051 0 85,474,051FRSS 2 0 305,477 305,477LVE 6 4,218,175 0 4,218,175OV65 7,847 136,279,488 0 136,279,488OV65S 44 660,000 0 660,000PC 48 6,239,167 0 6,239,167SO 5 110,734 0 110,734
Totals 234,249,355 2,160,865,702 2,395,115,057
Page 85 of 204HHO/395131 True Automation, Inc.
Page 102
HUNT County As of Certification2018 CERTIFIED TOTALSHHO - HUNT MEMORIAL HD
Grand TotalsProperty Count: 68,157 8/28/2018 5:00:18PM
State Category Breakdown
State Code Description Count Market ValueAcres New Value Market
A SINGLE FAMILY RESIDENCE 22,370 $102,846,416 $2,299,947,166B MULTIFAMILY RESIDENCE 351 $2,347,530 $173,041,048C1 VACANT LOTS AND LAND TRACTS 9,838 $0 $122,225,090D1 QUALIFIED AG LAND 13,861 $0 $1,483,695,030409,072.9054D2 NON-QUALIFIED LAND 4,576 $1,829,860 $72,281,895E FARM OR RANCH IMPROVEMENT 16,553 $50,839,050 $1,775,284,50560,145.1138F1 COMMERCIAL REAL PROPERTY 2,057 $29,681,090 $693,476,861F2 INDUSTRIAL REAL PROPERTY 96 $2,680,530 $147,431,598G1 OIL AND GAS 4 $0 $33,220J1 WATER SYSTEMS 15 $0 $606,060J2 GAS DISTRIBUTION SYSTEM 29 $0 $16,166,780J3 ELECTRIC COMPANY (INCLUDING CO-OP 71 $0 $55,934,920J4 TELEPHONE COMPANY (INCLUDING CO- 194 $0 $26,362,990J5 RAILROAD 162 $0 $13,982,030J6 PIPELAND COMPANY 190 $0 $50,636,140J7 CABLE TELEVISION COMPANY 51 $0 $6,877,010J8 OTHER TYPE OF UTILITY 1 $0 $2,390L1 COMMERCIAL PERSONAL PROPERTY 2,360 $977,900 $316,252,934L2 INDUSTRIAL PERSONAL PROPERTY 64 $0 $524,296,146M1 TANGIBLE OTHER PERSONAL, MOBILE H 1,559 $4,389,900 $40,844,742O RESIDENTIAL INVENTORY 1,952 $1,551,370 $22,618,167S SPECIAL INVENTORY TAX 109 $0 $25,731,050X TOTALLY EXEMPT PROPERTY 2,829 $2,601,154 $2,106,997,672
Totals 469,218.0192 $199,744,800 $9,974,725,444
Page 86 of 204HHO/395131 True Automation, Inc.
Page 103
HUNT County As of Certification2018 CERTIFIED TOTALSHHO - HUNT MEMORIAL HD
Property Count: 68,157 8/28/2018 5:00:18PMEffective Rate Assumption
New Value
TOTAL NEW VALUE MARKET: $199,744,800TOTAL NEW VALUE TAXABLE: $194,283,444
New Exemptions
Exemption Description CountEX-XL 11.231 Organizations Providing Economic Deve 1 2017 Market Value $48,370EX-XN 11.252 Motor vehicles leased for personal use 4 2017 Market Value $429,880EX-XR 11.30 Nonprofit water or wastewater corporati 1 2017 Market Value $0EX-XV Other Exemptions (including public property, r 54 2017 Market Value $744,460EX366 HB366 Exempt 12 2017 Market Value $11,430
ABSOLUTE EXEMPTIONS VALUE LOSS $1,234,140
Exemption Description Count Exemption Amount$039DisabilityDP
$81,00012Disabled Veterans 10% - 29%DV1$86,47112Disabled Veterans 30% - 49%DV2
$112,00011Disabled Veterans 50% - 69%DV3$368,13737Disabled Veterans 70% - 100%DV4$60,0005Disabled Veterans Surviving Spouse 70% - 100DV4S
$3,725,71726Disabled Veteran HomesteadDVHS$598,1553Disabled Veteran Homestead Surviving SpouseDVHSS$125,9011First Responder Surviving SpouseFRSS
$4,443,214279Over 65OV65$01OV65 Surviving SpouseOV65S
426PARTIAL EXEMPTIONS VALUE LOSS $9,600,595NEW EXEMPTIONS VALUE LOSS $10,834,735
Increased Exemptions
Increased Exemption_AmountCountDescriptionExemption
INCREASED EXEMPTIONS VALUE LOSS
TOTAL EXEMPTIONS VALUE LOSS $10,834,735
New Ag / Timber Exemptions
2017 Market Value Count: 144$7,208,3722018 Ag/Timber Use $168,020
$7,040,352NEW AG / TIMBER VALUE LOSS
New Annexations
New Deannexations
Page 88 of 204HHO/395131 True Automation, Inc.
Page 104
HUNT County As of Certification2018 CERTIFIED TOTALSHHO - HUNT MEMORIAL HD
Average Homestead Value
Category A and E
Count of HS Residences Average TaxableAverage HS ExemptionAverage Market
20,183 $126,890$5,876$132,766Category A Only
Count of HS Residences Average TaxableAverage HS ExemptionAverage Market
11,753 $125,462$5,468$130,930
Lower Value UsedCount of Protested Properties Total Market Value Total Value Used
Page 89 of 204HHO/395131 True Automation, Inc.
Page 105
HUNT County As of Certification2018 CERTIFIED TOTALSJTV - TRINITY VALLEY COMMUNITY COLLEGE
Grand TotalsProperty Count: 759 4:59:45PM8/28/2018
Land ValueHomesite: 14,173,399Non Homesite: 13,693,611Ag Market: 34,485,815Timber Market: 62,352,825Total Land (+)0
Improvement Value
Homesite: 69,201,940Non Homesite: 8,045,307 Total Improvements (+) 77,247,247
Non Real ValueCount
Personal Property: 24 1,831,140Mineral Property: 0 0Autos: 0 0 Total Non Real (+) 1,831,140
Market Value = 141,431,212ExemptAg Non Exempt
34,485,815 0Total Productivity Market:Ag Use: 510,000 0 33,975,815(-)Productivity LossTimber Use: 0 0 =Appraised Value 107,455,397Productivity Loss: 033,975,815
2,688,980(-)Homestead Cap
=Assessed Value 104,766,417
(-)Total Exemptions Amount(Breakdown on Next Page)
4,035,394
=Net Taxable 100,731,023
Freeze Assessed Taxable Actual Tax Ceiling Count
949,459 898,672 562.79 582.55 8DP22,226,801 20,013,151 15,665.67 15,799.94 139OV65
Total 23,176,260 20,911,823 16,382.49 Freeze Taxable (-)16,228.46 147 20,911,823Tax Rate 0.138540
= 79,819,200Freeze Adjusted Taxable
APPROXIMATE LEVY = (FREEZE ADJUSTED TAXABLE * (TAX RATE / 100)) + ACTUAL TAX126,809.98 = 79,819,200 * (0.138540 / 100) + 16,228.46
Tax Increment Finance Value: 0Tax Increment Finance Levy: 0.00
Page 90 of 204JTV/511351 True Automation, Inc.
Page 106
HUNT County As of Certification2018 CERTIFIED TOTALSJTV - TRINITY VALLEY COMMUNITY COLLEGE
Exemption Breakdown
StateLocalExemption Count Total
8/28/2018 5:00:18PMProperty Count: 759 Grand Totals
DP 10 0 0 0DV1 4 0 27,000 27,000DV2 1 0 12,000 12,000DV3 1 0 10,000 10,000DV4 3 0 36,000 36,000DV4S 1 0 0 0DVHS 3 0 551,756 551,756DVHSS 1 0 263,285 263,285EX-XN 1 0 16,300 16,300EX-XR 1 0 20,000 20,000EX-XV 4 0 983,930 983,930EX366 3 0 900 900OV65 155 2,114,223 0 2,114,223
Totals 2,114,223 1,921,171 4,035,394
Page 91 of 204JTV/511351 True Automation, Inc.
Page 107
HUNT County As of Certification2018 CERTIFIED TOTALSJTV - TRINITY VALLEY COMMUNITY COLLEGE
Grand TotalsProperty Count: 759 8/28/2018 5:00:18PM
State Category Breakdown
State Code Description Count Market ValueAcres New Value Market
A SINGLE FAMILY RESIDENCE 222 $90,070 $39,445,460B MULTIFAMILY RESIDENCE 2 $0 $230,320C1 VACANT LOTS AND LAND TRACTS 31 $0 $1,053,780D1 QUALIFIED AG LAND 295 $0 $34,485,8156,369.0685D2 NON-QUALIFIED LAND 115 $127,790 $2,755,163E FARM OR RANCH IMPROVEMENT 336 $804,170 $59,384,4342,437.6600F1 COMMERCIAL REAL PROPERTY 2 $0 $814,380J1 WATER SYSTEMS 1 $0 $35,000J3 ELECTRIC COMPANY (INCLUDING CO-OP 2 $0 $1,139,390J4 TELEPHONE COMPANY (INCLUDING CO- 1 $0 $132,050J6 PIPELAND COMPANY 2 $0 $272,640L1 COMMERCIAL PERSONAL PROPERTY 14 $0 $234,860M1 TANGIBLE OTHER PERSONAL, MOBILE H 14 $0 $426,790X TOTALLY EXEMPT PROPERTY 9 $0 $1,021,130
Totals 8,806.7285 $1,022,030 $141,431,212
Page 92 of 204JTV/511351 True Automation, Inc.
Page 108
HUNT County As of Certification2018 CERTIFIED TOTALSJTV - TRINITY VALLEY COMMUNITY COLLEGE
Property Count: 759 8/28/2018 5:00:18PMEffective Rate Assumption
New Value
TOTAL NEW VALUE MARKET: $1,022,030TOTAL NEW VALUE TAXABLE: $1,015,810
New Exemptions
Exemption Description Count
ABSOLUTE EXEMPTIONS VALUE LOSS
Exemption Description Count Exemption Amount$261,2561Disabled Veteran HomesteadDVHS$65,2177Over 65OV65
8PARTIAL EXEMPTIONS VALUE LOSS $326,473NEW EXEMPTIONS VALUE LOSS $326,473
Increased Exemptions
Increased Exemption_AmountCountDescriptionExemption
INCREASED EXEMPTIONS VALUE LOSS
TOTAL EXEMPTIONS VALUE LOSS $326,473
New Ag / Timber Exemptions
2017 Market Value Count: 3$205,0642018 Ag/Timber Use $2,000
$203,064NEW AG / TIMBER VALUE LOSS
New Annexations
New Deannexations
Average Homestead Value
Category A and E
Count of HS Residences Average TaxableAverage HS ExemptionAverage Market
344 $180,794$7,726$188,520Category A Only
Count of HS Residences Average TaxableAverage HS ExemptionAverage Market
146 $182,480$9,813$192,293
Page 94 of 204JTV/511351 True Automation, Inc.
Page 109
HUNT County As of Certification2018 CERTIFIED TOTALSMDR - DOUBLE R MUNICIPAL UTILITY DISTRICT #1
Grand TotalsProperty Count: 3 4:59:45PM8/28/2018
Land ValueHomesite: 0Non Homesite: 212,500Ag Market: 973,010Timber Market: 1,185,510Total Land (+)0
Improvement Value
Homesite: 0Non Homesite: 0 Total Improvements (+) 0
Non Real ValueCount
Personal Property: 0 0Mineral Property: 0 0Autos: 0 0 Total Non Real (+) 0
Market Value = 1,185,510ExemptAg Non Exempt
973,010 0Total Productivity Market:Ag Use: 15,350 0 957,660(-)Productivity LossTimber Use: 0 0 =Appraised Value 227,850Productivity Loss: 0957,660
0(-)Homestead Cap
=Assessed Value 227,850
(-)Total Exemptions Amount(Breakdown on Next Page)
0
=Net Taxable 227,850
APPROXIMATE TOTAL LEVY = NET TAXABLE * (TAX RATE / 100)0.00 = 227,850 * (0.000000 / 100)
Tax Increment Finance Value: 0Tax Increment Finance Levy: 0.00
Page 96 of 204MDR/542579 True Automation, Inc.
Page 110
HUNT County As of Certification2018 CERTIFIED TOTALSMDR - DOUBLE R MUNICIPAL UTILITY DISTRICT #1
Exemption Breakdown
StateLocalExemption Count Total
8/28/2018 5:00:18PMProperty Count: 3 Grand Totals
0 0 0 0
Totals 0 0 0
Page 97 of 204MDR/542579 True Automation, Inc.
Page 111
HUNT County As of Certification2018 CERTIFIED TOTALSMDR - DOUBLE R MUNICIPAL UTILITY DISTRICT #1
Grand TotalsProperty Count: 3 8/28/2018 5:00:18PM
State Category Breakdown
State Code Description Count Market ValueAcres New Value Market
D1 QUALIFIED AG LAND 2 $0 $973,01084.4160E FARM OR RANCH IMPROVEMENT 1 $0 $212,5005.0000
Totals 89.4160 $0 $1,185,510
Page 98 of 204MDR/542579 True Automation, Inc.
Page 112
HUNT County As of Certification2018 CERTIFIED TOTALSMDR - DOUBLE R MUNICIPAL UTILITY DISTRICT #1
Property Count: 3 8/28/2018 5:00:18PMEffective Rate Assumption
New Value
TOTAL NEW VALUE MARKET: $0TOTAL NEW VALUE TAXABLE: $0
New Exemptions
Exemption Description Count
ABSOLUTE EXEMPTIONS VALUE LOSS
Exemption Description Count Exemption Amount
PARTIAL EXEMPTIONS VALUE LOSSNEW EXEMPTIONS VALUE LOSS $0
Increased Exemptions
Increased Exemption_AmountCountDescriptionExemption
INCREASED EXEMPTIONS VALUE LOSS
TOTAL EXEMPTIONS VALUE LOSS $0
New Ag / Timber Exemptions
New Annexations
Count Market Value Taxable Value
3 $1,185,510 $227,850
New Deannexations
Average Homestead Value
Count of HS Residences Average TaxableAverage HS ExemptionAverage Market
Lower Value UsedCount of Protested Properties Total Market Value Total Value Used
Page 100 of 204MDR/542579 True Automation, Inc.
Page 113
HUNT County As of Certification2018 CERTIFIED TOTALSMV1 - VERANDAH MUNICIPAL UTILITY DISTRICT
Grand TotalsProperty Count: 615 4:59:45PM8/28/2018
Land ValueHomesite: 19,769,000Non Homesite: 9,799,820Ag Market: 5,290Timber Market: 29,574,110Total Land (+)0
Improvement Value
Homesite: 85,546,638Non Homesite: 2,024,160 Total Improvements (+) 87,570,798
Non Real ValueCount
Personal Property: 14 304,450Mineral Property: 0 0Autos: 0 0 Total Non Real (+) 304,450
Market Value = 117,449,358ExemptAg Non Exempt
5,290 0Total Productivity Market:Ag Use: 40 0 5,250(-)Productivity LossTimber Use: 0 0 =Appraised Value 117,444,108Productivity Loss: 05,250
306,343(-)Homestead Cap
=Assessed Value 117,137,765
(-)Total Exemptions Amount(Breakdown on Next Page)
3,332,650
=Net Taxable 113,805,115
APPROXIMATE TOTAL LEVY = NET TAXABLE * (TAX RATE / 100)967,343.48 = 113,805,115 * (0.850000 / 100)
Tax Increment Finance Value: 0Tax Increment Finance Levy: 0.00
Page 101 of 204MV1/504041 True Automation, Inc.
Page 114
HUNT County As of Certification2018 CERTIFIED TOTALSMV1 - VERANDAH MUNICIPAL UTILITY DISTRICT
Exemption Breakdown
StateLocalExemption Count Total
8/28/2018 5:00:18PMProperty Count: 615 Grand Totals
DP 11 0 0 0DV1 3 0 22,000 22,000DV2 4 0 30,000 30,000DV3 5 0 50,000 50,000DV4 9 0 96,000 96,000DV4S 1 0 0 0DVHS 4 0 869,400 869,400DVHSS 1 0 206,250 206,250EX-XN 3 0 113,630 113,630EX-XV 1 0 1,922,630 1,922,630EX366 1 0 460 460LVE 1 22,280 0 22,280
Totals 22,280 3,310,370 3,332,650
Page 102 of 204MV1/504041 True Automation, Inc.
Page 115
HUNT County As of Certification2018 CERTIFIED TOTALSMV1 - VERANDAH MUNICIPAL UTILITY DISTRICT
Grand TotalsProperty Count: 615 8/28/2018 5:00:18PM
State Category Breakdown
State Code Description Count Market ValueAcres New Value Market
A SINGLE FAMILY RESIDENCE 535 $8,074,670 $104,470,349C1 VACANT LOTS AND LAND TRACTS 36 $0 $715,970D1 QUALIFIED AG LAND 1 $0 $5,2900.3780D2 NON-QUALIFIED LAND 1 $0 $29,600E FARM OR RANCH IMPROVEMENT 24 $0 $9,265,960713.4893F1 COMMERCIAL REAL PROPERTY 1 $0 $2,000L1 COMMERCIAL PERSONAL PROPERTY 10 $0 $168,080O RESIDENTIAL INVENTORY 12 $430,370 $733,109X TOTALLY EXEMPT PROPERTY 6 $0 $2,059,000
Totals 713.8673 $8,505,040 $117,449,358
Page 103 of 204MV1/504041 True Automation, Inc.
Page 116
HUNT County As of Certification2018 CERTIFIED TOTALSMV1 - VERANDAH MUNICIPAL UTILITY DISTRICT
Property Count: 615 8/28/2018 5:00:18PMEffective Rate Assumption
New Value
TOTAL NEW VALUE MARKET: $8,505,040TOTAL NEW VALUE TAXABLE: $8,505,040
New Exemptions
Exemption Description Count
ABSOLUTE EXEMPTIONS VALUE LOSS
Exemption Description Count Exemption Amount$15,0002Disabled Veterans 30% - 49%DV2$20,0002Disabled Veterans 50% - 69%DV3$12,0001Disabled Veterans 70% - 100%DV4
$176,9301Disabled Veteran HomesteadDVHS6PARTIAL EXEMPTIONS VALUE LOSS $223,930
NEW EXEMPTIONS VALUE LOSS $223,930
Increased Exemptions
Increased Exemption_AmountCountDescriptionExemption
INCREASED EXEMPTIONS VALUE LOSS
TOTAL EXEMPTIONS VALUE LOSS $223,930
New Ag / Timber Exemptions
New Annexations
New DeannexationsTaxable ValueMarket ValueCount
1 $13,000 $350
Average Homestead Value
Category A and E
Count of HS Residences Average TaxableAverage HS ExemptionAverage Market
339 $201,593$904$202,497Category A Only
Count of HS Residences Average TaxableAverage HS ExemptionAverage Market
339 $201,593$904$202,497
Page 105 of 204MV1/504041 True Automation, Inc.
Page 117
HUNT County As of Certification2018 CERTIFIED TOTALSSBH - BOLES ISD
Grand TotalsProperty Count: 448 4:59:45PM8/28/2018
Land ValueHomesite: 3,170,910Non Homesite: 9,087,680Ag Market: 10,401,950Timber Market: 22,660,540Total Land (+)0
Improvement Value
Homesite: 16,442,882Non Homesite: 15,116,058 Total Improvements (+) 31,558,940
Non Real ValueCount
Personal Property: 21 687,430Mineral Property: 0 0Autos: 0 0 Total Non Real (+) 687,430
Market Value = 54,906,910ExemptAg Non Exempt
10,401,950 0Total Productivity Market:Ag Use: 268,680 0 10,133,270(-)Productivity LossTimber Use: 0 0 =Appraised Value 44,773,640Productivity Loss: 010,133,270
1,459,225(-)Homestead Cap
=Assessed Value 43,314,415
(-)Total Exemptions Amount(Breakdown on Next Page)
24,357,787
=Net Taxable 18,956,628
Freeze Assessed Taxable Actual Tax Ceiling Count
1,051,994 692,063 8,850.88 9,258.65 13DP3,297,407 1,985,294 18,825.84 20,431.59 42OV65
Total 4,349,401 2,677,357 29,690.24 Freeze Taxable (-)27,676.72 55 2,677,357Tax Rate 1.542940
= 16,279,271Freeze Adjusted Taxable
APPROXIMATE LEVY = (FREEZE ADJUSTED TAXABLE * (TAX RATE / 100)) + ACTUAL TAX278,856.10 = 16,279,271 * (1.542940 / 100) + 27,676.72
Tax Increment Finance Value: 0Tax Increment Finance Levy: 0.00
Page 107 of 204SBH/395132 True Automation, Inc.
Page 118
HUNT County As of Certification2018 CERTIFIED TOTALSSBH - BOLES ISD
Exemption Breakdown
StateLocalExemption Count Total
8/28/2018 5:00:18PMProperty Count: 448 Grand Totals
DP 13 0 82,211 82,211DV1 1 0 5,000 5,000DV3 1 0 12,000 12,000DV4 8 0 51,772 51,772DVHS 4 0 414,014 414,014DVHSS 1 0 127,855 127,855EX-XV 37 0 19,994,160 19,994,160EX366 2 0 190 190HS 152 0 3,329,827 3,329,827OV65 46 0 330,758 330,758OV65S 1 0 10,000 10,000
Totals 0 24,357,787 24,357,787
Page 108 of 204SBH/395132 True Automation, Inc.
Page 119
HUNT County As of Certification2018 CERTIFIED TOTALSSBH - BOLES ISD
Grand TotalsProperty Count: 448 8/28/2018 5:00:18PM
State Category Breakdown
State Code Description Count Market ValueAcres New Value Market
A SINGLE FAMILY RESIDENCE 154 $0 $11,207,070C1 VACANT LOTS AND LAND TRACTS 35 $0 $569,510D1 QUALIFIED AG LAND 114 $0 $10,401,9502,953.6418D2 NON-QUALIFIED LAND 30 $21,730 $510,688E FARM OR RANCH IMPROVEMENT 118 $347,280 $11,112,122396.2465F1 COMMERCIAL REAL PROPERTY 1 $0 $6,530J3 ELECTRIC COMPANY (INCLUDING CO-OP 2 $0 $526,900J4 TELEPHONE COMPANY (INCLUDING CO- 1 $0 $44,980J5 RAILROAD 1 $0 $7,860J6 PIPELAND COMPANY 1 $0 $2,180J7 CABLE TELEVISION COMPANY 2 $0 $33,800L1 COMMERCIAL PERSONAL PROPERTY 11 $0 $49,380M1 TANGIBLE OTHER PERSONAL, MOBILE H 19 $0 $439,590S SPECIAL INVENTORY TAX 1 $0 $0X TOTALLY EXEMPT PROPERTY 39 $0 $19,994,350
Totals 3,349.8883 $369,010 $54,906,910
Page 109 of 204SBH/395132 True Automation, Inc.
Page 120
HUNT County As of Certification2018 CERTIFIED TOTALSSBH - BOLES ISD
Property Count: 448 8/28/2018 5:00:18PMEffective Rate Assumption
New Value
TOTAL NEW VALUE MARKET: $369,010TOTAL NEW VALUE TAXABLE: $369,010
New Exemptions
Exemption Description Count
ABSOLUTE EXEMPTIONS VALUE LOSS
Exemption Description Count Exemption Amount$198,6801Disabled Veteran HomesteadDVHS$127,8551Disabled Veteran Homestead Surviving SpouseDVHSS$94,6605HomesteadHS$40,0004Over 65OV65
11PARTIAL EXEMPTIONS VALUE LOSS $461,195NEW EXEMPTIONS VALUE LOSS $461,195
Increased Exemptions
Increased Exemption_AmountCountDescriptionExemption
INCREASED EXEMPTIONS VALUE LOSS
TOTAL EXEMPTIONS VALUE LOSS $461,195
New Ag / Timber Exemptions
2017 Market Value Count: 1$36,7742018 Ag/Timber Use $270
$36,504NEW AG / TIMBER VALUE LOSS
New Annexations
New Deannexations
Average Homestead Value
Category A and E
Count of HS Residences Average TaxableAverage HS ExemptionAverage Market
147 $68,765$31,861$100,626Category A Only
Count of HS Residences Average TaxableAverage HS ExemptionAverage Market
85 $66,165$30,619$96,784
Page 111 of 204SBH/395132 True Automation, Inc.
Page 121
HUNT County As of Certification2018 CERTIFIED TOTALSSBL - BLAND ISD
Grand TotalsProperty Count: 2,613 4:59:45PM8/28/2018
Land ValueHomesite: 18,594,229Non Homesite: 27,701,582Ag Market: 103,111,106Timber Market: 149,406,917Total Land (+)0
Improvement Value
Homesite: 137,289,189Non Homesite: 48,883,072 Total Improvements (+) 186,172,261
Non Real ValueCount
Personal Property: 88 26,556,041Mineral Property: 0 0Autos: 0 0 Total Non Real (+) 26,556,041
Market Value = 362,135,219ExemptAg Non Exempt
102,966,046 145,060Total Productivity Market:Ag Use: 2,781,171 2,040 100,184,875(-)Productivity LossTimber Use: 0 0 =Appraised Value 261,950,344Productivity Loss: 143,020100,184,875
8,628,951(-)Homestead Cap
=Assessed Value 253,321,393
(-)Total Exemptions Amount(Breakdown on Next Page)
55,263,142
=Net Taxable 198,058,251
Freeze Assessed Taxable Actual Tax Ceiling Count
2,914,680 1,817,782 15,640.40 16,337.64 32DP25,615,005 17,551,656 140,396.94 141,412.68 261OV65
Total 28,529,685 19,369,438 157,750.32 Freeze Taxable (-)156,037.34 293 19,369,438Tax Rate 1.427100
Transfer Assessed Taxable Post % Taxable Adjustment CountOV65 194,840 159,840 87,305 72,535 2Total 194,840 159,840 87,305 Transfer Adjustment (-)72,535 72,5352
= 178,616,278Freeze Adjusted Taxable
APPROXIMATE LEVY = (FREEZE ADJUSTED TAXABLE * (TAX RATE / 100)) + ACTUAL TAX2,705,070.24 = 178,616,278 * (1.427100 / 100) + 156,037.34
Tax Increment Finance Value: 0Tax Increment Finance Levy: 0.00
Page 113 of 204SBL/395133 True Automation, Inc.
Page 122
HUNT County As of Certification2018 CERTIFIED TOTALSSBL - BLAND ISD
Exemption Breakdown
StateLocalExemption Count Total
8/28/2018 5:00:18PMProperty Count: 2,613 Grand Totals
AB 1 0 0 0DP 34 0 300,000 300,000DV1 3 0 29,000 29,000DV1S 1 0 5,000 5,000DV2 8 0 64,500 64,500DV3 3 0 30,000 30,000DV4 18 0 118,309 118,309DV4S 3 0 14,830 14,830DVHS 18 0 2,402,751 2,402,751DVHSS 1 0 194,190 194,190EX-XN 5 0 254,660 254,660EX-XR 7 0 1,280,300 1,280,300EX-XV 41 0 28,867,201 28,867,201EX-XV (Prorated) 2 0 299,696 299,696EX366 3 0 1,160 1,160HS 851 0 19,109,911 19,109,911LVE 1 24,050 0 24,050OV65 284 0 2,237,584 2,237,584OV65S 3 0 30,000 30,000
Totals 24,050 55,239,092 55,263,142
Page 114 of 204SBL/395133 True Automation, Inc.
Page 123
HUNT County As of Certification2018 CERTIFIED TOTALSSBL - BLAND ISD
Grand TotalsProperty Count: 2,613 8/28/2018 5:00:18PM
State Category Breakdown
State Code Description Count Market ValueAcres New Value Market
A SINGLE FAMILY RESIDENCE 502 $5,480,010 $57,660,659B MULTIFAMILY RESIDENCE 3 $0 $492,580C1 VACANT LOTS AND LAND TRACTS 154 $0 $3,298,310D1 QUALIFIED AG LAND 999 $0 $102,966,04626,671.7452D2 NON-QUALIFIED LAND 356 $272,910 $4,967,078E FARM OR RANCH IMPROVEMENT 1,191 $4,259,090 $126,292,7794,625.9661F1 COMMERCIAL REAL PROPERTY 31 $307,720 $6,468,490J3 ELECTRIC COMPANY (INCLUDING CO-OP 7 $0 $7,553,950J4 TELEPHONE COMPANY (INCLUDING CO- 9 $0 $1,264,620J5 RAILROAD 11 $0 $2,487,690J6 PIPELAND COMPANY 5 $0 $2,041,310J7 CABLE TELEVISION COMPANY 3 $0 $20,330L1 COMMERCIAL PERSONAL PROPERTY 54 $0 $12,916,630M1 TANGIBLE OTHER PERSONAL, MOBILE H 79 $318,530 $2,917,710O RESIDENTIAL INVENTORY 3 $0 $54,910S SPECIAL INVENTORY TAX 3 $0 $5,060X TOTALLY EXEMPT PROPERTY 59 $0 $30,727,067
Totals 31,297.7113 $10,638,260 $362,135,219
Page 115 of 204SBL/395133 True Automation, Inc.
Page 124
HUNT County As of Certification2018 CERTIFIED TOTALSSBL - BLAND ISD
Property Count: 2,613 8/28/2018 5:00:18PMEffective Rate Assumption
New Value
TOTAL NEW VALUE MARKET: $10,638,260TOTAL NEW VALUE TAXABLE: $10,369,400
New Exemptions
Exemption Description CountEX-XV Other Exemptions (including public property, r 2 2017 Market Value $260,000EX366 HB366 Exempt 2 2017 Market Value $0
ABSOLUTE EXEMPTIONS VALUE LOSS $260,000
Exemption Description Count Exemption Amount$10,0001DisabilityDP$5,0001Disabled Veterans 10% - 29%DV1$7,5001Disabled Veterans 30% - 49%DV2
$01Disabled Veterans 70% - 100%DV4$346,5293Disabled Veteran HomesteadDVHS$194,1901Disabled Veteran Homestead Surviving SpouseDVHSS$752,10434HomesteadHS$117,16815Over 65OV65$10,0001OV65 Surviving SpouseOV65S
58PARTIAL EXEMPTIONS VALUE LOSS $1,442,491NEW EXEMPTIONS VALUE LOSS $1,702,491
Increased Exemptions
Increased Exemption_AmountCountDescriptionExemption
INCREASED EXEMPTIONS VALUE LOSS
TOTAL EXEMPTIONS VALUE LOSS $1,702,491
New Ag / Timber Exemptions
2017 Market Value Count: 11$362,8252018 Ag/Timber Use $8,940
$353,885NEW AG / TIMBER VALUE LOSS
New Annexations
New Deannexations
Average Homestead Value
Category A and E
Count of HS Residences Average TaxableAverage HS ExemptionAverage Market
825 $98,147$32,545$130,692Category A Only
Count of HS Residences Average TaxableAverage HS ExemptionAverage Market
230 $107,019$34,268$141,287
Page 117 of 204SBL/395133 True Automation, Inc.
Page 125
HUNT County As of Certification2018 CERTIFIED TOTALSSCA - CAMPBELL ISD
Grand TotalsProperty Count: 2,210 4:59:45PM8/28/2018
Land ValueHomesite: 9,461,903Non Homesite: 15,917,124Ag Market: 75,272,678Timber Market: 100,651,705Total Land (+)0
Improvement Value
Homesite: 74,552,737Non Homesite: 26,489,788 Total Improvements (+) 101,042,525
Non Real ValueCount
Personal Property: 108 14,432,370Mineral Property: 0 0Autos: 0 0 Total Non Real (+) 14,432,370
Market Value = 216,126,600ExemptAg Non Exempt
75,272,678 0Total Productivity Market:Ag Use: 1,897,570 0 73,375,108(-)Productivity LossTimber Use: 0 0 =Appraised Value 142,751,492Productivity Loss: 073,375,108
963,341(-)Homestead Cap
=Assessed Value 141,788,151
(-)Total Exemptions Amount(Breakdown on Next Page)
35,271,039
=Net Taxable 106,517,112
Freeze Assessed Taxable Actual Tax Ceiling Count
1,379,226 746,807 5,676.74 5,964.83 23DP25,123,485 16,416,596 103,209.22 106,569.16 273OV65
Total 26,502,711 17,163,403 112,533.99 Freeze Taxable (-)108,885.96 296 17,163,403Tax Rate 1.040000
Transfer Assessed Taxable Post % Taxable Adjustment CountOV65 414,050 309,050 216,414 92,636 3Total 414,050 309,050 216,414 Transfer Adjustment (-)92,636 92,6363
= 89,261,073Freeze Adjusted Taxable
APPROXIMATE LEVY = (FREEZE ADJUSTED TAXABLE * (TAX RATE / 100)) + ACTUAL TAX1,037,201.12 = 89,261,073 * (1.040000 / 100) + 108,885.96
Tax Increment Finance Value: 0Tax Increment Finance Levy: 0.00
Page 119 of 204SCA/395134 True Automation, Inc.
Page 126
HUNT County As of Certification2018 CERTIFIED TOTALSSCA - CAMPBELL ISD
Exemption Breakdown
StateLocalExemption Count Total
8/28/2018 5:00:18PMProperty Count: 2,210 Grand Totals
DP 24 0 164,000 164,000DV1 3 0 22,000 22,000DV2 2 0 14,044 14,044DV3 2 0 20,000 20,000DV4 23 0 212,594 212,594DV4S 3 0 5,580 5,580DVHS 13 0 700,594 700,594DVHSS 4 0 111,280 111,280EX-XN 4 0 118,960 118,960EX-XR 9 0 1,657,230 1,657,230EX-XV 67 0 15,241,440 15,241,440EX366 9 0 2,270 2,270HS 662 0 14,580,152 14,580,152LVE 1 34,080 0 34,080OV65 290 0 2,338,585 2,338,585PC 2 48,230 0 48,230
Totals 82,310 35,188,729 35,271,039
Page 120 of 204SCA/395134 True Automation, Inc.
Page 127
HUNT County As of Certification2018 CERTIFIED TOTALSSCA - CAMPBELL ISD
Grand TotalsProperty Count: 2,210 8/28/2018 5:00:18PM
State Category Breakdown
State Code Description Count Market ValueAcres New Value Market
A SINGLE FAMILY RESIDENCE 125 $426,960 $6,063,520B MULTIFAMILY RESIDENCE 1 $0 $86,750C1 VACANT LOTS AND LAND TRACTS 85 $0 $830,270D1 QUALIFIED AG LAND 990 $0 $75,272,67823,995.0274D2 NON-QUALIFIED LAND 384 $129,630 $5,508,159E FARM OR RANCH IMPROVEMENT 1,160 $2,156,690 $95,046,2333,666.7861F1 COMMERCIAL REAL PROPERTY 27 $0 $2,338,870J2 GAS DISTRIBUTION SYSTEM 2 $0 $288,010J3 ELECTRIC COMPANY (INCLUDING CO-OP 3 $0 $1,487,970J4 TELEPHONE COMPANY (INCLUDING CO- 13 $0 $1,302,980J5 RAILROAD 18 $0 $3,107,330J6 PIPELAND COMPANY 18 $0 $4,314,950J7 CABLE TELEVISION COMPANY 6 $0 $153,140L1 COMMERCIAL PERSONAL PROPERTY 48 $0 $2,115,700M1 TANGIBLE OTHER PERSONAL, MOBILE H 56 $38,920 $1,094,530S SPECIAL INVENTORY TAX 2 $0 $61,530X TOTALLY EXEMPT PROPERTY 90 $0 $17,053,980
Totals 27,661.8135 $2,752,200 $216,126,600
Page 121 of 204SCA/395134 True Automation, Inc.
Page 128
HUNT County As of Certification2018 CERTIFIED TOTALSSCA - CAMPBELL ISD
Property Count: 2,210 8/28/2018 5:00:18PMEffective Rate Assumption
New Value
TOTAL NEW VALUE MARKET: $2,752,200TOTAL NEW VALUE TAXABLE: $2,632,110
New Exemptions
Exemption Description CountEX-XN 11.252 Motor vehicles leased for personal use 1 2017 Market Value $52,940EX366 HB366 Exempt 2 2017 Market Value $2,730
ABSOLUTE EXEMPTIONS VALUE LOSS $55,670
Exemption Description Count Exemption Amount$13,8782Disabled Veterans 70% - 100%DV4$80,9541Disabled Veteran HomesteadDVHS
$356,75018HomesteadHS$80,0009Over 65OV65
30PARTIAL EXEMPTIONS VALUE LOSS $531,582NEW EXEMPTIONS VALUE LOSS $587,252
Increased Exemptions
Increased Exemption_AmountCountDescriptionExemption
INCREASED EXEMPTIONS VALUE LOSS
TOTAL EXEMPTIONS VALUE LOSS $587,252
New Ag / Timber Exemptions
2017 Market Value Count: 4$370,3382018 Ag/Timber Use $11,140
$359,198NEW AG / TIMBER VALUE LOSS
New Annexations
New Deannexations
Average Homestead Value
Category A and E
Count of HS Residences Average TaxableAverage HS ExemptionAverage Market
641 $76,221$23,719$99,940Category A Only
Count of HS Residences Average TaxableAverage HS ExemptionAverage Market
43 $47,521$24,179$71,700
Page 123 of 204SCA/395134 True Automation, Inc.
Page 129
HUNT County As of Certification2018 CERTIFIED TOTALSSCL - CELESTE ISD
Grand TotalsProperty Count: 2,367 4:59:45PM8/28/2018
Land ValueHomesite: 9,649,580Non Homesite: 15,789,912Ag Market: 129,517,560Timber Market: 154,957,052Total Land (+)0
Improvement Value
Homesite: 86,579,702Non Homesite: 32,155,173 Total Improvements (+) 118,734,875
Non Real ValueCount
Personal Property: 115 13,043,182Mineral Property: 0 0Autos: 0 0 Total Non Real (+) 13,043,182
Market Value = 286,735,109ExemptAg Non Exempt
129,175,710 341,850Total Productivity Market:Ag Use: 3,435,190 11,070 125,740,520(-)Productivity LossTimber Use: 0 0 =Appraised Value 160,994,589Productivity Loss: 330,780125,740,520
3,040,584(-)Homestead Cap
=Assessed Value 157,954,005
(-)Total Exemptions Amount(Breakdown on Next Page)
41,624,278
=Net Taxable 116,329,727
Freeze Assessed Taxable Actual Tax Ceiling Count
1,445,712 745,413 7,068.76 7,160.55 29DP25,062,860 16,464,911 149,536.51 150,991.87 250OV65
Total 26,508,572 17,210,324 158,152.42 Freeze Taxable (-)156,605.27 279 17,210,324Tax Rate 1.460600
Transfer Assessed Taxable Post % Taxable Adjustment CountOV65 281,370 144,860 120,256 24,604 5Total 281,370 144,860 120,256 Transfer Adjustment (-)24,604 24,6045
= 99,094,799Freeze Adjusted Taxable
APPROXIMATE LEVY = (FREEZE ADJUSTED TAXABLE * (TAX RATE / 100)) + ACTUAL TAX1,603,983.90 = 99,094,799 * (1.460600 / 100) + 156,605.27
Tax Increment Finance Value: 0Tax Increment Finance Levy: 0.00
Page 125 of 204SCL/395135 True Automation, Inc.
Page 130
HUNT County As of Certification2018 CERTIFIED TOTALSSCL - CELESTE ISD
Exemption Breakdown
StateLocalExemption Count Total
8/28/2018 5:00:18PMProperty Count: 2,367 Grand Totals
DP 35 0 205,408 205,408DV1 6 0 44,000 44,000DV3 4 0 42,000 42,000DV4 23 0 199,965 199,965DV4S 7 0 25,320 25,320DVHS 14 0 977,883 977,883DVHSS 6 0 496,060 496,060EX-XG 1 0 42,550 42,550EX-XN 5 0 241,490 241,490EX-XR 6 0 1,799,592 1,799,592EX-XU 1 0 43,120 43,120EX-XV 125 0 19,634,030 19,634,030EX366 14 0 2,830 2,830FR 1 0 0 0HS 682 0 15,507,979 15,507,979LVE 1 69,690 0 69,690OV65 268 0 2,242,981 2,242,981OV65S 3 0 10,000 10,000PC 4 39,380 0 39,380
Totals 109,070 41,515,208 41,624,278
Page 126 of 204SCL/395135 True Automation, Inc.
Page 131
HUNT County As of Certification2018 CERTIFIED TOTALSSCL - CELESTE ISD
Grand TotalsProperty Count: 2,367 8/28/2018 5:00:18PM
State Category Breakdown
State Code Description Count Market ValueAcres New Value Market
A SINGLE FAMILY RESIDENCE 373 $234,340 $26,446,036B MULTIFAMILY RESIDENCE 1 $0 $100,000C1 VACANT LOTS AND LAND TRACTS 95 $0 $813,680D1 QUALIFIED AG LAND 1,084 $0 $129,175,71040,240.8566D2 NON-QUALIFIED LAND 364 $54,920 $4,850,367E FARM OR RANCH IMPROVEMENT 872 $1,738,880 $85,830,4143,236.8352F1 COMMERCIAL REAL PROPERTY 40 $0 $3,276,020F2 INDUSTRIAL REAL PROPERTY 1 $0 $723,950J2 GAS DISTRIBUTION SYSTEM 1 $0 $494,090J3 ELECTRIC COMPANY (INCLUDING CO-OP 4 $0 $4,260,980J4 TELEPHONE COMPANY (INCLUDING CO- 10 $0 $1,033,610J5 RAILROAD 8 $0 $228,240J6 PIPELAND COMPANY 18 $0 $3,364,090J7 CABLE TELEVISION COMPANY 3 $0 $153,730L1 COMMERCIAL PERSONAL PROPERTY 53 $0 $2,596,450M1 TANGIBLE OTHER PERSONAL, MOBILE H 39 $362,220 $1,526,230S SPECIAL INVENTORY TAX 1 $0 $28,210X TOTALLY EXEMPT PROPERTY 153 $199,240 $21,833,302
Totals 43,477.6918 $2,589,600 $286,735,109
Page 127 of 204SCL/395135 True Automation, Inc.
Page 132
HUNT County As of Certification2018 CERTIFIED TOTALSSCL - CELESTE ISD
Property Count: 2,367 8/28/2018 5:00:18PMEffective Rate Assumption
New Value
TOTAL NEW VALUE MARKET: $2,589,600TOTAL NEW VALUE TAXABLE: $2,339,600
New Exemptions
Exemption Description CountEX-XN 11.252 Motor vehicles leased for personal use 1 2017 Market Value $22,040EX-XV Other Exemptions (including public property, r 1 2017 Market Value $0EX366 HB366 Exempt 1 2017 Market Value $0
ABSOLUTE EXEMPTIONS VALUE LOSS $22,040
Exemption Description Count Exemption Amount$13,6922DisabilityDP
$425,00018HomesteadHS$45,5105Over 65OV65
25PARTIAL EXEMPTIONS VALUE LOSS $484,202NEW EXEMPTIONS VALUE LOSS $506,242
Increased Exemptions
Increased Exemption_AmountCountDescriptionExemption
INCREASED EXEMPTIONS VALUE LOSS
TOTAL EXEMPTIONS VALUE LOSS $506,242
New Ag / Timber Exemptions
2017 Market Value Count: 12$459,5932018 Ag/Timber Use $16,760
$442,833NEW AG / TIMBER VALUE LOSS
New Annexations
New Deannexations
Average Homestead Value
Category A and E
Count of HS Residences Average TaxableAverage HS ExemptionAverage Market
667 $85,673$27,176$112,849Category A Only
Count of HS Residences Average TaxableAverage HS ExemptionAverage Market
188 $62,716$26,148$88,864
Page 129 of 204SCL/395135 True Automation, Inc.
Page 133
HUNT County As of Certification2018 CERTIFIED TOTALSSCM - CADDO MILLS ISD
Grand TotalsProperty Count: 5,249 4:59:45PM8/28/2018
Land ValueHomesite: 59,277,350Non Homesite: 50,468,815Ag Market: 155,910,585Timber Market: 265,656,750Total Land (+)0
Improvement Value
Homesite: 365,728,639Non Homesite: 113,787,371 Total Improvements (+) 479,516,010
Non Real ValueCount
Personal Property: 366 95,308,616Mineral Property: 0 0Autos: 0 0 Total Non Real (+) 95,308,616
Market Value = 840,481,376ExemptAg Non Exempt
155,910,585 0Total Productivity Market:Ag Use: 3,537,726 0 152,372,859(-)Productivity LossTimber Use: 0 0 =Appraised Value 688,108,517Productivity Loss: 0152,372,859
15,801,774(-)Homestead Cap
=Assessed Value 672,306,743
(-)Total Exemptions Amount(Breakdown on Next Page)
131,141,843
=Net Taxable 541,164,900
Freeze Assessed Taxable Actual Tax Ceiling Count
7,272,077 5,044,174 50,934.41 51,191.23 73DP66,620,855 46,280,586 415,483.57 420,278.28 537OV65
Total 73,892,932 51,324,760 471,469.51 Freeze Taxable (-)466,417.98 610 51,324,760Tax Rate 1.455000
Transfer Assessed Taxable Post % Taxable Adjustment CountOV65 2,290,810 1,908,860 1,271,361 637,499 10Total 2,290,810 1,908,860 1,271,361 Transfer Adjustment (-)637,499 637,49910
= 489,202,641Freeze Adjusted Taxable
APPROXIMATE LEVY = (FREEZE ADJUSTED TAXABLE * (TAX RATE / 100)) + ACTUAL TAX7,584,316.41 = 489,202,641 * (1.455000 / 100) + 466,417.98
Tax Increment Finance Value: 0Tax Increment Finance Levy: 0.00
Page 131 of 204SCM/395136 True Automation, Inc.
Page 134
HUNT County As of Certification2018 CERTIFIED TOTALSSCM - CADDO MILLS ISD
Exemption Breakdown
StateLocalExemption Count Total
8/28/2018 5:00:18PMProperty Count: 5,249 Grand Totals
DP 76 0 630,453 630,453DV1 19 0 104,933 104,933DV2 13 0 99,000 99,000DV3 19 0 190,000 190,000DV4 50 0 479,321 479,321DV4S 4 0 42,647 42,647DVHS 31 0 6,033,883 6,033,883DVHSS 4 0 170,698 170,698EX-XG 1 0 166,700 166,700EX-XN 14 0 1,069,560 1,069,560EX-XR 8 0 2,809,132 2,809,132EX-XV 83 0 63,684,160 63,684,160EX366 10 0 2,330 2,330FRSS 1 0 100,901 100,901HS 1,974 0 46,152,169 46,152,169LVE 2 99,740 0 99,740OV65 592 2,419,144 5,171,472 7,590,616OV65S 3 15,000 30,000 45,000PC 6 1,670,600 0 1,670,600
Totals 4,204,484 126,937,359 131,141,843
Page 132 of 204SCM/395136 True Automation, Inc.
Page 135
HUNT County As of Certification2018 CERTIFIED TOTALSSCM - CADDO MILLS ISD
Grand TotalsProperty Count: 5,249 8/28/2018 5:00:18PM
State Category Breakdown
State Code Description Count Market ValueAcres New Value Market
A SINGLE FAMILY RESIDENCE 1,412 $20,903,190 $244,813,579B MULTIFAMILY RESIDENCE 8 $0 $1,924,739C1 VACANT LOTS AND LAND TRACTS 141 $0 $5,091,280D1 QUALIFIED AG LAND 1,247 $0 $155,910,58532,667.5519D2 NON-QUALIFIED LAND 355 $371,220 $5,634,870E FARM OR RANCH IMPROVEMENT 1,749 $8,559,490 $212,870,2055,282.3051F1 COMMERCIAL REAL PROPERTY 165 $2,332,790 $44,992,562F2 INDUSTRIAL REAL PROPERTY 11 $389,100 $3,331,270J2 GAS DISTRIBUTION SYSTEM 2 $0 $914,430J3 ELECTRIC COMPANY (INCLUDING CO-OP 5 $0 $4,393,230J4 TELEPHONE COMPANY (INCLUDING CO- 13 $0 $2,805,890J5 RAILROAD 23 $0 $138,100J6 PIPELAND COMPANY 16 $0 $9,831,320J7 CABLE TELEVISION COMPANY 5 $0 $142,820J8 OTHER TYPE OF UTILITY 1 $0 $2,390L1 COMMERCIAL PERSONAL PROPERTY 272 $0 $28,528,400L2 INDUSTRIAL PERSONAL PROPERTY 13 $0 $44,153,534M1 TANGIBLE OTHER PERSONAL, MOBILE H 83 $565,880 $3,660,290O RESIDENTIAL INVENTORY 517 $0 $1,775,340S SPECIAL INVENTORY TAX 18 $0 $1,734,920X TOTALLY EXEMPT PROPERTY 118 $0 $67,831,622
Totals 37,949.8570 $33,121,670 $840,481,376
Page 133 of 204SCM/395136 True Automation, Inc.
Page 136
HUNT County As of Certification2018 CERTIFIED TOTALSSCM - CADDO MILLS ISD
Property Count: 5,249 8/28/2018 5:00:18PMEffective Rate Assumption
New Value
TOTAL NEW VALUE MARKET: $33,121,670TOTAL NEW VALUE TAXABLE: $32,028,404
New Exemptions
Exemption Description CountEX-XN 11.252 Motor vehicles leased for personal use 2 2017 Market Value $171,190EX-XR 11.30 Nonprofit water or wastewater corporati 1 2017 Market Value $0EX366 HB366 Exempt 1 2017 Market Value $710
ABSOLUTE EXEMPTIONS VALUE LOSS $171,900
Exemption Description Count Exemption Amount$15,0003Disabled Veterans 10% - 29%DV1$7,5001Disabled Veterans 30% - 49%DV2
$10,0001Disabled Veterans 50% - 69%DV3$60,0005Disabled Veterans 70% - 100%DV4
$1,281,2128Disabled Veteran HomesteadDVHS$100,9011First Responder Surviving SpouseFRSS
$2,229,36898HomesteadHS$384,61432Over 65OV65
149PARTIAL EXEMPTIONS VALUE LOSS $4,088,595NEW EXEMPTIONS VALUE LOSS $4,260,495
Increased Exemptions
Increased Exemption_AmountCountDescriptionExemption
INCREASED EXEMPTIONS VALUE LOSS
TOTAL EXEMPTIONS VALUE LOSS $4,260,495
New Ag / Timber Exemptions
2017 Market Value Count: 10$787,0042018 Ag/Timber Use $13,700
$773,304NEW AG / TIMBER VALUE LOSS
New Annexations
New Deannexations
Average Homestead Value
Category A and E
Count of HS Residences Average TaxableAverage HS ExemptionAverage Market
1,939 $140,430$31,354$171,784Category A Only
Count of HS Residences Average TaxableAverage HS ExemptionAverage Market
946 $167,413$30,426$197,839
Page 135 of 204SCM/395136 True Automation, Inc.
Page 137
HUNT County As of Certification2018 CERTIFIED TOTALSSCO - COMMERCE ISD
Grand TotalsProperty Count: 6,418 4:59:45PM8/28/2018
Land ValueHomesite: 25,854,512Non Homesite: 56,802,801Ag Market: 155,612,568Timber Market: 238,269,881Total Land (+)0
Improvement Value
Homesite: 212,731,508Non Homesite: 697,775,285 Total Improvements (+) 910,506,793
Non Real ValueCount
Personal Property: 464 365,458,163Mineral Property: 0 0Autos: 0 0 Total Non Real (+) 365,458,163
Market Value = 1,514,234,837ExemptAg Non Exempt
155,612,568 0Total Productivity Market:Ag Use: 6,014,600 0 149,597,968(-)Productivity LossTimber Use: 0 0 =Appraised Value 1,364,636,869Productivity Loss: 0149,597,968
3,820,764(-)Homestead Cap
=Assessed Value 1,360,816,105
(-)Total Exemptions Amount(Breakdown on Next Page)
881,334,227
=Net Taxable 479,481,878
Freeze Assessed Taxable Actual Tax Ceiling Count
4,081,555 2,150,083 23,841.19 24,084.42 60DP64,700,045 42,707,005 425,712.77 428,267.03 620OV65
Total 68,781,600 44,857,088 452,351.45 Freeze Taxable (-)449,553.96 680 44,857,088Tax Rate 1.561000
Transfer Assessed Taxable Post % Taxable Adjustment CountDP 103,650 68,650 28,140 40,510 1OV65 542,300 402,300 314,567 87,733 4Total 645,950 470,950 342,707 Transfer Adjustment (-)128,243 128,2435
= 434,496,547Freeze Adjusted Taxable
APPROXIMATE LEVY = (FREEZE ADJUSTED TAXABLE * (TAX RATE / 100)) + ACTUAL TAX7,232,045.06 = 434,496,547 * (1.561000 / 100) + 449,553.96
Tax Increment Finance Value: 0Tax Increment Finance Levy: 0.00
Page 137 of 204SCO/395137 True Automation, Inc.
Page 138
HUNT County As of Certification2018 CERTIFIED TOTALSSCO - COMMERCE ISD
Exemption Breakdown
StateLocalExemption Count Total
8/28/2018 5:00:18PMProperty Count: 6,418 Grand Totals
AB 3 0 0 0CHODO (Partial) 1 1,267,740 0 1,267,740DP 65 0 549,107 549,107DV1 3 0 15,000 15,000DV2 9 0 49,100 49,100DV3 7 0 65,003 65,003DV4 39 0 291,364 291,364DV4S 9 0 74,234 74,234DVHS 28 0 2,555,427 2,555,427DVHSS 7 0 374,426 374,426EX-XG 2 0 190,330 190,330EX-XI 1 0 4,830 4,830EX-XJ 1 0 70,000 70,000EX-XL 1 0 81,760 81,760EX-XN 9 0 748,760 748,760EX-XR 17 0 1,658,142 1,658,142EX-XV 384 0 821,593,735 821,593,735EX-XV (Prorated) 21 0 265,283 265,283EX366 22 0 4,390 4,390FR 6 5,470,422 0 5,470,422HS 1,602 0 37,720,397 37,720,397LVE 3 882,820 0 882,820OV65 654 0 5,749,134 5,749,134OV65S 7 0 69,846 69,846PC 6 1,582,977 0 1,582,977
Totals 9,203,959 872,130,268 881,334,227
Page 138 of 204SCO/395137 True Automation, Inc.
Page 139
HUNT County As of Certification2018 CERTIFIED TOTALSSCO - COMMERCE ISD
Grand TotalsProperty Count: 6,418 8/28/2018 5:00:18PM
State Category Breakdown
State Code Description Count Market ValueAcres New Value Market
A SINGLE FAMILY RESIDENCE 1,703 $1,654,620 $129,158,372B MULTIFAMILY RESIDENCE 142 $105,150 $40,777,232C1 VACANT LOTS AND LAND TRACTS 621 $0 $5,822,239D1 QUALIFIED AG LAND 1,658 $0 $155,612,56858,992.7712D2 NON-QUALIFIED LAND 512 $48,750 $6,509,426E FARM OR RANCH IMPROVEMENT 1,698 $1,989,790 $139,575,0636,249.7819F1 COMMERCIAL REAL PROPERTY 271 $886,960 $62,273,865F2 INDUSTRIAL REAL PROPERTY 18 $1,864,300 $25,233,906J2 GAS DISTRIBUTION SYSTEM 5 $0 $2,942,230J3 ELECTRIC COMPANY (INCLUDING CO-OP 7 $0 $12,993,050J4 TELEPHONE COMPANY (INCLUDING CO- 22 $0 $2,751,990J5 RAILROAD 6 $0 $569,540J6 PIPELAND COMPANY 28 $0 $8,571,780J7 CABLE TELEVISION COMPANY 10 $0 $1,524,460L1 COMMERCIAL PERSONAL PROPERTY 338 $0 $45,864,866L2 INDUSTRIAL PERSONAL PROPERTY 15 $0 $41,965,090M1 TANGIBLE OTHER PERSONAL, MOBILE H 110 $188,210 $2,327,130O RESIDENTIAL INVENTORY 14 $0 $242,240S SPECIAL INVENTORY TAX 10 $0 $2,752,000X TOTALLY EXEMPT PROPERTY 462 $28,110 $826,767,790
Totals 65,242.5531 $6,765,890 $1,514,234,837
Page 139 of 204SCO/395137 True Automation, Inc.
Page 140
HUNT County As of Certification2018 CERTIFIED TOTALSSCO - COMMERCE ISD
Property Count: 6,418 8/28/2018 5:00:18PMEffective Rate Assumption
New Value
TOTAL NEW VALUE MARKET: $6,765,890TOTAL NEW VALUE TAXABLE: $6,642,445
New Exemptions
Exemption Description CountEX-XL 11.231 Organizations Providing Economic Deve 1 2017 Market Value $48,370EX-XN 11.252 Motor vehicles leased for personal use 1 2017 Market Value $0EX-XV Other Exemptions (including public property, r 11 2017 Market Value $138,180EX366 HB366 Exempt 3 2017 Market Value $1,130
ABSOLUTE EXEMPTIONS VALUE LOSS $187,680
Exemption Description Count Exemption Amount$20,0002DisabilityDP$10,0002Disabled Veterans 10% - 29%DV1
$2101Disabled Veterans 70% - 100%DV4$305,7403Disabled Veteran HomesteadDVHS$683,83034HomesteadHS$95,24917Over 65OV65
59PARTIAL EXEMPTIONS VALUE LOSS $1,115,029NEW EXEMPTIONS VALUE LOSS $1,302,709
Increased Exemptions
Increased Exemption_AmountCountDescriptionExemption
INCREASED EXEMPTIONS VALUE LOSS
TOTAL EXEMPTIONS VALUE LOSS $1,302,709
New Ag / Timber Exemptions
2017 Market Value Count: 10$491,2692018 Ag/Timber Use $15,040
$476,229NEW AG / TIMBER VALUE LOSS
New Annexations
New Deannexations
Average Homestead Value
Category A and E
Count of HS Residences Average TaxableAverage HS ExemptionAverage Market
1,575 $78,800$25,955$104,755Category A Only
Count of HS Residences Average TaxableAverage HS ExemptionAverage Market
802 $71,016$25,468$96,484
Page 141 of 204SCO/395137 True Automation, Inc.
Page 141
HUNT County As of Certification2018 CERTIFIED TOTALSSCP - COOPER ISD
Grand TotalsProperty Count: 69 4:59:45PM8/28/2018
Land ValueHomesite: 286,190Non Homesite: 346,620Ag Market: 4,002,096Timber Market: 4,634,906Total Land (+)0
Improvement Value
Homesite: 1,313,190Non Homesite: 58,320 Total Improvements (+) 1,371,510
Non Real ValueCount
Personal Property: 8 634,780Mineral Property: 0 0Autos: 0 0 Total Non Real (+) 634,780
Market Value = 6,641,196ExemptAg Non Exempt
4,002,096 0Total Productivity Market:Ag Use: 255,600 0 3,746,496(-)Productivity LossTimber Use: 0 0 =Appraised Value 2,894,700Productivity Loss: 03,746,496
52,671(-)Homestead Cap
=Assessed Value 2,842,029
(-)Total Exemptions Amount(Breakdown on Next Page)
373,540
=Net Taxable 2,468,489
Freeze Assessed Taxable Actual Tax Ceiling Count
28,870 0 0.00 0.00 1DP461,410 323,410 3,595.87 3,595.87 4OV65
Total 490,280 323,410 3,595.87 Freeze Taxable (-)3,595.87 5 323,410Tax Rate 1.470000
= 2,145,079Freeze Adjusted Taxable
APPROXIMATE LEVY = (FREEZE ADJUSTED TAXABLE * (TAX RATE / 100)) + ACTUAL TAX35,128.53 = 2,145,079 * (1.470000 / 100) + 3,595.87
Tax Increment Finance Value: 0Tax Increment Finance Levy: 0.00
Page 143 of 204SCP/395138 True Automation, Inc.
Page 142
HUNT County As of Certification2018 CERTIFIED TOTALSSCP - COOPER ISD
Exemption Breakdown
StateLocalExemption Count Total
8/28/2018 5:00:18PMProperty Count: 69 Grand Totals
DP 1 0 3,870 3,870EX-XR 1 0 250 250EX366 5 0 640 640HS 14 0 325,000 325,000OV65 6 0 43,730 43,730PC 2 50 0 50
Totals 50 373,490 373,540
Page 144 of 204SCP/395138 True Automation, Inc.
Page 143
HUNT County As of Certification2018 CERTIFIED TOTALSSCP - COOPER ISD
Grand TotalsProperty Count: 69 8/28/2018 5:00:18PM
State Category Breakdown
State Code Description Count Market ValueAcres New Value Market
C1 VACANT LOTS AND LAND TRACTS 3 $0 $22,780D1 QUALIFIED AG LAND 33 $0 $4,002,0961,766.2439D2 NON-QUALIFIED LAND 5 $0 $19,800E FARM OR RANCH IMPROVEMENT 28 $0 $1,898,860173.7330J3 ELECTRIC COMPANY (INCLUDING CO-OP 1 $0 $27,090J4 TELEPHONE COMPANY (INCLUDING CO- 1 $0 $2,320J6 PIPELAND COMPANY 1 $0 $604,680M1 TANGIBLE OTHER PERSONAL, MOBILE H 2 $0 $62,630X TOTALLY EXEMPT PROPERTY 6 $0 $940
Totals 1,939.9769 $0 $6,641,196
Page 145 of 204SCP/395138 True Automation, Inc.
Page 144
HUNT County As of Certification2018 CERTIFIED TOTALSSCP - COOPER ISD
Property Count: 69 8/28/2018 5:00:18PMEffective Rate Assumption
New Value
TOTAL NEW VALUE MARKET: $0TOTAL NEW VALUE TAXABLE: $0
New Exemptions
Exemption Description Count
ABSOLUTE EXEMPTIONS VALUE LOSS
Exemption Description Count Exemption Amount
PARTIAL EXEMPTIONS VALUE LOSSNEW EXEMPTIONS VALUE LOSS $0
Increased Exemptions
Increased Exemption_AmountCountDescriptionExemption
INCREASED EXEMPTIONS VALUE LOSS
TOTAL EXEMPTIONS VALUE LOSS $0
New Ag / Timber Exemptions
New Annexations
New Deannexations
Average Homestead Value
Category A and E
Count of HS Residences Average TaxableAverage HS ExemptionAverage Market
13 $70,318$26,035$96,353
Lower Value UsedCount of Protested Properties Total Market Value Total Value Used
Page 147 of 204SCP/395138 True Automation, Inc.
Page 145
HUNT County As of Certification2018 CERTIFIED TOTALSSCT - COMMUNITY ISD
Grand TotalsProperty Count: 89 4:59:45PM8/28/2018
Land ValueHomesite: 494,520Non Homesite: 526,998Ag Market: 7,327,780Timber Market: 8,349,298Total Land (+)0
Improvement Value
Homesite: 3,988,200Non Homesite: 2,502,020 Total Improvements (+) 6,490,220
Non Real ValueCount
Personal Property: 16 752,300Mineral Property: 0 0Autos: 0 0 Total Non Real (+) 752,300
Market Value = 15,591,818ExemptAg Non Exempt
7,327,780 0Total Productivity Market:Ag Use: 319,830 0 7,007,950(-)Productivity LossTimber Use: 0 0 =Appraised Value 8,583,868Productivity Loss: 07,007,950
85,097(-)Homestead Cap
=Assessed Value 8,498,771
(-)Total Exemptions Amount(Breakdown on Next Page)
3,223,530
=Net Taxable 5,275,241
Freeze Assessed Taxable Actual Tax Ceiling Count
681,312 213,192 2,749.16 4,019.31 5OV65Total 681,312 213,192 4,019.31 Freeze Taxable (-)2,749.16 5 213,192Tax Rate 1.625000
= 5,062,049Freeze Adjusted Taxable
APPROXIMATE LEVY = (FREEZE ADJUSTED TAXABLE * (TAX RATE / 100)) + ACTUAL TAX85,007.46 = 5,062,049 * (1.625000 / 100) + 2,749.16
Tax Increment Finance Value: 0Tax Increment Finance Levy: 0.00
Page 148 of 204SCT/395139 True Automation, Inc.
Page 146
HUNT County As of Certification2018 CERTIFIED TOTALSSCT - COMMUNITY ISD
Exemption Breakdown
StateLocalExemption Count Total
8/28/2018 5:00:18PMProperty Count: 89 Grand Totals
DV1 1 0 12,000 12,000DV2 1 0 7,500 7,500DV4 4 0 24,000 24,000DVHS 3 0 316,120 316,120EX-XN 1 0 19,700 19,700EX-XV 7 0 2,322,860 2,322,860EX366 5 0 1,390 1,390HS 22 0 475,000 475,000OV65 5 0 40,000 40,000PC 2 4,960 0 4,960
Totals 4,960 3,218,570 3,223,530
Page 149 of 204SCT/395139 True Automation, Inc.
Page 147
HUNT County As of Certification2018 CERTIFIED TOTALSSCT - COMMUNITY ISD
Grand TotalsProperty Count: 89 8/28/2018 5:00:18PM
State Category Breakdown
State Code Description Count Market ValueAcres New Value Market
A SINGLE FAMILY RESIDENCE 16 $8,320 $2,953,750C1 VACANT LOTS AND LAND TRACTS 2 $0 $19,668D1 QUALIFIED AG LAND 34 $0 $7,327,7802,390.7826D2 NON-QUALIFIED LAND 1 $0 $3,980E FARM OR RANCH IMPROVEMENT 17 $520,710 $2,211,48049.6392J3 ELECTRIC COMPANY (INCLUDING CO-OP 2 $0 $435,420J4 TELEPHONE COMPANY (INCLUDING CO- 2 $0 $6,550J6 PIPELAND COMPANY 4 $0 $286,980L1 COMMERCIAL PERSONAL PROPERTY 2 $0 $2,260X TOTALLY EXEMPT PROPERTY 13 $0 $2,343,950
Totals 2,440.4218 $529,030 $15,591,818
Page 150 of 204SCT/395139 True Automation, Inc.
Page 148
HUNT County As of Certification2018 CERTIFIED TOTALSSCT - COMMUNITY ISD
Property Count: 89 8/28/2018 5:00:18PMEffective Rate Assumption
New Value
TOTAL NEW VALUE MARKET: $529,030TOTAL NEW VALUE TAXABLE: $512,170
New Exemptions
Exemption Description CountEX366 HB366 Exempt 2 2017 Market Value $760
ABSOLUTE EXEMPTIONS VALUE LOSS $760
Exemption Description Count Exemption Amount$01HomesteadHS
1PARTIAL EXEMPTIONS VALUE LOSS $0NEW EXEMPTIONS VALUE LOSS $760
Increased Exemptions
Increased Exemption_AmountCountDescriptionExemption
INCREASED EXEMPTIONS VALUE LOSS
TOTAL EXEMPTIONS VALUE LOSS $760
New Ag / Timber Exemptions
New Annexations
New Deannexations
Average Homestead Value
Category A and E
Count of HS Residences Average TaxableAverage HS ExemptionAverage Market
22 $147,126$25,459$172,585Category A Only
Count of HS Residences Average TaxableAverage HS ExemptionAverage Market
14 $157,211$23,080$180,291
Lower Value UsedCount of Protested Properties Total Market Value Total Value Used
Page 152 of 204SCT/395139 True Automation, Inc.
Page 149
HUNT County As of Certification2018 CERTIFIED TOTALSSCU - CUMBY ISD
Grand TotalsProperty Count: 239 4:59:45PM8/28/2018
Land ValueHomesite: 836,770Non Homesite: 2,535,380Ag Market: 15,706,730Timber Market: 19,078,880Total Land (+)0
Improvement Value
Homesite: 6,094,070Non Homesite: 2,391,550 Total Improvements (+) 8,485,620
Non Real ValueCount
Personal Property: 16 1,790,580Mineral Property: 0 0Autos: 0 0 Total Non Real (+) 1,790,580
Market Value = 29,355,080ExemptAg Non Exempt
15,706,730 0Total Productivity Market:Ag Use: 497,570 0 15,209,160(-)Productivity LossTimber Use: 0 0 =Appraised Value 14,145,920Productivity Loss: 015,209,160
59,763(-)Homestead Cap
=Assessed Value 14,086,157
(-)Total Exemptions Amount(Breakdown on Next Page)
2,625,656
=Net Taxable 11,460,501
Freeze Assessed Taxable Actual Tax Ceiling Count
89,955 31,650 0.00 0.00 2DP1,167,596 661,147 3,191.33 3,565.89 19OV65
Total 1,257,551 692,797 3,565.89 Freeze Taxable (-)3,191.33 21 692,797Tax Rate 1.200000
= 10,767,704Freeze Adjusted Taxable
APPROXIMATE LEVY = (FREEZE ADJUSTED TAXABLE * (TAX RATE / 100)) + ACTUAL TAX132,403.78 = 10,767,704 * (1.200000 / 100) + 3,191.33
Tax Increment Finance Value: 0Tax Increment Finance Levy: 0.00
Page 153 of 204SCU/395140 True Automation, Inc.
Page 150
HUNT County As of Certification2018 CERTIFIED TOTALSSCU - CUMBY ISD
Exemption Breakdown
StateLocalExemption Count Total
8/28/2018 5:00:18PMProperty Count: 239 Grand Totals
DP 2 0 10,000 10,000DV1S 1 0 5,000 5,000EX-XR 1 0 909,680 909,680EX-XV 2 0 226,680 226,680EX366 1 0 30 30HS 63 0 1,316,886 1,316,886OV65 21 0 150,000 150,000PC 2 7,380 0 7,380
Totals 7,380 2,618,276 2,625,656
Page 154 of 204SCU/395140 True Automation, Inc.
Page 151
HUNT County As of Certification2018 CERTIFIED TOTALSSCU - CUMBY ISD
Grand TotalsProperty Count: 239 8/28/2018 5:00:18PM
State Category Breakdown
State Code Description Count Market ValueAcres New Value Market
A SINGLE FAMILY RESIDENCE 17 $0 $1,049,230C1 VACANT LOTS AND LAND TRACTS 6 $0 $122,090D1 QUALIFIED AG LAND 140 $0 $15,706,7305,691.6542D2 NON-QUALIFIED LAND 54 $0 $638,340E FARM OR RANCH IMPROVEMENT 101 $521,360 $8,604,910702.7143F1 COMMERCIAL REAL PROPERTY 2 $0 $201,560J3 ELECTRIC COMPANY (INCLUDING CO-OP 1 $0 $25,090J4 TELEPHONE COMPANY (INCLUDING CO- 2 $0 $151,180J5 RAILROAD 4 $0 $472,380J6 PIPELAND COMPANY 6 $0 $1,098,150J7 CABLE TELEVISION COMPANY 2 $0 $40,120L1 COMMERCIAL PERSONAL PROPERTY 3 $0 $3,630M1 TANGIBLE OTHER PERSONAL, MOBILE H 7 $0 $105,280X TOTALLY EXEMPT PROPERTY 4 $0 $1,136,390
Totals 6,394.3685 $521,360 $29,355,080
Page 155 of 204SCU/395140 True Automation, Inc.
Page 152
HUNT County As of Certification2018 CERTIFIED TOTALSSCU - CUMBY ISD
Property Count: 239 8/28/2018 5:00:18PMEffective Rate Assumption
New Value
TOTAL NEW VALUE MARKET: $521,360TOTAL NEW VALUE TAXABLE: $475,221
New Exemptions
Exemption Description Count
ABSOLUTE EXEMPTIONS VALUE LOSS
Exemption Description Count Exemption Amount$50,0003HomesteadHS$10,0001Over 65OV65
4PARTIAL EXEMPTIONS VALUE LOSS $60,000NEW EXEMPTIONS VALUE LOSS $60,000
Increased Exemptions
Increased Exemption_AmountCountDescriptionExemption
INCREASED EXEMPTIONS VALUE LOSS
TOTAL EXEMPTIONS VALUE LOSS $60,000
New Ag / Timber Exemptions
2017 Market Value Count: 2$74,1932018 Ag/Timber Use $1,000
$73,193NEW AG / TIMBER VALUE LOSS
New Annexations
New Deannexations
Average Homestead Value
Category A and E
Count of HS Residences Average TaxableAverage HS ExemptionAverage Market
60 $58,591$22,340$80,931Category A Only
Count of HS Residences Average TaxableAverage HS ExemptionAverage Market
11 $37,750$23,062$60,812
Page 157 of 204SCU/395140 True Automation, Inc.
Page 153
HUNT County As of Certification2018 CERTIFIED TOTALSSFD - FANNINDEL ISD
Grand TotalsProperty Count: 169 4:59:45PM8/28/2018
Land ValueHomesite: 413,090Non Homesite: 1,498,040Ag Market: 17,504,970Timber Market: 19,416,100Total Land (+)0
Improvement Value
Homesite: 2,496,750Non Homesite: 506,130 Total Improvements (+) 3,002,880
Non Real ValueCount
Personal Property: 12 313,110Mineral Property: 0 0Autos: 0 0 Total Non Real (+) 313,110
Market Value = 22,732,090ExemptAg Non Exempt
17,504,970 0Total Productivity Market:Ag Use: 765,150 0 16,739,820(-)Productivity LossTimber Use: 0 0 =Appraised Value 5,992,270Productivity Loss: 016,739,820
11,187(-)Homestead Cap
=Assessed Value 5,981,083
(-)Total Exemptions Amount(Breakdown on Next Page)
952,756
=Net Taxable 5,028,327
Freeze Assessed Taxable Actual Tax Ceiling Count
74,280 39,280 1.69 1.69 1DP266,130 161,130 798.70 798.70 3OV65
Total 340,410 200,410 800.39 Freeze Taxable (-)800.39 4 200,410Tax Rate 1.260000
= 4,827,917Freeze Adjusted Taxable
APPROXIMATE LEVY = (FREEZE ADJUSTED TAXABLE * (TAX RATE / 100)) + ACTUAL TAX61,632.14 = 4,827,917 * (1.260000 / 100) + 800.39
Tax Increment Finance Value: 0Tax Increment Finance Levy: 0.00
Page 159 of 204SFD/395141 True Automation, Inc.
Page 154
HUNT County As of Certification2018 CERTIFIED TOTALSSFD - FANNINDEL ISD
Exemption Breakdown
StateLocalExemption Count Total
8/28/2018 5:00:18PMProperty Count: 169 Grand Totals
DP 3 0 25,000 25,000DV4 2 0 24,000 24,000DVHS 1 0 196,560 196,560EX-XN 1 0 19,510 19,510EX-XR 1 0 187,980 187,980EX-XV 1 0 13,830 13,830HS 19 0 430,936 430,936OV65 3 0 30,000 30,000PC 2 6,660 0 6,660SO 1 18,280 0 18,280
Totals 24,940 927,816 952,756
Page 160 of 204SFD/395141 True Automation, Inc.
Page 155
HUNT County As of Certification2018 CERTIFIED TOTALSSFD - FANNINDEL ISD
Grand TotalsProperty Count: 169 8/28/2018 5:00:18PM
State Category Breakdown
State Code Description Count Market ValueAcres New Value Market
A SINGLE FAMILY RESIDENCE 9 $0 $562,850C1 VACANT LOTS AND LAND TRACTS 2 $0 $15,160D1 QUALIFIED AG LAND 111 $0 $17,504,9707,219.2911D2 NON-QUALIFIED LAND 23 $4,070 $236,010E FARM OR RANCH IMPROVEMENT 53 $269,460 $4,016,950468.9336J3 ELECTRIC COMPANY (INCLUDING CO-OP 1 $0 $54,180J4 TELEPHONE COMPANY (INCLUDING CO- 2 $0 $11,630J6 PIPELAND COMPANY 6 $0 $37,550L1 COMMERCIAL PERSONAL PROPERTY 1 $0 $2,260M1 TANGIBLE OTHER PERSONAL, MOBILE H 4 $44,100 $69,210X TOTALLY EXEMPT PROPERTY 3 $0 $221,320
Totals 7,688.2247 $317,630 $22,732,090
Page 161 of 204SFD/395141 True Automation, Inc.
Page 156
HUNT County As of Certification2018 CERTIFIED TOTALSSFD - FANNINDEL ISD
Property Count: 169 8/28/2018 5:00:18PMEffective Rate Assumption
New Value
TOTAL NEW VALUE MARKET: $317,630TOTAL NEW VALUE TAXABLE: $317,630
New Exemptions
Exemption Description CountEX-XN 11.252 Motor vehicles leased for personal use 1 2017 Market Value $0
ABSOLUTE EXEMPTIONS VALUE LOSS $0
Exemption Description Count Exemption Amount$50,0003HomesteadHS
3PARTIAL EXEMPTIONS VALUE LOSS $50,000NEW EXEMPTIONS VALUE LOSS $50,000
Increased Exemptions
Increased Exemption_AmountCountDescriptionExemption
INCREASED EXEMPTIONS VALUE LOSS
TOTAL EXEMPTIONS VALUE LOSS $50,000
New Ag / Timber Exemptions
New Annexations
New Deannexations
Average Homestead Value
Category A and E
Count of HS Residences Average TaxableAverage HS ExemptionAverage Market
19 $70,432$23,270$93,702Category A Only
Count of HS Residences Average TaxableAverage HS ExemptionAverage Market
4 $37,120$18,750$55,870
Lower Value UsedCount of Protested Properties Total Market Value Total Value Used
Page 163 of 204SFD/395141 True Automation, Inc.
Page 157
HUNT County As of Certification2018 CERTIFIED TOTALSSGR - GREENVILLE ISD
Grand TotalsProperty Count: 18,771 4:59:45PM8/28/2018
Land ValueHomesite: 123,509,667Non Homesite: 314,255,388Ag Market: 219,782,798Timber Market: 657,547,853Total Land (+)0
Improvement Value
Homesite: 976,573,253Non Homesite: 1,304,020,284 Total Improvements (+) 2,280,593,537
Non Real ValueCount
Personal Property: 1,510 740,225,963Mineral Property: 0 0Autos: 0 0 Total Non Real (+) 740,225,963
Market Value = 3,678,367,353ExemptAg Non Exempt
219,591,058 191,740Total Productivity Market:Ag Use: 5,843,585 5,950 213,747,473(-)Productivity LossTimber Use: 0 0 =Appraised Value 3,464,619,880Productivity Loss: 185,790213,747,473
36,426,730(-)Homestead Cap
=Assessed Value 3,428,193,150
(-)Total Exemptions Amount(Breakdown on Next Page)
1,095,976,769
=Net Taxable 2,332,216,381
Freeze Assessed Taxable Actual Tax Ceiling Count
20,054,925 11,777,754 93,768.81 95,213.81 217DP273,295,547 192,783,949 1,363,306.94 1,375,731.78 2,223OV65
Total 293,350,472 204,561,703 1,470,945.59 Freeze Taxable (-)1,457,075.75 2,440 204,561,703Tax Rate 1.308481
Transfer Assessed Taxable Post % Taxable Adjustment CountDP 405,441 300,441 269,689 30,752 3OV65 5,041,840 3,976,635 2,736,517 1,240,118 31Total 5,447,281 4,277,076 3,006,206 Transfer Adjustment (-)1,270,870 1,270,87034
= 2,126,383,808Freeze Adjusted Taxable
APPROXIMATE LEVY = (FREEZE ADJUSTED TAXABLE * (TAX RATE / 100)) + ACTUAL TAX29,280,403.86 = 2,126,383,808 * (1.308481 / 100) + 1,457,075.75
Tax Increment Finance Value: 0Tax Increment Finance Levy: 0.00
Page 164 of 204SGR/395142 True Automation, Inc.
Page 158
HUNT County As of Certification2018 CERTIFIED TOTALSSGR - GREENVILLE ISD
Exemption Breakdown
StateLocalExemption Count Total
8/28/2018 5:00:18PMProperty Count: 18,771 Grand Totals
AB 5 0 0 0DP 236 0 2,063,746 2,063,746DV1 31 0 204,000 204,000DV1S 1 0 5,000 5,000DV2 23 0 178,500 178,500DV3 35 0 350,410 350,410DV4 171 0 1,510,690 1,510,690DV4S 21 0 212,590 212,590DVHS 72 0 8,995,250 8,995,250DVHSS 10 0 1,337,190 1,337,190EX-XG 3 0 981,890 981,890EX-XI (Prorated) 1 0 74,521 74,521EX-XJ 2 0 3,328,620 3,328,620EX-XL 1 0 128,160 128,160EX-XN 13 0 3,507,850 3,507,850EX-XR 17 0 6,577,360 6,577,360EX-XU 7 0 1,247,460 1,247,460EX-XV 1,012 0 813,683,166 813,683,166EX-XV (Prorated) 37 0 283,959 283,959EX366 26 0 7,220 7,220FR 13 79,442,241 0 79,442,241HS 5,991 0 144,874,008 144,874,008LVE 4 2,491,382 0 2,491,382OV65 2,368 0 21,653,752 21,653,752OV65S 10 0 80,000 80,000PC 10 2,743,480 0 2,743,480SO 1 14,324 0 14,324
Totals 84,691,427 1,011,285,342 1,095,976,769
Page 165 of 204SGR/395142 True Automation, Inc.
Page 159
HUNT County As of Certification2018 CERTIFIED TOTALSSGR - GREENVILLE ISD
Grand TotalsProperty Count: 18,771 8/28/2018 5:00:18PM
State Category Breakdown
State Code Description Count Market ValueAcres New Value Market
A SINGLE FAMILY RESIDENCE 8,380 $27,138,316 $877,507,202B MULTIFAMILY RESIDENCE 158 $2,062,440 $122,790,569C1 VACANT LOTS AND LAND TRACTS 2,374 $0 $47,442,611D1 QUALIFIED AG LAND 2,017 $0 $219,591,05858,941.5879D2 NON-QUALIFIED LAND 628 $309,750 $8,861,323E FARM OR RANCH IMPROVEMENT 2,605 $6,292,830 $295,494,43610,608.8051F1 COMMERCIAL REAL PROPERTY 977 $21,322,040 $459,199,332F2 INDUSTRIAL REAL PROPERTY 56 $247,240 $116,373,109J2 GAS DISTRIBUTION SYSTEM 12 $0 $10,267,670J3 ELECTRIC COMPANY (INCLUDING CO-OP 6 $0 $7,146,140J4 TELEPHONE COMPANY (INCLUDING CO- 63 $0 $9,575,540J5 RAILROAD 73 $0 $6,500,690J6 PIPELAND COMPANY 36 $0 $11,869,500J7 CABLE TELEVISION COMPANY 10 $0 $4,614,550L1 COMMERCIAL PERSONAL PROPERTY 1,241 $977,900 $185,856,143L2 INDUSTRIAL PERSONAL PROPERTY 27 $0 $434,264,782M1 TANGIBLE OTHER PERSONAL, MOBILE H 335 $1,136,330 $7,866,800O RESIDENTIAL INVENTORY 165 $0 $603,090S SPECIAL INVENTORY TAX 38 $0 $19,920,730X TOTALLY EXEMPT PROPERTY 1,123 $2,270,814 $832,622,078
Totals 69,550.3930 $61,757,660 $3,678,367,353
Page 166 of 204SGR/395142 True Automation, Inc.
Page 160
HUNT County As of Certification2018 CERTIFIED TOTALSSGR - GREENVILLE ISD
Property Count: 18,771 8/28/2018 5:00:18PMEffective Rate Assumption
New Value
TOTAL NEW VALUE MARKET: $61,757,660TOTAL NEW VALUE TAXABLE: $58,210,003
New Exemptions
Exemption Description CountEX-XN 11.252 Motor vehicles leased for personal use 1 2017 Market Value $104,610EX-XV Other Exemptions (including public property, r 12 2017 Market Value $146,650EX366 HB366 Exempt 7 2017 Market Value $4,260
ABSOLUTE EXEMPTIONS VALUE LOSS $255,520
Exemption Description Count Exemption Amount$85,00010DisabilityDP$39,0005Disabled Veterans 10% - 29%DV1$30,0004Disabled Veterans 30% - 49%DV2$42,0004Disabled Veterans 50% - 69%DV3
$132,00012Disabled Veterans 70% - 100%DV4$24,0002Disabled Veterans Surviving Spouse 70% - 100DV4S
$110,8433Disabled Veteran HomesteadDVHS$171,1101Disabled Veteran Homestead Surviving SpouseDVHSS
$4,386,067191HomesteadHS$590,97468Over 65OV65
300PARTIAL EXEMPTIONS VALUE LOSS $5,610,994NEW EXEMPTIONS VALUE LOSS $5,866,514
Increased Exemptions
Increased Exemption_AmountCountDescriptionExemption
INCREASED EXEMPTIONS VALUE LOSS
TOTAL EXEMPTIONS VALUE LOSS $5,866,514
New Ag / Timber Exemptions
2017 Market Value Count: 31$1,849,6222018 Ag/Timber Use $51,850
$1,797,772NEW AG / TIMBER VALUE LOSS
New Annexations
New Deannexations
Average Homestead Value
Category A and E
Count of HS Residences Average TaxableAverage HS ExemptionAverage Market
5,907 $101,483$30,256$131,739Category A Only
Count of HS Residences Average TaxableAverage HS ExemptionAverage Market
4,604 $96,674$30,031$126,705
Page 168 of 204SGR/395142 True Automation, Inc.
Page 161
HUNT County As of Certification2018 CERTIFIED TOTALSSLE - LEONARD ISD
Grand TotalsProperty Count: 218 4:59:45PM8/28/2018
Land ValueHomesite: 993,870Non Homesite: 1,421,590Ag Market: 17,801,510Timber Market: 20,216,970Total Land (+)0
Improvement Value
Homesite: 7,778,472Non Homesite: 1,593,876 Total Improvements (+) 9,372,348
Non Real ValueCount
Personal Property: 18 1,989,900Mineral Property: 0 0Autos: 0 0 Total Non Real (+) 1,989,900
Market Value = 31,579,218ExemptAg Non Exempt
17,801,510 0Total Productivity Market:Ag Use: 586,640 0 17,214,870(-)Productivity LossTimber Use: 0 0 =Appraised Value 14,364,348Productivity Loss: 017,214,870
309,370(-)Homestead Cap
=Assessed Value 14,054,978
(-)Total Exemptions Amount(Breakdown on Next Page)
1,861,683
=Net Taxable 12,193,295
Freeze Assessed Taxable Actual Tax Ceiling Count
149,784 97,284 618.44 618.44 2DP1,333,433 931,333 7,014.40 7,014.40 13OV65
Total 1,483,217 1,028,617 7,632.84 Freeze Taxable (-)7,632.84 15 1,028,617Tax Rate 1.259060
= 11,164,678Freeze Adjusted Taxable
APPROXIMATE LEVY = (FREEZE ADJUSTED TAXABLE * (TAX RATE / 100)) + ACTUAL TAX148,202.83 = 11,164,678 * (1.259060 / 100) + 7,632.84
Tax Increment Finance Value: 0Tax Increment Finance Levy: 0.00
Page 170 of 204SLE/395143 True Automation, Inc.
Page 162
HUNT County As of Certification2018 CERTIFIED TOTALSSLE - LEONARD ISD
Exemption Breakdown
StateLocalExemption Count Total
8/28/2018 5:00:18PMProperty Count: 218 Grand Totals
DP 2 0 15,000 15,000DV1 1 0 5,000 5,000DV4 1 0 12,000 12,000DVHS 1 0 71,250 71,250EX-XV 4 0 291,590 291,590EX366 1 0 230 230HS 58 0 1,350,583 1,350,583OV65 13 0 105,000 105,000PC 2 11,030 0 11,030
Totals 11,030 1,850,653 1,861,683
Page 171 of 204SLE/395143 True Automation, Inc.
Page 163
HUNT County As of Certification2018 CERTIFIED TOTALSSLE - LEONARD ISD
Grand TotalsProperty Count: 218 8/28/2018 5:00:18PM
State Category Breakdown
State Code Description Count Market ValueAcres New Value Market
C1 VACANT LOTS AND LAND TRACTS 3 $0 $38,830D1 QUALIFIED AG LAND 135 $0 $17,801,5105,874.3262D2 NON-QUALIFIED LAND 45 $36,690 $573,206E FARM OR RANCH IMPROVEMENT 104 $336,110 $10,746,572440.0089J3 ELECTRIC COMPANY (INCLUDING CO-OP 2 $0 $180,120J4 TELEPHONE COMPANY (INCLUDING CO- 1 $0 $24,310J5 RAILROAD 2 $0 $42,730J6 PIPELAND COMPANY 8 $0 $1,689,800J7 CABLE TELEVISION COMPANY 1 $0 $17,490L1 COMMERCIAL PERSONAL PROPERTY 3 $0 $35,220M1 TANGIBLE OTHER PERSONAL, MOBILE H 4 $85,860 $137,610X TOTALLY EXEMPT PROPERTY 5 $0 $291,820
Totals 6,314.3351 $458,660 $31,579,218
Page 172 of 204SLE/395143 True Automation, Inc.
Page 164
HUNT County As of Certification2018 CERTIFIED TOTALSSLE - LEONARD ISD
Property Count: 218 8/28/2018 5:00:18PMEffective Rate Assumption
New Value
TOTAL NEW VALUE MARKET: $458,660TOTAL NEW VALUE TAXABLE: $368,070
New Exemptions
Exemption Description Count
ABSOLUTE EXEMPTIONS VALUE LOSS
Exemption Description Count Exemption Amount$71,2501Disabled Veteran HomesteadDVHS$75,0003HomesteadHS
4PARTIAL EXEMPTIONS VALUE LOSS $146,250NEW EXEMPTIONS VALUE LOSS $146,250
Increased Exemptions
Increased Exemption_AmountCountDescriptionExemption
INCREASED EXEMPTIONS VALUE LOSS
TOTAL EXEMPTIONS VALUE LOSS $146,250
New Ag / Timber Exemptions
2017 Market Value Count: 1$97,1002018 Ag/Timber Use $1,810
$95,290NEW AG / TIMBER VALUE LOSS
New Annexations
New Deannexations
Average Homestead Value
Category A and E
Count of HS Residences Average TaxableAverage HS ExemptionAverage Market
57 $101,424$28,803$130,227
Lower Value UsedCount of Protested Properties Total Market Value Total Value Used
Page 174 of 204SLE/395143 True Automation, Inc.
Page 165
HUNT County As of Certification2018 CERTIFIED TOTALSSLO - LONE OAK ISD
Grand TotalsProperty Count: 5,559 4:59:45PM8/28/2018
Land ValueHomesite: 28,659,817Non Homesite: 37,644,342Ag Market: 134,156,548Timber Market: 200,460,707Total Land (+)0
Improvement Value
Homesite: 224,377,668Non Homesite: 54,692,888 Total Improvements (+) 279,070,556
Non Real ValueCount
Personal Property: 158 12,511,768Mineral Property: 4 33,220Autos: 0 0 Total Non Real (+) 12,544,988
Market Value = 492,076,251ExemptAg Non Exempt
134,056,368 100,180Total Productivity Market:Ag Use: 3,300,170 1,430 130,756,198(-)Productivity LossTimber Use: 0 0 =Appraised Value 361,320,053Productivity Loss: 98,750130,756,198
7,227,896(-)Homestead Cap
=Assessed Value 354,092,157
(-)Total Exemptions Amount(Breakdown on Next Page)
83,371,068
=Net Taxable 270,721,089
Freeze Assessed Taxable Actual Tax Ceiling Count
5,581,564 3,529,434 31,876.61 32,532.82 61DP56,218,614 39,922,233 326,539.65 331,663.36 485OV65
Total 61,800,178 43,451,667 364,196.18 Freeze Taxable (-)358,416.26 546 43,451,667Tax Rate 1.300000
Transfer Assessed Taxable Post % Taxable Adjustment CountOV65 718,322 593,960 277,966 315,994 4Total 718,322 593,960 277,966 Transfer Adjustment (-)315,994 315,9944
= 226,953,428Freeze Adjusted Taxable
APPROXIMATE LEVY = (FREEZE ADJUSTED TAXABLE * (TAX RATE / 100)) + ACTUAL TAX3,308,810.82 = 226,953,428 * (1.300000 / 100) + 358,416.26
Tax Increment Finance Value: 0Tax Increment Finance Levy: 0.00
Page 175 of 204SLO/395144 True Automation, Inc.
Page 166
HUNT County As of Certification2018 CERTIFIED TOTALSSLO - LONE OAK ISD
Exemption Breakdown
StateLocalExemption Count Total
8/28/2018 5:00:18PMProperty Count: 5,559 Grand Totals
DP 67 0 505,606 505,606DV1 4 0 27,000 27,000DV2 3 0 22,500 22,500DV3 11 0 112,000 112,000DV4 53 0 470,918 470,918DV4S 7 0 54,250 54,250DVHS 20 0 2,316,102 2,316,102DVHSS 4 0 328,160 328,160EX-XG 2 0 56,940 56,940EX-XJ 1 0 21,380 21,380EX-XN 8 0 613,720 613,720EX-XR 8 0 4,145,380 4,145,380EX-XU 1 0 21,380 21,380EX-XV 131 0 39,382,510 39,382,510EX-XV (Prorated) 8 0 10,647 10,647EX366 11 0 2,230 2,230HS 1,358 0 30,720,899 30,720,899LVE 2 336,220 0 336,220OV65 521 0 4,203,385 4,203,385OV65S 3 0 19,001 19,001PC 2 840 0 840
Totals 337,060 83,034,008 83,371,068
Page 176 of 204SLO/395144 True Automation, Inc.
Page 167
HUNT County As of Certification2018 CERTIFIED TOTALSSLO - LONE OAK ISD
Grand TotalsProperty Count: 5,559 8/28/2018 5:00:18PM
State Category Breakdown
State Code Description Count Market ValueAcres New Value Market
A SINGLE FAMILY RESIDENCE 903 $4,931,000 $97,516,403B MULTIFAMILY RESIDENCE 2 $0 $275,650C1 VACANT LOTS AND LAND TRACTS 1,336 $0 $6,289,932D1 QUALIFIED AG LAND 1,551 $0 $134,056,36841,958.5546D2 NON-QUALIFIED LAND 563 $79,370 $11,420,436E FARM OR RANCH IMPROVEMENT 1,520 $4,429,050 $176,998,0194,183.3866F1 COMMERCIAL REAL PROPERTY 63 $846,630 $7,444,913G1 OIL AND GAS 4 $0 $33,220J2 GAS DISTRIBUTION SYSTEM 2 $0 $203,060J3 ELECTRIC COMPANY (INCLUDING CO-OP 7 $0 $2,723,040J4 TELEPHONE COMPANY (INCLUDING CO- 12 $0 $1,732,430J5 RAILROAD 5 $0 $227,160J6 PIPELAND COMPANY 3 $0 $154,350J7 CABLE TELEVISION COMPANY 2 $0 $4,680L1 COMMERCIAL PERSONAL PROPERTY 107 $0 $4,706,588L2 INDUSTRIAL PERSONAL PROPERTY 1 $0 $19,100M1 TANGIBLE OTHER PERSONAL, MOBILE H 108 $194,630 $2,624,880O RESIDENTIAL INVENTORY 412 $0 $1,035,255S SPECIAL INVENTORY TAX 6 $0 $20,360X TOTALLY EXEMPT PROPERTY 172 $95,040 $44,590,407
Totals 46,141.9412 $10,575,720 $492,076,251
Page 177 of 204SLO/395144 True Automation, Inc.
Page 168
HUNT County As of Certification2018 CERTIFIED TOTALSSLO - LONE OAK ISD
Property Count: 5,559 8/28/2018 5:00:18PMEffective Rate Assumption
New Value
TOTAL NEW VALUE MARKET: $10,575,720TOTAL NEW VALUE TAXABLE: $10,026,450
New Exemptions
Exemption Description CountEX-XN 11.252 Motor vehicles leased for personal use 1 2017 Market Value $62,860EX-XV Other Exemptions (including public property, r 4 2017 Market Value $28,440EX366 HB366 Exempt 3 2017 Market Value $3,910
ABSOLUTE EXEMPTIONS VALUE LOSS $95,210
Exemption Description Count Exemption Amount$60,0008DisabilityDP$10,0001Disabled Veterans 50% - 69%DV3$60,0005Disabled Veterans 70% - 100%DV4
$1,265,86159HomesteadHS$165,62919Over 65OV65
92PARTIAL EXEMPTIONS VALUE LOSS $1,561,490NEW EXEMPTIONS VALUE LOSS $1,656,700
Increased Exemptions
Increased Exemption_AmountCountDescriptionExemption
INCREASED EXEMPTIONS VALUE LOSS
TOTAL EXEMPTIONS VALUE LOSS $1,656,700
New Ag / Timber Exemptions
2017 Market Value Count: 23$793,4332018 Ag/Timber Use $13,300
$780,133NEW AG / TIMBER VALUE LOSS
New Annexations
New Deannexations
Average Homestead Value
Category A and E
Count of HS Residences Average TaxableAverage HS ExemptionAverage Market
1,321 $115,296$28,046$143,342Category A Only
Count of HS Residences Average TaxableAverage HS ExemptionAverage Market
480 $114,285$25,471$139,756
Page 179 of 204SLO/395144 True Automation, Inc.
Page 169
HUNT County As of Certification2018 CERTIFIED TOTALSSQL - QUINLAN ISD
Grand TotalsProperty Count: 17,388 4:59:45PM8/28/2018
Land ValueHomesite: 132,033,287Non Homesite: 210,619,143Ag Market: 192,923,842Timber Market: 535,576,272Total Land (+)0
Improvement Value
Homesite: 617,883,258Non Homesite: 207,257,935 Total Improvements (+) 825,141,193
Non Real ValueCount
Personal Property: 516 54,865,293Mineral Property: 0 0Autos: 0 0 Total Non Real (+) 54,865,293
Market Value = 1,415,582,758ExemptAg Non Exempt
192,923,842 0Total Productivity Market:Ag Use: 3,559,398 0 189,364,444(-)Productivity LossTimber Use: 0 0 =Appraised Value 1,226,218,314Productivity Loss: 0189,364,444
34,170,162(-)Homestead Cap
=Assessed Value 1,192,048,152
(-)Total Exemptions Amount(Breakdown on Next Page)
296,050,089
=Net Taxable 895,998,063
Freeze Assessed Taxable Actual Tax Ceiling Count
20,565,632 10,517,038 94,754.12 98,000.59 388DP175,766,516 121,323,016 985,200.93 998,590.58 1,873OV65
Total 196,332,148 131,840,054 1,096,591.17 Freeze Taxable (-)1,079,955.05 2,261 131,840,054Tax Rate 1.240000
Transfer Assessed Taxable Post % Taxable Adjustment CountDP 461,040 379,040 365,745 13,295 2OV65 2,233,914 1,849,543 1,484,722 364,821 15Total 2,694,954 2,228,583 1,850,467 Transfer Adjustment (-)378,116 378,11617
= 763,779,893Freeze Adjusted Taxable
APPROXIMATE LEVY = (FREEZE ADJUSTED TAXABLE * (TAX RATE / 100)) + ACTUAL TAX10,550,825.72 = 763,779,893 * (1.240000 / 100) + 1,079,955.05
Tax Increment Finance Value: 0Tax Increment Finance Levy: 0.00
Page 181 of 204SQL/395145 True Automation, Inc.
Page 170
HUNT County As of Certification2018 CERTIFIED TOTALSSQL - QUINLAN ISD
Exemption Breakdown
StateLocalExemption Count Total
8/28/2018 5:00:18PMProperty Count: 17,388 Grand Totals
DP 414 0 2,390,237 2,390,237DV1 28 0 131,530 131,530DV2 22 0 141,360 141,360DV3 14 0 121,326 121,326DV4 121 0 744,561 744,561DV4S 22 0 112,643 112,643DVHS 75 0 6,530,824 6,530,824DVHSS 13 0 337,115 337,115EX-XG 1 0 288,710 288,710EX-XI 3 0 447,900 447,900EX-XJ 2 0 396,940 396,940EX-XL (Prorated) 1 0 18,552 18,552EX-XN 13 0 1,737,300 1,737,300EX-XR 42 0 10,519,063 10,519,063EX-XR (Prorated) 1 0 1,580 1,580EX-XU 6 0 913,670 913,670EX-XU (Prorated) 1 0 5,639 5,639EX-XV 472 0 158,845,280 158,845,280EX-XV (Prorated) 45 0 96,260 96,260EX366 20 0 4,758 4,758HS 4,696 0 97,679,641 97,679,641LVE 1 166,320 0 166,320OV65 2,032 0 14,174,085 14,174,085OV65S 11 0 91,565 91,565PC 4 82,400 0 82,400SO 2 70,830 0 70,830
Totals 319,550 295,730,539 296,050,089
Page 182 of 204SQL/395145 True Automation, Inc.
Page 171
HUNT County As of Certification2018 CERTIFIED TOTALSSQL - QUINLAN ISD
Grand TotalsProperty Count: 17,388 8/28/2018 5:00:18PM
State Category Breakdown
State Code Description Count Market ValueAcres New Value Market
A SINGLE FAMILY RESIDENCE 6,599 $15,660,270 $506,139,264B MULTIFAMILY RESIDENCE 18 $179,940 $3,763,544C1 VACANT LOTS AND LAND TRACTS 4,654 $0 $44,357,490D1 QUALIFIED AG LAND 1,692 $0 $192,923,84240,709.2443D2 NON-QUALIFIED LAND 547 $116,530 $11,396,356E FARM OR RANCH IMPROVEMENT 3,157 $12,568,240 $338,765,33311,032.3165F1 COMMERCIAL REAL PROPERTY 372 $2,670,780 $82,433,242F2 INDUSTRIAL REAL PROPERTY 3 $179,890 $517,570J1 WATER SYSTEMS 14 $0 $571,060J2 GAS DISTRIBUTION SYSTEM 3 $0 $390,600J3 ELECTRIC COMPANY (INCLUDING CO-OP 11 $0 $7,648,970J4 TELEPHONE COMPANY (INCLUDING CO- 27 $0 $4,337,380J5 RAILROAD 5 $0 $114,930J6 PIPELAND COMPANY 11 $0 $3,458,630J7 CABLE TELEVISION COMPANY 3 $0 $100,710L1 COMMERCIAL PERSONAL PROPERTY 397 $0 $26,823,572L2 INDUSTRIAL PERSONAL PROPERTY 2 $0 $413,340M1 TANGIBLE OTHER PERSONAL, MOBILE H 567 $1,158,380 $14,207,763O RESIDENTIAL INVENTORY 417 $0 $3,276,630S SPECIAL INVENTORY TAX 18 $0 $500,560X TOTALLY EXEMPT PROPERTY 608 $7,950 $173,441,972
Totals 51,741.5608 $32,541,980 $1,415,582,758
Page 183 of 204SQL/395145 True Automation, Inc.
Page 172
HUNT County As of Certification2018 CERTIFIED TOTALSSQL - QUINLAN ISD
Property Count: 17,388 8/28/2018 5:00:18PMEffective Rate Assumption
New Value
TOTAL NEW VALUE MARKET: $32,541,980TOTAL NEW VALUE TAXABLE: $31,290,752
New Exemptions
Exemption Description CountEX-XN 11.252 Motor vehicles leased for personal use 1 2017 Market Value $0EX-XV Other Exemptions (including public property, r 23 2017 Market Value $167,420EX366 HB366 Exempt 2 2017 Market Value $0
ABSOLUTE EXEMPTIONS VALUE LOSS $167,420
Exemption Description Count Exemption Amount$115,00016DisabilityDP$18,9713Disabled Veterans 30% - 49%DV2$10,0001Disabled Veterans 50% - 69%DV3$42,0495Disabled Veterans 70% - 100%DV4$24,0002Disabled Veterans Surviving Spouse 70% - 100DV4S
$185,8342Disabled Veteran HomesteadDVHS$3,181,032174HomesteadHS
$512,70982Over 65OV65285PARTIAL EXEMPTIONS VALUE LOSS $4,089,595
NEW EXEMPTIONS VALUE LOSS $4,257,015
Increased Exemptions
Increased Exemption_AmountCountDescriptionExemption
INCREASED EXEMPTIONS VALUE LOSS
TOTAL EXEMPTIONS VALUE LOSS $4,257,015
New Ag / Timber Exemptions
2017 Market Value Count: 26$1,045,8342018 Ag/Timber Use $13,910
$1,031,924NEW AG / TIMBER VALUE LOSS
New Annexations
New DeannexationsTaxable ValueMarket ValueCount
1 $3,190 $3,190
Average Homestead Value
Category A and E
Count of HS Residences Average TaxableAverage HS ExemptionAverage Market
4,546 $87,115$28,140$115,255Category A Only
Count of HS Residences Average TaxableAverage HS ExemptionAverage Market
3,072 $77,296$27,329$104,625
Page 185 of 204SQL/395145 True Automation, Inc.
Page 173
HUNT County As of Certification2018 CERTIFIED TOTALSSRC - ROYSE CITY ISD
Grand TotalsProperty Count: 3,328 4:59:45PM8/28/2018
Land ValueHomesite: 62,800,437Non Homesite: 47,966,700Ag Market: 88,991,604Timber Market: 199,758,741Total Land (+)0
Improvement Value
Homesite: 307,685,199Non Homesite: 64,961,071 Total Improvements (+) 372,646,270
Non Real ValueCount
Personal Property: 157 8,203,540Mineral Property: 0 0Autos: 0 0 Total Non Real (+) 8,203,540
Market Value = 580,608,551ExemptAg Non Exempt
88,991,604 0Total Productivity Market:Ag Use: 1,122,400 0 87,869,204(-)Productivity LossTimber Use: 0 0 =Appraised Value 492,739,347Productivity Loss: 087,869,204
7,065,631(-)Homestead Cap
=Assessed Value 485,673,716
(-)Total Exemptions Amount(Breakdown on Next Page)
89,205,051
=Net Taxable 396,468,665
Freeze Assessed Taxable Actual Tax Ceiling Count
4,332,971 3,323,675 38,622.45 38,684.14 34DP41,807,235 28,831,741 309,048.64 313,974.87 252OV65
Total 46,140,206 32,155,416 352,659.01 Freeze Taxable (-)347,671.09 286 32,155,416Tax Rate 1.670000
Transfer Assessed Taxable Post % Taxable Adjustment CountOV65 986,700 774,700 633,587 141,113 4Total 986,700 774,700 633,587 Transfer Adjustment (-)141,113 141,1134
= 364,172,136Freeze Adjusted Taxable
APPROXIMATE LEVY = (FREEZE ADJUSTED TAXABLE * (TAX RATE / 100)) + ACTUAL TAX6,429,345.76 = 364,172,136 * (1.670000 / 100) + 347,671.09
Tax Increment Finance Value: 0Tax Increment Finance Levy: 0.00
Page 187 of 204SRC/395146 True Automation, Inc.
Page 174
HUNT County As of Certification2018 CERTIFIED TOTALSSRC - ROYSE CITY ISD
Exemption Breakdown
StateLocalExemption Count Total
8/28/2018 5:00:18PMProperty Count: 3,328 Grand Totals
DP 36 0 289,493 289,493DV1 12 0 81,000 81,000DV2 11 0 79,940 79,940DV3 13 0 115,000 115,000DV4 33 0 336,000 336,000DV4S 2 0 12,000 12,000DVHS 23 0 4,534,232 4,534,232DVHSS 1 0 171,250 171,250EX-XN 9 0 529,490 529,490EX-XR 2 0 835,110 835,110EX-XV 10 0 43,900,570 43,900,570EX366 9 0 1,960 1,960FRSS 1 0 154,576 154,576HS 1,350 0 32,179,675 32,179,675LVE 2 60,932 0 60,932OV65 279 3,442,255 2,463,388 5,905,643PC 2 10,880 0 10,880SO 1 7,300 0 7,300
Totals 3,521,367 85,683,684 89,205,051
Page 188 of 204SRC/395146 True Automation, Inc.
Page 175
HUNT County As of Certification2018 CERTIFIED TOTALSSRC - ROYSE CITY ISD
Grand TotalsProperty Count: 3,328 8/28/2018 5:00:18PM
State Category Breakdown
State Code Description Count Market ValueAcres New Value Market
A SINGLE FAMILY RESIDENCE 1,362 $26,251,940 $269,715,331C1 VACANT LOTS AND LAND TRACTS 133 $0 $5,049,010D1 QUALIFIED AG LAND 566 $0 $88,991,6049,800.4795D2 NON-QUALIFIED LAND 196 $91,280 $3,500,449E FARM OR RANCH IMPROVEMENT 874 $4,107,830 $125,816,7852,826.0164F1 COMMERCIAL REAL PROPERTY 43 $1,314,170 $17,092,840J3 ELECTRIC COMPANY (INCLUDING CO-OP 4 $0 $1,675,790J4 TELEPHONE COMPANY (INCLUDING CO- 4 $0 $499,640J5 RAILROAD 6 $0 $85,380J6 PIPELAND COMPANY 7 $0 $329,560L1 COMMERCIAL PERSONAL PROPERTY 111 $0 $4,241,258L2 INDUSTRIAL PERSONAL PROPERTY 1 $0 $11,600M1 TANGIBLE OTHER PERSONAL, MOBILE H 77 $62,060 $1,932,860O RESIDENTIAL INVENTORY 424 $1,551,370 $15,630,702S SPECIAL INVENTORY TAX 10 $0 $707,680X TOTALLY EXEMPT PROPERTY 32 $0 $45,328,062
Totals 12,626.4959 $33,378,650 $580,608,551
Page 189 of 204SRC/395146 True Automation, Inc.
Page 176
HUNT County As of Certification2018 CERTIFIED TOTALSSRC - ROYSE CITY ISD
Property Count: 3,328 8/28/2018 5:00:18PMEffective Rate Assumption
New Value
TOTAL NEW VALUE MARKET: $33,378,650TOTAL NEW VALUE TAXABLE: $32,989,138
New Exemptions
Exemption Description CountEX-XN 11.252 Motor vehicles leased for personal use 1 2017 Market Value $0EX366 HB366 Exempt 1 2017 Market Value $560
ABSOLUTE EXEMPTIONS VALUE LOSS $560
Exemption Description Count Exemption Amount$12,0001Disabled Veterans 10% - 29%DV1$22,5003Disabled Veterans 30% - 49%DV2$30,0003Disabled Veterans 50% - 69%DV3$60,0006Disabled Veterans 70% - 100%DV4
$413,0402Disabled Veteran HomesteadDVHS$2,335,12495HomesteadHS
$200,00011Over 65OV65121PARTIAL EXEMPTIONS VALUE LOSS $3,072,664
NEW EXEMPTIONS VALUE LOSS $3,073,224
Increased Exemptions
Increased Exemption_AmountCountDescriptionExemption
INCREASED EXEMPTIONS VALUE LOSS
TOTAL EXEMPTIONS VALUE LOSS $3,073,224
New Ag / Timber Exemptions
2017 Market Value Count: 4$211,1002018 Ag/Timber Use $3,110
$207,990NEW AG / TIMBER VALUE LOSS
New Annexations
New Deannexations
Average Homestead Value
Category A and E
Count of HS Residences Average TaxableAverage HS ExemptionAverage Market
1,337 $175,610$29,067$204,677Category A Only
Count of HS Residences Average TaxableAverage HS ExemptionAverage Market
853 $197,755$27,915$225,670
Page 191 of 204SRC/395146 True Automation, Inc.
Page 177
HUNT County As of Certification2018 CERTIFIED TOTALSSTR - TERRELL ISD
Grand TotalsProperty Count: 761 4:59:45PM8/28/2018
Land ValueHomesite: 14,173,399Non Homesite: 13,693,611Ag Market: 34,491,105Timber Market: 62,358,115Total Land (+)0
Improvement Value
Homesite: 69,201,940Non Homesite: 8,045,307 Total Improvements (+) 77,247,247
Non Real ValueCount
Personal Property: 25 1,857,990Mineral Property: 0 0Autos: 0 0 Total Non Real (+) 1,857,990
Market Value = 141,463,352ExemptAg Non Exempt
34,491,105 0Total Productivity Market:Ag Use: 510,040 0 33,981,065(-)Productivity LossTimber Use: 0 0 =Appraised Value 107,482,287Productivity Loss: 033,981,065
2,688,980(-)Homestead Cap
=Assessed Value 104,793,307
(-)Total Exemptions Amount(Breakdown on Next Page)
11,324,879
=Net Taxable 93,468,428
Freeze Assessed Taxable Actual Tax Ceiling Count
1,241,021 910,234 8,636.05 8,679.85 10DP22,310,775 17,613,706 175,530.36 177,895.24 140OV65
Total 23,551,796 18,523,940 186,575.09 Freeze Taxable (-)184,166.41 150 18,523,940Tax Rate 1.599700
Transfer Assessed Taxable Post % Taxable Adjustment CountOV65 248,480 213,480 172,225 41,255 1Total 248,480 213,480 172,225 Transfer Adjustment (-)41,255 41,2551
= 74,903,233Freeze Adjusted Taxable
APPROXIMATE LEVY = (FREEZE ADJUSTED TAXABLE * (TAX RATE / 100)) + ACTUAL TAX1,382,393.43 = 74,903,233 * (1.599700 / 100) + 184,166.41
Tax Increment Finance Value: 0Tax Increment Finance Levy: 0.00
Page 193 of 204STR/395147 True Automation, Inc.
Page 178
HUNT County As of Certification2018 CERTIFIED TOTALSSTR - TERRELL ISD
Exemption Breakdown
StateLocalExemption Count Total
8/28/2018 5:00:18PMProperty Count: 761 Grand Totals
DP 10 0 90,000 90,000DV1 4 0 27,000 27,000DV2 1 0 12,000 12,000DV3 1 0 10,000 10,000DV4 3 0 36,000 36,000DV4S 1 0 0 0DVHS 3 0 469,428 469,428DVHSS 1 0 228,285 228,285EX-XN 1 0 16,300 16,300EX-XR 1 0 20,000 20,000EX-XV 4 0 983,930 983,930EX366 3 0 900 900HS 348 0 8,107,869 8,107,869OV65 155 0 1,323,167 1,323,167
Totals 0 11,324,879 11,324,879
Page 194 of 204STR/395147 True Automation, Inc.
Page 179
HUNT County As of Certification2018 CERTIFIED TOTALSSTR - TERRELL ISD
Grand TotalsProperty Count: 761 8/28/2018 5:00:18PM
State Category Breakdown
State Code Description Count Market ValueAcres New Value Market
A SINGLE FAMILY RESIDENCE 222 $90,070 $39,445,460B MULTIFAMILY RESIDENCE 2 $0 $230,320C1 VACANT LOTS AND LAND TRACTS 31 $0 $1,053,780D1 QUALIFIED AG LAND 296 $0 $34,491,1056,369.4465D2 NON-QUALIFIED LAND 115 $127,790 $2,755,163E FARM OR RANCH IMPROVEMENT 336 $804,170 $59,384,4342,437.6600F1 COMMERCIAL REAL PROPERTY 2 $0 $814,380J1 WATER SYSTEMS 1 $0 $35,000J3 ELECTRIC COMPANY (INCLUDING CO-OP 2 $0 $1,139,390J4 TELEPHONE COMPANY (INCLUDING CO- 1 $0 $132,050J6 PIPELAND COMPANY 2 $0 $272,640L1 COMMERCIAL PERSONAL PROPERTY 15 $0 $261,710M1 TANGIBLE OTHER PERSONAL, MOBILE H 14 $0 $426,790X TOTALLY EXEMPT PROPERTY 9 $0 $1,021,130
Totals 8,807.1065 $1,022,030 $141,463,352
Page 195 of 204STR/395147 True Automation, Inc.
Page 180
HUNT County As of Certification2018 CERTIFIED TOTALSSTR - TERRELL ISD
Property Count: 761 8/28/2018 5:00:18PMEffective Rate Assumption
New Value
TOTAL NEW VALUE MARKET: $1,022,030TOTAL NEW VALUE TAXABLE: $1,015,810
New Exemptions
Exemption Description Count
ABSOLUTE EXEMPTIONS VALUE LOSS
Exemption Description Count Exemption Amount$238,9281Disabled Veteran HomesteadDVHS$141,1677HomesteadHS$33,4787Over 65OV65
15PARTIAL EXEMPTIONS VALUE LOSS $413,573NEW EXEMPTIONS VALUE LOSS $413,573
Increased Exemptions
Increased Exemption_AmountCountDescriptionExemption
INCREASED EXEMPTIONS VALUE LOSS
TOTAL EXEMPTIONS VALUE LOSS $413,573
New Ag / Timber Exemptions
2017 Market Value Count: 3$205,0642018 Ag/Timber Use $2,000
$203,064NEW AG / TIMBER VALUE LOSS
New Annexations
New Deannexations
Average Homestead Value
Category A and E
Count of HS Residences Average TaxableAverage HS ExemptionAverage Market
344 $157,438$31,082$188,520Category A Only
Count of HS Residences Average TaxableAverage HS ExemptionAverage Market
146 $159,061$33,232$192,293
Page 197 of 204STR/395147 True Automation, Inc.
Page 181
HUNT County As of Certification2018 CERTIFIED TOTALSSWC - WOLFE CITY ISD
Grand TotalsProperty Count: 2,807 4:59:45PM8/28/2018
Land ValueHomesite: 9,549,366Non Homesite: 16,604,366Ag Market: 121,958,430Timber Market: 148,112,162Total Land (+)0
Improvement Value
Homesite: 86,187,537Non Homesite: 37,782,039 Total Improvements (+) 123,969,576
Non Real ValueCount
Personal Property: 132 14,506,848Mineral Property: 0 0Autos: 0 0 Total Non Real (+) 14,506,848
Market Value = 286,588,586ExemptAg Non Exempt
121,958,430 0Total Productivity Market:Ag Use: 4,052,850 0 117,905,580(-)Productivity LossTimber Use: 0 0 =Appraised Value 168,683,006Productivity Loss: 0117,905,580
1,334,409(-)Homestead Cap
=Assessed Value 167,348,597
(-)Total Exemptions Amount(Breakdown on Next Page)
44,401,703
=Net Taxable 122,946,894
Freeze Assessed Taxable Actual Tax Ceiling Count
2,119,672 915,148 6,351.37 6,516.17 37DP24,255,388 14,377,820 99,720.10 100,809.60 298OV65
Total 26,375,060 15,292,968 107,325.77 Freeze Taxable (-)106,071.47 335 15,292,968Tax Rate 1.344000
= 107,653,926Freeze Adjusted Taxable
APPROXIMATE LEVY = (FREEZE ADJUSTED TAXABLE * (TAX RATE / 100)) + ACTUAL TAX1,552,940.24 = 107,653,926 * (1.344000 / 100) + 106,071.47
Tax Increment Finance Value: 0Tax Increment Finance Levy: 0.00
Page 199 of 204SWC/395148 True Automation, Inc.
Page 182
HUNT County As of Certification2018 CERTIFIED TOTALSSWC - WOLFE CITY ISD
Exemption Breakdown
StateLocalExemption Count Total
8/28/2018 5:00:18PMProperty Count: 2,807 Grand Totals
DP 37 0 256,300 256,300DV1 3 0 22,000 22,000DV2 2 0 15,000 15,000DV3 6 0 60,000 60,000DV4 25 0 237,910 237,910DV4S 5 0 60,000 60,000DVHS 13 0 781,518 781,518EX-XG 1 0 43,160 43,160EX-XJ 1 0 32,790 32,790EX-XN 8 0 467,200 467,200EX-XR 3 0 559,928 559,928EX-XV 97 0 20,920,910 20,920,910EX-XV (Prorated) 3 0 25,001 25,001EX366 8 0 1,460 1,460HS 783 0 18,234,306 18,234,306LVE 1 52,940 0 52,940OV65 310 0 2,581,916 2,581,916OV65S 3 0 19,064 19,064PC 2 30,300 0 30,300
Totals 83,240 44,318,463 44,401,703
Page 200 of 204SWC/395148 True Automation, Inc.
Page 183
HUNT County As of Certification2018 CERTIFIED TOTALSSWC - WOLFE CITY ISD
Grand TotalsProperty Count: 2,807 8/28/2018 5:00:18PM
State Category Breakdown
State Code Description Count Market ValueAcres New Value Market
A SINGLE FAMILY RESIDENCE 594 $67,380 $29,788,440B MULTIFAMILY RESIDENCE 16 $0 $2,599,664C1 VACANT LOTS AND LAND TRACTS 163 $0 $1,388,450D1 QUALIFIED AG LAND 1,194 $0 $121,958,43042,829.7005D2 NON-QUALIFIED LAND 398 $165,220 $4,896,244E FARM OR RANCH IMPROVEMENT 970 $1,938,070 $80,619,9103,763.9793F1 COMMERCIAL REAL PROPERTY 63 $0 $6,934,257F2 INDUSTRIAL REAL PROPERTY 7 $0 $1,251,793J2 GAS DISTRIBUTION SYSTEM 2 $0 $666,690J3 ELECTRIC COMPANY (INCLUDING CO-OP 6 $0 $3,663,610J4 TELEPHONE COMPANY (INCLUDING CO- 7 $0 $685,030J6 PIPELAND COMPANY 18 $0 $2,708,400J7 CABLE TELEVISION COMPANY 4 $0 $71,180L1 COMMERCIAL PERSONAL PROPERTY 78 $0 $2,338,960L2 INDUSTRIAL PERSONAL PROPERTY 5 $0 $3,468,700M1 TANGIBLE OTHER PERSONAL, MOBILE H 55 $234,780 $1,445,439S SPECIAL INVENTORY TAX 2 $0 $0X TOTALLY EXEMPT PROPERTY 122 $0 $22,103,389
Totals 46,593.6798 $2,405,450 $286,588,586
Page 201 of 204SWC/395148 True Automation, Inc.
Page 184
HUNT County As of Certification2018 CERTIFIED TOTALSSWC - WOLFE CITY ISD
Property Count: 2,807 8/28/2018 5:00:18PMEffective Rate Assumption
New Value
TOTAL NEW VALUE MARKET: $2,405,450TOTAL NEW VALUE TAXABLE: $2,248,579
New Exemptions
Exemption Description CountEX-XN 11.252 Motor vehicles leased for personal use 1 2017 Market Value $0EX-XV Other Exemptions (including public property, r 1 2017 Market Value $3,770
ABSOLUTE EXEMPTIONS VALUE LOSS $3,770
Exemption Description Count Exemption Amount$10,0001Disabled Veterans 50% - 69%DV3$12,0001Disabled Veterans Surviving Spouse 70% - 100DV4S$11,7731Disabled Veteran HomesteadDVHS
$340,85117HomesteadHS$67,5949Over 65OV65
29PARTIAL EXEMPTIONS VALUE LOSS $442,218NEW EXEMPTIONS VALUE LOSS $445,988
Increased Exemptions
Increased Exemption_AmountCountDescriptionExemption
INCREASED EXEMPTIONS VALUE LOSS
TOTAL EXEMPTIONS VALUE LOSS $445,988
New Ag / Timber Exemptions
2017 Market Value Count: 6$424,2232018 Ag/Timber Use $15,190
$409,033NEW AG / TIMBER VALUE LOSS
New Annexations
New Deannexations
Average Homestead Value
Category A and E
Count of HS Residences Average TaxableAverage HS ExemptionAverage Market
764 $67,195$25,170$92,365Category A Only
Count of HS Residences Average TaxableAverage HS ExemptionAverage Market
276 $41,192$24,141$65,333
Page 203 of 204SWC/395148 True Automation, Inc.
Page 185
2018 Masonry Final Number Calculations After Cost Multiplier, Local Multiplier and Market Factor
QUALITY LOWDEPRECIATION 50 YR
MAX SQ FT 1M 2M 2+M 3M 3+M 4M 4+M 5M 5+M 6M 6+M
400 67.90
500 64.48
600 61.81 74.65 87.85 100.51 115.81
700 59.65 72.37 85.16
800 57.84 70.44 81.63 94.73 109.14 119.33 128.92
900 56.28 68.78 79.69
1000 54.92 67.32 77.99 90.46 104.33 114.16 123.33 129.87
1100 53.73 66.04 76.48
1200 52.66 64.88 75.13 87.12 100.56 110.10 118.94 125.25 149.94
1300 51.69 63.84 73.91 85.70 98.95
1400 50.82 62.90 72.80 84.40 97.48 106.79 115.24 121.24 145.14
1500 62.03 71.79 83.20 95.91
1600 49.27 61.22 70.84 82.10 94.47 103.18 111.72 117.89 141.12 172.85 203.74
1700 60.48 69.97 81.08 93.31
1800 47.94 59.78 69.16 80.13 92.24 100.78 109.06 114.99 137.66 168.62 198.74
1900 79.25 91.25 99.71 107.85
2000 46.78 58.52 67.69 78.41 90.31 98.70 106.72 112.47 134.71 165.07 194.56
2100 77.63 89.42 97.75 105.66
2200 45.76 57.40 66.37 76.88 88.58 96.85 104.66 110.23 132.09 161.90 190.83
2300 109.20 130.92
2400 44.85 56.40 65.21 75.52 87.43 95.95 103.18 108.22 129.74 159.07 187.49
2500 95.20 102.33 107.29 128.65
2600 44.03 55.50 64.15 74.28 86.03 94.44 101.50 106.42 127.63 156.53 184.50
2800 43.29 54.67 63.18 73.15 84.75 93.05 99.96 104.77 125.69 154.18 181.72
3000 72.12 83.58 91.79 98.56 103.25 123.91 152.05 179.21
3200 90.62 97.26 101.86 122.28 150.07 176.88
3400 89.54 96.05 100.56 120.76 148.24 174.73
3600 88.52 94.94 99.36 119.34 146.53 172.71
3800 87.32 93.76 98.24 118.02 144.93 170.83
4000 97.19 116.78 143.44 169.07
4200 96.19 115.61 142.02 167.40
4400 140.69 165.83
4800 138.23 162.93
5200 136.01 160.31
5600 133.99 157.92
6000 132.13 155.73
9999999 41.91 53.16 61.55 70.21 80.83 86.06 92.50 94.31 113.25 130.27 153.54
60 YR 60 YR 60 YR 65 YRFAIR AVERAGE GOOD VERY GOOD EXCELLENT
55 YR
Page 186
2018 Frame Final Number Calculations After Cost Multipler, LocalMultiplier and Market Factor
QUALITY LOWDEPRECIATION 45 YR F RES
MAX SQ FT 1F 2F 2+F 3F 3+F 4F 4+F 5F 5+F 6F 6+F
400 66.74
500 63.41
600 60.81 67.78 83.33 89.98 108.02
700 58.69 65.83 80.95
800 56.92 64.17 78.92 85.24 102.33 106.21 121.29
900 55.41 62.77 77.21
1000 54.08 61.53 75.67 81.73 98.15 101.91 116.37
1100 52.91 60.44 74.32
1200 51.86 59.45 73.11 78.96 94.86 98.52 112.50 120.42 140.16
1300 50.93 58.55 72.01 77.78 93.46
1400 50.06 57.74 71.01 76.71 92.17 95.74 109.20 116.78 135.92
1500 56.99 70.10 75.72 91.00
1600 48.55 56.30 69.25 74.80 89.90 93.40 106.42 113.71 132.35
1700 55.66 68.46 73.95 88.89
1800 47.26 55.06 67.72 73.16 87.94 91.38 104.03 111.08 129.28 149.91 173.82
1900 72.42 87.06 90.47 102.95
2000 46.12 53.97 66.39 71.72 86.23 89.61 101.94 108.76 126.59 146.80 170.22
2100 71.07 85.46 88.81 100.98
2200 45.13 53.01 65.20 70.44 84.71 88.04 100.08 106.71 124.22 144.07 167.04
2300 105.77 123.14
2400 44.24 52.14 64.14 69.30 83.35 86.63 98.40 104.88 122.09 141.59 164.18
2500 104.03 121.10
2600 43.43 51.36 63.18 68.26 82.11 85.36 96.90 103.22 120.16 139.37 161.60
2800 42.70 50.64 62.31 67.32 80.98 84.19 95.52 101.71 118.41 137.34 159.24
3000 66.44 79.94 83.13 94.26 100.32 116.80 135.47 157.08
3200 82.14 93.09 99.03 115.31 133.75 155.09
3400 81.22 92.01 97.84 113.93 132.15 153.24
3600 80.36 91.00 96.74 112.64 130.67 151.51
3800 79.56 90.06 95.70 111.44 129.27 149.89
4000 78.81 89.16 94.73 110.31 127.96 148.38
4200 93.81 109.25 126.74 146.95
4400 125.57 145.60
4800 123.43 143.12
5200 121.48 140.85
5600 119.71 138.80
6000 118.09 136.92
9999999 41.35 49.94 60.66 64.83 76.31 78.05 87.42 92.07 103.32 116.46 135.04
50 YR F RES 55 YR F RES 55 YR F RES 60 YR F RES 60 YR F RESFAIR AVERAGE GOOD VERY GOOD EXCELLENT
Page 187
7/25/2018 2017 Property Value Study
https://comptroller.texas.gov/data/property-tax/pvs/2017p/1160000001A.php 1/2
TaxesProperty Tax Assistance
2017 Property Value Study
CAD Summary Worksheet 116 Hunt
CategoryNumber ofRatios **
2017 CAD Rept Apprais
ed ValueMedian Level of Appr
Coefficientof Dispersi
on
% Ratios w/in (+/-) 10%of Median
% Ratios w/in (+/-) 25%of Median
Price-Related Different
ial
A. Single-Family Residences
709 1,984,171,284 .98 9.27 71.08 92.66 1.01
B. Multi-Family Residences
42 146,967,072 * * * * *
C1. Vacant Lots
0 123,650,049 * * * * *
C2. Colonia lots
0 0 * * * * *
D2. Farm/Ranch Imp
25 68,151,379 * * * * *
E. Rural non-qualified
324 1,558,854,468 .98 13.73 53.39 85.18 1.01
F1. Commercial Real
135 615,521,875 .95 12.07 57.03 88.14 1.01
F2. IndustrialReal
0 148,038,494 * * * * *
G. Oil, Gas,Minerals
0 9,569 * * * * *
J. Utilities 6 163,787,182 1.25 .00 100.00 100.00 1.00
L1. Commercial Personal
72 313,154,813 * * * * *
L2. IndustrialPersonal
0 503,838,204 * * * * *
M. Other Personal
0 23,944,172 * * * * *
O. Residential Inventory
0 5,272,436 * * * * *
S. Special Inventory
0 26,363,600 * * * * *
Overall 1,313 5,681,724,597 .98 11.42 63.21 88.57 1.04
Glenn HegarTexas Comptroller of Public Accounts
Page 188
7/25/2018 2017 Property Value Study
https://comptroller.texas.gov/data/property-tax/pvs/2017p/1160000001A.php 2/2
* Not Calculated - Need a minimum of 5 ratios from either (A) categories representing at least 25% of total CADcategory value or (B) 5 ISDs or half the ISDs in the CAD, whichever is less ** Statistical measures may not be reliable when the sample is small
Page 189
2018 CERTIFIED RESIDENTIAL SALES BY ISD
Sales 4/01/2017 thru 4/1/2018
Residential Class SBH SBL SCA SCL SCM SCO SCP SCT SCU SFD SGR All ISD'S All ISD'S
Condition ALL ALL ALL ALL ALL ALL ALL ALL ALL ALL ALL AVG ALL
Lower Trimming Limit 0 0.8135 0.4545 0.6989 0.7968 0.6524 0 0 0 0 0.8353 0.8276 0.8012
Upper Trimming Limit 0 1.1119 1.4769 1.2189 1.1693 1.2649 0 0 0 0 1.1249 1.154 1.1516
Total Number of Sales in Class 4 17 17 16 96 71 0 0 2 0 344 635 899
Number of Sales Trimmed 0 0 0 0 4 1 0 0 0 0 52 54 99
Number of Sales Used in Ratio 4 17 17 16 92 70 0 0 2 0 292 581 800
Weighted Mean Ratio 0.9691 0.9783 0.9949 0.9671 0.9814 0.9536 #DIV/0! #DIV/0! 1.1107 #DIV/0! 0.9808 0.9907 0.9801
Mean Ratio 0.9555 0.9717 0.9739 0.9581 0.9809 0.9621 #DIV/0! #REF! 1.0948 #DIV/0! 0.9833 0.9906 0.9789
Median Ratio 0.9590 0.9824 0.9930 0.9574 0.9880 0.9642 #DIV/0! #REF! 1.0948 #DIV/0! 0.9928 0.9989 0.9896
Coefficient of Dispersion 6.1522 4.6417 12.1752 7.0295 6.2348 9.1371 #DIV/0! #REF! 2.2379 #DIV/0! 4.1801 4.6051 5.2749
Price Related Differential 0.9860 0.9933 0.9789 0.9907 0.9995 1.0089 #DIV/0! #REF! 0.9857 #DIV/0! 1.0025 0.9999 0.9988
Average Deviation 0.0590 0.0456 0.1209 0.0673 0.0616 0.0881 #DIV/0! #REF! 0.0245 #DIV/0! 0.0415 0.0460 0.0522
Population Variance 0.0058 0.0032 0.0234 0.0066 0.0066 0.0127 #DIV/0! #REF! 0.0012 #DIV/0! 0.0031 0.0039 0.0048
Standard Deviation 0.0762 0.0566 0.1530 0.0812 0.0812 0.1127 #DIV/0! #REF! 0.0346 #DIV/0! 0.0557 0.0624 0.0693
Number of Prop in Population All Cond 105 788 675 771 1935 2556 13 25 44 20 9338 20534 24828
#of Sales Used as % of Population 3.81% 2.16% 2.52% 2.08% 4.75% 2.74% 0.00% 0.00% 4.55% 0.00% 3.13% 2.83% 3.22%
Residential Class SLE SLO SQL SRC STR SWC
Condition AVG ALL ALL ALL ALL ALL
Lower Trimming Limit 0 0.5822 0.7086 0.852 0.6986 0.8913
Upper Trimming Limit 0 1.2507 1.231 1.1224 .1.2895 1.0953
Total Number of Sales in Class 4 41 135 120 14 18
Number of Sales Trimmed 0 2 8 6 2 4
Number of Sales Used in Ratio 4 39 127 114 12 14
Weighted Mean Ratio 0.9811 0.9259 0.9831 0.9938 0.9853 0.9992
Mean Ratio 0.9750 0.9291 0.9701 0.9921 0.9952 0.9977
Median Ratio 0.9771 0.9590 0.9861 0.9924 0.9995 1.0058
Coefficient of Dispersion 2.2720 8.2169 7.4333 4.1213 6.9635 1.9686
Price Related Differential 0.9938 1.0035 0.9868 0.9983 1.0100 0.9985
Average Deviation 0.0222 0.0788 0.0733 0.0409 0.0696 0.0198
Population Variance 0.0007 0.0106 0.0091 0.0031 0.0089 0.0008
Standard Deviation 0.0265 0.1030 0.0954 0.0557 0.0943 0.0283
Number of Prop in Population All Cond 50 1486 4303 1398 333 988
#of Sales Used as % of Population 8.00% 2.62% 2.95% 8.15% 3.60% 1.42%
SCHOOL DISTRICTS
SCHOOL DISTRICTS
8/23/2018 4:58 PM
Page 190
2018 CERTIFIED RESIDENTIAL SALES BY CLASSSALES 4/1/2017 THRU 4/2/2018
Residential Class 1F 2F 2+F 3F 3+F 4F 4+F 5F 5+F 6F 6+F All Classes All Classes
Condition ALL ALL ALL ALL ALL ALL ALL ALL AVG AVG ALLNumber of Sales Used 8 66 60 69 28 12 4 1 0 0 0 580 797Weighted Mean Ratio 0.9278 0.9148 0.9548 0.9610 1.0067 0.9809 0.9692 0.8669 0.9906 0.9801Mean Ratio 0.9497 0.9421 0.9569 0.9790 1.0031 0.9812 0.9968 0.8669 0.9902 0.9790Median Ratio 0.9399 0.9610 0.9588 0.9895 0.9938 0.9877 0.9887 0.8669 0.9987 0.9896Coefficient of Dispersion 10.6501 11.9875 6.9462 9.6513 3.7835 6.6619 5.5527 0.0000 4.6260 5.2648Price Related Differential 1.0236 1.0298 1.0022 1.0187 0.9964 1.0003 1.0285 1.0000 0.9996 0.9989Average Deviation 0.1001 0.1152 0.0666 0.0955 0.0376 0.0658 0.0549 0.0000 0.0462 0.0521Population Variance 0.0237 0.0211 0.0077 0.0168 0.0027 0.0091 0.0072 #DIV/0! 0.0039 0.0047Standard Deviation 0.1539 0.1453 0.0877 0.1296 0.0520 0.0954 0.0849 #DIV/0! 0.0624 0.0686Number of Prop in Population All Cond 1023 4557 3649 2297 661 351 134 28 6 2 0 20533 24826# OF SALES TRIMMED OUT 0 2 0 2 3 0 1 0 0 0 54 100
Residential Class 1M 2M 2+M 3M 3+M 4M 4+M 5M 5+M 6M 6+M
Condition ALL ALL ALL ALL ALL AVG ALL ALL ALL AVGNumber of Sales Used 0 10 35 314 97 91 29 8 2 1 0Weighted Mean Ratio #DIV/0! 1.0553 0.9162 0.9773 0.9858 1.0084 0.9854 1.0106 1.0024Mean Ratio #DIV/0! 1.0823 0.9145 0.9788 0.9890 1.0137 0.9923 1.0083 1.0011Median Ratio 0.0000 1.0166 0.9410 0.9905 0.9989 1.0000 0.9973 0.9947 1.0011Coefficient of Dispersion #DIV/0! 18.6406 11.1052 4.0081 4.8654 6.0900 5.4748 3.6594 0.7991Price Related Differential #DIV/0! 1.0256 0.9981 1.0015 1.0032 1.0053 1.0070 0.9977 0.9987Average Deviation 0.0000 0.1895 0.1045 0.0397 0.0486 0.0609 0.0546 0.0364 0.0080Population Variance #DIV/0! 0.0567 0.0162 0.0027 0.0043 0.0065 0.0054 0.0049 0.0001Standard Deviation #DIV/0! 0.2381 0.1273 0.0520 0.0656 0.0806 0.0735 0.0700 0.0100Number of Prop in Population All Cond 17 967 1668 5553 1737 1400 548 162 44 18 4# OF SALES TRIMMED OUT 0 0 2 40 6 1 0 0 0 0 0
# OF SALES = TRIMMED SALES
FRAME CLASSES
MASONRY CLASSES
FRAME AND MASONRY
COMBINED
8/23/2018