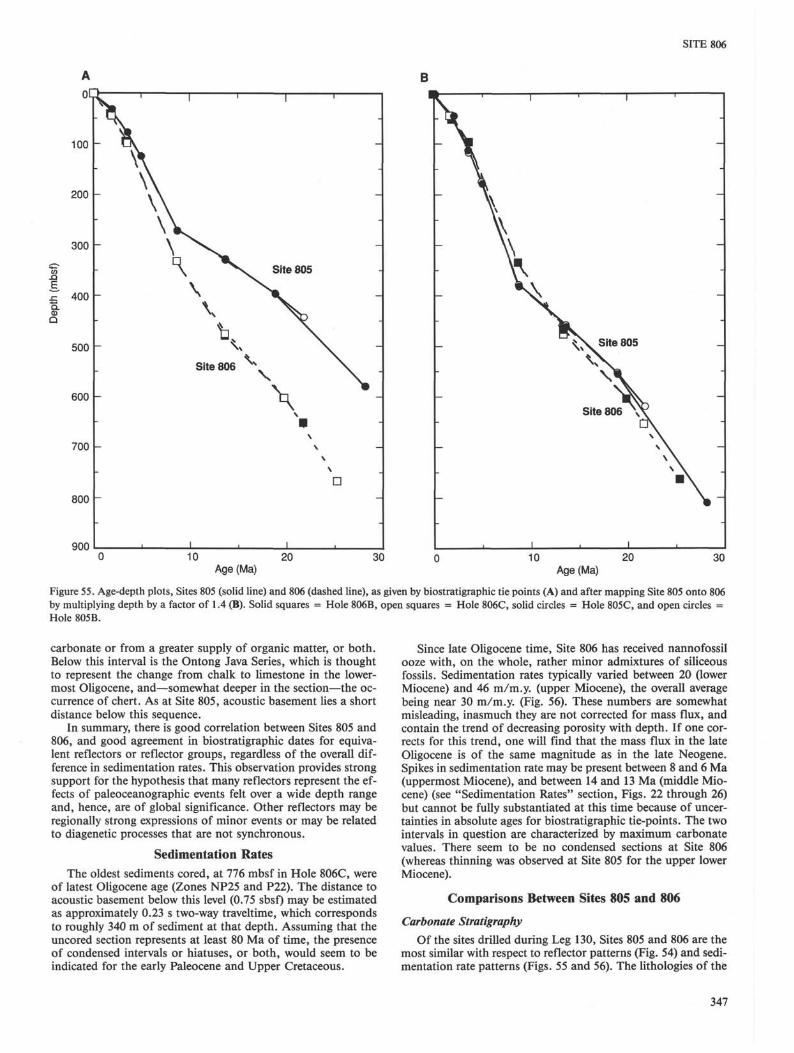
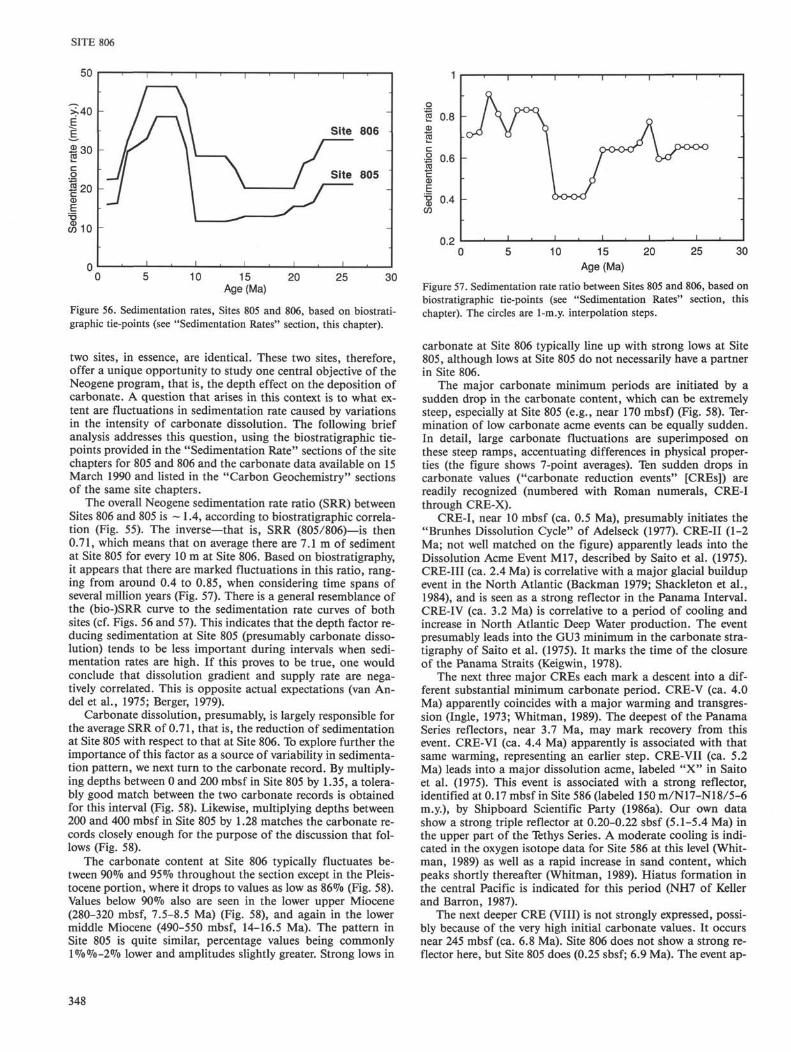
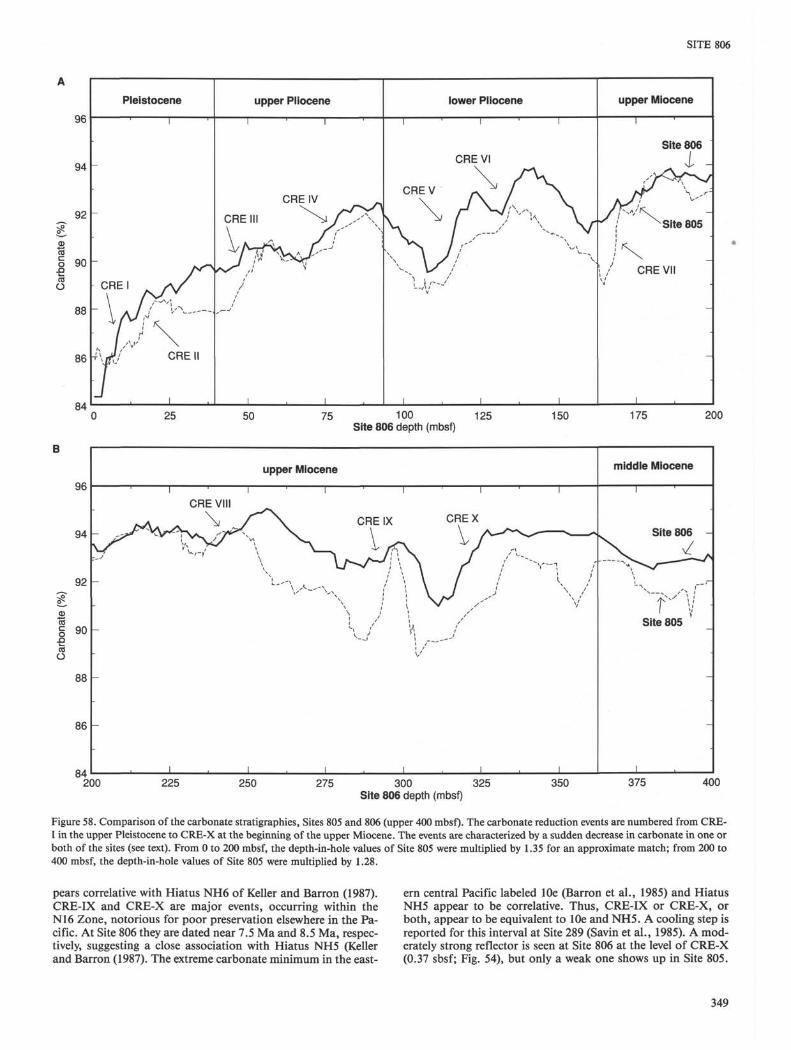
Kroenke, L. W., Berger, W. H., Janecek, T. R., et al., 1991 Proceedings of the Ocean Drilling Program, Initial Reports, Vol. 130 8. SITE 806 1 Shipboard Scientific Party 2 HOLE 806A Date occupied: 17 February 1990 Date departed: 18 February 1990 Time on hole: 1 day, 15 min Position: 0°19.11'N, 159°21.68'E Bottom felt (rig floor; m, drill-pipe measurement): 2531.8 Distance between rig floor and sea level (m): 11.14 Water depth (drill-pipe measurement from sea level, m): 2520.7 Total depth (rig floor; m): 2615.50 Penetration (m): 83.70 Number of cores (including cores with no recovery): 9 Total length of cored section (m): 83.70 Total core recovered (m): 85.95 Core recovery (%): 102.7 Oldest sediment cored: Depth (mbsf): 83.70 Nature: nannofossil ooze Oldest age: late Pliocene Youngest age: Quaternary Measured velocity (km/s): ND HOLE 806B Date occupied: 18 February 1990 Date departed: 22 February 1990 Time on hole: 4 days, 4 hr, 30 min Position: 0°l9.11 'N, 159°21.69'E Bottom felt (rig floor; m, drill-pipe measurement): 2531.0 Distance between rig floor and sea level (m): 11.14 Water depth (drill-pipe measurement from sea level, m): 2519.9 Total depth (rig floor; m): 3274.10 Penetration (m): 743.10 Number of cores (including cores with no recovery): 78 Total length of cored section (m): 743.10 (APC, 320.0; XCB, 423.1) Total core recovered (m): 666.36 (APC, 335.20; XCB, 331.15.) Core recovery (%): 89 (APC, 104.8; XCB, 78.3) Oldest sediment cored: Depth (mbsf): 743.10 Nature: nannofossil chalk with foraminifers Oldest age: early Miocene Youngest age: Quaternary Measured velocity (km/s): 2.2 1 Kroenke, L. W., Berger, W. H., Janecek, T. R., et al., 1991. Proc. ODP, Init. Repts., 130: College Station, TX (Ocean Drilling Program). 2 Shipboard Scientific Party is as given in the list of participants preceding the contents. HOLE 806C Date occupied: 22 February 1990 Date departed: 25 February 1990 Time on hole: 2 days, 17 hr, 30 min Position: 0°19.11'N, 159°21.70'E Bottom felt (rig floor; m, drill-pipe measurement): 2531.9 Distance between rig floor and sea level (m): 11.14 Water depth (drill-pipe measurement from sea level, m): 2520.8 Total depth (rig floor; m): 3308.30 Penetration (m): 776.40 Number of cores (including cores with no recovery): 62 Total length of cored section (m): 587.60 (APC, 309.6; XCB, 278) Total core recovered (m): 523.62 (APC, 320.61; XCB, 203.01) Total section drilled without coring: 188.8 Core recovery (%): 89 (APC, 103.6; XCB, 73) Oldest sediment cored: Depth (mbsf): 776.4 Nature: foraminifer nannofossil chalk Oldest age: late Oligocene Youngest age: Quaternary Measured velocity (km/s): 2.1 Principal results: Ocean Drilling Program (ODP) Site 806 (proposed Site OJP-1) is located on the northeastern margin of the Ontong Java Plateau, close to the equator (latitude 0°19.1'N, longitude 159°21.7'E) in 2520 m of water, roughly 125 km northeast of Deep Sea Drilling Project (DSDP) Sites 289/586. The site represents the shallow end member on a transect that was designed to detect depth- related paleoceanographic signals in Neogene sediments. We occu- pied this site with the objective to obtain a high-resolution carbonate record in an undisturbed setting, which could serve as a standard section for studies of ocean history, including biostratigraphy, che- mostratigraphy, and acoustic stratigraphy. Site 806 was positioned at the proposed location (OJP-1), on a 2- km-wide terrace interrupting a gentle incline sloping to the north- east. We used a single-channel-seismic (SCS) line acquired by the Thomas Washington during ROUNDABOUT Cruise 11 (0600 UTC, 21 December 1989). The seismic profile shows a full set of reflectors, comparable with those at Sites 289/586, with little or no distur- bance. Three holes were drilled, using the advanced hydraulic piston corer (APC) and the extended core barrel (XCB), with full recovery with the APC. Hole 806A, a dedicated hole, was cored with the APC to 83.7 mbsf into upper Pliocene sediments. Hole 806B was cored with the APC to 320 mbsf, at which point refusal occurred within the lower upper Miocene. The hole was continued with XCB coring to 743.1 mbsf, with 423.1 m of sediment cored and 331.2 m recovered (78%). Coring ended in the lowermost Miocene because of poor recovery. The hole was then logged. Hole 806C was cored with the APC to 309.6 mbsf and coring with the XCB was then begun. The aim was to core with the XCB to the lower middle Miocene a second time, and then drill ahead to search for the Oligocene/Mio- cene boundary. The attempt was successful. Drilling terminated in uppermost Oligocene sediments at 776.4 mbsf, with 278 m cored for a recovery rate of 73% and 188.8 m drilled without coring. 291
Transcript
Kroenke, L. W., Berger, W. H., Janecek, T. R., et al., 1991Proceedings of the Ocean Drilling Program, Initial Reports, Vol. 130
8. SITE 8061
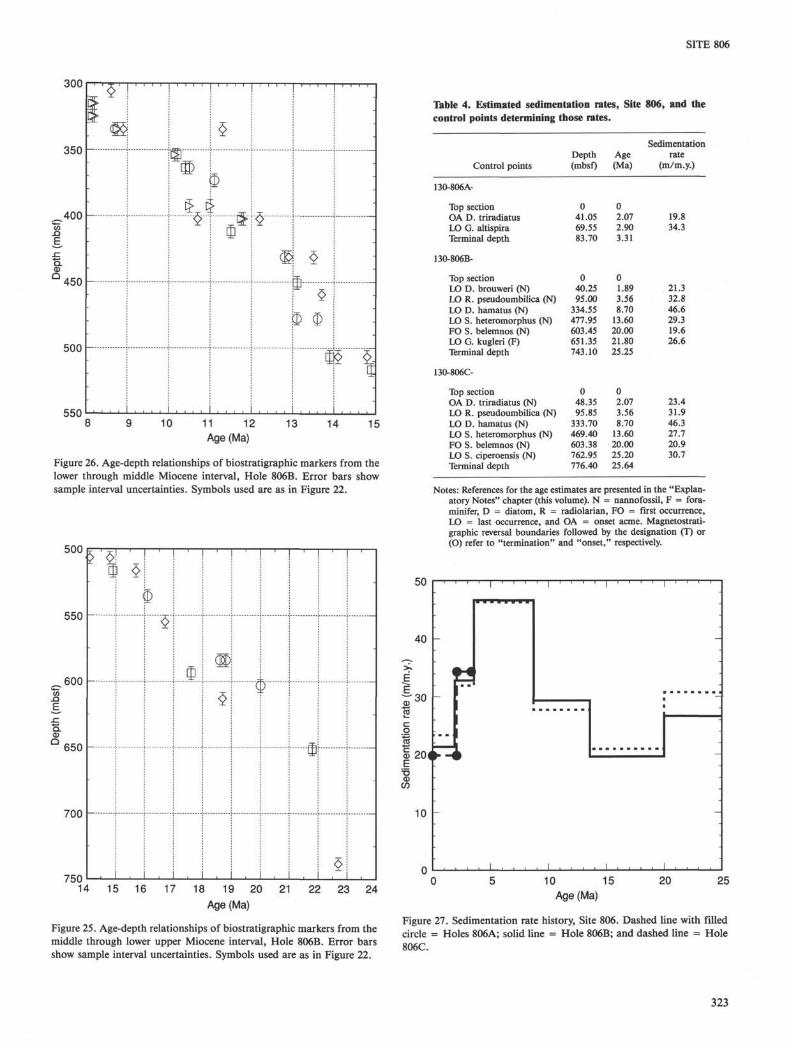
Shipboard Scientific Party2
HOLE 806A
Date occupied: 17 February 1990
Date departed: 18 February 1990
Time on hole: 1 day, 15 min
Position: 0°19.11'N, 159°21.68'E
Bottom felt (rig floor; m, drill-pipe measurement): 2531.8
Distance between rig floor and sea level (m): 11.14
Water depth (drill-pipe measurement from sea level, m): 2520.7
Total depth (rig floor; m): 2615.50
Penetration (m): 83.70
Number of cores (including cores with no recovery): 9
Principal results: Ocean Drilling Program (ODP) Site 806 (proposedSite OJP-1) is located on the northeastern margin of the OntongJava Plateau, close to the equator (latitude 0°19.1'N, longitude159°21.7'E) in 2520 m of water, roughly 125 km northeast of DeepSea Drilling Project (DSDP) Sites 289/586. The site represents theshallow end member on a transect that was designed to detect depth-related paleoceanographic signals in Neogene sediments. We occu-pied this site with the objective to obtain a high-resolution carbonaterecord in an undisturbed setting, which could serve as a standardsection for studies of ocean history, including biostratigraphy, che-mostratigraphy, and acoustic stratigraphy.
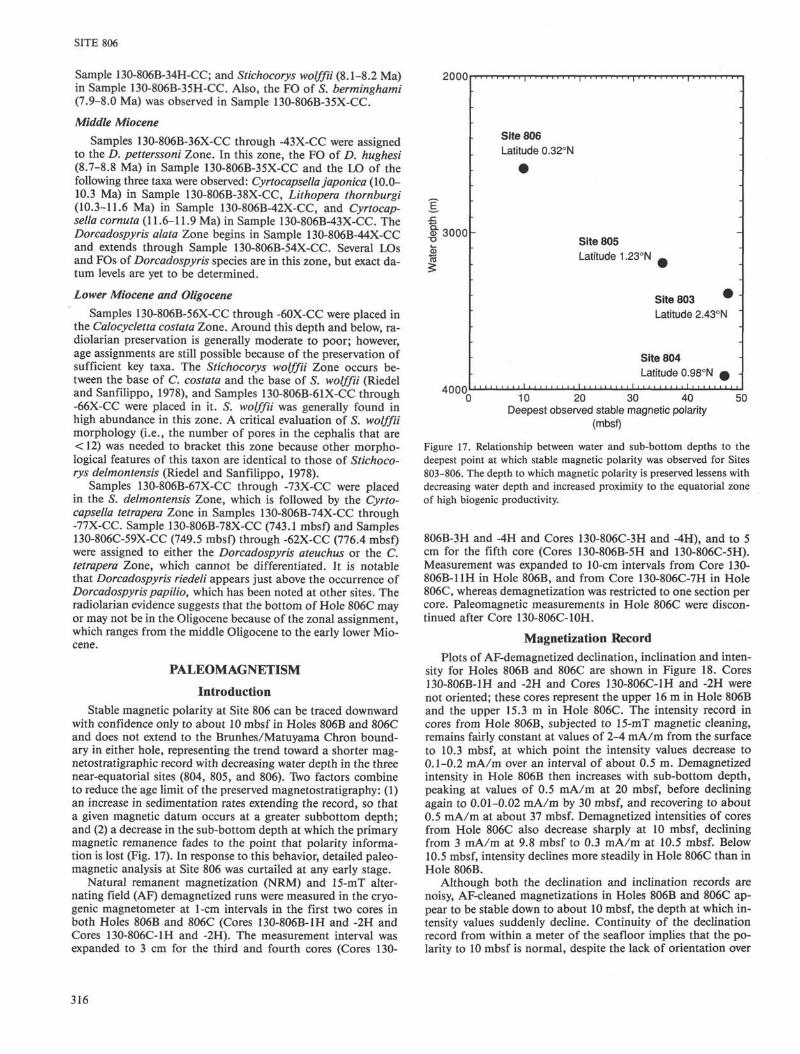
Site 806 was positioned at the proposed location (OJP-1), on a 2-km-wide terrace interrupting a gentle incline sloping to the north-east. We used a single-channel-seismic (SCS) line acquired by theThomas Washington during ROUNDABOUT Cruise 11 (0600 UTC,21 December 1989). The seismic profile shows a full set of reflectors,comparable with those at Sites 289/586, with little or no distur-bance.
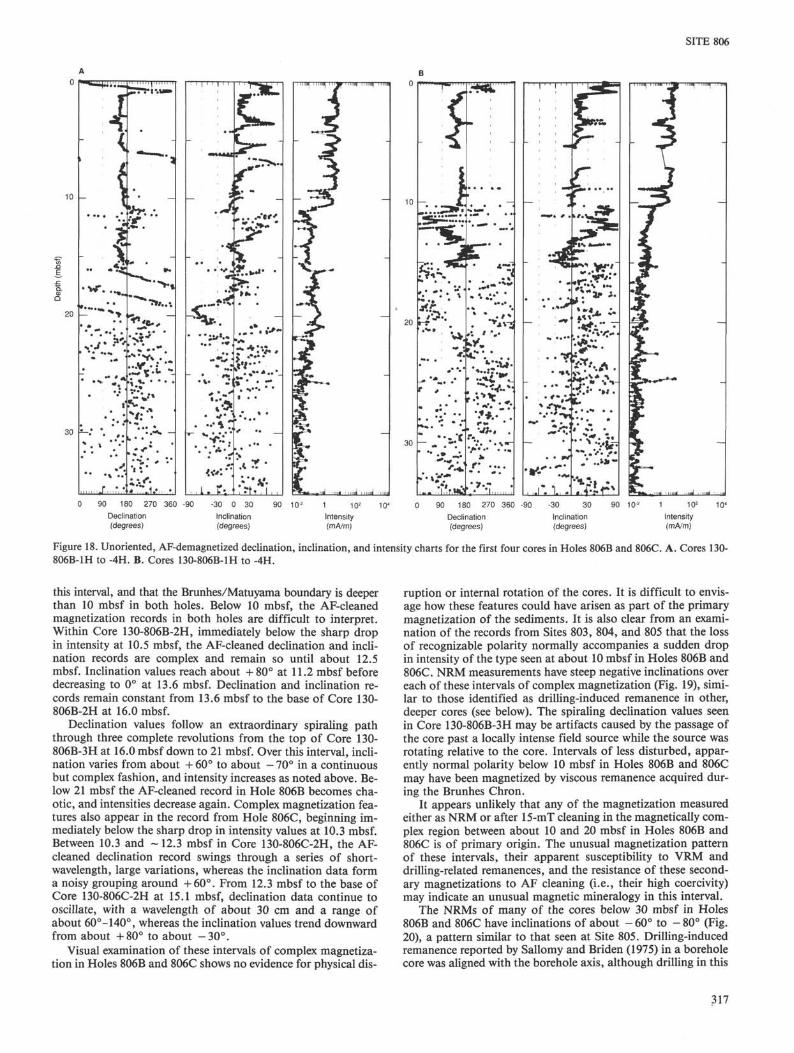
Three holes were drilled, using the advanced hydraulic pistoncorer (APC) and the extended core barrel (XCB), with full recoverywith the APC. Hole 806A, a dedicated hole, was cored with theAPC to 83.7 mbsf into upper Pliocene sediments. Hole 806B wascored with the APC to 320 mbsf, at which point refusal occurredwithin the lower upper Miocene. The hole was continued with XCBcoring to 743.1 mbsf, with 423.1 m of sediment cored and 331.2 mrecovered (78%). Coring ended in the lowermost Miocene because ofpoor recovery. The hole was then logged. Hole 806C was cored withthe APC to 309.6 mbsf and coring with the XCB was then begun.The aim was to core with the XCB to the lower middle Miocene asecond time, and then drill ahead to search for the Oligocene/Mio-cene boundary. The attempt was successful. Drilling terminated inuppermost Oligocene sediments at 776.4 mbsf, with 278 m cored fora recovery rate of 73% and 188.8 m drilled without coring.
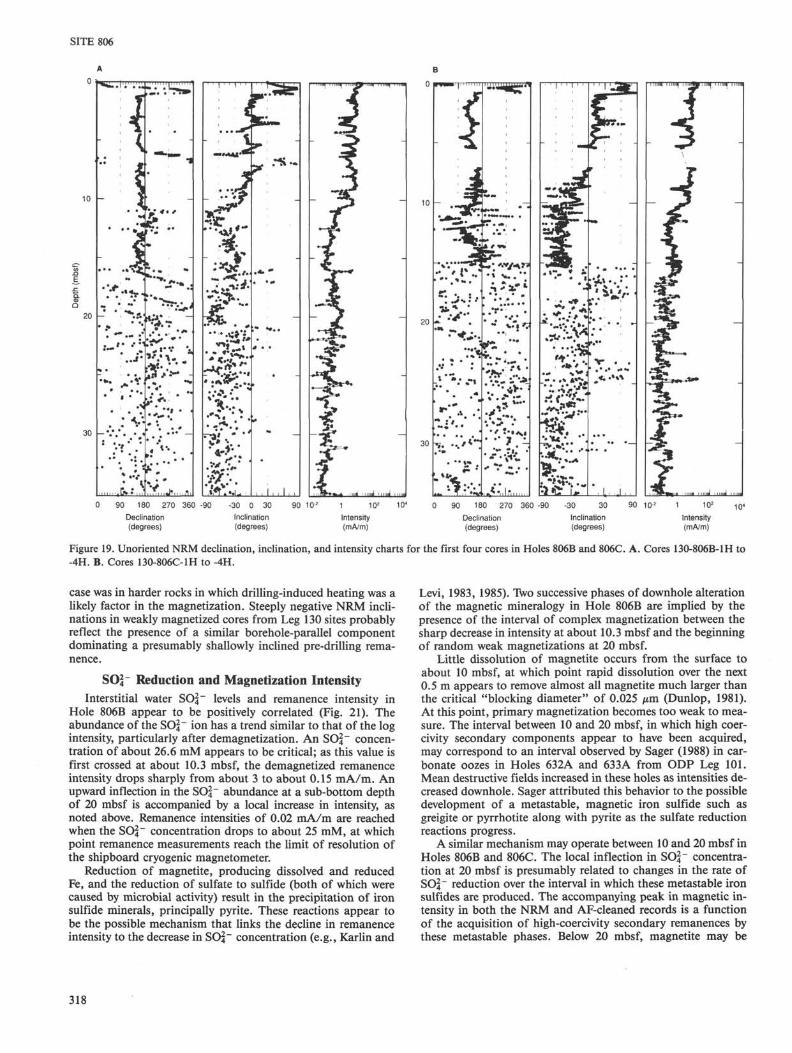
291
SITE 806
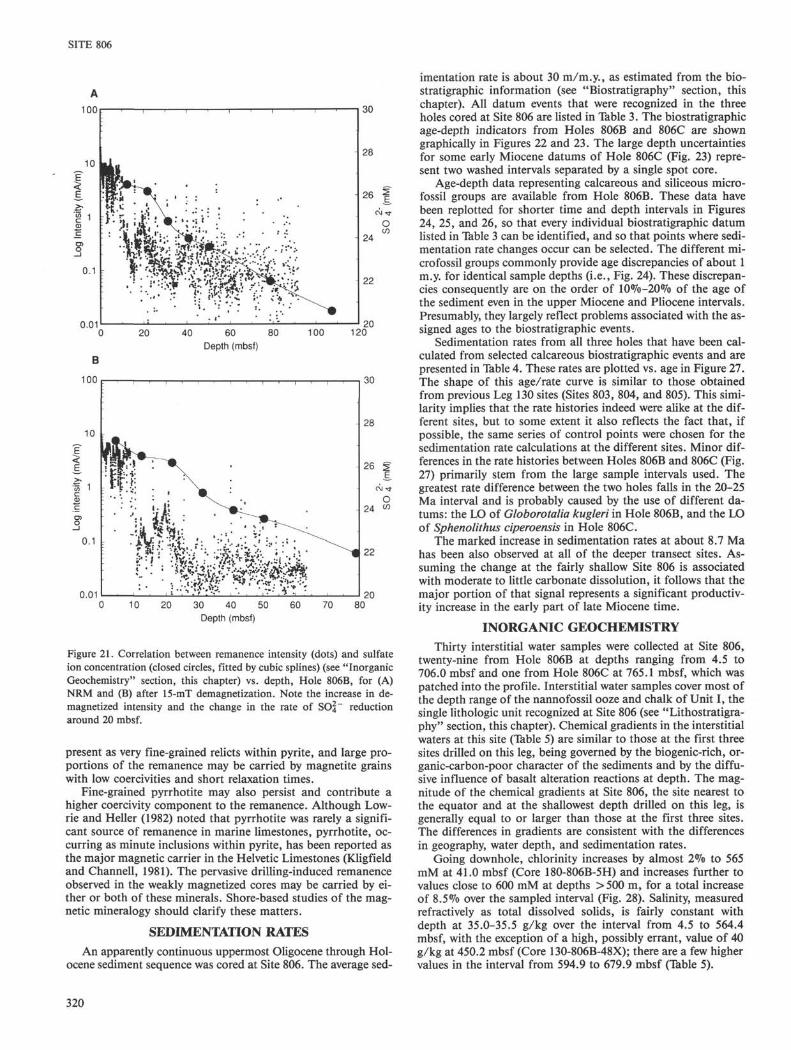
The entire sedimentary sequence encountered is considered asone lithologic unit (Unit 1), consisting of upper Oligocene to Pleisto-cene foraminifer nannofossil ooze and chalk to nannofossil oozeand chalk with foraminifers. Foraminifer abundances mostly rangebetween 15% and 30%, with occasional excursions to 10% and50%. Radiolarians are a minor constituent throughout the section.The ooze-chalk transition was placed between 338 and 340 mbsf; itis gradational and shows alternation of layers of varying induration,beginning at about 200 mbsf. The age of the sediments at the transi-tion is ca. 10 Ma. Sedimentation throughout the time interval repre-sented seems to have been continuous at this site.
Unit I is divided into two subunits at the ooze-chalk transition,as follows:
Subunit IA (0-339 mbsf) consists of Pleistocene to upper middleMiocene foraminifer nannofossil ooze to nannofossil ooze with fora-minifers. Carbonate content generally ranges from 90% to 95%, ex-cept in the Pleistocene where it drops to 85%-90%. The dominantcolor is white, but the topmost several meters are very pale browngrading to light gray below, and then to white. Bioturbation is com-mon throughout, ranging from slight to heavy. Liesegang banding iscommon throughout the subunit, although it appears to be fainterand more diffuse in appearance than at Sites 803-805. The best ex-amples are near the bottom of the subunit. Authigenic pyrite wasfound, associated with burrows, and a slight odor of H2S was occa-sionally noted on opening the cores. Microfaulting is rare. Sedi-ments are generally soft, but in the lowermost portion of Subunit IAintervals of greater lithification appear (below 200 mbsf). Coringwas impeded in one instance because of Porcellanite nodules (Core130-806C-34X) near the level of APC refusal. The shallowest Porcel-lanite nodules were found at 240 mbsf (ca. 8 Ma). A change in thevelocity-depth gradient occurs at this level. Deeper in the section, atthe ooze-chalk transition, the character of the velocity profile notice-ably changes: above this level, high-frequency variations are distinct;below it, they are subdued.
Subunit IB (339-776 mbsf) consists of lower upper Miocene toupper Oligocene foraminifer nannofossil chalk to nannofossil chalkwith foraminifers, with a few intervals of nannofossil chalk. Fora-minifer content is high (around 30%) down to about 600 mbsf (ca.20 Ma) and decreases somewhat below that level. Radiolarian con-tent is low. Carbonate content typically fluctuates between 90% and95%. The color is dominantly white. Color banding occurs through-out; bands become thinner and more distinct with depth in the sub-unit. Small-scale flaser structures are present. Bioturbation is ubiq-uitous. Rare, centimeter-size Porcellanite nodules were observed atseveral levels (350 and 510 mbsf). The depth gradient of dissolved sil-ica is reduced at 350 mbsf and between 450 and 550 mbsf, possibly inresponse to precipitation.
The sediments in the chalk section posed no problem for coringwith the XCB, down to the Oligocene/Miocene boundary zone,where recovery decreased. However, even where recovery is verygood, core contents are largely broken up and brecciated, with evi-dence for grinding of chalk on chalk. This type of recovery is typicalfor the material below 320 mbsf, that is, the section cored with theXCB. The Oligocene/Miocene boundary is located between 740 and750 mbsf, and apparently is without hiatus (although recovery ispoor at this level). Sedimentation rates for the deep chalk sectionvary between 20 and 30 m/m.y., the same as for the upper portion ofthe chalk subunit.
The entire Miocene section exhibits little change in foraminifercontent, carbonate percentage, and grain size; it also shows a steadyincrease in density and velocity with depth. The middle Miocene ischaracterized by rather high foraminifer abundances, with a mini-mum at the transition to the upper Miocene. Sedimentation rates in-crease from around 20 m/m.y. in the lower Miocene to more than 40m/m.y. in the upper Miocene. Above the middle Miocene/upper Mi-ocene boundary, there is a carbonate minimum. This feature corre-lates with a zone of increased dissolution in the eastern equatorialPacific. Carbonate values reach a maximum (near 95%) in the mid-dle portion of the upper Miocene and tend to decrease to the present,with increasing variability reflecting increasing fluctuations in thecarbon chemistry of the ocean. Sedimentation rates decrease in thelate Pliocene (to around 20 m/m.y. for the Pleistocene), despite thefact that the site was further off the equator in the late Miocene.
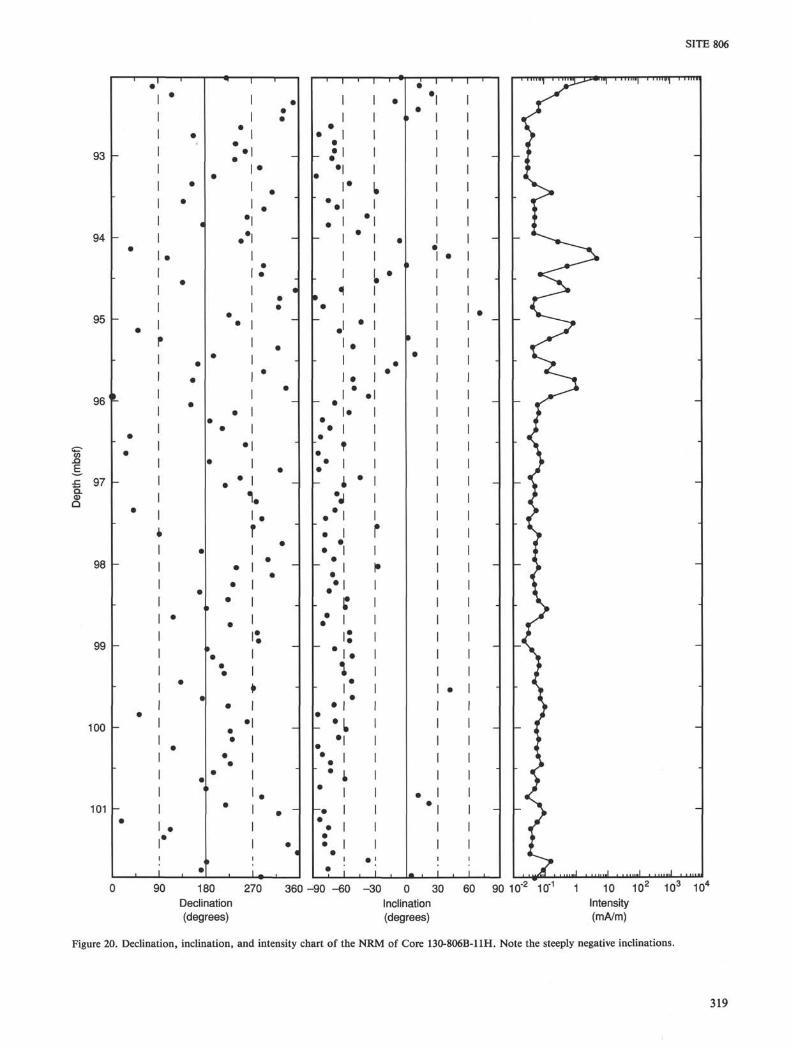
Magnetostratigraphies were produced for the uppermost sectionof the two holes. The high productivity experienced at this site, how-ever, is not conducive to the retention of a magnetic signal.
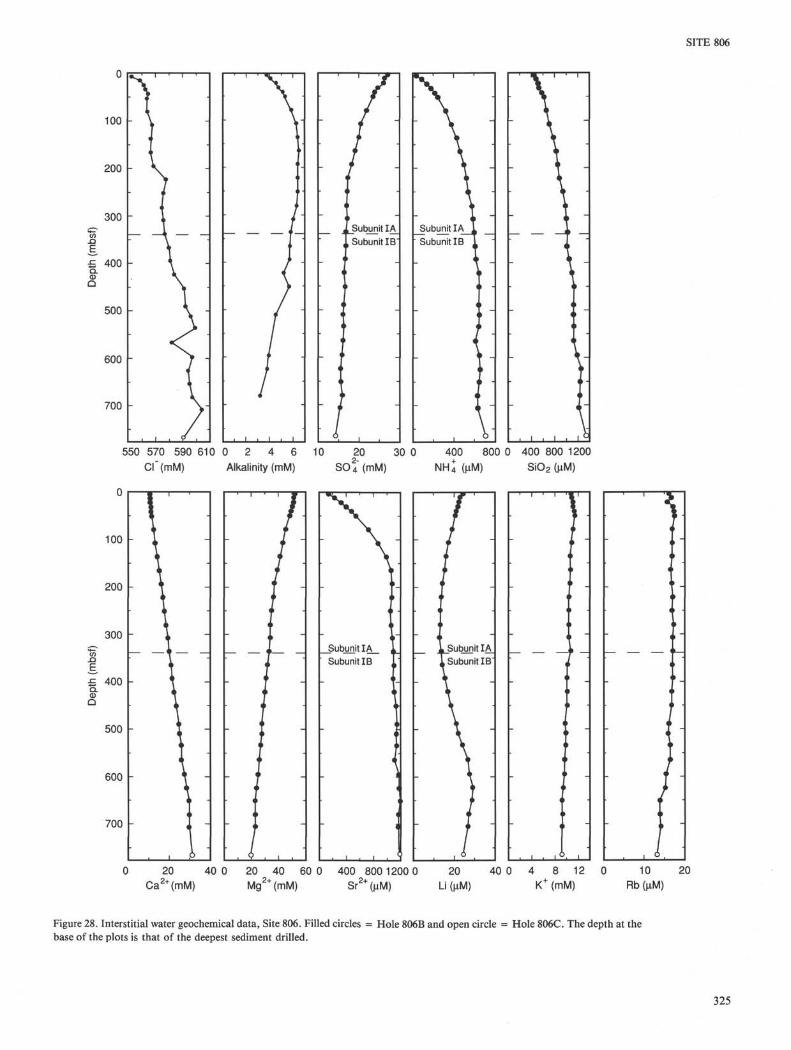
Chemical gradients in interstitial waters at this site are generallysimilar to those at Site 803 and 805, reflecting the calcareous/sili-ceous nature of the sediments and the paucity of organic material. Asomewhat higher supply of organic matter at this shallower site,close to the equator, tends to produce slightly stronger gradients.Calcium and magnesium gradients, influenced by basalt alterationreactions at depth, show the usual negative correlation. Strontiumconcentrations reflect recrystallization processes, which appear to bemore vigorous at this site than at the other two, because of thehigher sedimentation rates and the higher supply of organic matter.Dissolved silica shows a steady increase with depth, except for theminor reversals mentioned.
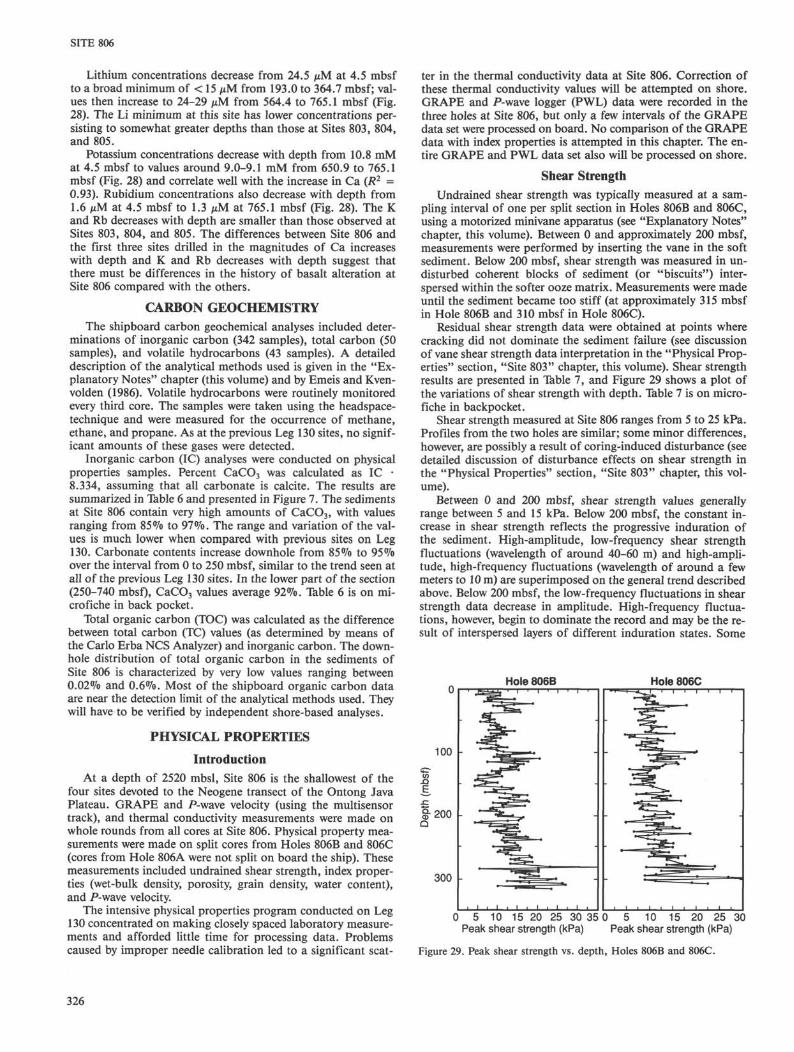
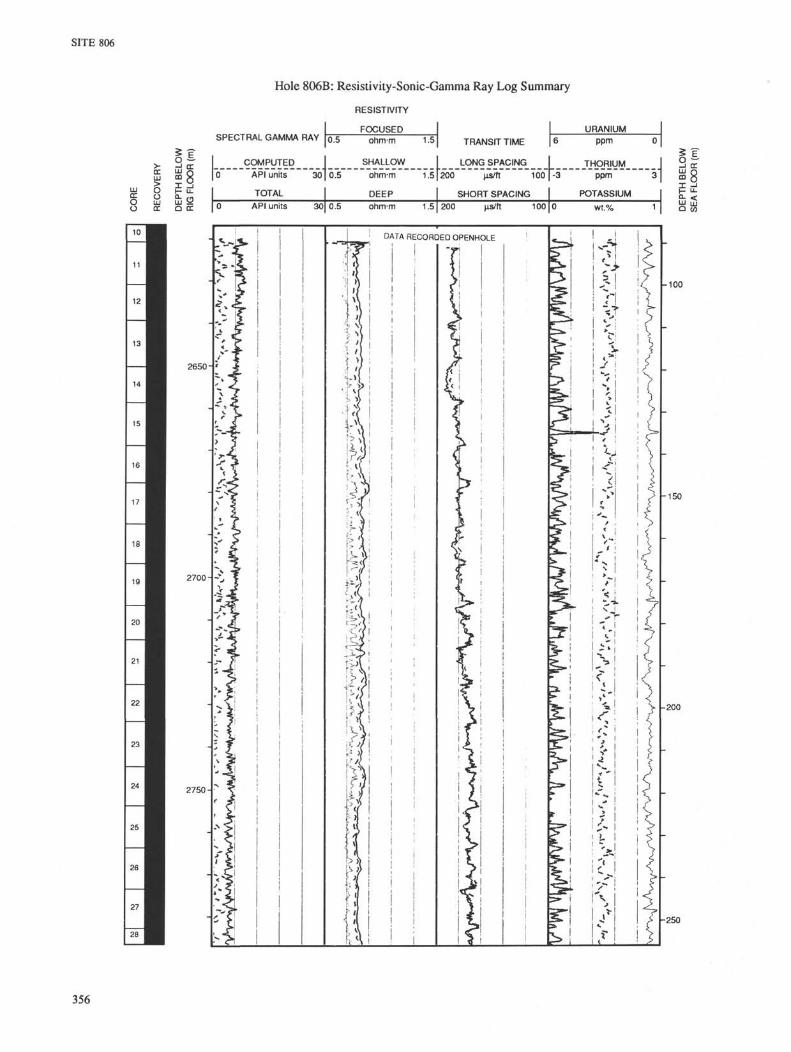
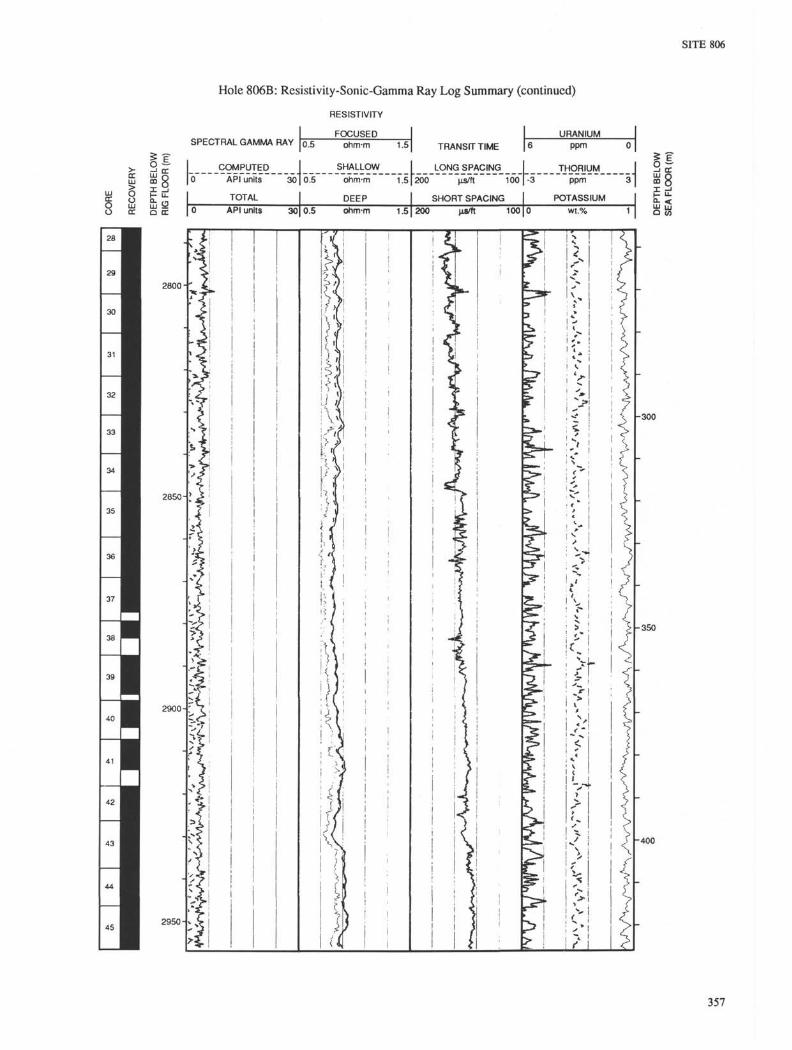
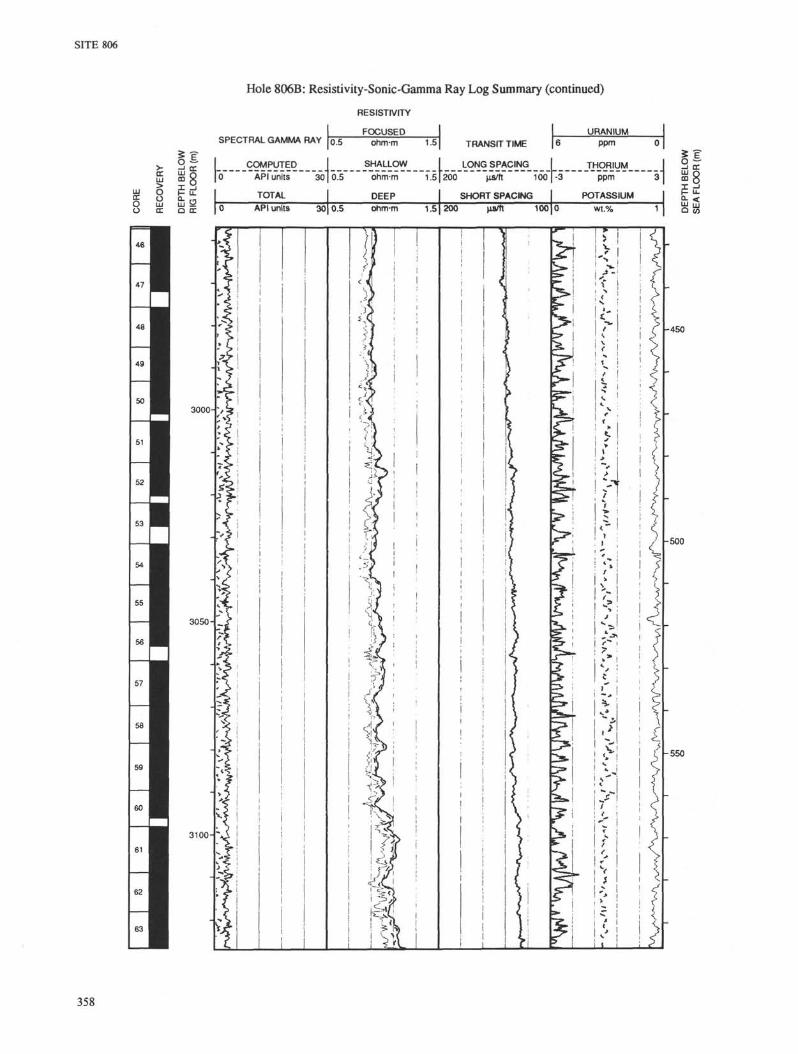
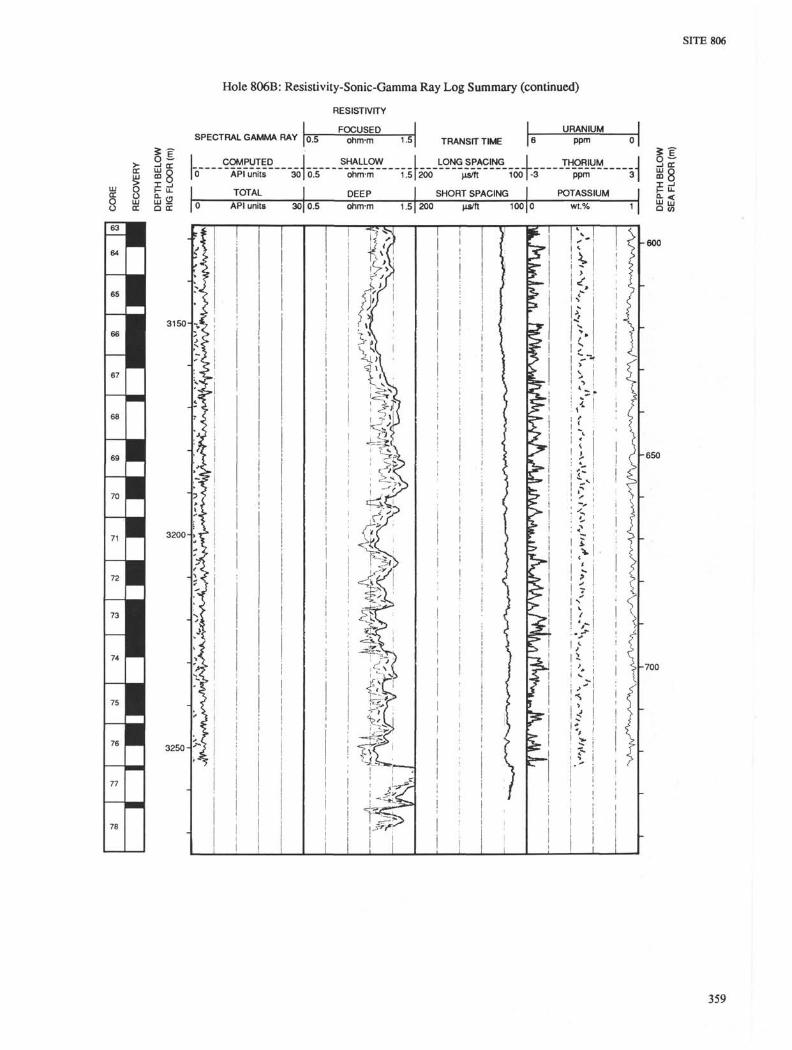
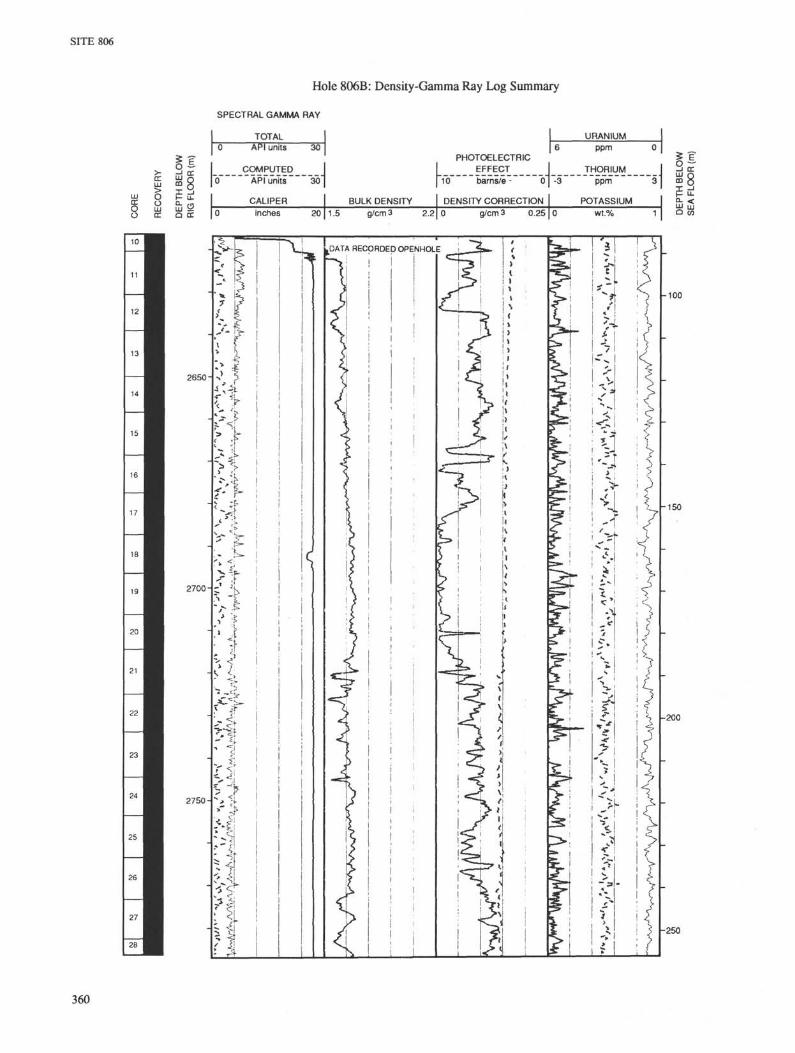
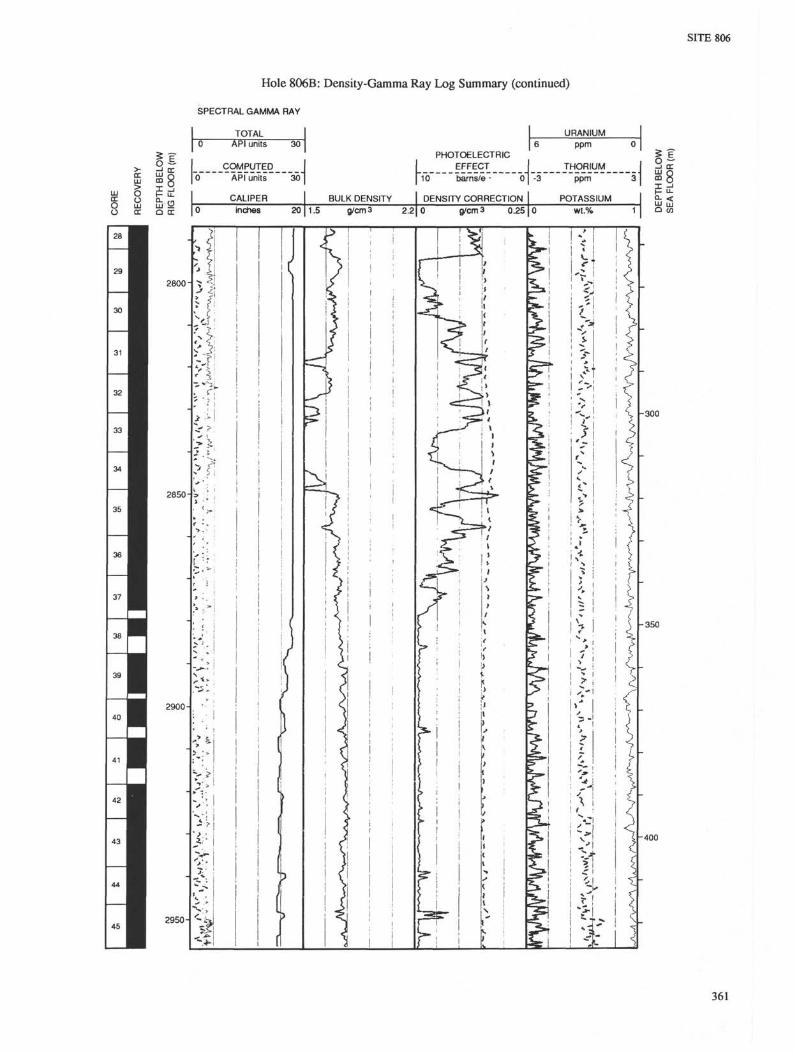
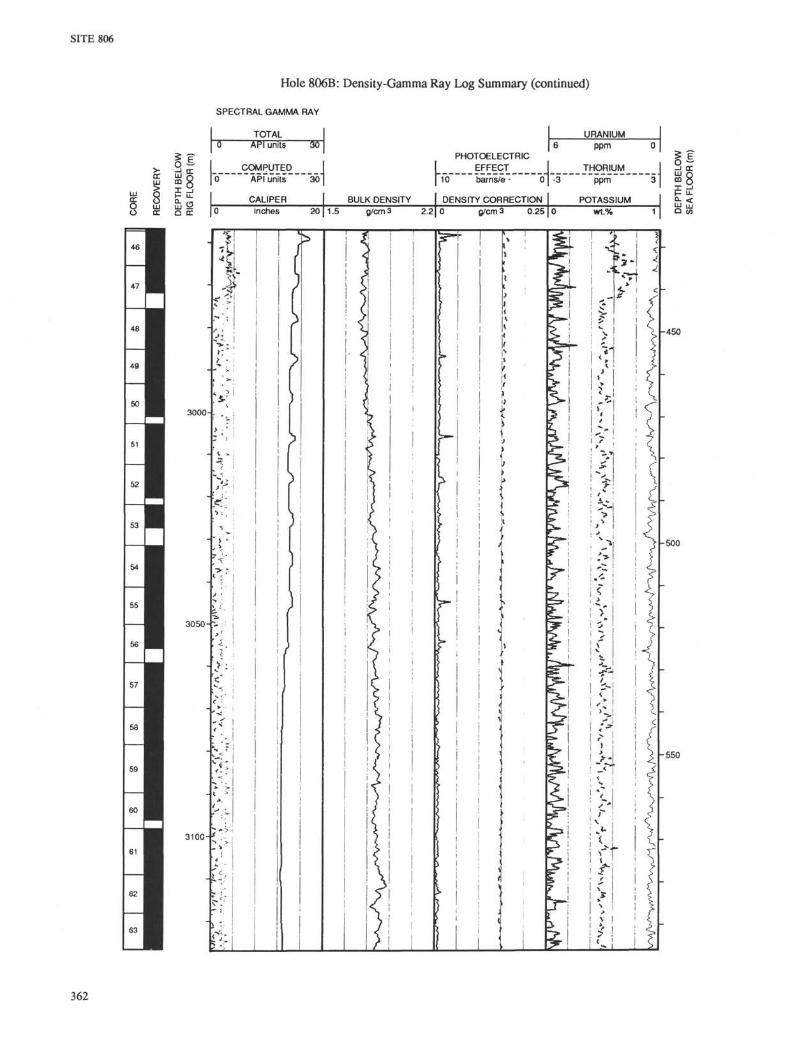
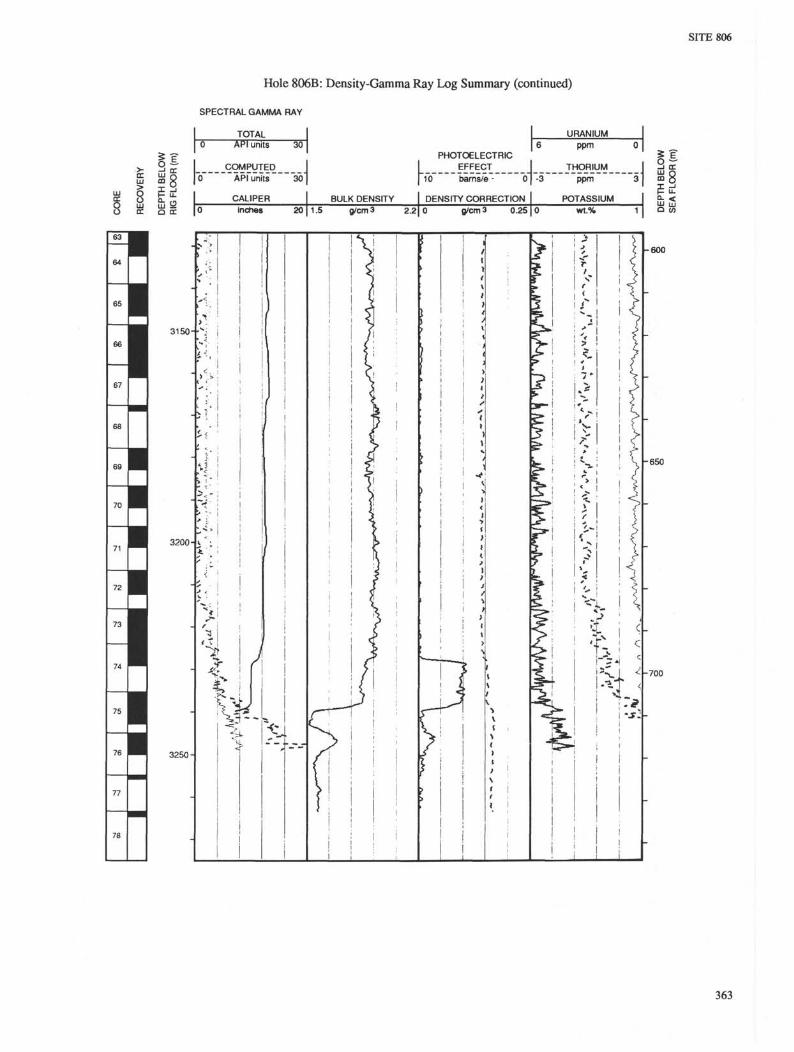
Excellent logs were obtained for sound velocity and density atSite 806. The fact that this site has continuous sedimentation at highrates will make these logs especially valuable for the interpretation ofseismic profiles and for the study of Milankovitch cycles.
BACKGROUND AND OBJECTIVES
Overview
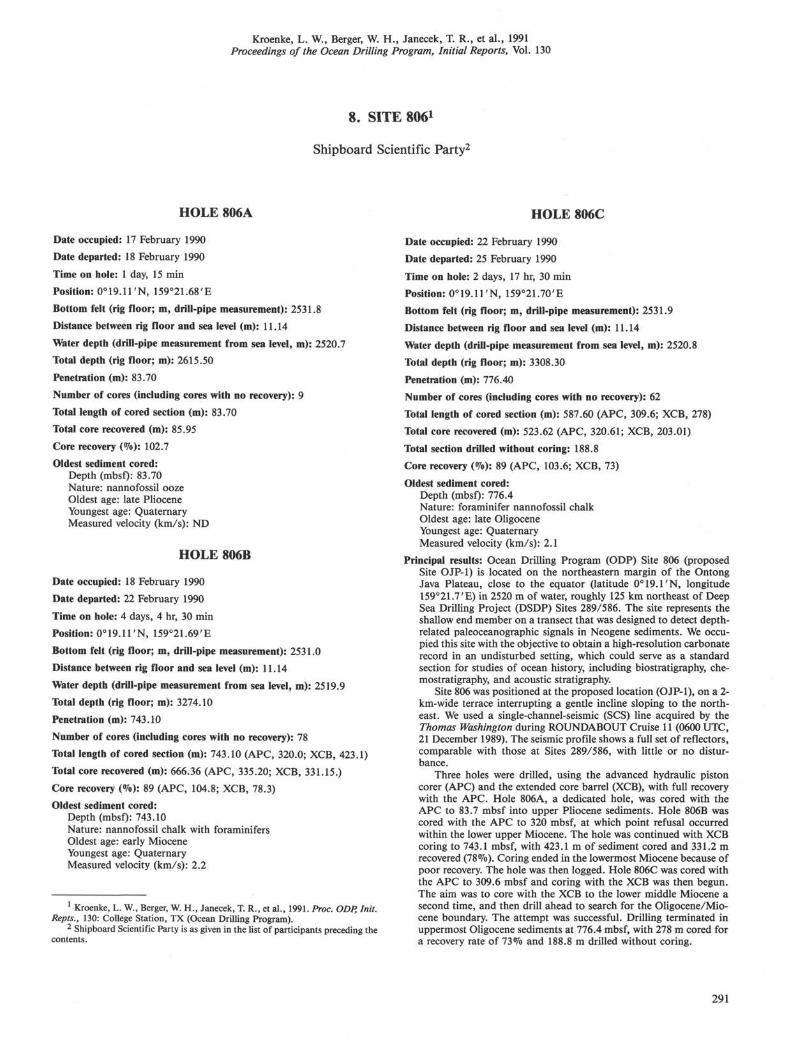
Site 806, the shallow-water anchor site of the Neogene depthtransect on the Ontong Java Plateau, was drilled near target SiteOJP-1 (2600 m) (Fig. 1). The site lies half-way between Site 805and DSDP Site 586, and is intermediate in depth between thetwo. It is well above the present lysocline and just slightly northof the equator, in the region of maximum Pleistocene sedimentsupply rate. Effects of varying dissolution are expected to besubdued at this depth, and the high rate of accumulation shouldprovide for maximum resolution within the Neogene record.Thus, the productivity history, and its ramifications for physicalproperties, should be optimally recorded in sediments accumu-lating at rates of 20-40 m/m.y. We expected to recover rich trop-ical assemblages of pelagic and benthic microfossils from thesesediments, for use in paleoceanographic and biostratigraphicstudies of the Neogene.
The site was planned for multiple coring in the upper portionof the section (Neogene and Quaternary), including two APC-cored holes to 250 mbsf, a third hole to 50 mbsf, and XCB-cor-ing to 600 mbsf. The multiple coring was expected to provide foroverlap between cores and for sufficient material for concurrenthigh-resolution studies. Logging was to provide the informationnecessary to interpret seismic reflection profiles, for correlationbetween holes, and for three-dimensional reconstruction of sed-imentation rates.
Background
The general background to this site is contained in the "In-troduction" chapter (this volume; also see Kroenke, 1972). TheOntong Java Plateau is a broad, shallow, mid-ocean highland inthe western equatorial Pacific. Its shallowest regions lie above2000 m, and its flanks reach depths in excess of 4500 m. Withan area of 1.5 million km2, it is the largest of the "classic" Pa-cific plateaus. The plateau has a crustal thickness on the order of40 km. Apparently, it roughly maintained its present depth overmuch of its history, indicating isostatic equilibrium. Crustal seis-mic velocities are in the range of that of oceanic crust (Hussonget al., 1979).
The pelagic sediment cover of the plateau is uniquely suitedfor paleoceanographic studies. The maximum thickness of thesediment is over 1200 m and occurs below the top of the pla-teau, in water depths between 2000 and 2500 m. The sedimentthins by roughly 100 m for every 200 m of water depth increasebelow 2200 m (Berger and Johnson, 1976). At Site 806, the sedi-ment is approximately 1200 m thick.
Site 806 was planned as the shallow-water, end-member siteof a Neogene depth transect in the equatorial portion of the On-
292
SITE 806
10°N
-̂ "5 \r^\ J
4460"-- ' \ **»>
155C 160c 165°EFigure 1. Bathymetry in meters of the northwestern part of the Ontong Java Plateau (after Mammerickx and Smith, 1985). The locations of the Leg130 sites as well as DSDP Sites 64 and 289/586 are shown. Contour interval is 100 m.
293
SITE 806
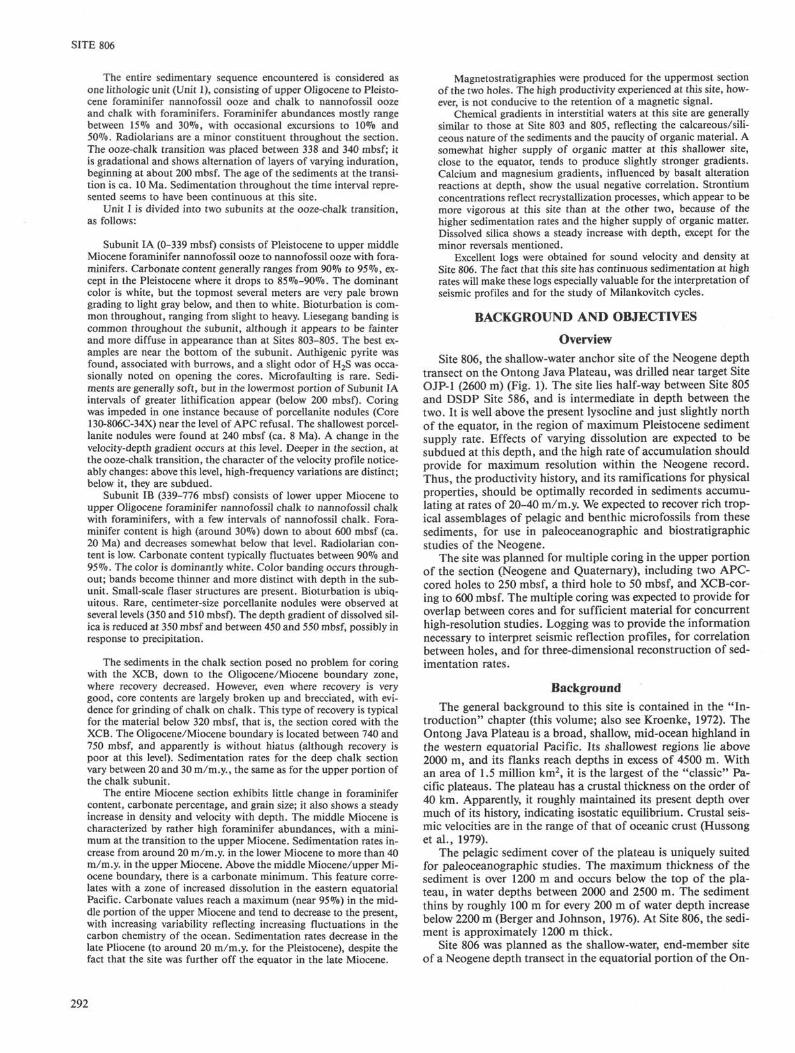
tong Java Plateau, designed for the study of paleoceanographicevents of global significance. In this transect, this site shouldhave the highest sedimentation rates and the best preserved car-bonates, containing the most complete paleoceanographic rec-ord. Problems arising from the creep of large sediment bodies,ubiquitous at water-depths between 3000 and 4000 m, seem tobe of much reduced importance at this shallower depth. The siteis well above the significant offset between the basement of theplateau and that of the deep ocean floor, which influences sedi-ment stability further down the plateau flank (Fig. 2). Thus, al-though earthquakes presumably affect the area occasionally, thedamage they can do is more restricted in extent (Berger et al.,1977). Selection of a suitable site to drill a continuous record ismuch less difficult under these conditions than in the deepersites.
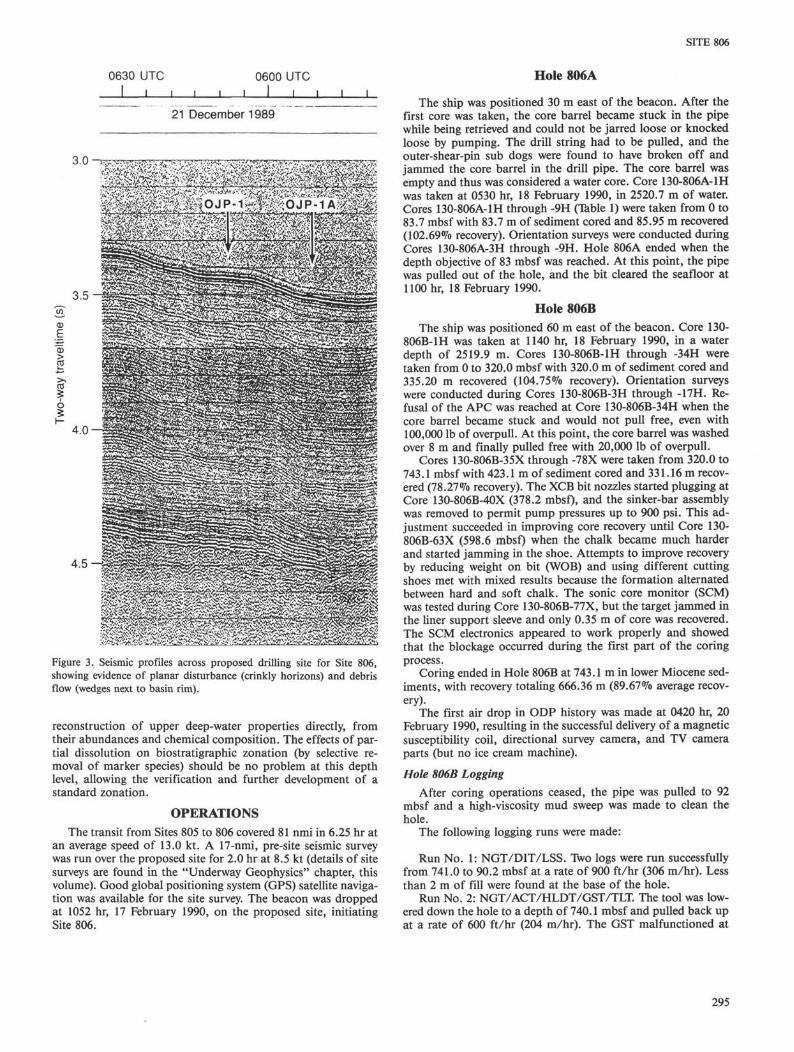
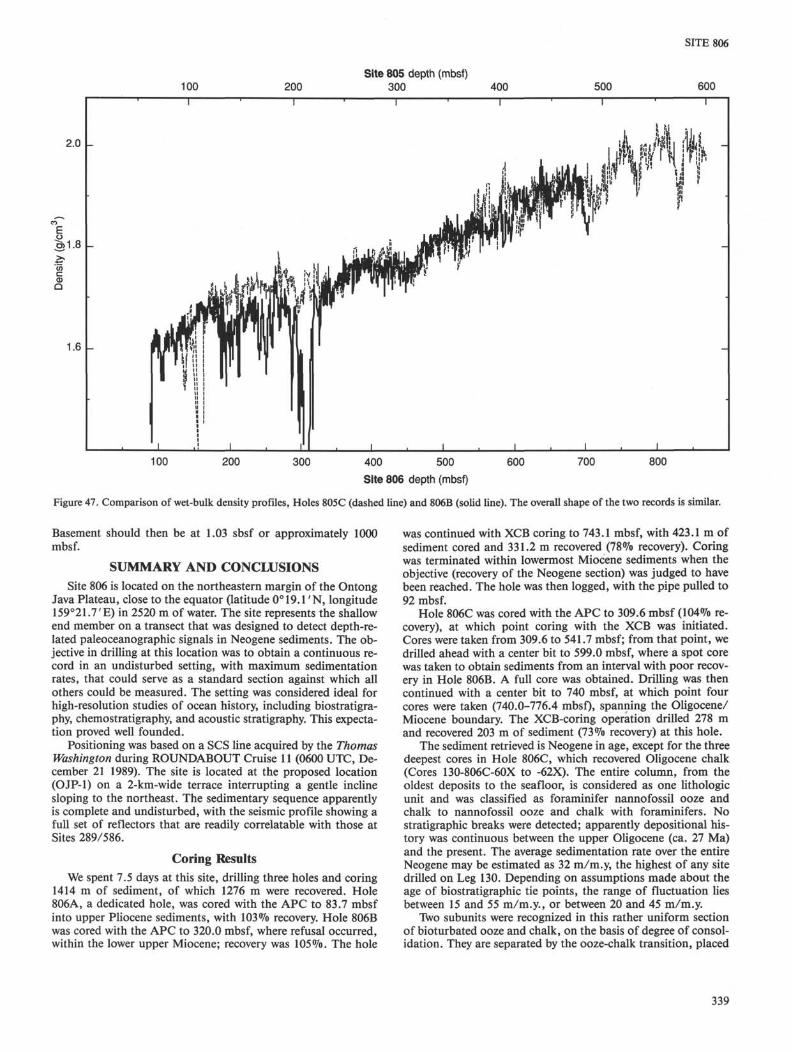
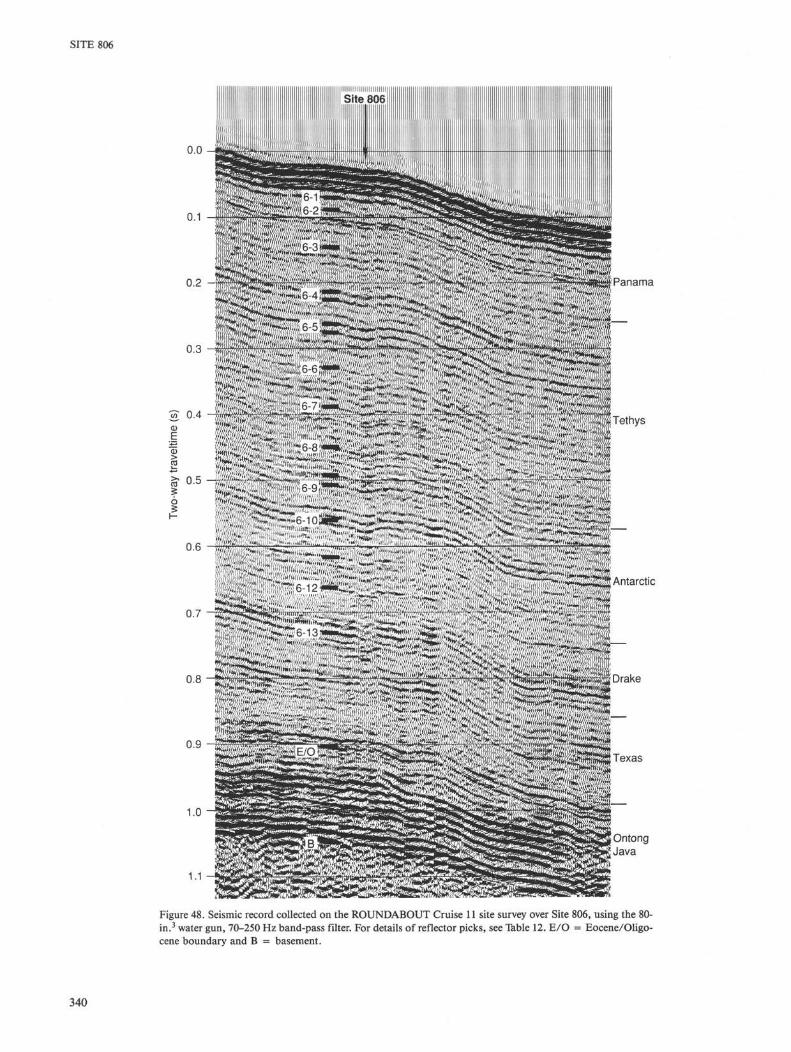
The seismic profiles across Site 806 (taken from the ROUND-ABOUT survey conducted in December 1989) show gently dip-ping parallel reflectors with very little disturbance, except atdepths well below the section of interest here, that is, below 800mbsf (Fig. 3). We therefore expected to encounter a rather com-plete section at this site.
The plateau has long been the focus of Quaternary paleocean-ographic studies based on conventional coring (e.g., Shackletonand Opdyke, 1976; Wu and Berger, 1989). Leg 130 is the fourthdrilling expedition to sample the sediment cover here. ThreeDSDP sites on the plateau were rotary-drilled: participants onLeg 7 drilled and spot-cored Site 64 (Shipboard Scientific Party,1971); and on Leg 30 the participants drilled and continuouslycored Sites 288 and 289 (Shipboard Scientific Party, 1975). Theupper 969 m in Site 289 consisted of upper Eocene to Pleisto-cene nannofossil foraminifer chalks and oozes. The section wasfound to be continuous from the lower Oligocene on, the top ofwhich was reached at 890 mbsf. Semilithified chalk first appearsnear 250 mbsf (late Miocene). Results of paleoceanographicstudies on Site 289 are reported in Kennett (1985). A fourthDSDP site, Site 586, drilled on Leg 89 next to Site 289, wascored with the hydraulic piston corer to 305 mbsf, reaching up-
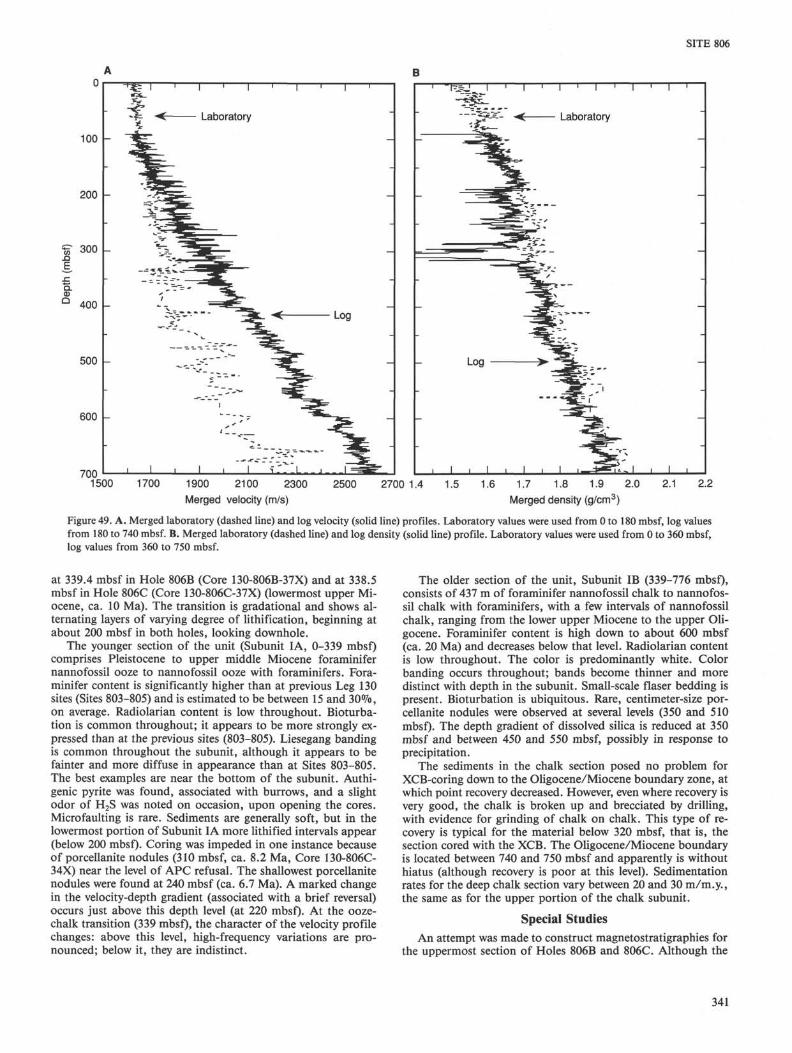
per Miocene sediments (Shipboard Scientific Party, 1986). Well-preserved nannofossil ooze was recovered.
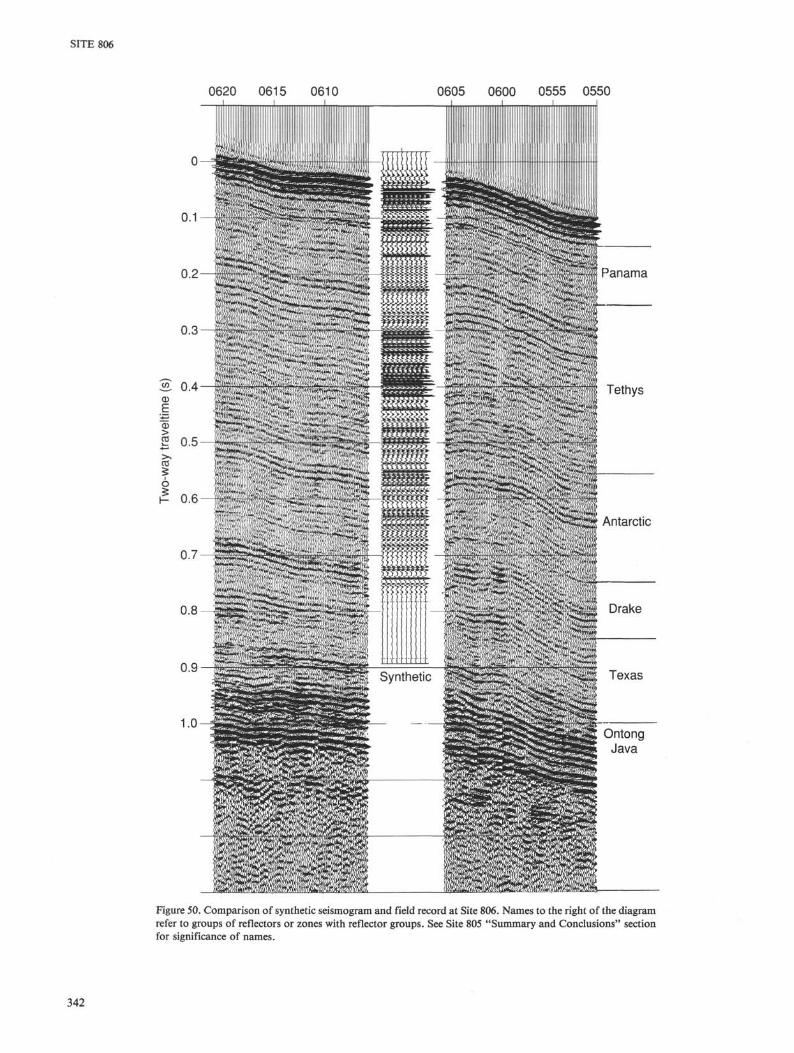
ObjectivesSite 806 was planned as the shallowest site within the series
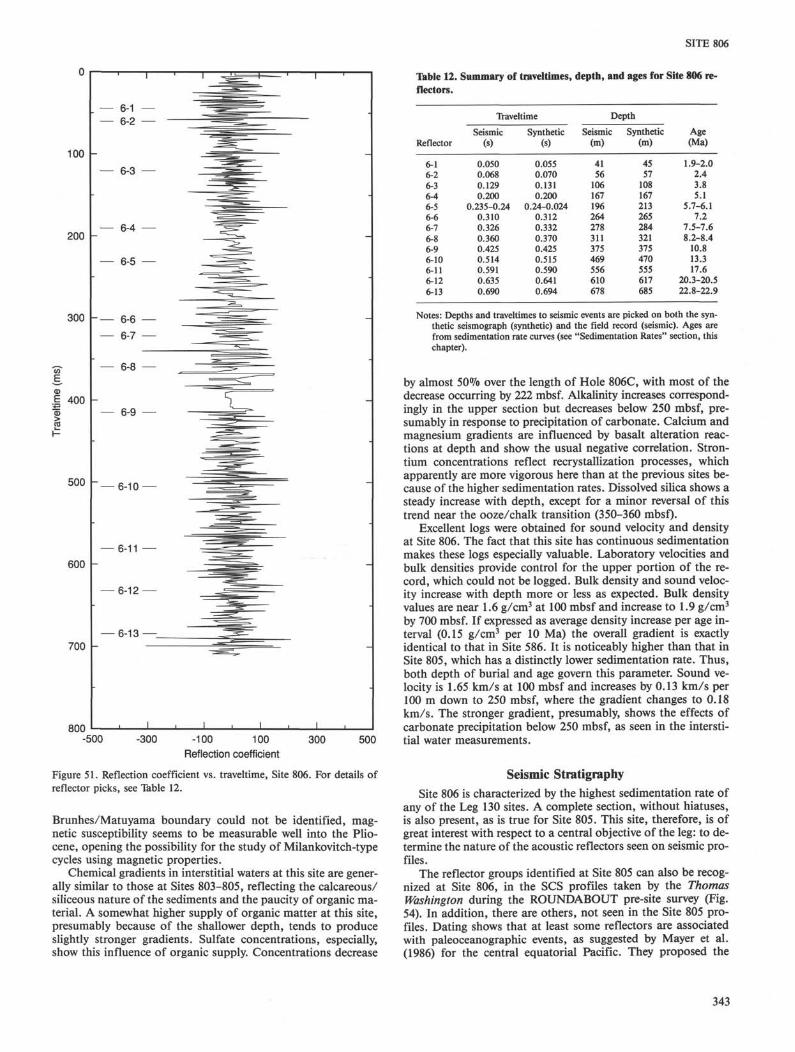
of four equatorial sites constituting the Neogene depth transect(Sites 803-806; Fig. 1). The general objective of this transectwas to detect depth-related paleoceanographic signals. The sedi-ments sampled along the transect are produced in the same sur-face-water conditions and thus arrive on the seafloor more orless in the same pelagic rain. Differences in physical, chemical,and paleontological properties, therefore, can be largely attrib-uted to a depth effect.
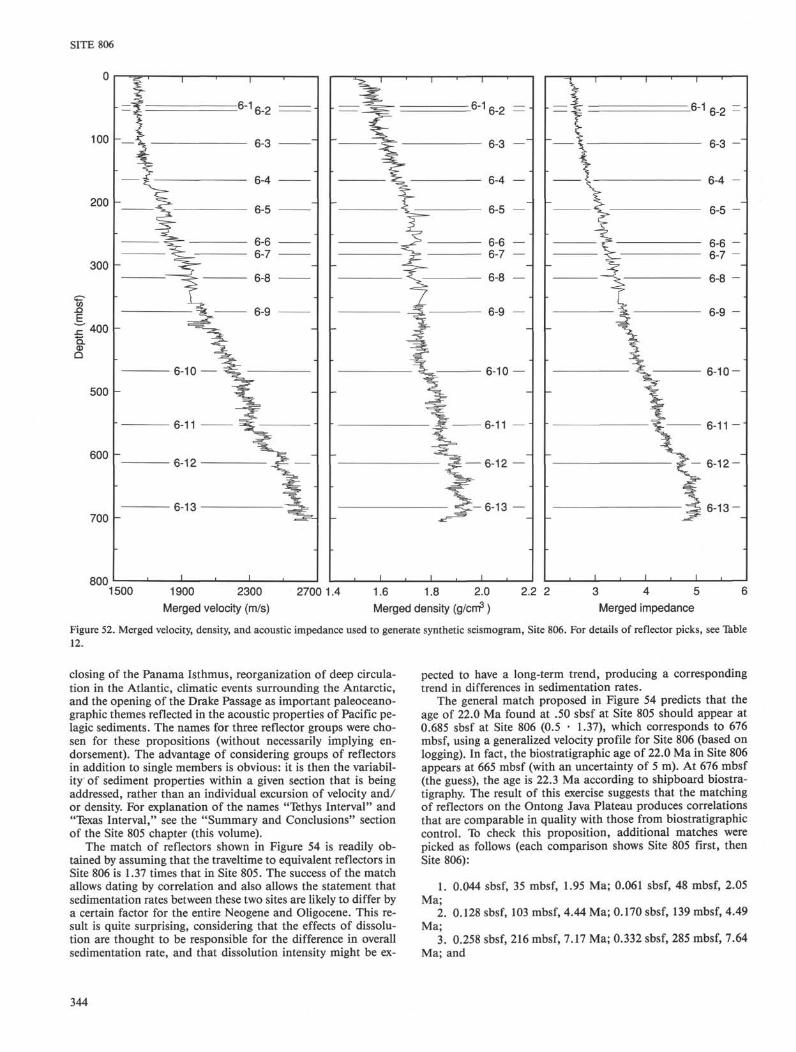
The depth sampled at Site 806 (Fig. 1), well above the mod-ern lysocline in this region, is that which should show the great-est preservation and the least influence from variations in disso-lution intensity. Thus, physical properties should show a signalthat can serve as a standard, for comparison with the deepersites. In turn, this would allow the identification of the factorsthat are responsible for producing the lithologic changes andwhich are detectable in the acoustic stratigraphy (productivitychanges, dissolution events). The objective was to explore whetherthrough such effects a clear linkage can be established betweenpaleoceanographic events and acoustic stratigraphy (Mayer etal., 1986). Hiatus formation (presumably also linked to pale-oceanographic events; Barron and Keller, 1982) should be at aminimum here. Establishing such linkages should allow three-dimensional mapping and correlation into distant sediment sec-tions throughout the Pacific basin.
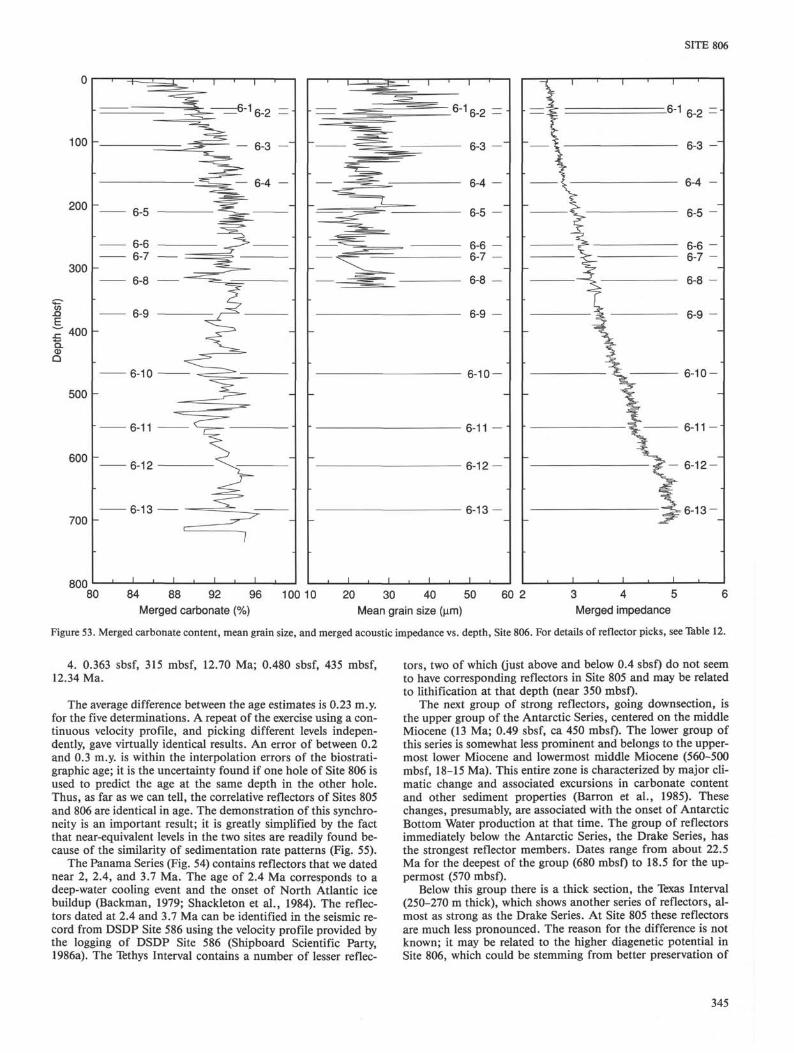
Regarding biostratigraphic objectives at this site, it was ex-pected that changes in the relative abundance of calcareous andsiliceous fossils and in the isotopic composition of planktonicforaminifers should provide clues to changes in intensity of pro-ductivity. An important objective is the determination of theoriginal sedimentation rates, as a function of productivity his-tory, with attendant implications for the study of the oceaniccarbon cycle. The recovery of benthic foraminifers should allow
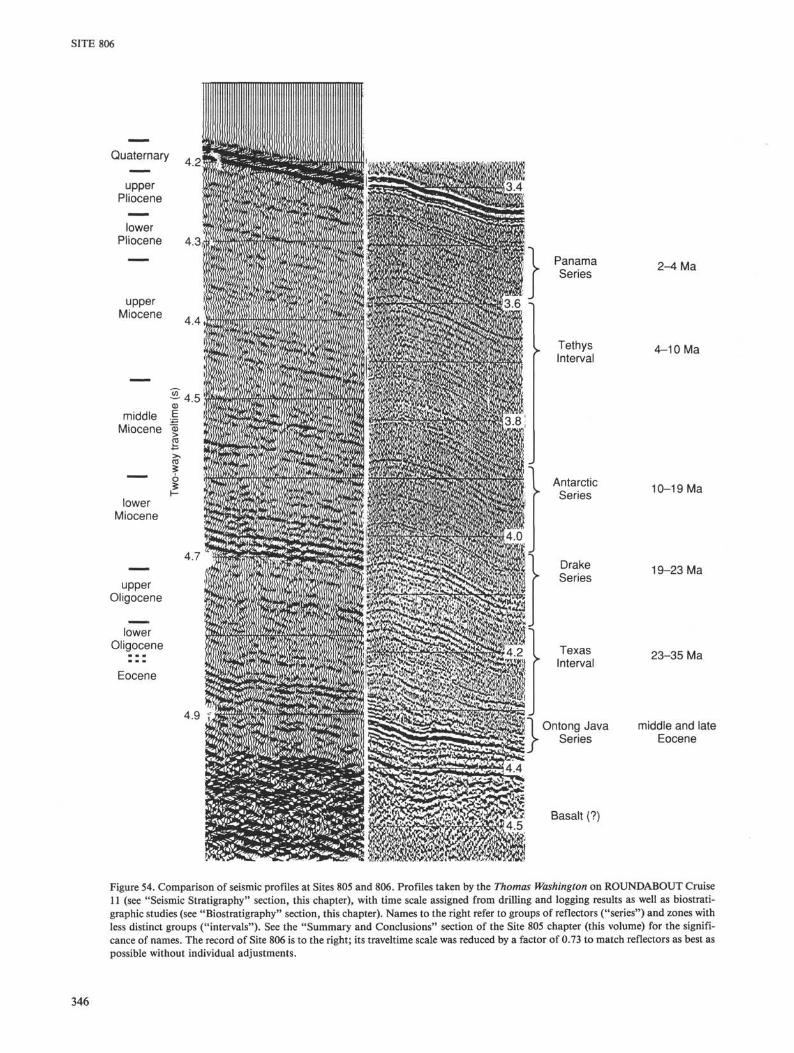
WSW ENE
I4o
Q.
Q
Sites 289/586
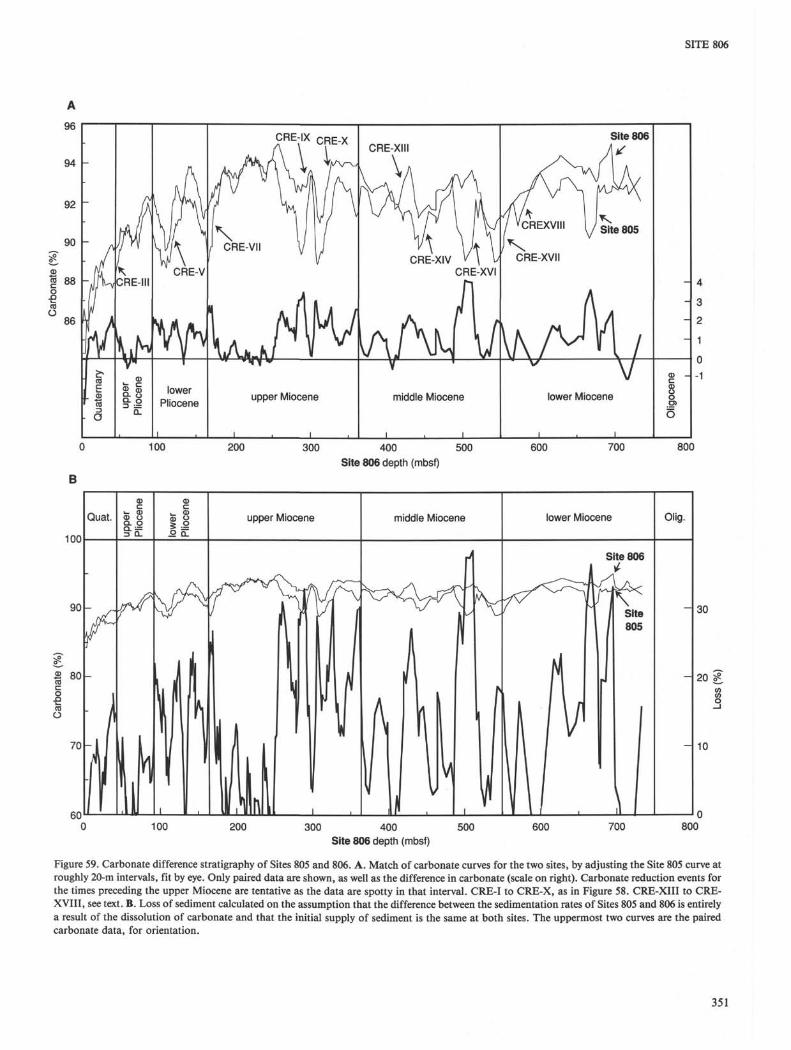
100
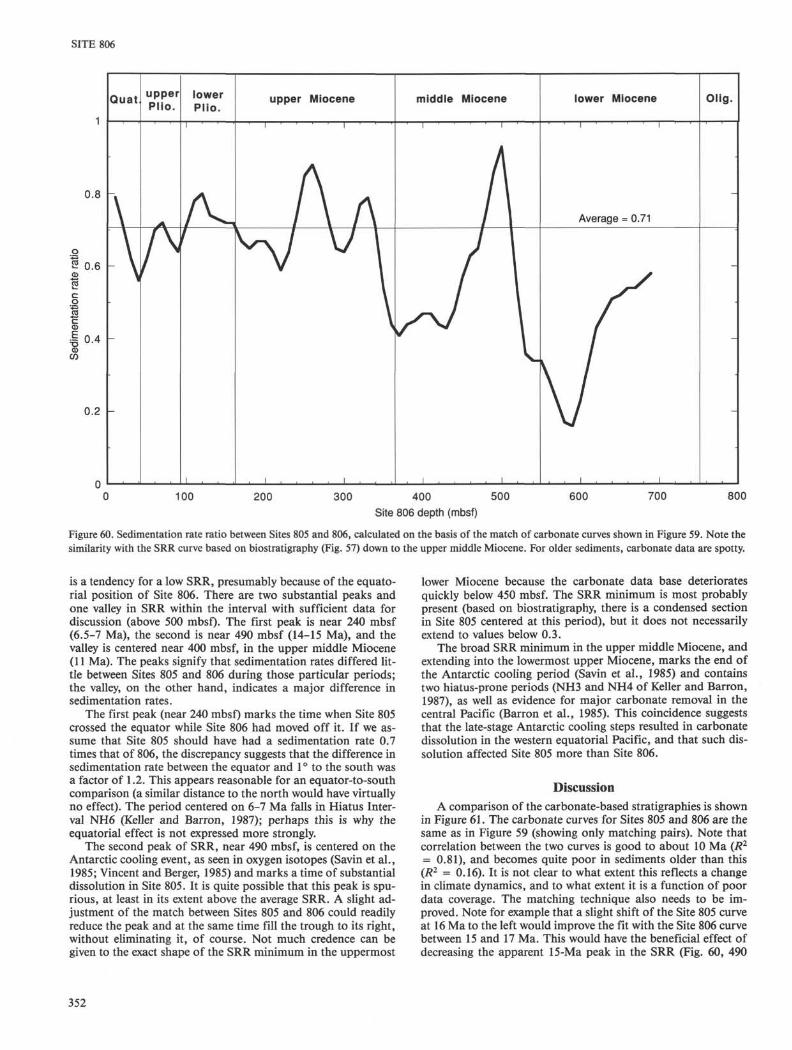
Figure 2. Simplified acoustic stratigraphy for the flank of the Ontong Java Plateau, and approximate location of Sites 803-806 (the depth transect).
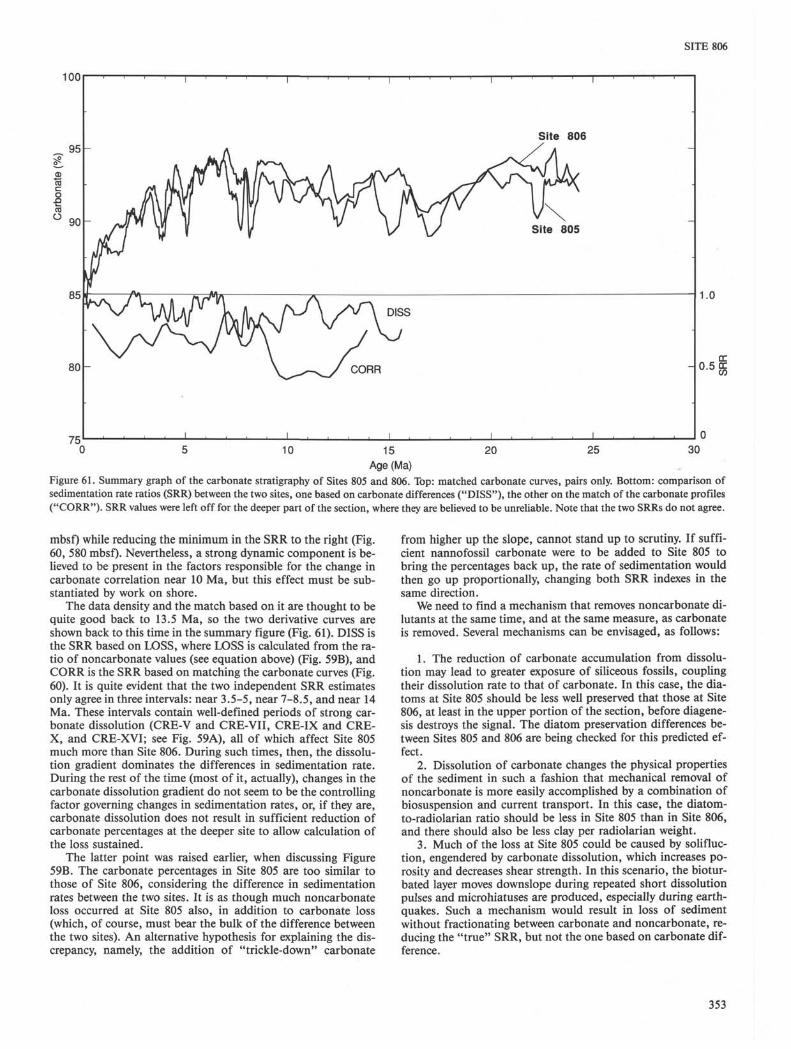
294
SITE 806
0630 UTCI . ,
0600 UTCj i i i
21 December 1989
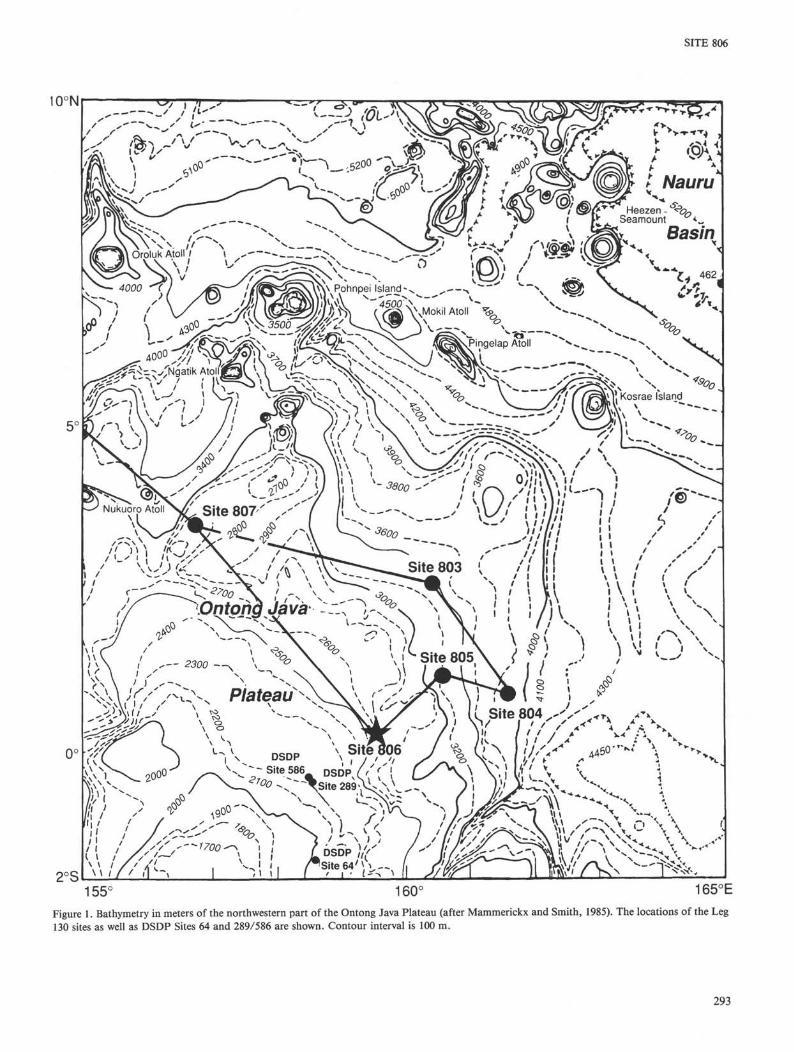
mmsmmmiFigure 3. Seismic profiles across proposed drilling site for Site 806,showing evidence of planar disturbance (crinkly horizons) and debrisflow (wedges next to basin rim).
reconstruction of upper deep-water properties directly, fromtheir abundances and chemical composition. The effects of par-tial dissolution on biostratigraphic zonation (by selective re-moval of marker species) should be no problem at this depthlevel, allowing the verification and further development of astandard zonation.
OPERATIONSThe transit from Sites 805 to 806 covered 81 nmi in 6.25 hr at
an average speed of 13.0 kt. A 17-nmi, pre-site seismic surveywas run over the proposed site for 2.0 hr at 8.5 kt (details of sitesurveys are found in the "Underway Geophysics" chapter, thisvolume). Good global positioning system (GPS) satellite naviga-tion was available for the site survey. The beacon was droppedat 1052 hr, 17 February 1990, on the proposed site, initiatingSite 806.
Hole 806A
The ship was positioned 30 m east of the beacon. After thefirst core was taken, the core barrel became stuck in the pipewhile being retrieved and could not be jarred loose or knockedloose by pumping. The drill string had to be pulled, and theouter-shear-pin sub dogs were found to have broken off andjammed the core barrel in the drill pipe. The core barrel wasempty and thus was considered a water core. Core 130-806A-1Hwas taken at 0530 hr, 18 February 1990, in 2520.7 m of water.Cores 130-806A-1H through -9H (Table 1) were taken from 0 to83.7 mbsf with 83.7 m of sediment cored and 85.95 m recovered(102.69% recovery). Orientation surveys were conducted duringCores 13O-8O6A-3H through -9H. Hole 806A ended when thedepth objective of 83 mbsf was reached. At this point, the pipewas pulled out of the hole, and the bit cleared the seafloor at1100 hr, 18 February 1990.
Hole 806BThe ship was positioned 60 m east of the beacon. Core 130-
806B-1H was taken at 1140 hr, 18 February 1990, in a waterdepth of 2519.9 m. Cores 130-806B-1H through -34H weretaken from 0 to 320.0 mbsf with 320.0 m of sediment cored and335.20 m recovered (104.75% recovery). Orientation surveyswere conducted during Cores 13O-8O6B-3H through -17H. Re-fusal of the APC was reached at Core 130-806B-34H when thecore barrel became stuck and would not pull free, even with100.000 lb of overpull. At this point, the core barrel was washedover 8 m and finally pulled free with 20,000 lb of overpull.
Cores 130-806B-35X through -78X were taken from 320.0 to743.1 mbsf with 423.1 m of sediment cored and 331.16 m recov-ered (78.27% recovery). The XCB bit nozzles started plugging atCore 130-806B-40X (378.2 mbsf), and the sinker-bar assemblywas removed to permit pump pressures up to 900 psi. This ad-justment succeeded in improving core recovery until Core 130-806B-63X (598.6 mbsf) when the chalk became much harderand started jamming in the shoe. Attempts to improve recoveryby reducing weight on bit (WOB) and using different cuttingshoes met with mixed results because the formation alternatedbetween hard and soft chalk. The sonic core monitor (SCM)was tested during Core 130-806B-77X, but the target jammed inthe liner support sleeve and only 0.35 m of core was recovered.The SCM electronics appeared to work properly and showedthat the blockage occurred during the first part of the coringprocess.
Coring ended in Hole 806B at 743.1 m in lower Miocene sed-iments, with recovery totaling 666.36 m (89.67% average recov-ery).
The first air drop in ODP history was made at 0420 hr, 20February 1990, resulting in the successful delivery of a magneticsusceptibility coil, directional survey camera, and TV cameraparts (but no ice cream machine).
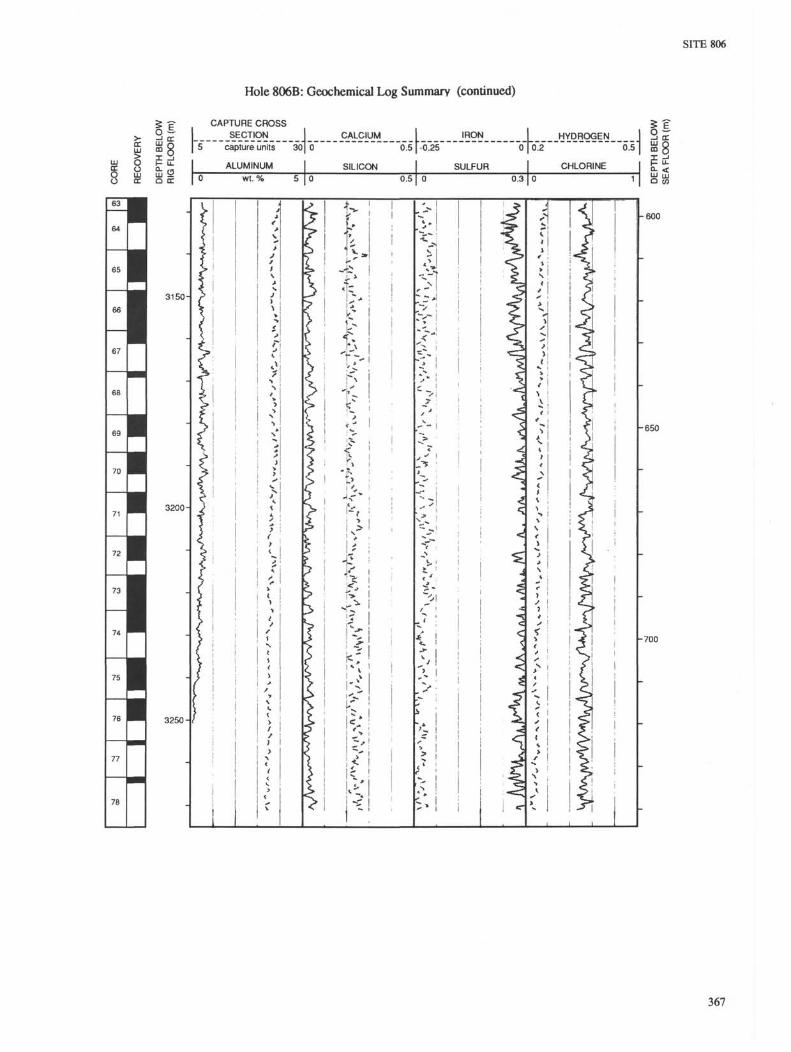
Hole 806B LoggingAfter coring operations ceased, the pipe was pulled to 92
mbsf and a high-viscosity mud sweep was made to clean thehole.
The following logging runs were made:
Run No. 1: NGT/DIT/LSS. Two logs were run successfullyfrom 741.0 to 90.2 mbsf at a rate of 900 ft/hr (306 m/hr). Lessthan 2 m of fill were found at the base of the hole.
Run No. 2: NGT/ACT/HLDT/GST/TLT. The tool was low-ered down the hole to a depth of 740.1 mbsf and pulled back upat a rate of 600 ft/hr (204 m/hr). The GST malfunctioned at
295
SITE 806
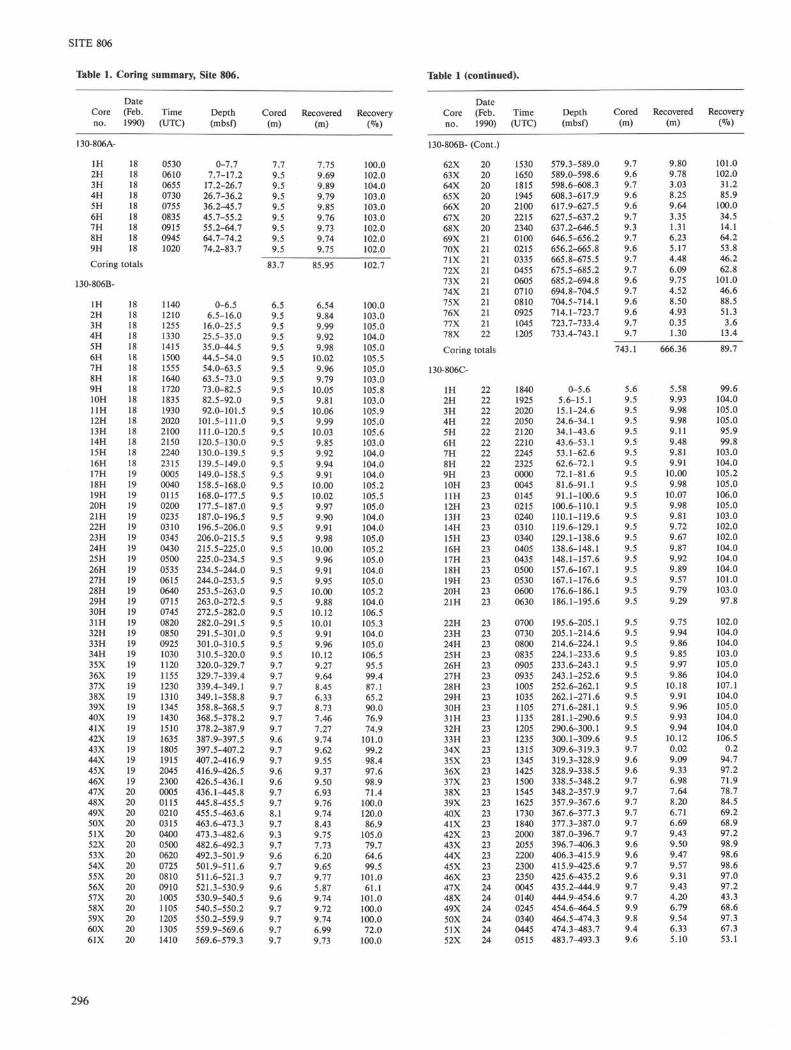
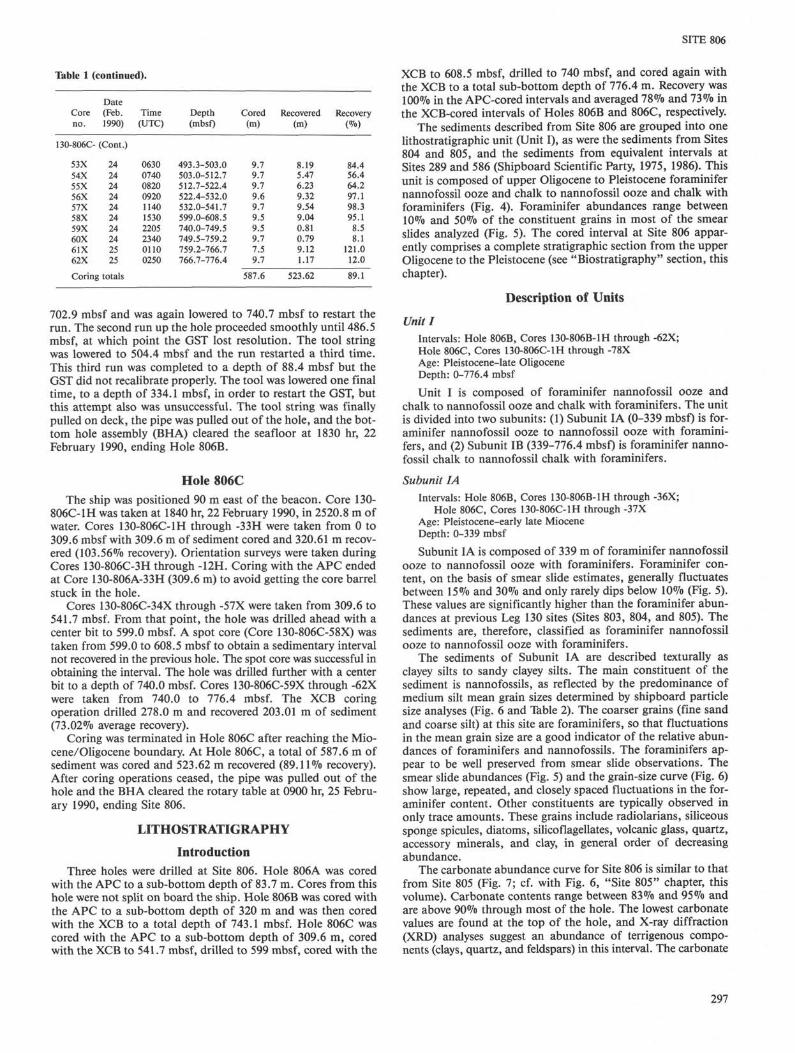
Table 1. Coring summary, Site 806. Table 1 (continued).
702.9 mbsf and was again lowered to 740.7 mbsf to restart therun. The second run up the hole proceeded smoothly until 486.5mbsf, at which point the GST lost resolution. The tool stringwas lowered to 504.4 mbsf and the run restarted a third time.This third run was completed to a depth of 88.4 mbsf but theGST did not recalibrate properly. The tool was lowered one finaltime, to a depth of 334.1 mbsf, in order to restart the GST, butthis attempt also was unsuccessful. The tool string was finallypulled on deck, the pipe was pulled out of the hole, and the bot-tom hole assembly (BHA) cleared the seafloor at 1830 hr, 22February 1990, ending Hole 806B.
Hole 806CThe ship was positioned 90 m east of the beacon. Core 130-
806C-1H was taken at 1840 hr, 22 February 1990, in 2520.8 m ofwater. Cores 130-806C-1H through -33H were taken from 0 to309.6 mbsf with 309.6 m of sediment cored and 320.61 m recov-ered (103.56% recovery). Orientation surveys were taken duringCores 13O-8O6C-3H through -12H. Coring with the APC endedat Core 13O-8O6A-33H (309.6 m) to avoid getting the core barrelstuck in the hole.
Cores 130-806C-34X through -57X were taken from 309.6 to541.7 mbsf. From that point, the hole was drilled ahead with acenter bit to 599.0 mbsf. A spot core (Core 130-806C-58X) wastaken from 599.0 to 608.5 mbsf to obtain a sedimentary intervalnot recovered in the previous hole. The spot core was successful inobtaining the interval. The hole was drilled further with a centerbit to a depth of 740.0 mbsf. Cores 130-806C-59X through -62Xwere taken from 740.0 to 776.4 mbsf. The XCB coringoperation drilled 278.0 m and recovered 203.01 m of sediment(73.02% average recovery).
Coring was terminated in Hole 806C after reaching the Mio-cene/Oligocene boundary. At Hole 806C, a total of 587.6 m ofsediment was cored and 523.62 m recovered (89.11% recovery).After coring operations ceased, the pipe was pulled out of thehole and the BHA cleared the rotary table at 0900 hr, 25 Febru-ary 1990, ending Site 806.
LITHOSTRATIGRAPHY
IntroductionThree holes were drilled at Site 806. Hole 806A was cored
with the APC to a sub-bottom depth of 83.7 m. Cores from thishole were not split on board the ship. Hole 806B was cored withthe APC to a sub-bottom depth of 320 m and was then coredwith the XCB to a total depth of 743.1 mbsf. Hole 806C wascored with the APC to a sub-bottom depth of 309.6 m, coredwith the XCB to 541.7 mbsf, drilled to 599 mbsf, cored with the
XCB to 608.5 mbsf, drilled to 740 mbsf, and cored again withthe XCB to a total sub-bottom depth of 776.4 m. Recovery was100% in the APC-cored intervals and averaged 78% and 73% inthe XCB-cored intervals of Holes 806B and 806C, respectively.
The sediments described from Site 806 are grouped into onelithostratigraphic unit (Unit I), as were the sediments from Sites804 and 805, and the sediments from equivalent intervals atSites 289 and 586 (Shipboard Scientific Party, 1975, 1986). Thisunit is composed of upper Oligocene to Pleistocene foraminifernannofossil ooze and chalk to nannofossil ooze and chalk withforaminifers (Fig. 4). Foraminifer abundances range between10% and 50% of the constituent grains in most of the smearslides analyzed (Fig. 5). The cored interval at Site 806 appar-ently comprises a complete stratigraphic section from the upperOligocene to the Pleistocene (see "Biostratigraphy" section, thischapter).
Description of Units
Unit IIntervals: Hole 806B, Cores 130-806B-1H through -62X;Hole 806C, Cores 130-806C-1H through -78XAge: Pleistocene-late OligoceneDepth: 0-776.4 mbsf
Unit I is composed of foraminifer nannofossil ooze andchalk to nannofossil ooze and chalk with foraminifers. The unitis divided into two subunits: (1) Subunit IA (0-339 mbsf) is for-aminifer nannofossil ooze to nannofossil ooze with foramini-fers, and (2) Subunit IB (339-776.4 mbsf) is foraminifer nanno-fossil chalk to nannofossil chalk with foraminifers.
Subunit IAIntervals: Hole 806B, Cores 130-806B-1H through -36X;
Hole 806C, Cores 130-806C-1H through -37XAge: Pleistocene-early late MioceneDepth: 0-339 mbsf
Subunit IA is composed of 339 m of foraminifer nannofossilooze to nannofossil ooze with foraminifers. Foraminifer con-tent, on the basis of smear slide estimates, generally fluctuatesbetween 15% and 30% and only rarely dips below 10% (Fig. 5).These values are significantly higher than the foraminifer abun-dances at previous Leg 130 sites (Sites 803, 804, and 805). Thesediments are, therefore, classified as foraminifer nannofossilooze to nannofossil ooze with foraminifers.
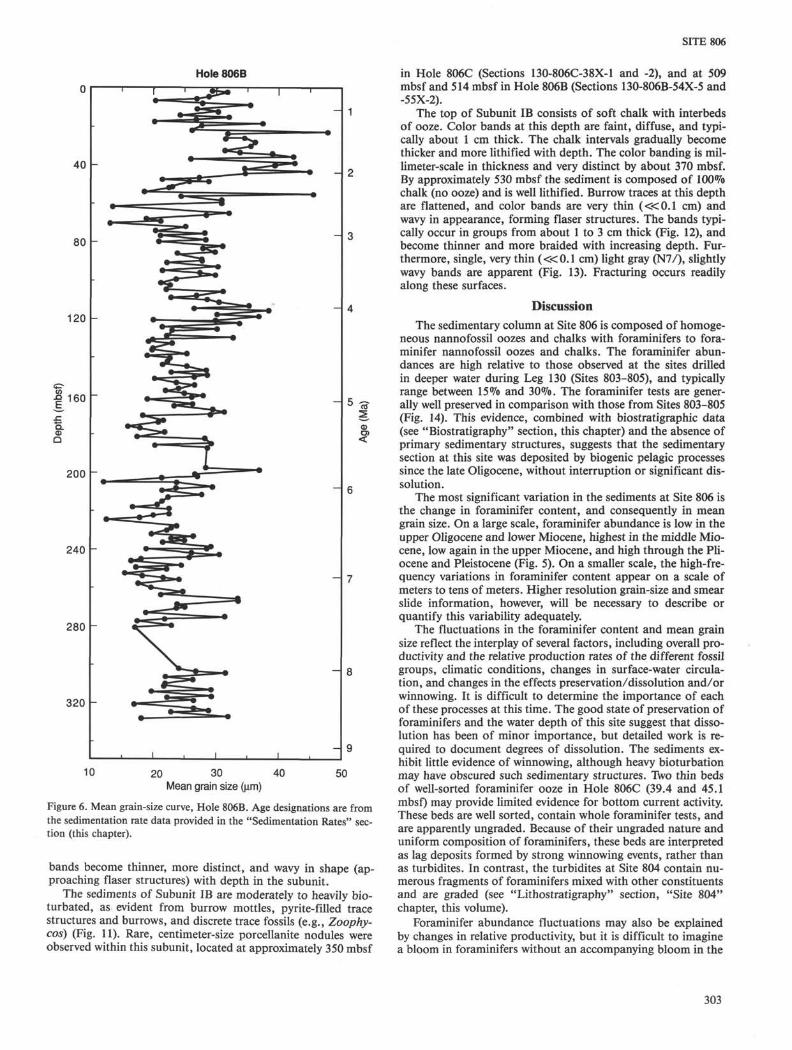
The sediments of Subunit IA are described texturally asclayey silts to sandy clayey silts. The main constituent of thesediment is nannofossils, as reflected by the predominance ofmedium silt mean grain sizes determined by shipboard particlesize analyses (Fig. 6 and Table 2). The coarser grains (fine sandand coarse silt) at this site are foraminifers, so that fluctuationsin the mean grain size are a good indicator of the relative abun-dances of foraminifers and nannofossils. The foraminifers ap-pear to be well preserved from smear slide observations. Thesmear slide abundances (Fig. 5) and the grain-size curve (Fig. 6)show large, repeated, and closely spaced fluctuations in the for-aminifer content. Other constituents are typically observed inonly trace amounts. These grains include radiolarians, siliceoussponge spicules, diatoms, silicoflagellates, volcanic glass, quartz,accessory minerals, and clay, in general order of decreasingabundance.
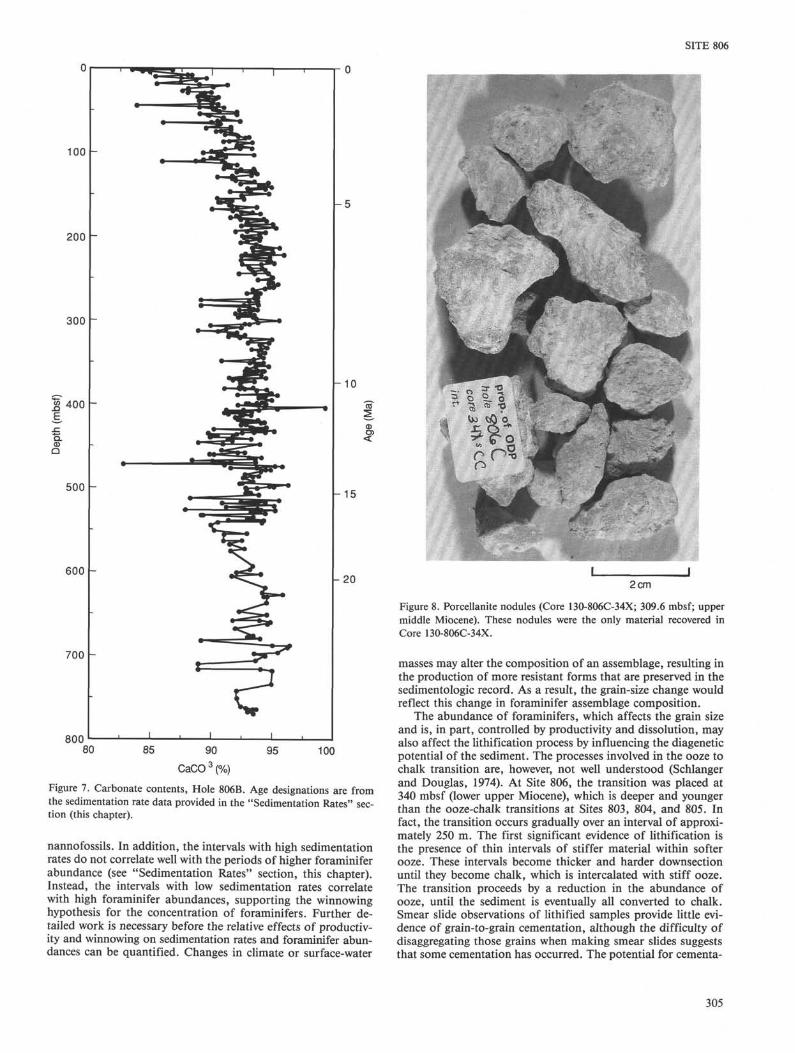
The carbonate abundance curve for Site 806 is similar to thatfrom Site 805 (Fig. 7; cf. with Fig. 6, "Site 805" chapter, thisvolume). Carbonate contents range between 83% and 95% andare above 90% through most of the hole. The lowest carbonatevalues are found at the top of the hole, and X-ray diffraction(XRD) analyses suggest an abundance of terrigenous compo-nents (clays, quartz, and feldspars) in this interval. The carbonate
297
SITE 806
Hole 806B Hole 806B Hole 806B
200-
300-
300
400-
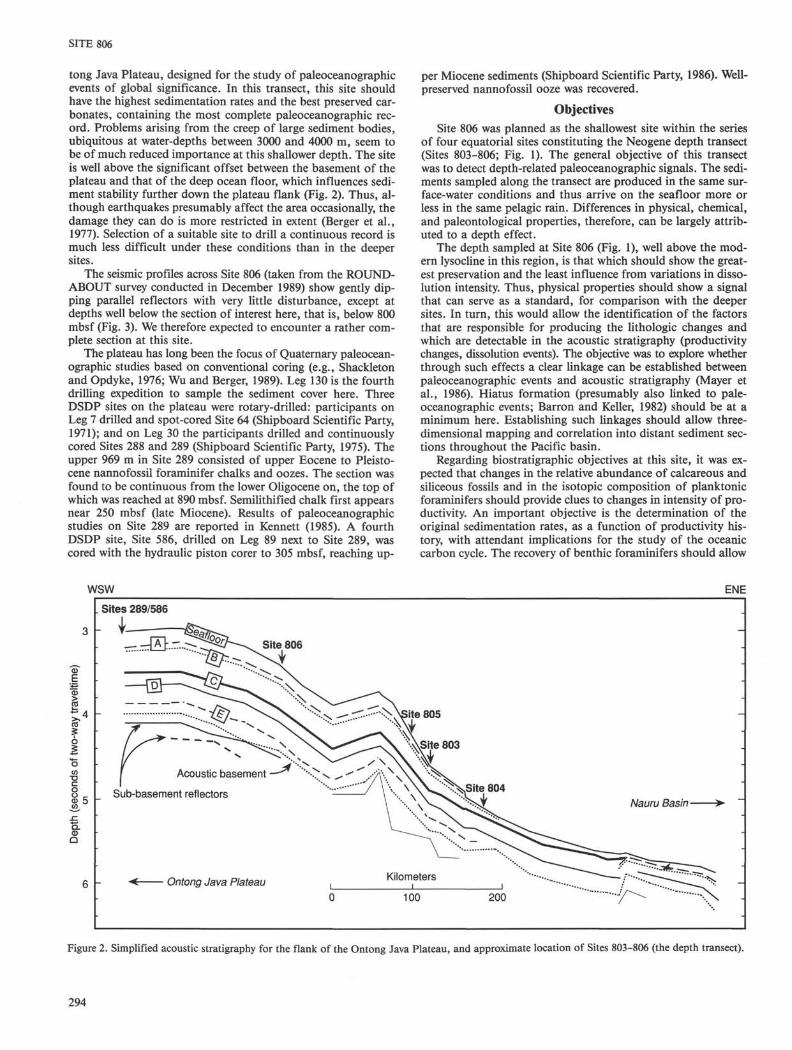
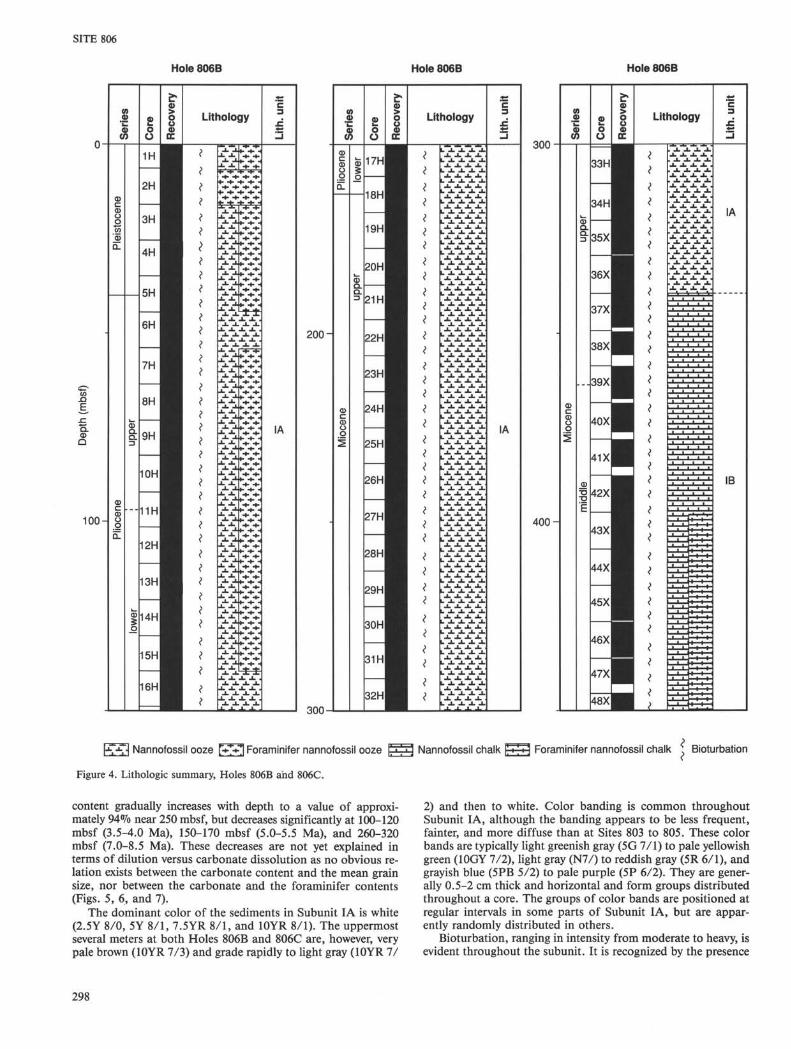
l•VV] Nannofossil ooze f -T - i Foraminifer nannofossil ooze
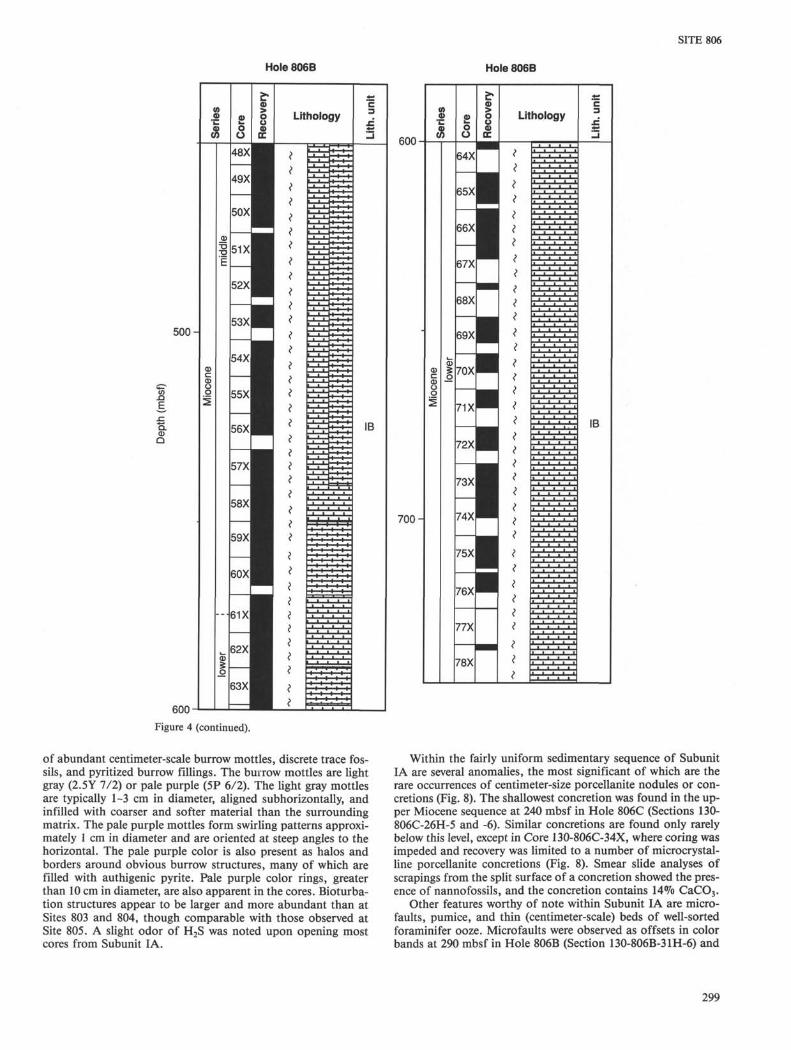
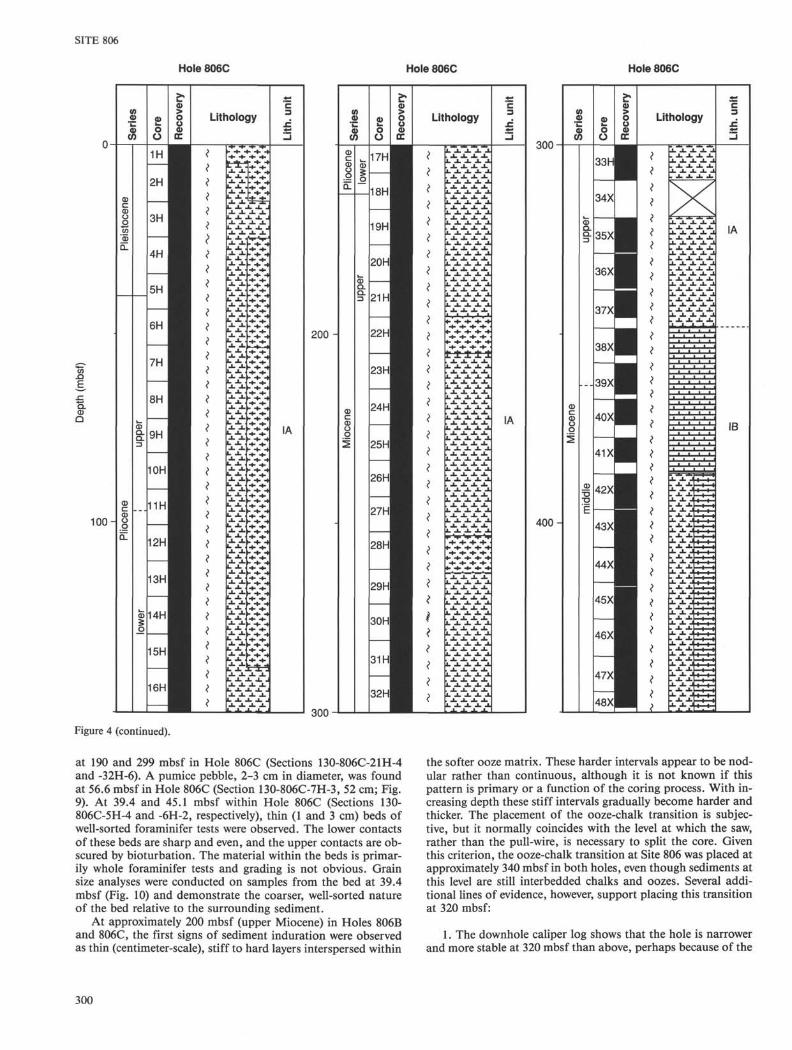
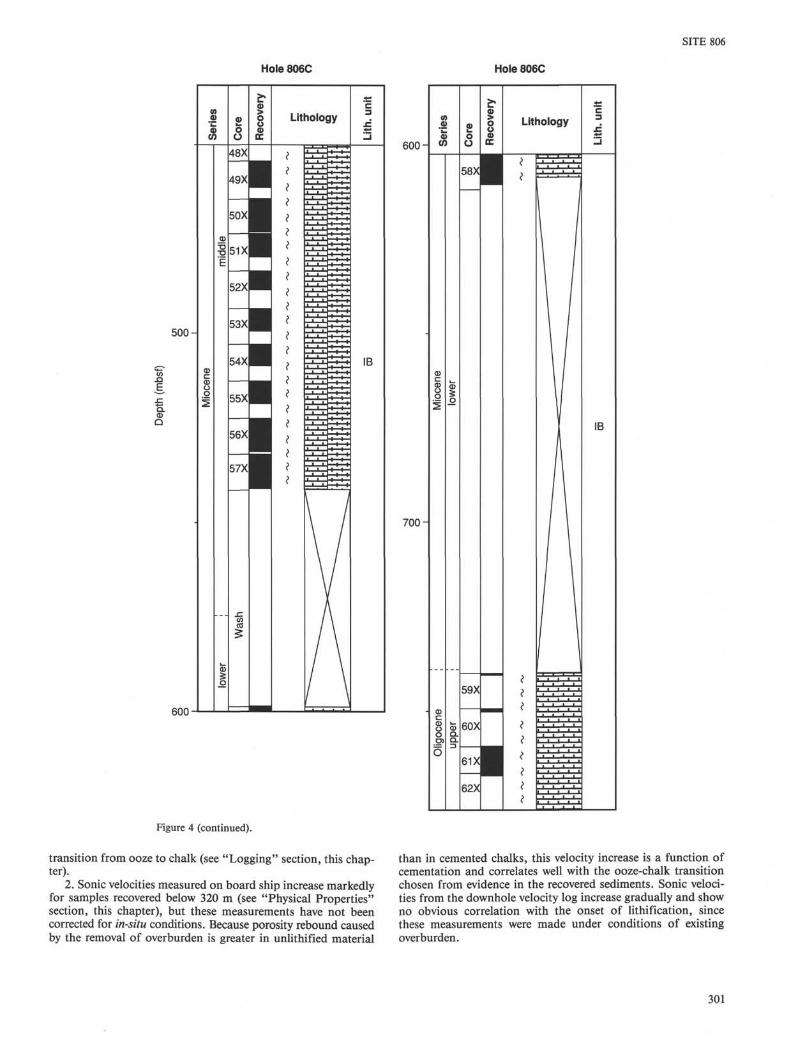
Figure 4. Lithologic summary, Holes 8O6B and 806C.
Nannofossil chalk | ' I ' I 3 Foraminifer nannofossil chalk ;
content gradually increases with depth to a value of approxi-mately 94% near 250 mbsf, but decreases significantly at 100-120mbsf (3.5-4.0 Ma), 150-170 mbsf (5.0-5.5 Ma), and 260-320mbsf (7.0-8.5 Ma). These decreases are not yet explained interms of dilution versus carbonate dissolution as no obvious re-lation exists between the carbonate content and the mean grainsize, nor between the carbonate and the foraminifer contents(Figs. 5, 6, and 7).
The dominant color of the sediments in Subunit IA is white(2.5Y 8/0, 5Y 8/1, 7.5YR 8/1, and 10YR 8/1). The uppermostseveral meters at both Holes 806B and 806C are, however, verypale brown (10YR 7/3) and grade rapidly to light gray (10YR 7/
2) and then to white. Color banding is common throughoutSubunit I A, although the banding appears to be less frequent,fainter, and more diffuse than at Sites 803 to 805. These colorbands are typically light greenish gray (5G 7/1) to pale yellowishgreen (10GY 7/2), light gray (N7/) to reddish gray (5R 6/1), andgrayish blue (5PB 5/2) to pale purple (5P 6/2). They are gener-ally 0.5-2 cm thick and horizontal and form groups distributedthroughout a core. The groups of color bands are positioned atregular intervals in some parts of Subunit IA, but are appar-ently randomly distributed in others.
Bioturbation, ranging in intensity from moderate to heavy, isevident throughout the subunit. It is recognized by the presence
298
SITE 806
Hole 806B Hole 806B
500-
Q.CD
a
600
700-
600
Figure 4 (continued).
of abundant centimeter-scale burrow mottles, discrete trace fos-sils, and pyritized burrow fillings. The burrow mottles are lightgray (2.5Y 7/2) or pale purple (5P 6/2). The light gray mottlesare typically 1-3 cm in diameter, aligned subhorizontally, andinfilled with coarser and softer material than the surroundingmatrix. The pale purple mottles form swirling patterns approxi-mately 1 cm in diameter and are oriented at steep angles to thehorizontal. The pale purple color is also present as halos andborders around obvious burrow structures, many of which arefilled with authigenic pyrite. Pale purple color rings, greaterthan 10 cm in diameter, are also apparent in the cores. Bioturba-tion structures appear to be larger and more abundant than atSites 803 and 804, though comparable with those observed atSite 805. A slight odor of H2S was noted upon opening mostcores from Subunit IA.
Within the fairly uniform sedimentary sequence of SubunitIA are several anomalies, the most significant of which are therare occurrences of centimeter-size Porcellanite nodules or con-cretions (Fig. 8). The shallowest concretion was found in the up-per Miocene sequence at 240 mbsf in Hole 806C (Sections 130-806C-26H-5 and -6). Similar concretions are found only rarelybelow this level, except in Core 130-806C-34X, where coring wasimpeded and recovery was limited to a number of microcrystal-line Porcellanite concretions (Fig. 8). Smear slide analyses ofscrapings from the split surface of a concretion showed the pres-ence of nannofossils, and the concretion contains 14% CaCO3.
Other features worthy of note within Subunit IA are micro-faults, pumice, and thin (centimeter-scale) beds of well-sortedforaminifer ooze. Micro faults were observed as offsets in colorbands at 290 mbsf in Hole 806B (Section 130-806B-31H-6) and
299
SITE 806
Hole 806C Hole 806C Hole 806C
o-
100-
1<Λ
CD
CD
(isto
c
Q.
CD
CD
üg
uppe
r
CD
_g
2oo1H
2H
_3H
4H
5H
6H
7H
—8H
9H
10H
11H
—12H
13H
14H
_
15H
—
16H
=
ery
I
5oα>DC
I
Lithology
ZZ
zzzzf
"
zzzzs
»
zz
zzzz
zz*zzz
zzzz
zzzzzz
•l• • • •l• •fh -f• -f• - f -f-f• -f• -H -f•
t -*- -
X XJ L X
X XJ . X
X XJ . X
f •+• -f-4- -4-• -f -f•f -f• -f -f
• -f -f- f •f•
1 - X X X .X X X X
J . J . J . J . JJ . J . J . J .
J L X X X JX X X X
~M X a
JL XX X
JL XX X
JL XX XJ- XX XJ. XJ. J.
J. XX X
X XL XX X
JL XX X
JL XX XL. XX XJ. X ,X XL. X ,X Xl_ X ,X X
1. X ,X X
J. XX X1. X ,X XJ. X ,X XL. XX XJL X ,X XX Xi. X iX X
JL X
X X1. XX XJL X ,X X
JL X ,JL XX X
JL Xi i1. X
X Xl_ XX X
JL X ,X X
J- X ,X X
JL XX X
J. X ,X X
X X
JL X ,X XIL XX X
JL X ,X XL. XX X
JL X iX X
X XL X .
I v
"#"*•4•*
- -f -- -4- -4•+• -f•• -f -*
- -f -*
-f. -|.• -f• -f
- -f• -1
- -f -f
- -f -1-4- .4.
^ ^- -f• -1•f• - I -- -f -t
- -f --f• -f-4- ^ -
• + •*^m ^ .- -4- .4-4- -4-- -f -1
- -f -1-f• -f>!--*--»
1- -f• -»•+• +
f• -f• -1- 1 - -4-
f -f• -1~§- ^ .
- - 4 - - 1
-H -4--•*••*-f• -4-- -f• •*-4- -4-
-4- -4-- •f• -1-4- -4-
-f• -f•- -f• -1
- -f• -4-4- -4-- -f• -4^• +.' •*• H
-•*--»-4- ^ .- -f• •*÷ +
f • f • •*-4- ^ -
h -f• -t
t• - f -t
-f •f
- -f• -•*• -f•
- •v -L x .X X X XJL X X X JX X X XL. J . J . J . .X X X XIL X X X .X X X X
nit
3r•
_J
IA
200 -
300
oO
17H|
18H
19H
20I-
21 Hi
22H|
23H|
24H|
25h
26HI
27H|
28H|
29H|
30H
311
32HI
o Lithology
1XXX J.
JL JL J . JL JL
J. J . J . JL
JL JL J . JL J .
J. JL JL J . JL
JL JL J . JL JL
IA
300
400-
Figure 4 (continued).
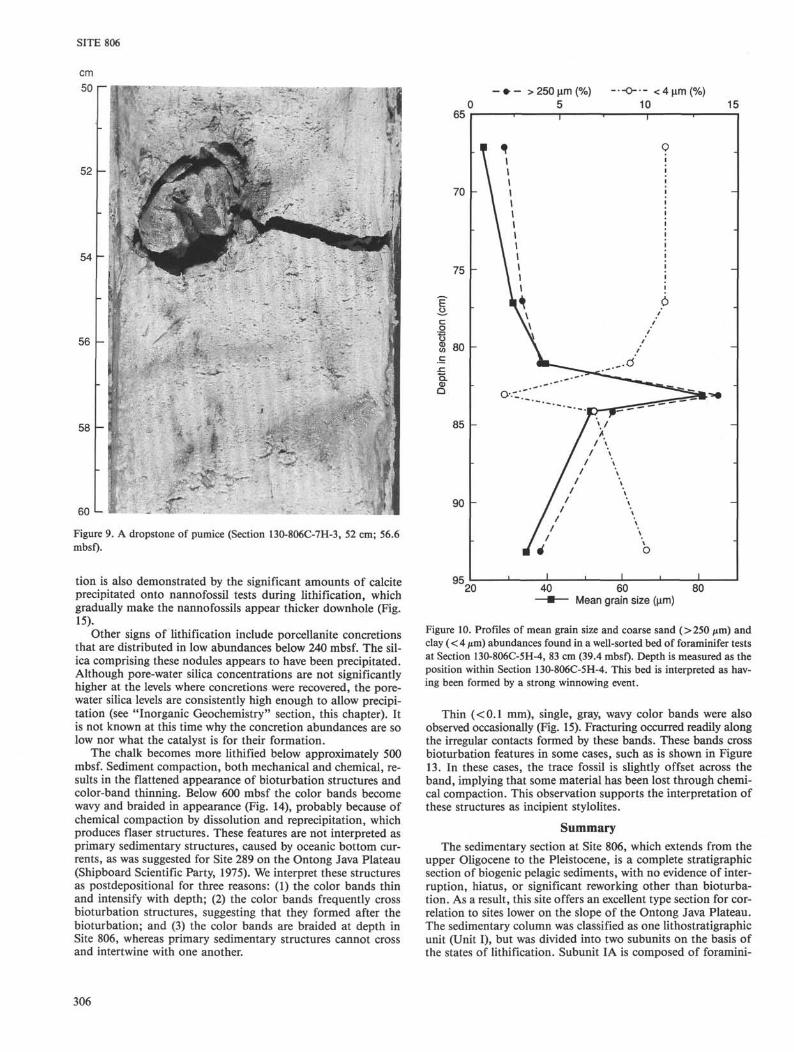
at 190 and 299 mbsf in Hole 806C (Sections 130-806C-21H-4and -32H-6). A pumice pebble, 2-3 cm in diameter, was foundat 56.6 mbsf in Hole 806C (Section 130-806C-7H-3, 52 cm; Fig.9). At 39.4 and 45.1 mbsf within Hole 806C (Sections 130-806C-5H-4 and -6H-2, respectively), thin (1 and 3 cm) beds ofwell-sorted foraminifer tests were observed. The lower contactsof these beds are sharp and even, and the upper contacts are ob-scured by bioturbation. The material within the beds is primar-ily whole foraminifer tests and grading is not obvious. Grainsize analyses were conducted on samples from the bed at 39.4mbsf (Fig. 10) and demonstrate the coarser, well-sorted natureof the bed relative to the surrounding sediment.
At approximately 200 mbsf (upper Miocene) in Holes 806Band 806C, the first signs of sediment induration were observedas thin (centimeter-scale), stiff to hard layers interspersed within
the softer ooze matrix. These harder intervals appear to be nod-ular rather than continuous, although it is not known if thispattern is primary or a function of the coring process. With in-creasing depth these stiff intervals gradually become harder andthicker. The placement of the ooze-chalk transition is subjec-tive, but it normally coincides with the level at which the saw,rather than the pull-wire, is necessary to split the core. Giventhis criterion, the ooze-chalk transition at Site 806 was placed atapproximately 340 mbsf in both holes, even though sediments atthis level are still interbedded chalks and oozes. Several addi-tional lines of evidence, however, support placing this transitionat 320 mbsf:
1. The downhole caliper log shows that the hole is narrowerand more stable at 320 mbsf than above, perhaps because of the
300
SITE 806
Hole 806C Hole 806C
500-
E
Q.CD
Q
600
600-
700-
Lithologyc3
59X
60X
IB
I •
Figure 4 (continued).
transition from ooze to chalk (see "Logging" section, this chap-ter).
2. Sonic velocities measured on board ship increase markedlyfor samples recovered below 320 m (see "Physical Properties"section, this chapter), but these measurements have not beencorrected for in-situ conditions. Because porosity rebound causedby the removal of overburden is greater in unlithified material
than in cemented chalks, this velocity increase is a function ofcementation and correlates well with the ooze-chalk transitionchosen from evidence in the recovered sediments. Sonic veloci-ties from the downhole velocity log increase gradually and showno obvious correlation with the onset of lithification, sincethese measurements were made under conditions of existingoverburden.
301
SITE 806
Hole 806B Hole 806C
100
200
300
a.ΦQ 400
500
600
700
lillliii
100
200
300
400
15500
Nannofossils
Foraminifers
Radiolarians
Others
60020
700
20 40 60
Abundance(%)
100' : : : : : : • f 1 lit!
20 40 60Abundance (%)
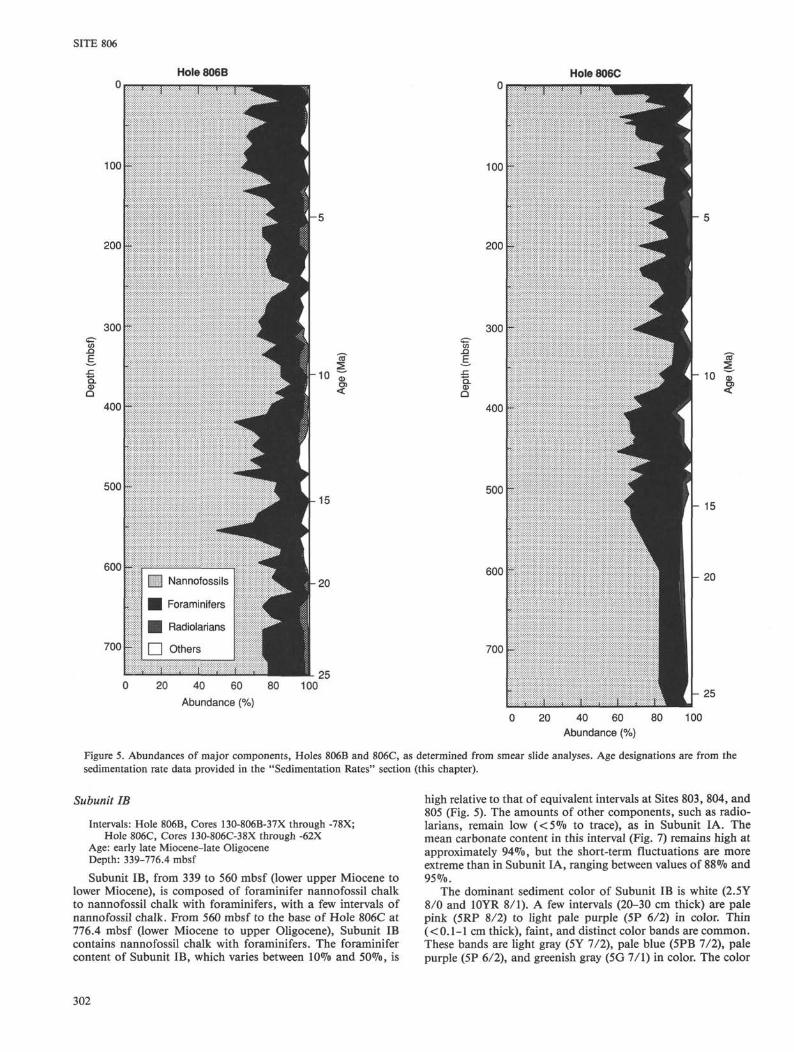
80
Figure 5. Abundances of major components, Holes 806B and 806C, as determined from smear slide analyses. Age designations are from thesedimentation rate data provided in the "Sedimentation Rates" section (this chapter).
Subunit IB
Intervals: Hole 806B, Cores 130-806B-37X through -78X;Hole 806C, Cores 130-806C-38X through -62X
Age: early late Miocene-late OligoceneDepth: 339-776.4 mbsf
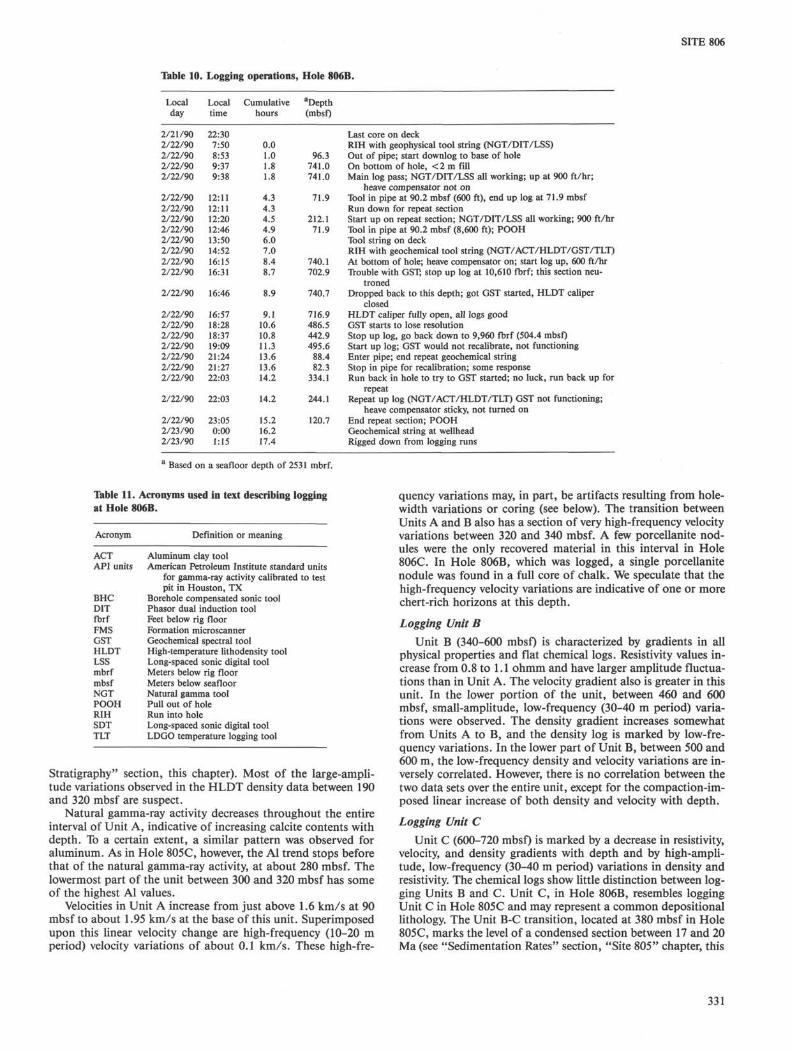
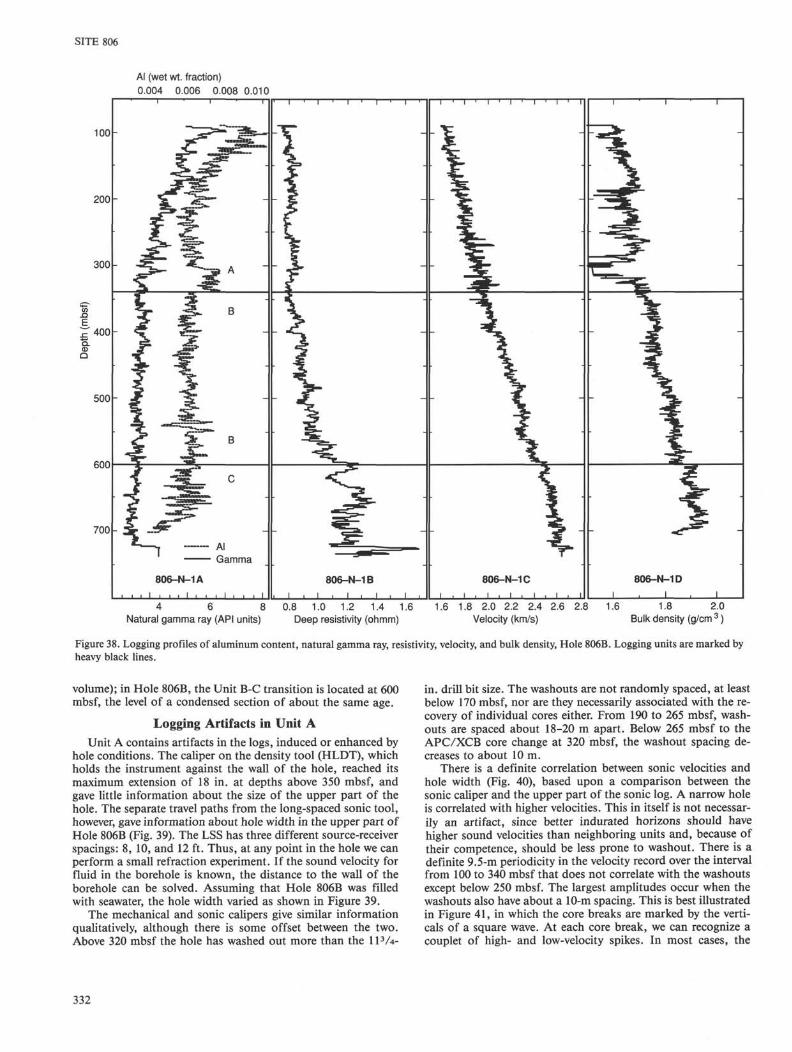
Subunit IB, from 339 to 560 mbsf (lower upper Miocene tolower Miocene), is composed of foraminifer nannofossil chalkto nannofossil chalk with foraminifers, with a few intervals ofnannofossil chalk. From 560 mbsf to the base of Hole 806C at776.4 mbsf (lower Miocene to upper Oligocene), Subunit IBcontains nannofossil chalk with foraminifers. The foraminifercontent of Subunit IB, which varies between 10% and 50%, is
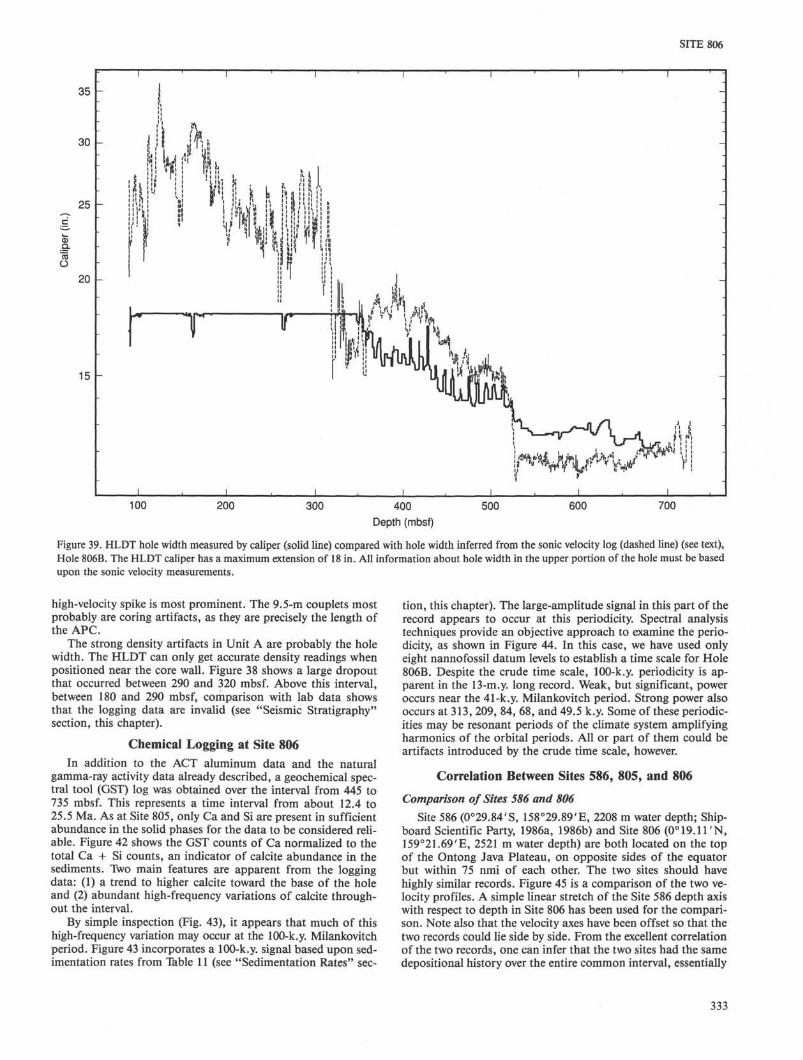
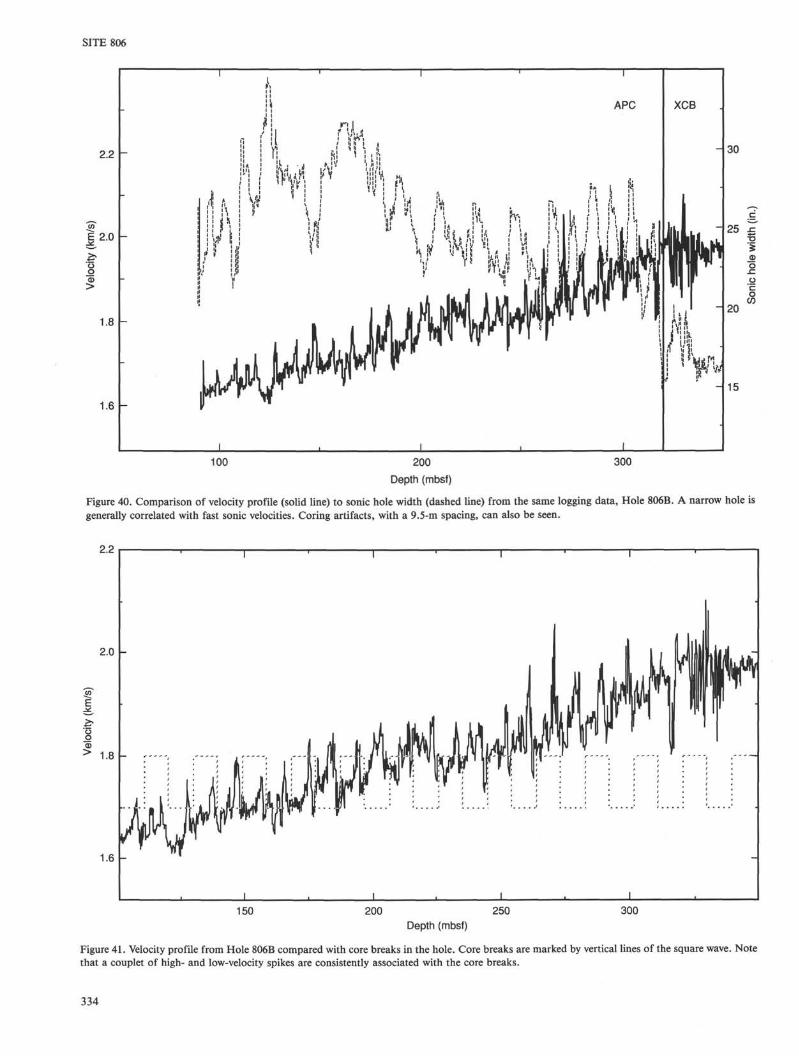
high relative to that of equivalent intervals at Sites 803, 804, and805 (Fig. 5). The amounts of other components, such as radio-larians, remain low (<5% to trace), as in Subunit I A. Themean carbonate content in this interval (Fig. 7) remains high atapproximately 94%, but the short-term fluctuations are moreextreme than in Subunit IA, ranging between values of 88% and95%.
The dominant sediment color of Subunit IB is white (2.5Y8/0 and 10YR 8/1). A few intervals (20-30 cm thick) are palepink (5RP 8/2) to light pale purple (5P 6/2) in color. Thin(<0.1-l cm thick), faint, and distinct color bands are common.These bands are light gray (5Y 7/2), pale blue (5PB 7/2), palepurple (5P 6/2), and greenish gray (5G 7/1) in color. The color
302
SITE 806
Hole 806B
- 1
320 -
20 30 40Mean grain size (µm)
50
Figure 6. Mean grain-size curve, Hole 806B. Age designations are fromthe sedimentation rate data provided in the "Sedimentation Rates" sec-tion (this chapter).
bands become thinner, more distinct, and wavy in shape (ap-proaching flaser structures) with depth in the subunit.
The sediments of Subunit IB are moderately to heavily bio-turbated, as evident from burrow mottles, pyrite-filled tracestructures and burrows, and discrete trace fossils (e.g., Zoophy-cos) (Fig. 11). Rare, centimeter-size Porcellanite nodules wereobserved within this subunit, located at approximately 350 mbsf
in Hole 806C (Sections 130-806C-38X-1 and -2), and at 509mbsf and 514 mbsf in Hole 806B (Sections 130-806B-54X-5 and-55X-2).
The top of Subunit IB consists of soft chalk with interbedsof ooze. Color bands at this depth are faint, diffuse, and typi-cally about 1 cm thick. The chalk intervals gradually becomethicker and more lithified with depth. The color banding is mil-limeter-scale in thickness and very distinct by about 370 mbsf.By approximately 530 mbsf the sediment is composed of 100%chalk (no ooze) and is well lithified. Burrow traces at this depthare flattened, and color bands are very thin (<<O.l cm) andwavy in appearance, forming flaser structures. The bands typi-cally occur in groups from about 1 to 3 cm thick (Fig. 12), andbecome thinner and more braided with increasing depth. Fur-thermore, single, very thin (<<O.l cm) light gray (N7/), slightlywavy bands are apparent (Fig. 13). Fracturing occurs readilyalong these surfaces.
DiscussionThe sedimentary column at Site 806 is composed of homoge-
neous nannofossil oozes and chalks with foraminifers to fora-minifer nannofossil oozes and chalks. The foraminifer abun-dances are high relative to those observed at the sites drilledin deeper water during Leg 130 (Sites 803-805), and typicallyrange between 15% and 30%. The foraminifer tests are gener-ally well preserved in comparison with those from Sites 803-805(Fig. 14). This evidence, combined with biostratigraphic data(see "Biostratigraphy" section, this chapter) and the absence ofprimary sedimentary structures, suggests that the sedimentarysection at this site was deposited by biogenic pelagic processessince the late Oligocene, without interruption or significant dis-solution.
The most significant variation in the sediments at Site 806 isthe change in foraminifer content, and consequently in meangrain size. On a large scale, foraminifer abundance is low in theupper Oligocene and lower Miocene, highest in the middle Mio-cene, low again in the upper Miocene, and high through the Pli-ocene and Pleistocene (Fig. 5). On a smaller scale, the high-fre-quency variations in foraminifer content appear on a scale ofmeters to tens of meters. Higher resolution grain-size and smearslide information, however, will be necessary to describe orquantify this variability adequately.
The fluctuations in the foraminifer content and mean grainsize reflect the interplay of several factors, including overall pro-ductivity and the relative production rates of the different fossilgroups, climatic conditions, changes in surface-water circula-tion, and changes in the effects preservation/dissolution and/orwinnowing. It is difficult to determine the importance of eachof these processes at this time. The good state of preservation offoraminifers and the water depth of this site suggest that disso-lution has been of minor importance, but detailed work is re-quired to document degrees of dissolution. The sediments ex-hibit little evidence of winnowing, although heavy bioturbationmay have obscured such sedimentary structures. Two thin bedsof well-sorted foraminifer ooze in Hole 806C (39.4 and 45.1mbsf) may provide limited evidence for bottom current activity.These beds are well sorted, contain whole foraminifer tests, andare apparently ungraded. Because of their ungraded nature anduniform composition of foraminifers, these beds are interpretedas lag deposits formed by strong winnowing events, rather thanas turbidites. In contrast, the turbidites at Site 804 contain nu-merous fragments of foraminifers mixed with other constituentsand are graded (see "Lithostratigraphy" section, "Site 804"chapter, this volume).
Foraminifer abundance fluctuations may also be explainedby changes in relative productivity, but it is difficult to imaginea bloom in foraminifers without an accompanying bloom in the
303
SITE 806
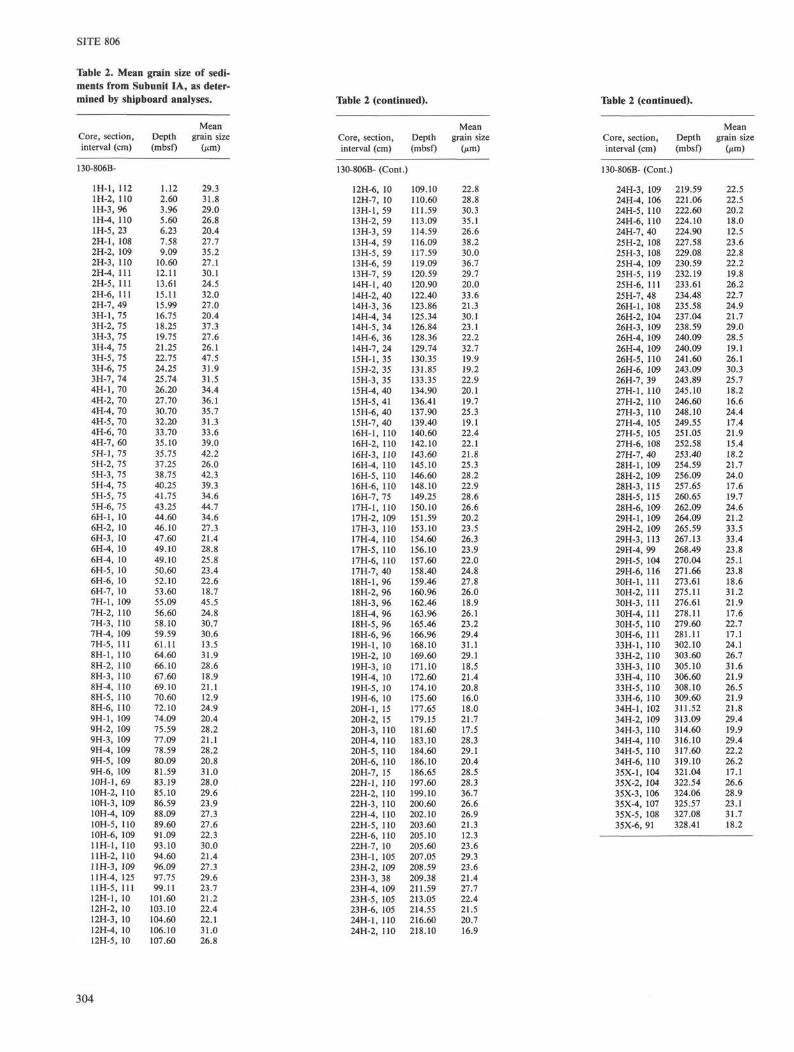
Table 2. Mean grain size of sedi-ments from Subunit IA, as deter-mined by shipboard analyses. Table 2 (continued). Table 2 (continued).
Figure 7. Carbonate contents, Hole 806B. Age designations are fromthe sedimentation rate data provided in the "Sedimentation Rates" sec-tion (this chapter).
nannofossils. In addition, the intervals with high sedimentationrates do not correlate well with the periods of higher foraminiferabundance (see "Sedimentation Rates" section, this chapter).Instead, the intervals with low sedimentation rates correlatewith high foraminifer abundances, supporting the winnowinghypothesis for the concentration of foraminifers. Further de-tailed work is necessary before the relative effects of productiv-ity and winnowing on sedimentation rates and foraminifer abun-dances can be quantified. Changes in climate or surface-water
2 cm
Figure 8. Porcellanite nodules (Core 130-806C-34X; 309.6 mbsf; uppermiddle Miocene). These nodules were the only material recovered inCore 13O-8O6C-34X.
masses may alter the composition of an assemblage, resulting inthe production of more resistant forms that are preserved in thesedimentologic record. As a result, the grain-size change wouldreflect this change in foraminifer assemblage composition.
The abundance of foraminifers, which affects the grain sizeand is, in part, controlled by productivity and dissolution, mayalso affect the lithification process by influencing the diageneticpotential of the sediment. The processes involved in the ooze tochalk transition are, however, not well understood (Schlangerand Douglas, 1974). At Site 806, the transition was placed at340 mbsf (lower upper Miocene), which is deeper and youngerthan the ooze-chalk transitions at Sites 803, 804, and 805. Infact, the transition occurs gradually over an interval of approxi-mately 250 m. The first significant evidence of lithification isthe presence of thin intervals of suffer material within softerooze. These intervals become thicker and harder downsectionuntil they become chalk, which is intercalated with stiff ooze.The transition proceeds by a reduction in the abundance ofooze, until the sediment is eventually all converted to chalk.Smear slide observations of lithified samples provide little evi-dence of grain-to-grain cementation, although the difficulty ofdisaggregating those grains when making smear slides suggeststhat some cementation has occurred. The potential for cementa-
305
SITE 806
58 -
60 «-
Figure 9. A dropstone of pumice (Section 130-806C-7H-3, 52 cm; 56.6mbsf>
tion is also demonstrated by the significant amounts of calciteprecipitated onto nannofossil tests during lithification, whichgradually make the nannofossils appear thicker downhole (Fig.15).
Other signs of lithification include Porcellanite concretionsthat are distributed in low abundances below 240 mbsf. The sil-ica comprising these nodules appears to have been precipitated.Although pore-water silica concentrations are not significantlyhigher at the levels where concretions were recovered, the pore-water silica levels are consistently high enough to allow precipi-tation (see "Inorganic Geochemistry" section, this chapter). Itis not known at this time why the concretion abundances are solow nor what the catalyst is for their formation.
The chalk becomes more lithified below approximately 500mbsf. Sediment compaction, both mechanical and chemical, re-sults in the flattened appearance of bioturbation structures andcolor-band thinning. Below 600 mbsf the color bands becomewavy and braided in appearance (Fig. 14), probably because ofchemical compaction by dissolution and reprecipitation, whichproduces flaser structures. These features are not interpreted asprimary sedimentary structures, caused by oceanic bottom cur-rents, as was suggested for Site 289 on the Ontong Java Plateau(Shipboard Scientific Party, 1975). We interpret these structuresas postdepositional for three reasons: (1) the color bands thinand intensify with depth; (2) the color bands frequently crossbioturbation structures, suggesting that they formed after thebioturbation; and (3) the color bands are braided at depth inSite 806, whereas primary sedimentary structures cannot crossand intertwine with one another.
GL
O
(65
70
75
80
85
90
QR
— • — >
)
•T\ 1\ I
- \ 1\ \\ \\ \\ \\ \\ \
\ \
M\\\\
-
J
250 µm (%)5I
/
/ /
/ '
1/4
i i
—o—10
r
t \
\
\
\
o
i
<< \ µm (%
9
ò
i
i 1
15
-
-
-
20 40 60 80— • — Mean grain size (µm)
Figure 10. Profiles of mean grain size and coarse sand (>25O µm) andclay (< 4 µm) abundances found in a well-sorted bed of foraminifer testsat Section 130-806C-5H-4, 83 cm (39.4 mbsf). Depth is measured as theposition within Section 130-806C-5H-4. This bed is interpreted as hav-ing been formed by a strong winnowing event.
Thin (<O.l mm), single, gray, wavy color bands were alsoobserved occasionally (Fig. 15). Fracturing occurred readily alongthe irregular contacts formed by these bands. These bands crossbioturbation features in some cases, such as is shown in Figure13. In these cases, the trace fossil is slightly offset across theband, implying that some material has been lost through chemi-cal compaction. This observation supports the interpretation ofthese structures as incipient stylolites.
SummaryThe sedimentary section at Site 806, which extends from the
upper Oligocene to the Pleistocene, is a complete stratigraphicsection of biogenic pelagic sediments, with no evidence of inter-ruption, hiatus, or significant reworking other than bioturba-tion. As a result, this site offers an excellent type section for cor-relation to sites lower on the slope of the Ontong Java Plateau.The sedimentary column was classified as one lithostratigraphicunit (Unit I), but was divided into two subunits on the basis ofthe states of lithification. Subunit IA is composed of foramini-
306
SITE 806
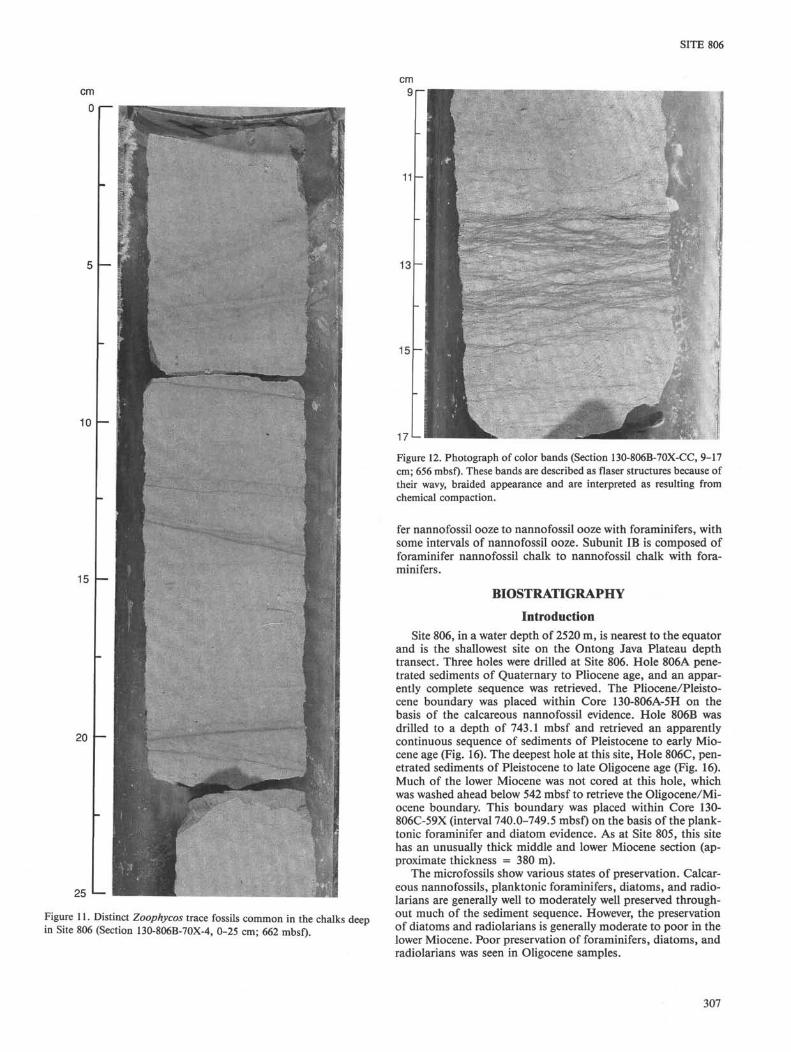
15 -
25 l—
Figure 11. Distinct Zoophycos trace fossils common in the chalks deepin Site 806 (Section 130-806B-70X-4, 0-25 cm; 662 mbsf).
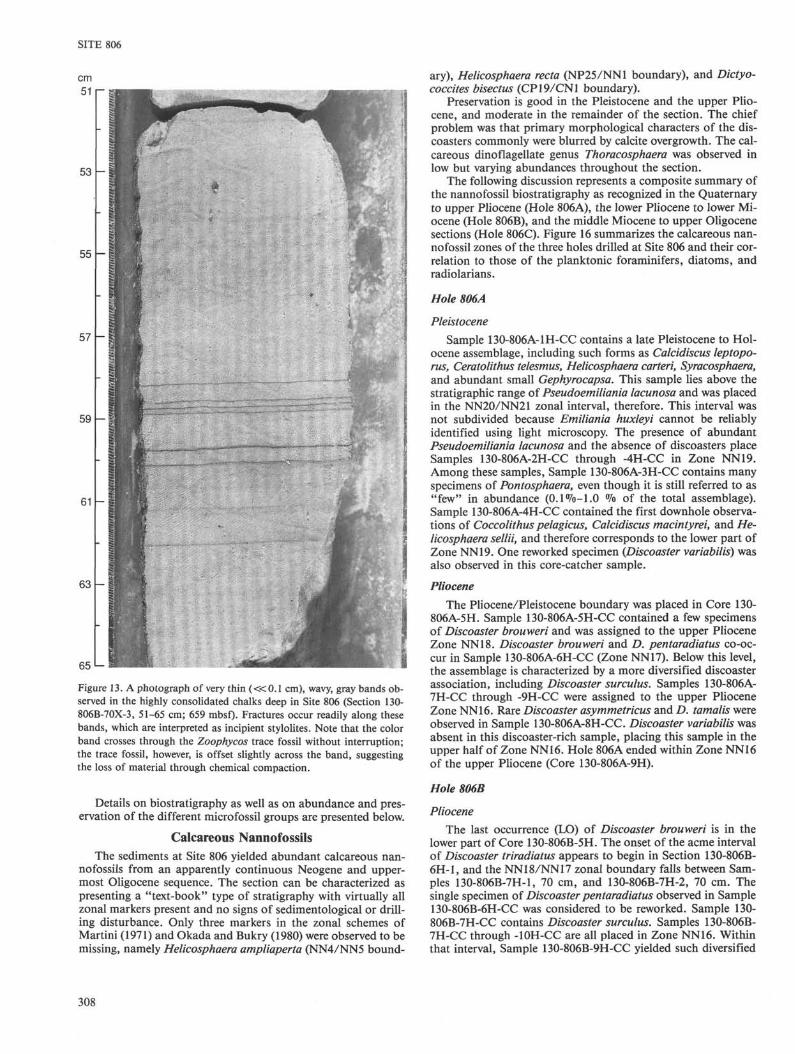
171-
Figure 12. Photograph of color bands (Section 13O-8O6B-7OX-CC, 9-17cm; 656 mbsf) These bands are described as flaser structures because oftheir wavy, braided appearance and are interpreted as resulting fromchemical compaction.
fer nannofossil ooze to nannofossil ooze with foraminifers, withsome intervals of nannofossil ooze. Subunit IB is composed offoraminifer nannofossil chalk to nannofossil chalk with fora-minifers.
BIOSTRATIGRAPHY
IntroductionSite 806, in a water depth of 2520 m, is nearest to the equator
and is the shallowest site on the Ontong Java Plateau depthtransect. Three holes were drilled at Site 806. Hole 806A pene-trated sediments of Quaternary to Pliocene age, and an appar-ently complete sequence was retrieved. The Pliocene/Pleisto-cene boundary was placed within Core 130-806A-5H on thebasis of the calcareous nannofossil evidence. Hole 806B wasdrilled to a depth of 743.1 mbsf and retrieved an apparentlycontinuous sequence of sediments of Pleistocene to early Mio-cene age (Fig. 16). The deepest hole at this site, Hole 806C, pen-etrated sediments of Pleistocene to late Oligocene age (Fig. 16).Much of the lower Miocene was not cored at this hole, whichwas washed ahead below 542 mbsf to retrieve the Oligocene/Mi-ocene boundary. This boundary was placed within Core 130-806C-59X (interval 740.0-749.5 mbsf) on the basis of the plank-tonic foraminifer and diatom evidence. As at Site 805, this sitehas an unusually thick middle and lower Miocene section (ap-proximate thickness = 380 m).
The microfossils show various states of preservation. Calcar-eous nannofossils, planktonic foraminifers, diatoms, and radio-larians are generally well to moderately well preserved through-out much of the sediment sequence. However, the preservationof diatoms and radiolarians is generally moderate to poor in thelower Miocene. Poor preservation of foraminifers, diatoms, andradiolarians was seen in Oligocene samples.
307
SITE 806
59 -
61 -
63 -
65 L-
Figure 13. A photograph of very thin (<<O.l cm), wavy, gray bands ob-served in the highly consolidated chalks deep in Site 806 (Section 130-806B-70X-3, 51-65 cm; 659 mbsf). Fractures occur readily along thesebands, which are interpreted as incipient stylolites. Note that the colorband crosses through the Zoophycos trace fossil without interruption;the trace fossil, however, is offset slightly across the band, suggestingthe loss of material through chemical compaction.
Details on biostratigraphy as well as on abundance and pres-ervation of the different microfossil groups are presented below.
Calcareous NannofossilsThe sediments at Site 806 yielded abundant calcareous nan-
nofossils from an apparently continuous Neogene and upper-most Oligocene sequence. The section can be characterized aspresenting a "text-book" type of stratigraphy with virtually allzonal markers present and no signs of sedimentological or drill-ing disturbance. Only three markers in the zonal schemes ofMartini (1971) and Okada and Bukry (1980) were observed to bemissing, namely Helicosphaera ampliaperta (NN4/NN5 bound-
ary), Helicosphaera recta (NP25/NN1 boundary), and Dictyo-coccites bisectus (CP19/CN1 boundary).
Preservation is good in the Pleistocene and the upper Plio-cene, and moderate in the remainder of the section. The chiefproblem was that primary morphological characters of the dis-coasters commonly were blurred by calcite overgrowth. The cal-careous dinoflagellate genus Thoracosphaera was observed inlow but varying abundances throughout the section.
The following discussion represents a composite summary ofthe nannofossil biostratigraphy as recognized in the Quaternaryto upper Pliocene (Hole 806A), the lower Pliocene to lower Mi-ocene (Hole 806B), and the middle Miocene to upper Oligocenesections (Hole 806C). Figure 16 summarizes the calcareous nan-nofossil zones of the three holes drilled at Site 806 and their cor-relation to those of the planktonic foraminifers, diatoms, andradiolarians.
Hole 806A
Pleistocene
Sample 130-806A-1H-CC contains a late Pleistocene to Hol-ocene assemblage, including such forms as Calcidiscus leptopo-rus, Ceratolithus telesmus, Helicosphaera carteri, Syracosphaera,and abundant small Gephyrocapsa. This sample lies above thestratigraphic range of Pseudoemiliania lacunosa and was placedin the NN20/NN21 zonal interval, therefore. This interval wasnot subdivided because Emiliania huxleyi cannot be reliablyidentified using light microscopy. The presence of abundantPseudoemiliania lacunosa and the absence of discoasters placeSamples 130-806A-2H-CC through -4H-CC in Zone NN19.Among these samples, Sample 13O-8O6A-3H-CC contains manyspecimens of Pontosphaera, even though it is still referred to as"few" in abundance (0.1%-1.0 % of the total assemblage).Sample 130-806A-4H-CC contained the first downhole observa-tions of Coccolithus pelagicus, Calcidiscus macintyrei, and He-licosphaera sellii, and therefore corresponds to the lower part ofZone NN19. One reworked specimen (Discoaster variabilis) wasalso observed in this core-catcher sample.
PlioceneThe Pliocene/Pleistocene boundary was placed in Core 130-
806A-5H. Sample 130-806A-5H-CC contained a few specimensof Discoaster brouweri and was assigned to the upper PlioceneZone NN18. Discoaster brouweri and D. pentaradiatus co-oc-cur in Sample 130-806A-6H-CC (Zone NN17). Below this level,the assemblage is characterized by a more diversified discoasterassociation, including Discoaster surculus. Samples 130-806A-7H-CC through -9H-CC were assigned to the upper PlioceneZone NN16. Rare Discoaster asymmetricus and D. tamalis wereobserved in Sample 130-806A-8H-CC. Discoaster variabilis wasabsent in this discoaster-rich sample, placing this sample in theupper half of Zone NN16. Hole 806A ended within Zone NN16of the upper Pliocene (Core 13O-8O6A-9H).
Hole 806B
PlioceneThe last occurrence (LO) of Discoaster brouweri is in the
lower part of Core 13O-8O6B-5H. The onset of the acme intervalof Discoaster triradiatus appears to begin in Section 13O-8O6B-6H-1, and the NN18/NN17 zonal boundary falls between Sam-ples 130-806B-7H-1, 70 cm, and 130-806B-7H-2, 70 cm. Thesingle specimen of Discoaster pentaradiatus observed in Sample130-806B-6H-CC was considered to be reworked. Sample 130-806B-7H-CC contains Discoaster surculus. Samples 130-806B-7H-CC through -10H-CC are all placed in Zone NN16. Withinthat interval, Sample 130-806B-9H-CC yielded such diversified
308
SITE 806
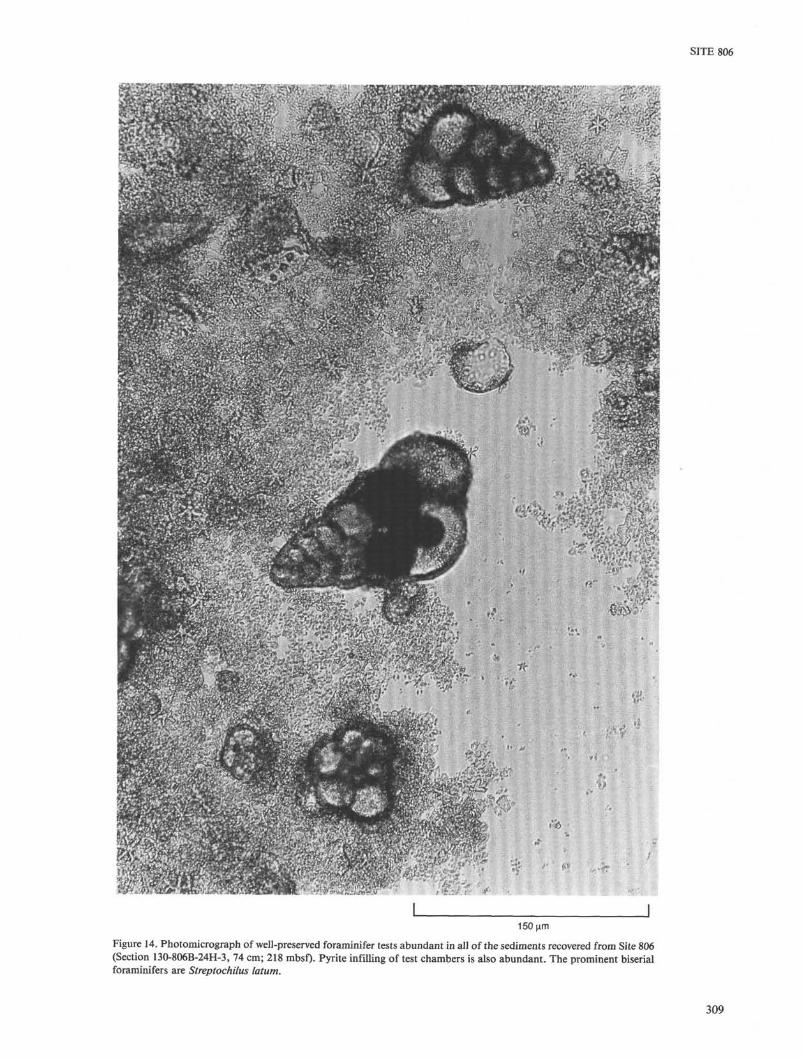
150µm
Figure 14. Photomicrograph of well-preserved foraminifer tests abundant in all of the sediments recovered from Site 806(Section 130-806B-24H-3, 74 cm; 218 mbsf) Pyrite infilling of test chambers is also abundant. The prominent biserialforaminifers are Streptochilus latum.
309
SITE 806
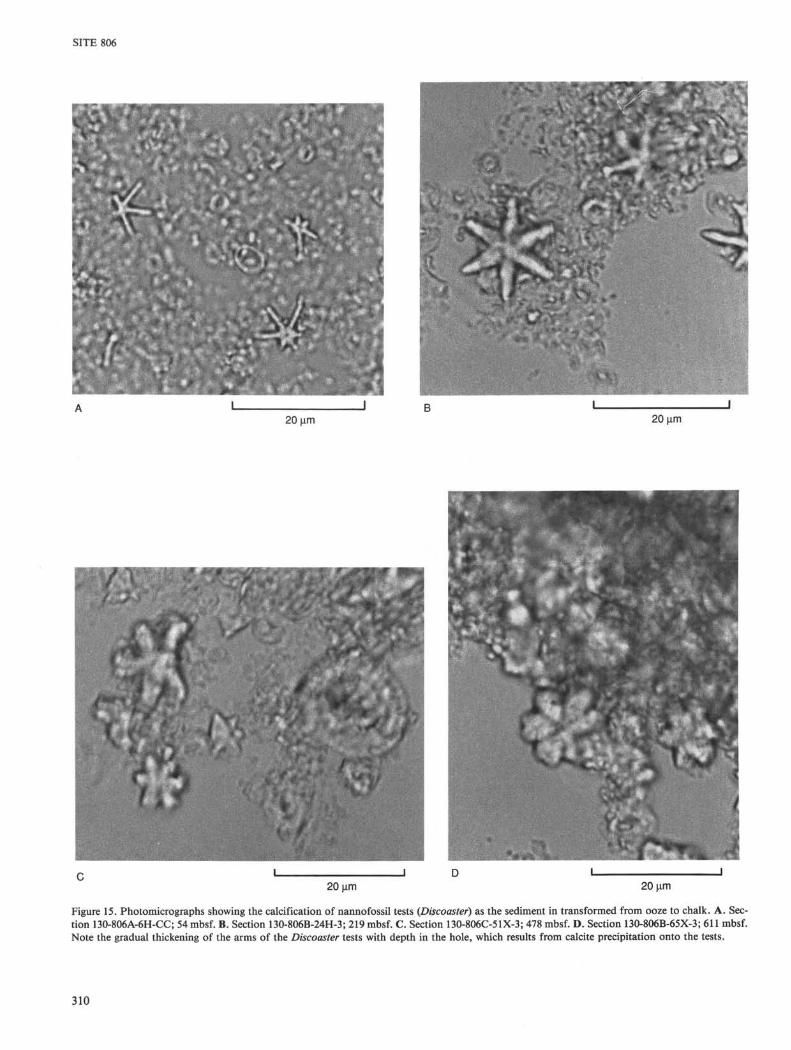
20 µm 20 µm
20 µm 20 µm
Figure 15. Photomicrographs showing the calcification of nannofossil tests (Discoaster) as the sediment in transformed from ooze to chalk. A. Sec-tion 130-806A-6H-CC; 54 mbsf. B. Section 130-806B-24H-3; 219 mbsf. C. Section 13O-8O6C-51X-3; 478 mbsf. D. Section 13O-8O6B-65X-3; 611 mbsf.Note the gradual thickening of the arms of the Discoaster tests with depth in the hole, which results from calcite precipitation onto the tests.
310
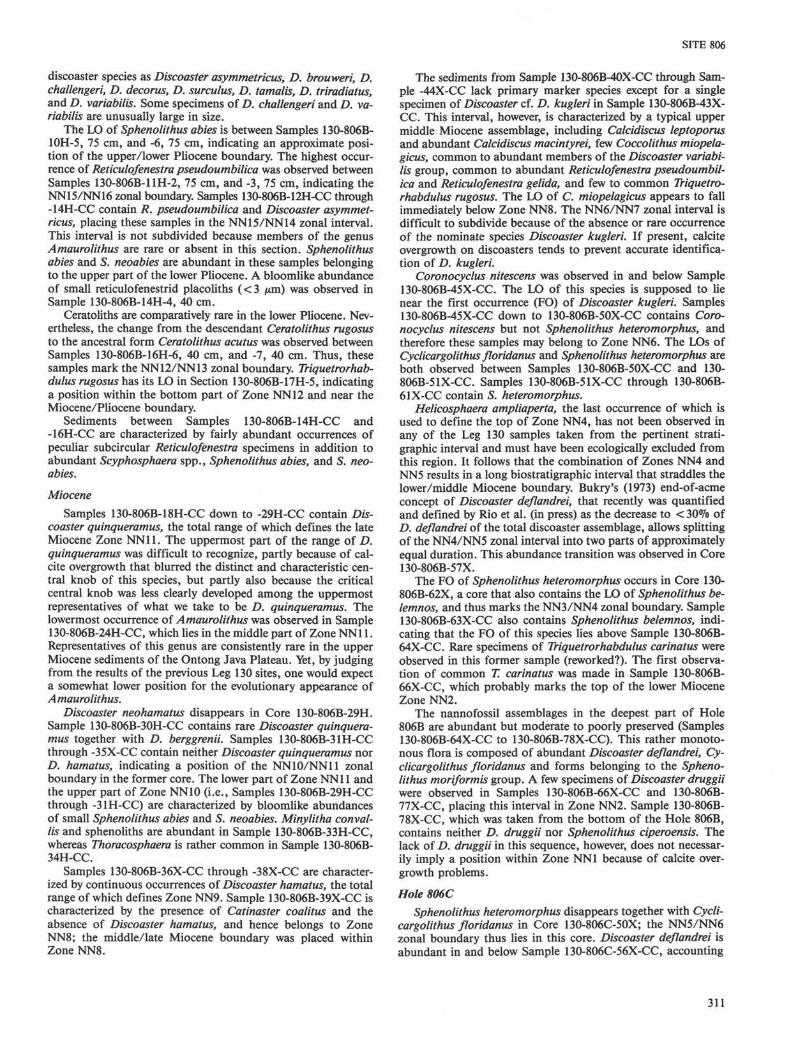
SITE 806
discoaster species as Discoaster asymmetricus, D. brouweri, D.challengeri, D. decorus, D. surculus, D. tamalis, D. triradiatus,and D. variabilis. Some specimens of D. challengeri and D. va-riabilis are unusually large in size.
The LO of Sphenolithus abies is between Samples 130-806B-10H-5, 75 cm, and -6, 75 cm, indicating an approximate posi-tion of the upper/lower Pliocene boundary. The highest occur-rence of Reticulofenestra pseudoumbilica was observed betweenSamples 130-806B-11H-2, 75 cm, and -3, 75 cm, indicating theNN15/NN16 zonal boundary. Samples 130-806B-12H-CC through-14H-CC contain R. pseudoumbilica and Discoaster asymmet-ricus, placing these samples in the NN15/NN14 zonal interval.This interval is not subdivided because members of the genusAmaurolithus are rare or absent in this section. Sphenolithusabies and S. neoabies are abundant in these samples belongingto the upper part of the lower Pliocene. A bloomlike abundanceof small reticulofenestrid placoliths (< 3 µm) was observed inSample 130-806B-14H-4, 40 cm.
Ceratoliths are comparatively rare in the lower Pliocene. Nev-ertheless, the change from the descendant Ceratolithus rugosusto the ancestral form Ceratolithus acutus was observed betweenSamples 130-806B-16H-6, 40 cm, and -7, 40 cm. Thus, thesesamples mark the NN12/NN13 zonal boundary. Triquetrorhab-dulus rugosus has its LO in Section 130-806B-17H-5, indicatinga position within the bottom part of Zone NN12 and near theMiocene/Pliocene boundary.
Sediments between Samples 130-806B-14H-CC and-16H-CC are characterized by fairly abundant occurrences ofpeculiar subcircular Reticulofenestra specimens in addition toabundant Scyphosphaera spp., Sphenolithus abies, and S. neo-abies.
Miocene
Samples 13O-8O6B-18H-CC down to -29H-CC contain Dis-coaster quinqueramus, the total range of which defines the lateMiocene Zone NN11. The uppermost part of the range of D.quinqueramus was difficult to recognize, partly because of cal-cite overgrowth that blurred the distinct and characteristic cen-tral knob of this species, but partly also because the criticalcentral knob was less clearly developed among the uppermostrepresentatives of what we take to be D. quinqueramus. Thelowermost occurrence of Amaurolithus was observed in Sample130-806B-24H-CC, which lies in the middle part of Zone NN11.Representatives of this genus are consistently rare in the upperMiocene sediments of the Ontong Java Plateau. Yet, by judgingfrom the results of the previous Leg 130 sites, one would expecta somewhat lower position for the evolutionary appearance ofAmaurolithus.
Discoaster neohamatus disappears in Core 130-806B-29H.Sample 13O-8O6B-3OH-CC contains rare Discoaster quinquera-mus together with D. berggrenii. Samples 130-806B-31H-CCthrough -35X-CC contain neither Discoaster quinqueramus norD. hamatus, indicating a position of the NN10/NN11 zonalboundary in the former core. The lower part of Zone NN11 andthe upper part of Zone NN10 (i.e., Samples 130-806B-29H-CCthrough -31H-CC) are characterized by bloomlike abundancesof small Sphenolithus abies and S. neoabies. Minylitha conval-lis and sphenoliths are abundant in Sample 13O-8O6B-33H-CC,whereas Thoracosphaera is rather common in Sample 130-806B-34H-CC.
Samples 130-806B-36X-CC through -38X-CC are character-ized by continuous occurrences of Discoaster hamatus, the totalrange of which defines Zone NN9. Sample 130-806B-39X-CC ischaracterized by the presence of Catinaster coalitus and theabsence of Discoaster hamatus, and hence belongs to ZoneNN8; the middle/late Miocene boundary was placed withinZone NN8.
The sediments from Sample 130-806B-40X-CC through Sam-ple -44X-CC lack primary marker species except for a singlespecimen of Discoaster cf. D. kugleri in Sample 130-806B-43X-CC. This interval, however, is characterized by a typical uppermiddle Miocene assemblage, including Calcidiscus leptoporusand abundant Calcidiscus macintyrei, few Coccolithus miopela-gicus, common to abundant members of the Discoaster variabi-lis group, common to abundant Reticulofenestra pseudoumbil-ica and Reticulofenestra gelida, and few to common Triquetro-rhabdulus rugosus. The LO of C. miopelagicus appears to fallimmediately below Zone NN8. The NN6/NN7 zonal interval isdifficult to subdivide because of the absence or rare occurrenceof the nominate species Discoaster kugleri. If present, calciteovergrowth on discoasters tends to prevent accurate identifica-tion of D. kugleri.
Coronocyclus nitescens was observed in and below Sample130-806B-45X-CC. The LO of this species is supposed to lienear the first occurrence (FO) of Discoaster kugleri. Samples130-806B-45X-CC down to 130-806B-50X-CC contains Coro-nocyclus nitescens but not Sphenolithus heteromorphus, andtherefore these samples may belong to Zone NN6. The LOs ofCyclicargolithus floridanus and Sphenolithus heteromorphus areboth observed between Samples 13O-8O6B-5OX-CC and 130-806B-51X-CC. Samples 130-806B-51X-CC through 130-806B-61X-CC contain S. heteromorphus.
Helicosphaera ampliaperta, the last occurrence of which isused to define the top of Zone NN4, has not been observed inany of the Leg 130 samples taken from the pertinent strati-graphic interval and must have been ecologically excluded fromthis region. It follows that the combination of Zones NN4 andNN5 results in a long biostratigraphic interval that straddles thelower/middle Miocene boundary. Bukry's (1973) end-of-acmeconcept of Discoaster deflandrei, that recently was quantifiedand defined by Rio et al. (in press) as the decrease to < 30% ofD. deflandrei of the total discoaster assemblage, allows splittingof the NN4/NN5 zonal interval into two parts of approximatelyequal duration. This abundance transition was observed in Core130-806B-57X.
The FO of Sphenolithus heteromorphus occurs in Core 130-806B-62X, a core that also contains the LO of Sphenolithus be-lemnos, and thus marks the NN3/NN4 zonal boundary. Sample130-806B-63X-CC also contains Sphenolithus belemnos, indi-cating that the FO of this species lies above Sample 130-806B-64X-CC. Rare specimens of Triquetrorhabdulus carinatus wereobserved in this former sample (reworked?). The first observa-tion of common T. carinatus was made in Sample 130-806B-66X-CC, which probably marks the top of the lower MioceneZone NN2.
The nannofossil assemblages in the deepest part of Hole806B are abundant but moderate to poorly preserved (Samples130-806B-64X-CC to 130-806B-78X-CC). This rather monoto-nous flora is composed of abundant Discoaster deflandrei, Cy-clicargolithus floridanus and forms belonging to the Spheno-lithus moriformis group. A few specimens of Discoaster druggiiwere observed in Samples 130-806B-66X-CC and 130-806B-77X-CC, placing this interval in Zone NN2. Sample 130-806B-78X-CC, which was taken from the bottom of the Hole 806B,contains neither D. druggii nor Sphenolithus ciperoensis. Thelack of D. druggii in this sequence, however, does not necessar-ily imply a position within Zone NN1 because of calcite over-growth problems.
Hole 806CSphenolithus heteromorphus disappears together with Cycli-
cargolithus floridanus in Core 13O-8O6C-5OX; the NN5/NN6zonal boundary thus lies in this core. Discoaster deflandrei isabundant in and below Sample 130-806C-56X-CC, accounting
311
SITE 806
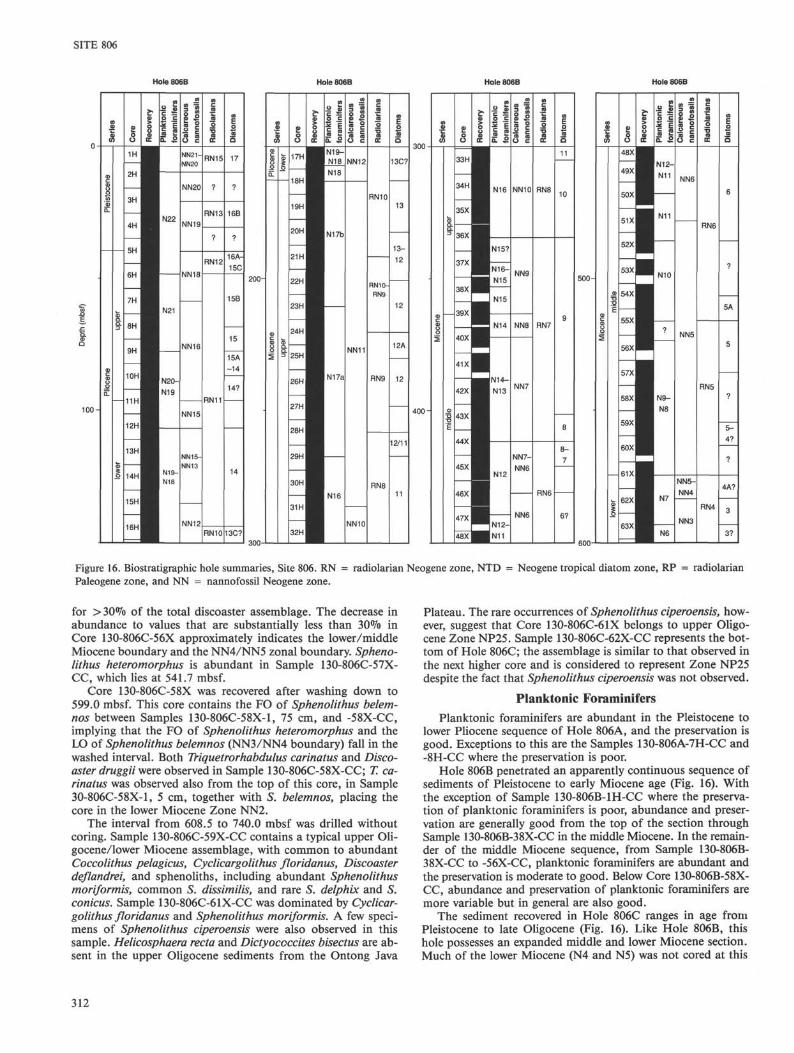
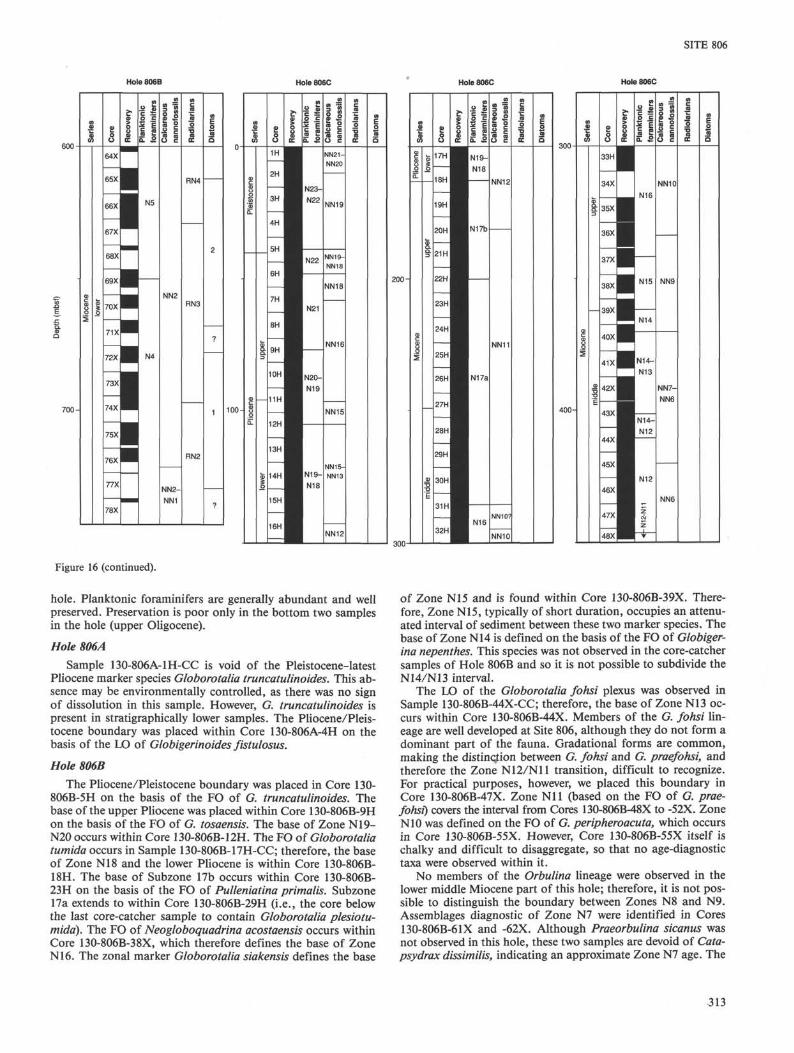
Hole 806B Hole806B Hole 806B
Figure 16. Biostratigraphic hole summaries, Site 806. RN = radiolarian Neogene zone, NTD = Neogene tropical diatom zone, RP = radiolarianPaleogene zone, and NN = nannofossil Neogene zone.
for > 30% of the total discoaster assemblage. The decrease inabundance to values that are substantially less than 30% inCore 130-806C-56X approximately indicates the lower/middleMiocene boundary and the NN4/NN5 zonal boundary. Spheno-lithus heteromorphus is abundant in Sample 130-806C-57X-CC, which lies at 541.7 mbsf.
Core 130-806C-58X was recovered after washing down to599.0 mbsf. This core contains the F0 of Sphenolithus belem-nos between Samples 130-806C-58X-1, 75 cm, and -58X-CC,implying that the FO of Sphenolithus heteromorphus and theLO of Sphenolithus belemnos (NN3/NN4 boundary) fall in thewashed interval. Both Triquetrorhabdulus carinatus and Disco-aster druggii were observed in Sample 130-806C-58X-CC; T. ca-rinatus was observed also from the top of this core, in Sample30-806C-58X-1, 5 cm, together with S. belemnos, placing thecore in the lower Miocene Zone NN2.
The interval from 608.5 to 740.0 mbsf was drilled withoutcoring. Sample 130-806C-59X-CC contains a typical upper Oli-gocene/lower Miocene assemblage, with common to abundantCoccolithus pelagicus, Cyclicargolithus floridanus, Discoasterdeflandrei, and sphenoliths, including abundant Sphenolithusmoriformis, common S. dissimilis, and rare S. delphix and S.conicus. Sample 130-806C-61X-CC was dominated by Cyclicar-golithus floridanus and Sphenolithus moriformis. A few speci-mens of Sphenolithus ciperoensis were also observed in thissample. Helicosphaera recta and Dictyococcites bisectus are ab-sent in the upper Oligocene sediments from the Ontong Java
Plateau. The rare occurrences of Sphenolithus ciperoensis, how-ever, suggest that Core 130-806C-61X belongs to upper Oligo-cene Zone NP25. Sample 130-806C-62X-CC represents the bot-tom of Hole 806C; the assemblage is similar to that observed inthe next higher core and is considered to represent Zone NP25despite the fact that Sphenolithus ciperoensis was not observed.
Planktonic ForaminifersPlanktonic foraminifers are abundant in the Pleistocene to
lower Pliocene sequence of Hole 806A, and the preservation isgood. Exceptions to this are the Samples 13O-8O6A-7H-CC and-8H-CC where the preservation is poor.
Hole 806B penetrated an apparently continuous sequence ofsediments of Pleistocene to early Miocene age (Fig. 16). Withthe exception of Sample 130-806B-1H-CC where the preserva-tion of planktonic foraminifers is poor, abundance and preser-vation are generally good from the top of the section throughSample 130-806B-38X-CC in the middle Miocene. In the remain-der of the middle Miocene sequence, from Sample 13O-8O6B-38X-CC to -56X-CC, planktonic foraminifers are abundant andthe preservation is moderate to good. Below Core 130-806B-58X-CC, abundance and preservation of planktonic foraminifers aremore variable but in general are also good.
The sediment recovered in Hole 806C ranges in age fromPleistocene to late Oligocene (Fig. 16). Like Hole 806B, thishole possesses an expanded middle and lower Miocene section.Much of the lower Miocene (N4 and N5) was not cored at this
312
SITE 806
Hole 806B Hole 806C Hole 806C Hole 806C
300-
Figure 16 (continued).
hole. Planktonic foraminifers are generally abundant and wellpreserved. Preservation is poor only in the bottom two samplesin the hole (upper Oligocene).
Hole 806A
Sample 130-806A-1H-CC is void of the Pleistocene-latestPliocene marker species Globorotalia truncatulinoides. This ab-sence may be environmentally controlled, as there was no signof dissolution in this sample. However, G. truncatulinoides ispresent in stratigraphically lower samples. The Pliocene/Pleis-tocene boundary was placed within Core 130-806A-4H on thebasis of the LO of Globigehnoides fistulosus.
Hole 806B
The Pliocene/Pleistocene boundary was placed in Core 130-806B-5H on the basis of the FO of G. truncatulinoides. Thebase of the upper Pliocene was placed within Core 130-806B-9Hon the basis of the FO of G. tosaensis. The base of Zone NI 9-N20 occurs within Core 130-806B-12H. The FO of Globorotaliatumida occurs in Sample 130-806B-17H-CC; therefore, the baseof Zone NI8 and the lower Pliocene is within Core 130-806B-18H. The base of Subzone 17b occurs within Core 130-806B-23H on the basis of the FO of Pulleniatina primalis. Subzone17a extends to within Core 130-806B-29H (i.e., the core belowthe last core-catcher sample to contain Globorotalia plesiotu-midà). The FO of Neogloboquadrina acostaensis occurs withinCore 13O-8O6B-38X, which therefore defines the base of ZoneNI6. The zonal marker Globorotalia siakensis defines the base
of Zone N15 and is found within Core 130-806B-39X. There-fore, Zone N15, typically of short duration, occupies an attenu-ated interval of sediment between these two marker species. Thebase of Zone N14 is defined on the basis of the FO of Globiger-ina nepenthes. This species was not observed in the core-catchersamples of Hole 806B and so it is not possible to subdivide theN14/N13 interval.
The LO of the Globorotalia fohsi plexus was observed inSample 130-806B-44X-CC; therefore, the base of Zone N13 oc-curs within Core 130-806B-44X. Members of the G. fohsi lin-eage are well developed at Site 806, although they do not form adominant part of the fauna. Gradational forms are common,making the distinction between G. fohsi and G. praefohsi, andtherefore the Zone N12/N11 transition, difficult to recognize.For practical purposes, however, we placed this boundary inCore 130-806B-47X. Zone N i l (based on the FO of G. prae-fohsi) covers the interval from Cores 130-806B-48X to -52X. ZoneN10 was defined on the FO of G. peripheroacuta, which occursin Core 13O-8O6B-55X. However, Core 130-806B-55X itself ischalky and difficult to disaggregate, so that no age-diagnostictaxa were observed within it.
No members of the Orbulina lineage were observed in thelower middle Miocene part of this hole; therefore, it is not pos-sible to distinguish the boundary between Zones N8 and N9.Assemblages diagnostic of Zone N7 were identified in Cores130-806B-61X and -62X. Although Praeorbulina sicanus wasnot observed in this hole, these two samples are devoid of Cata-psydrax dissimilis, indicating an approximate Zone N7 age. The
-313
SITE 806
Hole 806C Hole806C
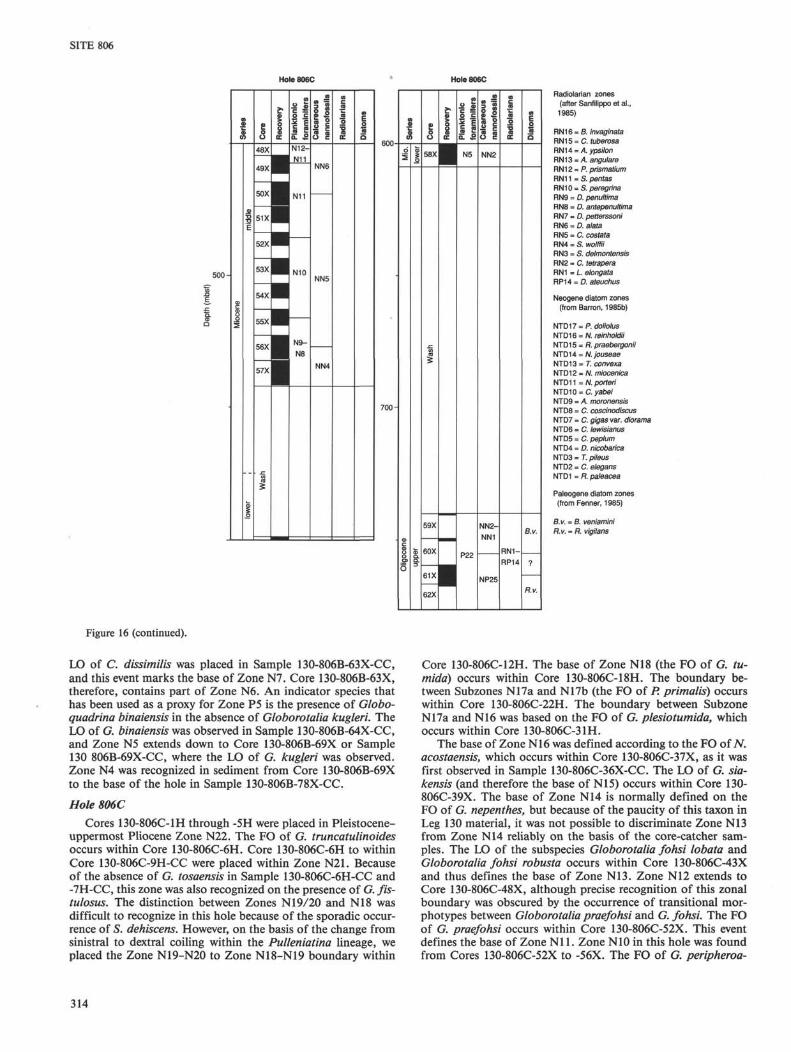
Radiolarian zones(after Sanfilippo et al.,1985)
= B. invaginata= C. tubβrosa= A. ypsilon= A. angulare= P. prismatium= S. pentas= S. perβgriπaD. pβnultimaD. antepenultimaD. petterssoniD. alataC. costataS. wolffiiS. dθlmontβnsisC. tβtrapβraL. βlongata-– D. atβuchus
Neogene diatom zones(from Barron, 1985b)
= P. doliolus= N. rβinholdii= R. praebβrgoniim N. jouseae= T. convβxa= N. miocβnica= N. porteri= C. yabβi: A. moronβnsisi C. coscinodiscusC. gigas var. dioramaC. lewisianusC. peplumD. nicobaricaT. pileusC. elegansR. paleacea
Paleogene diatom zones(from Fenner, 1985)
B.v. = B. vβπiaminiR.v. = R. vigilans
Figure 16 (continued).
LO of C. dissimilis was placed in Sample 130-806B-63X-CC,and this event marks the base of Zone N7. Core 130-806B-63X,therefore, contains part of Zone N6. An indicator species thathas been used as a proxy for Zone P5 is the presence of Globo-quαdrinα binαiensis in the absence of Globorotαliα kugleri. TheLO of G. binαiensis was observed in Sample 130-806B-64X-CC,and Zone N5 extends down to Core 130-806B-69X or Sample130 806B-69X-CC, where the LO of G. kugleri was observed.Zone N4 was recognized in sediment from Core 130-806B-69Xto the base of the hole in Sample 130-806B-78X-CC.
Hole 806C
Cores 130-806C-1H through -5H were placed in Pleistocene-uppermost Pliocene Zone N22. The FO of G. truncαtulinoidesoccurs within Core 130-806C-6H. Core 130-806C-6H to withinCore 130-806C-9H-CC were placed within Zone N21. Becauseof the absence of G. tosαensis in Sample 130-806C-6H-CC and-7H-CC, this zone was also recognized on the presence of G. fis-tulosus. The distinction between Zones NI9/20 and N18 wasdifficult to recognize in this hole because of the sporadic occur-rence of 5. dehiscens. However, on the basis of the change fromsinistral to dextral coiling within the Pulleniαtinα lineage, weplaced the Zone N19-N20 to Zone N18-N19 boundary within
Core 130-806C-12H. The base of Zone N18 (the FO of G. tu-midd) occurs within Core 13O-8O6C-18H. The boundary be-tween Subzones NI7a and NI7b (the FO of P. primαlis) occurswithin Core 130-806C-22H. The boundary between SubzoneNI7a and NI6 was based on the FO of G. plesiotumidα, whichoccurs within Core 130-806C-31H.
The base of Zone NI6 was defined according to the FO of N.αcostαensis, which occurs within Core 130-806C-37X, as it wasfirst observed in Sample 130-806C-36X-CC. The LO of G. siα-kensis (and therefore the base of NI5) occurs within Core 130-806C-39X. The base of Zone N14 is normally defined on theFO of G. nepenthes, but because of the paucity of this taxon inLeg 130 material, it was not possible to discriminate Zone NI3from Zone N14 reliably on the basis of the core-catcher sam-ples. The LO of the subspecies Globorotαliα fohsi lobαtα andGloborotαliα fohsi robustα occurs within Core 130-806C-43Xand thus defines the base of Zone NI3. Zone N12 extends toCore 130-806C-48X, although precise recognition of this zonalboundary was obscured by the occurrence of transitional mor-photypes between Globorotαliα prαefohsi and G. fohsi. The FOof G. prαefohsi occurs within Core 130-806C-52X. This eventdefines the base of Zone NI 1. Zone N10 in this hole was foundfrom Cores 130-806C-52X to -56X. The FO of G. peripheroα-
314
SITE 806
cuta, which defines the base of Zone N10, occurs within Core130-806C-56X.
Members of the Orbulina lineage are not well represented inHole 806C (as was the case in Hole 806B); therefore, it was notpossible to distinguish Zones N8 and N9. Together, these twozones occupy Cores 130-806C-56X and -57X. The hole wasdrilled without coring much of the lower Miocene. The nextsample examined (Sample 130-806C-58X-CC at 608.5 mbsf) iswithin Zone N5, the base of which is defined by the LO of G.kugleri. Further washing took place below this sample, and thenext sample to be examined (Sample 130-806C-59X-CC at 749.5mbsf) contains a planktonic foraminifer fauna of upper Oligo-cene age (Zone P22). The critical marker species designatingP22 is Globorotalia pseudokugleri in the absence of G. kugleris.s. Samples 130-806C-60X-CC and -61X-CC are also of ZoneP22 age.
DiatomsDiatoms were examined in Holes 806B (Samples 130-806B-
1H-CC through -78X-CC) and 806C (Samples 130-806C-59X-CC through -62X-CC). Quaternary through lower Miocene dia-toms are present in Hole 806B (Fig. 16). The sediment recoveredin Hole 806C ranges in age from Pleistocene to Oligocene.Much of the lower Miocene section was drilled without coringto retrieve the Oligocene/Miocene boundary. Oligocene diatomsare present in the four samples analyzed from Hole 806C (Fig.16).
Diatoms are common to abundant and preservation gener-ally is moderate from the Pleistocene (Sample 130-806B-1H-CC) through the middle Miocene (Sample 13O-8O6B-51X-CC).Large fluctuations in abundance (abundant to few) and preser-vation (moderate to poor) were seen below Core 130-806B-52X.Furthermore, only one fragment of Synedra jouseana and onefragment of Craspedodiscus coscinodiscus (coarse form) werefound in Sample 130-806C-78X-CC. Preservation is poor in up-permost Oligocene Samples 130-806C-59X-CC and -60X-CC.
As at Site 805, Site 806 has a complete and expanded sedi-ment sequence, from the Quaternary NTD 17 Pseudoeunotiadoliolus Zone (Sample 130-806B-1H-CC) throughout the Oligo-cene Rocella vigilans Zone (Sample 130-806C-62X-CC). How-ever, the Rocella gelida Zone across the Miocene/Oligoceneboundary may be missing. This also has been the case in all theprevious sites (803, 804, and 805).
The Pliocene/Pleistocene boundary, as defined on the basisof diatoms, is within Core 130-806B-5H, as Sample 130-806B-5H-CC does not contain specimens off? doliolus. Samples 130-806B-5H-CC through 130-806B-9H-CC are all referable to theNTD 15 R. praebergonii Zone in the upper Pliocene.
The Pliocene/Miocene boundary was located in the NTD 13Thalassiosira convexa Zone, and it coincides with the FO of T.oestrupii in Sample 130-806B-18H-CC.
The late Miocene/middle Miocene boundary falls within theNTD 9 Actinocyclus moronensis Zone and may be contained inCore 130-806B-39X. Poor preservation and low diatom abun-dance hinders exact recognition of the middle Miocene/lowerMiocene boundary. It may be placed in Core 130-806B-59X asthe next downcore sample analyzed (Sample 130-806B-59X-CC)contains the LO of Raphidodiscus marylandicus (16.7 Ma)within the lower Miocene. The thick Miocene section at Site 806allowed us to recognize two diatom zones previously missing atSites 803 and 804: the NTD 4 Denticulopsis nicobarica Zoneand the NTD 3 Triceratium pileus Zone (Samples 130-806B-57X-CC (?) to -63X-CC).
The Oligocene flora of Hole 806C is preserved poorly. Sam-ple 130-806C-59X-CC tentatively was assigned to the Borgoro-
via veniamini Zone, and Samples 130-806C-61X-CC and -62X-CC were assigned to the Rocella vigilans Zone.
RadiolariansRadiolarians recovered from Site 806 ranged from well to
poorly preserved, and most of the samples provided useful ageinformation. All core-catcher samples from Hole 806B were ex-amined. Four core-catcher samples recovered from Hole 806C(the bottom of which is at 776.4 mbsf) were also examined. Thefollowing discussion concerns the zonal assignments of the strati-graphically important taxa and the age of their datum levels.The radiolarian datums with absolute ages cited in the discus-sion are taken from those listed by Nigrini in the Leg 117 "Ex-planatory Notes" chapter (Prell et al., 1989). Figure 16 summa-rizes the radiolarian zonation of Holes 806B and 806C and cor-relates these zonations with the zones of the other microfossilgroups. The radiolarian zones are continuous at least from thelower Pleistocene to the early lower Miocene. No evidence forsignificant sediment reworking is found at this site.
Quaternary
Sample 130-806B-1H-CC was placed in the Collosphaeratuberosa Zone of the Quaternary, given the presence of C. tu-berosa and the absence of Buccinosphaera invaginata. The up-permost Pleistocene section appears to be condensed. Samples130-806B-2H-CC and -4H-CC did not contain enough key radi-olarian taxa to assign ages. Core 130-806B-3H-CC, which con-tains A. angulare and Theocorythium trachelium, was placed inthe Anthocyrtidium angulare Zone.
PlioceneThe LO of Pterocanium prismatium (1.52-1.56 Ma) was ob-
served in Sample 130-806B-5H-CC, which places it in the upperpart of the P. prismatium Zone. Samples 130-806B-6H-CCthrough -15H-CC were assigned to the Spongaster pentas Zone.This zone contains the following radiolarian events: the LO of5. pentas (3.74-3.82 Ma) in Sample 13O-8O6B-6H-CC; the LOof Stichocorys peregrina (2.62-2.64 Ma) in Sample 130-806B-7H-CC; the FO of Amphirhopalum ypsilon (3.77-3.79 Ma) inSample 130-806B-8H-CC; the FO of Spongaster tetras (3.83-3.85 MA) in Sample 130-806B-11H-CC; and the LO of Spon-gaster berminghami (3.85-3.87 Ma) in Sample 130-806B-16H-CC. Samples 130-806B-16H-CC through -20H-CC were placedin the Stichocorys peregrina Zone. Radiolarian events found inthis zone include the LO of Solenosphaera omnitubus (4.7-4.8Ma) in Sample 130-806B-16H-CC; the FO of S. pentas (4.2-4.3Ma) in Sample 130-806B-18H-CC; and the LO of Acrobotrystritubus (5.3-5.4 Ma) in Sample 130-806B-20H-CC.
Upper MioceneSamples 130-806B-21H-CC through -23H-CC were assigned
to the Didymocyrtispenultima or the S. peregrina Zones, whichcannot be differentiated. These samples contain the followingkey taxa: S. peregrina, S. berminghami, S. omnitubus, A. tritu-bus, and D. penultima. Samples 130-806B-24H-CC through-27H-CC belong to the D. penultima Zone. Radiolarian eventsfound in these samples include the LO of Calocycletta caepa(6.2-6.6 Ma) in Sample 130-806B-24H-CC and the FO of S.omnitubus (6.3-6.5 Ma) in Sample 130-806B-26H-CC. Samples130-806B-28H-CC through -35X-CC were placed in the Didy-mocyrtis antepenultima Zone. The LOs of the following fivetaxa were found: Diartus hughesi (7.1-7.2 Ma) in Sample 130-806B-29H-CC; Dictyocoryne ontogenesis (7.2-7.7 Ma) in Sam-ple 130-806B-31H-CC; Didymocyrtis laticonus (8.1-8.2 Ma) inSample 130-806B-31H-CC; Diartuspetterssoni (8.1-8.2 Ma) in
315
SITE 806
Sample 130-806B-34H-CC; and Stichocorys wolffii (8.1-8.2 Ma)in Sample 130-806B-35H-CC. Also, the FO of S. berminghami(7.9-8.0 Ma) was observed in Sample 130-806B-35X-CC.
Middle Miocene
Samples 130-806B-36X-CC through -43X-CC were assignedto the D. petterssoni Zone. In this zone, the FO of D. hughesi(8.7-8.8 Ma) in Sample 130-806B-35X-CC and the LO of thefollowing three taxa were observed: Cyrtocapsella japonica (10.0-10.3 Ma) in Sample 130-806B-38X-CC, Lithopera thornburgi(10.3-11.6 Ma) in Sample 130-806B-42X-CC, and Cyrtocap-sella cornuta (11.6-11.9 Ma) in Sample 13O-8O6B-43X-CC. TheDorcadospyris alata Zone begins in Sample 130-806B-44X-CCand extends through Sample 130-806B-54X-CC. Several LOsand FOs of Dorcadospyris species are in this zone, but exact da-tum levels are yet to be determined.
Lower Miocene and Oligocene
Samples 130-806B-56X-CC through -60X-CC were placed inthe Calocycletta costata Zone. Around this depth and below, ra-diolarian preservation is generally moderate to poor; however,age assignments are still possible because of the preservation ofsufficient key taxa. The Stichocorys wolffii Zone occurs be-tween the base of C. costata and the base of S. wolffii (Riedeland Sanfilippo, 1978), and Samples 130-806B-61X-CC through-66X-CC were placed in it. S. wolffii was generally found inhigh abundance in this zone. A critical evaluation of S. wolffiimorphology (i.e., the number of pores in the cephalis that are< 12) was needed to bracket this zone because other morpho-logical features of this taxon are identical to those of Stichoco-rys delmontensis (Riedel and Sanfilippo, 1978).
Samples 130-806B-67X-CC through -73X-CC were placedin the S. delmontensis Zone, which is followed by the Cyrto-capsella tetrapera Zone in Samples 130-806B-74X-CC through-77X-CC. Sample 130-806B-78X-CC (743.1 mbsf) and Samples130-806C-59X-CC (749.5 mbsf) through -62X-CC (776.4 mbsf)were assigned to either the Dorcadospyris ateuchus or the C.tetrapera Zone, which cannot be differentiated. It is notablethat Dorcadospyris riedeli appears just above the occurrence ofDorcadospyris papilio, which has been noted at other sites. Theradiolarian evidence suggests that the bottom of Hole 806C mayor may not be in the Oligocene because of the zonal assignment,which ranges from the middle Oligocene to the early lower Mio-cene.
PALEOMAGNETISM
IntroductionStable magnetic polarity at Site 806 can be traced downward
with confidence only to about 10 mbsf in Holes 806B and 806Cand does not extend to the Brunhes/Matuyama Chron bound-ary in either hole, representing the trend toward a shorter mag-netostratigraphic record with decreasing water depth in the threenear-equatorial sites (804, 805, and 806). Two factors combineto reduce the age limit of the preserved magnetostratigraphy: (1)an increase in sedimentation rates extending the record, so thata given magnetic datum occurs at a greater subbottom depth;and (2) a decrease in the sub-bottom depth at which the primarymagnetic remanence fades to the point that polarity informa-tion is lost (Fig. 17). In response to this behavior, detailed paleo-magnetic analysis at Site 806 was curtailed at any early stage.
Natural remanent magnetization (NRM) and 15-mT alter-nating field (AF) demagnetized runs were measured in the cryo-genic magnetometer at 1-cm intervals in the first two cores inboth Holes 806B and 806C (Cores 130-806B-1H and -2H andCores 130-806C-1H and -2H). The measurement interval wasexpanded to 3 cm for the third and fourth cores (Cores 130-
2000
S-3000
CO
4000
Site 806Latitude 0.32°N
•
-Site 805Latitude
-
1.23°N -
Site 803 *Latitude 2.43°N "
Site 804Latitude 0.98°N f -
10 20 30 40Deepest observed stable magnetic polarity
(mbsf)
50
Figure 17. Relationship between water and sub-bottom depths to thedeepest point at which stable magnetic polarity was observed for Sites803-806. The depth to which magnetic polarity is preserved lessens withdecreasing water depth and increased proximity to the equatorial zoneof high biogenic productivity.
806B-3H and -4H and Cores 130-806C-3H and -4H), and to 5cm for the fifth core (Cores 130-806B-5H and 130-806C-5H).Measurement was expanded to 10-cm intervals from Core 130-806B-11H in Hole 806B, and from Core 130-806C-7H in Hole806C, whereas demagnetization was restricted to one section percore. Paleomagnetic measurements in Hole 806C were discon-tinued after Core 130-806C-10H.
Magnetization RecordPlots of AF-demagnetized declination, inclination and inten-
sity for Holes 806B and 806C are shown in Figure 18. Cores130-806B-1H and -2H and Cores 130-806C-1H and -2H werenot oriented; these cores represent the upper 16 m in Hole 806Band the upper 15.3 m in Hole 806C. The intensity record incores from Hole 806B, subjected to 15-mT magnetic cleaning,remains fairly constant at values of 2-4 mA/m from the surfaceto 10.3 mbsf, at which point the intensity values decrease to0.1-0.2 mA/m over an interval of about 0.5 m. Demagnetizedintensity in Hole 806B then increases with sub-bottom depth,peaking at values of 0.5 mA/m at 20 mbsf, before decliningagain to 0.01-0.02 mA/m by 30 mbsf, and recovering to about0.5 mA/m at about 37 mbsf. Demagnetized intensities of coresfrom Hole 806C also decrease sharply at 10 mbsf, decliningfrom 3 mA/m at 9.8 mbsf to 0.3 mA/m at 10.5 mbsf. Below10.5 mbsf, intensity declines more steadily in Hole 806C than inHole 806B.
Although both the declination and inclination records arenoisy, AF-cleaned magnetizations in Holes 806B and 806C ap-pear to be stable down to about 10 mbsf, the depth at which in-tensity values suddenly decline. Continuity of the declinationrecord from within a meter of the seafloor implies that the po-larity to 10 mbsf is normal, despite the lack of orientation over
316
SITE 806
20
30
..j* T*
..j., ii •
-rt;J p;..,
!rt i90 180 270
Declination(degrees)
360 -90 -30 0 30Inclination(degrees)
90 10z 1 102
Intensity(mA/m)
104 0 90 180 270
Declination(degrees)
360 -90 -30 30Inclination(degrees)
90 10"2 1 1(
Intensity(mA/m)
10"
Figure 18. Unoriented, AF-demagnetized declination, inclination, and intensity charts for the first four cores in Holes 806B and 806C. A. Cores 130-806B-1H to -4H. B. Cores 130-806B-1H to -4H.
this interval, and that the Brunhes/Matuyama boundary is deeperthan 10 mbsf in both holes. Below 10 mbsf, the AF-cleanedmagnetization records in both holes are difficult to interpret.Within Core 130-806B-2H, immediately below the sharp dropin intensity at 10.5 mbsf, the AF-cleaned declination and incli-nation records are complex and remain so until about 12.5mbsf. Inclination values reach about + 80° at 11.2 mbsf beforedecreasing to 0° at 13.6 mbsf. Declination and inclination re-cords remain constant from 13.6 mbsf to the base of Core 130-806B-2H at 16.0 mbsf.
Declination values follow an extraordinary spiraling paththrough three complete revolutions from the top of Core 130-806B-3H at 16.0 mbsf down to 21 mbsf. Over this interval, incli-nation varies from about + 60° to about - 70° in a continuousbut complex fashion, and intensity increases as noted above. Be-low 21 mbsf the AF-cleaned record in Hole 806B becomes cha-otic, and intensities decrease again. Complex magnetization fea-tures also appear in the record from Hole 806C, beginning im-mediately below the sharp drop in intensity values at 10.3 mbsf.Between 10.3 and ~ 12.3 mbsf in Core 130-806C-2H, the AF-cleaned declination record swings through a series of short-wavelength, large variations, whereas the inclination data forma noisy grouping around +60°. From 12.3 mbsf to the base ofCore 130-806C-2H at 15.1 mbsf, declination data continue tooscillate, with a wavelength of about 30 cm and a range ofabout 60°-140°, whereas the inclination values trend downwardfrom about +80° to about -30°.
Visual examination of these intervals of complex magnetiza-tion in Holes 806B and 806C shows no evidence for physical dis-
ruption or internal rotation of the cores. It is difficult to envis-age how these features could have arisen as part of the primarymagnetization of the sediments. It is also clear from an exami-nation of the records from Sites 803, 804, and 805 that the lossof recognizable polarity normally accompanies a sudden dropin intensity of the type seen at about 10 mbsf in Holes 806B and806C. NRM measurements have steep negative inclinations overeach of these intervals of complex magnetization (Fig. 19), simi-lar to those identified as drilling-induced remanence in other,deeper cores (see below). The spiraling declination values seenin Core 13O-8O6B-3H may be artifacts caused by the passage ofthe core past a locally intense field source while the source wasrotating relative to the core. Intervals of less disturbed, appar-ently normal polarity below 10 mbsf in Holes 806B and 806Cmay have been magnetized by viscous remanence acquired dur-ing the Brunhes Chron.
It appears unlikely that any of the magnetization measuredeither as NRM or after 15-mT cleaning in the magnetically com-plex region between about 10 and 20 mbsf in Holes 806B and806C is of primary origin. The unusual magnetization patternof these intervals, their apparent susceptibility to VRM anddrilling-related remanences, and the resistance of these second-ary magnetizations to AF cleaning (i.e., their high coercivity)may indicate an unusual magnetic mineralogy in this interval.
The NRMs of many of the cores below 30 mbsf in Holes806B and 806C have inclinations of about - 60° to - 80° (Fig.20), a pattern similar to that seen at Site 805. Drilling-inducedremanence reported by Sallomy and Briden (1975) in a boreholecore was aligned with the borehole axis, although drilling in this
317
SITE 806
90 180 270 360 -90 -30 0 30
Declination Inclination(degrees) (degrees)
90 10: 102 104
Intensity(mA/m)
0 90 180 270 360 -90 -30 30
Declination Inclination(degrees) (degrees)
9 0 1 0 1 102
Intensity(mA/m)
Figure 19. Unoriented NRM declination, inclination, and intensity charts for the first four cores in Holes 806B and 806C. A. Cores 130-806B-1H to-4H. B. Cores 13O-8O6C-1H to -4H.
case was in harder rocks in which drilling-induced heating was alikely factor in the magnetization. Steeply negative NRM incli-nations in weakly magnetized cores from Leg 130 sites probablyreflect the presence of a similar borehole-parallel componentdominating a presumably shallowly inclined pre-drilling rema-nence.
Reduction and Magnetization IntensityInterstitial water SO^~ levels and remanence intensity in
Hole 806B appear to be positively correlated (Fig. 21). Theabundance of the SO^~ ion has a trend similar to that of the logintensity, particularly after demagnetization. An SO^~ concen-tration of about 26.6 mM appears to be critical; as this value isfirst crossed at about 10.3 mbsf, the demagnetized remanenceintensity drops sharply from about 3 to about 0.15 mA/m. Anupward inflection in the SO ~̂ abundance at a sub-bottom depthof 20 mbsf is accompanied by a local increase in intensity, asnoted above. Remanence intensities of 0.02 mA/m are reachedwhen the SO^~ concentration drops to about 25 mM, at whichpoint remanence measurements reach the limit of resolution ofthe shipboard cryogenic magnetometer.
Reduction of magnetite, producing dissolved and reducedFe, and the reduction of sulfate to sulfide (both of which werecaused by microbial activity) result in the precipitation of ironsulfide minerals, principally pyrite. These reactions appear tobe the possible mechanism that links the decline in remanenceintensity to the decrease in SO^~ concentration (e.g., Karlin and
Levi, 1983, 1985). Two successive phases of downhole alterationof the magnetic mineralogy in Hole 806B are implied by thepresence of the interval of complex magnetization between thesharp decrease in intensity at about 10.3 mbsf and the beginningof random weak magnetizations at 20 mbsf.
Little dissolution of magnetite occurs from the surface toabout 10 mbsf, at which point rapid dissolution over the next0.5 m appears to remove almost all magnetite much larger thanthe critical "blocking diameter" of 0.025 µm (Dunlop, 1981).At this point, primary magnetization becomes too weak to mea-sure. The interval between 10 and 20 mbsf, in which high coer-civity secondary components appear to have been acquired,may correspond to an interval observed by Sager (1988) in car-bonate oozes in Holes 632A and 633A from ODP Leg 101.Mean destructive fields increased in these holes as intensities de-creased downhole. Sager attributed this behavior to the possibledevelopment of a metastable, magnetic iron sulfide such asgreigite or pyrrhotite along with pyrite as the sulfate reductionreactions progress.
A similar mechanism may operate between 10 and 20 mbsf inHoles 806B and 806C. The local inflection in SO^~ concentra-tion at 20 mbsf is presumably related to changes in the rate ofSO4" reduction over the interval in which these metastable ironsulfides are produced. The accompanying peak in magnetic in-tensity in both the NRM and AF-cleaned records is a functionof the acquisition of high-coercivity secondary remanences bythese metastable phases. Below 20 mbsf, magnetite may be
Figure 20. Declination, inclination, and intensity chart of the NRM of Core 13O-8O6B-11H. Note the steeply negative inclinations.
319
SITE 806
30
28
26
24
22
20120
O00
0.0130 40 50
Depth (mbsf)60 70 80
Figure 21. Correlation between remanence intensity (dots) and sulfateion concentration (closed circles, fitted by cubic splines) (see "InorganicGeochemistry" section, this chapter) vs. depth, Hole 806B, for (A)NRM and (B) after 15-mT demagnetization. Note the increase in de-magnetized intensity and the change in the rate of SO^~ reductionaround 20 mbsf.
present as very fine-grained relicts within pyrite, and large pro-portions of the remanence may be carried by magnetite grainswith low coercivities and short relaxation times.
Fine-grained pyrrhotite may also persist and contribute ahigher coercivity component to the remanence. Although Low-rie and Heller (1982) noted that pyrrhotite was rarely a signifi-cant source of remanence in marine limestones, pyrrhotite, oc-curring as minute inclusions within pyrite, has been reported asthe major magnetic carrier in the Helvetic Limestones (Kligfieldand Channell, 1981). The pervasive drilling-induced remanenceobserved in the weakly magnetized cores may be carried by ei-ther or both of these minerals. Shore-based studies of the mag-netic mineralogy should clarify these matters.
SEDIMENTATION RATESAn apparently continuous uppermost Oligocene through Hol-
ocene sediment sequence was cored at Site 806. The average sed-
imentation rate is about 30 m/m.y., as estimated from the bio-stratigraphic information (see "Biostratigraphy" section, thischapter). All datum events that were recognized in the threeholes cored at Site 806 are listed in Table 3. The biostratigraphicage-depth indicators from Holes 806B and 806C are showngraphically in Figures 22 and 23. The large depth uncertaintiesfor some early Miocene datums of Hole 806C (Fig. 23) repre-sent two washed intervals separated by a single spot core.
Age-depth data representing calcareous and siliceous micro-fossil groups are available from Hole 806B. These data havebeen replotted for shorter time and depth intervals in Figures24, 25, and 26, so that every individual biostratigraphic datumlisted in Table 3 can be identified, and so that points where sedi-mentation rate changes occur can be selected. The different mi-crofossil groups commonly provide age discrepancies of about 1m.y. for identical sample depths (i.e., Fig. 24). These discrepan-cies consequently are on the order of 10%-20% of the age ofthe sediment even in the upper Miocene and Pliocene intervals.Presumably, they largely reflect problems associated with the as-signed ages to the biostratigraphic events.
Sedimentation rates from all three holes that have been cal-culated from selected calcareous biostratigraphic events and arepresented in Table 4. These rates are plotted vs. age in Figure 27.The shape of this age/rate curve is similar to those obtainedfrom previous Leg 130 sites (Sites 803, 804, and 805). This simi-larity implies that the rate histories indeed were alike at the dif-ferent sites, but to some extent it also reflects the fact that, ifpossible, the same series of control points were chosen for thesedimentation rate calculations at the different sites. Minor dif-ferences in the rate histories between Holes 806B and 806C (Fig.27) primarily stem from the large sample intervals used. Thegreatest rate difference between the two holes falls in the 20-25Ma interval and is probably caused by the use of different da-tums: the LO of Globorotalia kugleri in Hole 806B, and the LOof Sphenolithus ciperoensis in Hole 806C.
The marked increase in sedimentation rates at about 8.7 Mahas been also observed at all of the deeper transect sites. As-suming the change at the fairly shallow Site 806 is associatedwith moderate to little carbonate dissolution, it follows that themajor portion of that signal represents a significant productiv-ity increase in the early part of late Miocene time.
INORGANIC GEOCHEMISTRYThirty interstitial water samples were collected at Site 806,
twenty-nine from Hole 806B at depths ranging from 4.5 to706.0 mbsf and one from Hole 806C at 765.1 mbsf, which waspatched into the profile. Interstitial water samples cover most ofthe depth range of the nannofossil ooze and chalk of Unit I, thesingle lithologic unit recognized at Site 806 (see "Lithostratigra-phy" section, this chapter). Chemical gradients in the interstitialwaters at this site (Table 5) are similar to those at the first threesites drilled on this leg, being governed by the biogenic-rich, or-ganic-carbon-poor character of the sediments and by the diffu-sive influence of basalt alteration reactions at depth. The mag-nitude of the chemical gradients at Site 806, the site nearest tothe equator and at the shallowest depth drilled on this leg, isgenerally equal to or larger than those at the first three sites.The differences in gradients are consistent with the differencesin geography, water depth, and sedimentation rates.
Going downhole, chlorinity increases by almost 2% to 565mM at 41.0 mbsf (Core 180-806B-5H) and increases further tovalues close to 600 mM at depths > 500 m, for a total increaseof 8.5% over the sampled interval (Fig. 28). Salinity, measuredrefractively as total dissolved solids, is fairly constant withdepth at 35.0-35.5 g/kg over the interval from 4.5 to 564.4mbsf, with the exception of a high, possibly errant, value of 40g/kg at 450.2 mbsf (Core 130-806B-48X); there are a few highervalues in the interval from 594.9 to 679.9 mbsf (Table 5).
320
SITE 806
Table 3. Biostratigraphic events observed at Site 806.
Event
130-806A-
LO P. lacunosa (N)LO G. tosaensis (F)LO C. macintyrei (N)LO G. fistulosus (F)LO Zλ brouweri (N)OA Zλ triradiatus (N)LO Zλ pentaradiatus (N)LO Zλ surculus (N)LO Zλ tamalis (N)LO G. multicamerata (F)LO G. altispira (F)FO G. fistulosus (F)
130-8O6B-
LO P. lacunosa (N)FO C. tuberosa (R)LO G. tosaensis (F)LO N. reinholdii (D)LO A. angulare (R)LO C. macintyrei (N)LO P. prismatium (R)FO A. angulare (R)LO G. fistulosus (F)LO R. praebergonii var. robusta (D)LO Z). brouweri (N)FO G. truncatulinoides (F)OA Zλ triradiatus (N)LO 7; convexa var. aspinosa (D)LO Zλ pentaradiatus (N)LO N. jouseae (D)LO S. peregrina (R)LO G. multicamerata (F)LO G. altispira (F)FO G. fistulosus (F)LO Sphaeroidinellopsis spp. (F)FO /?. praebergonii (D)FO S. dehiscens (F)FO G. tosaensis (F)LO /> /tsf «te (R)LO G. margaritae (F)LO Sphenolithus (N)LO /> doliolum (R)LO /?. pseudoumbilica (N)FO A J>/UfVo/l (R)FO S. te/ras (R)LO S. berminghami (R)FO /I. elegans (D)FO S. p e n t e (R)LO TV. cylindrica (D)FO W. jouseae (D)LO C. «c«̂ MJ (N)LO S. omnitubus (R)LO Zλ quinqueramus (N)LO S. delmontensis (R)LO S. coro/iα (R)FO S. dehiscens (F)FO G. tumida (F)FO £ spectabilis (F)LO i4. acutiloba (D)LO /4. tritubus (R)LO N. miocenica (D)LO Z praeconvexa (D)FO /> primalis (F)LO C. cβepβ (R)FO S. omnitubus (R)FO Amaurolithus (N)FO G. plesiotumida (F)LO Zλ hughesi (R)FO Zλ quinqueramus (N)LO C. _yrá« (D)LO Zλ ontogenesis (R)FO S. berminghami (R)LO ^4. ellipticus var. javanica (D)LO B. miralestensis (R)
LO Zλ laticonus (R)LO Zλ petterssoni (R)LO S. wolffii (R)LO C. yabei (D)LO Zλ hamatus (N)FO Zλ hughesi (R)LO A. moronensis (D)LO C. japonica (R)FO N. acostaensis (F)LO G. siakensis (F)FO Zλ hamatus (N)LO C. coscinodiscus (D)LO L. thornburgi (R)FO C. coalitus (N)LO A. moronensis (D)LO G. fohsi lobata/robusta (F)LO C. cornuta (R)LO C. coscinodiscus (D)LO C. nitescens (N)LO C. lewisianus (D)FO G. fohsi fohsi (F)LO C. floridanus (N)LO C. lewisianus (D)LO S. heteromorphus (N)FO D. hustedtii (D)FO G. praefohsi (F)LO C. peplum (D)LO A. californicus (D)FO G. peripheroacuta (F)LO C. lewisianus var. similis (D)TA D. deflandrei (N)LO R. marylandicus (D)LO C. dissimilis (F)FO S. heteromorphus (N)LO C. elegans (D)LO S. belemnos (N)FO S. belemnos (N)LO G. kugleri (F)FO R. paleacea (D)
130-806C-
LO P. lacunosa (N)LO G. tosaensis (F)LO C. macintyrei (N)LO G. fistulosus (F)LO D. brouweri (N)FO G. truncatulinoides (F)OA D. triradiatus (N)LO D. pentaradiatus (N)LO D. surculus (N)LO G. altispira (F)FO G. fistulosus (F)LO Sphaeroidinellopsis spp. (F)FO S. dehiscens (F)FO G. tosaensis (F)LO G. margaritae (F)LO Sphenolithus (N)LO R. pseudoumbilica (N)LO C. acutus (N)FO C. acutus (N)LO D. quinqueramus (N)FO S. dehiscens (F)FO G. tumida (F)FO P. primalis (F)FO Amaurolithus (N)FO G. plesiotumida (F)FO D. quinqueramus (N)LO D. hamatus (N)LO Catinaster (N)FO D. neohamatus (N)FO N. acostaensis (F)LO G. siakensis (F)FO D. hamatus (N)FO Catinaster (N)
LO G. fohsi lobata/robusta (F)LO C. nitescens (N)FO G. fohsi fohsiLO C. floridanus (N)LO S. heteromorphus (N)FO G. praefohsi (F)FO G. peripheroacuta (F)TA D. deflandreiLO C. dissimilis (F)FO S. heteromorphus (N)LO S. belemnos (N)FO S. belemnos (N)LO G. kugleri (F)FO G. kugleri (F)LO S. ciperoensis (N)
Notes: The depth uncertainty predominantly represents sample in-tervals used. References for the age estimates are presented inthe "Explanatory Notes" chapter (this volume). N = nannofos-sil, F = foraminifer, D = diatom, R = radiolarian, FO = firstoccurrence, LO = last occurrence, OA = onset acme, and TA= termination acme. Magnetostratigraphic reversal boundariesfollowed by the designation (T) or (O) refer to "termination"and "onset," respectively.
100-
200"
300-
II400"
100 -
200 -
300
fJQ
E'400
500
600 -
700 -
80010 15 20 25
Age (Ma)
• • i • • • • • • • • • • • • • • • • Figure 23. Age-depth relationships of biostratigraphic markers, Hole806C. Large error bars show uncored interval. Symbols used are as inFigure 22.
Sodium concentrations measured by flame emission spectro-photometry (Table 5) and those estimated by charge balance cal-culations generally agree to within < 1.5%. Sodium concentra-tions increase from 471 mM at 4.5 mbsf to ~ 520 mM at 650.9-706.0 mbsf, a total increase of 10%. Sodium concentrations at
Figure 24. Age-depth relationships of biostratigraphic markers from theupper Miocene through Holocene interval, Hole 806B. Error bars showsample interval uncertainties. Symbols used are as in Figure 22.
322
SITE 806
300
350 -
400 -
Q450 -
500 -
550, , , .
, , I I
m
•<^•••
, , , ,
Φ
cpΦ
,, ,,
X
"§
, , , ,
1 - -
Φ Φ
-
1 •
• •
-
-
•
. , , ,
Table 4. Estimated sedimentation rates, Site 806, and the
control points determining those rates.
10 11 12 13 14 15
Age (Ma)
Figure 26. Age-depth relationships of biostratigraphic markers from the
lower through middle Miocene interval, Hole 806B. Error bars show
sample interval uncertainties. Symbols used are as in Figure 22.
500
Control points
13O-8O6A-
Top sectionOA D. triradiatusLO G. altispiraTerminal depth
13O-8O6B-
Top sectionLO D. brouweri (N)LO R. pseudoumbilica (N)LO D. hamatus (N)LO S. heteromorphus (N)FO S. belemnos (N)LO G. kugleri (F)Terminal depth
13O-8O6C-
Top sectionOA D. triradiatus (N)LO R. pseudoumbilica (N)LO D. hamatus (N)LO S. heteromorphus (N)FO S. belemnos (N)LO S. ciperoensis (N)Terminal depth
Depth(mbsf)
041.0569.5583.70
040.2595.00
334.55477.95603.45651.35743.10
048.3595.85
333.70469.40603.38762.95776.40
Age(Ma)
02.072.903.31
01.893.568.70
13.6020.0021.8025.25
02.073.568.70
13.6020.0025.2025.64
Sedimentationrate
(m/m.y.)
19.834.3
21.332.846.629.319.626.6
23.431.946.327.720.930.7
550 -
600 -
650 -
700
9
(
ç
1 1
SHΦ
-
Notes: References for the age estimates are presented in the "Explan-atory Notes" chapter (this volume). N = nannofossil, F = fora-minifer, D = diatom, R = radiolarian, FO = first occurrence,LO = last occurrence, and OA = onset acme. Magnetostrati-graphic reversal boundaries followed by the designation (T) or(O) refer to "termination" and "onset," respectively.
50
40 -
T3ΦCO
20i
10
, | , , ,
, i , , , ,
-
750
14 15 16 17 18 19 20 21 22 23 24
Age (Ma)
Figure 25. Age-depth relationships of biostratigraphic markers from the
middle through lower upper Miocene interval, Hole 806B. Error bars
show sample interval uncertainties. Symbols used are as in Figure 22.
10 15
Age (Ma)
20 25
Figure 27. Sedimentation rate history, Site 806. Dashed line with filled
circle = Holes 806A; solid line = Hole 806B; and dashed line = Hole
806C.
323
SITE 806
Table 5. Interstitial water geochemical data, Holes 806B and 806C.
Notes: LD = concentration lower than detection limit, and ND = not determined.
Site 806 below 300 mbsf are higher than those at Site 805, whichin turn were higher than those at Sites 803 and 804.
Alkalinity increases from 3.7 mM at 4.5 mbsf to a broadmaximum (>6 mM) from 107.5 to 280.0 mbsf; it then decreaseswith depth to 3.1 mM at 679.9 mbsf (Fig. 28). Site 806 has adeeper and broader alkalinity maximum with higher concentra-tions than Sites 803, 804, and 805, suggesting a larger supply oforganic matter for oxidation at this fairly shallow site, the clos-est to the equator of those drilled on the Ontong Java Plateau.
Sulfate concentrations decrease by almost 50% from 27.2mM at 4.5 mbsf to 14.3 mM at 765.1 mbsf; most of the decreaseoccurs by 221.5 mbsf, where the concentration is 17.4 mM (Fig.28). The sulfate depletion at this site is nearly a factor of 2larger than at Sites 803 and 805 and larger still than that at thedeepest site (804), consistent with the patterns of the alkalinityprofiles for these sites.
Phosphate concentrations are 2-3 µM in the upper 31.5mbsf, with concentrations at greater depths below the detectionlimit of 1-2 µM (Table 5).
Ammonia concentrations increase to a broad maximum >610µM by 392.3 mbsf, persisting at these levels throughout thedepth range sampled (Fig. 28). These concentrations are twicethose at Site 805, which are in turn higher than those at Sites803 and 804.
Measurable phosphate concentrations in the shallowest sam-ples, higher ammonia concentrations, higher alkalinities, andgreater sulfate depletion all suggest a greater supply of organicmatter to the sediments at Site 806, which is then oxidizeddowncore.
Dissolved silica concentrations increase with depth to 1200µM or greater by 623.8 mbsf (Fig. 28). The depth profile, bothin shape and concentration, is similar to those at Sites 803, 804,and 805. No decreases in dissolved Si are seen, but there are
only sparse occurrences of Porcellanite below 240 mbsf (see"Lithostratigraphy" section, this chapter).
Dissolved manganese concentrations are generally below thedetection limit of 2-3 µM, with the exception of samples in thedepth range from 4.5 to 31.5 mbsf. The higher dissolved manga-nese concentrations are consistent with the reduction of manga-nese oxides during organic matter oxidation shallow in the core.There is no increase in dissolved Mn with the dissolved Si in-crease, perhaps because of the organic-carbon-poor nature ofthe sediments (Gieskes, 1981).
Calcium concentrations increase with depth, with an averagegradient of 2.7 mM/100 m (Fig. 28), smaller than those ob-served at Sites 803, 804, and 805. Magnesium concentrationsdecrease with depth, with an overall gradient of —4.2 mM/100m (Fig. 28), similar to gradients observed at Sites 803, 804, and805. Although the Ca and Mg concentrations are linearly corre-lated overall (R2 = 0.96), with a ΔCa/ΔMg ratio approximatelyequal to -0.7, there is clear evidence in a plot of this relation-ship for nonconservative behavior of Mg in the upper 136 m.The extent of Mg depletion relative to Ca increase in that depthrange is greater than expected from a strictly linear correlation,indicating that there must be an additional sink for Mg in theshallowest sediments, such as dispersed volcanic ash (McDuffand Gieskes, 1976). Nonconservative Mg behavior was also ob-served in the upper section of Site 289 on the Ontong Java Pla-teau (Leg 30), though not at Site 288 (Elderfield et al., 1982).The correlation of Mg and Ca below 136 mbsf is linear (R2 =0.99) with a ΔCa/ΔMg ratio approximately equal to —0.9.
Strontium concentrations increase with depth to > 1000 µMby 164.5 mbsf and to maximum values of > 1100 µM by 364.7mbsf, persisting to the deepest sample (Fig. 28). The maximumconcentrations here are higher than at Sites 803, 804, and 805,where sediments accumulate more slowly.
Figure 28. Interstitial water geochemical data, Site 806. Filled circles = Hole 806B and open circle = Hole 806C. The depth at thebase of the plots is that of the deepest sediment drilled.
325
SITE 806
Lithium concentrations decrease from 24.5 µM at 4.5 mbsfto a broad minimum of < 15 µM from 193.0 to 364.7 mbsf; val-ues then increase to 24-29 µM from 564.4 to 765.1 mbsf (Fig.28). The Li minimum at this site has lower concentrations per-sisting to somewhat greater depths than those at Sites 803, 804,and 805.
Potassium concentrations decrease with depth from 10.8 mMat 4.5 mbsf to values around 9.0-9.1 mM from 650.9 to 765.1mbsf (Fig. 28) and correlate well with the increase in Ca (R2 =0.93). Rubidium concentrations also decrease with depth from1.6 µM at 4.5 mbsf to 1.3 µM at 765.1 mbsf (Fig. 28). The Kand Rb decreases with depth are smaller than those observed atSites 803, 804, and 805. The differences between Site 806 andthe first three sites drilled in the magnitudes of Ca increaseswith depth and K and Rb decreases with depth suggest thatthere must be differences in the history of basalt alteration atSite 806 compared with the others.
CARBON GEOCHEMISTRYThe shipboard carbon geochemical analyses included deter-
minations of inorganic carbon (342 samples), total carbon (50samples), and volatile hydrocarbons (43 samples). A detaileddescription of the analytical methods used is given in the "Ex-planatory Notes" chapter (this volume) and by Emeis and Kven-volden (1986). Volatile hydrocarbons were routinely monitoredevery third core. The samples were taken using the headspace-technique and were measured for the occurrence of methane,ethane, and propane. As at the previous Leg 130 sites, no signif-icant amounts of these gases were detected.
Inorganic carbon (IC) analyses were conducted on physicalproperties samples. Percent CaCO3 was calculated as IC8.334, assuming that all carbonate is calcite. The results aresummarized in Table 6 and presented in Figure 7. The sedimentsat Site 806 contain very high amounts of CaCO3, with valuesranging from 85% to 97%. The range and variation of the val-ues is much lower when compared with previous sites on Leg130. Carbonate contents increase downhole from 85% to 95%over the interval from 0 to 250 mbsf, similar to the trend seen atall of the previous Leg 130 sites. In the lower part of the section(250-740 mbsf), CaCO3 values average 92%. Table 6 is on mi-crofiche in back pocket.
Total organic carbon (TOC) was calculated as the differencebetween total carbon (TC) values (as determined by means ofthe Carlo Erba NCS Analyzer) and inorganic carbon. The down-hole distribution of total organic carbon in the sediments ofSite 806 is characterized by very low values ranging between0.02% and 0.6%. Most of the shipboard organic carbon dataare near the detection limit of the analytical methods used. Theywill have to be verified by independent shore-based analyses.
PHYSICAL PROPERTIES
IntroductionAt a depth of 2520 mbsl, Site 806 is the shallowest of the
four sites devoted to the Neogene transect of the Ontong JavaPlateau. GRAPE and P-wave velocity (using the multisensortrack), and thermal conductivity measurements were made onwhole rounds from all cores at Site 806. Physical property mea-surements were made on split cores from Holes 806B and 806C(cores from Hole 806A were not split on board the ship). Thesemeasurements included undrained shear strength, index proper-ties (wet-bulk density, porosity, grain density, water content),and P-wave velocity.
The intensive physical properties program conducted on Leg130 concentrated on making closely spaced laboratory measure-ments and afforded little time for processing data. Problemscaused by improper needle calibration led to a significant scat-
ter in the thermal conductivity data at Site 806. Correction ofthese thermal conductivity values will be attempted on shore.GRAPE and P-wave logger (PWL) data were recorded in thethree holes at Site 806, but only a few intervals of the GRAPEdata set were processed on board. No comparison of the GRAPEdata with index properties is attempted in this chapter. The en-tire GRAPE and PWL data set also will be processed on shore.
Shear StrengthUndrained shear strength was typically measured at a sam-
pling interval of one per split section in Holes 806B and 806C,using a motorized minivane apparatus (see "Explanatory Notes"chapter, this volume). Between 0 and approximately 200 mbsf,measurements were performed by inserting the vane in the softsediment. Below 200 mbsf, shear strength was measured in un-disturbed coherent blocks of sediment (or "biscuits") inter-spersed within the softer ooze matrix. Measurements were madeuntil the sediment became too stiff (at approximately 315 mbsfin Hole 806B and 310 mbsf in Hole 806C).
Residual shear strength data were obtained at points wherecracking did not dominate the sediment failure (see discussionof vane shear strength data interpretation in the "Physical Prop-erties" section, "Site 803" chapter, this volume). Shear strengthresults are presented in Table 7, and Figure 29 shows a plot ofthe variations of shear strength with depth. Table 7 is on micro-fiche in backpocket.
Shear strength measured at Site 806 ranges from 5 to 25 kPa.Profiles from the two holes are similar; some minor differences,however, are possibly a result of coring-induced disturbance (seedetailed discussion of disturbance effects on shear strength inthe "Physical Properties" section, "Site 803" chapter, this vol-ume).
Between 0 and 200 mbsf, shear strength values generallyrange between 5 and 15 kPa. Below 200 mbsf, the constant in-crease in shear strength reflects the progressive induration ofthe sediment. High-amplitude, low-frequency shear strengthfluctuations (wavelength of around 40-60 m) and high-ampli-tude, high-frequency fluctuations (wavelength of around a fewmeters to 10 m) are superimposed on the general trend describedabove. Below 200 mbsf, the low-frequency fluctuations in shearstrength data decrease in amplitude. High-frequency fluctua-tions, however, begin to dominate the record and may be the re-sult of interspersed layers of different induration states. Some
Figure 29. Peak shear strength vs. depth, Holes 806B and 806C.
326
SITE 806
of the lower values are probably caused by internal cracking inthe stiff er intervals.
Index PropertiesIn Hole 806B, the sampling frequency for index property
measurements in soft sediments was two samples per section un-til Core 130-806B-15H (139 mbsf). and one sample per sectionin the deeper cores. The sampling frequency in Hole 806C wasgenerally one sample per section in APC cores and less fre-quently in the chalk interval. Index property samples were al-ways taken at the same locations as the velocity measurements.Intervals showing evidence of "flow-in" or any other coring dis-turbance were not sampled (usually, the top of Section 1 inmany cores). Results of index property measurements are pre-sented in Table 8. Figures 30 through 33 show the downhole pro-files of wet-bulk density, porosity, water content and grain den-sity in each hole; superimposed on Figure 34 are the mergedporosity curve for Site 806 (Holes 806B and 806C) and a gener-alized porosity curve for calcareous sediments (Hamilton, 1976).Table 8 is on microfiche in back pocket.
Hole 806B Hole 806C
o
100
200
300
400
500
600
700
800
Hole 806B
X
1 1 1 1 1 1 1 1 1 1 1
Hole 806C
' 1 :
- \ •
• y1.4 1.5 1.6 1.7 1.8 1.9 2
3\1.4 1.5 1.6 1.7 1.8 1.9
Wet-bulk density (g/cm3) Wet-bulk density (g/cm
Figure 30. Wet-bulk density vs. depth, Holes 806B and 806C.
100 -
200 -
300 -
Q.CDQ
800
400 -
500 -
600 -
700 -
40 50 60 70
Porosity (%)
80 40 50 60 70
Porosity (%)
Figure 31. Porosity vs. depth, Holes 806B and 806C.
Wet-bulk density values at Site 806 range from 1.47 to 1.97g/cm3, generally increasing with depth. This increase is not lin-ear but shows several changes in the gradient. Porosity and wa-ter content have similar trends with depth but are inverted fromthat of wet-bulk density. The grain density is generally near 2.7g/cm3, reflecting the high carbonate content of the sedimentscored at Site 806 (around 85%-95%).
In the uppermost 60 mbsf of the sediment column, consoli-dation effects lead to a rapid change in index properties. Overthis interval, porosity decreases from 72% at the mud line to-66% at 60 mbsf (water content decreases from 100% to 75%and wet-bulk density increases from 1.47 to 1.58 g/cm3). Thetrend of the porosity-depth curve in this interval is similar to thegeneralized curve of Hamilton (1976) for calcareous sediments(Fig. 34).
At about 60 mbsf, a small step in the index property curves(a decrease in bulk density and an increase in porosity) marksthe beginning of an important divergence from the general trendof the Hamilton curve. Between 60 and ~ 240 mbsf, consolida-tion effects on the index properties were still observed but withdiminished amplitude. Compared to the Hamilton curve, the re-
327
SITE 806
πu
100
200
300
400
500
600
700
800
Hole 806B
1: 1 :
•r •
i •
Hole 806C
f •
r •/ •
j
-
Hole 806B Hole 806C
20 40 60 80 100 20 40 60 80 100
Water content (% dry wt) Water content (% dry wt)
Figure 32. Water content vs. depth, Holes 806B and 806C.
duction of porosity with depth at Site 806 is low (Fig. 34). At240 mbsf, the porosity at Site 806 reaches 61% and is, therefore,10% higher than the porosity value in the Hamilton curve. Anincrease of sediment rigidity because of early cementation mayexplain the small reduction of porosity in this depth interval.The low shear strength values measured in this interval do not,however, support this argument. Another possible explanationfor this low gradient in the porosity-depth curve is the fact thatthe sediment is richer in foraminifers at Site 806 than at the pre-vious Leg 130 sites (see "Lithostratigraphy" section, this chap-ter).
An important contribution to the porosity measured at Site806 may come from intraparticle porosity (foraminifer cham-bers). Between 0 and 60 mbsf, consolidation effects led to arapid reduction of the interparticle porosity. At about 60 mbsf,the sediment may become grain supported and thus further in-terparticle porosity reduction below 60 mbsf would be less im-portant. Intraparticle porosity in foraminifer tests is not re-duced by mechanical compaction; total porosity is, therefore,unaffected by compaction until breakdown of foraminifer testsoccurs or test are filled by remobilized calcite.
100 •
8002.6
Grain density (g/cm 3 ) Grain density (g/cm
Figure 33. Grain density vs. depth, Holes 806B and 806C.
The interval between 240 and ~ 440 mbsf shows little reduc-tion of porosity and water content and little increase in wet-bulkdensity with depth (Figs. 30 through 32). The first occurrence of"biscuits" interspersed in soft ooze was observed slightly abovethe beginning of this interval (around 200 mbsf) and reflects thevisible onset of lithification (see "Lithostratigraphy" section,this chapter). The ooze-chalk transition occurs at about 340mbsf. The small amount of compaction between 240 and 440mbsf is, therefore, probably a result of the progressive increaseof cementation over this interval. Cementation increases the ri-gidity of the sediment, thereby improving its resistance to com-paction.
A slight increase in porosity (decrease in density) was ob-served between approximately 250 and 320 mbsf (Figs. 30 and31), which correlates with a major decrease in carbonate con-tent. This trend also was observed in the index property curvesat previous Leg 130 sites.
Below 440 mbsf, bulk density increases rapidly with depth.Reduction of porosity because of mechanical compaction is pre-sumably very low, as it was in the previous interval (240-440mbsf). Thus, the reduction of porosity with depth (and the in-crease in bulk density) was possibly a result of pore spaces infill-ing with calcite as the chalk became more indurated.
328
SITE 806
200
400
α.Q
600
800
Generalized laboratory
curve for calcareous sediments(Hamilton, 1976)
\
Site 806 data(merged files)
Hole 806B Hole 806C
45 50 55 60 65
Porosity (%)
70 75
Figure 34. Merged porosity (Holes 806B and 806C) vs. depth for Site806 and generalized laboratory curve for calcareous sediments (Hamil-ton, 1976).
High-frequency fluctuations (wavelength of around a fewmeters to 30 m) are superimposed on the general index propertytrends described above (Figs. 30 through 32). The study of theorigin of major seismic reflectors at Site 806 (see "Seismic Stra-tigraphy" section, this chapter) shows that these fluctuations inindex property values result from a complex interplay of at leastthree major factors: carbonate content, mean grain size, andsediment induration.
Compressional Wave Velocity
Horizontal (parallel to bedding) and vertical (perpendicularto bedding) P-wave velocities were measured on split cores atSite 806. The DSV apparatus was replaced by the HamiltonFrame at 324 mbsf in Hole 806B and at 387 mbsf in Hole 806C.Results of velocity analyses are shown in Table 9 and listed inFigure 35. Figure 36 shows changes with depth of horizontal P-wave velocity and mean grain size in the top 350 mbsf at Hole806B, and Figure 37 shows a smoothed version of these twocurves (5-point running average). Table 9 is on microfiche inback pocket.
Velocities measured at Site 806 range from 1530 to about2400 m/s, generally increasing with depth. In the upper part ofthe section, however, between 0 and 120 mbsf, velocity actuallydecreases slightly. In this depth interval, the general trend andthe high-amplitude, low-frequency fluctuations of P-wave ve-locities correlate well with changes in mean grain size (Fig. 37).The trend of slightly decreasing velocity corresponds to the pro-gressive decrease in mean grain size over this interval.
Below 120 mbsf, velocity and mean grain size are poorly cor-related, with the mean grain size trend showing only minorchanges with depth whereas velocity values increase. This in-crease in the velocity values is presumably caused by consolida-tion and cementation.
100
200
300
Q.
a
400
500
600
700
800
* Horizontal
I Vertical
1500 1900 2300 1500 1900 2300
P-wave velocity (m/s) P-wave velocity (m/s)
Figure 35. P-wave velocity (vertical and horizontal) vs. depth, Holes806B and 806C.
The gradient of laboratory P-wave velocities is weak between120 and 310 mbsf. It begins to increase rapidly below about 310mbsf, slightly above the ooze/chalk transition (340 mbsp. Verylow velocity values recorded between 320 and 340 mbsf in Hole806B and at about 390 mbsf in Hole 806C correspond to thefirst measurements made with the Hamilton Frame and areprobably the result of chalk fracturing.
LOGGING
Logging at Site 806 followed the same protocol as at Site 805and achieved similar results (Tables 10 and 11). The first toolstring was the Leg 130 geophysical string consisting of an NGT(natural gamma-ray), LSS (long spaced sonic), and DITE (elec-trical resistivity) combination. Logging data were collected fromthe base of the hole (741 mbsf) to pipe (90.2 mbsf; Table 10).All data on this run are of good quality.
The next tool string consisted of the NGT (natural gamma-ray), ACT (aluminum clay tool), HLDT (lithodensity tool), GST(geochemical spectral tool), and TLT (temperature) combina-tion. After reaching the bottom of the hole at 741 mbsf and be-ginning this logging run, the GST would not calibrate properly.The tool string was lowered back to the bottom of the hole, re-calibrated, and the logging run started from 740 mbsf with all
329
SITE 806
300 -
3501500 1550 1600 1650 10
Horizontal P-wave velocity (m/s)20 30 40
Mean grain size (µm)
14500
Horizontal P-wave velocity (m/s)
1500 1550 1600 1650
|
Q.
O
50
100
150
200
250
300
350,10
Mean grain size
30 40Mean grain size (µm)
Figure 36. Horizontal P-wave velocity and mean grain size vs. depth,Hole 806B.
Figure 37. Smoothed curves (5-point running average) of horizontal P-wave velocity and mean grain size vs. depth, Hole 806B.
tools functioning. Because the formation was activated by theGST on the first (aborted) pass, the NGT and ACT logs of thebottom 38 m (741-703 mbsf) are suspect. The decay of unstablenuclei created by the high neutron flux from the GST producedgamma radiation that was measured by these two tools.
Logging proceeded smoothly until about 485 mbsf, wherethe GST again began to show poor resolution. By 442 mbsf, res-olution was sufficiently bad to require the loggers to stop log-ging operations. The tool string was lowered back down to 496mbsf and an attempt was made to recalibrate the GST. The GSTwould not function properly after 30 min of recalibration ef-fort, so the GST was shut down and logging continued upwardwith the other tools. The tool string entered pipe at 88.4 mbsf.
The GST, when checked in pipe, appeared to function. Forthis reason, the tool string was lowered to repeat the section notlogged with the GST. The tool string was lowered to 334 mbsf,but after an additional 15 min of recalibration the GST stillmalfunctioned. The tool string was raised to 244 mbsf for a re-peat logging section (without the GST) of the NGT/ACT/HLDT/TLT from 244 to 121 m without the heave compensatoras swells were low. Apparently, the caliper on the HLDT jammedinto the wall of the hole on a down swell and broke off at about160 mbsf during this final run.
Because of GST failures, the geochemical logs of Hole 806Bare not continuous and are pieced together in sections. Spikes inthe natural gamma activity logs and the aluminum logs may bepresent because of GST-induced hot spots in the hole. Neverthe-less, the NGT and ACT logs are of good quality for the mostpart. The density log suffers from one major dropout between290 and 320 mbsf and from suspect intervals between 290 and180 mbsf. On the repeat section, the density log data is uselessabove 160 mbsf, the point at which the caliper broke off.
Log Stratigraphic UnitsThe stratigraphic column recovered at Site 806 is nannofossil
ooze with foraminifers, grading into chalk at about 320 mbsf.We recognized three logging units, similar to the top three unitsat Site 805 (Fig. 38 and Site 805, Figs. 30-32).
Logging Unit A
Unit A (90-340 mbsf) is marked by low resistivity values thatremain at about 0.8 ohmm throughout the interval. Wet-bulkdensity values increase downcore only slightly, from 1.6 to 1.7g/cm3. A comparison of log and laboratory density reveals un-reliable logging data from 190 to 320 mbsf (Fig. 49, "Seismic
Last core on deckRIH with geophysical tool string (NGT/DIT/LSS)Out of pipe; start downlog to base of holeOn bottom of hole, <2 m fillMain log pass; NGT/DIT/LSS all working; up at 900 ft/hr;
heave compensator not onTool in pipe at 90.2 mbsf (600 ft), end up log at 71.9 mbsfRun down for repeat sectionStart up on repeat section; NGT/DIT/LSS all working; 900 ft/hrTool in pipe at 90.2 mbsf (8,600 ft); POOHTool string on deckRIH with geochemical tool string (NGT/ACT/HLDT/GST/TLT)At bottom of hole; heave compensator on; start log up, 600 ft/hrTrouble with GST; stop up log at 10,610 fbrf; this section neu-
tronedDropped back to this depth; got GST started, HLDT caliper
closedHLDT caliper fully open, all logs goodGST starts to lose resolutionStop up log, go back down to 9,960 fbrf (504.4 mbsf)Start up log; GST would not recalibrate, not functioningEnter pipe; end repeat geochemical stringStop in pipe for recalibration; some responseRun back in hole to try to GST started; no luck, run back up for
repeatRepeat up log (NGT/ACT/HLDT/TLT) GST not functioning;
heave compensator sticky, not turned onEnd repeat section; POOHGeochemical string at wellheadRigged down from logging runs
a Based on a seafloor depth of 2531 mbrf.
Table 11. Acronyms used in text describing loggingat Hole 806B.
Acronym
ACTAPI units
BHCDITfbrfFMSGSTHLDTLSSmbrfmbsfNGTPOOHRIHSDTTLT
Definition or meaning
Aluminum clay toolAmerican Petroleum Institute standard units
for gamma-ray activity calibrated to testpit in Houston, TX
Borehole compensated sonic toolPhasor dual induction toolFeet below rig floorFormation microscannerGeochemical spectral toolHigh-temperature lithodensity toolLong-spaced sonic digital toolMeters below rig floorMeters below seafloorNatural gamma toolPull out of holeRun into holeLong-spaced sonic digital toolLDGO temperature logging tool
Stratigraphy" section, this chapter). Most of the large-ampli-tude variations observed in the HLDT density data between 190and 320 mbsf are suspect.
Natural gamma-ray activity decreases throughout the entireinterval of Unit A, indicative of increasing calcite contents withdepth. To a certain extent, a similar pattern was observed foraluminum. As in Hole 805C, however, the Al trend stops beforethat of the natural gamma-ray activity, at about 280 mbsf. Thelowermost part of the unit between 300 and 320 mbsf has someof the highest Al values.
Velocities in Unit A increase from just above 1.6 km/s at 90mbsf to about 1.95 km/s at the base of this unit. Superimposedupon this linear velocity change are high-frequency (10-20 mperiod) velocity variations of about 0.1 km/s. These high-fre-
quency variations may, in part, be artifacts resulting from hole-width variations or coring (see below). The transition betweenUnits A and B also has a section of very high-frequency velocityvariations between 320 and 340 mbsf. A few Porcellanite nod-ules were the only recovered material in this interval in Hole806C. In Hole 806B, which was logged, a single Porcellanitenodule was found in a full core of chalk. We speculate that thehigh-frequency velocity variations are indicative of one or morechert-rich horizons at this depth.
Logging Unit B
Unit B (340-600 mbsf) is characterized by gradients in allphysical properties and flat chemical logs. Resistivity values in-crease from 0.8 to 1.1 ohmm and have larger amplitude fluctua-tions than in Unit A. The velocity gradient also is greater in thisunit. In the lower portion of the unit, between 460 and 600mbsf, small-amplitude, low-frequency (30-40 m period) varia-tions were observed. The density gradient increases somewhatfrom Units A to B, and the density log is marked by low-fre-quency variations. In the lower part of Unit B, between 500 and600 m, the low-frequency density and velocity variations are in-versely correlated. However, there is no correlation between thetwo data sets over the entire unit, except for the compaction-im-posed linear increase of both density and velocity with depth.
Logging Unit C
Unit C (600-720 mbsf) is marked by a decrease in resistivity,velocity, and density gradients with depth and by high-ampli-tude, low-frequency (30-40 m period) variations in density andresistivity. The chemical logs show little distinction between log-ging Units B and C. Unit C, in Hole 806B, resembles loggingUnit C in Hole 805C and may represent a common depositionallithology. The Unit B-C transition, located at 380 mbsf in Hole805C, marks the level of a condensed section between 17 and 20Ma (see "Sedimentation Rates" section, "Site 805" chapter, this
331
SITE 806
Al (wet wt. fraction)0.004 0.006 0.008 0.010
100 -
200 -
300 -
1STE
400 -Q .CDQ
500 -
600
700 -
4 6 8Natural gamma ray (API units)
0.8 1.0 1.2 1.4 1.6Deep resistivity (ohmm)
1.6 1.8 2.0 2.2 2.4 2.6 2.8Velocity (km/s)
1.6 1.8 2.0Bulk density (g/cm3)
Figure 38. Logging profiles of aluminum content, natural gamma ray, resistivity, velocity, and bulk density, Hole 806B. Logging units are marked byheavy black lines.
volume); in Hole 806B, the Unit B-C transition is located at 600mbsf, the level of a condensed section of about the same age.
Logging Artifacts in Unit AUnit A contains artifacts in the logs, induced or enhanced by
hole conditions. The caliper on the density tool (HLDT), whichholds the instrument against the wall of the hole, reached itsmaximum extension of 18 in. at depths above 350 mbsf, andgave little information about the size of the upper part of thehole. The separate travel paths from the long-spaced sonic tool,however, gave information about hole width in the upper part ofHole 806B (Fig. 39). The LSS has three different source-receiverspacings: 8, 10, and 12 ft. Thus, at any point in the hole we canperform a small refraction experiment. If the sound velocity forfluid in the borehole is known, the distance to the wall of theborehole can be solved. Assuming that Hole 806B was filledwith seawater, the hole width varied as shown in Figure 39.
The mechanical and sonic calipers give similar informationqualitatively, although there is some offset between the two.Above 320 mbsf the hole has washed out more than the 11V4-
in. drill bit size. The washouts are not randomly spaced, at leastbelow 170 mbsf, nor are they necessarily associated with the re-covery of individual cores either. From 190 to 265 mbsf, wash-outs are spaced about 18-20 m apart. Below 265 mbsf to theAPC/XCB core change at 320 mbsf, the washout spacing de-creases to about 10 m.
There is a definite correlation between sonic velocities andhole width (Fig. 40), based upon a comparison between thesonic caliper and the upper part of the sonic log. A narrow holeis correlated with higher velocities. This in itself is not necessar-ily an artifact, since better indurated horizons should havehigher sound velocities than neighboring units and, because oftheir competence, should be less prone to washout. There is adefinite 9.5-m periodicity in the velocity record over the intervalfrom 100 to 340 mbsf that does not correlate with the washoutsexcept below 250 mbsf. The largest amplitudes occur when thewashouts also have about a 10-m spacing. This is best illustratedin Figure 41, in which the core breaks are marked by the verti-cals of a square wave. At each core break, we can recognize acouplet of high- and low-velocity spikes. In most cases, the
332
SITE 806
200 300 400
Depth (mbsf)
500 600 700
Figure 39. HLDT hole width measured by caliper (solid line) compared with hole width inferred from the sonic velocity log (dashed line) (see text),Hole 806B. The HLDT caliper has a maximum extension of 18 in. All information about hole width in the upper portion of the hole must be basedupon the sonic velocity measurements.
high-velocity spike is most prominent. The 9.5-m couplets mostprobably are coring artifacts, as they are precisely the length ofthe APC.
The strong density artifacts in Unit A are probably the holewidth. The HLDT can only get accurate density readings whenpositioned near the core wall. Figure 38 shows a large dropoutthat occurred between 290 and 320 mbsf. Above this interval,between 180 and 290 mbsf, comparison with lab data showsthat the logging data are invalid (see "Seismic Stratigraphy"section, this chapter).
Chemical Logging at Site 806In addition to the ACT aluminum data and the natural
gamma-ray activity data already described, a geochemical spec-tral tool (GST) log was obtained over the interval from 445 to735 mbsf. This represents a time interval from about 12.4 to25.5 Ma. As at Site 805, only Ca and Si are present in sufficientabundance in the solid phases for the data to be considered reli-able. Figure 42 shows the GST counts of Ca normalized to thetotal Ca + Si counts, an indicator of calcite abundance in thesediments. Two main features are apparent from the loggingdata: (1) a trend to higher calcite toward the base of the holeand (2) abundant high-frequency variations of calcite through-out the interval.
By simple inspection (Fig. 43), it appears that much of thishigh-frequency variation may occur at the 100-k.y. Milankovitchperiod. Figure 43 incorporates a 100-k.y. signal based upon sed-imentation rates from Table 11 (see "Sedimentation Rates" sec-
tion, this chapter). The large-amplitude signal in this part of therecord appears to occur at this periodicity. Spectral analysistechniques provide an objective approach to examine the perio-dicity, as shown in Figure 44. In this case, we have used onlyeight nannofossil datum levels to establish a time scale for Hole806B. Despite the crude time scale, 100-k.y. periodicity is ap-parent in the 13-m.y. long record. Weak, but significant, poweroccurs near the 41-k.y. Milankovitch period. Strong power alsooccurs at 313, 209, 84, 68, and 49.5 k.y. Some of these periodic-ities may be resonant periods of the climate system amplifyingharmonics of the orbital periods. All or part of them could beartifacts introduced by the crude time scale, however.
Correlation Between Sites 586, 805, and 806
Comparison of Sites 586 and 806
Site 586 (0°29.84'S, 158°29.89'E, 2208 m water depth; Ship-board Scientific Party, 1986a, 1986b) and Site 806 (0°19.11 'N,159°21.69'E, 2521 m water depth) are both located on the topof the Ontong Java Plateau, on opposite sides of the equatorbut within 75 nmi of each other. The two sites should havehighly similar records. Figure 45 is a comparison of the two ve-locity profiles. A simple linear stretch of the Site 586 depth axiswith respect to depth in Site 806 has been used for the compari-son. Note also that the velocity axes have been offset so that thetwo records could lie side by side. From the excellent correlationof the two records, one can infer that the two sites had the samedepositional history over the entire common interval, essentially
333
SITE 806
- 30
- 15
1.6 -
100 200
Depth (mbsf)
300
Figure 40. Comparison of velocity profile (solid line) to sonic hole width (dashed line) from the same logging data, Hole 806B. A narrow hole isgenerally correlated with fast sonic velocities. Coring artifacts, with a 9.5-m spacing, can also be seen.
1.6 -
150 200 250 300Depth (mbsf)
Figure 41. Velocity profile from Hole 806B compared with core breaks in the hole. Core breaks are marked by vertical lines of the square wave. Notethat a couplet of high- and low-velocity spikes are consistently associated with the core breaks.
334
SITE 806
0.8 0.7Ca/(Ca + Si) counts
Figure 42. GST record of calcium variations, Hole 806B. The data arepresented as Ca/(Ca + Si) counts to normalize borehole effects in theshipboard-processed data. There is a trend throughout the interval towardhigher calcium in older sediments. In addition, there are abundantlarge-amplitude, high-frequency variations.
all of the Miocene. This observation argues against local win-nowing events at either site. Instead, any resuspension or othersediment loss must be regional in scale.
Site 586 does have lower sedimentation rates than Site 806for the entire logged interval, consistent with their positions rel-ative to the equator. Assuming an absolute latitudinal motionfor the Ontong Java Plateau of about 0.25°/m.y. northward
during the Neogene (R. Musgrave, pers. comm.) Site 806 waslocated about 1°S, and Site 586 was located about 2°S when thesediments at the top of the logged interval were being deposited.The difference in sediment deposition at the two sites may inpart reflect the sedimentation rate gradient away from the equa-tor. Expansion and contraction of the equatorial high-produc-tivity zone during the Miocene may eventually be discernedfrom detailed correlations of these two sites.
Even though velocity data from Holes 586C and 806C wereoffset for clarity in Figure 45, they converge at depth. The tworecords apparently have different velocity gradients. This is anartifact of the presentation in the figure, however. Commondepths have similar velocities at either site. Thus, the two siteshave similar compaction trends, which are mostly a result ofburial depth. Superimposed upon the compaction trend are thevariations in the physical properties caused by changes in sedi-mentation. These variations, which have paleoceanographic sig-nificance, will be easy to separate from the diagenetic informa-tion.
Comparison of Sites 805 and 806Correlation of Sites 805 and 806 should yield important in-
sights about dissolution gradients in the Miocene. Dissolution-and sedimentation-induced differences between Sites 805 and806 make the correlation more difficult than for the sites on topof the Ontong Java Plateau, however. The correlation will be de-pendent upon stratigraphic ties and age control provided by mi-cropaleontological studies. This should pose little problem, asthe two sites have two of the best Neogene micropaleontologicalrecords ever recovered in ODP (see "Biostratigraphy" section,this chapter and Site 805 chapter).
The comparisons between Site 805 and 806 velocity and den-sity, respectively, are illustrated in Figures 46 and 47. Both fig-ures are drawn assuming that Site 806 averages a factor of 1.44higher sedimentation rate than Site 805. An examination of ei-ther figure indicates that there have been many relative changesin sedimentation rate between the sites. Mesoscale features,such as the small 30-40-m wavelength velocity variations in theinterval from 420 to 640 mbsf in Hole 806B and from 300 to 440mbsf in Hole 8O5C will provide a means to refine the correlationand look for higher frequency ties between the records.
SEISMIC STRATIGRAPHYThe seismic section at Site 806, the shallowest of the Ontong
Java Plateau depth transect sites, is characterized by a thick se-quence of parallel, closely spaced reflectors that mirror the gen-tly sloping seafloor and basement topography (Fig. 48). Thesection shows little evidence of disturbance or mass wasting,and individual reflectors can be traced continuously to Sites289/586 (Shipboard Scientific Party, 1975b, 1986a), 139 kmwest and 400 m shallower than Site 806. The section at Site 806is only slightly thinner than those at Sites 289/586, and itsthickness exceeds that at Site 805 by a factor of 1.35. BetweenSites 289/586 and 806, the minor thinning that was observed oc-curs in the deep (pre-Oligocene) part of the section; betweenSites 806 and 805 the thinning takes place throughout the sec-tion, with the possible exception of the Oligocene (see Mayer etal., this volume).
As at the previous sites, we have used the results of labora-tory and logging measurements to convert seismic traveltime todepth-in-section, and we have employed seismic modeling tocheck on the accuracy of this traveltime-to-depth conversion.Site 806 laboratory measurements of velocity and density weremade approximately every 75 cm (see "Physical Properties" sec-tion, this chapter), and velocity and density logs (15-cm sampleinterval, 60-cm sensor spacing) were run for the section between100 and 710 mbsf (see "Logging" section, this chapter). Labo-
335
SITE 806
0.9 -
0.8
CO
ü 0.7
ü
0.6
500 510Depth (mbsf)
520
Figure 43. A plot of a small interval of the GST Ca/Ca + Si (solid line) data (Hole 806B), which shows that much of the variation in calcium occursat a period of approximately 100 k.y. The dashed line represents a 100-k.y. cycle based on sedimentation rates listed in Table 4.
0.05
0.03
trai p
ower
O
Oö
ö
oΦQ.
Λ
Ca/(Ca
h
\ AVA
313 k.y.
+ Si) power spectrum
209 k.y.
i i
i104 k.y.
r™ \ 68 k.y. -_
V / 495,ky:
I/|Λ/84k.y. \L
43k.y. \ I
800 400 200Period (k.y.)
Figure 44. Power spectrum of the GST calcium record interpolated to a7500-yr sample spacing. The time scale used for the spectral analysis isbased upon only eight nannofossil age control points (Table 4). Mi-lankovitch-type periodicity near 41 and 100 k.y. can be found, as well asa large amount of power in lower frequencies.
ratory measurements of velocity and density were converted toin-situ values using the methods described in Mayer et al. (1985)and merged with the logging data. A comparison of in-situ cor-rected laboratory data with log data reveals several inconsisten-cies that must be addressed before the data can be properlymerged (Fig. 49).
If we assume that the log-derived velocities and densities rep-resent in-situ values, then laboratory measurements, properlycorrected to in situ, should be the same as the logging values. Atthe previous sites, the corrected laboratory values have, for themost part, been in good agreement with the logging data, im-plying that the procedure used to correct laboratory data to in-situ values is reasonable. Discrepancies between the laboratoryand logging values (e.g., at Site 805 between 140 and 160 mbsf;see "Logging" section, "Site 805" chapter, this volume) havebeen attributed to poor hole conditions that have degraded thelogs in certain intervals.
A comparison of log and laboratory velocity measurements(Fig. 49) reveals that between 100 and 180 mbsf the logging dataare also in agreement with the corrected laboratory measure-ments and below 180 mbsf the two data sets diverge. Deeperthan about 180 mbsf, the laboratory velocities are consistentlylower than the logged velocities, but we have little confidence inthe in-situ correction process at these depths (once cementationbegins). A detailed look at several indicators of borehole condi-tions reveals that there are changes in the borehole behavior at180 and 340 mbsf (see "Logging" section, this chapter). A fullunderstanding of the effect of these borehole changes will haveto await further study.
Comparing the logs from Site 806 with the laboratory datareveals that between 100 and 180 mbsf the corrected density val-ues are in good agreement with the logging data; however, below
336
SITE 806
100 200 300
Site 586 depth (mbsf)
400 500 600 700
- 1.6
100 200 300 400 500 600 700
Site 806 depth (mbsf)Figure 45. Comparison of velocity profiles, Holes 586C (dashed line) and 806B (solid line). Site 586 is approximately 135 km to the southwest of Site806. Note that the two sites have separate depth axes so as to eliminate first-order sedimentation rate differences between the two sites. In the figure, theSite 586 velocity data have been offset by 0.1 km/s for clarity.
that depth the logging values are significantly lower than the labmeasurements (Fig. 49). Between 280 and 340 mbsf, the loggeddensities are so low that they are unquestionably in error.
To obtain the best possible data base for the seismic model,we have used laboratory density data from the seafloor to 360mbsf (and downhole density data deeper than that) and labora-tory velocity data from the seafloor to 180 mbsf (and downholevelocity data deeper down). The compromise that we make indoing this is the loss of detailed density sampling provided bylogging, particularly in the interval from 200 to 360 mbsf wherethe laboratory sampling interval was reduced (Fig. 49).
The merged, corrected laboratory and logging data (velocityand density) were used to calculate acoustic impedance (Fig.50), which was then convolved with a seismic source signatureto generate a synthetic seismogram (see "Seismic Stratigraphy"section, "Site 803" chapter, this volume, or Mayer et al., 1985,for details). The synthetic seismogram was compared with thefield seismic profile to evaluate the accuracy of the traveltime-to-depth conversion. The field records used for this study arethose collected by the Thomas Washington (ROUNDABOUTCruise 11) during the site surveys for Leg 130 (see Mayer et al.,this volume).
As at previous sites, we have looked in detail at several repre-sentative reflectors within the section. By examining the age andpossible origin of these reflectors, we hope to place the seismicrecord in a stratigraphic framework. The criteria for the selec-tion of these reflectors is simply that they have large amplitudesand are laterally coherent within the immediate area of Site 806.
No effort has been made to select reflectors that are regionallycorrelatable (e.g., see Mayer et al., this volume), although theregional distribution of the named reflector patterns is evident(see "Summary and Conclusions" section, this chapter). As atSite 805, we will refer to the six named reflector series (Panama,Tethys, Antarctic, Drake, Texas, and Ontong Java; see "SeismicStratigraphy" and "Summary and Conclusions" sections, "Site805" chapter, this volume) to place the selected reflectors withina regional stratigraphic framework.
The comparison of the synthetic seismogram to the fieldprofile at Site 806 (Fig. 50) produces a reasonable match,though not one that is without ambiguities. In the absence of aclear tie point such as basement or chert (as at Site 803), thereare several possible fits of the synthetic record to the field data.We have chosen a fit that maximizes the number of matches,particularly in the deeper part of the section (Fig. 50). We haveselected 13 reflectors in the 740 m of logged section; they are la-beled on the plot of reflection coefficient vs. traveltime (Fig.51), and their traveltimes, depths, and ages are listed in Table12.
The three shallowest reflectors picked (6-1, 6-2, and 6-3) areassociated with the "Panama Series" of reflectors. The youn-gest two (6-1, ca. 1.9-2.0 Ma., and 6-2, ca. 2.4 Ma.) are corre-lated with large grain size, low carbonate, high velocity, and lowdensity (Figs. 52 and 53), a physical property association thatappears to indicate winnowing. Increased currents remove thefine components (which may preferentially remove nannofossilsand could reduce the measured carbonate content, depending
337
SITE 806
100 200
Site 805 depth (mbsf)
300 400 500 600
1.6 -
100 300 600 700 800400 500
Site 806 depth (mbsf)
Figure 46. Comparison of velocity profiles, Holes 8O5C (dashed line) and 806B (solid line). The offset in the data at 220 mbsf in the Hole 805Cprofile is an artifact of the logging data (see "Seismic Stratigraphy" section, "Site 805" chapter, this volume).
on the composition of the noncarbonate components), resultingin a coarse-grained system that does not pack well (thus, the lowdensity) and yet has a high velocity (because of the large grainsize). The third reflector of this group (6-3, ca. 3.8-3.9 Ma) hasthe same set of physical property relationships except that it isassociated with a high carbonate content, which may indicatethat it is the result of increased productivity rather than win-nowing.
Within the "Tethys Series," six reflectors (6-4 through 6-9)have been picked. The youngest of these (6-4, ca. 5.1 Ma) showsthe physical property association that we suggest represents win-nowing (high in grain size and velocity with a low in carbonatecontent and density; Figs. 52 and 53). The next deepest reflector(6-5, ca. 5.8-6 Ma) is the only one associated with a marked lowin grain size (and thus velocity); density and carbonate contentvary only slightly (Figs. 52 and 53). This interval may representa period of particularly quiescent current activity. At about thesame depth (200 mbsf), there is a marked change in the shape ofthe velocity vs. depth curve with a sharp increase in velocity(Fig. 52). The rapid increase in velocity with depth is probablyindicative of the onset of cementation (induration is first re-ported by the sedimentologists at about 200 mbsf, see "Litho-stratigraphy" section, this chapter).
At about the same level, we also see a change in the slope ofthe density curve with density increasing at a slower rate below200 mbsf (Fig. 52). This change in the shape of the density curvemay also be indicative of a change from a compaction-domi-nated system (above 200 mbsf) to one where grain-to-grain con-tacts and induration begin to support the sediment column, or itmay simply be a reflection of the increase in carbonate contentwith depth (Fig. 53).
Deeper than 200 mbsf, the state of induration begins to playan important role in reflector formation. Reflector 6-6 (265mbsf, ca. 7.2 Ma) still shows some indication of a grain-size in-fluence (large grain size and high velocity), but at this depththere is also a peak in density, perhaps the result of enhancedcementation. Deeper than 250 mbsf, induration variations be-come the dominant mechanism for reflector formation. Reflec-tor 6-7 (280 mbsf, ca. 7.5-7.6 Ma) is associated with rapid, in-phase, alternations between high and low velocity, density, andcarbonate content. These variations in induration (as shown bythe rapid, large-amplitude changes in velocity and density) ap-parently are a response to fluctuations in carbonate content(and thus more fundamental Oceanographic factors such as dis-solution and productivity). Reflector 6-8 (320 mbsf, ca. 8.2-8.4Ma), with its low velocity and density, probably represents theunindurated end member of this system.
All of the deeper reflectors (6-9 through 6-13), which includerepresentatives of the "Antarctic," "Drake," and "Texas" se-ries, are characterized by synchronous, large-amplitude fluctua-tions in velocity, density, and carbonate content that appear torepresent the diagenetic enhancement of an original carbonatesignal. Interestingly, the "Texas Interval," which has been char-acterized by few large-amplitude reflectors at previous sites,shows a number of large-amplitude events here. It is possiblethat this is a result of the increased thickness of the section hereand thus the increased potential for diagenetic enhancement ofthe original sediment variability.
The logging record at Site 806 ends at approximately 740mbsf. We can, however, use the results of Site 803 to estimatethat the Eocene/Oligocene boundary is at about 120 m belowReflector 6-13, at approximately 0.88 s below seafloor (sbsf).
338
SITE 806
100 200Site 805 depth (mbsf)
300 400 500 600
100 200 300 600 700 800400 500
Site 806 depth (mbsf)
Figure 47. Comparison of wet-bulk density profiles, Holes 8O5C (dashed line) and 806B (solid line). The overall shape of the two records is similar.
Basement should then be at 1.03 sbsf or approximately 1000mbsf.
SUMMARY AND CONCLUSIONSSite 806 is located on the northeastern margin of the Ontong
Java Plateau, close to the equator (latitude 0°19.1 'N, longitude159°21.7'E) in 2520 m of water. The site represents the shallowend member on a transect that was designed to detect depth-re-lated paleoceanographic signals in Neogene sediments. The ob-jective in drilling at this location was to obtain a continuous re-cord in an undisturbed setting, with maximum sedimentationrates, that could serve as a standard section against which allothers could be measured. The setting was considered ideal forhigh-resolution studies of ocean history, including biostratigra-phy, chemostratigraphy, and acoustic stratigraphy. This expecta-tion proved well founded.
Positioning was based on a SCS line acquired by the ThomasWashington during ROUNDABOUT Cruise 11 (0600 UTC, De-cember 21 1989). The site is located at the proposed location(OJP-1) on a 2-km-wide terrace interrupting a gentle inclinesloping to the northeast. The sedimentary sequence apparentlyis complete and undisturbed, with the seismic profile showing afull set of reflectors that are readily correctable with those atSites 289/586.
Coring ResultsWe spent 7.5 days at this site, drilling three holes and coring
1414 m of sediment, of which 1276 m were recovered. Hole806A, a dedicated hole, was cored with the APC to 83.7 mbsfinto upper Pliocene sediments, with 103% recovery. Hole 806Bwas cored with the APC to 320.0 mbsf, where refusal occurred,within the lower upper Miocene; recovery was 105%. The hole
was continued with XCB coring to 743.1 mbsf, with 423.1 m ofsediment cored and 331.2 m recovered (78% recovery). Coringwas terminated within lowermost Miocene sediments when theobjective (recovery of the Neogene section) was judged to havebeen reached. The hole was then logged, with the pipe pulled to92 mbsf.
Hole 806C was cored with the APC to 309.6 mbsf (104% re-covery), at which point coring with the XCB was initiated.Cores were taken from 309.6 to 541.7 mbsf; from that point, wedrilled ahead with a center bit to 599.0 mbsf, where a spot corewas taken to obtain sediments from an interval with poor recov-ery in Hole 806B. A full core was obtained. Drilling was thencontinued with a center bit to 740 mbsf, at which point fourcores were taken (740.0-776.4 mbsf), spanning the Oligocene/Miocene boundary. The XCB-coring operation drilled 278 mand recovered 203 m of sediment (73% recovery) at this hole.
The sediment retrieved is Neogene in age, except for the threedeepest cores in Hole 806C, which recovered Oligocene chalk(Cores 130-806C-60X to -62X). The entire column, from theoldest deposits to the seafloor, is considered as one lithologicunit and was classified as foraminifer nannofossil ooze andchalk to nannofossil ooze and chalk with foraminifers. Nostratigraphic breaks were detected; apparently depositional his-tory was continuous between the upper Oligocene (ca. 27 Ma)and the present. The average sedimentation rate over the entireNeogene may be estimated as 32 m/m.y, the highest of any sitedrilled on Leg 130. Depending on assumptions made about theage of biostratigraphic tie points, the range of fluctuation liesbetween 15 and 55 m/m.y., or between 20 and 45 m/m.y.
Two subunits were recognized in this rather uniform sectionof bioturbated ooze and chalk, on the basis of degree of consol-idation. They are separated by the ooze-chalk transition, placed
339
SITE 806
0.
Panama
|Tethys
Antarctic
0.7
0.8
0.9
1.0
1.1
Drake
Texas
Ontong8?! Java
Figure 48. Seismic record collected on the ROUNDABOUT Cruise 11 site survey over Site 806, using the 80-in.3 water gun, 70-250 Hz band-pass filter. For details of reflector picks, see Table 12. E/O = Eocene/Oligo-cene boundary and B basement.
340
SITE 806
Q.CDQ
100 -
200 -
300 -
400 -
500 -
600 -
7001500
"TE I '
- i
J??
-
i i i
i • i • i *
— Laboratory
"• "• "• ~ - ^ ^ ^ ^ f c • ^
*
i
1 i 1 i " ^ ~ L J
1 '
-
1 i
1 i
Log
-
1700 1900 2100 2300
Merged velocity (m/s)
2500 2700 1.4 1.5 1.6 1.7 1.8 1.9 2.0
Merged density (g/cm3)
Figure 49. A. Merged laboratory (dashed line) and log velocity (solid line) profiles. Laboratory values were used from 0 to 180 mbsf, log valuesfrom 180 to 740 mbsf. B. Merged laboratory (dashed line) and log density (solid line) profile. Laboratory values were used from 0 to 360 mbsf,log values from 360 to 750 mbsf.
at 339.4 mbsf in Hole 806B (Core 130-806B-37X) and at 338.5mbsf in Hole 806C (Core 130-806C-37X) (lowermost upper Mi-ocene, ca. 10 Ma). The transition is gradational and shows al-ternating layers of varying degree of lithification, beginning atabout 200 mbsf in both holes, looking downhole.
The younger section of the unit (Subunit IA, 0-339 mbsf)comprises Pleistocene to upper middle Miocene foraminifernannofossil ooze to nannofossil ooze with foraminifers. Fora-minifer content is significantly higher than at previous Leg 130sites (Sites 803-805) and is estimated to be between 15 and 30%,on average. Radiolarian content is low throughout. Bioturba-tion is common throughout; it appears to be more strongly ex-pressed than at the previous sites (803-805). Liesegang bandingis common throughout the subunit, although it appears to befainter and more diffuse in appearance than at Sites 803-805.The best examples are near the bottom of the subunit. Authi-genic pyrite was found, associated with burrows, and a slightodor of H2S was noted on occasion, upon opening the cores.Microfaulting is rare. Sediments are generally soft, but in thelowermost portion of Subunit IA more lithified intervals appear(below 200 mbsf). Coring was impeded in one instance becauseof Porcellanite nodules (310 mbsf, ca. 8.2 Ma, Core 130-806C-34X) near the level of APC refusal. The shallowest Porcellanitenodules were found at 240 mbsf (ca. 6.7 Ma). A marked changein the velocity-depth gradient (associated with a brief reversal)occurs just above this depth level (at 220 mbsf). At the ooze-chalk transition (339 mbsf), the character of the velocity profilechanges: above this level, high-frequency variations are pro-nounced; below it, they are indistinct.
The older section of the unit, Subunit IB (339-776 mbsf),consists of 437 m of foraminifer nannofossil chalk to nannofos-sil chalk with foraminifers, with a few intervals of nannofossilchalk, ranging from the lower upper Miocene to the upper Oli-gocene. Foraminifer content is high down to about 600 mbsf(ca. 20 Ma) and decreases below that level. Radiolarian contentis low throughout. The color is predominantly white. Colorbanding occurs throughout; bands become thinner and moredistinct with depth in the subunit. Small-scale flaser bedding ispresent. Bioturbation is ubiquitous. Rare, centimeter-size por-cellanite nodules were observed at several levels (350 and 510mbsf). The depth gradient of dissolved silica is reduced at 350mbsf and between 450 and 550 mbsf, possibly in response toprecipitation.
The sediments in the chalk section posed no problem forXCB-coring down to the Oligocene/Miocene boundary zone, atwhich point recovery decreased. However, even where recovery isvery good, the chalk is broken up and brecciated by drilling,with evidence for grinding of chalk on chalk. This type of re-covery is typical for the material below 320 mbsf, that is, thesection cored with the XCB. The Oligocene/Miocene boundaryis located between 740 and 750 mbsf and apparently is withouthiatus (although recovery is poor at this level). Sedimentationrates for the deep chalk section vary between 20 and 30 m/m.y.,the same as for the upper portion of the chalk subunit.
Special StudiesAn attempt was made to construct magnetostratigraphies for
the uppermost section of Holes 806B and 806C. Although the
341
SITE 806
0620 0615 0610 0605 0600 0555 0550
Figure 50. Comparison of synthetic seismogram and field record at Site 806. Names to the right of the diagramrefer to groups of reflectors or zones with reflector groups. See Site 805 "Summary and Conclusions" sectionfor significance of names.
342
SITE 806
100
200
300
100
500
600
700
800
— 6-13—:
Table 12. Summary of traveltimes, depth, and ages for Site 806 re-
flectors.
-500 -300 -100 100
Reflection coefficient
300 500
Figure 51. Reflection coefficient vs. traveltime, Site 806. For details of
reflector picks, see Table 12.
Brunhes/Matuyama boundary could not be identified, mag-netic susceptibility seems to be measurable well into the Plio-cene, opening the possibility for the study of Milankovitch-typecycles using magnetic properties.
Chemical gradients in interstitial waters at this site are gener-ally similar to those at Sites 803-805, reflecting the calcareous/siliceous nature of the sediments and the paucity of organic ma-terial. A somewhat higher supply of organic matter at this site,presumably because of the shallower depth, tends to produceslightly stronger gradients. Sulfate concentrations, especially,show this influence of organic supply. Concentrations decrease
Notes: Depths and traveltimes to seismic events are picked on both the syn-thetic seismograph (synthetic) and the field record (seismic). Ages arefrom sedimentation rate curves (see "Sedimentation Rates" section, thischapter).
by almost 50% over the length of Hole 806C, with most of thedecrease occurring by 222 mbsf. Alkalinity increases correspond-ingly in the upper section but decreases below 250 mbsf, pre-sumably in response to precipitation of carbonate. Calcium andmagnesium gradients are influenced by basalt alteration reac-tions at depth and show the usual negative correlation. Stron-tium concentrations reflect recrystallization processes, whichapparently are more vigorous here than at the previous sites be-cause of the higher sedimentation rates. Dissolved silica shows asteady increase with depth, except for a minor reversal of thistrend near the ooze/chalk transition (350-360 mbsf)
Excellent logs were obtained for sound velocity and densityat Site 806. The fact that this site has continuous sedimentationmakes these logs especially valuable. Laboratory velocities andbulk densities provide control for the upper portion of the re-cord, which could not be logged. Bulk density and sound veloc-ity increase with depth more or less as expected. Bulk densityvalues are near 1.6 g/cm3 at 100 mbsf and increase to 1.9 g/cm3
by 700 mbsf. If expressed as average density increase per age in-terval (0.15 g/cm3 per 10 Ma) the overall gradient is exactlyidentical to that in Site 586. It is noticeably higher than that inSite 805, which has a distinctly lower sedimentation rate. Thus,both depth of burial and age govern this parameter. Sound ve-locity is 1.65 km/s at 100 mbsf and increases by 0.13 km/s per100 m down to 250 mbsf, where the gradient changes to 0.18km/s. The stronger gradient, presumably, shows the effects ofcarbonate precipitation below 250 mbsf, as seen in the intersti-tial water measurements.
Seismic StratigraphySite 806 is characterized by the highest sedimentation rate of
any of the Leg 130 sites. A complete section, without hiatuses,is also present, as is true for Site 805. This site, therefore, is ofgreat interest with respect to a central objective of the leg: to de-termine the nature of the acoustic reflectors seen on seismic pro-files.
The reflector groups identified at Site 805 can also be recog-nized at Site 806, in the SCS profiles taken by the ThomasWashington during the ROUNDABOUT pre-site survey (Fig.54). In addition, there are others, not seen in the Site 805 pro-files. Dating shows that at least some reflectors are associatedwith paleoceanographic events, as suggested by Mayer et al.(1986) for the central equatorial Pacific. They proposed the
343
SITE 806
0
100
200
300
400Q .CDQ
500
600
700
800
6-10 —
6-11 — -
-6-13 —
6-10
6-11
- 6-12
6-13-
1900 2300Merged velocity (m/s)
2700 1.4 1.6 1.8 2.0Merged density (g/cm3)
2.2 2 3 4 5Merged impedance
Figure 52. Merged velocity, density, and acoustic impedance used to generate synthetic seismogram, Site 806. For details of reflector picks, see Table12.
closing of the Panama Isthmus, reorganization of deep circula-tion in the Atlantic, climatic events surrounding the Antarctic,and the opening of the Drake Passage as important paleoceano-graphic themes reflected in the acoustic properties of Pacific pe-lagic sediments. The names for three reflector groups were cho-sen for these propositions (without necessarily implying en-dorsement). The advantage of considering groups of reflectorsin addition to single members is obvious: it is then the variabil-ity of sediment properties within a given section that is beingaddressed, rather than an individual excursion of velocity and/or density. For explanation of the names "Tethys Interval" and"Texas Interval," see the "Summary and Conclusions" sectionof the Site 805 chapter (this volume).
The match of reflectors shown in Figure 54 is readily ob-tained by assuming that the traveltime to equivalent reflectors inSite 806 is 1.37 times that in Site 805. The success of the matchallows dating by correlation and also allows the statement thatsedimentation rates between these two sites are likely to differ bya certain factor for the entire Neogene and Oligocene. This re-sult is quite surprising, considering that the effects of dissolu-tion are thought to be responsible for the difference in overallsedimentation rate, and that dissolution intensity might be ex-
pected to have a long-term trend, producing a correspondingtrend in differences in sedimentation rates.
The general match proposed in Figure 54 predicts that theage of 22.0 Ma found at .50 sbsf at Site 805 should appear at0.685 sbsf at Site 806 (0.5 1.37), which corresponds to 676mbsf, using a generalized velocity profile for Site 806 (based onlogging). In fact, the biostratigraphic age of 22.0 Ma in Site 806appears at 665 mbsf (with an uncertainty of 5 m). At 676 mbsf(the guess), the age is 22.3 Ma according to shipboard biostra-tigraphy. The result of this exercise suggests that the matchingof reflectors on the Ontong Java Plateau produces correlationsthat are comparable in quality with those from biostratigraphiccontrol. To check this proposition, additional matches werepicked as follows (each comparison shows Site 805 first, thenSite 806):
The average difference between the age estimates is 0.23 m.y.for the five determinations. A repeat of the exercise using a con-tinuous velocity profile, and picking different levels indepen-dently, gave virtually identical results. An error of between 0.2and 0.3 m.y. is within the interpolation errors of the biostrati-graphic age; it is the uncertainty found if one hole of Site 806 isused to predict the age at the same depth in the other hole.Thus, as far as we can tell, the correlative reflectors of Sites 805and 806 are identical in age. The demonstration of this synchro-neity is an important result; it is greatly simplified by the factthat near-equivalent levels in the two sites are readily found be-cause of the similarity of sedimentation rate patterns (Fig. 55).
The Panama Series (Fig. 54) contains reflectors that we datednear 2, 2.4, and 3.7 Ma. The age of 2.4 Ma corresponds to adeep-water cooling event and the onset of North Atlantic icebuildup (Backman, 1979; Shackleton et al., 1984). The reflec-tors dated at 2.4 and 3.7 Ma can be identified in the seismic re-cord from DSDP Site 586 using the velocity profile provided bythe logging of DSDP Site 586 (Shipboard Scientific Party,1986a). The Tethys Interval contains a number of lesser reflec-
tors, two of which (just above and below 0.4 sbsf) do not seemto have corresponding reflectors in Site 805 and may be relatedto lithification at that depth (near 350 mbsf)
The next group of strong reflectors, going downsection, isthe upper group of the Antarctic Series, centered on the middleMiocene (13 Ma; 0.49 sbsf, ca 450 mbsf) The lower group ofthis series is somewhat less prominent and belongs to the upper-most lower Miocene and lowermost middle Miocene (560-500mbsf, 18-15 Ma). This entire zone is characterized by major cli-matic change and associated excursions in carbonate contentand other sediment properties (Barron et al., 1985). Thesechanges, presumably, are associated with the onset of AntarcticBottom Water production at that time. The group of reflectorsimmediately below the Antarctic Series, the Drake Series, hasthe strongest reflector members. Dates range from about 22.5Ma for the deepest of the group (680 mbsf) to 18.5 for the up-permost (570 mbsf)
Below this group there is a thick section, the Texas Interval(250-270 m thick), which shows another series of reflectors, al-most as strong as the Drake Series. At Site 805 these reflectorsare much less pronounced. The reason for the difference is notknown; it may be related to the higher diagenetic potential inSite 806, which could be stemming from better preservation of
345
SITE 806
Quaternary 4 Λ
upperPliocene
lowerPliocene 4.3,
upperMiocene 4.4
^ 4 . 5
middle . iMiocene "^
CO
lowerMiocene
upperOligocene
lowerOligocene
Eocene
4.7
4.9
PanamaSeries
TethysInterval
AntarcticSeries
DrakeSeries
TexasInterval
Basalt (?)
2-4 Ma
4-10 Ma
10-19 Ma
19-23 Ma
23-35 Ma
Ontong Java middle and lateSeries Eocene
Figure 54. Comparison of seismic profiles at Sites 805 and 806. Profiles taken by the Thomas Washington on ROUNDABOUT Cruise11 (see "Seismic Stratigraphy" section, this chapter), with time scale assigned from drilling and logging results as well as biostrati-graphic studies (see "Biostratigraphy" section, this chapter). Names to the right refer to groups of reflectors ("series") and zones withless distinct groups ("intervals"). See the "Summary and Conclusions" section of the Site 805 chapter (this volume) for the signifi-cance of names. The record of Site 806 is to the right; its traveltime scale was reduced by a factor of 0.73 to match reflectors as best aspossible without individual adjustments.
346
SITE 806
B
I
h(m
l
Q.Φ
a
I
100
200
300
400
500
600
700
800
900
A\\
\\Site 806 ^ N
-
-
-
-
-
1
-
-
Site 805
α
•
Site 805
Site 806 V
10 20 30Age (Ma)
10 20 30Age (Ma)
Figure 55. Age-depth plots, Sites 805 (solid line) and 806 (dashed line), as given by biostratigraphic tie points (A) and after mapping Site 805 onto 806by multiplying depth by a factor of 1.4 (B). Solid squares = Hole 806B, open squares = Hole 806C, solid circles = Hole 805C, and open circles =Hole 8O5B.
carbonate or from a greater supply of organic matter, or both.Below this interval is the Ontong Java Series, which is thoughtto represent the change from chalk to limestone in the lower-most Oligocene, and—somewhat deeper in the section—the oc-currence of chert. As at Site 805, acoustic basement lies a shortdistance below this sequence.
In summary, there is good correlation between Sites 805 and806, and good agreement in biostratigraphic dates for equiva-lent reflectors or reflector groups, regardless of the overall dif-ference in sedimentation rates. This observation provides strongsupport for the hypothesis that many reflectors represent the ef-fects of paleoceanographic events felt over a wide depth rangeand, hence, are of global significance. Other reflectors may beregionally strong expressions of minor events or may be relatedto diagenetic processes that are not synchronous.
Sedimentation Rates
The oldest sediments cored, at 776 mbsf in Hole 806C, wereof latest Oligocene age (Zones NP25 and P22). The distance toacoustic basement below this level (0.75 sbsf) may be estimatedas approximately 0.23 s two-way traveltime, which correspondsto roughly 340 m of sediment at that depth. Assuming that theuncored section represents at least 80 Ma of time, the presenceof condensed intervals or hiatuses, or both, would seem to beindicated for the early Paleocene and Upper Cretaceous.
Since late Oligocene time, Site 806 has received nannofossilooze with, on the whole, rather minor admixtures of siliceousfossils. Sedimentation rates typically varied between 20 (lowerMiocene) and 46 m/m.y. (upper Miocene), the overall averagebeing near 30 m/m.y. (Fig. 56). These numbers are somewhatmisleading, inasmuch they are not corrected for mass flux, andcontain the trend of decreasing porosity with depth. If one cor-rects for this trend, one will find that the mass flux in the lateOligocene is of the same magnitude as in the late Neogene.Spikes in sedimentation rate may be present between 8 and 6 Ma(uppermost Miocene), and between 14 and 13 Ma (middle Mio-cene) (see "Sedimentation Rates" section, Figs. 22 through 26)but cannot be fully substantiated at this time because of uncer-tainties in absolute ages for biostratigraphic tie-points. The twointervals in question are characterized by maximum carbonatevalues. There seem to be no condensed sections at Site 806(whereas thinning was observed at Site 805 for the upper lowerMiocene).
Comparisons Between Sites 805 and 806
Carbonate Stratigraphy
Of the sites drilled during Leg 130, Sites 805 and 806 are themost similar with respect to reflector patterns (Fig. 54) and sedi-mentation rate patterns (Figs. 55 and 56). The lithologies of the
347
Site 806
Site 805
10 15Age (Ma)
20 25 30
Figure 56. Sedimentation rates, Sites 805 and 806, based on biostrati-graphic tie-points (see "Sedimentation Rates" section, this chapter).
two sites, in essence, are identical. These two sites, therefore,offer a unique opportunity to study one central objective of theNeogene program, that is, the depth effect on the deposition ofcarbonate. A question that arises in this context is to what ex-tent are fluctuations in sedimentation rate caused by variationsin the intensity of carbonate dissolution. The following briefanalysis addresses this question, using the biostratigraphic tie-points provided in the "Sedimentation Rate" sections of the sitechapters for 805 and 806 and the carbonate data available on 15March 1990 and listed in the "Carbon Geochemistry" sectionsof the same site chapters.
The overall Neogene sedimentation rate ratio (SRR) betweenSites 806 and 805 is —1.4, according to biostratigraphic correla-tion (Fig. 55). The inverse—that is, SRR (805/806)—is then0.71, which means that on average there are 7.1 m of sedimentat Site 805 for every 10 m at Site 806. Based on biostratigraphy,it appears that there are marked fluctuations in this ratio, rang-ing from around 0.4 to 0.85, when considering time spans ofseveral million years (Fig. 57). There is a general resemblance ofthe (bio-)SRR curve to the sedimentation rate curves of bothsites (cf. Figs. 56 and 57). This indicates that the depth factor re-ducing sedimentation at Site 805 (presumably carbonate disso-lution) tends to be less important during intervals when sedi-mentation rates are high. If this proves to be true, one wouldconclude that dissolution gradient and supply rate are nega-tively correlated. This is opposite actual expectations (van An-del et al., 1975; Berger, 1979).
Carbonate dissolution, presumably, is largely responsible forthe average SRR of 0.71, that is, the reduction of sedimentationat Site 805 with respect to that at Site 806. To explore further theimportance of this factor as a source of variability in sedimenta-tion pattern, we next turn to the carbonate record. By multiply-ing depths between 0 and 200 mbsf in Site 805 by 1.35, a tolera-bly good match between the two carbonate records is obtainedfor this interval (Fig. 58). Likewise, multiplying depths between200 and 400 mbsf in Site 805 by 1.28 matches the carbonate re-cords closely enough for the purpose of the discussion that fol-lows (Fig. 58).
The carbonate content at Site 806 typically fluctuates be-tween 90% and 95% throughout the section except in the Pleis-tocene portion, where it drops to values as low as 86% (Fig. 58).Values below 90% also are seen in the lower upper Miocene(280-320 mbsf, 7.5-8.5 Ma) (Fig. 58), and again in the lowermiddle Miocene (490-550 mbsf, 14-16.5 Ma). The pattern inSite 805 is quite similar, percentage values being commonlyl%%-2% lower and amplitudes slightly greater. Strong lows in
15Age (Ma)
Figure 57. Sedimentation rate ratio between Sites 805 and 806, based onbiostratigraphic tie-points (see "Sedimentation Rates" section, thischapter). The circles are 1-m.y. interpolation steps.
carbonate at Site 806 typically line up with strong lows at Site805, although lows at Site 805 do not necessarily have a partnerin Site 806.
The major carbonate minimum periods are initiated by asudden drop in the carbonate content, which can be extremelysteep, especially at Site 805 (e.g., near 170 mbsf) (Fig. 58). Ter-mination of low carbonate acme events can be equally sudden.In detail, large carbonate fluctuations are superimposed onthese steep ramps, accentuating differences in physical proper-ties (the figure shows 7-point averages). Ten sudden drops incarbonate values ("carbonate reduction events" [CREs]) arereadily recognized (numbered with Roman numerals, CRE-Ithrough CRE-X).
CRE-I, near 10 mbsf (ca. 0.5 Ma), presumably initiates the"Brunhes Dissolution Cycle" of Adelseck (1977). CRE-II (1-2Ma; not well matched on the figure) apparently leads into theDissolution Acme Event M17, described by Saito et al. (1975).CRE-III (ca. 2.4 Ma) is correlative with a major glacial buildupevent in the North Atlantic (Backman 1979; Shackleton et al.,1984), and is seen as a strong reflector in the Panama Interval.CRE-IV (ca. 3.2 Ma) is correlative to a period of cooling andincrease in North Atlantic Deep Water production. The eventpresumably leads into the GU3 minimum in the carbonate stra-tigraphy of Saito et al. (1975). It marks the time of the closureof the Panama Straits (Keigwin, 1978).
The next three major CREs each mark a descent into a dif-ferent substantial minimum carbonate period. CRE-V (ca. 4.0Ma) apparently coincides with a major warming and transgres-sion (Ingle, 1973; Whitman, 1989). The deepest of the PanamaSeries reflectors, near 3.7 Ma, may mark recovery from thisevent. CRE-VI (ca. 4.4 Ma) apparently is associated with thatsame warming, representing an earlier step. CRE-VII (ca. 5.2Ma) leads into a major dissolution acme, labeled "X" in Saitoet al. (1975). This event is associated with a strong reflector,identified at 0.17 mbsf in Site 586 (labeled 150 m/N17-N18/5-6m.y.), by Shipboard Scientific Party (1986a). Our own datashow a strong triple reflector at 0.20-0.22 sbsf (5.1-5.4 Ma) inthe upper part of the Tethys Series. A moderate cooling is indi-cated in the oxygen isotope data for Site 586 at this level (Whit-man, 1989) as well as a rapid increase in sand content, whichpeaks shortly thereafter (Whitman, 1989). Hiatus formation inthe central Pacific is indicated for this period (NH7 of Kellerand Barron, 1987).
The next deeper CRE (VIII) is not strongly expressed, possi-bly because of the very high initial carbonate values. It occursnear 245 mbsf (ca. 6.8 Ma). Site 806 does not show a strong re-flector here, but Site 805 does (0.25 sbsf; 6.9 Ma). The event ap-
348
SITE 806
ü
96
94 -
92 -
90 -
88
86
84
Pleistocene
-
CREI w V
π'\"~~i\Jf V CRE II
upper Pliocene
I ' T
CRE IV
CRE III ^ ^ / / \
/
lower Pliocene
i I 1
CRE VI
w4'^
i , i . i
upper Miocene
Site 806
^ ( ^ S i t e 805
'; / CRE VII
-
l
25 50 75 100 125Site 806 depth (mbsf)
150 175 200
96
94 -
92 -
Φ
§ 90€ü
88 -
86 -
84200
1
-
-
, i
CRE VIII
upper Miocene
i i
i . i
CRE
V
\
IX
!
i
\
I''
1
CRE
VJ
J
1
X
i
i
i
middle Miocene
l~~
L
1
Site 806 -
•v—
Site 805 '
-
225 250 275 300 325Site 806 depth (mbsf)
350 375 400
Figure 58. Comparison of the carbonate stratigraphies, Sites 805 and 806 (upper 400 mbsf) The carbonate reduction events are numbered from CRE-I in the upper Pleistocene to CRE-X at the beginning of the upper Miocene. The events are characterized by a sudden decrease in carbonate in one orboth of the sites (see text). From 0 to 200 mbsf, the depth-in-hole values of Site 805 were multiplied by 1.35 for an approximate match; from 200 to400 mbsf, the depth-in-hole values of Site 805 were multiplied by 1.28.
pears correlative with Hiatus NH6 of Keller and Barron (1987).CRE-IX and CRE-X are major events, occurring within theN16 Zone, notorious for poor preservation elsewhere in the Pa-cific. At Site 806 they are dated near 7.5 Ma and 8.5 Ma, respec-tively, suggesting a close association with Hiatus NH5 (Kellerand Barron (1987). The extreme carbonate minimum in the east-
ern central Pacific labeled lOe (Barron et al., 1985) and HiatusNH5 appear to be correlative. Thus, CRE-IX or CRE-X, orboth, appear to be equivalent to lOe and NH5. A cooling step isreported for this interval at Site 289 (Savin et al., 1985). A mod-erately strong reflector is seen at Site 806 at the level of CRE-X(0.37 sbsf; Fig. 54), but only a weak one shows up in Site 805.
349
SITE 806
With regard to carbonate reduction events, then, we notethat they have Pacific-wide significance, in lining up with car-bonate lows in the central Pacific, as well as with Pacific hiatusevents. Also, acoustic reflectors tend to be associated withCREs, presumably because they are responsible for creating sur-faces of contrasting physical properties, within the sedimentstack. As to causes, we note that several of the events appear tobe associated with cooling, and at least one (CRE-V) with a pro-nounced warming. Cooling and warming changes the sites ofcarbonate deposition of the ocean, leading to a reorganizationof sedimentation patterns. In principle, this could lead to eitheran increase or a decrease in carbonate deposition at a given site.On the flanks of the Ontong Java Plateau, in the tropical Pa-cific, a cooling event apparently produces sudden carbonate re-duction (although the cooling trend, after 10 Ma, is associatedwith increased carbonate sedimentation rates). The response towarming seen at CRE-V may stem from a change in the parti-tioning of carbonate between shelf and deep-ocean (Berger andWinterer, 1974; Davies et al., 1977) environments, or fromsharply reduced carbonate production. These findings lendstrong support to the hypothesis that many acoustic reflectorson the Ontong Java Plateau are the result of paleoceanographicevents (Schlanger and Douglas, 1974; Berger and Mayer, 1978;Mayer et al., 1985, 1986).
Curve Matching and Difference in Carbonate Content
The close correspondence of the carbonate stratigraphies ofSites 805 and 806 permits a detailed feature-for-feature match-ing on a scale somewhat finer than that provided by biostratig-raphy alone. Figure 59 shows such a match, based on peak-to-peak and ramp-to-ramp correlations. Although all availabledata were used to make the match, only paired data are shown,that is, values that have a partner within 4 m of the matchedlevel (i.e., Site 806 depth-in-hole). Resolution varies dependingon the variability of the record; it is taken to be about 1 Ma.The stratigraphy of differences in the carbonate content in thetwo sites (based on paired, averaged data) shows fluctuationswith a typical range between 0% and 3% (the carbonate contentof Site 806 minus the carbonate content of Site 805, at equiva-lent depth levels). The greatest differences, and the most varia-ble portions of the record, are associated with major CREs,such as CRE-II, CRE-V, CRE-VII, and the CRE-IX/X interval,discussed above.
The maximum difference is seen at 510 mbsf (Site 806), near15.5 Ma (CRE-XVI). This event coincides with the rapid changein oxygen isotopes that marks the acme of the Antarctic coolingevent (Zones N9/N10; Savin et al., 1985; Vincent and Berger,1985). The maximum is preceded (in time) by two smaller peaks(belonging to CRE-XVII and CRE-XVIII), one near 550 mbsf(ca. 17.5 Ma), the other near 585 mbsf (19 Ma). CRE-XVII iscentered on Zone N8, which marks the onset of the Antarcticcooling event (Savin et al., 1985) and the maximum of the Mon-terey carbon isotope excursion (Vincent and Berger, 1985). Hia-tus formation is common in this interval (NH2 of Keller andBarron, 1987). CRE-XVIII occurs in the uppermost lower Mio-cene, in Zone N7. Cooling and 13C enrichment is correlatedwith this event, as well as a carbonate minimum in the centralPacific (16g; Barron et al., 1985). CRE-XVI through CRE-XVIII define a period of reduced sedimentation rate in Site 806,whereas at Site 805 there is a condensed section, and at Sites 803and 804 the interval is not represented in the record at all.
Surprisingly, the events surrounding CRE-XVI to CRE-XVIII are not strongly expressed in the acoustic reflection re-cords of Sites 805 and 806. There is, however, a strong doublereflector in the profile at Site 586, farther up on the plateau. Itis labeled 550/N6/19 m.y. (Shipboard Scientific Party, 1986a)and probably corresponds to CRE XVII/CRE XVIII. At Site
806, there is a group of strong reflectors in the middle of theAntarctic Series (at ca. 3.9 sbsf; Fig. 54) near 435 mbsf (Site806). This series apparently belongs to the interval betweenCRE-XIII and CRE-XIV (12-13 Ma), which corresponds to aperiod of hiatus formation in the central Pacific (NH3 of Kellerand Barron, 1987). The differences in carbonate content be-tween matching depth levels of Sites 806 and 805 imply a loss ofcarbonate at the deeper site. Assuming that this loss occurredby carbonate dissolution, and that noncarbonate material wasnot affected, we can calculate the proportion of sediment lost atthe deeper site ("Loss") from the carbonate fluxes in the shal-low site ("initial carbonate") and in the deeper one ("final car-bonate"), at corresponding depth levels:
where NCt and NCf are initial and final percent of noncarbon-ate, respectively. To determine the percentage loss of carbonate,"Loss" would have to be multiplied by the percentage of car-bonate content at Site 806.
The "Loss" curve should repeat the pattern of the carbonatedifference curve (Fig. 59A), as it is a function of the differencein carbonate. The result of calculating the loss of sediment bythe above equation is shown in Figure 59B, together with thetwo smoothed carbonate curves, on the same scale. First, oneshould note that small differences in carbonate between the twosites are translated into large losses. The reason for this is thegreat sensitivity of "Loss" in the above equation to the quotientNC/NQ when these numbers are small. This also means thaterrors in measurement, or in matching the carbonate curves, aregreatly amplified. Second, it is evident that losses are pulsedrather than being smoothly distributed through time. We knowthis is true for the Milankovitch scale, where dissolution cyclesare common (e.g., Thompson, 1976; Moore et al., 1977; Farrelland Prell, 1989). Apparently, unless the results shown here areartifacts stemming from spotty data and poor matching, similarpulsing is indicated on scales between 0.5 and 1 Ma in our car-bonate curves (cf. van Andel et al., 1975). Finally, this analysisreveals that loss by carbonate dissolution in the manner as-sumed (that is, without involving loss of noncarbonate) cannotaccount for the overall difference in sedimentation rates be-tween Sites 805 and 806.
If the stratigraphy of Site 805 were to be generated from thatof Site 806 solely according to carbonate dissolution, the differ-ences in carbonate percentages would have to be greater thanobserved. For a general sedimentation rate ratio of 0.71, the av-erage loss would have to come out as 29% (100% — 71%). Infact, we get about one-half of that (Pleistocene, 8.5%; upperPliocene, 6.3%; lower Pliocene, 13.9%; upper Miocene, 13.9%,middle Miocene, 13.0%, and lower Miocene, 16.8%). We shallnext adduce further evidence regarding this discrepancy andsubsequently discuss possible causes for its origin.
Sedimentation Rate Ratios from Curve Matching
The match of carbonate curves shown in Figure 59 impliesthat we know which depth levels at Sites 805 and 806 correspondto each other. If this knowledge is accurate, we can next turn tothe ratios in sedimentation rates that are implied for each 10-msection in Site 806 (10 m is an arbitrary interpolation interval).Note that the resulting curve (Fig. 60) is independent of age as-signments. The overall SRR is given as 0.71, from biostratigra-phy. Down to about 400 mbsf (Site 806), the SRR found by car-bonate matching agrees well with that based on biostratigraphy.Below this depth, the carbonate data have too many gaps forconfident matching.
Down into the uppermost upper Miocene, the deviations ofthe SRR from the average are minor. For the Quaternary, there
350
SITE 806
A
96
94
92
σ
JRE-CRE-V
lowerPliocene
CRE-IX CRE-X
upper Miocene
CRE-XIII
middle Miocene
Site 805
CRE-XVII
lower Miocene
100 200 300 400 500
Site 806 depth (mbsf)
600 700
B
100
100 200 300 400Site 806 depth (mbsf)
500 600 700
800
800
Figure 59. Carbonate difference stratigraphy of Sites 805 and 806. A. Match of carbonate curves for the two sites, by adjusting the Site 805 curve atroughly 20-m intervals, fit by eye. Only paired data are shown, as well as the difference in carbonate (scale on right). Carbonate reduction events forthe times preceding the upper Miocene are tentative as the data are spotty in that interval. CRE-I to CRE-X, as in Figure 58. CRE-XIII to CRE-XVIII, see text. B. Loss of sediment calculated on the assumption that the difference between the sedimentation rates of Sites 805 and 806 is entirelya result of the dissolution of carbonate and that the initial supply of sediment is the same at both sites. The uppermost two curves are the pairedcarbonate data, for orientation.
351
SITE 806
0.8 -,
o5 0.6α>
o1Φ
I 0.4Φ
CO
0.2
Quat
\
\
upperPlio.
Λ
lowerPlio.
i
I
i
upper Miocene
I i
v A Λ
i , , , , i
middle Miocene
i . . . . i . .
AA
lower Miocene
i I '
Average = 0.71
/
i , . , . i
Olig.
-
I i
l~
100 200 300 400 500Site 806 depth (mbsf)
600 700 800
Figure 60. Sedimentation rate ratio between Sites 805 and 806, calculated on the basis of the match of carbonate curves shown in Figure 59. Note thesimilarity with the SRR curve based on biostratigraphy (Fig. 57) down to the upper middle Miocene. For older sediments, carbonate data are spotty.
is a tendency for a low SRR, presumably because of the equato-rial position of Site 806. There are two substantial peaks andone valley in SRR within the interval with sufficient data fordiscussion (above 500 mbsf). The first peak is near 240 mbsf(6.5-7 Ma), the second is near 490 mbsf (14-15 Ma), and thevalley is centered near 400 mbsf, in the upper middle Miocene(11 Ma). The peaks signify that sedimentation rates differed lit-tle between Sites 805 and 806 during those particular periods;the valley, on the other hand, indicates a major difference insedimentation rates.
The first peak (near 240 mbsf) marks the time when Site 805crossed the equator while Site 806 had moved off it. If we as-sume that Site 805 should have had a sedimentation rate 0.7times that of 806, the discrepancy suggests that the difference insedimentation rate between the equator and 1 ° to the south wasa factor of 1.2. This appears reasonable for an equator-to-southcomparison (a similar distance to the north would have virtuallyno effect). The period centered on 6-7 Ma falls in Hiatus Inter-val NH6 (Keller and Barron, 1987); perhaps this is why theequatorial effect is not expressed more strongly.
The second peak of SRR, near 490 mbsf, is centered on theAntarctic cooling event, as seen in oxygen isotopes (Savin et al.,1985; Vincent and Berger, 1985) and marks a time of substantialdissolution in Site 805. It is quite possible that this peak is spu-rious, at least in its extent above the average SRR. A slight ad-justment of the match between Sites 805 and 806 could readilyreduce the peak and at the same time fill the trough to its right,without eliminating it, of course. Not much credence can begiven to the exact shape of the SRR minimum in the uppermost
lower Miocene because the carbonate data base deterioratesquickly below 450 mbsf. The SRR minimum is most probablypresent (based on biostratigraphy, there is a condensed sectionin Site 805 centered at this period), but it does not necessarilyextend to values below 0.3.
The broad SRR minimum in the upper middle Miocene, andextending into the lowermost upper Miocene, marks the end ofthe Antarctic cooling period (Savin et al., 1985) and containstwo hiatus-prone periods (NH3 and NH4 of Keller and Barron,1987), as well as evidence for major carbonate removal in thecentral Pacific (Barron et al., 1985). This coincidence suggeststhat the late-stage Antarctic cooling steps resulted in carbonatedissolution in the western equatorial Pacific, and that such dis-solution affected Site 805 more than Site 806.
Discussion
A comparison of the carbonate-based stratigraphies is shownin Figure 61. The carbonate curves for Sites 805 and 806 are thesame as in Figure 59 (showing only matching pairs). Note thatcorrelation between the two curves is good to about 10 Ma {JR2
= 0.81), and becomes quite poor in sediments older than this(R2 = 0.16). It is not clear to what extent this reflects a changein climate dynamics, and to what extent it is a function of poordata coverage. The matching technique also needs to be im-proved. Note for example that a slight shift of the Site 805 curveat 16 Ma to the left would improve the fit with the Site 806 curvebetween 15 and 17 Ma. This would have the beneficial effect ofdecreasing the apparent 15-Ma peak in the SRR (Fig. 60, 490
352
SITE 806
100
95
75
Site 806
Site 805
CORR
1.0
05 I
10 20 25 3015Age (Ma)
Figure 61. Summary graph of the carbonate stratigraphy of Sites 805 and 806. Top: matched carbonate curves, pairs only. Bottom: comparison ofsedimentation rate ratios (SRR) between the two sites, one based on carbonate differences ("DISS"), the other on the match of the carbonate profiles("CORR"). SRR values were left off for the deeper part of the section, where they are believed to be unreliable. Note that the two SRRs do not agree.
mbsf) while reducing the minimum in the SRR to the right (Fig.60, 580 mbsf) Nevertheless, a strong dynamic component is be-lieved to be present in the factors responsible for the change incarbonate correlation near 10 Ma, but this effect must be sub-stantiated by work on shore.
The data density and the match based on it are thought to bequite good back to 13.5 Ma, so the two derivative curves areshown back to this time in the summary figure (Fig. 61). DISS isthe SRR based on LOSS, where LOSS is calculated from the ra-tio of noncarbonate values (see equation above) (Fig. 59B), andCORR is the SRR based on matching the carbonate curves (Fig.60). It is quite evident that the two independent SRR estimatesonly agree in three intervals: near 3.5-5, near 7-8.5, and near 14Ma. These intervals contain well-defined periods of strong car-bonate dissolution (CRE-V and CRE-VII, CRE-IX and CRE-X, and CRE-XVI; see Fig. 59A), all of which affect Site 805much more than Site 806. During such times, then, the dissolu-tion gradient dominates the differences in sedimentation rate.During the rest of the time (most of it, actually), changes in thecarbonate dissolution gradient do not seem to be the controllingfactor governing changes in sedimentation rates, or, if they are,carbonate dissolution does not result in sufficient reduction ofcarbonate percentages at the deeper site to allow calculation ofthe loss sustained.
The latter point was raised earlier, when discussing Figure59B. The carbonate percentages in Site 805 are too similar tothose of Site 806, considering the difference in sedimentationrates between the two sites. It is as though much noncarbonateloss occurred at Site 805 also, in addition to carbonate loss(which, of course, must bear the bulk of the difference betweenthe two sites). An alternative hypothesis for explaining the dis-crepancy, namely, the addition of "trickle-down" carbonate
from higher up the slope, cannot stand up to scrutiny. If suffi-cient nannofossil carbonate were to be added to Site 805 tobring the percentages back up, the rate of sedimentation wouldthen go up proportionally, changing both SRR indexes in thesame direction.
We need to find a mechanism that removes noncarbonate di-lutants at the same time, and at the same measure, as carbonateis removed. Several mechanisms can be envisaged, as follows:
1. The reduction of carbonate accumulation from dissolu-tion may lead to greater exposure of siliceous fossils, couplingtheir dissolution rate to that of carbonate. In this case, the dia-toms at Site 805 should be less well preserved that those at Site806, at least in the upper portion of the section, before diagene-sis destroys the signal. The diatom preservation differences be-tween Sites 805 and 806 are being checked for this predicted ef-fect.
2. Dissolution of carbonate changes the physical propertiesof the sediment in such a fashion that mechanical removal ofnoncarbonate is more easily accomplished by a combination ofbiosuspension and current transport. In this case, the diatom-to-radiolarian ratio should be less in Site 805 than in Site 806,and there should also be less clay per radiolarian weight.
3. Much of the loss at Site 805 could be caused by solifluc-tion, engendered by carbonate dissolution, which increases po-rosity and decreases shear strength. In this scenario, the biotur-bated layer moves downslope during repeated short dissolutionpulses and microhiatuses are produced, especially during earth-quakes. Such a mechanism would result in loss of sedimentwithout fractionating between carbonate and noncarbonate, re-ducing the "true" SRR, but not the one based on carbonate dif-ference.
353
SITE 806
Evidence for the operation of these (or related) processes hasto be collected onshore. It is unlikely that the raw grain size dataavailable will throw light on the subject. The mean size valuesare higher in Site 806 than at Site 805, presumably because ofthe higher foraminifer content at the shallower site. This is thereverse of what would be expected if winnowing were the mostimportant factor. However, breakdown of foraminifers fromdissolution will produce a decrease in mean size in calcareoussediments (Johnson et al., 1977), overriding any effect fromwinnowing.
REFERENCES
Adelseck, C. G., Jr., 1977. Recent and late Pleistocene sediments fromthe eastern equatorial Pacific Ocean: sedimentation and dissolution[Ph.D. dissert.]. Univ. California, San Diego.
Backman, J., 1979. Pliocene biostratigraphy of DSDP Sites 111 and 116from the North Atlantic Ocean and the age of the Northern Hemi-sphere Glaciation. Stockholm Contrib. Geol., 32:115-137.
Barron, J. A., and Keller, G., 1982. Widespread Miocene deep-sea hia-tuses: coincidence with periods of global cooling. Geology, 10:577-581.
Barron, J. A., Keller, G., and Dunn, D. A., 1985. A multiple microfos-sil biochronology for the Miocene. In Kennett, J. P. (Ed.), The Mio-cene Ocean: Paleoceanography and Biogeography. Mem. Geol. Soc.Am., 163:21-36.
Berger, W. H., 1979. Impact of deep-sea drilling on paleoceanography.In Talwani, M., Hay, W., and Ryan, W.B.F. (Eds.), Deep DrillingResults in the Atlantic Ocean: Continental Margins and Paleoenvi-ronment. Am. Geophys. Union, Maurice Ewing Sen, 3:297-314.
Berger, W. H., and Johnson, T. C , 1976. Deep-sea carbonates: dissolu-tion and mass wasting on Ontong Java Plateau. Science, 192:785-787.
Berger, W. H., Johnson, T. C , and Hamilton, E. L., 1977. Sedimenta-tion on Ontong Java Plateau: observations on a classic "carbonatemonitor." In Anderson, N. R., and Malahoff, A. (Eds.), The Fate ofFossil Fuel CO2 in the Oceans: New York (Plenum Press), 543-567.
Berger, W. H., and Mayer, L. A., 1978. Deep-sea carbonates: acousticreflectors and lysocline fluctuations. Geology, 6:11-15.
Berger, W. H., and Winterer, E. L., 1974. Plate stratigraphy and thefluctuating carbonate line. In Hsü, K. J., and Jenkyns, H. C. (Eds.),Pelagic Sediments on Land and Under the Sea: Spec. Publ., Int. As-soc. Sedimentol., 1:11-48.
Bukry, D., 1973. Low-latitude coccolith biostratigraphic zonation. InEdgar, N. T., Saunders, J. B., et al., Init. Repts. DSDP, 15: Wash-ington (U.S. Govt. Printing Office), 685-703.
Davies, T. A., Hay, W. W., Southam, J. R., Worsley, T. R., 1977. Esti-mates of Cenozoic oceanic sedimentation rates. Science, 197:53-55.
Dunlop, D. J., 1981. The rock magnetism of fine particles. Phys. EarthPlanet. Inter., 26:1-26.
Elderfield, H., Gieskes, J. M., Baker, P. A., Oldfield, R. K.,Hawkesworth, C. J., and Miller, R., 1982. 87Sr/86Sr and 18O/16O ra-tios, interstitial water chemistry and diagenesis in deep-sea carbon-ate sediments of the Ontong-Java Plateau. Geochim. Cosmochim.Acta, 46:2259-2268.
Emeis, K.-C, and Kvenvolden, K. A., 1986. Shipboard organic geo-chemistry on JOIDES Resolution. ODP Tech. Note, No. 7.
Farrell, J. W., and Prell, W. L., 1989. Climatic change and CaCO3 pres-ervation: an 800,000 year bathymetric reconstruction from the cen-tral equatorial Pacific Ocean. Paleoceanography, 4:447-466.
Gieskes, J. M., 1981. Deep-sea drilling interstitial water studies: impli-cations for chemical alteration of the oceanic crust, Layers I and II.In Warme, J. E., Douglas, R. G., and Winterer, E. L. (Eds.), TheDeep Sea Drilling Project: A Decade of Progress. Spec. Publ., Soc.Econ. Paleontol. Mineral., 32:149-167.
Hamilton, E. L., 1976. Variations in density and porosity with depth indeep-sea sediments. J. Sediment. Petrol., 46:280-300.
Hussong, D. M., Wipperman, L. K., and Kroenke, L. W., 1979. Thecrustal structure of the Ontong Java and Manahiki oceanic plateaus./. Geophys. Res., 84:6003-6010.
Ingle, J. C , 1973. Summary comments on Neogene biostratigraphy,physical stratigraphy and paleo-oceanography in the marginal north-eastern Pacific Ocean. In Kulm, L. D., von Huene, R., et al., Init.Repts. DSDP, 18: Washington (U.S. Govt. Printing Office), 949-960.
Johnson, T. C , Hamilton, E. L., and Berger, W. H., 1977. Physicalproperties of calcareous ooze: control by dissolution at depth. Mar.Geol., 24:259-277.
Karlin, R., and Levi, S., 1983. Diagenesis of magnetic minerals in re-cent hemipelagic sediments. Nature, 303:327-330.
Karlin, R., and Levi, S., 1985. Geochemical and sedimentological con-trol of the magnetic properties of hemipelagic sediments. J. Geo-phys. Res., 90:10,373-10,392.
Keigwin, L. D., 1978. Pliocene closing of the Isthmus of Panama, basedon biostratigraphic evidence from nearby Pacific and Caribbean seacores. Geology, 6:630-634.
Keller, G., and Barron, J. A., 1987. Paleodepth distribution of Neogenedeep-sea hiatuses. Paleoceanography, 2:697-713.
Kennett, J. P. (Ed.), 1985. The Miocene Ocean: Paleoceanography andBiogeography. Mem. Geol. Soc. Am., No. 163.
Kligfield, R., and Channell, J.E.T., 1981. Widespread remagnetizationof Helvetic Limestones. J. Geophys. Res., 86:1888-1900.
Kroenke, L., 1972. Geology of the Ontong Java Plateau [Ph.D. dis-sert.]. Univ. of Hawaii.
Lowrie, W, and Heller, F., 1982. Magnetic properties of marine lime-stones. Rev. Geophys. Space Phys., 20:171-192.
Martini, E., 1971. Standard Tertiary and Quaternary calcareous nanno-plankton zonation. In Farinacci, A. (Ed.), Proc. 2nd PlanktonicConf. Roma: Rome (Ed. Technosci.), 2:739-785.
Mayer, L. A., Shipley, T. H., Theyer, F., Wilkens, R. W., and Winterer,E. L., 1985. Seismic modelling and paleoceanography at DSDP Site574. In Mayer, L. A., Theyer, F., Thomas, E., et al., Init. Repts.DSDP, 85: Washington (U.S. Govt. Printing Office), 947-970.
Mayer, L. A., Shipley, T. H., and Winterer, E. L., 1986. Equatorial Pa-cific seismic reflectors as indicators of global Oceanographic events.Science, 233:761-764.
McDuff, R. E., and Gieskes, J. M., 1976. Calcium and magnesium pro-files in DSDP interstitial waters: diffusion or reaction? Earth Planet.Sci. Lett., 33:1-10.
Moore, T. C , Pisias, N. G., and Heath, G. R., 1977. Climate changesand lags in Pacific carbonate preservation, sea surface temperatureand global ice volume. In Malahoff, A., and Anderson, N. (Eds.),The Fate of Fossil Fuel CO2 in the Oceans: New York (PlenumPress), 145-165.
Okada, H., and Bukry, D., 1980. Supplementary modification and in-troduction of code numbers to the low latitude coccolith biostrati-graphic zonation (Bukry, 1973; 1975). Mar. Micropaleontol., 5:321-325.
Riedel, W. R., and Sanfilippo, A., 1978. Stratigraphy and evolution oftropical Cenozoic radiolarians. Micropaleontology, 24:61-96.
Rio, D., Fornaciari, E., and Raffi, I., 1990. Late Oligocene throughearly Pleistocene calcareous nannofossils from western equatorialIndian Ocean (ODP Leg 115). In Backman, J., Duncan, R. A., etal., Proc. ODP, Sci. Results, 115: College Station, TX (Ocean Drill-ing Program), .
Sager, W. W., 1988. Paleomagnetism of Ocean Drilling Program Leg101 Sediments: magnetostratigraphy, magnetic diagenesis, and pa-leolatitudes. In Austin, J. A., Jr., Schlager, W., et al., Proc. ODP,Sci. Results, 101: College Station, TX (Ocean Drilling Program),327-360.
Saito, X, Burckle, L. H., and Hays, J. D., 1975. Late Miocene to Pleis-tocene biostratigraphy of equatorial Pacific sediments. In Saito, T.,and Burckle, L. H. (Eds.), Late Neogene Epoch Boundaries. Spec.Publ., Micropaleontol., 1:226-244.
Sallomy, J. T., and Briden, J. C , 1975. Palaeomagnetic studies ofLower Jurassic rocks in England and Wales. Earth Planet. Sci. Lett.,24:369-376.
Savin, S. M., Abel, L., Barrera, E., Hodell, D., Kennett, J. P., Murphy,M., Keller, G., Killingley, J., and Vincent, E., 1985. The evolution ofMiocene surface and near-surface marine temperatures: oxygen iso-topic evidence. In Kennett, J. P. (Ed.), The Miocene Ocean: Pale-oceanography and Biogeography. Mem. Geol. Soc. Am., 163:49-82.
Schlanger, S. O., and Douglas, R. G., 1974. The pelagic ooze-chalk-limestone transition and its implication for marine stratigraphy. InHsü, K. J., and Jenkyns, H. C. (Eds.), Pelagic Sediments: On Landand Under the Sea. Spec. Publ., Int. Assoc. Sedimentol., 1:117-148.
Shackleton, N. J., Backman, J., Zimmerman, H., Kent, D. V., Hall,M. A., Roberts, D. G., Schnitker, D., Baldauf, J., Desprairies, A.,Homrighausen, R., Huddlestun, P., Keene, J. B., Kaltenback, A. J.,
354
Krumsiek, K.A.O., Morton, A. C , Murray, J. W., and Westberg-Smith, J., 1984. Oxygen isotope calibration of the onset of ice-raft-ing in DSDP Site 552A: history of glaciation in the North Atlanticregion. Nature, 307:620-623.
Shackleton, N. J., and Opdyke, N. D., 1976. Oxygen-isotope and pa-leomagnetic stratigraphy of Pacific Core V28-239: late Pliocene tolatest Pleistocene. In Cline, R. M., and Hays, J. D. (Eds.), Investi-gations of Late Quaternary Paleoceanography and Paleoclimatol-ogy. Mem. Geol. Soc. Am., 145:449-464.
Shipboard Scientific Party, 1971. Site 64. In Winterer, E. L., Riedel,W. R., et al., Init. Repts. DSDP, 7: Washington (U.S. Govt. PrintingOffice), 473-606.
Shipboard Scientific Party, 1975a. Site 288. In Andrews, J. E., Pack-ham, G., et al., Init. Repts. DSDP, 30: Washington (U.S. Govt.Printing Office), 175-229.
Shipboard Scientific Party, 1975b. Site 289. In Andrews, J. E., Pack-ham, G., et al., Init. Repts. DSDP, 30: Washington (U.S. Govt.Printing Office), 231-398.
Shipboard Scientific Party, 1986a. Site 586. In Moberly, R., Schlanger,S. O., et al., Init. Repts. DSDP, 89: Washington (U.S. Govt. Print-ing Office), 213-281.
Shipboard Scientific Party, Leg 90, 1986b. Site 586: western equatorialPacific. In Kennett, J. P., von der Borch, C. C , et al., Init. ReptsDSDP, 90: Washington (U.S. Govt. Printing Office), 19-114.
SITE 806
Shipboard Scientific Party, 1989. Explanatory Notes. In Prell, W. L.,Niitsuma, N., et al., Proc. ODP, Init. Repts., 117: College Station,TX (Ocean Drilling Program), 11-33.
Thompson, P. R., 1976. Planktonic foraminiferal dissolution and theprogress towards a Pleistocene equatorial Pacific transfer function.J. Foraminiferal Res., 6:208-227.
van Andel, T. H., Heath, G. R., and Moore, T. C , Jr., 1975. Cenozoichistory and paleoceanography of the central equatorial Pacific. Mem.Geol. Soc. Am., No. 143.
Vincent, E., and Berger, W. H., 1985. Carbon dioxide and polar coolingin the Miocene: the Monterey Hypothesis. In Sundquist, E., andBroecker, W. S. (Eds.), The Carbon Cycle and Atmospheric CO2:Natural Variations Archean to Present: Am. Geophys. Union, Geo-phys. Monogr. Ser., 32:455-468.
Whitman, J. M, 1989. Stable isotope record of foraminifera from On-tong Java Plateau for the last 6 million years, DSDP Site 586 [Ph.D.dissert.]. Univ. California, San Diego.
Wu, G., and Berger, W. H., 1989. Planktonic foraminifera: differentialdissolution and the Quaternary stable isotope record in the west-equatorial Pacific. Paleoceanography, 4:181-198.
Ms 130A-108
NOTE: All core description forms ("barrel sheets") and core photographs have been printedon coated paper and bound as Section 5, near the back of the book, beginning on page559.
355
Hole 806B: Resistivity-Sonic-Gamma Ray Log Summary
RESISTIVITY
FOCUSED I I URANIUMSPECTRAL GAMMA RAY [ ö l ShSvm T3] TRANSIT TIME |6 pp^ 5"
> 2 c COMPUTED SHALLOW LONG SPACING THORIUM _ 2 a£ o δ "θ ~~ÅPTúnfts 30|0!5 ohm~m i".5|200 µs/ft TθO"|~-3 "ppm 31 m g
c 8 t E I TOTAL I DEEP I SHORT SPACING I POTASSIUM I fc<8 oc Q E |0 API units 3θ| 0.5 ohm m 1.51200 µs/ft 100|0 wt.% 1 α ^
_|^_H - *.„!<£. —, -• ' D A T A RECORDED OPENHOLE i . I _ j
2 2 1 " > i ?^! ! ' ! \ ! %" ; \ | j \ -2oo
26 I ^ >' A I ' \ I ' ! <1""!
i ' f <, ! j ‰ áTj J*| -250
SITE 806
Hole 806B: Resistivity-Sonic-Gamma Ray Log Summary (continued)
RESISTIVITY
SPECTRAL GAMMA RAYFOCUSED
0.5 ohm m 1.5 TRANSIT TIMEURANIUM
ppm
>tr
i8LUtr
S_ iLUCQT
EP
TI
Q
(m)
α:
8IG
FI
er
COMPUTED SHALLOW LONG SPACING THORIUM
~O API units 3θ|θ!δ ohm~m i".512θO~~ ~~µsZft~" "Too f-3 " p p m " " ~ 3 |
35
37
45
2800
2850-
2900-
2950-
TOTAL
API units 30
DEEP0.5 ohm m 1.5
I
SHORT SPACING
200 µs/ft 100
POTASSIUM
wt.%
Vl>.
IV
j
3
I
z i
^ I
« ;
f
VJ
>
•
gQ. <LU LU
-300
-350
-400
357
Hole 806B: Resistivity-Sonic-Gamma Ray Log Summary (continued)
RESISTIVITY
FOCUSED I I URANIUMSPECTRAL GAMMA RAY [ ö l Bhrrvm TJ] TRANSIT TIME |6~ ppm 0
>- ° α __ - . ç ^ f y H ? - - ._>^H:9ü'__ __y?ü?5?5C!W®.-. _j_H_°_RjyM___ °£ cog "ö ~~ApTJnits 30]0!5 ~~öhm~m i".5|200 µs/ft ~~TOb|-3~~ ~~ppm~~ " ~ 3 | m g
a 8 £ £ I TOTAL I DEEP I SHORT SPACING I POTASSIUM I fc <8 a a E fö API units 3θ|θ.5 ohm m 1.5|200 µsm Toöjö wT% 1 a eo
— I i >i ! / à. I ! > i iI ;<f ! i •^J j s | ;
5 0 1 ! ; 5 \ • i ; C u ! ^ : :
54 I <λ ' | .'sj i j) J | ! S | J
^ < ç>c i i i I ^ * j i ^r ç
5 8 1 "S j Jv ! | ) ?J j *"/ ; J
" S% /Yp* ' ' ; ^ ^ T i <^i I -5509 I s • '*' j ! '• ' ) ! v* •
3ioo--4! ! ! I^Sv I i iisr i \ \ \61 I " f j ' i I f jjf i j ( ** ^
6 3 1 ^ ç j è « 1 ' ^ i I ^ ' "̂
Hole 806B: Resistivity-Sonic-Gamma Ray Log Summary (continued)
RESISTIVITY
I FOCUSED I I URANIUM ISPECTRAL GAMMA RAY ^ ö l Shπvm iT| TRANSIT TIME |6 ppm ö]
> 9 ^ çoMfy i iç . . _SHALLOW _t919^PA9LNil_. -JJIPJi yw -> tz£ m g "o~~ "APrùni ts 30"| 0̂ 5~ ~ "~~ohirvm 7.51200 " ~~µsZff ~' "~iOO|-3 " " "ppm~~ ~~31 m g
a 8 t g I TOTAL I DEEP I SHORT SPACING I POTASSIUM I £ £8 a Q E 0 API units 30 0.5 ohm m 1.5 200 µs/ft 100 0 wt.% 1 Q ^
J 3250"4 I | I i ^ l | : | J !?| f•7 7 . j ^ \ ! |
78 ! i -^V*P ! | I
J J I . I 1 1 1
Hole 806B: Density-Gamma Ray Log Summary
SPECTRAL GAMMA RAY
TOTAL I URANIUM~ö API units 30~ 6 ppm 0
§ -g• PHOTOELECTRIC 5 E,> 2 ~ COMPUTED EFFECT THORIUM 3 DC£ m S ~0~~ ~~ApTù~nTts ~30~| |~10 "bams/ë~ 01-3 ppm 3 | m 8
a. 8 £ ^ CALIPER BULK DENSITY DENSITY CORRECTION POTASSIUM I g] <8 a. o £ 0 inches 20 1.5 g/cm3 2.2 0 g/cm3 0.25 0 wt.% 1 Q w
_ _ • ' - ^ ' π ^ M ^ ,,DATA RECORDED OPENHOLE i^^áto- t \ ^ _ i | I » JC -
1 81 "> <ε i K i) r ! ' *• i ;V<?-I ; s
I " > ^ I < i i - ^ < • f* ! i •200
SITE 806
35
37
45
Hole 806B: Density-Gamma Ray Log Summary (continued)
LU
ccOo
>ccLU
8LUCC
5O_ iLUCD
PTH
LUQ
SPECTRAL GAMMA RAY
TOTAL0
0
0
API units
COMPUTED
API units
CALIPER
inches
30
30
20 1.5
BULK DENSITY
g/cm 3
PHOTOELECTRIC
EFFECT
I2.2
10 barns/e - 0
DENSITY CORRECTION
0 g/cm 3 0.25
6
-3
0
URANIUM
ppm
THORIUM
ppm
POTASSIUM
wt.%
0
I3 I1
S8
2800-
2850-
2900-
2950-
:7r
-**•!
*:: i
s
VA
‰ !
c
' - . I
\ i
i Λ
I J
-300
-350
-400
361
SITE 806
Hole 806B: Density-Gamma Ray Log Summary (continued)
>CC
ILUCC
5OLUCO
EP
TH
a
•ELcr8_ J
u.Oer
SPECTRAL GAMMA RAY
TOTAL0
0
0
API units
COMPUTEDAPI units
CALIPERinches
30
30
20 1.5BULK DENSITY
g/cm 3
PHOTOELECTRICEFFECT
I2.2
10 barns/e - 0
DENSITY CORRECTION0 g/cm 3 0.25
6
-3
0
URANIUMppm
THORIUMppm
POTASSIUMwt.%
0
3
1
5 1- J CC
48
49
50
53
57
3000-
•
-
3050-
-
3100-
-
7 L
"*Ci
*• ;J :.
* ;* 'v » ;
j •**
.*'• j
* >
£ '
'-:
1 ;
<-s « '
* •>
!*< '
\ * »
J %
s, "•, j
- v*. -
- i
iI|
>
••
/
jj5
C
?1
i!
\
• 1
|
1
1
j
!
!
1
;
•
-
rf|
L
1
1
1
I1 ;t
tKI
|<
s
ü\t
I
r
J.1
Sr
t
«
j
>•
1
s
>
1>f
'
!!
1
j .
if>
> >
1
;
>
1
t
f
# i
>~3^ I
r
^̂ !5F
•St[̂ –
a .
< ^
^ .
5̂>*^ j
•
> .
[J- j
>* ;: s
\
c
t
' i
>7
>
>
*
>
*̂ r i>>*r
y , ;
<
/ *
* ~
( 1 <^
/ • f>
f
-450
-500
-550
362
SITE 806
Hole 806B: Density-Gamma Ray Log Summary (continued)
SPECTRAL GAMMA RAY
TOTALAPI units 30
63
64
75
,>. 2 c COMPUTEDLu m 8 I"0 APT units ~30"|
8 t— LLS1 rn
PHOTOELECTRIC
URANIUMppm
EFFECT THORIUM 2 tr
j 10 "bàrns/β - 0| -3 ppm 3 | to g
CALIPER0 inches 20 1.5
BULK DENSITYg/cm 3 2.2
DENSITY CORRECTION0 g/cm 3 0.25 0
POTASSIUMwt.% 1
i<LU LU
-
_
3150-
-
3200-
-
-
3250-
-
j. >
i*•- •
*» i
<• <
5,
yl•
•* * . •
> j
: < ^
-» « i
>
*^L
j
j ^ J ;
f
8
/
i l!
<
1 <T
i
1
/\\
1
j
i
\
/
J>>
j
1/
i
j
>
<
X
I)
/
I
<
i•>
<
J/•>t
>
t
>S
> |
I\/V
<>
t 1
>
'j
%
5 j
r<
—• 1 v 1 1
tl ^^? 1 ' <
! >^ ç
? V&>?» . <
5 ;
$\5> 1
^t, 1 i /?
r2,
f 1è i
'1[3.ccc
-I <!\Ij
1
-600
-650
-700
363
Hole 806B: Geochemical Log Summary
§ |T CAPTURE CROSS 5 g
>• ° α _ S E C T I O N _ CALCIUM IRON HYDROGEN 3 cr£ m δ ~5 captu~rëùnits 30|"0 O.5|-θ725 " T f o T f ö.B" m §> x j X —'
c ü t Jt I ALUMINUM I SILICON I SULFUR I CHLORINE | t <8 ffi Q E (ö wT% 5~|0 0.51 0 O3|0 1 Q $
10 I "*> \ PIPEH ' ^ » OPEN HOLE
1 ' J -10012 I l_ _ _ H "f NO VALID ELEMENTAL YIELDS RECORDED
13 I U
1 2650- ^ i i
15 I s
16 I f j
19 I 27°°• i
21 I " }
I ' \\ I -200
2 3 1 • ‰ I
24 I 2750- )
26 I j
27 I i' S -250
28 I J
SITE 806
Hole 806B: Geochemical Log Summary (continued)
LUer8
>er
LU
er
O_J
CO
Q_LUQ
er
LL
E
5
ü
CAPTURE CROSSSECTION
capture units
ALUMINUMwt. %
30
5
0
0
CALCIUM
SILICON
0.5
0.5
-0.25
0
IRON
SULFUR
0
0.3
0.2
0
HYDROGEN
CHLORINE
0.5
1Q. <LU LU
33
38
39
2800"
2850-
2900-
-300
NO VALID ELEMENTAL YIELDS RECORDED
-350
-400
452950-
365
SITE 806
Hole 806B: Geochemical Log Summary (continued)
<rUJ>OüLUcc
—J ccUJ f~\
CD pcT _J1— LLQ- ,π
LU yQ er
5
0
CAPTURE CROSSSECTION
capture units
ALUMINUM
wt. %
30
5 0
CALCIUM
SILICON
0.5
0.5
-0.25
0
IRON
SULFUR0.3
0.2
0
HYDROGEN
CHLORINE
0.5
1
48
53
54
59
62
63
3000-
-
3050-
-
3100-
fF
I
>
j f
e
t*
j
it
4
\
-
1
**•>
>
<
i
L
i
V
1
k
>
<r\
j4<
>
4
f
<
>
: f
I *rC •? ' "*
— 4».s »
<^ t
β )• *
AT"
, ^ + *
' N ; : i•~' ^
–̂ -4- »
*3 4"-
x i*j
rc <:
s' 1
<
1I
>
N
i
•-
<
• ^ .
• 3 ^ .
• ^ -
?•
'fi>>5*
•s i> •
%•^ r"
• ^ • *
- •*1
r
> .
•s
_ / " *
%
* **uj*
S1
\
>l
V
j "*=^
>
<.
k
r<
<
i>
K
IT
! >
V1
k*V
N•>
j
i 1V
-
>!
i
:]4
"^>!
X
<<
:
k
- 4 5 0
- 5 0 0
^ 5 5 0
366
Hole 806B: Geochemical Log Summary (continued)
§ |> CAPTURE CROSS § g
> 9 C SECTION I CALCIUM IRON HYDROGEN . I 2 c£ m δ 5 capture urüts 30|"b~~ ~~O.5|-θ725~~ ~~O~foT~" ~~0.5~| m g
E 8 ^ ^ | ALUMINUM | SILICON I SULFUR | CHLORINE | fc^